Fundamental Limits on Wavelength, Efficiency and Yield of the Charge Separation Triad Alexander Punnoose 1,2 *, Liza McConnell 2 , Wei Liu 2 , Andrew C. Mutter 2 , Ronald Koder 2 * 1 Instituto de Fı ´sica Teo ´ rica, Universidade Estadual Paulista, Sa ˜o Paulo, Brazil, 2 Department of Physics, City College of the City University of New York, New York, New York, United States of America Abstract In an attempt to optimize a high yield, high efficiency artificial photosynthetic protein we have discovered unique energy and spatial architecture limits which apply to all light-activated photosynthetic systems. We have generated an analytical solution for the time behavior of the core three cofactor charge separation element in photosynthesis, the photosynthetic cofactor triad, and explored the functional consequences of its makeup including its architecture, the reduction potentials of its components, and the absorption energy of the light absorbing primary-donor cofactor. Our primary findings are two: First, that a high efficiency, high yield triad will have an absorption frequency more than twice the reorganization energy of the first electron transfer, and second, that the relative distance of the acceptor and the donor from the primary-donor plays an important role in determining the yields, with the highest efficiency, highest yield architecture having the light absorbing cofactor closest to the acceptor. Surprisingly, despite the increased complexity found in natural solar energy conversion proteins, we find that the construction of this central triad in natural systems matches these predictions. Our analysis thus not only suggests explanations for some aspects of the makeup of natural photosynthetic systems, it also provides specific design criteria necessary to create high efficiency, high yield artificial protein-based triads. Citation: Punnoose A, McConnell L, Liu W, Mutter AC, Koder R (2012) Fundamental Limits on Wavelength, Efficiency and Yield of the Charge Separation Triad. PLoS ONE 7(6): e36065. doi:10.1371/journal.pone.0036065 Editor: Carl J. Bernacchi, University of Illinois, United States of America Received February 2, 2012; Accepted March 30, 2012; Published June 1, 2012 Copyright: ß 2012 Punnoose et al. This is an open-access article distributed under the terms of the Creative Commons Attribution License, which permits unrestricted use, distribution, and reproduction in any medium, provided the original author and source are credited. Funding: RLK gratefully acknowledges support by the following grants: FA9550-10-1-0350 from the Air Force Office of Scientific Research and the NIH National Center for Research Resources to CCNY (NIH 5G12 RR03060). ACM gratefully acknowledges support from the Center for Exploitation of Nanostructures in Sensor and Energy Systems (CENSES) under NSF Cooperative Agreement Award Number 0833180. These funders had no role in study design, data collection and analysis, decision to publish, or preparation of the manuscript. Competing Interests: The authors have declared that no competing interests exist. * E-mail: [email protected] (AP); [email protected] (RK) Introduction Solar energy conversion machines found in nature utilize a number of small molecules, called cofactors, which serve as discrete sites for the binding of a single electron [1]. Charge separation in these proteins is effected via a cascade of several individual electron transfer (ET) events initiated by the absorption of a photon at a central cofactor termed the primary-donor [2]. These protein machines typically contain numerous cofactors arranged so as to enable the movement of the electron and the oxidizing equivalent away from the primary-donor in opposite directions [3,4]. The resultant potential energy is then coupled to some chemical reaction or reactions which create a storable, diffusable form of chemical energy. Chemists have made an intensive effort over the past forty years to recreate the charge separation capability of these devices in synthetic systems [5–11]. The minimal construct that can achieve long-lived charge separation contains a primary-donor along with two other cofactors to facilitate the separation and prevent the fast relaxation of the electron back to the groundstate of the primary- donor (see Figure 1A). This has been termed the photosynthetic cofactor triad (PCT) [7,11–13]. Research efforts have aimed at engineering protein-based PCTs, either through the reengineering of natural proteins [14,15] or de novo design of new artificial proteins [16,17]. An optimal PCT construct will maximize the yield of the charge separated state and minimize energy loss while maintaining the state for as long as necessary before decaying to the groundstate. These performance metrics are intimately related to the microscopic ET rates which themselves are a function of the reduction potentials and the spatial arrangement of the three cofactors. Given the large expense and long time scale of these design efforts [2,18–20], it is important to understand the optimal structure and properties of this molecule from the beginning of the design process. The key is to identify the set of microscopic parameters which when manipulated can effect maximum benefit during the design process. Clearly, numerical simulations of the rate equations to map out the optimal set of ET rates for the entire construct involve a large parameter space [21]. For this reason there has been little theoretical analysis of the optimal structure and properties of the cofactor triad and its many sequential ETs. There are several semiclassical equations which predict ET rates that are well validated, in particular the semiclassical Marcus expression [22– 26]. These are all complicated functions with a number of terms. The challenge in a complex system such as the PCT is to select the formalism which will give a meaningful analytical expression for its behavior. For example, Cho and Silby, in 1995, derived the time- dependent behavior of a molecular dyad structure composed of two cofactors and three states in the limit of a very large reduction potential difference between the excited state primary donor and the acceptor site [27]. PLoS ONE | www.plosone.org 1 June 2012 | Volume 7 | Issue 6 | e36065

Welcome message from author
This document is posted to help you gain knowledge. Please leave a comment to let me know what you think about it! Share it to your friends and learn new things together.
Transcript
Fundamental Limits on Wavelength, Efficiency and Yieldof the Charge Separation TriadAlexander Punnoose1,2*, Liza McConnell2, Wei Liu2, Andrew C. Mutter2, Ronald Koder2*
1 Instituto de Fısica Teorica, Universidade Estadual Paulista, Sao Paulo, Brazil, 2 Department of Physics, City College of the City University of New York, New York, New
York, United States of America
Abstract
In an attempt to optimize a high yield, high efficiency artificial photosynthetic protein we have discovered unique energyand spatial architecture limits which apply to all light-activated photosynthetic systems. We have generated an analyticalsolution for the time behavior of the core three cofactor charge separation element in photosynthesis, the photosyntheticcofactor triad, and explored the functional consequences of its makeup including its architecture, the reduction potentialsof its components, and the absorption energy of the light absorbing primary-donor cofactor. Our primary findings are two:First, that a high efficiency, high yield triad will have an absorption frequency more than twice the reorganization energy ofthe first electron transfer, and second, that the relative distance of the acceptor and the donor from the primary-donor playsan important role in determining the yields, with the highest efficiency, highest yield architecture having the light absorbingcofactor closest to the acceptor. Surprisingly, despite the increased complexity found in natural solar energy conversionproteins, we find that the construction of this central triad in natural systems matches these predictions. Our analysis thusnot only suggests explanations for some aspects of the makeup of natural photosynthetic systems, it also provides specificdesign criteria necessary to create high efficiency, high yield artificial protein-based triads.
Citation: Punnoose A, McConnell L, Liu W, Mutter AC, Koder R (2012) Fundamental Limits on Wavelength, Efficiency and Yield of the Charge SeparationTriad. PLoS ONE 7(6): e36065. doi:10.1371/journal.pone.0036065
Editor: Carl J. Bernacchi, University of Illinois, United States of America
Received February 2, 2012; Accepted March 30, 2012; Published June 1, 2012
Copyright: � 2012 Punnoose et al. This is an open-access article distributed under the terms of the Creative Commons Attribution License, which permitsunrestricted use, distribution, and reproduction in any medium, provided the original author and source are credited.
Funding: RLK gratefully acknowledges support by the following grants: FA9550-10-1-0350 from the Air Force Office of Scientific Research and the NIH NationalCenter for Research Resources to CCNY (NIH 5G12 RR03060). ACM gratefully acknowledges support from the Center for Exploitation of Nanostructures in Sensorand Energy Systems (CENSES) under NSF Cooperative Agreement Award Number 0833180. These funders had no role in study design, data collection andanalysis, decision to publish, or preparation of the manuscript.
Competing Interests: The authors have declared that no competing interests exist.
* E-mail: [email protected] (AP); [email protected] (RK)
Introduction
Solar energy conversion machines found in nature utilize a
number of small molecules, called cofactors, which serve as
discrete sites for the binding of a single electron [1]. Charge
separation in these proteins is effected via a cascade of several
individual electron transfer (ET) events initiated by the absorption
of a photon at a central cofactor termed the primary-donor [2].
These protein machines typically contain numerous cofactors
arranged so as to enable the movement of the electron and the
oxidizing equivalent away from the primary-donor in opposite
directions [3,4]. The resultant potential energy is then coupled to
some chemical reaction or reactions which create a storable,
diffusable form of chemical energy.
Chemists have made an intensive effort over the past forty years
to recreate the charge separation capability of these devices in
synthetic systems [5–11]. The minimal construct that can achieve
long-lived charge separation contains a primary-donor along with
two other cofactors to facilitate the separation and prevent the fast
relaxation of the electron back to the groundstate of the primary-
donor (see Figure 1A). This has been termed the photosynthetic
cofactor triad (PCT) [7,11–13]. Research efforts have aimed at
engineering protein-based PCTs, either through the reengineering
of natural proteins [14,15] or de novo design of new artificial
proteins [16,17]. An optimal PCT construct will maximize the
yield of the charge separated state and minimize energy loss while
maintaining the state for as long as necessary before decaying to
the groundstate. These performance metrics are intimately related
to the microscopic ET rates which themselves are a function of the
reduction potentials and the spatial arrangement of the three
cofactors. Given the large expense and long time scale of these
design efforts [2,18–20], it is important to understand the optimal
structure and properties of this molecule from the beginning of the
design process. The key is to identify the set of microscopic
parameters which when manipulated can effect maximum benefit
during the design process.
Clearly, numerical simulations of the rate equations to map out
the optimal set of ET rates for the entire construct involve a large
parameter space [21]. For this reason there has been little
theoretical analysis of the optimal structure and properties of the
cofactor triad and its many sequential ETs. There are several
semiclassical equations which predict ET rates that are well
validated, in particular the semiclassical Marcus expression [22–
26]. These are all complicated functions with a number of terms.
The challenge in a complex system such as the PCT is to select the
formalism which will give a meaningful analytical expression for its
behavior. For example, Cho and Silby, in 1995, derived the time-
dependent behavior of a molecular dyad structure composed of
two cofactors and three states in the limit of a very large reduction
potential difference between the excited state primary donor and
the acceptor site [27].
PLoS ONE | www.plosone.org 1 June 2012 | Volume 7 | Issue 6 | e36065
In this work, we solve the rate equations analytically for a
generic molecular triad with four states and obtain closed-form
expressions relating the lifetime and yield of the charge separated
state to the ET rates. The equations allow us to isolate the relevant
ratios of rate constants that control the yield and the lifetime.
These conditions are used to set bounds on the physical distances
and potentials that makeup the PCT using a standard semiclassical
model which incorporates Marcus theory for the DG dependence
and an exponential drop-off of the ET rate with distance [28] as
parameterized in the Moser-Dutton ruler [29,30]. We report two
major findings: first, that the highest yield occurs when the
primary-donor cofactor is closest to the acceptor cofactor and
second, that the highest yield and efficiency occurs when the
absorption frequency of the primary-donor is more than twice the
reorganization energy of the first electron transfer. Interestingly,
we demonstrate that natural systems seem to obey these rules
despite their much higher degree of complexity.
Methods
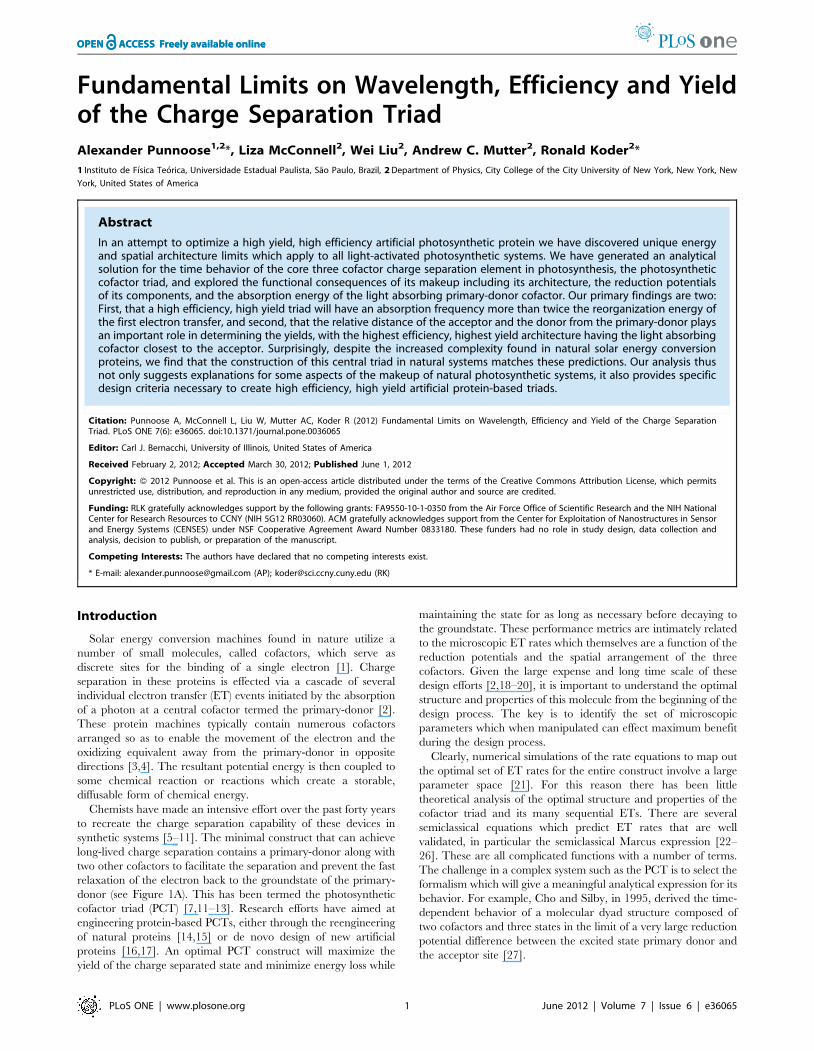
The basic PCT arrangement for long lived charge separation is
depicted schematically in Figure 1A [7], and the microscopic steps
leading to charge separation are shown explicitly in Figure 1B and
energetically in Figure 1C: upon photoexcitation of the site of
charge separation or primary-donor (P) to P�, the excited electron
transfers to an acceptor molecule (A). A donor molecule (D) then
transfers an electron to P, thus blocking the unproductive charge
recombination via back electron transfer, to create a fully charge
separated state, C: D+PA2.
The state C principally relaxes back to the ground state, G:DPA, by one of two mechanisms: direct long ET between A2 and
D+, or a two step recombination process via the intermediate state,
I: DP+A2, followed by electron transfer from A2 to P+, i.e, from
state I? G. When the molecules are arranged linearly, as in
Figure 1A, the first short-circuit reaction mechanism is consider-
ably suppressed, and is therefore neglected in our model. The ET
rates for the two step process are kPD and kAP, respectively. The
reverse transition back to the excited state P� from A is also
suppressed; below we demonstrate that the corresponding ET rate
is exponentially suppressed for energy differences larger than 60–
100 meV between P� A and P+A2, which we show is much less
than 10% of the output energy and therefore does not affect our
general conclusions. Similarly, since the energy difference for the
ET from P to A is in the eV range, thermal excitation from the
groundstate to the acceptor is not considered at room tempera-
tures.
The master equations describing the transitions between the
states corresponding to the scheme in Figure 1C are:
dG�
dt~{(k�zk�PA)G� ð1aÞ
dI
dt~k�PAG�{(kDPzkAP)IzkPDC ð1bÞ
dC
dt~kDPI{kPDC ð1cÞ
dG
dt~k�G�zkAPI ð1dÞ
The transition rates between different configurations is
governed by the microscopic ET rates. The specific ET involved is
encoded in the subscript, for example, kDP, denotes the ET rate
for the D?P transition. The complete list of transitions are:
G� �?k�
PAI �?kDP
C �?kPDI �?kAP
G and G� �?k�
G. As explained
earlier, the C?G short-circuit and the reverse I?G� transitions
are suppressed in our scheme. The rate k� is the combined direct
relaxation rate, fluorescent and otherwise, from the photoexcited
state P� to its groundstate P.
Setting either of the two rates kAP or kPD to zero in Equation 1
prevents the state C (the charge separated state) from decaying into
the ground state G creating a steadystate at long times. A finite kAP
and/or kPD will, on the other hand, force C to decay in a finite
time, which we call the lifetime of the charge separated state. To
study this decay and determine the population (yield) of state C, it
is convenient to solve for the evolution of C(t) analytically. The
solution is presented in the next section.
G G
IG
I C
CC
D A
D Ae -
D A-+
D A-+
P
P
P
P
e -
StateCharge Position
e -
e -
hν
C
hν
∗
∗∗
D P A
D P A+ _
D P A+ _
G
G
I
C
D P A*kPA
kAP
khνk
PDkDP
∗
∗
∗
D AP
A. B. C.
Figure 1. Structure and function of the photosynthetic triad. (A) Molecular detail of an idealized artificial charge separation construct, a self-assembling de novo designed protein. (B) Discrete steps in the formation of the charge separated state: The primary-donor molecule P in the groundstate configuration G: DPA absorbs a photon of the correct frequency to form G�: DP�A, where P� is the photoexcited state of P. The excitedelectron transfers to the acceptor cofactor, A, forming the intermediate state I: DP+A2. The donor cofactor, D, then transfers an electron into P,resulting in the charge separated state C: D+PA2. (C) Energy level diagram of the states in B. The k-variables denote the corresponding microscopicsingle-electron ET rates. In this scheme, the direct long range tunneling between D and A (i.e., C?G) and the ‘thermal back reaction’ [33] between Pand A (i.e., I?G�) are not considered. As explained in the main text, their magnitudes can be significantly suppressed without affecting the efficiencyand yield.doi:10.1371/journal.pone.0036065.g001
Fundamental Limits of the Charge Separation Triad
PLoS ONE | www.plosone.org 2 June 2012 | Volume 7 | Issue 6 | e36065
Results
Analytical solution of the PCTOur goal in this section is two-fold: to obtain the conditions
under which a charge separated state can be maintained in a
quasi-steadystate (QSS) for a desired length of time, determined,
for example, by the optimal throughput rate, and to derive simple
explicit formulas for the lifetime of the QSS and the maximum
yield of C. To this end, we first analytically solve Equation 1 for
C(t). For the initial conditions, we note that the equations being
homogeneous, the solutions scale with the initial population G�(0),which is determined by the efficiency of the photoexcitation
process. Hence, given a non-zero ‘‘source’’ G�(0) at t~0, we
assume that I(0)~C(0)~G(0)~0, i.e., they are initially un-
populated.
We first note that Equation 1a can be integrated to give
G�(t)~G�(0)e{(k�zk�PA
)t. Substituting G�(t) into Equation 1c for
C and after taking a second time derivative to eliminate I, we
arrive at the following second order equation for C(t):
d2C
dt2zk1
dC
dtzk2C~Se
{(k�zk�PA
)t ð2Þ
where
k1~(kAPzkDPzkPD) and k2~kAPkPD ð3Þ
The source term on the right.
S~G�(0)kDPk�PA ð4Þ
The boundary condition dC(t)=dtDt~0~0 is obtained by setting
I(0)~C(0)~0 in Equation 1c. Since the coefficients appearing in
Equation 2 are real, it can be written as:
(d
dtzkz)(
d
dtzk{)C~Se
{(k�zk�PA
)t ð5Þ
where the macroscopic rate constants
k+~1
2k1+
1
2
ffiffiffiffiffiffiffiffiffiffiffiffiffiffiffiffiffik2
1{4k2
qð6Þ
are the roots of the algebraic equation: D2zk1Dzk2~0:(Negative roots are used to keep the rates k+ positive.) Using
the following identity, where k is a constant,
(d
dtzk)f (t)~e{kt d
dt(ektf (t)) ð7Þ
we rewrite Equation 5 as
e{kzt d
dte(kz{k{)t d
dtek{tC� �� �
~Se{(k�zk�
PA)t ð8Þ
Equation 8 is now easily integrated to obtain the solution for
C(t). Separating the constant source term as C(t)~Sc(t), the
time-dependent part c(t) equals
c(t)~e{(k�zk�
PA)t
(k�zk�PA{kz)(k�zk�PA{k{)z
e{kzt
(kz{k{)(kz{k�{k�PA)z
e{k{t
(k{{kz)(k{{k�{k�PA)
ð9Þ
This completes our derivation of C(t).
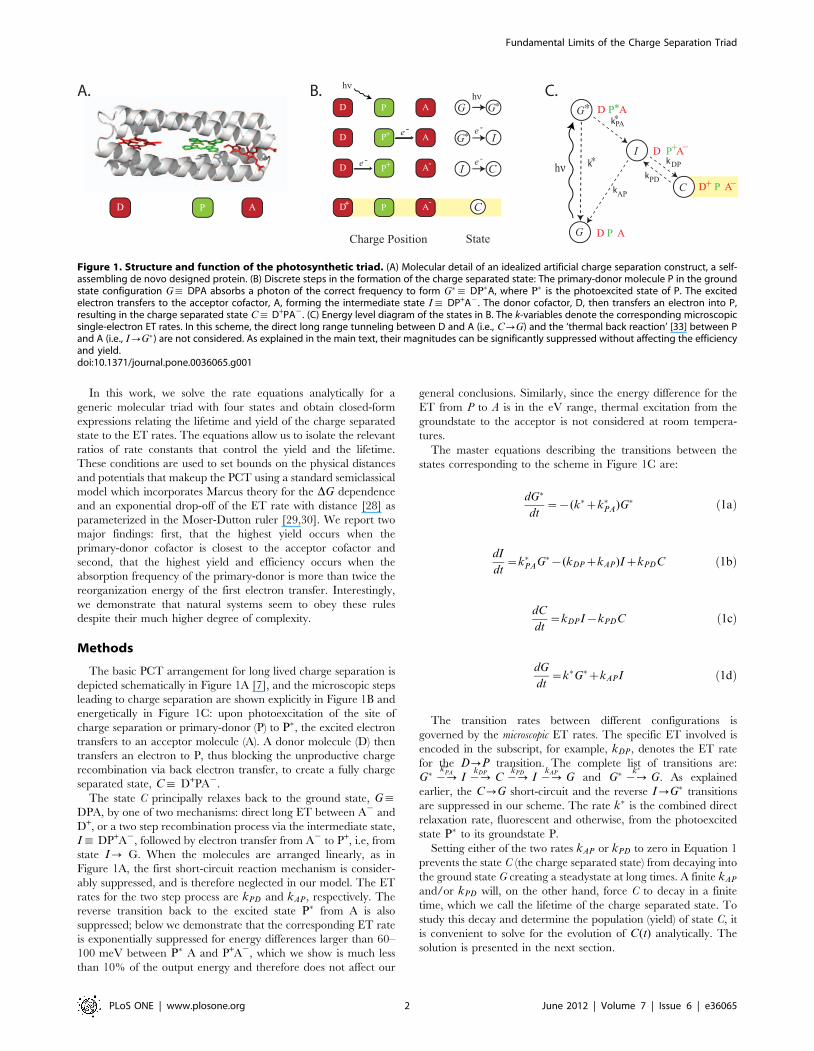
A typical time evolution of C(t) is depicted in Figure 2. This
graph exhibits several aspects characteristic of charge separation in
a PCT [12]: an exponential buildup of state C with a rate constant
kz, followed by a QSS plateau region that decays exponentially at
the rate k{. The length of time for which the QSS persists is
termed the charge separation lifetime (tC ), and the population of C
at the plateau stage is termed the yield of charge separation (YC ).
The rate (k�zk�PA) is the rate at which the state I is initially
populated by G� (see Equation 1b); I then subsequently populates
C at the rate kz. Physically, any system designed to spatially
separate charges has to be able to transfer an electron from the
photoexcited primary-donor P� to the acceptor A (which is
controlled by the rate k�PA) before it decays back to the ground
state at the rate k�. We thus restrict our analysis to
k�%k�PA ð10Þ
[We use the strong inequality (%) to emphasize at least an
order-of-magnitude smallness.]
The determinants of QSS lifetime and yieldIn the previous section, we observed that a QSS is reached at
intermediate times provided
1k-
1k+
1k+kPA∗ ∗
10 -11
0.2
0.4
0.6
0.8
1.0
time (s)
Frac
tiona
l con
cent
ratio
n of
C(t)
10 -9 10 -7 10 -5 10 -3 10 -1 10
YC
0
Figure 2. The evolution of the charge separated state C(t)
derived in eqn:ct. C(t) is normalized by G�(0), which we take to beunity. Rate constants are chosen as k�~109s{1,k�PA~5|109s{1,kAP~5|106s{1,kDP~5|107s{1 , and kPD~1:2|104 s{1 . Relevanttimescales are labeled on the upper axis and are marked by verticallines (see eqn:kpm for definitions of k+). A central quasi-steadystate(QSS) plateau region is formed when these timescales are wellseparated. We define the decay time of the QSS, tC~1=k{, as thelifetime of the charge separated state. The horizontal line marks theyield, YC , defined as the value of C in QSS. Analytical expressions for tC
and YC are derived in Equations 14 and 17, respectively.doi:10.1371/journal.pone.0036065.g002
Fundamental Limits of the Charge Separation Triad
PLoS ONE | www.plosone.org 3 June 2012 | Volume 7 | Issue 6 | e36065
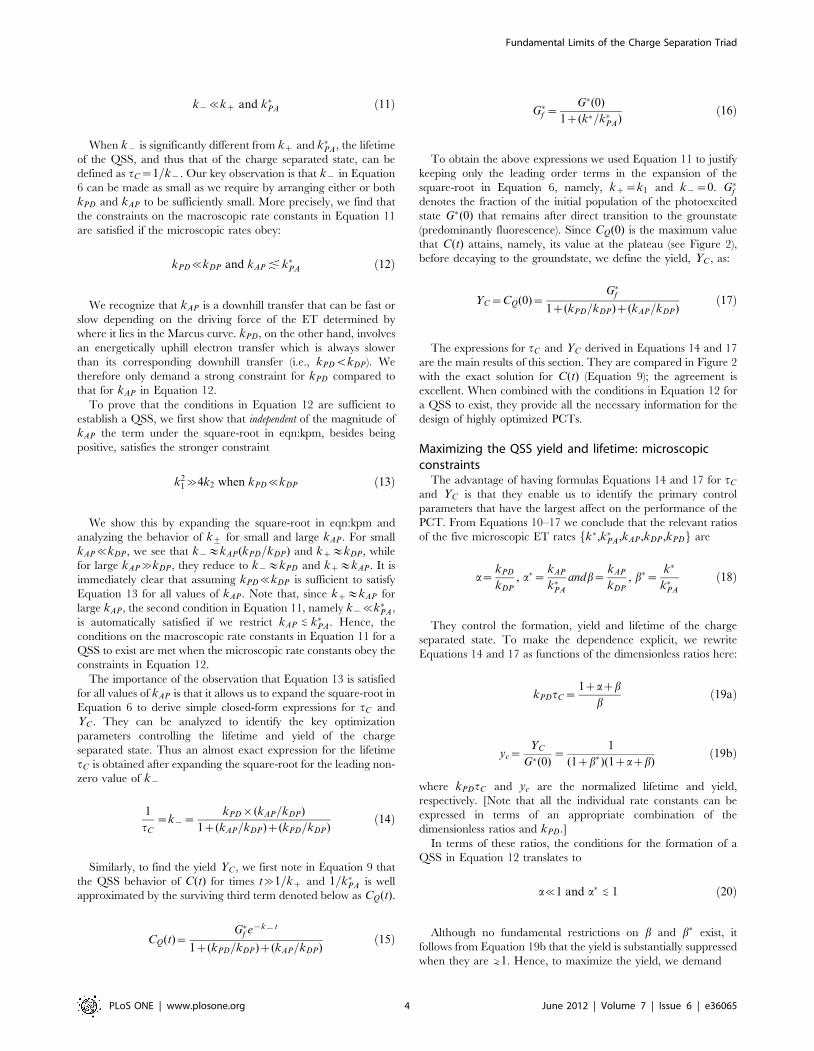
k{%kz and k�PA ð11Þ
When k{ is significantly different from kz and k�PA, the lifetime
of the QSS, and thus that of the charge separated state, can be
defined as tC~1=k{. Our key observation is that k{ in Equation
6 can be made as small as we require by arranging either or both
kPD and kAP to be sufficiently small. More precisely, we find that
the constraints on the macroscopic rate constants in Equation 11
are satisfied if the microscopic rates obey:
kPD%kDP and kAP k�PA ð12Þ
We recognize that kAP is a downhill transfer that can be fast or
slow depending on the driving force of the ET determined by
where it lies in the Marcus curve. kPD, on the other hand, involves
an energetically uphill electron transfer which is always slower
than its corresponding downhill transfer (i.e., kPDvkDP). We
therefore only demand a strong constraint for kPD compared to
that for kAP in Equation 12.
To prove that the conditions in Equation 12 are sufficient to
establish a QSS, we first show that independent of the magnitude of
kAP the term under the square-root in eqn:kpm, besides being
positive, satisfies the stronger constraint
k21&4k2 when kPD%kDP ð13Þ
We show this by expanding the square-root in eqn:kpm and
analyzing the behavior of k+ for small and large kAP. For small
kAP%kDP, we see that k{&kAP(kPD=kDP) and kz&kDP, while
for large kAP&kDP, they reduce to k{&kPD and kz&kAP. It is
immediately clear that assuming kPD%kDP is sufficient to satisfy
Equation 13 for all values of kAP. Note that, since kz&kAP for
large kAP, the second condition in Equation 11, namely k{%k�PA,
is automatically satisfied if we restrict kAP *v k�PA. Hence, the
conditions on the macroscopic rate constants in Equation 11 for a
QSS to exist are met when the microscopic rate constants obey the
constraints in Equation 12.
The importance of the observation that Equation 13 is satisfied
for all values of kAP is that it allows us to expand the square-root in
Equation 6 to derive simple closed-form expressions for tC and
YC . They can be analyzed to identify the key optimization
parameters controlling the lifetime and yield of the charge
separated state. Thus an almost exact expression for the lifetime
tC is obtained after expanding the square-root for the leading non-
zero value of k{
1
tC
~k{~kPD|(kAP=kDP)
1z(kAP=kDP)z(kPD=kDP)ð14Þ
Similarly, to find the yield YC , we first note in Equation 9 that
the QSS behavior of C(t) for times t&1=kz and 1=k�PA is well
approximated by the surviving third term denoted below as CQ(t).
CQ(t)~G�f e{k{t
1z(kPD=kDP)z(kAP=kDP)ð15Þ
G�f ~G�(0)
1z(k�=k�PA)ð16Þ
To obtain the above expressions we used Equation 11 to justify
keeping only the leading order terms in the expansion of the
square-root in Equation 6, namely, kz~k1 and k{~0. G�fdenotes the fraction of the initial population of the photoexcited
state G�(0) that remains after direct transition to the grounstate
(predominantly fluorescence). Since CQ(0) is the maximum value
that C(t) attains, namely, its value at the plateau (see Figure 2),
before decaying to the groundstate, we define the yield, YC , as:
YC~CQ(0)~G�f
1z(kPD=kDP)z(kAP=kDP)ð17Þ
The expressions for tC and YC derived in Equations 14 and 17
are the main results of this section. They are compared in Figure 2
with the exact solution for C(t) (Equation 9); the agreement is
excellent. When combined with the conditions in Equation 12 for
a QSS to exist, they provide all the necessary information for the
design of highly optimized PCTs.
Maximizing the QSS yield and lifetime: microscopicconstraints
The advantage of having formulas Equations 14 and 17 for tC
and YC is that they enable us to identify the primary control
parameters that have the largest affect on the performance of the
PCT. From Equations 10–17 we conclude that the relevant ratios
of the five microscopic ET rates fk�,k�PA,kAP,kDP,kPDg are
a~kPD
kDP
, a�~kAP
k�PA
andb~kAP
kDP
, b�~k�
k�PA
ð18Þ
They control the formation, yield and lifetime of the charge
separated state. To make the dependence explicit, we rewrite
Equations 14 and 17 as functions of the dimensionless ratios here:
kPDtC~1zazb
bð19aÞ
yc~YC
G�(0)~
1
(1zb�)(1zazb)ð19bÞ
where kPDtC and yc are the normalized lifetime and yield,
respectively. [Note that all the individual rate constants can be
expressed in terms of an appropriate combination of the
dimensionless ratios and kPD.]
In terms of these ratios, the conditions for the formation of a
QSS in Equation 12 translates to
a%1 and a� *v 1 ð20Þ
Although no fundamental restrictions on b and b� exist, it
follows from Equation 19b that the yield is substantially suppressed
when they are *>1. Hence, to maximize the yield, we demand
Fundamental Limits of the Charge Separation Triad
PLoS ONE | www.plosone.org 4 June 2012 | Volume 7 | Issue 6 | e36065
b%1 and b�%1 ð21Þ
The condition b�%1 justifies the arguments leading to Equation
10 and therefore no new condition is obtained. Note that since
tC*1=b, a b%1 also implies long life-times. We wish to
emphasize that while restricting a and a� to %1 is necessary for
a QSS to form, the conditions on b and b� ensure a high QSS
concentration or yield and a long lifetime.
This completes our analysis of the fundamental constraints on
the microscopic rate constants derived to maximize the yield and
the lifetime of charge separated states in the QSS regime. It is
model-free in the sense that we have not utilized any particular
equation to calculate the ET rates and we have not determined
any specifics in terms of spatial constraints or electron affinities.
We have only derived the limits of optimal values for the rate
constants themselves. We now discuss in detail the physical
constraints that Equations 20 and 21 impose on the energetics and
architecture of the cofactor triads.
Engineering guidelines for optimal PCTs
The physical characteristics of a PCT involve the differences in
reduction potentials and distances between the cofactors. Such a
construct consistent with the scheme in Figure 1C is shown in
Figure 3 where the energies and the distances are marked
explicitly. Two more relevant metrics, geometric (overall size) and
energetic (efficiency), are introduced below.
Separation distanceWe believe that a linear construct is better because it maximizes
the distance between the acceptor and donor, thus preventing
relaxation by short circuiting direct electron transfer between these
sites. We note, however, that this ideal is not found in all natural
systems. The maximum distance of charge separation is thus:
RC~rAzrD ð22Þ
where rA and rD are the edge-to-edge separations of the P-A pair
and D-P pair, respectively. Since the ET rates are determined
primarily by the edge-to-edge distance [29], the width of P does
not play a part in any of the microscopic rate constants delineated
in our scheme in Figs. 1B and 3. We do not therefore include the
actual width of the primary-donor site P, which even further helps
to eliminate the short circuiting A?D electron transfer. Instead,
we introduce a second distance parameter:
Dr~rA{rD ð23Þ
that can be varied, keeping RC fixed, to optimize the output.
Charge-separation efficiencyAn optimal light-activated charge separation construct should
also maximize the available useful energy stored in the charge
separated state C~ D+PA2 (see Figure 3). The energy stored in C
can be expressed in terms of the driving force as
DG:DA~E
0={A {E
z=0D ~DG
:PA{DG
:PD (see Figure 3). Defining
the charge separation efficiency, g, as the ratio of the stored energy
DG:DA to the input photon energy, hn, we get:
g~DG
:DA
hn~
1
hn(DG
:PA{DG
:PD) ð24Þ
Thus, consideration of the reduction potentials of each cofactor
in the PCT adds a third performance metric g, to YC and tC , to
optimize.
Pho
ton
Ene
rgy
Sto
red
Ene
rgy
E P
E D
E A
k
k
k
k
k PA
AP
PD
DP
E P
DA
Ene
rgy
ΔGPD
ΔGPA
ΔG AP
ΔG
hν
rD rA
+/0
+/0
0/-
+/0
∗
∗
∗
∗
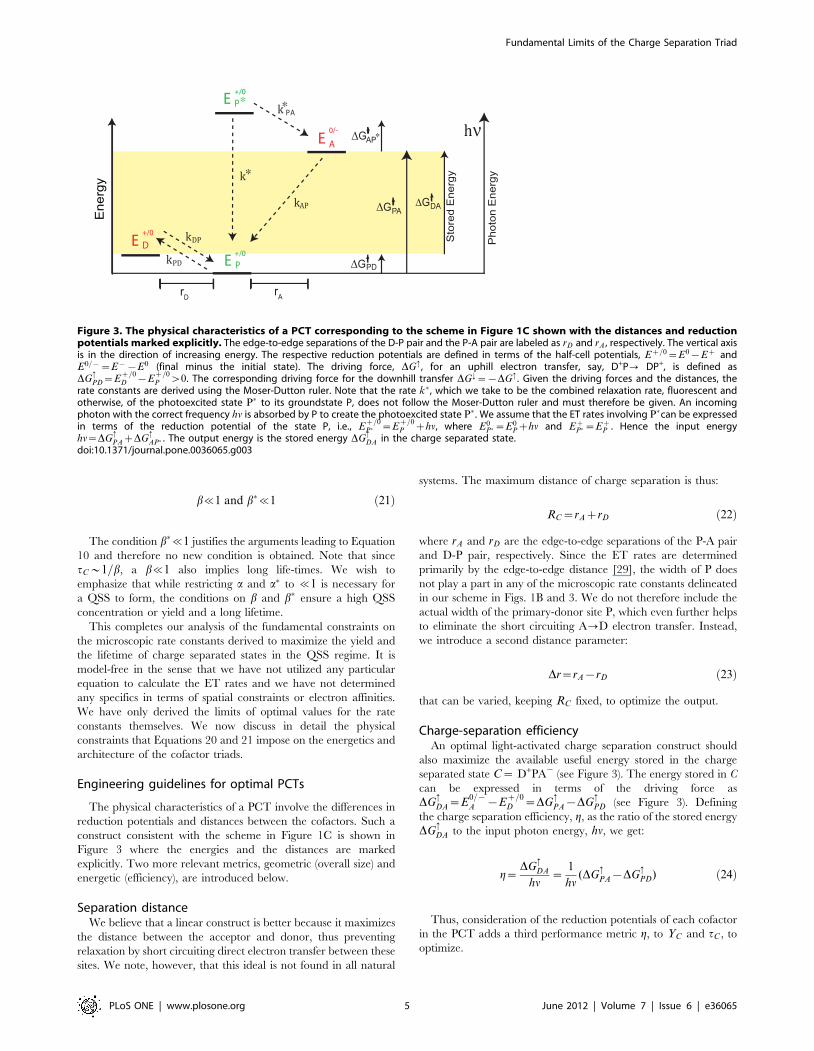
Figure 3. The physical characteristics of a PCT corresponding to the scheme in Figure 1C shown with the distances and reductionpotentials marked explicitly. The edge-to-edge separations of the D-P pair and the P-A pair are labeled as rD and rA , respectively. The vertical axisis in the direction of increasing energy. The respective reduction potentials are defined in terms of the half-cell potentials, Ez=0~E0{Ez andE0={~E{{E0 (final minus the initial state). The driving force, DG: , for an uphill electron transfer, say, D+P? DP+, is defined asDG
:PD~E
z=0D {E
z=0P w0. The corresponding driving force for the downhill transfer DG;~{DG: . Given the driving forces and the distances, the
rate constants are derived using the Moser-Dutton ruler. Note that the rate k� , which we take to be the combined relaxation rate, fluorescent andotherwise, of the photoexcited state P� to its groundstate P, does not follow the Moser-Dutton ruler and must therefore be given. An incomingphoton with the correct frequency hn is absorbed by P to create the photoexcited state P� . We assume that the ET rates involving P�can be expressedin terms of the reduction potential of the state P, i.e., E
z=0P� ~E
z=0P zhn, where E0
P�~E0Pzhn and Ez
P�~EzP . Hence the input energy
hn~DG:PAzDG
:AP� . The output energy is the stored energy DG
:DA in the charge separated state.
doi:10.1371/journal.pone.0036065.g003
Fundamental Limits of the Charge Separation Triad
PLoS ONE | www.plosone.org 5 June 2012 | Volume 7 | Issue 6 | e36065
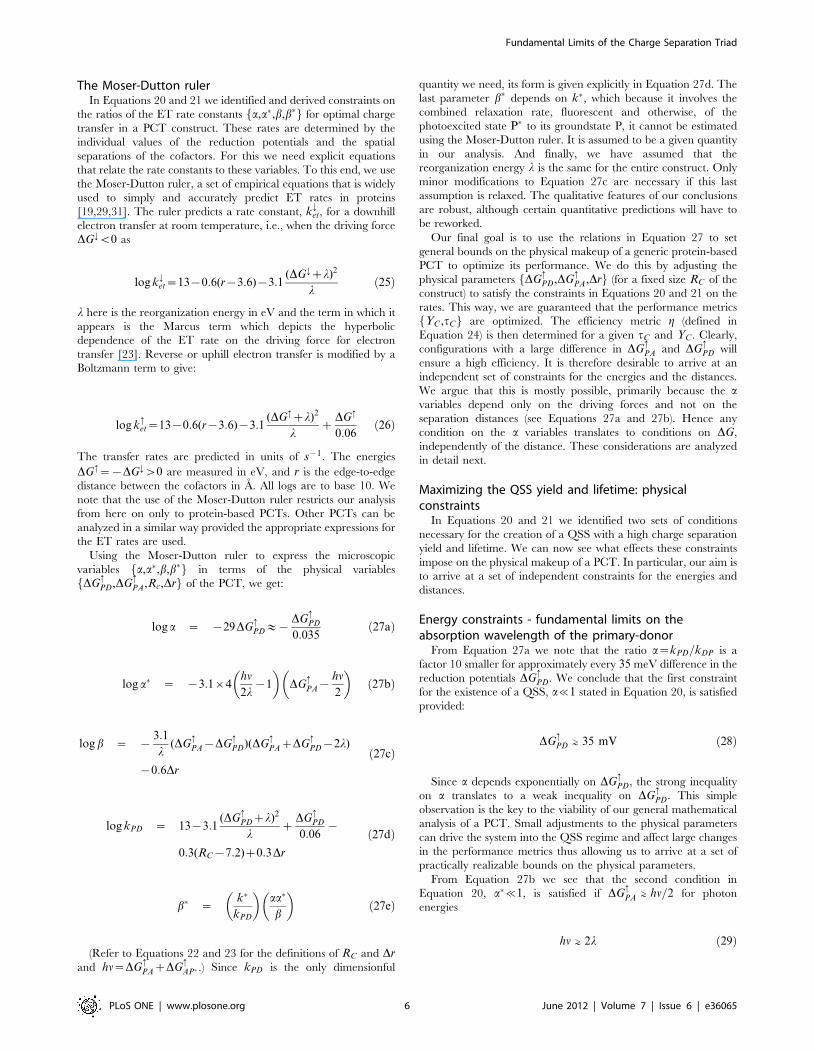
The Moser-Dutton rulerIn Equations 20 and 21 we identified and derived constraints on
the ratios of the ET rate constants fa,a�,b,b�g for optimal charge
transfer in a PCT construct. These rates are determined by the
individual values of the reduction potentials and the spatial
separations of the cofactors. For this we need explicit equations
that relate the rate constants to these variables. To this end, we use
the Moser-Dutton ruler, a set of empirical equations that is widely
used to simply and accurately predict ET rates in proteins
[19,29,31]. The ruler predicts a rate constant, k;et, for a downhill
electron transfer at room temperature, i.e., when the driving force
DG;v0 as
log k;et~13{0:6(r{3:6){3:1
(DG;zl)2
lð25Þ
l here is the reorganization energy in eV and the term in which it
appears is the Marcus term which depicts the hyperbolic
dependence of the ET rate on the driving force for electron
transfer [23]. Reverse or uphill electron transfer is modified by a
Boltzmann term to give:
log k:et~13{0:6(r{3:6){3:1
(DG:zl)2
lz
DG:
0:06ð26Þ
The transfer rates are predicted in units of s{1. The energies
DG:~{DG;w0 are measured in eV, and r is the edge-to-edge
distance between the cofactors in A. All logs are to base 10. We
note that the use of the Moser-Dutton ruler restricts our analysis
from here on only to protein-based PCTs. Other PCTs can be
analyzed in a similar way provided the appropriate expressions for
the ET rates are used.
Using the Moser-Dutton ruler to express the microscopic
variables fa,a�,b,b�g in terms of the physical variables
fDG:PD,DG
:PA,Rc,Drg of the PCT, we get:
log a ~ {29DG:PD&{
DG:PD
0:035ð27aÞ
log a� ~ {3:1|4hn
2l{1
� �DG
:PA{
hn
2
� �ð27bÞ
log b ~ {3:1
l(DG
:PA{DG
:PD)(DG
:PAzDG
:PD{2l)
{0:6Dr
ð27cÞ
log kPD ~ 13{3:1(DG
:PDzl)2
lz
DG:PD
0:06{
0:3(RC{7:2)z0:3Dr
ð27dÞ
b� ~k�
kPD
� �aa�
b
� �ð27eÞ
(Refer to Equations 22 and 23 for the definitions of RC and Drand hn~DG
:PAzDG
:AP� .) Since kPD is the only dimensionful
quantity we need, its form is given explicitly in Equation 27d. The
last parameter b� depends on k�, which because it involves the
combined relaxation rate, fluorescent and otherwise, of the
photoexcited state P� to its groundstate P, it cannot be estimated
using the Moser-Dutton ruler. It is assumed to be a given quantity
in our analysis. And finally, we have assumed that the
reorganization energy l is the same for the entire construct. Only
minor modifications to Equation 27c are necessary if this last
assumption is relaxed. The qualitative features of our conclusions
are robust, although certain quantitative predictions will have to
be reworked.
Our final goal is to use the relations in Equation 27 to set
general bounds on the physical makeup of a generic protein-based
PCT to optimize its performance. We do this by adjusting the
physical parameters fDG:PD,DG
:PA,Drg (for a fixed size RC of the
construct) to satisfy the constraints in Equations 20 and 21 on the
rates. This way, we are guaranteed that the performance metrics
fYC ,tCg are optimized. The efficiency metric g (defined in
Equation 24) is then determined for a given tC and YC . Clearly,
configurations with a large difference in DG:PA and DG
:PD will
ensure a high efficiency. It is therefore desirable to arrive at an
independent set of constraints for the energies and the distances.
We argue that this is mostly possible, primarily because the avariables depend only on the driving forces and not on the
separation distances (see Equations 27a and 27b). Hence any
condition on the a variables translates to conditions on DG,
independently of the distance. These considerations are analyzed
in detail next.
Maximizing the QSS yield and lifetime: physicalconstraints
In Equations 20 and 21 we identified two sets of conditions
necessary for the creation of a QSS with a high charge separation
yield and lifetime. We can now see what effects these constraints
impose on the physical makeup of a PCT. In particular, our aim is
to arrive at a set of independent constraints for the energies and
distances.
Energy constraints - fundamental limits on theabsorption wavelength of the primary-donor
From Equation 27a we note that the ratio a~kPD=kDP is a
factor 10 smaller for approximately every 35 meV difference in the
reduction potentials DG:PD. We conclude that the first constraint
for the existence of a QSS, a%1 stated in Equation 20, is satisfied
provided:
DG:PD *> 35 mV ð28Þ
Since a depends exponentially on DG:PD, the strong inequality
on a translates to a weak inequality on DG:PD. This simple
observation is the key to the viability of our general mathematical
analysis of a PCT. Small adjustments to the physical parameters
can drive the system into the QSS regime and affect large changes
in the performance metrics thus allowing us to arrive at a set of
practically realizable bounds on the physical parameters.
From Equation 27b we see that the second condition in
Equation 20, a�%1, is satisfied if DG:PA *> hn=2 for photon
energies
hn *> 2l ð29Þ
Fundamental Limits of the Charge Separation Triad
PLoS ONE | www.plosone.org 6 June 2012 | Volume 7 | Issue 6 | e36065
The low energy range hn *v 2l results in a small DG:PA
*vhn=2 which reduces the efficiency as seen from Equation24,
and is therefore not a useful range for our purpose.
Equation 21 presents the constraints necessary to maximize the
yield YC . The energy dependent term for b in Equation 27c is
formed out of the product of the sum and difference of the driving
forces. The difference term is proportional to the efficiency g and
is therefore always positive. To maintain b%1 for all g, the sum
must satisfy DG:PAzDG
:PD *> 2l. Since a large DG
:PAwDG
:PD
increases the efficiency from Equation 24, for practical purposes it
is sufficient to ensure that DG:PAw2l. The two conditions for
DG:PA can be combined as:
maxhn
2,2l
� �*v DG
:PA *v hn ð30Þ
where max½a,b� implies the larger of the two variables a and b.
Thus, a DG:PAw2l satisfies conditions for both high YC and g,
and a DG:PAv2l will either result in a loss of efficiency or yield.
We thus predict that high yield, high efficiency QSS formation in a
triad requires that back electron transfer from A to P be so
downhill as to be well into the Marcus inverted region (see
Figure 4.) This greatly slows the rate of this ET, allowing the donor
molecule time to re-reduce the primary-donor molecule.
The upper limit is necessary to facilitate the electron transfer
from the photoexcited primary-donor P�?A. This, however, has
certain limitations: as DG:PA approaches the photoexcitation
energy hn, the back ET governed by the uphill rate k�:AP (which
is set to zero in our scheme) will become relevant - see Figure 3.
This will provide yet another route for the charge separated state
to decay to the groundstate thus reducing the performance.
Hence, we put an upper cut-off on DG:PA. To obtain this upper
cut-off, we study the behavior of the ratio of the uphill vs downhill
rates using the Moser-Dutton ruler and find that (similar to the
ratio a in Equation 27a)
logk�:AP
k�PA
!~{
DG:AP�
0:035~{
(hn{DG:PA)
0:035ð31Þ
This clearly suggests that as long as the uphill driving force
DG:AP�~hn{DG
:PAw35 meV, the back reaction is exponentially
suppressed. By direct simulation (not shown here), we find that our
results obtained by setting k�:AP~0 are unaffected if a difference of
the order of 60{100 meV or higher is maintained. Although
larger values will reduce the efficiency, a difference of 100 meV
affects the efficiency by less than 10%.
Finally, we analyze b� in Equation 27e. Since it can be
expressed in terms of the ratios a,a� and b, no new energy
constraints can be obtained. Instead, we show below that requiring
b�%1 (Equation 21) provides useful insight into the geometrical
construction of the PCT.
Distance constraints - optimal placement of the threecofactors
Since b�*1=b (see Equation 27e), maintaining b%1 can only
be done at the expense of increasing b� which is counterproductive
as we require both b and b�%1 for maximum yield (Equation 21).
An optimal compromise can be reached by adjusting the distance
Dr~rA{rD. To see this, we write the Dr dependence explicitly in
Equation 27e by combining it with Equations 33 and 34 to give
log b�*0:3Drz(energy{dependent terms). Hence, once the
energy terms are optimized for a fixed total length RC , we predict
that arranging for
Drv0 ð32Þ
will significantly reduce b�. Provided b%1, an order-of-magnitude
suppression of b? is achieved if 0:3Dr*{1, i.e., Dr*{3 A.
Hence, Dr can be fine-tuned to increase the yield.
There is a relatively simple physical explanation for our
prediction. This is due in part to the fact that while electron
transfer rates in proteins are strongly distance dependent, the
equilibria are not. As noted in Equation 19b, there are three pairs
of rate constants which determine quantum yield, of which the aparameter involves electron transfers that are the forward and
reverse of each other between P and D. Since ratios involving
forward and backward rates for any particular triad are not
dependent on distance, the a parameter is distance independent.
On the other hand, the remaining two pairs, b� and b, are
distance dependent: the first is the initial ET between A and P
which competes with the relaxation processes encompassed by k?.In this case the actual rate, and therefore the distance, plays a
direct role in the final yield. This constrains the primary-donor
and acceptor cofactors to be close enough to out-compete k?. The
second is the competing pair of electron transfers which can occur
from state I: reverse electron transfer from A to P forming G vs. the
formation of C by electron transfer from D to P. This second pair
is a weaker constraint given the fact that electron transfer from A
to P is well into the Marcus inverted region. Viewed in this light it
is not surprising that optimal arrangements move the primary-
donor and acceptor closer together (see Figure 4 for a
demonstration of this using commonly observed parameters).
The full dependence of YC and g on Dr are discussed further in
the discussion.
Finally, regarding the total size RC~rAzrD: the RC depen-
dence of tC and YC in Equations 19a and 19b are fully governed
by the rate constant kPD defined in Equation 27d. It follows that
2 hh /2
G PA
G
GPA
log10(rate)
∗
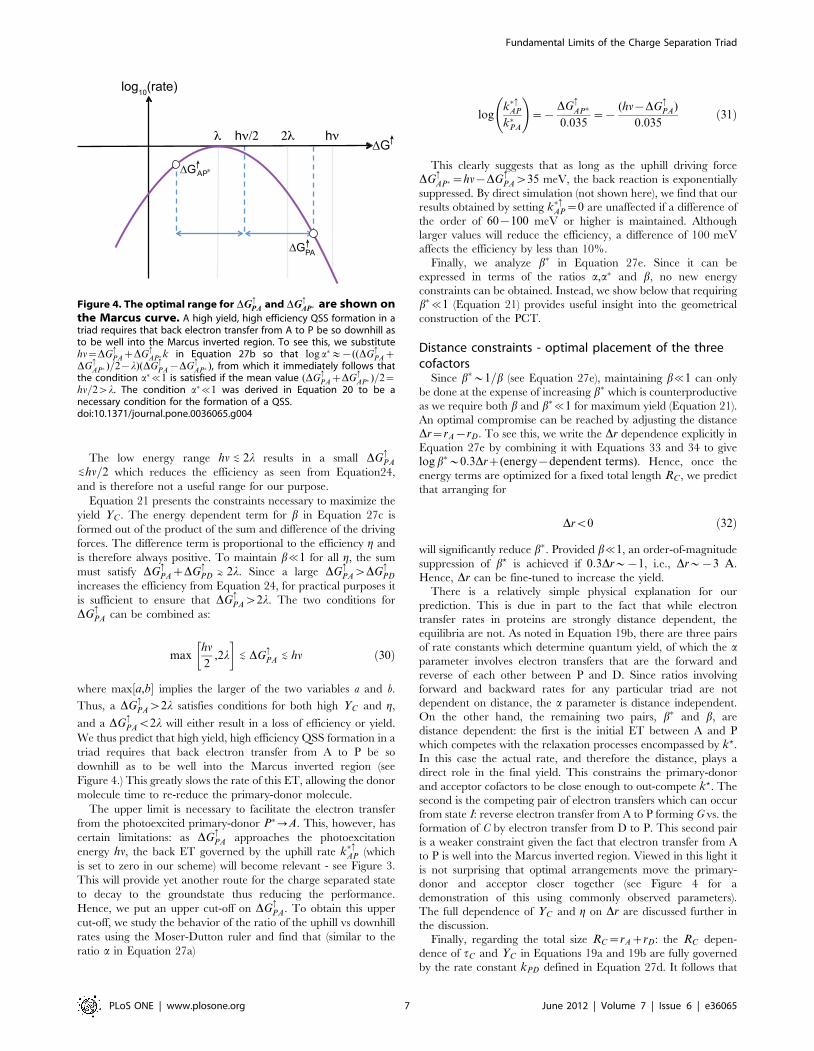
Figure 4. The optimal range for DG:PA and DG:
AP� are shown onthe Marcus curve. A high yield, high efficiency QSS formation in atriad requires that back electron transfer from A to P be so downhill asto be well into the Marcus inverted region. To see this, we substitutehn~DG
:PAzDG
:AP�k in Equation 27b so that log a�&{((DG
:PAz
DG:AP� )=2{l)(DG
:PA{DG
:AP� ), from which it immediately follows that
the condition a�%1 is satisfied if the mean value (DG:PAzDG
:AP� )=2~
hn=2wl. The condition a�%1 was derived in Equation 20 to be anecessary condition for the formation of a QSS.doi:10.1371/journal.pone.0036065.g004
Fundamental Limits of the Charge Separation Triad
PLoS ONE | www.plosone.org 7 June 2012 | Volume 7 | Issue 6 | e36065
while the lifetime grows with RC as tC&100:3RC , the yield is
suppressed as YC&1=(1zconstant|100:3RC ).This completes our analysis of the fundamental constraints on
the physical parameters for an optimized PCT. The guidelines
listed in Equations 28–32 are relevant to any protein based PCTs
where the Moser-Dutton ruler is applicable.
Discussion
In Equations 28–32, we arrived at a set of constraints on the
physical makeup of a high performance PCT capable of creating
and maintaining a high yield charge separated state in a QSS for a
significant length of time. We now apply these results to study the
efficiency of such PCTs.
While analysis of many PCT constructs focus on the charge
separation lifetime, tC [6], it is clear that the arrangement which
gives the longest possible lifetime will oftentimes make a less
efficient solar energy conversion component. The charge separat-
ed state must only last as long as the mechanism for extracting this
potential energy requires. After this condition is met, factors which
maximize the yield and efficiency of QSS formation (YC and g) are
paramount, as these determine the eventual power output. Thus,
in the following we fix the lifetime tC~1 ms in our analysis.
In Figure 5, we start with a set of parameters that are typical of
photonic energy transduction in proteins: The reorganization
energy l varies in the range of 0.7 to 1.4 eV for cofactors bound
within typical native proteins, with l taking higher values with
decreasing hydrophobicity in the local cofactor environment [19].
Light frequencies are in the near infrared and higher. We use
l~0:7 eV and hn~1:8 eV (690 nm) as a starting point. Note that
hnw2l is satisfied consistent with Equation 29. To satisfy the
energy constraint in Equation 30, we choose the range
DG:PA~1:4{1:7 eV. [Note that the highest value for DG
:PA is
100 meV less than hn for the reasons described following Equation
31.] Electron tunneling distances in biology range from 4–14 A,
with the shorter limit that of Van der Waals contact and the longer
setting a millisecond time limit on electron transfer rates [29,31].
Hence, the sum of the distances between the cofactors are typically
in the range 8AƒRCƒ28A; we use RC~16A. Instead of
specifying the final parameter, DG:PD, we specify the QSS lifetime
tC~1 ms and solve Equation 19a for DG:PD for different values of
DG:PA and Dr (for a fixed RC ). For self-consistency, we check that
the DG:PD values obtained using these parameters all satisfy
Equation 28 in the optimal range.
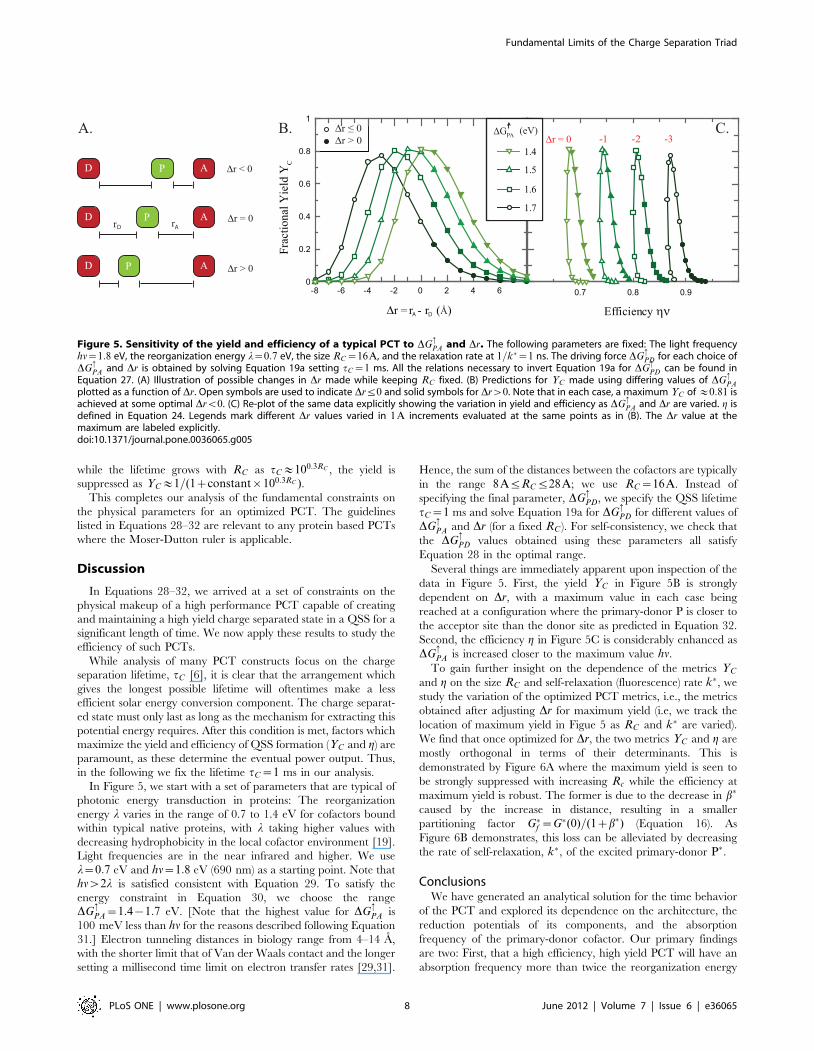
Several things are immediately apparent upon inspection of the
data in Figure 5. First, the yield YC in Figure 5B is strongly
dependent on Dr, with a maximum value in each case being
reached at a configuration where the primary-donor P is closer to
the acceptor site than the donor site as predicted in Equation 32.
Second, the efficiency g in Figure 5C is considerably enhanced as
DG:PA is increased closer to the maximum value hn.
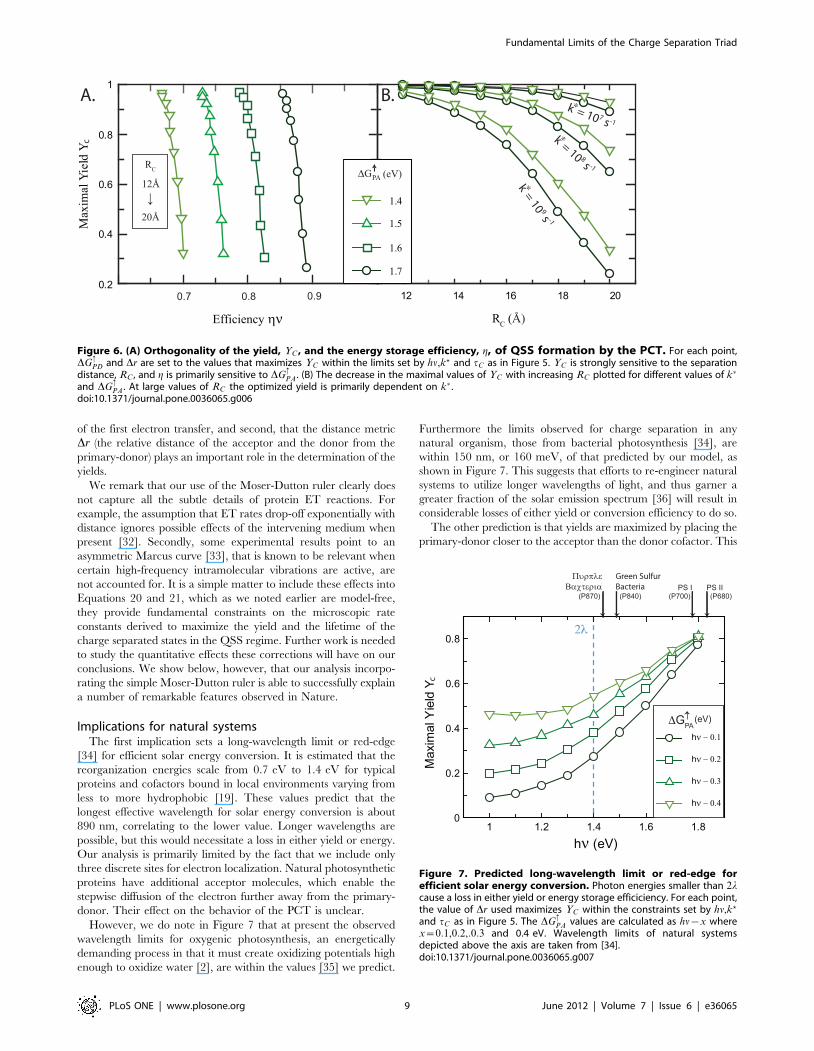
To gain further insight on the dependence of the metrics YC
and g on the size RC and self-relaxation (fluorescence) rate k�, we
study the variation of the optimized PCT metrics, i.e., the metrics
obtained after adjusting Dr for maximum yield (i.e, we track the
location of maximum yield in Figue 5 as RC and k� are varied).
We find that once optimized for Dr, the two metrics YC and g are
mostly orthogonal in terms of their determinants. This is
demonstrated by Figure 6A where the maximum yield is seen to
be strongly suppressed with increasing Rc while the efficiency at
maximum yield is robust. The former is due to the decrease in b�
caused by the increase in distance, resulting in a smaller
partitioning factor G�f ~G�(0)=(1zb�) (Equation 16). As
Figure 6B demonstrates, this loss can be alleviated by decreasing
the rate of self-relaxation, k�, of the excited primary-donor P�.
ConclusionsWe have generated an analytical solution for the time behavior
of the PCT and explored its dependence on the architecture, the
reduction potentials of its components, and the absorption
frequency of the primary-donor cofactor. Our primary findings
are two: First, that a high efficiency, high yield PCT will have an
absorption frequency more than twice the reorganization energy
Frac
tiona
l Yie
ld Y
C
Efficiency ην
-3 -2 -1 Δr = 0
D AP
D AP
D AP
r r Δr = 0
Δr < 0
Δr > 0
A. B. C.
Δr =
r - r (Å)0.7 0.8 0.9
Δr ≤ 0Δr > 0
A D
AD
-8 -6 -4 -2 0 2 4 60
0.2
0.4
0.6
0.8
1
1.4
1.5
1.6
(eV)ΔGPA
1.7
Figure 5. Sensitivity of the yield and efficiency of a typical PCT to DG:PA and Dr. The following parameters are fixed: The light frequency
hn~1:8 eV, the reorganization energy l~0:7 eV, the size RC~16A, and the relaxation rate at 1=k�~1 ns. The driving force DG:PD for each choice of
DG:PA and Dr is obtained by solving Equation 19a setting tC~1 ms. All the relations necessary to invert Equation 19a for DG
:PD can be found in
Equation 27. (A) Illustration of possible changes in Dr made while keeping RC fixed. (B) Predictions for YC made using differing values of DG:PA
plotted as a function of Dr. Open symbols are used to indicate Drƒ0 and solid symbols for Drw0. Note that in each case, a maximum YC of &0:81 isachieved at some optimal Drv0. (C) Re-plot of the same data explicitly showing the variation in yield and efficiency as DG
:PA and Dr are varied. g is
defined in Equation 24. Legends mark different Dr values varied in 1A increments evaluated at the same points as in (B). The Dr value at themaximum are labeled explicitly.doi:10.1371/journal.pone.0036065.g005
Fundamental Limits of the Charge Separation Triad
PLoS ONE | www.plosone.org 8 June 2012 | Volume 7 | Issue 6 | e36065
of the first electron transfer, and second, that the distance metric
Dr (the relative distance of the acceptor and the donor from the
primary-donor) plays an important role in the determination of the
yields.
We remark that our use of the Moser-Dutton ruler clearly does
not capture all the subtle details of protein ET reactions. For
example, the assumption that ET rates drop-off exponentially with
distance ignores possible effects of the intervening medium when
present [32]. Secondly, some experimental results point to an
asymmetric Marcus curve [33], that is known to be relevant when
certain high-frequency intramolecular vibrations are active, are
not accounted for. It is a simple matter to include these effects into
Equations 20 and 21, which as we noted earlier are model-free,
they provide fundamental constraints on the microscopic rate
constants derived to maximize the yield and the lifetime of the
charge separated states in the QSS regime. Further work is needed
to study the quantitative effects these corrections will have on our
conclusions. We show below, however, that our analysis incorpo-
rating the simple Moser-Dutton ruler is able to successfully explain
a number of remarkable features observed in Nature.
Implications for natural systemsThe first implication sets a long-wavelength limit or red-edge
[34] for efficient solar energy conversion. It is estimated that the
reorganization energies scale from 0.7 eV to 1.4 eV for typical
proteins and cofactors bound in local environments varying from
less to more hydrophobic [19]. These values predict that the
longest effective wavelength for solar energy conversion is about
890 nm, correlating to the lower value. Longer wavelengths are
possible, but this would necessitate a loss in either yield or energy.
Our analysis is primarily limited by the fact that we include only
three discrete sites for electron localization. Natural photosynthetic
proteins have additional acceptor molecules, which enable the
stepwise diffusion of the electron further away from the primary-
donor. Their effect on the behavior of the PCT is unclear.
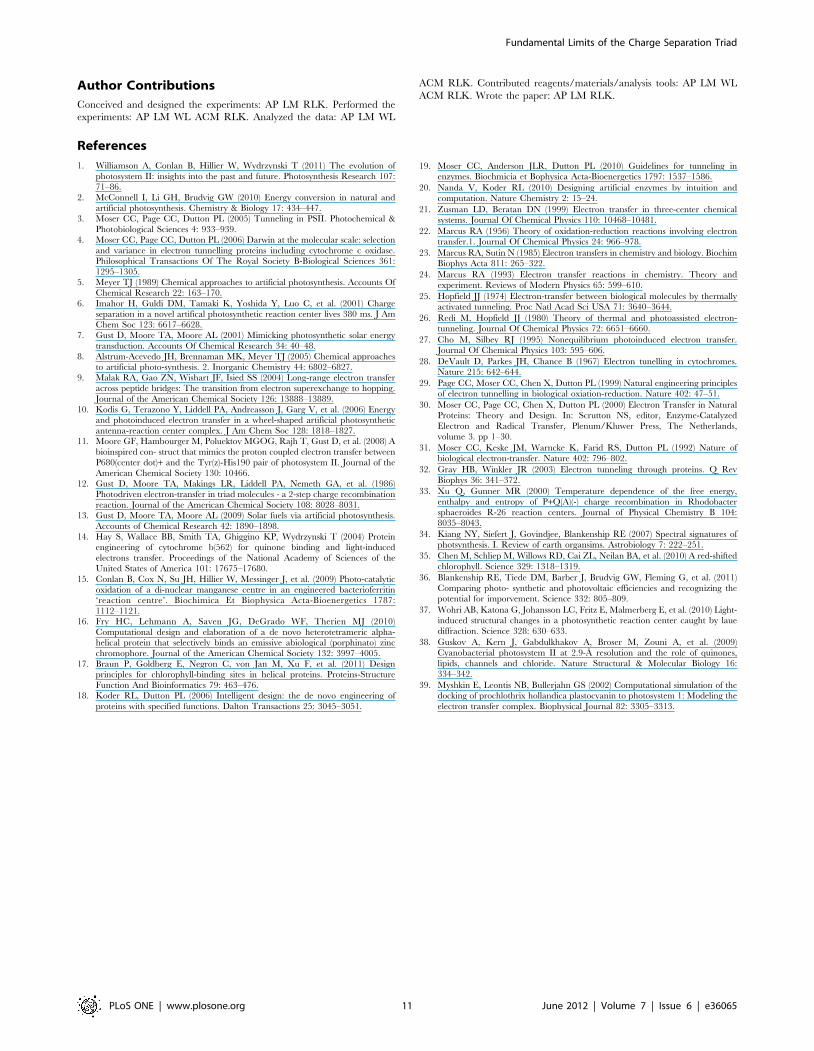
However, we do note in Figure 7 that at present the observed
wavelength limits for oxygenic photosynthesis, an energetically
demanding process in that it must create oxidizing potentials high
enough to oxidize water [2], are within the values [35] we predict.
Furthermore the limits observed for charge separation in any
natural organism, those from bacterial photosynthesis [34], are
within 150 nm, or 160 meV, of that predicted by our model, as
shown in Figure 7. This suggests that efforts to re-engineer natural
systems to utilize longer wavelengths of light, and thus garner a
greater fraction of the solar emission spectrum [36] will result in
considerable losses of either yield or conversion efficiency to do so.
The other prediction is that yields are maximized by placing the
primary-donor closer to the acceptor than the donor cofactor. This
RC (Å)
12 14 16 18 20
Max
imal
Yie
ld Y
0.2
0.4
0.6
0.8
1
k = 10 9 s -1
k = 10 8 s -1
k = 10 7 s -1
c
A0.7 0.8 0.9
Efficiency ην
RC
12Å→
20Å
∗
∗
∗
ΔGPA (eV)
1.4
1.5
1.6
1.7
A. B.
Figure 6. (A) Orthogonality of the yield, YC , and the energy storage efficiency, g, of QSS formation by the PCT. For each point,DG
:PD and Dr are set to the values that maximizes YC within the limits set by hn,k? and tC as in Figure 5. YC is strongly sensitive to the separation
distance, RC , and g is primarily sensitive to DG:PA . (B) The decrease in the maximal values of YC with increasing RC plotted for different values of k�
and DG:PA . At large values of RC the optimized yield is primarily dependent on k� .
doi:10.1371/journal.pone.0036065.g006
hν (eV)1 1.2 1.4 1.6 1.8
Max
imal
Yie
ld Y
0
0.2
0.4
0.6
0.8
hν − 0.1
ΔGPA(eV)
2
(P870) (P840)PS I
(P700)PS II(P680)
hν − 0.2
hν − 0.3
hν − 0.4
ΠυρπλεΒαχτερια
Green SulfurBacteria
c
Figure 7. Predicted long-wavelength limit or red-edge forefficient solar energy conversion. Photon energies smaller than 2lcause a loss in either yield or energy storage efficiciency. For each point,the value of Dr used maximizes YC within the constraints set by hn,k?
and tC as in Figure 5. The DG:PA values are calculated as hn{x where
x~0:1,0:2,:0:3 and 0.4 eV. Wavelength limits of natural systemsdepicted above the axis are taken from [34].doi:10.1371/journal.pone.0036065.g007
Fundamental Limits of the Charge Separation Triad
PLoS ONE | www.plosone.org 9 June 2012 | Volume 7 | Issue 6 | e36065
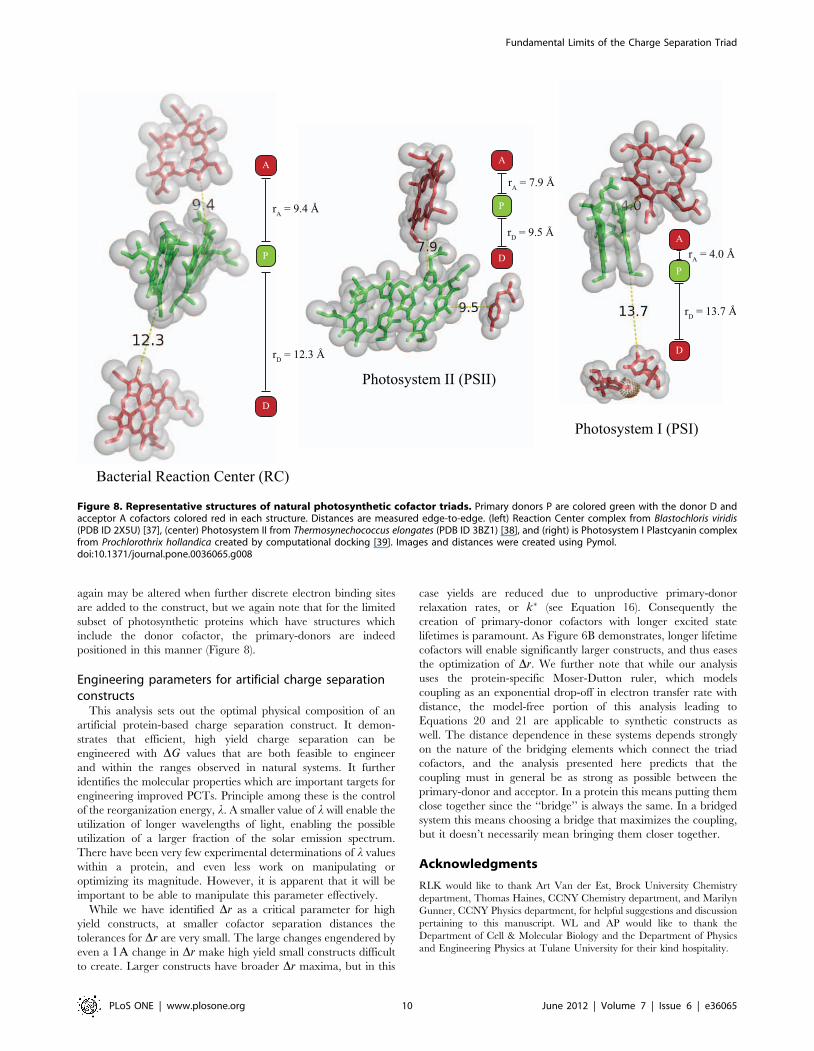
again may be altered when further discrete electron binding sites
are added to the construct, but we again note that for the limited
subset of photosynthetic proteins which have structures which
include the donor cofactor, the primary-donors are indeed
positioned in this manner (Figure 8).
Engineering parameters for artificial charge separationconstructs
This analysis sets out the optimal physical composition of an
artificial protein-based charge separation construct. It demon-
strates that efficient, high yield charge separation can be
engineered with DG values that are both feasible to engineer
and within the ranges observed in natural systems. It further
identifies the molecular properties which are important targets for
engineering improved PCTs. Principle among these is the control
of the reorganization energy, l. A smaller value of l will enable the
utilization of longer wavelengths of light, enabling the possible
utilization of a larger fraction of the solar emission spectrum.
There have been very few experimental determinations of l values
within a protein, and even less work on manipulating or
optimizing its magnitude. However, it is apparent that it will be
important to be able to manipulate this parameter effectively.
While we have identified Dr as a critical parameter for high
yield constructs, at smaller cofactor separation distances the
tolerances for Dr are very small. The large changes engendered by
even a 1A change in Dr make high yield small constructs difficult
to create. Larger constructs have broader Dr maxima, but in this
case yields are reduced due to unproductive primary-donor
relaxation rates, or k� (see Equation 16). Consequently the
creation of primary-donor cofactors with longer excited state
lifetimes is paramount. As Figure 6B demonstrates, longer lifetime
cofactors will enable significantly larger constructs, and thus eases
the optimization of Dr. We further note that while our analysis
uses the protein-specific Moser-Dutton ruler, which models
coupling as an exponential drop-off in electron transfer rate with
distance, the model-free portion of this analysis leading to
Equations 20 and 21 are applicable to synthetic constructs as
well. The distance dependence in these systems depends strongly
on the nature of the bridging elements which connect the triad
cofactors, and the analysis presented here predicts that the
coupling must in general be as strong as possible between the
primary-donor and acceptor. In a protein this means putting them
close together since the ‘‘bridge’’ is always the same. In a bridged
system this means choosing a bridge that maximizes the coupling,
but it doesn’t necessarily mean bringing them closer together.
Acknowledgments
RLK would like to thank Art Van der Est, Brock University Chemistry
department, Thomas Haines, CCNY Chemistry department, and Marilyn
Gunner, CCNY Physics department, for helpful suggestions and discussion
pertaining to this manuscript. WL and AP would like to thank the
Department of Cell & Molecular Biology and the Department of Physics
and Engineering Physics at Tulane University for their kind hospitality.
rA = 7.9 Å
rA = 4.0 Å
A
P
D
A
P
D
rD = 9.5 Å
rD = 13.7 Å
D
A
P
rD = 12.3 Å
rA = 9.4 Å
Photosystem II (PSII)
Bacterial Reaction Center (RC)
Photosystem I (PSI)
Figure 8. Representative structures of natural photosynthetic cofactor triads. Primary donors P are colored green with the donor D andacceptor A cofactors colored red in each structure. Distances are measured edge-to-edge. (left) Reaction Center complex from Blastochloris viridis(PDB ID 2X5U) [37], (center) Photosystem II from Thermosynechococcus elongates (PDB ID 3BZ1) [38], and (right) is Photosystem I Plastcyanin complexfrom Prochlorothrix hollandica created by computational docking [39]. Images and distances were created using Pymol.doi:10.1371/journal.pone.0036065.g008
Fundamental Limits of the Charge Separation Triad
PLoS ONE | www.plosone.org 10 June 2012 | Volume 7 | Issue 6 | e36065
Author Contributions
Conceived and designed the experiments: AP LM RLK. Performed the
experiments: AP LM WL ACM RLK. Analyzed the data: AP LM WL
ACM RLK. Contributed reagents/materials/analysis tools: AP LM WL
ACM RLK. Wrote the paper: AP LM RLK.
References
1. Williamson A, Conlan B, Hillier W, Wydrzynski T (2011) The evolution of
photosystem II: insights into the past and future. Photosynthesis Research 107:71–86.
2. McConnell I, Li GH, Brudvig GW (2010) Energy conversion in natural andartificial photosynthesis. Chemistry & Biology 17: 434–447.
3. Moser CC, Page CC, Dutton PL (2005) Tunneling in PSII. Photochemical &
Photobiological Sciences 4: 933–939.4. Moser CC, Page CC, Dutton PL (2006) Darwin at the molecular scale: selection
and variance in electron tunnelling proteins including cytochrome c oxidase.Philosophical Transactions Of The Royal Society B-Biological Sciences 361:
1295–1305.
5. Meyer TJ (1989) Chemical approaches to artificial photosynthesis. Accounts OfChemical Research 22: 163–170.
6. Imahor H, Guldi DM, Tamaki K, Yoshida Y, Luo C, et al. (2001) Chargeseparation in a novel artifical photosynthetic reaction center lives 380 ms. J Am
Chem Soc 123: 6617–6628.7. Gust D, Moore TA, Moore AL (2001) Mimicking photosynthetic solar energy
transduction. Accounts Of Chemical Research 34: 40–48.
8. Alstrum-Acevedo JH, Brennaman MK, Meyer TJ (2005) Chemical approachesto artificial photo-synthesis. 2. Inorganic Chemistry 44: 6802–6827.
9. Malak RA, Gao ZN, Wishart JF, Isied SS (2004) Long-range electron transferacross peptide bridges: The transition from electron superexchange to hopping.
Journal of the American Chemical Society 126: 13888–13889.
10. Kodis G, Terazono Y, Liddell PA, Andreasson J, Garg V, et al. (2006) Energyand photoinduced electron transfer in a wheel-shaped artificial photosynthetic
antenna-reaction center complex. J Am Chem Soc 128: 1818–1827.11. Moore GF, Hambourger M, Poluektov MGOG, Rajh T, Gust D, et al. (2008) A
bioinspired con- struct that mimics the proton coupled electron transfer between
P680(center dot)+ and the Tyr(z)-His190 pair of photosystem II. Journal of theAmerican Chemical Society 130: 10466.
12. Gust D, Moore TA, Makings LR, Liddell PA, Nemeth GA, et al. (1986)Photodriven electron-transfer in triad molecules - a 2-step charge recombination
reaction. Journal of the American Chemical Society 108: 8028–8031.13. Gust D, Moore TA, Moore AL (2009) Solar fuels via artificial photosynthesis.
Accounts of Chemical Research 42: 1890–1898.
14. Hay S, Wallace BB, Smith TA, Ghiggino KP, Wydrzynski T (2004) Proteinengineering of cytochrome b(562) for quinone binding and light-induced
electrons transfer. Proceedings of the National Academy of Sciences of theUnited States of America 101: 17675–17680.
15. Conlan B, Cox N, Su JH, Hillier W, Messinger J, et al. (2009) Photo-catalytic
oxidation of a di-nuclear manganese centre in an engineered bacterioferritin‘reaction centre’. Biochimica Et Biophysica Acta-Bioenergetics 1787:
1112–1121.16. Fry HC, Lehmann A, Saven JG, DeGrado WF, Therien MJ (2010)
Computational design and elaboration of a de novo heterotetrameric alpha-helical protein that selectively binds an emissive abiological (porphinato) zinc
chromophore. Journal of the American Chemical Society 132: 3997–4005.
17. Braun P, Goldberg E, Negron C, von Jan M, Xu F, et al. (2011) Designprinciples for chlorophyll-binding sites in helical proteins. Proteins-Structure
Function And Bioinformatics 79: 463–476.18. Koder RL, Dutton PL (2006) Intelligent design: the de novo engineering of
proteins with specified functions. Dalton Transactions 25: 3045–3051.
19. Moser CC, Anderson JLR, Dutton PL (2010) Guidelines for tunneling inenzymes. Biochmicia et Bophysica Acta-Bioenergetics 1797: 1537–1586.
20. Nanda V, Koder RL (2010) Designing artificial enzymes by intuition andcomputation. Nature Chemistry 2: 15–24.
21. Zusman LD, Beratan DN (1999) Electron transfer in three-center chemicalsystems. Journal Of Chemical Physics 110: 10468–10481.
22. Marcus RA (1956) Theory of oxidation-reduction reactions involving electrontransfer.1. Journal Of Chemical Physics 24: 966–978.
23. Marcus RA, Sutin N (1985) Electron transfers in chemistry and biology. BiochimBiophys Acta 811: 265–322.
24. Marcus RA (1993) Electron transfer reactions in chemistry. Theory andexperiment. Reviews of Modern Physics 65: 599–610.
25. Hopfield JJ (1974) Electron-transfer between biological molecules by thermallyactivated tunneling. Proc Natl Acad Sci USA 71: 3640–3644.
26. Redi M, Hopfield JJ (1980) Theory of thermal and photoassisted electron-tunneling. Journal Of Chemical Physics 72: 6651–6660.
27. Cho M, Silbey RJ (1995) Nonequilibrium photoinduced electron transfer.Journal Of Chemical Physics 103: 595–606.
28. DeVault D, Parkes JH, Chance B (1967) Electron tunelling in cytochromes.Nature 215: 642–644.
29. Page CC, Moser CC, Chen X, Dutton PL (1999) Natural engineering principlesof electron tunnelling in biological oxiation-reduction. Nature 402: 47–51.
30. Moser CC, Page CC, Chen X, Dutton PL (2000) Electron Transfer in NaturalProteins: Theory and Design. In: Scrutton NS, editor, Enzyme-Catalyzed
Electron and Radical Transfer, Plenum/Kluwer Press, The Netherlands,
volume 3. pp 1–30.
31. Moser CC, Keske JM, Warncke K, Farid RS, Dutton PL (1992) Nature of
biological electron-transfer. Nature 402: 796–802.
32. Gray HB, Winkler JR (2003) Electron tunneling through proteins. Q Rev
Biophys 36: 341–372.
33. Xu Q, Gunner MR (2000) Temperature dependence of the free energy,
enthalpy and entropy of P+Q(A)(-) charge recombination in Rhodobactersphaeroides R-26 reaction centers. Journal of Physical Chemistry B 104:
8035–8043.
34. Kiang NY, Siefert J, Govindjee, Blankenship RE (2007) Spectral signatures of
photsynthesis. I. Review of earth organsims. Astrobiology 7: 222–251.
35. Chen M, Schliep M, Willows RD, Cai ZL, Neilan BA, et al. (2010) A red-shifted
chlorophyll. Science 329: 1318–1319.
36. Blankenship RE, Tiede DM, Barber J, Brudvig GW, Fleming G, et al. (2011)
Comparing photo- synthetic and photovoltaic efficiencies and recognizing thepotential for imporvement. Science 332: 805–809.
37. Wohri AB, Katona G, Johansson LC, Fritz E, Malmerberg E, et al. (2010) Light-induced structural changes in a photosynthetic reaction center caught by laue
diffraction. Science 328: 630–633.
38. Guskov A, Kern J, Gabdulkhakov A, Broser M, Zouni A, et al. (2009)
Cyanobacterial photosystem II at 2.9-A resolution and the role of quinones,
lipids, channels and chloride. Nature Structural & Molecular Biology 16:334–342.
39. Myshkin E, Leontis NB, Bullerjahn GS (2002) Computational simulation of thedocking of prochlothrix hollandica plastocyanin to photosystem 1: Modeling the
electron transfer complex. Biophysical Journal 82: 3305–3313.
Fundamental Limits of the Charge Separation Triad
PLoS ONE | www.plosone.org 11 June 2012 | Volume 7 | Issue 6 | e36065
Related Documents