1 Fund manager skill: Does selling matters more than buying? Liang Jin and Richard Taffler * First draft: January 2016 ABSTRACT This study explores whether mutual fund managers have “bad” skill that can persistently affect fund performance. By decomposing aggregate characteristic-timing performance into buying and selling components we show that, while on average fund managers are able to generate positive characteristic- timing returns when buying stocks, they exhibit a “striking” ability to sell stocks at the wrong time. A closer look reveals that fund managers making purely valuation-motivated purchases generate significant timing returns, but are not able to do so when compelled to work off excess cash from investor inflows. More importantly, fund managers do not demonstrate any timing performance from their selling decisions, even when they are mostly motivated by valuation beliefs. Further results show that fund managers who possess superior selling ability are also significantly better at buying stocks than other fund managers and, as a result, earn significantly greater aggregate characteristic-timing returns. Surprisingly, fund managers who appear to buy stocks well are not able to outperform other funds when selling stocks, and overall are unable to generate superior returns. Keywords: mutual funds, characteristic-timing ability, trade motivation, investment performance, valuation beliefs * Both authors from the Finance Group, University of Warwick, Warwick Business School, Coventry, CV4 7AL, United Kingdom, Respective e-mail addresses are [email protected] and [email protected].

Welcome message from author
This document is posted to help you gain knowledge. Please leave a comment to let me know what you think about it! Share it to your friends and learn new things together.
Transcript
1
Fund manager skill: Does selling matters more than
buying?
Liang Jin and Richard Taffler*
First draft: January 2016
ABSTRACT
This study explores whether mutual fund managers have “bad” skill that can persistently affect fund
performance. By decomposing aggregate characteristic-timing performance into buying and selling
components we show that, while on average fund managers are able to generate positive characteristic-
timing returns when buying stocks, they exhibit a “striking” ability to sell stocks at the wrong time. A
closer look reveals that fund managers making purely valuation-motivated purchases generate
significant timing returns, but are not able to do so when compelled to work off excess cash from
investor inflows. More importantly, fund managers do not demonstrate any timing performance from
their selling decisions, even when they are mostly motivated by valuation beliefs. Further results show
that fund managers who possess superior selling ability are also significantly better at buying stocks
than other fund managers and, as a result, earn significantly greater aggregate characteristic-timing
returns. Surprisingly, fund managers who appear to buy stocks well are not able to outperform other
funds when selling stocks, and overall are unable to generate superior returns.
Keywords: mutual funds, characteristic-timing ability, trade motivation, investment performance,
valuation beliefs
* Both authors from the Finance Group, University of Warwick, Warwick Business School, Coventry, CV4 7AL,
United Kingdom, Respective e-mail addresses are [email protected] and [email protected].
2
Fund manager skill: Does selling matters more than
buying?
1. Introduction
Despite the vast amount of resource fund managers expend, and the high management fees charged to
fund investors, whether fund managers have investment skills or talents to deliver exceptional returns
to fund investors still remains an open question. Prior literature on the performance of actively managed
mutual funds paints a disheartening picture of active funds on average failing to outperform passive
benchmarks and failing to add value for fund investors.2 The consensus view is that only a small number
of fund managers, if any at all, are able to identify and profit from mispriced stocks,3 and there is little
evidence of fund manager timing ability. Early studies such as Treynor and Mazuy (1966), Chang and
Lewellen (1984), and Henriksson (1984) suggest that significant market timing ability is rare among
mutual fund managers. The most puzzling aspect of the empirical evidence in most of such studies is
that average timing performance across mutual funds is negative, and that mutual fund managers who
exhibit superior market timing ability show negative performance more often than positive
performance. Using more sophisticated tests, more recent studies such as Becker et al (1999) and Jiang
(2003) still fail to provide convincing evidence that funds have superior timing ability.
Extant studies identify and measure timing ability by running non-linear regressions of realized fund
returns against contemporaneous market returns (return-based measure). However, this approach can
lead to misleading inferences regarding market timing ability. First, in a non-linear regression
framework, spurious timing ability can appear to exist due to factors other than active timing strategies
of fund managers. Jagannathan and Korajczyk (1986) demonstrate that certain dynamic trading
strategies by mutual funds might give rise to a negative non-linear relationship between fund and market
returns. Second, most existing studies assume that market timing strategies are implemented in a
specific way. Elton et al (2012) argue that fund managers might choose to time in a more complicated
way. Third, Goetzmann, et al (2000) and Bollen and Busse (2001) argue that return-based methods
employ monthly return information, and thus ignore active timing and trading between observations of
fund returns, leading to negatively-biased timing ability. Recent studies such as Jiang et al (2007) and
2 See e.g., Jensen (1968), Friend et al (1970), Lehmann and Modest (1987), Elton et al (1993), Malkiel (1995), Carhart (1997),
Fama and French (2010) and others. 3 See e.g., Pástor and Stambaugh (2002), Kacperczyk et al (2005, 2008), Kosowski et al (2006), Cremers and Petajisto (2009),
Barras et al (2010), Huang et al (2011) and others.

3
Kaplan and Sensoy (2008) propose alternative market timing measures based on mutual fund portfolio
holdings (holding-based measure). Using a single-index model, these authors find that mutual fund
managers have significant timing ability, which is opposite to what has been found in prior return-based
studies. However, Elton et al (2012) show that the positive timing ability identified by the single-index
model actually turns out to be negative timing ability. Overall, there is also little empirical evidence to
suggest that mutual fund managers are able to time the market or exploit time-varying stock
characteristic returns.
One possible reason for this unfavourable view of fund manager timing ability is that extant work on
timing ability has concentrated on investigating whether mutual fund managers or a subset of them have
timing ability by testing the market timing performance in aggregate which might not necessarily be a
good indicator of the timing skills mutual fund managers really possess. Mutual fund managers might
be able to perform some tasks well, but they might be not good at other tasks. As a result, superior
performance deriving from positive skill can be cancelled out by poor performance from negative skill,
which perhaps explains the lack of evidence of fund managers’ timing skills documented in the
literature.
One set of potential candidates for such distinct investment skills consists of buying and selling abilities.
Sell decisions are assumed in traditional finance literature to be the other side of the coin to buy
decisions, but investment practitioners often find themselves tending to have more trouble with sell
decisions than they do with buy decisions. Norris (2002) expresses concern that behavioral and
emotional biases can be highly influential in shaping investors’ decisions to sell stocks and argues that
a decision to sell stocks involves changing investors’ minds about the prospects of their investments,
which can be particularly difficult in the investment world, where investors are swamped with
incomplete information. The behavioral finance literature recognizes the existence of such differential
investment behaviors, and explains how sell decisions are more likely to be susceptible to the operation
of cognitive heuristics and biases. It suggests that buy decisions may be more forward looking in terms
of prospective performance while sell decisions may be more backward looking focusing on past
performance. In particular, several studies of selling behavior in natural and experimental markets
provide evidence that investors are more reluctant to realize losses than gains (Odean, 1998; Weber and
Camerer, 1998). Shefrin and Statman (1985) label this phenomenon the “disposition effect”. Working
with a discount brokerage database, Odean (1998) finds that retail investors tend to selling winning
stocks rather than losing stocks using the original purchase price as a reference point. A similar pattern
can also be found in other markets such as the housing market (Genesove and Mayer, 2001). Genesove
and Mayer (2001) show that house sellers tend to set an asking price that exceeds the asking price of
other sellers with comparable houses when the expected selling price is below their original purchase
price. Researchers find that it is very hard to explain the tendency of selling winners over losers in a
rational trading framework (e.g., Barberis and Thaler, 2003). On the other hand, a number of behavioral
4
explanations have been suggested such as the concavity (convexity) of the value function in the domain
of gains (losses) from prospect theory (e.g., Kahneman and Tversky, 1979).
These studies mostly provide evidence that retail investors tend to have difficulty to make sell decisions
in a disciplined way. While there is little doubt that behavioral biases can play an adverse role in sell
decisions and therefore can be harmful to investment performance from the individual investors’ point
view, there is rare empirical evidence on the more critical question of whether professional investors
such as mutual fund managers who play a dominating role in financial market are also bad at selling. A
survey conducted by Cabot Research and the CFA Institute provides direct evidence that mutual fund
managers have to rely on subjective judgment to shape their sell decisions, rather than more quantitative
or research based methods (Cabot Research, 2007). In particular, more than 80% of participants in their
survey indicate that judgment plays an important role in making sell decisions and over 70% of the
respondents indicate that their decisions are formed from experience, trial and error, and advice from
past mentors. If it is more difficult to make disciplined investment decisions in the sell domain than the
buy domain, then the lack of evidence of overall mutual fund performance along the market-timing and
characteristic-timing dimensions documented in the literature might mask the existence of positive
buying but negative selling skills.
To investigate whether mutual fund managers exhibit distinct trading skills, this study evaluates the
timing ability of mutual fund managers by employing the characteristic-timing measure of Daniel et al
(1997) decomposing estimated aggregate characteristic-timing performance into its buying and selling
components. Specifically, we utilise mutual fund holdings to explore directly whether increases or
decreases in portfolio weightings along the three stock characteristics of size, book-to-market, and
momentum effect, are able to forecast future returns. This approach not only allows researchers to better
capture the dynamic aspects of actively managed portfolios but also avoid the “artificial timing” bias
that is usually found in return-based measures. Using the CRSP Mutual Fund Holdings Dataset with a
broad sample of 3,384 unique U.S. actively managed domestic equity funds from September 2003 to
December 2013, this study finds no evidence that mutual fund managers exhibit significant aggregate
characteristic-timing performance, which is consistent with the literature (e.g., Daniel et al, 1997).
However, there is strong evidence that fund managers possess distinct trading abilities. In particular,
mutual fund managers on average earn characteristic-timing returns of 1.42% per year when adding
stocks to their portfolios, indicating that fund managers possess abilities in the buy domain. On the other
hand, fund managers appear to exhibit negative characteristic-timing skill when selling stocks with
average characteristic-timing returns of no less than -1.78% per year, significant at the 5% level.
This study also examines whether characteristic timing abilities persist over time by sorting mutual fund
portfolios into quintiles based on their past characteristic-timing performance and then tracking the
future performance of each performance quintile. There is strong persistence of aggregate
5
characteristic-timing performance in the negative domain, at least over the following four quarters,
suggesting that mutual fund managers do not possess characteristic-timing ability in aggregate. A subset
of fund managers tend to have poor timing ability that persistently hurts their overall portfolio
performance. More importantly, results reveal that fund managers who exhibit superior characteristic-
timing performance when buying stocks in the past tend to continue performing buying tasks well in
the near term, while those who were the worst performers for selling stocks tend to underperform in the
selling domain over the following quarter. In other words, a small number of mutual fund managers
have “hot” hands in buying stocks, while another subset of fund managers have “icy” hands in selling
stocks in the short term. Any apparent extreme negative (positive) performance for buying (selling)
seems to be due to bad (good) luck.
In further examination of potential distinct trading skills, this study considers the fact that the natural
structure of open-end mutual funds can often force fund managers to trade for reasons other than their
valuation beliefs, which is mostly overlooked by previous studies in the literature. In fact, not only
mutual fund managers provide investors with valuation expertise and diversified equity positions, but
also offer low direct costs for liquidity to investors. They are required by law to pay a proportional share
of the net asset value of the fund to investors who choose to redeem fund shares. This unique structural
design of open-end mutual funds actually allows fund investors to buy and redeem fund shares without
paying a large premium for immediate liquidity needs. However, this provision of low cost liquidity
imposes significant indirect trading costs on open-end funds (e.g., Chordia, 1996; Edelen, 1999; and
Nanda et al, 2000). Fund managers themselves must engage in costly trades in response to significant
fund flows. Significant investor inflows can compel fund managers to work off excessive cash by
purchasing stocks, even if none of these stocks are believed to be undervalued at the time; similarly,
significant investor outflows will constrain fund managers by forcing them to control liquidity in their
portfolio by disposing of stocks, even if these stocks are perceived to be under-priced. In effect, such
liquidity-driven trades play the role of uninformed trades and cause fund managers to act as noisy
traders who should experience losses to other informed traders in a rational expectation framework.4
Grossman and Stiglitz (1980) suggest that uninformed trades should underperform informed trades that
represent fund managers’ valuation beliefs. Thus, any performance metric that does not account for
funds’ flow-induced trading can yield negatively biased inferences regarding fund manager trading
skills that they really possess (e.g., Edelen, 1999). In particular, the adverse effect of fund flows on sell
decisions can be particularly severe. This is because fund managers with large inflows might have more
flexibility in their investment decisions: they can temporarily accumulate cash for unexpected
redemption needs and postpone their equity investment decisions, and can immediately open new
positions or expand their current holdings. On the other hand, when experiencing significant outflows,
4 See e.g., Grossman (1976); Hellwig (1980); and Verrcecchia (1982).
6
fund managers without enough cash reserves have no other options available but to sell their assets
immediately at fire sale prices (Coval and Stafford, 2007; Zhang, 2010).
A more appropriate indicator of fund managers’ skill should be based only on trades motivated by
valuation beliefs (e.g., Alexander et al, 2007). However fund managers’ beliefs are not observable, and
consequently the key challenge in studies on mutual fund performance is to identify ex ante valuation-
motivated trades. Cohen et al (2011) label each manager’s highest estimated alpha holding as his “best
idea” and show fund managers’ “best idea” generate superior performance. Similarly, Pomorski (2009)
shows that when multiple funds in the same fund family trade the same stock in the same direction, that
stock outperforms. In order to separate various trading motivations, this study follows the approach of
Alexander et al (2007) to condition trades on the direction and magnitude of concurrent realised net
fund flows. The rationale is that fund managers who face severe outflows would buy stocks that are
perceived to be significantly undervalued, and thus a larger proportion of the purchases they make in
their portfolios are likely to be motivated by valuation beliefs. On the other hand, when experiencing
significant inflows, fund managers are compelled to work off excess cash, and thus a smaller proportion
of the purchases in their portfolios are likely to be valuation-based ones. Symmetrical intuition applies
to fund managers’ sales of stocks.
Indeed, our analysis shows that the performance of mutual fund trades is significantly related to the
motivation behind fund managers’ trading decisions. In particular, fund managers making purely
valuation-based buys generate significant characteristic-timing performance of about 1.90% per year (t
= 2.19), but are not able to do so when they are compelled to work off excessive cash from investor
inflows. On the other hand, valuation-motivated sales significantly outperform liquidity-driven sales by
an average of 0.69% per year at the 5% significance level. More importantly, fund managers appear to
have a striking ability to sell stocks at the wrong time. Sales of stocks are associated with negative and
significant characteristic-timing returns of -1.57% per year (t = 1.94), even when sells are most likely
to be motivated by their valuation beliefs. These results are robust when using multivariate regressions
to control for other mutual fund characteristics that might be related to the performance of fund trades.
These findings confirm that observed fund managers’ distinct trading skills are not driven by the adverse
effect of fund flows, and that fund managers are not able to generate characteristic-timing performance
from their selling decisions.
In addition, most studies on mutual fund performance view fund managers as a homogeneous class of
professional investor, and to the best of our knowledge the literature has not yet explored whether
different groups of fund managers possess different trading skills. A group of fund managers might
specialize in buying decisions and another group of fund managers might be expert at selling decisions,
or a small subset of fund managers might successfully perform both buying and selling tasks. In
particular, since selling decisions are susceptible to behavioral bias, fund managers who can manage to
7
make sell decisions in a more disciplined and research-based way may be more likely to possess general
investment ability. By identifying the top 25% of funds in terms of their selling (buying) ability, this
study provides strong evidence that these “good sellers” outperform other fund managers when selling
stocks on a statistically significant basis by an average of 1.35% per year, and they also significantly
outperform others when purchasing stocks by an average of 0.87% per year. On the other hand,
although “good buyers” by construction do exhibit good characteristic-timing performance when
adding stocks to their portfolios, they are unable to do the same when selling stocks, and give their
buying returns back as a result. Whereas “good sellers” exhibit statistically and economically
significant outperformance of 0.31% per year in aggregate characteristic-timing performance terms,
good buyers do not. These results are consistent with the notion that sell decisions are particularly
susceptible to behavioral bias, and are not made in a way as disciplined as buying decisions might be.
Our analysis suggests that a small subset of fund managers skilled in selling possess investment ability
that can lead to significant outperformance.
Our study contributes to the literature on mutual fund performance. While the majority of prior studies
evaluate fund managers’ skills using the conventional approach which only considers aggregate mutual
fund performance, this study decomposes overall timing performance into different trading components
and reveals that fund managers appear to possess positive buying skill and negative selling skills. In
this way we are able to offer a potential explanation for the lack of evidence of overall mutual fund
performance documented in the literature.
Our research is closely related to Chen et al (2013) who identify differential trading skills for a small
number of “star” growth-oriented mutual fund managers. However, their study can be subject to some
criticisms. Chen et al (2013) use at least 36 months of past monthly fund returns data to identify superior
performing funds. This sample selection procedure not only excludes young mutual funds that do not
have a sufficiently long return history, but also induces survivorship bias. Their analysis might also
overestimate the trading skills along both buying and selling dimensions because their small group of
growth-oriented mutual fund managers are more likely to possess genuine skill, rather than luck
(Kosowski et al, 2006). Our findings therefore support and complement their argument with direct
evidence that such distinct buying and selling characteristics-timing abilities exist in a much broader
sample of virtually all U.S. domestic actively managed equity funds, and these trading skills are not
driven by luck.
Our study also makes a significant contribution over and above Chen et al (2013) and others by
considering the potential adverse effect of flow-induced trading on trade performance. First, although
the academic literature recognises that liquidity-induced trades are costly (Edelen, 1999), there are few
empirical studies that directly investigate the costs of liquidity provision on actual fund trades. One
notable exception is Alexander et al (2007) who place emphasis on fund managers’ stock picking ability
8
and show that valuation-motivated trades outperform liquidity-driven trades. Our study contributes to
the literature by showing that trade motivation also matters for characteristic-timing ability, even after
controlling for fund characteristics and time fixed effects. Second, our results show that fund managers
appear to exhibit significantly negative characteristic-timing performance from their selling decisions,
even when most of these sales are motivated by fund managers’ valuation beliefs. Third, our study
contributes to the literature by showing that a small subset of fund managers who specialise in making
sell decisions (good sellers) also possess buying skill and exhibit superior aggregate performance while
those who have the best record of buying performance (good buyers) exhibit negative selling ability,
suggesting that the performance deriving from fund managers’ selling activities is a more powerful
indicator of overall fund manager skills.
The remainder of this study is organized as follows. Section 2 describes the performance and other
relevant fund characteristics measurements used in this study. Section 3 describes the data sources and
sample construction. Section 4 discusses the results and findings and Section 5 concludes.
2. Methodology
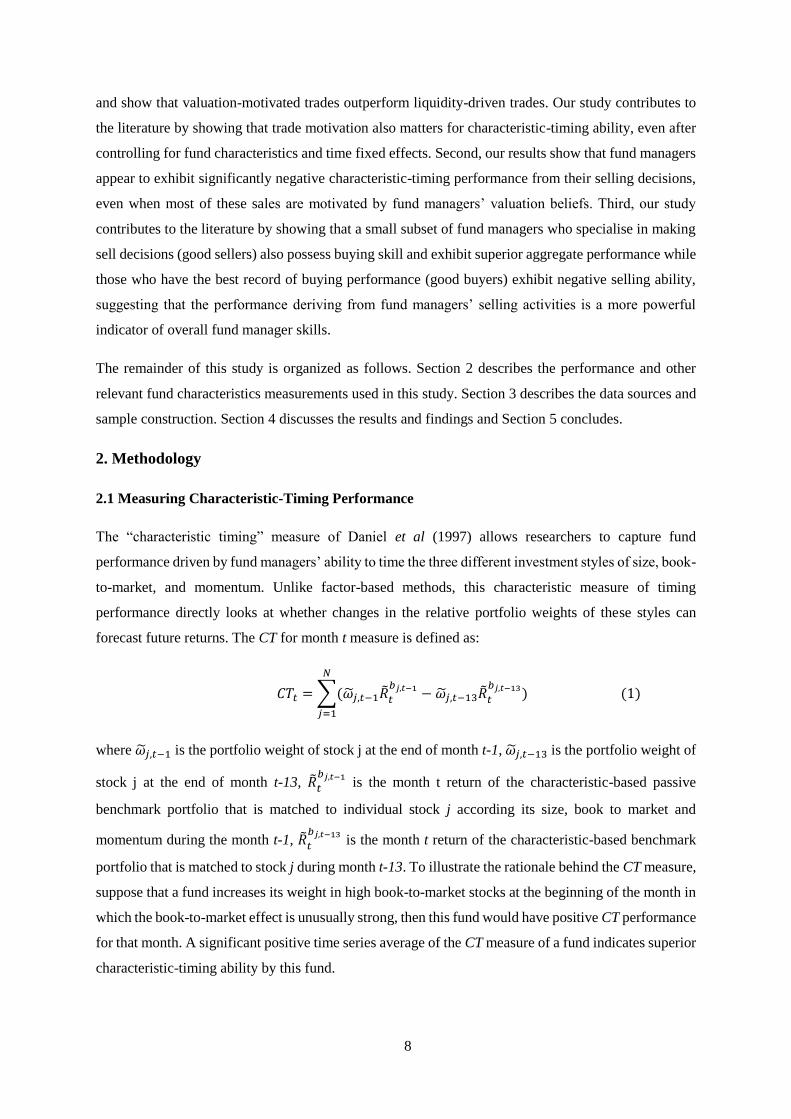
2.1 Measuring Characteristic-Timing Performance
The “characteristic timing” measure of Daniel et al (1997) allows researchers to capture fund
performance driven by fund managers’ ability to time the three different investment styles of size, book-
to-market, and momentum. Unlike factor-based methods, this characteristic measure of timing
performance directly looks at whether changes in the relative portfolio weights of these styles can
forecast future returns. The CT for month t measure is defined as:
𝐶𝑇𝑡 = ∑(�̃�𝑗,𝑡−1�̃�𝑡
𝑏𝑗,𝑡−1 − �̃�𝑗,𝑡−13�̃�𝑡
𝑏𝑗,𝑡−13)
𝑁
𝑗=1
(1)
where �̃�𝑗,𝑡−1 is the portfolio weight of stock j at the end of month t-1, �̃�𝑗,𝑡−13 is the portfolio weight of
stock j at the end of month t-13, �̃�𝑡
𝑏𝑗,𝑡−1 is the month t return of the characteristic-based passive
benchmark portfolio that is matched to individual stock j according its size, book to market and
momentum during the month t-1, �̃�𝑡
𝑏𝑗,𝑡−13 is the month t return of the characteristic-based benchmark
portfolio that is matched to stock j during month t-13. To illustrate the rationale behind the CT measure,
suppose that a fund increases its weight in high book-to-market stocks at the beginning of the month in
which the book-to-market effect is unusually strong, then this fund would have positive CT performance
for that month. A significant positive time series average of the CT measure of a fund indicates superior
characteristic-timing ability by this fund.
9
This characteristic-based approach requires the construction of passive benchmark portfolios that are
matched to individual stocks in the mutual fund portfolios with the dimensions of market value of equity
(size), book-to-market ratio (btm), and momentum effect (mom). This paper constructs passive
benchmark portfolios according to the procedure detailed in Daniel et al (1997). Briefly, at the end of
June each year, the common stocks listed from the NYSE, AMEX, and NASDAQ are categorized into
three quintile groups based on individual stock size, book to market ratio and prior year return and
consequently 5 × 5 × 5 sorted characteristic-based portfolios are formed. The monthly returns of these
benchmark portfolios are calculated as the monthly value weighted returns of the stocks in the 125
portfolios. The detailed procedure is provided in Daniel et al (1997).
2.2 Measuring Buying and Selling Performance
Chen et al (2013) point out that the traditional CT measure, which is simply calculated by aggregating
the characteristic timing performance of all holdings, would mask the distinct characteristic timing
ability of buying and selling. This study follows Chen et al (2013) in decomposing the aggregate CT
performance into different trading components. Specifically, for each fund, we measure the changes in
number of shares held in each stock from the end of quarter t-1 to the end of quarter t for each quarter
in the sample period. Increases in the number of shares are treated as buys and aggregated to form the
buy portfolio, and decreases are aggregated to form the sell portfolio, for each fund each quarter. This
study then calculates the characteristic-timing performance for each trading portfolio.
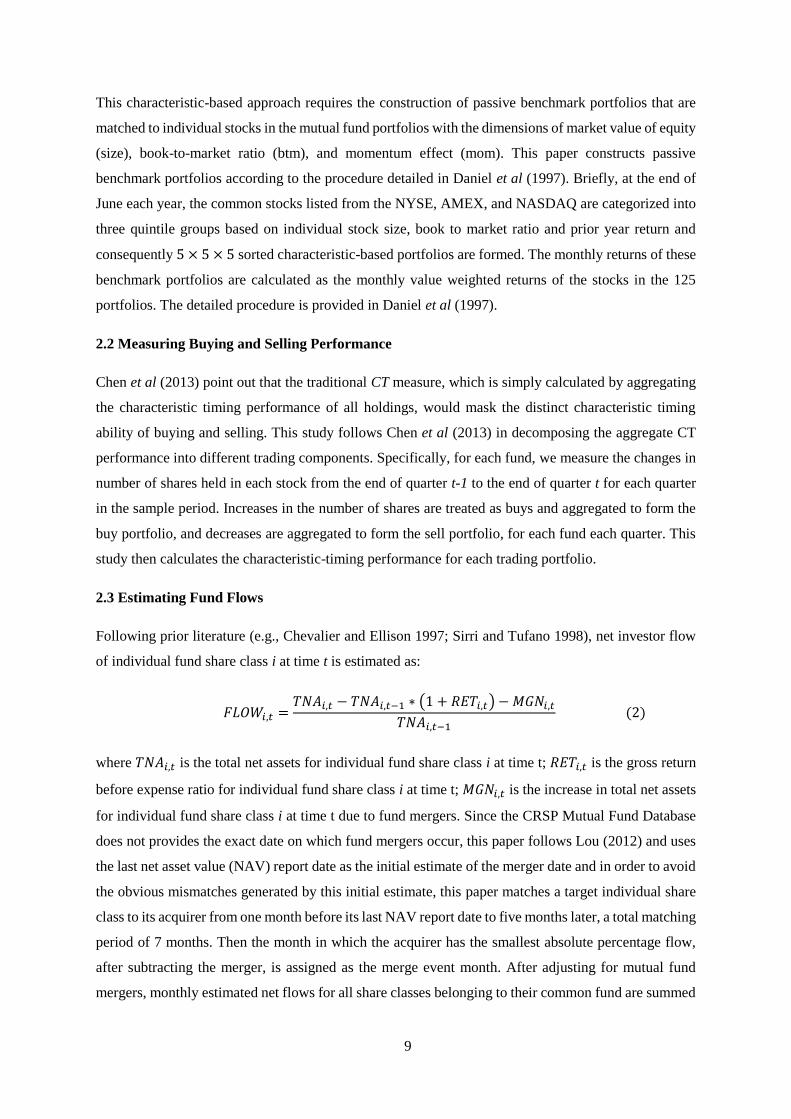
2.3 Estimating Fund Flows
Following prior literature (e.g., Chevalier and Ellison 1997; Sirri and Tufano 1998), net investor flow
of individual fund share class i at time t is estimated as:
𝐹𝐿𝑂𝑊𝑖,𝑡 =𝑇𝑁𝐴𝑖,𝑡 − 𝑇𝑁𝐴𝑖,𝑡−1 ∗ (1 + 𝑅𝐸𝑇𝑖,𝑡) − 𝑀𝐺𝑁𝑖,𝑡
𝑇𝑁𝐴𝑖,𝑡−1 (2)
where 𝑇𝑁𝐴𝑖,𝑡 is the total net assets for individual fund share class i at time t; 𝑅𝐸𝑇𝑖,𝑡 is the gross return
before expense ratio for individual fund share class i at time t; 𝑀𝐺𝑁𝑖,𝑡 is the increase in total net assets
for individual fund share class i at time t due to fund mergers. Since the CRSP Mutual Fund Database
does not provides the exact date on which fund mergers occur, this paper follows Lou (2012) and uses
the last net asset value (NAV) report date as the initial estimate of the merger date and in order to avoid
the obvious mismatches generated by this initial estimate, this paper matches a target individual share
class to its acquirer from one month before its last NAV report date to five months later, a total matching
period of 7 months. Then the month in which the acquirer has the smallest absolute percentage flow,
after subtracting the merger, is assigned as the merge event month. After adjusting for mutual fund
mergers, monthly estimated net flows for all share classes belonging to their common fund are summed
10
to obtain the total fund level monthly estimated flow. Monthly fund flows during the corresponding
quarter are then aggregated into the quarter flow. This paper assumes that investor inflows and outflows
take place at the end of each quarter, and investors reinvest their dividends and capital appreciation
distributions in the same fund.
2.4 Measuring Trade Motivation
To measure trade motivation, this paper follows Alexander et al (2007) and divides fund manager
trading activities into different types and track the characteristic-timing performance of trades, based
on the various motivations driving them. Specifically, for each fund i, trade in stock j made by the fund
manager is estimated as the change in the number of shares held in stock j between two consecutive
reports from time t-1 and time t in the sample period and trade dollar volume for each stock j is
calculated by multiplying each change by the appropriate stock price which is the average daily closing
stock price between the two consecutive report dates when the trade is assumed to occur. Trades
associated with increased number of shares are treated as buys and then summed to obtain total purchase
volume 𝐵𝑈𝑌𝑖,𝑡for fund i at time t and trades associated with decreased number of shares are aggregated
to form the total sell volume 𝑆𝐸𝐿𝐿𝑖,𝑡 for fund i at time t. Buy flow score (𝐵𝐹𝑖,𝑡) and sell flow score
(𝑆𝐹𝑖,𝑡) that are used as proxies for trade motivation are defined respectively as:
𝐵𝐹𝑖,𝑡 =𝐵𝑈𝑌𝑖,𝑡 − 𝐹𝐿𝑂𝑊𝑖,𝑡
𝑇𝑁𝐴𝑖,𝑡−1 (3)
𝑆𝐹𝑖,𝑡 =𝑆𝐸𝐿𝐿𝑖,𝑡 + 𝐹𝐿𝑂𝑊𝑖,𝑡
𝑇𝑁𝐴𝑖,𝑡−1 (4)
where 𝐹𝐿𝑂𝑊𝑖,𝑡 is the estimated net investor flow into/out of fund i during quarter t, and 𝑇𝑁𝐴𝑖,𝑡−1 is
fund i total net assets under management at the end of quarter t-1. This paper follows Alexander et al
(2007) in dividing the time series of portfolios of each fund’s holdings that existed during the sample
period into five quintiles. The 𝐵𝐹𝑖,𝑡 metric assigns buy portfolios of funds with high total buy dollar
volume and high investor outflows to the top quintile, BF1, and buy portfolios with low total buy dollar
volume and high investor inflow to the bottom quintile, BF5. This ranking procedure, according to
Alexander et al (2007), deals appropriately with possible serial and cross-sectional trading patterns and
correlations that might be present in the holdings data and therefore could bias results in unexpected
ways.
BF1 refers to cases where despite a need to raise cash to meet investors outflows, mutual funds will
only purchase stocks that are strongly believed to be undervalued, which infers that a large proportion
of the buys in these buy portfolios are likely to be motivated by valuation considerations. On the other
hand, BF5 refers to those cases where mutual fund managers might be forced to invest the excess cash
11
from large investor inflows into stocks that are not perceived to be undervalued, and therefore a small
proportion of buys in these buy portfolios are likely to be valuation motivated. Similarly, 𝑆𝐹𝑖,𝑡 assigns
sell portfolios with high total sell dollar volume with high investor inflows when a large proportion of
sells in these sell portfolios are likely to be driven by valuation motivation to the top quintile, SF1, and
sell portfolios with low total sell dollar volume with high investor outflows when a small proportion of
sells in these sell portfolios are likely to be driven by valuation motivation to the bottom quintile, SF5
For illustration purposes, consider an example of the two scenario used by Alexander et al (2007) where
a fund holds total net assets of $100 million at the beginning of two quarterly report dates. During the
quarter of the first report, the fund undergoes net outflows of $10 million and purchase $5 million worth
of stocks, while during the quarter of the second report, this fund experiences inflows of $15 million
and buys $10 million worth of stocks. The 𝐵𝐹𝑖,𝑡 metric assigns the higher score of 0.15 = [5 - (-10)] /
100 to buy portfolios for the first report that are more likely to have a larger proportion of valuation-
motivated trades, while it assigns a lower score of -0.05 = (10 - 15) / 100 for the second report which
has a larger proportions of liquidity-motivated trades. Symmetrical intuition also applies to the 𝑆𝐹𝑖,𝑡
metric.
2.5 Measuring Active Style Drift
The characteristic-timing measure is designed to see whether, and by how much mutual fund managers
are able to generate additional performance by increasing (or decreasing) portfolio weights on stock
characteristics along the dimensions of size, book to market, and momentum when trading strategies
focused on these stock characteristics are most profitable (or unprofitable). However, the characteristic-
timing measure is not able to reflect how and to what extent mutual fund managers adjust their portfolio
weights across these three different characteristics. In particular, characteristic-timing performance can
be generated from passively holding the same stocks in portfolios over time because of fund managers’
preference for certain overall stock characteristics, or from active engagement in chasing stock
characteristics when they become profitable, or even from aggressive style drift from one equity style
category to another one.
In order to investigate the relationship between style drift and characteristic-timing performance, this
study employs the non-parametric measure developed by Wermers (2012) which allows us to identify
the style characteristics of each stock held by mutual funds over time and to track the difference in
overall stock style, in each of the three dimensions of size, book-to-market and momentum, in mutual
fund portfolio holdings between two periods.
The total style drift of a managed portfolio in style dimension l (where l = size, book-to-market, or
momentum) at portfolio reporting date is measured as:
12
𝑇𝑆𝐷𝑞𝑙 = ∑(�̃�𝑗,𝑞�̃�𝑗,𝑞
𝑙 − �̃�𝑗,𝑞−1�̃�𝑗,𝑞−1𝑙 )
𝑁
𝑗=1
(5)
where �̃�𝑗,𝑞 is the portfolio weight on stock j at the end of quarter q and �̃�𝑗,𝑞−1 is the portfolio weight
on stock j at the end of quarter q-1, while �̃�𝑗,𝑞𝑙 equals the non-parametric style characteristic of stock j
in style dimension l at the end of quarter q and �̃�𝑗,𝑞−1𝑙 equals the non-parametric style characteristic of
stock j in style dimension l at the end of quarter q-1.
The total style drift can be further decomposed into active style drift that results from active changes in
the portfolio through trades of stocks, and passive style drift that results from passively holding stocks
with changing holding weights and stock characteristics:
TSD𝑞𝑙 = 𝑃𝑆𝐷𝑞
𝑙 + 𝐴𝑆𝐷𝑞𝑙 (6)
where 𝑃𝑆𝐷𝑞𝑙 measures the change in style dimension l assuming that the manager passively hold the
portfolio during quarter q-1 to quarter q while 𝐴𝑆𝐷𝑞𝑙 measures the change in style dimension l through
buys and sales of stocks during quarter q-1 to quarter q.
𝑃𝑆𝐷𝑞𝑙 or passive style drift in dimension l during quarter q-1 to quarter q is measured as:
𝑃𝑆𝐷𝑞𝑙 = ∑(�̃�𝑗,𝑞
′ �̃�𝑗,𝑞𝑙 − �̃�𝑗,𝑞−1
′ �̃�𝑗,𝑞−1𝑙 )
𝑁
𝑗=1
(7)
where �̃�𝑗,𝑞′ denotes the portfolio weight of stock j of quarter q when a manager buys and holds the entire
portfolio during quarter q-1 to quarter q, while �̃�𝑗,𝑞𝑙 equals the non-parametric style characteristic of
stock j in style dimension l at the end of quarter q and �̃�𝑗,𝑞−1𝑙 equals the non-parametric style
characteristic of stock j in style dimension l at the end of quarter q-1.
The remainder of total style drift is captured by 𝐴𝑆𝐷𝑞𝑙 or the active style drift:
𝐴𝑆𝐷𝑞𝑙 = ∑(�̃�𝑗,𝑞�̃�𝑗,𝑞
𝑙 − �̃�𝑗,𝑞′ �̃�𝑗,𝑞
𝑙 )
𝑁
𝑗=1
(8)
Where �̃�𝑗,𝑞 is the portfolio weight on stock j at the end of quarter q while �̃�𝑗,𝑞′ denotes the portfolio
weight of stock j at the end of quarter q when a manager buys and holds the entire portfolio during
quarter q-1 to quarter q and �̃�𝑗,𝑞𝑙 equals the non-parametric style characteristic of stock j in style
dimension l at the end of quarter q.
13
Total, passive and active style drifts are then aggregated across all three dimensions of size, book-to-
market and momentum effects for a fund during the period between quarter q-1 to quarter q as:
𝑇𝑆𝐷𝑞 = |𝑇𝑆𝐷𝑞𝑠𝑖𝑧𝑒| + |𝑇𝑆𝐷𝑞
𝑏𝑡𝑚| + |𝑇𝑆𝐷𝑞𝑚𝑜𝑚| (9)
𝑃𝑆𝐷𝑞 = |𝑃𝑆𝐷𝑞𝑠𝑖𝑧𝑒| + |𝑃𝑆𝐷𝑞
𝑏𝑡𝑚| + |𝑃𝑆𝐷𝑞𝑚𝑜𝑚| (10)
𝐴𝑆𝐷𝑞 = |𝐴𝑆𝐷𝑞𝑠𝑖𝑧𝑒| + |𝐴𝑆𝐷𝑞
𝑏𝑡𝑚| + |𝐴𝑆𝐷𝑞𝑚𝑜𝑚| (11)
A non-zero value of active style drift would primarily occur due to active changes in portfolio weights
of stocks through buys and sells. For example, in the style dimension of book-to-market, a fund manager
who believes that the book-to-market effect would be unusually strong for the following month could
allocate a higher portfolio weight to high book-to-market stocks by purchasing high book-to-market
stocks or selling low book-to-market stocks in his portfolios.
3. Data and Sample
3.1 Mutual Fund Holdings Data
Our portfolio holdings data from September 2003 to December 2013 for U.S. actively managed
domestic equity funds is created by merging the CRSP Survivorship Bias Free Mutual Fund Database
with the CRSP stock price database. The CRSP Mutual Fund Database provides information on monthly
fund net returns (RET), monthly total net assets (TNA), monthly net assets value (NAV) different types
of fees including annual expense ratio and management fee, turnover ratio, investment objectives, first
offer date and other fund characteristics for each share class of every U.S. open-end mutual fund. The
CRSP Mutual Fund Database also provides information on reported portfolio holdings of mutual funds
since September 2003, including the identification of portfolios (crsp_portno), holdings report date
(report_dt), the effectiveness date of the report (eff_dt), stock identification number (permno), number
of shares held in the portfolio (nbr_shares), and market value of the stocks held (market_val). The
holdings data in the CRSP Mutual Fund Database is collected both from reports filed with the SEC and
from voluntary reports generated by the mutual funds themselves. The CRSP mutual fund
characteristic/returns dataset for each share class of every common mutual fund is linked to the holdings
dataset of mutual fund portfolios by using the map (portnomap) provided by the CRSP mutual fund
database. The map dataset contains information on the identification of individual share classes
(crsp_fundno) and their common funds (crsp_portno) over time, as well as other share class
characteristics including delist date, delist type, and the identification of the acquirer share classes and
the latest available date for monthly net assets value for target share classes.
3.2 Price and Accounting Data
14
Data on stock identification, stock return, delist return, share price, trading volume, cumulative price
adjustment factors, cumulative shares adjustment factors, and shares outstanding as well as other stock
characteristics are obtained from the CRSP stock price database. This CRSP price dataset5 is then
merged with the CRSP Mutual Fund database by matching stock identification (permno) and holding
report date (report_dt). This study estimates mutual fund trades by tracking changes in holdings from
report to report. In order to follow changes in stock holdings correctly, the number of shares held in
portfolios is adjusted by the CRSP cumulative shares adjustment factors.6 Data used to estimate book
value of equity for stocks in the way by Daniel and Titman (1997) are retrieved from Compustat,
including shareholders’ equity (SEQ), deferred taxes (TXDB), investment tax credit (ITCB), and
preferred stock (PREF). Industry classifications (SIC) are obtained from the CRSP stock file and
Compustat whenever available.
3.3 Sample Selection
This study follows and modifies the procedure of Kacperczyk et al (2008) to select U.S. domestic equity
mutual funds.7 This study starts with all mutual fund samples in the CRSP Mutual Fund Database
universe. Since the focus of the analysis is on actively managed U.S. domestic equity mutual funds for
which holdings data are most complete and reliable, this study eliminates balanced, bond, money
market, international, sector, index, ETF, exchange target, and target date funds as well as those funds
not invested primarily in equity securities. This screening procedure generates a sample of 109054 fund-
report observations with a total of 3384 unique U.S. domestic equity mutual fund samples from
September 2004 to December 2013. Table 1 reports the summary statistics relating to our sample of
mutual funds and Appendix A provides the detailed screening procedure.
4. Empirical Results
4.1 Aggregate Characteristic-Timing Performance
This study first reports an overview of fund performance of our sample of U.S. domestic equity mutual
funds over the 10-year period from 2004 to 2013. Column (2) to column (4) of Table 2 provide a year-
by-year comparison of the average gross returns of all mutual funds in the sample with the average buy-
and-hold monthly return for the CRSP value weighted and equally weighted NYSE/AMEX/NASDAQ
portfolios without distribution. Comparisons indicate that at first glance, mutual fund managers appear
to outperform the two passive portfolios of the CRSP stock universe. For instance, the average gross
5 Stock return is adjusted for delist events, share price is adjusted by cumulative price adjustment factors, and share outstanding
is adjusted by cumulative shares adjustment factors. 6 The CRSP Mutual Fund Holdings Database changed its data source since October 2010. Before October 2010, the reported
number of shares in portfolio for stock distribution events such as splits is already adjusted and therefore we need to re-adjust
it back before calculating changes in shares and market value of holdings. 7 This report also follows a note written by Glushkov and Moussawi (2010) from WRDS on selecting actively managed U.S.
domestic equity mutual funds.
15
return of mutual funds before any expense and commissions is 11.29%, while the value-weighted
(equally-weighted) hypothetical portfolio of all stocks in CRSP universe is only 7.39% (9.23%) for the
period from 2004 to 2013 in our study. However, this outperformance does not hold when we control
for the cross-sectional differences in stock returns, due to stock characteristics of size, book-to-market
and momentum effects by using the Daniel et al (1997) performance measures.
In particular, the last three columns on the right of Table 2 report the three different performance
attributes proposed by Daniel et al (1997). “CS Performance” captures the stock picking ability of
mutual fund managers by mitigating performance generated due to cross-sectional differences in stocks
returns attributable to the size, book-to-market, and momentum anomalies. Results in Table 2 indicate
that on average mutual fund managers have a negative but insignificant stock selectivity ability over
the sample period from 2004 to 2013, with statistically insignificant -2 basis point per year before
expense. Yearly results also show that, on average, stocks held in mutual fund portfolios could not
outperform passive characteristic-benchmark portfolios. Overall, these results are consistent with the
consensus view in the literature that on average mutual fund managers are not able to outperform their
passive benchmarks. Recent empirical studies in the U.S. market suggest little or no evidence of
superior mutual fund performance.8
The CT measure is designed to detect any additional performance from successfully timing stock
characteristics. Overall, we can see that on average, CT performance is -37 basis points per year but is
statistically insignificant with a t-statistic -1.57 from 2004 to 2013, consistent with the results of Daniel
et al (1997). In other words, mutual fund managers do not exhibit any characteristic timing skills, but
instead, there is weak evidence to show that they actually have negative timing performance at a
marginally significant level. Separate yearly results show that CT measure is negative but insignificant
in eight years except for year 2008. Sub-period results confirm that there is no evidence of timing skills:
average CT performance is -42 basis points per year but is insignificant with a t-statistic of -1.61 before
the recession, while average CT performance is -46 basis points per year, statistically significant at 10%
level, with t-statistic of -1.82, after the recession. Fund managers tend to have economically significant
and negative characteristic-timing performance during expansion period. Interestingly, during the
recession from December 2007 to June 2009, CT performance is only -3 basis points per year, and it is
not statistically different from zero. The difference in characteristic-timing performance between
recession and expansion market conditions is economically meaningful and it is mainly driven by the
poor performance during the expansion periods. In other words, fund managers appear to have some
timing abilities, at least showing non-negative characteristic-timing performance, during the recession.
This finding is consistent with Kacperczyk et al (2014) who find that fund managers have time-varying
8 See e.g., Blake and Timmermann, 1998; Blake et al 1999; Thomas and Tonks, 2001, Cuthbertson et al, 2008.
16
skills. Fund managers tend to perform stock picking well in expansions and time the market well in
recessions.
Table 3 reports the CS, CT, and AS performance attribution components for funds in different
investment categories. Panel A shows that in the analysis of the entire sample period on average, CS
performance for all mutual fund investment categories is never statistically significant, indicating that
none of the mutual fund categories on average is able to outperform their passive benchmark portfolios.
In terms of characteristic-timing ability, only Micro-Cap mutual funds exhibit negative and statistically
significant CT performance, with an average -79 basis points per year, while the other investment
objectives have negative but insignificant CT performance. Sub-period analysis provides strong
evidence that no investment category of fund managers possesses positive characteristic-timing skills
while fund managers in some investment categories exhibit positive stock-picking performance in
expansions but significantly negative performance in recessions.
To summarize, we find that on average, mutual fund managers exhibit no superior investment
performance. In particular, mutual fund managers have negative but insignificant stock selection ability
over our sample period, indicating that fund managers are not able to pick stocks that deliver risk-
adjusted abnormal performance. More interestingly, there is some evidence to show that fund managers
appear to have, if any, negative characteristic-timing performance. In other words, fund managers tend
to change the weights on the characteristics of the stocks held in the portfolios along the dimensions of
size, book to market, and momentum in the wrong way, or at least they are not able to exploit the time-
varying expected returns of these stock characteristics.
4.2 Buying and Selling Abilities
Although a large number of studies in the literature find that mutual fund managers do not possess
timing ability, there is no convincing evidence that directly explains why mutual fund managers
underperform in the domain. Chen et al (2013) point out that the traditional CT measure, which is
simply calculated by aggregating the characteristic timing performance of all holdings, would mask the
distinct trading skills where the CT performance for buying and selling are calculated separately.
To explore distinct trading abilities, this study follows Chen et al (2013) to decompose aggregate CT
performance into different trading components. Specifically, for each fund, we measure the changes in
number of shares held in each stock from the end of quarter t-1 to the end of quarter t for each quarter
in the sample period. Increases in the number of shares are treated as buys and aggregated to form the
buy portfolio and decreases are aggregated to form the sell portfolio, for each fund each quarter.
Additionally, we aggregate stocks with no changes in number of shares between two quarters into the
passive holding portfolio. This study then calculates the characteristic-timing performance for each
trading portfolio. If a fund’s purchases of stocks are associated with subsequent performance above
17
prior average returns from stock characteristics, the characteristic-timing performance for the buy
portfolio will be positive; if sales of stocks are associated with subsequent returns higher than prior
average returns from stock characteristics, the characteristic-timing performance for the sell portfolio
will also be positive. Similarly, if passive holdings are effective in terms of subsequent performance,
the characteristic-timing performance for passive holdings will equally be positive. If a fund exhibits
positive time series average characteristic-timing performance along buying (selling) dimension, this
indicates that this fund manager possesses superior buying (selling) skill.
Panel A in Table 4 reports the CT performance for buying, selling and passive holdings for equity
mutual funds during the whole sample period from September 2004 to December 2013. The second
column reveals that whereas no overall characteristic-timing ability measured by aggregate
characteristic-timing performance is found, this masks different skills along buying and selling
dimensions. In general, mutual fund managers (All Funds) appear to exhibit significant timing ability
when purchasing stocks. For example, mutual fund managers earn an average return of 1.42% per year
(t-statistic=1.65) greater than the average across the three characteristic styles from their purchases,
indicating that mutual fund managers possess skills in this domain. When breaking down mutual funds
by their investment objectives, we find some evidence to show that growth oriented mutual funds
(Growth and Mid-Cap funds) possess significant timing ability for buying stocks, while income oriented
mutual funds (Growth & Income and Income funds) exhibit no statistically significant characteristic-
timing performance when purchasing stocks. The difference of buying performance between growth
and income funds is economically significant.
Our results show that none of the investment categories of mutual funds earn significant characteristic-
timing performance from holding the same stocks. This is consistent with the literature, suggesting that
passive holdings represent fund managers’ past investment beliefs and are not useful measures for
detecting investment ability (e.g., Chen et al, 2000). Our findings therefore contribute to the literature
by showing a similar result in terms of characteristic-timing ability.
More interestingly, mutual fund managers exhibit poor characteristic-timing abilities when disposing
of stocks in their portfolios. In general, the stocks mutual fund managers sell are associated with
subsequent negative characteristic-timing returns of -1.78% per year (t-statistic=-1.86). None of the
fund investment categories shows positive characteristic-timing performance for selling. These results
indicate that on average, mutual fund managers are not able to generate characteristic-timing
performance when selling their stocks but instead destroy the characteristic-timing performance
generated from their buying activities.
To summarize, our results show that fund managers appear to possess significant timing ability over
stock characteristics when purchasing stocks. In particular, growth oriented funds have greater stock
buying skills than other income oriented funds. We also reveal that mutual fund managers seem to
18
systematically fail to time the stock characteristic styles when selling stocks. None of the investment
categories exhibit significant and positive characteristic-timing skills for selling. Overall, these findings
are consistent with the fundamental asymmetry between buy and sell decisions in terms of trading
disciplines found in the investment community. This study also offers empirical support to the
theoretical predictions from the behavioral finance literature that sell decisions are susceptible to
behavioral biases and heuristics that might affect investment performance.
4.3 Characteristic-timing Performance Persistence
To test for persistence of characteristic-timing performance, this study first sorts mutual funds into five
performance quintiles each quarter based on aggregate, buying and selling CT measures respectively.
We report the average characteristic-timing performance of each of the performance quintile portfolios
during the formation quarter and track the performance over the subsequent four quarters. Panel A in
Table 5 summarises the persistence results for aggregate performance while Panel B and Panel C present
persistence results for trading activities.
There is weak evidence in Panel A to show that the difference in aggregate performance between past
winners and losers continues to remain positive in the following four quarters after portfolio formation,
suggesting that aggregate characteristic-timing performance is persistent. Surprisingly, a closer look
reveals that such persistence of aggregate performance is mainly driven by the persistence of
characteristic-timing performance in the negative domain. In particular, losers in performance quintile
1 who exhibit the worst characteristic-timing performance (-7.64% per year) in the formation quarter
continue to have negative quarterly characteristic-timing performance of -0.87%, -0.46%, -0.87% and
-0.75% per year in the following four quarters, while the future performance of past winners (7.26%
per year) turn out to be negative immediately after the formation quarter. These results are consistent
with recent studies such as Teo and Woo (2001) and Cuthbertson et al (2008) who observe strong
persistence among poorly performing funds.
Panel B shows that the characteristic-timing performance when buying stocks is persistent. In particular,
on average mutual funds in the performance quintile 1 that have the worst 𝐶𝑇𝑏𝑢𝑦 performance in the
formation quarter have positive 𝐶𝑇𝑏𝑢𝑦 performance of 1.00%, 1.53%, 1.36%, and 1.41% per year in the
subsequent four quarters. On the other hand, mutual funds that are particularly successful in buying
stocks continue to have positive and statistically significant 𝐶𝑇𝑏𝑢𝑦 performance of 2.39%, 1.85%,
1.94%, and 1.67% per year in the following four quarters. The performance difference between past
winners and losers remain positive over four quarters and the outperformance of past winning funds is
a statistically and economically significant average of 1.38% per year for at least the following quarter
Q+1. These results suggest that a small number of fund managers have “hot hands” to buys stocks: fund
19
managers who have the best past buying performance continue outperform those who display the worst
buying ability in near term.
Similarly, results in Panel C report that mutual fund managers seem to have persistently bad
characteristic-timing ability for selling. Mutual funds with the lowest 𝐶𝑇𝑠𝑒𝑙𝑙 performance in the quintile
formation quarter display negative performance of -2.83%, -2.28%, -2.56%, and -2.14% per year while
mutual funds with highest past 𝐶𝑇𝑠𝑒𝑙𝑙 performance exhibit negative performance of -1.44%, -1.90%, -
1.55%, and -1.74% per year during the following four quarters. Past losers continue to underperform
past winners by a statistically significant amount of 1.43% in quarter Q+1. This underperformance is
also economically meaningful. These results suggest that there is a small number of mutual fund
managers who exhibit “icy hands” in selling stocks in short term.
This study documents the strong persistence of aggregate characteristic-timing performance in the
negative domain over the following four quarters, indicating that mutual fund managers do not possess
characteristic-timing ability in aggregate but instead a subset of fund managers tend to have poor timing
ability that persistently destroys portfolio value. We also find strong evidence to show that
characteristic-timing performance along both buying and selling dimensions is persistent in near term.
In particular, mutual fund managers who exhibit superior characteristic-timing performance when
buying stocks in the past tend to continue performing buying tasks well, while those who were the worst
performers in selling stocks tend to underperform in the sell domain in short term. Extreme positive
(negative) performance for selling (buying) is due to good (bad) luck. These results reinforce our main
hypothesis that mutual fund managers have distinct trading skills.
4.5 Do Investor Flows Act as Drag of Characteristic-Timing Performance?
The structure of open-end mutual funds forces fund managers to trade in response to fund flows. First,
an important role of open-end mutual funds is to provide liquidity to investors. Fund managers are
required by law to pay a proportional share of the net asset value of the fund to each investor who
chooses to redeem their investment. Second, since fund managers’ compensation depends on their
ability to track and beat their benchmark portfolios (e.g., Chevalier and Ellison, 1997; Sirri and Tufano,
1998), they have strong incentives to trade to counteract flow shocks so that they can maintain the
efficient fraction of equity investment in their portfolios.
One might naturally ask whether, and to what extent, fund flows affect fund performance. In the context
of timing performance, consider a mutual fund manager who initially holds some target efficient
portfolio in terms of level of risk exposure toward the three stock characteristics. Unanticipated fund
flows would then force this fund manager make trades that could his fund portfolio to shift away from
his initial efficient target portfolio. When experiencing fund outflows, fund managers often have to sell
some of their existing holdings to fulfil investor redemption requirements. In extreme cases, they can
20
also be forced to engage in fire sales (Coval and Stafford, 2007). These liquidity-driven sales can move
fund portfolios away from fund managers’ intended exposure to style factors because fund managers
might need to sell down their liquid positions to avoid a high liquidity premium. On the other hand,
despite the need to maintain an efficient fraction of equity investment in their portfolios, fund managers
who have fund inflows have more flexibility in their trading: they can accumulate cash for cash
redemption needs; they can postpone their equity investment decisions; and they can immediately open
new positions or expand their current holdings. If fund managers can take advantage of the financial
flexibility provided by investor flows, one should observe better, at least not worse performance by
those fund managers with fund inflows compared with those who experience significant outflows.
In contrast with expectations, Table 6 shows that mutual fund managers who experience heavy investor
inflows (NF5) exhibit statistically and economically significant characteristic-timing returns of -0.85%
per year (t-statistic=-2.86), while those who have heavy investor outflows exhibit no characteristic-
timing performance. The difference in characteristic-timing performance between NF1 and NF5 is
significantly positive 0.78% per year (t-statistic=2.80) with this difference driven by the
underperformance of mutual funds that experiencing heavy inflows. Moreover, no mutual fund
investment objective subgroups exhibits any characteristic-timing performance when experiencing
heavy outflows while all subgroups exhibit negative characteristic-timing performance when facing
heavy inflows. In particular, income mutual funds appear to have the worst performance when they face
extreme investor inflows.
In a further refinement, mutual fund portfolios within each flow quintile are sorted and categorised into
another 5 quintile groups based on their active style drift at the end of each quarter. SD1 refers to
portfolios which engage in large active style drift and SD5 refers to the portfolios which engage in small
style drift. The rationale is that when facing investor flows, fund managers could simply proportionally
adjust current holdings to minimise the impact of inflow shock to portfolio risk exposure and control
liquidity. They will engage in active style drift along the three stock characteristics by buying (selling)
stocks, when and only when they strongly believe that these stocks will have good (poor) future
characteristic-timing performance. In other words, managers who strongly believe that certain stock
characteristics would have superior future performance will make active style changes moving their
portfolio equity style factors from one category to another over the quarter. But managers who need to
control for liquidity will make smaller adjustments across the three characteristics. If this is the case,
one should observe that the portfolios with high level of active style drift when experiencing heavy
unanticipated flows have better subsequent characteristic-timing performance. However, if these style
bets are motivated by reasons other than valuation beliefs, a negative relationship should be observed.
Table 7 reports aggregate characteristic-timing performance results for mutual fund portfolios
categorized by active style drift and concurrent investor flows. The first three rows and three columns
21
of each panel report results from two way sorting on net investor flows and active style drift. The fourth
row and fourth column present results from one-way sorting only on active style drift and net investor
flows, respectively. The fifth row and fifth column report the difference between the extreme investor
flow and active style drift quintiles.
Consider now the upper left-hand corner of Panel A where we find NF1/SD1 (i.e., large active style
drift concurrent with heavy outflows), the fund portfolios that should reflect managers’ strong beliefs
about the future performance of certain stock characteristics. Inconsistent with the expectation,
NF1/SD1 exhibits a negative but marginally significant -0.92% characteristic-timing return per year.
Similarly, as we move down to NF5/SD1 (i.e., large active style drift concurrent with heavy inflows),
reflecting the large style bets of mutual fund managers when they have financial flexibility. These
portfolios are associated with economically and statistically significant characteristic-timing returns of
-1.76% per year (t-statistics=-2.78). These results therefore provide evidence for the competing
hypothesis that active timing decisions might be motivated by reasons other than valuation beliefs, such
as overconfidence.
Small style drifts could be simply motivated by the need to control liquidity. When fund managers face
heavy outflows, they could proportionally reduce their existing holdings to raise cash. These sales are
more likely to be driven by liquidity needs, and thus are less likely to reflect managers’ valuation beliefs.
Consistent with our expectation, NF1/SD5 (i.e., small active style drift concurrent with heavy outflows)
shows a statistically and economically insignificant -0.02% characteristic-timing return per year.
Similarly, fund managers could proportionally expand their holdings when experiencing significant
inflows. NF5/SD5 (i.e., small active style drift concurrent with heavy inflows) exhibits a negative
statistically significant -0.90% characteristic-timing return per year. We interpret these results as
consistent with no significant characteristic-timing ability.
Inconsistent with Simutin (2014) who argue that financial flexibility allows fund managers to satisfy
redemption requests and capture investment opportunities quickly, our results suggest that fund
managers seem to be not able to take advantages of the financial flexibility provided by fund inflows.
Instead, excessive cash holdings from fund inflows impose a significant drag on characteristic-timing
performance. This argument is confirmed by the results of further investigation conditioning portfolios
based on the magnitude of active style drifts as a proxy for fund manager conviction. Large style bets
that should reflect the strong valuation beliefs when managers have excess cash from investor flows are
associated with significantly negative characteristic-timing returns. Furthermore, these surprising
results are consistent with the free cash flows hypothesis that is well documented in the corporate
finance literature. Free cash flow hypothesis suggests that firms’ managers tend to use free cash flows
to finance low-return projects (e.g., Jensen, 1986).
4.6 Does Trade Motivation Relate to Trade Performance?
22
4.6.1 Conditioning on Motivation Score
Chen et al (2013) document that mutual fund managers exhibit distinct trading skills by decomposing
their aggregate characteristic-timing performance into buying and selling components. Their study,
however, gives no consideration to the fact that fund managers provide a great deal of liquidity to
investors and that this provision of liquidity forces fund managers to engage in costly trading. Thus, the
inference regarding fund manager trading skills in their study can be significantly negatively biased.
One might naturally ask whether negative characteristic-timing performance when selling stocks is
driven by liquidity-induced sales. This sub-section attempts to address this question.
To increase the test power of the standard characteristic-timing performance measure, we separate fund
managers’ motivations for trading by conditioning fund purchases and sales on the motivation score
metrics of Alexander et al (2007). Intuitively, the flow-based motivation score metric assigns a higher
score to buy (sell) portfolios of funds that are more likely comprised of larger proportions of valuation
motivated purchases (sales). This approach has several advantages over realised net fund flows. First,
motivation score metrics not only consider realised net investor flows between two quarters, but also
capture total trading volume from buying and selling actives during the corresponding period. Second,
the ranking procedure based on motivation score breaks down possible serial and cross-sectional trading
patterns and correlations that might be present in the stock holdings data and therefore could bias results
in unexpected ways (Alexander et al, 2007).
Panel A of Table 8 provides evidence that buying characteristic-timing ability is strongly related to
trade motivations. Consistent with the expectation that mutual fund managers (All Funds) possess
positive buying skill, in the case of BF1 (i.e., large total purchase volume concurrent with heavy
outflows), buy portfolios that have the highest proportion of valuation-motivated buys show a
statistically and economically significant characteristic-timing return of 1.90% per year higher than the
average across the three different characteristic styles. When moving down the rows from BF1, one can
observe generally decreasing returns because buy portfolios are characterized by a decreasing
proportion of valuation-motivated buys and an increasing proportion of liquidity-induced buys. In
particular, in the case of BF5 (i.e., low total purchase volume concurrent with heavy inflows), buy
portfolios that consist of the highest proportion of liquidity-driven buys exhibit no statistically
significant characteristics-timing returns. As expected, valuation-motivated buys outperform liquidity-
driven buys (BF1-BF5) by an average of 0.93% per year, statistically significant at the 1% level. While
this pattern holds for all investment categories, there is some evidence to show that income oriented
mutual funds appear to have lower characteristic-timing returns from their valuation-motivated
purchases.
In Panel B, the results for sell portfolios are organised in the same ways as for the buy portfolios.
Consistent with mutual fund managers (All Funds) having negative selling skill, SF1 (i.e., high total
23
stock sales concurrent with high inflows), sell portfolios that have the highest proportion of valuation-
motivated sales have a statistically and economically significant characteristic-timing return of -1.57%
per year. On the other hand, in the case of SF5 (i.e., low total stock sales concurrent with high outflows),
the sell portfolios that have the highest proportion of liquidity-driven sales show an average
characteristic-timing returns of -2.24% per year, significant at the 5% level. The difference between
valuation-motivated sales and liquidity-driven sales (SF1-SF5) is statistically and economically
significant at 0.69% per year. This suggests that despite lacking selling ability in general, trade
motivation still matters in terms of subsequent characteristic-timing performance. The remaining
columns in Panel B demonstrate a similar story, namely that none of the investment categories exhibits
positive selling skill and that valuation-motivated sales outperform liquidity-induced sales.
4.6.2 Multivariate Regression Evidence
In this section, we further extend our analysis of fund manager trading skills using multivariate
regressions. This approach differs from the above portfolio approach in three major respects. First, a
multivariate regression framework can simultaneously control for mutual fund characteristics that might
be related to trade motivations or/and fund manager trading performance. Second, fund managers might
be motivated to trade due to other reasons, such as for tax management and window-dressing purpose.
According to the mutual fund tournament literature, these trades typically occur before the fiscal year
end. Regression analysis can effectively control these effects by introducing year-end dummy variables.
Third, the portfolio approach aggregates mutual funds of similar trade motivation scores into quintile
groups, while the regression approach allows researchers to take advantage of the rich panel structure
to directly look at individual mutual funds.
We begin with sorting fund-month observations for each fund based on motivation scores for purchase
(BF) and divide these observations into high, mid and low motivation score subgroups. An indicator
variable, 𝑉𝑎𝑙𝑢𝑎𝑡𝑖𝑜𝑛𝑡𝑖 , is constructed to capture the purchases that are the most likely to be motivated
by valuation beliefs, and the other dummy variable 𝐿𝑖𝑞𝑢𝑖𝑑𝑖𝑡𝑦𝑡𝑖 is used to identify liquidity-induced
purchases. This procedure is repeated for selling skills. we test the hypothesis that trade motivations are
related to subsequent characteristic-timing performance by estimating the following fixed effect panel
data regression model separately for buying and selling skills:
𝐴𝑏𝑖𝑙𝑖𝑡𝑦𝑡𝑖 = 𝑎0 + 𝑎1𝑉𝑎𝑙𝑢𝑎𝑡𝑖𝑜𝑛𝑡−1
𝑖 + 𝑎2𝐿𝑖𝑞𝑢𝑖𝑑𝑖𝑡𝑦𝑡−1𝑖 + 𝑎3𝐶𝑜𝑛𝑡𝑟𝑜𝑙𝑡−1
𝑖 + 𝜖𝑡𝑖
where 𝐴𝑏𝑖𝑙𝑖𝑡𝑦 denotes either 𝑆𝑒𝑙𝑙𝑖𝑛𝑔 or 𝐵𝑢𝑦𝑖𝑛𝑔; 𝑉𝑎𝑙𝑢𝑎𝑡𝑖𝑜𝑛𝑡−1𝑖 is an indicator variable equal to one
if the mutual fund i is categorised as being more likely to be motivated by valuation beliefs at time t-1,
and zero otherwise; 𝐿𝑖𝑞𝑢𝑖𝑑𝑖𝑡𝑦𝑡−1𝑖 is an indicator variable equal to one if the mutual fund i is categorised
as being more likely to be motivated by liquidity needs at time t-1, and zero otherwise. 𝐶𝑜𝑛𝑡𝑟𝑜𝑙𝑡−1𝑖 is
mainly a vector of lagged fund-specific control variables, including age (natural logarithm of age in
24
years since first offer date, log(AGE)), size (natural logarithm of total net assets under management in
millions of dollars, log(TNA)), expense ratio (in percent per year, Expenses), turnover rate (in
percentage per year, Turnover), percentage flow (the ratio of 𝑇𝑁𝐴𝑖,𝑡 − 𝑇𝑁𝐴𝑖,𝑡−1 ∗ (1 + 𝑅𝐸𝑇𝑖,𝑡) −
𝑀𝐺𝑁𝑖,𝑡 to 𝑇𝑁𝐴𝑖,𝑡−1, Flow), management fee (in percentage per year, Fee) and fund style characteristics
along the size, book-to-market and momentum dimensions (in quintile number, size, btm, and
momentum). To mitigate the impact of outliers on our estimates, we winsorize Flow and Turnover at
the 1% level. We demean all these control variables so that the constant 𝑎0 measures the performance
of trades when fund managers are “normally” motivated, and 𝑎1 indicates how much skills increase
when fund managers are motivated by valuation beliefs, while 𝑎2 indicates how much skills decrease
when fund managers are motivated by liquidity needs. In addition to these control variables mainly
from Kacperczyk et al (2014), We also include two variables to control the effect of the financial crisis
(defined by the NBER, Recession) and the fourth calendar quarter (4th Quarter). The latter is motivated
by Alexander et al (2007) and others working in tournament literature who argue that there is the
possibility that some trades may be motivated by tax management or window-dressing reasons which
typically occur just before the fund’s fiscal year end.
Table 9 examines the variation in buying and selling skills based on trade motivations. Column (1) to
Column (3) show the coefficients on trade motivation from the panel regression using the characteristic-
timing returns of buy portfolios as the dependent variable. The sign and magnitude of the coefficients
on both motivation indicator variables are consistent with the previous analysis based on the trade
motivation quintile portfolios across all three model specifications. For example, in Column (3),
valuation-motivated purchases are associated with 7 basis points per month or approximately 0.85%
per year higher returns than others purchases while liquidity-driven purchases are associated with 4.7
basis points per month or 0.56% per year lower returns than others purchases, after controlling for fund-
specific characteristics and time fixed effects. The effects of trade motivation on subsequent
performance are economically and statistically significant. Likewise, Column (4) to Column (6) reports
that valuation-motivated sales outperform other sales by an average of 4.3 basis points per month or
0.52% per year, while liquidity-induced sales substantially underperform other sales by a statistically
and economically significant 12 basis points per month or about 1.43% per year. Again, signs and
magnitudes of the coefficients are consistent with previous portfolio analysis.
4.6.3. Conditioning on Motivation Score and Trade Size
Another test of managers’ timing ability is attainable by studying their individual stock trades. Trades
within each motivation score categorized portfolio are further split into another 5 quintile groups on the
basis of their dollar volume. Alexander et al (2007) argue that large trades are more likely to be driven
by valuation motivation, whereas small trades are more likely to be liquidity motivated. The rationale
is that fund managers would want to buy a relatively large amount of stocks that they believe are
25
undervalued, but they are more likely to make smaller-size purchases when dealing excess liquidity
from unanticipated investor inflows. Similarly, fund managers would want to sell a relative large
amount of stocks when they no longer believe that these stocks are attractive while they might spread
the smaller-size sales across the stocks in their the portfolios to meet investor redemption requests.
Panel A of Table 10 summarizes characteristic-timing performance for buy portfolios categorized by
net investor flows and trade size. Stocks mutual fund managers purchase in the BF1/TS1 group (i.e.,
large buys concurrent heavy outflows) are associated with subsequent significantly positive
characteristic-timing returns of 1.61% per year. Moving down the rows from BF1 to BF5 and across
the columns from TS1 to TS5, generally decreasing trends of characteristic-timing returns are reported
as these portfolios are characterised by a decreasing proportion of valuation-motivated, but an increased
percentage of liquidity-motivated buys. Difference of characteristic-timing performance between large
buys (TS1) and small buys (TS5) is 1.45% per year in the group where buys are most likely valuation-
motivated. This difference goes down to 0.58% per year in the group of lowest valuation-motivated
buys. A similar pattern holds when the difference in characteristic-timing performance between
valuation-motivated buys and liquidity-motivated buys is conditional on trade size. The difference
between the two extreme groups: BF1/TS1, which contain the highest proportion of valuation-buys, and
BF5/TS5, which have the highest proportion of liquidity-motivated buys, is statistically and
economically significant with characteristic-timing returns of 1.56% per year. These results are
consistent with previous findings that fund managers possess positive buying skill, and that valuation-
based purchases outperform liquidity-driven purchases.
Panel B presents the subsequent characteristic-timing returns of fund managers’ sells, which are
categorized by the SF metric and trade size. Characteristic-timing performance for selling in the
category SF1/TS1 (i.e., large sells and high total sales concurrent with heavy inflows) is statistically
significant but negative or -0.87% per year. There is a decreasing trend in characteristic-timing
performance for sell portfolios characterised by the decreasing proportions of valuation-motivated sells
and increasing proportions of liquidity motivated sells from SF1 to SF5. Difference between the
category SF1/TS1 and SF5/TS1 is significantly positive or 1.91% per year, indicating that even though
mutual fund managers have negative characteristic-timing selling ability, trade motivation still matters.
However, when moving across columns from large sells (TS1) to small sells (TS5), an increasing trend
of characteristic-timing performance is observed, which is inconsistent with the expectation that large
sells that are more likely to be motivated by valuation beliefs should outperform small sells. Instead,
within any net investor flow category from SF1 to SF5, large sells tend to underperform small sells in
terms of subsequent characteristic-timing returns. When experiencing heavy investor outflows, mutual
fund managers appear to exhibit significantly negative characteristic-timing returns of -2.73% per year
from large sells (SF5/TS1), while insignificant but positive characteristic-timing performance of 0.03%

26
per year from small sells (SF5/TS5). The difference between these two groups is statistically and
economically significant. We interpret this finding as consistent with the notion that mutual fund
managers have negative timing ability when selling stocks. Large bets when selling stocks might be
more likely to reflect other reasons than valuation beliefs, such as behavioral bias.
Overall, by segmenting trades based on the motivation for making them, we find evidence that trade
motivations are strongly related to subsequent trade performance. In particular, valuation-motivated
trades significantly outperform liquidity-induced trades, and this pattern holds for both buying and
selling dimensions. However, fund managers appear to exhibit negative selling ability even when they
are highly motivated by valuation beliefs, which directly supports and extends the argument of Chen et
al (2013) who show that in general mutual fund managers exhibit poor selling characteristic-timing
abilities. These findings are robust when using a multivariate regression approach to control for fund
characteristics and time fixed effects.
4.7 Are there managers who possess both good buying and good selling skills?
Findings reported thus far show that mutual fund managers on average possess apparent buying skill
but exhibit negative selling skill which is consistent with Chen et al (2013). By conditioning on trade
motivations, further evidence does not improve this unfavourable finding regarding selling ability.
Instead, valuation-based sales are associated with significantly negative subsequent characteristic-
timing returns, indicating that on average fund managers exhibit negative selling skill even when these
sales are motivated by valuation beliefs. However, such underperformance in general does not
necessarily mean that no mutual fund managers possess good selling skills. Most studies in the literature
on mutual fund performance treat fund managers as a homogeneous class of professional investor, and
have not yet explored whether one group of fund managers is better at buying and another group of
fund managers specialise in selling, or that a small subset of managers can perform both buying and
selling well.
To examine whether different groups of fund managers possess different skills, we begin by testing the
prediction that the same mutual funds that exhibit good selling skills display good buying skills. Since
valuation-motivated trades are more likely to reflect the true trading skills of fund managers, we first
identify “good sellers”, those mutual funds with superior selling ability when they are most likely to be
motivated by valuation beliefs. To achieve this, for each fund, we divide all fund-month observations
into three subsamples according to motivation scores for selling (SF). Within the subsamples of fund-
month observations that are mostly likely to have the highest proportion of valuation-motivated sales
(high motivation score), we select fund-month observations that are in the highest 25% of the 𝑆𝑒𝑙𝑙𝑖𝑛𝑔𝑡𝑖
distribution. Then, an indicator variable Top (𝑇𝑜𝑝𝑖 ∈ {0, 1}) is formed to identify those managers who
have the best record for valuation-motivated selling, which is equal one for the 25% of funds with the
27
highest fraction of observations (months) in that group, relative to the total number of observations for
that fund in the high motivation score subsample. Next we estimate the following pooled panel data
regression model:
𝐴𝑏𝑖𝑙𝑖𝑡𝑦𝑡𝑖 = 𝑐0 + 𝑐1𝑇𝑜𝑝𝑡
𝑖 + 𝑐2𝐶𝑜𝑛𝑡𝑟𝑜𝑙𝑡−1𝑖 + 𝜖𝑡
𝑖
Where 𝐴𝑏𝑖𝑙𝑖𝑡𝑦 denotes either 𝑆𝑒𝑙𝑙𝑖𝑛𝑔 or 𝐵𝑢𝑦𝑖𝑛𝑔, 𝑇𝑜𝑝 denotes either “good sellers” or “good buyers”,
and 𝐶𝑜𝑛𝑡𝑟𝑜𝑙 is a vector of previously defined control variables. The coefficient of interest is 𝑐1.
Table 11 summarises the pooled panel data regression estimates with different model specifications.
Column (3) shows that on average “good sellers” are significantly better at characteristic-timing when
selling stocks than all other funds, after controlling for fund characteristics and other time effects. The
coefficient of the indicator variable 𝑇𝑜𝑝 is statistically and economically significant. This is true given
the way “good sellers” are identified. When mutual fund managers are highly motivated by valuation
beliefs, 𝑆𝑒𝑙𝑙𝑖𝑛𝑔 is 11.2 basis points per months or 1.35% higher for “good sellers” than for the
remaining funds. The main point of Table 11 is that the same “good sellers” are on average also better
at 𝐵𝑢𝑦𝑖𝑛𝑔 when they are motivated by valuation beliefs. Column (6) presents the positive coefficient
on the indicator variable 𝑇𝑜𝑝, which is statistically significant at the 1% level. The effect is also
economically meaningful. 𝐵𝑢𝑦𝑖𝑛𝑔 is 7.2 basis points per month or 0.87% per year higher for the same
“good sellers” than for all other funds. In sum, these results suggest that there are a small number of
mutual fund managers who possess selling skill and also exhibit positive buying skill.
We repeat the above analysis procedure for “good buyers” who are the funds in the top 25% of the
buying skill distribution. In Table 12, Column (3) shows that on average “good buyers” are significantly
better at buying stocks than all other funds, after controlling for fund characteristics and other time
effects, which follows the construction of the “good buyer” set of funds. These successful buyers exhibit
30.7 basis points per month or 3.75% per year higher characteristic-timing performance when buying
stocks based on valuation beliefs. Strikingly, these “good buyers” are not able to outperform the other
funds when selling stocks. This result is evident from the negative but statistically insignificant
coefficient on 𝑇𝑜𝑝 in column (6). Overall, it is very interesting to see that “good sellers” who by
construction are good at selling ability also possess good buying ability, while “good buyers” who by
construction are significantly successful at characteristic-timing when buying stocks are not able to
outperform all other funds when selling stocks. In other words, “good sellers” are also “good buyers”
but “good buyers” are not “good sellers”.
If the same “good sellers” are able to time stock characteristics well when buying and selling stocks in
their portfolios, then these fund managers should also outperform unskilled funds in terms of aggregate
characteristic-timing, whereas “good buyers” who are good at buying but are not capable of selling
might not be able to exhibit superior aggregate characteristic-timing ability. To investigate this, we
28
estimate the above pooled panel data regression with aggregate characteristic-timing performance as
dependent variables for “good sellers” and “good buyers” separately. Consistent with expectation,
Column (3) of Table 13 shows that aggregate characteristic-timing performance is 2.6 basis points per
month or 31.2 basis points per year higher for “good sellers” than all other funds, which is statistically
significant at the 1% level after controlling for fund characteristics and time effects. Column (6) shows
that the coefficient of 𝑇𝑜𝑝 for “good buyers” is economically and statistically insignificant, indicating
that on average “good buyers” exhibit no aggregate characteristic-timing ability. These results indicate
that there are a small number of mutual fund managers that possess timing abilities, and the superior
characteristic-timing performance is mainly attributed to their selling skills.
These findings are robust to changing the cut-off levels for inclusion in the 𝑇𝑜𝑝 portfolio and using an
alternative way to identify “good sellers” or “good buyers” by conditioning on trade motivation based
on net investor flows. The main findings that good sellers are also good buyers but good buyers are not
necessarily good seller and that good sellers possess superior aggregate characteristic-timing ability
hold.
To summarise, we find strong evidence to suggest that there are a small number of mutual funds in our
sample that possess both good buying and selling skills in timing stock characteristics along the size,
book-to-market, and momentum dimensions. By estimating panel data regressions of characteristic-
timing performance on the indicator variable for “good sellers”, our results reveal that “good sellers”,
namely mutual fund managers who by construction have the best performance record for selling, also
have superior characteristic-timing performance when buying stocks compared with all other funds,
after controlling for fund characteristics and time effects. However, there is no evidence to show that
“good buyers” who by construction are good at buying exhibit superior characteristic-timing
performance when selling stocks than all other funds. Furthermore, “good sellers” exhibit superior
aggregate characteristic-timing performance, while “good buyers” do not have outperformance. We
interpret this as being consistent with the behavioral finance literature which shows that sell decisions
are particularly difficult because they are more likely to be susceptible to behavioral biases and
heuristics, even for mutual fund managers who are skilled at buying. Fund managers who are good at
the difficult task of selling stocks perhaps possess genuine investment talents so that not only do they
outperform other funds when buying stocks, but they also exhibit superior aggregate characteristic-
timing performance.
4.8 The Characteristics of Good Sellers
Table 14 summarises the fund characteristics of “good sellers” in comparison with the remaining funds.
Several interesting differences emerge. First, “good sellers” are younger than other fund managers in
our sample. Second, they have less assets under management, suggestive decreasing returns to scale at
29
the fund level (e.g., Berk and Green, 2004). Third, “good sellers” appear to charge higher expenses and
management fees to fund investors, perhaps reflecting higher rents to their customers for their superior
skills. Fourth, they exhibit higher portfolio turnover, indicating that these mutual funds are more active
than other funds. Fifth, they tend to hold portfolios with a smaller number of stocks, and therefore, tend
to be somehow more concentrated. Finally, they are more likely to actively engage in style drift,
suggesting that their superior characteristic-timing performance comes from active style drift along the
size, book-to-market, momentum dimensions. In sum, in line with previous studies that find there does
exist a subset of skilled managers, “good sellers” seem to be younger, manage smaller funds and are
more active as measured by turnover ratio, diversification, and active style drift than all other funds,
but they also charge higher expenses and management fees to compensate for their superior skills.
5. Conclusion
This study examines whether mutual fund managers, a representative group of professional investors,
exhibit investment abilities, and in particular, whether they possess the skill to produce performance
from adjusting portfolio exposure to the risk factors of size, book-to-market and momentum effects.
Consistent with Daniel et al (1997) and others, we find no evidence of significant aggregate
characteristic-timing skill. However, we show strong persistence of aggregate characteristic-timing
performance in the negative domain. Mutual fund managers do not possess characteristic-timing ability
in aggregate but instead a subset of fund managers tend to have poor timing ability that persistently
destroys overall portfolio value.
In an attempt to explain such underperformance from characteristic-timing decisions, this study
disaggregates overall characteristic-timing performance into different trading components. Consistent
with Chen et al (2013), our results show that in general mutual fund managers possess positive
characteristic-timing ability when buying stocks but negative trading ability when selling stocks.
Performance persistence tests confirm that these distinct trading “skills” are driven by systematic
factors. Mutual fund managers who were successful in buying stocks tend to continue generating
superior characteristic-timing performance when purchasing stocks, while those who were the worst
sellers tend to remain underperforming when disposing of stocks in near term. In other words, there are
a small number of mutual funds exhibiting “hot hands” (“icy hands”) in buying (selling) stocks.
By conditioning trades on the motivation for making them, our results shows that valuation-motivated
trades are associated with higher subsequent characteristic-timing performance than liquidity-driven
trades, which is consistent with predications from the literature. Perhaps more interestingly, stocks sold
by managers who have excess liquidity following significant investor inflows, which are expected to
have a higher proportion of valuation-motivated sales, are on average still associated with statistically
significant negative characteristic-timing returns. These results suggest that average managers seem to
30
be unable to generate positive characteristic-timing performance when selling stocks, even when these
sales are valuation-motivated.
This study further investigates the proposition that there is a group of fund managers who are
particularly good at selling, while another group of managers have strong buying skills, or alternatively,
the same group of managers can perform both tasks well, or badly. We find clear evidence that there
are a small number of mutual funds in our sample that possess both good buying and selling skills in
timing stock characteristics along the size, book-to-market, and momentum dimensions. Results reveal
that “good sellers”, those fund managers who have the best performance records for selling, also show
superior characteristic-timing performance when buying stocks compared with all other funds.
However, there is no evidence to show that “good buyers” exhibit any superior characteristic-timing
performance when selling stocks over and above all other funds. Furthermore, “good sellers” exhibit
significant aggregate characteristic-timing performance, while “good buyers” do not outperform other
funds in aggregate. Comparing fund-specific characteristics with other funds, “good sellers” appear to
be younger, smaller in size, and more active in managing their portfolios as measured by turnover ratio,
diversification, and active style drift. However, they also tend to charger higher expenses and
management fees to compensate for their superior skills.
Overall, our study contributes to the ongoing debate about whether professional investors possess
special investment skills or talents. Our findings suggest that the lack of evidence of overall mutual
fund performance documented in the literature masks distinct trading abilities. In particular, while fund
managers are able to perform buy decisions well, they seem to possess negative selling ability. This
finding is consistent with the hypothesis that sell decisions are more likely to be susceptible to
behavioral bias. Even for professional investors, sell decisions are particularly difficult.
Future work might explore the mechanisms by which behavioral biases could drive poor selling
performance. In addition, it would be interesting to examine whether the inability to sell down stocks
well contributes to the strong negative performance persistence among poorly performing fund
managers documented in recent studies (e.g., Cuthbertson et al, 2008) which suggest the inferior
performance of most poorly performing funds is not merely due to bad luck, but to “bad skill”. These
questions are left for future research.
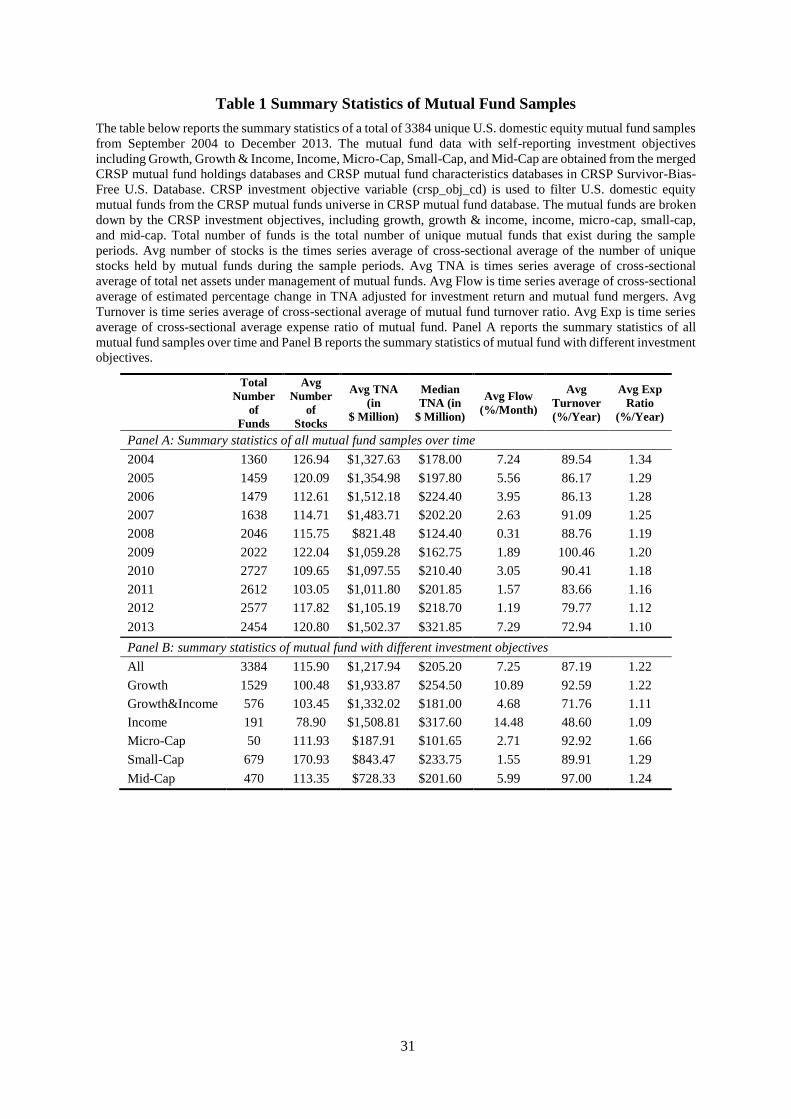
31
Table 1 Summary Statistics of Mutual Fund Samples
The table below reports the summary statistics of a total of 3384 unique U.S. domestic equity mutual fund samples
from September 2004 to December 2013. The mutual fund data with self-reporting investment objectives
including Growth, Growth & Income, Income, Micro-Cap, Small-Cap, and Mid-Cap are obtained from the merged
CRSP mutual fund holdings databases and CRSP mutual fund characteristics databases in CRSP Survivor-Bias-
Free U.S. Database. CRSP investment objective variable (crsp_obj_cd) is used to filter U.S. domestic equity
mutual funds from the CRSP mutual funds universe in CRSP mutual fund database. The mutual funds are broken
down by the CRSP investment objectives, including growth, growth & income, income, micro-cap, small-cap,
and mid-cap. Total number of funds is the total number of unique mutual funds that exist during the sample
periods. Avg number of stocks is the times series average of cross-sectional average of the number of unique
stocks held by mutual funds during the sample periods. Avg TNA is times series average of cross-sectional
average of total net assets under management of mutual funds. Avg Flow is time series average of cross-sectional
average of estimated percentage change in TNA adjusted for investment return and mutual fund mergers. Avg
Turnover is time series average of cross-sectional average of mutual fund turnover ratio. Avg Exp is time series
average of cross-sectional average expense ratio of mutual fund. Panel A reports the summary statistics of all
mutual fund samples over time and Panel B reports the summary statistics of mutual fund with different investment
objectives.
Total
Number
of
Funds
Avg
Number
of
Stocks
Avg TNA
(in
$ Million)
Median
TNA (in
$ Million)
Avg Flow
(%/Month)
Avg
Turnover
(%/Year)
Avg Exp
Ratio
(%/Year)
Panel A: Summary statistics of all mutual fund samples over time
2004 1360 126.94 $1,327.63 $178.00 7.24 89.54 1.34
2005 1459 120.09 $1,354.98 $197.80 5.56 86.17 1.29
2006 1479 112.61 $1,512.18 $224.40 3.95 86.13 1.28
2007 1638 114.71 $1,483.71 $202.20 2.63 91.09 1.25
2008 2046 115.75 $821.48 $124.40 0.31 88.76 1.19
2009 2022 122.04 $1,059.28 $162.75 1.89 100.46 1.20
2010 2727 109.65 $1,097.55 $210.40 3.05 90.41 1.18
2011 2612 103.05 $1,011.80 $201.85 1.57 83.66 1.16
2012 2577 117.82 $1,105.19 $218.70 1.19 79.77 1.12
2013 2454 120.80 $1,502.37 $321.85 7.29 72.94 1.10
Panel B: summary statistics of mutual fund with different investment objectives
All 3384 115.90 $1,217.94 $205.20 7.25 87.19 1.22
Growth 1529 100.48 $1,933.87 $254.50 10.89 92.59 1.22
Growth&Income 576 103.45 $1,332.02 $181.00 4.68 71.76 1.11
Income 191 78.90 $1,508.81 $317.60 14.48 48.60 1.09
Micro-Cap 50 111.93 $187.91 $101.65 2.71 92.92 1.66
Small-Cap 679 170.93 $843.47 $233.75 1.55 89.91 1.29
Mid-Cap 470 113.35 $728.33 $201.60 5.99 97.00 1.24
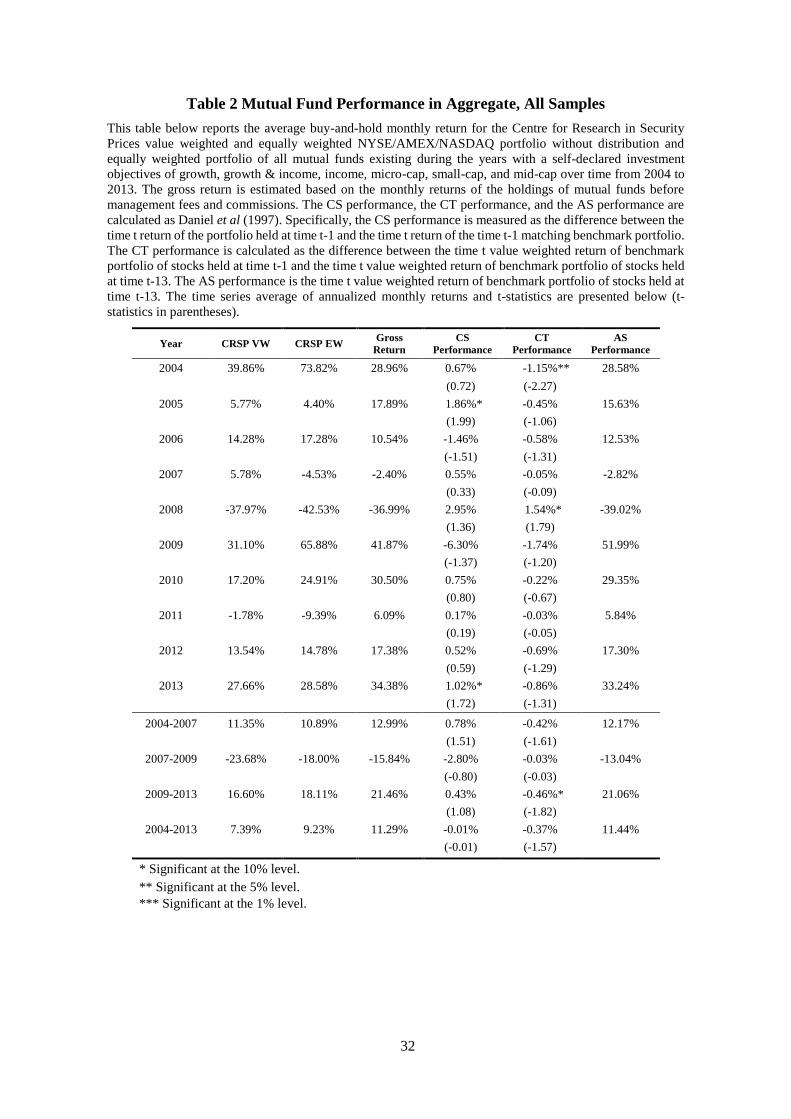
32
Table 2 Mutual Fund Performance in Aggregate, All Samples
This table below reports the average buy-and-hold monthly return for the Centre for Research in Security
Prices value weighted and equally weighted NYSE/AMEX/NASDAQ portfolio without distribution and
equally weighted portfolio of all mutual funds existing during the years with a self-declared investment
objectives of growth, growth & income, income, micro-cap, small-cap, and mid-cap over time from 2004 to
2013. The gross return is estimated based on the monthly returns of the holdings of mutual funds before
management fees and commissions. The CS performance, the CT performance, and the AS performance are
calculated as Daniel et al (1997). Specifically, the CS performance is measured as the difference between the
time t return of the portfolio held at time t-1 and the time t return of the time t-1 matching benchmark portfolio.
The CT performance is calculated as the difference between the time t value weighted return of benchmark
portfolio of stocks held at time t-1 and the time t value weighted return of benchmark portfolio of stocks held
at time t-13. The AS performance is the time t value weighted return of benchmark portfolio of stocks held at
time t-13. The time series average of annualized monthly returns and t-statistics are presented below (t-
statistics in parentheses).
Year CRSP VW CRSP EW Gross
Return
CS
Performance
CT
Performance
AS
Performance
2004 39.86% 73.82% 28.96% 0.67% -1.15%** 28.58%
(0.72) (-2.27)
2005 5.77% 4.40% 17.89% 1.86%* -0.45% 15.63%
(1.99) (-1.06)
2006 14.28% 17.28% 10.54% -1.46% -0.58% 12.53%
(-1.51) (-1.31)
2007 5.78% -4.53% -2.40% 0.55% -0.05% -2.82%
(0.33) (-0.09)
2008 -37.97% -42.53% -36.99% 2.95% 1.54%* -39.02%
(1.36) (1.79)
2009 31.10% 65.88% 41.87% -6.30% -1.74% 51.99%
(-1.37) (-1.20)
2010 17.20% 24.91% 30.50% 0.75% -0.22% 29.35%
(0.80) (-0.67)
2011 -1.78% -9.39% 6.09% 0.17% -0.03% 5.84%
(0.19) (-0.05)
2012 13.54% 14.78% 17.38% 0.52% -0.69% 17.30%
(0.59) (-1.29)
2013 27.66% 28.58% 34.38% 1.02%* -0.86% 33.24%
(1.72) (-1.31)
2004-2007 11.35% 10.89% 12.99% 0.78% -0.42% 12.17%
(1.51) (-1.61)
2007-2009 -23.68% -18.00% -15.84% -2.80% -0.03% -13.04%
(-0.80) (-0.03)
2009-2013 16.60% 18.11% 21.46% 0.43% -0.46%* 21.06%
(1.08) (-1.82)
2004-2013 7.39% 9.23% 11.29% -0.01% -0.37% 11.44%
(-0.01) (-1.57)
* Significant at the 10% level.
** Significant at the 5% level.
*** Significant at the 1% level.
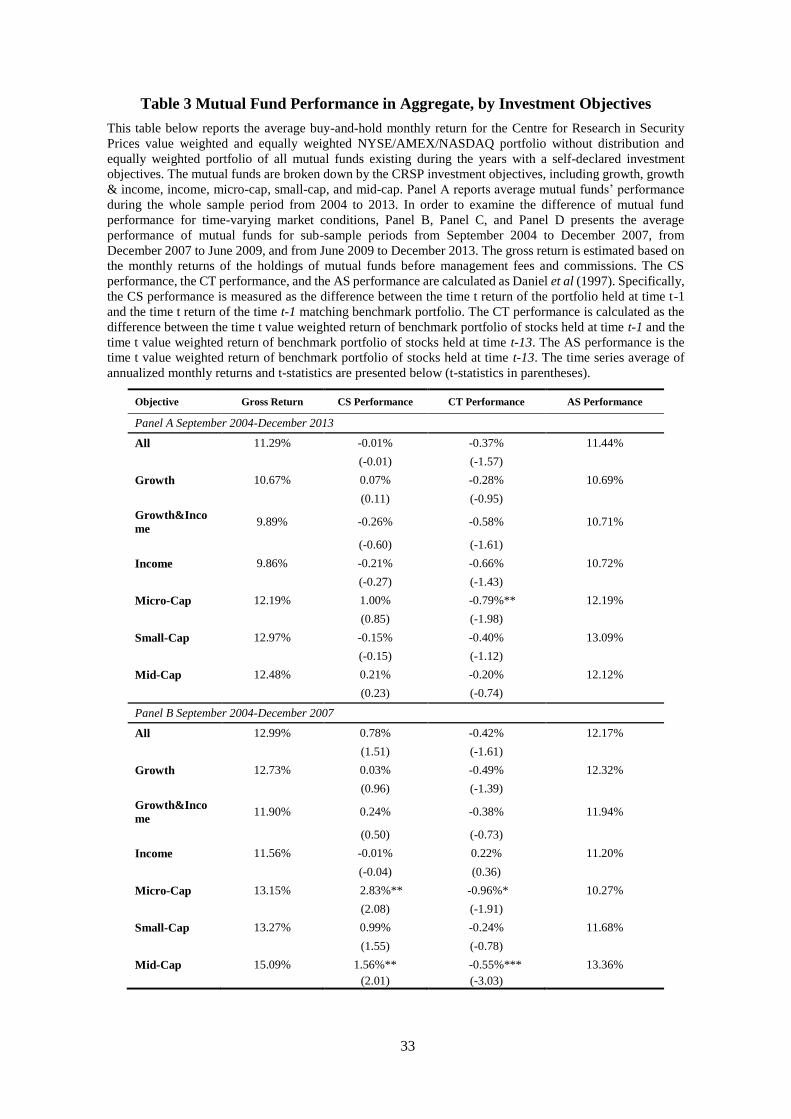
33
Table 3 Mutual Fund Performance in Aggregate, by Investment Objectives
This table below reports the average buy-and-hold monthly return for the Centre for Research in Security
Prices value weighted and equally weighted NYSE/AMEX/NASDAQ portfolio without distribution and
equally weighted portfolio of all mutual funds existing during the years with a self-declared investment
objectives. The mutual funds are broken down by the CRSP investment objectives, including growth, growth
& income, income, micro-cap, small-cap, and mid-cap. Panel A reports average mutual funds’ performance
during the whole sample period from 2004 to 2013. In order to examine the difference of mutual fund
performance for time-varying market conditions, Panel B, Panel C, and Panel D presents the average
performance of mutual funds for sub-sample periods from September 2004 to December 2007, from
December 2007 to June 2009, and from June 2009 to December 2013. The gross return is estimated based on
the monthly returns of the holdings of mutual funds before management fees and commissions. The CS
performance, the CT performance, and the AS performance are calculated as Daniel et al (1997). Specifically,
the CS performance is measured as the difference between the time t return of the portfolio held at time t-1
and the time t return of the time t-1 matching benchmark portfolio. The CT performance is calculated as the
difference between the time t value weighted return of benchmark portfolio of stocks held at time t-1 and the
time t value weighted return of benchmark portfolio of stocks held at time t-13. The AS performance is the
time t value weighted return of benchmark portfolio of stocks held at time t-13. The time series average of
annualized monthly returns and t-statistics are presented below (t-statistics in parentheses).
Objective Gross Return CS Performance CT Performance AS Performance
Panel A September 2004-December 2013
All 11.29% -0.01% -0.37% 11.44%
(-0.01) (-1.57)
Growth 10.67% 0.07% -0.28% 10.69%
(0.11) (-0.95)
Growth&Inco
me 9.89% -0.26% -0.58% 10.71%
(-0.60) (-1.61)
Income 9.86% -0.21% -0.66% 10.72%
(-0.27) (-1.43)
Micro-Cap 12.19% 1.00% -0.79%** 12.19%
(0.85) (-1.98)
Small-Cap 12.97% -0.15% -0.40% 13.09%
(-0.15) (-1.12)
Mid-Cap 12.48% 0.21% -0.20% 12.12%
(0.23) (-0.74)
Panel B September 2004-December 2007
All 12.99% 0.78% -0.42% 12.17%
(1.51) (-1.61)
Growth 12.73% 0.03% -0.49% 12.32%
(0.96) (-1.39)
Growth&Inco
me 11.90% 0.24% -0.38% 11.94%
(0.50) (-0.73)
Income 11.56% -0.01% 0.22% 11.20%
(-0.04) (0.36)
Micro-Cap 13.15% 2.83%** -0.96%* 10.27%
(2.08) (-1.91)
Small-Cap 13.27% 0.99% -0.24% 11.68%
(1.55) (-0.78)
Mid-Cap 15.09% 1.56%** -0.55%*** 13.36%
(2.01) (-3.03)
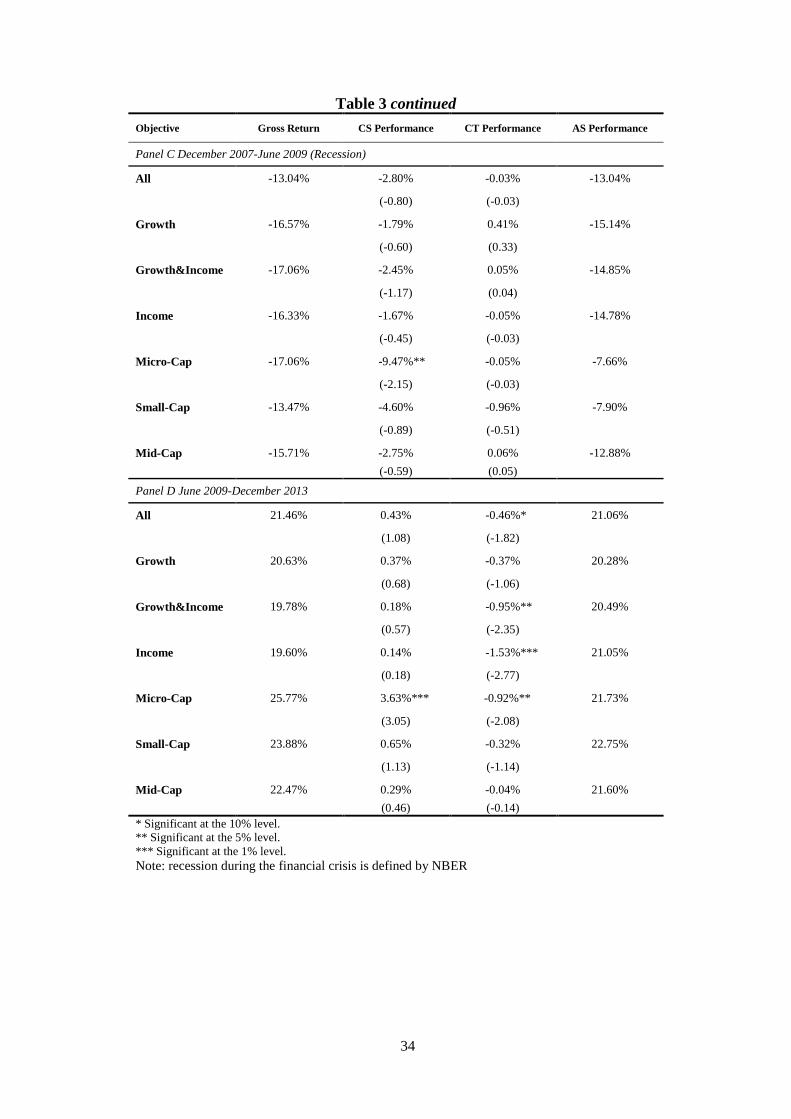
34
Table 3 continued
Objective Gross Return CS Performance CT Performance AS Performance
Panel C December 2007-June 2009 (Recession)
All -13.04% -2.80% -0.03% -13.04%
(-0.80) (-0.03)
Growth -16.57% -1.79% 0.41% -15.14%
(-0.60) (0.33)
Growth&Income -17.06% -2.45% 0.05% -14.85%
(-1.17) (0.04)
Income -16.33% -1.67% -0.05% -14.78%
(-0.45) (-0.03)
Micro-Cap -17.06% -9.47%** -0.05% -7.66%
(-2.15) (-0.03)
Small-Cap -13.47% -4.60% -0.96% -7.90%
(-0.89) (-0.51)
Mid-Cap -15.71% -2.75% 0.06% -12.88%
(-0.59) (0.05)
Panel D June 2009-December 2013
All 21.46% 0.43% -0.46%* 21.06%
(1.08) (-1.82)
Growth 20.63% 0.37% -0.37% 20.28%
(0.68) (-1.06)
Growth&Income 19.78% 0.18% -0.95%** 20.49%
(0.57) (-2.35)
Income 19.60% 0.14% -1.53%*** 21.05%
(0.18) (-2.77)
Micro-Cap 25.77% 3.63%*** -0.92%** 21.73%
(3.05) (-2.08)
Small-Cap 23.88% 0.65% -0.32% 22.75%
(1.13) (-1.14)
Mid-Cap 22.47% 0.29% -0.04% 21.60%
(0.46) (-0.14)
* Significant at the 10% level.
** Significant at the 5% level.
*** Significant at the 1% level.
Note: recession during the financial crisis is defined by NBER
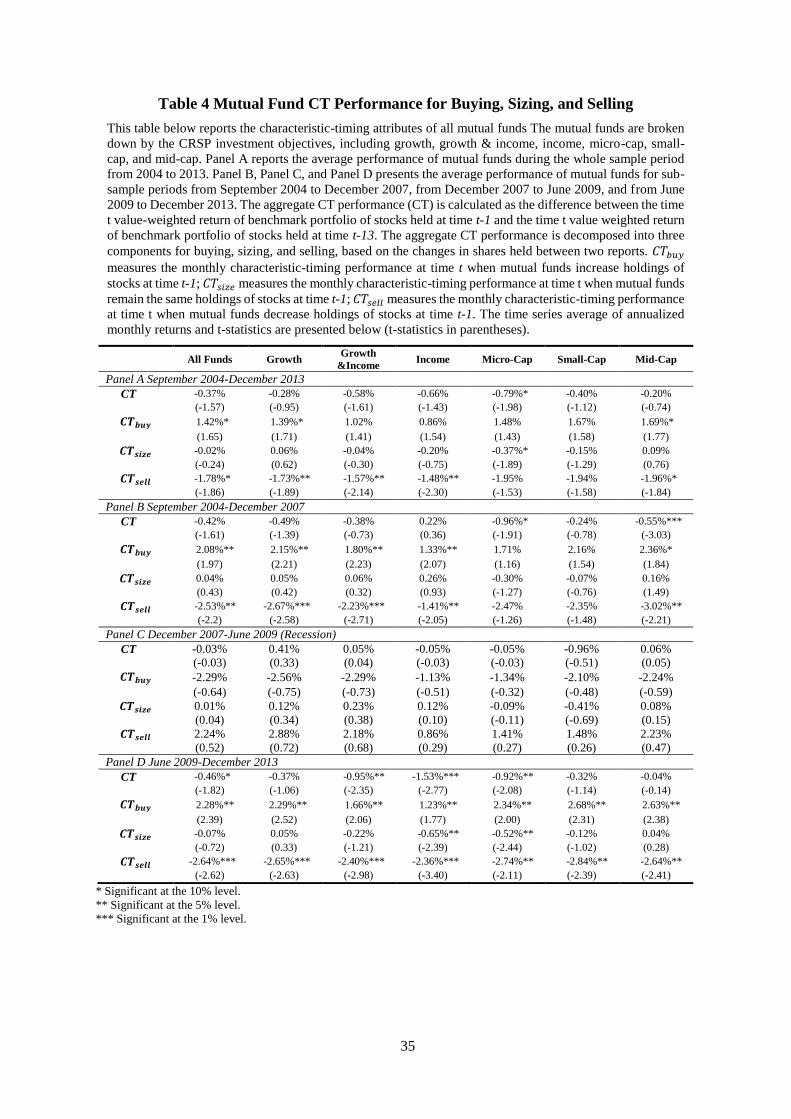
35
Table 4 Mutual Fund CT Performance for Buying, Sizing, and Selling
This table below reports the characteristic-timing attributes of all mutual funds The mutual funds are broken
down by the CRSP investment objectives, including growth, growth & income, income, micro-cap, small-
cap, and mid-cap. Panel A reports the average performance of mutual funds during the whole sample period
from 2004 to 2013. Panel B, Panel C, and Panel D presents the average performance of mutual funds for sub-
sample periods from September 2004 to December 2007, from December 2007 to June 2009, and from June
2009 to December 2013. The aggregate CT performance (CT) is calculated as the difference between the time
t value-weighted return of benchmark portfolio of stocks held at time t-1 and the time t value weighted return
of benchmark portfolio of stocks held at time t-13. The aggregate CT performance is decomposed into three
components for buying, sizing, and selling, based on the changes in shares held between two reports. 𝐶𝑇𝑏𝑢𝑦
measures the monthly characteristic-timing performance at time t when mutual funds increase holdings of
stocks at time t-1; 𝐶𝑇𝑠𝑖𝑧𝑒 measures the monthly characteristic-timing performance at time t when mutual funds
remain the same holdings of stocks at time t-1; 𝐶𝑇𝑠𝑒𝑙𝑙 measures the monthly characteristic-timing performance
at time t when mutual funds decrease holdings of stocks at time t-1. The time series average of annualized
monthly returns and t-statistics are presented below (t-statistics in parentheses).
All Funds Growth Growth
&Income Income Micro-Cap Small-Cap Mid-Cap
Panel A September 2004-December 2013
CT -0.37% -0.28% -0.58% -0.66% -0.79%* -0.40% -0.20%
(-1.57) (-0.95) (-1.61) (-1.43) (-1.98) (-1.12) (-0.74)
𝑪𝑻𝒃𝒖𝒚 1.42%* 1.39%* 1.02% 0.86% 1.48% 1.67% 1.69%*
(1.65) (1.71) (1.41) (1.54) (1.43) (1.58) (1.77)
𝑪𝑻𝒔𝒊𝒛𝒆 -0.02% 0.06% -0.04% -0.20% -0.37%* -0.15% 0.09%
(-0.24) (0.62) (-0.30) (-0.75) (-1.89) (-1.29) (0.76)
𝑪𝑻𝒔𝒆𝒍𝒍 -1.78%* -1.73%** -1.57%** -1.48%** -1.95% -1.94% -1.96%*
(-1.86) (-1.89) (-2.14) (-2.30) (-1.53) (-1.58) (-1.84)
Panel B September 2004-December 2007
CT -0.42% -0.49% -0.38% 0.22% -0.96%* -0.24% -0.55%***
(-1.61) (-1.39) (-0.73) (0.36) (-1.91) (-0.78) (-3.03)
𝑪𝑻𝒃𝒖𝒚 2.08%** 2.15%** 1.80%** 1.33%** 1.71% 2.16% 2.36%*
(1.97) (2.21) (2.23) (2.07) (1.16) (1.54) (1.84)
𝑪𝑻𝒔𝒊𝒛𝒆 0.04% 0.05% 0.06% 0.26% -0.30% -0.07% 0.16%
(0.43) (0.42) (0.32) (0.93) (-1.27) (-0.76) (1.49)
𝑪𝑻𝒔𝒆𝒍𝒍 -2.53%** -2.67%*** -2.23%*** -1.41%** -2.47% -2.35% -3.02%**
(-2.2) (-2.58) (-2.71) (-2.05) (-1.26) (-1.48) (-2.21)
Panel C December 2007-June 2009 (Recession)
CT -0.03% 0.41% 0.05% -0.05% -0.05% -0.96% 0.06%
(-0.03) (0.33) (0.04) (-0.03) (-0.03) (-0.51) (0.05)
𝑪𝑻𝒃𝒖𝒚 -2.29% -2.56% -2.29% -1.13% -1.34% -2.10% -2.24%
(-0.64) (-0.75) (-0.73) (-0.51) (-0.32) (-0.48) (-0.59)
𝑪𝑻𝒔𝒊𝒛𝒆 0.01% 0.12% 0.23% 0.12% -0.09% -0.41% 0.08%
(0.04) (0.34) (0.38) (0.10) (-0.11) (-0.69) (0.15)
𝑪𝑻𝒔𝒆𝒍𝒍 2.24% 2.88% 2.18% 0.86% 1.41% 1.48% 2.23%
(0.52) (0.72) (0.68) (0.29) (0.27) (0.26) (0.47)
Panel D June 2009-December 2013
CT -0.46%* -0.37% -0.95%** -1.53%*** -0.92%** -0.32% -0.04%
(-1.82) (-1.06) (-2.35) (-2.77) (-2.08) (-1.14) (-0.14)
𝑪𝑻𝒃𝒖𝒚 2.28%** 2.29%** 1.66%** 1.23%** 2.34%** 2.68%** 2.63%**
(2.39) (2.52) (2.06) (1.77) (2.00) (2.31) (2.38)
𝑪𝑻𝒔𝒊𝒛𝒆 -0.07% 0.05% -0.22% -0.65%** -0.52%** -0.12% 0.04%
(-0.72) (0.33) (-1.21) (-2.39) (-2.44) (-1.02) (0.28)
𝑪𝑻𝒔𝒆𝒍𝒍 -2.64%*** -2.65%*** -2.40%*** -2.36%*** -2.74%** -2.84%** -2.64%**
(-2.62) (-2.63) (-2.98) (-3.40) (-2.11) (-2.39) (-2.41)
* Significant at the 10% level.
** Significant at the 5% level.
*** Significant at the 1% level.
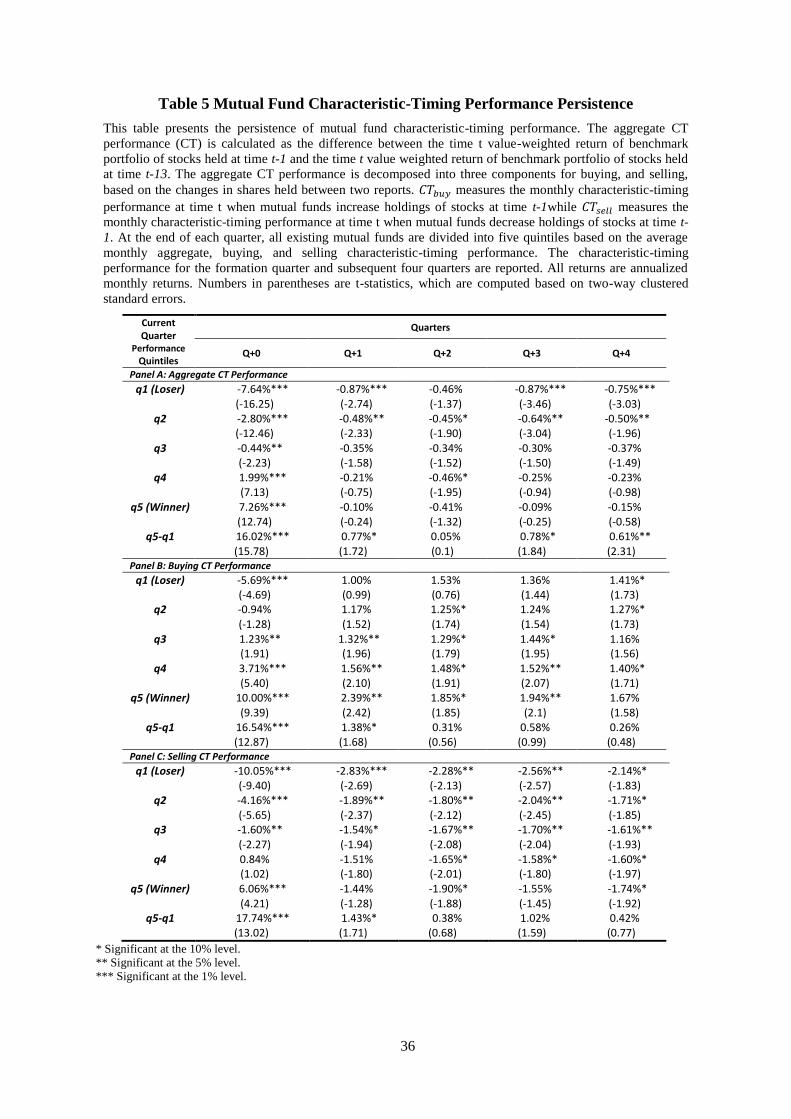
36
Table 5 Mutual Fund Characteristic-Timing Performance Persistence
This table presents the persistence of mutual fund characteristic-timing performance. The aggregate CT
performance (CT) is calculated as the difference between the time t value-weighted return of benchmark
portfolio of stocks held at time t-1 and the time t value weighted return of benchmark portfolio of stocks held
at time t-13. The aggregate CT performance is decomposed into three components for buying, and selling,
based on the changes in shares held between two reports. 𝐶𝑇𝑏𝑢𝑦 measures the monthly characteristic-timing
performance at time t when mutual funds increase holdings of stocks at time t-1while 𝐶𝑇𝑠𝑒𝑙𝑙 measures the
monthly characteristic-timing performance at time t when mutual funds decrease holdings of stocks at time t-
1. At the end of each quarter, all existing mutual funds are divided into five quintiles based on the average
monthly aggregate, buying, and selling characteristic-timing performance. The characteristic-timing
performance for the formation quarter and subsequent four quarters are reported. All returns are annualized
monthly returns. Numbers in parentheses are t-statistics, which are computed based on two-way clustered
standard errors.
Current Quarter
Performance Quintiles
Quarters
Q+0 Q+1 Q+2 Q+3 Q+4
Panel A: Aggregate CT Performance
q1 (Loser) -7.64%*** -0.87%*** -0.46% -0.87%*** -0.75%*** (-16.25) (-2.74) (-1.37) (-3.46) (-3.03)
q2 -2.80%*** -0.48%** -0.45%* -0.64%** -0.50%** (-12.46) (-2.33) (-1.90) (-3.04) (-1.96)
q3 -0.44%** -0.35% -0.34% -0.30% -0.37% (-2.23) (-1.58) (-1.52) (-1.50) (-1.49)
q4 1.99%*** -0.21% -0.46%* -0.25% -0.23% (7.13) (-0.75) (-1.95) (-0.94) (-0.98)
q5 (Winner) 7.26%*** -0.10% -0.41% -0.09% -0.15% (12.74) (-0.24) (-1.32) (-0.25) (-0.58)
q5-q1 16.02%*** 0.77%* 0.05% 0.78%* 0.61%** (15.78) (1.72) (0.1) (1.84) (2.31)
Panel B: Buying CT Performance q1 (Loser) -5.69%*** 1.00% 1.53% 1.36% 1.41%*
(-4.69) (0.99) (0.76) (1.44) (1.73) q2 -0.94% 1.17% 1.25%* 1.24% 1.27%*
(-1.28) (1.52) (1.74) (1.54) (1.73) q3 1.23%** 1.32%** 1.29%* 1.44%* 1.16%
(1.91) (1.96) (1.79) (1.95) (1.56) q4 3.71%*** 1.56%** 1.48%* 1.52%** 1.40%*
(5.40) (2.10) (1.91) (2.07) (1.71) q5 (Winner) 10.00%*** 2.39%** 1.85%* 1.94%** 1.67%
(9.39) (2.42) (1.85) (2.1) (1.58) q5-q1 16.54%*** 1.38%* 0.31% 0.58% 0.26%
(12.87) (1.68) (0.56) (0.99) (0.48) Panel C: Selling CT Performance
q1 (Loser) -10.05%*** -2.83%*** -2.28%** -2.56%** -2.14%* (-9.40) (-2.69) (-2.13) (-2.57) (-1.83)
q2 -4.16%*** -1.89%** -1.80%** -2.04%** -1.71%* (-5.65) (-2.37) (-2.12) (-2.45) (-1.85)
q3 -1.60%** -1.54%* -1.67%** -1.70%** -1.61%** (-2.27) (-1.94) (-2.08) (-2.04) (-1.93)
q4 0.84% -1.51% -1.65%* -1.58%* -1.60%* (1.02) (-1.80) (-2.01) (-1.80) (-1.97)
q5 (Winner) 6.06%*** -1.44% -1.90%* -1.55% -1.74%* (4.21) (-1.28) (-1.88) (-1.45) (-1.92)
q5-q1 17.74%*** 1.43%* 0.38% 1.02% 0.42% (13.02) (1.71) (0.68) (1.59) (0.77)
* Significant at the 10% level.
** Significant at the 5% level.
*** Significant at the 1% level.
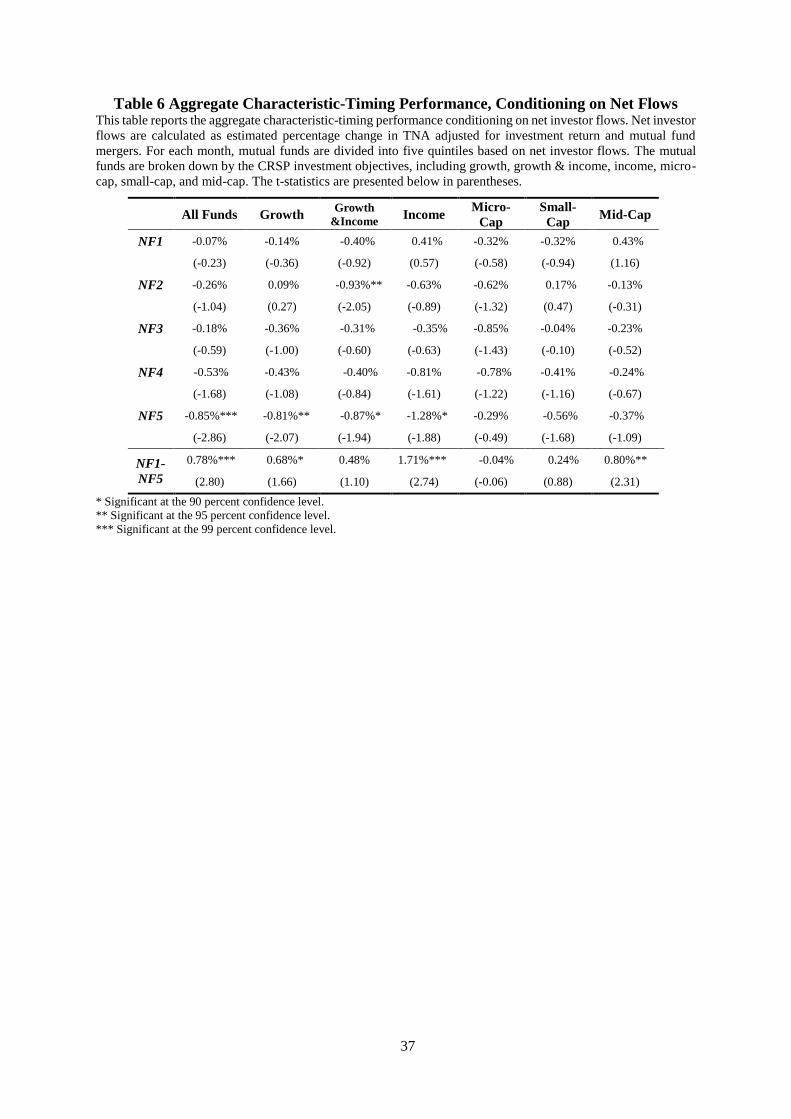
37
Table 6 Aggregate Characteristic-Timing Performance, Conditioning on Net Flows This table reports the aggregate characteristic-timing performance conditioning on net investor flows. Net investor
flows are calculated as estimated percentage change in TNA adjusted for investment return and mutual fund
mergers. For each month, mutual funds are divided into five quintiles based on net investor flows. The mutual
funds are broken down by the CRSP investment objectives, including growth, growth & income, income, micro-
cap, small-cap, and mid-cap. The t-statistics are presented below in parentheses.
All Funds Growth Growth
&Income Income
Micro-
Cap
Small-
Cap Mid-Cap
NF1 -0.07% -0.14% -0.40% 0.41% -0.32% -0.32% 0.43%
(-0.23) (-0.36) (-0.92) (0.57) (-0.58) (-0.94) (1.16)
NF2 -0.26% 0.09% -0.93%** -0.63% -0.62% 0.17% -0.13%
(-1.04) (0.27) (-2.05) (-0.89) (-1.32) (0.47) (-0.31)
NF3 -0.18% -0.36% -0.31% -0.35% -0.85% -0.04% -0.23%
(-0.59) (-1.00) (-0.60) (-0.63) (-1.43) (-0.10) (-0.52)
NF4 -0.53% -0.43% -0.40% -0.81% -0.78% -0.41% -0.24%
(-1.68) (-1.08) (-0.84) (-1.61) (-1.22) (-1.16) (-0.67)
NF5 -0.85%*** -0.81%** -0.87%* -1.28%* -0.29% -0.56% -0.37%
(-2.86) (-2.07) (-1.94) (-1.88) (-0.49) (-1.68) (-1.09)
NF1-
NF5
0.78%*** 0.68%* 0.48% 1.71%*** -0.04% 0.24% 0.80%**
(2.80) (1.66) (1.10) (2.74) (-0.06) (0.88) (2.31)
* Significant at the 90 percent confidence level.
** Significant at the 95 percent confidence level.
*** Significant at the 99 percent confidence level.
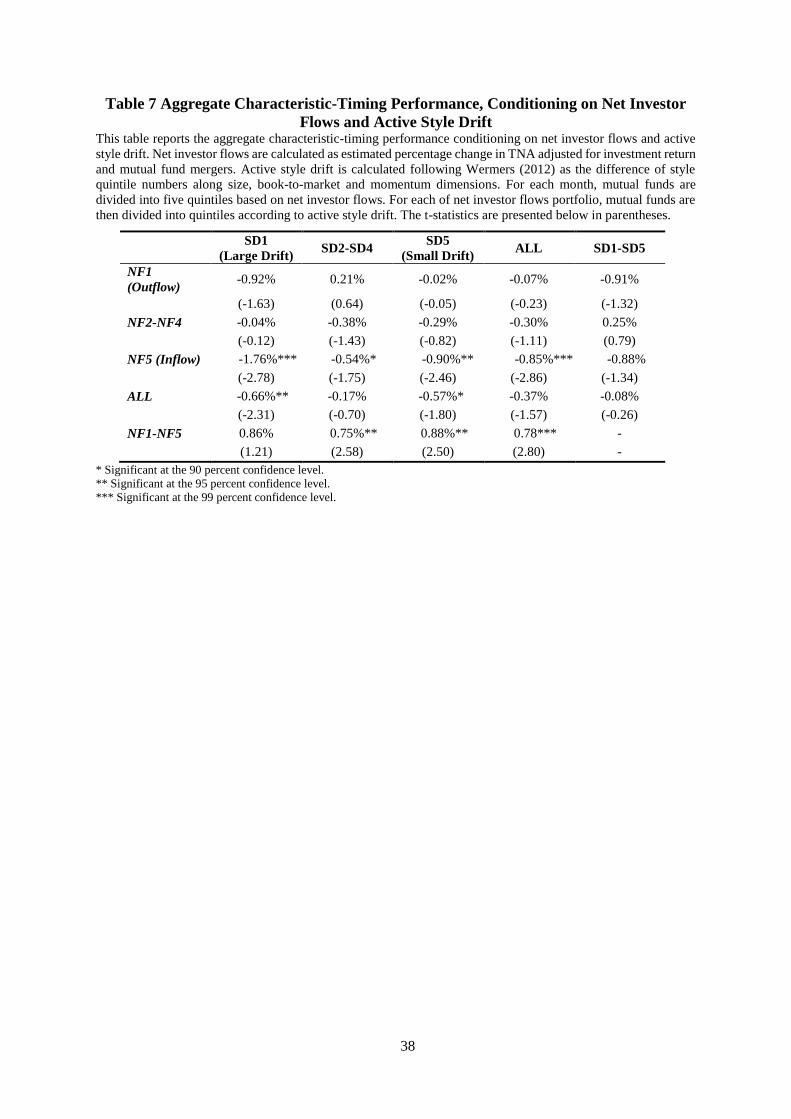
38
Table 7 Aggregate Characteristic-Timing Performance, Conditioning on Net Investor
Flows and Active Style Drift This table reports the aggregate characteristic-timing performance conditioning on net investor flows and active
style drift. Net investor flows are calculated as estimated percentage change in TNA adjusted for investment return
and mutual fund mergers. Active style drift is calculated following Wermers (2012) as the difference of style
quintile numbers along size, book-to-market and momentum dimensions. For each month, mutual funds are
divided into five quintiles based on net investor flows. For each of net investor flows portfolio, mutual funds are
then divided into quintiles according to active style drift. The t-statistics are presented below in parentheses.
SD1
(Large Drift) SD2-SD4
SD5
(Small Drift) ALL SD1-SD5
NF1
(Outflow) -0.92% 0.21% -0.02% -0.07% -0.91%
(-1.63) (0.64) (-0.05) (-0.23) (-1.32)
NF2-NF4 -0.04% -0.38% -0.29% -0.30% 0.25%
(-0.12) (-1.43) (-0.82) (-1.11) (0.79)
NF5 (Inflow) -1.76%*** -0.54%* -0.90%** -0.85%*** -0.88%
(-2.78) (-1.75) (-2.46) (-2.86) (-1.34)
ALL -0.66%** -0.17% -0.57%* -0.37% -0.08%
(-2.31) (-0.70) (-1.80) (-1.57) (-0.26)
NF1-NF5 0.86% 0.75%** 0.88%** 0.78*** -
(1.21) (2.58) (2.50) (2.80) -
* Significant at the 90 percent confidence level.
** Significant at the 95 percent confidence level.
*** Significant at the 99 percent confidence level.
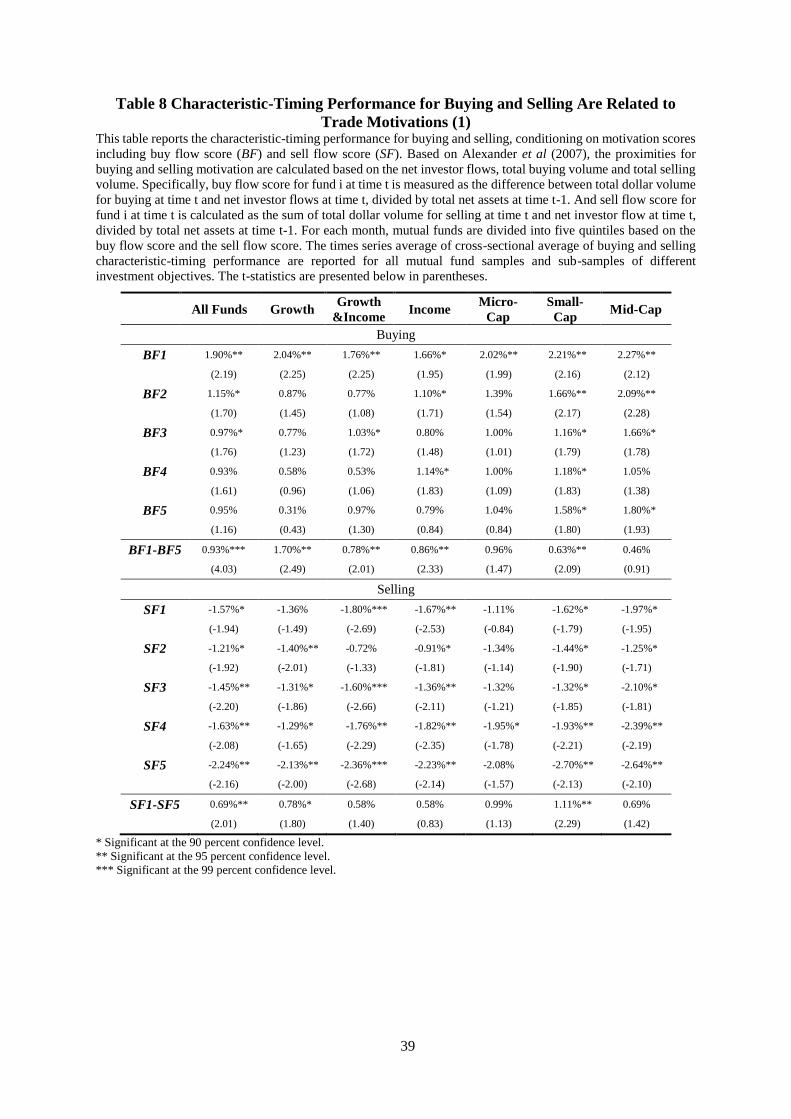
39
Table 8 Characteristic-Timing Performance for Buying and Selling Are Related to
Trade Motivations (1) This table reports the characteristic-timing performance for buying and selling, conditioning on motivation scores
including buy flow score (BF) and sell flow score (SF). Based on Alexander et al (2007), the proximities for
buying and selling motivation are calculated based on the net investor flows, total buying volume and total selling
volume. Specifically, buy flow score for fund i at time t is measured as the difference between total dollar volume
for buying at time t and net investor flows at time t, divided by total net assets at time t-1. And sell flow score for
fund i at time t is calculated as the sum of total dollar volume for selling at time t and net investor flow at time t,
divided by total net assets at time t-1. For each month, mutual funds are divided into five quintiles based on the
buy flow score and the sell flow score. The times series average of cross-sectional average of buying and selling
characteristic-timing performance are reported for all mutual fund samples and sub-samples of different
investment objectives. The t-statistics are presented below in parentheses.
All Funds Growth Growth
&Income Income
Micro-
Cap
Small-
Cap Mid-Cap
Buying
BF1 1.90%** 2.04%** 1.76%** 1.66%* 2.02%** 2.21%** 2.27%**
(2.19) (2.25) (2.25) (1.95) (1.99) (2.16) (2.12)
BF2 1.15%* 0.87% 0.77% 1.10%* 1.39% 1.66%** 2.09%**
(1.70) (1.45) (1.08) (1.71) (1.54) (2.17) (2.28)
BF3 0.97%* 0.77% 1.03%* 0.80% 1.00% 1.16%* 1.66%*
(1.76) (1.23) (1.72) (1.48) (1.01) (1.79) (1.78)
BF4 0.93% 0.58% 0.53% 1.14%* 1.00% 1.18%* 1.05%
(1.61) (0.96) (1.06) (1.83) (1.09) (1.83) (1.38)
BF5 0.95% 0.31% 0.97% 0.79% 1.04% 1.58%* 1.80%*
(1.16) (0.43) (1.30) (0.84) (0.84) (1.80) (1.93)
BF1-BF5 0.93%*** 1.70%** 0.78%** 0.86%** 0.96% 0.63%** 0.46%
(4.03) (2.49) (2.01) (2.33) (1.47) (2.09) (0.91)
Selling
SF1 -1.57%* -1.36% -1.80%*** -1.67%** -1.11% -1.62%* -1.97%*
(-1.94) (-1.49) (-2.69) (-2.53) (-0.84) (-1.79) (-1.95)
SF2 -1.21%* -1.40%** -0.72% -0.91%* -1.34% -1.44%* -1.25%*
(-1.92) (-2.01) (-1.33) (-1.81) (-1.14) (-1.90) (-1.71)
SF3 -1.45%** -1.31%* -1.60%*** -1.36%** -1.32% -1.32%* -2.10%*
(-2.20) (-1.86) (-2.66) (-2.11) (-1.21) (-1.85) (-1.81)
SF4 -1.63%** -1.29%* -1.76%** -1.82%** -1.95%* -1.93%** -2.39%**
(-2.08) (-1.65) (-2.29) (-2.35) (-1.78) (-2.21) (-2.19)
SF5 -2.24%** -2.13%** -2.36%*** -2.23%** -2.08% -2.70%** -2.64%**
(-2.16) (-2.00) (-2.68) (-2.14) (-1.57) (-2.13) (-2.10)
SF1-SF5 0.69%** 0.78%* 0.58% 0.58% 0.99% 1.11%** 0.69%
(2.01) (1.80) (1.40) (0.83) (1.13) (2.29) (1.42)
* Significant at the 90 percent confidence level.
** Significant at the 95 percent confidence level.
*** Significant at the 99 percent confidence level.
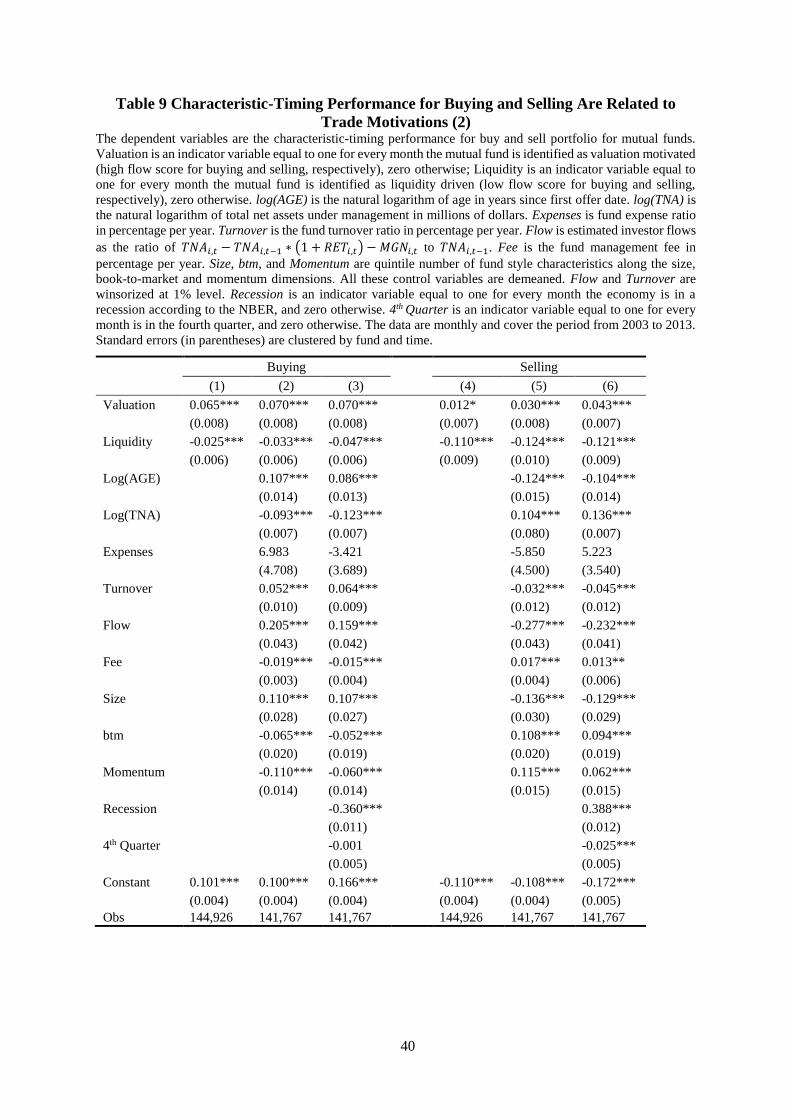
40
Table 9 Characteristic-Timing Performance for Buying and Selling Are Related to
Trade Motivations (2) The dependent variables are the characteristic-timing performance for buy and sell portfolio for mutual funds.
Valuation is an indicator variable equal to one for every month the mutual fund is identified as valuation motivated
(high flow score for buying and selling, respectively), zero otherwise; Liquidity is an indicator variable equal to
one for every month the mutual fund is identified as liquidity driven (low flow score for buying and selling,
respectively), zero otherwise. log(AGE) is the natural logarithm of age in years since first offer date. log(TNA) is
the natural logarithm of total net assets under management in millions of dollars. Expenses is fund expense ratio
in percentage per year. Turnover is the fund turnover ratio in percentage per year. Flow is estimated investor flows
as the ratio of 𝑇𝑁𝐴𝑖,𝑡 − 𝑇𝑁𝐴𝑖,𝑡−1 ∗ (1 + 𝑅𝐸𝑇𝑖,𝑡) − 𝑀𝐺𝑁𝑖,𝑡 to 𝑇𝑁𝐴𝑖,𝑡−1. Fee is the fund management fee in
percentage per year. Size, btm, and Momentum are quintile number of fund style characteristics along the size,
book-to-market and momentum dimensions. All these control variables are demeaned. Flow and Turnover are
winsorized at 1% level. Recession is an indicator variable equal to one for every month the economy is in a
recession according to the NBER, and zero otherwise. 4th Quarter is an indicator variable equal to one for every
month is in the fourth quarter, and zero otherwise. The data are monthly and cover the period from 2003 to 2013.
Standard errors (in parentheses) are clustered by fund and time.
Buying Selling
(1) (2) (3) (4) (5) (6)
Valuation 0.065*** 0.070*** 0.070*** 0.012* 0.030*** 0.043***
(0.008) (0.008) (0.008) (0.007) (0.008) (0.007)
Liquidity -0.025*** -0.033*** -0.047*** -0.110*** -0.124*** -0.121***
(0.006) (0.006) (0.006) (0.009) (0.010) (0.009)
Log(AGE) 0.107*** 0.086*** -0.124*** -0.104***
(0.014) (0.013) (0.015) (0.014)
Log(TNA) -0.093*** -0.123*** 0.104*** 0.136***
(0.007) (0.007) (0.080) (0.007)
Expenses 6.983 -3.421 -5.850 5.223
(4.708) (3.689) (4.500) (3.540)
Turnover 0.052*** 0.064*** -0.032*** -0.045***
(0.010) (0.009) (0.012) (0.012)
Flow 0.205*** 0.159*** -0.277*** -0.232***
(0.043) (0.042) (0.043) (0.041)
Fee -0.019*** -0.015*** 0.017*** 0.013**
(0.003) (0.004) (0.004) (0.006)
Size 0.110*** 0.107*** -0.136*** -0.129***
(0.028) (0.027) (0.030) (0.029)
btm -0.065*** -0.052*** 0.108*** 0.094***
(0.020) (0.019) (0.020) (0.019)
Momentum -0.110*** -0.060*** 0.115*** 0.062***
(0.014) (0.014) (0.015) (0.015)
Recession -0.360*** 0.388***
(0.011) (0.012)
4th Quarter -0.001 -0.025***
(0.005) (0.005)
Constant 0.101*** 0.100*** 0.166*** -0.110*** -0.108*** -0.172***
(0.004) (0.004) (0.004) (0.004) (0.004) (0.005)
Obs 144,926 141,767 141,767 144,926 141,767 141,767
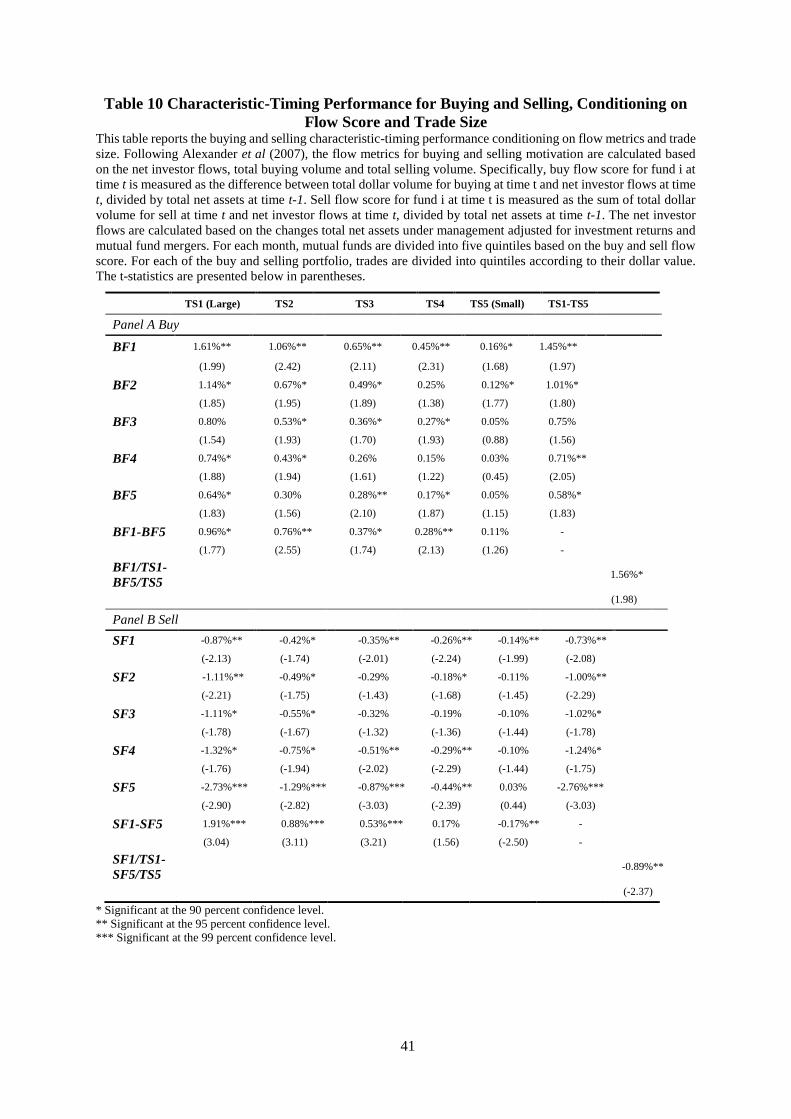
41
Table 10 Characteristic-Timing Performance for Buying and Selling, Conditioning on
Flow Score and Trade Size This table reports the buying and selling characteristic-timing performance conditioning on flow metrics and trade
size. Following Alexander et al (2007), the flow metrics for buying and selling motivation are calculated based
on the net investor flows, total buying volume and total selling volume. Specifically, buy flow score for fund i at
time t is measured as the difference between total dollar volume for buying at time t and net investor flows at time
t, divided by total net assets at time t-1. Sell flow score for fund i at time t is measured as the sum of total dollar
volume for sell at time t and net investor flows at time t, divided by total net assets at time t-1. The net investor
flows are calculated based on the changes total net assets under management adjusted for investment returns and
mutual fund mergers. For each month, mutual funds are divided into five quintiles based on the buy and sell flow
score. For each of the buy and selling portfolio, trades are divided into quintiles according to their dollar value.
The t-statistics are presented below in parentheses.
TS1 (Large) TS2 TS3 TS4 TS5 (Small) TS1-TS5
Panel A Buy
BF1 1.61%** 1.06%** 0.65%** 0.45%** 0.16%* 1.45%**
(1.99) (2.42) (2.11) (2.31) (1.68) (1.97)
BF2 1.14%* 0.67%* 0.49%* 0.25% 0.12%* 1.01%*
(1.85) (1.95) (1.89) (1.38) (1.77) (1.80)
BF3 0.80% 0.53%* 0.36%* 0.27%* 0.05% 0.75%
(1.54) (1.93) (1.70) (1.93) (0.88) (1.56)
BF4 0.74%* 0.43%* 0.26% 0.15% 0.03% 0.71%**
(1.88) (1.94) (1.61) (1.22) (0.45) (2.05)
BF5 0.64%* 0.30% 0.28%** 0.17%* 0.05% 0.58%*
(1.83) (1.56) (2.10) (1.87) (1.15) (1.83)
BF1-BF5 0.96%* 0.76%** 0.37%* 0.28%** 0.11% -
(1.77) (2.55) (1.74) (2.13) (1.26) -
BF1/TS1-
BF5/TS5 1.56%*
(1.98)
Panel B Sell
SF1 -0.87%** -0.42%* -0.35%** -0.26%** -0.14%** -0.73%**
(-2.13) (-1.74) (-2.01) (-2.24) (-1.99) (-2.08)
SF2 -1.11%** -0.49%* -0.29% -0.18%* -0.11% -1.00%**
(-2.21) (-1.75) (-1.43) (-1.68) (-1.45) (-2.29)
SF3 -1.11%* -0.55%* -0.32% -0.19% -0.10% -1.02%*
(-1.78) (-1.67) (-1.32) (-1.36) (-1.44) (-1.78)
SF4 -1.32%* -0.75%* -0.51%** -0.29%** -0.10% -1.24%*
(-1.76) (-1.94) (-2.02) (-2.29) (-1.44) (-1.75)
SF5 -2.73%*** -1.29%*** -0.87%*** -0.44%** 0.03% -2.76%***
(-2.90) (-2.82) (-3.03) (-2.39) (0.44) (-3.03)
SF1-SF5 1.91%*** 0.88%*** 0.53%*** 0.17% -0.17%** -
(3.04) (3.11) (3.21) (1.56) (-2.50) -
SF1/TS1-
SF5/TS5 -0.89%**
(-2.37)
* Significant at the 90 percent confidence level.
** Significant at the 95 percent confidence level.
*** Significant at the 99 percent confidence level.
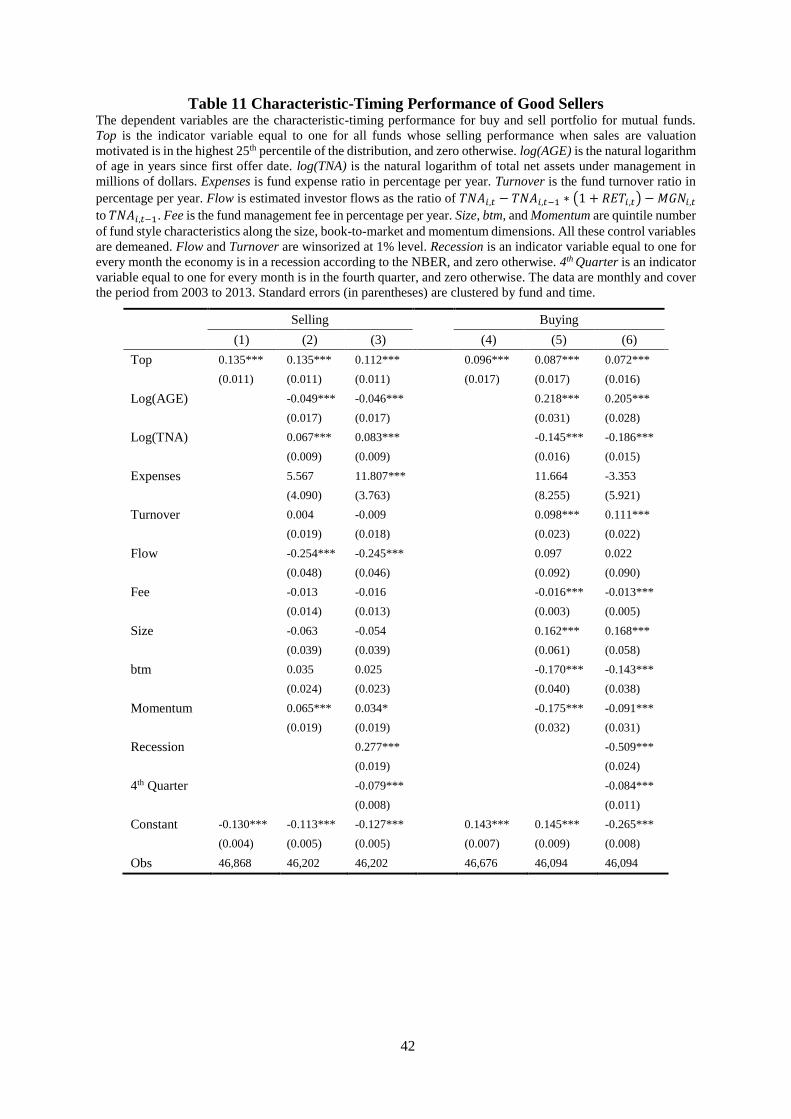
42
Table 11 Characteristic-Timing Performance of Good Sellers The dependent variables are the characteristic-timing performance for buy and sell portfolio for mutual funds.
Top is the indicator variable equal to one for all funds whose selling performance when sales are valuation
motivated is in the highest 25th percentile of the distribution, and zero otherwise. log(AGE) is the natural logarithm
of age in years since first offer date. log(TNA) is the natural logarithm of total net assets under management in
millions of dollars. Expenses is fund expense ratio in percentage per year. Turnover is the fund turnover ratio in
percentage per year. Flow is estimated investor flows as the ratio of 𝑇𝑁𝐴𝑖,𝑡 − 𝑇𝑁𝐴𝑖,𝑡−1 ∗ (1 + 𝑅𝐸𝑇𝑖,𝑡) − 𝑀𝐺𝑁𝑖,𝑡
to 𝑇𝑁𝐴𝑖,𝑡−1. Fee is the fund management fee in percentage per year. Size, btm, and Momentum are quintile number
of fund style characteristics along the size, book-to-market and momentum dimensions. All these control variables
are demeaned. Flow and Turnover are winsorized at 1% level. Recession is an indicator variable equal to one for
every month the economy is in a recession according to the NBER, and zero otherwise. 4th Quarter is an indicator
variable equal to one for every month is in the fourth quarter, and zero otherwise. The data are monthly and cover
the period from 2003 to 2013. Standard errors (in parentheses) are clustered by fund and time.
Selling Buying
(1) (2) (3) (4) (5) (6)
Top 0.135*** 0.135*** 0.112*** 0.096*** 0.087*** 0.072***
(0.011) (0.011) (0.011) (0.017) (0.017) (0.016)
Log(AGE) -0.049*** -0.046*** 0.218*** 0.205***
(0.017) (0.017) (0.031) (0.028)
Log(TNA) 0.067*** 0.083*** -0.145*** -0.186***
(0.009) (0.009) (0.016) (0.015)
Expenses 5.567 11.807*** 11.664 -3.353
(4.090) (3.763) (8.255) (5.921)
Turnover 0.004 -0.009 0.098*** 0.111***
(0.019) (0.018) (0.023) (0.022)
Flow -0.254*** -0.245*** 0.097 0.022
(0.048) (0.046) (0.092) (0.090)
Fee -0.013 -0.016 -0.016*** -0.013***
(0.014) (0.013) (0.003) (0.005)
Size -0.063 -0.054 0.162*** 0.168***
(0.039) (0.039) (0.061) (0.058)
btm 0.035 0.025 -0.170*** -0.143***
(0.024) (0.023) (0.040) (0.038)
Momentum 0.065*** 0.034* -0.175*** -0.091***
(0.019) (0.019) (0.032) (0.031)
Recession 0.277*** -0.509***
(0.019) (0.024)
4th Quarter -0.079*** -0.084***
(0.008) (0.011)
Constant -0.130*** -0.113*** -0.127*** 0.143*** 0.145*** -0.265***
(0.004) (0.005) (0.005) (0.007) (0.009) (0.008)
Obs 46,868 46,202 46,202 46,676 46,094 46,094
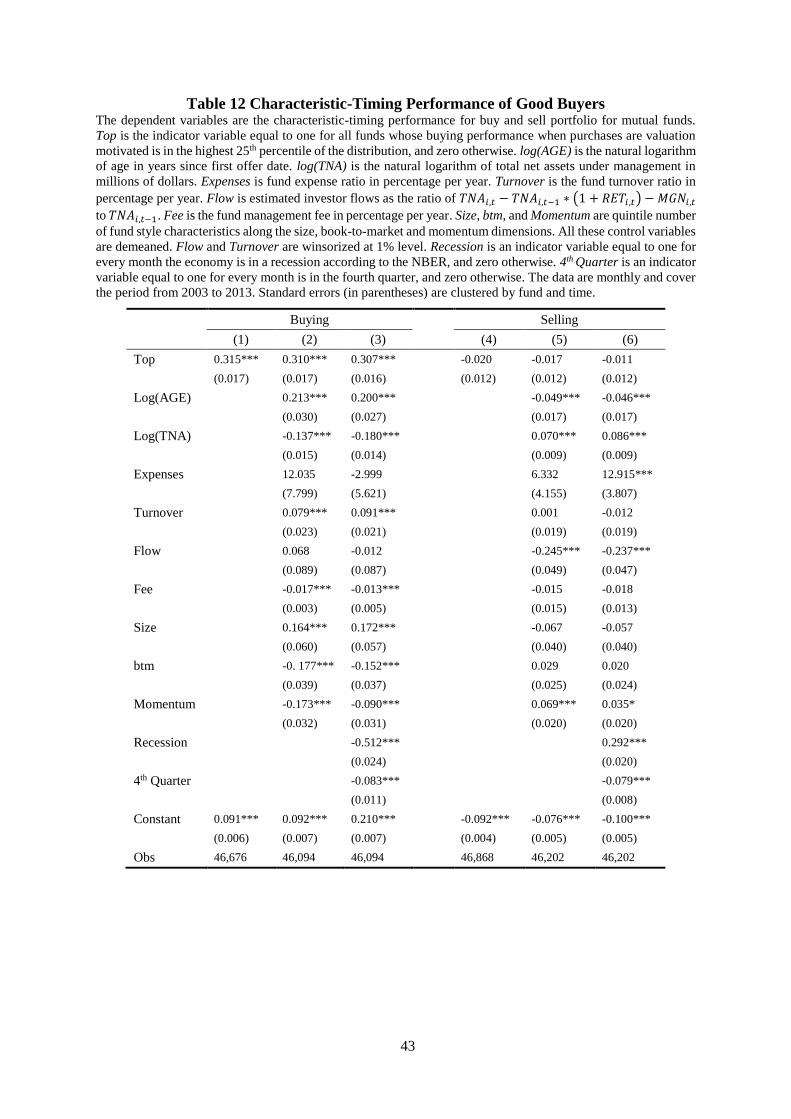
43
Table 12 Characteristic-Timing Performance of Good Buyers The dependent variables are the characteristic-timing performance for buy and sell portfolio for mutual funds.
Top is the indicator variable equal to one for all funds whose buying performance when purchases are valuation
motivated is in the highest 25th percentile of the distribution, and zero otherwise. log(AGE) is the natural logarithm
of age in years since first offer date. log(TNA) is the natural logarithm of total net assets under management in
millions of dollars. Expenses is fund expense ratio in percentage per year. Turnover is the fund turnover ratio in
percentage per year. Flow is estimated investor flows as the ratio of 𝑇𝑁𝐴𝑖,𝑡 − 𝑇𝑁𝐴𝑖,𝑡−1 ∗ (1 + 𝑅𝐸𝑇𝑖,𝑡) − 𝑀𝐺𝑁𝑖,𝑡
to 𝑇𝑁𝐴𝑖,𝑡−1. Fee is the fund management fee in percentage per year. Size, btm, and Momentum are quintile number
of fund style characteristics along the size, book-to-market and momentum dimensions. All these control variables
are demeaned. Flow and Turnover are winsorized at 1% level. Recession is an indicator variable equal to one for
every month the economy is in a recession according to the NBER, and zero otherwise. 4th Quarter is an indicator
variable equal to one for every month is in the fourth quarter, and zero otherwise. The data are monthly and cover
the period from 2003 to 2013. Standard errors (in parentheses) are clustered by fund and time.
Buying Selling
(1) (2) (3) (4) (5) (6)
Top 0.315*** 0.310*** 0.307*** -0.020 -0.017 -0.011
(0.017) (0.017) (0.016) (0.012) (0.012) (0.012)
Log(AGE) 0.213*** 0.200*** -0.049*** -0.046***
(0.030) (0.027) (0.017) (0.017)
Log(TNA) -0.137*** -0.180*** 0.070*** 0.086***
(0.015) (0.014) (0.009) (0.009)
Expenses 12.035 -2.999 6.332 12.915***
(7.799) (5.621) (4.155) (3.807)
Turnover 0.079*** 0.091*** 0.001 -0.012
(0.023) (0.021) (0.019) (0.019)
Flow 0.068 -0.012 -0.245*** -0.237***
(0.089) (0.087) (0.049) (0.047)
Fee -0.017*** -0.013*** -0.015 -0.018
(0.003) (0.005) (0.015) (0.013)
Size 0.164*** 0.172*** -0.067 -0.057
(0.060) (0.057) (0.040) (0.040)
btm -0. 177*** -0.152*** 0.029 0.020
(0.039) (0.037) (0.025) (0.024)
Momentum -0.173*** -0.090*** 0.069*** 0.035*
(0.032) (0.031) (0.020) (0.020)
Recession -0.512*** 0.292***
(0.024) (0.020)
4th Quarter -0.083*** -0.079***
(0.011) (0.008)
Constant 0.091*** 0.092*** 0.210*** -0.092*** -0.076*** -0.100***
(0.006) (0.007) (0.007) (0.004) (0.005) (0.005)
Obs 46,676 46,094 46,094 46,868 46,202 46,202
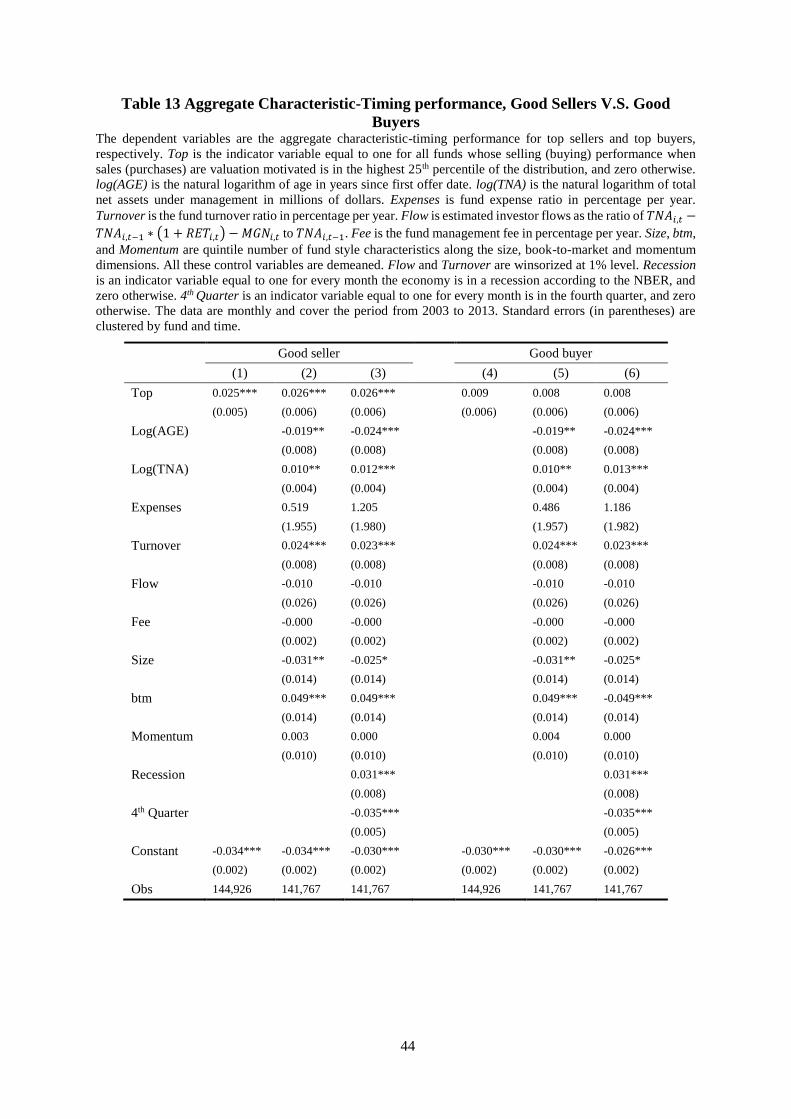
44
Table 13 Aggregate Characteristic-Timing performance, Good Sellers V.S. Good
Buyers The dependent variables are the aggregate characteristic-timing performance for top sellers and top buyers,
respectively. Top is the indicator variable equal to one for all funds whose selling (buying) performance when
sales (purchases) are valuation motivated is in the highest 25th percentile of the distribution, and zero otherwise.
log(AGE) is the natural logarithm of age in years since first offer date. log(TNA) is the natural logarithm of total
net assets under management in millions of dollars. Expenses is fund expense ratio in percentage per year.
Turnover is the fund turnover ratio in percentage per year. Flow is estimated investor flows as the ratio of 𝑇𝑁𝐴𝑖,𝑡 −
𝑇𝑁𝐴𝑖,𝑡−1 ∗ (1 + 𝑅𝐸𝑇𝑖,𝑡) − 𝑀𝐺𝑁𝑖,𝑡 to 𝑇𝑁𝐴𝑖,𝑡−1. Fee is the fund management fee in percentage per year. Size, btm,
and Momentum are quintile number of fund style characteristics along the size, book-to-market and momentum
dimensions. All these control variables are demeaned. Flow and Turnover are winsorized at 1% level. Recession
is an indicator variable equal to one for every month the economy is in a recession according to the NBER, and
zero otherwise. 4th Quarter is an indicator variable equal to one for every month is in the fourth quarter, and zero
otherwise. The data are monthly and cover the period from 2003 to 2013. Standard errors (in parentheses) are
clustered by fund and time.
Good seller Good buyer
(1) (2) (3) (4) (5) (6)
Top 0.025*** 0.026*** 0.026*** 0.009 0.008 0.008
(0.005) (0.006) (0.006) (0.006) (0.006) (0.006)
Log(AGE) -0.019** -0.024*** -0.019** -0.024***
(0.008) (0.008) (0.008) (0.008)
Log(TNA) 0.010** 0.012*** 0.010** 0.013***
(0.004) (0.004) (0.004) (0.004)
Expenses 0.519 1.205 0.486 1.186
(1.955) (1.980) (1.957) (1.982)
Turnover 0.024*** 0.023*** 0.024*** 0.023***
(0.008) (0.008) (0.008) (0.008)
Flow -0.010 -0.010 -0.010 -0.010
(0.026) (0.026) (0.026) (0.026)
Fee -0.000 -0.000 -0.000 -0.000
(0.002) (0.002) (0.002) (0.002)
Size -0.031** -0.025* -0.031** -0.025*
(0.014) (0.014) (0.014) (0.014)
btm 0.049*** 0.049*** 0.049*** -0.049***
(0.014) (0.014) (0.014) (0.014)
Momentum 0.003 0.000 0.004 0.000
(0.010) (0.010) (0.010) (0.010)
Recession 0.031*** 0.031***
(0.008) (0.008)
4th Quarter -0.035*** -0.035***
(0.005) (0.005)
Constant -0.034*** -0.034*** -0.030*** -0.030*** -0.030*** -0.026***
(0.002) (0.002) (0.002) (0.002) (0.002) (0.002)
Obs 144,926 141,767 141,767 144,926 141,767 141,767
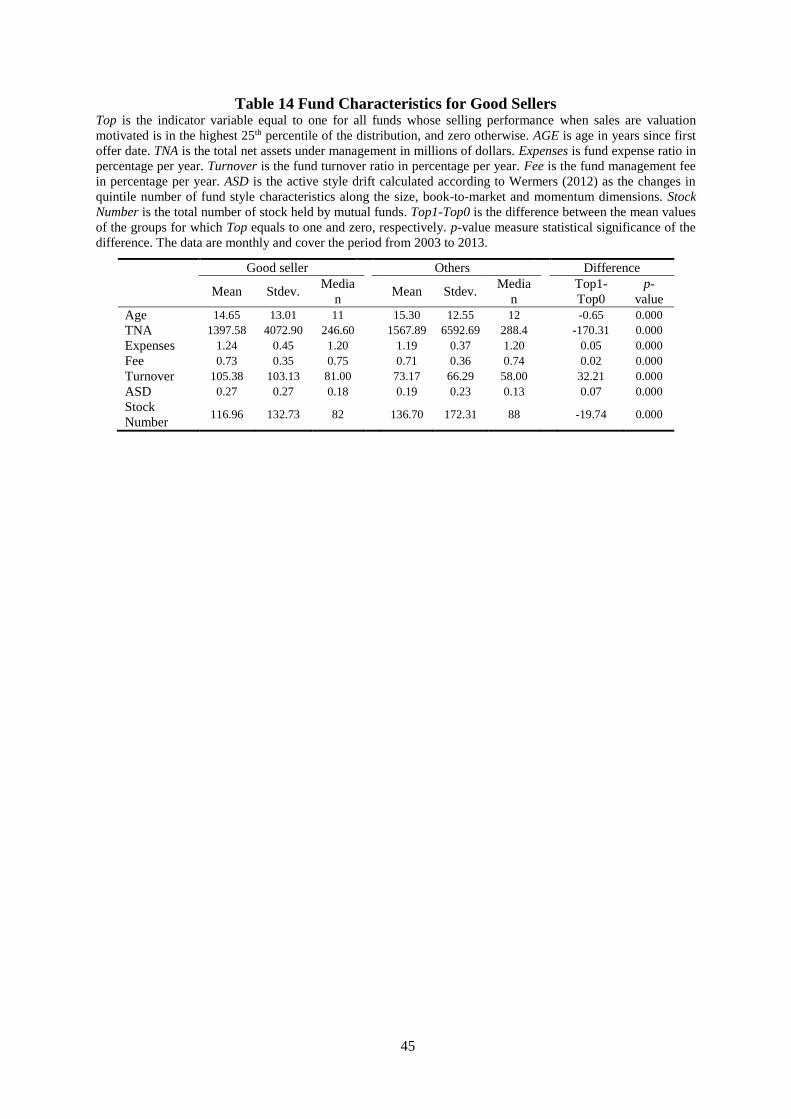
45
Table 14 Fund Characteristics for Good Sellers Top is the indicator variable equal to one for all funds whose selling performance when sales are valuation
motivated is in the highest 25th percentile of the distribution, and zero otherwise. AGE is age in years since first
offer date. TNA is the total net assets under management in millions of dollars. Expenses is fund expense ratio in
percentage per year. Turnover is the fund turnover ratio in percentage per year. Fee is the fund management fee
in percentage per year. ASD is the active style drift calculated according to Wermers (2012) as the changes in
quintile number of fund style characteristics along the size, book-to-market and momentum dimensions. Stock
Number is the total number of stock held by mutual funds. Top1-Top0 is the difference between the mean values
of the groups for which Top equals to one and zero, respectively. p-value measure statistical significance of the
difference. The data are monthly and cover the period from 2003 to 2013.
Good seller Others Difference
Mean Stdev.
Media
n Mean Stdev.
Media
n
Top1-
Top0
p-
value
Age 14.65 13.01 11 15.30 12.55 12 -0.65 0.000
TNA 1397.58 4072.90 246.60 1567.89 6592.69 288.4 -170.31 0.000
Expenses 1.24 0.45 1.20 1.19 0.37 1.20 0.05 0.000
Fee 0.73 0.35 0.75 0.71 0.36 0.74 0.02 0.000
Turnover 105.38 103.13 81.00 73.17 66.29 58.00 32.21 0.000
ASD 0.27 0.27 0.18 0.19 0.23 0.13 0.07 0.000
Stock
Number 116.96 132.73 82 136.70 172.31 88 -19.74 0.000
46
References
Admati, A. R., Bhattacharya, S., Pfleiderer, P., and Ross, S. A. (1986). On timing and selectivity. The
Journal of Finance, 41(3), 715-730.
Alexander, G. J., Cici, G., and Gibson, S. (2007). Does motivation matter when assessing trade
performance? An analysis of mutual funds. Review of Financial Studies, 20(1), 125-150.
Baker, M., Litov, L., Wachter, J. A., and Wurgler, J. (2010). Can mutual fund managers pick stocks?
Evidence from their trades prior to earnings announcements. Journal of Financial and
Quantitative Analysis 45 (5), 1111-1131.
Baks, K. P., Metrick, A., and Wachter, J. (2001). Should investors avoid all actively managed mutual
funds? A study in Bayesian performance evaluation. The Journal of Finance, 56(1), 45-85.
Barber, B., Lehavy, R., McNichols, M., and Trueman, B. (2001). Can investors profit from the
prophets? Security analyst recommendations and stock returns. The Journal of Finance, 56(2),
531-563.
Barber, B. M., and Odean, T. (2000). Trading is hazardous to your wealth: The common stock
investment performance of individual investors. Journal of Finance, 773-806.
Barber, B. M., and Odean, T. (2001). Boys will be boys: Gender, overconfidence, and common stock
investment. Quarterly journal of Economics, 261-292.
Barber, B. M., and Odean, T. (2002). Online investors: do the slow die first? Review of Financial
Studies, 15(2), 455-488.
Barber, B. M., Odean, T., and Zheng, L. (2005). Out of sight, out of mind: The effects of expenses on
mutual fund flows. Journal of Business, 78, 2095-2119
Barber, B. M., and Odean, T. (2008). All that glitters: The effect of attention and news on the buying
behavior of individual and institutional investors. Review of Financial Studies, 21(2), 785-
818.
Barber, B. M., Huang, X., and Odean, T. (2015). Which Risk Factors Matter To Investors? Evidence
From Mutual Fund Flows. Working Paper.
Barber, B., Lehavy, R., McNichols, M., and Trueman, B. (2001). Can investors profit from the
prophets? Security analyst recommendations and stock returns. The Journal of Finance, 56(2),
531-563.
Barberis, N., Huang, M., and Santos, T. (2001). Prospect theory and asset prices. Quarterly Journal of
Economics, 116(1).
47
Barberis, N., and Thaler, R. (2003). A survey of behavioral finance. Handbook of the Economics of
Finance, 1, 1053-1128.
Barras, L., Scaillet, O., and Wermers, R. (2010). False discoveries in mutual fund performance:
Measuring luck in estimated alphas. The Journal of Finance, 65(1), 179-216.
Bär, M., Kempf, A., and Ruenzi, S. (2011). Is a team different from the sum of its parts? Evidence
from mutual fund managers. Review of Finance, 15(2), 359-396.
Becker, C., Ferson, W., Myers, D. H., and Schill, M. J. (1999). Conditional market timing with
benchmark investors. Journal of Financial Economics, 52(1), 119-148.
Benos, E., Jochec, M., and Nyekel, V. (2010). Can mutual funds time risk factors? The Quarterly
Review of Economics and Finance, 50(4), 509-514.
Berk, J. B., and Green, R. C. (2004). Mutual fund flows and performance in rational markets. Journal
of Political Economy, 112(6), 1269-1295.
Berk, J. B., and Van Binsbergen, J. H. (2012). Measuring managerial skill in the mutual fund industry
(No. w18184). National Bureau of Economic Research.
Bernile, G., Kumar, A., Sulaeman, J., and Wang, Q. (2014). Are Institutional Investors Truly Skilled
or Merely Opportunistic? Available at SSRN 2291690.
Bion, W. R. (1970). Attention and Interpretation: a Scientific Approach to Insights in Psychoanalysis
and Groups. London: Tavistock.
Blake, D., and Timmermann, A. (1998). Mutual fund performance: evidence from the UK. European
Finance Review, 2(1), 57-77.
Blake, D., Lehmann, B. N., and Timmermann, A. (1999). Performance Measurement Using Multi-
Asset Portfolio Data: A Study of UK Pension Funds 1986-94. Pensions Institute, London.
Bloomfield, R., Libby, R., and Nelson, M. W. (2000). Underreactions, overreactions and moderated
confidence. Journal of Financial Markets, 3(2), 113-137.
Bloomfield, R., Libby, R., and Nelson, M. W. (1999). Confidence and the welfare of less-informed
investors. Accounting, Organizations and Society, 24(8), 623-647.
Bollen, N. P. (2007). Mutual fund attributes and investor behavior. Journal of Financial and
Quantitative Analysis, 42(03), 683-708.
Bollen, N. P., and Busse, J. A. (2001). On the timing ability of mutual fund managers. The Journal of
Finance, 56(3), 1075-1094.
48
Bollen, N. P., and Busse, J. A. (2005). Short-term persistence in mutual fund performance. Review of
Financial Studies, 18(2), 569-597.
Brennan, M. J., Jegadeesh, N., and Swaminathan, B. (1993). Investment analysis and the adjustment
of stock prices to common information. Review of Financial Studies, 6(4), 799-824.
Brown, S. J., and Goetzmann, W. N. (1995). Performance persistence. Journal of finance, 679-698.
Brown, K. C., and Harlow, W. V. (2002). Staying the Course: The Impact of Investment Style
Consistency on Mutual Fund Performance. Available at SSRN 306999.
Busse, J. A., Green, T. C., and Jegadeesh, N. (2012). Buy-side trades and sell-side recommendations:
Interactions and information content. Journal of Financial Markets, 15(2), 207-232.
Cabot Research. (2007). Calibrating Selling – A rich source of additional alpha. Behavioral Matters:
Insights From the Application of Behavioral Finance, Issue 1.
Carhart, M. M. (1997). On persistence in mutual fund performance. The Journal of finance, 52(1), 57-
82.
Chan, L. K., Jegadeesh, N., and Lakonishok, J. (1996). Momentum strategies. The Journal of Finance,
51(5), 1681-1713.
Chang, E. C., and Lewellen, W. G. (1984). Market timing and mutual fund investment performance.
Journal of Business, 57-72.
Chen, J., Hong, H., Huang, M., and Kubik, J. (2004). Does fund size erode mutual fund
performance.the role of liquidity and organization. American Economic Review, 94(5).
Chen, H. L., and Pennacchi, G. G. (2009). Does prior performance affect a mutual fund’s choice of
risk? Theory and further empirical evidence. Journal of Financial and Quantitative Analysis,
44(04), 745-775.
Chen, H. L., Jegadeesh, N., and Wermers, R. (2000). The value of active mutual fund management:
An examination of the stockholdings and trades of fund managers. Journal of Financial and
quantitative Analysis, 35(03), 343-368.
Chen, L. W., Adams, A., and Taffler, R. (2013). What style-timing skills do mutual fund “stars”
possess? Journal of Empirical Finance, 21, 156-173.
Chevalier, J., and Ellison, G. (1997). Risk taking by mutual funds as a response to incentives. The
Journal of Political Economy, 105(6), 1167-1200.
Chevalier, J., and Ellison, G. (1999). Career concerns of mutual fund managers. Quarterly Journal of
Economics, 389-432.
49
Choi, D., and Lou, D. (2010). A test of the self-serving attribution bias: evidence from mutual funds.
In Fourth Singapore International Conference on Finance.
Chordia, T. (1996). The structure of mutual fund charges. Journal of financial Economics, 41(1), 3-
39.
Christoffersen, S. E., and Sarkissian, S. (2011). The demographics of fund turnover. Journal of
Financial Intermediation, 20(3), 414-440.
Cohen, L., Frazzini, A., and Malloy, C. (2007). The Small World of Investing: Board Connections
and Mutual Fund Returns. NBER Working Paper, (w13121).
Cohen, R. B., Polk, C., and Silli, B. (2011). Best Ideas. Working Paper, London School of
Economics. Available at SSRN 1364827.
Cooper, D. J., and Kagel, J. H. (2005). Are two heads better than one? Team versus individual play in
signaling games. American Economic Review, 477-509.
Coval, J. D., and Moskowitz, T. J. (2001). The geography of investment: informed trading and asset
prices. Journal of Political Economy, 109(4), 811-841.
Coval, J. D., and Shumway, T. (2005). Do behavioral biases affect prices?. The Journal of Finance,
60(1), 1-34.
Coval, J., and Stafford, E. (2007). Asset fire sales (and purchases) in equity markets. Journal of
Financial Economics, 86(2), 479-512.
Cremers, K. M., and Petajisto, A. (2009). How active is your fund manager? A new measure that
predicts performance. Review of Financial Studies, 22(9), 3329-3365.
Cuthbertson, K., Nitzsche, D., and O'Sullivan, N. (2008). UK mutual fund performance: Skill or
luck?.Journal of Empirical Finance, 15(4), 613-634.
Daniel, K., Grinblatt, M., Titman, S., and Wermers, R. (1997). Measuring mutual fund performance
with characteristic-based benchmarks. Journal of Finance 52, 1035-1058.
Daniel, K., Hirshleifer, D., and Subrahmanyam, A. (1998). Investor psychology and security market
under-and overreactions. The Journal of Finance, 53(6), 1839-1885.
Daniel, K. D., Hirshleifer, D., and Subrahmanyam, A. (2001). Overconfidence, arbitrage, and
equilibrium asset pricing. Journal of Finance, 921-965.
Daniel, K., and Titman, S. (1997). Evidence on the characteristics of cross sectional variation in stock
returns. The Journal of Finance, 52(1), 1-33.
50
Dybvig, P. H., and Ross, S. A. (1985). Differential information and performance measurement using a
security market line. The Journal of finance, 40(2), 383-399.
Edelen, R., and Warner, J. (1998). The High Frequency Relation Between Aggregate Mutual Fund
Flows and Market Returns. Working Paper, University of Pensylvannia.
Edelen, R. M. (1999). Investor flows and the assessed performance of open-end mutual funds. Journal
of Financial Economics, 53(3), 439-466.
Elton, E. J., Gruber, M. J., Das, S., and Hlavka, M. (1993). Efficiency with costly information: A
reinterpretation of evidence from managed portfolios. Review of Financial studies, 6(1), 1-22.
Elton, E. J., Gruber, M. J., and Blake, C. R. (1996). Survivor bias and mutual fund performance.
Review of Financial Studies, 9(4), 1097-1120.
Elton, E. J., Gruber, M. J., and Blake, C. R. (1996). The persistence of risk-adjusted mutual fund
performance. The Journal of Business, 69(2), 133-57.
Elton, E. J., Gruber, M. J., Brown, S. J., and Goetzmann, W. N. (2009). Modern portfolio theory and
investment analysis. John Wiley & Sons.
Elton, E. J., Gruber, M. J., Blake, C. R., Krasny, Y., and Ozelge, S. (2010). The effect of the
frequency of holding data on conclusions about mutual fund management behavior. Journal
of Banking and Finance, 34, 903-1108.
Elton, E. J., Gruber, M. J., and Blake, C. R. (2012). An examination of mutual fund timing ability
using monthly holdings data. Review of Finance, 16(3), 619-645.
Eshraghi, A., and Taffler, R. (2012). Fund Manager Overconfidence And Investment Performance:
Evidence From Mutual Funds. Available at SSRN 2146864.
Eshraghi, A., and Taffler, R. (2014). Heroes and Victims: Fund Manager Sense-making, Self-
legitimation and Storytelling. Unpublished working paper, Warwick Business School.
Evans, R. B. (2010). Mutual fund incubation. The Journal of Finance, 65(4), 1581-1611.
Fama, E. F., and MacBeth, J. D. (1973). Risk, return, and equilibrium: Empirical tests. The Journal of
Political Economy, 607-636.
Fama, E. F., and French, K. R. (1992). The cross-section of expected stock returns. The Journal of
Finance, 47(2), 427-465.
Fama, E. F., and French, K. R. (1993). Common risk factors in the returns on stocks and bonds.
Journal of financial economics, 33(1), 3-56.
51
Fama, E. F., and French, K. R. (1996). Multifactor explanations of asset pricing anomalies. The
Journal of Finance, 51(1), 55-84.
Fama, E. F., and French, K. R. (2010). Luck versus skill in the cross-section of mutual fund returns.
The Journal of Finance, 65(5), 1915-1947.
Faugere, C., Shawky, H. A., and Smith, D. M. (2004). Sell discipline and institutional money
management. The Journal of Portfolio Management, 30(3), 95-105.
Ferson, W., and Khang, K. (2002). Conditional performance measurement using portfolio weights:
Evidence for pension funds. Journal of Financial Economics, 65(2), 249-282.
Ferson, W. E., and Schadt, R. W. (1996). Measuring fund strategy and performance in changing
economic conditions. Journal of Finance, 425-461.
Ferson, W. E., and Warther, V. A. (1996). Evaluating fund performance in a dynamic market.
Financial Analysts Journal, 52(6), 20-28.
Fidelity Investment (2014) Active Share: A Misunderstood Measure In Manager Selection.
Leadership series.
Fischhoff, B., Slovic, P., and Lichtenstein, S. (1977). Knowing with certainty: The appropriateness of
extreme confidence. Journal of Experimental Psychology: Human perception and
performance, 3(4), 552.
Frank, J. D. (1935). Some psychological determinants of the level of aspiration. The American
Journal of Psychology, 285-293.
Frazzini, A., and Lamont, O. (2006). The Earnings Announcement Premium and Trading Volume.
NBER working paper, 13090.
Frazzini, A., and Lamont, O. (2008). Dumb money: Mutual fund flows and the cross-section of stock
returns. Journal of Financial Economics, 88(2), 299-322.
French, K. R. (2008). Presidential address: The cost of active investing. The Journal of Finance,
63(4), 1537-1573.
Friend, I., Blume, M., and Crockett, J. (1970). Mutual funds and other institutional investors: a new
perspective. McGraw-Hill Companies.
Gallaher, S. T., Kaniel, R., and Starks, L. T. (2015). Advertising And Mutual Funds: From Families
to Individual Funds. Working Paper
52
Gallaher, S., Kaniel, R., and Starks, L. (2008). Determinants of Mutual Fund Family Flows.
University of South New Hampshire, Duke University and University of Texas at Austin
working paper.
Genesove, D., and Mayer, C. (2001). ). Loss aversion and seller behavior: Evidence from the housing
market. Quarterly Journal of Economics, 116(4), 1233-1260.
Gervais, S., and Odean, T. (2001). Learning to be overconfident. Review of Financial studies, 14(1),
1-27.
Gervais, S., Heaton, J. B., and Odean, T. (2011). Overconfidence, compensation contracts, and capital
budgeting. The Journal of Finance, 66(5), 1735-1777.
Glaser, M., Langer, T., and Weber, M. (2010). Overconfidence of Professionals and Lay Men:
Individual Differences Within and Between Tasks? Working Paper
Glushkov and Moussawi (2010). A Note On Screening For Domestic Equity Mutual Funds. Wharton
Research Data Services (WRDS), Wharton of University of Pennsylvania.
Goetzmann, W. N., and Kumar, A. (2008). Equity portfolio diversification. Review of Finance, 12(3),
433-463.
Goetzmann, W. N., Ingersoll, J., and Ivković, Z. (2000). Monthly measurement of daily timers.
Journal of Financial and Quantitative Analysis, 35(03), 257-290.
Griffin, D., and Tversky, A. (1992). The weighing of evidence and the determinants of confidence.
Cognitive Psychology, 24(3), 411-435.
Grinblatt, M., and Han, B. (2005). Prospect theory, mental accounting, and momentum. Journal of
financial economics, 78(2), 311-339
Grinblatt, M., and Keloharju, M. (2009). Sensation seeking, overconfidence, and trading activity. The
Journal of Finance, 64(2), 549-578.
Grinblatt, M., and Titman, S. (1988). The evaluation of mutual fund performance: An analysis of
monthly returns. John E. Anderson Graduate School of Management, University of
California.
Grinblatt, M., and Titman, S. (1989). Mutual fund performance: An analysis of quarterly portfolio
holdings. Journal of business, 393-416.
Grinblatt, M., and Titman, S. (1992). The persistence of mutual fund performance. The Journal of
Finance, 47(5), 1977-1984.
53
Grinblatt, M., Titman, S., and Wermers, R. (1995). Momentum investment strategies, portfolio
performance, and herding: A study of mutual fund behavior. The American economic review,
1088-1105.
Grossman, S. (1976). On the efficiency of competitive stock markets where trades have diverse
information. The Journal of finance, 31(2), 573-585.
Grossman, S. J., and Stiglitz, J. E. (1980). On the impossibility of informationally efficient markets.
The American economic review, 393-408.
Gruber, M. J. (1996). Another puzzle: The growth in actively managed mutual funds. The journal of
finance, 51(3), 783-810.
Hastorf, A. H., Schneider, D. J., and Polefka, J. (1970). Person perception. Reading, MA: Addison-
Wesley.
Hellwig, M. F. (1980). On the aggregation of information in competitive markets. Journal of
economic theory, 22(3), 477-498.
Hendricks, D., Patel, J., and Zeckhauser, R. (1993). Hot hands in mutual funds: Short-run persistence
of relative performance, 1974-1988. Journal of finance, 93-130.
Henriksson, R. D., and Merton, R. C. (1981). On market timing and investment performance. II.
Statistical procedures for evaluating forecasting skills. Journal of business, 513-533.
Henriksson, R. D. (1984). Market timing and mutual fund performance: An empirical investigation.
Journal of business, 73-96.
Hirshleifer, D. (2001). Investor psychology and asset pricing. Journal of finance, 1533-1597.
Hogg, M. A., Turner, J. C., and Davidson, B. (1990). Polarized norms and social frames of reference:
A test of the self-categorization theory of group polarization. Basic and Applied Social
Psychology, 11(1), 77-100.
Hsieh, J., and Walkling, R. A. (2006). The history and performance of concept stocks. Journal of
Banking and Finance, 30(9), 2433-2469.
Huang, J., Sialm, C., and Zhang, H. (2011). Risk shifting and mutual fund performance. Review of
Financial Studies, 24, 2576-2616.
Ippolito, R. A. (1992). Consumer reaction to measures of poor quality: Evidence from the mutual
fund industry. Journal of law and Economics, 45-70.
Jagannathan, R., and Korajczyk, R. A. (1986). Assessing the market timing performance of managed
portfolios. Journal of Business, 59(2), 217-235.
54
Jain, P. C., and Wu, J. S. (2000). Truth in mutual fund advertising: Evidence on future performance
and fund flows. The journal of finance, 55(2), 937-958.
Jegadeesh, N., Kim, J., Krische, S. D., and Lee, C. (2004). Analyzing the analysts: When do
recommendations add value?. The journal of finance, 59(3), 1083-1124.
Jegadeesh, N., and Titman, S. (1993). Returns to buying winners and selling losers: Implications for
stock market efficiency. The Journal of finance, 48(1), 65-91.
Jensen, M. C. (1968). The performance of mutual funds in the period 1945–1964. The Journal of
finance, 23(2), 389-416.
Jensen, M. C. (1986). Agency cost of free cash flow, corporate finance, and takeovers. Corporate
Finance, and Takeovers. American Economic Review, 76(2).
Jiang, W. (2003). A nonparametric test of market timing. Journal of Empirical Finance, 10(4), 399-
425.
Jiang, G. J., Yao, T., and Yu, T. (2007). Do mutual funds time the market? Evidence from portfolio
holdings. Journal of Financial Economics, 86(3), 724-758.
Jiang, H., Verbeek, M., and Wang, Y. (2014). Information content when mutual funds deviate from
benchmarks. Management Science, 60(8), 2038-2053.
Josephs, R. A., Larrick, R. P., Steele, C. M., and Nisbett, R. E. (1992). Protecting the self from the
negative consequences of risky decisions. Journal of Personality and Social Psychology,
62(1), 26.
Kacperczyk, M., and Seru, A. (2007). Fund manager use of public information: New evidence on
managerial skills. The Journal of Finance, 62(2), 485-528.
Kacperczyk, M., Sialm, C., and Zheng, L. (2005). On the industry concentration of actively managed
equity mutual funds. The Journal of Finance, 60(4), 1983-2011.
Kacperczyk, M., Sialm, C., and Zheng, L. (2008). Unobserved actions of mutual funds. Review of
Financial Studies, 21(6), 2379-2416.
Kacperczyk, M., Van Nieuwerburgh, S., and Veldkamp, L. (2011). Rational attention allocation over
the business cycle. Unpublished working paper. New York University.
Kacperczyk, M., Nieuwerburgh, S. V., and Veldkamp, L. (2014). Time-Varying Fund Manager Skill.
The Journal of Finance, 69(4), 1455-1484.
Kahneman, D., and Tversky, A. (1979). Prospect theory: An analysis of decision under
risk.Econometrica: Journal of the Econometric Society, 263-291.
55
Kahneman, D. (1973). Attention and effort (p. 246). Englewood Cliffs, NJ: Prentice-Hall.
Kahneman, D., Knetsch, J. L., and Thaler, R. H. (1991). Anomalies: The endowment effect, loss
aversion, and status quo bias. The journal of economic perspectives, 193-206.
Kane, A., Santini, D., and Aber, J. (1991). Lessons from the Growth History of Mutual Funds.
Unpublished workingpaper, Boston University.
Kaniel, R., Starks, L. T., and Vasudevan, V. (2007). Headlines and bottom lines: attention and
learning effects from media coverage of mutual funds. Available at SSRN 687103.
Kaplan, S. N., and Sensoy, B. A. (2008). Do mutual funds time their benchmarks? NBER Working
paper.
Kempf, A., Ruenzi, S., and Thiele, T. (2009). Employment risk, compensation incentives, and
managerial risk taking: Evidence from the mutual fund industry. Journal of Financial
Economics, 92(1), 92-108.
Kerr, N. L. (1992). Group decision making at a multialternative task: Extremity, interfaction distance,
pluralities, and issue importance. Organizational Behavior and Human Decision Processes,
52(1), 64-95.
Kim, S. T., Lin, J. C., and Slovin, M. B. (1997). Market structure, informed trading, and analysts'
recommendations. Journal of Financial and Quantitative Analysis, 32(04), 507-524.
Klein, M. (1957). Envy and Gratitude, Psyche, 11(5), 241-255.
Knez, P., Smith, V. L., and Williams, A. W. (1985). Individual rationality, market rationality, and
value estimation. The American Economic Review, 397-402.
Kocher, M. G., and Sutter, M. (2005). The Decision Maker Matters: Individual Versus Group
Behavior in Experimental Beauty‐Contest Games. The Economic Journal, 115(500), 200-
223.
Kosowski, R., Timmermann, A., Wermers, R., and White, H. (2006). Can mutual fund “stars” really
pick stocks? New evidence from a bootstrap analysis. The Journal of finance, 61(6), 2551-
2595.
Kothari, S. P., and Warner, J. B. (2001). Evaluating mutual fund performance. The Journal of
Finance, 56(5), 1985-2010.
Kumar, A., Niessen-Ruenzi, A., and Spalt, O. G. (2015). What's in a Name? Mutual Fund Flows
When Managers Have Foreign-Sounding Names. Review of Financial Studies, forthcoming.
56
Lakonishok, J., Shleifer, A., Vishny, R. W., Hart, O., and Perry, G. L. (1992). The structure and
performance of the money management industry. Brookings Papers on Economic Activity.
Microeconomics, 339-391.
Lehmann, B. N., and Modest, D. M. (1987). Mutual fund performance evaluation: A comparison of
benchmarks and benchmark comparisons. The journal of finance, 42(2), 233-265.
Lou, D. (2012). A flow-based explanation for return predictability. Review of financial studies,
25(12), 3457-3489.
Lundeberg, M. A., Fox, P. W., Brown, A. C., and Elbedour, S. (2000). Cultural influences on
confidence: Country and gender. Journal of Educational Psychology, 92(1), 152.
Lundeberg, M. A., Fox, P. W., and Punćcohaŕ, J. (1994). Highly confident but wrong: Gender
differences and similarities in confidence judgments. Journal of educational psychology,
86(1), 114.
Malkiel, B. G. (1995). Returns from investing in equity mutual funds 1971 to 1991. The Journal of
finance, 50(2), 549-572.
Malmendier, U., and Tate, G. (2005). CEO overconfidence and corporate investment. The journal of
finance, 60(6), 2661-2700.
Malmendier, U., and Tate, G. (2008). Who makes acquisitions? CEO overconfidence and the market's
reaction. Journal of financial Economics, 89(1), 20-43.
Malmendier, U., Tate, G., and Yan, J. (2011). Overconfidence and early‐life experiences: the effect
of managerial traits on corporate financial policies. The Journal of finance, 66(5), 1687-1733.
Massa, M., Reuter, J., and Zitzewitz, E. (2010). When should firms share credit with employees?
Evidence from anonymously managed mutual funds. Journal of Financial Economics, 95(3),
400-424.
Merton, R. C. (1981). On market timing and investment performance. I. An equilibrium theory of
value for market forecasts. Journal of business, 363-406.
Miller, D. T., and Ross, M. (1975). Self-serving biases in the attribution of causality: Fact or fiction?.
Psychological bulletin, 82(2), 213.
Moscovici, S., and Zavalloni, M. (1969). The group as a polarizer of attitudes. Journal of personality
and social psychology, 12(2), 125.
Nanda, V., Narayanan, M. P., and Warther, V. A. (2000). Liquidity, investment ability, and mutual
fund structure. Journal of Financial Economics, 57(3), 417-443.
57
Niessen-Ruenzi, A., and Ruenzi, S. (2013). Sex Matters: Gender and Prejudice in the Mutual Fund
Industry. Available at SSRN 1957317.
Nikolic, B and Yan, X (2014) Investor Overconfidence, Misvaluation, and Corporate Decisions.
Working paper
Norris, J. (2002). How to Take Your Emotions Out of the Sell Decision. American Association of
Individual Investors Journal, 24, 15-18
Odean, T. (1998). Are investors reluctant to realize their losses? Journal of Finance 53(5), 1775-1798.
Odean, T. (1999). Do Investors Trade Too Much. American Economic Review 89(5), 1279-1298.
O’Connell, P. G., and Teo, M. (2009). Institutional investors, past performance, and dynamic loss
aversion. Journal of Financial and Quantitative Analysis, 44(01), 155-188.
Pástor, Ľ., and Stambaugh, R. F. (2002). Mutual fund performance and seemingly unrelated assets.
Journal of Financial Economics, 63(3), 315-349.
Petajisto, A. (2013). Active share and mutual fund performance. Financial Analysts Journal, 69(4),
73-93.
Plous, S. (1993). The psychology of judgment and decision making. Mcgraw-Hill Book Company.
Pomorski, L. (2009). Acting on the Most Valuable Information: 'Best Idea' Trades of Mutual Fund
Managers. Available at SSRN 1108186.
Prince, M. (1993). Women, men and money styles. Journal of economic Psychology, 14(1), 175-182.
Prather, L. J., and Middleton, K. L. (2002). Are N+ 1 heads better than one? The case of mutual fund
managers. Journal of Economic Behavior and Organization, 47(1), 103-120.
Prather, L. J., and Middleton, K. L. (2006). Timing and selectivity of mutual fund managers: An
empirical test of the behavioral decision-making theory. Journal of Empirical Finance, 13(3),
249-273.
Puckett, A., and Yan, X. S. (2011). The interim trading skills of institutional investors. The Journal of
Finance, 66(2), 601-633.
Puetz, A., and Ruenzi, S. (2011). Overconfidence among professional investors: Evidence from
mutual fund managers. Journal of Business Finance and Accounting, 38(5‐6), 684-712.
Puncochar, J. M., and Fox, P. W. (2004). Confidence in individual and group decision making:
When" two heads" are worse than one. Journal of Educational Psychology, 96(3), 582.
58
Ritov, I. (1996). Probability of regret: Anticipation of uncertainty resolution in choice. Organizational
Behavior and Human Decision Processes, 66(2), 228-236.
Ross, S. A., Westerfield, R. W., and Jaffe, J. (2002). Corporate finance. 6th edition McGraw-Hill
Irwin, New York.
Sah, R. K. and Stiglitz, J. (1986) The architecture of economic systems: Hierarchies and polyarchies.
American Economic Review 76, 716–727.
Sah, R. K. and Stiglitz, J. (1988) Committees, hierarchies and polyarchies, The Economic Journal 98,
451–470.
Sah, R. K., and Stiglitz, J. (1991). The quality of managers in centralized versus decentralized
organizations. The Quarterly Journal of Economics, 289-295.
Sapp, T., and Tiwari, A. (2004). Does stock return momentum explain the “smart money” effect?.
The Journal of Finance, 59(6), 2605-2622.
Sharpe, W. F. (1991). The arithmetic of active management. Financial Analysts Journal, 47(1), 7-9.
Shefrin, H., and Statman, M. (1985). The disposition to sell winners too early and ride losers too
long: Theory and evidence. Journal of Finance, 777-790.
Shefrin, H. (2010). Behavioralizing Finance. Foundations and Trends (R) in Finance, 4(1–2), 1-184.
Shumway, T., Szefler, M., and Yuan, K. (2009). The Information Content of Revealed Beliefs in
Portfolio Holdings. Working paper.
Simon, H. A. (1957). Models of man; social and rational. New York: Wiley andSons.
Simutin, M. (2014). Cash Holdings and Mutual Fund Performance. Review of Finance, 18(4), 1425-
1464.
Sirri, E. R., and Tufano, P. (1998). Costly search and mutual fund flows. Journal of finance, 1589-
1622.
Smith, K. V. (1978). Is fund growth related to fund performance?. The Journal of Portfolio
Management, 4(3), 49-54.
Spitz, A. E. (1970). Mutual fund performance and cash inflows. Applied Economics, 2(2), 141-145.
Stulz, R. (1990). Managerial discretion and optimal financing policies. Journal of financial
Economics, 26(1), 3-27.
Taffler, R., and Tuckett, D. (2007). Emotional finance: understanding what drives investors.
Professional Investor, Autumn, 18-20.

59
Taffler, R. J., and D. A. Tuckett, 2010, Emotional finance: The role of the unconscious in financial
decisions, in K. Baker and J. Nofsinger, eds.: Behavioral Finance (Hoboken, NJ: John Wiley
& Sons Inc).
Teo, M., and Woo, S. J. (2001). Persistence in Style-Adjusted Mutual Fund Returns. Available at
SSRN 291372.
Thaler, R. (1985). Mental accounting and consumer choice. Marketing science, 4(3), 199-214.
Thomas, A., and Tonks, I. (2001). Equity performance of segregated pension funds in the UK. Journal
of Asset Management, 1(4), 321-343.
Treynor, J., and Mazuy, K. (1966). Can mutual funds outguess the market. Harvard business review,
44(4), 131-136.
Tuckett, D., and Taffler, R. J. (2012). Fund management: An emotional finance perspective. CFA
Research Foundation Monograph.
Tversky, A., and Kahneman, D. (1974). Judgment under uncertainty: Heuristics and biases.
science,185(4157), 1124-1131.
Tversky, A., and Kahneman, D. (1992). Advances in prospect theory: Cumulative representation of
uncertainty. Journal of Risk and uncertainty, 5(4), 297-323.
Verrecchia, R. E. (1982). Information acquisition in a noisy rational expectations economy.
Econometrica: Journal of the Econometric Society, 1415-1430.
Warther, V. A. (1995). Aggregate mutual fund flows and security returns. Journal of financial
economics, 39(2), 209-235.
Weber, M., and Camerer, C. F. (1998). The disposition effect in securities trading: An experimental
analysis. Journal of Economic Behavior and Organization, 33(2), 167-184.
Wermers, R. (2000). Mutual fund performance: An empirical decomposition into stock-picking talent,
style, transactions costs, and expenses. The Journal of Finance, 55(4), 1655-1703.
Wermers, R. (2003). Is Money Really'smart'? New Evidence on the Relation Between Mutual Fund
Flows, Manager Behavior, and Performance Persistence. Working paper.
Wermers, R. (2012). Matter of Style: The Causes And Consequences of Style Drift In Institutional
Portfolios. Available at SSRN 2024259.
Womack, K. L. (1996). Do brokerage analysts' recommendations have investment value? Journal of
finance, 137-167.

60
Zhang, H. (2010). Asset fire sales, liquidity provision, and mutual fund performance. Liquidity
Provision, and Mutual Fund Performance (January 30, 2010).
Zheng, J. X. (1999). Testing Heteroskedasticity in Nonlinear and Nonparametric Regressions with an
Application to Interest Rate Volatility. Working paper, University of Texas at Austin.
61
Appendix A
The screening procedure for U.S. domestic equity mutual funds builds on Kacperczyk et al (2008). I
start with a sample of all mutual funds in the CRSP Mutual Fund Database and eliminate funds with
the Investment Objective Codes (IOC) of International funds (IOC=1), Municipal Bonds funds
(IOC=5), Bond and Preferred funds (IOC=6) and Balanced funds (IOC=7). Then, I exclude funds with
CRSP policy codes for Canadian and international (C&I), Balanced (Bal), Bonds (Bonds), Preferred
stocks (Pfd), Bonds and preferred stocks (B&P), Government securities (GS), Money market fund
(MM), and Tax-free money market fund (TFM). After these two screening steps, I select funds with
Lipper Class codes of, if available, “EIEI”, “G”, “LCCE”, “LCGE”, “LCVE”, “MCCE”, “MCGE”,
“MCVE”, “MLCE”, “MLGE”, “MLVE”, “SCCE”, “SCGE”, and “SCVE” or with Lipper Objective
codes of, if available, “CA”, “EI”, “G”, “GI”, “MC”, “MR”, and “SG”. If neither Lipper Class codes
nor Lipper Objective codes are available, I include funds with Strategic Insight Objective Code
(si_obj_cd) of “AGG”, “GMC”, “GRI”, “GRO”, “ING”, and “SCG”. If Strategic Insight Objective
codes are missing, then funds with Wiesenberger Fund Type codes of “G”, “G-I”, “AGG”, “GCI”,
“GRI”, “GRO”, “LTG”, “MCG”, and “SCG” are included. If none of the above objective codes are
available, funds with a CS policy are included. If CS policy is not available, I exclude funds with
average stock holdings less than 80% or more than 105% and fund that hold less than 10 stocks and that
managed asset less than $5 million in previous month. In addition, I search for keywords in the fund
full name and eliminate funds with keywords of “index”, “idx”, “S&P”, “DFA”, “program”, “ETF”,
“exchange traded”, “exchange-traded”, “target”, and target date funds. Following Alexander et al
(2007), funds with less than four holdings reports that were each preceded by another report in the
previous quarter are excluded from my final sample.
Related Documents