Function–Structure Connectivity in Patients with Severe Brain Injury as Measured by MRI-DWI and FDG-PET J. Annen, 1,2,3,† L. Heine, 1,2,3,† E. Ziegler, 1 G. Frasso, 4 M. Bahri, 1 C. Di Perri, 1,2 J. Stender, 5 C. Martial, 1,2,3 S. Wannez, 1,2,3 K. D’ostilio, 6 E. Amico, 1,2 G. Antonopoulos, 1,2 C. Bernard, 3 F. Tshibanda, 3 R. Hustinx, 3 and S. Laureys 1,2,3 * 1 Cyclotron Research Centre, University of Lie `ge, Lie `ge, Belgium 2 Coma Science Group, GIGA Consciousness, University of Lie `ge, Lie `ge, Belgium 3 University Hospital of Lie `ge, Lie `ge, Belgium 4 Faculty of Social Sciences, Quantitative Methods for Social Sciences, University of Lie `ge, Lie `ge, Belgium 5 University of Copenhagen, Copenhagen, Denmark 6 Headache Research Unit, University of Lie `ge, Lie `ge, Belgium r r Abstract: A vast body of literature exists showing functional and structural dysfunction within the brains of patients with disorders of consciousness. However, the function (fluorodeoxyglucose FDG- PET metabolism)–structure (MRI-diffusion-weighted images; DWI) relationship and how it is affected in severely brain injured patients remains ill-defined. FDG-PET and MRI-DWI in 25 severely brain injured patients (19 Disorders of Consciousness of which 7 unresponsive wakefulness syndrome, 12 minimally conscious; 6 emergence from minimally conscious state) and 25 healthy control subjects were acquired here. Default mode network (DMN) function–structure connectivity was assessed by fractional anisotropy (FA) and metabolic standardized uptake value (SUV). As expected, a profound decline in regional metabolism and white matter integrity was found in patients as compared with healthy subjects. Furthermore, a function–structure relationship was present in brain-damaged patients between functional metabolism of inferior-parietal, precuneus, and frontal regions and structural integ- rity of the frontal-inferiorparietal, precuneus-inferiorparietal, thalamo-inferioparietal, and thalamofron- tal tracts. When focusing on patients, a stronger relationship between structural integrity of thalamo- inferiorparietal tracts and thalamic metabolism in patients who have emerged from the minimally con- scious state as compared with patients with disorders of consciousness was found. The latter finding Additional Supporting Information may be found in the online version of this article. Contract grant sponsor: University and University Hospital of Lie `ge, the Belgian National Funds for Scientific Research (FRS- FNRS) the French Speaking Community Concerted Research Action (ARC - 06/11 - 340); Contract grant sponsor: NSERC dis- covery grant, IAP research network P7/06 of the Belgian Govern- ment (Belgian Science Policy); Contract grant sponsor: the European Commission; Contract grant sponsor: the James McDonnell Foundation, Mind Science Foundation; Contract grant sponsor: the European space agency (ESA); Contract grant spon- sor: the Public Utility Foundation ‘Universit e Europ eenne du Travail’, “Fondazione Europea di Ricerca Biomedica.” *Correspondence to: Prof. Steven Laureys; Coma Science Group, CHU Sart Tilman, GIGA-Research B34-Quartier H^ opital, Avenue de l’H^ opital, 11, 4000 Lie `ge, Belgium. E-mail: [email protected] † J. Annen and L. Heine have contributed equally to this work. Received for publication 10 February 2016; Revised 12 April 2016; Accepted 16 May 2016. DOI: 10.1002/hbm.23269 Published online 6 June 2016 in Wiley Online Library (wileyonlinelibrary.com). r Human Brain Mapping 37:3707–3720 (2016) r V C 2016 Wiley Periodicals, Inc.

Welcome message from author
This document is posted to help you gain knowledge. Please leave a comment to let me know what you think about it! Share it to your friends and learn new things together.
Transcript
Function–Structure Connectivity in Patientswith Severe Brain Injury as Measured by MRI-DWI
and FDG-PET
J. Annen,1,2,3,† L. Heine,1,2,3,† E. Ziegler,1 G. Frasso,4 M. Bahri,1 C. Di Perri,1,2
J. Stender,5 C. Martial,1,2,3 S. Wannez,1,2,3 K. D’ostilio,6 E. Amico,1,2
G. Antonopoulos,1,2 C. Bernard,3 F. Tshibanda,3 R. Hustinx,3 andS. Laureys1,2,3*
1Cyclotron Research Centre, University of Liege, Liege, Belgium2Coma Science Group, GIGA Consciousness, University of Liege, Liege, Belgium
3University Hospital of Liege, Liege, Belgium4Faculty of Social Sciences, Quantitative Methods for Social Sciences, University of Liege,
Liege, Belgium5University of Copenhagen, Copenhagen, Denmark
6Headache Research Unit, University of Liege, Liege, Belgium
r r
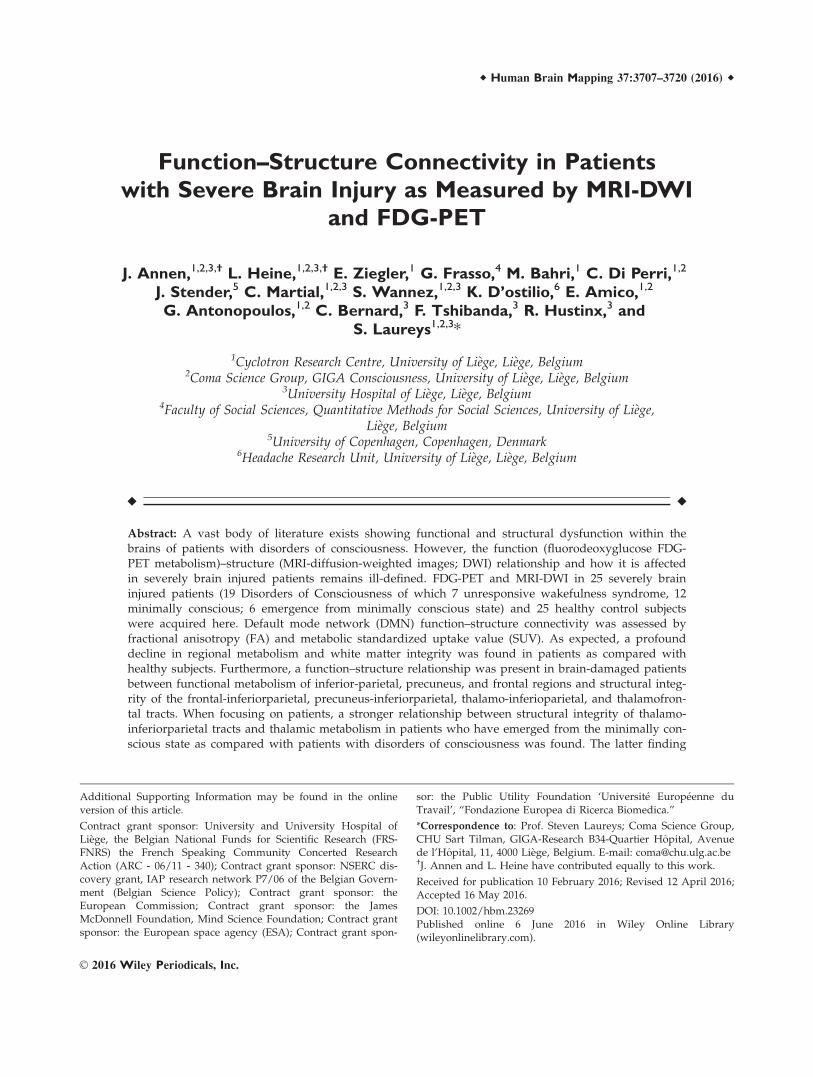
Abstract: A vast body of literature exists showing functional and structural dysfunction within thebrains of patients with disorders of consciousness. However, the function (fluorodeoxyglucose FDG-PET metabolism)–structure (MRI-diffusion-weighted images; DWI) relationship and how it is affectedin severely brain injured patients remains ill-defined. FDG-PET and MRI-DWI in 25 severely braininjured patients (19 Disorders of Consciousness of which 7 unresponsive wakefulness syndrome, 12minimally conscious; 6 emergence from minimally conscious state) and 25 healthy control subjectswere acquired here. Default mode network (DMN) function–structure connectivity was assessed byfractional anisotropy (FA) and metabolic standardized uptake value (SUV). As expected, a profounddecline in regional metabolism and white matter integrity was found in patients as compared withhealthy subjects. Furthermore, a function–structure relationship was present in brain-damaged patientsbetween functional metabolism of inferior-parietal, precuneus, and frontal regions and structural integ-rity of the frontal-inferiorparietal, precuneus-inferiorparietal, thalamo-inferioparietal, and thalamofron-tal tracts. When focusing on patients, a stronger relationship between structural integrity of thalamo-inferiorparietal tracts and thalamic metabolism in patients who have emerged from the minimally con-scious state as compared with patients with disorders of consciousness was found. The latter finding
Additional Supporting Information may be found in the onlineversion of this article.
Contract grant sponsor: University and University Hospital ofLiege, the Belgian National Funds for Scientific Research (FRS-FNRS) the French Speaking Community Concerted ResearchAction (ARC - 06/11 - 340); Contract grant sponsor: NSERC dis-covery grant, IAP research network P7/06 of the Belgian Govern-ment (Belgian Science Policy); Contract grant sponsor: theEuropean Commission; Contract grant sponsor: the JamesMcDonnell Foundation, Mind Science Foundation; Contract grantsponsor: the European space agency (ESA); Contract grant spon-
sor: the Public Utility Foundation ‘Universit�e Europ�eenne duTravail’, “Fondazione Europea di Ricerca Biomedica.”
*Correspondence to: Prof. Steven Laureys; Coma Science Group,CHU Sart Tilman, GIGA-Research B34-Quartier Hopital, Avenuede l’Hopital, 11, 4000 Liege, Belgium. E-mail: [email protected]†J. Annen and L. Heine have contributed equally to this work.
Received for publication 10 February 2016; Revised 12 April 2016;Accepted 16 May 2016.
DOI: 10.1002/hbm.23269Published online 6 June 2016 in Wiley Online Library(wileyonlinelibrary.com).
r Human Brain Mapping 37:3707–3720 (2016) r
VC 2016 Wiley Periodicals, Inc.
was in line with the mesocircuit hypothesis for the emergence of consciousness. The findings showeda positive function–structure relationship within most regions of the DMN. Hum Brain Mapp 37:3707–3720, 2016. VC 2016 Wiley Periodicals, Inc.
Key words: FDG-PET; DWI; disorders of consciousness; function–structure coupling; default modenetwork
r r
INTRODUCTION
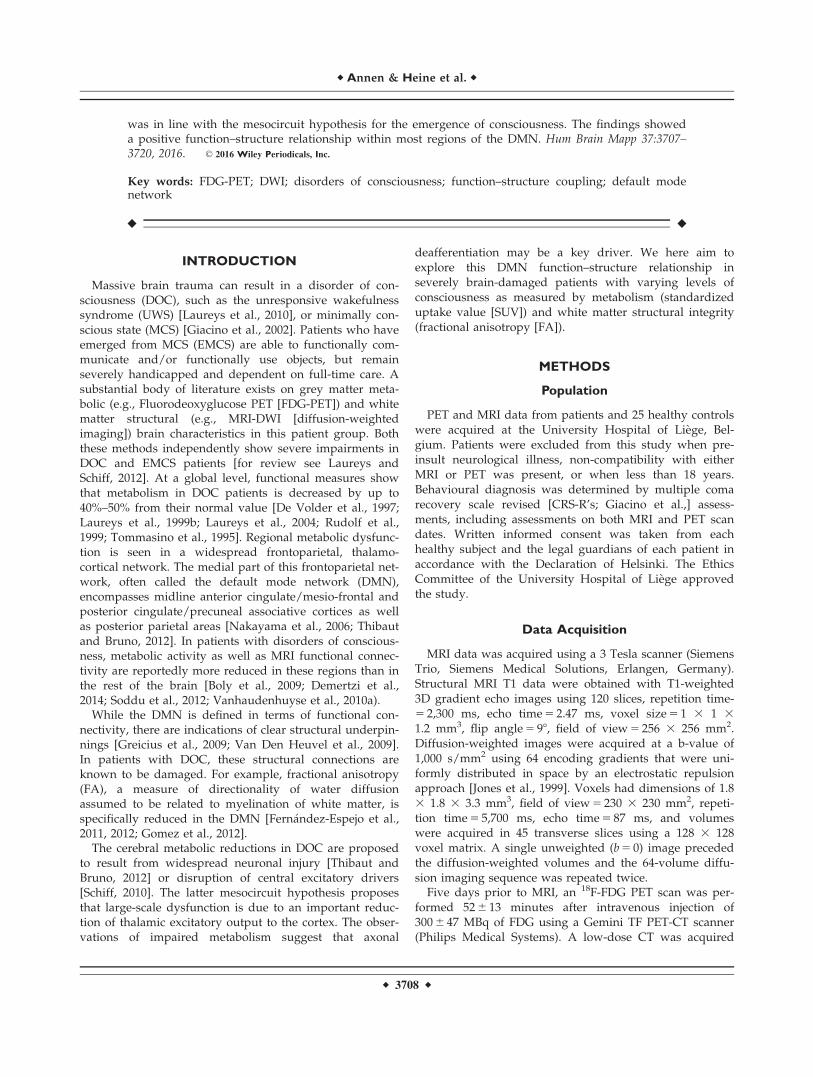
Massive brain trauma can result in a disorder of con-sciousness (DOC), such as the unresponsive wakefulnesssyndrome (UWS) [Laureys et al., 2010], or minimally con-scious state (MCS) [Giacino et al., 2002]. Patients who haveemerged from MCS (EMCS) are able to functionally com-municate and/or functionally use objects, but remainseverely handicapped and dependent on full-time care. Asubstantial body of literature exists on grey matter meta-bolic (e.g., Fluorodeoxyglucose PET [FDG-PET]) and whitematter structural (e.g., MRI-DWI [diffusion-weightedimaging]) brain characteristics in this patient group. Boththese methods independently show severe impairments inDOC and EMCS patients [for review see Laureys andSchiff, 2012]. At a global level, functional measures showthat metabolism in DOC patients is decreased by up to40%–50% from their normal value [De Volder et al., 1997;Laureys et al., 1999b; Laureys et al., 2004; Rudolf et al.,1999; Tommasino et al., 1995]. Regional metabolic dysfunc-tion is seen in a widespread frontoparietal, thalamo-cortical network. The medial part of this frontoparietal net-work, often called the default mode network (DMN),encompasses midline anterior cingulate/mesio-frontal andposterior cingulate/precuneal associative cortices as wellas posterior parietal areas [Nakayama et al., 2006; Thibautand Bruno, 2012]. In patients with disorders of conscious-ness, metabolic activity as well as MRI functional connec-tivity are reportedly more reduced in these regions than inthe rest of the brain [Boly et al., 2009; Demertzi et al.,2014; Soddu et al., 2012; Vanhaudenhuyse et al., 2010a).
While the DMN is defined in terms of functional con-nectivity, there are indications of clear structural underpin-nings [Greicius et al., 2009; Van Den Heuvel et al., 2009].In patients with DOC, these structural connections areknown to be damaged. For example, fractional anisotropy(FA), a measure of directionality of water diffusionassumed to be related to myelination of white matter, isspecifically reduced in the DMN [Fern�andez-Espejo et al.,2011, 2012; Gomez et al., 2012].
The cerebral metabolic reductions in DOC are proposedto result from widespread neuronal injury [Thibaut andBruno, 2012] or disruption of central excitatory drivers[Schiff, 2010]. The latter mesocircuit hypothesis proposesthat large-scale dysfunction is due to an important reduc-tion of thalamic excitatory output to the cortex. The obser-vations of impaired metabolism suggest that axonal
deafferentiation may be a key driver. We here aim toexplore this DMN function–structure relationship inseverely brain-damaged patients with varying levels ofconsciousness as measured by metabolism (standardizeduptake value [SUV]) and white matter structural integrity(fractional anisotropy [FA]).
METHODS
Population
PET and MRI data from patients and 25 healthy controlswere acquired at the University Hospital of Liege, Bel-gium. Patients were excluded from this study when pre-insult neurological illness, non-compatibility with eitherMRI or PET was present, or when less than 18 years.Behavioural diagnosis was determined by multiple comarecovery scale revised [CRS-R’s; Giacino et al.,] assess-ments, including assessments on both MRI and PET scandates. Written informed consent was taken from eachhealthy subject and the legal guardians of each patient inaccordance with the Declaration of Helsinki. The EthicsCommittee of the University Hospital of Liege approvedthe study.
Data Acquisition
MRI data was acquired using a 3 Tesla scanner (SiemensTrio, Siemens Medical Solutions, Erlangen, Germany).Structural MRI T1 data were obtained with T1-weighted3D gradient echo images using 120 slices, repetition time-5 2,300 ms, echo time 5 2.47 ms, voxel size 5 1 3 1 3
1.2 mm3, flip angle 5 98, field of view 5 256 3 256 mm2.Diffusion-weighted images were acquired at a b-value of1,000 s/mm2 using 64 encoding gradients that were uni-formly distributed in space by an electrostatic repulsionapproach [Jones et al., 1999]. Voxels had dimensions of 1.83 1.8 3 3.3 mm3, field of view 5 230 3 230 mm2, repeti-tion time 5 5,700 ms, echo time 5 87 ms, and volumeswere acquired in 45 transverse slices using a 128 3 128voxel matrix. A single unweighted (b 5 0) image precededthe diffusion-weighted volumes and the 64-volume diffu-sion imaging sequence was repeated twice.
Five days prior to MRI, an 18F-FDG PET scan was per-formed 52 6 13 minutes after intravenous injection of300 6 47 MBq of FDG using a Gemini TF PET-CT scanner(Philips Medical Systems). A low-dose CT was acquired
r Annen & Heine et al. r
r 3708 r
for attenuation correction, followed by a 12-minuteemission scan. The studies were reconstructed using aLOR-OSEM algorithm and reconstructed images had2 mm3 isotropic voxels in a 256 3 256 3 89 voxel matrix.
Data Processing
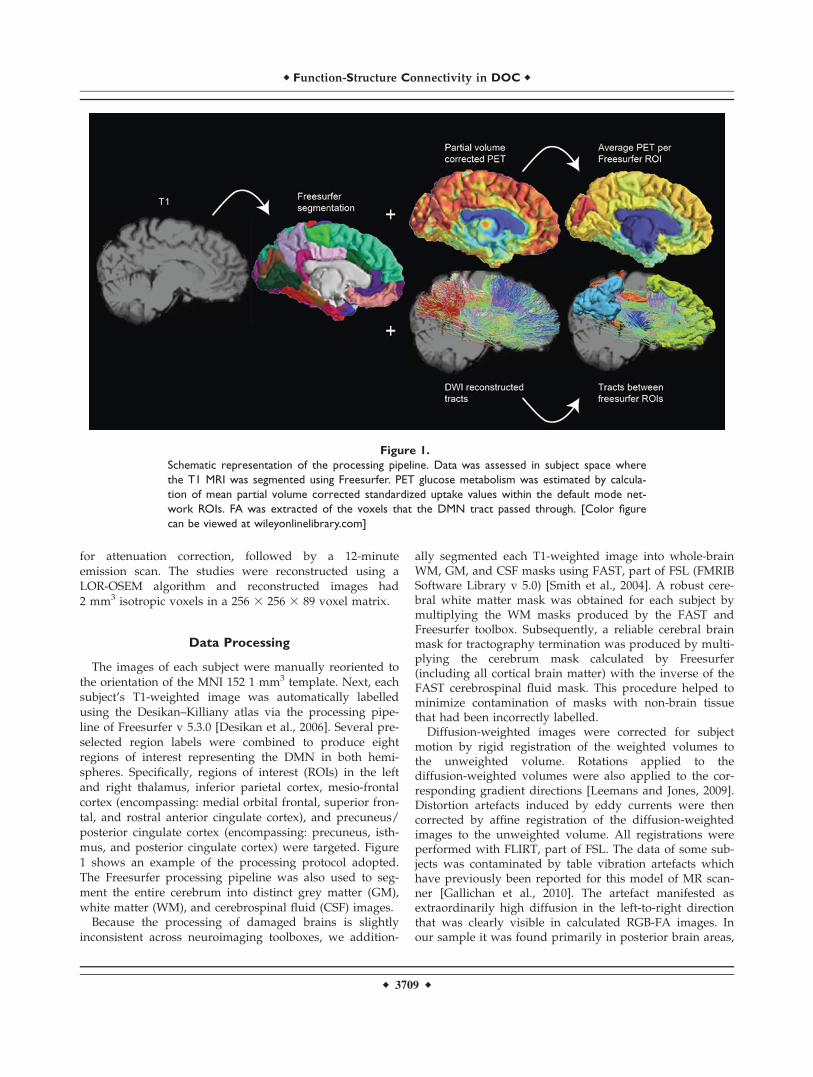
The images of each subject were manually reoriented tothe orientation of the MNI 152 1 mm3 template. Next, eachsubject’s T1-weighted image was automatically labelledusing the Desikan–Killiany atlas via the processing pipe-line of Freesurfer v 5.3.0 [Desikan et al., 2006]. Several pre-selected region labels were combined to produce eightregions of interest representing the DMN in both hemi-spheres. Specifically, regions of interest (ROIs) in the leftand right thalamus, inferior parietal cortex, mesio-frontalcortex (encompassing: medial orbital frontal, superior fron-tal, and rostral anterior cingulate cortex), and precuneus/posterior cingulate cortex (encompassing: precuneus, isth-mus, and posterior cingulate cortex) were targeted. Figure1 shows an example of the processing protocol adopted.The Freesurfer processing pipeline was also used to seg-ment the entire cerebrum into distinct grey matter (GM),white matter (WM), and cerebrospinal fluid (CSF) images.
Because the processing of damaged brains is slightlyinconsistent across neuroimaging toolboxes, we addition-
ally segmented each T1-weighted image into whole-brainWM, GM, and CSF masks using FAST, part of FSL (FMRIBSoftware Library v 5.0) [Smith et al., 2004]. A robust cere-bral white matter mask was obtained for each subject bymultiplying the WM masks produced by the FAST andFreesurfer toolbox. Subsequently, a reliable cerebral brainmask for tractography termination was produced by multi-plying the cerebrum mask calculated by Freesurfer(including all cortical brain matter) with the inverse of theFAST cerebrospinal fluid mask. This procedure helped tominimize contamination of masks with non-brain tissuethat had been incorrectly labelled.
Diffusion-weighted images were corrected for subjectmotion by rigid registration of the weighted volumes tothe unweighted volume. Rotations applied to thediffusion-weighted volumes were also applied to the cor-responding gradient directions [Leemans and Jones, 2009].Distortion artefacts induced by eddy currents were thencorrected by affine registration of the diffusion-weightedimages to the unweighted volume. All registrations wereperformed with FLIRT, part of FSL. The data of some sub-jects was contaminated by table vibration artefacts whichhave previously been reported for this model of MR scan-ner [Gallichan et al., 2010]. The artefact manifested asextraordinarily high diffusion in the left-to-right directionthat was clearly visible in calculated RGB-FA images. Inour sample it was found primarily in posterior brain areas,
Figure 1.
Schematic representation of the processing pipeline. Data was assessed in subject space where
the T1 MRI was segmented using Freesurfer. PET glucose metabolism was estimated by calcula-
tion of mean partial volume corrected standardized uptake values within the default mode net-
work ROIs. FA was extracted of the voxels that the DMN tract passed through. [Color figure
can be viewed at wileyonlinelibrary.com]
r Function-Structure Connectivity in DOC r
r 3709 r
though its effects occasionally appeared throughout thebrain. We reduced the effect of the artefact by removingvolumes in which the absolute value of the x-componentof the encoding gradient vector exceeded a manuallyselected threshold. This threshold was chosen by repeat-edly examining the RGB-FA image at distinct thresholdsby at least two assessors.
For both analysis and preprocessing diffusion tensorswere fit at each voxel using non-linear least squares fitting.Tensor eigenvalues were constrained to positivity by tak-ing their absolute value. This method is known to berobust against noise [Koay, 2009]. FA, tensor mode [Ennisand Kindlmann, 2006], and RGB-FA images were com-puted. Tensor mode provides a method for quantifyingthe type of anisotropy (e.g., planar 5 two fibre populations,or linear 5 one fibre population) found in the voxel. Moderanges between 21 (planar anisotropy) and 11 (linear ani-sotropy) with 0 representing orthotropy. All tensor calcula-tions were performed with Dipy [Garyfallidis et al., 2014].
Affine registration was performed between each sub-ject’s white matter mask (in T1 space) and a thresholdedFA image (FA> 0.2) using FLIRT (nearest neighbour inter-polation, mutual information cost function), part of FSL.The translation component of the transformation matrixwas modified by adding half of the difference between thefields of view of the DWI and T1-weighted images. Thisallows the transformation matrix to be used to register T1-derived masks to those in DWI orientation without down-sampling. The transformation matrix was applied to theT1-derived white matter mask, cerebral track terminationmask, and ROI label map.
A set of voxels with unidirectional diffusion (or a“single fibre population”) was identified by eroding andthresholding (0.8< FA< 0.99) the FA image and multiply-ing this by a map of the thresholded tensor mode (mod-e> 0.9). These operations were performed with fslmaths,part of FSL. Binary single fibre population masks weremanually revised to select only voxels that were clearlyinside the corpus callosum and corticospinal tracts. Thesehigh FA and high mode voxels were used to estimate thediffusion-weighted signal response for a single fibre popu-lation. Next, non-negativity constrained spherical deconvo-lution was performed and fibre orientation distributionfunctions within each voxel were estimated. A maximumharmonic order of 4 was used for both response estimationand spherical deconvolution. Probabilistic tractographywas performed using randomly placed seeds within thesubject-specific white matter masks described above. Fibretracking settings were as follows: number oftracks 5 1,000,000, FOD magnitude cutoff for terminatingtracks 5 0.1, minimum track length 5 10 mm, maximumtrack length 5 200 mm, minimum radius ofcurvature 5 1 mm, tracking algorithm step size 5 0.2 mm.Streamlines were terminated when they (i) extended outof the cerebrum track termination mask, or (ii) could notprogress along a direction with FOD magnitude or curva-
ture radius higher than the minimum cutoffs. A connectiv-ity matrix for the eight-region connectome was computedusing the streamline origin and termination points and theROI label mask. For each streamline the FA was averagedover all the voxels it passed through; meaning that weextracted the FA within the 12 tracts connecting each ofour DMN regions of interest. Constrained spherical decon-volution and fibre tracking were performed with MRtrix0.2.12 [Tournier et al., 2012]. Computation of the connec-tivity matrices was performed with MRtrix 0.3.
FDG-PET images for each subject were first manuallyreoriented toward the T1-weighted image using StatisticalParametric Mapping 8 (SPM8; www.fil.ion.ucl.ac.uk/spm)in order to ease later automated registration tasks. FDG-PET images underwent partial volume effect (PVE) correc-tion using the Muller–Gartner–Rousset method [M€uller-G€artner et al., 1992; Rousset et al., 2007] in PVElab v 2.2[Quarantelli et al., 2004; Svarer et al., 2005]. Partial volumecorrection aims to remove the spillover of signal to regionsthat are known to be without activity (e.g., CSF), in orderto prevent underestimation of signal in regions with activ-ity (e.g., GM). Grey matter, white matter, and cerebrospi-nal fluid partial volume estimate images were obtained, asearlier, using FAST. A rigid-body transformation wasobtained between the uncorrected FDG-PET and the sub-ject’s T1-weighted image to bring the T1 image to PETspace (trilinear interpolation, correlation ratio cost func-tion; in six patients, cost function was changed to normal-ized mutual information to improve registration). Theinverse of this transformation matrix was applied to theGM, WM, and CSF partial volume images to bring theminto the space of the PET image. The point spread functionwas modelled by 3D Gaussian function with in-plane full-width at half maximum (FWHM) values of 8 mm. Finally,following PVE correction the PET image was transformedinto T1 space and the mean SUV value was extractedwithin each ROI using in-house software.
For all subjects it was necessary to manually check theperformance of the automated labelling and registrationprocedures. In six patients there were voxels that wereclearly mislabelled and required correction. The ROI labelswere evaluated and adjusted when deemed necessary by atleast two researchers. Processing pipelines were developedin Python using Nipype [Gorgolewski et al., 2011] and arefreely available online (https://github.com/GIGA-Con-sciousness/structurefunction). A figure showing ROIs andtracts can be found in the Supporting Information Fig. 1.
Statistical Analysis
Statistical analysis was done using R [R Core Team,2014]. First, to test for demographic differences (age andgender) between our two groups (healthy controls andbrain-injured patients), we used independent two-samplet-tests or chi-square test, respectively. To test for possibledifferences between left and right brain function/structure
r Annen & Heine et al. r
r 3710 r

we assessed laterality differences using a two sample t-tests within brain-injured patients and controls with a“logit” transform of FA and log transformation of SUV toaccount for parametric test-assumptions. Subsequently,SUV and FA of the left and right hemisphere regions wereaveraged for each subject. Next, to test the differencesbetween the two groups in mean SUV and FA values two-sample t-tests with Bonferroni correction (a 5 0.012 anda 5 0.008 respectively) were used. Using a v2 test the num-ber of volumes removed during vibration artefact correc-tion was evaluated to identify any potential group bias.Subsequently, multivariate linear regression analysis withgroup and FA as regressors was performed to model howgroup and structural integrity (FA) of DMN tracts relate tometabolism (SUV) in adjacent regions. SUV was log scaledto meet normality assumptions. Furthermore, to take intoaccount the differences in variance we weighted theregression function by the inverse of the FA of the corre-sponding connection. Type II ANOVA’s were used toassess significant main and interaction effects. As eachSUV ROI is tested three times, Bonferroni correction wasused with a 5 0.016.
We then focused on patients alone to better understandthe structure–function relationship in the brain-injuredgroup. Multiple linear regression models were used toinvestigate how demographic factors as diagnosis (DOCvs. EMCS), aetiology (TBI or non-TBI), disease duration(subchronic vs. chronic), gender, and age influence thefunction–structure relationship in the patient population.Type II ANOVA’s were used to assess significant mainand interaction effects. Within the control population wetested for an effect of FA on SUV using a simple linearregression with FA as regressor and SUV as outcomemeasure.
To assess a possible global effect of SUV and FA weused a multivariate linear regression analysis to modelhow group and whole-brain structural integrity of whitematter (FA over all white matter voxels) relate to whole-brain grey matter metabolism (SUV). Furthermore we per-formed an analogous regression analysis for the patientand control group separately.
RESULTS
We obtained MRI data of 163 adult, (sub-) chronic (>30days after injury) patients without pre-existing comorbid-ities and 14 healthy control subjects between November2009 and October 2013. Stringent exclusion criteria wereapplied as visualized in Fig. 2. Patients were excludedbecause of technical difficulties in either MRI or PET(N 5 25), more than 5 days between exams (N 5 5), severedeformations consisting of more than one-third of onehemisphere (e.g., enlarged ventricles, haemorrhage, severeatrophy), metal/drain artefacts (N 5 79). Data of 54patients were preprocessed, although 29 subjects had to beexcluded because Freesurfer was unable to complete seg-
mentation. Thus, the final cohort consisted of 25 patientsand 25 healthy controls. The patients did not differ fromcontrol subjects in age (P 5 0.214; mean age 5 36.3 for braininjured and 40.9 for healthy controls) or gender (P 5 0.756;13 male against 11 male in brain injured and healthygroups, respectively).
DOC patients had been clinically diagnosed as in anunresponsive wakeful state (UWS, n 5 7) or a minimallyconscious state (MCS, n 5 12), and diagnosis was consist-ent with the diagnosis of the day of the PET and MRIscan. Six subjects were diagnosed as emerged from a mini-mally conscious state (EMCS, n 5 6). The patient cohortconsisted of subacute (n 5 10, between 30 days and 3months after onset) and chronic patients (n 5 15, >3 monthafter onset) with a mean time since onset of 1.8 years(SD 5 1.9 years). Patients suffered from traumatic braininjury (TBI, n 5 12), anoxia (n 5 11), both (mix, n 5 1), orinfection (n 5 1). For demographic and clinical details seeTable I.
The vibration artefact affected 14 of 25 patients and 5out of 25 controls. On average, 39 diffusion-weighted vol-umes (30%) had to be removed from patient data and 32(25%) out of 128 volumes from control subjects. We didnot find a difference between the amount of affected vol-umes between patients and controls [v2(1,N 5 50) 5 3.14,P 5 0.076].
Figure 2.
Flowchart of exclusion criteria. This study was conducted using
stringent exclusion criteria. Of the 163 MRI examinations per-
formed at the Coma Science Group between November 2009
and October 2013, 109 were excluded before image analysis.
Data preprocessing was done for 54 patients, of which addition-
ally 19 subjects had to be excluded due to inaccurate segmenta-
tion. Finally, we included 25 patients in the statistical analysis.
r Function-Structure Connectivity in DOC r
r 3711 r

To assess if there is an effect of laterality, the differencebetween SUV values in our ROIs and FA values for con-nections in the left and right hemisphere were assessed.No differences could be observed within SUV values forcontrols (P 5 0.794) or patients (P 5 0.691), nor in FA val-ues between the left and right tracts (controls; P 5 0.156,patients; P 5 0.053). The values of each hemisphere wereaveraged for subsequent analysis so that each subject wasnot tested twice.
Functional and Structural Integrity
Metabolism (SUV values) was significantly (P< 0.001)lower in brain-injured patients compared with controls(Fig. 3). The average reduction in SUV of patients was42%. The reduction was strongest in the precuneus (44%)and weakest in the frontal cortex (39%).
FA was also significantly (P< 0.001) lower in brain-injured patients compared with controls (Fig. 4). The aver-age reduction of FA was 17%, with the biggest reductionin the fronto-precuneus tract (23%) and the smallest reduc-tion in the thalamo-precuneus radiation (13%). A table
indicating all two-sample t-tests with Bonferroni correctioncan be found in the Supporting Information.
Regression Analysis
Explaining SUV through FA and group
Multiple linear regression (Fig. 5; Supporting Informa-tion Fig. 2; Tables (II–V) for P-values) including the twogroups (patients and controls) showed a main effect of FAand of group (with Bonferoni correction of P< 0.016). Themain effect of group is significant for all the regions andadjacent tracts with a higher SUV for healthy controls thanfor patients, except for SUV in the inferioparietal cortexwith FA from the frontal to inferioparietal tract whereonly a trend can be observed.
The main effect of FA can be found in five tracts(Fig. 5). This is the case for SUV in the inferioparietal cor-tex and FA from all assessed tracts toward this ROI (tha-lamo-interioparietal P< 0.0001, frontal-inferioparietalP 5 0.012, precuneus-inferioparietal P< 0.0001), SUV in theprecuneus and precuneus-inferioparietal FA (P< 0.0001),and SUV of the frontal cortex and thalamo-frontal FA
TABLE I. Patient demographics
Diagnosis Age Gender EtiologyDays
(Onset) GOSE
CRS-RCRS-RtotalA. V. M. O. C. Ar.
EMCS 33 F TBI 388 NA 4 5 6 3 2 3 23EMCS 30 M TBI 881 3 4 5 6 3 2 3 23EMCS 37 M Anoxia 284 3 4 5 6 3 0 2 20EMCS 45 F Anoxia 38 3 4 5 6 3 1 1 20EMCS 31 F TBI 439 3 4 5 5 2 2 2 20EMCS 22 M TBI 2,424 3 3 4 6 3 1 1 18MCS1 28 M TBI 589 3 1 2 2 1 0 1 7MCS1 45 M TBI 533 3 3 3 3 1 0 2 12MCS1 47 F Anoxia 210 NA 3 0 1 1 0 2 7MCS1 19 M MIX 1,236 3 3 4 1 2 0 2 12MCS1 23 M TBI 752 3 3 4 5 1 0 2 15MCS1 48 F Anoxia 292 NA 3 1 2 2 0 1 9MCS1 49 M Anoxia 674 1 3 1 3 1 0 2 10MCS- 29 F TBI 569 3 1 2 1 2 0 1 7MCS- 28 M TBI 634 2 0 1 2 1 1 1 6MCS- 36 F Anoxia 549 3 1 3 2 2 1 1 10MCS- 45 F Anoxia 259 1 0 0 2 1 0 1 4MCS- 48 M Anoxia 1,100 3 1 3 1 2 0 1 8UWS 40 M Anoxia 2,890 3 1 0 1 2 0 1 5UWS 21 M TBI 196 2 1 0 2 2 0 2 7UWS 44 F Anoxia 101 1 0 0 2 1 0 1 4UWS 54 F Infection 51 1 0 0 2 1 0 1 4UWS 20 M TBI 31 7 0 1 2 1 0 1 5UWS 48 F Anoxia 129 1 1 0 0 1 0 2 4UWS 37 F TBI 1,192 3 1 0 1 1 0 2 5
EMCS, Emergence from minimally conscious state; MCS, minimally conscious state; UWS, unresponsive wakefulness syndrome; M,male; F, female; TBI, traumatic brain injury; MIX, anoxia and traumatic brain injury; GOSE, Glasgow outcome scale extended; CRS-R,Coma recovery scale – revised; A., Auditory; V., visual; M., motor; O., oromotor; C., communication; Ar., arousal.
r Annen & Heine et al. r
r 3712 r

(P 5 0.009) (Tables II–V). The relationship between FA andSUV within each of the two samples has been furtherinvestigated and the results are discussed in the followingparagraph.
Explaining SUV through FA and demographic factors
Within patients, we did not find any significant effect ofaetiology (TBI or non-TBI), duration, gender, or age in themultiple linear regression model. An interaction effect
between group (EMCS vs. DOC) and FA was found (withBonferoni correction a< 0.016) on thalamic SUV andthalamo-inferioparietal FA (P 5 0.006). Trends wereobserved for thalamic SUV and the other two tractstoward this ROI (thalamo-frontal P 5 0.04, thalamo-precuneus P 5 0.017) (Supporting Information Fig. 4).Furthermore, apart from one, all observed main effects ofFA seen in the previous analysis were also observed in thecurrent analysis between the two patient populations. SUVin the inferioparietal cortex is explained by thalamo-
Figure 4.
MRI white matter structural integrity in DMN tracts. Structural
integrity of tracts between the default mode network regions rep-
resented with FA of the voxels that the tracts pass through, in
healthy controls and brain injured patients (average of left and right
hemispheres). Brain injured patients show lower FA values com-
pared with healthy controls subjects in all tracts. ***5 P< 0.001.
[Color figure can be viewed at wileyonlinelibrary.com]
Figure 3.
PET glucose uptake in DMN regions. Standardized uptake value
following partial volume correction (PVC) in the default mode
network regions (average of standardized uptake values of left
and right hemisphere) for healthy controls and brain injured
patients. Brain injured patients show a decreased standardized
uptake value compared with controls in all default mode net-
work regions. *** 5 P< 0.001. [Color figure can be viewed at
wileyonlinelibrary.com]
r Function-Structure Connectivity in DOC r
r 3713 r

interioparietal FA (P 5 0.002), and precuneus-inferioparietal FA (P< 0.0001). Similarly, SUV in the precu-neus that depends on the precuneus-inferioparietal FA(P 5 0.002). SUV of the frontal cortex is linearly related tothalamo-frontal FA (P 5 0.012). Within the healthy popula-tion there is no evidence for a main effect of FA on SUVin any of the structure–function pairs (Table VI).
Whole brain regression analysis
To test if these results were limited to the DMN orreflective of general brain integrity, we performed a linearregression analysis to model how group and whole-brainstructural integrity of white matter (FA) relate to wholebrain grey matter metabolism (SUV). This additional anal-ysis showed a main effect of group (P 5 0.0003), but not ofFA (P 5 0.17). Instead, a small evidence for an interactioneffect could be observed (P 5 0.03) (Supporting Informa-tion Fig. 3). However, we did not find evidence for a struc-ture–function relationship within each subgroup.
DISCUSSION
We here aimed to directly investigate, in severely braininjured patients, the relationship between functional brainactivity and structural connectivity within the DMN in anobjective and combined fashion using both FDG-PETand FA MRI. We show that a function–structurerelationship is present in brain-damaged patients betweenfunctional metabolism of inferior-parietal, precuneus, andfrontal regions and structural integrity of the frontal-inferiorparietal, precuneus-inferiorparietal, thalamo-interioparietal and thalamofrontal tracts. When focusing onEMCS versus DOC patients, we found a stronger relation-ship between structural integrity of thalamo-inferiorparietaltracts and thalamic metabolism in patients who haveemerged from MCS as compared with DOC patients.
We first assessed function (PET metabolism) and struc-ture (DWI-FA) independently, to replicate previous studiesfocusing on either measure separately. Indeed, markedimpairments in SUV and FA were observed in patients.
Figure 5.
Linear regression model of the function–structure relationship.
Left side of the image shows a spatial representation of the
function–structure relationships (blue circles for regions where
the partial volume corrected - standardized uptake value (PVC-
SUV) depended on FA, blue arrows for FA of tracts that drive
SUV in adjacent regions). Right side of image shows five scatter-
plots of the linear regression models for healthy controls (blue
dots), and patients (green dots), and significant main effect of FA
(lines). Abbreviations: FA, fractional anisotropy; PVC-SUV, partial
volume corrected-standardized uptake value. [Color figure can
be viewed at wileyonlinelibrary.com]
r Annen & Heine et al. r
r 3714 r

SUV in all DMN regions was lowered in brain-injuredpatients compared with healthy controls, with a 39%–42%reduction of metabolic rates in brain-injured patients inthe cortical DMN regions and thalamus (Fig. 3). This is inaccordance with previous findings on a global brain scale[Laureys et al., 1999a,; Rudolf et al., 1999; Stender et al.,2014a,b; Tommasino et al., 1995] and within the DMN spe-cifically [Fridman et al., 2014; Nakashima et al., 2007; Thi-baut and Bruno, 2012]. FA in all DMN tracts wasdiminished by about 13%–23% in brain-injured patientscompared with healthy controls (Fig. 4), in line with previ-ous reports [Fern�andez-Espejo et al., 2011, 2012; G�omez
et al., 2012]. Our results support recent findings of dimin-ished structural integrity of corticocortical and subcortico-cortical DMN connections, which correlated with clinicalseverity in a group of eight patients [Lant et al., 2015].
The main aim of this study was to assess the function–structure relationship in the DMN and thalamus in healthyconscious subjects and coma survivors. First, as expected,we have replicated previous studies and shown thatpatients have significantly lower FA in all studied connec-tions and SUV in all regions. Building on this, we showedthat grey matter metabolic function can be partiallyexplained by white matter anisotropy in several regions of
TABLE II. Regression analysis SUV of the thalamus, FA, and group (healthy vs. brain injured)
SUV FA R2 Beta95% confidence
interval Sum Sq Df F P-value
Thalamus Thalamo-frontal 0.722FA 0.538 21.029 2.105 0.026 1 0.309 0.581Group 0.947 20.819 2.713 4.823 1 56.763 0.000 ***Interaction 20.988 25.216 3.240 0.019 1 0.221 0.640Residuals 3.908 46
Thalamus Thalamo-inferiorparietal 0.721FA 0.523 21.358 2.404 0.036 1 0.425 0.518Group 0.425 21.623 2.474 4.338 1 50.929 0.000 ***Interaction 0.255 24.591 5.101 0.001 1 0.011 0.916Residuals 3.833 45
Thalamus Thalamo-precuneus 0.731FA 1.322 20.882 3.526 0.083 1 1.007 0.321Group 1.100 20.641 2.841 4.200 1 50.900 0.000 ***Interaction 21.411 25.623 2.801 0.038 1 0.456 0.503Residuals 3.713 45
Statistics and confidence interval of the regression models to predict SUV using FA of adjacent tracts and group (brain-injured patientsor healthy control subjects). * 5 P< 0.05, ** 5 P< 0.01, *** 5 P< 0.00.
TABLE III. Regression analysis SUV of the frontal cortex, FA, and group (healthy vs. brain injured)
SUV FA R2 Beta95% confidence
interval Sum Sq Df F P-value
Frontal Thalamo-frontal 0.644FA 2.692 0.860 4.524 0.872 1 7.510 0.009 **Group 1.502 20.563 3.566 2.232 1 19.222 0.000 ***Interaction 22.732 27.674 2.211 0.144 1 1.238 0.272Residuals 5.342 46
Frontal Frontal-inferiorparietal 0.607FA 2.254 0.253 4.255 0.688 1 5.090 0.029 *Group 0.836 21.417 3.088 1.165 1 8.624 0.005 **Interaction 21.254 26.696 4.187 0.029 1 0.216 0.645Residuals 6.081 45
Frontal Frontal-precuneus 0.587FA 1.635 20.754 4.024 0.133 1 0.926 0.341Group 1.574 20.487 3.635 1.685 1 11.736 0.001 **Interaction 22.955 28.174 2.264 0.187 1 1.299 0.260Residuals 6.603 46
Statistics and confidence interval of the regression models to predict SUV using FA of adjacent tracts and group (brain-injured patientsor healthy control subjects). * 5 P< 0.05, ** 5 P< 0.01, *** 5 P< 0.00
r Function-Structure Connectivity in DOC r
r 3715 r

the DMN within the patient cohort. More specifically,metabolism of the frontal cortex, precuneus, and inferiorparietal cortex can be explained by fronto-inferioparietal,precuneal-inferiorparietal, and thalamo-inferioparietal aswell as thalamo-frontal structural integrity (FA). Theseresults are in line with the limited previous studies indi-cating there might be a link between structural integrityand glucose metabolism. For example, one study correlat-ing metabolism with white matter bundles in the DMN inhealthy subjects found that working memory is related toa structure–function correlation in the cingulum [Yakushevet al., 2013]. Further studies have shown that diffusion
measures have been correlated to glucose uptake inpatients with Alzheimer’s disease and dementia [Bozokiet al., 2012; Kuczynski et al., 2010; Yakushev et al., 2011],children with occipital lesions [ Jeong et al., 2015], normalaging [Inoue et al., 2008], and epilepsy [Chandra et al.,2006]. However, all of these studies use simple correlationsinstead of regressions measures, and thus do not takepopulation-specific changes into account. This could resultin false positive-correlations, driven by main effects ofgroup on the (in) dependent variables. We provide proofthat metabolic function is indeed directly related to struc-tural integrity, surpassing existing correlational results.
TABLE IV. Regression analysis SUV of the precuneus, FA, and group (healthy vs. brain injured)
SUV FA R2 Beta95% confidence
interval Sum Sq Df F P-value
Precuneus Thalamo-precuneus 0.675FA 4.249 1.348 7.150 0.863 1 6.037 0.018 *Group 2.318 0.026 4.609 3.351 1 23.434 0.000 ***Interaction 24.503 210.047 1.041 0.383 1 2.676 0.109Residuals 6.434 45
Precuneus Frontal-precuneus 0.622FA 1.865 20.841 4.570 0.196 1 1.063 0.308Group 1.692 20.642 4.026 2.527 1 13.725 0.001 ***Interaction 23.018 28.928 2.893 0.194 1 1.056 0.309Residuals 8.468 46
Precuneus Precuneus-inferioparietal 0.720FA 2.618 1.245 3.990 2.465 1 16.571 0.000 ***Group 0.469 21.037 1.976 3.393 1 22.810 0.000 ***Interaction 20.148 24.068 3.772 0.001 1 0.006 0.940Residuals 6.843 46
Statistics and confidence interval of the regression models to predict SUV using FA of adjacent tracts and group (brain-injured patientsor healthy control subjects). * 5 P< 0.05, ** 5 P< 0.01, *** 5 P< 0.00.
TABLE V. Regression analysis SUV of the inferioparietal cortex FA, and group (healthy vs. brain injured)
SUV FA R2 Beta95% confidence
interval Sum Sq Df F P-value
Inferior parietal Thalamo-inferioparietal 0.683FA 5.278 2.989 7.567 2.562 1 20.321 0.000 ***Group 1.824 20.668 4.317 1.075 1 8.528 0.005 **Interaction 23.697 29.593 2.199 0.201 1 1.595 0.213Residuals 5.673 45
Inferior parietal frontal-inferioparietal 0.585FA 2.961 0.680 5.241 1.216 1 6.928 0.012 *Group 0.863 21.705 3.431 0.953 1 5.426 0.024 *Interaction 21.395 27.597 4.808 0.036 1 0.205 0.653Residuals 7.901 45
Inferior parietal Precuneus-inferioparietal 0.668FA 3.283 1.656 4.910 2.477 1 18.739 0.000 ***Group 0.502 21.020 2.023 1.400 1 10.591 0.002 **Interaction 20.552 24.525 3.421 0.010 1 0.078 0.781Residuals 5.949 45
Statistics and confidence interval of the regression models to predict SUV using FA of adjacent tracts and group (brain-injured patientsor healthy control subjects). * 5 P< 0.05, ** 5 P< 0.01, *** 5 P< 0.00.
r Annen & Heine et al. r
r 3716 r

Interestingly, we did not find a structure–function rela-tionship at the global brain level, suggesting that ourresults do not solely reflect general brain integrity. Instead,the function–structure relationship of the DMN might bedirectly related to consciousness. This has been shown insingle-modality studies, for example functional connectiv-ity [Vanhaudenhuyse et al., 2010b), white matter structuralintegrity [Fern�andez-Espejo et al., 2011, 2012; Gomez et al.,2012], and metabolic function [Thibaut et al., 2012]. Herewe show for the first time a direct function–structure rela-tionship within this network.
As expected, healthy control subjects showed FA andSUV within normal range and therefore we are unable tomake inferences about whether one drives the other. Nextwe investigated the function–structure relationship withinour patient population, comparing EMCS with DOCpatients (MCS and UWS). EMCS patients are able to useobjects and/or functionally communicate, and thus by def-inition conscious. Apart from one region-connection pair,all observed main effects of FA seen in the healthy vs.brain injured analysis were also observed in the analysisbetween the two patient populations, indicating that thereis a positive linear relation between functional and struc-tural integrity of the DMN. Furthermore, in contrast toDOC patients, EMCS patients show a significantly strongerfunction–structure interaction between the function of thethalamus and the structural integrity of the thalamo-inferiorparietal tract. On the uni-modal level our resultsmatch previous research in post-comatose patients findingthat structural cortico-thalamic connections are diminished[Lant et al., 2015] and thalamic metabolism is lowered[Fridman et al., 2014]. These findings can be explained by
the mesocircuit theory, which proposes that large-scaledysfunction is due to a global decrease of excitatory neu-rotransmission which in turn alters cerebral activity. Morespecifically, the globus pallidus is disinhibited and overac-tive, inhibiting the thalamic excitatory output to the frontalcortex [Schiff, 2010]. By combining both functional metabo-lism and white matter structural information we here pro-vide further evidence for the validity of this theory,supporting the hypothesis that thalamo-cortical connectiv-ity plays an important role in emergence of consciousness[Schiff, 2010]. We limited ourselves to the DMN because ofthe large body of literature on this brain-network relatingto consciousness. Therefore, future research should extendthese findings to more specific sub-cortical regions, suchas the globus pallidus or specific thalamic regions.
We do not find any difference between patients basedon aetiology, even though several studies have shown thattemporal dynamics of Wallerian degeneration vary givendifferent aetiologies [Kumar et al., 2009; Luyt et al., 2012]and that traumatic brain injury, unlike anoxia, might selec-tively affect DMN white matter integrity [Bonnelle et al.,2011; Warner et al., 2010]. Multicentre collaborationsshould provide sufficiently large datasets to study theseeffects in the future.
Methodologically, several comments can be addressedwhen dealing with brain-injured patients, especially con-cerning normalization, SUV, and tractography procedures.We here chose to perform a within-subject ROI labellingrather than applying a common atlas after spatial normal-ization as this latter procedure might results in a lack ofinter-subject anatomical correspondence in severelyinjured brains. As there is no consensus on the most
TABLE VI. Statistics and confidence interval of the regression models to predict SUV of the thalamus using FA of
adjacent tracts and group (DOC patients and patients who recovered from DOC)
SUV FA R2 Beta95% confidence
interval Sum Sq Df F P-value
Thalamus Thalamo-frontal 0.200FA 0.270 21.459 1.999 0.044 1 0.516 0.480Group 23.965 27.742 20.188 0.003 1 0.038 0.848Interaction 10.299 0.456 20.142 0.401 1 4.735 0.041 *Residuals 1.777 21
Thalamus Thalamo-inferiorparietal 0.333FA 20.282 22.243 1.679 0.028 1 0.394 0.537Group 23.891 26.512 21.270 0.002 1 0.023 0.882Interaction 9.986 3.252 16.720 0.685 1 9.567 0.006 **Residuals 1.431 20
Thalamus Thalamo-precuneus 0.296FA 0.852 21.356 3.060 0.118 1 1.607 0.219Group 26.133 211.053 21.212 0.000 1 0.000 0.999Interaction 16.134 3.197 29.071 0.497 1 6.767 0.017 *Residuals 1.468 20
aStatistics and confidence interval of the regression models to predict SUV using FA of adjacent tracts and group (brain-injured patientsor patients who recovered the ability to functionally communicate or use objects in a functionl manner). * 5 P< 0.05, ** 5 P< 0.01,*** 5 P< 0.00.
r Function-Structure Connectivity in DOC r
r 3717 r
reliable calculation of standard uptake value, weaccounted for the partial-volume effect [Rousset et al.,2007]. Tractography based on constrained spherical decon-volution is optimal with b-values of 2,500–3,000 s/mm2
[Tournier et al., 2013], but crossing fibres can still be morereliably modelled than with simple DTI-based modelsusing our lower b-value of 1,000 s/mm2 [e.g., see for effec-tive application: Roine et al., 2015]. Future studies shouldstrive to acquire diffusion-weighted images using isotropicvoxels, as anisotropic voxel sizes produce datasets in whichthe fibre orientation estimates depend on the position ofthe subject in the scanner. Anisotropic voxel sizes weremitigated in this study by linear interpolation of the fibreorientation distributions during the fibre tracking step.
CONCLUSION
We here assessed the function–structure relationshipwithin healthy, conscious subjects and severely brain dam-aged patients with varying levels of consciousness throughdirect combined investigation of function (FDG-PET), andstructure (MRI-DWI). Levels of structural integrity (FA)and metabolic function (standardized metabolic rates) aresignificantly diminished in patients compared with con-trols. Furthermore, a significant positive function–structurerelationship can be observed within most regions of theDMN. This relationship may be network-specific, as itdoes not appear at the whole-brain level. Finally, we showthat EMCS compared with DOC show a significantlystronger thalamo-cortical function–structure relationship,which is in line with the mesocircuit hypothesis.
REFERENCES
Boly M, Tshibanda L, Vanhaudenhuyse A, Noirhomme Q,
Schnakers C, Ledoux D, Boveroux P, Garweg C, Lambermont
B, Phillips C (2009): Functional connectivity in the default net-
work during resting state is preserved in a vegetative but not
in a brain dead patient. Hum Brain Mapp 30:2393–2400.Bonnelle V, Leech R, Kinnunen KM, Ham TE, Beckmann CF, De
Boissezon X, Greenwood RJ, Sharp DJ (2011): Default mode
network connectivity predicts sustained attention deficits after
traumatic brain injury. J Neurosci 31:13442–13451.Bozoki AC, Korolev IO, Davis NC, Hoisington LA, Berger KL
(2012): Disruption of limbic white matter pathways in mild
cognitive impairment and Alzheimer’s disease: A DTI/FDG-
PET Study. Hum Brain Mapp 33:1792–1802.Chandra PS, Salamon N, Huang J, Wu JY, Koh S, Vinters HV,
Mathern GW (2006): FDG-PET/MRI coregistration and
diffusion-tensor imaging distinguish epileptogenic tubers and
cortex in patients with tuberous sclerosis complex: A prelimi-
nary report. Epilepsia 47:1543–1549.De Volder AG, Bol A, Blin J, Robert A, Arno P, Grandin C,
Michel C, Veraart C (1997): Brain energy metabolism in early
blind subjects: Neural activity in the visual cortex. Brain Res
750:235–244.Demertzi A, G�omez F, Crone JS, Vanhaudenhuyse A, Tshibanda
L, Noirhomme Q, Thonnard M, Charland-Verville V, Kirsch
M, Laureys S, et al. (2014): Multiple fMRI system-level baselineconnectivity is disrupted in patients with consciousness altera-tions. Cortex 52:35–46. doi:10.1016/j.cortex.2013.11.005.
Desikan RS, S�egonne F, Fischl B, Quinn BT, Dickerson BC, BlackerD, Buckner RL, Dale AM, Maguire RP, Hyman BT, et al. (2006):An automated labeling system for subdividing the human cere-bral cortex on MRI scans into gyral based regions of interest.Neuroimage 31:968–980. doi:10.1016/j.neuroimage.2006.01.021.
Ennis DB, Kindlmann G (2006): Orthogonal tensor invariants andthe analysis of diffusion tensor magnetic resonance images.Magn Reson Med 55:136–146.
Fern�andez-Espejo D, Bekinschtein T, Monti MM, Pickard JD,Junque C, Coleman MR, Owen AM (2011): Diffusion weightedimaging distinguishes the vegetative state from the minimallyconscious state. Neuroimage 54:103–112.
Fern�andez-Espejo D, Soddu A, Cruse D, Palacios EM, Junque C,Vanhaudenhuyse A, Rivas E, Newcombe V, Menon DK,Pickard JD, et al. (2012): A role for the default mode network inthe bases of disorders of consciousness. Ann Neurol 72:335–343.
Fridman EA, Beattie BJ, Broft A, Laureys S, Schiff ND (2014):Regional cerebral metabolic patterns demonstrate the role ofanterior forebrain mesocircuit dysfunction in the severelyinjured brain. Proc Natl Acad Sci USA 111:6473–6478.
Gallichan D, Scholz J, Bartsch A, Behrens TE, Robson MD, MillerKL (2010): Addressing a systematic vibration artifact indiffusion-weighted MRI. Hum Brain Mapp 31:193–202.
Garyfallidis E, Brett M, Amirbekian B, Rokem A, van der Walt S,Descoteaux M, Nimmo-Smith I (2014): Dipy, a library for theanalysis of diffusion MRI data. Front Neuroinform 8:8.
Giacino JT, Ashwal S, Childs N, Cranford R, Jennett B, Katz DI,Kelly JP, Rosenberg JH, Whyte J, Zafonte RD, et al. (2002): Theminimally conscious state: Definition and diagnostic criteria.Neurology 58:349.
Giacino JT, Kalmar K, Whyte J (2004): The JFK Coma RecoveryScale-Revised: Measurement characteristics and diagnostic util-ity. Arch Phys Med Rehabil 85:2020–2029. doi:10.1016/j.apmr.2004.02.033.
G�omez F, Soddu A, Noirhomme Q, Vanhaudenhuyse A, TshibandaL, Lepor N (2012): DTI based structural damage characterizationfor disorders of consciousness.In: 2012 19th Ieee InternationalConference on Image Processing, 2:1257–1260.
Gorgolewski K, Burns CD, Madison C, Clark D, Halchenko YO,Waskom ML, Ghosh SS (2011): Nipype: A flexible, lightweightand extensible neuroimaging data processing framework inpython. Front Neuroinform 5:1–15.
Greicius MD, Supekar K, Menon V, Dougherty RF (2009): Resting-state functional connectivity reflects structural connectivity inthe default mode network. Cereb Cortex 19:72–78. doi:10.1093/cercor/bhn059.
Inoue K, Ito H, Uchida S, Taki Y, Kinomura S, Tsuji I, Sato S,Horie K, Kawashima R, Ito M, et al. (2008): Decrease in glu-cose metabolism in frontal cortex associated with deteriorationof microstructure of corpus callosum measured by diffusiontensor imaging in healthy elderly. Hum Brain Mapp 29:375–384. doi:10.1002/hbm.20394.
Jones DK, Horsfield MA, Simmons A (1999): Optimal strategiesfor measuring diffusion in anisotropic systems by magneticresonance imaging. Magn Reson Med 42:515–525.
Jeong JW, Tiwari VN, Shin J, Chugani HT, Juh�asz C (2015):Assessment of brain damage and plasticity in the visual sys-tem due to early occipital lesion: Comparison of FDG-PETwith diffusion MRI tractography. J Magn Reson Imaging 41:431–438.
r Annen & Heine et al. r
r 3718 r

Koay CG (2009): On the six-dimensional orthogonal tensor repre-
sentation of the rotation in three dimension: A simplifiedapproach. Mech Mater 41:951–953.
Kuczynski B, Targan E, Madison C, Weiner M, Zhang Y, Reed B,
Chui HC, Jagust W (2010): White matter integrity and corticalmetabolic associations in aging and dementia. Alzheimers
Dement 6:1–17. doi:10.1016/j.jalz.2009.04.1228.White.Kumar R, Husain M, Gupta RK, Hasan KM, Haris M, Agarwal
AK, Pandey CM, Narayana PA (2009): Serial changes in the
white matter diffusion tensor imaging metrics in moderate
traumatic brain injury and correlation with neuro-cognitive
function. J Neurotrauma 495:481–495.Lant ND, Gonzalez-Lara LE, Owen AM, Fern�andez-Espejo D
(2015): Relationship between the anterior forebrain mesocircuit
and the default mode network in the structural bases of disor-
ders of consciousness. NeuroImage Clin 10:27–35.Laureys S, Schiff ND (2012): Coma and consciousness: Paradigms
(re)framed by neuroimaging. Neuroimage 61:478–491.Laureys S, Goldman S, Phillips C, van Bogaert P, Aerts J, Luxen
A, Franck G, Maquet P (1999a): Impaired effective cortical con-
nectivity in vegetative state: Preliminary investigation using
PET. Neuroimage 9:377–382.Laureys S, Lemaire C, Maquet P, Phillips C, Franck G (1999b):
Cerebral metabolism during vegetative state and after recovery
to consciousness. J Neurol Neurosurg Psychiatry 67:121.Laureys S, Owen AM, Schiff ND (2004): Brain function in coma,
vegetative state, and related disorders. Lancet 3:537–546.Laureys S, Celesia GG, Cohadon F, Lavrijsen J, Leon-Carrrion J,
Sannita WG, Sazbon L, Schmutzhard E, von Wild KR, Zeman
A, et al. (2010): Unresponsive wakefulness syndrome: A new
name for the vegetative state or apallic syndrome. BMC Med
8:68.Leemans A, Jones DK (2009): The B-matrix must be rotated when
correcting for subject motion in DTI data. Magn Reson Med
61:1336–1349.Luyt CE, Galenaud D, Perlbarg V, Vanhaudenhuyse A, Stevens
RD, Gupta R, Besancenot H, Krainik A, Audibert G, Combes
A, et al. (2012): Diffusion tensor imaging to predict long-term
outcome after cardiac arrest. Anesthesiology 117:3–1.M€uller-G€artner HW, Links JM, Prince JL, Bryan RN, McVeigh E,
Leal JP, Davatzikos C, Frost JJ (1992): Measurement of radio-
tracer concentration in brain gray matter using positron emis-
sion tomography: MR-based correction for partial volume
effects. J Cereb Blood Flow Metab 12:571–583.Nakashima T, Nakayama N, Miwa K, Okumura A, Soeda A,
Iwama T (2007): Focal brain glucose hypometabolism in
patients with neuropsychologic deficits after diffuse axonalinjury. Am J Neuroradiol 28:236–242. [pii].
Nakayama N, Okumura A, Shinoda J, Nakashima T, Iwama T
(2006): Relationship between regional cerebral metabolism andconsciousness disturbance in traumatic diffuse brain injury
without large focal lesions: An FDG-PET study with statistical
parametric mapping analysis. J Neurol Neurosurg Psychiatry
77:856–862.Quarantelli M, Berkouk K, Prinster A, Landeau B, Svarer C,
Balkay L, Alfano B, Brunetti A, Baron JC, Salvatore M (2004):
Integrated software for the analysis of brain PET/SPECT stud-
ies with partial-volume-effect correction. J Nucl Med 45:
192–201.R core team (2014): R: A Language and Environment for Statistical
Computing. Vienna, Austria: Statistical Computing. URL:
https://www.R-project.org
Roine U, Salmi J, Roine T, Wendt TN, Lepp€am€aki S, Rintahaka P
(2015): Constrained spherical deconvolution-based tractogra-phy and tract-based spatial statistics show abnormal micro-
structural organization in Asperger syndrome. Mol Autism 6:4.Rousset O, Rahmim A, Alavi A, Zaidi H (2007): Partial volume
correction strategies in PET. PET Clin 2:235–249.Rudolf J, Ghaemi M, Haupt WF, Szelies B, Heiss WD (1999): Cere-
bral glucose metabolism in acute and persistent vegetativestate. J Neurosurg Anesthesiol 11:17–24.
Schiff NDN (2010): Recovery of consciousness after brain injury:
A mesocircuit hypothesis. Trends Neurosci 33:1–9.Smith SM, Jenkinson M, Woolrich MW, Beckmann CF, Behrens
TEJ, Johansen-Berg H, Bannister PR, De Luca M, Drobnjak I,
Flitney DE, et al. (2004): Advances in functional and structural
MR image analysis and implementation as FSL. Neuroimage23:208.
Soddu A, Vanhaudenhuyse A, Bahri MA, Bruno MA, Boly M,
Demertzi A, Tshibanda JF, Phillips C, Stanziano M,Ovadia-Caro S, et al. (2012): Identifying the default-mode com-
ponent in spatial IC analyses of patients with disorders of con-
sciousness. Hum Brain Mapp 33:778–796. doi:10.1002/
hbm.21249.Stender J, Gosseries O, Bruno MA, Charland-Verville V,
Vanhaudenhuyse A, Demertzi A, Chatelle C, Thonnard M,
Thibaut A, Heine L, et al. (2014a): Diagnostic precision of PET
imaging and functional MRI in disorders of consciousness: A
clinical validation study. Lancet 384:514–522.Stender J, Kupers R, Rodell A, Thibaut A, Chatelle C, Bruno MA,
Gejl M, Bernard C, Hustinx R, Laureys S, et al. (2014b): Quan-
titative rates of brain glucose metabolism distinguish mini-
mally conscious from vegetative state patients. J Cereb BloodFlow Metab 35:58.
Svarer C, Madsen K, Hasselbalch SG, Pinborg LH, Haugbøl S,
Frøkjær VG, Holm S, Paulson OB, Knudsen GM (2005): MR-basedautomatic delineation of volumes of interest in human brain PET
images using probability maps. Neuroimage 24:969–979.Thibaut A, Bruno M (2012): Metabolic activity in external and
internal awareness networks in severely brain-damaged
patients. J Rehabil Med 44:487–494.Thibaut A, Bruno MA, Chatelle C, Gosseries O, Vanhaudenhuyse
A, Demertzi A, Schnakers C, Thonnard M, Charland-VervilleV, Bernard C, et al. (2012): Metabolic activity in external and
internal awareness networks in severely brain-damaged
patients. J Rehabil Med 44:481–516.Tommasino C, Grana C, Lucignani G, Torri G, Fazio F (1995):
Regional cerebral metabolism of glucose in comatose and vege-
tative state patients. J Neurosurg Anesthesiol 7:109–116.Tournier JD, Calamante F, Connelly A (2012): MRtrix: Diffusion
tractography in crossing fiber regions. Int J Imaging Syst Tech-
nol 22:53–66.Tournier JD, Calamante F, Connelly A (2013): Determination of
the appropriate b value and number of gradient directions for
high-angular-resolution diffusion-weighted imaging. NMR
Biomed 26:1775–1786.Van Den Heuvel MP, Mandl RCW, Kahn RS, Hulshoff Pol HE
(2009): Functionally linked resting-state networks reflect the
underlying structural connectivity architecture of the human
brain. Hum Brain Mapp 30:3127–3141.Vanhaudenhuyse A, Demertzi A, Schabus M, Noirhomme Q,
Bredart S, Boly M, Phillips C, Soddu A, Luxen A, Moonen G
(2010a): Two distinct neuronal networks mediate the aware-
ness of environment and of self. J Cogn Neurosci 23:570–578.
r Function-Structure Connectivity in DOC r
r 3719 r

Vanhaudenhuyse A, Noirhomme Q, Tshibanda LJF, Bruno MA,Boveroux P, Schnakers C, Soddu A, Perlbarg V, Ledoux D,Brichant JF (2010b): Default network connectivity reflects thelevel of consciousness in non-communicative brain-damagedpatients. Brain 133:161–171.
Warner MA, Youn TS, Davis T, Chandra A, Marquez de la PlataC, Moore C, Harper C, Madden CJ, Spence J, McColl R, et al.(2010): Regionally selective atrophy after traumatic axonalinjury. Arch Neurol 67:1336–1344.
Yakushev I, Schreckenberger M, M€uller MJ, Schermuly I,Cumming P, Stoeter P, Gerhard A, Fellgiebel A (2011): Func-tional anatomy of interhemispheric cortical connections in thehuman brain. Eur. J Nucl Med Mol Imaging 38:2219–2227.
Yakushev I, Ch�etelat G, Fischer FU, Landeau B, Bastin C,Scheurich A, Perrotin A, Bahri MA, Drzezga A, Eustache F,et al. (2013): Metabolic and structural connectivity within thedefault mode network relates to working memory performancein young healthy adults. Neuroimage 79:184–190.
r Annen & Heine et al. r
r 3720 r
Related Documents