Functional Overlap and Regulatory Links Shape Genetic Interactions between Signaling Pathways Sake van Wageningen, 1,5 Patrick Kemmeren, 1,5 Philip Lijnzaad, 1,4 Thanasis Margaritis, 1 Joris J. Benschop, 1 Ine ˆ s J. de Castro, 1 Dik van Leenen, 1 Marian J.A. Groot Koerkamp, 1 Cheuk W. Ko, 1 Antony J. Miles, 1 Nathalie Brabers, 1 Mariel O. Brok, 1 Tineke L. Lenstra, 1 Dorothea Fiedler, 2 Like Fokkens, 3 Rodrigo Aldecoa, 1 Eva Apweiler, 1 Virginia Taliadouros, 1 Katrin Sameith, 1 Loes A.L. van de Pasch, 1 Sander R. van Hooff, 1 Linda V. Bakker, 1,4 Nevan J. Krogan, 2 Berend Snel, 3 and Frank C.P. Holstege 1, * 1 Molecular Cancer Research, University Medical Centre Utrecht, Universiteitsweg 100, Utrecht, The Netherlands 2 Department of Cellular and Molecular Pharmacology, University of California, San Francisco, San Francisco, CA 94158, USA 3 Theoretical Biology and Bioinformatics, Department of Biology, Science Faculty, Utrecht University, Padualaan 8, 3584 CH Utrecht, The Netherlands 4 Netherlands Bioinformatics Centre, Geert Grooteplein 28, 6525 GA, Nijmegen, The Netherlands 5 These authors contributed equally to this work *Correspondence: [email protected] DOI 10.1016/j.cell.2010.11.021 SUMMARY To understand relationships between phosphoryla- tion-based signaling pathways, we analyzed 150 deletion mutants of protein kinases and phospha- tases in S. cerevisiae using DNA microarrays. Down- stream changes in gene expression were treated as a phenotypic readout. Double mutants with synthetic genetic interactions were included to investigate genetic buffering relationships such as redundancy. Three types of genetic buffering relationships are identified: mixed epistasis, complete redundancy, and quantitative redundancy. In mixed epistasis, the most common buffering relationship, different gene sets respond in different epistatic ways. Mixed epistasis arises from pairs of regulators that have only partial overlap in function and that are coupled by additional regulatory links such as repression of one by the other. Such regulatory modules confer the ability to control different combinations of pro- cesses depending on condition or context. These properties likely contribute to the evolutionary main- tenance of paralogs and indicate a way in which signaling pathways connect for multiprocess control. INTRODUCTION Protein kinases and protein phosphatases are key components of regulatory pathways, many of which have been studied in detail. This has revealed the pleiotropic role of signaling in cellular regulation, its involvement in disease and how pathway architecture underlies mechanistic aspects such as specificity. Understanding the complexity of cellular regulation also requires in depth knowledge about the ways in which different pathways work together. Due to the extensive role of signaling, perturbation of different pathways leads to diverse phenotypes. Different pathways have therefore often been studied in isolation, frequently using different readouts for different pathways and thereby confound- ing systematic comparisons of pathways. This can be overcome by using a single assay that is detailed enough to reveal differ- ences and at the same time comprehensive enough to reveal the workings of many different pathways simultaneously. Pheno- types are often accompanied by changes in gene expression and genome-wide mRNA expression profiling can reveal rela- tionships between pathway components (Capaldi et al., 2008; Roberts et al., 2000). Here, we have applied expression profile phenotypes to systematically investigate relationships between many different signaling pathways that are simultaneously active under a single growth condition in the yeast Saccharomyces cerevisiae. Analysis of pathway activity using mutants also requires buff- ering interactions between genes to be considered. Genetic buffering results in masking of the phenotypic consequences of mutations (Hartman et al., 2001). The best appreciated buff- ering relationship is redundancy, often defined as genes that can compensate for each other’s loss by their ability to share and takeover the exact same function. Redundancy is frequently associated with paralogs that are more likely to share an identical biochemical function (Prince and Pickett, 2002). Nonhomolo- gous genes are less likely to share function but can still exhibit genetic buffering in the form of growth-rate compensation. The relative contribution of paralogs versus nonhomologs toward buffering is under debate (Gu et al., 2003; Ihmels et al., 2007; Papp et al., 2004; Wagner, 2000), but systematic analysis of synthetic genetic interactions (SGIs) is revealing extensive buffering between nonhomologs (Costanzo et al., 2010). How nonhomologous pairs compensate for loss of each other’s Cell 143, 991–1004, December 10, 2010 ª2010 Elsevier Inc. 991

Welcome message from author
This document is posted to help you gain knowledge. Please leave a comment to let me know what you think about it! Share it to your friends and learn new things together.
Transcript

Functional Overlap and Regulatory LinksShape Genetic Interactionsbetween Signaling PathwaysSake van Wageningen,1,5 Patrick Kemmeren,1,5 Philip Lijnzaad,1,4 Thanasis Margaritis,1 Joris J. Benschop,1
Ines J. de Castro,1 Dik van Leenen,1 Marian J.A. Groot Koerkamp,1 Cheuk W. Ko,1 Antony J. Miles,1 Nathalie Brabers,1
Mariel O. Brok,1 Tineke L. Lenstra,1 Dorothea Fiedler,2 Like Fokkens,3 Rodrigo Aldecoa,1 Eva Apweiler,1
Virginia Taliadouros,1 Katrin Sameith,1 Loes A.L. van de Pasch,1 Sander R. van Hooff,1 Linda V. Bakker,1,4
Nevan J. Krogan,2 Berend Snel,3 and Frank C.P. Holstege1,*1Molecular Cancer Research, University Medical Centre Utrecht, Universiteitsweg 100, Utrecht, The Netherlands2Department of Cellular and Molecular Pharmacology, University of California, San Francisco, San Francisco, CA 94158, USA3Theoretical Biology and Bioinformatics, Department of Biology, Science Faculty, Utrecht University, Padualaan 8,3584 CH Utrecht, The Netherlands4Netherlands Bioinformatics Centre, Geert Grooteplein 28, 6525 GA, Nijmegen, The Netherlands5These authors contributed equally to this work
*Correspondence: [email protected] 10.1016/j.cell.2010.11.021
SUMMARY
To understand relationships between phosphoryla-tion-based signaling pathways, we analyzed 150deletion mutants of protein kinases and phospha-tases in S. cerevisiae using DNA microarrays. Down-stream changes in gene expression were treated asa phenotypic readout. Double mutants with syntheticgenetic interactions were included to investigategenetic buffering relationships such as redundancy.Three types of genetic buffering relationships areidentified: mixed epistasis, complete redundancy,and quantitative redundancy. In mixed epistasis,the most common buffering relationship, differentgene sets respond in different epistatic ways. Mixedepistasis arises from pairs of regulators that haveonly partial overlap in function and that are coupledby additional regulatory links such as repression ofone by the other. Such regulatory modules conferthe ability to control different combinations of pro-cesses depending on condition or context. Theseproperties likely contribute to the evolutionary main-tenance of paralogs and indicate a way in whichsignaling pathways connect formultiprocess control.
INTRODUCTION
Protein kinases and protein phosphatases are key components
of regulatory pathways, many of which have been studied in
detail. This has revealed the pleiotropic role of signaling in
cellular regulation, its involvement in disease and how pathway
architecture underlies mechanistic aspects such as specificity.
Understanding the complexity of cellular regulation also requires
in depth knowledge about the ways in which different pathways
work together.
Due to the extensive role of signaling, perturbation of different
pathways leads to diverse phenotypes. Different pathways have
therefore often been studied in isolation, frequently using
different readouts for different pathways and thereby confound-
ing systematic comparisons of pathways. This can be overcome
by using a single assay that is detailed enough to reveal differ-
ences and at the same time comprehensive enough to reveal
the workings of many different pathways simultaneously. Pheno-
types are often accompanied by changes in gene expression
and genome-wide mRNA expression profiling can reveal rela-
tionships between pathway components (Capaldi et al., 2008;
Roberts et al., 2000). Here, we have applied expression profile
phenotypes to systematically investigate relationships between
many different signaling pathways that are simultaneously active
under a single growth condition in the yeast Saccharomyces
cerevisiae.
Analysis of pathway activity using mutants also requires buff-
ering interactions between genes to be considered. Genetic
buffering results in masking of the phenotypic consequences
of mutations (Hartman et al., 2001). The best appreciated buff-
ering relationship is redundancy, often defined as genes that
can compensate for each other’s loss by their ability to share
and takeover the exact same function. Redundancy is frequently
associatedwith paralogs that aremore likely to share an identical
biochemical function (Prince and Pickett, 2002). Nonhomolo-
gous genes are less likely to share function but can still exhibit
genetic buffering in the form of growth-rate compensation. The
relative contribution of paralogs versus nonhomologs toward
buffering is under debate (Gu et al., 2003; Ihmels et al., 2007;
Papp et al., 2004; Wagner, 2000), but systematic analysis of
synthetic genetic interactions (SGIs) is revealing extensive
buffering between nonhomologs (Costanzo et al., 2010). How
nonhomologous pairs compensate for loss of each other’s
Cell 143, 991–1004, December 10, 2010 ª2010 Elsevier Inc. 991
function is not well understood and the molecular mechanisms
behind such genetic relationships are relatively uncharacterized.
Also enigmatic is the question of why paralogs are stably
maintained during evolution, often remaining redundant, despite
evolutionary pressure against seemingly superfluous copies
(Dean et al., 2008; Vavouri et al., 2008). Resolving these
questions likely requires more detailed characterization of the
mechanisms that underlie buffering interactions, including
redundancy.
The yeast Saccharomyces cerevisiae has 141 genes encoding
protein kinases and 38 genes encoding protein phosphatases.
Here, kinase and phosphatase function is systematically com-
pared by generating DNA microarray expression profiles for all
150 viable protein kinase and phosphatase knockout strains
under a single growth condition. To take buffering interactions
into account, SGI data is exploited by profiling double mutants
that show greater than expected fitness reduction (Fiedler
et al., 2009). This provides a detailed and systematic character-
ization of different genetic buffering relationships. The molecular
mechanisms of each type are studied in detail, including analysis
of a phosphatase that buffers kinase deletions. An important
outcome is identification of a recurrent regulatory module for
signaling pathways. This module consists of pairs of regulators
that have partial overlap in function and that are also linked by
additional regulatory relationships such as repression or inhibi-
tion of one partner by the other. The module offers insight into
how signaling pathways may regulate different combinations of
processes in a flexible yet coordinate manner and plausibly
explains why apparently redundant components of regulatory
pathways are maintained during evolution.
RESULTS
Expression Profiles of Kinase and Phosphatase GeneDeletionsTo compare signaling pathways, DNA microarray gene expres-
sion profiles were generated for all 150 viable protein kinase/
phosphatase deletions in S. cerevisiae under a single growth
condition (synthetic complete medium with 2% glucose). Each
mutant was profiled four times, from two independent cultures
on dual-channel microarrays using a batch of wild-type (WT)
RNA as common reference. To further control for technical and
biological variation, additional WT cultures were grown along-
side sets of mutants on each day. These ‘‘same-day’’ WTs
were processed in parallel to the mutants, all using automated,
robotic procedures. Comparison of the many WT profiles yields
insight into the expression variation of each gene. Statistical
modeling results in an average profile for each mutant, consist-
ing of p values and changes in mRNA expression for each
gene, relative to the expression in the 200 WT cultures (Experi-
mental Procedures). Throughout the manuscript ‘‘significant’’
indicates statistically significant. A p value of 0.05, in combina-
tion with a fold change (FC) of 1.7, is applied as a threshold for
calling a change in mRNA expression significant. Aneuploidy,
incorrect deletions, and spurious mutations were identified in
11% of the mutant strains (Experimental Procedures). These
strains were remade and reprofiled.
992 Cell 143, 991–1004, December 10, 2010 ª2010 Elsevier Inc.
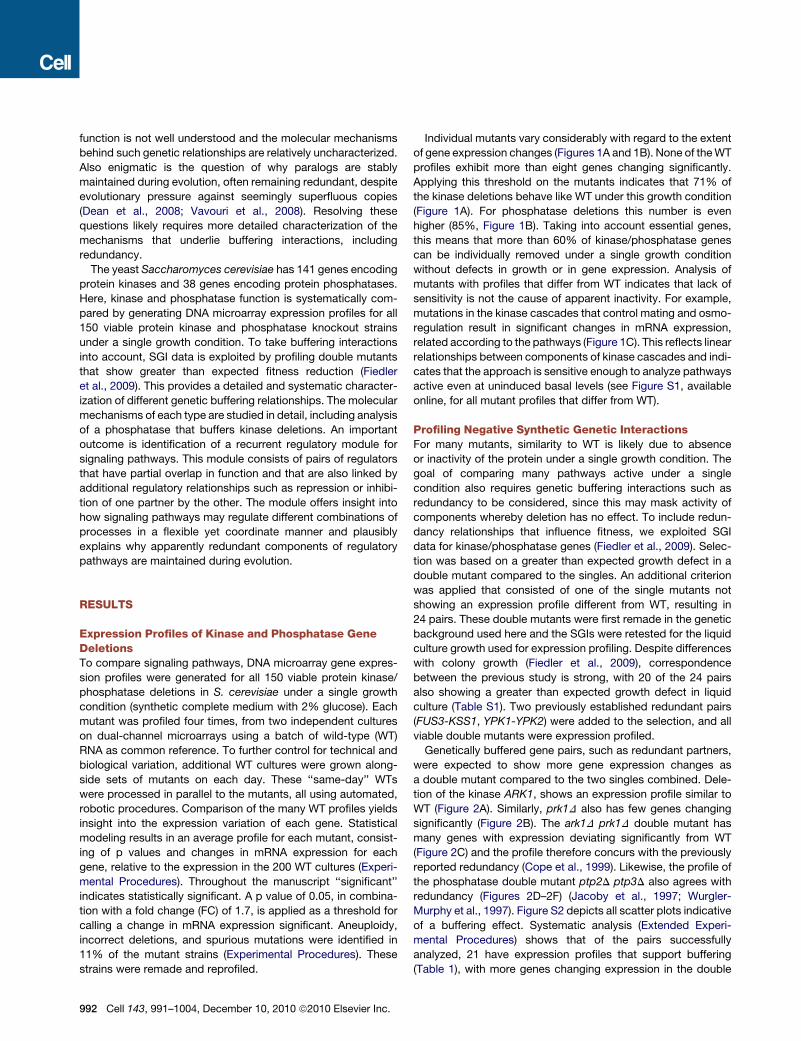
Individual mutants vary considerably with regard to the extent
of gene expression changes (Figures 1A and 1B). None of theWT
profiles exhibit more than eight genes changing significantly.
Applying this threshold on the mutants indicates that 71% of
the kinase deletions behave like WT under this growth condition
(Figure 1A). For phosphatase deletions this number is even
higher (85%, Figure 1B). Taking into account essential genes,
this means that more than 60% of kinase/phosphatase genes
can be individually removed under a single growth condition
without defects in growth or in gene expression. Analysis of
mutants with profiles that differ from WT indicates that lack of
sensitivity is not the cause of apparent inactivity. For example,
mutations in the kinase cascades that control mating and osmo-
regulation result in significant changes in mRNA expression,
related according to the pathways (Figure 1C). This reflects linear
relationships between components of kinase cascades and indi-
cates that the approach is sensitive enough to analyze pathways
active even at uninduced basal levels (see Figure S1, available
online, for all mutant profiles that differ from WT).
Profiling Negative Synthetic Genetic InteractionsFor many mutants, similarity to WT is likely due to absence
or inactivity of the protein under a single growth condition. The
goal of comparing many pathways active under a single
condition also requires genetic buffering interactions such as
redundancy to be considered, since this may mask activity of
components whereby deletion has no effect. To include redun-
dancy relationships that influence fitness, we exploited SGI
data for kinase/phosphatase genes (Fiedler et al., 2009). Selec-
tion was based on a greater than expected growth defect in a
double mutant compared to the singles. An additional criterion
was applied that consisted of one of the single mutants not
showing an expression profile different from WT, resulting in
24 pairs. These double mutants were first remade in the genetic
background used here and the SGIs were retested for the liquid
culture growth used for expression profiling. Despite differences
with colony growth (Fiedler et al., 2009), correspondence
between the previous study is strong, with 20 of the 24 pairs
also showing a greater than expected growth defect in liquid
culture (Table S1). Two previously established redundant pairs
(FUS3-KSS1, YPK1-YPK2) were added to the selection, and all
viable double mutants were expression profiled.
Genetically buffered gene pairs, such as redundant partners,
were expected to show more gene expression changes as
a double mutant compared to the two singles combined. Dele-
tion of the kinase ARK1, shows an expression profile similar to
WT (Figure 2A). Similarly, prk1D also has few genes changing
significantly (Figure 2B). The ark1D prk1D double mutant has
many genes with expression deviating significantly from WT
(Figure 2C) and the profile therefore concurs with the previously
reported redundancy (Cope et al., 1999). Likewise, the profile of
the phosphatase double mutant ptp2D ptp3D also agrees with
redundancy (Figures 2D–2F) (Jacoby et al., 1997; Wurgler-
Murphy et al., 1997). Figure S2 depicts all scatter plots indicative
of a buffering effect. Systematic analysis (Extended Experi-
mental Procedures) shows that of the pairs successfully
analyzed, 21 have expression profiles that support buffering
(Table 1), with more genes changing expression in the double

-2.5 2.50
Fold change
hog1Δ
ssk2Δpbs2Δ
fus3Δ kss1Δ
ste11Δste7Δ
ste20Δ
−4−2
ctk1
Δss
n3Δ
vps1
5Δyp
k1Δ
pho8
5Δck
a2Δ
fus3
Δm
ck1Δ
ste7
Δst
e11Δ
elm
1Δdu
n1Δ
kin3
Δfa
b1Δ
pbs2
Δst
e20Δ
hog1
Δss
k2Δ
yck3
Δsk
y1Δ
snf1
Δire
1Δks
p1Δ
tpk2
Δcl
a4Δ
ptk2
Δrim
15Δ
chk1
Δck
a1Δ
cmk2
Δbc
k1Δ
rim11
Δsa
t4Δ
ssk2
2Δtp
k3Δ
cmk1
Δlc
b5Δ
slt2
Δte
l1Δ
ygk3
Δkk
q8Δ
kss1
Δnp
r1Δ
tor1
Δfp
k1Δ
ark1
Δfm
p48Δ
kin8
2Δpr
r2Δ
ptk1
Δsk
m1 Δ
ybr0
28cΔ
ykl1
61cΔ
ypl1
41cΔ
ypl1
50w
Δis
r1Δ
abc1
Δha
l5Δ
hsl1
Δki
n1Δ
kns1
Δm
kk2Δ
prr1
Δps
k1Δ
swe1
Δtp
k1Δ
vhs1
Δya
k1Δ
yck1
Δyp
k2Δ
atg1
Δck
i1Δ
gcn2
Δhr
k1Δ
iks1
Δm
ek1Δ
mrk
1Δpk
h1Δ
prk1
Δsc
y1Δ
sks1
Δsp
s1Δ
twf1
Δyk
l171
wΔ
akl1
Δal
k1Δ
alk2
Δdb
f20Δ
eki1
Δgi
n4Δ
ime2
Δkc
c4Δ
kin2
Δki
n4Δ
lcb4
Δm
kk1Δ
pkh3
Δps
k2Δ
rck1
Δrc
k2Δ
sak1
Δsm
k1Δ
tos3
Δyc
k2Δ
ydl0
25cΔ
pkp2
Δpk
p1Δ
ylr2
53w
Δtd
a1Δ
ypl1
09cΔ
env7
Δ
02
4
A
M (
log 2(
mt/w
t))
B
ptc
1Δ
sit4
Δyvh1
Δoca1
Δsiw
14
Δm
sg5
Δpph3
Δm
ih1
Δptc
3Δ
ptc
4Δ
ptp
3Δ
oca2
Δppg1
Δppt1
Δppz1
Δpsr1
Δppq1
Δptc
7Δ
nem
1Δ
psr2
Δptc
2Δ
cna1
Δ
pph21
Δpph22
Δppz2
Δptc
5Δ
ych1
Δcm
p2
Δpps1
Δptp
1Δ
ptp
2Δ
sdp1
Δ
−4−2
02
4M
(lo
g 2(m
t/wt)
)
ltp1
Δ
YD
L158
C
ST
E7
TIP
1 F
IG1
PR
M6
YH
R21
4W
FR
E7
YG
R10
9W-A
Y
GR
109W
-B
YIL
080W
Y
PR
158W
-A
YM
R04
6C
YD
R26
1W-B
Y
BL1
07W
-A
FU
S1
MA
TA
LPH
A1
YP
R15
8C-D
Y
DR
098C
-B
YE
R13
8W-A
Y
DR
261C
-D
DA
D4
YG
R16
1C-D
Y
AR
009C
K
AR
4 Y
LR40
0W
YM
R15
8C-A
Y
DR
379C
-A
YD
R38
1C-A
R
NA
14
AG
A1
YD
R21
0C-D
Y
CL0
21W
-A
CT
R3
SR
D1
ND
J1
MF
(ALP
HA
)2
SA
G1
TE
C1
ST
E12
S
TE
3 S
ST
2 P
RM
5 Y
LR04
0C
MS
B2
GP
A1
FA
R1
MF
(ALP
HA
)1
YLR
042C
S
NR
10
ST
E11
SP
I1
PR
Y2
DD
R48
Y
MR
173W
-A
FU
S3
KS
S1
GP
H1
GS
Y2
ALD
4 L
SP
1
ST
E20
YC
R01
3C
YD
L228
C
PH
O12
P
HM
6 V
TC
4 V
TC
1 C
OS
12
YIL
169C
H
PF
1 Z
RT
1 Y
CR
102C
Y
LR46
0C
AQ
Y2
YLL
053C
Y
HB
1 F
IT3
YJL
127W
-A
BD
H2
CT
T1
NC
A3
ST
F2
PG
M2
YG
P1
CH
A1
FM
P48
H
OR
2 R
HR
2 H
XT
1 H
XT
8 G
RE
2 P
YC
1 Y
JL10
7C
PR
M10
S
ED
1 C
WP
1 P
NS
1
HO
G1
PB
S2
SS
K2
1
2
3
4
5
67
C
Figure 1. Expression Profiles of Kinase/Phosphatase Single Gene Deletions
(A and B) Activity profiles of all deletion strains, ranked as box-whisker plots for kinases (A) and phosphatases (B), showing fold changes (vertical axis), with
significantly changing genes (p < 0.05, FC > 1.7) as red dots and unresponsive genes as black dots. Green triangles indicate the doubling time of each mutant
(-log2 relative toWT). Dashed gray lines indicate 1.7-fold change. The solid gray line is the threshold for distinguishing deletions with significant profiles (R8 genes
changing) versus deletions that behave similarly toWT (<8 genes changing). This threshold is based on themaximum number of changes observed in the 200WT
profiles, excluding the WT variable genes (Experimental Procedures).
(C) Lanes 1–7 are expression profiles of strains indicated to the right. All genes with significantly changed expression in any single mutant (p < 0.05, FC > 1.7) are
depicted, with gene names on top. STE20, STE11, STE7 and FUS3 are the MAPK components of the mating pheromone response pathway. FUS3 is redundant
with KSS1 and the profile of the double mutant is therefore shown in lane 4. Profiles of the single mutants are depicted in Figure 4C. SSK2, PBS2 and HOG1 are
MAPK components of the HOGpathway. The opposite effects of the HOGpathway on some of the genes affected by themating pathway agreeswith inhibition of
the mating pathway by the HOG pathway (Chen and Thorner, 2007).
See also Figure S1.
mutant versus the two single mutants combined. This includes
all the pairs that showed a negative SGI in liquid culture
(Table S1).
Redundancy involves overlap of function and is often associ-
ated with paralogs. Phylogenetic analysis reveals that less than
one third of the buffering relationships observed here are derived
from close paralogs, that is from duplication events that
occurred less than approximately 600 million years ago (Table 1,
Figure S3, Extended Experimental Procedures). More than half
of the interactions are between pairs that arose from ancient
duplications (an estimated 2 billion years ago) or between non-
homologs, in five cases even between kinase-phosphatase
pairs. Buffering between nonhomologs has been noted before
(Gu et al., 2003; Ihmels et al., 2007; Papp et al., 2004; Wagner,
2000), but the underlyingmechanisms are often not investigated.
Therefore, we selected an example for further analysis, focusing
on the intriguing buffering between kinases and phosphatases.
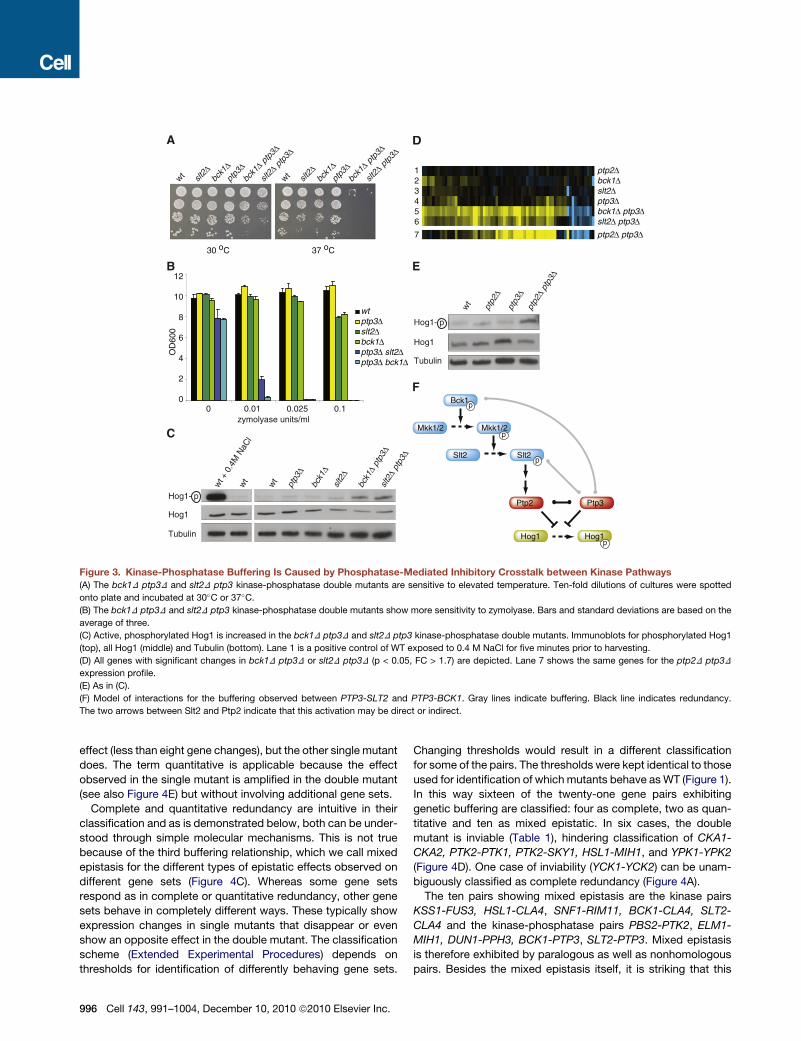
Buffering between a Kinase and Phosphatase Is dueto Phosphatase-Mediated Inhibitory Crosstalkbetween Kinase PathwaysBck1 and Slt2 are mitogen-activated protein kinase (MAPK)
components of the cell-wall integrity (CWI) pathway (Chen and
Thorner, 2007). Both kinases show buffering with the phospha-
tase PTP3, likely reflecting the fact that both kinases belong to
the same MAPK cascade (Figures 2G–2K). In both kinase-phos-
phatase double mutants the same genes change (Figure 2L).
Ptp3 dephosphorylates Hog1, resulting in inactivation of Hog1
(Jacoby et al., 1997). Most of the bck1D ptp3D and slt2D
ptp3D double deletion profiles consist of upregulated genes
(Figures 2J and 2K). This includes established Hog1 downstream
target genes (Rodrıguez-Pena et al., 2005), indicating that buff-
ering may be related to defective inhibition of Hog1. To test
this, the double deletion strains were first assayed for pheno-
types associated with increased Hog1 activity such as elevated
Cell 143, 991–1004, December 10, 2010 ª2010 Elsevier Inc. 993

Figure 2. Expression Profiles of Genetically Buffered Pairs
(A–K) Single and double deletion gene expression scatter plots of four genetically buffered pairs. In each scatter plot the normalized, dye-bias corrected and
statistically modeled fluorescent intensity value is plotted for each gene. For each mutant this is the average of four measurements. For WT this is the average
of 200 cultures grown throughout the project. Genes with significant increase or decrease in mRNA expression (p < 0.05, FC > 1.7) are represented by yellow and
blue dots respectively. Gray dots are all other genes.
(L) Scatter plot of all genes that have a significant change in mRNA expression in either bck1D ptp3D (J), slt2D ptp3D (K) or in both double mutants. The log2 FC is
plotted for each of these genes in both double deletions, showing that the same mRNAs are changing in both strains.
See also Figure S2.
994 Cell 143, 991–1004, December 10, 2010 ª2010 Elsevier Inc.
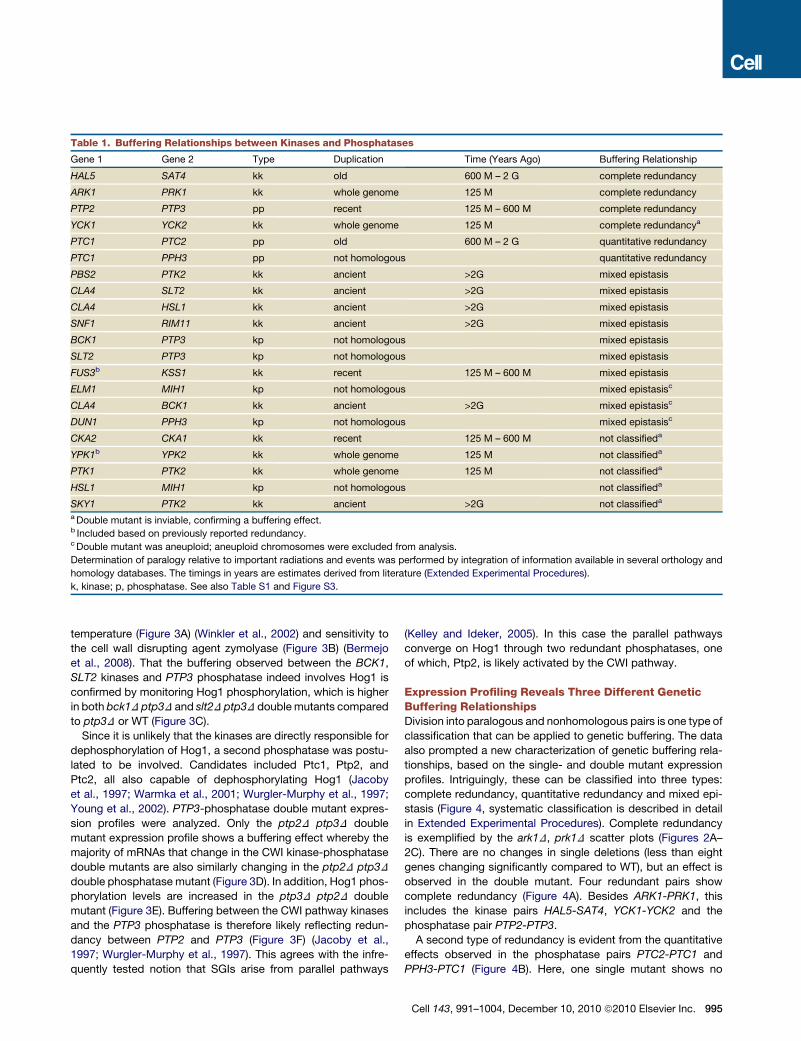
Table 1. Buffering Relationships between Kinases and Phosphatases
Gene 1 Gene 2 Type Duplication Time (Years Ago) Buffering Relationship
HAL5 SAT4 kk old 600 M – 2 G complete redundancy
ARK1 PRK1 kk whole genome 125 M complete redundancy
PTP2 PTP3 pp recent 125 M – 600 M complete redundancy
YCK1 YCK2 kk whole genome 125 M complete redundancya
PTC1 PTC2 pp old 600 M – 2 G quantitative redundancy
PTC1 PPH3 pp not homologous quantitative redundancy
PBS2 PTK2 kk ancient >2G mixed epistasis
CLA4 SLT2 kk ancient >2G mixed epistasis
CLA4 HSL1 kk ancient >2G mixed epistasis
SNF1 RIM11 kk ancient >2G mixed epistasis
BCK1 PTP3 kp not homologous mixed epistasis
SLT2 PTP3 kp not homologous mixed epistasis
FUS3b KSS1 kk recent 125 M – 600 M mixed epistasis
ELM1 MIH1 kp not homologous mixed epistasisc
CLA4 BCK1 kk ancient >2G mixed epistasisc
DUN1 PPH3 kp not homologous mixed epistasisc
CKA2 CKA1 kk recent 125 M – 600 M not classifieda
YPK1b YPK2 kk whole genome 125 M not classifieda
PTK1 PTK2 kk whole genome 125 M not classifieda
HSL1 MIH1 kp not homologous not classifieda
SKY1 PTK2 kk ancient >2G not classifieda
aDouble mutant is inviable, confirming a buffering effect.b Included based on previously reported redundancy.cDouble mutant was aneuploid; aneuploid chromosomes were excluded from analysis.
Determination of paralogy relative to important radiations and events was performed by integration of information available in several orthology and
homology databases. The timings in years are estimates derived from literature (Extended Experimental Procedures).
k, kinase; p, phosphatase. See also Table S1 and Figure S3.
temperature (Figure 3A) (Winkler et al., 2002) and sensitivity to
the cell wall disrupting agent zymolyase (Figure 3B) (Bermejo
et al., 2008). That the buffering observed between the BCK1,
SLT2 kinases and PTP3 phosphatase indeed involves Hog1 is
confirmed by monitoring Hog1 phosphorylation, which is higher
in both bck1D ptp3D and slt2D ptp3D doublemutants compared
to ptp3D or WT (Figure 3C).
Since it is unlikely that the kinases are directly responsible for
dephosphorylation of Hog1, a second phosphatase was postu-
lated to be involved. Candidates included Ptc1, Ptp2, and
Ptc2, all also capable of dephosphorylating Hog1 (Jacoby
et al., 1997; Warmka et al., 2001; Wurgler-Murphy et al., 1997;
Young et al., 2002). PTP3-phosphatase double mutant expres-
sion profiles were analyzed. Only the ptp2D ptp3D double
mutant expression profile shows a buffering effect whereby the
majority of mRNAs that change in the CWI kinase-phosphatase
double mutants are also similarly changing in the ptp2D ptp3D
double phosphatase mutant (Figure 3D). In addition, Hog1 phos-
phorylation levels are increased in the ptp3D ptp2D double
mutant (Figure 3E). Buffering between the CWI pathway kinases
and the PTP3 phosphatase is therefore likely reflecting redun-
dancy between PTP2 and PTP3 (Figure 3F) (Jacoby et al.,
1997; Wurgler-Murphy et al., 1997). This agrees with the infre-
quently tested notion that SGIs arise from parallel pathways
(Kelley and Ideker, 2005). In this case the parallel pathways
converge on Hog1 through two redundant phosphatases, one
of which, Ptp2, is likely activated by the CWI pathway.
Expression Profiling Reveals Three Different GeneticBuffering RelationshipsDivision into paralogous and nonhomologous pairs is one type of
classification that can be applied to genetic buffering. The data
also prompted a new characterization of genetic buffering rela-
tionships, based on the single- and double mutant expression
profiles. Intriguingly, these can be classified into three types:
complete redundancy, quantitative redundancy and mixed epi-
stasis (Figure 4, systematic classification is described in detail
in Extended Experimental Procedures). Complete redundancy
is exemplified by the ark1D, prk1D scatter plots (Figures 2A–
2C). There are no changes in single deletions (less than eight
genes changing significantly compared to WT), but an effect is
observed in the double mutant. Four redundant pairs show
complete redundancy (Figure 4A). Besides ARK1-PRK1, this
includes the kinase pairs HAL5-SAT4, YCK1-YCK2 and the
phosphatase pair PTP2-PTP3.
A second type of redundancy is evident from the quantitative
effects observed in the phosphatase pairs PTC2-PTC1 and
PPH3-PTC1 (Figure 4B). Here, one single mutant shows no
Cell 143, 991–1004, December 10, 2010 ª2010 Elsevier Inc. 995
D
wt slt2Δ
bck1
Δpt
p3Δbc
k1Δ p
tp3Δ
slt2Δ p
tp3Δ
wt slt2Δ
bck1
Δpt
p3Δbc
k1Δ p
tp3Δ
slt2Δ p
tp3Δ
30 oC 37 oC
A
zymolyase units/ml
OD
600
B
C
F
E
Bck1
Mkk1/2 Mkk1/2
Slt2 Slt2
Hog1Hog1
Ptp2 Ptp3
wt +
0.4
M N
aCl
wt
ptp3
Δ
bck1
Δsl
t2Δ
bck1
Δ pt
p3Δ
slt2
Δ pt
p3Δ
wt
ptp3
Δ
ptp2
Δ
ptp2
Δ pt
p3Δ
wt
ptp2Δbck1Δslt2Δptp3Δbck1Δ ptp3Δslt2Δ ptp3Δptp2Δ ptp3Δ
wtptp3Δslt2Δbck1Δptp3Δ slt2Δptp3Δ bck1Δ
0 0.01 0.025 0.1
12
10
8
6
4
2
0
Hog1- p
Hog1
Tubulin
Hog1- p
Hog1
Tubulin
123456
7
p
p
p
p
Figure 3. Kinase-Phosphatase Buffering Is Caused by Phosphatase-Mediated Inhibitory Crosstalk between Kinase Pathways
(A) The bck1D ptp3D and slt2D ptp3 kinase-phosphatase double mutants are sensitive to elevated temperature. Ten-fold dilutions of cultures were spotted
onto plate and incubated at 30�C or 37�C.(B) The bck1D ptp3D and slt2D ptp3 kinase-phosphatase double mutants show more sensitivity to zymolyase. Bars and standard deviations are based on the
average of three.
(C) Active, phosphorylated Hog1 is increased in the bck1D ptp3D and slt2D ptp3 kinase-phosphatase double mutants. Immunoblots for phosphorylated Hog1
(top), all Hog1 (middle) and Tubulin (bottom). Lane 1 is a positive control of WT exposed to 0.4 M NaCl for five minutes prior to harvesting.
(D) All genes with significant changes in bck1D ptp3D or slt2D ptp3D (p < 0.05, FC > 1.7) are depicted. Lane 7 shows the same genes for the ptp2D ptp3D
expression profile.
(E) As in (C).
(F) Model of interactions for the buffering observed between PTP3-SLT2 and PTP3-BCK1. Gray lines indicate buffering. Black line indicates redundancy.
The two arrows between Slt2 and Ptp2 indicate that this activation may be direct or indirect.
effect (less than eight gene changes), but the other single mutant
does. The term quantitative is applicable because the effect
observed in the single mutant is amplified in the double mutant
(see also Figure 4E) but without involving additional gene sets.
Complete and quantitative redundancy are intuitive in their
classification and as is demonstrated below, both can be under-
stood through simple molecular mechanisms. This is not true
because of the third buffering relationship, which we call mixed
epistasis for the different types of epistatic effects observed on
different gene sets (Figure 4C). Whereas some gene sets
respond as in complete or quantitative redundancy, other gene
sets behave in completely different ways. These typically show
expression changes in single mutants that disappear or even
show an opposite effect in the double mutant. The classification
scheme (Extended Experimental Procedures) depends on
thresholds for identification of differently behaving gene sets.
996 Cell 143, 991–1004, December 10, 2010 ª2010 Elsevier Inc.
Changing thresholds would result in a different classification
for some of the pairs. The thresholds were kept identical to those
used for identification of which mutants behave asWT (Figure 1).
In this way sixteen of the twenty-one gene pairs exhibiting
genetic buffering are classified: four as complete, two as quan-
titative and ten as mixed epistatic. In six cases, the double
mutant is inviable (Table 1), hindering classification of CKA1-
CKA2, PTK2-PTK1, PTK2-SKY1, HSL1-MIH1, and YPK1-YPK2
(Figure 4D). One case of inviability (YCK1-YCK2) can be unam-
biguously classified as complete redundancy (Figure 4A).
The ten pairs showing mixed epistasis are the kinase pairs
KSS1-FUS3, HSL1-CLA4, SNF1-RIM11, BCK1-CLA4, SLT2-
CLA4 and the kinase-phosphatase pairs PBS2-PTK2, ELM1-
MIH1, DUN1-PPH3, BCK1-PTP3, SLT2-PTP3. Mixed epistasis
is therefore exhibited by paralogous as well as nonhomologous
pairs. Besides the mixed epistasis itself, it is striking that this

buffering interaction is the most common. Redundancy is not
necessarily complete. Partial overlap in function is expected to
result in single mutants exhibiting effects on their own, with these
same effects reflected in the doublemutant, alongside additional
genes changing due to loss of the shared function. It is remark-
able that no very clear example of this expected partial redun-
dancy pattern is observed. As is made clear below, this is related
to the finding of mixed epistasis.
Mechanisms Underlying Complete and QuantitativeRedundancyWe next considered molecular mechanisms. Complete and
quantitative redundancy can be explained by similar models
whereby redundant partners function on the same targets (Fig-
ures 4F and 4H). As an example, Ark1 and Prk1 are previously es-
tablished redundant kinases that regulate endocytosis and the
actin cytoskeleton (Smythe and Ayscough, 2003). ARK1-PRK1
demonstrate complete redundancy (Figures 2A–2C). The endo-
cytic adaptor protein Sla1 is an established direct target of
both kinases (Zeng et al., 2001). The sla1D expression profile
reflects this, with the changes in mRNA expression forming
a perfect subset of the ark1D prk1D expression profile (Fig-
ure 4G). This illustrates that kinase targets can in some cases
be identified by comparative expression profiling and indicates
here that Ark1 and Prk1 likely have more than one target.
It is similarly intuitive that pairs showing quantitative redun-
dancy have identical targets, since the same genes are affected
in single and double mutants, but to different degrees (Figures
4B and 4E). Quantitative redundancy may reflect a quantitatively
different effect on the target. To test this, we investigated the
phosphatase pair PTC1-PTC2 (Figure 4B). Hog1 is a shared
target of Ptc1 and Ptc2 (Young et al., 2002). In agreement with
the hypothesis, the degree to which Ptc1 and Ptc2 dephosphor-
ylate Hog1 differs (Figure 4I). Levels of phosphorylated Hog1 in
the different mutants match the quantitative effects observed
in the expression profiles (Figure 4B). This supports the proposal
that quantitative redundancy is caused by identical target
specificity combined with a quantitatively different effect on the
target. This could be due to differences in enzyme efficiency or
through differences in expression levels of redundant partners.
Due to the selection criteria, the effects observed here always
involve one single mutant showing an expression profile similar
to WT. This implies that the enzyme that does show a single-
deletion phenotype is overabundantly active under this growth
condition.
Mixed Epistasis of FUS3-KSS1 Is a Result of PartialRedundancy Coupled to Unidirectional RepressionMixed epistasis is the most frequently observed buffering inter-
action (Figure 4C, Table 1). To investigate mechanism, we first
focused on the FUS3-KSS1 kinase pair (reviewed in Chen and
Thorner, 2007). The Fus3 MAPK is responsible for activation of
mating genes in response to pheromone. Kss1 is the MAPK of
the filamentous growth pathway that activates a nutrient starva-
tion response whereby yeast cells change polarity and shape,
resulting in filamentous colony outgrowth that enables foraging
for nutrients. The fus3D, kss1D and fus3D kss1D profiles consist
of several responder gene sets that behave in different ways in
the three strains (Figure 4C). To understand mixed epistasis,
we focused on two such gene sets. The first set behaves as in
complete redundancy, with downregulation only in the double
mutant (Figure 5A). The second set shows upregulation in
fus3D only. Together, these two gene sets form a minimal mixed
epistasis pattern, shared by the majority of pairs classified as
such (Figure 4C).
A model that explains the different epistatic behavior of the
two responder gene sets (Figures 5B and 5C) is based on data
presented here (Figure 5A) as well as on many previous studies
of these pathways (Chen and Thorner, 2007). FUS3 and KSS1
are redundant paralogs but the redundancy is only partial (Elion
et al., 1991). The two pathways work through two downstream
transcription factors, Ste12 and Tec1 (Chen and Thorner,
2007; Chou et al., 2006; Madhani and Fink, 1997). The promoters
of the two gene sets are differentially enriched for Ste12 and
Tec1 binding sites (Figure 5A). The first gene set consists of
mating genes, enriched for pheromone response elements
that bind homodimerized Ste12. The second gene set is en-
riched for the filamentation response element that binds the
Ste12-Tec1 heterodimer. In agreement with previous studies
(Chen and Thorner, 2007), Kss1 is inactive under noninducing
conditions and kss1D has virtually no effect (Figure 5A). The
mating pathway (Fus3) is active at low basal levels under nonin-
ducing conditions. Fus3 is an activating kinase for Ste12 and an
inactivating kinase for Tec1, whereby Tec1 phosphorylation
leads to its degradation (Chen and Thorner, 2007; Chou et al.,
2004). KSS1 is a target of Tec1 in this model. Upon deletion of
FUS3, Tec1 is no longer degraded. KSS1 becomes upregulated
and because of their redundancy, Kss1 can (partially) take over
the role of Fus3 (Figure 5C). Kss1 takes over the role of activating
Ste12 (Madhani et al., 1997). No change is therefore observed in
themating genes, which remain active at basal levels (Figure 5A).
Kss1 does not take over the inactivating role of Fus3 toward Tec1
(Chou et al., 2004), leading to activation of the filamentous
gene cluster in fus3D (Figure 5A). This effect is lost in the double
mutant and the filamentous gene set reverts back to WT levels
(Figure 5A). The mating gene set is down in the double mutant
(Figure 5A) because neither Kss1 nor Fus3 are present to activate
Ste12.
The two pivotal elements that explain the mixed epistatic
effects are therefore partial redundancy and the negative regula-
tion of KSS1 by Fus3. A negative effect of Fus3 on KSS1 has
been described for activating conditions (Chou et al., 2006).
The promoter of KSS1 contains binding sites for Tec1 (Figure 5A)
and, as predicted, KSS1 indeed becomes upregulated in fus3D
(Figure 5A). The involvement of the two downstream transcrip-
tion factors (Chen and Thorner, 2007) is supported by the differ-
ential enrichment of binding sites (Figure 5A) and was tested by
analyzing tec1D and ste12D (Figure S4).
Boolean Modeling Reveals Two General Propertiesof Mixed Epistasis: Partial Overlap in Functionand Regulatory CouplingMixed epistasis similar to FUS3-KSS1 occurs in 10 out of the 16
pairs that can be classified (Figure 4C). To determine whether
similar mechanisms underlie all such cases, we asked which
regulatory network topologies lead to such phenotypes. By
Cell 143, 991–1004, December 10, 2010 ª2010 Elsevier Inc. 997

ark1Δprk1Δark1Δ prk1Δ
cka1Δcka2Δcka1Δ cka2Δ
A
inviable
C
inviable
ypk2Δypk1Δypk1Δ ypk2Δinviable
M (log2(mt/wt))
Den
sity
-3 -2 -1 0 1 2 3
0.0
0.2
0.4
0.6
0.8
M (log2(mt/wt))
-3 -2 -1 0 1 2 3
0.0
0.2
0.4
0.6
0.8
1.0
Den
sity
B
ptk2Δptk1Δptk1Δ ptk2Δinviable
Dptk2Δsky1Δsky1Δ ptk2Δ
hsl1Δmih1Δhsl1Δ mih1Δinviable inviable
E
yck1Δyck2Δyck1Δ yck2Δ
hal5Δsat4Δhal5Δ sat4Δ
ptp2Δptp3Δptp2Δ ptp3Δ
ptc2Δptc1Δptc1Δ ptc2Δ
pph3Δptc1Δptc1Δ pph3Δ
fus3Δkss1Δfus3Δ kss1Δ
dun1Δpph3Δdun1Δ pph3Δ
hsl1Δcla4Δhsl1Δ cla4Δ
bck1Δcla4Δbck1Δ cla4Δ
bck1Δptp3Δbck1Δ ptp3Δ
slt2Δcla4Δslt2Δ cla4Δ
ptk2Δpbs2Δpbs2Δ ptk2Δ
rim11Δsnf1Δsnf1Δ rim11Δ
slt2Δptp3Δslt2Δ ptp3Δ
mih1Δelm1Δmih1Δ elm1Δ
*
* *
ptc1Δ ptc1Δ ptc2Δ ptc1Δ ptc1Δ pph3Δ
Ark1 Prk1
Sla1 Sla1 p Hog1Hog1
Ptc1 Ptc2
p
ptc1
Δ
ptc2
Δ
ptc1
Δptc
2Δ
wt
Hog1- p
Hog1
Tubulin
ark1Δ prk1Δ
sla1Δ
F
G
H
I
Figure 4. Expression Profiling Reveals Three Different Genetic Buffering Interactions
For each set of three profiles all genes with changes in mRNA expression in any single profile are shown (p < 0.05, FC > 1.7).
(A) Complete redundancy whereby the single mutants have less than eight genes changing significantly and the double have more than eight.
(B) Quantitative redundancy, whereby one single mutant shows no significant profile (<8 genes p < 0.05, FC > 1.7), the other single mutant has a significant profile
and in the double the same genes change to a higher degree.
(C) Mixed epistasis. Here at least 8 more genes change significantly in the double versus the two singles, with at least 8 genes behaving in other ways than in
complete or quantitative phenotypes. The two bars below the FUS3-KSS1 profiles indicate the two gene sets selected for modeling (Figure 5).
(D) Unclassified buffering interactions due to inviability of the double mutant (Table 1).
998 Cell 143, 991–1004, December 10, 2010 ª2010 Elsevier Inc.
definition, all the cases of mixed epistasis contain at least two
differently responding gene sets. We therefore considered
models consisting of four nodes: two gene sets and two regula-
tors. To arrive at all possible solution models rather than a single
optimized solution, modeling was performed with Boolean oper-
ators (Albert et al., 2008;Ma et al., 2009). Since two nodes can be
linked by different combinations of positive and negative regula-
tory edges going in different directions, any two nodes can be
connected in nine different ways. This leads to 794,176 models
(Experimental Procedures), of which 106 result in the minimal
mixed epistasis pattern (Figure 5A, Table S5). These steady-
state solution models were pruned by removing superfluous
edges (Figure S4C), revealing 28 root models that all exhibit
the experimentally observed mixed epistasis (Table S2).
Two important general properties emerge from these models.
The first is inhibition or repression of one regulator by the other
(Table S2 and Table S3). Different ways of achieving these unidi-
rectional negative effects are exemplified by the model solution
that most closely resembles the literature-derived model for
FUS3-KSS1 (Figures 5D and 5E). Besides encompassing all
the regulatory edges contained in the experimentally derived
scheme, including repression of kinase 2 expression by kinase
1, in this Boolean model, kinase 1 also inhibits kinase 2. Previous
experiments have suggested the existence of an inhibitory effect
of Fus3 toward Kss1, albeit indirectly through Fus3-mediated
activation of a Kss1-inhibitory phosphatase (Chen and Thorner,
2007). Although this Boolean solution closely resembles the
experimentally derived model (Figure 5C), it should be noted
that this is not a root model and can be pruned by removal of
two edges without affecting outcome (Figures 5F and 5G). That
the experimentally derived model contains seemingly super-
fluous edges indicates that these features are required for
aspects of FUS3-KSS1 not modeled here, such as regulatory
dynamics and the different behavior of other gene sets
(Figure 4C).
A second general property of all the Boolean solutions is
partial overlap in function. As with the negative effects, the
models indicate that partial overlap in function can also be
achieved in different ways. The least complex models, the two
solutions that consist of only four edges, illustrate direct (Fig-
ure 5F) and indirect ways (Figures 5H and 5I) in which partial
overlap in function can be achieved. In the first root model (Fig-
ure 5F) both kinases have activating edges toward the first
responder gene set. This indicates redundancy and fits best
with the expected action of redundant paralogs. The partial
nature of the redundancy is represented by different edges to
the other responder gene set. In the second simple Boolean
root model (Figure 5H), partial overlap in function is achieved in
a different, indirect way, with kinase 2 indirectly acting on one
responder gene set through the other. This indirect manner of
(E) Quantification of the profiles shown in B, plotted for all genes with significant
mutant strain. M is the log2 ratio of normalized fluorescent mRNA expression in t
double mutant whereby all genes on aneuploid chromosomes were excluded fro
(F) Complete redundancy can result from two proteins able to directly substitute
(G) Expression profiles of the ark1D prk1D double mutant and the target sla1D.
expression in any profile.
(H) Quantitative redundancy resulting from the ability of two proteins to directly s
(I) Immunoblot as described in Figure 3C.
achieving overlap in function explains how functionally distinct
nonhomologous pairs such as kinase-phosphatase pairs, can
nevertheless still have buffering effects. That the Boolean solu-
tions encompass both direct and indirect ways of achieving
overlapping function fits well with the observation that mixed
epistasis is exhibited by paralogous as well as nonhomologous
pairs (Table 1).
Modeling shows that mixed epistasis arises through partial
overlap in function combined with regulatory links from one
partner to the other. Themajority of genetic buffering interactions
are mixed epistatic (Table 1). This indicates that the majority of
genetically buffered kinase/phosphatase pairs have partial
overlap in function and regulatory links. As is explained below,
this has implications for understanding multiprocess control
and for explaining the evolutionary maintenance of redundant
paralogs.
Regulatorily Linked Pairs with Partial Overlapin Function Form Modules for ControllingDifferent Combinations of ProcessesA consequence of the network topologies that explain the
minimal mixed epistasis pattern is that two distinct responses
can be regulated in either coupled or uncoupled manners.
Depending on which regulator is active, a single process, or a
second process in combination with the first, can be coordi-
nately regulated. This feature is illustrated by FUS3-KSS1.
Although the mating pheromone response (Fus3) and the fila-
mentous growth starvation response (Kss1) are often treated
as distinct, it has been reported that Kss1 is briefly activated
during pheromone treatment (Ma et al., 1995). Furthermore,
under lowmating pheromone concentrations, yeast cells display
a Kss1-dependent filamentation response that allows outgrowth
toward cells of the opposite mating type (Erdman and Snyder,
2001). This is similar to Kss1-dependent filamentous growth
during nutrient starvation and suggests that under certain
conditions, such as low pheromone concentration, aspects of
filamentous growth are indeed regulatorily coupled to the mating
response.
It is not well understood why redundant pairs such as paralogs
are evolutionarily maintained (Vavouri et al., 2008). The ability to
flexibly couple and uncouple regulation of distinct processes is
intuitively advantageous as a multiprocess control mechanism
for responding to a large variety of different (combinations of)
conditions. If this ability is a driving force behind the evolutionary
maintenance of redundant pairs, then one prediction is that the
gene sets that behave in different ways in mixed epistatic inter-
actions should correspond to distinct processes. This prediction
is confirmed by Gene Ontology (GO) analysis of the groups of
genes contained within the mixed epistasis profiles (Figure 6).
Presentation of this enrichment analysis as a network also
(p < 0.05, FC > 1.7) changes in mRNA expression in any one single or double
he mutant divided by WT. Asterisks indicate strains showing aneuploidy in the
m analyses.
for all of each other’s activity.
All genes are depicted with significant changes (p < 0.05, FC > 1.7) in mRNA
ubstitute for each others activity qualitatively, but not quantitatively.
Cell 143, 991–1004, December 10, 2010 ª2010 Elsevier Inc. 999
Ste11
Ste7 Ste7
Fus3 Fus3 Kss1
Ste11
Ste7 Ste7
Kss1 Kss1
B
C
p
p
p
p
p
p
Ste12Ste12Ste12
Tec1Tec1
mating genes
degradation
p
Ste12
Ste12Ste12Ste12
Tec1Tec1
mating genes
p
Ste12
KSS1
filamentous growth genes
Ste12Ste12 p
G
D
K2 K1
R1 R2
OR
K2 K1
R1 R2OR
filamentous growth genes
-800
-700
-600
-500
-400
-300
-200
-100
fus3Δkss1Δfus3Δ kss1Δ
mating filamentous growth
SR
L1Y
JU2
KT
R2
FY
V6
YA
R06
0CA
IM38
PG
U1
YH
R21
4WY
HR
177W
YH
R21
4W-A
KS
S1
AG
A1
ST
E3
FA
R1
MF
(ALP
HA
)1G
PA
1S
AG
1S
ST
2T
EC
1
prom
oter
(ba
se p
airs
)
Tec1 binding site Ste12 binding site
123
H
I
E
K2 K1
R1 R2
OR
OR
AND
k1Δk2Δk1Δ k2Δ
wtk1Δk2Δk1Δ k2Δ
R1 (relative) R2 (relative)
K1 (absolute) K2 (absolute)
1 2 3 4 5 1 2 3 4 5
R1 (relative) R2 (relative)
K1 (absolute) K2 (absolute)
1 2 3 4 5 1 2 3 4 5
R1 (relative) R2 (relative)
K1 (absolute) K2 (absolute)
1 2 3 4 5 1 2 3 4 5
F
k1Δk2Δk1Δ k2Δ
wtk1Δk2Δk1Δ k2Δ
k1Δk2Δk1Δ k2Δ
wtk1Δk2Δk1Δ k2Δ
A
t t
t t
t t
p
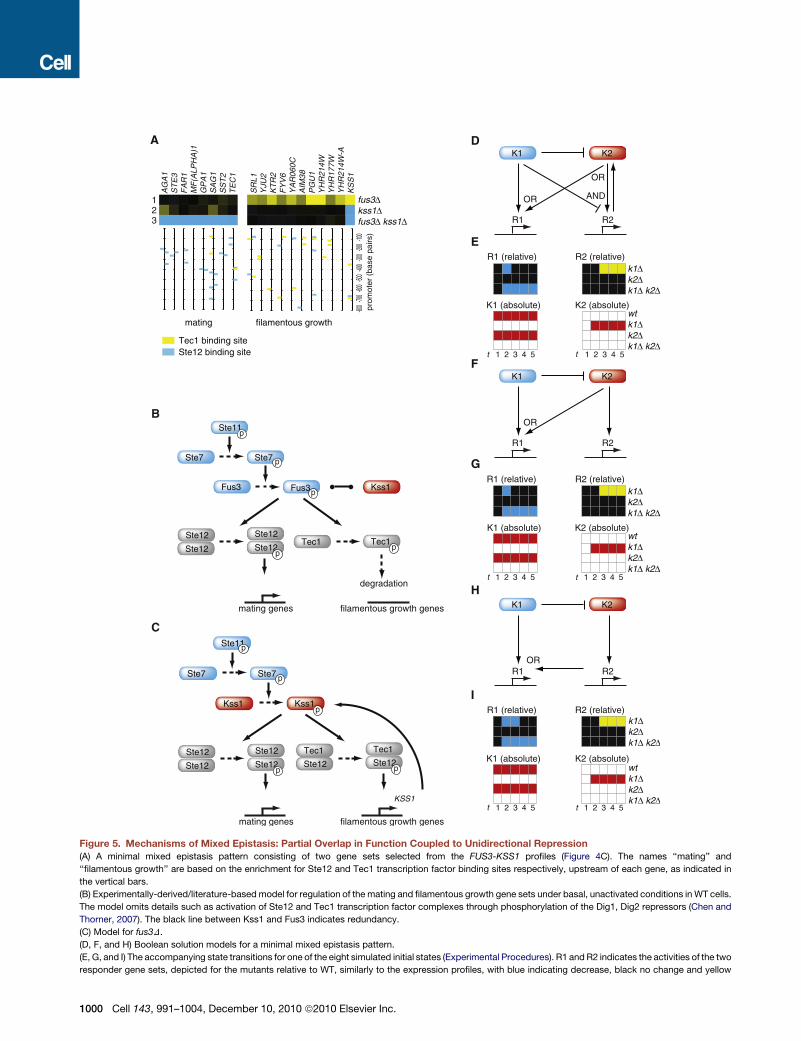
Figure 5. Mechanisms of Mixed Epistasis: Partial Overlap in Function Coupled to Unidirectional Repression
(A) A minimal mixed epistasis pattern consisting of two gene sets selected from the FUS3-KSS1 profiles (Figure 4C). The names ‘‘mating’’ and
‘‘filamentous growth’’ are based on the enrichment for Ste12 and Tec1 transcription factor binding sites respectively, upstream of each gene, as indicated in
the vertical bars.
(B) Experimentally-derived/literature-based model for regulation of the mating and filamentous growth gene sets under basal, unactivated conditions in WT cells.
The model omits details such as activation of Ste12 and Tec1 transcription factor complexes through phosphorylation of the Dig1, Dig2 repressors (Chen and
Thorner, 2007). The black line between Kss1 and Fus3 indicates redundancy.
(C) Model for fus3D.
(D, F, and H) Boolean solution models for a minimal mixed epistasis pattern.
(E, G, and I) The accompanying state transitions for one of the eight simulated initial states (Experimental Procedures). R1 and R2 indicates the activities of the two
responder gene sets, depicted for the mutants relative to WT, similarly to the expression profiles, with blue indicating decrease, black no change and yellow
1000 Cell 143, 991–1004, December 10, 2010 ª2010 Elsevier Inc.
STB1
TEC1
vacuolarprotein
catabolicprocess
cellularresponse
to DNA damagestimulus
2 3
DNAreplication
MBP1
iron ion transport
SWI6
mitoticsister
chromatidcohesion
DNAreplication
DNArepair
ironassimilation
ironassimilation
byreduction
andtransport
2 5
MBP1
responseto stress
energyreserve
metabolicprocessaging
septinring
organization
responseto
stimulus
regulationof
establishmentor
maintenanceof cell
polarity
regulationof cell
division
2 22 1
DNAconformation
change
2 01 91 8
cellularresponseto heat
regulationof cell cycle
celldivision
1 5
cellularnitrogen
compoundmetabolicprocess
1 6
responseto
pheromoneduring
conjugationwith
cellularfusion
ascosporeformation
1 7
HAP4DIG1reproduction
STE12
cell deathregulationof mitotic cell cycle
glycerolbiosynthetic
process
hexosetransport
HAP4response
toosmoticstress
vacuolefusion,
non-autophagic
nucleotidemetabolicprocess
microautophagy
polyphosphatemetabolicprocess
1 2
iontransport
4
conjugation
oxidativephosphorylation
responseto
pheromoneduring
conjugationwith
cellularfusion
responseto
pheromone
pheromone-dependentsignal
transductioninvolved
inconjugation
withcellularfusion
transposition,RNA-mediated
sexualreproduction
STE12DIG1
chromatinorganization
RNAmetabolicprocess
mitochondrialATP
synthesiscoupledelectron
transport
RNAprocessing ribosomal
largesubunit
biogenesis
reproduction
HAP4HAP2 ribosomal
largesubunit
assembly
MIG1responseto
temperaturestimulus
vacuolarprotein
catabolicprocess
chromatinassembly
ordisassembly
cellularcatabolicprocess
cellularresponseto heat
protein-DNAcomplexassembly
YHP1
ncRNAprocessing
autophagycellularresponseto water
deprivation
iontransport
nucleotidemetabolicprocess
regulationof
molecularfunction
ribosomebiogenesis
vacuolarprotein
catabolicprocess
celldivision
oxidationreduction
cellularresponseto heat
3 8 4 0
nucleosomeorganization
4 2
Propanoatemetabolism
4 13 9
osmosensorysignalingpathway
4 4 4 5 4 6 4 7 4 9 5 04 3 4 8
fus3 fus3 kss1 pbs2 ptk2 pph3 dun1pbs2kss1 dun1 pph3 elm1 mih1 elm1 slt2 slt2 ptp3 snf1 rim11snf1bck1 ptp3bck1bck1 cla4cla4hsl1 cla4slt2 cla4
phospholipidcatabolicprocess
conjugationwith
cellularfusion
celladhesion ion
transport
nucleotidemetabolicprocess
3 5 6 7 8 9 1 0 1 1 2 41 41 2 1 3
fungal-typecell wall
organizationDNA
integration
viralprocapsid
maturationribosome
biogenesis
S phase of mitotic cell cycle
deoxyribonucleotidebiosynthetic
processDNA
replicationinitiation
ribosomalsmall
subunitassembly
FHL1
YOX1MCM1
ribosomalsubunitexportfrom
nucleus
ribosomalsmall
subunitbiogenesis
translationtransposition,RNA-mediated
beta-glucanbiosynthetic
process
pre-replicativecomplexassembly
DNAreplication oxidation
reduction
3 73 63 53 42 6 2 7 2 8 2 9 3 0 3 1 3 2 3 3
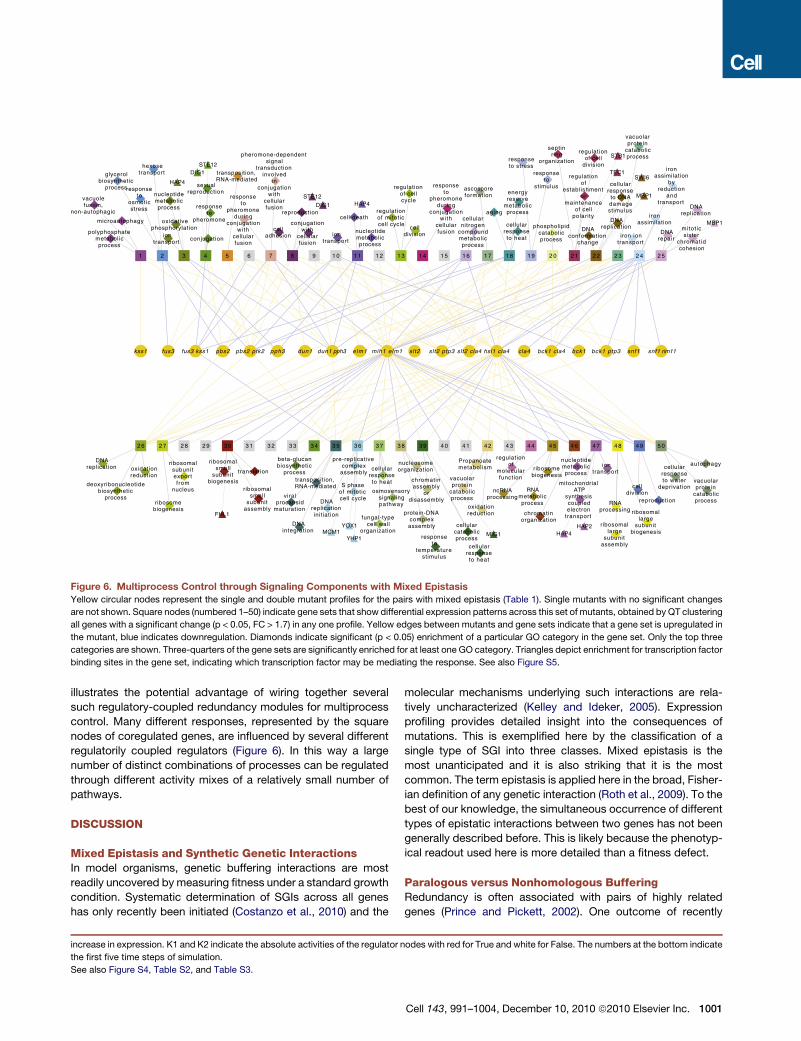
Figure 6. Multiprocess Control through Signaling Components with Mixed Epistasis
Yellow circular nodes represent the single and double mutant profiles for the pairs with mixed epistasis (Table 1). Single mutants with no significant changes
are not shown. Square nodes (numbered 1–50) indicate gene sets that show differential expression patterns across this set of mutants, obtained by QT clustering
all genes with a significant change (p < 0.05, FC > 1.7) in any one profile. Yellow edges between mutants and gene sets indicate that a gene set is upregulated in
the mutant, blue indicates downregulation. Diamonds indicate significant (p < 0.05) enrichment of a particular GO category in the gene set. Only the top three
categories are shown. Three-quarters of the gene sets are significantly enriched for at least one GO category. Triangles depict enrichment for transcription factor
binding sites in the gene set, indicating which transcription factor may be mediating the response. See also Figure S5.
illustrates the potential advantage of wiring together several
such regulatory-coupled redundancy modules for multiprocess
control. Many different responses, represented by the square
nodes of coregulated genes, are influenced by several different
regulatorily coupled regulators (Figure 6). In this way a large
number of distinct combinations of processes can be regulated
through different activity mixes of a relatively small number of
pathways.
DISCUSSION
Mixed Epistasis and Synthetic Genetic InteractionsIn model organisms, genetic buffering interactions are most
readily uncovered by measuring fitness under a standard growth
condition. Systematic determination of SGIs across all genes
has only recently been initiated (Costanzo et al., 2010) and the
increase in expression. K1 and K2 indicate the absolute activities of the regulator n
the first five time steps of simulation.
See also Figure S4, Table S2, and Table S3.
molecular mechanisms underlying such interactions are rela-
tively uncharacterized (Kelley and Ideker, 2005). Expression
profiling provides detailed insight into the consequences of
mutations. This is exemplified here by the classification of a
single type of SGI into three classes. Mixed epistasis is the
most unanticipated and it is also striking that it is the most
common. The term epistasis is applied here in the broad, Fisher-
ian definition of any genetic interaction (Roth et al., 2009). To the
best of our knowledge, the simultaneous occurrence of different
types of epistatic interactions between two genes has not been
generally described before. This is likely because the phenotyp-
ical readout used here is more detailed than a fitness defect.
Paralogous versus Nonhomologous BufferingRedundancy is often associated with pairs of highly related
genes (Prince and Pickett, 2002). One outcome of recently
odes with red for True and white for False. The numbers at the bottom indicate
Cell 143, 991–1004, December 10, 2010 ª2010 Elsevier Inc. 1001

initiated genome-wide mapping of genetic interactions is the
contribution of nonhomologous genes toward buffering (Cos-
tanzo et al., 2010). The relative contributions of nonhomologs
versus duplicate pairs is under debate (Gu et al., 2003; Papp
et al., 2004; Wagner, 2000), with a recent estimate as high as
75% for nonhomologs (Ihmels et al., 2007). The gene pairs inves-
tigated here were selected from a comprehensive kinase/phos-
phatase genetic interaction study (Fiedler et al., 2009). Half are
either unambiguously nonhomologous or have arisen from
ancient duplication events (over two billion years ago, Table 1).
This agrees with a strong contribution of nonhomologous pairs
toward genetic buffering (Ihmels et al., 2007) and indicates that
redundancy is not merely the transient by-product of gene dupli-
cations, since overlaps in cellular function have evolved from
nonhomologous genes too.
The Selective Advantage of Kinase/PhosphataseRedundancy Is Superior Regulatory SystemsOther arguments in favor of an important functional role for
redundancy include the stable evolutionary maintenance of pa-
ralogs and the persistent nature of redundancy (Dean et al.,
2008; Vavouri et al., 2008). Different types of selective advan-
tages have been proposed for the maintenance of redundant
paralogs, including robustness against mutation and robustness
against stochastic fluctuations in gene expression (Kafri et al.,
2006; Nowak et al., 1997; Prince and Pickett, 2002). Backup
models lack explanation of why only some genes have backups
and why redundancy is present in diploid organisms too. The
partial nature of most redundancy, observed here and elsewhere
(Ihmels et al., 2007), as well as the condition-dependence of
paralogous redundancy (Musso et al., 2008), also argue against
backup function. Instead, the results favor superior control
mechanisms as a selective advantage. The lack of phenotypes
expected for simple partial functional redundancy relationships
(Figure 4) is particularly interesting since this indicates that pairs
with partial overlap in function are always connected through
additional links. One property of suchmodules is that dependent
on which member of a pair is active, distinct processes can be
regulated in coupled or uncoupled manners.
The formation of regulatory modules with superior control
potential may also have other implications for understanding
the evolution of gene duplications. Models explaining the main-
tenance of paralogs include neo- and subfunctionalisation of
duplicate copies (DeLuna et al., 2008; Innan and Kondrashov,
2010). Recent systematic studies indicate that neofunctionalisa-
tion does not play a large role (Dean et al., 2008). The regulatory
modules described here fit best with subfunctionalisation, but
the finding that partially redundant pairs are also coupled by
regulatory links to each other may require additional subclassifi-
cation of these models (Innan and Kondrashov, 2010).
Quantitatively redundant pairs may also confer superior regu-
latory properties or may simply indicate requirement for a higher
enzymatic capacity than can otherwise be reached with only
a single copy. Complete redundancy phenotypes are a minority
(Table 1). The selective advantage of such pairs remains enig-
matic. Growth condition dependency of redundancy (Musso
et al., 2008) suggests that if profiled under other conditions,
such pairs may exhibit one of the other phenotypes.
1002 Cell 143, 991–1004, December 10, 2010 ª2010 Elsevier Inc.
Recurrent Modules and Pathway ConnectivityRecurrent motifs with important properties have previously been
described for transcription regulatory networks (Alon, 2007). The
extent of signaling pathway connectivity has recently been
highlighted by systematic analysis of protein interactions (Breitk-
reutz et al., 2010). Common regulatory motifs within signaling
networks are not well established and little is known in general
about multiprocess control. Our analyses indicate that regulato-
rily coupled pairs with partial overlap in function form a common
module for contributing to the control of different combinations
of processes (Figure 6).
One of the regulatory links is repression of one regulator by the
other, as exemplified by FUS3-KSS1. The dataset contains other
examples where inactivation of one redundant gene leads to
increase in expression of its partner (Figure S5). This regulatory
link contributes to differential expression of paralogs (Kafri
et al., 2005) and to paralog-responsiveness (DeLuna et al.,
2010). The minimal mixed epistasis pattern modeled here
consists of only two gene sets (Figure 5). Besides such gene
sets, most mixed epistasis profiles also have additional gene
sets behaving in different epistatic ways (Figure 4C). This implies
that wiring of such pairs also occurs in more ways than unidirec-
tional repression and likely involves other mechanisms, including
differential dose-response effects for other gene sets. The data
forms a basis for unraveling such modules further and will be
useful for engineering different types of combinatorial control in
synthetic signaling pathways (Kiel et al., 2010). Although the
number of pairs described here is likely an underestimate, it
should be noted that these were selected based on SGIs and
form only a distinct subset of all possible kinase/phosphatase
pairs. Connectivity between signaling pathways therefore
occurs in more ways. It can be anticipated that besides regula-
torily coupled pairs with partial overlapping function, more
recurrent modules will be uncovered by combinatorial analyses
(Kelley and Ideker, 2005), especially of datasets that are starting
to reveal the full scale of pathway connectivity (Breitkreutz et al.,
2010; Costanzo et al., 2010).
EXPERIMENTAL PROCEDURES
All procedures are described in detail in the Extended Experimental
Procedures.
Expression Profiling and Deletion Strains
Each mutant strain, BY4742 (Table S4), was profiled four times from two
independently inoculated cultures. Sets of mutants were grown alongside
WT cultures, all processed in parallel. Dual-channel 70-mer oligonucleotide
arrays were employed with a common reference WT RNA. All steps after
RNA isolation were automated using robotic liquid handlers. These proce-
dures were first optimized for accuracy (correct fold change) and precision
(reproducible result), using spiked-in RNA calibration standards (van Bakel
and Holstege, 2004). After quality control, normalization and dye-bias correc-
tion (Margaritis et al., 2009), statistical analysis was performed for eachmutant
versus the collection of 200 WT cultures. The reported fold change is the
average of the four replicate mutant profiles versus the average of all WTs.
76 genes showed stochastic changes in WT profiles and were excluded
from the analyses. Incorrect strains from the collection as indicated by aneu-
ploidy (5%), incorrect deletion (3%) or additional spurious mutation affecting
the profile (3%), were remade and reprofiled (Table S4). None of the WT
profiles had more than eight genes changing compared to the average WT

(p < 0.05, FC > 1.7). A threshold of fewer than eight genes changing was
therefore applied to determine whether a mutant had a significant profile.
Double Mutants
SGI data (Fiedler et al., 2009) were converted to Z-scores and double mutants
were selected based on exhibiting a negative SGI, a Z-score significance of p <
0.05 after multiple testing correction (46 pairs) and one of the mutants having
an expression profile similar to WT (24 pairs). Double mutants were all remade
in an identical genetic background as the single mutants. Six were inviable,
consistent with buffering. One double mutant (dun1D chk1D) had different
degrees of aneuploidy in different isolates and buffering could not be confi-
dently determined from the profile (Table S1).
Boolean Modeling
Given four nodes and no self-edges, topologies were constrained to be
completely connected and have at least two edges from the regulator nodes
(K1, K2) to the responder nodes (R1, R2). The number of incoming edges on
any node was limited to two. Influence of two incoming edges could be
Boolean AND or OR. Synchronous Boolean simulations were run for all
possible initial states of K2, R1, and R2. The initial state of K1 was True. Solu-
tion models were those that converged to a steady state under all initial state
settings and had the final states of wild-type: R1 = True, R2 = False; k1D: R1 =
True, R2 = True; k2D: R1 = True, R2 = False; k1D k2D: R1 = False, R2 = False.
ACCESSION NUMBERS
All microarray gene expression data have been deposited in the public
data repositories ArrayExpress (accession numbers E-TABM-907 [mutants]
and E-TABM-773 [200 WT replicates]) and GEO (GSE25644 [mutants]). The
data are also available as flat-file or in TreeView format from http://www.
holstegelab.nl/publications/sv/signaling_redundancy/.
SUPPLEMENTAL INFORMATION
Supplemental Information includes Extended Experimental Procedures,
five figures, and five tables and can be found with this article online at
doi:10.1016/j.cell.2010.11.021.
ACKNOWLEDGMENTS
This work was supported by the Netherlands Bioinformatics Centre (NBIC) and
the Netherlands Organization of Scientific Research (NWO), grants
016.108.607, 817.02.015, 050.71.057, 911.06.009, 021.002.035 (T.L.L.),
863.07.007 (P.K.), 700.57.407 (J.J.B.).
Received: January 29, 2010
Revised: September 20, 2010
Accepted: November 9, 2010
Published: December 9, 2010
REFERENCES
Albert, I., Thakar, J., Li, S., Zhang, R., and Albert, R. (2008). Boolean network
simulations for life scientists. Source Code Biol. Med. 3, 16.
Alon, U. (2007). Network motifs: theory and experimental approaches. Nat.
Rev. Genet. 8, 450–461.
Bermejo, C., Rodrıguez, E., Garcıa, R., Rodrıguez-Pena, J.M., Rodrıguez de la
Concepcion, M.L., Rivas, C., Arias, P., Nombela, C., Posas, F., and Arroyo, J.
(2008). The sequential activation of the yeast HOG and SLT2 pathways is
required for cell survival to cell wall stress. Mol. Biol. Cell 19, 1113–1124.
Breitkreutz, A., Choi, H., Sharom, J.R., Boucher, L., Neduva, V., Larsen, B., Lin,
Z.Y., Breitkreutz, B.J., Stark, C., Liu, G., et al. (2010). A global protein kinase
and phosphatase interaction network in yeast. Science 328, 1043–1046.
Capaldi, A.P., Kaplan, T., Liu, Y., Habib, N., Regev, A., Friedman, N., and
O’Shea, E.K. (2008). Structure and function of a transcriptional network
activated by the MAPK Hog1. Nat. Genet. 40, 1300–1306.
Chen, R.E., and Thorner, J. (2007). Function and regulation in MAPK signaling
pathways: lessons learned from the yeast Saccharomyces cerevisiae. Bio-
chim. Biophys. Acta 1773, 1311–1340.
Chou, S., Huang, L., and Liu, H. (2004). Fus3-regulated Tec1 degradation
through SCFCdc4 determines MAPK signaling specificity during mating in
yeast. Cell 119, 981–990.
Chou, S., Lane, S., and Liu, H. (2006). Regulation of mating and filamentation
genes by two distinct Ste12 complexes in Saccharomyces cerevisiae. Mol.
Cell. Biol. 26, 4794–4805.
Cope, M.J., Yang, S., Shang, C., and Drubin, D.G. (1999). Novel protein
kinases Ark1p and Prk1p associate with and regulate the cortical actin
cytoskeleton in budding yeast. J. Cell Biol. 144, 1203–1218.
Costanzo, M., Baryshnikova, A., Bellay, J., Kim, Y., Spear, E.D., Sevier, C.S.,
Ding, H., Koh, J.L., Toufighi, K., Mostafavi, S., et al. (2010). The genetic
landscape of a cell. Science 327, 425–431.
Dean, E.J., Davis, J.C., Davis, R.W., and Petrov, D.A. (2008). Pervasive and
persistent redundancy among duplicated genes in yeast. PLoS Genet. 4,
e1000113.
DeLuna, A., Springer, M., Kirschner, M.W., and Kishony, R. (2010). Need-
based up-regulation of protein levels in response to deletion of their duplicate
genes. PLoS Biol. 8, e1000347.
DeLuna, A., Vetsigian, K., Shoresh, N., Hegreness, M., Colon-Gonzalez, M.,
Chao, S., and Kishony, R. (2008). Exposing the fitness contribution of
duplicated genes. Nat. Genet. 40, 676–681.
Elion, E.A., Brill, J.A., and Fink, G.R. (1991). FUS3 represses CLN1 and CLN2
and in concert with KSS1 promotes signal transduction. Proc. Natl. Acad. Sci.
USA 88, 9392–9396.
Erdman, S., and Snyder, M. (2001). A filamentous growth response mediated
by the yeast mating pathway. Genetics 159, 919–928.
Fiedler, D., Braberg, H., Mehta, M., Chechik, G., Cagney, G., Mukherjee, P.,
Silva, A.C., Shales, M., Collins, S.R., van Wageningen, S., et al. (2009).
Functional organization of the S. cerevisiae phosphorylation network. Cell
136, 952–963.
Gu, Z., Steinmetz, L.M., Gu, X., Scharfe, C., Davis, R.W., and Li, W.H. (2003).
Role of duplicate genes in genetic robustness against null mutations. Nature
421, 63–66.
Hartman, J.L., 4th, Garvik, B., and Hartwell, L. (2001). Principles for the
buffering of genetic variation. Science 291, 1001–1004.
Ihmels, J., Collins, S.R., Schuldiner, M., Krogan, N.J., and Weissman, J.S.
(2007). Backup without redundancy: genetic interactions reveal the cost of
duplicate gene loss. Mol. Syst. Biol. 3, 86.
Innan, H., and Kondrashov, F. (2010). The evolution of gene duplications:
classifying and distinguishing between models. Nat. Rev. Genet. 11, 97–108.
Jacoby, T., Flanagan, H., Faykin, A., Seto, A.G., Mattison, C., and Ota, I.
(1997). Two protein-tyrosine phosphatases inactivate the osmotic stress
response pathway in yeast by targeting the mitogen-activated protein kinase,
Hog1. J. Biol. Chem. 272, 17749–17755.
Kafri, R., Bar-Even, A., and Pilpel, Y. (2005). Transcription control reprogram-
ming in genetic backup circuits. Nat. Genet. 37, 295–299.
Kafri, R., Levy, M., and Pilpel, Y. (2006). The regulatory utilization of genetic
redundancy through responsive backup circuits. Proc. Natl. Acad. Sci. USA
103, 11653–11658.
Kelley, R., and Ideker, T. (2005). Systematic interpretation of genetic interac-
tions using protein networks. Nat. Biotechnol. 23, 561–566.
Kiel, C., Yus, E., and Serrano, L. (2010). Engineering signal transduction
pathways. Cell 140, 33–47.
Ma, D., Cook, J.G., and Thorner, J. (1995). Phosphorylation and localization of
Kss1, a MAP kinase of the Saccharomyces cerevisiae pheromone response
pathway. Mol. Biol. Cell 6, 889–909.
Ma, W., Trusina, A., El-Samad, H., Lim, W.A., and Tang, C. (2009). Defining
network topologies that can achieve biochemical adaptation. Cell 138,
760–773.
Cell 143, 991–1004, December 10, 2010 ª2010 Elsevier Inc. 1003

Madhani, H.D., and Fink, G.R. (1997). Combinatorial control required for the
specificity of yeast MAPK signaling. Science 275, 1314–1317.
Madhani, H.D., Styles, C.A., and Fink, G.R. (1997). MAP kinases with distinct
inhibitory functions impart signaling specificity during yeast differentiation.
Cell 91, 673–684.
Margaritis, T., Lijnzaad, P., van Leenen, D., Bouwmeester, D., Kemmeren, P.,
van Hooff, S.R., and Holstege, F.C. (2009). Adaptable gene-specific dye bias
correction for two-channel DNA microarrays. Mol. Syst. Biol. 5, 266.
Musso, G., Costanzo, M., Huangfu, M., Smith, A.M., Paw, J., San Luis, B.J.,
Boone, C., Giaever, G., Nislow, C., Emili, A., and Zhang, Z. (2008). The
extensive and condition-dependent nature of epistasis among whole-genome
duplicates in yeast. Genome Res. 18, 1092–1099.
Nowak, M.A., Boerlijst, M.C., Cooke, J., and Smith, J.M. (1997). Evolution of
genetic redundancy. Nature 388, 167–171.
Papp, B., Pal, C., and Hurst, L.D. (2004). Metabolic network analysis of the
causes and evolution of enzyme dispensability in yeast. Nature 429, 661–664.
Prince, V.E., and Pickett, F.B. (2002). Splitting pairs: the diverging fates of
duplicated genes. Nat. Rev. Genet. 3, 827–837.
Roberts, C.J., Nelson, B., Marton, M.J., Stoughton, R., Meyer, M.R., Bennett,
H.A., He, Y.D., Dai, H., Walker, W.L., Hughes, T.R., et al. (2000). Signaling and
circuitry of multiple MAPK pathways revealed by a matrix of global gene
expression profiles. Science 287, 873–880.
Rodrıguez-Pena, J.M., Perez-Dıaz, R.M., Alvarez, S., Bermejo, C., Garcıa, R.,
Santiago, C., Nombela, C., and Arroyo, J. (2005). The ‘yeast cell wall chip’ -
a tool to analyse the regulation of cell wall biogenesis in Saccharomyces
cerevisiae. Microbiology 151, 2241–2249.
Roth, F.P., Lipshitz, H.D., and Andrews, B.J. (2009). Q&A: epistasis. J. Biol. 8, 35.
1004 Cell 143, 991–1004, December 10, 2010 ª2010 Elsevier Inc.
Smythe, E., and Ayscough, K.R. (2003). The Ark1/Prk1 family of protein
kinases. Regulators of endocytosis and the actin skeleton. EMBO Rep. 4,
246–251.
van Bakel, H., and Holstege, F.C. (2004). In control: systematic assessment of
microarray performance. EMBO Rep. 5, 964–969.
Vavouri, T., Semple, J.I., and Lehner, B. (2008). Widespread conservation of
genetic redundancy during a billion years of eukaryotic evolution. Trends
Genet. 24, 485–488.
Wagner, A. (2000). Robustness against mutations in genetic networks of yeast.
Nat. Genet. 24, 355–361.
Warmka, J., Hanneman, J., Lee, J., Amin, D., and Ota, I. (2001). Ptc1, a type 2C
Ser/Thr phosphatase, inactivates the HOG pathway by dephosphorylating the
mitogen-activated protein kinase Hog1. Mol. Cell. Biol. 21, 51–60.
Winkler, A., Arkind, C., Mattison, C.P., Burkholder, A., Knoche, K., and Ota, I.
(2002). Heat stress activates the yeast high-osmolarity glycerol mitogen-
activated protein kinase pathway, and protein tyrosine phosphatases are
essential under heat stress. Eukaryot. Cell 1, 163–173.
Wurgler-Murphy, S.M., Maeda, T., Witten, E.A., and Saito, H. (1997).
Regulation of the Saccharomyces cerevisiae HOG1mitogen-activated protein
kinase by the PTP2 and PTP3 protein tyrosine phosphatases. Mol. Cell. Biol.
17, 1289–1297.
Young, C., Mapes, J., Hanneman, J., Al-Zarban, S., and Ota, I. (2002). Role of
Ptc2 type 2C Ser/Thr phosphatase in yeast high-osmolarity glycerol pathway
inactivation. Eukaryot. Cell 1, 1032–1040.
Zeng, G., Yu, X., and Cai, M. (2001). Regulation of yeast actin cytoskeleton-
regulatory complex Pan1p/Sla1p/End3p by serine/threonine kinase Prk1p.
Mol. Biol. Cell 12, 3759–3772.
Related Documents