Functional Neoangiogenesis Imaging of Genetically Engineered Mouse Prostate Cancer Using Three-Dimensional Power Doppler Ultrasound Jim W. Xuan, 1 Michael Bygrave, 6 Hongyi Jiang, 1 Fatma Valiyeva, 1 Joy Dunmore-Buyze, 6 David W. Holdsworth, 2,6 Jonathan I. Izawa, 1 Glenn Bauman, 3 Madeleine Moussa, 4 Scott F. Winter, 7 Norman M. Greenberg, 7 Joseph L. Chin, 1 Maria Drangova, 2,6 Aaron Fenster, 2,3,6 and James C. Lacefield 2,5,6 Departments of 1 Surgery, 2 Medical Biophysics, 3 Oncology, 4 Pathology, and 5 Electrical and Computer Engineering, University of Western Ontario and 6 Imaging Research Laboratories, Robarts Research Institute, London, Ontario, Canada; and 7 Clinical Research Division, Fred Hutchinson Cancer Research Center, Seattle, Washington Abstract We report the first application of high-frequency three- dimensional power Doppler ultrasound imaging in a geneti- cally engineered mouse (GEM) prostate cancer model. We show that the technology sensitively and specifically depicts functional neoangiogenic blood flow because little or no flow is measurable in normal prostate tissue or tumors smaller than 2–3 mm diameter, the neoangiogenesis ‘‘switch-on’’ size. Vascular structures depicted by power Doppler were verified using Microfil-enhanced micro-computed tomography (micro- CT) and by correlation with microvessel distributions mea- sured by immunohistochemistry and enhanced vascularity visualized by confocal microscopy in two GEM models [transgenic adenocarcinoma of the mouse prostate (TRAMP) and PSP94 gene-directed transgenic mouse adenocarcinoma of the prostate (PSP-TGMAP)]. Four distinct phases of neoangiogenesis in cancer development were observed, specifically, ( a ) an early latent phase; (b) establishment of a peripheral capsular vascular structure as a neoangiogenesis initiation site; (c ) a peak in tumor vascularity that occurs before aggressive tumor growth; and (d ) rapid tumor growth accompanied by decreasing vascularity. Microsurgical inter- ventions mimicking local delivery of antiangiogenesis drugs were done by ligating arteries upstream from feeder vessels branching to the prostate. Microsurgery produced an imme- diate reduction of tumor blood flow, and flow remained low from 1 h to 2 weeks or longer after treatment. Power Doppler, in conjunction with micro-CT, showed that the tumors recruit secondary blood supplies from nearby vessels, which likely accounts for the continued growth of the tumors after surgery. The microsurgical model represents an advanced angiogenic prostate cancer stage in GEM mice corresponding to clinically defined hormone-refractory prostate cancer. Three-dimensional power Doppler imaging is completely noninvasive and will facilitate basic and preclinical research on neoangiogenesis in live animal models. [Cancer Res 2007;67(6):2830–9] Introduction The formation of tumor-associated new blood vessels, neoangio- genesis, is the cardinal feature of virtually all malignant tumor growth and the initiation of metastasis. Because of this common- ality, probing tumor-induced and associated angiogenesis is a viable approach to detect and treat a wide range of cancers. Recently, accumulated evidence has confirmed that the combina- tion of chemotherapy with inhibition of neovascularization is a promising therapeutic strategy. This strategy is motivated by the fact that tumor growth beyond 2 to 3 mm diameter is strictly dependent on neoangiogenesis ( for reviews, see refs. 1–4). However, many potential antiangiogenic therapies have not lived up to the expectations of preclinical trials because those drugs are usually cytotoxic and lack the specificity to target angiogenic tissues in tumors. This occurs because normal vascular develop- ment or angiogenesis is required for many normal physiologic organ and tissue maintenance processes, and both endogenous angiogenic promoters and angiogenic inhibitors are required (2, 3). Tumor-associated angiogenesis is controlled only by a different balance between angiogenic promoters and inhibitors relative to normal tissues (3). Furthermore, maximum tolerated doses and responses to anticancer treatments vary widely among individuals (4). Advances in imaging are transforming our understanding of angiogenesis and the evaluation of drugs that stimulate or inhibit angiogenesis in preclinical models and human disease ( for reviews, see refs. 2, 5–7). The objective of this study is to image in vivo the process of neoangiogenesis using a genetically engineered mouse (GEM) prostate cancer model. Prostate cancer is the most common cancer and the third leading cause of cancer mortality in adult men in North America. Prostatectomy and radiation therapy are more widely used to control early-stage disease. Although most patients initially respond to hormone therapy, almost all prostate cancer patients eventually develop progressive disease, a condition called androgen-independent or hormone-refractory prostate cancer. Currently, there is no curative therapy for hormone-refractory prostate cancer. Because prostate cancer does not occur naturally in rodents, and because mice are the most prominent model organisms for research, basic and preclinical studies frequently employ GEM Note: Supplementary data for this article are available at Cancer Research Online (http://cancerres.aacrjournals.org/). Requests for reprints: Jim W. Xuan, Urology Research Laboratory, London Health Sciences Centre, 375 South Street, London, ON, Canada, N6A 4G5. Phone: 519-667- 6682; Fax: 519-432-7367; E-mail: [email protected] or James C. Lacefield, Department of Electrical and Computer Engineering, University of Western Ontario, 279 Thompson Engineering Building, London, ON, Canada, N6A 5B9. Phone: 519-661- 2111, ext. 84303; Fax: 519-850-2436; E-mail: [email protected]. I2007 American Association for Cancer Research. doi:10.1158/0008-5472.CAN-06-3944 Cancer Res 2007; 67: (6). March 15, 2007 2830 www.aacrjournals.org Research Article Research. on May 12, 2016. © 2007 American Association for Cancer cancerres.aacrjournals.org Downloaded from

Welcome message from author
This document is posted to help you gain knowledge. Please leave a comment to let me know what you think about it! Share it to your friends and learn new things together.
Transcript
Functional Neoangiogenesis Imaging of Genetically Engineered
Mouse Prostate Cancer Using Three-Dimensional
Power Doppler Ultrasound
Jim W. Xuan,1Michael Bygrave,
6Hongyi Jiang,
1Fatma Valiyeva,
1Joy Dunmore-Buyze,
6
David W. Holdsworth,2,6
Jonathan I. Izawa,1Glenn Bauman,
3Madeleine Moussa,
4
Scott F. Winter,7Norman M. Greenberg,
7Joseph L. Chin,
1Maria Drangova,
2,6
Aaron Fenster,2,3,6
and James C. Lacefield2,5,6
Departments of 1Surgery, 2Medical Biophysics, 3Oncology, 4Pathology, and 5Electrical and Computer Engineering, University of WesternOntario and 6Imaging Research Laboratories, Robarts Research Institute, London, Ontario, Canada; and 7Clinical Research Division,Fred Hutchinson Cancer Research Center, Seattle, Washington
Abstract
We report the first application of high-frequency three-dimensional power Doppler ultrasound imaging in a geneti-cally engineered mouse (GEM) prostate cancer model. Weshow that the technology sensitively and specifically depictsfunctional neoangiogenic blood flow because little or no flowis measurable in normal prostate tissue or tumors smallerthan 2–3 mm diameter, the neoangiogenesis ‘‘switch-on’’ size.Vascular structures depicted by power Doppler were verifiedusing Microfil-enhanced micro-computed tomography (micro-CT) and by correlation with microvessel distributions mea-sured by immunohistochemistry and enhanced vascularityvisualized by confocal microscopy in two GEM models[transgenic adenocarcinoma of the mouse prostate (TRAMP)and PSP94 gene-directed transgenic mouse adenocarcinomaof the prostate (PSP-TGMAP)]. Four distinct phases ofneoangiogenesis in cancer development were observed,specifically, (a) an early latent phase; (b) establishment of aperipheral capsular vascular structure as a neoangiogenesisinitiation site; (c) a peak in tumor vascularity that occursbefore aggressive tumor growth; and (d) rapid tumor growthaccompanied by decreasing vascularity. Microsurgical inter-ventions mimicking local delivery of antiangiogenesis drugswere done by ligating arteries upstream from feeder vesselsbranching to the prostate. Microsurgery produced an imme-diate reduction of tumor blood flow, and flow remained lowfrom 1 h to 2 weeks or longer after treatment. Power Doppler,in conjunction with micro-CT, showed that the tumors recruitsecondary blood supplies from nearby vessels, which likelyaccounts for the continued growth of the tumors aftersurgery. The microsurgical model represents an advancedangiogenic prostate cancer stage in GEM mice correspondingto clinically defined hormone-refractory prostate cancer.Three-dimensional power Doppler imaging is completely
noninvasive and will facilitate basic and preclinical researchon neoangiogenesis in live animal models. [Cancer Res2007;67(6):2830–9]
Introduction
The formation of tumor-associated new blood vessels, neoangio-genesis, is the cardinal feature of virtually all malignant tumorgrowth and the initiation of metastasis. Because of this common-ality, probing tumor-induced and associated angiogenesis is aviable approach to detect and treat a wide range of cancers.Recently, accumulated evidence has confirmed that the combina-tion of chemotherapy with inhibition of neovascularization is apromising therapeutic strategy. This strategy is motivated by thefact that tumor growth beyond 2 to 3 mm diameter is strictlydependent on neoangiogenesis ( for reviews, see refs. 1–4).However, many potential antiangiogenic therapies have not lived
up to the expectations of preclinical trials because those drugs areusually cytotoxic and lack the specificity to target angiogenictissues in tumors. This occurs because normal vascular develop-ment or angiogenesis is required for many normal physiologicorgan and tissue maintenance processes, and both endogenousangiogenic promoters and angiogenic inhibitors are required (2, 3).Tumor-associated angiogenesis is controlled only by a differentbalance between angiogenic promoters and inhibitors relative tonormal tissues (3). Furthermore, maximum tolerated doses andresponses to anticancer treatments vary widely among individuals(4). Advances in imaging are transforming our understanding ofangiogenesis and the evaluation of drugs that stimulate or inhibitangiogenesis in preclinical models and human disease ( for reviews,see refs. 2, 5–7).The objective of this study is to image in vivo the process
of neoangiogenesis using a genetically engineered mouse (GEM)prostate cancer model. Prostate cancer is the most common cancerand the third leading cause of cancer mortality in adult men inNorth America. Prostatectomy and radiation therapy are morewidely used to control early-stage disease. Although most patientsinitially respond to hormone therapy, almost all prostate cancerpatients eventually develop progressive disease, a condition calledandrogen-independent or hormone-refractory prostate cancer.Currently, there is no curative therapy for hormone-refractoryprostate cancer.Because prostate cancer does not occur naturally in rodents, and
because mice are the most prominent model organisms forresearch, basic and preclinical studies frequently employ GEM
Note: Supplementary data for this article are available at Cancer Research Online(http://cancerres.aacrjournals.org/).
Requests for reprints: Jim W. Xuan, Urology Research Laboratory, London HealthSciences Centre, 375 South Street, London, ON, Canada, N6A 4G5. Phone: 519-667-6682; Fax: 519-432-7367; E-mail: [email protected] or James C. Lacefield,Department of Electrical and Computer Engineering, University of Western Ontario,279 Thompson Engineering Building, London, ON, Canada, N6A 5B9. Phone: 519-661-2111, ext. 84303; Fax: 519-850-2436; E-mail: [email protected].
I2007 American Association for Cancer Research.doi:10.1158/0008-5472.CAN-06-3944
Cancer Res 2007; 67: (6). March 15, 2007 2830 www.aacrjournals.org
Research Article
Research. on May 12, 2016. © 2007 American Association for Cancercancerres.aacrjournals.org Downloaded from
autochthonous prostate cancer models ( for reviews, see refs. 8, 9).These GEM prostate cancer models normally employ promotersfrom prostate tissue-specific genes (probasin, refs. 10, 11; PSP94,refs. 12–14), or prostate-specific antigen to drive prostate-tissue–specific targeting of oncogene SV40 T antigen (T and/or t).Transgenic models, in contrast to s.c. or orthotopic tumorsimplanted in immunodeficient nude mice, show salient aspectsof prostate cancer, including a complete process of tumorigenesis,tumor progression, and metastasis, along with angiogenesismimicking the human disease.Our research team and collaborators have developed high-
frequency (>20 MHz) three-dimensional ultrasound microimagingfor measuring tumor progression in mouse cancer models (15–17)and showed the use of the technology in a GEM prostate cancermodel (12, 13). The sensitivity of high-frequency power Doppler tochanges in tumor blood flow produced by an antivascular agentwas first shown in an orthotopic melanoma in an athymic nudemouse model (18). However, xenograft models are frequently notrepresentative of the corresponding human tumor.Not all blood vessels are functional in living organisms.
Examination of the morphologic structure may not necessarilyallow direct assessment of tumor microcirculatory function ( for areview, see ref. 19). This paper reports the use of high-frequencypower Doppler to obtain the first high-resolution three-dimen-sional images of functional neoangiogenesis in a live transgenicprostate cancer model, the PSP94 gene-directed transgenic mouseadenocarcinoma of the prostate (PSP-TGMAP) model.
Materials and Methods
Microscopic and macroscopic prostate cancer in geneticallyengineered transgenic mice, anatomy and histology and pathologyanalysis. PSP94 gene and rat probasin-directed SV40T/t antigen GEM-
prostate cancer PSP-TGMAP (12–14) and transgenic adenocarcinoma of the
mouse prostate (TRAMP) (10) models were used. Transgenic mice in both
models develop rapidly growing tumors within 4 to 8 months of age. Allanimal experiments were conducted according to standard protocols
approved by the University Council on Animal Care. Vascular anatomy was
identified by following the text by Cook (20).8
Three-dimensional ultrasound imaging. Three-dimensional gray-scale (anatomic) and power Doppler (blood flow) images showing the
prostate and surrounding structures were obtained using a Vevo 770
(VisualSonics Inc., Toronto, ON) ultrasound microimaging system with a
30-MHz transducer and three-dimensional image visualization andanalysis software described previously (21). When operated in power
Doppler mode, the nominal in-plane spatial resolution was 140 Am(lateral) by 130 Am (depth), the out-of-plane resolution was 140 Am, andthe system parameters were set to provide sensitivity to vessels with flow
velocities >3 mm/s.
Anatomic images were used to measure tumor volumes as described in
ref. (16). Tumor vascularity was quantified in power Doppler images bycomputing the color pixel density (CPD), which is equal to the percentage of
image voxels within a region of interest that exhibit detectable flow. Three
regional CPD values were obtained from each image using a tumor
boundary determined from the three-dimensional gray-scale image: (a) anoverall CPD value for the entire tumor; (b) a peripheral CPD value within a
three-dimensional shell extending 1 mm inward from the tumor boundary,
and (c) an internal CPD value corresponding to the volume in the interior ofthe tumor >1 mm from its boundary. Peripheral CPD measurements in wild-
type mouse prostate were done within a 0.5-mm-thick shell around the
perimeter of the gland.
Microfil-enhanced X-ray micro-computed tomography. Micro-CTimages were obtained by sacrificing the mice, clearing the blood with
heparinized saline, and infusing a radiopaque silicone polymer (Microfil
MV-122, Flow Tech, Carver, MA). Each mouse was imaged using a GE
eXplore Locus micro-CT scanner (GE Healthcare Biosciences, London, ON);720 projection views were obtained at 0.5j intervals, and three-dimensionalCT images were reconstructed with 45 � 45 � 45-Am3 voxels.
Entire-tumor, peripheral, and internal regions of interest, defined as in
the Doppler CPD analysis, were manually outlined in the CT images usingthree-dimensional analysis software (MicroView, GE Healthcare Bioscien-
ces). Voxels with CT numbers greater than an automatically determined
threshold value (22) were treated as vessels and used to compute the
vascular volume. Division of the vascular volume by the total volume of theregion of interest yielded the vascular density, which has the same units (%)
as, and hence can be compared with, the power Doppler CPD of the region.
For visualization of vascular anatomy, three-dimensional surface renderingsof vessels were generated using the MicroView software. Different colors
were assigned to anatomically identifiable features to highlight the prostate
and specific branches of the vasculature.
Immunohistochemistry analysis of microvessel distribution andFITC-labeled lectin and CD31 high-resolution confocal microscopy.Large prostate tumors (2.5 cm in diameter, at 28–38 weeks of age) from
PSP-TGMAP mice were dissected, and frozen sections were prepared for
immunohistochemistry staining from areas of the outer ring and inner coreof the freshly dissected sample. Immunohistochemistry protocols were
followed as we reported previously (13, 14) using a 1:50 dilution of rat
antimouse platelet/endothelial cell adhesion molecule 1 (CD31, BDPharMingen, San Diego, CA). Vascular labeling with FITC-lectin, CD31
immunofluorescence, and high-resolution confocal microscopy were mostly
done in TRAMP mice. Following several washes with PBS, slides were
incubated with a 1:200 dilution of AlexaFluor594 goat anti-rat immuno-globulin G (Molecular Probes, Eugene, OR), washed several times with PBS,
and coverslipped. Images were collected using a Zeiss LSM 510 confocal
laser scanning microscope.
Microsurgical procedure. In normal mice, the prostate and bladdertypically share blood supplied by the superior vesical artery, which branches
from the internal iliac artery, and by the inferior vesical artery, which
branches from either the inferior iliac or the superior vesical artery ( formore detailed views of the anatomy, see Fig. 1C , Supplementary Fig. S4, and
ref. 20). The majority of the blood supply to the prostate was blocked by
ligating the branches of the inferior vesical artery and vein using 11-0 nylon
suture. If the tumor was small and localized to one side of the prostate, thenonly the vessels on that side were ligated; otherwise, both the left and right
vesical arteries and veins were blocked. Animal surgical procedures followed
university Animal Care and Veterinary Services standard operating
procedures.All experimental procedures are described in detail in the Supplementary
material.
Results
High-resolution, three-dimensional power Doppler ultra-sound imaging detects tumor-associated angiogenesis verifiedby Microfil-enhanced micro-CT in a GEM prostate cancermodel. Three-dimensional power Doppler and Microfil-enhancedmicro-CT images of five prostate tumors with volumes rangingfrom 7 to 1300 mm3 (2–15 mm diameter) were acquired tocompare the vascular architecture at different stages of tumorgrowth. Each row in Fig. 1A , from left to right , consists of a three-dimensional power Doppler image, a three-dimensional micro-CTimage aligned with the three-dimensional power Doppler, a two-dimensional plane through the power Doppler, a matchedtwo-dimensional plane through the micro-CT, and an overlaycomparing the two-dimensional images. The vessels labeledwith arrows were used to register the images. Comparisons ofvasculature depicted in the two modalities suggest that the8 http://www.informatics.jax.org/cookbook/
Neoangiogenesis Imaging of Mouse Prostate Cancer Model
www.aacrjournals.org 2831 Cancer Res 2007; 67: (6). March 15, 2007
Research. on May 12, 2016. © 2007 American Association for Cancercancerres.aacrjournals.org Downloaded from

smallest vessels reliably detected by power Doppler were f100 to150 Am diameter.A movie (Supplementary Fig. S1) shows user manipulation of
registered power Doppler and micro-CT images of the 370-mm3
tumor shown in Fig. 1A using image visualization softwaredeveloped in our laboratory (21). Rotation of the images enhancesthe viewer’s appreciation of the three-dimensional nature of thevascular structures and shows that the majority of the vasculature
depicted in the images is concentrated in the peripheral regions ofthe tumor. This impression is confirmed by the regional vascularitydata (Fig. 1B) obtained from the three-dimensional Doppler andmicro-CT images of the tumors shown in Fig. 1A . Peripheralvascularity is greater than internal vascularity in five of the siximages; the micro-CT image of the 370-mm3 tumor was the onlyexception to this pattern. Inspection of that CT image revealed thatMicrofil formed small pools in the inner core of that tumor. Those
Micro-CT Verifies Vascular Structures Depicted by High-Frequency Power Doppler
Regional Tumor Vascularity in Images in Figure 1A
Blood Supply to Prostate in Wildtype Mice
Figure 1. Power Doppler ultrasoundimages of vasculature in a GEM-prostatecancer model are verified by Microfil-enhanced micro-CT. A, from left to right inthe first row , a three-dimensional powerDoppler image, a three-dimensionalmicro-CT image, a two-dimensional planefrom the three-dimensional power Dopplerimage, the matching two-dimensionalplane from the three-dimensionalmicro-CT image, and an overlay of thetwo-dimensional power Doppler andmicro-CT images of a 7.1-mm3 tumor.Second and third rows , equivalentsequences of images from a 130-mm3
tumor and 370-mm3 tumor, respectively.Arrows, sites used for registration ofcorresponding vessels. Bars, 1 mm.B, bar graphs of internal and peripheralvascularity estimated from the three-dimensional power Doppler and micro-CTimages shown in (A). The power Dopplerand micro-CT vascularity metrics (CPDand vascular density, respectively) areshown on separate graphs. C, Dopplerand CT images of the blood supply to anormal prostate and surrounding tissuesare presented as controls for comparisonwith the images of tumor vasculature. Thesuperior and inferior vesical arteriesbranch from the internal iliac artery towardthe bladder and prostate, but only theinferior vesical supplies the prostate.
Cancer Research
Cancer Res 2007; 67: (6). March 15, 2007 2832 www.aacrjournals.org
Research. on May 12, 2016. © 2007 American Association for Cancercancerres.aacrjournals.org Downloaded from

Microfil pools seem to have increased the CT internal vasculardensity estimate for that tumor.Figure 1C shows a power Doppler view of a typical control
prostate and surrounding tissue. The few functional vessels withsufficient flow to be detected by power Doppler supply the bladderand surrounding tissues; power Doppler shows flow around theoutside of the prostate, but is not sensitive to blood flow within theprostate in the control mice. The micro-CT image in Fig. 1Cillustrates the vascular anatomy in the vicinity of the prostate inwild-type mice; key arteries on the animal’s left side have beenhighlighted. Small vessels (50–100 Am diameter) penetrating shortdistances (<1 mm) inside the prostate could be seen if the imagewas magnified. The spermatic artery branches from the abdominalaorta and passes near, but does not supply, the prostate in wild-type mice. These observations are consistent with the anatomydepicted in the text by Cook (20).8 Supplementary Fig. S2 showstumor-associated vascularity changes consistently observed in 17PSP-TGMAP mice, including, in this example, an abnormal feedervessel from the spermatic artery to the tumor, which was not seenin any of the eight wild-type mice imaged.
Power Doppler imaging provides an effective neoangio-genesis functional assay: correlation of three-dimensionalpower Doppler imaging with microvessel determination inhistopathologic and high-resolution confocal microscopyfluorescence staining. The differences in peripheral and internalvascularity in the power Doppler images of tumors and thedifferences in vascularity depicted in prostate tumors comparedwith normal mouse prostate suggest that power Doppler can beused to detect the functional consequences of neovascularizationin GEM prostate cancer models. To support these interpretations,immunohistochemical measurements of microvessel density (MVD)were done with an antibody to the endothelial cell marker CD31,which serves as a surrogate marker for angiogenesis. Five largetumors (2–3 cm diameter) were dissected, and frozen sections oftumor specimens from the outer ring and inner core were studiedseparately. Figure 2A shows immunohistochemistry results. Asshown in Fig. 2B, graph 1 , total CD31 staining signals in outer ringare statistically significantly higher than in the inner core (t test,P = 0.004). Graph 2 (Fig. 2C) shows the CD31 vessel counts fromdifferent vessel size ranges and shows that most of the micro-
Figure 2. Immunohistochemistry(IHC ) and high-resolution confocalmicroscopy of FITC-labeled lectin andCD31 staining in GEM-prostate cancermodels (PSP-TGMAP and TRAMP).A, immunohistochemistry by CD31 infrozen sections prepared from freshlydissected large tumors (2.5 cm indiameter, at 28 wks of age) inPSP-TGMAP mice. Areas of the outer ring(top) and innner core (bottom ) wereanalyzed separately. Magnified (�20 and�40) views of the boxed region in the �10image are also shown. H&E (middle ) andnormal prostate tissue (right ) wereused as control. Graphs (C and D )show comparisons of CD31 signals formicrovessel distribution using totalmicrovessel counts (B) and classificationof small (10–30 Am) and large (100 Am)vessels in the normal prostate tissue andouter ring and inner core of large tumors.D, in vivo FITC-lectin perfusion (green)and postfixation immunohistochemistryto detect CD31 (red ) in TRAMP mice.Prostate vasculature is essentiallynormal at 12 wks of age. At 18 wks, thePIN phenotype or well- to moderatelydifferentiated adenocarcinomas(18 wks �2) were highly angiogenic.In 24-week-old TRAMP mice, in the interiorof large poorly differentiated tumors,regions of hemorrhage (arrowheads )were shown by the pooling of FITC-lectin.Magnification, 40�; 325 � 325 Amof specimen.
Neoangiogenesis Imaging of Mouse Prostate Cancer Model
www.aacrjournals.org 2833 Cancer Res 2007; 67: (6). March 15, 2007
Research. on May 12, 2016. © 2007 American Association for Cancercancerres.aacrjournals.org Downloaded from
vessels (12–24 Am diameter, i.e., the true MVD) were detected inthe outer ring of the tumor mass. Vessels of 100 Am or larger weremostly located in the inner core. H&E staining of the tumor mass(Fig. 2A) showed that the inner core consisted primarily of necrosis,hemorrhage (seen at �40), large blood vessels, and a lower densityof poorly differentiated prostate cancer cells, which is a vasculartumor structure. The concentration of larger vessels in the core ofthe tumor could explain the CT vascular density results (Fig. 1B)for the large tumor, because large blood vessels would providespace for the observed pooling of the Microfil. Conversely, the outerring is an active neuroendocrine tumor (13) structure with lessnecrosis and a high density of tumor cells. Control measurementson five normal prostate specimens showed no or few MVD.Similar CD31 staining was observed in the TRAMP model. Figure
2D shows high-resolution confocal microscopy images of FITC-labeled lectin and CD31 staining in TRAMP mice (12–24 weeks of
age), demonstrating that neoangiogenic vessels are much moredisorganized in GEM-prostate cancer tissues than are vessels in thenormal mouse prostate. In the FITC images in Fig. 2D , the vascularnetwork has broken down and allowed the lectin to leak out of thevessels and aggregate into large bright-green globs. This leakinesscorresponds to the appearance of hemorrhagic regions of bloodpooling on the H&E-stained slides (which was also observed inPSP-TGMAP tumors). It is likely that the blood leaking out of thesevessels was flowing too slowly to be detected by Doppler, but thevessel permeability may have contributed to the pooling of Microfilin the CT image of the large tumor in Fig. 1A . In addition, regionaldifferences exist in the blood flow within the tumor, as shown bythe fact that regions of necrosis as well as regions of live cells wereobserved within the tumor mass (age of 24 weeks).Longitudinal three-dimensional power Doppler imaging
shows kinetics of tumor-associated angiogenesis, with a peak
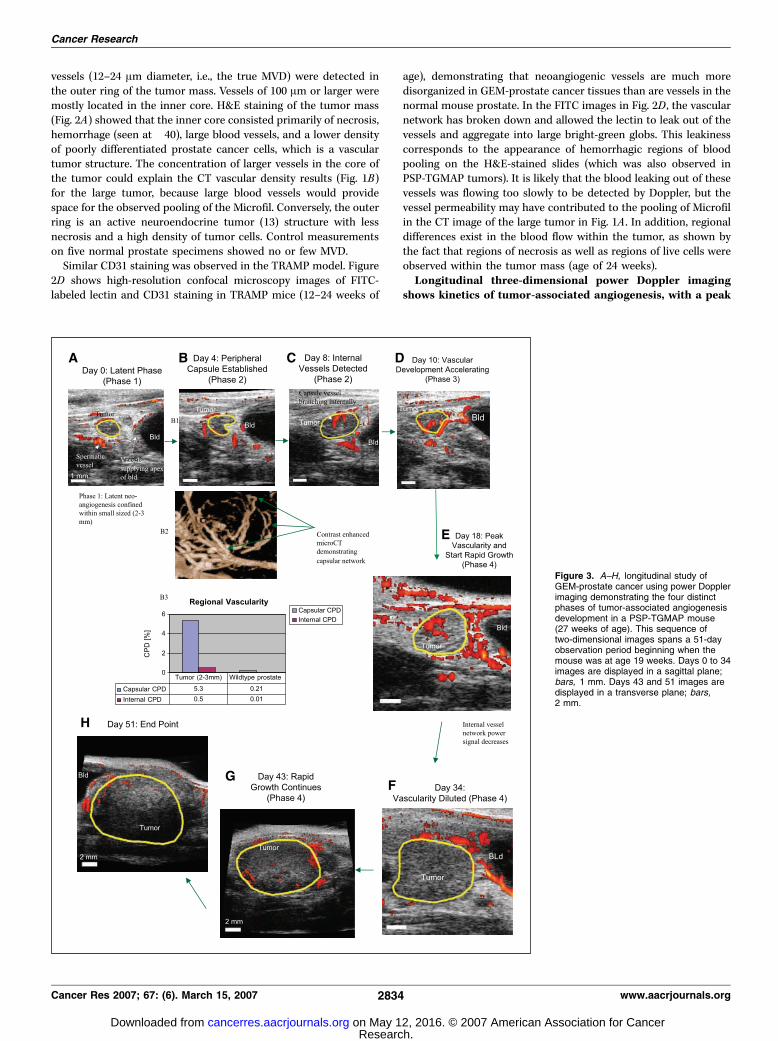
Figure 3. A–H, longitudinal study ofGEM-prostate cancer using power Dopplerimaging demonstrating the four distinctphases of tumor-associated angiogenesisdevelopment in a PSP-TGMAP mouse(27 weeks of age). This sequence oftwo-dimensional images spans a 51-dayobservation period beginning when themouse was at age 19 weeks. Days 0 to 34images are displayed in a sagittal plane;bars, 1 mm. Days 43 and 51 images aredisplayed in a transverse plane; bars,2 mm.
Cancer Research
Cancer Res 2007; 67: (6). March 15, 2007 2834 www.aacrjournals.org
Research. on May 12, 2016. © 2007 American Association for Cancercancerres.aacrjournals.org Downloaded from

in vascularity development before rapid tumor volumegrowth. Longitudinal three-dimensional gray-scale and powerDoppler imaging was done in 10 PSP-TGMAP mice. A four-phasedescription (Fig. 3A–H) of the entire neoangiogenesis process issummarized from an illustrative mouse (27 weeks of age). Growthand vascularity curves (Fig. 3N–P) show longitudinal relationshipsbetween the internal, peripheral, and overall vascularity (CPD) andtumor volume. Microfil-enhanced micro-CT images were alsoacquired from some of the mice after they were euthanized.In a first, ‘‘latent’’ phase illustrated in Fig. 3A (designated day 0),
tumor diameters are <2 to 3 mm. Power Doppler exhibited minimalblood flow, although gray-scale ultrasound is capable of detectingGEM-prostate cancer at this stage.The second phase establishes a peripheral capsular vascular
structure (Fig. 3B-1), which was confirmed by contrast agentenhanced micro-CT imaging (Fig. 3B-2). Although the tumorinitially grew slowly (reaching 3.65 mm3 on day 4), the Dopplervascularity (CPD) increased to 3.6%. This increase in CPD reflectsincreased flow in the peripheral capsule of the tumor because theperipheral CPD increased from 0.9% to 4.6% from days 0 to 4,whereas the internal CPD remained similar to the vascularitymeasured in wild-type mice at 0.2% to 0.4% (graphs shown in Figs.
3B-3 and 3O). Similar observations were made in the otheruntreated mice with tumors smaller than 2 to 3 mm in diameter(n > 5; Fig. 3B and J).The peripheral capsular vascular structure was observed consis-
tently in tumors larger than 2 mm diameter, as illustrated byadditional examples in Fig. 3I–M . Figure 3I is a two-dimensionalDoppler image of a small tumor that has not yet developed aperipheral capsular structure. The vasculature of this tumor is visiblydifferent from the subsequent examples. Figure 3J is a three-dimensional Doppler image suggesting the beginning of a capsularstructure; the arrow indicates the spermatic vessel that washighlighted in Fig. 3A . That capsular structure became moreprominent a few days later (Fig. 3B-1). Figure 3K is a three-dimensional Doppler image of a 4-mm-diameter tumor showing awell-developed vascular capsule encircling the perimeter of thetumor. Figure 3L is a three-dimensional Doppler image of an8-mm-diameter tumor that also possesses prominent blood flowaround its perimeter. Figure 3M is a gross pathology photograph of avery large tumor obtained after the mouse was infused with Microfil.The yellow Microfil highlights the tumor’s peripheral vessels.The third phase is characterized by a dramatic increase in tumor
vascularity. As shown in Fig. 3N (blue curve), from days 3 up to 17,
Figure 3 Continued. I–M, demonstrationof peripheral capsular structures, which arehypothesized to be neoangiogenesisinitiation sites. I, a two-dimensionalDoppler image of a small tumor (1.88 mm3
volume, 1.8 mm maximum diameter) in a60-week-old mouse that had not yetdeveloped a peripheral capsular vascularstructure. J, three-dimensional Dopplerimage showing a developing peripheralcapsular vascular structure in a 2.1-mm3
(1.6 mm maximum diameter) tumor in a19-week-old mouse. K, coronal view ofthree-dimensional Doppler and gray-scaleimage showing a 4-mm-diameter tumorin 27-week-old mouse that possesseswell-defined capsular vascularity.L, three-dimensional Doppler imageshowing the peripheral capsular vascularstructure of a 320-mm3 (8.0-mm-diameter)tumor in a 34-week-old mouse. M, grosspathology photograph of a very large(about 20 mm diameter) tumor in a32-week-old mouse taken after injectionof Microfil. N–P, graphs derived from thelongitudinal study depicted in A–Hsummarize changes in tumor vascularity(measured by CPD) as a function of time(in days). N, tumor volume (blue ) andvascularity measured over the entire tumor(red). O, coincident timing of vascularitypeaks measured over the entire tumor(red), the peripheral region of the tumor(purple ), and the internal portion of thetumor (black ). P, the ratio of internal CPDto peripheral CPD (green ) peaks justbefore the tumor volume (blue ) enters itsrapid growth phase.
Neoangiogenesis Imaging of Mouse Prostate Cancer Model
www.aacrjournals.org 2835 Cancer Res 2007; 67: (6). March 15, 2007
Research. on May 12, 2016. © 2007 American Association for Cancercancerres.aacrjournals.org Downloaded from

the tumor grew slowly, but the vascularity (CPD) increaseddramatically to a maximum value of 30.9%. A transient appearanceof a well-developed internal vascular network was seen in the days8, 10, and 18 Doppler images (Fig. 3C–E). The peripheral vascularityremained greater than the internal vascularity at all time points(Fig. 3O, purple and black curves , and Fig. 3P, green curve). The peakin the overall CPD for the entire tumor was coincident with peaksin the internal CPD (Fig. 3O) and the ratio of the internal CPD toperipheral capsular CPD (Fig. 3P, green curve).The fourth phase is a period of rapid tumor growth accompanied
by decreasing vascularity. The tumor volume increased by a factorof 30 from day 18 (Fig. 3E) to day 34 (Fig. 3F) after having changedby only a factor of 3 over the 18 preceding days. During this rapidgrowth, the overall CPD regressed to the 1–4% range measured ondays 0 to 4 and remained around this level for the rest of the timethe tumor was followed. The ratio of internal to peripheral CPD(Fig. 3P, green curve) simultaneously decreased to values similar tothe earliest measurements. This decrease in vascularity in theinternal portion of the tumor is evident in the days 34, 43, and 51(Fig. 3F–H) power Doppler images and supported by the lack ofinternal vessels in the postmortem image. Figure 3H shows the endpoint (day 51), with a large tumor volume (1250 mm3) and lowvascularity. Note that after day 44, the tumor was too large topermit Doppler measurements over its entire volume (similar tothe example in Supplementary Fig. S3), so only volume data wereobtained for the last three time points. All three graphs (Fig. 3N–P)show that, by any of the measures of vascular development, tumorvascularity peaks and regresses before the tumor reaches itsmaximum volume. Similar examples of low vascularity in anotherthree mice with four tumors are shown in Supplementary Fig. S3with both two-dimensional and three-dimensional power Dopplerand micro-CT.The increased vascularity and progression of angiogenesis
observed by longitudinal imaging of the PSP-TGMAP model wasconfirmed in the TRAMPmodel by in vivo FITC-lectin perfusion andpostfixation immunohistochemistry to detect CD31 in mice at agesof 12, 18, and 24 weeks (Fig. 2D). At 18 weeks, some mice displaymoderate angiogenesis that is typical for the prostate intraepithelialneoplasia (PIN) phenotype, whereas other mice display well- tomoderately differentiated adenocarcinomas. Tumors of 18 weeks�2were highly angiogenic. A compromised vascular structure, similarto that observed in PSP-TGMAP mice in the interior of large, poorlydifferentiated tumors, is shown in 24-week-old TRAMP miceby the regions of hemorrhage visualized by the pooling of FITC-lectin (arrowheads).An antivascular microsurgery mimicking interventional
therapy by ligation of feeder vessels branching from the iliacartery by power Doppler imaging. Figure 4 illustrates thevascular response of a PSP-TGMAP tumor to microsurgicalligation of feeder vessels branching from the iliac artery. Theintervention temporarily eliminates the capsular and intratumorblood flow detected by power Doppler. Similar images wereobtained from each of the eight treated mice. A sequence ofphotographs detailing the microsurgery procedure is shown inSupplementary Fig. S4.The first two Doppler images (Fig. 4A and B) show coronal and
transverse three-dimensional views acquired before surgery. Thistumor possessed several prominent blood vessels in its peripherycontributing to an overall vascularity (CPD) of 4.1% (Fig. 4I, dashedcurve). One hour after microsurgery (Fig. 4C), the CPD was reducedto 0.85%, indicating that the intervention eliminated most of the
blood flow to the tumor, or at least reduced it to levels too low to bedetected by power Doppler. The branching vessel seen near thebottom of the tumor in Fig. 4C to F (open arrows) is a spermaticartery or vein passing below the prostate and outside the tumor.No short-term recovery of blood flow is evident in the imagesacquired 1 h (Fig. 4C) and 8 h (Fig. 4D) after surgery. Blood flow tothe surface of the bladder, seminal vesicles, spermatic vessels, andcoagulation gland (data not shown) remained detectable immedi-ately after surgery (the pulsed Doppler spectrum of flow in thevesical artery supplying the bladder is shown in SupplementaryFig. S5). The residual blood flow to the bladder is apparently suppliedby branches of the superior vesical artery (shown in Fig. 4E).Detectable capsular flow returned by the fourth and eighth days aftersurgery (Fig. 4E and F); by day 8, the CPD had partially recovered to2.4%. The mouse was followed for 6 more days, during which time,the CPD remained in the 2.0% to 2.5% range (Fig. 4I, dashed curve).The Microfil-enhanced micro-CT images in Fig. 4G and H show
that the surgical treatment induced regression of the vasculatureon the treated side of the prostate relative to the contralateral side.Lower vascular density was observed on the treated side (Fig. 4Gand H, arrows) of each tumor-bearing mouse that was imaged withmicro-CT.Longitudinal measurements of tumor volume and vascular CPD
for the tumor shown in Fig. 4A to F are plotted in Fig. 4I . After theimmediate postsurgical drop, the CPD followed a graduallyincreasing trend until to about 10 days after surgery and thendecreased slightly as the tumor became larger. The surgicalintervention apparently prevented the dramatic peak in CPDobserved in many untreated tumors.Power Doppler measurements meaningfully discriminate be-
tween tumors with differing levels of active blood flow. Figure 4Jshows cumulative distribution functions for CPD values measuredfrom the entire tumor in untreated and treated mice. At the lowend of the distribution, 15 out of 37 images (41%) acquired fromtreated mice, but only 1 of 47 images (2%) from untreated mice,possessed CPD of 0.5% or less. At the high end of the distribution,20 out of 47 images (43%) acquired from untreated mice, but only3 of 37 images (8%) from treated mice, possessed CPD >3.0%.Power Doppler and Microfil-enhanced micro-CT show that
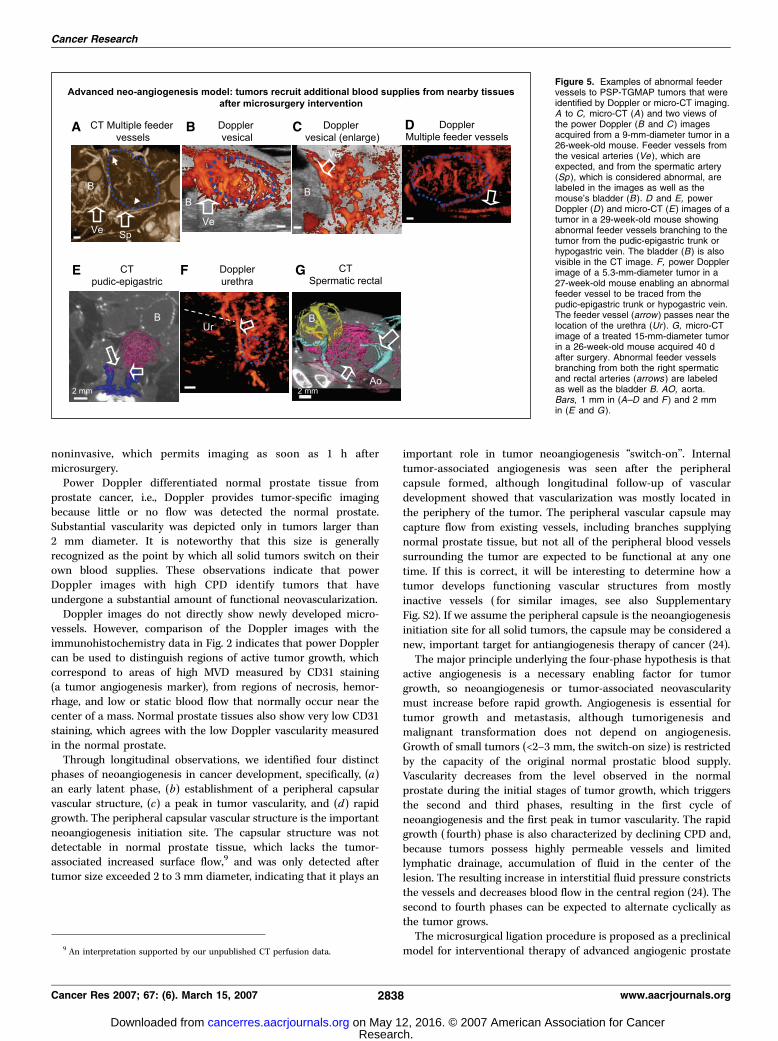
PSP-TGMAP tumors recruit additional blood supplies fromnearby vessels. To further study the mechanism of tumor growthrefractory to microsurgical blocking of blood supplies to GEM-prostate cancer, we compared Doppler and micro-CT images foreach mouse. In tumor-bearing mice, additional feeder vessels tothe prostate were identified.Figure 5A shows a coronal Microfil-enhanced micro-CT image of
an untreated tumor. The top solid arrow identifies a feeder vesselarising from a vesical artery running across the surface of thebladder, which presumably represents a portion of the prostate’soriginal blood supply. The bottom solid arrow highlights anabnormal feeder vessel from the spermatic artery to the tumor.Figure 5B and C are power Doppler images of the same tumordisplayed in sagittal and coronal views, respectively. The vesicalartery highlighted in the micro-CT image is also recognizable inboth Doppler images.Figure 5D and E show power Doppler and micro-CT images of
an untreated tumor that possesses abnormal feeder vessels fromthe pudic-epigastric trunk or hypogastric vein. Those feeder vesselsare highlighted by arrows in both images. The characteristic ‘‘U’’shape formed by the left and right pudic-epigastric trunks andhypogastric veins and the anastomotic vein that bridges the
Cancer Research
Cancer Res 2007; 67: (6). March 15, 2007 2836 www.aacrjournals.org
Research. on May 12, 2016. © 2007 American Association for Cancercancerres.aacrjournals.org Downloaded from

hypogastric veins is highlighted in blue and easily recognized inthe CT image (see also Figs. 113 and 116 in ref. 20).Figure 5F shows a power Doppler image of another untreated
tumor with an abnormal feeder vessel (arrow) arising from thevicinity of the urethra, which suggests that the feeder originatedfrom the pudic-epigastric trunk. The white dashed line delineatesthe approximate location of the segment of the urethra caudal tothe prostate as determined by inspection of the gray-scale three-dimensional ultrasound image of the same tumor.Figure 5G is a micro-CT image of a treated tumor, indicated by
the pink vasculature, acquired 40 days after surgery. In this image,it is possible to trace the left and right spermatic arteries (lightblue) from their origins on the abdominal aorta (Ao) and identifyabnormal feeder vessels (rightmost arrow) from the rightspermatic artery to the tumor. A second set of abnormal feedervessels (leftmost arrow) arising from a rectal artery is alsodepicted dorsal to the tumor. Note that the normal blood supplyfrom the vesical arteries to the prostate was eliminated by thesurgical intervention.Additional images demonstrating tumor-specific vessels branch-
ing from the internal iliac artery, spermatic artery, and pudic-
epigastric trunk are shown in Supplementary Fig. S6A to C ,respectively.
Discussion
The observations presented in this paper collectively indicatethat high-frequency three-dimensional power Doppler ultrasoundcan be used to assess functional neoangiogenesis in GEM prostatecancer models. The power Doppler signal is proportional to theconcentration of blood cells flowing at velocities high enough to bedetected by the Doppler system (e.g., > 3 mm/s in this study).The CPD is therefore considered an estimate of the fraction ofthe tissue volume that is occupied by moving blood (23). TumorCPD data reflect flow in intermediate-sized (e.g., >100 Am diameter)arterioles and venules and arteriovenous shunts. Vessels imaged bypower Doppler are functional in the sense that they support activeblood flow. This point is an important aspect of interpretingDoppler images of tumors because as few as 20% of the vessels in atumor may be perfused at any given instant, and tumor perfusionvaries both spatially and temporally (19). In addition, unlike manyother imaging techniques, Doppler ultrasound is completely
Figure 4. Responses of tumor vascularityto microsurgical ligation of feeder vesselsbranching from the inferior vesical artery.A and B, coronal and transverse views ofthree-dimensional power Doppler imagesof a 630-mm3 tumor in a 29-week-oldPSP-TGMAP mouse, acquired 1 dbefore microsurgery. The vessels to beligated are labeled in both, as is thespermatic artery, which bypasses and doesnot supply the tumor. C and D, coronalviews of three-dimensional Doppler imagesacquired 1 and 8 h after surgery. Blood flowto the tumor is visibly reduced. Thespermatic artery (open arrow ) passingbeneath the tumor is also depicted. E andF, coronal images of the same tumoracquired 5 and 8 d after surgery. Partialrecovery of blood flow to the tumor andreestablishment of the peripheral capsularvascular structure is evident. Bars, 1 mm.G and H, micro-CT images of a 23-mm-diameter tumor in a 23-week-old mouse(G) and a 15-mm-diameter tumor in a26-week-old mouse (H ), each acquired40 d after surgery. The vascularity on theside of the tumors where the ligation wasdone (arrows ) is visibly lower thanthe vascularity on the contralateral side.Bars, 5 mm in (G) and 2 mm in (H ).I, volume (blue ) and vascularity measuredover the entire tumor (CPD, in red) plottedas functions of time after surgery for thetumor depicted in A to F. J, cumulativeprobability density functions for all DopplerCPD data measured over the entirevolumes of treated (red) and untreated(blue ) tumors. The plot shows that lowCPD values usually indicated treatedtumors, and high CPD values usuallyindicated untreated tumors.
Neoangiogenesis Imaging of Mouse Prostate Cancer Model
www.aacrjournals.org 2837 Cancer Res 2007; 67: (6). March 15, 2007
Research. on May 12, 2016. © 2007 American Association for Cancercancerres.aacrjournals.org Downloaded from
noninvasive, which permits imaging as soon as 1 h aftermicrosurgery.Power Doppler differentiated normal prostate tissue from
prostate cancer, i.e., Doppler provides tumor-specific imagingbecause little or no flow was detected the normal prostate.Substantial vascularity was depicted only in tumors larger than2 mm diameter. It is noteworthy that this size is generallyrecognized as the point by which all solid tumors switch on theirown blood supplies. These observations indicate that powerDoppler images with high CPD identify tumors that haveundergone a substantial amount of functional neovascularization.Doppler images do not directly show newly developed micro-
vessels. However, comparison of the Doppler images with theimmunohistochemistry data in Fig. 2 indicates that power Dopplercan be used to distinguish regions of active tumor growth, whichcorrespond to areas of high MVD measured by CD31 staining(a tumor angiogenesis marker), from regions of necrosis, hemor-rhage, and low or static blood flow that normally occur near thecenter of a mass. Normal prostate tissues also show very low CD31staining, which agrees with the low Doppler vascularity measuredin the normal prostate.Through longitudinal observations, we identified four distinct
phases of neoangiogenesis in cancer development, specifically, (a)an early latent phase, (b) establishment of a peripheral capsularvascular structure, (c) a peak in tumor vascularity, and (d) rapidgrowth. The peripheral capsular vascular structure is the importantneoangiogenesis initiation site. The capsular structure was notdetectable in normal prostate tissue, which lacks the tumor-associated increased surface flow,9 and was only detected aftertumor size exceeded 2 to 3 mm diameter, indicating that it plays an
important role in tumor neoangiogenesis ‘‘switch-on’’. Internaltumor-associated angiogenesis was seen after the peripheralcapsule formed, although longitudinal follow-up of vasculardevelopment showed that vascularization was mostly located inthe periphery of the tumor. The peripheral vascular capsule maycapture flow from existing vessels, including branches supplyingnormal prostate tissue, but not all of the peripheral blood vesselssurrounding the tumor are expected to be functional at any onetime. If this is correct, it will be interesting to determine how atumor develops functioning vascular structures from mostlyinactive vessels ( for similar images, see also SupplementaryFig. S2). If we assume the peripheral capsule is the neoangiogenesisinitiation site for all solid tumors, the capsule may be considered anew, important target for antiangiogenesis therapy of cancer (24).The major principle underlying the four-phase hypothesis is that
active angiogenesis is a necessary enabling factor for tumorgrowth, so neoangiogenesis or tumor-associated neovascularitymust increase before rapid growth. Angiogenesis is essential fortumor growth and metastasis, although tumorigenesis andmalignant transformation does not depend on angiogenesis.Growth of small tumors (<2–3 mm, the switch-on size) is restrictedby the capacity of the original normal prostatic blood supply.Vascularity decreases from the level observed in the normalprostate during the initial stages of tumor growth, which triggersthe second and third phases, resulting in the first cycle ofneoangiogenesis and the first peak in tumor vascularity. The rapidgrowth ( fourth) phase is also characterized by declining CPD and,because tumors possess highly permeable vessels and limitedlymphatic drainage, accumulation of fluid in the center of thelesion. The resulting increase in interstitial fluid pressure constrictsthe vessels and decreases blood flow in the central region (24). Thesecond to fourth phases can be expected to alternate cyclically asthe tumor grows.The microsurgical ligation procedure is proposed as a preclinical
model for interventional therapy of advanced angiogenic prostate
Figure 5. Examples of abnormal feedervessels to PSP-TGMAP tumors that wereidentified by Doppler or micro-CT imaging.A to C, micro-CT (A) and two views ofthe power Doppler (B and C ) imagesacquired from a 9-mm-diameter tumor in a26-week-old mouse. Feeder vessels fromthe vesical arteries (Ve ), which areexpected, and from the spermatic artery(Sp ), which is considered abnormal, arelabeled in the images as well as themouse’s bladder (B ). D and E, powerDoppler (D ) and micro-CT (E) images of atumor in a 29-week-old mouse showingabnormal feeder vessels branching to thetumor from the pudic-epigastric trunk orhypogastric vein. The bladder (B) is alsovisible in the CT image. F, power Dopplerimage of a 5.3-mm-diameter tumor in a27-week-old mouse enabling an abnormalfeeder vessel to be traced from thepudic-epigastric trunk or hypogastric vein.The feeder vessel (arrow ) passes near thelocation of the urethra (Ur ). G, micro-CTimage of a treated 15-mm-diameter tumorin a 26-week-old mouse acquired 40 dafter surgery. Abnormal feeder vesselsbranching from both the right spermaticand rectal arteries (arrows ) are labeledas well as the bladder B. AO, aorta.Bars, 1 mm in (A–D and F ) and 2 mmin (E and G).
9 An interpretation supported by our unpublished CT perfusion data.
Cancer Research
Cancer Res 2007; 67: (6). March 15, 2007 2838 www.aacrjournals.org
Research. on May 12, 2016. © 2007 American Association for Cancercancerres.aacrjournals.org Downloaded from

cancer because most mice undergoing surgery showed poorlydifferentiated and neuroendocrine prostate cancer structure (Fig. 2).As with most interventional therapies, which increase survival ratesbut do not produce cures, the surgical procedure effectivelyamplifies vessel recruitment in the PSP-TGMAP mice and, thus,provides a means of modeling neoangiogenic prostate cancer. Asillustrated in Fig. 5, additional blood supplies were typicallyrecruited from the downstream branches of the internal iliac artery,the spermatic artery, or the pudic-epigastric trunk. The surgicalprocedure also provides a means to mimic local delivery ofantivascular agents, which would be most effectively used incombination with cytotoxic chemotherapy (4).In this study, Microfil-enhanced micro-CT images were used to
confirm that power Doppler presents an accurate depiction oflarge- and intermediate-sized tumor vessels and to identify theorigins of vessels feeding the tumors. The vascular castingtechnique used in this study provides a gold standard represen-tation of the vascular anatomy at sizes down to 50 Am diameterbecause the Microfil enhances X-ray contrast between the vesselsand surrounding tissue and because postmortem imaging permitsacquisition of high-resolution images without concern for the risksto the animal from high levels of X-ray exposure or extendedperiods of anesthesia. Microfil-enhanced CT images are notfunctional in the sense employed in this paper, but several otherhigh-resolution methods for functional microvascular imaging are
available, including CT and positron emission tomographyperfusion imaging (25, 26), dynamic contrast-enhanced MRI, bloodoxygen-level–dependent MRI, diffusion-weighed MRI (27), andoptical techniques such as intravital video microscopy (28).The four-phase description of GEM prostate cancer may have
direct preclinical and clinical applications to prostate cancer andother tumors. For example, the longitudinal trends in tumorgrowth and vascularity suggest that timing of interventionaltherapy to prevent large peaks in vascularity may be a criticalfactor in the effectiveness of antiangiogenic agents. Second,detection of rapid changes in tumor-associated vascular flow usingpower Doppler ultrasound may indicate a worse prognosis for bothpreclinical and clinical cases. This study also emphasizes thepotential importance of vascular imaging in clinical cancerdiagnosis and therapeutic planning.
Acknowledgments
Received 10/25/2006; revised 1/2/2007; accepted 1/18/2007.Grant support: Canadian Institute of Health Research (MOP-77684), NIH-National
Cancer Institute (2 U01 CA084296-06), the Prostate Cancer Research Foundation ofCanada, the Canada Foundation for Innovation, the Ontario Innovation Trust, and theOntario Research and Development Challenge Fund-Ontario Consortium for SmallAnimal Imaging. Aaron Fenster is a Canada Research Chair in Medical Imagingsupported by funding from the Canada Research Chairs Program.
The costs of publication of this article were defrayed in part by the payment of pagecharges. This article must therefore be hereby marked advertisement in accordancewith 18 U.S.C. Section 1734 solely to indicate this fact.
References1. Ferrara N, Kerbel RS. Angiogenesis as a therapeutictarget. Nature 2005;438:967–74.
2. Miller JC, Pien HH, Sahani D, et al. Imagingangiogenesis: applications and potential for drugdevelopment. J Natl Cancer Inst 2005;97:172–7.
3. Nyberg P, Xie L, Kalluri R. Endogenous inhibitors ofangiogenesis. Cancer Res 2005;65:3967–79.
4. Kerbel RS. Antiangiogenic therapy: a universal chemo-sensitization strategy for cancer? Science 2006;312:1171–5.
5. Ferrara KW, Merritt CR, Burns PN, et al. Evaluation oftumor angiogenesis with US: imaging, Doppler, andcontrast agents. Acad Radiol 2000;7:824–39.
6. Kiessling F, Greschus S, Lichy MP, et al. Volumetriccomputed tomography (VCT): a new technology fornoninvasive, high-resolution monitoring of tumor an-giogenesis. Nat Med 2004;10:1133–8.
7. McDonald DM, Choyke PL. Imaging of angiogenesis:from microscope to clinic. Nat Med 2003;9:713–25.
8. Abate-Shen C, Shen MM. Mouse models of prostatecarcinogenesis. Trends Genet 2002;18:S1–5.
9. Huss WJ, Maddison LA, Greenberg NM. Autochtho-nous mouse models for prostate cancer: past, presentand future. Semin Cancer Biol 2001;11:245–60.
10. Greenberg NM, Demayo F, Finegold MJ, et al.Prostate cancer in a transgenic mouse. Proc Natl AcadSci U S A 1995;92:3439–43.
11. Masumori N, Thomas TZ, Chaurand P, et al. A
probasin large T antigen transgenic mouse linedevelops prostate adenocarcinoma and neuroendocrinecarcinoma with metastatic potential. Cancer Res 2001;61:2239–49.
12. Gabril MY, Onita T, Ji PG, et al. Prostate targeting:PSP94 gene promoter/enhancer region directed prostatetissue-specific expression in a transgenic mouse pros-tate cancer model. Gene Ther 2002;9:1589–99.
13. Duan WM, Gabril MY, Moussa M, et al. Knock-in ofSV40 Tag oncogene in a mouse adenocarcinoma of theprostate (KIMAP) model demonstrates advantageousfeatures over the transgenic model. Oncogene 2005;24:1510–24.
14. Gabril MY, Duan WM, Wu GJ, et al. A novel knock-inprostate cancer model demonstrates biology similar tothat of human prostate cancer and suitable forpreclinical studies. Mol Ther 2005;11:348–62.
15. Cheung AMY, Brown AS, Hastie LA, et al Three-dimensional ultrasound biomicroscopy for xenograftgrowth analysis. Ultrasound Med Biol 2005;31:865–70.
16. Wirtzfeld LA, Wu GJ, Bygrave M, et al. Three-dimensional ultrasound microimaging for preclinicalstudies using a transgenic prostate cancer mouse model.Cancer Res 2005;65:6337–45.
17. Graham KC, Wirtzfeld LA, MacKenzie LT, et al.Three-dimensional high-frequency ultrasound imagingfor longitudinal evaluation of liver metastases inpreclinical models. Cancer Res 2005;65:5231–7.
18. Goertz DE, Yu JL, Kerbel RS, Burns PN, Foster FS.High-frequency Doppler ultrasound monitors the effects
of antivascular therapy on tumor blood flow. Cancer Res2002;62:6371–5.
19. Fleischer AC. Sonographic depiction of tumorvascularity and flow: from in vivo models to clinicalapplications. J Ultrasound Med 2000;19:55–61.
20. Cook MJ. The anatomy of the laboratory mouse.London: Academic Press; 1965. p. 113–7.
21. Fenster A, Downey DB, Cardinal HN. Three-dimen-sional ultrasound imaging. Phys Med Biol 2001;46:R67–99.
22. Otsu NA. A threshold selection method from gray-level histograms. IEEE Trans Syst Man Cyber 1979;9:62–6.
23. Rubin JM, Adler RS, Fowlkes JB, et al. Fractionalmoving blood volume: estimation with power DopplerUS. Radiology 1995;197:183–90.
24. Jain RK. Transport of molecules, particles, and cellsin solid tumors. Annu Rev Biomed Eng 1999;1:241–63.
25. Laking GR, Price PM. Positron emission tomographicimaging of angiogenesis and vascular function. Br JRadiol 2003;76:S50–9.
26. Miles KA. Tumour angiogenesis and its relation tocontrast enhancement on computed tomography: areview. Eur Rev Biomed Eng 1999;30:198–205.
27. Neenam M, Dafni H. Structural, functional, andmolecular MR imaging of the microvasculature. AnnuRev Biomed Eng 2003;5:29–56.
28. Dewhirst MW, Klitzman B, Braun RD, Brizel DM,Haroon ZH, Secomb TW. Review of methods used tostudy oxygen transport at the microcirculatory level. IntJ Cancer 2006;90:237–55.
Neoangiogenesis Imaging of Mouse Prostate Cancer Model
www.aacrjournals.org 2839 Cancer Res 2007; 67: (6). March 15, 2007
Research. on May 12, 2016. © 2007 American Association for Cancercancerres.aacrjournals.org Downloaded from

2007;67:2830-2839. Cancer Res Jim W. Xuan, Michael Bygrave, Hongyi Jiang, et al. Three-Dimensional Power Doppler UltrasoundEngineered Mouse Prostate Cancer Using Functional Neoangiogenesis Imaging of Genetically
Updated version
http://cancerres.aacrjournals.org/content/67/6/2830
Access the most recent version of this article at:
Material
Supplementary
http://cancerres.aacrjournals.org/content/suppl/2007/03/15/67.6.2830.DC1.html
Access the most recent supplemental material at:
Cited articles
http://cancerres.aacrjournals.org/content/67/6/2830.full.html#ref-list-1
This article cites 24 articles, 10 of which you can access for free at:
Citing articles
http://cancerres.aacrjournals.org/content/67/6/2830.full.html#related-urls
This article has been cited by 9 HighWire-hosted articles. Access the articles at:
E-mail alerts related to this article or journal.Sign up to receive free email-alerts
Subscriptions
Reprints and
To order reprints of this article or to subscribe to the journal, contact the AACR Publications
Permissions
To request permission to re-use all or part of this article, contact the AACR Publications
Research. on May 12, 2016. © 2007 American Association for Cancercancerres.aacrjournals.org Downloaded from
Related Documents