RESEARCH ARTICLE Open Access Functional diversity in the color vision of cichlid fishes Shai Sabbah 1 , Raico Lamela Laria 1 , Suzanne M Gray 1,2 , Craig W Hawryshyn 1,3* Abstract Background: Color vision plays a critical role in visual behavior. An animal’s capacity for color vision rests on the presence of differentially sensitive cone photoreceptors. Spectral sensitivity is a measure of the visual responsiveness of these cones at different light wavelengths. Four classes of cone pigments have been identified in vertebrates, but in teleost fishes, opsin genes have undergone gene duplication events and thus can produce a larger number of spectrally distinct cone pigments. In this study, we examine the question of large-scale variation in color vision with respect to individual, sex and species that may result from differential expression of cone pigments. Cichlid fishes are an excellent model system for examining variation in spectral sensitivity because they have seven distinct cone opsin genes that are differentially expressed. Results: To examine the variation in the number of cones that participate in cichlid spectral sensitivity, we used whole organism electrophysiology, opsin gene expression and empirical modeling. Examination of over 100 spectral sensitivity curves from 34 individuals of three species revealed that (1) spectral sensitivity of individual cichlids was based on different subsets of four or five cone pigments, (2) spectral sensitivity was shaped by multiple cone interactions and (3) spectral sensitivity differed between species and correlated with foraging mode and the spectral reflectance of conspecifics. Our data also suggest that there may be significant differences in opsin gene expression between the sexes. Conclusions: Our study describes complex opponent and nonopponent cone interactions that represent the requisite neural processing for color vision. We present the first comprehensive evidence for pentachromatic color vision in vertebrates, which offers the potential for extraordinary spectral discrimination capabilities. We show that opsin gene expression in cichlids, and possibly also spectral sensitivity, may be sex-dependent. We argue that females and males sample their visual environment differently, providing a neural basis for sexually dimorphic visual behaviour. The diversification of spectral sensitivity likely contributes to sensory adaptations that enhance the contrast of transparent prey and the detection of optical signals from conspecifics, suggesting a role for both natural and sexual selection in tuning color vision. Background Vision is central to the survival of animals. Visual cues are used for orientation, detecting prey, avoiding preda- tors and communication. The visual process starts with visual pigments absorbing light and initiating a photo- chemical cascade that leads to neural signaling, percep- tion and ultimately visually mediated behavior. A common method for studying vision is the measurement of spectral sensitivity. Spectral sensitivity is the relative efficiency of detection of light as a function of wavelength. Spectral sensitivity is used to describe the characteristics of visual pigments found in cone photo- receptors in the retina, and it is particularly useful in describing the mechanisms of color vision [1,2]. Comparative studies in vertebrates established the pre- sence of four spectrally distinct classes of cone visual pigments produced by several different opsin genes: SWS1 being the ultraviolet/violet-sensitive class (355- 440 nm), SWS2 being the short wavelength-sensitive class (410-490 nm), RH2 being the mid-wavelength- sensitive class (470-530 nm) and LWS being the long-wavelength-sensitive class (495-570 nm) [3,4]. These opsin genes have been identified in the earliest * Correspondence: [email protected] 1 Department of Biology, Queen’s University, Kingston, ON, K7L 3N6, Canada Full list of author information is available at the end of the article Sabbah et al. BMC Biology 2010, 8:133 http://www.biomedcentral.com/1741-7007/8/133 © 2010 Sabbah et al; licensee BioMed Central Ltd. This is an Open Access article distributed under the terms of the Creative Commons Attribution License (http://creativecommons.org/licenses/by/2.0), which permits unrestricted use, distribution, and reproduction in any medium, provided the original work is properly cited.

Welcome message from author
This document is posted to help you gain knowledge. Please leave a comment to let me know what you think about it! Share it to your friends and learn new things together.
Transcript

RESEARCH ARTICLE Open Access
Functional diversity in the color vision of cichlidfishesShai Sabbah1, Raico Lamela Laria1, Suzanne M Gray1,2, Craig W Hawryshyn1,3*
Abstract
Background: Color vision plays a critical role in visual behavior. An animal’s capacity for color vision rests on thepresence of differentially sensitive cone photoreceptors. Spectral sensitivity is a measure of the visualresponsiveness of these cones at different light wavelengths. Four classes of cone pigments have been identifiedin vertebrates, but in teleost fishes, opsin genes have undergone gene duplication events and thus can produce alarger number of spectrally distinct cone pigments. In this study, we examine the question of large-scale variationin color vision with respect to individual, sex and species that may result from differential expression of conepigments. Cichlid fishes are an excellent model system for examining variation in spectral sensitivity because theyhave seven distinct cone opsin genes that are differentially expressed.
Results: To examine the variation in the number of cones that participate in cichlid spectral sensitivity, we usedwhole organism electrophysiology, opsin gene expression and empirical modeling. Examination of over 100spectral sensitivity curves from 34 individuals of three species revealed that (1) spectral sensitivity of individualcichlids was based on different subsets of four or five cone pigments, (2) spectral sensitivity was shaped bymultiple cone interactions and (3) spectral sensitivity differed between species and correlated with foraging modeand the spectral reflectance of conspecifics. Our data also suggest that there may be significant differences inopsin gene expression between the sexes.
Conclusions: Our study describes complex opponent and nonopponent cone interactions that represent therequisite neural processing for color vision. We present the first comprehensive evidence for pentachromatic colorvision in vertebrates, which offers the potential for extraordinary spectral discrimination capabilities. We show thatopsin gene expression in cichlids, and possibly also spectral sensitivity, may be sex-dependent. We argue thatfemales and males sample their visual environment differently, providing a neural basis for sexually dimorphicvisual behaviour. The diversification of spectral sensitivity likely contributes to sensory adaptations that enhance thecontrast of transparent prey and the detection of optical signals from conspecifics, suggesting a role for bothnatural and sexual selection in tuning color vision.
BackgroundVision is central to the survival of animals. Visual cuesare used for orientation, detecting prey, avoiding preda-tors and communication. The visual process starts withvisual pigments absorbing light and initiating a photo-chemical cascade that leads to neural signaling, percep-tion and ultimately visually mediated behavior. Acommon method for studying vision is the measurementof spectral sensitivity. Spectral sensitivity is the relativeefficiency of detection of light as a function of
wavelength. Spectral sensitivity is used to describe thecharacteristics of visual pigments found in cone photo-receptors in the retina, and it is particularly useful indescribing the mechanisms of color vision [1,2].Comparative studies in vertebrates established the pre-
sence of four spectrally distinct classes of cone visualpigments produced by several different opsin genes:SWS1 being the ultraviolet/violet-sensitive class (355-440 nm), SWS2 being the short wavelength-sensitiveclass (410-490 nm), RH2 being the mid-wavelength-sensitive class (470-530 nm) and LWS being thelong-wavelength-sensitive class (495-570 nm) [3,4].These opsin genes have been identified in the earliest
* Correspondence: [email protected] of Biology, Queen’s University, Kingston, ON, K7L 3N6, CanadaFull list of author information is available at the end of the article
Sabbah et al. BMC Biology 2010, 8:133http://www.biomedcentral.com/1741-7007/8/133
© 2010 Sabbah et al; licensee BioMed Central Ltd. This is an Open Access article distributed under the terms of the Creative CommonsAttribution License (http://creativecommons.org/licenses/by/2.0), which permits unrestricted use, distribution, and reproduction inany medium, provided the original work is properly cited.

vertebrate lineage, the jawless fishes or Agnathans (lam-prey) [5], and arose through duplications of a singleancestral opsin gene. Mutations in duplicated genes canlead to the evolution of additional spectral classes ofcone visual pigments within a class of opsin gene. Infact, in many teleost fishes, cone opsin genes haveundergone gene duplication to produce a wide range ofopsin genes [6-8]. The expression of different subsets ofthese genes can potentially generate large-scale variationin spectral sensitivity and the mechanisms of colorvision in fish [9-11].The cichlid fishes of Lake Malawi are an excellent
model system for examining large-scale variation incolor vision. Lake Malawi has 700-800 species ofcichlids [12-14] that have evolved from a commonancestor in a brief period of evolutionary time (2-4 mil-lion years) [15]. Malawi cichlids are notable for theirdiversity in male nuptial color patterns, sexual dimorph-ism in color patterns and visual communication pro-cesses governing mate choice [16-18]. Cichlids haveundergone multiple opsin gene duplication events, pro-ducing seven classes of cone opsin genes [10,19]. Theseseven opsin genes include an ultraviolet-sensitive(SWS1), two short-wavelength-sensitive (SWS2a andSWS2b), three mid-wavelength-sensitive (RH2aa,RH2ab, RH2b) and long-wavelength-sensitive (LWS)cone opsins. Of particular interest is that Malawicichlids show differential expression of primarily threeof the seven available cone opsin genes [9,20,21], withsome evidence of differential expression through onto-geny [20]. This raises an intriguing question of howseven opsin genes are maintained in Malawi cichlids.Our central research focus concerns the large-scalediversity in cichlid visual systems and differences in thenumber of cone classes that participate in color vision.Here we examine variation in cone classes contributingto spectral sensitivity in cichlids between individuals,sexes and species and discuss the adaptive significanceof this variation in color vision.
ResultsTo quantify the number of physiologically functionalcone classes, we recorded electroretinograms (ERG)from whole fish preparations of three Malawi cichlids:Metriaclima zebra, Melanochromis auratus and Proto-melas taeniolatus. We measured the b-wave amplitudeof ERGs, representative of ON (response to light stimu-lus onset) bipolar cell activity, to assess the integrativeresponse of functional cones. We were primarily inter-ested in evaluating the number of cone classes contri-buting to spectral sensitivity and their correspondingvisual pigments, but we also used multiple-mechanismmodeling to understand the opponent and nonopponentcone interactions at play that can shape the spectral
tuning of cone mechanisms. Our analysis was focusedon describing variation in spectral sensitivity withrespect to individual, sex and species differences.
Individual differences in spectral sensitivityOver 100 spectral sensitivity curves were recorded froma total of 15 females and 19 males of the three speciesstudied. The spectral sensitivity of each individual wasevaluated under three different color background condi-tions, each aimed at isolating the sensitivity of specificcones (Figure 1; see Additional file 1 for the backgroundconditions and the quantum catches of the various conemechanisms). For each individual, we identified thenumber of sensitivity peaks and their spectral locationsfor the three background conditions. We then fittedcone pigment absorption templates [22] to the sensitiv-ity peaks using a least-squares method.Individuals of all three species of Malawi cichlids
examined in this study possessed 11 different cone sub-sets (Table 1; see Table 2 for specific lmax values andgoodness of fit of visual pigment templates). A maxi-mum of five different cone classes were present in 41%of fish, four different cone classes were present in 56%of fish, and three different cone classes were present inonly 3% of the fish (one individual) (Table 1). All conesubsets (excluding no. 5) consisted of at least two pig-ments corresponding to single cones and two pigmentscorresponding to double cones.Examining the individuals of each species separately
revealed that all individuals in M. zebra possessed fourcone pigments, while 55% of individuals in M. auratusand 67% of individuals in P. taeniolatus possessed fivecone pigments (Table 1).The collection of all cone subsets exhibited by either
M. auratus or P. taeniolatus included the completeopsin gene set (Table 1). That is, each of these speciesutilizes the complete set of six cone pigments (RH2aaand RH2ab pooled because of genetic and functionalsimilarity [10,19]). However, the collection of all subsetsexhibited by M. zebra encompassed only five cone pig-ments and excluded the LWS pigment.
Sex differences in spectral sensitivityTo evaluate how sex differences contribute to the varia-tion in cone subsets, we calculated the frequency ofcone subsets in each species and sex. In all species, theindividual variation in pigment subsets used was high,and a strong trend for differences between females andmales in the identity and frequency of the pigment sub-sets they utilized emerged (Table 3). The degree towhich pigment subsets were shared between sexes var-ied across species. Half of M. zebra females shared sub-set 2 with all conspecific males, 28% of M. auratusmales shared subset 3 with half the females and 60% of
Sabbah et al. BMC Biology 2010, 8:133http://www.biomedcentral.com/1741-7007/8/133
Page 2 of 16

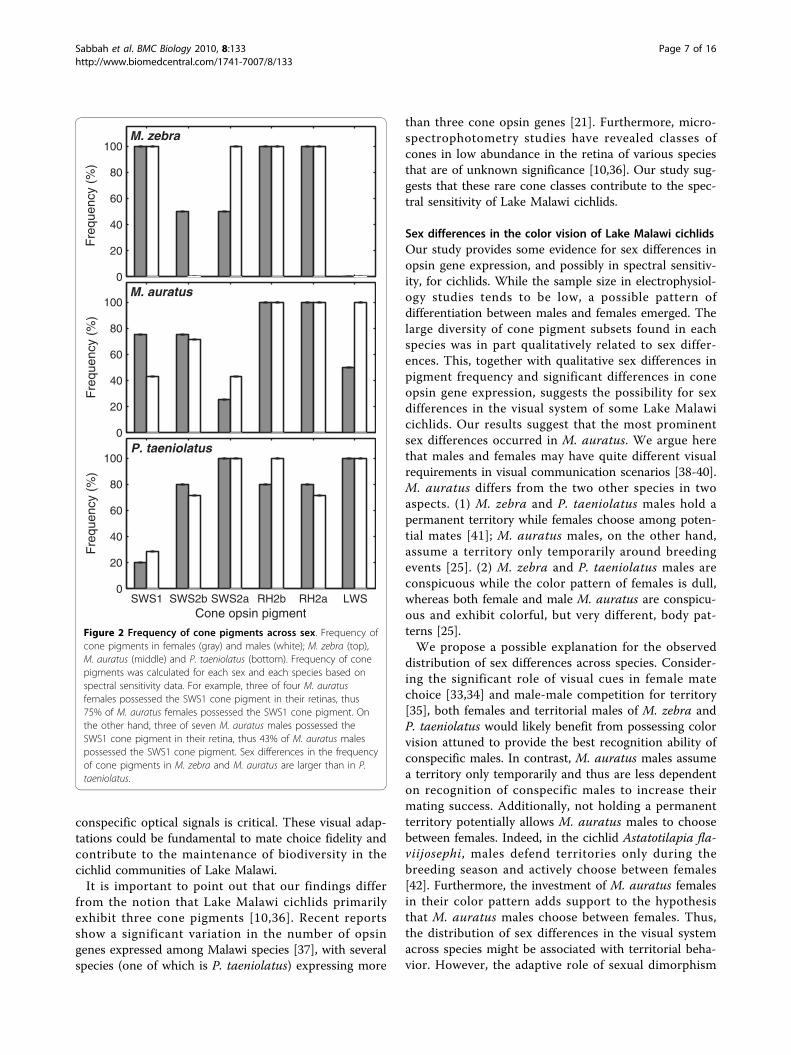
P. taeniolatus females shared subsets 6 and 7 with 71%of males.The frequency of each cone pigment present in
females and males was calculated (Figure 2). Sex differ-ences in the frequency of cone pigments were evident inall species, with M. auratus and M. zebra showing thelargest differences. The frequency of M. auratus femalesshowing SWS1 pigments was 75% larger than in males,
while the frequency of males showing SWS2a and LWSpigments was 71% and 100% larger than in females,respectively. The frequency of M. zebra males showingSWS2a cone pigment was 100% larger than in females,while SWS2b cone pigment was found only in females.In contrast, the frequency of cone pigments in P. taenio-latus showed less variation across sexes, with pigmentfrequencies differing 12%-42% between sexes.
Figure 1 Relative spectral sensitivity of Lake Malawi cichlids obtained under different background conditions. (a-c) Relative spectralsensitivity of three individuals of M. zebra, M. auratus and P. taeniolatus (left to right). The spectral sensitivity of each species was measuredunder three background conditions: long-wavelength isolation (LW, red), control (green), and intense short-wavelength isolation (SW, blue). In P.taeniolatus, LW was replaced by Dim short-wavelength isolation (Dim-SW, cyan). In M. zebra, the spectral sensitivity curves measured under allconditions show four sensitivity peaks, whereas in M. auratus and P. taeniolatus the complete set of five sensitivity peaks was revealed across allbackground conditions. Data points were connected with lines to facilitate the identification of sensitivity peaks. (d-i) Visual pigment templates(dashed lines) fitted to spectral sensitivity (circles) measured under two background conditions. (Typically, the examination of two spectralsensitivity curves was sufficient to correlate all sensitivity peaks to cone pigments.) M. zebra: control (D) and SW (G); M. auratus: LW (E) and SW(H); P. taeniolatus: Dim-SW (F) and SW (I). Visual pigment templates: SWS1 (black), SWS2b (violet), SWS2a (blue), RH2b (green), RH2a (orange) andLWS (red). Similar plots were used for all individuals to identify sensitivity peaks and correlate them to cone pigments. See criteria for peakidentification in the Methods section. See Additional file 1 for background isolation conditions and quantum catch of cone pigments.
Sabbah et al. BMC Biology 2010, 8:133http://www.biomedcentral.com/1741-7007/8/133
Page 3 of 16
We also examined the effect of sex on the pattern ofcone opsin gene expression. We focused our analysis onM. auratus and P. taeniolatus, the species that exhibitedthe lowest and highest degree of common cone pigmentsubsets between the sexes, respectively. Variation inopsin gene expression between females and males in M.auratus was larger than in P. taeniolatus (Figure 3). Spe-cifically, in M. auratus, the expression of RH2b andRH2a opsin genes differed across sexes (t-test, df = 8, P <0.0002 and P < 0.005, respectively). In contrast, in P. tae-niolatus, no significant differences in the relative opsingene expression were detected between sexes (t-test, P >0.2 for all genes). See Additional file 2 for detailed t-testresults and Additional file 3 for primer specifications forcone opsin genes. The frequency of cone pigments andopsin gene expression are not quantitatively comparable.In the calculation of pigment frequency, each individualis scored as either 1 (pigment present) or 0 (pigmentabsent), whereas gene expression can assume any valuebetween 0 and 1. Moreover, the expression level of anopsin gene does not necessarily dictate its contribution tosensitivity, since patterns of convergence of cones ontoretinal interneurons and the network processing of theseneurons [23] are critical to governing visual responsive-ness. Our results show that females and males differ inthe cone opsin gene expression profiles. Our results alsosuggest that females and males differ in cone pigmentsubsets and in the frequency of cone pigments. However,owing to sample size limitation imposed by the complex-ity of spectral sensitivity measurements, the statisticalsignificance of the sex differences observed in cone pig-ment subsets and in the frequency of cone pigments
cannot be evaluated at this time. It is important to note,however, that the variability of all three properties of thevisual system of cichlids was consistently larger in M.auratus than in the other two species.
Species differences in spectral sensitivityIn general, different cichlid species used different conesubsets (Table 3). Closer examination reveals thatfemales of the three species did not use the same conesubsets, but 43% of male M. auratus shared three conesubsets with P. taeniolatus males.The frequency of cone pigments varied across species
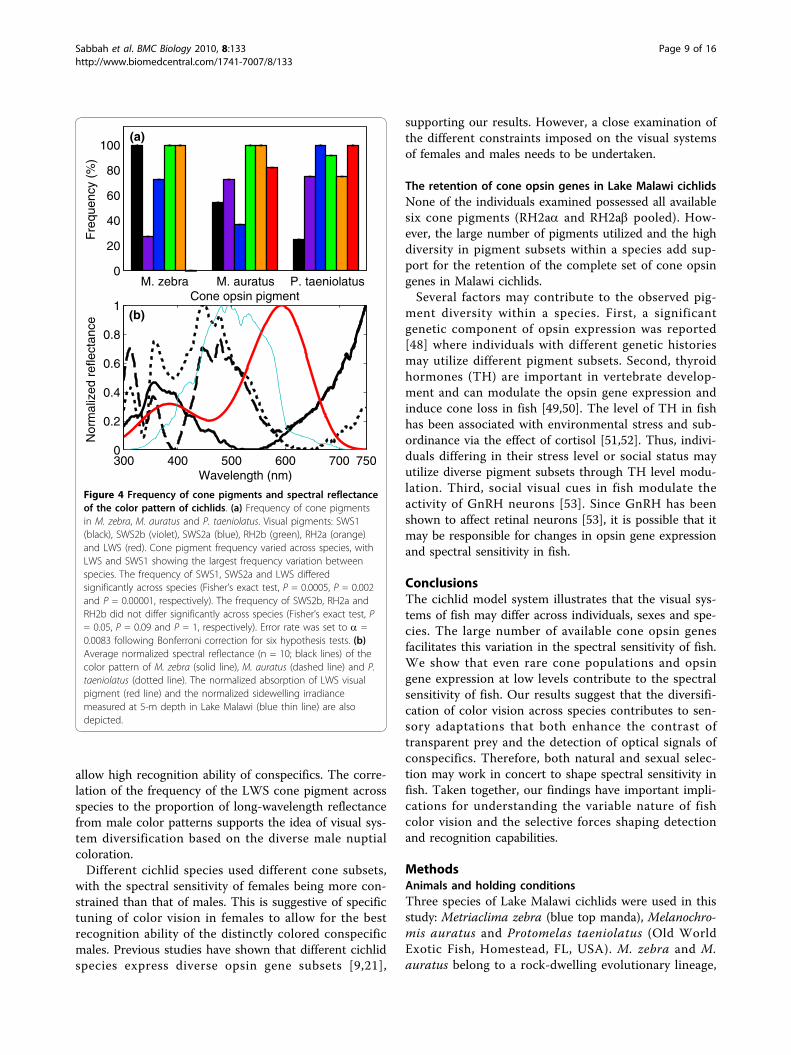
(Figure 4a). The frequency of RH2a (SD = 14%) andRH2b (SD = 5%) showed the smallest variation and didnot differ significantly between species (Fisher’s exacttest; P = 0.091 and P = 1, respectively). In contrast, thefrequency of LWS (SD = 53%) and SWS1 (SD = 38%)showed the largest variation and differed significantlybetween species (Fisher’s exact test; P < 0.001 for bothpigments). See Figure 4 caption for detailed statistics.The frequency of SWS1 was highest in M. zebra (100%),lower in M. auratus (54%) and lowest in P. taeniolatus(25%). The frequency of LWS in P. taeniolatus (100%)and M. auratus (81%) was higher than in M. zebra (0%).The frequency of the SWS1 cone pigment across spe-
cies qualitatively correlated with planktivory. M. zebramay be highly planktivorous, feeding on both phyto-plankton (mainly diatoms) and zooplankton (Cladocer-ans and copepods) [24]. M. auratus is omnivorous,consuming algae and a wide range of nonalgal dietaryitems such as cyclopoid copepods [24,25]. P. taeniolatusis almost strictly herbivorous and feeds on the biocover
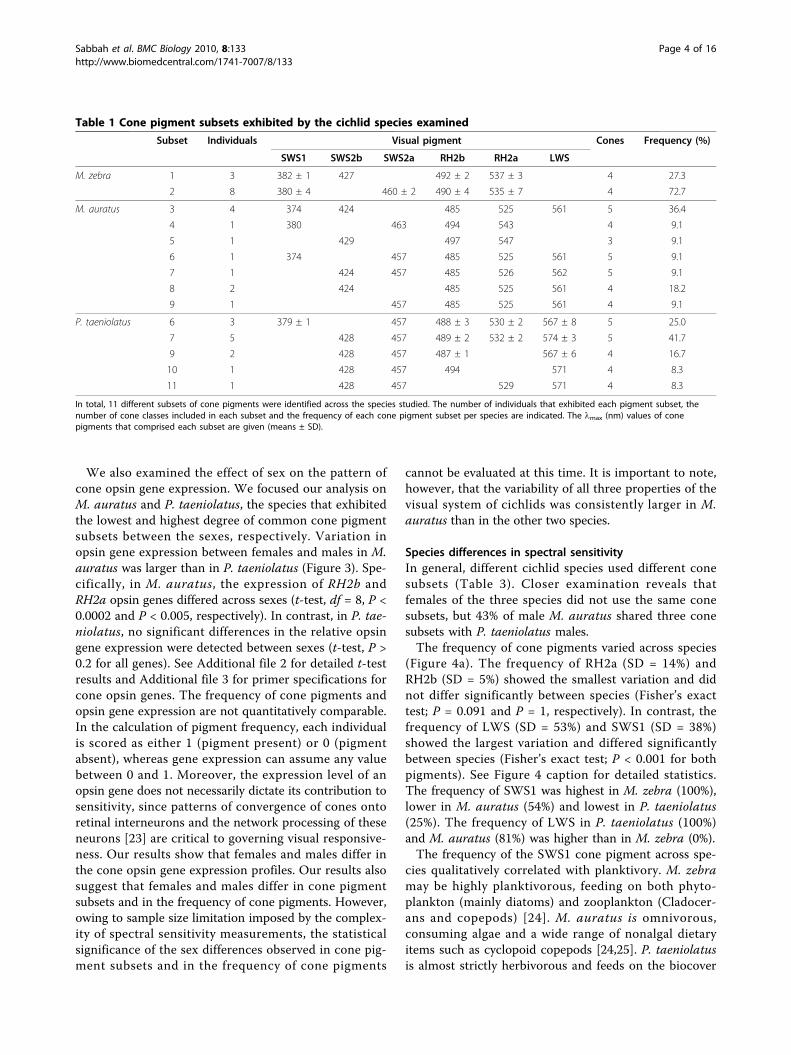
Table 1 Cone pigment subsets exhibited by the cichlid species examined
Subset Individuals Visual pigment Cones Frequency (%)
SWS1 SWS2b SWS2a RH2b RH2a LWS
M. zebra 1 3 382 ± 1 427 492 ± 2 537 ± 3 4 27.3
2 8 380 ± 4 460 ± 2 490 ± 4 535 ± 7 4 72.7
M. auratus 3 4 374 424 485 525 561 5 36.4
4 1 380 463 494 543 4 9.1
5 1 429 497 547 3 9.1
6 1 374 457 485 525 561 5 9.1
7 1 424 457 485 526 562 5 9.1
8 2 424 485 525 561 4 18.2
9 1 457 485 525 561 4 9.1
P. taeniolatus 6 3 379 ± 1 457 488 ± 3 530 ± 2 567 ± 8 5 25.0
7 5 428 457 489 ± 2 532 ± 2 574 ± 3 5 41.7
9 2 428 457 487 ± 1 567 ± 6 4 16.7
10 1 428 457 494 571 4 8.3
11 1 428 457 529 571 4 8.3
In total, 11 different subsets of cone pigments were identified across the species studied. The number of individuals that exhibited each pigment subset, thenumber of cone classes included in each subset and the frequency of each cone pigment subset per species are indicated. The lmax (nm) values of conepigments that comprised each subset are given (means ± SD).
Sabbah et al. BMC Biology 2010, 8:133http://www.biomedcentral.com/1741-7007/8/133
Page 4 of 16

detached from rocks, mainly comprising algae and dia-toms [21,26].The frequency of the LWS cone pigment across spe-
cies was quantitatively correlated with the proportion oflong-wavelength reflectance in the color pattern of con-specific males (Figure 4b). As a first-order approxima-tion, the quantum catch of an LWS cone pigment wascalculated for the spectral reflectance of the species
used in this study. The normalized quantum catch washighest in P. taeniolatus (100%), lower in M. auratus(80%) and lowest in M. zebra (17%).
Color vision in Lake Malawi cichlidsSpectral sensitivity curves determined using different colorbackground conditions were used to evaluate mechanismsof color vision. Color vision requires the possession of at
Table 2 Statistics of visual pigment templates fit to spectral sensitivity curves
Gender Fish ID Visual pigment templatea A2%b 1st R2c 2nd R2d Subsete
SWS1 SWS2b SWS2a RH2b RH2a LWS
M. zebra Female ZF7 381 (0.62) 427 (0.63) 491 (0.76) 535 (0.90) 37.6 RH2a (0.98) LWS (0.47) 1
ZF6 381 (0.46) 427 (0.82) 491 (0.70) 535 (0.90) 37.6 RH2a (0.98) LWS (0.21) 1
ZF8 383 (0.88) 428 (0.55) 494 (0.73) 540 (0.87) 53.8 RH2a (0.94) LWS (0.59) 1
ZF1 383 (0.09) 461 (0.96) 493 (0.72) 540 (0.85) 48.4 RH2a (0.95) LWS (0.58) 2
ZF4 379 (0.91) 459 (0.30) 487 (0.69) 530 (0.94) 21.5 RH2a (0.93) LWS (0.01) 2
ZF2 375 (0.53) 461 (0.98) 493 (0.38) 540 (0.96) 48.4 RH2a (0.95) LWS (0.56) 2
Male ZM2 375 (0.85) 457 (0.76) 484 (0.85) 526 (0.91) 8 RH2a (0.89) LWS (0.49) 2
ZM6 378 (0.75) 458 (0.57) 487 (0.81) 530 (0.95) 18.8 RH2a (0.97) LWS (-0.18) 2
ZM4 383 (0.15) 463 (0.64) 494 (0.54) 540(0.91) 53.7 RH2a (0.99) LWS (0.62) 2
ZM1 385 (0.55) 463 (0.99) 495 (0.93) 544 (0.55) 59.1 RH2a (0.91) LWS (0.64) 2
ZM3 378 (0.69) 458 (0.18) 487 (0.91) 530 (0.79) 18.8 RH2a (0.91) LWS (-0.69) 2
M. auratus Female AF13 374 (0.84) 424 (0.70) 485 (0.82) 525 (0.72) 561 (0.87) 0 LWS (0.85) 3
AF15 374 (0.25) 424 (0.75) 485 (0.43) 525 (0.14) 561 (0.82) 0 LWS (0.85) 3
AF14 380 (0.76) 463 (0.33) 494 (0.81) 543 (0.71) 53.7 RH2a (0.91) LWS (0.24) 4
AF11 429 (0.47) 497 (0.63) 547 (0.91) 64.5 RH2a (0.94) LWS (0.84) 5
Male AM14 374 (0.71) 424 (0.96) 485 (0.41) 525 (0.70) 561 (0.85) 0 LWS (0.96) 3
AM13 374 (0.67) 424 (0.60) 485 (0.73) 525 (0.74) 561 (0.85) 0 LWS (0.85) 3
AM12 374 (0.54) 457 (0.85) 485 (0.41) 525 (0.27) 561 (0.98) 0 LWS (0.98) 6
AM11 424 (0.32) 457 (0.09) 485 (0.85) 526 (0.43) 562 (0.57) 3 LWS (0.89) 7
AM16 424 (0.56) 485 (0.41) 525 (0.47) 561 (0.70) 0 LWS (0.84) 8
AM17 424 (0.97) 485 (0.70) 525 (0.29) 561 (0.88) 0 LWS (0.96) 8
AM18 457 (0.52) 485 (0.33) 525 (0.46) 561 (0.87) 0 LWS (0.87) 9
P. taeniolatus Female TF6 428 (0.49) 457 (0.89) 491 (0.75) 533 (0.55) 576 (0.95) 18.1 LWS (0.86) 7
TF2 428 (0.66) 457 (0.98) 487 (0.84) 528 (0.55) 571 (0.43) 10.6 LWS (0.63) 7
TF1 428 (0.49) 457 (0.97) 48 (0.49) 571 (0.91) 15.1 LWS (0.98) RH2a (0.82) 10
TF4 428 (0.48) 457 (0.54) 529 (0.88) 571 (0.72) 10.6 LWS (0.91) 11
TF7 379 (0.81) 457 (0.47) 487 (0.63) 529 (0.54) 563 (0.73) 6 LWS (0.93) 6
Male TM1 428 (0.68) 457 (0.64) 491 (0.59) 533 (0.52) 576 (0.88) 18.6 LWS (0.96) 7
TM3 428 (0.71) 457 (0.08) 494 (0.89) 529 (0.59) 571 (0.98) 15 LWS (0.95) 7
TM8 428 (0.59) 457 (0.94) 491 (0.90) 534 (0.49) 576 (0.80) 22.6 LWS (0.95) 7
TM4 428 (0.64) 457 (0.91) 486 (0.84) 563 (0.98) 3 LWS (0.98) RH2a (0.96) 9
TM6 428 (0.42) 457 (0.45) 487 (0.74) 571 (0.94) 10.7 LWS (0.97) RH2a (0.87) 9
TM5 379 (0.78) 457 (0.84) 486 (0.50) 529 (0.57) 563 (0.91) 3 LWS (0.97) 6
TM2 380 (0.95) 457 (0.99) 491 (0.67) 533 (0.87) 576 (0.99) 18.1 LWS (0.99) 6almax (nm) of Visual pigment template that were fitted to the sensitivity curve (R2 values of the template fits in parentheses). Owing to cone interactions, thesensitivity peaks measured were typically narrower than the fitted pigment templates, resulting in relatively low R2 values.bEstimated A2 percent in the retina (A2 percent = A2 proportion × 100).cThe visual pigment template that resulted in the highest R2 value when fitted to the long-wavelength limb of the spectral sensitivity curve (R2 value of thetemplate fit in parentheses).dThe visual pigment template which resulted in the second highest R2 value when fitted to the long-wavelength limb of the spectral sensitivity curve (R2 value ofthe template fit in parentheses).eThe cone pigment subset to which each individual was assigned.
Sabbah et al. BMC Biology 2010, 8:133http://www.biomedcentral.com/1741-7007/8/133
Page 5 of 16

least two differentially sensitive cones that interact throughopponent and nonopponent processes to enable wave-length discrimination [27]. Our results show that 97% ofindividuals possessed four or five cone classes. To studycone interactions, we used a multiple-cone mechanism(MCM) model, employing strict criteria (see Methods), toreconstruct spectral sensitivity under different backgroundconditions. To do this, we selected three individual fishthat exhibited the most frequent cone subset for a givenspecies. These were subsets 2, 3 and 7, occurring in 73%,36% and 42% of the M. zebra, M. auratus and P. taeniola-tus individuals, respectively.Spectral sensitivity was successfully reconstructed
using the MCM model (R2 = 0.83-0.99 for all speciesand background conditions) (Figure 5). Cone interactionwas expressed as an additive (nonopponent) or subtrac-tive (opponent) contribution to the modeled spectralsensitivity, and we summarize these cone interactions inTable 4 (see Additional file 4 for more comprehensiveinformation that details the specific coefficients andgoodness of fit of the model). Typically, the cone classexhibiting the highest sensitivity for a spectral rangecontributed positively to the modeled spectral sensitivity,whereas other cone classes contributed either positively(nonopponent) or negatively (opponent) to the modeledspectral sensitivity. The successful reconstruction ofspectral sensitivity curves further validated our analysisand the distribution of the cone pigment subsets. Mostimportantly, we identified and characterized cone inter-actions representative of retinal neural network proces-sing, essential to color vision.
DiscussionPentachromatic color vision in Lake Malawi cichlidsNinety-seven percent of fish examined in this studyemployed cone subsets of four or five pigments, with
most M. auratus and P. taeniolatus exhibiting five func-tional cone classes. The spectral sensitivity of all threespecies of cichlids was shaped by both opponent andnonopponent cone interactions, and thus our data pro-vide the first comprehensive evidence for pentachro-matic color vision in vertebrates. Although the presenceof five (or more) cone classes was previously reported inmicrospectrophotometry studies [10,28], this is the firstdemonstration that five cone mechanisms were used bya single individual. In this regard, designating thedimensionality of color vision requires the essential evi-dence that shows not only that the different conemechanisms participate in spectral sensitivity but alsothat the different cone mechanisms show multiple neu-ronal interactions. P. taeniolatus and M. auratus showedfive distinct cone classes spectrally compressed in arange of 146 nm (subset 7) and 187 nm (subset 3),respectively. The spectral compression of this sensitivityprovides the basis for extraordinary spectral discrimina-tion, which could be important in visual communica-tion. To better understand how pentachromatic colorvision would be beneficial to cichlids, we need to con-sider factors at play in the visual environment of cichlidswhere visual communication takes place: (1) the highspecies diversity of cichlids in Lake Malawi (700-800species) [14,25,29], (2) the large within-genera variationin the color pattern of fish and the small within-generavariation in their size and shape [30-32] and (3) the pre-valence of visual cues driving mate choice [33,34] andintrasexual competition [35]. Visual communicationwould depend on exquisite sensory performance in thisvisual environment, since cichlids are continually chal-lenged to make fine-scale discriminations of complexcolor patterns. This visual system capability would beparticularly important in guiding visual behavior relatedto mate choice, where the detection and recognition of
Table 3 Frequency of cone pigment subsets across species and sex
Frequency (%)
M. zebra M. auratus P. taeniolatus
Subset Cones Female (6) Male (5) Female (4) Male (7) Female (5) Male (7)
1 4 50.0 - - - - -
2 4 50.0 100.0 - - - -
3 5 - - 50.0 28.6 - -
4 4 - - 25.0 - - -
5 3 - - 25.0 - - -
6 5 - - - 14.3 20.0 28.6
7 5 - - - 14.3 40.0 42.9
8 4 - - - 28.6 - -
9 4 - - - 14.3 - 28.6
10 4 - - - - 20.0 -
11 4 - - - - 20.0 -
Frequency of cone pigment subsets in females and males of M. zebra, M. auratus and P. taeniolatus. Frequency of cone pigment subsets was calculated for eachsex and each species on the basis of spectral sensitivity data. The sample size for each of the examined groups is indicated in parentheses.
Sabbah et al. BMC Biology 2010, 8:133http://www.biomedcentral.com/1741-7007/8/133
Page 6 of 16
conspecific optical signals is critical. These visual adap-tations could be fundamental to mate choice fidelity andcontribute to the maintenance of biodiversity in thecichlid communities of Lake Malawi.It is important to point out that our findings differ
from the notion that Lake Malawi cichlids primarilyexhibit three cone pigments [10,36]. Recent reportsshow a significant variation in the number of opsingenes expressed among Malawi species [37], with severalspecies (one of which is P. taeniolatus) expressing more
than three cone opsin genes [21]. Furthermore, micro-spectrophotometry studies have revealed classes ofcones in low abundance in the retina of various speciesthat are of unknown significance [10,36]. Our study sug-gests that these rare cone classes contribute to the spec-tral sensitivity of Lake Malawi cichlids.
Sex differences in the color vision of Lake Malawi cichlidsOur study provides some evidence for sex differences inopsin gene expression, and possibly in spectral sensitiv-ity, for cichlids. While the sample size in electrophysiol-ogy studies tends to be low, a possible pattern ofdifferentiation between males and females emerged. Thelarge diversity of cone pigment subsets found in eachspecies was in part qualitatively related to sex differ-ences. This, together with qualitative sex differences inpigment frequency and significant differences in coneopsin gene expression, suggests the possibility for sexdifferences in the visual system of some Lake Malawicichlids. Our results suggest that the most prominentsex differences occurred in M. auratus. We argue herethat males and females may have quite different visualrequirements in visual communication scenarios [38-40].M. auratus differs from the two other species in twoaspects. (1) M. zebra and P. taeniolatus males hold apermanent territory while females choose among poten-tial mates [41]; M. auratus males, on the other hand,assume a territory only temporarily around breedingevents [25]. (2) M. zebra and P. taeniolatus males areconspicuous while the color pattern of females is dull,whereas both female and male M. auratus are conspicu-ous and exhibit colorful, but very different, body pat-terns [25].We propose a possible explanation for the observed
distribution of sex differences across species. Consider-ing the significant role of visual cues in female matechoice [33,34] and male-male competition for territory[35], both females and territorial males of M. zebra andP. taeniolatus would likely benefit from possessing colorvision attuned to provide the best recognition ability ofconspecific males. In contrast, M. auratus males assumea territory only temporarily and thus are less dependenton recognition of conspecific males to increase theirmating success. Additionally, not holding a permanentterritory potentially allows M. auratus males to choosebetween females. Indeed, in the cichlid Astatotilapia fla-viijosephi, males defend territories only during thebreeding season and actively choose between females[42]. Furthermore, the investment of M. auratus femalesin their color pattern adds support to the hypothesisthat M. auratus males choose between females. Thus,the distribution of sex differences in the visual systemacross species might be associated with territorial beha-vior. However, the adaptive role of sexual dimorphism
Figure 2 Frequency of cone pigments across sex. Frequency ofcone pigments in females (gray) and males (white); M. zebra (top),M. auratus (middle) and P. taeniolatus (bottom). Frequency of conepigments was calculated for each sex and each species based onspectral sensitivity data. For example, three of four M. auratusfemales possessed the SWS1 cone pigment in their retinas, thus75% of M. auratus females possessed the SWS1 cone pigment. Onthe other hand, three of seven M. auratus males possessed theSWS1 cone pigment in their retina, thus 43% of M. auratus malespossessed the SWS1 cone pigment. Sex differences in the frequencyof cone pigments in M. zebra and M. auratus are larger than in P.taeniolatus.
Sabbah et al. BMC Biology 2010, 8:133http://www.biomedcentral.com/1741-7007/8/133
Page 7 of 16

in color vision of Lake Malawi cichlids requires furtherexamination.
Adaptive significance of species differences in the colorvision of Lake Malawi cichlidsThe variation in cone pigment frequency across speciesreflects visual adaptations that both enhance the con-trast of transparent prey and detect signals importantfor mate choice, suggesting that both natural selectionand sexual selection played a role in shaping the spectralsensitivity of cichlids.The frequency of the SWS1 cone pigment across spe-
cies qualitatively correlated with planktivory. UV photo-reception mediated by the SWS1 cone pigmentenhances the contrast of transparent zooplanktonagainst the water background and thus aids in theirdetection [43,44]. However, UV sensitivity does not con-fer any advantage over longer-wavelength sensitivity inthe detection of opaque food items such as loose algae.Thus, UV sensitivity is expected to be highly advanta-geous for the planktivorous M. zebra, less advantageousfor the omnivorous M. auratus and least advantageousfor the herbivorous P. taeniolatus, which is in agreementwith our findings. Thus, the presence of the SWS1 pig-ment in the retina of cichlids has likely significant adap-tive value. In this regard, the expression of the SWS1opsin gene was recently reported to be highest amongspecies foraging on zooplankton, phytoplankton andalgae and lowest among species foraging on fish orbenthic invertebrates [21]; however, the relationshipbetween opsin gene expression and spectral sensitivityin cichlids is still largely unknown. UV photoreceptionis also tightly linked to polarization sensitivity, and thismay provide yet greater contrast enhancement of
transparent prey [45-47]. Researchers in our lab are cur-rently examining polarization sensitivity in cichlid fishesand its role in visual behavior.The frequency of the LWS cone pigment across spe-
cies was quantitatively correlated with the proportion oflong-wavelength reflectance in the color pattern of con-specific males. While the possession of the LWS conepigment by M. auratus and P. taeniolatus may facilitatethe detection of long-wavelength signals of conspecifics,this would not be the case for M. zebra that do nothave prominent long-wavelength signals, which is inagreement with our findings. Therefore, the presence ofthe LWS pigment in M. auratus and P. taeniolatus hasa significant adaptive value. Interestingly, the detectionof UV reflections from the color pattern of these fishspecies may be mediated through the b-band of theLWS cone pigment (Figure 4b), thus potentially elimi-nating the need for the possession of the SWS1 pigmentto detect UV signals from conspecifics.Both natural and sexual selection work sequentially to
contribute to the divergence of Lake Malawi rock-dwell-ing cichlids [16]. In the first episode of cladogenesis,competition for trophic resources resulted in the differ-entiation of trophic morphology and the diversificationof the visual system to allow the utilization of differentforaging styles. The correlation of the frequency of theSWS1 cone pigment across species to planktivory (thisstudy), and the recent report that the expression of theSWS1 opsin gene correlates with planktivory [21], sup-port the idea of diversification of the visual systembased on competition for trophic resources. In the sec-ond episode of cladogenesis, sexual selection contributedto the differentiation of male nuptial coloration and theaccompanying diversification of the visual system to
Figure 3 Relative cone opsin gene expression across sex. Relative expression of cone opsin genes (means ± SEM) in females (gray) andmales (white), M. auratus (left) and P. taeniolatus (right). Female and male M. auratus, but not P. taeniolatus, differed significantly in theexpression of the RH2b and RH2a opsin genes. See Additional file 2 for detailed t-test results and Additional file 3 for primer specifications forcone opsin genes.
Sabbah et al. BMC Biology 2010, 8:133http://www.biomedcentral.com/1741-7007/8/133
Page 8 of 16
allow high recognition ability of conspecifics. The corre-lation of the frequency of the LWS cone pigment acrossspecies to the proportion of long-wavelength reflectancefrom male color patterns supports the idea of visual sys-tem diversification based on the diverse male nuptialcoloration.Different cichlid species used different cone subsets,
with the spectral sensitivity of females being more con-strained than that of males. This is suggestive of specifictuning of color vision in females to allow for the bestrecognition ability of the distinctly colored conspecificmales. Previous studies have shown that different cichlidspecies express diverse opsin gene subsets [9,21],
supporting our results. However, a close examination ofthe different constraints imposed on the visual systemsof females and males needs to be undertaken.
The retention of cone opsin genes in Lake Malawi cichlidsNone of the individuals examined possessed all availablesix cone pigments (RH2aa and RH2ab pooled). How-ever, the large number of pigments utilized and the highdiversity in pigment subsets within a species add sup-port for the retention of the complete set of cone opsingenes in Malawi cichlids.Several factors may contribute to the observed pig-
ment diversity within a species. First, a significantgenetic component of opsin expression was reported[48] where individuals with different genetic historiesmay utilize different pigment subsets. Second, thyroidhormones (TH) are important in vertebrate develop-ment and can modulate the opsin gene expression andinduce cone loss in fish [49,50]. The level of TH in fishhas been associated with environmental stress and sub-ordinance via the effect of cortisol [51,52]. Thus, indivi-duals differing in their stress level or social status mayutilize diverse pigment subsets through TH level modu-lation. Third, social visual cues in fish modulate theactivity of GnRH neurons [53]. Since GnRH has beenshown to affect retinal neurons [53], it is possible that itmay be responsible for changes in opsin gene expressionand spectral sensitivity in fish.
ConclusionsThe cichlid model system illustrates that the visual sys-tems of fish may differ across individuals, sexes and spe-cies. The large number of available cone opsin genesfacilitates this variation in the spectral sensitivity of fish.We show that even rare cone populations and opsingene expression at low levels contribute to the spectralsensitivity of fish. Our results suggest that the diversifi-cation of color vision across species contributes to sen-sory adaptations that both enhance the contrast oftransparent prey and the detection of optical signals ofconspecifics. Therefore, both natural and sexual selec-tion may work in concert to shape spectral sensitivity infish. Taken together, our findings have important impli-cations for understanding the variable nature of fishcolor vision and the selective forces shaping detectionand recognition capabilities.
MethodsAnimals and holding conditionsThree species of Lake Malawi cichlids were used in thisstudy: Metriaclima zebra (blue top manda), Melanochro-mis auratus and Protomelas taeniolatus (Old WorldExotic Fish, Homestead, FL, USA). M. zebra and M.auratus belong to a rock-dwelling evolutionary lineage,
Figure 4 Frequency of cone pigments and spectral reflectanceof the color pattern of cichlids. (a) Frequency of cone pigmentsin M. zebra, M. auratus and P. taeniolatus. Visual pigments: SWS1(black), SWS2b (violet), SWS2a (blue), RH2b (green), RH2a (orange)and LWS (red). Cone pigment frequency varied across species, withLWS and SWS1 showing the largest frequency variation betweenspecies. The frequency of SWS1, SWS2a and LWS differedsignificantly across species (Fisher’s exact test, P = 0.0005, P = 0.002and P = 0.00001, respectively). The frequency of SWS2b, RH2a andRH2b did not differ significantly across species (Fisher’s exact test, P= 0.05, P = 0.09 and P = 1, respectively). Error rate was set to a =0.0083 following Bonferroni correction for six hypothesis tests. (b)Average normalized spectral reflectance (n = 10; black lines) of thecolor pattern of M. zebra (solid line), M. auratus (dashed line) and P.taeniolatus (dotted line). The normalized absorption of LWS visualpigment (red line) and the normalized sidewelling irradiancemeasured at 5-m depth in Lake Malawi (blue thin line) are alsodepicted.
Sabbah et al. BMC Biology 2010, 8:133http://www.biomedcentral.com/1741-7007/8/133
Page 9 of 16

the mbuna, whereas P. taeniolatus is a member of thenonmbuna lineage. These species are sexually dimorphicand occur sympatrically in the rocky habitat in LakeMalawi. The males have distinctive nuptial color pat-terns, and they use the rocky habitat differently withrespect to reproductive behavior [25,29]. Adult fish wereheld in our aquatic facility tanks under a 12 h:12 h
light-dark photoperiod at 25 ± 1°C. Facility lightingfeatured enhanced full spectrum fluorescent lamps (UV-Blue actinic and BlueMax lamps; Full Spectrum Solu-tions, Jackson, MI, USA). All experimental and animalcare procedures were approved by Queen’s UniversityAnimal Care Committee under the auspices of theCanadian Council for Animal Care.
Electroretinogram (ERG) experimental apparatusThe general design of the optical system and recordingapparatus has been described previously [2,54]. Twobackground channels each with a 250-W quartz-halogenlamp (Osram, Danvers, MA, USA) were used to provideconstant background, to which test fish were light-adapted. Long- and short-pass interference filters (FusedSilica, OD 2; Edmund Optics, Barrington, NJ, USA),band-pass interference filters (Edmund Optics), broad-band color filters (Schott, Elmsford, NY, USA) andreflective neutral density filters (Edmund Optics), wereused to manipulate the spectral irradiance of each back-ground channel. Light from the two background chan-nels was guided to the electrophysiology rig using abifurcated optical fiber (fused silica, numerical aperture(NA) = 0.22; Fiberoptic Systems, Simi Valley, CA, USA).The stimulus channel used a 300-W xenon arc lamp
system (Thermo Oriel, Stratford, CT, USA). The opticalpath consisted of a monochrometer (Instruments SA,Metuchen, New Jersey, USA), Inconel quartz neutraldensity wedge (0-4.0 neutral density; CVI Melles Griot,Albuquerque, NM, USA), shutter (Uniblitz, Rochester,NY, USA), optical filters to block spectral sidebands andUV lenses to match the numerical aperture of the liquidlight pipe (fused silica; NA = 0.55; Fiberoptic Systems).
Figure 5 Spectral sensitivity of cichlids reconstructed using the multiple-cone mechanism model. Measured (circles) and modeled (lines)relative spectral sensitivity for subsets 2 (M. zebra, left), 3 (M. auratus, middle) and 7 (P. taeniolatus, right). The low sensitivity at 340-380 nm insubset 7 corresponds to b-band absorption of the RH2b, RH2a and LWS pigments and was not modeled. Relative spectral sensitivity of eachspecies was measured under three background conditions: long-wavelength isolation (LW, red), control (green) and short-wavelength isolation(SW, blue). In P. taeniolatus, LW was replaced by Dim short-wavelength isolation (Dim-SW, cyan).
Table 4 Summary of nonopponent and opponent coneinteractions
Single cones Double cones
Spectralrange (nm)
KSWS1 KSWS2b KSWS2a KRH2b KRH2a KLWS
M. zebra 340-400 + -
(Subset 2) 400-480 - + -
480-540 - + -
540-620 - +
M. auratus 340-380 + -
(Subset 3) 400-440 - +
440-480 - +
480-540 - +
540-640 + +
P.taeniolatus
380-420 + -
(Subset 7) 420-460 + -
460-540 - - +
540-580 + +
580-660 - +
KSWS1-KLWS represent the weights of the relative contribution of each conemechanism to spectral sensitivity used in the multiple-cone mechanismmodel. Weights can be positive (nonopponent) or negative (opponent). Thespectral ranges listed in this table represent discernible peaks (or conemechanism) in the spectral sensitivity curves, and each peak was fitted by themultiple cone mechanism model.
Sabbah et al. BMC Biology 2010, 8:133http://www.biomedcentral.com/1741-7007/8/133
Page 10 of 16

The background and stimulus optical fibers were fittedto a beam splitter to produce a stimulus beam (diameter0.5 cm at the plane of the fish eye) contained within thebackground beam (diameter 1 cm). This setup ensuredthat the chromatically adapted portion of the fish retinawas also the one stimulated.
Preparation of fishPrior to ERG recordings, fish were immersed in a solu-tion of 150 mg l-1 tricaine methanesulfonate (MS-222)until the fish reached stage IV anesthesia [55]. Intramus-cular injections of a general anaesthetic, Maranil (0.1 mgg-1 body mass) and an immobilizing agent, pancuroniumbromide (0.04 mg g-1 body mass), were administered atseveral sites. Test fish were then placed in a holding cra-dle in a Faraday cage. Experimental fish were irrigatedwith aerated fresh water (20°C, flow rate ~3 ml s-1), andtheir body was covered with a moist cloth.
ERG recording procedureERG recordings started at least 1 hour following theonset of the light phase and concluded before theonset of the dark phase to avoid any effects related tocircadian rhythm [2,56,57]. A glass electrode (1.5 mmouter diameter, 1 mm inner diameter, borosilicateglass; World Precision Instruments, Sarasota, FL, USA)that was pulled to a tip diameter of 80-125 μm (P-97Flaming/Brown Micropipette puller; Sutter Instru-ments, Novato, CA, USA) was loaded with saline(0.684 M sodium chloride) and inserted into a saline-filled chlorided AgCl half-cell (A-M systems, Sequim,WA, USA). The electrode tip was positioned using amicromanipulator on the dorsal-nasal surface of theright eye. A ground electrode was attached to the cau-dal fin and a chlorided-silver reference electrode wasplaced on the head of the test fish. Fish were chroma-tically adapted for 1 hour prior to experiments. Thestimulus duration was 500 ms with an interstimulusinterval of 5 s. An isolated bioamplifier (ISO-80;World Precision Instruments, Sarasota, FL, USA)amplified the ERG signal and filtered the signal usingband-pass filter settings (5-Hz low-pass, 100-Hz high-pass). The amplified signal was analyzed with a 16-bitA/D data acquisition system and Signal 4.0 software(Micro 1401; Cambridge Electronic Design Limited,Cambridge, UK). A custom-designed software analysismodule determined the b-wave amplitude (correspond-ing to the ON response of bipolar cells) by measuringthe potential change between the a-wave and b-wavepeaks. Spectral sensitivity was measured in 20-nmincrements, from 320 to 700 nm, using a staggeredwavelength presentation to prevent adaptation to aspectral region.
Analysis of electroretinogramsA response versus intensity (RI) curve was generated foreach wavelength examined. To determine the sensitivityat a given wavelength, the empirical Naka-Rushton func-tion was least-squares fitted to the RI curve with a slopeparameter of 1 [58,59]. The log irradiance level corre-sponding to half response (LogK) was determined, fromwhich the sensitivity was calculated by taking the reci-procal of this value. Typically, the upper asymptote ofthe Naka-Rushton function could be reached for allwavelengths. There were a few exceptions at wave-lengths shorter than 360 nm and longer than 600 nm.At these wavelengths, the value of the maximumresponse parameter (Rmax) was set to that of the neigh-boring wavelength examined, prior to fitting. A log rela-tive sensitivity curve was constructed by normalizing thelog absolute sensitivity values to the maximum sensitiv-ity. This procedure was repeated for each individualunder each of the background conditions.
Background isolation conditionsFour background conditions were designed and used forisolating cones dominating certain spectral regions. Along-wavelength-isolation condition (LW) was used forisolating cone mechanisms most sensitive to long wave-lengths, dim and intense short-wavelength-isolation con-ditions (Dim-SW and SW) aimed at isolating conemechanisms most sensitive to short wavelengths and arelatively spectrally flat background condition was usedas a control. To design and carefully control the level oflight adaptation of the respective cone mechanisms, aquantum catch model was used:
Q A E di i i= ∫ ( ) ( ) ( ) 300
800
(1)
where Qi (photons cm-2 s-1) denotes the quantumcatch of cone mechanism i (i = 1, 2, ..., 6), Ai(l) repre-sents the visual pigment absorption coefficient of conemechanism i at a wavelength l (nm), and Ei(l) denotesthe photon irradiance of the background light field at awavelength l.
Characterization of background conditionsThe irradiance provided under the various backgroundconditions was characterized by measuring the spectralirradiance of the background beam. Spectral irradiancewas measured using a spectroradiometer (QE65000;Ocean Optics, Dunedin, FL, USA) connected to a 2-moptical fiber (QP600-2-UV/VIS; Ocean Optics) that wasfitted with a cosine corrector (CC-3-UV; Ocean Optics).The spectroradiometer utilized a 1024 × 58-element
Sabbah et al. BMC Biology 2010, 8:133http://www.biomedcentral.com/1741-7007/8/133
Page 11 of 16

square silicon CCD (charge-coupled device) array andwas configured with a 25-μm slit and a variable blazewavelength grating (HC-1, groove density = 300 mm-1;Ocean Optics), resulting in an effective spectral resolu-tion of 1.9 nm (FWHM) between 200 and 950 nm. Thefiber end was held approximately 5 cm away from theemergence plane of the background beam, ensuringsampling of the entire beam diameter. The spectroradi-ometer setup was calibrated for absolute irradianceusing a NIST (National Institute of Standards and Tech-nology, Gaithersberg, MD, USA) calibrated Halogen-Deuterium dual light source (200-1000 nm, DH-2000-CAL; Ocean Optics). In cases where spectral variationexceeded the dynamic range of the spectroradiometerand thus a reliable measurement could not be obtained,the irradiance delivered under the background conditionwas calculated by multiplying the measured output ofeach light source by the spectral transmission of the fil-ters used in producing the background condition.
Analysis of spectral sensitivity curves1. Identification of functional conesTwo criteria were devised for the identification of conemechanisms. A sensitivity peak was considered to be acone mechanism if it satisfied the following conditions:(1) the sensitivity peak appeared under at least twobackground isolation conditions, and (2) the sensitivitypeak exhibited changes that were directly related tochanges in the spectral composition of the backgroundconditions. For instance, a sensitivity peak in the ultra-violet range (UV; 340-400 nm) was identified as a UVcone when sensitivity increased under a short-wave-length isolation background or as the b-band of mid-and long-wavelength cones when sensitivity decreasedunder a short-wavelength isolation background.2. Correspondence between visual pigments and conemechanismsTo relate visual pigments with cone mechanisms,absorption templates of visual pigments were fitted tospectral sensitivity curves using a least-squares fit. Thistechnique was previously used in numerous studies andrepeatedly has been shown to allow for the identificationof the cone classes in the retinas of animals [60-62]. Inthis regard, interactions between different cone classesproduce sensitivity peaks that are narrower than theabsorption templates of visual pigments, resulting in asomewhat reduced goodness of fit [60,61]. Visual pig-ment absorbance templates [22] were constructed forthe opsin genes previously reported in cichlids: Notethat the lmax of A1-reconstituted visual pigment is pro-vided in parentheses SWS1 (368 nm), SWS2b (423 nm),SWS2a (456 nm), Rh2b (484 nm), Rh2aa (519 nm),Rh2ab (528 nm) and LWS (560 nm) [10,19]. In the caseof Rh2aa and Rh2ab, the spectral overlap of the two
visual pigment curves necessitated calculating an averagelmax of 523 nm. The 532-nm lmax absorption spectrumwas used for subsequent analysis and is hereafterreferred to as RH2a. To generate visual pigment tem-plates we combined absorption spectra for the A1 andA2 chromophores (A1, equations 1, 2, 4, 5a, 5b; A2,equations 1, 4, 6a, 6b, 8a, 8b) [22]. The proportion ofthe A2 state was presented using a fraction parameter, a(0 ≤ a ≤ 1), and therefore the absorption spectra of agiven cone type exhibiting an A2 proportion of a wascalculated as A2 (a) = A1·(1 - a) + A2·a. The lmax ofeach cone type exhibits a defined wavelength shift as theA2 proportion changes [63]. This shift was also takeninto account when generating the visual pigment tem-plates for varying A2 proportions.Typically, the long-wavelength peak in spectral sensi-
tivity was located between 560 and 600 nm, and thus itcould correspond to either the RH2a (523-560 nm; lmax
A1-lmax A2) or the LWS (560-626 nm; lmax A1-lmax A2)visual pigments. Therefore, to correlate the long-wave-length peak with a visual pigment absorption curve, itwas necessary to determine the A2 proportion in theretina of each individual. Visual pigment absorptiontemplates for the RH2a and LWS pigments were fittedto the long-wavelength limb of the spectral sensitivitycurve. The least-squares fit was performed while leavingthe A2 proportion and a magnitude coefficient unrest-ricted, allowing the software to find a visual pigmenttemplate with an A2 proportion that best describes thelong-wavelength limb. Estimating the A2 proportion onthe basis of the long-wavelength limb is the best possi-ble approach because (1) the lmax shift between the A1
and A2 states is largest for long-wavelength-sensitivecones, and (2) the spectral sensitivity is based on onecone class and thus is not affected by opponent interac-tions. For each individual, the A2 proportion estimatewas used for fitting all visual pigment templates to thespectral sensitivity curve. All absorption templates werecorrected for the spectral transmission of the fish lens(P. taeniolatus [64]; M. zebra and M. auratus measured[1]).3. Modeling cone interactionsA multiple-cone mechanism (MCM) model was used todetermine the relative contribution of each cone class toeach spectral sensitivity curve by assigning weights,which can be positive (excitatory) or negative (inhibi-tory) for each cone mechanism. This “upper envelope”model that was previously used in primates [65,66] andfish [61] assumes that the spectral sensitivity of the eyeis determined by the cones that are most sensitive overthe spectral region of concern. This linear model takesthe general form Sl1, l2 (l) = ∑ ki·Ai (l), where Sl1, l2(l) denotes the modeled spectral sensitivity in the spec-tral range enclosed by l1 and l2 while accounting for
Sabbah et al. BMC Biology 2010, 8:133http://www.biomedcentral.com/1741-7007/8/133
Page 12 of 16

cone interactions; Ai(l) represents the absorption of thevisual pigment template, corresponding to cone i (i = 1,2, ..., 6) at a wavelength l (nm); and ki denotes theweight representing the contribution of cone i. TheMCM model was least-squares fitted to the spectral sen-sitivity curves determined under the various backgroundconditions for each individual separately. The spectralrange between two sensitivity notches was set as the l1- l2 range [61,65,66]. For modeling spectral sensitivity,we selected the cone interaction that (1) included theminimum possible number of cones, (2) allowed for thebest fit under all background conditions, and (3)ensured the same type of cone interaction (opponentand nonopponent) under all background conditions. Toprevent overparameterization of the model, the numberof possible cone interactions was restricted to three.That is, the maximum number of free parameters in themodel was three, while the number of data points usedto fit the model was always larger than three. Theweights assigned to each cone, in addition to the R2
values (total amount of variance accounted for by themodel across the spectrum), were determined. Log rela-tive sensitivity was transformed to percent relative sensi-tivity and normalized to range between 0 and 1 prior tofitting [67].
Preparation of retinal samplesUpon completion of ERG recordings, fish were dark-adapted for 1 hour and then killed by cervical transec-tion. Under deep red illumination (>650 nm), both eyeswere enucleated and hemisected along an anterior-pos-terior axis. The neural retina was then dissected free ofpigmented epithelium. Each isolated retina was pre-served in 0.5 ml of RNAlater (Ambion), stored at 4°Cfor the first 24 hours, and then kept at -80°C untilfurther processing. The sex of the fish was determinedusing the acetocarmine technique [68,69]. Fish were dis-sected and their gonads were removed, stained withacetocarmine and viewed under a dissecting microscopeto determine the fish sex. All fish were sexually matureadults showing well-developed eggs or sperm and wereat least 9 months old. Cichlids typically reach sexualmaturity at 6 months from release [70,71].
Relative gene expression by qPCRQuantitative real-time RT-PCR (qPCR) was used toquantify the relative levels of mRNA expression corre-sponding to the various cone opsin genes. Unless speci-fied otherwise, all procedures described below wereperformed following the manufacturer’s protocols. TotalRNA was extracted from retinas (Absolutely RNA Mini-prep Kit; Agilent Technologies, Santa Clara, CA, USA),and its amount and quality were determined by reading
the absorbance at 260 nm and calculating the absolute260/280 absorbance ratio using a benchtop spectrophot-ometer (Cary 300 Bio; Varian, Santa Clara, CA, USA).Total cDNA was synthesized using 250 ng of total ret-inal RNA and a Superscript III first-strand synthesisSuperMix (Invitrogen, Carlsbad, CA, USA) at 50°C for30 minutes. See Additional file 3 for primer sequencesfor the amplification of the cDNA opsin genes incichlids (RH2aa and RH2ab combined). All primerswere analyzed using the Primer-Blast primer design tool(National Center for Biotechnology Information,Bethesda, MD, USA) for product size, melting tempera-ture, guanine-cytosine content (%) and sequence specifi-city. The specificity of all primer pairs was tested byamplifying target sequences present within the cDNAsynthesized from retinal total RNA. Amplification wascarried out in a Mastercycler gradient 5331 (Eppendorf)using the following concentrations: 2.5 mM MgCl2, 200μM deoxynucleotide triphosphate (dNTP), 100 μM for-ward and reverse primers, 0.05 U GotTaq Flexi DNApolymerase (Promega, Madison, WI, USA), 1× PCR buf-fer and 1 μl of cDNA template, in a final volume of 25μl. The PCR cycling profile consisted of an initial holdat 92°C for 2 minutes, 40 cycles (92°C for 25 s, 55°C for25 s, 72°C for 25 s), and a final extension at 72°C for 5min. To verify that the amplified product obtained fromeach primer pair consisted of a single band and was ofthe correct size, amplified DNA products were separatedin a 2.0% agarose gel 1× TBE (Tris/Borate/EDTA) buf-fer, visualized by GelRed on a gel imager (AlphaImager,Cell Biosciences, Santa Clara, CA, USA) and comparedwith a benchtop 100-bp DNA ladder (Promega).qPCR analysis of individual retinal cDNA samples was
carried out for each opsin gene using Brilliant SYBRgreen qPCR Master Mix (Agilent Technologies) in areal-time quantitative system MX3000P™ (Agilent Tech-nologies). Each 25-μl reaction contained 1× BrilliantSYBR Green Master Mix, 200 mM quantities of bothforward and reverse primers, 0.05 μl of ROX passivereference dye and 1 μl of four times diluted cDNA. Thereaction mix was placed in 96-well nonskirted polypro-pylene PCR plate and capped with optical strip caps(Agilent Technologies). The plate was briefly centrifugedand eye-inspected for the presence of bubbles. The ther-mocycle program was 95°C for 10 minutes, followed by40 cycles of 95°C for 25 seconds, 55°C for 25 secondsand 72°C for 25 seconds. Controls included a reactionlacking cDNA template) and a nontranscribed reactionfor genomic DNA contamination (No-RT). All sampleswere run in triplicate, and fractional cycle values (Cq)were averaged. Amplification efficiencies per sample pertarget were calculated from the slope of the amplifica-tion curve in the exponential phase using LinRegPCR
Sabbah et al. BMC Biology 2010, 8:133http://www.biomedcentral.com/1741-7007/8/133
Page 13 of 16

11.0 software [72]. Relative gene expression was deter-mined for the six opsin genes as a fraction of the totalcone opsin genes expressed for an individual [19]:
T
T
E
E
g i
all i
g iCq
g iCq
g i
g i
,
,
,
,
( )
( )
,
,=
+
+
−
−∑1
1(2)
where Tg,i/Tall,i is the relative gene expression ratio forgene g normalized by the total cone opsin genesexpressed for individual i, Eg,i is the amplification effi-ciency for gene g and individual i, and Cqg,i is the frac-tional cycle value for gene g and individual i. Finally,relative gene expression was averaged for each speciesand sex.
Underwater irradiance measurementsUnderwater spectral irradiance at a horizontal line ofsight was measured in July 2008 at a near-shore site atCape Maclear on the northwestern part of the Nan-kumba Peninsula, Lake Malawi (14° 1” 0” S 34° 51” 0” E;local time: 11:00-11:30, GMT +02:00, average solarzenith angle within the water = 25.6°). The samplingsite, Otter Point, is exposed to wind and wave actionand exhibits a rocky bottom that subsides with depthand becomes a sandy bottom at ~15 m depth [25]. Irra-diance was measured using a thermoelectrically cooledspectroradiometer (QE65000; Ocean Optics) connectedto a 30-m optical fiber (ZPK600-30-UV/VIS; OceanOptics) that was fitted with a cosine corrector (CC-3-UV; Ocean Optics). See the specifications of the spec-troradiometer in the Characterization of backgroundconditions section. Holding the irradiance probe, aSCUBA diver attained position at depths of 5, 10 and 15m, and readings were saved on a computer placed on aboat (positioned as far as possible and never betweenthe diver and the sun to prevent shading). The spectro-radiometer setup was calibrated for absolute irradiancefollowing the same procedure described in the Charac-terization of background conditions section.
Spectral reflectance measurementsSpectral reflectance of the color pattern of fish was mea-sured using a spectroradiometer (USB2000; OceanOptics) connected to one arm of a 2-m bifurcated opti-cal fiber (BIF600-2-UV/VIS; Ocean Optics). The otherarm of the fiber was connected to a light source (DH-2000-BAL; Ocean Optics). The spectroradiometer uti-lized a 2048-element linear silicon CCD array and wasconfigured with a 50-μm slit and a grating (groove den-sity, 600 mm-1; blaze wavelength, 400 nm; grating 2,Ocean Optics), resulting in an effective spectral resolu-tion of 2.06 nm (FWHM) between 200 and 950 nm.The light source integrated two lamps, tungsten-halogen
and deuterium, providing a high and spectrally balancedoutput between 200 and 1000 nm. The common end ofthe bifurcated fiber was fitted with a flat black reflec-tance probe exhibiting a 3-mm diameter tip cut at anangle of 45°. Prior to each measurement session, thelight source was allowed to warm up for at least 40 min-utes. Then a measurement of a Spectralon diffuse reflec-tance standard (WS-1-SL; Ocean Optics) was taken as100% reflectance, and a dark measurement was taken aszero reflectance. Fish were immersed in a 1:10 clove oil:ethanol solution immediately after capture until the fishreached stage IV anesthesia [55]. Fish were held sub-merged in lake water, and spectral reflectance was mea-sured at 10 points along the trunk of the fish (oneindividual per species). Care was given to sealing thereflectance probe against the fish skin to reduce straylight. Readings were acquired and saved on a laptopcomputer.To calculate the quantum catch of the LWS cone pig-
ment, we used the spectral radiance reflected from thecolor pattern of the species studied (equation 1). In thiscase, however, Ei(l) was substituted by the product ofthe sidewelling irradiance at a depth of 5 m, Eh(l) timesthe spectral reflectance of the color pattern of the fish,R(l). Absorption template for the LWS cone pigmentwas generated while assuming A2 proportion of 0.5 [22].
Statistical analysisTo study the effect of sex on the relative opsin geneexpression, we performed multiple t-tests where anexperiment-wise error rate of 5% was corrected to 0.83%(a = 0.05/6 = 0.0083) following Bonferroni correctionfor six hypothesis tests [73] that correspond to six opsingenes (RH2aa and RH2ab were pooled because ofgenetic and functional similarity [10,19]). Prior to per-forming statistical analyses, the normality of all data wasconfirmed using the Kolmogorov-Smirnov test, and thehomogeneity of variance across treatment groups wasconfirmed using Cochran’s C test [74]. To study theeffect of species on the frequency of cone pigments, weperformed multiple Fisher’s exact tests (two-tailed) witha corrected experimental error (a = 0.0083). Statisticalanalysis was performed using the Statistica (t-test) andR version 2.11.1 (Fisher’s exact test) software.
Additional material
Additional file 1: Background isolation conditions for spectralsensitivity measurements. (a) The spectral irradiance provided underthe various background isolation conditions. Background conditions:long-wavelength isolation (LW, red), control (green), Dim shortwavelength (Dim SW, cyan) and short-wavelength isolation (SW, blue).(b) The quantum catches of the six possible cone mechanisms undereach condition. Cone pigment: SWS1 (black), SWS2b (violet), SWS2a(blue), RH2b (green), RH2a (orange) and LWS (red). Cone quantum
Sabbah et al. BMC Biology 2010, 8:133http://www.biomedcentral.com/1741-7007/8/133
Page 14 of 16
catches were calculated while setting the A2% of cones to 50 for thedesign of the background conditions.
Additional file 2: Summary of t-test results for the examination ofthe effect of sex on opsin gene expression.
Additional file 3: Primer specifications for cone opsin genes.
Additional file 4: Statistics of cone interactions for the mostfrequent cone pigment subset of each species.
AbbreviationsCCD: charge-coupled device; Dim-SW: dim short-wavelength-isolationbackground condition; ERG: electroretinogram; FWHM: full width half max;GnRH: Gonadotropin-releasing hormone; SW: short-wavelength-isolationbackground condition; LW: long-wavelength-isolation background condition;LWS: long wavelength sensitive; MCM: multiple-cone mechanism; NA:numerical aperture; NIST: National Institute of standards and technology; OD:optical density; RH: rhodopsin-like; RI: response versus intensity; SWS: shortwavelength sensitive; TH: thyroid hormones; UV: ultraviolet.
AcknowledgementsWe thank Rotem Goldshmid, Prof. Barrie Frost, Dr. Nicholas Roberts, Dr.Shelby Temple, Shyh-Chi Chen, Ilse Dedden, and Dr. Taro Matsumoto forvaluable comments. We thank Dr. James Fraser and Dr. Tom Lisney for helpin optimizing the ERG experimental apparatus and procedures, Dr. WilliamNelson and Dr. Nikolaus Troje for suggestions regarding modelingprocedures, Dr. Chris Hofmann for providing lens transmission data forcichlids, and Dr. Karen Carleton for qPCR primer sequences and helpfulsuggestions for gene expression analysis. This research was supported by aNatural Sciences and Engineering Research Council of Canada (NSERC)Discovery Grant, NSERC Research Tools and Instruments Grant, the CanadaResearch Chair Program, the Canada Foundation for Innovation, and theOntario Innovation Trust to CWH. SS was supported by an NSERC VanierCanada Graduate Scholarship. SMG was supported by a NSERC PostdoctoralFellowship.
Author details1Department of Biology, Queen’s University, Kingston, ON, K7L 3N6, Canada.2Department of Biology, McGill University, Montreal, QC, H3A 1B1, Canada.3Centre for Neuroscience Studies, Queen’s University, Kingston, ON, K7L 3N6,Canada.
Authors’ contributionsSS carried out the design of the experiments, executed the spectralsensitivity measurements, performed all data analysis and participated inwriting the manuscript; CWH participated in the design of the study andwriting the manuscript; RLL performed the qPCR gene expression profiling;SMG performed the spectral reflectance measurements. All authors read andapproved the final manuscript.
Competing interestsThe authors declare that they have no competing interests.
Received: 14 July 2010 Accepted: 28 October 2010Published: 28 October 2010
References1. Lisney TJ, Studd E, Hawryshyn CW: Electrophysiological assessment of
spectral sensitivity in adult Nile tilapia Oreochromis niloticus: evidencefor violet sensitivity. J Exp Biol 2010, 213:1453-1463.
2. Parkyn DC, Hawryshyn CW: Spectral and ultraviolet-polarisation sensitivityin juvenile salmonids: A comparative analysis using electrophysiology. JExp Biol 2000, 203:1173-1191.
3. Yokoyama S, Yokoyama R: Adaptive evolution of photoreceptors andvisual pigments in vertebrates. Annu Rev Ecol Syst 1996, 27:543-567.
4. Bowmaker JK: Evolution of vertebrate visual pigments. Vision Res 2008,48:2022-2041.
5. Collin SP, Knight MA, Davies WL, Potter IC, Hunt DM, Trezise AEO: Ancientcolour vision: Multiple opsin genes in the ancestral vertebrates. Curr Biol2003, 13:R864-R865.
6. Christoffels A, Koh EGL, Chia JM, Brenner S, Aparicio S, Venkatesh B: Fugugenome analysis provides evidence for a whole-genome duplicationearly during the evolution of ray-finned fishes. Mol Biol Evol 2004,21:1146-1151.
7. Furutani-Seiki M, Wittbrodt J: Medaka and zebrafish, an evolutionary twinstudy. Mech Dev 2004, 121:629-637.
8. Meyer A, Schartl M: Gene and genome duplications in vertebrates: theone-to-four (-to-eight in fish) rule and the evolution of novel genefunctions. Curr Opin Cell Biol 1999, 11:699-704.
9. Carleton KL, Kocher TD: Cone opsin genes of African cichlid fishes:Tuning spectral sensitivity by differential gene expression. Mol Biol Evol2001, 18:1540-1550.
10. Parry JWL, Carleton KL, Spady T, Carboo A, Hunt DM, Bowmaker JK: Mixand match color vision: Tuning spectral sensitivity by differential opsingene expression in Lake Malawi cichlids. Curr Biol 2005, 15:1734-1739.
11. Shand J, Davies WL, Thomas N, Balmer L, Cowing JA, Pointer M,Carvalho LS, Trezise AEO, Collin SP, Beazley LD, Hunt DM: The influence ofontogeny and light environment on the expression of visual pigmentopsins in the retina of the black bream, Acanthopagrus butcheri. J ExpBiol 2008, 211:1495-1503.
12. Fryer G, Iles TD: The Cichlid Fishes of the Great Lakes of Africa: Their Biologyand Evolution Neptune City, NJ: T. F. H. Publications; 1972.
13. Salzburger W: The interaction of sexually and naturally selected traits inthe adaptive radiations of cichlid fishes. Mol Ecol 2009, 18:169-185.
14. Turner GF, Seehausen O, Knight ME, Allender CJ, Robinson RL: How manyspecies of cichlid fishes are there in African lakes? Mol Ecol 2001,10:793-806.
15. Genner MJ, Seehausen O, Lunt DH, Joyce DA, Shaw PW, Carvalho GR,Turner GF: Age of cichlids: new dates for ancient lake fish radiations. MolBiol Evol 2007, 24:1269-1282.
16. Danley PD, Kocher TD: Speciation in rapidly diverging systems: lessonsfrom Lake Malawi. Mol Ecol 2001, 10:1075-1086.
17. Kocher TD: Adaptive evolution and explosive speciation: the cichlid fishmodel. Nature Reviews Genetics 2004, 5:288-298.
18. Jordan R, Kellogg K, Juanes F, Stauffer J: Evaluation of female mate choicecues in a group of Lake Malawi mbuna (Cichlidae). Copeia 2003, 181-186.
19. Spady TC, Parry JWL, Robinson PR, Hunt DM, Bowmaker JK, Carleton KL:Evolution of the cichlid visual palette through ontogeneticsubfunctionalization of the opsin gene arrays. Mol Biol Evol 2006,23:1538-1547.
20. Carleton KL, Spady TC, Streelman JT, Kidd MR, McFarland WN, Loew ER:Visual sensitivities tuned by heterochronic shifts in opsin geneexpression. BMC Biol 2008, 6:22.
21. Hofmann CM, O’Quin KE, Marshall NJ, Cronin TW, Seehausen O, Carleton KL:The eyes have it: regulatory and structural changes both underlie cichlidvisual pigment diversity. PLoS Biol 2009, 7:e1000266.
22. Govardovskii VI, Fyhrquist N, Reuter T, Kuzmin DG, Donner K: In search ofthe visual pigment template. Vis Neurosci 2000, 17:509-528.
23. Djamgoz MBA, Yamada M: Electrophysiological characteristics of retinalneurons; interactions and functional output. In The Visual System of Fish.Edited by: Douglas R, Djamgoz MBA. London: Chapman and Hall;1990:161-210.
24. Reinthal PN: The feeding-habits of group of herbivorous rock-dwellingcichlid fishes (Cichlidae, Perciformes) from Lake Malawi, Africa. EnvironBiol Fishes 1990, 27:215-233.
25. Ribbink AJ, Marsh BA, Marsh AC, Ribbink AC, Sharp BJ: A preliminarysurvey of the cichlid fishes of rocky habitats in Lake Malawi. S Afr J Zool1983, 18:149-310.
26. Konings A: Konings’s Book of Cichlids and All the Other Fishes of Lake MalawiNeptune, NJ: T.F.H publications; 1990.
27. Hurvich LM: Color Vision Sunderland, MA: Sinauer Associates; 1981.28. Fuller RC, Fleishman LJ, Leal M, Travis J, Loew E: Intraspecific variation in
retinal cone distribution in the bluefin killifish, Lucania goodei. J CompPhysiol A 2003, 189:609-616.
29. Konings A: Lake Malawi Cichlids in their Natural Habitat Germany: CichlidPress; 1995.
Sabbah et al. BMC Biology 2010, 8:133http://www.biomedcentral.com/1741-7007/8/133
Page 15 of 16

30. Deutsch JC: Colour diversification in Malawi cichlids: Evidence foradaptation, reinforcement or sexual selection? Biol J Linn Soc Lond 1997,62:1-14.
31. McElroy DM, Kornfield I, Everett J: Coloration in African cichlids: diversityand constraints in Lake Malawi endemics. Neth J Zool 1991, 41:250-268.
32. Stauffer JR, Bowers NJ, Kellogg KA, McKaye KR: A revision of the blue-blackPseudotropheus zebra (Teleostei: Cichlidae) complex from Lake Malawi,Africa, with a description of a new genus and ten new species. ProcAcad Nat Sci Phila 1997, 148:189-230.
33. Couldridge VCK, Alexander GJ: Color patterns and species recognition infour closely related species of Lake Malawi cichlid. Behav Ecol 2002,13:59-64.
34. Kidd MR, Danley PD, Kocher TD: A direct assay of female choice incichlids: all the eggs in one basket. J Fish Biol 2006, 68:373-384.
35. Dijkstra PD, Seehausen O, Groothuis TGG: Direct male-male competitioncan facilitate invasion of new colour types in Lake Victoria cichlids.Behav Ecol Sociobiol 2005, 58:136-143.
36. Jordan R, Kellogg K, Howe D, Juanes F, Stauffer J, Loew E: Photopigmentspectral absorbance of Lake Malawi cichlids. J Fish Biol 2006,68:1291-1299.
37. Carleton KL: Cichlid fish visual systems: mechanisms of spectral tuning.Integr Zool 2009, 4:75-86.
38. Darwin C: The Descent of Man and Selection in Relation to Sex London:Murray; 1871.
39. Shine R: Ecological causes for the evolution of sexual dimorphism: areview of the evidence. Q Rev Biol 1989, 64:419-461.
40. Slatkin M: Ecological causes of sexual dimorphism. Evolution 1984,38:622-630.
41. Barlow GW: Mating systems among cichlid fishes. In Cichlid Fishes:Behaviour, Ecology and Evolution. Edited by: Keenleyside MHA. London:Chapman 1991:173-190.
42. Werner NY, Lotem A: Choosy males in a haplochromine cichlid: Firstexperimental evidence for male mate choice in a lekking species. AnimBehav 2003, 66:293-298.
43. Browman HI, Novales Flamarique I, Hawryshyn CW: Ultravioletphotoreception contributes to prey search behavior in 2 species ofzooplanktivorous fishes. J Exp Biol 1994, 186:187-198.
44. Johnsen S, Widder EA: Ultraviolet absorption in transparent zooplanktonand its implications for depth distribution and visual predation. Mar Biol2001, 138:717-730.
45. Novales Flamarique I, Browman HI: Foraging and prey-search behaviour ofsmall juvenile rainbow trout (Oncorhynchus mykiss) under polarizedlight. J Exp Biol 2001, 204:2415-2422.
46. Sabbah S, Shashar N: Polarization contrast of zooplankton: a model forpolarization-based sighting distance. Vision Res 2006, 46:444-456.
47. Shashar N, Hanlon RT, Petz AD: Polarization vision helps detecttransparent prey. Nature 1998, 393:222-223.
48. Carleton KL, Hofmann CM, Klisz C, Patel Z, Chircus LM, Simenauer LH,Soodoo N, Albertson RC, Ser JR: Genetic basis of differential opsin geneexpression in cichlid fishes. J Evol Biol 2010, 23:840-853.
49. Temple SE, Ramsden SD, Haimberger TJ, Veldhoen KM, Veldhoen NJ,Carter NL, Roth WM, Hawryshyn CW: Effects of exogenous thyroidhormones on visual pigment composition in Coho salmon(Oncorhynchus kisutch). J Exp Biol 2008, 211:2134-2143.
50. Raine JC, Coffin AB, Hawryshyn CW: Systemic thyroid hormone isnecessary and sufficient to induce ultraviolet-sensitive cone loss in thejuvenile rainbow trout retina. J Exp Biol 2010, 213:493-501.
51. Ejike C, Schreck CB: Stress and social hierarchy rank in Coho salmon.Trans Am Fish Soc 1980, 109:423-426.
52. Pickering AD: Growth and stress in fish production. Aquaculture 1993,111:51-63.
53. Ramakrishnan S, Wayne NL: Social cues from conspecifics alter electricalactivity of gonadotropin-releasing hormone neurons in the terminalnerve via visual signals. Am J Physiol Regul Integr Comp Physiol 2009, 297:R135-R141.
54. Hawryshyn CW, Moyer HD, Allison WT, Haimberger TJ, McFarland WN:Multidimensional polarization sensitivity in damselfishes. J Comp PhysiolA 2003, 189:213-220.
55. Jolly DW, Mawdesley-Thomas LE, Bucke D: Anaesthesia of fish. Vet Rec1972, 91:424-426.
56. Li P, Temple S, Gao Y, Haimberger TJ, Hawryshyn CW, Li L: Circadianrhythms of behavioral cone sensitivity and long wavelength opsinmRNA expression: a correlation study in zebrafish. J Exp Biol 2005,208:497-504.
57. Parkyn DC, Hawryshyn CW: Polarized-light sensitivity in rainbow-trout(Oncorhynchus-Mykiss): characterization from multiunit responses in theoptic-nerve. J Comp Physiol A 1993, 172:493-500.
58. Dowling JE, Ripps H: Adaptation in skate photoreceptors. J Gen Physiol1972, 60:698-719.
59. Naka KI, Rushton WAH: S-potentials from colour units in retina of fish(Cyprinidae). J Physiol (London) 1966, 185:536-555.
60. Hawryshyn CW, Ramsden SD, Betke KM, Sabbah S: Spectral andpolarization sensitivity of juvenile Atlantic salmon (Salmo salar):phylogenetic considerations. J Exp Biol 2010, 213:3187-3197.
61. Hughes A, Saszik S, Bilotta J, DeMarco PJ, Patterson WF: Cone contributionsto the photopic spectral sensitivity of the zebrafish ERG. Vis Neurosci1998, 15:1029-1037.
62. Patterson WF, McDowell AL, Hughes A, Bilotta J: Opponent andnonopponent contributions to the zebrafish electroretinogram usingheterochromatic flicker photometry. J Comp Physiol A 2002, 188:283-293.
63. Harosi FI: An analysis of two spectral properties of vertebrate visualpigments. Vision Res 1994, 34:1359-1367.
64. Hofmann CM, O’Quin KE, Marshall NJ, Carleton KL: The relationshipbetween lens transmission and opsin gene expression in cichlids fromLake Malawi. Vision Res 2010, 50:357-363.
65. Kalloniatis M, Harwerth RS: Spectral sensitivity and adaptationcharacteristics of cone mechanisms under white-light adaptation. J OptSoc Am A 1990, 7:1912-1928.
66. Sperling HG, Harwerth RS: Red-green cone interactions in increment-threshold spectral sensitivity of primates. Science 1971, 172:180-184.
67. Demarco PJ, Powers MK: Spectral sensitivity of On and Off responsesfrom the optic-nerve of goldfish. Visual Neurosci 1991, 6:207-217.
68. Guerrero RD, Shelton WL: An aceto-carmine squash technique for sexingjuvenile fishes. The Progressive Fish Culturist 1974, 36:56.
69. Wassermann GJ, Afonso LOB: Validation of the aceto-caramin techniquefor evaluating phenotypic sex in Nile tilapia (Oreochromis niloticus) fry.Ciência Rural 2002, 32:133-139.
70. Balon EK: Early ontogeny of Labeotropheus Ahl 1927 (Mbuna, Cichlidae,Lake Malawi) with a discussion on advanced protective styles in fishreproduction and development. Environ Biol Fishes 1977, 2:147-176.
71. Morrison CM, Miyake T, Wright JR: Histological study of the developmentof the embryo and early larva of Oreochromis niloticus (Pisces: Cichlidae).J Morphol 2001, 247:172-195.
72. Ruijter JM, Ramakers C, Hoogaars WMH, Karlen Y, Bakker O, van denHoff MJB, Moorman AFM: Amplification efficiency: linking baseline andbias in the analysis of quantitative PCR data. Nucleic Acids Res 2009, 37:e45.
73. Quinn GP, Keough MJ: Experimental Design and Data Analysis for BiologistsNew York: Cambridge University Press; 2002.
74. Underwood AJ: Experiments in Ecology Cambridge, UK: CambridgeUniversity Press; 1997.
doi:10.1186/1741-7007-8-133Cite this article as: Sabbah et al.: Functional diversity in the color visionof cichlid fishes. BMC Biology 2010 8:133.
Submit your next manuscript to BioMed Centraland take full advantage of:
• Convenient online submission
• Thorough peer review
• No space constraints or color figure charges
• Immediate publication on acceptance
• Inclusion in PubMed, CAS, Scopus and Google Scholar
• Research which is freely available for redistribution
Submit your manuscript at www.biomedcentral.com/submit
Sabbah et al. BMC Biology 2010, 8:133http://www.biomedcentral.com/1741-7007/8/133
Page 16 of 16
Related Documents