Functional connectivity of the reward circuit predicts changes in appetite in depression Nils B. Kroemer 1* , Nils Opel 2,5 , Vanessa Teckentrup 1,9 , Meng Li 1-3 , Dominik Grotegerd 5 , Susanne Meinert 5 , Hannah Lemke 5 , Tilo Kircher 6 , Igor Nenadić 6 , Axel Krug 6,10 , Andreas Jansen 6 , Jens Sommer 6 , Olaf Steinsträter 6 , Dana M. Small 7,8 , Udo Dannlowski 5 , & Martin Walter 1-4 1 Department of Psychiatry and Psychotherapy, Tübingen Center for Mental Health, University of Tübingen, Tübingen, Germany 2 Department of Psychiatry and Psychotherapy, University Hospital Jena, Jena, Germany 3 Department of Psychiatry and Psychotherapy, Otto-von-Guericke University Magdeburg, Magdeburg, Germany 4 Leibniz Institute for Neurobiology, Magdeburg, Germany 5 Institute for Translational Psychiatry, University of Münster, Münster, Germany 6 Department of Psychiatry and Psychotherapy, University of Marburg, Marburg, Germany 7 Departments of Psychiatry and Psychology, Yale University, New Haven, CT 8 Modern Diet and Physiology Research Center, Yale University, New Haven, CT 9 Institute of Neuroscience, Trinity College Dublin, Dublin, Ireland 10 Department of Psychiatry and Psychotherapy, University of Bonn, Bonn, Germany Corresponding author* Dr. Nils B. Kroemer, [email protected] Calwerstr. 14, 72076 Tübingen, Germany

Welcome message from author
This document is posted to help you gain knowledge. Please leave a comment to let me know what you think about it! Share it to your friends and learn new things together.
Transcript
Functional connectivity of the reward circuit predicts changes in appetite in
depression
Nils B. Kroemer1*, Nils Opel2,5, Vanessa Teckentrup1,9, Meng Li1-3, Dominik
Grotegerd5, Susanne Meinert5, Hannah Lemke5, Tilo Kircher6, Igor Nenadić6, Axel
Krug6,10, Andreas Jansen6, Jens Sommer6, Olaf Steinsträter6, Dana M. Small7,8, Udo
Dannlowski5, & Martin Walter1-4
1 Department of Psychiatry and Psychotherapy, Tübingen Center for Mental Health, University of Tübingen, Tübingen, Germany
2 Department of Psychiatry and Psychotherapy, University Hospital Jena, Jena, Germany
3 Department of Psychiatry and Psychotherapy, Otto-von-Guericke University Magdeburg, Magdeburg, Germany
4 Leibniz Institute for Neurobiology, Magdeburg, Germany 5 Institute for Translational Psychiatry, University of Münster, Münster, Germany 6 Department of Psychiatry and Psychotherapy, University of Marburg, Marburg,
Germany 7 Departments of Psychiatry and Psychology, Yale University, New Haven, CT 8 Modern Diet and Physiology Research Center, Yale University, New Haven,
CT 9 Institute of Neuroscience, Trinity College Dublin, Dublin, Ireland 10 Department of Psychiatry and Psychotherapy, University of Bonn, Bonn,
Germany
Corresponding author*
Dr. Nils B. Kroemer, [email protected]
Calwerstr. 14, 72076 Tübingen, Germany

MDD & appetite Kroemer et al. 2
Key Points
Question: Does the functional architecture of the reward circuit reflect whether patients suffering from depression experience increases or decreases in appetite and weight?
Findings: Using neuroimaging, we observed that reduced appetite in depression was associated with reduced functional connectivity between the nucleus accumbens and the ventromedial prefrontal cortex as well as the hippocampus. In contrast, reduced connectivity of the nucleus accumbens to the insular ingestive cortex was associated with increased appetite and cross-validated elastic-net models predicted changes in appetite if symptom severity was high.
Meaning: Differential changes in appetite are reflected in the functional architecture of the reward circuit, but predictive accuracy scales with symptom severity.
MDD & appetite Kroemer et al. 3
Structured Abstract
Importance: Major depressive disorder (MDD) is characterized by a substantial
burden on health including changes in appetite and body weight. Heterogeneity of
depressive symptoms has hampered the identification of robust biomarkers thus
limiting the potential for personalized treatment.
Objective: To define the functional architecture of the reward circuit subserving
increases versus decreases in appetite and body weight in MDD by specifying their
respective contributions and their influence on disease biomarkers using resting-state
functional connectivity (FC).
Design, Setting, & Participants: Functional magnetic resonance imaging (fMRI) data
were from the Marburg-Münster FOR 2107 Affective Disorder Cohort (MACS) study,
collected between September 2014 and November 2016. Cross-sectional data of
patients with MDD (NMDD=407) and healthy control participants (NHC=400) were
analyzed.
Main outcomes and measures: We examined dimensional changes in appetite
during the depressive episode and their association with functional connectivity of the
reward circuit at rest using fMRI. By taking the nucleus accumbens (NAcc) as seed,
we mapped associations with opposing changes in appetite and build a sparse
symptom-specific prediction model using elastic net with tenfold cross-validation.
Results: Among 407 MDD patients (mean [SD] age, 36.79 [13.4] years; 249 women
[61%]), reduced NAcc-based FC to the ventromedial prefrontal cortex (vmPFC) and
the hippocampus was associated with reduced appetite (bootstrap r [95% CI], vmPFC:
r = .13 [.02, .23]; hippocampus r = .15 [.05, .26]). In contrast, reduced NAcc-based FC
to the insular ingestive cortex was associated with increased appetite (bootstrap r [95%
CI], r = -.14 [-.24, -.04]). Critically, the cross-validated elastic net model predicted
changes in appetite based on NAcc FC and explained variance increased with
increasing symptom severity (bootstrap mean [95% CI], all patients r = .24 [.16, .31,
BDI ≥ 28 r = .42 [.25, .58]). In contrast, NAcc FC did not predict diagnosis (MDD vs.
HC).
Conclusions and relevance: Our results show that the FC of the reward circuit
reflects important individual differences in appetite and body weight in depression that
can be leveraged for personalized prediction. However, classification of diagnosis
based on FC of the reward circuit did not exceed chance levels. Such symptom-specific
associations emphasize the need to map biomarkers onto more confined facets of
psychopathology to improve classification and treatment of patients with MDD.
MDD & appetite Kroemer et al. 4
Introduction
Major depressive disorder (MDD) is a common (lifetime prevalence 8-15%) and
multifaceted mental disorder accounting globally for about 4% of disability-adjusted life
years1. However, effective treatment suffers from considerable limitations. Less than
40% of patients treated for MDD achieve remission by an initial treatment and sequelae
of “failed” attempts impose substantial individual and societal costs2. Although there
are various reasons for low success rates of treatment, one major obstacle is imposed
by the striking heterogeneity of symptoms present in MDD3-6. Critically, these clusters
of symptoms may respond differentially to treatment7,8 calling for a stronger emphasis
on biological mechanisms9. Despite numerous alleged biomarkers2,7,10, the mapping
of specific symptoms onto well-defined characteristics of the brain as propelled by the
research domain criteria framework9,11 has been largely intractable to date12,13. Hence,
there is still great demand to delineate alterations in brain function that may give rise
to the diverse psychopathology in patients suffering from MDD.
A substantial part of MDD’s burden on health is caused by changes in appetite
and body weight as vegetative symptoms14-16 and comorbid obesity leads to more
severe courses of depression17. Whereas changes in appetite and body weight are key
symptoms of MDD, not all patients experience alterations in the same direction.
Melancholic depression is characterized by severe loss of appetite and weight,
whereas atypical depression is characterized by the reverse: increased appetite and
weight gain3,14-16. Moreover, changes in weight are highly correlated across episodes18
suggesting that the expression of vegetative symptoms could be linked to trait-like
differences. Quantitative modeling of individual differences is commonly seen as an
essential step towards precision medicine in psychiatry19-21. One promising candidate
to identify trait-like biomarkers of cardinal symptoms in mental disorders is the unique
functional architecture of the brain22-26. Illustratively, it has been shown that
connectomes based on functional connectivity (FC) matrices can re-identify individuals
with very high accuracy even across task states22,25,27,28, comparable to a “fingerprint”.
Thus, leveraging information about the unique functional architecture of patients
suffering from either increases or decreases of appetite and body weight may help
unravel the neurobiological mechanisms of opposing changes in appetite in MDD.
To identify differential signatures of increases versus decreases in appetite, we
used the FC of the reward circuit and tested associations with changes in appetite in a
MDD & appetite Kroemer et al. 5
large sample of patients with MDD and compared FC to healthy control (HC)
participants. We hypothesized that alterations in the reward circuit would be more
strongly associated with this symptomatic dimension reflecting changes in appetitive
behavior for primary rewards, compared to a diagnosis of MDD per se. Moreover, we
trained cross-validated elastic net models to derive sparse quantitative predictions
based on individual FC profiles of the reward circuit and assessed the accuracy of
prediction as a function of overall symptom severity. By combining functional symptom
mapping and predictive modeling, we identify individual differences in the functional
architecture of the brain that may reflect diverse behavioral profiles of depressive
symptoms.
Methods
Participants
All participants took part in the ongoing Marburg-Münster FOR 2107 Affective
Disorder Cohort (MACS) study involving two different sites for scanning29. We included
participants in the analysis who had records of the SIGH-ADS interview30 and Beck
Depression Inventory (BDI)31 questionnaires that we used to calculate the composite
appetite score and passed quality control of the data including FC matrices (for details,
see SI)32. This led to a total sample size of NMDD=407 and NHC=400. All participants
were free of any significant neurological condition. Demographic characteristics of
participants are reported in Table 1. The FOR2107 cohort project (WP1) was approved
by the Ethics Committees of the Medical Faculties, University of Marburg (AZ: 07/14)
and University of Münster (AZ: 2014-422-b-S).
MR data acquisition and preprocessing
MR data was collected using comparable sequences at two different scanners:
a 3T Siemens TIM Trio scanner and a 3T Siemens Prisma scanner (Siemens,
Erlangen, Germany). First, we collected T1-weighted anatomical scans with an
isotropic resolution of 1 mm3. Second, for rs-fMRI, we used a T2*-weighted AC-PC
aligned echo planar imaging (EPI) sequence. We collected 237 volumes with an
effective voxel size of 3.28 x 3.28 x 4.18 mm3 (slice thickness 3.8 mm, distance factor
10%, field of view = 210 mm, ascending slice acquisition order), a repetition time (TR)
of 2,000 ms, an echo time (TE) of 30 ms (29 ms for the second site), and a flip angle
of 90°. Participants were instructed to lie still with their eyes closed.
MDD & appetite Kroemer et al. 6
The first 5 volumes of rs-fMRI data were discarded from the analyses to avoid
artifacts due to magnetic saturation effects. We applied the default preprocessing
pipeline of CONN33 to the MRI data. Functional preprocessing included realignment,
slice-time correction, and resampling at 2 mm3 isotropic. Structural data was
segmented into gray matter, white matter, and cerebrospinal fluid (CSF), then
normalized to MNI space before direct segmentation and normalization of functional
data. All preprocessing steps were performed using the CONN Functional Connectivity
Toolbox33 in SPM12 (Wellcome Department of Imaging Neuroscience, London, UK)
and MATLAB v2018a (Mathworks Inc).
Data analysis
Calculation of the composite appetite score
To quantify whether patients were experiencing increases or decreases of
appetite and body weight, we calculated a composite appetite score, Δappetite. The
composite score contained 4 positively and 4 negatively poled items from the SIGH-
ADS30 extended version of the Hamilton interview and the BDI31. To calculate
Δappetite, we subtracted negatively poled items from the positively poled items,
leading to scores ranging from +9 (strong increases in appetite and body weight) to -9
(strong decreases in appetite and body weight) with a median and mode of 0 (Figure
1). For MDD patients, Cronbach’s alpha of the composite score was α =.63. This
internal consistency is acceptable given the low number of items, the complementary
acquisition method of items (clinical rating via interview vs. self-report), and
psychometric characteristics of most depression scales4,6,34.
Calculation of functional connectivity
Before extraction of time courses to calculate FC, we applied confound
regression and band-pass filtering (0.01 - 0.1 Hz) to functional MRI data. Confound
regression steps included anatomical CompCor, which uses 5 principal components
each extracted from the white matter and CSF35, 6 rigid body motion parameters as
well as their first temporal derivatives, and scrubbing. During scrubbing, outlier
volumes were removed by adding a dummy-coded regressor36. We determined outlier
volumes via Artifact Detection Tools (ART, www.nitrc.org/projects/artifact_detect/) and
frames were flagged if framewise displacement exceeded 0.5 mm compared to the
MDD & appetite Kroemer et al. 7
previous frame or if the global mean signal intensity of the frame was +3 SD above the
mean intensity of all frames.
To define regions of interest (ROIs), we used an extended version of the CONN
atlas consisting of the Harvard-Oxford brain atlas, the AAL cerebellum ROIs, and
additional subcortical structures defined by the Pauli atlas37. To account for nuisance
variance at the participant level, we controlled for age, gender, BMI, scanner site, and
framewise displacement (ln-transformed) in all analyses. FC was calculated as the
Pearson correlation coefficient between each pair of ROIs. For statistical analyses, all
correlations were Fisher z-transformed.
Cross-validated prediction of appetite scores using elastic net
To assess whether opposing changes in appetite can be robustly predicted from
NAcc-based FC, we used an elastic net as implemented in MATLAB. Elastic net is a
regularized regression technique that combines L1 and L2 penalties used in LASSO
and ridge regression, respectively. Thereby, it yields a sparse prediction model by
selecting a limited number of complementary features from a candidate set of
correlated features. The hyperparameter, α, weighing the penalty terms was set a priori
to 0.5 and was not optimized to avoid overfitting. By default, the elastic net uses tenfold
cross-validation to select a set of regularized predictors minimizing the mean squared
error (MSE) of prediction in held-out folds. Due to probabilistic partitioning of data into
folds, we repeated each training 10 times and took the median weights to select a
robust model for prediction. Hence, weights that were not reproduced in at least half of
the iterations were dropped from the model. For permutation testing, we repeated the
same procedure 1000 times, but permuted the appetite score vector (MATLAB
datasample) before training the models. To classify participants as MDD or HC, we
used a support vector machine (MATLAB fitcsvm) with tenfold cross-validation, which
is analogous to a (rescaled) elastic net38.
Statistical analysis, threshold, and software
For whole-brain fMRI analyses, we used p<.001 as first-pass voxel threshold.
To determine the necessary cluster extent k for family-wise whole-brain correction after
masking for gray matter voxels, we used AlphaSim with 1,000 iterations as
implemented in restplus v1.2239. This indicated that a threshold of k≥125 voxels
provides whole-brain correction for multiple comparisons (pFWE_cl≤.05). For display, we
MDD & appetite Kroemer et al. 8
selected a slightly lower k≥105 (pFWE_cl≤.10) to include clusters that may marginally fail
to surpass the whole-brain threshold. Since small ROIs within the reward circuit may
not surpass the corrected whole-brain threshold, we used an ROI of the reward circuit
based on the extended Harvard-Oxford brain atlas for focused hypothesis testing
(Figure S.1). Selected ROIs included the striatum, vmPFC, pallidum, amygdala,
hippocampus, insula, dopaminergic midbrain. For all other analyses, we used a two-
tailed α≤.05. To obtain bootstrap confidence intervals, we used 50,000 resampling
iterations (MATLAB bootci with bca).
Bayes factors were calculated using JASP v0.9.0.040 using a stretched beta
prior width set to .5 (denoting strong correlations as less likely a priori). We also
conducted prior robustness analyses and changes in the prior would have not led to
differences in evidential conclusions. Other statistical analyses were conducted with
MATLAB vR2017-2018a, SPSS v24, and R v3.4.041.
Results
A total of 407 participants with MDD were included (mean [SD] age, 36.79
[13.35] years, 158 [39%] male). Out of the 407 patients, 150 [37%] experienced
decreases in appetite and weight (i.e., Δappetite<0), whereas 94 [23%] experienced
increases in appetite and weight (i.e., Δappetite>0). The study also included 400
healthy individuals (mean [SD] age, 29.37 [10.64] years, 149 [37%] male; see Table
1). Crucially, medication was not associated with Δappetite (|r| <.1, p >.1; Figure S.2)
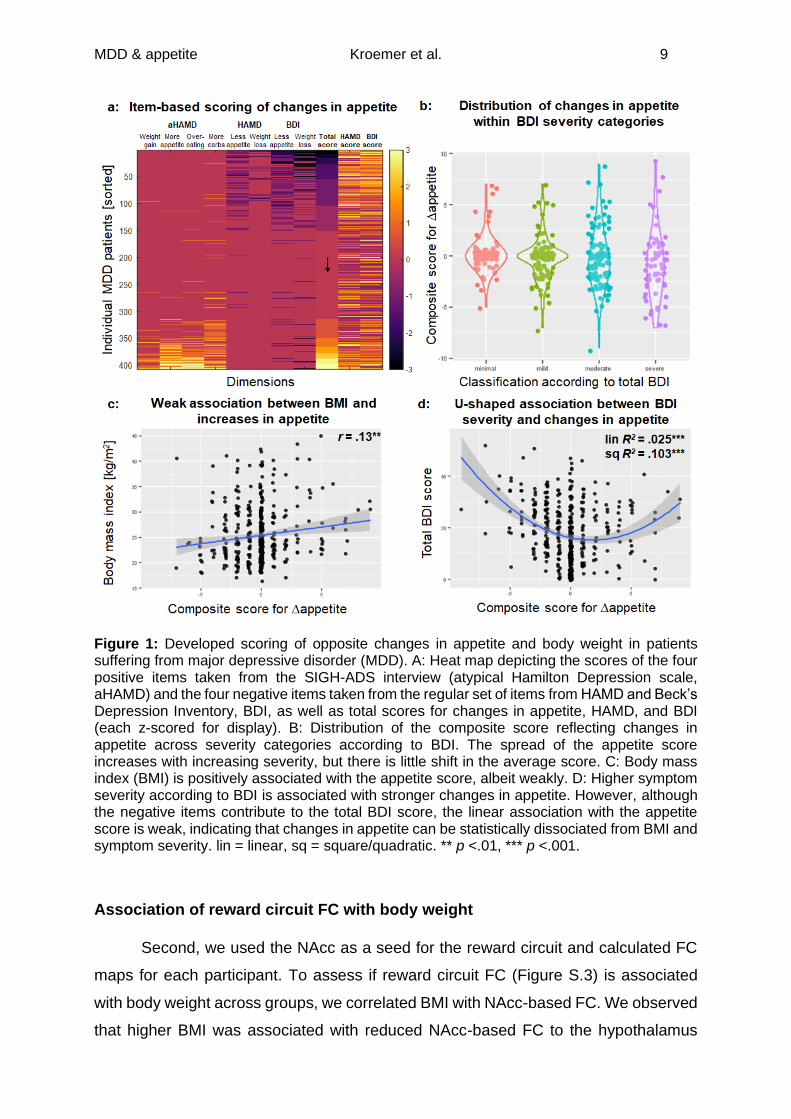
Changes in composite appetite score
First, we calculated a composite score Δappetite based on the positively and
negatively poled items from the clinical interview and the BDI. In patients with MDD,
this composite score showed an adequate internal consistency (Cronbach’s α =.63;
Figure 1a) and was only weakly associated with BMI and overall symptom severity
(Figure 1b-d). Nevertheless, the variance in Δappetite increased with increasing
symptom severity (Levene’s test contrasting minimal&low to moderate&severe BDI
categories, p <.001; Figure 1b).
MDD & appetite Kroemer et al. 9
Figure 1: Developed scoring of opposite changes in appetite and body weight in patients suffering from major depressive disorder (MDD). A: Heat map depicting the scores of the four positive items taken from the SIGH-ADS interview (atypical Hamilton Depression scale, aHAMD) and the four negative items taken from the regular set of items from HAMD and Beck’s Depression Inventory, BDI, as well as total scores for changes in appetite, HAMD, and BDI (each z-scored for display). B: Distribution of the composite score reflecting changes in appetite across severity categories according to BDI. The spread of the appetite score increases with increasing severity, but there is little shift in the average score. C: Body mass index (BMI) is positively associated with the appetite score, albeit weakly. D: Higher symptom severity according to BDI is associated with stronger changes in appetite. However, although the negative items contribute to the total BDI score, the linear association with the appetite score is weak, indicating that changes in appetite can be statistically dissociated from BMI and symptom severity. lin = linear, sq = square/quadratic. ** p <.01, *** p <.001.
Association of reward circuit FC with body weight
Second, we used the NAcc as a seed for the reward circuit and calculated FC
maps for each participant. To assess if reward circuit FC (Figure S.3) is associated
with body weight across groups, we correlated BMI with NAcc-based FC. We observed
that higher BMI was associated with reduced NAcc-based FC to the hypothalamus
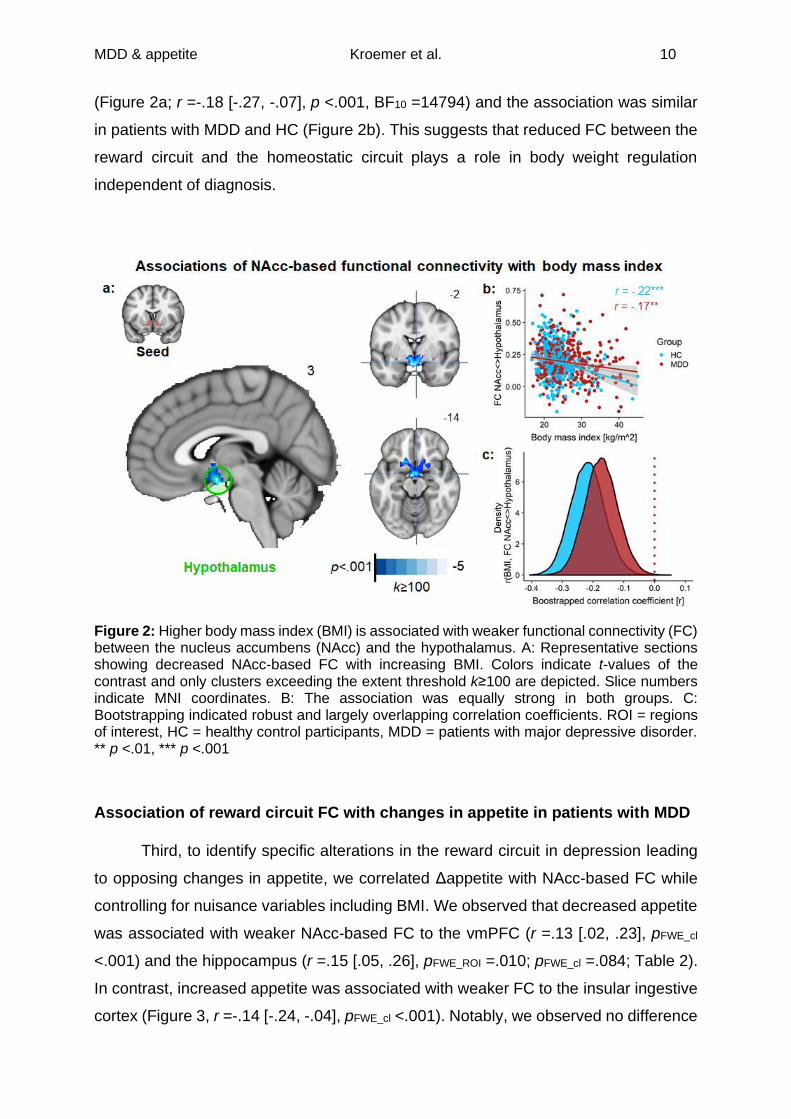
MDD & appetite Kroemer et al. 10
(Figure 2a; r =-.18 [-.27, -.07], p <.001, BF10 =14794) and the association was similar
in patients with MDD and HC (Figure 2b). This suggests that reduced FC between the
reward circuit and the homeostatic circuit plays a role in body weight regulation
independent of diagnosis.
Figure 2: Higher body mass index (BMI) is associated with weaker functional connectivity (FC) between the nucleus accumbens (NAcc) and the hypothalamus. A: Representative sections showing decreased NAcc-based FC with increasing BMI. Colors indicate t-values of the contrast and only clusters exceeding the extent threshold k≥100 are depicted. Slice numbers indicate MNI coordinates. B: The association was equally strong in both groups. C: Bootstrapping indicated robust and largely overlapping correlation coefficients. ROI = regions of interest, HC = healthy control participants, MDD = patients with major depressive disorder. ** p <.01, *** p <.001
Association of reward circuit FC with changes in appetite in patients with MDD
Third, to identify specific alterations in the reward circuit in depression leading
to opposing changes in appetite, we correlated Δappetite with NAcc-based FC while
controlling for nuisance variables including BMI. We observed that decreased appetite
was associated with weaker NAcc-based FC to the vmPFC (r =.13 [.02, .23], pFWE_cl
<.001) and the hippocampus (r =.15 [.05, .26], pFWE_ROI =.010; pFWE_cl =.084; Table 2).
In contrast, increased appetite was associated with weaker FC to the insular ingestive
cortex (Figure 3, r =-.14 [-.24, -.04], pFWE_cl <.001). Notably, we observed no difference
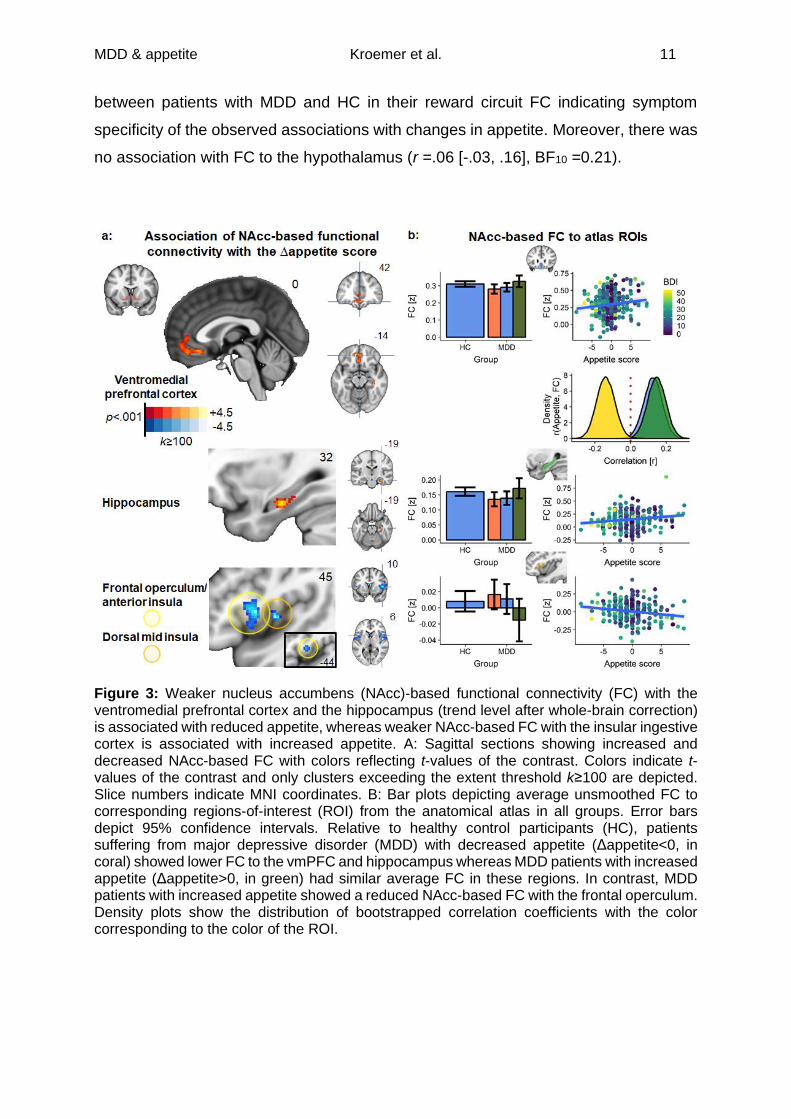
MDD & appetite Kroemer et al. 11
between patients with MDD and HC in their reward circuit FC indicating symptom
specificity of the observed associations with changes in appetite. Moreover, there was
no association with FC to the hypothalamus (r =.06 [-.03, .16], BF10 =0.21).
Figure 3: Weaker nucleus accumbens (NAcc)-based functional connectivity (FC) with the ventromedial prefrontal cortex and the hippocampus (trend level after whole-brain correction) is associated with reduced appetite, whereas weaker NAcc-based FC with the insular ingestive cortex is associated with increased appetite. A: Sagittal sections showing increased and decreased NAcc-based FC with colors reflecting t-values of the contrast. Colors indicate t-values of the contrast and only clusters exceeding the extent threshold k≥100 are depicted. Slice numbers indicate MNI coordinates. B: Bar plots depicting average unsmoothed FC to corresponding regions-of-interest (ROI) from the anatomical atlas in all groups. Error bars depict 95% confidence intervals. Relative to healthy control participants (HC), patients suffering from major depressive disorder (MDD) with decreased appetite (Δappetite<0, in coral) showed lower FC to the vmPFC and hippocampus whereas MDD patients with increased appetite (Δappetite>0, in green) had similar average FC in these regions. In contrast, MDD patients with increased appetite showed a reduced NAcc-based FC with the frontal operculum. Density plots show the distribution of bootstrapped correlation coefficients with the color corresponding to the color of the ROI.
MDD & appetite Kroemer et al. 12
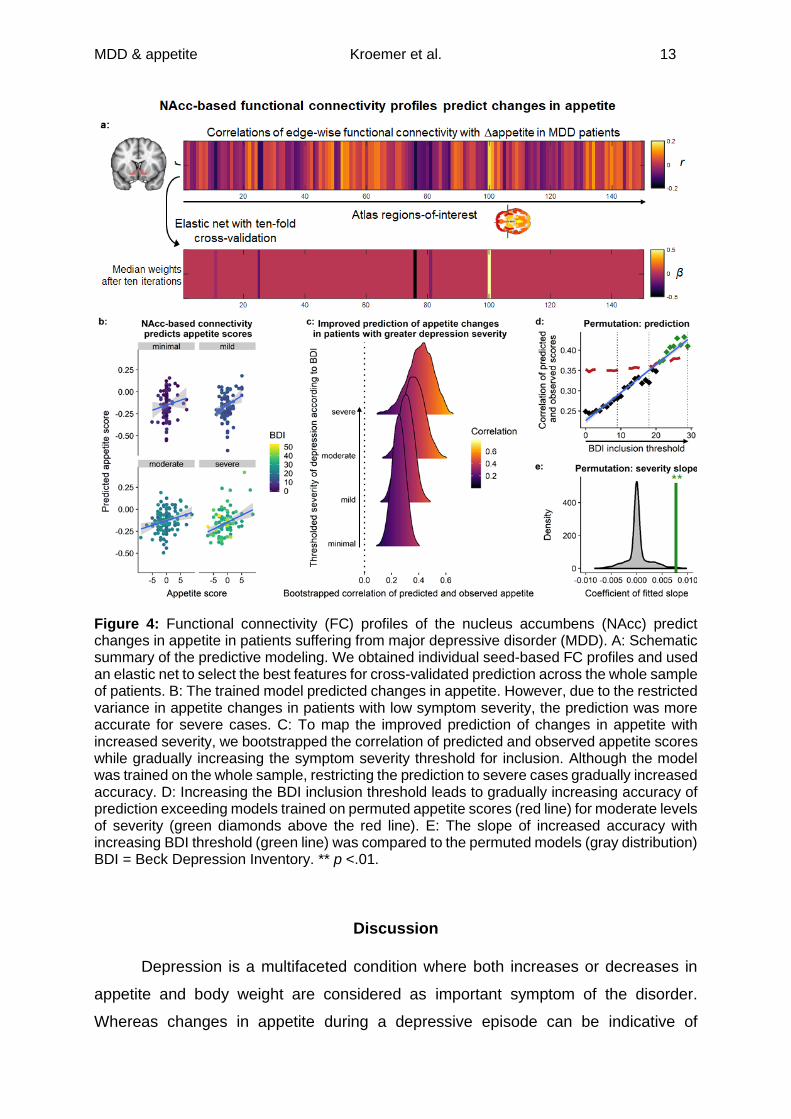
Cross-validated prediction of changes in appetite in patients with MDD
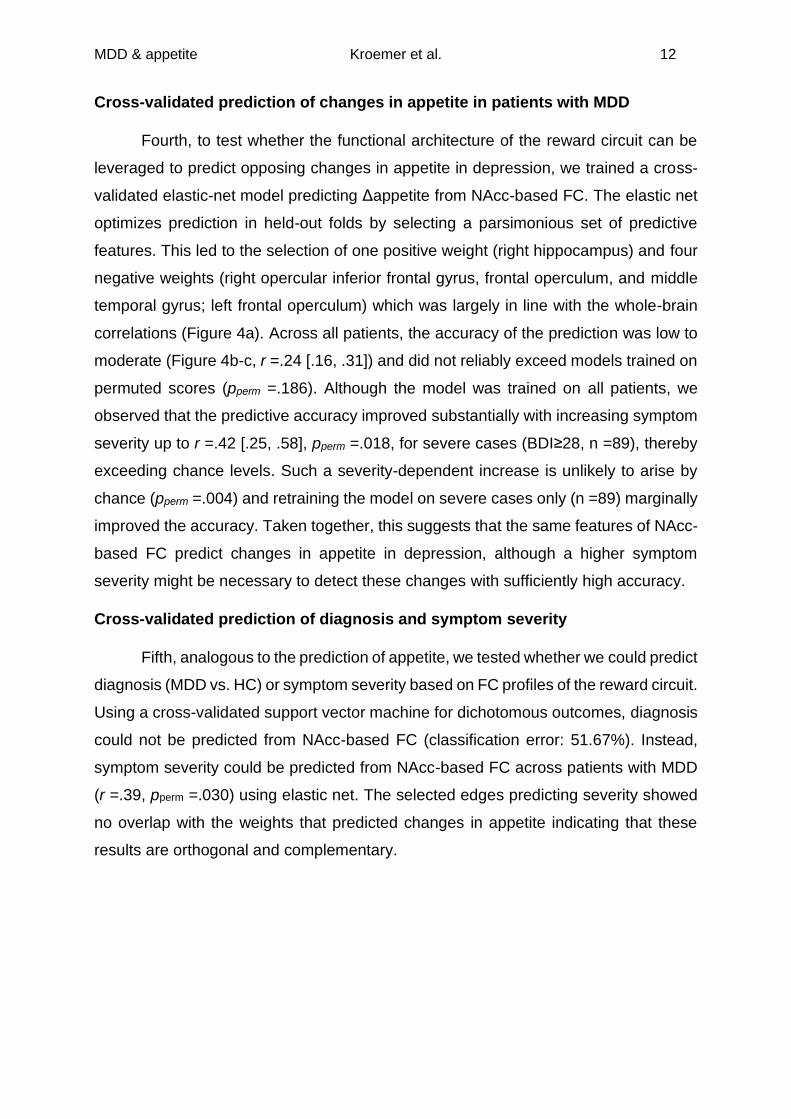
Fourth, to test whether the functional architecture of the reward circuit can be
leveraged to predict opposing changes in appetite in depression, we trained a cross-
validated elastic-net model predicting Δappetite from NAcc-based FC. The elastic net
optimizes prediction in held-out folds by selecting a parsimonious set of predictive
features. This led to the selection of one positive weight (right hippocampus) and four
negative weights (right opercular inferior frontal gyrus, frontal operculum, and middle
temporal gyrus; left frontal operculum) which was largely in line with the whole-brain
correlations (Figure 4a). Across all patients, the accuracy of the prediction was low to
moderate (Figure 4b-c, r =.24 [.16, .31]) and did not reliably exceed models trained on
permuted scores (pperm =.186). Although the model was trained on all patients, we
observed that the predictive accuracy improved substantially with increasing symptom
severity up to r =.42 [.25, .58], pperm =.018, for severe cases (BDI≥28, n =89), thereby
exceeding chance levels. Such a severity-dependent increase is unlikely to arise by
chance (pperm =.004) and retraining the model on severe cases only (n =89) marginally
improved the accuracy. Taken together, this suggests that the same features of NAcc-
based FC predict changes in appetite in depression, although a higher symptom
severity might be necessary to detect these changes with sufficiently high accuracy.
Cross-validated prediction of diagnosis and symptom severity
Fifth, analogous to the prediction of appetite, we tested whether we could predict
diagnosis (MDD vs. HC) or symptom severity based on FC profiles of the reward circuit.
Using a cross-validated support vector machine for dichotomous outcomes, diagnosis
could not be predicted from NAcc-based FC (classification error: 51.67%). Instead,
symptom severity could be predicted from NAcc-based FC across patients with MDD
(r =.39, pperm =.030) using elastic net. The selected edges predicting severity showed
no overlap with the weights that predicted changes in appetite indicating that these
results are orthogonal and complementary.
MDD & appetite Kroemer et al. 13
Figure 4: Functional connectivity (FC) profiles of the nucleus accumbens (NAcc) predict changes in appetite in patients suffering from major depressive disorder (MDD). A: Schematic summary of the predictive modeling. We obtained individual seed-based FC profiles and used an elastic net to select the best features for cross-validated prediction across the whole sample of patients. B: The trained model predicted changes in appetite. However, due to the restricted variance in appetite changes in patients with low symptom severity, the prediction was more accurate for severe cases. C: To map the improved prediction of changes in appetite with increased severity, we bootstrapped the correlation of predicted and observed appetite scores while gradually increasing the symptom severity threshold for inclusion. Although the model was trained on the whole sample, restricting the prediction to severe cases gradually increased accuracy. D: Increasing the BDI inclusion threshold leads to gradually increasing accuracy of prediction exceeding models trained on permuted appetite scores (red line) for moderate levels of severity (green diamonds above the red line). E: The slope of increased accuracy with increasing BDI threshold (green line) was compared to the permuted models (gray distribution) BDI = Beck Depression Inventory. ** p <.01.
Discussion
Depression is a multifaceted condition where both increases or decreases in
appetite and body weight are considered as important symptom of the disorder.
Whereas changes in appetite during a depressive episode can be indicative of
MDD & appetite Kroemer et al. 14
depression regardless of the direction, disregarding whether appetite is increased or
decreased may hamper the dissection of brain circuits subserving specific
symptoms14,16,42,43. Here, we demonstrate that FC of the reward circuit provides critical
insights on body weight regulation in general and, more specifically, the direction of
appetite changes in depression. Crucially, using voxel-based analyses and predictive
modeling, we identified reduced NAcc-based FC to the hippocampus with reduced
appetite and reduced NAcc-based FC to the insular ingestive cortex/frontal operculum
with increased appetite as robust associations. Collectively, our results corroborate
and substantially extend previous findings that individual differences in the functional
architecture of the reward circuit are associated with specific appetitive symptoms of a
disorder without necessarily discerning patients from controls. This key observation re-
emphasizes the demand to move towards theory-driven quantitative modeling of
specific symptoms instead of lumping together patients20 despite their obvious
heterogeneity in symptoms4,5.
In line with previous findings, we showed that the functional architecture of the
reward circuit is an important marker of individual differences in body weight and
appetitive symptoms in depression. We showed that reduced NAcc-based FC to the
hypothalamus was associated with higher BMI. The hypothalamus tracks homeostatic
state which is consistently reflected in altered BOLD responses44-48. Reduced
correspondence between homeostatic and “hedonic” circuits has been repeatedly
linked to an increased risk for overweight and obesity in preclinical49,50 and human
studies51-57. This mechanism is pharmacologically modulated by nicotine58-61, reducing
the boost in incentive salience conferred by a hungry state60. Thus, reward circuit FC
with the hypothalamus plays a vital role in body weight regulation making it a prime
candidate to mediate opposing changes in appetite in depression alike.
However, perhaps surprisingly, we found conclusive evidence for a functional
dissociation in NAcc-based FC with other crucial regions of the reward circuit. First,
there was no association between changes in appetite and NAcc-based FC to the
hypothalamus and our data provided moderate support for the null hypothesis, despite
the strong support for an association with BMI. Second, we found that reduced NAcc-
based FC with the vmPFC and the hippocampus was associated with reduced appetite
in patients with MDD. The vmPFC serves as a hub coordinating goal-directed and
emotional behavior in concert with default mode, brainstem, and limbic circuits to
generate “affective meaning”62,63. By providing top-down control on striatal signaling,
MDD & appetite Kroemer et al. 15
the vmPFC is more broadly involved in anhedonia64,65 and it is commonly used as
target for deep brain stimulation in treatment-resistant depression66,67. FC between the
NAcc and the hippocampus, particularly the ventral hippocampus, has been previously
linked to vulnerability for depression in rodents68,69 and studies in humans have shown
altered effective connectivity of the hippocampus in depression70. In contrast, reduced
FC to the insular ingestive cortex was associated with increased appetite, dovetailing
well with previous results that pointed to the NAcc using insula-based FC analyses in
depressed patients with increased appetite14,16. FC between the insula and the NAcc
has been linked to processing of unexpected taste71 and global brain connectivity of
the insular ingestive cortex and the striatum during milkshake intake is reduced in
obesity55. More broadly, discrepancies between interoceptive signals forwarded by the
insula72 and exteroceptive signals have been hypothesized to drive depression73,74.
Taken together, our findings corroborate the idea that core symptoms of depression
can be mapped onto alterations in the reward circuit in line with established functional
characteristics of these regions—even though depression cannot be categorically
classified from their FC profiles, or more extensive sets of potential neuroimaging
biomarkers75.
Limitations
We observed that the predictive accuracy of the cross-validated models was
scaling with symptom severity, likely due to the restricted range of the composite score
Δappetite in less severe cases. However, since retraining the models on severe cases
only did not improve prediction, future research should try to improve the assessment
of symptoms. Since changes in appetite are highly consistent across episodes, one
promising option would be to complement the assessment by asking for symptoms
during the most severe state that a patient has experienced. Moreover, extending the
assessment by including more sensitive questions could improve the prediction for
patients with low severity as well.
Conclusion
Changes in appetite and body weight as vegetative symptoms are a core
diagnostic element of depression. Although the opposing direction of changes may
preclude the robust identification of biomarkers, it has received limited attention so far.
We show that the functional architecture of the reward circuit reflects individual
differences in BMI, and, more specifically, the direction of appetite changes in patients
MDD & appetite Kroemer et al. 16
with MDD. Crucially, we functionally dissociated the connectivity profiles associated
with inter-individual differences in BMI across participants from changes in appetite
and weight during depressive episodes. Collectively, our results suggest that aberrant
connectivity between the reward and homeostatic circuits is related to body weight
regulation, but the expression of appetitive changes may depend on intrinsic
connectivity to hubs conferring primary reward “value” and affective meaning. These
findings strongly suggest that differential treatments would be necessary to specifically
target the alterations in the reward circuit. Quantitative modeling such as provided by
our work may ultimately help pave the way towards personalization of therapeutic
modules in depression and beyond.
Acknowledgement
This work is part of the German multicenter consortium “Neurobiology of
Affective Disorders. A translational perspective on brain structure and function“, funded
by the German Research Foundation (Deutsche Forschungsgemeinschaft DFG;
Forschungsgruppe/Research Unit FOR2107).
Principal investigators (PIs) with respective areas of responsibility in the
FOR2107 consortium are:
Work Package WP1, FOR2107/MACS cohort and brain imaging: Tilo Kircher
(speaker FOR2107; DFG grant numbers KI 588/14-1, KI 588/14-2), Udo Dannlowski
(co-speaker FOR2107; DA 1151/5-1, DA 1151/5-2), Axel Krug (KR 3822/5-1, KR
3822/7-2), Igor Nenadic (NE 2254/1-2), Carsten Konrad (KO 4291/3-1). WP2, animal
phenotyping: Markus Wöhr (WO 1732/4-1, WO 1732/4-2), Rainer Schwarting (SCHW
559/14-1, SCHW 559/14-2). WP3, miRNA: Gerhard Schratt (SCHR 1136/3-1, 1136/3-
2). WP4, immunology, mitochondriae: Judith Alferink (AL 1145/5-2), Carsten Culmsee
(CU 43/9-1, CU 43/9-2), Holger Garn (GA 545/5-1, GA 545/7-2). WP5, genetics:
Marcella Rietschel (RI 908/11-1, RI 908/11-2), Markus Nöthen (NO 246/10-1, NO
246/10-2), Stephanie Witt (WI 3439/3-1, WI 3439/3-2). WP6, multi‑method data
analytics: Andreas Jansen (JA 1890/7-1, JA 1890/7-2), Tim Hahn (HA 7070/2-2),
Bertram Müller-Myhsok (MU1315/8-2), Astrid Dempfle (DE 1614/3-1, DE 1614/3-2).
CP1, biobank: Petra Pfefferle (PF 784/1-1, PF 784/1-2), Harald Renz (RE 737/20-1,
737/20-2). CP2, administration. Tilo Kircher (KI 588/15-1, KI 588/17-1), Udo
Dannlowski (DA 1151/6-1), Carsten Konrad (KO 4291/4-1).
MDD & appetite Kroemer et al. 17
NBK received support from the University of Tübingen, Faculty of Medicine,
fortune grant #2453-0-0, the Daimler and Benz Foundation, grant #32-04/19, and DFG
grants KR 4555/7-1 and KR 4555/9-1. NBK and all coauthors had full access to all the
data in the study and NBK takes responsibility for the accuracy of the data analysis.
All PIs take responsibility for the integrity of the respective study data and their
components.
Author contributions
TK, AK, IN, AJ, & UD were responsible for the study concept and design. DG,
SM, HL collected data under supervision by TK, AK, IN, AJ, & UD. NBK, NO, & MW
conceived the research question as well as the corresponding analysis methods and
ML & VT preprocessed the data. NBK performed the data analysis and VT contributed
to analyses. NBK wrote the manuscript and NO contributed to the writing. All authors
contributed to the interpretation of findings, provided critical revision of the manuscript
for important intellectual content, and approved the final version for publication.
Financial disclosure
Tilo Kircher received unrestricted educational grants from Servier, Janssen,
Recordati, Aristo, Otsuka, neuraxpharm. Markus Wöhr is scientific advisor of Avisoft
Bioacoustics. Martin Walter is a member of the advisory boards and gave
presentations for the following companies: Boehringer Ingelheim, Germany; Bayer AG,
Germany; and Biologische Heilmittel Heel GmbH, Germany. Martin Walter has further
conducted studies with institutional research support from HEEL and from Janssen
Pharmaceutical Research for a clinical trial (IIT) on ketamine in patients with major
depression unrelated to this investigation. Martin Walter has not received any financial
compensation from above-mentioned companies. All other authors report no
biomedical financial interests or potential conflicts of interest.
MDD & appetite Kroemer et al. 18
References
1. Ferrari AJ, Charlson FJ, Norman RE, et al. Burden of depressive disorders by country, sex, age, and year: findings from the global burden of disease study 2010. PLoS Med. Nov 2013;10(11):e1001547. doi:10.1371/journal.pmed.1001547 2. McGrath CL, Kelley ME, Holtzheimer PE, et al. Toward a neuroimaging treatment selection biomarker for major depressive disorder. JAMA Psychiatry. Aug 2013;70(8):821-9. doi:10.1001/jamapsychiatry.2013.143 3. Sullivan PF, Kessler RC, Kendler KS. Latent class analysis of lifetime depressive symptoms in the national comorbidity survey. Am J Psychiatry. Oct 1998;155(10):1398-406. doi:10.1176/ajp.155.10.1398 4. Fried EI, Nesse RM. Depression sum-scores don't add up: why analyzing specific depression symptoms is essential. BMC Med. Apr 6 2015;13:72. doi:10.1186/s12916-015-0325-4 5. Fried EI, Nesse RM. Depression is not a consistent syndrome: An investigation of unique symptom patterns in the STAR*D study. J Affect Disord. Feb 1 2015;172:96-102. doi:10.1016/j.jad.2014.10.010 6. Fried EI, Nesse RM, Zivin K, Guille C, Sen S. Depression is more than the sum score of its parts: individual DSM symptoms have different risk factors. Psychol Med. Jul 2014;44(10):2067-76. doi:10.1017/S0033291713002900 7. Drysdale AT, Grosenick L, Downar J, et al. Resting-state connectivity biomarkers define neurophysiological subtypes of depression. Nat Med. Jan 2017;23(1):28-38. doi:10.1038/nm.4246 8. Argyropoulos SV, Nutt DJ. Anhedonia revisited: is there a role for dopamine-targeting drugs for depression? J Psychopharmacol. Oct 2013;27(10):869-77. doi:10.1177/0269881113494104 9. Insel TR. The NIMH Research Domain Criteria (RDoC) Project: precision medicine for psychiatry. Am J Psychiatry. Apr 2014;171(4):395-7. doi:10.1176/appi.ajp.2014.14020138 10. Fröhner JH, Teckentrup V, Smolka MN, Kroemer NB. Addressing the reliability fallacy in fMRI: Similar group effects may arise from unreliable individual effects. NeuroImage. Mar 28 2019;195:174-189. doi:10.1016/j.neuroimage.2019.03.053 11. Insel TR, Cuthbert B, Garvey M, et al. Research domain criteria (RDoC): toward a new classification framework for research on mental disorders. Am J Psychiatry. Jul 2010;167(7):748-51. doi:10.1176/appi.ajp.2010.09091379 12. Borsboom D, Cramer A, Kalis A. Brain disorders? Not really... Why network structures block reductionism in psychopathology research. Behav Brain Sci. Jan 24 2018:1-54. doi:10.1017/S0140525X17002266 13. Muller VI, Cieslik EC, Serbanescu I, Laird AR, Fox PT, Eickhoff SB. Altered brain activity in unipolar depression revisited: meta-analyses of neuroimaging studies. JAMA Psychiatry. Jan 01 2017;74(1):47-55. doi:10.1001/jamapsychiatry.2016.2783 14. Simmons WK, Burrows K, Avery JA, et al. Depression-related increases and decreases in appetite: dissociable patterns of aberrant activity in reward and interoceptive neurocircuitry. Am J Psychiatry. Apr 01 2016;173(4):418-28. doi:10.1176/appi.ajp.2015.15020162 15. Milaneschi Y, Simmons WK, van Rossum EFC, Penninx BW. Depression and obesity: evidence of shared biological mechanisms. Mol Psychiatry. Feb 16 2018;doi:10.1038/s41380-018-0017-5 16. Simmons WK, Burrows K, Avery JA, et al. Appetite changes reveal depression subgroups with distinct endocrine, metabolic, and immune states. Mol Psychiatry. Jun 13 2018;doi:10.1038/s41380-018-0093-6
MDD & appetite Kroemer et al. 19
17. Opel N, Redlich R, Grotegerd D, et al. Obesity and major depression: Body-mass index (BMI) is associated with a severe course of disease and specific neurostructural alterations. Psychoneuroendocrinology. Jan 2015;51:219-26. doi:10.1016/j.psyneuen.2014.10.001 18. Stunkard AJ, Fernstrom MH, Price A, Frank E, Kupfer DJ. Direction of weight change in recurrent depression. Consistency across episodes. Arch Gen Psychiatry. Sep 1990;47(9):857-60. 19. Wolfers T, Doan NT, Kaufmann T, et al. Mapping the Heterogeneous Phenotype of Schizophrenia and Bipolar Disorder Using Normative Models. JAMA Psychiatry. Nov 1 2018;75(11):1146-1155. doi:10.1001/jamapsychiatry.2018.2467 20. Marquand AF, Wolfers T, Mennes M, Buitelaar J, Beckmann CF. Beyond Lumping and Splitting: A Review of Computational Approaches for Stratifying Psychiatric Disorders. Biol Psychiatry Cogn Neurosci Neuroimaging. Sep 2016;1(5):433-447. doi:10.1016/j.bpsc.2016.04.002 21. Marquand AF, Rezek I, Buitelaar J, Beckmann CF. Understanding Heterogeneity in Clinical Cohorts Using Normative Models: Beyond Case-Control Studies. Biol Psychiatry. Oct 1 2016;80(7):552-61. doi:10.1016/j.biopsych.2015.12.023 22. Horien C, Shen X, Scheinost D, Constable RT. The individual functional connectome is unique and stable over months to years. Neuroimage. Feb 2 2019;189:676-687. doi:10.1016/j.neuroimage.2019.02.002 23. Shen X, Finn ES, Scheinost D, et al. Using connectome-based predictive modeling to predict individual behavior from brain connectivity. Nat Protoc. Mar 2017;12(3):506-518. doi:10.1038/nprot.2016.178 24. Noble S, Spann MN, Tokoglu F, Shen X, Constable RT, Scheinost D. Influences on the Test-Retest Reliability of Functional Connectivity MRI and its Relationship with Behavioral Utility. Cereb Cortex. Sep 12 2017:1-15. doi:10.1093/cercor/bhx230 25. Waller L, Walter H, Kruschwitz JD, et al. Evaluating the replicability, specificity, and generalizability of connectome fingerprints. Neuroimage. Jul 11 2017;158:371-377. doi:10.1016/j.neuroimage.2017.07.016 26. Yip SW, Scheinost D, Potenza MN, Carroll KM. Connectome-Based Prediction of Cocaine Abstinence. Am J Psychiatry. Feb 1 2019;176(2):156-164. doi:10.1176/appi.ajp.2018.17101147 27. Finn ES, Scheinost D, Finn DM, Shen X, Papademetris X, Constable RT. Can brain state be manipulated to emphasize individual differences in functional connectivity? Neuroimage. Mar 31 2017;doi:10.1016/j.neuroimage.2017.03.064 28. Finn ES, Shen X, Scheinost D, et al. Functional connectome fingerprinting: identifying individuals using patterns of brain connectivity. Nat Neurosci. Nov 2015;18(11):1664-71. doi:10.1038/nn.4135 29. Kircher T, Wohr M, Nenadic I, et al. Neurobiology of the major psychoses: a translational perspective on brain structure and function-the FOR2107 consortium. Eur Arch Psychiatry Clin Neurosci. Sep 28 2018;doi:10.1007/s00406-018-0943-x 30. Williams JBW, Terman M. Structured interview guide for the Hamilton depression rating scale with atypical depression supplement (SIGH-ADS). New York State Psychiatric Institute; 2003. 31. Beck AT, Steer RA, Garbin MG. Psychometric properties of the Beck Depression Inventory: twenty-five years of evaluation. Clin Psychol Rev. 1988; 32. Vogelbacher C, Mobius TWD, Sommer J, et al. The Marburg-Munster Affective Disorders Cohort Study (MACS): A quality assurance protocol for MR neuroimaging data. Neuroimage. May 15 2018;172:450-460. doi:10.1016/j.neuroimage.2018.01.079
MDD & appetite Kroemer et al. 20
33. Whitfield-Gabrieli S, Nieto-Castanon A. Conn: a functional connectivity toolbox for correlated and anticorrelated brain networks. Brain Connect. 2012;2(3):125-41. doi:10.1089/brain.2012.0073 34. Fried EI, Epskamp S, Nesse RM, Tuerlinckx F, Borsboom D. What are 'good' depression symptoms? Comparing the centrality of DSM and non-DSM symptoms of depression in a network analysis. J Affect Disord. Jan 1 2016;189:314-20. doi:10.1016/j.jad.2015.09.005 35. Behzadi Y, Restom K, Liau J, Liu TT. A component based noise correction method (CompCor) for BOLD and perfusion based fMRI. Neuroimage. Aug 1 2007;37(1):90-101. doi:10.1016/j.neuroimage.2007.04.042 36. Power JD, Barnes KA, Snyder AZ, Schlaggar BL, Petersen SE. Spurious but systematic correlations in functional connectivity MRI networks arise from subject motion. Neuroimage. Feb 1 2012;59(3):2142-54. doi:10.1016/j.neuroimage.2011.10.018 37. Pauli WM, Nili AN, Tyszka JM. A high-resolution probabilistic in vivo atlas of human subcortical brain nuclei. Sci Data. Apr 17 2018;5:180063. doi:10.1038/sdata.2018.63 38. Zhou Q, Chen W, Song S, Gardner JR, Weinberger KQ, Chen Y. A reduction of the elastic net to support vector machines with an application to GPU computing. 2015: 39. Song XW, Dong ZY, Long XY, et al. REST: a toolkit for resting-state functional magnetic resonance imaging data processing. PLoS One. 2011;6(9):e25031. doi:10.1371/journal.pone.0025031 40. JASP (Version 0.9.0)[Computer software]. 2019. 41. R: A language and environment for statistical computing. Version 3.4.0. R Foundation for Statistical Computing; 2017. 42. Milaneschi Y, Lamers F, Peyrot WJ, et al. Genetic Association of Major Depression With Atypical Features and Obesity-Related Immunometabolic Dysregulations. JAMA Psychiatry. Dec 1 2017;74(12):1214-1225. doi:10.1001/jamapsychiatry.2017.3016 43. Milaneschi Y, Lamers F, Bot M, Drent ML, Penninx BW. Leptin Dysregulation Is Specifically Associated With Major Depression With Atypical Features: Evidence for a Mechanism Connecting Obesity and Depression. Biol Psychiatry. May 1 2017;81(9):807-814. doi:10.1016/j.biopsych.2015.10.023 44. Smeets PA, Vidarsdottir S, de Graaf C, et al. Oral glucose intake inhibits hypothalamic neuronal activity more effectively than glucose infusion. Am J Physiol Endocrinol Metab. Sep 2007;293(3):E754-8. doi:10.1152/ajpendo.00231.2007 45. Smeets PA, de Graaf C, Stafleu A, van Osch MJ, van der Grond J. Functional magnetic resonance imaging of human hypothalamic responses to sweet taste and calories. Am J Clin Nutr. Nov 2005;82(5):1011-6. doi:10.1093/ajcn/82.5.1011 46. Cornier MA, Salzberg AK, Endly DC, Bessesen DH, Rojas DC, Tregellas JR. The effects of overfeeding on the neuronal response to visual food cues in thin and reduced-obese individuals. PLoS One. Jul 28 2009;4(7):e6310. doi:10.1371/journal.pone.0006310 47. Cornier MA, Von Kaenel SS, Bessesen DH, Tregellas JR. Effects of overfeeding on the neuronal response to visual food cues. Am J Clin Nutr. Oct 2007;86(4):965-71. doi:10.1093/ajcn/86.4.965 48. Kroemer NB, Krebs L, Kobiella A, et al. (Still) longing for food: insulin reactivity modulates response to food pictures. Hum Brain Mapp. Oct 2013;34(10):2367-80. doi:10.1002/hbm.22071 49. Kenny PJ. Common cellular and molecular mechanisms in obesity and drug addiction. Nat Rev Neurosci. Nov 2011;12(11):638-51. doi:10.1038/nrn3105
MDD & appetite Kroemer et al. 21
50. Johnson PM, Kenny PJ. Dopamine D2 receptors in addiction-like reward dysfunction and compulsive eating in obese rats. Nat Neurosci. May 2010;13(5):635-41. doi:10.1038/nn.2519 51. Sun X, Kroemer NB, Veldhuizen MG, et al. Basolateral amygdala response to food cues in the absence of hunger is associated with weight gain susceptibility. J Neurosci. May 20 2015;35(20):7964-76. doi:10.1523/JNEUROSCI.3884-14.2015 52. Goldstone AP, Miras AD, Scholtz S, et al. Link between increased satiety gut hormones and reduced food reward following gastric bypass surgery for obesity. J Clin Endocrinol Metab. Nov 18 2015:jc20152665. doi:10.1210/jc.2015-2665 53. Jastreboff AM, Sinha R, Arora J, et al. Altered brain response to drinking glucose and fructose in obese adolescents. Diabetes. Jul 2016;65(7):1929-39. doi:10.2337/db15-1216 54. Cornier MA, McFadden KL, Thomas EA, Bechtell JL, Bessesen DH, Tregellas JR. Propensity to obesity impacts the neuronal response to energy imbalance. Front Behav Neurosci. 2015;9:52. doi:10.3389/fnbeh.2015.00052 55. Geha P, Cecchi G, Constable RT, Abdallah C, Small DM. Reorganization of brain connectivity in obesity. Hum Brain Mapp. Nov 16 2016;doi:10.1002/hbm.23462 56. Hinkle W, Cordell M, Leibel R, Rosenbaum M, Hirsch J. Effects of reduced weight maintenance and leptin repletion on functional connectivity of the hypothalamus in obese humans. PLoS One. 2013;8(3):e59114. doi:10.1371/journal.pone.0059114 57. Thaler JP, Yi CX, Schur EA, et al. Obesity is associated with hypothalamic injury in rodents and humans. J Clin Invest. Jan 2012;122(1):153-62. doi:10.1172/JCI59660 58. Geha PY, Aschenbrenner K, Felsted J, O'Malley SS, Small DM. Altered hypothalamic response to food in smokers. Am J Clin Nutr. Jan 2013;97(1):15-22. doi:10.3945/ajcn.112.043307 59. Kroemer NB, Wuttig F, Bidlingmaier M, Zimmermann US, Smolka MN. Nicotine enhances modulation of food-cue reactivity by leptin and ghrelin in the ventromedial prefrontal cortex. Addict Biol. Jul 2015;20(4):832-44. doi:10.1111/adb.12167 60. Kroemer NB, Guevara A, Vollstadt-Klein S, Smolka MN. Nicotine alters food-cue reactivity via networks extending from the hypothalamus. Neuropsychopharmacology. Oct 2013;38(11):2307-14. doi:10.1038/npp.2013.133 61. Mineur YS, Abizaid A, Rao Y, et al. Nicotine decreases food intake through activation of POMC neurons. Science. Jun 10 2011;332(6035):1330-2. doi:10.1126/science.1201889 62. Hamilton JP, Farmer M, Fogelman P, Gotlib IH. Depressive Rumination, the Default-Mode Network, and the Dark Matter of Clinical Neuroscience. Biol Psychiatry. Aug 15 2015;78(4):224-30. doi:10.1016/j.biopsych.2015.02.020 63. Roy M, Shohamy D, Wager TD. Ventromedial prefrontal-subcortical systems and the generation of affective meaning. Trends Cogn Sci. Mar 2012;16(3):147-56. doi:10.1016/j.tics.2012.01.005 64. Ferenczi EA, Zalocusky KA, Liston C, et al. Prefrontal cortical regulation of brainwide circuit dynamics and reward-related behavior. Science. Jan 1 2016;351(6268)doi:10.1126/science.aac9698 65. Walter M, Henning A, Grimm S, et al. The relationship between aberrant neuronal activation in the pregenual anterior cingulate, altered glutamatergic metabolism, and anhedonia in major depression. Arch Gen Psychiatry. May 2009;66(5):478-486. 66. Holtzheimer PE, Husain MM, Lisanby SH, et al. Subcallosal cingulate deep brain stimulation for treatment-resistant depression: a multisite, randomised, sham-controlled trial. Lancet Psychiatry. Nov 2017;4(11):839-849. doi:10.1016/S2215-0366(17)30371-1
MDD & appetite Kroemer et al. 22
67. Hamani C, Mayberg H, Stone S, Laxton A, Haber S, Lozano AM. The subcallosal cingulate gyrus in the context of major depression. Biol Psychiatry. Feb 15 2011;69(4):301-8. doi:10.1016/j.biopsych.2010.09.034 68. Hultman R, Ulrich K, Sachs BD, et al. Brain-wide Electrical Spatiotemporal Dynamics Encode Depression Vulnerability. Cell. Mar 22 2018;173(1):166-180 e14. doi:10.1016/j.cell.2018.02.012 69. Bagot RC, Parise EM, Pena CJ, et al. Ventral hippocampal afferents to the nucleus accumbens regulate susceptibility to depression. Nat Commun. 2015;6:7062. doi:10.1038/ncomms8062 70. Rolls ET, Cheng W, Gilson M, et al. Effective Connectivity in Depression. Biol Psychiatry Cogn Neurosci Neuroimaging. Feb 2018;3(2):187-197. doi:10.1016/j.bpsc.2017.10.004 71. Veldhuizen MG, Douglas D, Aschenbrenner K, Gitelman DR, Small DM. The anterior insular cortex represents breaches of taste identity expectation. J Neurosci. Oct 12 2011;31(41):14735-44. doi:10.1523/JNEUROSCI.1502-11.2011 72. de Araujo IE, Schatzker M, Small DM. Rethinking Food Reward. Annu Rev Psychol. Sep 27 2019;doi:10.1146/annurev-psych-122216-011643 73. Feldman Barrett L, Simmons WK. Interoceptive predictions in the brain. Nat Rev Neurosci. Jul 2015;16(7):419-29. doi:10.1038/nrn3950 74. Kühnel A, Czisch M, Sämann PGBwg, Binder EB, Kroemer NB. Spatio-temporal dynamics of stress-induced network reconfigurations reflect negative affectivity. Biological Psychiatry. 2022;doi:10.1016/j.biopsych.2022.01.008 75. Winter NR, Leenings R, Ernsting J, et al. More Alike than Different: Quantifying Deviations of Brain Structure and Function in Major Depressive Disorder across Neuroimaging Modalities. arXiv. 2021;doi:arXiv:2112.10730
MDD & appetite Kroemer et al. 23
Tables
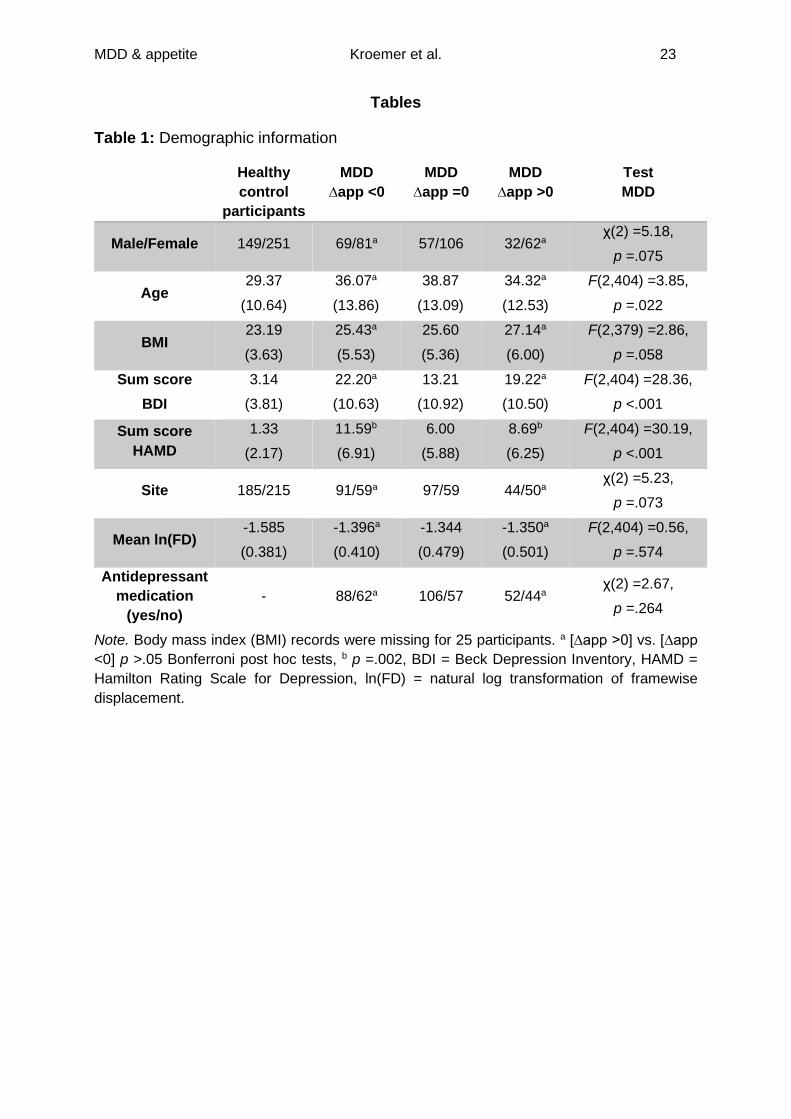
Table 1: Demographic information
Healthy
control
participants
MDD
∆app <0
MDD
∆app =0
MDD
∆app >0
Test
MDD
Male/Female 149/251 69/81a 57/106 32/62a χ(2) =5.18,
p =.075
Age 29.37
(10.64)
36.07a
(13.86)
38.87
(13.09)
34.32a
(12.53)
F(2,404) =3.85,
p =.022
BMI 23.19
(3.63)
25.43a
(5.53)
25.60
(5.36)
27.14a
(6.00)
F(2,379) =2.86,
p =.058
Sum score
BDI
3.14
(3.81)
22.20a
(10.63)
13.21
(10.92)
19.22a
(10.50)
F(2,404) =28.36,
p <.001
Sum score
HAMD
1.33
(2.17)
11.59b
(6.91)
6.00
(5.88)
8.69b
(6.25)
F(2,404) =30.19,
p <.001
Site 185/215 91/59a 97/59 44/50a χ(2) =5.23,
p =.073
Mean ln(FD) -1.585
(0.381)
-1.396a
(0.410)
-1.344
(0.479)
-1.350a
(0.501)
F(2,404) =0.56,
p =.574
Antidepressant
medication
(yes/no)
- 88/62a 106/57 52/44a χ(2) =2.67,
p =.264
Note. Body mass index (BMI) records were missing for 25 participants. a [∆app >0] vs. [∆app
<0] p >.05 Bonferroni post hoc tests, b p =.002, BDI = Beck Depression Inventory, HAMD =
Hamilton Rating Scale for Depression, ln(FD) = natural log transformation of framewise
displacement.
MDD & appetite Kroemer et al. 24
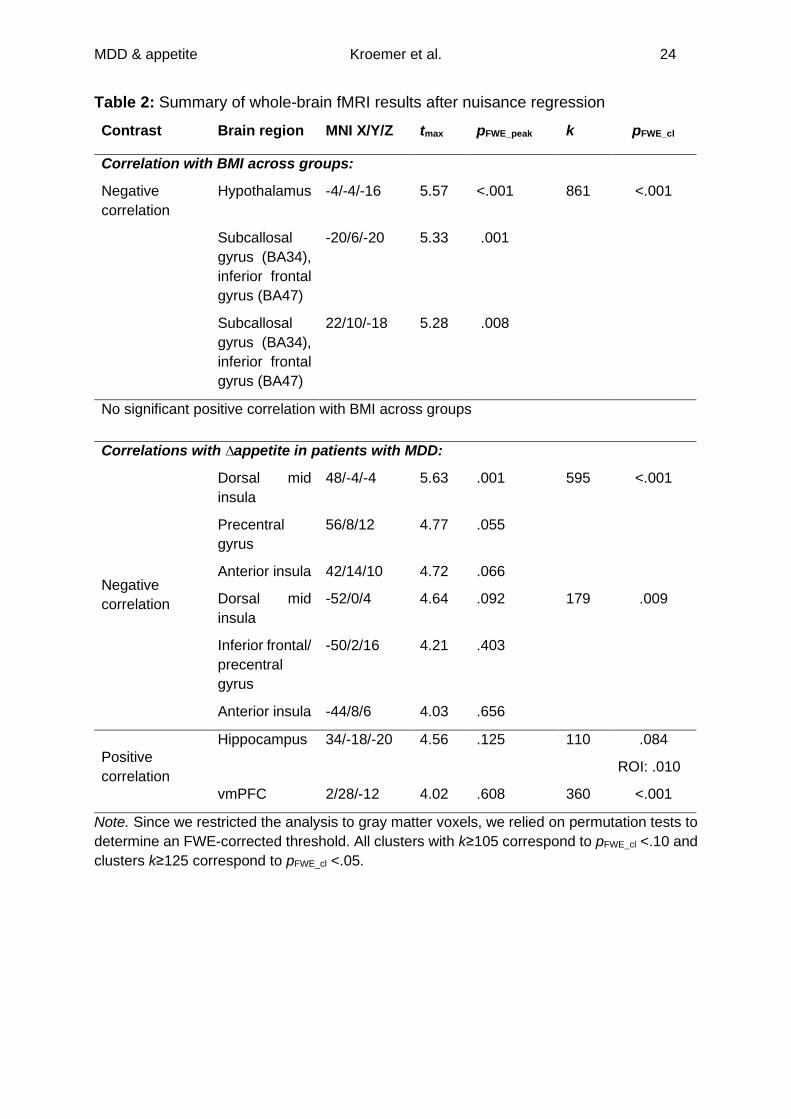
Table 2: Summary of whole-brain fMRI results after nuisance regression
Contrast Brain region MNI X/Y/Z tmax pFWE_peak k pFWE_cl
Correlation with BMI across groups:
Negative
correlation
Hypothalamus -4/-4/-16 5.57 <.001 861 <.001
Subcallosal
gyrus (BA34),
inferior frontal
gyrus (BA47)
-20/6/-20 5.33 .001
Subcallosal
gyrus (BA34),
inferior frontal
gyrus (BA47)
22/10/-18 5.28 .008
No significant positive correlation with BMI across groups
Correlations with ∆appetite in patients with MDD:
Negative
correlation
Dorsal mid
insula
48/-4/-4 5.63 .001 595 <.001
Precentral
gyrus
56/8/12 4.77 .055
Anterior insula 42/14/10 4.72 .066
Dorsal mid
insula
-52/0/4 4.64 .092 179 .009
Inferior frontal/
precentral
gyrus
-50/2/16 4.21 .403
Anterior insula -44/8/6 4.03 .656
Positive
correlation
Hippocampus 34/-18/-20 4.56 .125 110 .084
ROI: .010
vmPFC 2/28/-12 4.02 .608 360 <.001
Note. Since we restricted the analysis to gray matter voxels, we relied on permutation tests to
determine an FWE-corrected threshold. All clusters with k≥105 correspond to pFWE_cl <.10 and
clusters k≥125 correspond to pFWE_cl <.05.
Related Documents