Molecules 2022, 27, 1452. https://doi.org/10.3390/molecules27041452 www.mdpi.com/journal/molecules Article Functional Analysis of Autoantibody Signatures in Rheumatoid Arthritis Lisa Milchram 1 , Anita Fischer 2 , Jasmin Huber 1 , Regina Soldo 1 , Daniela Sieghart 2 , Klemens Vierlinger 1 , Stephan Blüml 2 , Günter Steiner 2,3 and Andreas Weinhäusel 1, * 1 Center for Health and Bioresources, Molecular Diagnostics, AIT Austrian Institute of Technology GmbH, Giefinggasse 4, 1210 Vienna, Austria; [email protected] (L.M.); [email protected] (J.H.); [email protected] (R.S.); [email protected] (K.V.) 2 Department of Internal Medicine III, Division of Rheumatology, Medical University of Vienna, Währinger Gürtel 18-20, 1090 Vienna, Austria; [email protected] (A.F.); [email protected] (D.S.); [email protected] (S.B.); [email protected] (G.S.) 3 Ludwig Boltzmann Institute for Arthritis and Rehabilitation, Medical University of Vienna, Währinger Gürtel 18-20, 1090 Vienna, Austria * Correspondence: [email protected] Abstract: For the identification of antigenic protein biomarkers for rheumatoid arthritis (RA), we conducted IgG profiling on high density protein microarrays. Plasma IgG of 96 human samples (healthy controls, osteoarthritis, seropositive and seronegative RA, n = 24 each) and time-series plasma of a pristane-induced arthritis (PIA) rat model (n = 24 total) were probed on AIT’s 16k pro- tein microarray. To investigate the analogy of underlying disease pathways, differential reactivity analysis was conducted. A total of n = 602 differentially reactive antigens (DIRAGs) at a significance cutoff of p < 0.05 were identified between seropositive and seronegative RA for the human samples. Correlation with the clinical disease activity index revealed an inverse correlation of antibodies against self-proteins found in pathways relevant for antigen presentation and immune regulation. The PIA model showed n = 1291 significant DIRAGs within acute disease. Significant DIRAGs for (I) seropositive, (II) seronegative and (III) PIA were subjected to the Reactome pathway browser which also revealed pathways relevant for antigen presentation and immune regulation; of these, seven overlapping pathways had high significance. We therefore conclude that the PIA model re- flects the biological similarities of the disease pathogenesis. Our data show that protein array anal- ysis can elucidate biological differences and pathways relevant in disease as well be a useful addi- tional layer of omics information. Keywords: rheumatoid arthritis; autoantibodies; seroreactivity; disease activity; rat model; pathway analysis 1. Introduction Rheumatoid arthritis (RA) is a systemic autoimmune disease characterized by the presence of auto-reactive B- and T-cells, autoantibodies and increased cytokine release which all together lead to chronic joint inflammation. In untreated RA, fibroblasts and osteoclasts are activated triggering cartilage degradation and bone destruction [1]. The diagnosis relies on a combination of clinical serological and radiographic assessments ac- companied by the EULAR classification criteria. The serological diagnosis is based on the presence of rheumatoid factor (RF) and anti-citrullinated protein/peptide antibodies (AC- PAs) [2]. ACPAs and RF enable the differentiation of two serological groups of RA (sero- positive and seronegative) and were shown to be of prognostic value for disease progres- sion [3,4]. However, the pathological role of auto-antibodies is hardly understood, alt- hough extensive research is ongoing [5]. In the search for improved and novel Citation: Milchram, L.; Fischer, A.; Huber, J.; Soldo, R.; Sieghart, D.; Vierlinger, K.; Blüml, S.; Steiner, G.; Weinhäusel, A. Functional Analysis of Autoantibody Signatures in Rheumatoid Arthritis. Molecules 2022, 27, 1452. https://doi.org/ 10.3390/molecules27041452 Academic Editors: Manuel Fuentes and Angela-Patricia Hernández Received: 31 December 2021 Accepted: 18 February 2022 Published: 21 February 2022 Publisher’s Note: MDPI stays neu- tral with regard to jurisdictional claims in published maps and institu- tional affiliations. Copyright: © 2022 by the authors. Li- censee MDPI, Basel, Switzerland. This article is an open access article distributed under the terms and con- ditions of the Creative Commons At- tribution (CC BY) license (https://cre- ativecommons.org/licenses/by/4.0/).

Welcome message from author
This document is posted to help you gain knowledge. Please leave a comment to let me know what you think about it! Share it to your friends and learn new things together.
Transcript

Molecules 2022, 27, 1452. https://doi.org/10.3390/molecules27041452 www.mdpi.com/journal/molecules
Article
Functional Analysis of Autoantibody Signatures in
Rheumatoid Arthritis
Lisa Milchram 1, Anita Fischer 2, Jasmin Huber 1, Regina Soldo 1, Daniela Sieghart 2, Klemens Vierlinger 1,
Stephan Blüml 2, Günter Steiner 2,3 and Andreas Weinhäusel 1,*
1 Center for Health and Bioresources, Molecular Diagnostics, AIT Austrian Institute of Technology GmbH,
Giefinggasse 4, 1210 Vienna, Austria; [email protected] (L.M.); [email protected] (J.H.);
[email protected] (R.S.); [email protected] (K.V.) 2 Department of Internal Medicine III, Division of Rheumatology, Medical University of Vienna,
Währinger Gürtel 18-20, 1090 Vienna, Austria; [email protected] (A.F.);
[email protected] (D.S.); [email protected] (S.B.);
[email protected] (G.S.) 3 Ludwig Boltzmann Institute for Arthritis and Rehabilitation, Medical University of Vienna,
Währinger Gürtel 18-20, 1090 Vienna, Austria
* Correspondence: [email protected]
Abstract: For the identification of antigenic protein biomarkers for rheumatoid arthritis (RA), we
conducted IgG profiling on high density protein microarrays. Plasma IgG of 96 human samples
(healthy controls, osteoarthritis, seropositive and seronegative RA, n = 24 each) and time-series
plasma of a pristane-induced arthritis (PIA) rat model (n = 24 total) were probed on AIT’s 16k pro-
tein microarray. To investigate the analogy of underlying disease pathways, differential reactivity
analysis was conducted. A total of n = 602 differentially reactive antigens (DIRAGs) at a significance
cutoff of p < 0.05 were identified between seropositive and seronegative RA for the human samples.
Correlation with the clinical disease activity index revealed an inverse correlation of antibodies
against self-proteins found in pathways relevant for antigen presentation and immune regulation.
The PIA model showed n = 1291 significant DIRAGs within acute disease. Significant DIRAGs for
(I) seropositive, (II) seronegative and (III) PIA were subjected to the Reactome pathway browser
which also revealed pathways relevant for antigen presentation and immune regulation; of these,
seven overlapping pathways had high significance. We therefore conclude that the PIA model re-
flects the biological similarities of the disease pathogenesis. Our data show that protein array anal-
ysis can elucidate biological differences and pathways relevant in disease as well be a useful addi-
tional layer of omics information.
Keywords: rheumatoid arthritis; autoantibodies; seroreactivity; disease activity; rat model;
pathway analysis
1. Introduction
Rheumatoid arthritis (RA) is a systemic autoimmune disease characterized by the
presence of auto-reactive B- and T-cells, autoantibodies and increased cytokine release
which all together lead to chronic joint inflammation. In untreated RA, fibroblasts and
osteoclasts are activated triggering cartilage degradation and bone destruction [1]. The
diagnosis relies on a combination of clinical serological and radiographic assessments ac-
companied by the EULAR classification criteria. The serological diagnosis is based on the
presence of rheumatoid factor (RF) and anti-citrullinated protein/peptide antibodies (AC-
PAs) [2]. ACPAs and RF enable the differentiation of two serological groups of RA (sero-
positive and seronegative) and were shown to be of prognostic value for disease progres-
sion [3,4]. However, the pathological role of auto-antibodies is hardly understood, alt-
hough extensive research is ongoing [5]. In the search for improved and novel
Citation: Milchram, L.; Fischer, A.;
Huber, J.; Soldo, R.; Sieghart, D.;
Vierlinger, K.; Blüml, S.; Steiner, G.;
Weinhäusel, A. Functional Analysis
of Autoantibody Signatures
in Rheumatoid Arthritis. Molecules
2022, 27, 1452. https://doi.org/
10.3390/molecules27041452
Academic Editors: Manuel Fuentes
and Angela-Patricia Hernández
Received: 31 December 2021
Accepted: 18 February 2022
Published: 21 February 2022
Publisher’s Note: MDPI stays neu-
tral with regard to jurisdictional
claims in published maps and institu-
tional affiliations.
Copyright: © 2022 by the authors. Li-
censee MDPI, Basel, Switzerland.
This article is an open access article
distributed under the terms and con-
ditions of the Creative Commons At-
tribution (CC BY) license (https://cre-
ativecommons.org/licenses/by/4.0/).

Molecules 2022, 27, 1452 2 of 18
therapeutics for RA, animal models play a major role in research and development. In a
recent review, Meehan et al. described the currently available collection of preclinical
models [6]. Besides the known advantages and limitations of these models, currently no
comparative analysis of auto-antibody signatures for RA and its respective animal models
can be found within the literature. Among these models pristane-induced arthritis (PIA)
is of particular interest, because arthritogenic autoimmunity is induced in rats by the ap-
plication of the non-immunogenic mineral oil pristane (2,6,10,14-Tetramethylpentade-
cane). PIA shows many features which are similar to human RA, such as chronic synovitis,
cartilage degradation, bone erosions and the presence of RF [7]. Therefore, we conducted
IgG profiling of human and rodent plasma on high density protein microarrays and sub-
jected higher reactive differentially reactive antigens (DIRAGs) to pathway analysis aim-
ing to elucidate the underlying processes (Figure 1).
Figure 1. Study design. (A) sample cohort: 96 samples from RF- and CCP-positive (sero+), RF- and
CCP- negative (sero-) RA, osteoarthritis and healthy human individuals and 24 samples from time-
course pristane induced arthritis (PIA) and control animals were investigated. (B) IgG isolated from
plasma was probed on AIT’s 16k microarray. (C) Data obtained from microarray scans was sub-
jected to differential reactivity analysis (DRA) and correlation analysis with clinical disease activity
index (CDAI) using BRB ArrayTools and RStudio elucidating differentially reactive antigens
(DIRAGs) which were subsequently (D) in silico analyzed for dysregulated pathways.
2. Results
To elucidate and investigate auto-antibody signatures of RF- and CCP-positive and -
negative rheumatoid arthritis and the PIA rodent model described by Tuncel et al., IgG
probing was conducted on high density protein microarrays. IgG was isolated from treat-
ment naive plasma of human individuals and rat sera and probed on AIT’s 16k protein
microarray (comprising n = 7390 proteins recombinantly expressed in 15,417 cDNA E.coli
clones). Data extracted from microarray images were analysed for differentially reactive
antigens (DIRAGs) between seropositive and seronegative RA and samples of the PIA rat
model upon the disease onset period. In addition, antibody reactivities in the human RA
samples were correlated with the clinical disease activity index (CDAI). Lists comprising
DIRAGs were further investigated in silico with the Reactome pathway browser and the
WebGestalt analysis toolkit to investigate the underlying disease pathways (methodolog-
ical details are given in the Methods section 4). DIRAGs of suspected biological relevance

Molecules 2022, 27, 1452 3 of 18
(included in the top pathways) were evaluated for previously described roles as auto-
antibodies or involvement in auto-immune diseases.
2.1. Antibody Isolation
The concentration of isolated IgG was determined via duplicate A280 measurements
and averaged. Human IgG concentration ranged from 0.809–2.918 mg/mL (mean: 1.403 ±
0.362 mg/mL (plasma concentration: 10.240 ± 2.641 mg/mL)). Student’s t-test (p < 0.05)
showed no significant differences between the concentrations of the groups. Mean rat IgG
concentration ranged from 0.423–0.727 mg/mL (mean: 0.529 ± 0.063 mg/mL [plasma con-
centration: 3.861 ± 0.447 mg/mL]), without significant differences between the control and
PIA group (Student’s t-test, p < 0.05). IgG integrity was determined via observed molecu-
lar weight determined within SDS-PAGE, a sharp band at 150 kDa was probative for
structural protein integrity. An SDS-Page image of the purified IgG from human samples
is given in Supplementary Materials Figure S1.
2.2. Differential Reactivity Analysis
Class comparison analysis (p < 0.05) was applied to the human IgG profiles for the
groups seropositive versus seronegative RA to elucidate differentially reactive antigens
(DIRAGs). Out of n = 15,032 features passing the filtering criteria, n = 382 proteins were
found to be significantly differentially reactive (p < 0.05) with a fold-change of > 1.25 (Fig-
ure 2). Class comparison analysis was repeated with respect to the observed clusters with
the assigned cluster as a blocking variable. Blocked analysis revealed n = 602 significant
differential reactive features, n = 206 higher reactive DIRAGs in seropositive RA versus
seronegative RA with unambiguous gene symbols used in pathway analysis. In seroneg-
ative RA, n = 221 higher reactive DIRAGs were used for Reactome analysis.
Figure 2. Volcano plot of seropositive versus seronegative RA. The unblocked class comparison
elucidated n = 382 significant (p < 0.05) DIRAGs with a fold-change > 1.25 (−0.3219 and 0.3219 on the
log2 scale, indicated as dashed line in the plot above). DIRAGs above the significance thresholds are
indicated in blue (BRB ArrayTools [8] output per default). The sign of the fold-change is assigned

Molecules 2022, 27, 1452 4 of 18
in alphabetical order; hence, proteins higher reactive in seropositive RA are located on the left side
of the plot.
Class comparison (p < 0.05) applied to the rat samples between 7 and 24 days after
arthritis induction with pristane revealed n = 1766 (PIA) and n = 1352 (controls) significant
DIRAGs with a fold-change > 1.35 (p < 0.05). After correction for significant DIRAGs
higher reactive in the control animals, class comparison (p < 0.05) for PIA revealed n = 1291
significant DIRAGs with a fold-change > 1.35. n = 988 DIRAGs remained after gene symbol
cleansing and were subjected to pathway analysis. The intersection of all protein lists con-
taining the respective higher reactive DIRAGs revealed 8 proteins (EEF1A1, HBP1,
TXNDC5, TPM3, c8orf33, ILF3, MGEA5, LTBP3, HLA-C and UBA1) higher reactive in
seropositive RA, seronegative RA and PIA (Figure 3A, not corrected for duplicated pro-
teins). Signal intensities of the top 10 proteins of each comparison are given as boxplots in
Supplementary Materials Figure S2.
Figure 3. Intersection of significant higher reactive DIRAGs as Venn Diagram (A) and their respec-
tive p-values and the average fold-change as a forest plot (B). Results of the blocked analysis of the
comparison seropositive versus seronegative RA was used, and PIA 7 vs. 24 days after correction
for DIRAGs higher reactive in PBS animals. VennDiagram created with JVenn [9].
2.3. Reactome Pathway Analysis
At the time of analysis, Reactome version 66 (human), version 69 (rat) and version 77
(reference) were used. 206 significant DIRAGs derived from the human class comparison
remained higher reactive in seropositive RA after gene symbol cleansing for unambigu-
ous IDs, 101 of them were found in Reactome (560 pathways were hit by them).
Reactome analysis elucidated 25 pathways with an FDR ≤ 0.1—these pathways are
listed in Supplementary Materials Table S1. All of the top 25 pathways showed high sig-
nificance for their respective entities p-value (0.004–10−10), the top 16 pathways preserved
false discovery rates (FDRs) < 0.05 after Benjamini-Hochberg (BH) correction. Comparison
of the pathway’s respective rank within the reference analysis indicates the pathways En-
dosomal/Vacuolar pathway and Antigen Presentation: Folding, assembly and peptide
loading of class I MHC as overrepresented (entities p-values 7.16 × 10⁻¹¹ and 0.004, FDR:
0.981). HLA-C was the associated gene for these two pathways which was also involved
in eight additional enriched pathways. The synopsis of the genes/proteins with a bearing
role within the pathway analysis is given in Table 1.
For seronegative RA, 147 higher reactive DIRAGs versus seropositive RA out of the
221 cleaned IDs were found in Reactome which hit 812 pathways. Fourteen (14) of them
showed high significance from 10−4–10−16 (overall range 0.014–1.11 × 10⁻¹⁶) and preserved
significance (p < 0.05) after BH-correction. Without respect to the overrepresentation

Molecules 2022, 27, 1452 5 of 18
analysis, 10 identical pathways were elucidated in the top 25 for both disease serotypes
(Supplementary Materials Tables S1 and S2).
For the PIA model 673 out of 988 cleansed DIRAGs with unambigious genesymbols
were found in Reactome with 1397 hit pathways, the top 25 are given in Supplementary
Materials Table S3. All of them showed high significance levels after multiple testing cor-
rection (2.08 × 10⁻¹²–0.002). The intersection of the top 25 pathways for seropositive RA,
seronegative RA and PIA pathway analysis revealed 8 common pathways: the endoso-
mal/vacuolar pathway, the antigen presentation: folding, assembly and peptide loading
of class I MHC, interferon alpha/beta signaling, the ER-Phagosome pathway, the inter-
feron pathway, antigen processing–cross presentation, interferon gamma signaling and
cytokine signaling in the immune system with preserved significance after BH-correction
(Supplementary Materials Tables S1–S3). This suggests similarities of the auto-antibody
signatures of RA and PIA and hence the disease reflection in this animal model which
shows many clinical features of RA.
Found gene symbols of the top 25 pathways for each comparison were intersected
for overlapping features (Figure 4). This intersection of the gene lists showed HLA-C as
single common higher reactive DIRAG for the seropositive, seronegative RA and the PIA
model. The candidate role of HLA-C as important player in rheumatic diseases was re-
cently reviewed by Siegel et al. Besides HLA-C, GBP6, EIF4G2 and HNRPDL were iden-
tified between seropositive RA and PIA. Between seronegative RA and PIA, 11 overlaps
were identified: HLA-A, FLNA, CCND1, FN1, APEH, VCL, NUP62, LCP1, PSMC4,
DDOST and EEF1A1. Previously described disease involvement of genes is given in Table
1.
Figure 4. Graphic representation (Venn diagram) of the involved genes of the top 25 pathways for
the comparisons: seropositive RA vs. seronegative RA (seropos, red), seronegative RA vs. seroposi-
tive RA (blue) and 7- vs. 24-day PIA corrected for controls (PIA, green). Venn diagram created with
JVenn [9].
Based on the comparison of elucidated DIRAGs with “biological relevance” (in-
volved in pathway analysis), CCND1 and PSMC4 arose as potential novel autoantibod-
ies/autoantigens since they are herein described for the first time. Other DIRAGs such as
MSN and NUP62 were extensively described as autoantigens in systemic auto-immune
diseases.

Molecules 2022, 27, 1452 6 of 18
Table 1. Relevance—with respect to the previously described involvements of genes or proteins, of
higher reactive DIRAGs overlapping within the identified top 25 pathways of the class—compari-
sons: seropositive RA vs. seronegative RA (both directions, compare Supplementary Materials Ta-
bles S1–S3) and PIA vs. control animals.
GeneSymbol SwissProt ID Overlap Described as… Reference
HLA-C P10321
seropos RA,
seroneg RA,
PIA
genetic involvement Siegel 2019 [10]
higher expressed in RA synovium Xiao 2016 [11]
auto-antibodies present (citrullinated) Lo 2020 [12]
GBP6 Q6ZN66 seropos RA,
PIA higher expression in RA? Roche mRNA patent
EIF4G2 P78344 seropos RA,
PIA
involvement in OA (miRNA-197) Gao 2020 [13]
citrullinated antigen Okazaki 2009 [14]
auto antigen Sjörgens Uchadi 2005 [15]
higher expressed in RA synovium Xiao 2016 [11]
MSN P26038 seropos RA,
PIA
potential RA autoantigen Wagatsuma 1996 [16]
potential psoriasis autoantigen Maejima 2014 [17]
autoantigen in Behcets Hussain 2020 [18]
autoantigen in acquired aplastic anemia Takamatsu 2006 [19]
autoantigen in MPO-ANCA associated
vasculitis Suzuki 2014 [20]
autoantigen in Sjörgens Zhang 2018 [21]
autoantigen in anti-phospholipid
syndrome Lin 2015 [22]
HNRPDL O14979 seropos RA,
PIA autoantigen in RA (citrullinated) Marklein 2021 [23]
HLA-A P04439 seroneg RA,
PIA
genetic involvement Raychaudhuri 2012
[24]
auto-antibodies present (citrullinated) Lo 2020 [12]
FLNA P21333 seroneg RA,
PIA
auto-antibodies present; involved in
microbial immunity Pianta 2017 [25]
auto-antibodies present (citrullinated) Lo 2020 [12]
synovium Biswas et al. 2013 [26]
CCND1 P24385 seroneg RA,
PIA n.a. n.a.
FN1 P02751 seroneg RA,
PIA
elevated levels in synovium Scott 1981 [27]
autoantigen in RA (citrullinated) Beers 2012 [28]
APEH P13798 seroneg RA,
PIA auto-antibodies present (citrullinated) Lo 2020 [12]
VCL P18206 seroneg RA,
PIA auto antigen in RA (citrullinated) Heemst 2015 [29]
NUP62 P37198 seroneg RA,
PIA
higher expressed in Psoriasis arthritis
PBMCs Batliwalla 2005 [30]
autoantibodies in myositis Senecal 2014 [31]
autoantibodies in SLE Meulen 2017 [32]
autoantibodies in Vasculitis/Sjörgens
combination (single case report) Fuchs 2020 [33]
autoantibodies in primary biliary cirrhosis
(PBS) Bogdanos 2011 [34]
autoantibodies in Psoriasis Arthritis Yuan 2019 [35]
LCP1 P13796 seroneg RA,
PIA mRNA classifier Liu 2021 [36]

Molecules 2022, 27, 1452 7 of 18
PSMC4 P43686 seroneg RA,
PIA n.a. n.a.
DDOST P39656 seroneg RA,
PIA higher expression in Type2 Diabetes Gupta 2019 [37]
EEF1A1 P68104 seroneg RA,
PIA
auto-antibodies present in Type1 Diabetes Koo 2014 [38]
used as reference gene for synovial
fibroblasts Schröder 2019 [39]
Auto-antibodies present in Felty’s
syndrome Ditzel 2000 [40]
All of the overlapping pathways between human RA and PIA are linked to intra-
cellular protein degrading and signaling processes, and hence, antigen processing and
presentation processes. Seropositive versus seronegative RA showed significant path-
ways for the intra-cellular skeleton and transport system (seropositive RA). In seronega-
tive RA, pathways for the adaptive immune response and transcriptional regulation were
found significant. Besides antigen processing and presentation pathways, the PIA model
showed significant pathways for transcription, translation, RNA metabolism and pro-
cessing.
2.4. WebGestalt Pathway Analysis
WebGestalt analysis was appended for GeneOntology (GO) annotation of elucidated
DIRAGs based on their respective gene symbols. For seropositive RA from n = 206 higher
reactive DIRAGs with cleansed gene symbols, 130 could be annotated for functional cate-
gories. For seronegative RA from n = 261, higher reactive DIRAGs with cleansed gene
symbols, 156 were mapped to functional categories. From the PIA list, n = 605 could be
annotated for functional categories. From the 16k annotations (reference list), n = 3246 IDs
were mapped to functional categories. The GOSlim summaries for the biological pro-
cesses, cellular components and molecular functions categories are given in Figure 5. Re-
sults for the top 10 pathways with the respective identified gene symbols are compiled in
Tables 2–4. GeneSymbol lists containing the gene symbols of suspected biological rele-
vance (included in the top 10 gene sets) were intersected (Supplementary Materials),
whereby EEF1A1 arose as single hit between all subjected gene sets. The GOSlim sum-
maries of the annotated gene symbols show similar rankings for the associated categories,
with a slightly different order for seronegative RA (biological regulation followed by met-
abolic processes, vice versa in seropositive RA).

Molecules 2022, 27, 1452 8 of 18
Figure 5. GOslim summaries for DIRAGs identified as higher reactive in (A) seropositive RA versus
seronegative RA, (B) seronegative RA vs. seropositive RA and (C) PIA animals 7 and 24 days after
disease induction corrected for signatures of control animals.
2.5. Correlation with Clinical Disease Activity Index (CDAI)
Clinical disease activity scores (CDAI) were available for 46 of the total 48 RA sam-
ples (n = 22 seropositive and n = 24 seronegative RA samples). Estimation statistics did not
show any significant difference in CDAI when comparing seropositive versus seronega-
tive RA (Figure 6).

Molecules 2022, 27, 1452 9 of 18
Figure 6. The median difference between seronegative RA and seropositive RA is shown in the
above Gardner–Altman estimation plot. Both groups are plotted on the left axes; the mean difference
is plotted on a floating axis on the right as a bootstrap sampling distribution. The mean difference
is depicted as a dot; the 95% confidence interval is indicated by the ends of the vertical error bar.
The unpaired median difference between seronegative RA and seropositive RA is 0.2 [95.0%CI
−6.45, 4.25]. The p value of the two-sided permutation t-test is 0.9 (calculation and plot generated by
https://www.estimationstats.com (accessed on 19 February 2022) according [41].
To investigate if the antibody reactivities of the 46 human RA samples (for which
CDAI was available) are correlated with the clinical disease activity, a quantitative trait
analysis of the human RA sample data was conducted with the clinical disease activity
index (CDAI) as quantitative trait (BRB ArrayTools). In total, 429 different antigenic pro-
teins showed a significant correlation of r = ±0.29–±0.49 (p < 0,05; Spearman’s rank corre-
lation) with disease activity. The n = 153 positively correlated antigens (r = 0.29–0.46) as
well as 276 negatively correlated antigens (r = −0.29–−0.49) where then subjected to the
Reactome pathway browser.
Pathways elucidated for the proteins positively correlated with CDAI showed RNA
Polymerase I Transcription Initiation, RUNX1 regulates expression of components of tight
junctions and Metabolism of RNA as the top three hits (p < 0,05; FDR 3.37 × 10⁻¹, the latter
not shown; details giving in Supplementary Materials Table S4A). Exemplarily, the in-
volvement of the DIRAGs within the Metabolism of RNA (super-)pathway is given in
Supplementary Materials Figure S3A.
Reactome analysis of the negatively correlated antigens displays a completely diver-
gent panel of pathways compared to the those of positively correlated antigens. The top
five of these pathways are: Antigen Presentation: Folding, assembly and peptide loading
of class I MHC, Endosomal/Vacuolar pathway, Class I MHC mediated antigen processing
& presentation, ER-Phagosome pathway and Interferon Signaling (p = 1,11 × 10⁻¹⁶; FDR =
1,57 × 10⁻¹⁴; Supplementary Materials Table S4B and Figure S3B exemplifying the Class I
MHC mediated antigen processing & presentation - pathway as extracted from Reactome
pathway browser). However, these pathways of the positively correlated antigens resem-
ble with those found enriched for the DIRAGS from the other contrasts e.g., “seropositive
versus seronegative RA”, “higher reactive in seronegative RA” and “higher reactive in
established PIA” (Supplementary Materials Tables S1–S3). As an example, the involve-
ment of the DIRAGs within the Antigen Presentation (super-)pathway is given in Supple-
mentary Materials Figure S4B.

Molecules 2022, 27, 1452 10 of 18
Table 2. Top 10 identified gene sets in the WebGestalt analysis for DIRAGs higher reactive in sero-
positive (A) and seronegative RA (B) and PIA animals (C) during the disease onset period (24 days
after pristane induction). The Reactome GeneSet and link to the Pathway browser, gene set descrip-
tion, the respective p-value and the GeneSymbols of significantly higher reactive DIRAGs are given.
(A) DIRAGs Higher Reactive in Seropositive RA (Seropositive vs. Seronegative RA)
GeneSet
(Reactome) Description p-Value Gene Symbol
R-HSA-936440 Negative regulators of DDX58/IFIH1 signaling 0.0039 UBA7, CYLD, ISG15, PCBP2
R-HSA-202403 TCR signaling 0.0039 VASP, LAT, PTPRC, PSME4, NFKB1, ITK,
PSMD13, PSMB10
R-HSA-6790901 rRNA modification in the nucleus and cytosol 0.0070 NOP2, TBL3, UTP14A, RRP9, IMP4
R-HSA-202433 Generation of second messenger molecules 0.0106 VASP, LAT, ITK
R-HSA-8953854 Metabolism of RNA 0.0114
NOP2, PHAX, EIF4A3, EIF4G1, TBL3, SF1,
RPL4, THOC3, UTP14A, EXOSC10,
TSEN54, PPP2R1A, DDX42, DCP1A,
PSME4, SF3B5, RRP9, PUS3, PSMD13,
SF3A1, PSMB10, IMP4, PCBP2
R-HSA-1660662 Glycosphingolipid metabolism 0.0134 ESYT1, ESYT2, SUMF2
R-HSA-168249 Innate Immune System 0.0143
EEF1A1, TXNDC5, SDCBP, PRKCSH,
LAT, STAT6, UBA7, CYLD, PTPRC,
PPP2R1A, IQGAP1, PSME4, CYB5R3,
NFKB1, ITK, CYFIP2, HLA-C, DPP7,
PSMD13, VAV2, ELMO2, PSMB10,
PDAP1, ISG15, PCBP2
R-HSA-352230 Amino acid transport across the plasma
membrane 0.0147 SLC7A5, SLC3A2
R-HSA-168928 DDX58/IFIH1-mediated induction of
interferon-alpha/beta 0.0148 UBA7, CYLD, NFKB1, ISG15, PCBP2
R-HSA-381183 ATF6 (ATF6-alpha) activates chaperone genes 0.0215 ATF4, NFYA
Table 3. Continued: Top 10 identified gene sets in the WebGestalt analysis for DIRAGs higher reac-
tive in seropositive (A) and seronegative RA (B) and PIA animals (C) during the disease onset period
(24 days after pristane induction). Reactome GeneSet and link to the Reactome pathway browser,
gene set description, the respective p-value and GeneSymbols of significantly higher reactive
DIRAGs are given.
(B) DIRAGs Higher Reactive in Seronegative RA (Seropositive vs. Seronegative RA)
GeneSet
(Reactome) Description p-Value Gene Symbol
R-HSA-74217 Purine salvage 0.0010 AMPD2, APRT, HPRT1
R-HSA-8956321 Nucleotide salvage 0.0051 AMPD2, APRT, HPRT1
R-HSA-6798695 Neutrophil degranulation 0.0058
APEH, IMPDH2, APRT, STK10, TXNDC5,
DDOST, HLA-C, CTSD, SPTAN1, C3,
EEF1A1, TCIRG1, VCL, DYNC1H1, PSMC3,
DSP, GUSB, CCT8
R-HSA-1474244 Extracellular matrix organization 0.0072
LTBP3, TGFB1, LAMC1, COL1A2, HSPG2,
CTSD, SERPINH1, ADAMTS4, ADAM19,
PLOD1, ITGA3, COMP
R-HSA-8941856 RUNX3 regulates NOTCH signaling 0.0074 JAG1, NOTCH1, KAT2A
R-HSA-8878159 Transcriptional regulation by RUNX3 0.0150 JAG1, PSMC5, TGFB1, NOTCH1, CCND1,
KAT2A, PSMC3

Molecules 2022, 27, 1452 11 of 18
R-HSA-5688426 Deubiquitination 0.0186
OTUB1, USP30, PSMC5, TADA2B, TGFB1,
ACTB, KAT2A, UIMC1, MBD6, PSMC3,
AXIN1, RAD23A
R-HSA-425393 Transport of inorganic cations/anions and
amino acids/oligopeptides 0.0218 SLC4A2, SLC1A5, SLC20A2
R-HSA-3000178 ECM proteoglycans 0.0243 TGFB1, LAMC1, COL1A2, HSPG2, COMP
R-HSA-5663202 Diseases of signal transduction 0.0253
JAG1, PSMC5, CUX1, TGFB1, NOTCH1,
ACTB, POLR2G, KAT2A, MTOR, HDAC6,
VCL, LCK, PSMC3, AXIN1
Table 4. Continued: Top 10 identified gene sets in the WebGestalt analysis for DIRAGs higher reac-
tive in seropositive (A) and seronegative RA (B) and PIA animals (C) during the disease onset period
(24 days after pristane induction). Reactome GeneSet and link to Reactome pathway browser, gene
set description, the respective p-value and GeneSymbols of significantly higher reactive DIRAGs are
given.
(C) DIRAGs Higher Reactive in PIA Animals (Corrected for DIRAGs Higher Reactive in PBS Animals, PIA vs.
Control Animals)
GeneSet
(Reactome) Description p-Value Gene Symbol
R-HSA-156827
L13a-mediated
translational silencing of
Ceruloplasmin expression
1.31 × 10⁻⁵
RPL7, RPL17, RPL27A, EIF4B, EIF4H, EIF4G1, EIF3A,
RPS10, RPL10A, RPL26, RPS25, RPL41, RPL4, RPL24, RPS19,
EIF4E, RPS18, EIF3H, RPL12, RPS4Y2, RPL22, RPL15, RPS5,
RPL27, EIF3M, EIF3G, EIF3B
R-HSA-72706
GTP hydrolysis and joining
of the 60S ribosomal
subunit
1.31 × 10⁻⁵
RPL7, RPL17, RPL27A, EIF4B, EIF4H, EIF4G1, EIF3A,
RPS10, RPL10A, RPL26, RPS25, RPL41, RPL4, RPL24, RPS19,
EIF4E, RPS18, EIF3H, RPL12, RPS4Y2, RPL22, RPL15, RPS5,
RPL27, EIF3M, EIF3G, EIF3B
R-HSA-72613 Eukaryotic Translation
Initiation 1.54 × 10⁻⁵
RPL7, RPL17, RPL27A, EIF4B, EIF2B4, EIF4H, EIF4G1,
EIF3A, RPS10, RPL10A, RPL26, RPS25, RPL41, RPL4, RPL24,
RPS19, EIF4E, RPS18, EIF3H, RPL12, RPS4Y2, RPL22, RPL15,
RPS5, RPL27, EIF3M, EIF3G, EIF3B
R-HSA-72737 Cap-dependent Translation
Initiation 1.54 × 10⁻⁵
RPL7, RPL17, RPL27A, EIF4B, EIF2B4, EIF4H, EIF4G1,
EIF3A, RPS10, RPL10A, RPL26, RPS25, RPL41, RPL4, RPL24,
RPS19, EIF4E, RPS18, EIF3H, RPL12, RPS4Y2, RPL22, RPL15,
RPS5, RPL27, EIF3M, EIF3G, EIF3B
R-HSA-72689 Formation of a pool of free
40S subunits 7.14 × 10⁻⁵
RPL7, RPL17, RPL27A, EIF3A, RPS10, RPL10A, RPL26,
RPS25, RPL41, RPL4, RPL24, RPS19, RPS18, EIF3H, RPL12,
RPS4Y2, RPL22, RPL15, RPS5, RPL27, EIF3M, EIF3G, EIF3B
R-HSA-156842 Eukaryotic Translation
Elongation 1.00 × 10⁻⁴
RPL7, RPL17, RPL27A, RPS10, EEF1D, RPL10A, RPL26,
RPS25, RPL41, RPL4, RPL24, RPS19, RPS18, RPL12, EEF1G,
EEF1A1, RPS4Y2, RPL22, RPL15, RPS5, RPL27
R-HSA-72766 Translation 2.21 × 10⁻⁴
PPA1, VARS, RPL7, MRPL54, RPL17, RPL27A, SARS, EIF4B,
EIF2B4, LARS, EIF4H, EIF4G1, AURKAIP1, YARS, EIF3A,
DDOST, APEH, RPS10, EEF1D, RPL10A, RPL26, FARSA,
HARS, RPS25, RPL41, RPL4, RPL24, PARS2, RPS19, EIF4E,
AARS2, RPS18, EIF3H, RPL12, MRPS6, EEF1G, OXA1L,
EEF1A1, RPS4Y2, RPL22, RPL15, RPS5, RPL27, EIF3M,
EIF3G, EIF3B
R-HSA-72702 Ribosomal scanning and
start codon recognition 2.33 × 10⁻⁴
EIF4B, EIF4H, EIF4G1, EIF3A, RPS10, RPS25, RPS19, EIF4E,
RPS18, EIF3H, RPS4Y2, RPS5, EIF3M, EIF3G, EIF3B
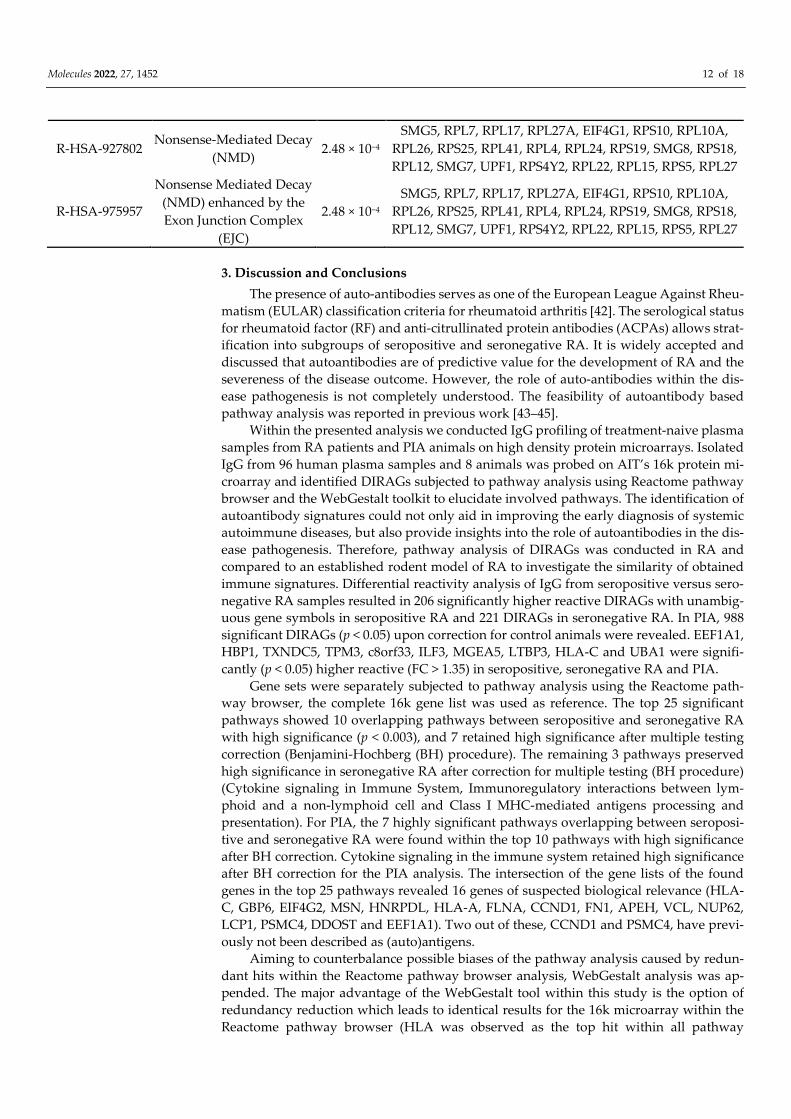
Molecules 2022, 27, 1452 12 of 18
R-HSA-927802 Nonsense-Mediated Decay
(NMD) 2.48 × 10⁻⁴
SMG5, RPL7, RPL17, RPL27A, EIF4G1, RPS10, RPL10A,
RPL26, RPS25, RPL41, RPL4, RPL24, RPS19, SMG8, RPS18,
RPL12, SMG7, UPF1, RPS4Y2, RPL22, RPL15, RPS5, RPL27
R-HSA-975957
Nonsense Mediated Decay
(NMD) enhanced by the
Exon Junction Complex
(EJC)
2.48 × 10⁻⁴
SMG5, RPL7, RPL17, RPL27A, EIF4G1, RPS10, RPL10A,
RPL26, RPS25, RPL41, RPL4, RPL24, RPS19, SMG8, RPS18,
RPL12, SMG7, UPF1, RPS4Y2, RPL22, RPL15, RPS5, RPL27
3. Discussion and Conclusions
The presence of auto-antibodies serves as one of the European League Against Rheu-
matism (EULAR) classification criteria for rheumatoid arthritis [42]. The serological status
for rheumatoid factor (RF) and anti-citrullinated protein antibodies (ACPAs) allows strat-
ification into subgroups of seropositive and seronegative RA. It is widely accepted and
discussed that autoantibodies are of predictive value for the development of RA and the
severeness of the disease outcome. However, the role of auto-antibodies within the dis-
ease pathogenesis is not completely understood. The feasibility of autoantibody based
pathway analysis was reported in previous work [43–45].
Within the presented analysis we conducted IgG profiling of treatment-naive plasma
samples from RA patients and PIA animals on high density protein microarrays. Isolated
IgG from 96 human plasma samples and 8 animals was probed on AIT’s 16k protein mi-
croarray and identified DIRAGs subjected to pathway analysis using Reactome pathway
browser and the WebGestalt toolkit to elucidate involved pathways. The identification of
autoantibody signatures could not only aid in improving the early diagnosis of systemic
autoimmune diseases, but also provide insights into the role of autoantibodies in the dis-
ease pathogenesis. Therefore, pathway analysis of DIRAGs was conducted in RA and
compared to an established rodent model of RA to investigate the similarity of obtained
immune signatures. Differential reactivity analysis of IgG from seropositive versus sero-
negative RA samples resulted in 206 significantly higher reactive DIRAGs with unambig-
uous gene symbols in seropositive RA and 221 DIRAGs in seronegative RA. In PIA, 988
significant DIRAGs (p < 0.05) upon correction for control animals were revealed. EEF1A1,
HBP1, TXNDC5, TPM3, c8orf33, ILF3, MGEA5, LTBP3, HLA-C and UBA1 were signifi-
cantly (p < 0.05) higher reactive (FC > 1.35) in seropositive, seronegative RA and PIA.
Gene sets were separately subjected to pathway analysis using the Reactome path-
way browser, the complete 16k gene list was used as reference. The top 25 significant
pathways showed 10 overlapping pathways between seropositive and seronegative RA
with high significance (p < 0.003), and 7 retained high significance after multiple testing
correction (Benjamini-Hochberg (BH) procedure). The remaining 3 pathways preserved
high significance in seronegative RA after correction for multiple testing (BH procedure)
(Cytokine signaling in Immune System, Immunoregulatory interactions between lym-
phoid and a non-lymphoid cell and Class I MHC-mediated antigens processing and
presentation). For PIA, the 7 highly significant pathways overlapping between seroposi-
tive and seronegative RA were found within the top 10 pathways with high significance
after BH correction. Cytokine signaling in the immune system retained high significance
after BH correction for the PIA analysis. The intersection of the gene lists of the found
genes in the top 25 pathways revealed 16 genes of suspected biological relevance (HLA-
C, GBP6, EIF4G2, MSN, HNRPDL, HLA-A, FLNA, CCND1, FN1, APEH, VCL, NUP62,
LCP1, PSMC4, DDOST and EEF1A1). Two out of these, CCND1 and PSMC4, have previ-
ously not been described as (auto)antigens.
Aiming to counterbalance possible biases of the pathway analysis caused by redun-
dant hits within the Reactome pathway browser analysis, WebGestalt analysis was ap-
pended. The major advantage of the WebGestalt tool within this study is the option of
redundancy reduction which leads to identical results for the 16k microarray within the
Reactome pathway browser (HLA was observed as the top hit within all pathway

Molecules 2022, 27, 1452 13 of 18
analyses, also for the reference design). Since seropositive and seronegative RA have dis-
tinct serological and radiological appearance and disease progression, different auto-an-
tibody signatures for the serotypes could be plausible. This hypothesis, however, required
the reduction of redundant database hits as the reference analysis showed the identical
result. Within the WebGestalt analysis, no overlapping pathways for seropositive or ser-
onegative RA and PIA were observed. EEF1A1 was observed as single hit between after
intersection of the gene lists, which also arose within the Reactome pathway browser anal-
ysis. EEF1A1 was previously described as an autoantigen in type 1 diabetes by Koo et al.
in 2014 [38] and is stably expressed in synovial fibroblast as shown by Schröder et al. in
2019 [39]. Furthermore, EEF1A1 is described as an autoantigen in Felty’s syndrome, which
is a rare condition associated with RA encompassing splenomegaly and low neutrophil
counts [40]. The clinical disease activity index (CDAI) of the investigated cohort com-
prised patients with moderate-to-severe disease activity status (CDAI mean 20.7 in sero-
positive RA and 21.9 in seronegative RA, compare Table 3). A correlation analysis with
CDAI as quantitative trait showed n = 429 antigens with significant correlation between r
= ±0,29–0,49 which in summary shows good correlation for CDAI and antibody reactivity.
With regard to the treatment-naive status of considered patient samples, elucidated anti-
gens and pathways should reflect disease characteristics free of effects of immune-modu-
latory treatments. Of interest, the pathways affected by our analysis of antigenic reactivi-
ties showing negative correlation are strongly associated with antigen presentation and
immune regulation—these are statistically highly significant. This means an inverse rela-
tion and less autoantibody reactivity towards these self-antigens in mild or less-active dis-
ease with respect to the CDAI. On the contrary antigens functional in RNA-associated
pathways (e.g., RNA Polymerase I Transcription Initiation, RUNX1 regulates the expres-
sion of components of tight junctions, Metabolism of RNA, etc.) showed positive correla-
tion with disease activity– this means higher autoantibody reactivity towards self-anti-
gens, were found in more severe or active disease.
Although these data need to be validated with an independent sample cohort, espe-
cially for those with positive correlation (when p-values were significant, but the false dis-
covery rates are high, thus this interpretation has to be taken with caution), the negative
correlation with disease activity goes in line with the same pathways relevant in antigen
presentation and immune regulation, as found significant when comparing the seroposi-
tive vs. seronegative human RA and in the PIA rodent RA model the animals expressing
RA disease vs. those before RA induction.
To our knowledge, this is the first comprehensive comparative study of rodent and
human autoantibody signatures in RA. Taken together, the pathways elucidated from au-
toantibody signatures underpin the previously described clinical similarities between RA
and PIA, suggesting shared pathways in disease initiation and progression. Therefore we
conclude that IgG profiling on high density protein microarrays offers (I) the possibility
to reveal novel autoantigens for diagnostic or therapeutic applications and (II) gives in-
sights into the role of auto-antibodies within the pathogenesis.
4. Materials and Methods
4.1. Samples
Plasma samples from 96 treatment naive human individuals were provided by the
biobank of the Division of Rheumatology of the Medical University of Vienna. Determi-
nation of RF and ACPA status were determined as previously described [46] and RA pa-
tients stratified respectively to seropositive (RF and ACPA positive) and seronegative (RF
and ACPA negative) RA. Samples were equally distributed (n = 24 per group) over the
patient groups osteoarthritis, seropositive RA, seronegative RA and bone-erosive disease-
free controls (healthy). The characteristics of the human cohort are given in Table 5.
Serum from 8 animals was provided by the Division of Rheumatology of the Medical
University of Vienna. The animal cohort comprised serum from n = 3 control group rats

Molecules 2022, 27, 1452 14 of 18
and n = 5 immunized rats collected 5, 7 and 24 days after Pristane (2,6,10,14-Tetra-
methylpentadecan) or PBS treatment; this arthritis model (Pristane induced arthritis
(PIA)) and its protocol was previously described elsewhere in detail [7].
Table 5. Sample characteristics of the investigated human cohort: age, biological sex, rheumatoid
factor (RF), ACPA (CCP+) status and disease activity as clinical disease activity status (CDAI) are
given.
Characteristic Seropositive RA Seronegative RA Healthy Controls Osteoarthritis
age range (years) 24.7–76.8 33.6–77.9 41–68 35–78
mean (years) 54.3 58.9 52.5 60.9
sex male (n) 9 7 8 5
female (n) 15 17 16 19
RF+ n = 24 - - -
CCP+ n = 24 - - -
disease activity range (CDAI) 10.1–44.4 11.9–38.4 - -
mean (CDAI) 20.7 21.9 - -
4.2. Antibody Isolation
IgG was isolated with the MelonTM Gel IgG Spin Purification Kit (Thermo ScientificTM
45,206) from human and murine plasma by diluting 15 µL plasma with 95 µL of purifica-
tion buffer and isolation according manufacturer’s instructions. Antibody concentration
was determined as the means of A280 duplicate measurements (Epoch Take3 system) and
the integrity of antibodies was determined via gradient sodium dodecylsulfate (SDS) pol-
yacrylamide gel electrophoresis (NuPAGETM 4–12% Bis-Tris (InvitrogenTM NO0336) in 1X
MOPS (InvitrogenTM NP0050)) and subsequent Coomassie staining (InvitrogenTM Simply-
BlueTM SafeStain). Two µg of eluate was mixed with 2.5 µL 4X LDS buffer (PierceTM 84788)
and filled with buffer to 10 µL, denatured at 70 °C for 10 min and loaded to each lane and
gel run at 180 V for 60min. IgG was concentration adjusted to 0.3 mg/mL (human) and 0.2
mg/mL (murine) with the kit provided buffer and stored −20 °C until slide processing.
4.3. Protein Microarray Processing
AIT’s 16k protein microarray is an in-house printed, high density protein microarray
derived from the UniPEx expression library. Production of recombinant proteins was pre-
viously described in detail elsewhere [44,47,48]. In brief, the array represents 5449 anno-
tated human proteins in one or more E. coli cDNA clones (15,417 cDNA clones in total).
Purified 6xHis-Tag proteins are spotted in duplicates onto SU8 epoxy coated glass slides
with an Arrayjet Marathon Argus inkjet microarray instrument. Bovine serum albumin,
human serum albumin, human IgG, crude E. coli lysate and elution buffer are spotted as
controls. Each batch of printed slides is subjected to a qualification experiment as previ-
ously described by Coronell et al., and slides are vacuum sealed and stored at 4 °C until
processing. Briefly, this qualification experiment comprises the reliability analysis of the
platform to comprehend an individual’s antibody fingerprint by crosswise mixing of two
samples and subsequent correlation analysis of the obtained antibody profiles when 97%
of DIRAGs correlated (r = 0.5–1) with the mixing ratio [43].
16k protein microarray slides were equilibrated to room temperature, slides pre-
treated by incubation with 2% SDS at 70 °C for 10min and blocked with DIG Easy HybTM
for 30 min at room temperature (RT) in one tank equipped with magnetic stirrers. Slides
were washed three times in 1× PBS pH 7.4 0.1% Triton X-100 (PBST; GibcoTM 70011044 and
Merck X100) for 5 min each with stirring and rinsed with Milli-Q® water. Blocked slides
were spin dried at 900 rpm for 4 min and put in dust-free hybridization chambers (Agilent
G253A). Thawn samples were diluted to a final concentration of 0.15 mg/mL with 2× PBST
6% skimmed milk powder (Maresi Fixmilch) and 400 µL of sample dilution applied to
each gasket slide (Agilent G2534-60003), slides placed on top and chambers closed. Upon
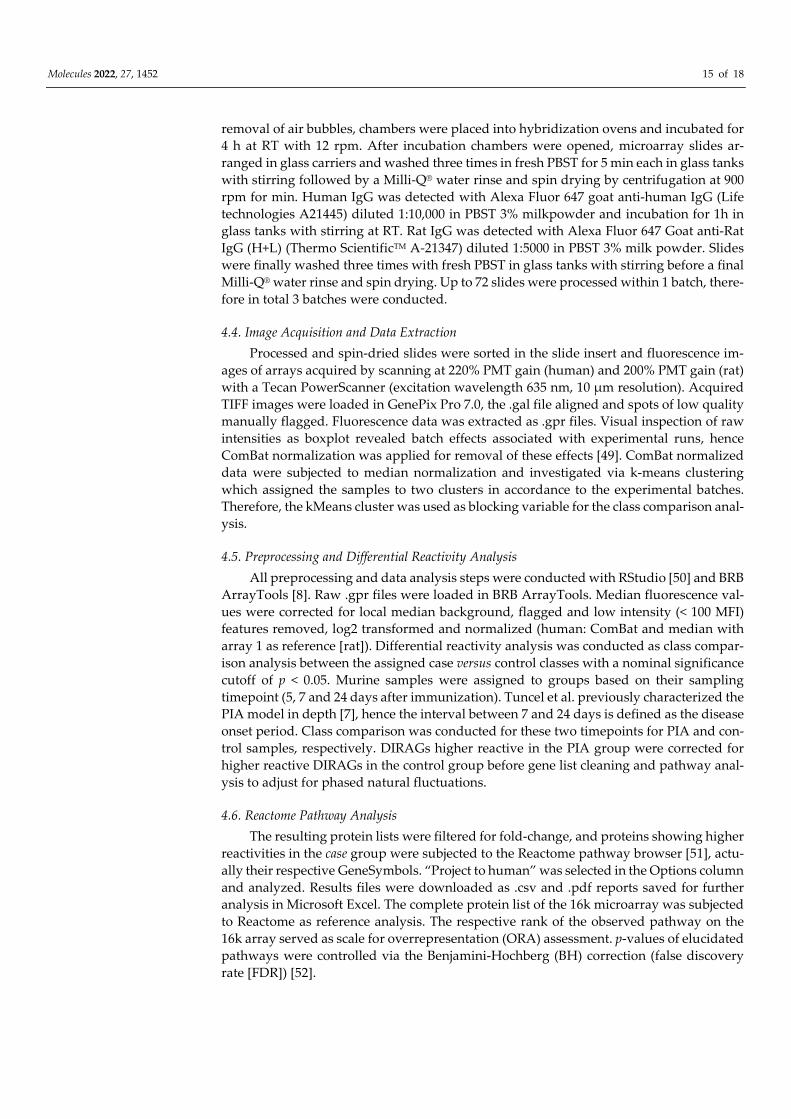
Molecules 2022, 27, 1452 15 of 18
removal of air bubbles, chambers were placed into hybridization ovens and incubated for
4 h at RT with 12 rpm. After incubation chambers were opened, microarray slides ar-
ranged in glass carriers and washed three times in fresh PBST for 5 min each in glass tanks
with stirring followed by a Milli-Q® water rinse and spin drying by centrifugation at 900
rpm for min. Human IgG was detected with Alexa Fluor 647 goat anti-human IgG (Life
technologies A21445) diluted 1:10,000 in PBST 3% milkpowder and incubation for 1h in
glass tanks with stirring at RT. Rat IgG was detected with Alexa Fluor 647 Goat anti-Rat
IgG (H+L) (Thermo ScientificTM A-21347) diluted 1:5000 in PBST 3% milk powder. Slides
were finally washed three times with fresh PBST in glass tanks with stirring before a final
Milli-Q® water rinse and spin drying. Up to 72 slides were processed within 1 batch, there-
fore in total 3 batches were conducted.
4.4. Image Acquisition and Data Extraction
Processed and spin-dried slides were sorted in the slide insert and fluorescence im-
ages of arrays acquired by scanning at 220% PMT gain (human) and 200% PMT gain (rat)
with a Tecan PowerScanner (excitation wavelength 635 nm, 10 µm resolution). Acquired
TIFF images were loaded in GenePix Pro 7.0, the .gal file aligned and spots of low quality
manually flagged. Fluorescence data was extracted as .gpr files. Visual inspection of raw
intensities as boxplot revealed batch effects associated with experimental runs, hence
ComBat normalization was applied for removal of these effects [49]. ComBat normalized
data were subjected to median normalization and investigated via k-means clustering
which assigned the samples to two clusters in accordance to the experimental batches.
Therefore, the kMeans cluster was used as blocking variable for the class comparison anal-
ysis.
4.5. Preprocessing and Differential Reactivity Analysis
All preprocessing and data analysis steps were conducted with RStudio [50] and BRB
ArrayTools [8]. Raw .gpr files were loaded in BRB ArrayTools. Median fluorescence val-
ues were corrected for local median background, flagged and low intensity (< 100 MFI)
features removed, log2 transformed and normalized (human: ComBat and median with
array 1 as reference [rat]). Differential reactivity analysis was conducted as class compar-
ison analysis between the assigned case versus control classes with a nominal significance
cutoff of p < 0.05. Murine samples were assigned to groups based on their sampling
timepoint (5, 7 and 24 days after immunization). Tuncel et al. previously characterized the
PIA model in depth [7], hence the interval between 7 and 24 days is defined as the disease
onset period. Class comparison was conducted for these two timepoints for PIA and con-
trol samples, respectively. DIRAGs higher reactive in the PIA group were corrected for
higher reactive DIRAGs in the control group before gene list cleaning and pathway anal-
ysis to adjust for phased natural fluctuations.
4.6. Reactome Pathway Analysis
The resulting protein lists were filtered for fold-change, and proteins showing higher
reactivities in the case group were subjected to the Reactome pathway browser [51], actu-
ally their respective GeneSymbols. “Project to human” was selected in the Options column
and analyzed. Results files were downloaded as .csv and .pdf reports saved for further
analysis in Microsoft Excel. The complete protein list of the 16k microarray was subjected
to Reactome as reference analysis. The respective rank of the observed pathway on the
16k array served as scale for overrepresentation (ORA) assessment. p-values of elucidated
pathways were controlled via the Benjamini-Hochberg (BH) correction (false discovery
rate [FDR]) [52].

Molecules 2022, 27, 1452 16 of 18
4.7. WebGestalt Pathway Analysis
For GeneOntology analysis and refined ORA, protein lists containing the higher re-
active DIRAGs in the respective case group were subjected to the WebGestalt toolkit (path-
way and Reactome as functional database, minimum number of genes per category n = 5
and top 10 as respective significance level [53]). The complete list of gene symbols pre-
sented on the 16k array was used as a reference list. Report files were downloaded in the
default format and further analysed in Microsoft Excel and the JVenn [9].
Supplementary Materials: The following supporting information can be downloaded online. Fig-
ure S1: SDS Page for plasma isolated IgG; Figure S2: Boxplots of top 10 DIRAGs in human RA and
the PIA rat model; Figure S3: A) Involvement of antigens with significant positive CDAI correlation
in Metabolism of RNA pathway. B) the top pathway of antigens with significant positive CDAI
correlation: Class I MHC mediated antigen processing & presentation; Table S1: Top 25 enriched
pathways identified for DIRAGs higher reactive in seropositive versus seronegative RA in human
IgG profiling. Table S2: Top 25 pathways enriched pathways for DIRAGs higher reactive in sero-
negative RA. Table S3: Top 25 enriched pathways for DIRAGs higher reactive in established PIA.
Table S4: The enriched pathways for antigens positively (A) and the top 20 negatively (B) correlated
with CDAI.
Author Contributions: L.M.: manuscript writing, data acquisition and analysis; A.F.: animal exper-
iments, writing; J.H.: data acquisition; K.V.: data analysis and interpretation, discussion; S.B.: dis-
cussion, writing; G.S.: conceptualization, discussion, writing; A.W.: conceptualization, data analysis
and interpretation, supervision, writing, revising; R.S.: data analysis, curation; D.S.: providing hu-
man samples. All authors have read and agreed to the published version of the manuscript.
Funding: This work was supported by the FFG Research Studios Austria (5th call, grant agreement
no. 859182, project PepPipe) and by the Innovative Medicines Innovative Medicines Initiative 2 Joint
Undertaking (grant agreement no. 777357, project RTCure).
Institutional Review Board Statement: The human study was approved by the ethics committee of
the Medical University of Vienna (ethics vote number: 559/2005). All animal experiments were car-
ried out in accordance to EU Directive 2010/63/EU for animal experiments and were approved by
the ethics committee of the Medical University Vienna.
Informed Consent Statement: Informed consent was obtained from all subjects involved in the
study.
Data Availability Statement: Protein array data are available on request.
Acknowledgments: The authors thank Michael Stierschneider, Silvia Schönthaler and Ronald Ku-
lovics for the spotting of the arrays.
Conflicts of Interest: The authors declare no conflicts of interest. The funders had no role in the
design of the study; in the collection, analyses, or interpretation of data; in the writing of the manu-
script, or in the decision to publish the results.
Sample Availability: Samples of the compounds are not available from the authors.
References
1. Smolen, J.S.; Steiner, G. Therapeutic strategies for rheumatoid arthritis. Nat. Rev. Drug Discov.2003, 2, 473–488.
2. Egerer, K.; Feist, E.; Burmester, G.-R. The Serological Diagnosis of Rheumatoid Arthritis. Dtsch. Aerzteblatt Online 2009, 106, 159–
163.
3. Brink, M.; Hansson, M.; Mathsson-Alm, L.; Wijayatunga, P.; Verheul, M.; Trouw, L.; Holmdahl, R.; Rönnelid, J.; Klareskog, L.;
Rantapää-Dahlqvist, S. Rheumatoid factor isotypes in relation to antibodies against citrullinated peptides and carbamylated
proteins before the onset of rheumatoid arthritis. Arthritis Res. Ther. 2016, 18, 1–11.
4. Van Delft, M.; Huizinga, T. An overview of autoantibodies in rheumatoid arthritis. J. Autoimmun. 2020, 110, 102392.
5. Blüml, D.A.S. Therapeutic implications of autoantibodies in rheumatoid arthritis. RMD Open 2016, 2, 1–8.
6. Meehan, G.R.; Thomas, R.; Al Khabouri, S.; Wehr, P.; Hilkens, C.; Wraith, D.; Sieghart, D.; Bonelli, M.; Nagy, G.; Garside, P.; et
al. Preclinical models of arthritis for studying immunotherapy and immune tolerance. Ann. Rheum. Dis. 2021, 80, 1268–1277.
7. Tuncel, J.; Haag, S. Animal models of rheumatoid arthritis (I): Pristane-induced arthritis in the rat. PLoS ONE 2016, 11, 1–17.
8. Ngan, M.; Simon, R.; Menenzes, S.; Zhao, Y.; Lam, A.; Li, M.-C. Analysis of Gene Expression Data Using BRB-Array Tools. Cancer
Inform. 2017, 3, 117693510700300.
Molecules 2022, 27, 1452 17 of 18
9. Bardou, P.; Mariette, J.; Escudié, F.; Djemiel, C.; Klopp, C. jvenn: An interactive Venn diagram viewer. BMC Bioinform. 2014, 15,
1–7.
10. Siegel, R.J.; Bridges, S.L.; Ahmed, S. HLA -C: An Accomplice in Rheumatic Diseases . ACR Open Rheumatol. 2019, 1, 571–579.
11. Xiao, X.; Hao, J.; Wen, Y.; Wang, W.; Guo, X.; Zhang, F. Genome-wide association studies and gene expression profiles of rheu-
matoid arthritis: An analysis. Bone Jt. Res. 2016, 5, 314–319.
12. Lo, K.C.; Sullivan, E.; Bannen, R.; Jin, H.; Rowe, M.; Li, H.; Pinapati, R.; Cartwright, A.; Tan, J.; Patel, J.; et al. Comprehensive
Profiling of the Rheumatoid Arthritis Antibody Repertoire. Arthritis Rheumatol. 2020, 72, 242–250.
13. Gao, S.; Liu, L.; Zhu, S.; Wang, D.; Wu, Q.; Ning, G.; Feng, S. MicroRNA-197 regulates chondrocyte proliferation, migration, and
inflammation in pathogenesis of osteoarthritis by targeting EIF4G2. Biosci. Rep. 2020, 40, 1–13.
14. Okazaki, Y.; Suzuki, A.; Sawada, T.; Ohtake-Yamanaka, M.; Inoue, T.; Hasebe, T.; Yamada, R.; Yamamoto, K. Identification of
citrullinated eukaryotic translation initiation factor 4G1 as novel autoantigen in rheumatoid arthritis. Biochem. Biophys. Res. Com-
mun. 2006, 341, 94–100.
15. Uchida, K.; Akita, Y.; Matsuo, K. Identification of specific autoantigens in Sjögren’s syndrome by SEREX. Immunology 2005, 116,
53–63.
16. Wagatsuma, M.; Kimura, M.; Suzuki, R.; Takeuchi, F.; Matsuta, K.; Watanabe, H. Ezrin, radixin, and moesin are possible auto-
immune antigens in rheumatoid arthritis. Mol. Immunol. 1996, 33, 1171–1176.
17. Maejima, H.; Nagashio, R.; Hamada, Y. Moesin and stress-induced phosphoprotein-1 are possible sero-diagnostic markers of
psoriasis. PLoS ONE 2017, 9, 7.
18. Hussain, M.; Chen, P.; Zhang, Y.; Tian, Y.; Du, H. Moesin expression is correlated with its involvement in patients with Behcet’s
disease. Arch. Med. Sci. 2020, 16, 924–930.
19. Takamatsu, H.; Feng, X.; Chuhjo, T. Specific antibodies to moesin, a membrane-cytoskeleton linker protein, are frequently de-
tected in patients with acquired aplastic anemia. Blood 2007, 109, 2514–2520.
20. Suzuki, K.; Nagao, T.; Itabashi, M. A novel autoantibody against moesin in the serum of patients with MPO-ANCA-associated
vasculitis. Nephrol. Dial. Transplant. 2014, 29, 1168–1177.
21. Zhang, Y.; Hussain, M.; Yang, X. Identification of Moesin as a Novel Autoantigen in Patients with Sjögren’s Syndrome. Protein
Pept. Lett. 2018, 25, 4.
22. Lin, X.; Liang, Q.; Lin, L.; Ding, Q.; Wang, X.; Wang, Y. Identification of anti-moesin antibodies in the serums of patients with
antiphospholipid syndrome. Thromb. Res.2015, 135, 867–872.
23. Marklein, B.; Jenning, M.; Konthur, Z.; Cope, A. Correction to: The citrullinated/native index of autoantibodies against hnRNP-
DL predicts an individual ‘window of treatment success’ in RA patients. Arthritis Res. Ther. 2021, 23, 1–16, doi:10.1186/s13075-
021-02603-x).
24. Raychaudhuri, S.; Sandor, C.; Stahl, E. Five amino acids in three HLA proteins explain most of the association between MHC
and seropositive rheumatoid arthritis. Nat. Genet. 2012, 44, 291–296.
25. Pianta, A.; Arvikar, S.; Strle, K. Two rheumatoid arthritis-specific autoantigens correlate microbial immunity with autoimmune
responses in joints. J. Clin. Investig. 2017, 127, 2946–2956.
26. Biswas, S.; Sharma, S. Identification of Novel Autoantigen in the Synovial Fluid of Rheumatoid Arthritis Patients Using an Im-
munoproteomics Approach. PLoS ONE 2013, 8, 2.
27. Walton, D.L.S.K.W. The significance of fibronectin in rheumatoid arthritis. Semin. Arthritis Rheum. 1984, 13, 244–254, 1984.
28. Van Beers, J.J.B.C.; Willemze, A.; Stammen-Vogelzangs, J.; Drijfhout, J.W.; Toes, R.E.M.; Pruijn, G.J.M. Anti-citrullinated fibron-
ectin antibodies in rheumatoid arthritis are associated with human leukocyte antigen-DRB1 shared epitope alleles. Arthritis Res.
Ther. 2012, 14, 1–16.
29. Van Heemst, J.; Jansen, D.; Polydoridess, S.; Moustakas, A.K.; Bax, M.; Feitsma, A.; Bontrop-Elferink, D.; Baarse, M.; van der
Woude, D.; Wolbink, G.; et al. Crossreactivity to vinculin and microbes provides a molecular basis for HLA-based protection
against rheumatoid arthritis. Nat. Commun. 2015, 6, 6681.
30. Batliwalla, F.M.; Li, W. Microarray analyses of peripheral blood cells identifies unique gene expression signature in psoriatic
arthritis. Mol. Med. 2005, 11, 21–29.
31. Senécal, J.L.; Isabelle, C.; Friztler, M.; Targoff, I.; Goldsterin, R.; Gagne, M.; Raynauld, P.; Joyal, F.; Troyanov, Y.; Dabauavalle,
M. An autoimmune myositis-overlap syndrome associated with autoantibodies to nuclear pore complexes: Description and
long-term follow-up of the anti-nup syndrome. Medicines 2014, 93, 383–394.
32. Van der Meulen, P.M.; Cuadrado, E. Protein array autoantibody profiles to determine diagnostic markers for neuropsychiatric
systemic lupus erythematosus. Rheumatology 2017, 56, 1407–1416, 2017.
33. Fuchs, P.S.; Christ, E. Co-Occurrence of ANCA-Associated Vasculitis and Sjögren’s Syndrome in a Patient With Acromegaly: A
Case Report and Retrospective Single-Center Review of Acromegaly Patients. Front. Immunol. 2020, 11, 1–6.
34. Komorowski, D.P.B.L. Disease-specific autoantibodies in primary biliary cirrhosis. Clin. Chim. Acta 2011, 412, 502–512.
35. Yuan, Y.; Lin, Z. Identification of Novel Autoantibodies Associated With Psoriatic Arthritis. Arthritis Rheumatol. 2019, 71, 941–
951.
36. Chen, J.L.N. A 9 mRNAs-based diagnostic signature for rheumatoid arthritis by integrating bioinformatic analysis and machine-
learning. J. Orthop. Surg. Res. 2021, 16, 1–7.
37. Vadde, M.K.G.R. Identification and characterization of differentially expressed genes in Type 2 Diabetes using in silico approach.
Comput. Biol. Chem. 2019, 79, 24–35.

Molecules 2022, 27, 1452 18 of 18
38. Koo, B.K.; Cha, S. Identification of novel autoantibodies in type 1 diabetic patients using a high-Density protein microarray.
Diabetes 2014, 63, 3022–3032.
39. Schröder, A.; Nazet, U.; Muschter, D.; Grässel, S.; Proff, P.; Kirschneck. Impact of mechanical load on the expression profile of
synovial fibroblasts from patients with and without osteoarthritis. Int. J. Mol. Sci. 2019, 20, 3.
40. Ditzel, H.J.; Masaki, Y.; Nielsen, H.; Farnaes, L.; Burton, D.R. Cloning and expression of a novel human antibody-antigen pair
associated with Felty’s syndrome. Proc. Natl. Acad. Sci. USA 2000, 97, 9234–9239.
41. Ho, J.; Tumkaya, T.; Aryal, S.; Choi, H.; Claridge-Chang, A. Moving beyond P values: Data analysis with estimation graphics.
Nat. Methods 2019, 16, 565–566.
42. Aletaha, D.; Neogi, T. 2010 Rheumatoid arthritis classification criteria: An American College of Rheumatology/European League
Against Rheumatism collaborative initiative. Arthritis Rheum. 2010, 62, 2569–2581.
43. Coronell, J.A.L.; Sergelen, K. The Immunome of Colon Cancer: Functional In Silico Analysis of Antigenic Proteins Deduced from
IgG Microarray Profiling. Genom. Proteom. Bioinforma. 2018, 16, 73–84.
44. Gyurján, I.; Rosskopf, S.; Coronell, J.A.L.; Muhr, D.; Singer, C.; Weinhäusel, A. IgG based immunome analyses of breast cancer
patients reveal underlying signaling pathways. Oncotarget 2019, 10, 3491–3505.
45. Luna-Coronell, J.A.; Vierlinger, K.; Gamperl, M.; Hofbauer, J.; Berger, I.; Weinhäusel, A. The prostate cancer immunome: In silico
functional analysis of antigenic proteins from microarray profiling with IgG. Proteomics 2016, 16, 1204–1214.
46. Sieghart, D.; Platezer, A. Determination of autoantibody isotypes increases the sensitivity of serodiagnostics in rheumatoid ar-
thritis. Front. Immunol. 2018, 9, 876.
47. Stempfer, R.; Syed, P. Tumour auto-antibody screening: Performance of protein microarrays using SEREX derived antigens.
BMC Cancer 2010, 10, 627.
48. Brezina, S.; Soldo, R.; Kreuzhuber, R.; Hofer, P.; Gsur, A.; . Weinhaeusel. Immune-Signatures for Lung Cancer Diagnostics: Eval-
uation of Protein Microarray Data Normalization Strategies. Microarrays 2015, 4, 162–187.
49. Leek, J.T.; Johnson, W.E.; Parker, H.S.; Jaffe, A.E.; Storey, J.D. The SVA package for removing batch effects and other unwanted
variation in high-throughput experiments. Bioinformatics 2012, 28, 882–883.
50. R: A language and Environment for Statistical Computing. 2018. Available online: https://www.r-project.org/ (accessed on 19
February 2022).
51. Jassal, B.; Viteri, G. The reactome pathway knowledgebase. Nucleic Acids Res. 2020, 48, D498–D503.
52. Hochberg, Y.B.Y. Controlling the False Discovery Rate: A Practical and Powerful Approach to Multiple Testing. J. R. Stat. Soc.
1995, 57, 289–300, 1995.
53. Liao, Y.; Wang, J.; Jaehnig, E.J.; Shi, Z.; Zhang, B. WebGestalt 2019: Gene set analysis toolkit with revamped UIs and APIs. Nucleic
Acids Res. 2019, 47, W199–W205.
Related Documents