ANALYST BRIEFING Financial Year Ended 31 March 2012

Full Year Analyst Briefing as at 31 March 2012
Nov 12, 2014
This is the Full Year Analyst Briefing as at 31 March 2012 for Alliance Financial Group Berhad (AFGB).
Welcome message from author
This document is posted to help you gain knowledge. Please leave a comment to let me know what you think about it! Share it to your friends and learn new things together.
Transcript
ANALYST BRIEFINGFinancial Year Ended 31 March 2012

Executive Summary
Financial Results for FY2012
Contents
2
1
1
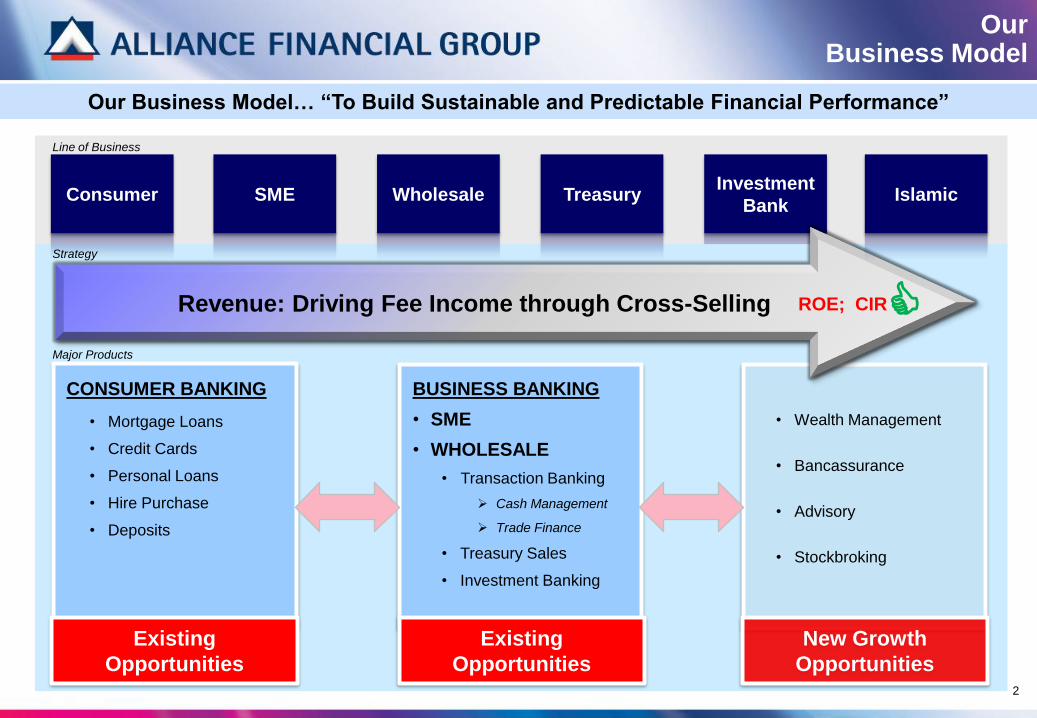
Our Business Model… “To Build Sustainable and Predictable Financial Performance”
Investment
Bank
• Wealth Management
• Bancassurance
• Advisory
• Stockbroking
Revenue: Driving Fee Income through Cross-Selling
CONSUMER BANKING
• Mortgage Loans
• Credit Cards
• Personal Loans
• Hire Purchase
• Deposits
Existing
Opportunities
BUSINESS BANKING
• SME
• WHOLESALE
• Transaction Banking
Cash Management
Trade Finance
• Treasury Sales
• Investment Banking
Existing
Opportunities
New Growth
Opportunities
Consumer SME Wholesale Treasury Islamic
Line of Business
Major Products
Strategy
ROE; CIR
Our Business Model
2

We achieved good progress against our 3-Year Medium Term Targets FY2012 – FY2015
Medium Term Targets
3
Cost to Income
Ratio
Return on
Equity
Dividend
Policy
… move to industry average (45% - 48%) through:
• targeted revenue growth
• improved productivity
… achieve industry average (14% - 16%) through:
• focus on underlying earnings momentum
• effective capital management
… pay “as much as we can afford, whenever we can”, subject to
maintaining strong capital ratios
… gross impaired loans to be better than industry averageAsset
Quality
Non Interest
Income Ratio … to increase non-interest income to 30% of total revenue 26.8%
13.6%
47.3%
2.4%
42.3%
FY2012
Achievement

FY12 FY11 Change
Profitability/ Efficiency Ratio
Return on Equity 13.6% 13.0% +0.6%
Return on Assets 1.3% 1.2% +0.1%
Non-Interest Income Ratio 26.8% 20.8% +6.0%
Cost-to-Income Ratio 47.3% 48.3% +1.0%
Asset Quality
Gross Impaired Loans 2.4% 3.3% +0.9%
Loan Loss Coverage Ratio 108.5% 90.1% +18.4%
Liquidity & Capital Ratio
CASA Ratio 33.7% 34.0% - 0.3%
Loan to Deposit Ratio 77.8% 78.8% +1.0%
Risk Weighted Capital Ratio 15.2% 16.1% - 0.87%
Core Capital Ratio 11.5% 11.9% - 0.43%
FY2012:
Key Financial Ratios
4
Key performance metrics are improving in right direction
Achieved ROE of 13.6%.
Driven mainly by expansion in non-
interest income ratio to 26.8%; and
Drop in cost-to-income ratio to
47.3% due better cost management.
Gross impaired loans ratio dropped to
2.4% and loan loss coverage raised to
108.5%, better than industry average.
Flexibility to expand balance
sheet, with:
15.2% RWCR
77.8% loans to deposits ratio
Stable CASA ratio at 33.7%

FY12
RM mil
FY11
RM mil
Change
RM mil %
Net Interest & Islamic
Banking Income930.2 903.0 27.2 +3.0%
Non-Interest Income 320.2 225.7 94.5 +41.8%
Net Income 1,250.4 1,128.7 121.7 +10.8%
Operating Expenses 591.8 544.9 46.9 +8.6%
Operating Profit 658.6 583.8 74.8 +12.8%
Allowance for losses on
loans, advances and
financing and other losses
-34.6 -33.3 -1.3 +3.9%
Write back of impairment 21.6 4.1 17.5 +426.8%
Pre-tax profit 643.6 553.1 90.5 +16.4%
Net Profit After Taxation 479.8 409.2 70.6 +17.3%
Summarised
Income Statement
5
17.3% increase in net profits driven
by growth in:
Net interest income due to 11.3%
expansion in loans, but offset
with margin compression and
rise in cost of funds.
Non-interest income due to
recurring transaction
banking, treasury sales and
wealth management.
Write back in impairment
provisions due to RM23.1 million
of CLO recoveries.
Offset by:
8.6% rise in operating expenses
in line with business expansion.
Higher collective impairment
provisions due to acceleration in
gross loans growth to
11.3%, from 4.8% in FY2011.
FY2012: Net Profit After Taxation Rose 17.3% to RM479.8 mil

FY12
RM bil
FY11
RM bil
Change
RM bil %
Net Loans, Advances
and Financing 24.4 21.8 2.6 +11.8%
Investment and
Dealing Securities11.4 12.1 0.7 -6.0%
Deposits from
Customers 32.1 28.3 3.8 +13.4%
Total Assets 39.6 36.1 3.5 +9.8%
Shareholders’ Funds 3.7 3.4 0.3 +9.5%
Summarised
Balance Sheet
6
FY2012: Total assets expanded 9.8% to RM39.6 billion, driven by acceleration in loans growth
Total assets expanded by 9.8% to
RM39.6 billion.
Double-digit net loans growth of
11.8% to RM24.4 bilion, driven by
Consumer and Business Banking.
Healthy liquidity with customer
deposits expanding by RM3.8
billion or 13.4%.
Shareholders’ funds increased by
9.5%.

46.2%
53.0% 52.1%
48.3%47.3%
45%
49%
53%
FY2008 FY2009 FY2010 FY2011 FY2012
Cost To Income Ratio
380.1
228.9
301.5
409.2
479.8
200
250
300
350
400
450
FY2008 FY2009 FY2010 FY2011 FY2012
RM mil
Profit After Tax
16.8%
8.6% 10.5%
13.0%
13.6%
5%
9%
13%
17%
FY2008 FY2009 FY2010 FY2011 FY2012
Return On Equity
26.1%
22.4% 22.4%
20.8%
26.8%
19%
21%
23%
25%
27%
FY2008 FY2009 FY2010 FY2011 FY2012
Non-Interest Income ratio
Key Financial Trends
Return on Equity
Profit After Tax
Cost-to-Income Ratio
Financial Performance is improving, with Key Metrics in Right Direction
Non-Interest Income Ratio
7

• Clear niche position in Consumer and Business Banking.
• Well-capitalised, with strong asset quality.
• Continued focus on strengthening risk management capabilities.
The Bank remains strong and well-positioned.
Alliance Bank GroupToday
• Improving customer service, cross-selling, productivity and reducing turn around times.
remains a major priority.
• Impactful investment in our IT and infrastructure.
• Focus on human capital with right values.
Clear strategy and the right team to deliver it.
• Clear strategy focused on building sustainable long-term growth.
• Leverage on all our business franchises to drive non-interest income activities.
• Launched new initiatives such as Transaction banking, Treasury sales, Bancassurance
and Wealth Management.
Achieving continued growth.
8

9
Corporate
DevelopmentsGrowing Non-Interest Income: 8-Year Bancassuranc Arrangement with AIA
One-stop financial
services center for
customers’
convenience – both
banking and insurance
products
Broad suite of
products to meet
market, customer and
channel needs
Provide financial
solutions that
maximise savings
potential and provides
protection to the
customers
January 2011
Established Takaful joint venture
with AIA
Strategic
Partnership
Our Objectives
March 2012
Formalized an 8-year arrangement
with AIA
March 2012
Launched Premier Income 5 (“PI5”)
Maximises savings potential
Provides protection to subscribers
Initiatives
The opportunities ahead
Innovative & high-value products for:
Protection
Savings / Investments
Medical / Health
Retirement
Highly experienced in multi-channel
distribution, including in-branch
sales, direct marketing, and tele
marketing, worksite marketing, cross-
referrals, brokers and mobile sales team
Strong product development capabilities
What Does AIA Provide?
Distribution channelsProduct Development

FY2013:
Business Focus
The FY2013 Business Plans will focus on…
To Build “Best Customer
Service Bank”
To Develop “Engaged
Employees with Right
Values”
Generate recurring revenue from existing & new business opportunities
Building infrastructure and the Alliance brand
Enhancing cost efficiency and productivity
Delivering excellent customer service and experience
Consumer Bkg
SME Bkg
Investment Bkg
Wholesale Bkg
Islamic Bkg
Financial Markets
Asset Mgt.
Strategic Action
Plans by Each
LOB
Our Aspirations
B
C
How?
To Build “Predictable &
Sustainable Financial
Performance”
A
Reinforcing the right values & rewarding performance
Who?
10

Enhance
Shareholder Value
Alliance
Bank
DIFFERENTIATION
ENABLERS
IMPROVED MARGINSCUSTOMER LOYALTY
& RETENTION
BUSINESS
LEADERSHIP
ENHANCE
SHAREHOLDER VALUE
BRANDINGPRODUCT
INNOVATION CHANNELS SERVICE
IT
INFRASTRUCTURE
PEOPLE
& TRAINING
Drive high productivity with effective cost management
11

12
Executive Summary
Financial Results for FY2012
Contents
2
1

13
Sustainable Interest income and margin
FY12 vs FY11
+ RM3.6 mil
+ 0.5%
FY11 vs FY10
+ RM84.8 mil
+ 14.5%
Q4FY12 vs Q4FY11
+RM3.8 mil
+ 2.4%
Q4FY11 vs Q4FY10
+RM4.3 mil
+ 2.8%
Interest income increased by RM3.6 mil (0.5%) y-o-y, and
RM4.6 mil (2.9%) q-o-q.
Net interest margin (“NIM”) contracted by 20 bps to 2.5%
in FY2012, due to rise in cost of funds – follow through
impact of OPR revision in 2010 and increase in SRR.
Net Interest Income
654.6
585.5
670.3 673.9
500.00
550.00
600.00
650.00
700.00
FY2009 FY2010 FY2011 FY2012
Net Interest Income TrendNet Interest Income
2.8%2.7% 2.7%
2.5%2.5%
1.9%
2.1%2.3%
1.5%
2.0%
2.5%
3.0%
3.5%
FY2009 FY2010 FY2011 FY2012
NIM and Cost of Funds Trend
NIM Cost of FundsRM mil

14
Non-Interest Income
Non Interest Income gaining momentum
235.0 233.2 225.7
320.2
22.4% 22.4%20.8%
26.8%
0.0%
5.0%
10.0%
15.0%
20.0%
25.0%
30.0%
150.0
200.0
250.0
300.0
350.0
400.0
FY2009 FY2010 FY2011 FY2012
Non-Interest Income TrendNon Interest Income NII/ Total Income
FY12 vs FY11
+ RM94.5m
+ 41.8%
FY11 vs FY10
- RM7.4m
-3.2%
Q4FY12 vs Q4FY11
+ RM36.2m
+ 69.4%
Q4FY11 vs Q4FY10
+ RM1.2m
+ 2.4%
Non-Interest Income growth of RM36.2 mil (69.4%) q-o-q
and RM 94.5 mil (41.8%) y-o-y.
The Non-Interest Income growth was mainly from an
increase in treasury trading activities, foreign exchange
gain, commission from sale of wealth management
products, and trade bills.
35.055.2
112.1
121.6
56.0
117.0
7.4
8.0
15.2
18.5
0
50
100
150
200
250
300
350
FY11 FY12
Commission Fee Income Investment Income
Forex Gain Other Income
FY2012 Growth
+108.9%
+8.5%
+57.7%
RM mil

Operating Expenses
15
Cost growth moderated to 8.6%. Increase mainly from
personnel expenses as we continue to invest in human
capital and IT infrastructure to support the business growth.
Cost-to-income (“CIR”) ratio declined further to 47.3%, from 48.3% a year ago
559.4554.6 544.9
591.8
53.0 52.148.3 47.3
0.0
10.0
20.0
30.0
40.0
50.0
60.0
100.0
200.0
300.0
400.0
500.0
600.0
700.0
800.0
FY2009 FY2010 FY2011 FY2012
Operating expenses trend
Operating expenses CIR
FY12 vs FY11
+ RM46.9 mil
+ 8.6%
FY11 vs FY10
- RM9.7 mil
-1.7%
Q4FY12 vs Q4FY11
+RM10.3 mil
+ 7.0%
Q4FY11 vs Q4FY10
RM7.6 mil
+ 5.5%
0 200 400 600 800
Admin &General
Expenses
Marketing Expenses
EstablishmentCosts
Personnel Costs
TotalOverheadExpenses
Operating expenses breakdown
FY12 FY11
+8.6%
+12.8%
+3.9%
+11.0%
-6.2%
RM mil
Impairment Provisions
RM mil
16
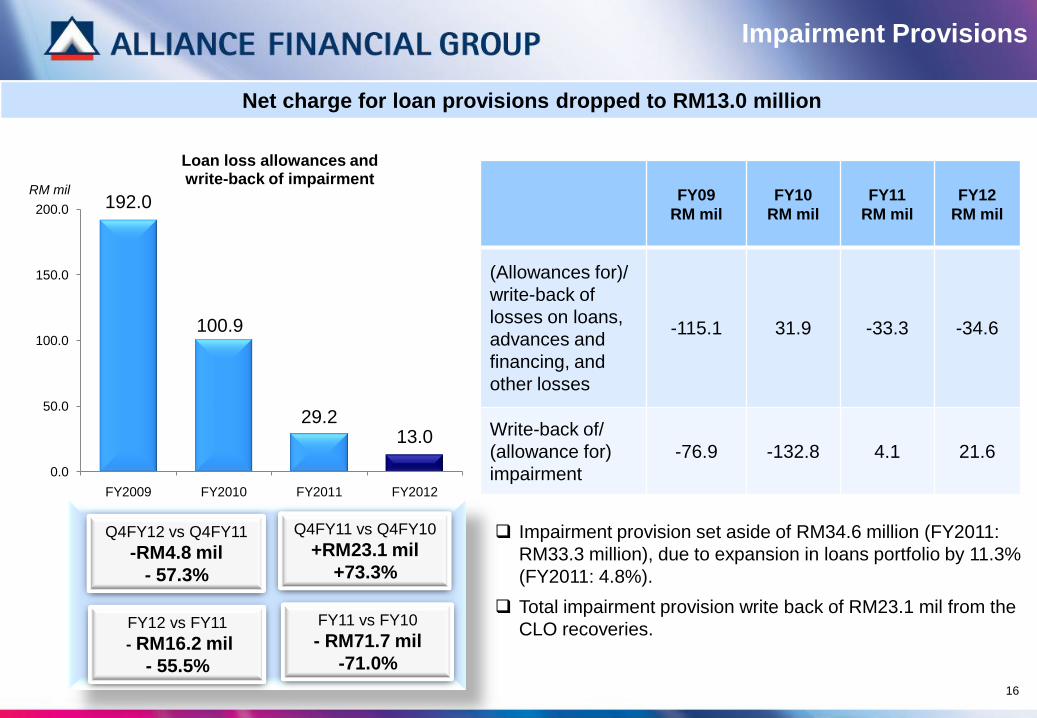
Net charge for loan provisions dropped to RM13.0 million
192.0
100.9
29.213.0
0.0
50.0
100.0
150.0
200.0
FY2009 FY2010 FY2011 FY2012
Loan loss allowances andwrite-back of impairment
FY12 vs FY11
- RM16.2 mil
- 55.5%
FY11 vs FY10
- RM71.7 mil
-71.0%
Q4FY12 vs Q4FY11
-RM4.8 mil
- 57.3%
Q4FY11 vs Q4FY10
+RM23.1 mil
+73.3%
FY09
RM mil
FY10
RM mil
FY11
RM mil
FY12
RM mil
(Allowances for)/
write-back of
losses on loans,
advances and
financing, and
other losses
-115.1 31.9 -33.3 -34.6
Write-back of/
(allowance for)
impairment
-76.9 -132.8 4.1 21.6
Impairment provision set aside of RM34.6 million (FY2011:
RM33.3 million), due to expansion in loans portfolio by 11.3%
(FY2011: 4.8%).
Total impairment provision write back of RM23.1 mil from the
CLO recoveries.

228.9
301.5
409.2
479.8
14.9
19.7
26.7
31.5
0
5
10
15
20
25
30
35
0
100
200
300
400
500
600
2009 2010 2011 2012
Net Profit After Tax
NPAT EPS
17.3% Y-o-Y growth over FY2011 to RM479.8 mil.
26.7% growth over 4th Quarter FY2011.
Earnings per share rose to 31.5 sen in FY2012, compared
with 26.7 sen, a year ago.
Net Profit After Taxation
17
FY2012: Net Profit After Taxation up 17.3%
FY12 vs FY11
+ RM70.6 mil
+ 17.3%
FY11 vs FY10
+ RM107.7 mil
+35.7%
Q4FY12 vs Q4FY11
+RM 22.7 mil
+ 26.7%
Q4FY11 vs Q4FY10
+ RM7.7 mil
+ 9.9%
Legal
EntitiesFY2012 FY2011
NPAT
RM mil
EPS
sen
NPAT
RM mil
EPS
sen
ABMB 484.3 81 415.4 70
AIS 72.6 24 56.1 19
AIBB 38.9 10.66 45.7 12.52
NPAT and EPS by entitiesRM mil

42.3% of Net Profits declared as Dividends – Payout Ratio on the rise
18
Enhance
Shareholder Value
8.6
10.5
13.013.6
6
8
10
12
14
FY2009 FY2010 FY2011 FY2012
Return on Equity (Net Profit After Tax)%
14.9
19.7
26.7
31.5
10
15
20
25
30
35
FY2009 FY2010 FY2011 FY2012
Earnings per share (sen)
41.9
32.5
26.2
42.3
10.00
15.00
20.00
25.00
30.00
35.00
40.00
45.00
FY2009 FY2010 FY2011 FY2012
%
Dividend payout ratio
11.3
14.3
17.6 18.3
6.0
8.0
10.0
12.0
14.0
16.0
18.0
20.0
FY2009 FY2010 FY2011 FY2012
Return on Equity (Pre-Tax Profit)%

398.6
107.3
108.9
19
Customer Deposits
25.623.6
28.3
32.1
0.0
5.0
10.0
15.0
20.0
25.0
30.0
35.0
FY2009 FY2010 FY2011 FY2012
Customer deposits TrendRM bil
Demand deposits28.5%
Saving deposits5.3%Fixed/
investment deposits 48.5%
Money market deposits12.7%
Negotiable instruments of
deposits,4.4%
Structured deposits
0.6%
Composition of customer depositsFY2012
13.4% Growth in Customer Deposits, with CASA ratio at 33.8%
Deposit growth of RM3.8 billion or 13.4%.
Fixed deposits at RM15.6 billion, accounted for 48.5%
of total deposits.
FY2012 growth
+ RM3.8 bil
+ 13.4%
FY2011 growth
+ RM4.7 bil
+ 19.9%

108.9
20
Liquidity remains strong, with CASA ratio at 33.7% , and Loan-to-deposit ratio at 77.8%
Loan to deposit ratio remained healthy at 77.8%
(FY2012).
Deposits growth momentum maintained with
growth at 13.4%
76.40%
90.6%
78.8%77.8%
65.00%
70.00%
75.00%
80.00%
85.00%
90.00%
95.00%
FY2009 FY2010 FY2011 FY2012
Loan-to-deposit ratio trend
FY2009 FY2010 FY2011 FY2012
14.1
12.2
14.615.6
33.0%
41.5%
34.0%
33.7%
0.0%
5.0%
10.0%
15.0%
20.0%
25.0%
30.0%
35.0%
40.0%
45.0%
0.0
5.0
10.0
15.0
20.0
25.0
30.0
35.0
40.0
45.0
FY2009 FY2010 FY2011 FY2012
CASA trend
NID FD DD SA CASA ratio
9.6
9.8
Demand deposits and saving deposit increased by 12.5%
to RM10.8 bil in FY2012.
Fixed deposits increased by 7.0%.
10.8
8.4
Liquidity
RM bil

398.6
107.3
108.9
21
19.621.4
22.4
25.0
0.0
4.0
8.0
12.0
16.0
20.0
24.0
28.0
FY2009 FY2010 FY2011 FY2012
Gross loans, Advances and Financing Trend
FY2012 growth
+ RM2.5 mil
+ 11.3%
FY2011 growth
+ RM1.0 mil
+ 4.8%
Gross Loans
Loans growth momentum has accelerated to 11.3%, highest growth rate in recent years
Gross loans, including Islamic financing, recorded a
healthy double-digit growth of 11.3% to RM25.0 bil.
Variable rate loan account for 89.0% of total gross
loans.
2.9 3.5 3.1 2.7
16.717.9 19.3
22.2
0.0
4.0
8.0
12.0
16.0
20.0
24.0
28.0
FY2009 FY2010 FY2011 FY2012
Gross loans composition
Fixed rate Variable rateRM bil
RM bil

398.6
107.3
108.9
22
Purchase of securities
1.8%
Purchase of transport vehicles
2.3%
Purchase of residential property39.0%
Purchase of non-
residential property13.4%
Purchase of other fixed
assets0.5%
Personal use8.6%
Credit card2.5%
Construction,1.0%
Working capital 25.3%
Others5.6%
FY2012
Diversified Loans Portfolio – 54% Consumer & 22% from SME
53.9%
21.9%
24.2%
FY2012
Consumer SME Wholesale
FY2011:
21.3%
FY2011:
23.6%
Housing loans account for 39.0% of total loans.
Housing loans expanded by RM1.1 billion or 12.4%.
11.3% growth in gross loans.
Consumer Banking accounts for 53.9% of total gross
loans.
Composition of loans by business segments Composition of loans by economic purposes
FY2011:
55.0%
12.4% y-o-y
17.9% y-o-y
3.5% y-o-y
Composition of Loans Portfolio
23
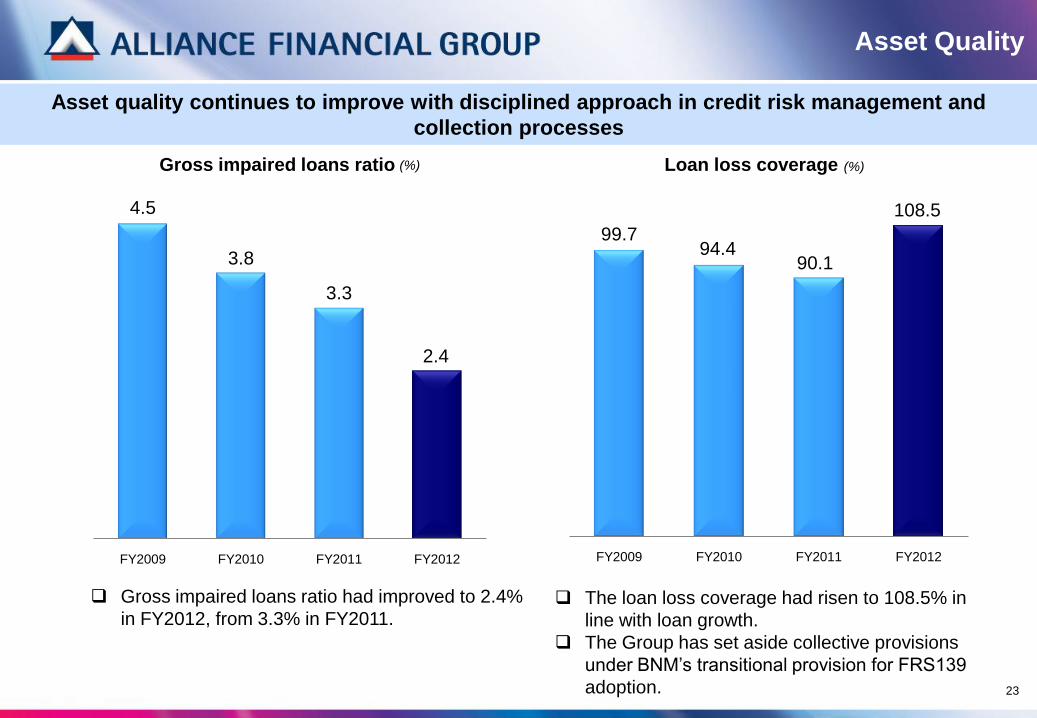
Asset quality continues to improve with disciplined approach in credit risk management and
collection processes
4.5
3.8
3.3
2.4
FY2009 FY2010 FY2011 FY2012
Gross impaired loans ratio
99.794.4
90.1
108.5
FY2009 FY2010 FY2011 FY2012
Loan loss coverage(%) (%)
Gross impaired loans ratio had improved to 2.4%
in FY2012, from 3.3% in FY2011. The loan loss coverage had risen to 108.5% in
line with loan growth.
The Group has set aside collective provisions
under BNM’s transitional provision for FRS139
adoption.
Asset Quality

10.30%
11.13%
11.95%11.52%
FY2009 FY2010 FY2011 FY2012
Core Capital Ratio
Group RWCR at 15.22% with Core Capital Ratio
at 11.52%.
RWCR ratios also in compliance with Basel III
requirements.
Presently, only RM597.8 mil of capital is from
Subordinated Bonds.
Legal
Entities
Core Capital RWCR
ABMB 13.32% 13.76%
AIS 11.52% 13.36%
AIBB 56.65% 57.13%
Capital Adequacy by Legal Entities
Capital
24
Capital ratios remained strong to meet Basel III requirements
14.65%
15.40%
16.09%
15.22%
FY2009 FY2010 FY2011 FY2012
Risk Weighted Capital Ratio
Alliance Financial Group
7th Floor, Menara Multi-Purpose
Capital Square
No. 8, Jalan Munshi Abdullah
50100 Kuala Lumpur, Malaysia
Tel: (6)03-2730 2300
www.alliancegroup.com.my/quarterlyresults.html
THANK YOU
Eric Lee
Group Chief Financial Officer
Contact: (6)03-2730 2388
Email: [email protected]
Disclaimer: This presentation has been prepared by Alliance Financial Group (the “Company”) for information purposes only and does not purport to contain all the
information that may be required to evaluate the Company or its financial position. No representation or warranty, expressed or implied, is given by or on behalf of the
Company as to the accuracy or completeness of the information or opinions contained in this presentation.
This presentation does not constitute or form part of an offer, solicitation or invitation of any offer, to buy or subscribe for any securities, nor should it or any part of it
form the basis of, or be relied in any connection with, any contract, investment decision or commitment whatsoever.
The Company does not accept any liability whatsoever for any loss howsoever arising from any use of this presentation or its contents or otherwise arising in
connection therewith.
For further information, please contact: Amarjeet Kaur
Group Corporate Strategy &
Development
Contact: (6)03-2034 4386
Email: [email protected]
25
Related Documents