Economic and competiveness gains from the adoption of best practices in intermodal maritime and road transport in the Americas The TIR system as an example of a best practice Kareen El Beyrouty Andrew Tessler A report prepared by for

Welcome message from author
This document is posted to help you gain knowledge. Please leave a comment to let me know what you think about it! Share it to your friends and learn new things together.
Transcript
Economic and competiveness gains from the adoption of best practices in
intermodal maritime and road transport in the Americas
The TIR system as an example of a best practice
Kareen El Beyrouty
Andrew Tessler
A report prepared by for
0
Contents
Executive Summary.................................................................................. 2
1 Introduction ..................................................................................... 5
2 Maritime and road transport systems in
international transport ............................................................................. 7
2.1 Growth in shipping and road transport ....................................................... 7
2.1.1 Maritime Transport ............................................................................. 7
2.1.2 Roads ............................................................................................... 10
2.2 Key maritime developments ..................................................................... 15
2.3 Key road transport developments ............................................................ 18
3 Maritime and road transport systems
and intermodal transport ....................................................................... 24
3.1 Intermodal transport ................................................................................. 24
3.1.1 Intermodal linkages .......................................................................... 24
3.2 Potential for improvements in trade
facilitation ........................................................................................................... 26
3.3 Potential for improvement in customs
procedures – the example of TIR ...................................................................... 32
3.3.1 The TIR system ................................................................................ 32
3.3.2 Quantification of potential for
trade facilitation in LAC – TIR example ........................................................ 34
4 Adoption of TIR system ................................................................ 38
4.1 Potential challenges to TIR
implementation for LAC countries ..................................................................... 38
5 References ..................................................................................... 43
Maritime and Road Transport in the Americas October 2014
1
Disclaimer and copyright
Unless otherwise indicated, the materials published herein (the “Published
Materials"), including opinions expressed therein, are the responsibility of the
individual authors/compilers and not those of the Organization of American
States (“OAS”), the General Secretariat of the OAS (“GS/OAS”), and the OAS
Member States.
As the holder of copyright in the Published Materials, the GS/OAS hereby grants
to users (“Licensees”) a non-exclusive, limited license to download the
Published Materials for non-commercial use and distribution. This license is
subject to the condition that Licensees give full copyright credit to the GS/OAS
and include the following: “Reproduced with permission of the General
Secretariat of the Organization of American States.”
Maritime and Road Transport in the Americas October 2014
2
Executive Summary
Both road and maritime transport modes have grown substantially in recent
years, a likely product of globalization and the rapid development of emerging
markets. Over 80 percent of goods marketed worldwide are transported by sea.1
More than 99 percent of trade by weight (except for bulks) is carried via ocean
cargo, with a nine-fold surge in tonnages traded since 1960.2 Furthermore,
developing countries are making up an ever larger share of the seaborne trade,
responsible for 60 percent of world goods loaded and 58 percent unloaded.3 The
world’s road network comprises over 40 million paved lane km. In the period
2000-2009, the global road network length increased by approximately 12 million
lane-km with China and India accounting for more than 50 percent of paved
lane-km additions during that time. Paved roadway length in Latin America also
recorded substantial growth over that time. Within South America specifically,
trucks account for some 35 percent of intra-regional trade by volume (with
maritime transport some 61 percent) and 42 percent of trade by value (maritime
46 percent). Latin American and Caribbean (LAC) countries accounted for some
15.3 million trucks and vans in 2006 – roughly 8 percent of the global fleet total
of 196.5 million in that year.
Some key maritime developments in recent years include containerization, the
increasing capacity of ports and shipping vessels, and improvements in port
logistics. Containerized trade, one of the most profitable activities for ports, has
been the fastest growing segment of the shipping market, making up more than
16 percent of the global shipping trade by volume in 2012 and more than 50
percent of the trade by value.4 Container traffic in Latin America has more than
doubled in the past ten years, from 17 million twenty-foot equivalent units
(TEUs) in 2000 to 40 million TEUs in 2010, with an average annual growth rate
of 10 percent.5 A second key maritime development, related to the increase in
containerization, is the expansion in capacity of ports and shipping vessels to
take advantage of the economies of scale offered by larger vessels and to keep
up with the increasingly larger volumes of goods traded. The average size of
container ships has grown 80 percent since 2005.6 A third key maritime issue is
port logistics, which includes tracking goods and relieving port congestion. The
1Sida, K. (2009) Trade Facilitation and Maritime Transport: The Development Agenda. National
Board of Trade, and Swedish Maritime Administration
2 Hummels, D. (2006) Global Trends in Trade and Transportation: Benefiting from Globalization:
Transport sector contribution and policy challenges. Berlin: 17th International Symposium on
Transport Economics and Policy.
3 United Nations Conference on Trade and Development (UNCTAD) (2013) ‘Review of Maritime
Transport’
4 ibid
5 Sarriera, M. (2013) Benchmarking Container Port Technical Efficiency in Latin America and the
Caribbean. IDB Working Paper Series No. IDB-WP-474.
6 UNCTAD (2013) ‘Review of Maritime Transport’
Maritime and Road Transport in the Americas October 2014
3
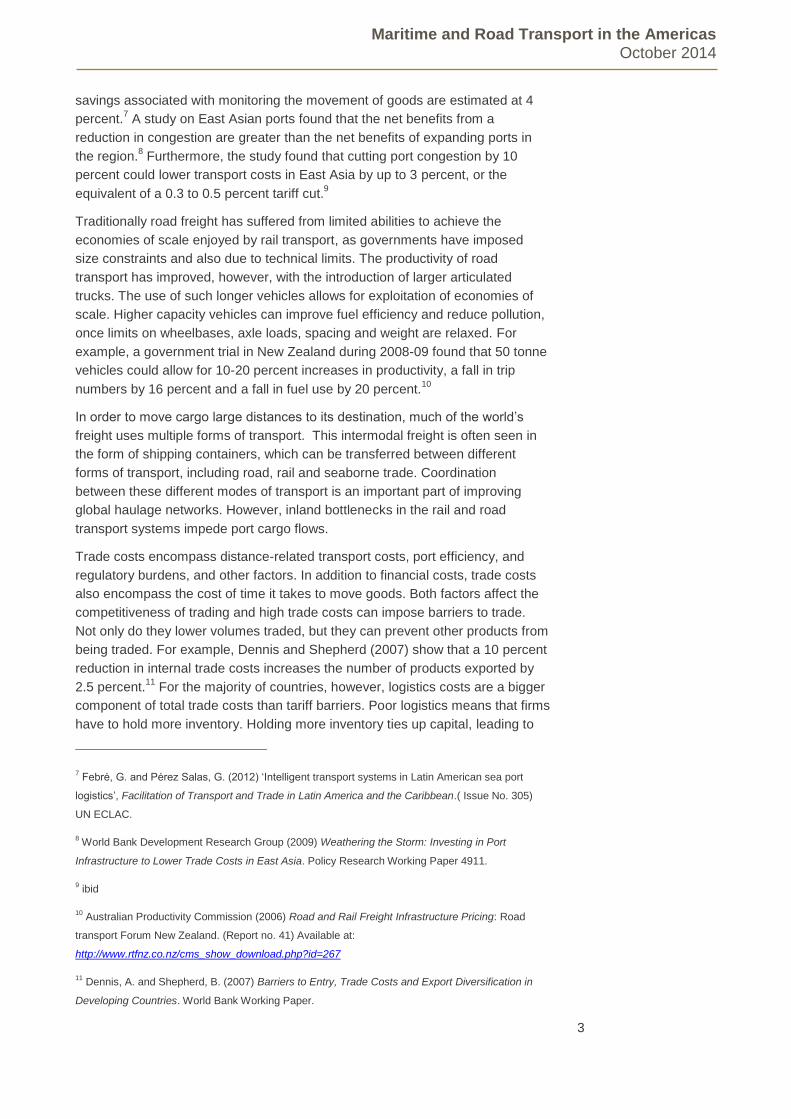
savings associated with monitoring the movement of goods are estimated at 4
percent.7 A study on East Asian ports found that the net benefits from a
reduction in congestion are greater than the net benefits of expanding ports in
the region.8 Furthermore, the study found that cutting port congestion by 10
percent could lower transport costs in East Asia by up to 3 percent, or the
equivalent of a 0.3 to 0.5 percent tariff cut.9
Traditionally road freight has suffered from limited abilities to achieve the
economies of scale enjoyed by rail transport, as governments have imposed
size constraints and also due to technical limits. The productivity of road
transport has improved, however, with the introduction of larger articulated
trucks. The use of such longer vehicles allows for exploitation of economies of
scale. Higher capacity vehicles can improve fuel efficiency and reduce pollution,
once limits on wheelbases, axle loads, spacing and weight are relaxed. For
example, a government trial in New Zealand during 2008-09 found that 50 tonne
vehicles could allow for 10-20 percent increases in productivity, a fall in trip
numbers by 16 percent and a fall in fuel use by 20 percent.10
In order to move cargo large distances to its destination, much of the world’s
freight uses multiple forms of transport. This intermodal freight is often seen in
the form of shipping containers, which can be transferred between different
forms of transport, including road, rail and seaborne trade. Coordination
between these different modes of transport is an important part of improving
global haulage networks. However, inland bottlenecks in the rail and road
transport systems impede port cargo flows.
Trade costs encompass distance-related transport costs, port efficiency, and
regulatory burdens, and other factors. In addition to financial costs, trade costs
also encompass the cost of time it takes to move goods. Both factors affect the
competitiveness of trading and high trade costs can impose barriers to trade.
Not only do they lower volumes traded, but they can prevent other products from
being traded. For example, Dennis and Shepherd (2007) show that a 10 percent
reduction in internal trade costs increases the number of products exported by
2.5 percent.11
For the majority of countries, however, logistics costs are a bigger
component of total trade costs than tariff barriers. Poor logistics means that firms
have to hold more inventory. Holding more inventory ties up capital, leading to
7 Febré, G. and Pérez Salas, G. (2012) ‘Intelligent transport systems in Latin American sea port
logistics’, Facilitation of Transport and Trade in Latin America and the Caribbean.( Issue No. 305)
UN ECLAC.
8 World Bank Development Research Group (2009) Weathering the Storm: Investing in Port
Infrastructure to Lower Trade Costs in East Asia. Policy Research Working Paper 4911.
9 ibid
10 Australian Productivity Commission (2006) Road and Rail Freight Infrastructure Pricing: Road
transport Forum New Zealand. (Report no. 41) Available at:
http://www.rtfnz.co.nz/cms_show_download.php?id=267
11 Dennis, A. and Shepherd, B. (2007) Barriers to Entry, Trade Costs and Export Diversification in
Developing Countries. World Bank Working Paper.
Maritime and Road Transport in the Americas October 2014
4
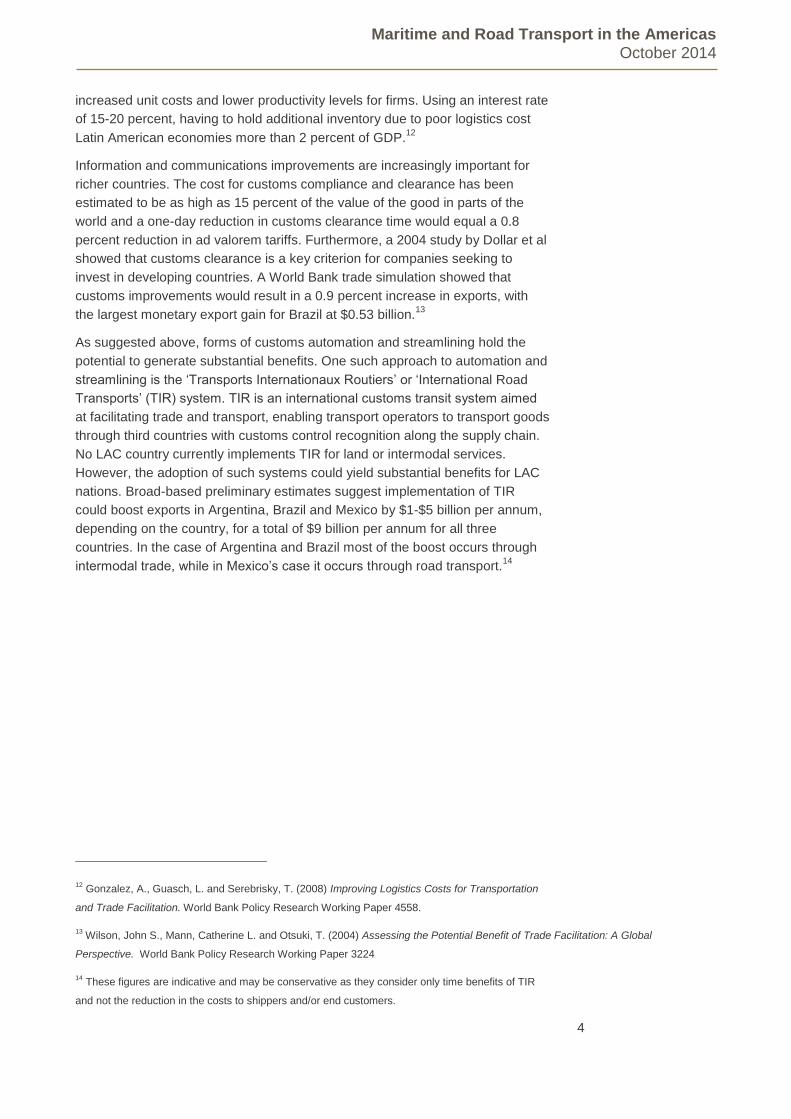
increased unit costs and lower productivity levels for firms. Using an interest rate
of 15-20 percent, having to hold additional inventory due to poor logistics cost
Latin American economies more than 2 percent of GDP.12
Information and communications improvements are increasingly important for
richer countries. The cost for customs compliance and clearance has been
estimated to be as high as 15 percent of the value of the good in parts of the
world and a one-day reduction in customs clearance time would equal a 0.8
percent reduction in ad valorem tariffs. Furthermore, a 2004 study by Dollar et al
showed that customs clearance is a key criterion for companies seeking to
invest in developing countries. A World Bank trade simulation showed that
customs improvements would result in a 0.9 percent increase in exports, with
the largest monetary export gain for Brazil at $0.53 billion.13
As suggested above, forms of customs automation and streamlining hold the
potential to generate substantial benefits. One such approach to automation and
streamlining is the ‘Transports Internationaux Routiers’ or ‘International Road
Transports’ (TIR) system. TIR is an international customs transit system aimed
at facilitating trade and transport, enabling transport operators to transport goods
through third countries with customs control recognition along the supply chain.
No LAC country currently implements TIR for land or intermodal services.
However, the adoption of such systems could yield substantial benefits for LAC
nations. Broad-based preliminary estimates suggest implementation of TIR
could boost exports in Argentina, Brazil and Mexico by $1-$5 billion per annum,
depending on the country, for a total of $9 billion per annum for all three
countries. In the case of Argentina and Brazil most of the boost occurs through
intermodal trade, while in Mexico’s case it occurs through road transport.14
12 Gonzalez, A., Guasch, L. and Serebrisky, T. (2008) Improving Logistics Costs for Transportation
and Trade Facilitation. World Bank Policy Research Working Paper 4558.
13 Wilson, John S., Mann, Catherine L. and Otsuki, T. (2004) Assessing the Potential Benefit of Trade Facilitation: A Global
Perspective. World Bank Policy Research Working Paper 3224
14 These figures are indicative and may be conservative as they consider only time benefits of TIR
and not the reduction in the costs to shippers and/or end customers.
Maritime and Road Transport in the Americas October 2014
5
1 Introduction
The General Secretariat of the Organization of American States (OAS), which
serves as the secretariat for the Inter-American Committee on Ports (CIP/OAS)
and the International Road Transport Union (IRU) have commissioned Oxford
Economics to carry out a study of the economic and competiveness gains from
the development of best practices in intermodal, maritime and road transport in
the Americas, with the Transports Internationaux Routiers (TIR) system as an
example of a best practice.
The Organization of American States is the world’s oldest regional organization,
dating back to the First International Conference of American States, held in
Washington, D.C., from October 1889 to April 1890. Today, the OAS brings
together the 35 independent states of the Americas and constitutes the main
political, juridical, and social governmental forum in the Hemisphere. In addition,
it has granted permanent observer status to 69 states, as well as to the
European Union (EU). The Organization uses a four-pronged approach to
effectively implement its essential purposes, based on its main pillars:
democracy, human rights, security, and development.
The inter-American Committee on Ports (CIP) is the permanent Inter-American
forum and advisory body of the OAS member states that promotes hemispheric
development and cooperation at the highest government level in the port sector,
with the active participation and collaboration of the private sector.
The CIP has the following six thematic priorities, each with a Technical Advisory
Group (TAGs), to support the needs for development of its members on port
issues:
Logistics, Innovation and Competitiveness
Sustainable Port Management and Environmental Protection
Port Protection and Safety
Public Policy, Legislation and Regulation
Tourism, Inland Ports and Waterways, Ship Services and
Navigation Safety
Corporate Social Responsibility and Women in Ports
Founded in Geneva in 1948, the International Road Transport Union (IRU) is the
world road transport organization, which upholds the interests of bus, coach, taxi
and truck operators to ensure economic growth and prosperity via the
sustainable mobility of people and goods by road worldwide. A global industry
federation of national Member Associations and Associate Members in 75
countries on the 5 continents, the IRU today represents the interests of bus,
coach, taxi and truck operators worldwide, from large fleets to individual owner-
operators.
The IRU manages the TIR System under the mandate of the United Nations.
The TIR “Transports Internationaux Routiers”, meaning International Road
Maritime and Road Transport in the Americas October 2014
6
Transport System, was created shortly after World War II to facilitate trade and
transport while implementing an international harmonized system of customs
control that effectively protects the revenue of each country through which goods
are carried. The TIR convention has provided for intermodal transport operations
since 1975. While some countries in the Western Hemisphere (Canada, Chile,
the United States, and Uruguay) are contracting parties to, or have expressed
interest in joining the TIR Convention, the TIR system has not yet been
implemented in the hemisphere.
The study consists of three sections:
An overview of maritime and road transport systems in
international transport, with key developments in both;
A review of maritime and road transport systems along with
intermodal transport, with focus on trade facilitation and the
potential for improvements in trade systems in Argentina,
Brazil and Mexico with implementation of the TIR system; and
A discussion of potential and actual challenges in the adoption
of the TIR system.
Maritime and Road Transport in the Americas October 2014
7
2 Maritime and road transport systems in international transport
2.1 Growth in shipping and road transport
2.1.1 Maritime Transport
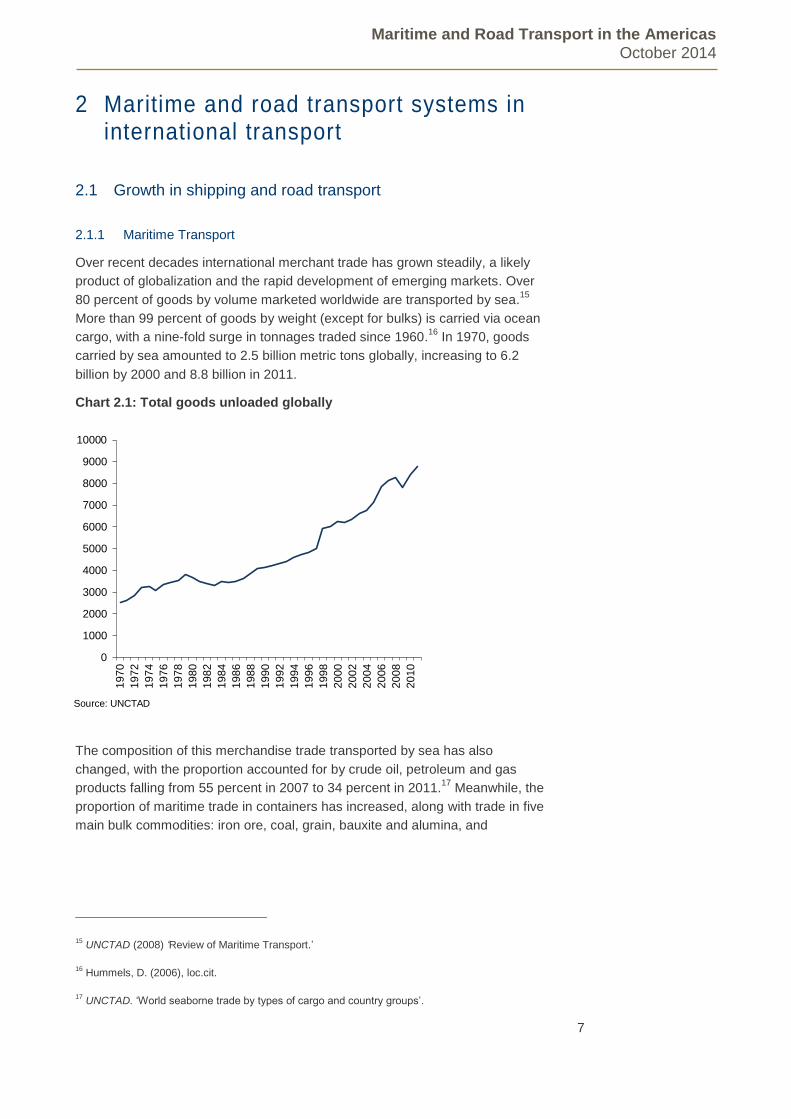
Over recent decades international merchant trade has grown steadily, a likely
product of globalization and the rapid development of emerging markets. Over
80 percent of goods by volume marketed worldwide are transported by sea.15
More than 99 percent of goods by weight (except for bulks) is carried via ocean
cargo, with a nine-fold surge in tonnages traded since 1960.16
In 1970, goods
carried by sea amounted to 2.5 billion metric tons globally, increasing to 6.2
billion by 2000 and 8.8 billion in 2011.
Chart 2.1: Total goods unloaded globally
The composition of this merchandise trade transported by sea has also
changed, with the proportion accounted for by crude oil, petroleum and gas
products falling from 55 percent in 2007 to 34 percent in 2011.17
Meanwhile, the
proportion of maritime trade in containers has increased, along with trade in five
main bulk commodities: iron ore, coal, grain, bauxite and alumina, and
15 UNCTAD (2008) ‘Review of Maritime Transport.’
16 Hummels, D. (2006), loc.cit.
17 UNCTAD. ‘World seaborne trade by types of cargo and country groups’.
0
1000
2000
3000
4000
5000
6000
7000
8000
9000
10000
19
70
19
72
19
74
19
76
19
78
19
80
19
82
19
84
19
86
19
88
19
90
19
92
19
94
19
96
19
98
20
00
20
02
20
04
20
06
20
08
20
10
Source: UNCTAD
Maritime and Road Transport in the Americas October 2014
8
phosphate rock.18
Containerized cargo is mainly composed of manufactured
goods and high-value bulk commodities such as time and temperature-sensitive
agricultural products.19
The recession saw shipping fall slightly in 2009, however it continued to grow
throughout 2010 and 2011. More and more, developing countries are making up
a larger share of seaborne trade, responsible for 60 percent of world goods
loaded and 58 percent unloaded20
with developing countries in Asia responsible
for 47 percent of world goods unloaded in 2011.21
Since 2006, seaborne
merchandise trade to and from developing economies in the Americas have
risen more strongly, with export and import volumes rising by 22 percent and 32
percent respectively, compared to an 18 percent increase for both exports and
imports in developed economies.22
The value of seaborne trade with major Latin American economies has also
grown over recent years. For the Latin America and Caribbean (LAC) region in
2011, merchandise exports and imports reached US$886 and US$874 billion
respectively, and 81 percent of these goods were transported via seaports.23
However, this has happened at a time of volatile growth due to the financial
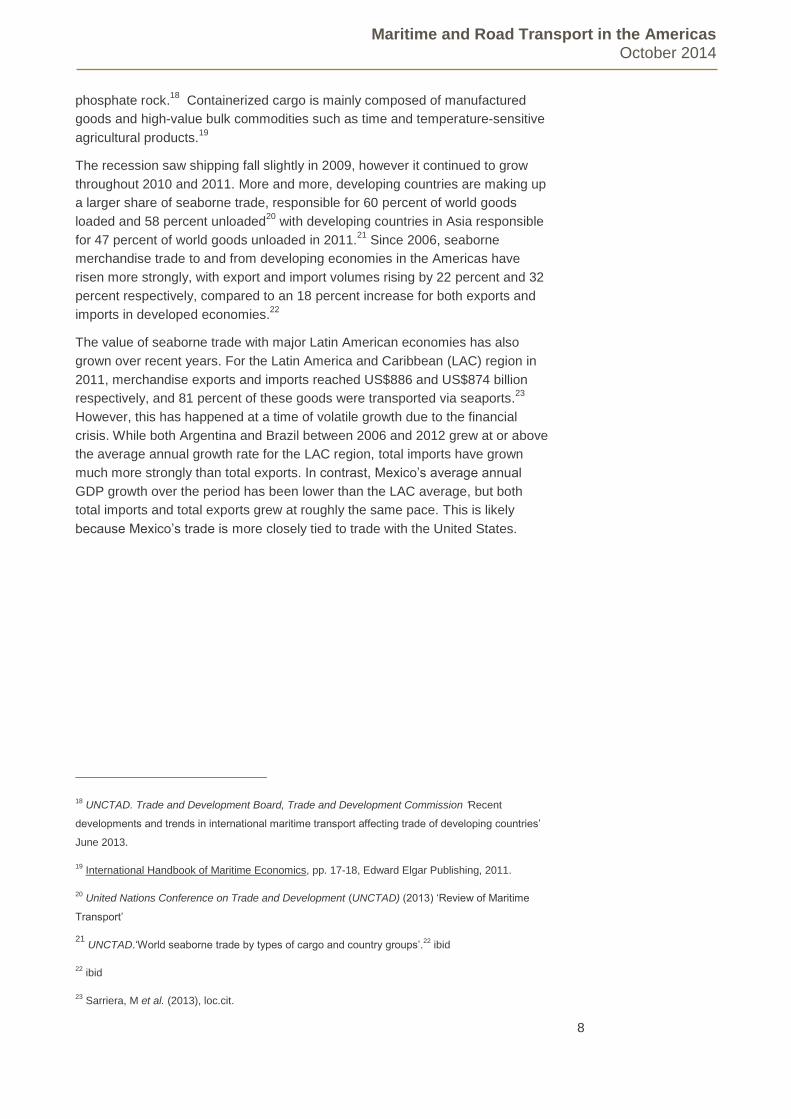
crisis. While both Argentina and Brazil between 2006 and 2012 grew at or above
the average annual growth rate for the LAC region, total imports have grown
much more strongly than total exports. In contrast, Mexico’s average annual
GDP growth over the period has been lower than the LAC average, but both
total imports and total exports grew at roughly the same pace. This is likely
because Mexico’s trade is more closely tied to trade with the United States.
18 UNCTAD. Trade and Development Board, Trade and Development Commission ‘Recent
developments and trends in international maritime transport affecting trade of developing countries’
June 2013.
19 International Handbook of Maritime Economics, pp. 17-18, Edward Elgar Publishing, 2011.
20 United Nations Conference on Trade and Development (UNCTAD) (2013) ‘Review of Maritime
Transport’
21 UNCTAD.‘World seaborne trade by types of cargo and country groups’.
22 ibid
22 ibid
23 Sarriera, M et al. (2013), loc.cit.
Maritime and Road Transport in the Americas October 2014
9
Table 2.1: 2006-2012 per annum GDP, Total Import and Total Export
Growth for LAC, Argentina, Brazil and Mexico
Source: Oxford Economics.
With respect to modal shares for the shipment of goods, the mode of
transportation used is affected by geography and the product. If the cost of
transportation is a substantial portion of the final price, cost considerations drive
the decisions behind mode of transport. On the other hand, if the cost of
transportation is a small fraction of the final delivered price, other factors such as
timeliness and reliability will drive the choice of mode of transport.
In Latin America, trade with land neighbors makes up roughly 10-20 percent of
total trade.25
In South America, much of the volume of goods traded is for trade
external to the region. Between 2000 and 2010, the volumes of intra-regional
transport rose by less than 7 percent, while it rose more than 5 times for
volumes of extra-regional transport.26
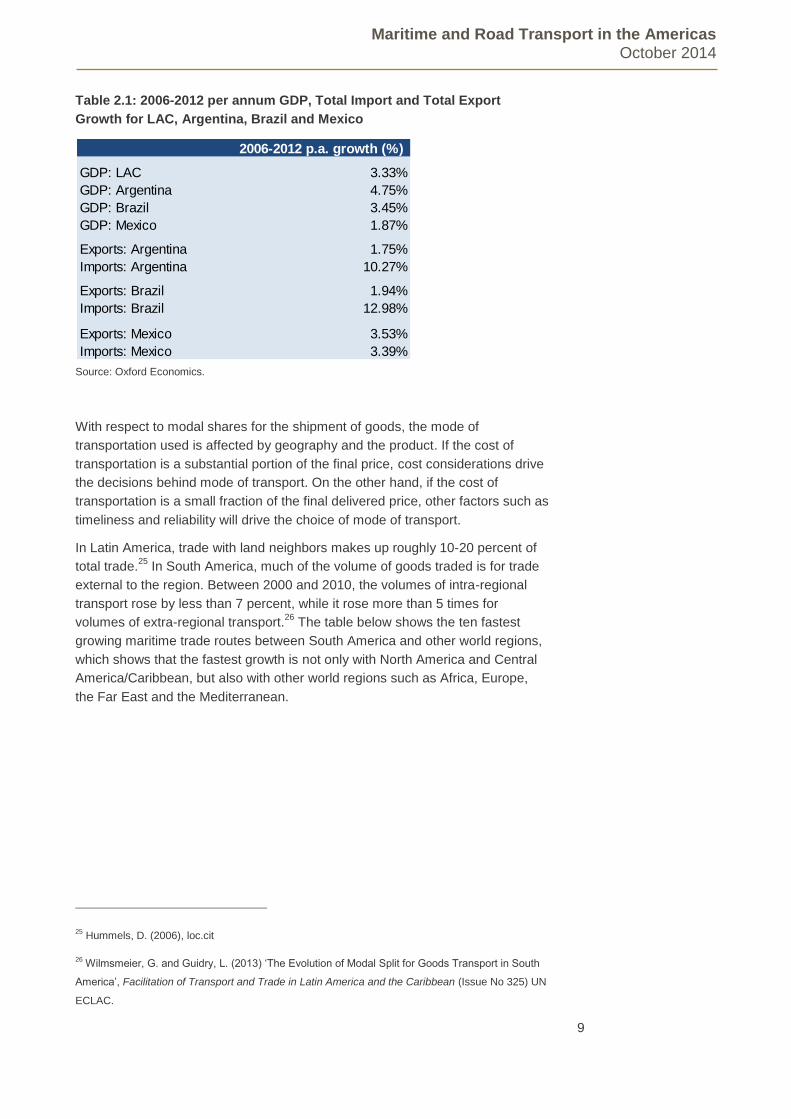
The table below shows the ten fastest
growing maritime trade routes between South America and other world regions,
which shows that the fastest growth is not only with North America and Central
America/Caribbean, but also with other world regions such as Africa, Europe,
the Far East and the Mediterranean.
25 Hummels, D. (2006), loc.cit
26 Wilmsmeier, G. and Guidry, L. (2013) ‘The Evolution of Modal Split for Goods Transport in South
America’, Facilitation of Transport and Trade in Latin America and the Caribbean (Issue No 325) UN
ECLAC.
2006-2012 p.a. growth (%)
GDP: LAC 3.33%
GDP: Argentina 4.75%
GDP: Brazil 3.45%
GDP: Mexico 1.87%
Exports: Argentina 1.75%
Imports: Argentina 10.27%
Exports: Brazil 1.94%
Imports: Brazil 12.98%
Exports: Mexico 3.53%
Imports: Mexico 3.39%
Maritime and Road Transport in the Americas October 2014
10
Table 2.2: Routes with fastest growing supply of TEU capacity between
South America and the World
Source: CEPALStat.
This tendency has implications for modes of transport used and will be
discussed further in the following sections.
2.1.2 Roads
The history of roads – and of road freight – is as old as the history of settled
civilization. Once societies began to develop an agricultural surplus and unified
states, roads became important for both military and commercial reasons.
Particularly notable examples include the Persian Empire’s Royal Road and the
Inca Road network, the latter extending some 40,000 kilometers.27
Despite their necessity, ancient civilizations - particularly in Europe and China -
often found sea or river transport more efficient than that of roads, a feature of
life which persisted until the industrial revolution.28
A combination of developments – the increasing use of coal, the harnessing of
steam power and the development of reliable rails and the consequent
exploitation of the traction power of “wheel on steel” – resulted in the explosion
of railway construction across the world during the 19th century, with roads being
relegated to a supporting role in many respects. However a century later another
series of developments – the internal combustion engine, pneumatic tyres, mass
production and tarmac – all conspired to return roads to their dominant position
in land transport and indeed ate into intra-national shipping in many cases.
Apart from the popularity of personal transport, roads offer a number of
advantages for the movement of freight. While rail and sea transport retain some
advantages for the movement of large amounts of goods over long distances,
and for bulk transport, road transport offers flexibility and efficiency over shorter
ones. Moreover, rail has always suffered one traditional disadvantage - goods
transported by rail still require the use of roads to move goods from rail depots to
27 Carballo, Volpe Martincus and Cusolito, A. (2013) "Routes, exports and employment in developing
countries: Following the trace of the Inca Roads", Inter-American Development Bank, mimeo.
28 A good illustration of the advantage of sea as a transport mode in ancient Europe is found at
Stanford University’s Orbis Geospatial Mapping website which charts the length of time taken to
transport goods by sea or land in Roman times – see http://orbis.stanford.edu/
Rank Route Index Supply Growth TEU Capacity Jun 2011 (Sept 2002=100)
1 West Africa - East coast South America 787.6
2 East coast North America - north coast South America 784.8
3 Europe - north coast South America 643
4 South Africa - East coast South America 502.4
5 Caribbean/Central America - East coast South America 399.1
6 Far East - East coast South America 366.6
7 Europe - west coast South America 362.4
8 Caribbean/Central America - North coast South America 355.2
9 Mediterranean - East coast South America 311.3
10 Caribbean/Central America - West coast South America 290.9
Maritime and Road Transport in the Americas October 2014
11
their final destination. In the 19th century this was an inconvenience but in the
20th many shippers elected not to bother with intermodal transfers at all but used
roads for the entirety of the trip, helping to hasten rail’s relative decline.
Like rail and sea transport, roads also benefited from the development of
containerization, with trucks increasingly being designed around container
dimensions and interfaces with rail and port facilities being improved to allow for
easier loading and unloading of containers.
Moreover the development of road networks themselves has been an important
facilitator in increasing the efficiency of road transport. The United States’
Interstate Highway Network, Germany’s Autobahns, and the gradual
development of broader European motorway systems, among others, all
represented examples of 20th century engineering which acted to further
facilitate the use of road transport, helping to establish the predominance of
trucks as a mode of land transport. In some cases, the development of such
major highways has allowed road freight to mimic some of the efficiencies of the
rail network – as exemplified by Europe’s experiments with European Modular
Systems (EMS) and Australia’s B-doubles, B-triples and road trains.
The late 20th century and the early years of the 21
st have seen emerging
markets mimic past trends within the developed world. The advantages of road
transport have been enhanced in recent years by the development of the global
road transport network, particularly in China and India. The world’s road network
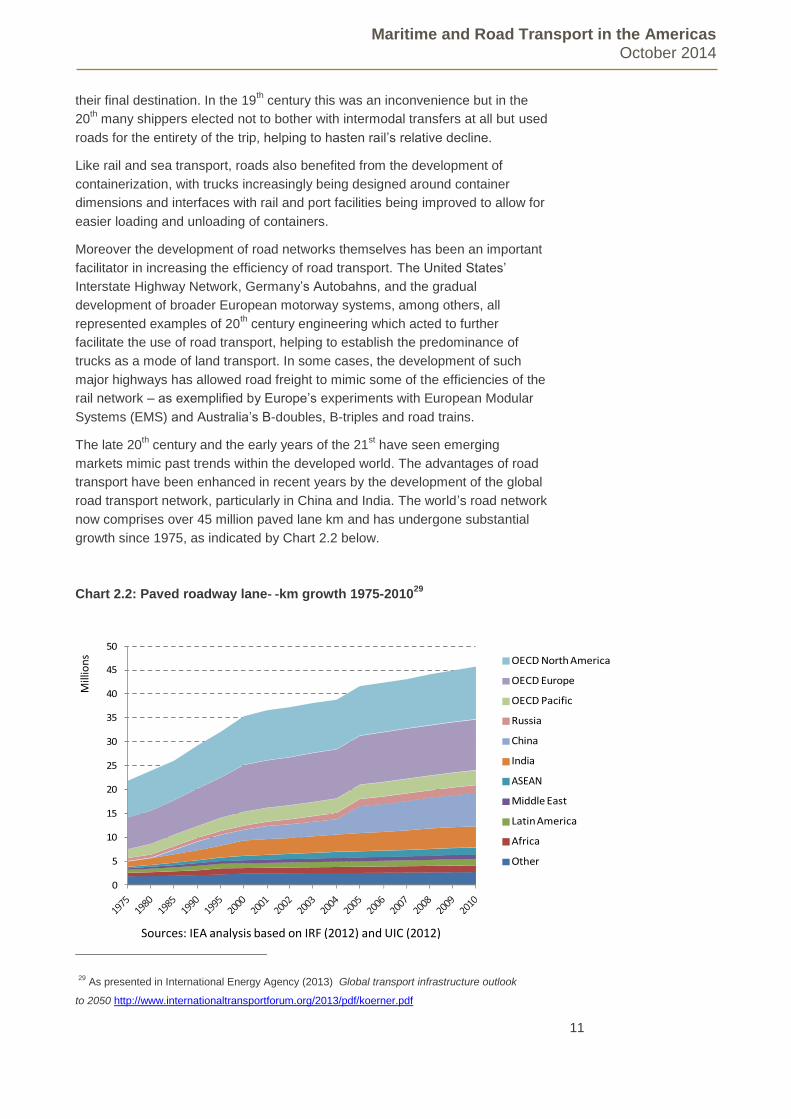
now comprises over 45 million paved lane km and has undergone substantial
growth since 1975, as indicated by Chart 2.2 below.
Chart 2.2: Paved roadway lane‐ ‐km growth 1975-201029
29
As presented in International Energy Agency (2013) Global transport infrastructure outlook
to 2050 http://www.internationaltransportforum.org/2013/pdf/koerner.pdf
ASEAN
Sources: IEA analysis based on IRF (2012) and UIC (2012)
Mill
ion
s
Maritime and Road Transport in the Americas October 2014
12
More specifically, in the period 2000-2009, global road network length increased
by approximately 12 million lane-km (of which nearly 11 million lane-km was
paved) with China and India accounting for more than 50 percent of paved lane-
km additions during that time. Paved roadway length in Latin America also
recorded growth in that period. Overall the proportion of paved lane-km rose
from 53 percent of total global road lane-km in 2000 to nearly 60 percent by
2010. These developments have further boosted the salience of road freight,
particularly given that global rail track length decreased by some 66,000
kilometers over the same period.30
The growth of global road transport infrastructure has allowed road freight to
further strengthen its comparative advantage. The World Bank estimates that in
low and middle-income countries over 70 percent of freight is now moved by
trucks.31
Globally, calculations by the World Trade Organization (WTO) suggested that in
2007 road freight transport’s global share of inland freight transport (measured in
tonne kilometers) was 36 percent, with rail freight transport at 43 percent,
pipelines at 16 percent and inland waterways at 5 percent.32
Between 1990 and 2007, the volume of freight (measured in tonne kilometers)
transported by road in the 54 OECD International Transport Forum (ITF)
member countries33
nearly tripled. This outstripped the growth in volume of rail
freight, which doubled over that period. The WTO suggests that the relative
increase in the use of road freight reflects increasing complexity of production
methods (with several plants involved in the manufacture of a single product)
and the spread of "just-in-time" production, which has resulted in increasing
demand for door-to-door services, smaller and more frequent freight deliveries
and shorter delivery time windows. These issues are further examined below.34
The WTO also points to trucking’s dominant role in many land transport tasks,
especially shorter haul ones. In particular, it indicates that in the EU-27 about
two-thirds of national freight (measured in tonnes moved) travelled less than 50
30 International Energy Agency (2013) Global Land Transport Infrastructure Requirements:
Estimating road and railway infrastructure capacity and costs to 2050.
31 See http://www.ppiaf.org/freighttoolkit/knowledge-map/road. In addition, note Barbero J.
(2010) Freight Logistics in Latin America and the Caribbean: An Agenda to Improve
Performance. Inter-American Development Bank (Technical Note No. IDB-TN-103). Barbero
cites 2007 work by Hine indicating that in developing countries trucks account for 70 percent of
domestic freight task by volume and 80 percent by value.
32 World Trade Organization (WTO) (2010) Road Freight Transport Services Background Note by
the Secretariat S/C/W/324. These calculations were based on data provided by the 51
International Transport Forum (ITF) members in 2007
33 In the Americas, members are Canada, Chile, Mexico and the United States.
34 WTO (2010), loc.cit.
Maritime and Road Transport in the Americas October 2014
13
kilometers in 2007. Surface transport also dominates trade between neighbors.
The WTO notes Fernandez (2008) calculations that 90 percent of the US-
Mexican freight is transported by truck. In addition, road freight dominates
domestic trading as well. For example, road freight transport accounted for 95
percent of the share of US domestic freight transport (measured by value) in
2008.35
Recent work has also begun to pinpoint the precise difference that road
improvements and the related freight transport benefits in particular can make,
some examples of which are discussed below.
Kerem Cosar and Demir (2014) examine Turkey’s major investments in
expressways in the 2000’s, finding that road infrastructure development
accounts for 15 percent of the increase in exports from the interior, with effects
being particularly large for time sensitive/transport intensive industries.36
In Latin America, Volpe Martincus and Blyde (2013) use Chile’s 2010
earthquake, which forced major re-routings of road freight transport, as a
“natural experiment” to determine the impacts of the nation’s road infrastructure.
They find that in the short run (February 2010-February 2011) Chile’s total
industrial exports would have been 6.3 percent larger in the absence of those
domestic road infrastructure re-routings.37
Carballo, Volpe Martincus and Cusolito (2013) examined the impact of the
recent major expansion of the Peruvian road network between 2003 and 2010
on exports. They used the ancient Inca road network as an “instrumental
variable” to control for the fact that exports may also have boosted infrastructure.
They find that Peruvian exports would have been 20 percent smaller in 2010
without the road development program.38
LAC countries also experienced many of the broad international trends
described above, with the 19th century rail boom giving way to the ascendency
of road transport. The increasing importance of trade to LAC countries (and
particularly of exports for countries such as Argentina, Brazil, and Mexico),
associated with globalization has only served to place more emphasis on the
importance of roads as the dominant form of land transport and on the need for
efficient intermodal facilities at ports in particular.
Within South America specifically, trucks transport some 35 percent of intra-
regional merchandise trade by volume (with maritime 61 percent) and 42
35 ibid
36 Kerem Cosar A., Demir B., “Domestic Road Infrastructure and International Trade: Evidence from
Turkey”, University of Chicago Booth School of Business. Available at:
http://faculty.chicagobooth.edu/kerem.cosar/research/cd_roadsandtrade_2014.pdf
37 Volpe Martincus C, Blyde, J (2013) “Shaky roads and trembling exports: Assessing the trade
effects of domestic infrastructure using a natural experiment” Journal of International Economics 90
(2013) 148–161
38Carballo, Volpe Martincus and Cusolito, A. (2013) New roads to export: Insights from the Inca
roads. Available at: http://www.voxeu.org/article/new-roads-export-insights-inca-roads
Maritime and Road Transport in the Americas October 2014
14
percent of such trade by value (maritime 46 percent). There have been some
indications that there has been a modal shift in the volume of intraregional trade
from seaborne to truck transport for countries such as Brazil and Argentina.39
LAC countries tend to have less dense road networks than is true of the world as
a whole. Whereas the world average is 241 km of road network for every 1,000
km2, the equivalent LAC figure is 156 km. However, while road density is often
linked to levels of economic development, this is not always a straightforward
relationship with countries such as Canada having similar network density to
LAC countries. LAC countries hold up well when compared to road network
coverage per capita (5.7 km for every 1,000 inhabitants, vs the global average of
4.8. km per 1,000), though highly developed countries have values of around 15
per 1,000 people.40
However, length is only one dimension of road network measurement. In
particular, while nearly 60 percent of the world’s roads are paved (and nearly
100 percent in many developed countries), in LAC countries the equivalent
figure is 16 percent, suggesting particularly poor road network quality. The
proportion of paved roads in LAC countries is remarkably low even when set
against other emerging markets, with 89 percent of China’s roads paved, 78
percent of Malaysia’s, 64 percent of India’s and 58 percent of Indonesia’s.
Further, there is evidence that standards of road maintenance in LAC are below
those of other regions in the developing as well as the developed world.41
More specifically, although Brazil possessed over 1.75 million km of roads in
2008, only some 5 percent of these were paved. For Mexico the equivalent
figures were 0.36 million km and 50 percent.42
These issues are becoming more pressing as demand for road use has grown
significantly in the last few years, driven by rapid growth and increasing
motorization. This has placed strain not only on urban but also on rural highway
links.
Concerns about infrastructure quality have hampered the development of LAC
road and other transport - with LAC recording the lowest road infrastructure
satisfaction ratings of any global region in a recent international survey.43
Recent work has sought to quantify the effects of poor road quality. While the
papers of Volpe Martincus and Blyde (2013) and Carballo, Volpe Martincus and
Cusolito (2013) cited above suggest that the extent of the road network is
important. As a good road network can aid exports poor road quality may also
39 Wilmsmeier, G. and Guidry, L. (2013) ‘The Evolution of Modal Split for Goods Transport in South
America’, Facilitation of Transport and Trade in Latin America and the Caribbean (Bulletin FAL Issue
No 325, No.9) UN ECLAC.
40 Barbero J. (2010), loc.cit.
41
ibid
42 U.S. Department of Transportation, Research and Innovative Technology Administration, Bureau of Transportation Statistics (2010)
Freight Transportation: Global Highlights 2010
43 World Bank (2014) Connecting to Compete 2014 Trade Logistics in the Global Economy The
Logistics Performance Index and Its Indicators
Maritime and Road Transport in the Americas October 2014
15
act to hold such exports back, if it is not addressed. For example, Blyde and
Iberti (2014) recently found that improvement in the quality of Chilean roads
could generate a reduction in transport costs of 16 percent and increase
average exports by 2 percent.44
2.2 Key maritime developments
Some key maritime developments in recent years include containerization, the
increasing capacity of ports and shipping vessels, and improvements in port
logistics. Containerization, a method of shipping whereby items are packaged
into large standardized containers that can be transported via ship, truck, and
rail, was invented and first commercially implemented in the US in the mid-
1950s and adopted internationally in 1966.45
Containerization dramatically
reduced the total cost of shipping from the inland manufacturer to the inland
customer by allowing goods to be packed once and shipped over long distances
using a variety of modes of transport, reducing direct port costs for storage and
stevedoring and indirect costs incurred during long port stops. Furthermore, the
technology has continued to develop, with an increase in the types of goods that
can be transported via containers (i.e. refrigerated containers to transport food).
The transport economics literature posits that containerization was the key
innovation in 20th century transportation technology and the key driver of
accelerated globalization from the 1960s. For example, it reduced the journey-
time between Europe and Australia from 70 to 34 days between 1965 and 1970
and lowered insurance costs from an average of 24 pennies a ton to 4 pennies a
ton on that route, thereby halving the capital cost of inventory for cargo.46
An
econometric study of the impact of containerization on trade found that the
impact on the North-North trade over a 20-year period was larger than free trade
agreements or the GATT [though the results were far weaker when the rest of
world sample was added in].47
Another study finds that doubling the proportion
of cargo that is containerized results in a 13.4 percent reduction in shipping
costs.48
Containerized trade, one of the most profitable activities for ports, has been the
fastest growing segment of the shipping market, making up more than 16
percent of the global shipping trade by volume in 2012 and more than 50
44 Blyde J & Iberti G A (2014) “Better Pathway to Export: How the Quality of Road Infrastructure
Affects Export Performance” The International Trade Journal, 28:1, 3-22
45 Bernhofen, D., El-Sahli, Z. and Kneller, R. (2012) Estimating the effects of the container revolution
on world trade.
46 ibid
47 ibid
48 Hummels, D. (2009) ‘Globalization and Freight Transport Costs in Maritime Shipping and
Aviation’International Transport Forum 2009 (Forum Paper 3) OECD.
Maritime and Road Transport in the Americas October 2014
16
percent of the trade by value.49
Container traffic in Latin America has more than
doubled in the past ten years, from 17 million twenty-foot equivalent units
(TEUs) in 2000 to 40 million TEUs in 2010, with an average annual growth rate
of 10 percent.50
The capacity of container vessels serving Latin America doubled
between 2000 and 2011, from approximately 2,000 TEUs to over 4,000 TEUs.51
Within Latin America and the Caribbean, Brazil led in volume terms for container
traffic, handling 19.1 percent of the regional share of container traffic in 2011,
with Panama second (16 percent share) and Mexico third (10.2 percent share).52
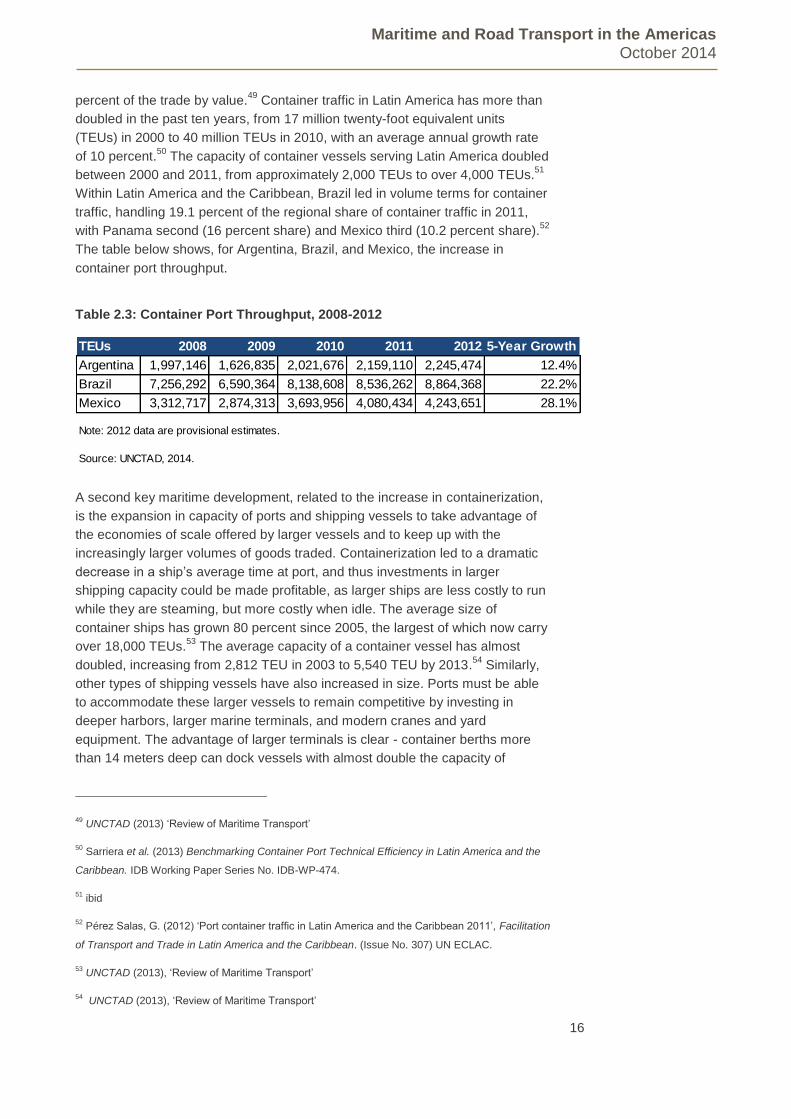
The table below shows, for Argentina, Brazil, and Mexico, the increase in
container port throughput.
Table 2.3: Container Port Throughput, 2008-2012
A second key maritime development, related to the increase in containerization,
is the expansion in capacity of ports and shipping vessels to take advantage of
the economies of scale offered by larger vessels and to keep up with the
increasingly larger volumes of goods traded. Containerization led to a dramatic
decrease in a ship’s average time at port, and thus investments in larger
shipping capacity could be made profitable, as larger ships are less costly to run
while they are steaming, but more costly when idle. The average size of
container ships has grown 80 percent since 2005, the largest of which now carry
over 18,000 TEUs.53
The average capacity of a container vessel has almost
doubled, increasing from 2,812 TEU in 2003 to 5,540 TEU by 2013.54
Similarly,
other types of shipping vessels have also increased in size. Ports must be able
to accommodate these larger vessels to remain competitive by investing in
deeper harbors, larger marine terminals, and modern cranes and yard
equipment. The advantage of larger terminals is clear - container berths more
than 14 meters deep can dock vessels with almost double the capacity of
49 UNCTAD (2013) ‘Review of Maritime Transport’
50 Sarriera et al. (2013) Benchmarking Container Port Technical Efficiency in Latin America and the
Caribbean. IDB Working Paper Series No. IDB-WP-474.
51 ibid
52 Pérez Salas, G. (2012) ‘Port container traffic in Latin America and the Caribbean 2011’, Facilitation
of Transport and Trade in Latin America and the Caribbean. (Issue No. 307) UN ECLAC.
53 UNCTAD (2013), ‘Review of Maritime Transport’
54 UNCTAD (2013), ‘Review of Maritime Transport’
TEUs 2008 2009 2010 2011 2012 5-Year Growth
Argentina 1,997,146 1,626,835 2,021,676 2,159,110 2,245,474 12.4%
Brazil 7,256,292 6,590,364 8,138,608 8,536,262 8,864,368 22.2%
Mexico 3,312,717 2,874,313 3,693,956 4,080,434 4,243,651 28.1%
Note: 2012 data are provisional estimates.
Source: UNCTAD, 2014.
Maritime and Road Transport in the Americas October 2014
17
container berths 13 or fewer meters deep. In addition, the ongoing expansion of
the Panama Canal (to be completed in 2015) will increase the maximum size of
container ships going through the canal from 5,000 TEU to 13,000 TEU.55
This
expansion is motivating ports with shipping routes through the canal (the eastern
US seaboard and the Caribbean) to improve their facilities to handle larger
vessels. One of the questions that arise, however, in the light of ever larger ship
and port developments is how sustainable these practices are. Larger shipping
vessels place a greater strain on the environment and concentrate maritime
shipping between ports with greater demand, thereby potentially putting smaller
ports at a disadvantage.
In contrast, the expansion of inland waterways (of which the Panama Canal is
an example) is generally regarded as a positive development in terms of
environmental sustainability because it is much more efficient than road or rail
alternatives for inland transport. In the European Union, the energy consumption
of transportation per ton-kilometer via inland waterways is one-sixth the
consumption on roads and half the energy consumption of rail transport.56
This
efficiency also translates to lower costs of transport. In the US, the unit cost of
transporting commodities via inland waterways is 2-3 times lower than other
forms of transportation.57
In South America, 90 percent of the southern cone’s
freight between Mercosur countries is moved via road and although shipments
via the Paraguay-Paraná Hidrovía (HPP) increased by 13.4 percent per annum
from 2002-2007, inland waterways in South America are far less developed than
inland waterways in the United States and Europe.58
The tonnage transported
via the HPP increased from 2-2.5 million tons per year between 1990 and 1995
to over 15 million tons in 2008.59
The Amazon Basin, the largest inland waterway
network (by volume) in South America carries 21 million tons of freight per
year.60
In contrast, inland waterways in the US move almost 2.5 billion tons of
cargo per annum.61
A third key maritime issue is port logistics. One aspect of port logistics involves
the use of intelligent transport systems (ITS). Technological advances in ITS are
mostly associated with freight, vehicle and infrastructure operations, but are less
well-known for ports. They are particularly useful in coordinating intermodal
55 Canal de Panamá (2012) ‘Panama Canal Expansion Program.’
56 World Bank Sustainable Development Department, Latin America and Caribbean Region (March
2010) ‘Southern Cone Inland Waterways Transportation Study- The Paraguay-Paraná Hidrovía: Its
Role in the Regional Economy and Impact on Climate Change.’
57 ibid
58 ibid
59 World Bank Sustainable Development Department, Latin America and Caribbean Region (March
2010), loc.cit.
60 World Bank Sustainable Development Department, Latin America and Caribbean Region (March
2010)
61 ibid
Maritime and Road Transport in the Americas October 2014
18
transport, and are productivity-enhancing tools. Most of these systems are
expanding to encompass the entire logistics chain, sharing standardized
information more easily, reducing processing and inspection times in terminals,
enhancing data accuracy, enhancing storage yard and vehicle efficiency, and
decreasing paperwork. For example, the port of Valparaiso (Chile), granted a
concession to one private technology operator that develops, implements, and
operates a single window to coordinate information exchange with all public and
private agents involved in the chain of imports/exports through the port.
One of the benefits of the use of ITS systems to enhance the traceability of
goods through the logistics chain entails a reduction in company operating costs
via lower fuel consumption. The savings associated with monitoring the
movement of goods are estimated at 4 percent.62
Many Latin American ports
have implemented traceability using radio frequency identification (RFID),
consisting of an electronic tag that sends radio signals to an interrogating
antenna. At the Argentine port of Ingeniero White, RFID systems have been
implemented to better manage the increase in trucks around the port due to the
rise in cereal production. The tags used are readable at four to six meters
passing at up to 20 km/hr and the data is subsequently transmitted via the
internet to the exporter’s unloading software to manage travel journey times and
certify grain quality.63
Within another category of ITS systems are automated
guidance systems that run vehicles using remote control. These systems
encompass the vehicle, the navigation and route selection system and
automated controls. They move and stack containers, lowering the cost of
operations involving many containers.
Another important port logistics issue is relieving port congestion, which can be
an alternative to port expansion. A study on East Asian ports found that the net
benefits from a reduction in congestion are greater than the net benefits of
expanding ports in the region.64
Furthermore, the study found that cutting port
congestion by 10 percent could lower transport costs in East Asia by up to 3
percent, or the equivalent of a 0.3 to 0.5 percent tariff cut.65
One method of
reducing port congestion is the use of efficient rationing of port berths and
instead of implementing a first-come-first-serve approach, rationing by the value
of the cargo is more beneficial. This method of rationing places the priority first
on containerized cargo, then on break bulk cargo, and bulk cargo last.
2.3 Key road transport developments
Traditionally road freight has suffered from limited abilities to achieve the
economies of scale enjoyed by rail transport as governments have imposed size
constraints and also due to technical limits. Limits on the traction capacities of
62 Febré, G., and Pérez Salas, G. (2012) , loc.cit.
63 ibid
64 World Bank Development Research Group (2009), loc.cit.
65 ibid
Maritime and Road Transport in the Americas October 2014
19
trucks also restrict carrying capacities. However, some of these limits have
gradually proved less restrictive in recent years (see below).
Road transport does possess significant advantages, including relatively low
capital costs, and easy entry which helps ensure strong competition within the
trucking industry. Low capital costs also ensure that innovations and new
technologies can diffuse quickly through the industry. Other advantages of road
transport include the high relative speed of vehicles, the flexibility of route
choices, and door-to-door service for both passengers and freight. These
multiple advantages have made cars and trucks the modes of choice for a great
number of trip purposes, and have led to the market dominance of cars and
trucks for short-distance trips.66
Authorities in countries with both short and long haul tasks (such as Australia)
have noted that road freight offers greater flexibility in many cases than rail.
Unlike rail access (where specialized equipment is required and access to the
network is governed by allocation of train paths) road freight operators have
relatively free access to the road network, and can reach points which are not
served by rail networks, particularly smaller rural areas (for paved roads). In
addition, pickup and delivery times can therefore more closely meet customer
needs rather than being determined by less flexible rail timetables. Further, the
ability to avoid transshipment (which is not available to rail transport) can reduce
the risk of breakage and handling costs.67
Road freight is also especially well-suited for dealing with perishables and/or
time-sensitive freight compared to rail. Along with improved truck
communications, (which have helped reduce the need for intermediate
warehousing in some cases) this flexibility has also helped make road freight
increasingly efficient. This is especially true given increasing business adoption
of just-in-time methods, which call for smaller inventories and reduced
overheads. In addition, the growing popularity of door-to-door deliveries requires
more frequent and generally smaller, shorter-haul deliveries.68
Consequently, in cases such as Australia, only 10-15 percent of the market is
now contestable between road and rail services.69
These advantages mean that
road transport is often favored for many transport tasks, particularly within
smaller countries such as Japan or jurisdictions containing several countries,
such as the EU. However, rail transport remains important in certain very large
countries, particularly where very large loads are involved – as indicated below.
66 Rodrigue,J. Comtois C. and Slack, B. (2006) The Geography of Transport Systems
67 Australian Productivity Commission (2006), loc.cit.
68 ibid
69 ibid

Maritime and Road Transport in the Americas October 2014
20
Chart 2.3: Modal distribution of inland surface freight transport – selected
jurisdictions 2005 (tonne km)70
Source: OECD
The productivity of road transport also has improved, with the introduction of
larger articulated trucks. Australia allows the use of B-doubles (25m in length)
and even B-triples (36m in length) on certain routes. Within the EU, maximum
truck length is generally set at 18.75m. However, Sweden and Finland have
been allowed to use trucks up to 25.25m in length and consideration is being
given to the use of European Modular Systems (EMS) of this length (and
weighting up to 60 tonnes) across the EU, with trials currently underway in
Germany, Denmark and the Netherlands.71
The use of such longer vehicles allows for exploitation of economies of scale
(thereby taking on some of the characteristics of trains in miniature form). Higher
capacity vehicles have potential to improve fuel efficiency and reduce pollution
once limits on wheelbases, axle loads, spacing and weight are relaxed. They
can also result in a reduction in the number of vehicle kilometers for a given
amount of freight, particularly in given that load volumes rather than weight can
determine truck numbers. In addition, the use of modules (as per the Australian
and European experiences) can allow for better load matching and help with
intermodal transfers.72
A variety of past evidence has pointed to the efficiency gains of using longer and
heavier vehicles:
Swedish studies found that moving to the smaller trucks used elsewhere in the
EU would decrease cost per truck trip by 5-12 percent. However, the number of
70 OECD (2011) Moving Freight with Better Trucks: Improving Safety, Productivity and
Sustainability. Available at: http://dx.doi.org/10.1787/9789282102961-en
71 EPRS (2014) ‘Weights and dimensions of road vehicles in the EU’ Available at:
http://epthinktank.eu/2014/04/10/weights-and-dimensions-of-road-vehicles-in-the-eu/
72 OECD (2011) loc.cit.
Maritime and Road Transport in the Americas October 2014
21
trucks required for transport would increase by 35-50 percent, resulting in an
overall truck transport cost increase of 24 percent.73
In Canada studies found that using single semitrailer configurations in Alberta
rather than larger vehicles would result in an 80 percent increase in truck
movements and a 40 percent cost increase for shippers.74
Australian estimates indicate that if B-Doubles had not been introduced in 1984
then the country would require an additional 15,000-20,000 trucks. B-Doubles
are estimated to have reduced fuel use by the articulated trucks by 11 percent.75
Separate Australian work has also suggested that allowing larger trucks in
specific areas could reduce truck trips to terminal and/or to ports by as much as
50 percent. Longer trailers alone are estimated to save 25 percent of trips.
“SMART” trucks (with better designed steering, load and axle systems) could
improve productivity by 37 percent and allow for a reduction in fleet numbers by
up to 20 percent.76
A government trial in New Zealand during 2008-09 found that 50 tonne vehicles
could allow for 10-20 percent increases in productivity, a fall in trip numbers by
16 percent and fuel use by 20 percent. This combined with the fact that road
freight rates were 30 percent higher than in neighboring Australia, where B-
doubles and triples were in use - facilitated a government decision to allow the
use of vehicles up to 62 tonnes and 25m in length.77
Use of longer and heavier trucks could result in a modal shift from rail or other
modes, though in some cases contestability is limited. Another impact may be
an increase in the use of intermodal transport involving containers in particular.
These could generate some gains to rail markets which offset the losses due to
improved truck efficiency.78
At the same time border crossings have come to be recognized as major
obstacles to international freight movement. The World Bank has helped to
develop multimodal goods depots to which international goods can be consigned
and delivered in bond before customs inspection and clearance in locations such
as China, however as indicated below, the TIR system could constitute a viable
global approach to such issues.
73 OECD (2011) loc.cit.
74 ibid
75ibid
76 Australian Productivity Commission (2006), loc.cit.
77 ibid
78 OECD (2011) Of course there is also potential for induced demand resulting from lower prices to
offset reductions in vehicle kilometers due to larger and more efficient trucks. Studies of the
introduction of 25.25m, 60 tonne trucks on European road networks found induced demand would be
modest, with an initial 13 percent reduction in vkm reduced to 12 percent. However some UK work
has suggested larger effects.
Maritime and Road Transport in the Americas October 2014
22
Nonetheless, the World Bank has also recognized that in recent decades, road
transport has improved what it nominates as its “price-quality ratio” substantially
through technical and logistical innovations. In the same period rail freight has
lagged behind in such improvements. Moreover, the fact that growth in bulk
transport–with a high market share for rail and water–has been lower than the
growth in containers and packed goods - has added to road’s general increase
in market share across the globe.79
Typical road freight issues in low and middle income countries cited by the
World Bank include industry fragmentation, the use of older (e.g. 20 year old)
vehicles and continued use of smaller, less efficient, rigid vehicles rather than
the larger articulated vehicles which are increasingly being used in industrialized
countries and a large proportion of empty backloads.80
LAC countries accounted for some 15.3 million trucks and vans in 2006 –
roughly 8 percent of the global fleet total of 196.5 million in that year. Mexico
alone accounted for some 6.9 million trucks, with Argentina accounting for some
0.27 million.81
However, 85 percent of Mexican trucks in that year were classed
as rigid (rather than articulated while the corresponding figure for Argentina was
80 percent. This suggests there is still some way to go in introducing larger and
more efficient vehicles – and the attendant efficiency benefits noted above -
within these states.
Overall, the Latin American experience with trucking industry structure is mixed.
Barbero (2010) has pointed to the fact that the importance of road freight
transportation is actually understated in LAC National Accounts, and much of the
sector is typically highly fragmented, consisting of differentiated markets and
characterized by small operators whose activities may not be fully recorded.82
In Mexico, for example, where trucks account for roughly 70 percent of the
freight volume and 80 percent by value, 85 percent of trucking entities are small
operators who own with 1-5 units with an average age of 20 years. Conversely a
handful of larger companies have 100 or more units, on average 5-10 years old,
but these account for some 65 percent of the national haulage. The World Bank
has previously estimated that 30-40 percent of trips are “empty running”
backloads.83
While the sector’s fragmented and privatized nature makes information
collection difficult, similar productivity issues appear to occur elsewhere in the
region. For example, in Colombia trucks typically travel 50,000-60,000km/year
79 Freight Transport for Development (2014) Available at:
http://www.ppiaf.org/freighttoolkit/knowledge-map/road/intermodal-freight-systems
80 World Bank (2009) Freight Transport for Development Toolkit: Road Freight.
81 Ibid. Figures for the following year (2007) indicate some 7.9 m trucks and vans in Mexico and 5.6m
in Brazil. Not surprisingly this implies the great majority of the LAC truck and van fleet is in those two
countries. See World Trade Organisation (WTO) (2010) Road Freight Transport Services,
Background Note by the Secretariat S/C/W/324.
82 Barbero J. (2010), loc. cit.
83 World Bank (2009) Freight Transport for Development Toolkit: Road Freight.
Maritime and Road Transport in the Americas October 2014
23
and with 30 percent empty running. In developed economies these figures are
typically some 200,000 km per year and empty running is typically around 25
percent.84
The Mercosur countries, however, tend to have better developed regulatory and
competitive environments with clearer segmentation between companies that
serve domestic and international cargo and long and short distances.85
The impacts of border crossings and associated customs delays along with the
equivalent effects for sea freight will be considered more fully in the next
chapter. However, given the size of its truck fleet and the salience of its road
freight trade with the United States, customs related delays on the US-Mexican
border are of particular interest. Cedillo-Campos et al86
point to the importance
of NAFTA with the value of trade between the USA and Mexico by all modes of
transportation increasing from $97 billion in 1995 to $461 billion in 2011.
Nonetheless narcotics and security concerns have frustrated many efforts to
smooth the flow of goods at the two nations’ land border entry points, with
delays of several hours being common, particularly where physical inspections
are required. The authors find typical delays to enter the US from Mexico of
some 5.87 hours based on careful analysis of one crossing point.87
84 Barbero J. (2010), loc.cit.
85 World Bank (2009) Freight Transport for Development Toolkit: Road Freight.
86 Cedillo-Campos M., Sánchez-Ramírez,C , Vadali,S., Villa,J, Menezes,M (2014) Supply chain
dynamics and the ‘‘cross-border effect’’: The U.S.–Mexican border’s case, Computers and Industrial
Engineering Volume 72, June 2014, Pages 261.sci
87 Extensive recent work has also been carried out in the trucking industry in Central America: - see
World Bank (2012) Five Explanations to High Costs of Service Provision, Road Freight in Central
America. Apart from pointing to many of the issues noted above, other things this work points to the
long border crossing times as a significant issue – with border times ranging from 5-35 hours – or
often 10-25 percent of the total trip time.
Maritime and Road Transport in the Americas October 2014
24
3 Maritime and road transport systems and intermodal transport
3.1 Intermodal transport
In order to move cargo large distances to its destination, much of the world’s
freight uses multiple forms of transport. This intermodal freight is often seen in
the form of shipping containers, which can be transferred between different
forms of transport, including road, rail and seaborne trade. Coordination
between these different modes of transport is an important part of improving
global haulage networks.
Monios and Wilmsmeir (2013) show that the organizational disconnection
between different parts of the freight process, is because “spatial development is
to a large degree an institutional problem, as intermodal corridors involve many
actors that are integrated at different levels and managed by varying
arrangements.” This creates a collective action problem, where coordination
between different bodies is required to increase freight capacity. As a
consequence, a number of investments require public sector support, especially
in Europe where many rail operators receive public subsidies.88
Coordination failures in the planning, development, and maintenance of various
forms of transport infrastructure can have serious impacts on the costs of
trading. This is evident in cases like the one of Brazilian soybean exports. The
Caramuru Group (manufacturer and exporter of soybean) estimated port costs
at US$7.00/ton in Santos (the largest exporter port of Brazilian soybean), the
cost of exporting to China at US$50/ton (each vessel holds sixty tons) along with
various costs added due to inefficiency costs due to poor transport
infrastructure. These trade costs are equivalent to 178.5 percent of the farm
price. Soy has transportation costs above 30 percent of the final product cost in
Brazil, much more than that of exporting from the US to Germany - at 19 percent
of the final product cost.89
3.1.1 Intermodal linkages
Whilst infrastructure plays an important role in improving shipping links, many
forms of international trade require various modes of transport. For these forms
of transport, one World Bank report argues that “the emphasis lies more on
reducing the non-physical impediments to movement.” This highlights a need for
improved information technology transfers, track and trace and delays
associated with customs and crossing national borders.90
The lack of
88 Monios, J. and Wilmsmeir, G. (2013) The role of intermodal transport in port regionalization.
89 Moreira, M., Volpe, C. and Blyde, J. (2008) Unclogging the Arteries: The Impact of Transport
Costs on Latin American and Caribbean Trade. Inter-American Development Bank.
90 Gwilliam, K. Multi-Modal Transport Networks and Logistics. World Bank.
Maritime and Road Transport in the Americas October 2014
25
documentation of shippers and custom work inefficiencies, including duplicity of
controls etc., are common problems faced in Latin America trade.91
A 2012 report by the World Bank considers a range of factors contributing to the
high cost of road transport services in Central America. One key contributor is
fuel costs, especially because the sector is quite inefficient and not technically
advanced in the region; as well as this there are inefficiencies where a large
number of return trips happen without cargo. On top of this, security costs are
rising as crime increases and a combination of time consuming border
crossings, road congestions, security concerns, inefficient custom procedures
and infrastructure problems contribute to large wait times and higher transport
costs.92
Furthermore, inland bottlenecks in the rail and road transport systems impede
port cargo flows. The report argues that mechanisms such as joint-financing
systems are required, as is better use of data in identifying bottlenecks and
changing trade patterns. In Argentina, port access is a significant issue, as many
of the ports are located in central city locations, so both rail and highway access
must compete with normal city traffic when serving the port. This is particularly a
concern for truck traffic, which for the Port of Buenos Aires carries 85 percent of
the cargo going to and from the port.94
According to Notteboom (2008), terminals are integral to this process in Europe,
both in seaports as well as inland ports, both of which will play an increasing role
as capacity constraints grow. Alongside this, inland terminals play an important
role in developing transport networks, with the author arguing that capacity
constraints have gained less attention than in seaports.95
Suitable capacity in inland terminals can ease pressure on sea ports by allowing
them to move cargo onwards more quickly, preventing congestion and waiting
times on waterfronts. In larger countries such as the United States they are often
found a significant distance inland and close to large population centers.96
Much
of these capacity and transport inefficiencies can be improved upon: the railway
system in LAC countries carries 21 billion tons/km-year, compared to 2700
billion tons in the US and the average speed of trains for load transportation is
25 km/hour, compared to 64 km/hour in the US when transporting goods to
91 Moreira, M., Volpe, C. and Blyde, J. (2008) Unclogging the Arteries: The Impact of Transport
Costs on Latin American and Caribbean Trade. Inter-American Development Bank.
92 The World Bank (2012) Road Freight in Central America, Five Explanations to High Costs of
Service Provision.
94 Federal Highway Administration, U.S. Department of Transportation (2003) ‘Scan Visits’, in Larry,
B. et al. (ed.) Freight Transportation: The Latin American Market. (pp. 21-59)
95 Notteboom, T. (2008) The relationship between seaports and the intermodal hinterland in light of
global supply chains. OECD
96 LaSalle, J. (2011) ‘The emergence of the inland port’.
Maritime and Road Transport in the Americas October 2014
26
ports. Moreover, a research study by the CNT in 2009 indicates that only 32
percent of roads are considered ‘good to excellent’.97
3.2 Potential for improvements in trade facilitation
Economic research highlights a border effect in trade. For example, trade
volumes are much higher between Canadian provinces compared to trade
between Canada and US states, even though the border is relatively open and
American and Canadian culture and institutions are comparable. This border
effect is the result of a combination of trade barriers, trade costs, and the rate of
substitution between domestic and foreign goods. Trade costs encompass
distance-related transport costs, port efficiency, and regulatory burdens, and
other factors. In addition to financial costs, trade costs also encompass the cost
of time it takes to trade goods. Both factors affect the competitiveness of trading.
High trade costs can impose barriers to trade. Not only do they lower volumes
traded, but they can prevent other products from being traded. Dennis and
Shepherd (2007) show that a 10 percent reduction in internal trade costs
increases the number of products exported by 2.5 percent.102
For the majority of countries, however, logistics costs are a bigger component of
total trade costs than tariff barriers. This is because many tariff barriers have
been significantly reduced. For products from Argentina, logistics costs were
found to make up 27 percent of the total product value, 26 percent for Brazil and
20 percent for Mexico, compared to 9 percent for the OECD average (data from
2004).103
Poor logistics means that firms have to hold more inventory, because
they are unable to operate just-in-time. Holding more inventory ties up capital,
leading to increased unit costs and lower levels of productivity for firms. Using
an interest rate of 15-20 percent, having to hold additional inventory due to poor
logistics cost Latin American economies more than 2 percent of GDP.104
In
addition, extra time in shipping leads to uncertainty on delivery times, meaning
that companies will then have to spend additional resources holding a safety
margin of inventory.
The World Bank’s Logistics Performance Index (LPI) allows for comparisons of
logistics performance globally. The LPI is discussed in more detail below and
results of the 2014 World Bank LPI for the top 5 countries, the United States,
Canada, Argentina, Brazil and Mexico are in the below table along with a Latin
America and Caribbean average.
97 Moreira, M., Volpe, C. and Blyde, J. (2008), loc.cit.
102 Dennis, A. and Shepherd, B. (2007), loc.cit.
103 Gonzalez, A., Guasch, L. and Serebrisky, T. (2008), loc.cit.
104 ibid
Maritime and Road Transport in the Americas October 2014
27
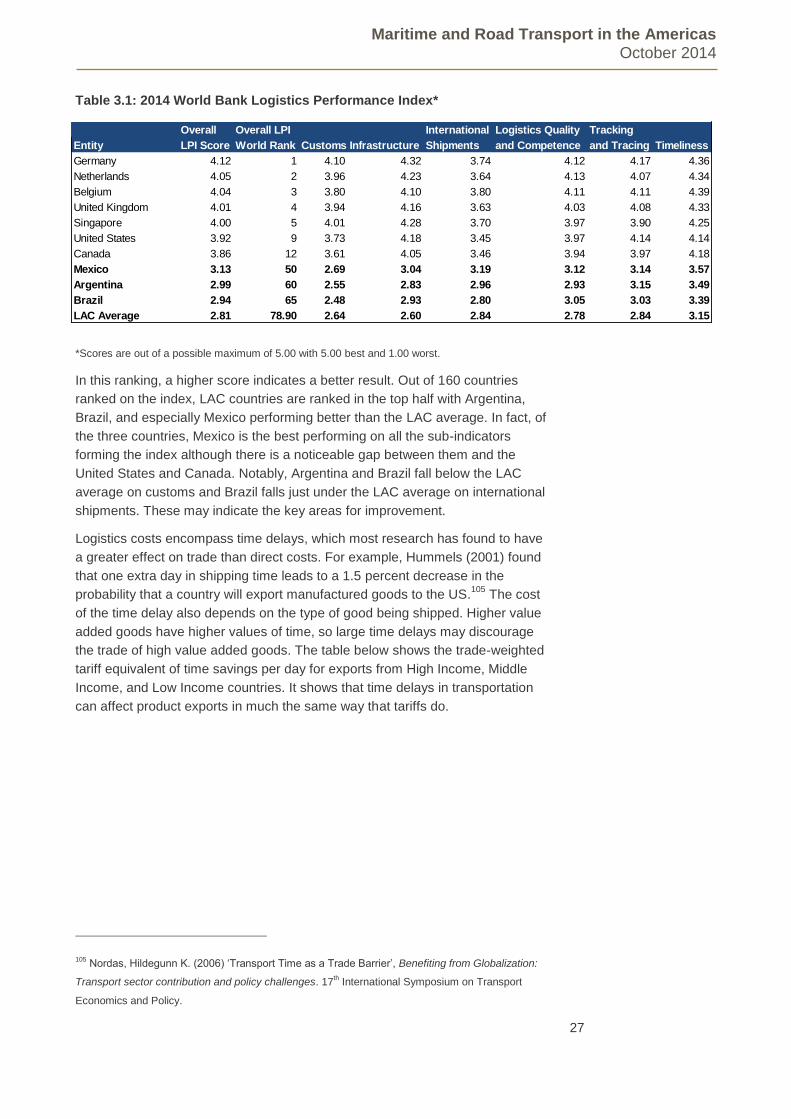
Table 3.1: 2014 World Bank Logistics Performance Index*
*Scores are out of a possible maximum of 5.00 with 5.00 best and 1.00 worst.
In this ranking, a higher score indicates a better result. Out of 160 countries
ranked on the index, LAC countries are ranked in the top half with Argentina,
Brazil, and especially Mexico performing better than the LAC average. In fact, of
the three countries, Mexico is the best performing on all the sub-indicators
forming the index although there is a noticeable gap between them and the
United States and Canada. Notably, Argentina and Brazil fall below the LAC
average on customs and Brazil falls just under the LAC average on international
shipments. These may indicate the key areas for improvement.
Logistics costs encompass time delays, which most research has found to have
a greater effect on trade than direct costs. For example, Hummels (2001) found
that one extra day in shipping time leads to a 1.5 percent decrease in the
probability that a country will export manufactured goods to the US.105
The cost
of the time delay also depends on the type of good being shipped. Higher value
added goods have higher values of time, so large time delays may discourage
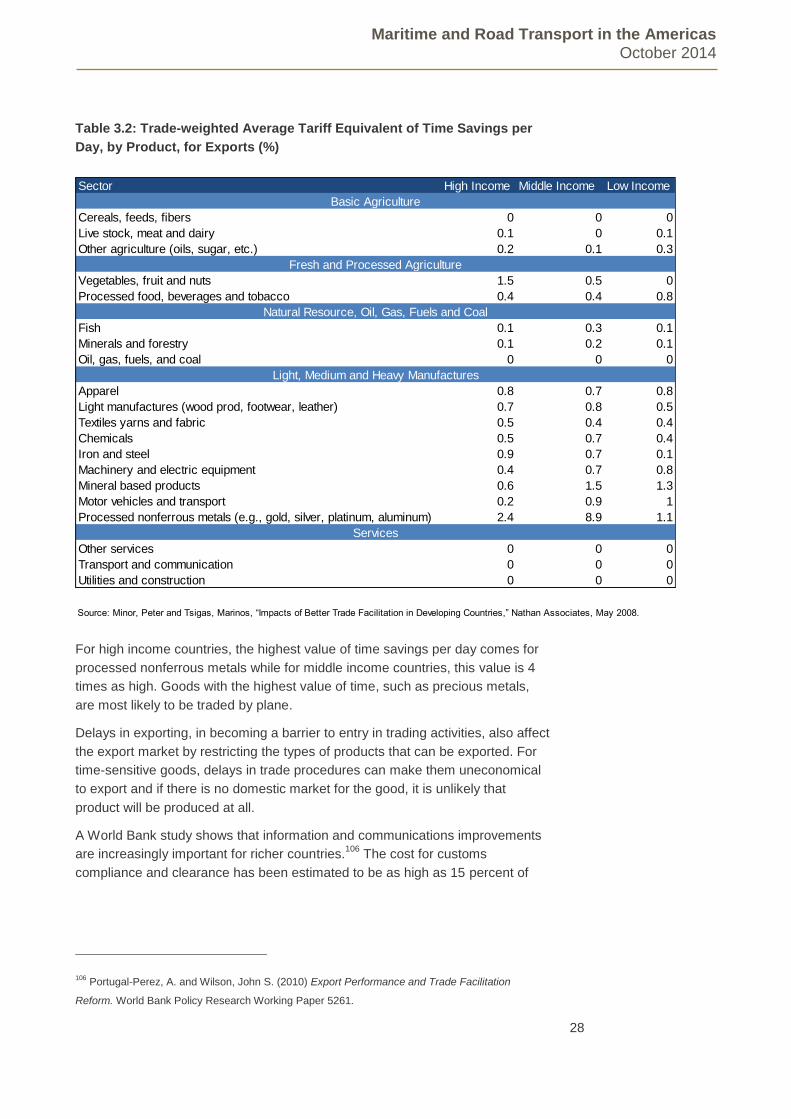
the trade of high value added goods. The table below shows the trade-weighted
tariff equivalent of time savings per day for exports from High Income, Middle
Income, and Low Income countries. It shows that time delays in transportation
can affect product exports in much the same way that tariffs do.
105 Nordas, Hildegunn K. (2006) ‘Transport Time as a Trade Barrier’, Benefiting from Globalization:
Transport sector contribution and policy challenges. 17th International Symposium on Transport
Economics and Policy.
Overall Overall LPI International Logistics Quality Tracking
Entity LPI Score World Rank Customs Infrastructure Shipments and Competence and Tracing Timeliness
Germany 4.12 1 4.10 4.32 3.74 4.12 4.17 4.36
Netherlands 4.05 2 3.96 4.23 3.64 4.13 4.07 4.34
Belgium 4.04 3 3.80 4.10 3.80 4.11 4.11 4.39
United Kingdom 4.01 4 3.94 4.16 3.63 4.03 4.08 4.33
Singapore 4.00 5 4.01 4.28 3.70 3.97 3.90 4.25
United States 3.92 9 3.73 4.18 3.45 3.97 4.14 4.14
Canada 3.86 12 3.61 4.05 3.46 3.94 3.97 4.18
Mexico 3.13 50 2.69 3.04 3.19 3.12 3.14 3.57
Argentina 2.99 60 2.55 2.83 2.96 2.93 3.15 3.49
Brazil 2.94 65 2.48 2.93 2.80 3.05 3.03 3.39
LAC Average 2.81 78.90 2.64 2.60 2.84 2.78 2.84 3.15
Maritime and Road Transport in the Americas October 2014
28
Table 3.2: Trade-weighted Average Tariff Equivalent of Time Savings per
Day, by Product, for Exports (%)
For high income countries, the highest value of time savings per day comes for
processed nonferrous metals while for middle income countries, this value is 4
times as high. Goods with the highest value of time, such as precious metals,
are most likely to be traded by plane.
Delays in exporting, in becoming a barrier to entry in trading activities, also affect
the export market by restricting the types of products that can be exported. For
time-sensitive goods, delays in trade procedures can make them uneconomical
to export and if there is no domestic market for the good, it is unlikely that
product will be produced at all.
A World Bank study shows that information and communications improvements
are increasingly important for richer countries.106
The cost for customs
compliance and clearance has been estimated to be as high as 15 percent of
106 Portugal-Perez, A. and Wilson, John S. (2010) Export Performance and Trade Facilitation
Reform. World Bank Policy Research Working Paper 5261.
Sector High Income Middle Income Low Income
Cereals, feeds, fibers 0 0 0
Live stock, meat and dairy 0.1 0 0.1
Other agriculture (oils, sugar, etc.) 0.2 0.1 0.3
Vegetables, fruit and nuts 1.5 0.5 0
Processed food, beverages and tobacco 0.4 0.4 0.8
Fish 0.1 0.3 0.1
Minerals and forestry 0.1 0.2 0.1
Oil, gas, fuels, and coal 0 0 0
Apparel 0.8 0.7 0.8
Light manufactures (wood prod, footwear, leather) 0.7 0.8 0.5
Textiles yarns and fabric 0.5 0.4 0.4
Chemicals 0.5 0.7 0.4
Iron and steel 0.9 0.7 0.1
Machinery and electric equipment 0.4 0.7 0.8
Mineral based products 0.6 1.5 1.3
Motor vehicles and transport 0.2 0.9 1
Processed nonferrous metals (e.g., gold, silver, platinum, aluminum) 2.4 8.9 1.1
Other services 0 0 0
Transport and communication 0 0 0
Utilities and construction 0 0 0
Source: Minor, Peter and Tsigas, Marinos, “Impacts of Better Trade Facilitation in Developing Countries,” Nathan Associates, May 2008.
Light, Medium and Heavy Manufactures
Services
Natural Resource, Oil, Gas, Fuels and Coal
Fresh and Processed Agriculture
Basic Agriculture
Maritime and Road Transport in the Americas October 2014
29
the value of the good in parts of the world107
and a 2004 study by Dollar et al
showed that customs clearance is a key criterion for companies seeking to
invest in developing countries. According to recent research, a one-day
reduction in customs clearance time would equal a 0.8 percent reduction in ad
valorem tariffs.108
Transparent customs procedures also reduce corruption. A customs
modernization in Mozambique increased customs revenues by 38.4 percent.109
Single window systems have been implemented in many cases to facilitate
customs procedures. In these systems, exporters file a unique export declaration
to one entity (i.e. the national customs office). This system then transfers the
data to the customs administrations of the importing countries, saving time with
administrative processes and queues at the borders. E-customs platforms are a
further way to facilitate cross-border trade as well as to ensure regulatory
compliance. Such a system has been put into place in Europe. Single window
systems are also being implemented in Latin American countries, with varying
levels of advancement. A recent UNECE report showed that Colombia has the
most complete experience with implementation of a single window system that
includes digital certification of origin and digital signature.110
Moreover, in 2011,
Chile, Costa Rica, Ecuador, El Salvador and Peru were also making good
progress in the implementation of these systems, with the capability to process
e-documents.111
A World Bank trade simulation showed that customs improvements would result
in a 0.9 percent increase in exports, with the largest monetary export gain for
Brazil at $0.53 billion.112
Customs inefficiency and long border related delays on
land routes within LAC countries in particular also continue to be regional
problems. Past evidence suggests that delays in customs clearance in LAC as a
whole increases transport costs by some 4-12 percent in LAC countries.113
For instance, Mexico is a major importer of cotton, most of which comes from
the US. The American cotton is delivered to Nuevo Laredo and then taken to
Central Mexico. The time to cover the distance from Nuevo Laredo takes on
average 2-6 days, of which up to 84 percent of the time is spent on custom
107 Urciuoli, L., Hintsa, J., and Ahokas, J. (2013) Drivers and barriers affecting usage of e-Customs
— A global survey with customs administrations using multivariate analysis techniques. Government
Information, Quarterly 30 pp. 473–485.
108 Behar, A., Manners, P. and Nelson, B. (2011) Exports and International Logistics. Working paper.
109 Sida, K. (2009), loc.cit.
110 United Nations Economic Commission for Europe (UNECE) (2013) Connecting International
Trade: Single Windows and Supply Chains in the Next Decade.
111 ibid
112 Wilson, John S., Mann, Catherine L. and Otsuki, T. (2004) Assessing the Potential Benefit of
Trade Facilitation: A Global Perspective. World Bank Policy Research Working Paper 3224.
113 Guasch, J (2011) Logistics as a Driver for Competitiveness in Latin America and the Caribbean.
Inter-American Development Bank (Discussion Paper No. IDP-DP-193) .
Maritime and Road Transport in the Americas October 2014
30
procedures. This elongated process increases the price of the product by 6
percent (caused by both freight expenditures and custom requirements), in turn
hampering the consequent exports of Mexican textile.114
A variety of international studies have also sought to provide quantitative
estimates of the benefits of trade facilitation and some of these also refer to LAC
countries. For example, the OECD (2009) finds that reducing border trade
transactions costs by 1 percentage point of the value of the traded goods would
result in LAC countries’ income increasing by between 5 -13 percent.115
In other work, the OECD (2013) finds measures to streamline border procedures
and the use of automated processes and risk management would be of
particular benefit to upper middle income countries (included in which are
Argentina and Brazil), considering that these would reduce costs by 2.8 percent
and 2.4 percent respectively. These effects would be additive.116
As already noted, commonly cited references in the trade facilitation literature
include:
World Bank Doing Business project - This annual database and accompanying
sets of reports includes a wide range of measures including the Trading Across
Borders measure – which estimates, among other things, the time and cost (ex.
tariffs) of exporting and importing a standardized cargo of goods by sea
(excluding sea transport times and costs). The “Time to export” (or import)
measure in particular, (separately) reports the time taken for inland transport,
port and terminal handling, customs clearance and technical control and
document preparation. The most recent data recorded in this publication relate
to June 2013.117
World Bank Connecting to Compete: Trade Logistics in the Global Economy
(Logistics Performance Index (LPI)) – This has been referred to above and is
also an annual publication. The LPI is based on a global survey of 1000
respondents at international logistics companies in 143 countries. The LPI itself
is based on the factors noted above (customs, infrastructure, international
shipments, logistics quality, tracking and tracing and timeliness). However, this
publication also includes a variety of data including details on the “lead times” for
sea/air and land transport (the latter including the total time taken from dispatch
at the seller’s factory to arrival at the buyer’s warehouse). The current (2014)
report is based on data collected from interviews in October-December 2013.118
114 Moreira, M., Volpe, C. and Blyde, J. (2008), loc.cit.
115 OECD (2009) Overcoming Border Bottlenecks – The Costs and Benefits of Trade Facilitation
116 OECD (2013) “The Potential Impact of Trade Facilitation Measures on Developing Countries
Trade”, Trade Policy Papers No. 144
117 World Bank (2013) Doing business-Trading across borders. Available at:
http://www.doingbusiness.org/data/exploretopics/trading-across-borders
118 World Bank (2014), loc.cit.
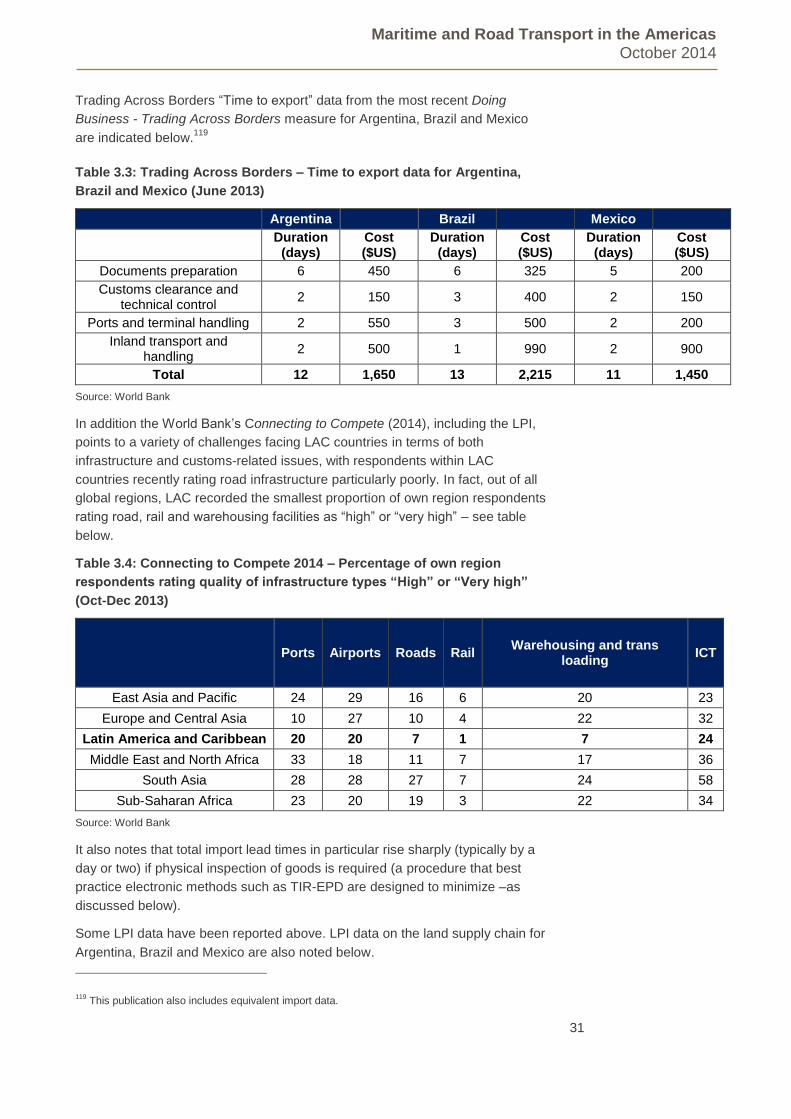
Maritime and Road Transport in the Americas October 2014
31
Trading Across Borders “Time to export” data from the most recent Doing
Business - Trading Across Borders measure for Argentina, Brazil and Mexico
are indicated below.119
Table 3.3: Trading Across Borders – Time to export data for Argentina,
Brazil and Mexico (June 2013)
Argentina Brazil Mexico
Duration
(days) Cost ($US)
Duration (days)
Cost ($US)
Duration (days)
Cost ($US)
Documents preparation 6 450 6 325 5 200
Customs clearance and technical control
2 150 3 400 2 150
Ports and terminal handling 2 550 3 500 2 200
Inland transport and handling
2 500 1 990 2 900
Total 12 1,650 13 2,215 11 1,450
Source: World Bank
In addition the World Bank’s Connecting to Compete (2014), including the LPI,
points to a variety of challenges facing LAC countries in terms of both
infrastructure and customs-related issues, with respondents within LAC
countries recently rating road infrastructure particularly poorly. In fact, out of all
global regions, LAC recorded the smallest proportion of own region respondents
rating road, rail and warehousing facilities as “high” or “very high” – see table
below.
Table 3.4: Connecting to Compete 2014 – Percentage of own region
respondents rating quality of infrastructure types “High” or “Very high”
(Oct-Dec 2013)
Ports Airports Roads Rail Warehousing and trans
loading ICT
East Asia and Pacific 24 29 16 6 20 23
Europe and Central Asia 10 27 10 4 22 32
Latin America and Caribbean 20 20 7 1 7 24
Middle East and North Africa 33 18 11 7 17 36
South Asia 28 28 27 7 24 58
Sub-Saharan Africa 23 20 19 3 22 34
Source: World Bank
It also notes that total import lead times in particular rise sharply (typically by a
day or two) if physical inspection of goods is required (a procedure that best
practice electronic methods such as TIR-EPD are designed to minimize –as
discussed below).
Some LPI data have been reported above. LPI data on the land supply chain for
Argentina, Brazil and Mexico are also noted below.
119 This publication also includes equivalent import data.
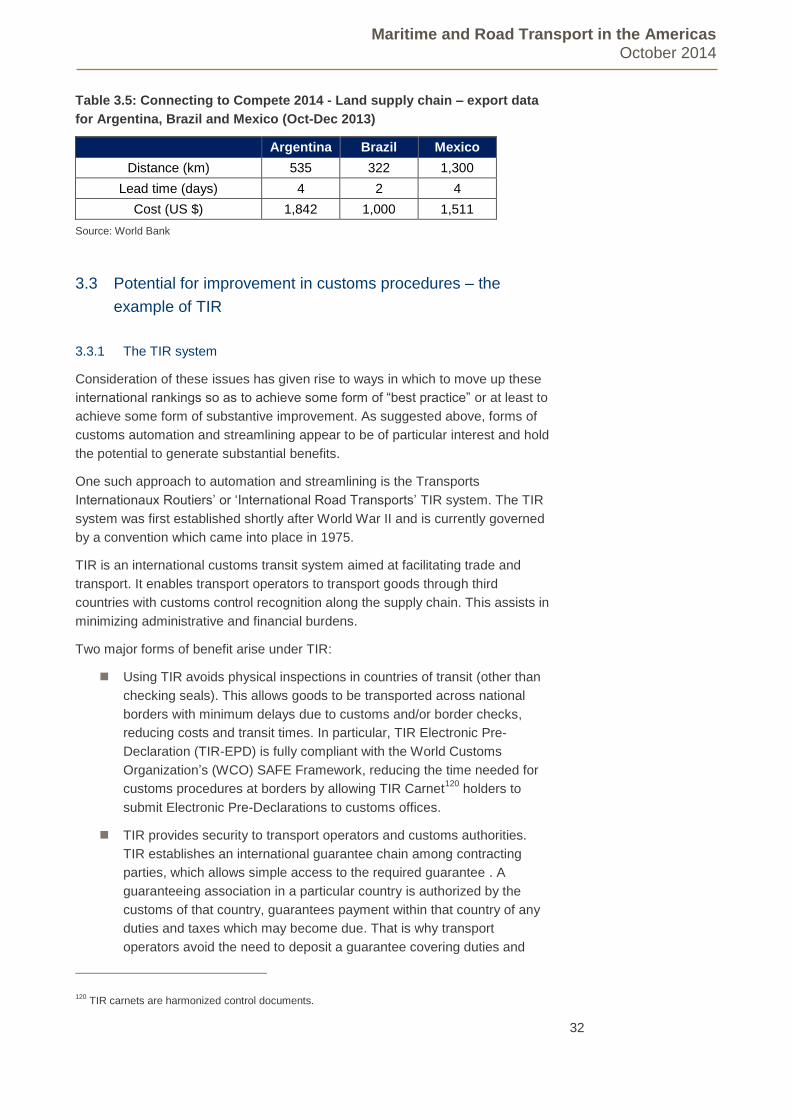
Maritime and Road Transport in the Americas October 2014
32
Table 3.5: Connecting to Compete 2014 - Land supply chain – export data
for Argentina, Brazil and Mexico (Oct-Dec 2013)
Argentina Brazil Mexico
Distance (km) 535 322 1,300
Lead time (days) 4 2 4
Cost (US $) 1,842 1,000 1,511
Source: World Bank
3.3 Potential for improvement in customs procedures – the
example of TIR
3.3.1 The TIR system
Consideration of these issues has given rise to ways in which to move up these
international rankings so as to achieve some form of “best practice” or at least to
achieve some form of substantive improvement. As suggested above, forms of
customs automation and streamlining appear to be of particular interest and hold
the potential to generate substantial benefits.
One such approach to automation and streamlining is the Transports
Internationaux Routiers’ or ‘International Road Transports’ TIR system. The TIR
system was first established shortly after World War II and is currently governed
by a convention which came into place in 1975.
TIR is an international customs transit system aimed at facilitating trade and
transport. It enables transport operators to transport goods through third
countries with customs control recognition along the supply chain. This assists in
minimizing administrative and financial burdens.
Two major forms of benefit arise under TIR:
Using TIR avoids physical inspections in countries of transit (other than
checking seals). This allows goods to be transported across national
borders with minimum delays due to customs and/or border checks,
reducing costs and transit times. In particular, TIR Electronic Pre-
Declaration (TIR-EPD) is fully compliant with the World Customs
Organization’s (WCO) SAFE Framework, reducing the time needed for
customs procedures at borders by allowing TIR Carnet120
holders to
submit Electronic Pre-Declarations to customs offices.
TIR provides security to transport operators and customs authorities.
TIR establishes an international guarantee chain among contracting
parties, which allows simple access to the required guarantee . A
guaranteeing association in a particular country is authorized by the
customs of that country, guarantees payment within that country of any
duties and taxes which may become due. That is why transport
operators avoid the need to deposit a guarantee covering duties and
120 TIR carnets are harmonized control documents.
Maritime and Road Transport in the Americas October 2014
33
taxes at transit borders. This reduces operator risk and uncertainty and
also serves to allow for reduced transit times.
In particular, the TIR Electronic Pre-Declaration (TIR-EPD) considerably
reduces the time needed for customs procedures at borders by allowing TIR
Carnet Holders to submit TIR Electronic Pre-Declarations to Customs offices of
entry/departure in a simple, standardized way. TIR-EPD provides customs with
all required TIR data well in advance of TIR truck arrival at border points,
allowing for appropriate risk management in advance, increasing customs
efficiency. Furthermore, the Real Time Safe TIR (RTS) mechanism enables
automatic transmission of the data on the termination of the TIR operation and
allows for prompt action to be taken if customs irregularities occurred.
The IRU in cooperation with the UN Economic Commission for Europe (UNECE)
is currently working on the implementation of a fully computerized version of TIR
system- eTIR , that would enable fully paperless exchange of all the information
related to the TIR procedure.
The TIR System is currently operational in 58 countries. These include all
European nations as well as several in North Africa and the Middle East. More
than 35,000 operators are currently authorized to use the TIR system. Some 3
million TIR carnets were issued in 2013.
Historically, TIR has been connected with freight movements by road and due to
such historical and geographical reasons, many of the users of the TIR system
have been in Eurasia, where land routes are of paramount importance.
However, TIR has recently expressed an interest in expanding into intermodal
transport. The TIR Convention allows for such transport provided that at least
one leg of the journey is carried out by road and transported goods are not
reloaded from the sealed load compartment en route. TIR therefore holds the
prospect of substantial intermodal benefits, with improved traffic flows in ports,
secure transport and smoother customs procedures. The IRU has consequently
developed a TIR Intermodal Program to facilitate intermodal traffic by identifying
ways in which the road-sea interface could be better harmonized and by seeking
to extend TIR to regions such as LAC.
Initial work examining the experience with Roll On-Roll-Off (RO-RO) ferries on
the Turkey-Trieste/Toulon route suggests that the route was shortened by 1-2
days through use of TIR.121
Other past work connected with TIR notes the
following:
The absence of harmonized procedures at borders can lead to up to 57
percent of transport time being lost at border crossings. This can also
create an environment conducive to unofficial levies amounting to
almost 38 percent of transport costs.122
121 Rojas, M. (2014) TIR for Global Intermodal Trade Facilitation.
122 IRU (2014) ‘IRU resolution on the WTO Bali Agreement’. Available at:
www.wto.org/english/forums_e/ngo_e/irubaligreement_e.pdf
Maritime and Road Transport in the Americas October 2014
34
Usage of TIR-EPD saves up to 50 percent of border waiting times for
transport operators, compared to border crossings without TIR-EPD.124
The development of TIR-EPD Green Lanes – dedicated lanes on both
sides of a given land border means that trucks in such lanes will be
subject only to scanning and shipment of their TIR carnet. This allows
customs to assess risks and determine which trucks should be subject
to specific controls in advance, allowing for speedy customs controls.
IRU estimates that this produces savings in transport time and costs of
up to 40 percent.125
Another approach to understanding the benefits of customs facilitation
measures such as TIR is to compare them to the costs of infrastructure
provision. IRU analysis of the Bishkek-Warsaw route suggests that for
$28 billion an additional two lanes could be added, cutting travel time by
3.9 days. However, if key UN customs facilitation methods were adopted
and border wait times were typically closer to minimum (0.4 days) as
opposed to maximum (4.5 days) than this would save 4.1 days.127
While the importance of appropriate infrastructure (globally and in LAC) is noted
above, the cost of implementing such trade facilitation measures is likely to be
far lower than infrastructure provision and, as this example suggests, has the
potential to yield benefits which are as high or higher than infrastructure
provision in some cases.
3.3.2 Quantification of potential for trade facilitation in LAC – TIR example
No LAC country currently implements TIR for land or intermodal services.
However, the discussion above suggests that the adoption of such systems
could yield substantial benefits for LAC nations.
The current report focuses on the potential for trade facilitation benefits for best
practices in intermodal maritime and transport in Argentina, Brazil and Mexico,
using TIR as an example of a best practice and some of the gains which might
be made. The following approach was adopted in order to derive some indicative
potential quantitative estimates of the adoption of a trade facilitation measure
such as TIR:
Path breaking work by Hummels (2001)128
and Hummels and Schaur
(2013)129
has investigated the role of time as a trade barrier. Hummels
and Schaur find that each day in transit is equivalent to an ad valorum
tariff of 0.6 to 2.1 per cent. Likewise, using Doing Business – Trading
124 Communication with the IRU on 8 July 2014, using IRU data based on TIR-EPD Users` feedback.
125 IRU, Implement TIR-EPD Green Lanes http://www.iru.org/cms-filesystem-action/mix-
publications/E-0303-1en.pdf
127 IRU (2013) The role of road transport in the globalised economy, Presentation in New York, 23
October 2013
128 Hummels, D., (2001) “Time as a Trade Barrier”, American Economic Review 103(7): 2935–2959.
129 ibid
Maritime and Road Transport in the Americas October 2014
35
Across Borders and other data over a sample of 126 countries Djankov
et al (2006) find that a 10 percent saving in time prior to export (e.g. due
to improved trade facilitation measures) increases exports by about 4
percent – i.e. an elasticity of 0.4 (or using their precise estimate
0.38).130
These analysts also find that for the median country in their
survey, a one day saving in time prior to export would result in a 1.2 per
cent increase in trade.
The Doing Business-Trading Across Borders Data for days taken in port
Customs clearance and technical control for Argentina (2 days), Brazil
(3 days) and Mexico (2 days) were examined and compared to
equivalent times in major European countries utilizing the TIR system
(generally 1 day). The difference between these two figures (i.e. 1 - 2
days) was used as a rough indicator of the potential reduction in time
the implementation of a TIR intermodal system could bring.
For land transport, LPI data on land transport lead times for Argentina,
Brazil and Mexico referred to above were utilized. Unlike the Trading
Across Borders data these effectively include total travel times (including
actual road transport). In order to estimate customs clearance times at
land borders of Argentina and Brazil the World Bank (2010)131
was used
as a reference source. This cited work by Barbero (2008) indicating that
average customs clearance times at Brazil-Argentinian and Argentinian-
Chilean borders were in the order of 14-18 hours. The mid-point of these
estimates (16 hours) was used.132
Based on the TIR results presented
above, it was assumed that use of TIR would cut these times by 50
percent.
In the case of Mexico, recent detailed analysis by Cedillo-Campus et al
(2014) suggests average US-Mexico border crossing times of 5.87
hours. This could be reduced to 3.40 hours if the truck used the
electronic transmission of cargo manifests under the Free and Secure
Trade (FAST) program. However, relatively few shipments are
registered under this program.133
The difference between these two was
130 Djankov, S., Freund, C., Pham C. “Trading on Time” (2006), World Bank Policy Research Working
Paper 3909, May 2006 Note that consistent with this dataset, this effect measures the effect of trade
facilitation on exports, as it is based on time taken to get from factory through customs to final export.
131 World Bank (2010) Uruguay Trade and Logistics: An Opportunity. (Report no. 52303-UY)
132 Note that this is close to the mid-point of land border clearance times (i.e. 20 hours) mentioned in
World Bank (2012). Earlier (2003) work by CEPAL-ECLAC suggested that 65 percent of land cargo
on the main Brazil-Argentina crossing point suffers delays of 30-36 hours (Bulletin FAL “Border
Crossings in Mercosur Countries: Obstacles and their Cost”, Issue 199 March 2003).
133 Registration into FAST works in conjunction with the Customs-Trade Partnership Against
Terrorism (C-TPAT). It is necessary to be part of C-TPAT in order to utilize FAST. FAST shipments
have dedicated lanes at the US-Mexico border and dedicated inspection booths. Their registration
into C-TPAT means they are considered low risk and therefore unlikely to be subject to secondary
inspection. FAST would therefore appear to share some of the characteristics of TIR-EPD. The
percentage reduction in customs clearance times implied by these figures (43 percent) is also similar
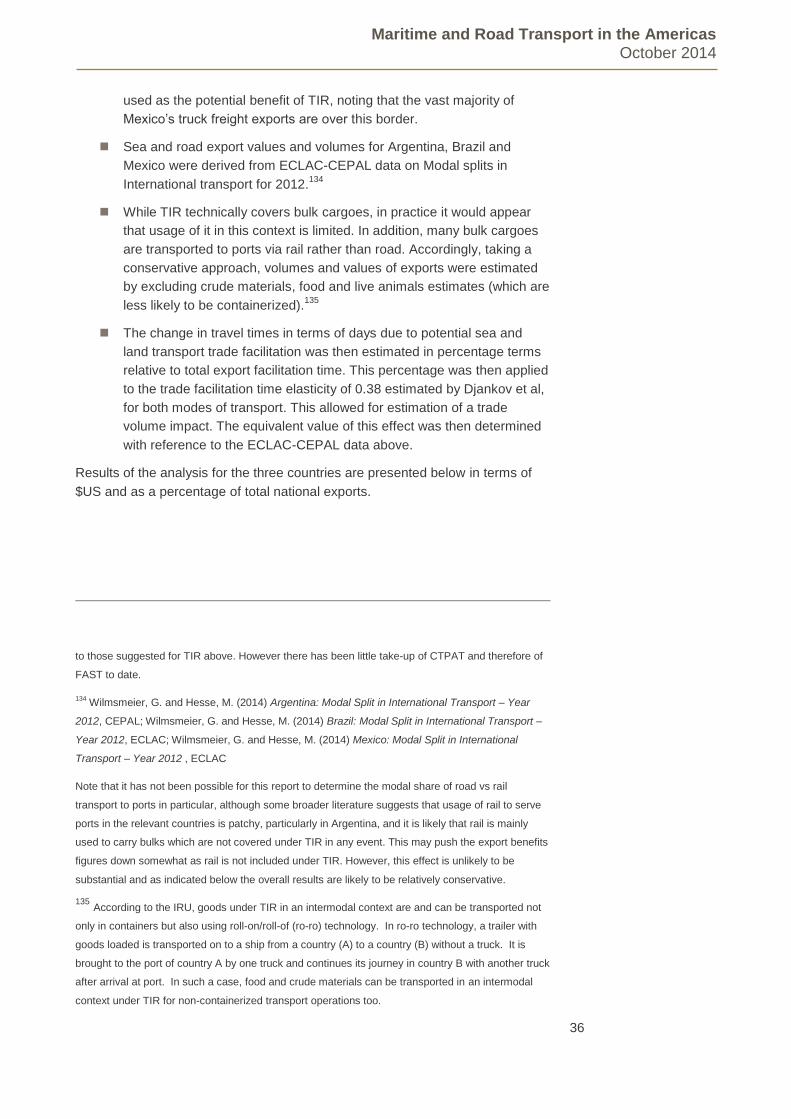
Maritime and Road Transport in the Americas October 2014
36
used as the potential benefit of TIR, noting that the vast majority of
Mexico’s truck freight exports are over this border.
Sea and road export values and volumes for Argentina, Brazil and
Mexico were derived from ECLAC-CEPAL data on Modal splits in
International transport for 2012.134
While TIR technically covers bulk cargoes, in practice it would appear
that usage of it in this context is limited. In addition, many bulk cargoes
are transported to ports via rail rather than road. Accordingly, taking a
conservative approach, volumes and values of exports were estimated
by excluding crude materials, food and live animals estimates (which are
less likely to be containerized).135
The change in travel times in terms of days due to potential sea and
land transport trade facilitation was then estimated in percentage terms
relative to total export facilitation time. This percentage was then applied
to the trade facilitation time elasticity of 0.38 estimated by Djankov et al,
for both modes of transport. This allowed for estimation of a trade
volume impact. The equivalent value of this effect was then determined
with reference to the ECLAC-CEPAL data above.
Results of the analysis for the three countries are presented below in terms of
$US and as a percentage of total national exports.
to those suggested for TIR above. However there has been little take-up of CTPAT and therefore of
FAST to date.
134 Wilmsmeier, G. and Hesse, M. (2014) Argentina: Modal Split in International Transport – Year
2012, CEPAL; Wilmsmeier, G. and Hesse, M. (2014) Brazil: Modal Split in International Transport –
Year 2012, ECLAC; Wilmsmeier, G. and Hesse, M. (2014) Mexico: Modal Split in International
Transport – Year 2012 , ECLAC
Note that it has not been possible for this report to determine the modal share of road vs rail
transport to ports in particular, although some broader literature suggests that usage of rail to serve
ports in the relevant countries is patchy, particularly in Argentina, and it is likely that rail is mainly
used to carry bulks which are not covered under TIR in any event. This may push the export benefits
figures down somewhat as rail is not included under TIR. However, this effect is unlikely to be
substantial and as indicated below the overall results are likely to be relatively conservative.
135 According to the IRU, goods under TIR in an intermodal context are and can be transported not
only in containers but also using roll-on/roll-of (ro-ro) technology. In ro-ro technology, a trailer with
goods loaded is transported on to a ship from a country (A) to a country (B) without a truck. It is
brought to the port of country A by one truck and continues its journey in country B with another truck
after arrival at port. In such a case, food and crude materials can be transported in an intermodal
context under TIR for non-containerized transport operations too.
Maritime and Road Transport in the Americas October 2014
37
Table 3.7: Potential increase in exports from TIR implementation ($ billion
US, 2012 and percentage of total exports, 2012)
These figures suggest that implementation of TIR would boost exports in the
three countries in question by $1-$5 billion for a total of $9 billion. In the case of
Argentina and Brazil most of the boost occurs through intermodal trade, while in
Mexico’s case it occurs through road transport (which is largely with the US).
Note that these figures are indicative but may be conservative as they consider
only time benefits of TIR and not the reduction in the costs to shippers (and/or
end customers) due to a reduced regulatory burden, risk, uncertainty and
security related issues.136
Further, TIR might also affect document preparation
time for sea transport (a factor which was not taken into account above). The
reduction in such costs and allowance for such factors might also be expected to
result in an increase in exports, which would be in addition to that estimated
above.
136 Notwithstanding this, time costs are likely to be more significant than direct financial ones. Past
APEC work based on Trading Across Borders data for containerized traffic suggests that costs of
trading account for only 12 percent of trade transaction costs whereas the value of time to trade
accounts for 88 percent of such costs.
Sohn (2013) ‘The Impact of aid for trade on the cost and time to Trade: The case of Latin America
and the Caribbean’, International Trade Series. ECLAC.
Total
value/pe
rcent of
national
exports
1 1.6 5 2.7 3.3 1.1
-Of which
from use
at sea
ports
(intermod
al)
0.7 4.1 1.5
-Of which
from use
in land
(road)
transport
0.3 0.8 1.8
Percent
increase
in total
export
value (%)
Argentina Brazil Mexico
Increase
in value
($US
billion)
Increase
in value
($US
billion)
Percent
increase
in total
export
value (%)
Increase
in value
($US
billion)
Percent
increase
in total
export
value (%)
Maritime and Road Transport in the Americas October 2014
38
4 Adoption of TIR system
4.1 Potential challenges to TIR implementation for LAC countries
Although Chile and Uruguay are contracting parties to the TIR Convention, no
country in LAC (or the Americas as a whole) is currently an operational member
of TIR for road or intermodal transport. Given the potential effects of TIR on the
three sample countries, estimated above and the more general benefits of trade
facilitation suggested by other studies, an obvious question is why LAC
countries do not adopt the TIR system. To some extent, this encapsulates a
broader question – why do LAC countries not adopt trade facilitation measures
which would appear to offer them clear benefits?
Oxford Economics had originally planned to conduct interviews with contacts in
Argentina, Brazil and Mexico to discuss this issue. However difficulties in
contacting potential participants meant that the only direct interview was with
Brazilian port officials. Additional written responses were obtained from the
Brazilian port officials and from the Argentinian National Customs Office.
Nonetheless, it is possible to suggest several reasons as to why this is the case:
Lack of knowledge about TIR – When questioned about this issue by
Oxford Economics, the IRU itself has suggested that the major reason
for the failure to take up TIR there is a lack of knowledge about the
benefits of TIR in countries such as Brazil and Argentina.137
Likewise, an
interview with Brazilian port officials (and a subsequent written
response) also suggested that information on TIR and its benefits had
not been widely disseminated in this sector, despite recent interest
shown in expanding TIR to international intermodal operations.138
It is
likely that both a lack of knowledge of TIR itself (and its historical
contribution to road transport) as well as a lack of knowledge of TIR’s
potential application to intermodal transport (which has only received
attention much more recently) are both issues here. It should be noted
however that the Argentinian National Customs Office has indicated that
it is aware of TIR and has studied the TIR system.
Historical/geographical reasons – TIR has found its greater popularity in
Eurasia where, for reasons of geography, land routes predominate.
Within Europe itself it was likely assisted by the presence of borders
within relatively short distances of major population and industrial
centers (implying a more pressing need for trade facilitation) and
development of the common market over a lengthy period after World
137 Communication with IRU (30 June 2014)
138 Communication with José Newton Barbosa Gama, Assessor Especial Secretaria de Portos Brazil
(28 July 2014)
Maritime and Road Transport in the Americas October 2014
39
War II.139
However, while Mexico’s trade is heavily dependent on road
freight to and from the US, countries such as Argentina and Brazil are
focused on sea trade with the outside world, with major population and
production centers some distance from borders and with intra-LAC trade
only becoming of more importance with the development of Mercosur
after 1991.140
Likewise, in the case of Mexico, NAFTA was only enacted
in 1994. Accordingly, a system which developed through harmonization
of road transport might have found less initial usage within such
countries and intermodal applications may have been less immediately
obvious. While there is now interest in promoting the intermodal benefits
of TIR, in particular, given the historical “head start” to TIRs usage in
pure road transport, and LAC trade patterns, it may not be surprising
that there has been less take-up in LAC.
The existence of other reform programs/systems – Regional trade
agreements may have had an impact on interest in take-up of TIR,
though such regional agreements may not be as effective as a TIR
system which is standardized and international in scope. To the extent
that NAFTA and MERCOSUR and/or internal country arrangements
have facilitated such agreements, these may be seen as reducing the
need for TIR. In the case of NAFTA in particular, Mexican trucks are
allowed to make deliveries within the United States (although without
long haul authority these deliveries are limited to a maximum of 25 miles
within the United States).
The response from the Argentinian National Customs Office also made
the following points:
139 ECLAC recently noted that overall intra-regional trace within South America (and indeed LAC)
has always been of less importance than is the case of for example the EU. The share of South
American trade (relative to total South American trade) doubled between the foundation of the Latin
American Integration Association (1980) and 2000 to 26 percent. It has since fallen slightly to 23
percent in 2010. ECLAC (2013), “The Evolution of Modal Split for Goods Transport in South
America, “Bulletin FAL Issue No. 325, Number 9, 2013. South America’s trade with the outside world
has been the subject of extensive debate in past decades including the arguments of “dependency
theorists”. It is possible to speculate that the more recent increase in trade may be due to the impact
of globalization and increasing trade with emerging markets such as China.
140 Based on Wilmsmeier, G. and Hesse, M. (2014) 75 percent of Brazil’s exports (by value) went to
non-LAC countries in 2012, while for Argentina the proportion was 55 percent. Sea transport
accounted for the vast majority of such transport. In the case of Mexico, 92 percent of its exports by
value are outside LAC, though, of these, 69 percent go by road. The great majority of these non-LAC
road exports are of course to the US. However, as the US likewise does not operate TIR,
implementation would need to be mutual. As noted below alternative systems have also been
developed for use along the US/Mexican border. Likewise it has been suggested that Chile’s failure
to move from contracting to implementation status has been due relatively fewer land borders than is
the case with Eurasian countries. Communication with Aleksandra Zaronina, Project Manager TIR-
EPD/Safe TIR IRU, 30 June 2014.
Maritime and Road Transport in the Americas October 2014
40
Argentina has been a signatory since 1990 to the Agreement on
International Land Transport (Acuerdo sobre Transporte
Internacional Terrestre (ATIT)), under the Agreement of Partial
Scope (Acuerdo de Alcance Parcial) within the framework of the
Latin American Integration Association (Asociacion
Latinoamericana de Integracion (ALADI)), whose other
signatories are Bolivia, Brazil, Chile, Paraguay, Peru and
Uruguay.
In 1991, in the 18th Meeting of the Ministers of Public Works
and Transportation of the Southern Cone countries (Argentina,
Bolivia, Brazil, Chile, Paraguay, Peru and Uruguay) a customs
agreement for trucking between countries was approved. This
agreement is now under revision to perhaps provide other types
of guarantees than those currently allowed for.
In 2004, Argentina signed an agreement with other
MERCOSUR countries to allow customs declarations to be
transmitted electronically. This agreement would also apply to
international transport via inland waterways. In 2009, they
approved the International Customs Transit Computerized
System (Sistema Informático del Tránsito Internacional
Aduanero (SINTIA)), which is a customs information
transmission mechanism as a pilot between Argentina, Chile,
and Paraguay.
Argentina has now expanded the SINTIA system to transport via
land to destination countries party to the ATIT agreement. In
fact, they feel that this system is satisfactory and they do not
need to be signatories to TIR.
The National Customs Office has stressed the importance of e-
documentation to streamline the process.
It is worth noting however that the Argentinian response appears to
suggest that the TIR Convention does not include an electronic customs
declaration. Partly for that reason, it is not seen as suiting Argentina's
goals in reducing the cost and time of customs transactions. TIR
Electronic Pre-declarations (TIR-EPD) system enables TIR Carnet
holders to submit TIR electronic pre-declarations to the customs offices
en route. Furthermore, IRU is currently working on an eTIR international
system that would enable fully paperless exchange of all the information
related to TIR procedure. Given that TIR does indeed include electronic
customs declaration, this suggests that there may be something of an
information gap which has forestalled any further interest in TIR.
Likewise, an interview with Brazilian port officials (and a subsequent
written response) indicated that the country was pursuing internal reform
mechanisms such as its Paperless Ports program (Porto sem Papel)
and Single Window for Foreign Trade (Portal Único de Comercio
Exterior). Among other things, these initiatives are envisaged as
allowing ships to send all port and customs-related documentation
Maritime and Road Transport in the Americas October 2014
41
through a single electronic point (the Paperless Port Information
System). It is hoped that these and other reform measures might reduce
the 13 days required for exports, cited above, to 8-10 days in the future.
This target suggests even greater trade facilitation benefits than those
(conservatively) modelled for TIR above, however full implementation of
this program has yet to occur.142
While the evidence above suggests that there is still much to do to meet
best practice and that TIR would nonetheless offer substantial benefits,
what may also be of relevance is that such countries perceive that they
should (or are) achieving such benefits through internal and/or regional
reform rather than via arrangements which historically largely been of
interest in Eurasia, such as TIR.
Further, electronic systems such as FAST, whose usage along the
US/Mexican border is discussed above, appear to offer a local
alternative to TIR-EPD despite their limited uptake to date. However,
TIR-EPD also offers a guarantee system that is not offered by FAST.
One of the IT risk management tools offered by the TIR system
establishes an international guarantee chain among contracting parties
and guarantees payment of any duties or taxes that may become due.
Institutional constraints – As part of the accession plan for the countries
who are interested in becoming parties to the TIR Convention, it is
recommended that such countries also ratify a package of other
international conventions related to trade facilitation.143
These include:
The Kyoto Convention
The Revised Kyoto Convention
The International Convention of the Harmonization of Frontier
Controls of Goods; and
The WCO SAFE framework of standards
Subscribing to such conventions is recommended rather than required per se
and the IRU works with accession countries144
. Nonetheless, notes to articles
19 and 22 of the TIR Convention state the following:145
142 Interview with José Newton Barbosa Gama, Assessor Especial Secretaria de Portos Brazil (28
July 2014).
143 Communication with Communication with IRU (17 July 2014).
144 The IRU has found that implementing the TIR system and applying TIR IT risk management tools
like TIR-EPD and SafeTIR, has enabled countries to meet the requirements of the above-mentioned
Conventions.
145 United Nations Economic Commission for Europe, The TIR Convention, 1975 (2013 Version)
http://www.unece.org/fileadmin/DAM/tir/handbook/english/newtirhand/TIR-
6Rev10EN_Convention.pdf
Maritime and Road Transport in the Americas October 2014
42
Specifications for Customs seals: The TIR Convention does
not address the issue of standards and requirements for
Customs seals’ requirements for Customs seals. It only
stipulates that, as a general rule, Contracting Parties must
accept Customs seals affixed by other Contracting Parties.
Thus, specification of Customs seals is left at the discretion of
national Customs authorities. However, with a view to ensuring
high security of Customs sealing, it is essential that Customs
administrations use seals which conform to up-to-date
international standards and requirements in this field. In this
context, the attention of Customs authorities is drawn to the
guidelines to Chapter 6 of the General Annex to the
International Convention on the Simplification and
Harmonization of Customs Procedures (revised Kyoto
Convention) as well as to minimum requirements for Customs
seals laid down in Specific Annex E, Chapter 1 of the said
Convention elaborated under the auspices of the World
Customs Organization (WCO). {TRANS/WP.30/216, paragraph
67 and Annex 2 and TRANS/WP.30/216/Corr.1;
TRANS/WP.30/AC.2/77 paragraph 54 and Annex 3}
While not a requirement, per se, membership of the Kyoto/revised Kyoto
Conventions would therefore appear to make TIR accession easier. However
the only countries in the Americas that are contracting parties are Canada, Cuba
and the United States.146
Factors such as these could represent additional
barriers to accession.
More broadly a recent global survey found that issues of confidentiality and
technical constraints and implementation costs were major barriers preventing
more widespread implementation of e-customs systems. In particular, a lack of
trust by traders that their information would be handled and stored securely, the
existence of a wide variety of – and widely differing data - standards and the
relatively high burden of implementation costs147
in emerging economies were all
cited by participants as important barriers.148
146 See http://www.wcoomd.org/en/topics/facilitation/instrument-and-
tools/conventions/pf_revised_kyoto_conv/instruments.aspx 147 Implementation costs for the countries where the TIR system has already become operational
have usually been jointly covered by the IRU and national customs authorities.
148 Urciuoli,L., Hintsa,J., Ahokas,J., (2013) “Drivers and barriers affecting usage of e-Customs – A
global survey of customs administrations using multivariate analysis techniques” Government
Information Quarterly 30(2013) 473–485.
Maritime and Road Transport in the Americas October 2014
43
5 References
Agostini, Claudio A. and Saavedra, Eduardo H. Chile: Port congestion and efficient rationing in
cargo transfer operations.
Australian Productivity Commission (2006) Road and Rail Freight Infrastructure Pricing, Road
transport Forum New Zealand. (Report no. 41) Available at:
http://www.rtfnz.co.nz/cms_show_download.php?id=267
Barbero, J. (2010) cites 2007 work by Hine indicating that in developing countries trucks account
for 70 percent of domestic freight task by volume and 80 percent by value. (See
http://www.ppiaf.org/freighttoolkit/knowledge-map/road)
Behar, A., Manners, P. and Nelson, B. (2011) Exports and International Logistics. Working paper
Bernhofen, D., El-Sahli, Z. and Kneller, R. (2012) Estimating the effects of the container revolution
on world trade.
Blonigen, A. B. and Wilson, W. W. (2006) Port efficiency and trade flows.
Blyde J & Iberti G A (2014) “Better Pathway to Export: How the Quality of Road Infrastructure
Affects Export Performance” The International Trade Journal, 28:1, 3-22
Canal de Panamá (2012) ‘Panama Canal Expansion Program.’
Carballo, Volpe Martincus and Cusolito, A. (2013) New roads to export: Insights from the Inca
roads. Available at: http://www.voxeu.org/article/new-roads-export-insights-inca-roads
Carballo, Volpe Martincus and Cusolito, A. (2013) "Routes, exports and employment in developing
countries: Following the trace of the Inca Roads", Inter-American Development Bank, mimeo.
Cedillo-Campos M., Sánchez-Ramírez,C, Vadali,S, Villa,J, Menezes,M (2014)
Supply chain dynamics and the ‘‘cross-border effect’’: The U.S.–Mexican border’s
case, Computers and Industrial Engineering Volume 72, June 2014, Pages 261–
273
Communication with Aleksandra Zaronina, Project Manager TIR-EPD/Safe TIR IRU, 30 June 2014
Communication with Aleksandra Zaronina of the IRU on 8 July 2014, using IRU data based on TIR-
EPD Users` feedback
Communication with Interview with Aleksandra Zaronina, Project Manager TIR-EPD/Safe TIR, IRU
17 July 2014
Communication with José Newton Barbosa Gama, Assessor Especial Secretaria de Portos Brazil
28 July 2014
Copenhagen Economics, (2014) Economic costs of the non-application of the TIR system by the
Russian Federation
Dennis, A. and Shepherd, B. (2007) Barriers to Entry, Trade Costs and Export Diversification in
Developing Countries. World Bank Working Paper.
EPRS (2014) ‘Weights and dimensions of road vehicles in the EU’ Available at:
http://epthinktank.eu/2014/04/10/weights-and-dimensions-of-road-vehicles-in-the-eu/
Maritime and Road Transport in the Americas October 2014
44
Febré, G. and Pérez Salas, G. (2012) ‘Intelligent transport systems in Latin American sea port
logistics’, Facilitation of Transport and Trade in Latin America and the Caribbean.( Issue No. 305)
UN ECLAC.
Federal Highway Administration, U.S. Department of Transportation (2003) ‘Scan Visits’, in Larry,
B. et al. (ed.) Freight Transportation: The Latin American Market. (pp. 21-59)
Freight Transport for Development (2014) Available at:
http://www.ppiaf.org/freighttoolkit/knowledge-map/road
Gonzalez, A., Guasch, L. and Serebrisky, T. (2008) Improving Logistics Costs for Transportation
and Trade Facilitation. World Bank Policy Research Working Paper 4558.
Guasch, J (2011) Logistics as a Driver for Competitiveness in Latin America and the Caribbean.
Inter-American Development Bank (Discussion Paper No. IDP-DP-193)
Gwilliam, K. Multi-Modal Transport Networks and Logistics. World Bank.
Hatch, A. (2014) Ten Years After: The Second Intermodal Revolution. Association of American
Railroads and the Intermodal Association of North America
Hummels D. and Schaur G., (2013) “Time as a Trade Barrier” American Economic Review 103(7):
2935–2959
Hummels, D. (2006) Global Trends in Trade and Transportation: Benefiting from Globalization:
Transport sector contribution and policy challenges. Berlin: 17th International Symposium on
Transport Economics and Policy.
Hummels, D. (2001) “Time as a Trade Barrier”, GTAP Working Paper, No.18
International Energy Agency (2013) Global Land Transport Infrastructure Requirements: Estimating
road and railway infrastructure capacity and costs to 2050
International Handbook of Maritime Economics, Edward Elgar Publishing, 2011.
IRU (2014) ‘IRU resolution on the WTO Bali Agreement’. Available at:
www.wto.org/english/forums_e/ngo_e/irubaligreement_e.pdf
IRU (2013) The role of road transport in the globalised economy, Presentation in New York, 23
October 2013
IRU, Implement TIR-EPD Green Lanes http://www.iru.org/cms-filesystem-action/mix-
publications/E-0303-1en.pdf
Kerem Cosar A, Demir B, “Domestic Road Infrastructure and International Trade: Evidence from
Turkey”, University of Chicago Booth School of Business
http://faculty.chicagobooth.edu/kerem.cosar/research/cd_roadsandtrade_2014.pdf
LaSalle, J. (2011) ‘The emergence of the inland port’.
Martincus, Volpe C. and Blyde, J. Shaky roads and trembling exports: Assessing the trade effects
of domestic infrastructure using a natural experiment.
Minor, P. and Tsigas, M. (2008) Impacts of Better Trade Facilitation in Developing Countries,”
Nathan Associates.
Monios, J. and Wilmsmeir, G. (2013) The role of intermodal transport in port regionalization.
Maritime and Road Transport in the Americas October 2014
45
Moreira, M., Volpe, C. and Blyde, J. (2008) Unclogging the Arteries: The Impact of Transport Costs
on Latin American and Caribbean Trade. Inter-American Development Bank.
Nordas, Hildegunn K. (2006) ‘Transport Time as a Trade Barrier’, Benefiting from Globalization:
Transport sector contribution and policy challenges. 17th International Symposium on Transport
Economics and Policy.
Notteboom, T. (2008) The relationship between seaports and the intermodal hinterland in light of global supply chains. OECD
OECD (2013) “The Potential Impact of Trade Facilitation Measures on Developing Countries Trade”, Trade Policy Papers No. 144
OECD (2012) Efficiency of world ports in container and bulk cargo (oil, coal, ores and grain) OECD
Regional Development Working Paper.
OECD (2011) Moving Freight with Better Trucks: Improving Safety, Productivity and Sustainability. Available at: http://dx.doi.org/10.1787/9789282102961-en
OECD (2009) Overcoming Border Bottlenecks – The Costs and Benefits of Trade Facilitation
Oxford Economics, Global Economics Databank.
Pérez Salas, G. (2012) ‘Port container traffic in Latin America and the Caribbean 2011’, Facilitation
of Transport and Trade in Latin America and the Caribbean. (Issue No. 307) UN ECLAC.
Persson, M (2012) ‘From trade preferences to trade facilitation: Taking stock of the issues,
Economics’, Economics: The Open-Access, Open-Assessment, 6(17), pp. 1-33
Pomfret, R. and Sourdin, P. (2010) ‘Trade Facilitation and the Measurement of Trade Costs’,
Journal of International Commerce, Economics, and Policy, 1(1) pp. 145-163.
Portugal-Perez, A. and Wilson, John S. (2010) Export Performance and Trade Facilitation Reform.
World Bank Policy Research Working Paper 5261.
Rodrigue,J. Comtois C. and Slack, B. (2006) The Geography of Transport Systems
Rojas, M. (2014) TIR for Global Intermodal Trade Facilitation.
Sarriera, M. (2013) Benchmarking Container Port Technical Efficiency in Latin America and the
Caribbean. IDB Working Paper Series No. IDB-WP-474.
Sida, K. (2009) Trade Facilitation and Maritime Transport: The Development Agenda. National
Board of Trade, and Swedish Maritime Administration.
Sohn (2013) ‘The Impact of aid for trade on the cost and time to Trade: The case of Latin America
and the Caribbean’, International Trade Series. ECLAC.
United Nations Economic Commission for Europe, The TIR Convention, 1975 (2013 Version)
http://www.unece.org/fileadmin/DAM/tir/handbook/english/newtirhand/TIR-
6Rev10EN_Convention.pdf
United Nations Conference on Trade and Development (UNCTAD) (2008) ‘Review of Maritime
Transport.’
United Nations Conference on Trade and Development (UNCTAD) (2013) ‘Review of Maritime
Transport.’
Maritime and Road Transport in the Americas October 2014
46
United Nations Conference on Trade and Development (UNCTAD) Trade and Development Board,
Trade and Development Commission ‘Recent developments and trends in international maritime
transport affecting trade of developing countries’ June 2013.
United Nations Conference on Trade and Development (UNCTAD) ‘World seaborne trade by types
of cargo and country groups’.
United Nations Economic Commission for Europe (UNECE) (2013) Connecting International Trade:
Single Windows and Supply Chains in the Next Decade.
Urciuoli, L., Hintsa, J. and Ahokas, J. (2013) ‘Drivers and barriers affecting usage of e-Customs —
A global survey with customs administrations using multivariate analysis techniques’, Government
Information Quarterly 30, pp. 473–485.
U.S. Maritime Administration (2009) America’s Ports and Intermodal Transportation System
Volpe Martincus C, Blyde, J (2013) “Shaky roads and trembling exports: Assessing the trade
effects of domestic infrastructure using a natural experiment” Journal of International Economics 90
(2013) 148–161
Wilmsmeier, G. and Hesse, M. (2014) Argentina: Modal Split in International
Transport – Year 2012, CEPAL
Wilmsmeier, G. and Hesse, M. (2014) Brazil: Modal Split in International
Transport – Year 2012, CEPAL
Wilmsmeier, G. and Hesse, M. (2014) Mexico: Modal Split in International
Transport – Year 2012 , CEPAL
Wilmsmeier, G. and Guidry, L. (2013) ‘The Evolution of Modal Split for Goods Transport in South
America’, Facilitation of Transport and Trade in Latin America and the Caribbean (Issue No 325)
UN ECLAC
Wilson, John S., Mann, Catherine L. and Otsuki, T. (2004) Assessing the Potential Benefit of Trade
Facilitation: A Global Perspective. World Bank Policy Research Working Paper 3224
World Bank (2014) Connecting to Compete 2014 Trade Logistics in the Global Economy The
Logistics Performance Index and Its Indicators
World Bank (2013) Doing business-Trading across borders. Available at:
http://www.doingbusiness.org/data/exploretopics/trading-across-borders
World Bank (2012) Road Freight in Central America, Five Explanations to High Costs of Service
Provision.
World Bank (2010) Uruguay Trade and Logistics: An Opportunity. (Report no. 52303-UY)
World Bank (2009) Freight Transport for Development Toolkit: Road Freight
World Bank Sustainable Development Department, Latin America and Caribbean Region (March
2010) ‘Southern Cone Inland Waterways Transportation Study- The Paraguay-Paraná Hidrovía: Its
Role in the Regional Economy and Impact on Climate Change.’
World Bank Development Research Group (2009) Weathering the Storm: Investing in Port
Infrastructure to Lower Trade Costs in East Asia. Policy Research Working Paper 4911.
World Trade Organisation (WTO) (2010) Road Freight Transport Services, Background Note by the
Secretariat S/C/W/324
Maritime and Road Transport in the Americas October 2014
47
Acknowledgements The authors of this report would like to thank the following members of the steering committee from the two sponsoring institutions for this study: Jorge Duran (Organization of American States) Ernesto Fernandez (Organization of American States) Ksenia Kasko (International Road Transport Union) Dalida Matic (International Road Transport Union) Rosine Plank-Brumback (Organization of American States) Marek Retelski (International Road Transport Union) Igor Runov (International Road Transport Union) Aleksandra Zaronina (International Road Transport Union) We would also like to thank the following individuals who assisted in this research study: Juan Chimento (Subsecretaría de Puertos y Vías Navegables, Argentina) Jose Newton Barbosa Gama, (Secretaria de Portos, Brazil) This research was made possible with the financial contribution of: IRU
and with support from: Secretaría de Comunicaciones y Transportes de México
Maritime and Road Transport in the Americas October 2014
48
OXFORD
Abbey House, 121 St Aldates
Oxford, OX1 1HB, UK
Tel: +44 1865 268900
LONDON
Broadwall House, 21 Broadwall
London, SE1 9PL, UK
Tel: +44 207 803 1400
BELFAST
Lagan House, Sackville Street
Lisburn, BT27 4AB, UK
Tel: +44 28 9266 0669
NEW YORK
817 Broadway, 10th Floor
New York, NY 10003, USA
Tel: +1 646 786 1863
PHILADELPHIA
303 Lancaster Avenue, Suite 1b
Wayne PA 19087, USA
Tel: +1 610 995 9600
.
Related Documents