Simulation of power market analyzes using optimal power flow in power world simulator Kannadasan Raju P. Valsalal College of Engineering, Division of Power System Engineering, Anna University, Chennai, India Abstract- In this work, a Newton-based optimal power flow (OPF) is used for power market analyze in simulation environment. The OPF performs many role in the system namely line overload removal, enforce the constraints, bus marginal control, transmission line marginal control, super area control etc….this can simulated by using power world simulator. The sample case study is used to implement the OPF for market analyze. The main goal of using optimal power flow (OPF) in this paper is to determine the “best” way to instantaneously operate a power system, and also discussed the various ways to reduce the marginal cost of both buses and lines under constraints. Power world simulator employs linear programming method for finding optimal solution. Key Words: OPF (Optimal power flow), power market, constraints, super areas, Power World Simulator. I. INTRODUCTION During the past two decades, the increase in electrical energy demand has presented higher requirements from the power industry. More power plants, substations, and transmission lines need to be constructed. However, the most commonly used devices in present power grid are the mechanically- controlled circuit breakers. The long switching periods and discrete operation make them difficult to handle the frequently changed loads smoothly. In order to compensate these drawbacks, large operational margins and redundancies are maintained to protect the system from dynamic variation and recover from faults. This not only increases the cost and lowers the efficiency, but also increases the complexity of the system and augments the difficulty of operation and control. Severe black-outs happened recently in power grids worldwide and these have revealed that conventional transmission systems are unable to manage the control requirements of the complicated interconnections and variable power flow. One of the cornerstones of any restructuring plan is the ability to operate the transmission system in a manner which is fair to all participants in the industry. In Indian country, the Energy Regulatory Commission oversees issues involving the transmission system. It presently believes that the only manner

Welcome message from author
This document is posted to help you gain knowledge. Please leave a comment to let me know what you think about it! Share it to your friends and learn new things together.
Transcript
Simulation of power marketanalyzes using optimal power flow
in power world simulator Kannadasan Raju P.
ValsalalCollege of Engineering, Division of Power System Engineering,
Anna University, Chennai, India
Abstract-In this work, a Newton-basedoptimal power flow (OPF) is used for powermarket analyze in simulation environment.The OPF performs many role in the systemnamely line overload removal, enforce theconstraints, bus marginal control,transmission line marginal control, superarea control etc….this can simulated byusing power world simulator. The samplecase study is used to implement the OPFfor market analyze. The main goal of usingoptimal power flow (OPF) in this paper isto determine the “best” way toinstantaneously operate a power system,and also discussed the various ways toreduce the marginal cost of both buses andlines under constraints. Power worldsimulator employs linear programmingmethod for finding optimal solution.
Key Words: OPF (Optimal power flow), powermarket, constraints, super areas, PowerWorld Simulator.
I. INTRODUCTION During the past two decades, the
increase in electrical energy demandhas presented higher requirements fromthe power industry. More power plants,substations, and transmission linesneed to be constructed. However, the
most commonly used devices in presentpower grid are the mechanically-controlled circuit breakers. The longswitching periods and discreteoperation make them difficult to handlethe frequently changed loads smoothly.In order to compensate these drawbacks,large operational margins andredundancies are maintained to protectthe system from dynamic variation andrecover from faults. This not onlyincreases the cost and lowers theefficiency, but also increases thecomplexity of the system and augmentsthe difficulty of operation andcontrol. Severe black-outs happenedrecently in power grids worldwide andthese have revealed that conventionaltransmission systems are unable tomanage the control requirements of thecomplicated interconnections andvariable power flow. One of thecornerstones of any restructuring planis the ability to operate thetransmission system in a manner whichis fair to all participants in theindustry. In Indian country, the EnergyRegulatory Commission oversees issuesinvolving the transmission system. Itpresently believes that the only manner
in which everyone will be on an equalplaying field is to create open accessto all. In order to achieve the idealof open access, many outstandingengineering problems will need to beinvestigated and tools created fortheir solution.It is very important that theseproblems be addressed early in therestructuring process. If theseengineering problems becomeovershadowed by short term economicconcerns, then the result could bedecreased electricity reliability. Inthe past year, the north Indian gridhas seen the consequences of pushingthe transmission system too hard on twoseparate occasions.The major blackouts in the northern
grid system in the last several monthshappened and affected heavily. The workpresented in this paper utilizes anoptimal power flow program, OPF, as thetool for solving many problems likeline overloading removal, bus marginalcost control, line marginal cost, superarea controls etc… The OPF is anatural choice for addressing theseconcerns because it is basically anoptimal control problem. The OPFutilizes all control variables to helpminimize the costs of the power systemoperation. It also yields valuableeconomic information and insight intothe power system. In these ways, theOPF very adeptly addresses both thecontrol and economic problems. Aftercreating the OPF program, the user-interface and simulation problems mayalso be addressed by implementing theOPF into a power system simulator. Inthis way, the results of the economicand control operations of the OPF caneasily be utilized by the user of theprogram.
II. OPTIMAL POWER FLOW CONTROL
A. OverviewThe OPF program written in
conjunction with this paper usesNewton’s method as its solutionalgorithm. It will tackle all of thegoals set forth for an OPF except thecontrol of switched shunts and otherFACTS devices. The control of these maybe added at a later time as desired.The following section of this paperwill discuss the theory of the Newton-based optimal power flow. It will lay aframework for the mathematics andengineering behind the OPF computersource code. And also this paper showsseveral sample applications of the OPF.The sample applications discussed willinclude transmission line overloadremoval, super area control, busmarginal control and transmissionmarginal pricing control. Finally, itwill conclude with a summary andseveral improvements which would aid increating a truly useful OPF.
B. Role of OPFOptimal Power Flow (OPF) plays an
important role in power systemoperations and planning. In the normaloperating condition OPF is used todetermine the load flow solution whichsatisfies the system operating limitsand minimize the generation costs.Before beginning the creation of anOPF, it is useful to consider the goalsthat the OPF will need to accomplish.The primary goal of a generic OPF is tominimize the costs of meeting the loaddemand for a power system whilemaintaining the security of the system.Each transmission line and transformerhas a limit on the amount of power thatcan be transmitted through it, with thelimit arising because of thermal,voltage as stability considerations.The costs associated with the power
system may depend on the situation, butin general they can be attributed tothe cost of generating power(megawatts) at each generator. From theviewpoint of an OPF, the maintenance ofsystem security requires keeping eachdevice in the power system within itsdesired operation range at steady-state. This will include maximum andminimum outputs for generators, maximumMVA flows on transmission lines andtransformers, as well as keeping systembus voltages within specified ranges.It should be noted that the OPF onlyaddresses steady-state operation of thepower system. Traditionally, thetransmission system was designed sothat when the generation was dispatchedeconomically there should be no limitviolations. To achieve these goals, theOPF will perform all the steady-statecontrol functions of the power system.Hence, with the worldwide trend towardsde-regulation of the electric utilityindustry, the transmission system isbecoming increasingly constrained.These functions may include generatorcontrol and transmission systemcontrol. However, when one or moreelements loaded to their limits theeconomic dispatch become constrainedand the bus marginal energy prices areno longer identical.
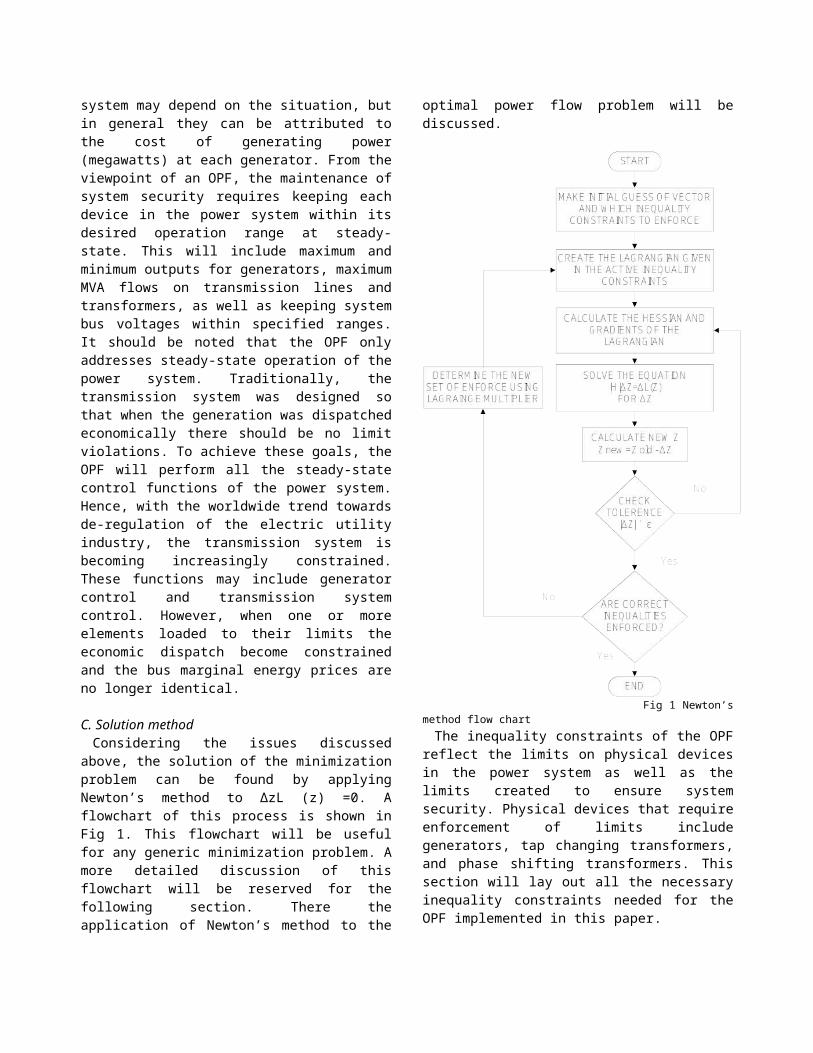
C. Solution methodConsidering the issues discussed
above, the solution of the minimizationproblem can be found by applyingNewton’s method to ΔzL (z) =0. Aflowchart of this process is shown inFig 1. This flowchart will be usefulfor any generic minimization problem. Amore detailed discussion of thisflowchart will be reserved for thefollowing section. There theapplication of Newton’s method to the
optimal power flow problem will bediscussed.
Fig 1 Newton’smethod flow chartThe inequality constraints of the OPF
reflect the limits on physical devicesin the power system as well as thelimits created to ensure systemsecurity. Physical devices that requireenforcement of limits includegenerators, tap changing transformers,and phase shifting transformers. Thissection will lay out all the necessaryinequality constraints needed for theOPF implemented in this paper.
Generators have maximum and minimumoutput powers and reactive powers whichadd inequality constraints. PGi min ≤ PGi ≤PGi
max
QGi min ≤ QGi ≤QGi max
Load tap changing transformers have amaximum and a minimum tap ratio whichcan be achieved and phase shiftingtransformers have a maximum and aminimum phase shift, which can beachieved. Both of these createinequality constraints. km min ≤ km ≤ km
max
tkm min ≤ tkm ≤tkm max
These ratings may come from thermalratings (current ratings) ofconductors, or they may be set to alevel due to system stability concerns.The determination of these MVA ratingswill not be of concern in this thesis.It is assumed that they are given.Regardless, these MVA ratings willresult in another inequalityconstraint. To make the mathematicsless complex, the constraint used inthe OPF will limit the square of theMVA flow on a transformer ortransmission line.
│Skm│2 -│Skm max│2 ≤ 0
To maintain the quality of electricalservice and system security, busvoltages usually have maximum andminimum magnitudes. These limits againrequire the addition of inequalityconstraints.
Vi min ≤ Vi ≤
Vi max.
III. SIMULATION ENVIRONMENT
While a single OPF solution yieldsvaluable information regarding a powersystem, the implementation of the OPFinto a power system simulationenvironment holds even greater promise.In this environment, simulation of asystem over time can be done whilemaintaining it at its optimalcondition. In this way, a vast amountof economic data can be gleaned fromthe simulation. This section will giveseveral examples of the use of the OPFcode as implemented into the powersystem simulator, POWERWORLD. It is apower system simulation packagedesigned from the ground up to be user-friendly and highly interactive.Simulator has the power for seriousengineering analysis, but it is also sointeractive and graphical that it canbe used to explain power systemoperations to non-technical audiences.Simulator consists of a number ofintegrated products. At its core is acomprehensive, robust Power FlowSolution engine capable of efficientlysolving systems of up to 100,000 buses.This makes Simulator quite useful as astand-alone power flow analysispackage.
A. Line overload removalA simple power system not operating
under the OPF control is shown in Fig2. It consists of 3 buses, 3 lines, 3generators and one load which islocated at bus 3 and it consumes 180MW. After the simulation, the line frombus 1 to bus 3 is overloaded by 120%and all the buses have the samemarginal cost of $10MWh. All the buses
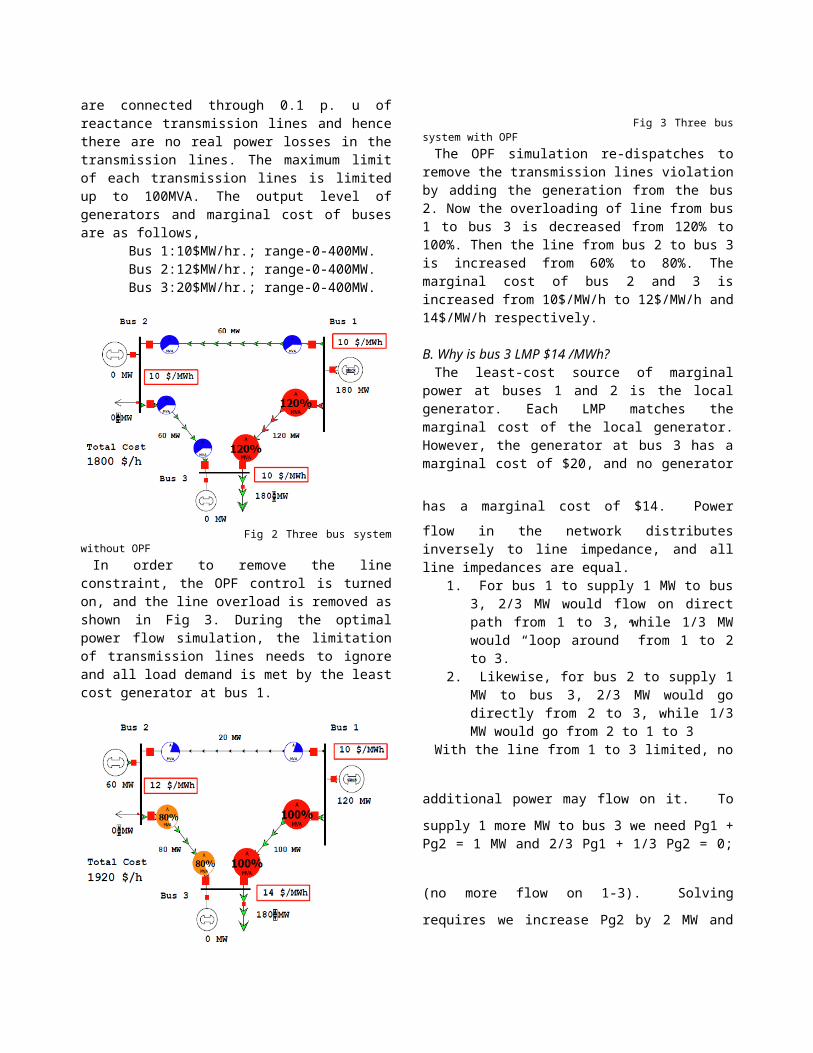
are connected through 0.1 p. u ofreactance transmission lines and hencethere are no real power losses in thetransmission lines. The maximum limitof each transmission lines is limitedup to 100MVA. The output level ofgenerators and marginal cost of busesare as follows,
Bus 1:10$MW/hr.; range-0-400MW.Bus 2:12$MW/hr.; range-0-400MW.Bus 3:20$MW/hr.; range-0-400MW.
Fig 2 Three bus systemwithout OPFIn order to remove the line
constraint, the OPF control is turnedon, and the line overload is removed asshown in Fig 3. During the optimalpower flow simulation, the limitationof transmission lines needs to ignoreand all load demand is met by the leastcost generator at bus 1.
Fig 3 Three bussystem with OPFThe OPF simulation re-dispatches to
remove the transmission lines violationby adding the generation from the bus2. Now the overloading of line from bus1 to bus 3 is decreased from 120% to100%. Then the line from bus 2 to bus 3is increased from 60% to 80%. Themarginal cost of bus 2 and 3 isincreased from 10$/MW/h to 12$/MW/h and14$/MW/h respectively.
B. Why is bus 3 LMP $14 /MWh?The least-cost source of marginal
power at buses 1 and 2 is the localgenerator. Each LMP matches themarginal cost of the local generator.However, the generator at bus 3 has amarginal cost of $20, and no generator
has a marginal cost of $14. Powerflow in the network distributesinversely to line impedance, and allline impedances are equal.
1. For bus 1 to supply 1 MW to bus3, 2/3 MW would flow on directpath from 1 to 3, while 1/3 MWwould “loop around” from 1 to 2to 3.
2. Likewise, for bus 2 to supply 1MW to bus 3, 2/3 MW would godirectly from 2 to 3, while 1/3MW would go from 2 to 1 to 3
With the line from 1 to 3 limited, no
additional power may flow on it. Tosupply 1 more MW to bus 3 we need Pg1 +Pg2 = 1 MW and 2/3 Pg1 + 1/3 Pg2 = 0;
(no more flow on 1-3). Solvingrequires we increase Pg2 by 2 MW and
decrease Pg1 by 1 MW: a net costincrease of $14.
C. Bus Marginal ControlsIn the OPF Options and Results tab in
power world simulator, the bus marginalcontrol tool is available to identifythe marginal units for each bus.
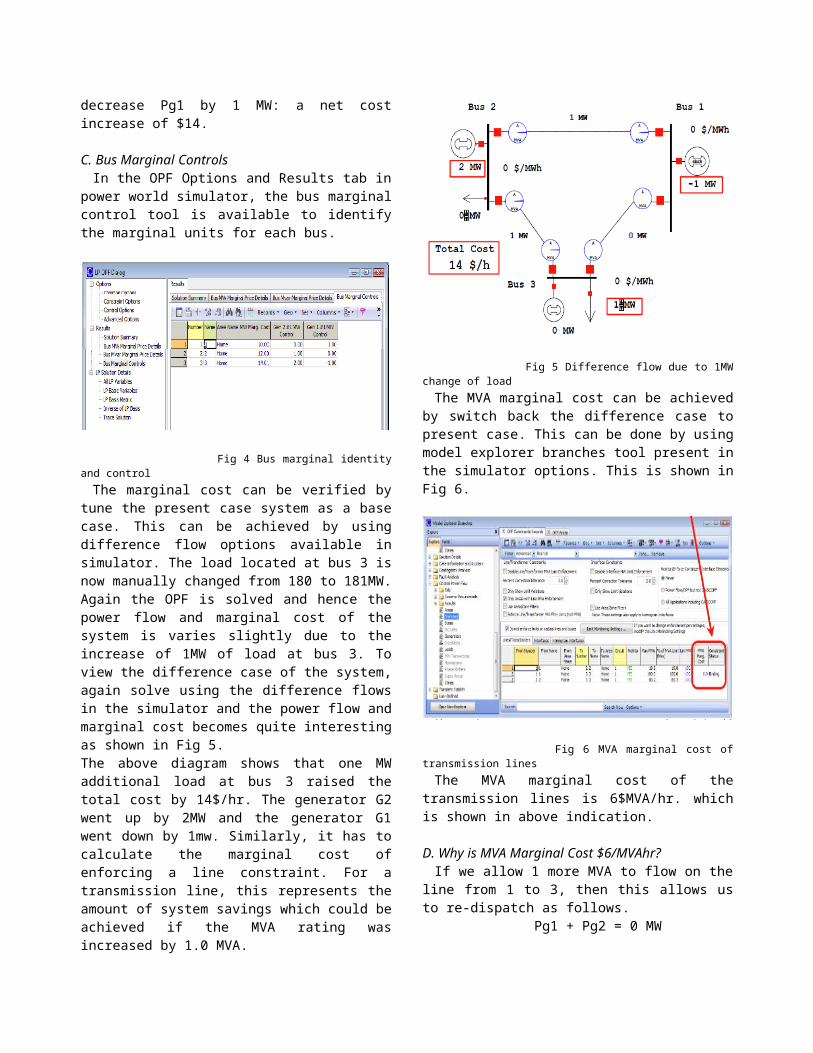
Fig 4 Bus marginal identityand controlThe marginal cost can be verified by
tune the present case system as a basecase. This can be achieved by usingdifference flow options available insimulator. The load located at bus 3 isnow manually changed from 180 to 181MW.Again the OPF is solved and hence thepower flow and marginal cost of thesystem is varies slightly due to theincrease of 1MW of load at bus 3. Toview the difference case of the system,again solve using the difference flowsin the simulator and the power flow andmarginal cost becomes quite interestingas shown in Fig 5.The above diagram shows that one MWadditional load at bus 3 raised thetotal cost by 14$/hr. The generator G2went up by 2MW and the generator G1went down by 1mw. Similarly, it has tocalculate the marginal cost ofenforcing a line constraint. For atransmission line, this represents theamount of system savings which could beachieved if the MVA rating wasincreased by 1.0 MVA.
Fig 5 Difference flow due to 1MWchange of loadThe MVA marginal cost can be achieved
by switch back the difference case topresent case. This can be done by usingmodel explorer branches tool present inthe simulator options. This is shown inFig 6.
Fig 6 MVA marginal cost oftransmission linesThe MVA marginal cost of the
transmission lines is 6$MVA/hr. whichis shown in above indication.
D. Why is MVA Marginal Cost $6/MVAhr?If we allow 1 more MVA to flow on the
line from 1 to 3, then this allows usto re-dispatch as follows. Pg1 + Pg2 = 0 MW
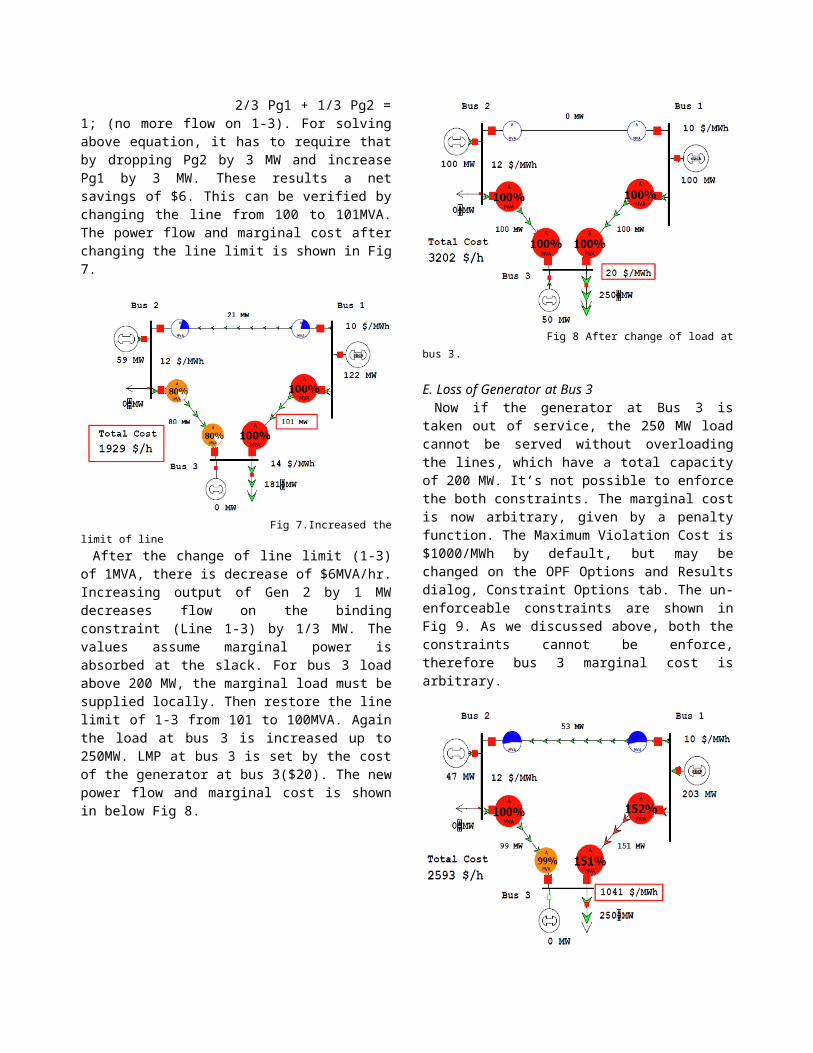
2/3 Pg1 + 1/3 Pg2 =1; (no more flow on 1-3). For solvingabove equation, it has to require thatby dropping Pg2 by 3 MW and increasePg1 by 3 MW. These results a netsavings of $6. This can be verified bychanging the line from 100 to 101MVA.The power flow and marginal cost afterchanging the line limit is shown in Fig7.
Fig 7.Increased thelimit of lineAfter the change of line limit (1-3)
of 1MVA, there is decrease of $6MVA/hr.Increasing output of Gen 2 by 1 MWdecreases flow on the bindingconstraint (Line 1-3) by 1/3 MW. Thevalues assume marginal power isabsorbed at the slack. For bus 3 loadabove 200 MW, the marginal load must besupplied locally. Then restore the linelimit of 1-3 from 101 to 100MVA. Againthe load at bus 3 is increased up to250MW. LMP at bus 3 is set by the costof the generator at bus 3($20). The newpower flow and marginal cost is shownin below Fig 8.
Fig 8 After change of load atbus 3.
E. Loss of Generator at Bus 3Now if the generator at Bus 3 is
taken out of service, the 250 MW loadcannot be served without overloadingthe lines, which have a total capacityof 200 MW. It’s not possible to enforcethe both constraints. The marginal costis now arbitrary, given by a penaltyfunction. The Maximum Violation Cost is$1000/MWh by default, but may bechanged on the OPF Options and Resultsdialog, Constraint Options tab. The un-enforceable constraints are shown inFig 9. As we discussed above, both theconstraints cannot be enforce,therefore bus 3 marginal cost isarbitrary.
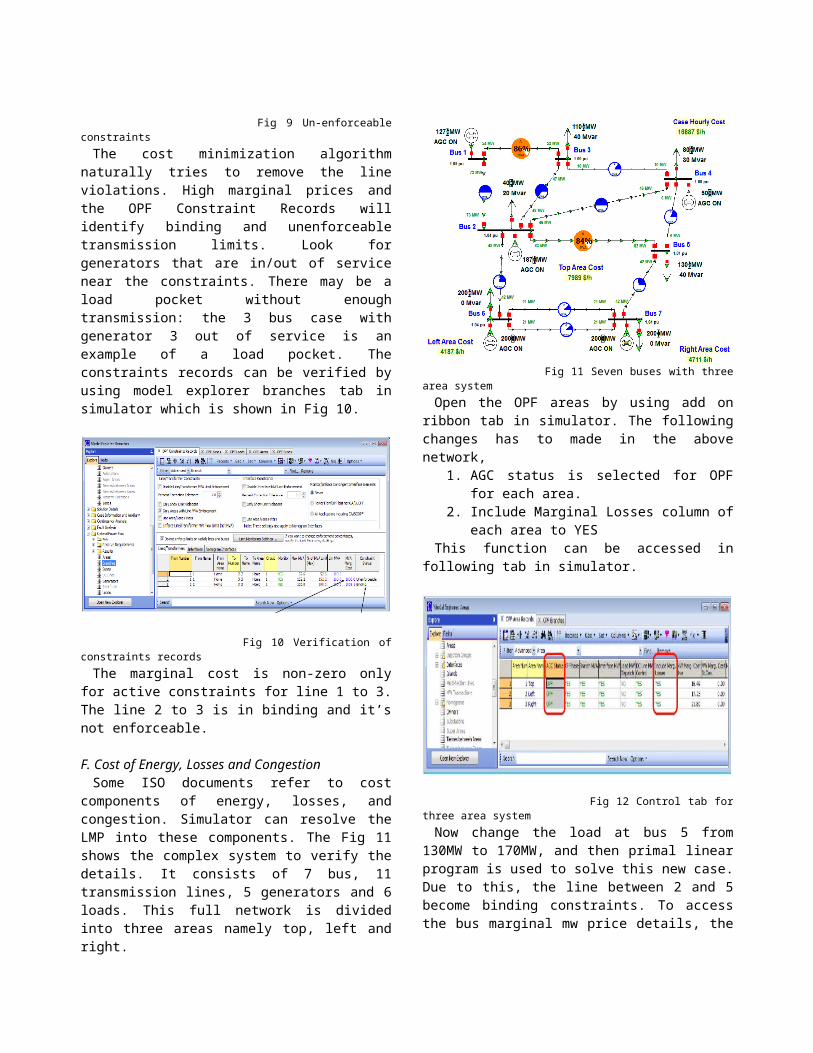
Fig 9 Un-enforceableconstraintsThe cost minimization algorithm
naturally tries to remove the lineviolations. High marginal prices andthe OPF Constraint Records willidentify binding and unenforceabletransmission limits. Look forgenerators that are in/out of servicenear the constraints. There may be aload pocket without enoughtransmission: the 3 bus case withgenerator 3 out of service is anexample of a load pocket. Theconstraints records can be verified byusing model explorer branches tab insimulator which is shown in Fig 10.
Fig 10 Verification ofconstraints recordsThe marginal cost is non-zero only
for active constraints for line 1 to 3.The line 2 to 3 is in binding and it’snot enforceable.
F. Cost of Energy, Losses and CongestionSome ISO documents refer to cost
components of energy, losses, andcongestion. Simulator can resolve theLMP into these components. The Fig 11shows the complex system to verify thedetails. It consists of 7 bus, 11transmission lines, 5 generators and 6loads. This full network is dividedinto three areas namely top, left andright.
Fig 11 Seven buses with threearea systemOpen the OPF areas by using add on
ribbon tab in simulator. The followingchanges has to made in the abovenetwork,
1. AGC status is selected for OPFfor each area.
2. Include Marginal Losses column ofeach area to YES
This function can be accessed infollowing tab in simulator.
Fig 12 Control tab forthree area systemNow change the load at bus 5 from
130MW to 170MW, and then primal linearprogram is used to solve this new case.Due to this, the line between 2 and 5become binding constraints. To accessthe bus marginal mw price details, the
OPF tab is used to verify the Energy,Congestion, and Losses.Return to OPF Case Info and set OPF
Areas. The Cost of Energy, Loss, andCongestion Reference option group is inthe lower left. Similar settings may befound on the Super Area dialog.Super areas are a record structure usedto hold a set of areas. This work likeISOs: a number of control areas aredispatched as though they were a singlearea, without fixed interchangesbetween the individual areas. Arearecords are preserved for calculationof average prices, exports, and otherquantities. For a super area to be usedin the OPF, its AGC status field mustbe OPF.
G. Super area controlTo make the comparison, set the
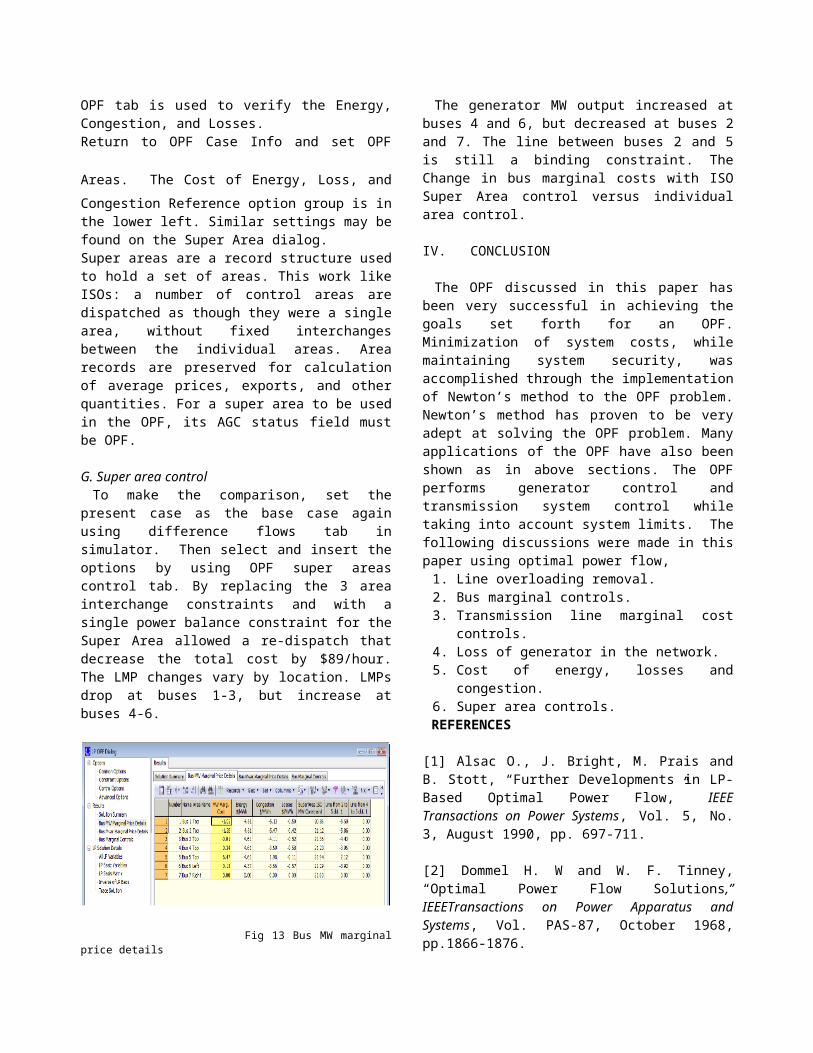
present case as the base case againusing difference flows tab insimulator. Then select and insert theoptions by using OPF super areascontrol tab. By replacing the 3 areainterchange constraints and with asingle power balance constraint for theSuper Area allowed a re-dispatch thatdecrease the total cost by $89/hour.The LMP changes vary by location. LMPsdrop at buses 1-3, but increase atbuses 4-6.
Fig 13 Bus MW marginalprice details
The generator MW output increased atbuses 4 and 6, but decreased at buses 2and 7. The line between buses 2 and 5is still a binding constraint. TheChange in bus marginal costs with ISOSuper Area control versus individualarea control.
IV. CONCLUSION
The OPF discussed in this paper hasbeen very successful in achieving thegoals set forth for an OPF.Minimization of system costs, whilemaintaining system security, wasaccomplished through the implementationof Newton’s method to the OPF problem.Newton’s method has proven to be veryadept at solving the OPF problem. Manyapplications of the OPF have also beenshown as in above sections. The OPFperforms generator control andtransmission system control whiletaking into account system limits. Thefollowing discussions were made in thispaper using optimal power flow,1. Line overloading removal.2. Bus marginal controls.3. Transmission line marginal cost
controls.4. Loss of generator in the network.5. Cost of energy, losses and
congestion.6. Super area controls.
REFERENCES
[1] Alsac O., J. Bright, M. Prais andB. Stott, “Further Developments in LP-Based Optimal Power Flow,” IEEETransactions on Power Systems, Vol. 5, No.3, August 1990, pp. 697-711.
[2] Dommel H. W and W. F. Tinney,“Optimal Power Flow Solutions,”IEEETransactions on Power Apparatus andSystems, Vol. PAS-87, October 1968,pp.1866-1876.
[3] Huneault M. and F. D. Galiana, “ASurvey of the Optimal Power FlowLiterature,” IEEE Transactions on PowerSystems, Vol. 6, No. 2, May 1991, pp.762-770.
[4] Interactive power systemsimulation, analysis and Visualization,Power world corporation user guide,version 14.
[5] Liu E., A. D. Papalexopoulos and W.F. Tinney, “Discrete Shunt Controls inA Newton Optimal Power Flow,” IEEETransactions on Power Systems, Vol. 7, No.4, November 1992, pp. 1519-1528.
[6] Shirmohammadi D., X.V. Filho, B.Gorenstin and M. Pereira, “Somefundamental technical concepts aboutcost based transmission pricing,” IEEETransactions on Power Systems, Vol. 11, No.2, May 1996, pp. 1002-1008.
[7] Tinney W. F. and C. E. Hart,“Power Flow Solution by Newton’sMethod,” IEEE Transactions on Power Apparatusand Systems, Vol. PAS-86, No. 11,November 1967, pp. 1866-1876.
[8] Tabors R. D., “Transmission SystemManagement and Pricing: New Paradigmsand International Comparisons,” IEEETransactions on Power Systems, Vol. 9, No.1, February 1994, pp. 206-215.
[9] Wood A. J. and B. F. Wollenberg,Power Generation Operation and Control, NewYork, NY: John Wiley & Sons, Inc.,1996, pp. 39,517. BIOGRAPHIES
R. Kannadasan Raju graduated from Veltech engineering college, Chennai inthe year 2010. Presently he is doinghis M.E. in Power System Engineeringfrom College of Engineering Guindy,Anna University Chennai. His researchareas are transmission lines andlocation of FACTS devices.
P. Valsalal graduated from, BharathiarUniversity in the year 1990. Sheobtained her M.E. and Ph.D. in
Electrical Engineering from College ofEngineering Guindy, Anna UniversityChennai in 1993 and 2006 respectively.Currently she is working as AssociateProfessor in the Department ofElectrical and Electronics Engineering,Anna University, Chennai, India. Herresearch areas are power systemtransients, insulation coordination ofGIS, surge arrester modelling, Powerquality, power system restoration.
APPENDIX
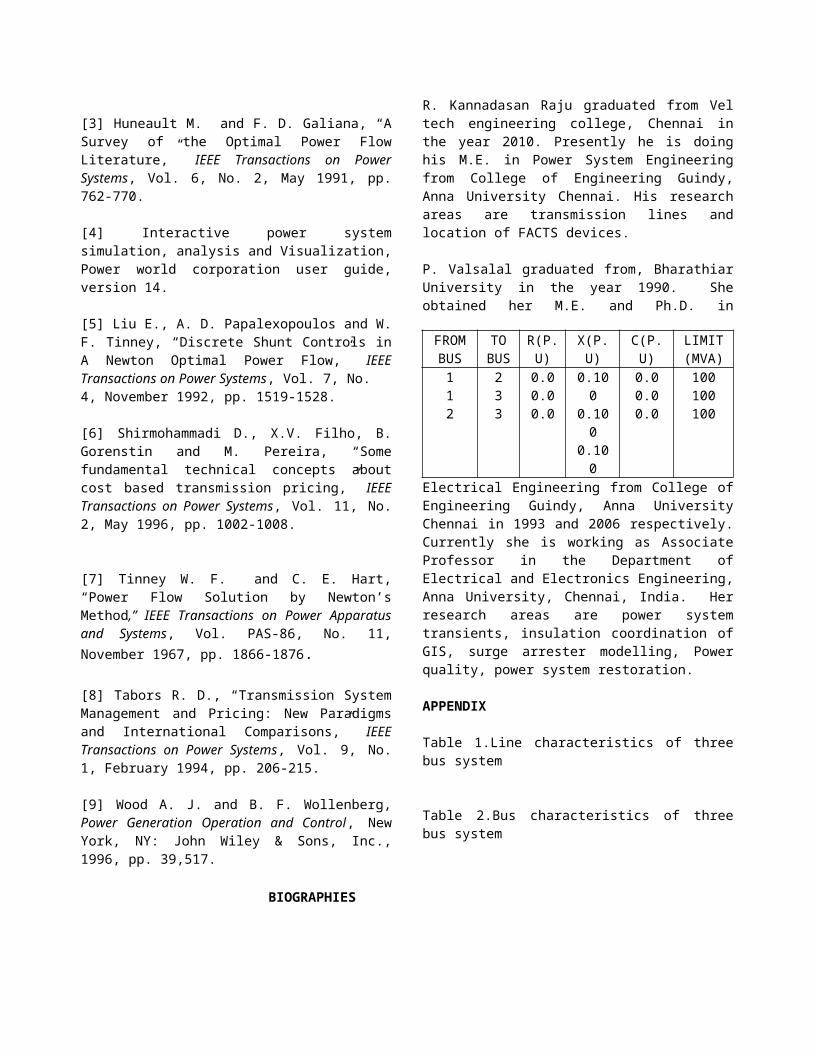
Table 1.Line characteristics of threebus system
Table 2.Bus characteristics of threebus system
FROMBUS
TOBUS
R(P.U)
X(P.U)
C(P.U)
LIMIT(MVA)
112
233
0.00.00.0
0.100
0.100
0.100
0.00.00.0
100100100
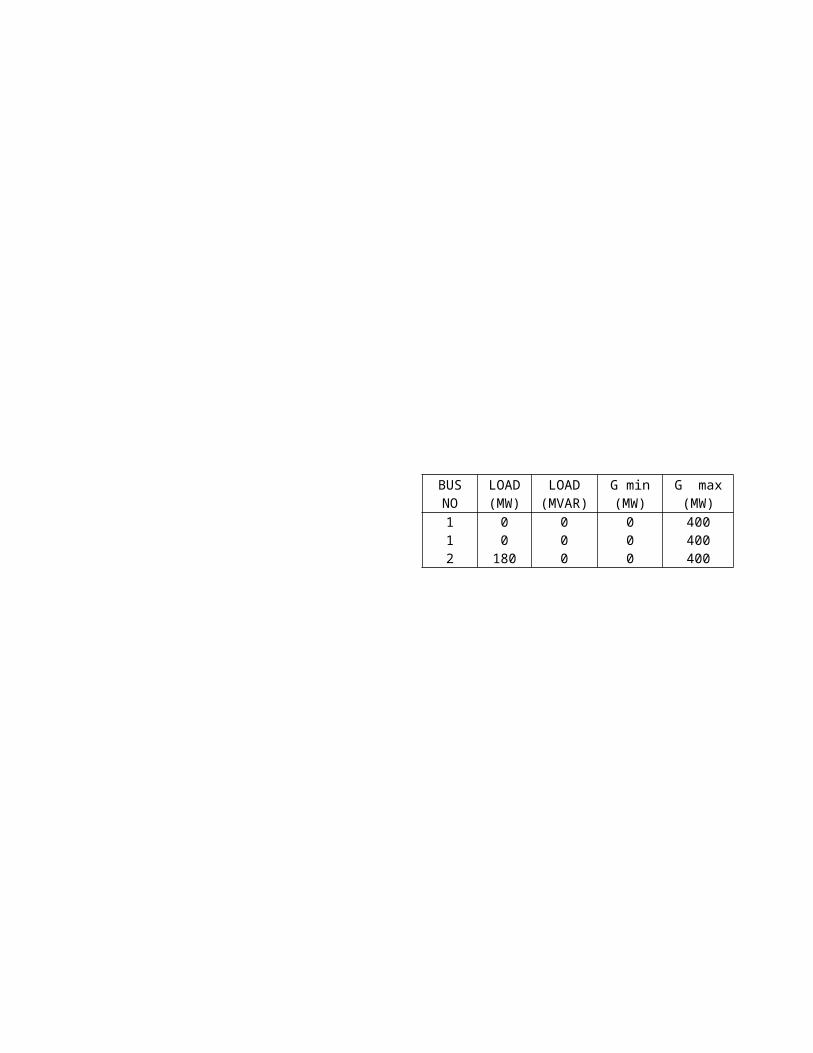
BUSNO
LOAD(MW)
LOAD(MVAR)
G min(MW)
G max(MW)
112
00180
000
000
400400400
Related Documents


![Austin Journal of Biomedical Engineering Austin Full Text ......[30]. Positively charged hydrogels (i.e. oligo-(polyethylene glycol) fumarate (OPF)) also support attachment of rat](https://static.cupdf.com/doc/110x72/60d11ddd2e47ee2ded4ac244/austin-journal-of-biomedical-engineering-austin-full-text-30-positively.jpg)
