Foam Processing and Cellular Structure of Polycarbonate-Based Nanocomposites Yasuhito Ito, Masatoshi Yamashita, Masami Okamoto* Advanced Polymeric Nanostructured Materials Engineering, Graduate School of Engineering, Toyota Technological Institute, Hisakata 2-12-1, Tempaku, Nagoya 468-8511, Japan E-mail: [email protected] Received: February 10, 2006; Revised: April 5, 2006; Accepted: April 5, 2006; DOI: 10.1002/mame.200600075 Keywords: heterogeneous nucleation; nanocellular; nanocomposite foams; polycarbonate; supercritical carbon dioxide Introduction Development of nanocomposite foams is one of the latest evolutionary technologies of the polymeric foam through a pioneering effort by Okamoto and his colleagues. [1,2] They prepared intercalated polycarbonate (PC)/clay nanocom- posite (PCCN) foams in a batch process, by using super- critical CO 2 as a physical foaming agent. [3] The PCCN foam exhibited smaller cell size and larger cell density compared with neat PC foam. However there are still some controversial data regarding the nucleating effect of the dispersed clay particles. To innovate on the materials properties of nanocomposites foams, we have to understand the morphology correlation between the dispersed clay particles with nanometer dimen- sions in the bulk and formed closed-cell structure after Summary: Via a batch process in an autoclave, foam pro- cessing of intercalated PC/clay nanocomposites, having dif- ferent amounts of clay, has been conducted using supercritical CO 2 as a foaming agent. The cellular structures obtained from various foaming temperature-CO 2 pressure ranges were investigated by SEM. The incorporation with nanoclay-induc- ed heterogeneous nucleation occurs because of a lower activation energy barrier compared with homogeneous nuclea- tion as revealed by the characterization of the interfacial ten- sion between bubble and matrix. The controlled structure of the PCCN foams changed from microcellular (d ffi 20 mm and N c ffi 1.0 10 9 cells cm 3 ) to nanocellular (d ffi 600 nm and N c ffi 3.0 10 13 cells cm 3 ). The mechanical properties of PCCN foams under compression test were discussed. TEM micrograph for the structure of the cell wall foamed at 160 8C. Macromol. Mater. Eng. 2006, 291, 773–783 ß 2006 WILEY-VCH Verlag GmbH & Co. KGaA, Weinheim Full Paper DOI: 10.1002/mame.200600075 773

Welcome message from author
This document is posted to help you gain knowledge. Please leave a comment to let me know what you think about it! Share it to your friends and learn new things together.
Transcript

Foam Processing and Cellular Structure of
Polycarbonate-Based Nanocomposites
Yasuhito Ito, Masatoshi Yamashita, Masami Okamoto*
Advanced Polymeric Nanostructured Materials Engineering, Graduate School of Engineering,Toyota Technological Institute, Hisakata 2-12-1, Tempaku, Nagoya 468-8511, JapanE-mail: [email protected]
Received: February 10, 2006; Revised: April 5, 2006; Accepted: April 5, 2006; DOI: 10.1002/mame.200600075
Keywords: heterogeneous nucleation; nanocellular; nanocomposite foams; polycarbonate; supercritical carbon dioxide
Introduction
Development of nanocomposite foams is one of the latest
evolutionary technologies of the polymeric foam through a
pioneering effort by Okamoto and his colleagues.[1,2] They
prepared intercalated polycarbonate (PC)/clay nanocom-
posite (PCCN) foams in a batch process, by using super-
critical CO2 as a physical foaming agent.[3] The PCCN
foam exhibited smaller cell size and larger cell density
compared with neat PC foam. However there are still some
controversial data regarding the nucleating effect of the
dispersed clay particles.
To innovate on the materials properties of nanocomposites
foams, we have to understand the morphology correlation
between the dispersed clay particles with nanometer dimen-
sions in the bulk and formed closed-cell structure after
Summary: Via a batch process in an autoclave, foam pro-cessing of intercalated PC/clay nanocomposites, having dif-ferent amounts of clay, has been conducted using supercriticalCO2 as a foaming agent. The cellular structures obtained fromvarious foaming temperature-CO2 pressure ranges wereinvestigated by SEM. The incorporation with nanoclay-induc-ed heterogeneous nucleation occurs because of a lower
activation energy barrier compared with homogeneous nuclea-tion as revealed by the characterization of the interfacial ten-sion between bubble and matrix. The controlled structure ofthe PCCN foams changed from microcellular (dffi 20 mm andNcffi 1.0� 109 cells � cm�3) to nanocellular (dffi 600 nm andNcffi 3.0� 1013 cells � cm�3). The mechanical properties ofPCCN foams under compression test were discussed.
TEM micrograph for the structure of the cell wall foamed at 160 8C.
Macromol. Mater. Eng. 2006, 291, 773–783 � 2006 WILEY-VCH Verlag GmbH & Co. KGaA, Weinheim
Full Paper DOI: 10.1002/mame.200600075 773

foaming. To the best of our knowledge, however, this issue is
not very well explored in the literature. There has been no
research reported so far on systematic studies on the pre-
paration of nanocomposite foams from microcellular to nano-
cellular. This paper is devoted to the study and evaluation of
the performance potential of the PCCNs in foam applications.
We investigate the influence of clay loading to the morphology
of PCCN foams.
Experimental Part
Materials
PC with viscosity-average molecular weightMV of 2.40� 104
(Teijin Chemicals Ltd., Japan) was dried under vacuum at120 8C and kept under a dry nitrogen gas for one week prior touse. In this study, we used a synthetic fluorohectorite (syn-FH)as an organically modified clay, which was supplied by CO-OPChemical Co. Ltd. The organically modified synthetic fluoro-hectorite was synthesized by replacing Naþ in syn-FH of acation exchange capacity of 120 milliequiv. per 100 g (originalthickness of �1 nm and average length of 200–300 nm) with
the dimethyl dioctadecylammonium cation (MAE) by ionexchange reaction.
The compatibilizer poly[styrene-co-(maleic anhydride)](SMA) with 15 wt.-% MA content, number-average molecularweight Mn of 17.1� 104 (DYLARK 332-80) was supplied byNova Chemical Japan Ltd.
Nanocomposites Preparation and Characterization
Nanocomposites were prepared by melt extrusion. MAE(powder form) and SMA as a compatibilizer (pellets form)were first dry-mixed by shaking them in a bag. The mixture wasthen melt extruded using a twin-screw extruder (PCM-30,Ikegai machinery Co.) operated at 240 8C (screw speed¼100 rpm, feed rate¼ 120 g �min�1) to yield SMA/MAE-inter-calated nanocomposites strands. The strands were then pelle-tized, and loaded with PC pellets. The mixture was againextruded by melt mixing operated at 260 8C. The abbreviationsof various nanocomposites (PCCNs) prepared using threedifferent content of MAE are shown in Table 1. The detailsof the nanocomposites preparation were described in ourprevious paper.[3] The extruded strands were pelletized anddried under vacuum at 120 8C for 24 h to remove water. The
Table 1. Composition and characteristic parameters of various PCCNs.
CompositionPC SMA MAEa)
10�4 MVb) Tg
c) Modulusd)
wt.-% g �mol�1 8C GPa
PC/SMA 90 10 2.43 146 2.32PC/SMA/MAE1 96.4 2 1.6 [1.0] 2.11 144 2.63PC/SMA/MAE2.5 91 5 4 [2.5] 1.93 134 3.10PC/SMA/MAE5 82 10 8 [5.0] 1.85 107 4.15
a) Value in the parentheses indicates the amount of clay (inorganic part) content after burning.b) Viscosity-average molecular weight.[3]
c) The glass transition temperature.[3]
d) Flexural modulus and strength of the injection-molded specimens (thickness �3.2 mm) were measured according to ASTM D-790method (Model 2020, Intesco Co.) with a strain rate of 2 mm �min�1 at room temperature.[3]
Figure 1. Typical SEM images of the fracture surfaces of the PC/SMA and PCCNsfoamed at 140 8C under different isobaric condition (10, 18 and 24 MPa).
774 Y. Ito, M. Yamashita, M. Okamoto
Macromol. Mater. Eng. 2006, 291, 773–783 www.mme-journal.de � 2006 WILEY-VCH Verlag GmbH & Co. KGaA, Weinheim

nanostructure analyses of wide-angle X-ray diffraction(WAXD) and transmission electron microscopy (TEM) werecarried out using the same apparatus as described in theprevious articles.[1–3]
Foam Processing
The foam processing was conducted on PC/SMA and PCCNsin an autoclave (TSC-WC-0096, Taiatsu Techno Co) by usingsupercritical CO2.[2] Before foaming, the test samples weredried under vacuum at 100 8C for 8 h to remove the water.Basically, the physical foam processing (batch process) usedin this study consists of three stages: (1) CO2 saturation ofthe sample under supercritical CO2; (2) cell nucleation whenthe release of CO2 pressure started (supersaturated CO2), andcell growth to an equilibrium size during releasing of CO2;
and, (3) cell stabilization via the cooling process of the foamedsystem. In the first stage, the pellets form (2.5 mm diameter�3mm length) was inserted into an autoclave (96 mL) and the CO2
pressure was increased up to 10–24 MPa for 5 h at 80 8C. Givensuch a long time dissolving CO2 into the sample, CO2 wascompletely saturated in the sample at 80 8C.[3]
In the second stage, upon saturation the samples wereremoved from the autoclave and brought to atmosphericconditions, and then dipped in a silicone oil bath maintained atthe desired foaming temperature Tf, ranging from 80 to 240 8Cbelow and above the glass transition temperature Tg of thevirgin matrix polymer for 30 s. After releasing the CO2
pressure, the formed foams were stabilized via cooling with anethanol/water mixture (1/1 v/v) to room temperature. Thefoamed PC/SMA and PCCNs were dried under vacuum at30 8C to remove the water.
Figure 2. (a) Foaming temperature dependence of foam density (rf) for PC/SMA and PCCNs foams at different pressure conditions.(b) Foaming temperature dependence of cell size (d) for PC/SMA and PCCNs foams at different pressure conditions. (c) Foamingtemperature dependence of cell density (Nc) for PC/SMA and PCCNs foams at different pressure conditions.
Foam Processing and Cellular Structure of Polycarbonate-Based Nanocomposites 775
Macromol. Mater. Eng. 2006, 291, 773–783 www.mme-journal.de � 2006 WILEY-VCH Verlag GmbH & Co. KGaA, Weinheim

Foam Characterization
The cell structures were investigated by using a scanningelectron microscope (SEM) (JSM-5310LV, JEOL), operated atan accelerating voltage of 15 kV. The test samples for SEMwere fractured in liquid nitrogen and coated with 20 nm of goldunder a pressure of 0.1 Torr for 3 min at a current of 10 mA. Themass density (g � cm�3) of both pre-foamed (rp¼ 1.270 g �cm�3) and post-foamed (rf) samples were estimated by usingthe method of buoyancy. The average cell size (d) in mm wasdetermined from the SEM observations. Almost all samplesobeyed the Gaussian distribution. The function for determiningcell density (Nc) in cells � cm�3 is given in Equation (1)[4]
Nc ¼ 1036½1 � ðrf=rpÞ�
pd3ð1Þ
On the other hand, the mean cell wall thickness (d) in mm wasestimated by Equation (2)[4]
d ¼ d
2
1ffiffiffiffiffiffiffiffiffiffiffiffiffiffiffiffiffiffiffiffiffiffiffiffi1 � ðrf=rpÞ
q� 1
ð2Þ
Thermomechanical Analysis (TMA)
The compressive modulus of PC/SMA and various PCCNsfoams were measured by using TMA (TMA4010S, BrukerAXS K. K.), operated at ambient temperature. The analysiswas performed via ‘‘the program displacement mode’’ with astrain rate of 0.01 mm �min�1 up to strain of 3% of the testsample’s thickness.[1] The shape of the test sample was cuboid(2.3� 3.2� 1.5 mm3).
Results and Discussion
Morphology of PCCN Foams
Figure 1 shows the typical results of SEM images of the
fracture surfaces of the PC/SMA and PCCNs foamed at
140 8C under different isobaric saturation condition (10, 18
and 24 MPa). PC/SMA foams exhibit the polygon closed-
cell structures having pentagonal and hexagonal faces,
which express the most energetically stable state of polygon
cells. Such foam structure was obtained probably because
these foams belong to the polymeric foams having high gas
phase volume (>0.6).[4] Obviously, under low saturation
CO2 pressure (�10 MPa), both PC/SMA/MAE1 and PC/
SMA/MAE2.5 foams exhibit larger cell size compared with
PC/SMA, indicating the dispersed clay particles hinder
CO2 diffusion by creating a maze or a more tortuous path.[3]
However, high CO2 pressure (�24 MPa) provides a large
supply of CO2 molecules, which can subsequently form a
large population of cell nuclei upon depressurization. The
incorporation of nanoclay hinders CO2 diffusion and
simultaneously induces heterogeneous nucleation because
of a lower activation energy barrier compared with homo-
geneous nucleation.[5]
Here, we calculated the distribution function of cell
size from SEM images. Almost all samples obeyed the
Gaussian distribution. Cell density and cell wall thick-
ness are calculated by Equation (1) and (2), respectively.
Figure 2 (a–c) shows the foam density (rf), cell size (d), and
cell density (Nc) versus foaming temperature (Tf) under
various CO2 pressures. In case of temperature dependence
of rf [Figure 2(a)], PC/SMA, PC/SMA/MAE1, and PC/
SMA/MAE2.5 foams indicate a complex tendency. That is,
the foam density decreases with increasing Tf up to 140 8C,
and after that, again increases with Tf under high and low
CO2 pressure. From the above results, such behavior of
foam density is due to the competition between the cell
nucleation and the cell growth. In the temperature depend-
ence of cell size [Figure 2(b)], we can observe the same
temperature dependence in especially PC/SMA and PC/
SMA/MAE1. On the other hand, the temperature depend-
ence of cell density [Figure 2(c)] shows the opposite
Figure 2. (Continued)
776 Y. Ito, M. Yamashita, M. Okamoto
Macromol. Mater. Eng. 2006, 291, 773–783 www.mme-journal.de � 2006 WILEY-VCH Verlag GmbH & Co. KGaA, Weinheim
behavior compared with the tendency of d owing to the cell
growth and the coalescence of cells, which usually takes
place at high Tf range due to the low viscosity of the
systems. This behavior is prominent for PC/SMA/MAE1
due to the action of the heterogeneous nucleation as a
dominant factor with increasing CO2 pressure because of
more homogeneous and fine dispersion of clay particles.[3]
For PC/SMA/MAE5, no temperature dependence of Nc is
seen, might be indicating the rigidity of the matrix polymer
with high MAE loading (5 wt.-%) (see Table 1).
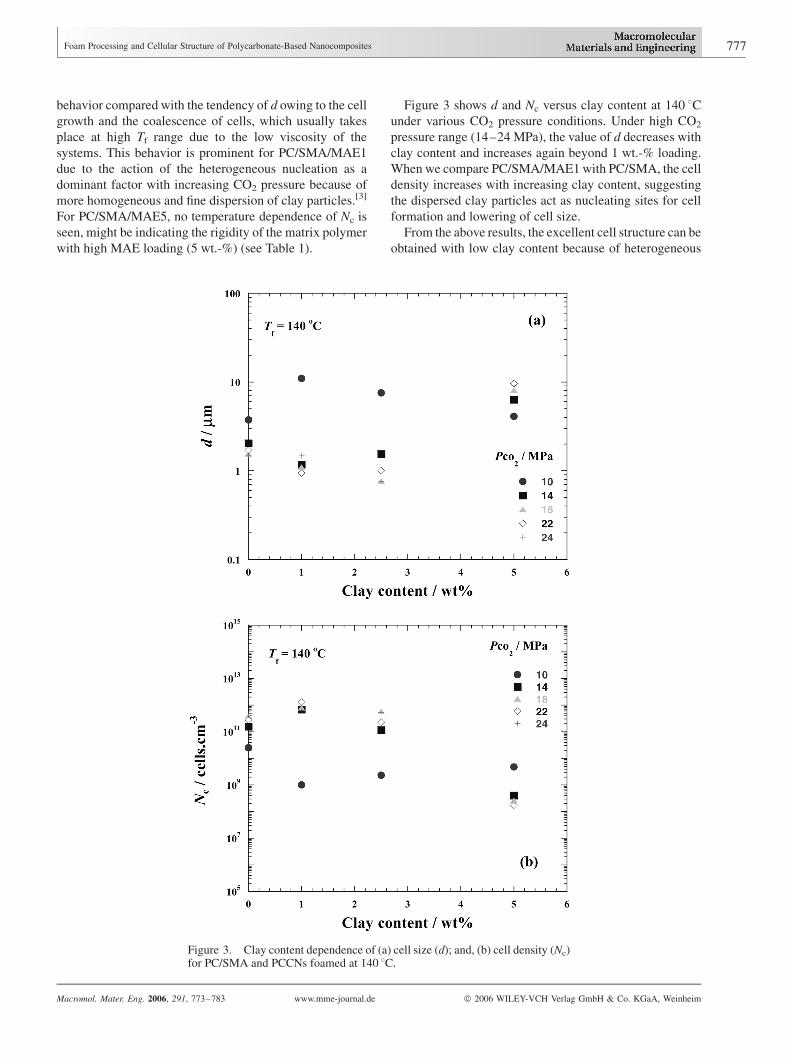
Figure 3 shows d and Nc versus clay content at 140 8Cunder various CO2 pressure conditions. Under high CO2
pressure range (14–24 MPa), the value of d decreases with
clay content and increases again beyond 1 wt.-% loading.
When we compare PC/SMA/MAE1 with PC/SMA, the cell
density increases with increasing clay content, suggesting
the dispersed clay particles act as nucleating sites for cell
formation and lowering of cell size.
From the above results, the excellent cell structure can be
obtained with low clay content because of heterogeneous
Figure 3. Clay content dependence of (a) cell size (d); and, (b) cell density (Nc)for PC/SMA and PCCNs foamed at 140 8C.
Foam Processing and Cellular Structure of Polycarbonate-Based Nanocomposites 777
Macromol. Mater. Eng. 2006, 291, 773–783 www.mme-journal.de � 2006 WILEY-VCH Verlag GmbH & Co. KGaA, Weinheim

nucleation, whereas it cannot be obtained with high clay
content because of the matrix rigidity.
Dissolved CO2 and Tg Depression
Now we turn our discussion to the glass transition tem-
perature Tg depression. To clearly investigate the melt
viscosity, we should understand the residue of CO2 in the
samples after depressurization. According to Henry’s law,[6]
CS ¼ HðTÞPCO2ð3Þ
where Cs is the gas concentration at saturation, H(T) is the
Henry’s law constant, and PCO2is the CO2 saturation pres-
sure. The temperature dependence ofH can be expressed by
an Arrhenius-type equation:
lnHðTÞH0
� �¼ Ea
R
1
T� 1
T0
� �ð4Þ
where H0 and T0 are the Henry’s constant and temperature
for STP (¼ 19.57� 10�3 g CO2 � g�1 �MPa�1), respectively,
andEa is the activation energy (¼ 16.13 kJ �mol�1).[7,8]First
we determined H(T) in the temperature range 50–150 8Cbefore determining the gas concentration at various satu-
ration pressures. Figure 4 shows some examples of
equilibrium gas concentration versus saturation pressure.
Furthermore, according to Chow’s model,[9] we can predict
the Tg of the polymer/gas mixture from
lnTg
Tg0
� �¼ b½ð1 � yÞ lnð1 � yÞ þ y lnðyÞ� ð5Þ
y ¼ Mp
2MCO2
w
1 � wð6Þ
where Tg0 is the Tg without gas, Mp and MCO2are the
molecular weights of repeating units in PC and CO2,
respectively, and w is the weight fraction of gas. b is related
to the heat capacity by
b ¼ 2R
MpDCp
ð7Þ
where DCP is the specific heat change at Tg (¼ 0.245 J �g�1 �K�1).[10] As the above results, the Tg depression of PC
is shown in Figure 5. The increase in the diluent (CO2)
concentration reducesTg monotonously. High CO2 pressure
condition (20 MPa at 80 8C) provides a large supply of CO2
molecules (14 wt.-%) where the Tg depression occurs up to
75 8C. The significant depression in Tg greatly reduces
the melt viscosity and increases the mobility of polymer
chains.
Using Tg depressions (corresponding to DTg), we
reconstructed plots of rf, d, and Nc versus TfþDTg from
data of Figure 2. The results are shown in Figure 6. This
Figure shows that the data nicely conform to a reduced
curve compared with Figure 2. The intermediate Tf condi-
tion (�140 8C) corresponds to a much higher processing
temperature (�200 8C). This indicates that Tg depression is
important in optimizing foam processing condition.
In Figure 7, we show the relations between d and Nc, and
d and d. Equation (1) and (2) lead to these relations but the
some deviation occurs in each system. For example, PC/
SMA/MAE2.5 exhibits smaller value of Nc under the same
d value when we compare with PC/SMA and PC/SMA/
MAE1. For the relation of d and Nc, PC/SMA/MAE2.5
shows a large value of d compared with PC/SMA/MAE1.
These deviations indicate that the heterogeneous cell
distribution mechanism due to the rigid matrix phases in
PC/SMA caused by high MAE loading (2.5–5.0 wt.-%), as
seen in Figure 1.
Characterization of Interfacial Tension
Both homogeneous and heterogeneous nucleation mechan-
ism may appear to be of comparable significance. All
Figure 4. Equilibrium CO2gas concentration versus saturationpressure.
Figure 5. Glass transition temperature depression of PC versusCO2 concentration.
778 Y. Ito, M. Yamashita, M. Okamoto
Macromol. Mater. Eng. 2006, 291, 773–783 www.mme-journal.de � 2006 WILEY-VCH Verlag GmbH & Co. KGaA, Weinheim

systems demonstrate that Nc increases systematically with
increasing in Tf up to 140 8C. The cell nucleation in the
heterogeneous nucleation system such as PC/SMA/MAE
foams took place in the boundary between the matrix and
the dispersed nanoclay particles. Accordingly, the cell size
decreases without individual cell coalescence for PC/SMA/
MAE and PC/SMA systems as seen in Figure 6(c).
To clearly investigate the influence of internal surfaces of
the dispersed nanoclay that hinders CO2 diffusion by
creating a more tortuous diffusive pathway, we charac-
terized the interfacial tension between bubble and matrix by
using modified classical nucleation theory.[5] According
to the theory proposed by Suh and Colton, the rate of
nucleation of cells per unit volume ( _N) can be written as
_N � Cf exp�DGkBT
� �ð8Þ
where C is the concentration of CO2 and/or the concentra-
tion of heterogeneous nucleation sites, f is the collision
frequency of CO2, DG is the activation energy barrier,
kB is the Boltzmann constant and T denotes absolute
temperature. Moreover, the activation energy barrier is
given by
DG ¼ 16pg3S yð Þ3ðDPCO2
Þ2ð9Þ
where g is the interfacial tension between bubble and
matrix, DPCO2is the magnitude of the pressure quench
during depressurization and S(y) is the energy reduction
Figure 6. (a) Foam density (rf) versus TfþDTg for PC/SMA and PCCNs foams at different pressure conditions. (b) Cell size (d)versus TfþDTg for PC/SMA and PCCNs foams at different pressure conditions. (c) Cell density (Nc) versus TfþDTg for PC/SMAand PCCNs foams at different pressure conditions.
Foam Processing and Cellular Structure of Polycarbonate-Based Nanocomposites 779
Macromol. Mater. Eng. 2006, 291, 773–783 www.mme-journal.de � 2006 WILEY-VCH Verlag GmbH & Co. KGaA, Weinheim

factor for the heterogeneous nucleation (i.e., PC/SMA/
MAE). The theoretical cell density is given by
Ntheor ¼ðt
0
_Ndt ð10Þ
where t is the foaming time that takes 30 s.
At low Tf range (80–140 8C), the value of Nc increase
with temperature because the cell growth is prominent.
Assuming no effect of the coalescence of cell on the value of
Nc, we estimate the interfacial tension of the systems
calculated using Equation (8)–(10), that is, the slope of the
plots (Nc, versus 1/Tf).
In Table 2, we summarized the interfacial tension and
energy reduction factor of systems calculated using
Equation (8)–(10). The interfacial tension of PC/SMA/
MAE1 (including S(y) factor) and PC/SMA (S(y)¼ 1) are
9.7 and 10.9 mJ �m�2 at 14 MPa, respectively. These
estimated values of g are in good agreement with that
of other poly(methyl methacrylate) (PMMA)-CO2
system (10–20 mJ �m�2).[11] These results are shown in
Figure 8(a–b): (a) interfacial tension (gS(y)1/3) versus
clay content under various CO2 pressure and (b) inter-
facial tension (gS(y)1/3) versus CO2 pressure under
different clay content. As shown in Figure 8(a), the inter-
facial tension slightly decreases with increasing in
clay content under same CO2 pressure condition, indicat-
ing heterogeneous cell nucleation occurs easily with
increasing in clay content. The estimated reduction
factor (S(y)¼ 0.3–0.8) is same order compared with the
foaming of PLA-based nanocomposites.[12] In Figure 8(b)
we observe weak CO2 pressure dependence of the
interfacial tension. The value of gS(y)1/3 shows a
little increment with CO2 pressure. This result seems to
be in conflict with the result in Figure 3(b). However, these
are reasonable results when we consider the activation
energy barrier, DG. As shown in Figure 9, the absolute
value of DG decreases with CO2 pressure accompanied
with the dependence of the clay content. Therefore, this
reasoning is consistent with the explanation for
Figure 3(b).
Mechanical Properties of PCCN Foams
Due to the cuboid shape prepared by melt extrusion, the
clay particles probably are fixed their face and aligned
along the flow (extruded) direction of test specimen. For
this reason, we speculated that the orientation of the
dispersed clay particles in the sample is well-ordered. We
measured compressive moduli in directions both perpendi-
cular and parallel to the flow.
Figure 10 shows the stress-strain curves taken in the
direction perpendicularly to the flow and strain recovery
behavior of the nanocomposites foams and PC/SMA foam
prepared with high CO2 pressure range (18 MPa) at a
constant rate of 0.4% min�1. The nanocomposites foam
exhibit high modulus compared with PC/SMA foam. The
residual strain is around 30–40% as well as PC/SMA foam,
providing the excellent strain recovery and the energy
dissipation mechanism.[1]
To clarify whether the modulus enhancement of the
nanocomposite foams was reasonable, we applied the
following Equation (11) proposed earlier by Kumar[13] to
estimate relative moduli with various foam density:
Kf
Kp
¼ rf
rp
!4
� rf
rp
!2
þ rf
rp
!ð11Þ
where Kpand Kf are the modulus of pre-foamed and post-
foamed samples, respectively.
Figure 6. (Continued)
780 Y. Ito, M. Yamashita, M. Okamoto
Macromol. Mater. Eng. 2006, 291, 773–783 www.mme-journal.de � 2006 WILEY-VCH Verlag GmbH & Co. KGaA, Weinheim

Figure 11 shows the relation of relative moduli (Kf/Kp)
against relative density (rf/rp) of PC/SMA and PCCNs
foams, taken in both directions perpendicular (\) and
parallel (k) to the flow. This may be because the dispersed
clay particles in the cell wall may align along the thickness
direction of the sample. In other words, the clay particles
arrange due to the biaxial flow of material during foam-
ing.[1] The solid line in the figure represents the theoretical
fit with Equation (11). The relative moduli (KfkþKf\)/
(KpkþKp\) of PC/SMA/MAE1 and PC/SMA foams exhi-
bit higher values than predicted even though they have
the same relative mass density. This upward deviation
may indicate that the alignment of the dispersed clay
particles and the orientation of the polymeric chains taking
place during foaming due to the large reduction of the mass
density. This creates the improvement in mechanical
properties for polymeric foams through polymeric nano-
composites. In case of PC/SMA/MAE1 foams, the clay
particles seem to act as a secondary cloth layer to protect the
cells from being destroyed by external forces.
Figure 7. (a) Cell size versus cell density; and, (b) cell wall thickness (d) versuscell size for PCCNs foams.
Foam Processing and Cellular Structure of Polycarbonate-Based Nanocomposites 781
Macromol. Mater. Eng. 2006, 291, 773–783 www.mme-journal.de � 2006 WILEY-VCH Verlag GmbH & Co. KGaA, Weinheim

Figure 8. Clay content and CO2 pressure (Pco2) dependence ofinterfacial tension gS(y)1/3 for PC/SMA and PCCNs foams.
}}}}
Table 2. Interfacial tension (gS(y)1/3) including energy reductionfactor (S(y)) of systems calculated using Equation (8)–(10).
Systems g S(y)1/3 S(y)
mJ �m�2
PC/SMA-CO2 PCO2¼ 10 MPa 10.7 1.0
PC/SMA/MAE1-CO2 8.6 0.53PC/SMA/MAE2.5-CO2 8.0 0.42PC/SMA-CO2 PCO2
¼ 14 MPa 10.9 1.0PC/SMA/MAE1-CO2 9.7 0.72PC/SMA/MAE2.5-CO2 9.9 0.77PC/SMA-CO2 PCO2
¼ 18 MPa 13.6 1.0PC/SMA/MAE1-CO2 10.2 0.42PC/SMA/MAE2.5-CO2 9.2 0.30PC/SMA-CO2 PCO2
¼ 22 MPa 11.3 1.0PC/SMA/MAE1-CO2 12.4 –PC/SMA/MAE2.5-CO2 8.0 0.36
Figure 9. PCO2dependence of activation energy barrier (DG) for
PC/SMA and PCCNs foams.
Figure 10. Strain-Stress curve of PC/SMA and PCCNs foamedat 140 8C under 18 MPa.
Figure 11. Relative moduli (KfkþKf\)/(Kpk/þKp\) versusrelative density (rf/rp) of PC/SMA and PCCNs foamed at140 8C. The solid line in the figure represents the theoretical fitsbased on the Kumar’s model.
782 Y. Ito, M. Yamashita, M. Okamoto
Macromol. Mater. Eng. 2006, 291, 773–783 www.mme-journal.de � 2006 WILEY-VCH Verlag GmbH & Co. KGaA, Weinheim

Conclusion
Under low saturation CO2 pressure (�10 MPa), both PC/
SMA/MAE1 and PC/SMA/MAE2.5 foam exhibited larger
cell size compared with PC/SMA, indicating the dispersed
clay particles hinder CO2 diffusion by creating a maze or
a more tortuous path. Whereas, under high CO2 pressure
(�24 MPa), both PC/SMA/MAE1 and PC/SMA/MAE2.5
foam exhibited smaller cell size (d), that is, larger cell density
(Nc) compared with PC/SMA foam. This reason is a large
supply of CO2 molecules under high CO2 pressure, which can
subsequently form a large population of cell nuclei upon
depressurization. In this time, the dispersed clay particles act
as nucleating sites for the cell formation and lowering of cell
size with clay. In addition, the incorporation of nanoclay-
hindered CO2 diffusion and simultaneously induced hetero-
geneous nucleation because of a lower activation energy
barrier compared with homogeneous nucleation. For PC/
SMA/MAE5, no temperature dependence of Nc was
seen, might be indicating the rigidity of the matrix polymer
with high MAE loading (5 wt.-%). From these results,
the excellent cell structure could be obtained with low
clay content because of heterogeneous nucleation, whereas
it could not be obtained with high clay content because of the
matrix rigidity. The controlled structure of the PCCN foams
became from microcellular (dffi 20 mm and Ncffi 1.0�
109 cells � cm�3) to nanocellular (dffi 600 nm and
Ncffi 3.0� 1013 cells � cm�3).
The relative moduli of PC/SMA/MAE1 and PC/SMA
foams showed higher values than predicted even though
they have the same relative mass density.
[1] M. Okamoto, P. H. Nam, M. Maiti, T. Kotaka, T. Nakayama,M. Takada, M. Ohshima, A. Usuki, N. Hasegawa, H.Okamoto, Nano Lett. 2001, 1, 503.
[2] P. H. Nam, M. Okamoto, P. Maiti, T. Kotaka, T. Nakayama,M. Takada, M. Ohshima, N. Hasegawa, A. Usuki, Polym.Eng. Sci. 2002, 42, 1907.
[3] M. Mitsunaga, Y. Ito, S. Sinha Ray, M. Okamoto, K.Hironaka, Macromol. Mater. Eng. 2003, 288, 543.
[4] D. Klempner, K. C. Frisch, ‘‘Handbook of Polymeric Foamsand Foam Technology’’, Hanser, Munich 1991.
[5] J. S. Colton, N. P. Suh, Polym. Eng. Sci. 1987, 27, 485.[6] P. L. Durril, R. G. Griskey, AIChE J. 1969, 15, 106.[7] V. Kumar, J. E. Weller, ANTEC 1991, 1401.[8] V. Kumar, J. E. Weller,Cell. Microcell. Mater. 1994, 53, 255.[9] T. S. Chow, Macromolecules 1980, 13, 362.
[10] V. B. F. Mathot, Polymer 1984, 25, 579.[11] S. K. Goel, E. J. Beckman, Polym. Eng. Sci. 1994, 34,
1137.[12] Y. Ema, M. Ikeya, M. Okamoto, Polymer, in press.[13] V. Kumar, M. M. van der Wel, ANTEC 1991, 1406.
Foam Processing and Cellular Structure of Polycarbonate-Based Nanocomposites 783
Macromol. Mater. Eng. 2006, 291, 773–783 www.mme-journal.de � 2006 WILEY-VCH Verlag GmbH & Co. KGaA, Weinheim
Related Documents