Fugacity modelling to predict the distribution of organic contaminants in the 1 soil : oil matrix of constructed biopiles. 2 3 Simon J.T. Pollard a , Rupert L. Hough a,d , Kye-Hoon Kim a,e , Jessica Bellarby b , Graeme 4 Paton b , Kirk T. Semple c and Frédéric Coulon a* 5 6 a Centre for Resource Management and Efficiency, Sustainable Systems Department, School of 7 Applied Sciences, Cranfield University, Cranfield, MK43 0AL, UK 8 b Department of Plant and Soil Sciences, School of Biological Sciences, Cruickshank Building, 9 University of Aberdeen, Aberdeen, Scotland, AB24 3UU, UK 10 c Department of Environmental Sciences, Lancaster University, Lancaster, LA1 4YQ, UK 11 d Soils Department, The Macaulay Institute, Craigiebuckler, Aberdeen, AB15 8QH, UK 12 e The University of Seoul, Department of Environmental Horticulture, 90 Jeonnong-dong, 13 Dongdaemun-gu, Seoul, 130-743, South Korea. 14 15 *Corresponding author: 16 Tel: +44 (0)1234 750 111 17 Fax: +44 (0)1234 751 671 18 Email: [email protected] 19 20 Running title: Fugacity for oil-contaminated soils 21 22 Keywords: oil, contaminated, soils, fugacity, biopile, hydrocarbons 23 24

Welcome message from author
This document is posted to help you gain knowledge. Please leave a comment to let me know what you think about it! Share it to your friends and learn new things together.
Transcript
Fugacity modelling to predict the distribution of organic contaminants in the 1
soil : oil matrix of constructed biopiles. 2
3
Simon J.T. Pollarda, Rupert L. Hougha,d, Kye-Hoon Kima,e, Jessica Bellarbyb, Graeme 4
Patonb, Kirk T. Semplec and Frédéric Coulona* 5
6
aCentre for Resource Management and Efficiency, Sustainable Systems Department, School of 7
Applied Sciences, Cranfield University, Cranfield, MK43 0AL, UK 8
bDepartment of Plant and Soil Sciences, School of Biological Sciences, Cruickshank Building, 9
University of Aberdeen, Aberdeen, Scotland, AB24 3UU, UK 10
cDepartment of Environmental Sciences, Lancaster University, Lancaster, LA1 4YQ, UK 11
dSoils Department, The Macaulay Institute, Craigiebuckler, Aberdeen, AB15 8QH, UK 12
eThe University of Seoul, Department of Environmental Horticulture, 90 Jeonnong-dong, 13
Dongdaemun-gu, Seoul, 130-743, South Korea. 14
15
*Corresponding author: 16
Tel: +44 (0)1234 750 111 17
Fax: +44 (0)1234 751 671 18
Email: [email protected] 19
20
Running title: Fugacity for oil-contaminated soils 21
22
Keywords: oil, contaminated, soils, fugacity, biopile, hydrocarbons 23
24
2
Abstract 25
A level I and II fugacity approaches were used to model the environmental distribution of 26
benzene, anthracene, phenanthrene, 1-methylphenanthrene and benzo[a]pyrene in a four phase 27
biopile system, accounting for air, water, mineral soil and non-aqueous phase liquid (oil) phase. 28
The non-aqueous phase liquid (NAPL) and soil phases were the dominant partition media for the 29
contaminants in each biopile and the contaminants differed markedly in their individual 30
fugacities. Comparison of three soils with different percentage of organic carbon (% org C) 31
showed that the % org C influenced contaminant partitioning behaviour. While benzene showed 32
an aqueous concentration worthy of note for leachate control during biopiling, other organic 33
chemicals showed that insignificant amount of chemicals leached into the water, greatly 34
reducing the potential extent of groundwater contamination. Level II fugacity model showed that 35
degradation was the dominant removal process except for benzene. In all three biopile systems, 36
the rate of degradation of benzo(a)pyrene was low, requiring more than 12 years for soil 37
concentrations from a spill of about 25 kg (100 moles) to be reduced to a concentration of 0.001 38
µg g-1. The removal time of 1-methylphenanthrene and either anthracene or phenanthrene was 39
about 1 and 3 years, respectively. In contrast, benzene showed the highest degradation rate and 40
was removed after 136 days in all biopile systems. Overall, this study confirms the association of 41
risk critical contaminants with the residual saturation in treated soils and reinforces the 42
importance of accounting for the partitioning behaviour of both NAPL and soil phases during 43
the risk assessment of oil-contaminated sites. 44
45
Keywords – Biopiling, bioremediation, fugacity, modelling, organic contaminants, oil 46
47
3
INTRODUCTION 47
Constructed biopile technology (Batelle, 1996) is one means of reducing risks to human 48
health and the environment from soils contaminated with hydrocarbons. Risk reduction is 49
heavily dependent on the physicochemical behaviour of risk critical compounds in the oil-soil 50
matrix, and on their bioaccessibility and bioavailability to microorganisms (Doick et al., 2005; 51
Allan et al., 2006). We have long been concerned with the environmental fate, partitioning and 52
toxicity of risk critical compounds within hydrocarbon-contaminated soils (Pollard et al., 1992; 53
1999; Zemanek et al., 1997a,b; Whittaker et al., 1999; Pollard et al., 2004; Brassington et al., 54
2007). In these soils, an oil-soil matrix is universally present as the principal source of the 55
organic contaminants that drive risk assessments (e.g. benzene, benzo(a)pyrene) and remedial 56
actions at these sites. 57
However, within exposure assessment models for hydrocarbon-contaminated sites, the 58
partitioning of risk critical compounds to their host matrix, the oil (Boyd and Sun, 1990; 59
USEPA, 1991; Walter et al., 2000; Heyes et al., 2002) is rarely represented. As an oil matrix 60
weathers, it develops into a more condensed, asphaltenic structure (Westlake et al., 1974) 61
representing, in principle, an even stronger partition medium for contaminants in weathered 62
hydrocarbon matrices and their post-treatment residues. Further, the oil becomes physically 63
entrained within the soil matrix over time and hydrophobic contaminants are increasingly 64
sequestered through partitioning into soil organic matter and/or diffusion into nanopores 65
(Huesemann et al., 2005). As a result, contaminant molecules are released very slowly into the 66
aqueous phase of the oil-soil matrix (Pignatello and Xing, 1996; Hatzinger and Alexander, 1997; 67
Huesemann, 1997; Alexander, 2000). The rate of contaminant biotransformation in aged soils is 68
thus limited by the rate of release from the matrix (Huesemann et al., 2003 and 2004). 69
The application of fugacity modelling to the challenges of solid wastes is increasing. 70
Previous applications include its use for directing site remediation decisions (Pollard et al., 1993; 71
She et al., 1995), for quantifying vapour emissions from contaminated sites (Mills et al., 2004), 72
and to predict the fate of organic compounds at landfill sites (Kjeldsen and Christensen, 2001; 73
4
Shafi et al., 2006). However, there have only been limited attempts to include the source term 74
(e.g. oil) for organic waste matrices (Nieman, 2003). Here, we investigate the capacity of oily 75
waste source terms to act as a sink for priority contaminants within the oil-soil matrix of a 76
biopile during bioremediation. Our research is part of an ongoing investigation by a research 77
consortium (PROMISE) to place biopiling within a risk management framework and improve 78
end-user confidence in this technology. Level I and II fugacity models were developed that 79
included four phases within the soil matrix, namely: air, water, mineral soil and non-aqueous 80
phase liquid (NAPL) to represent the source term. The model was parameterised using physical 81
and chemical characteristics of three soils collected from sites historically contaminated with 82
oily wastes. Our interest is in (i) to what extent this conceptualisation of partitioning in a biopile 83
allows us to optimise treatment and (ii) what implications emerge from the modeled 84
concentrations of key contaminants in individual media (air, water, soil) for the environmental 85
regulation of biopiling, including the derivation of practical remedial targets for residual 86
hydrocarbons. 87
88
MATERIALS AND METHODS 89
Soil characterisation 90
Archived soils (A, B and C; Table 1) were obtained from three sites in the UK, historically 91
contaminated with petroleum hydrocarbons. Soil A was from a site that had undergone biopiling 92
until the total petroleum hydrocarbon (TPH) load was reduced to the satisfaction of the 93
regulatory authorities. Soils B and C were sampled from unremediated sites that had a long 94
history of contamination with heavy petroleum. 95
Samples were prepared and characterised using standard procedures (Allan, 1989). 96
Extractions for nitrate and ammonium analysis were performed using 4.0 ± 0.5 g (dry weight) 97
soil and 40 ml of 1 M KCl. These were shaken on an end-over-end shaker for 30 min. 98
Phosphate extractions were performed with 0.5 ± 0.1 g (dry weight) soil with 40 ml 2.5% v:v 99
acetic acid using an end-over-end shaker for 2 h. Extracts were filtered through Whatman 44 100
5
paper prior to analysis on a flow injection analyzer (FIAstar). Carbon dioxide production, as a 101
surrogate for respiration, was measured by weighing 1 ± 0.5 g (dry weight) soil into 11 ml 102
vacuettes. Sealed vacuettes were incubated for 24 h at 15 °C and the headspace analysed for 103
carbon dioxide using a gas chromatograph (Chrompack 9001) equipped with a methanizer and a 104
flame ionisation detector (FID). An aliquot of between 50 – 100 µl was taken using a 250 µl 105
gastight glass Hamilton syringe, and immediately injected onto an 80/100 mesh Poropak Q 106
column (2 m x 1/8” OD x 2 mm). The carrier gas was nitrogen at a flow of 20 ml min-1. 107
Temperatures of oven, injector and detector were 250 °C, 100 °C and 350 °C, respectively. A 108
standard curve was prepared using certified gas mixtures (Linde Gases, Aberdeen). Three 109
replicate blank vials were incubated and analysed with the samples to account for background 110
carbon dioxide levels (Paton et al., 2006). 111
Microbial numbers for heterotrophic microorganisms and hydrocarbon degraders were 112
estimated using the “most probable number” (MPN) method (Kirk et al., 2005). Soil (0.5 ± 0.2 113
g; dry weight) was extracted with 0.1% w:v sodium pyrophosphate in ringer’s solution using an 114
end-over-end shaker for 2 h. Extracts (20 µl) were added to 3 different 96-well microtiter plates 115
containing 180 µl media amended with 0.25 g l-1 INT (p-iodonitrotetrazolium violet) solution. 116
The media were tryptic soya broth (TSA) for heterotrophs and Bushnell-Haas amended with 2 µl 117
filter-sterilised diesel per well for hydrocarbon degraders or unamended for the control. The 118
plates were incubated for two and four weeks at 25 °C for heterotrophic and hydrocarbon-119
degrading microorganisms, respectively. 120
Soil pH was measured using deionised water and a solution of 0.01 M CaCl2. The 121
measurement was performed by weighing 4 g (wet weight) into 50 ml centrifuge tubes and 122
adding 20 ml solution. Tubes were shaken using an end-over-end shaker for 30 min and left to 123
settle for at least 30 min. The pH was recorded when there was no change in the pH value in the 124
second decimal point after 10 s. 125
126
127
6
Hydrocarbon extractions 127
Prior to extraction, samples (10 g) of each soil were blended with 10 g Na2SO4 to obtain 128
a free flowing mixture. A layer of Na2SO4 (5 g) was placed in a series of Soxhlet thimbles 129
followed by the soil samples. To each thimble, 1 ml of 50 mg l-1 o-terphenyl in methanol was 130
added as a surrogate standard. Further blank (Na2SO4), blank spike (Na2SO4 with 1 ml of a 10 131
000 mg l-1 diesel/mineral oil in pesticide grade methanol solution) and reference (air-dried and 132
ground soil reference material) samples were prepared. All glass thimbles were placed into 133
soxhlet extractors and connected to 500 ml round bottom flasks containing 200 ml 134
dichloromethane/acetone (90:10) solution. Samples were refluxed at 30 °C for 6 - 8 h and 135
extracted samples concentrated down to 1 ml by Kurderna-Danish, using a 3-ball macro synder 136
column. Concentrations of total petroleum hydrocarbon (TPH) were determined using GC-FID 137
on a Perkin Elmer elite 5-MS capillary column (30 m x 0.25 mm x 0.25 µm) with helium carrier 138
gas at a flow rate of 1 ml min-1. The initial oven temperature of 40 °C was raised to 300 °C at a 139
gradient of 4.4 °C min-1. The soils characterisation is presented in Table 1. 140
141
Fugacity model development 142
Soil characteristics (Table 1) were used to parameterise Level I and II fugacity models 143
representative of a ‘typical’ constructed biopile. Initially, a Level I fugacity model (Level 1 144
Fugacity calculator version 1.2; Nieman, 2003) was used to examine the general partitioning 145
behaviour and preferential partitioning in a constructed biopile environment. An evaluative 146
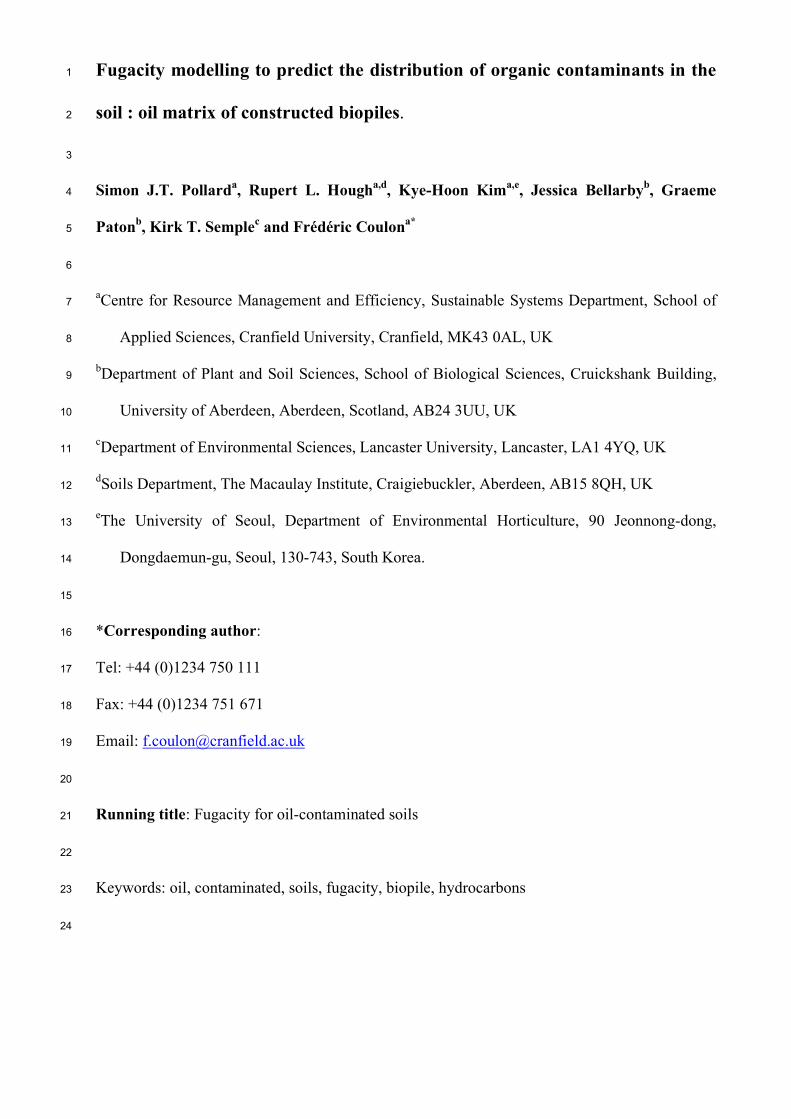
environment was constructed using a typical biopile design (Batelle, 1996). It was assumed that 147
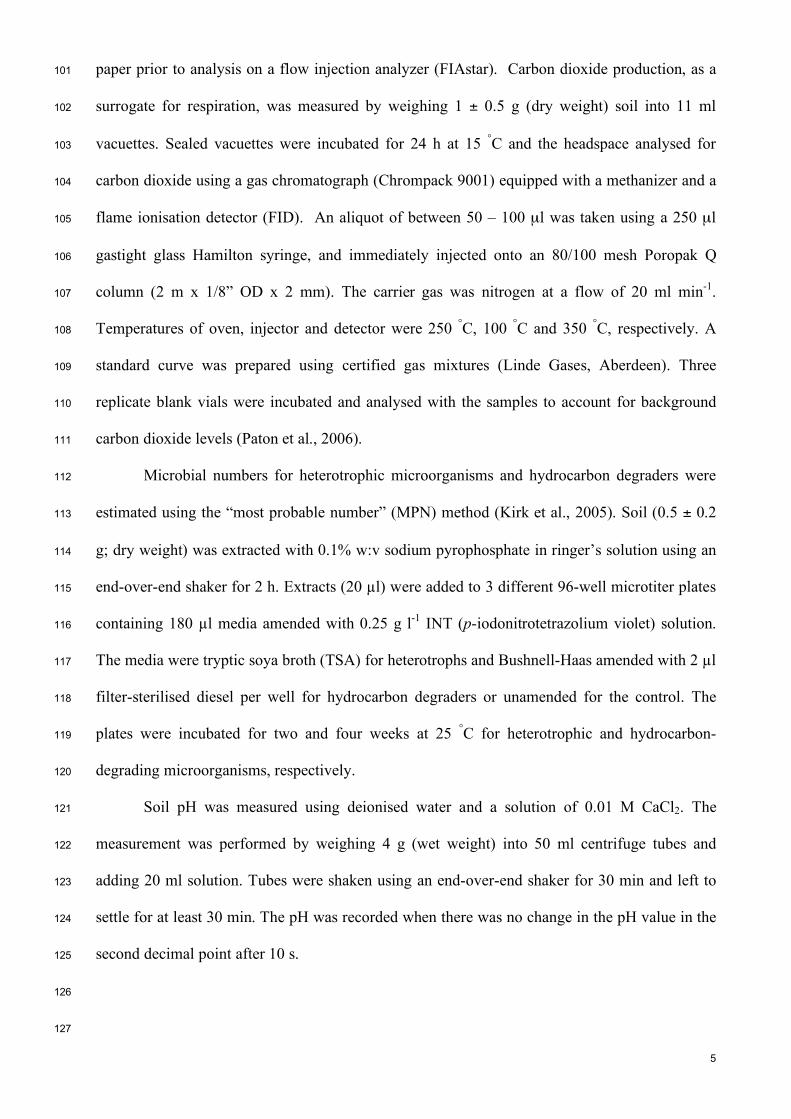
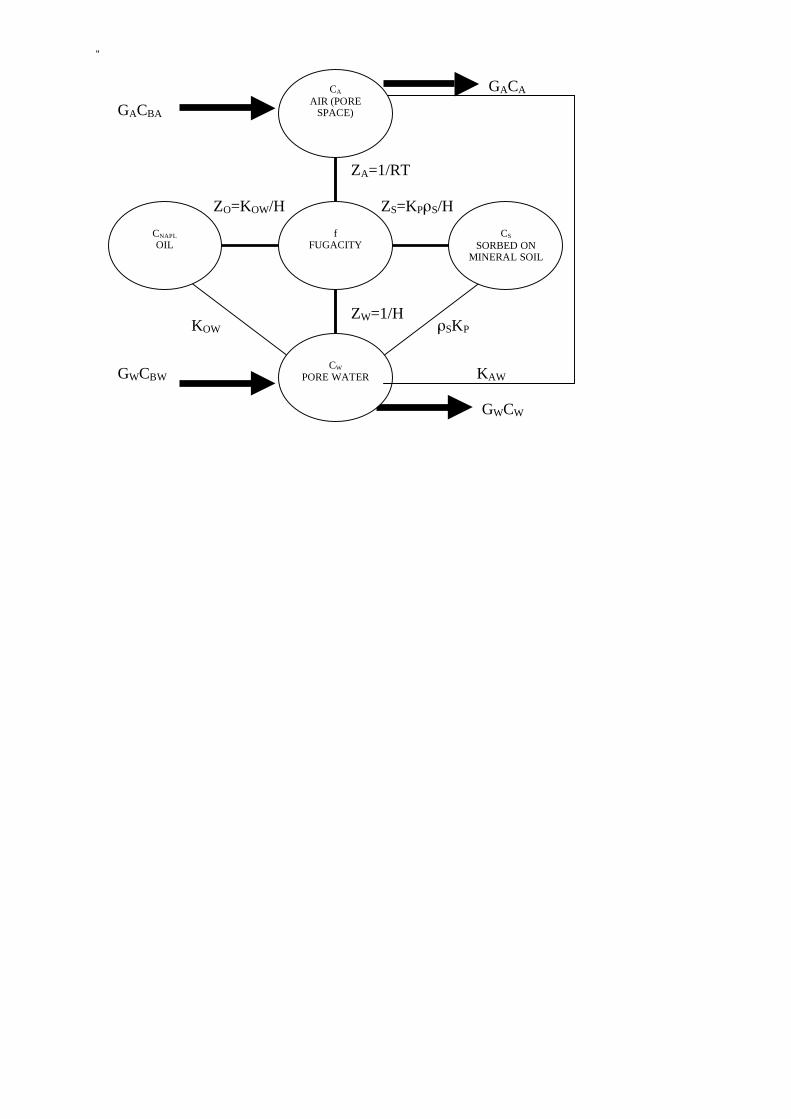
the soil matrix consisted of four compartments: air (‘A’, pore space), water (‘W’, soil pore 148
water), non-aqueous phase liquid (‘NAPL’) and mineral soil (‘S’) (Fig. 2). The total mass of 149
contaminant in the system (T, mol) is described by: 150
151
!
T =VACA
+VWCW
+VNAPL
CNAPL
+VSCS (1) 152
153
7
Where T is the total mass of contaminant in the system, V represents the volume of each 154
compartment (m3), and C represents the concentration of the contaminant in each compartment 155
(mol m-3). 156
In order to estimate the fluxes between the compartments (depicted as connecting lines in Fig. 157
2), the relationships between CA, CW, CNAPL and CS were estimated by deriving partition 158
coefficients [Eq. (2)]. The partition coefficients can be used to characterise the distribution of the 159
contaminant within the system [Eq. (3)]. 160
161
NAPLW
W
NAPLK
C
C=!!
"
#$$%
& (2) 162
163
!
T =VAK
AWCW
{ } +VWKWNAPL
CNAPL
,KWACA
{ } +VNAPL
KNAPLS
CS,K
NAPLWCW
{ } +VSK
SNAPLCNAPL
{ } (3) 164
165
Where V represents the volume of each compartment in Fig. 2 (m3), and C represents the 166
concentration of the contaminant in each compartment (mol m-3). 167
168
Under the fugacity approach, the concentration term, C, is replaced with the fugacity term Zf. 169
This employs the relationship between concentration, C, and fugacity, f, which may be defined 170
as the proportionality constant, Z [Eq. (4)] (MacKay, 2001). Definitions of the fugacity 171
capacities ZA, ZW, ZO and ZS used in the level I model are indicated in Fig. 2. 172
173
ZfC = (4) 174
175
In order to parameterise Equation 1, the volumetric composition of each biopile was derived 176
using a mass fraction based on the bulk density of each soil (Table 1), and a biopile volume of 177
625 m3 (Batelle, 1996). The concentration of NAPL was assumed to be equal to the measured 178
concentration of TPH (Table 1). The volumetric composition of the three biopiles is reported in 179
8
Table 1. The volume of water, NAPL and mineral soil were calculated using literature-derived 180
densities: water 1000 kg m-3; NAPL was assumed to have an average bulk density of 970 kg m-3 181
(Woolgar, 1997); mineral soil was assumed to have a particle density of 2400 kg m-3 (Rowell, 182
1997). The volume of air was calculated as the total volume minus the sum of the other three 183
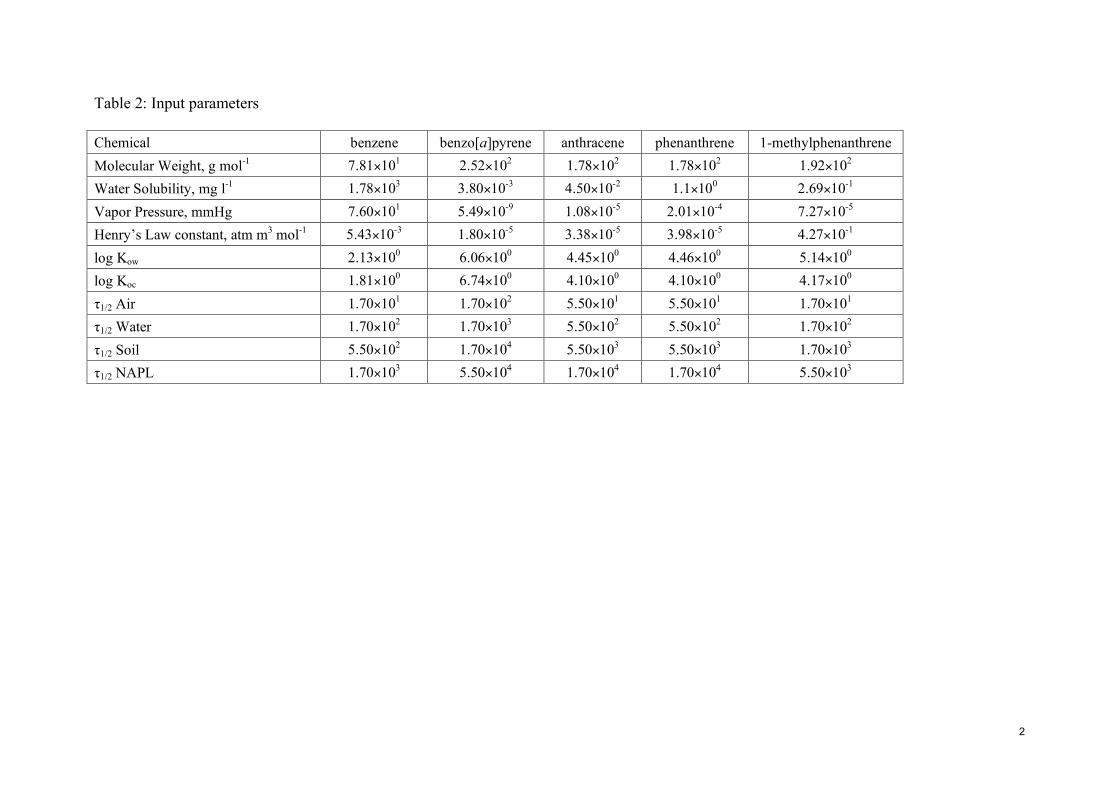
volumes. A hundred moles of five priority compounds (Table 2) were introduced into the models 184
and the partitioning of these compounds within the three soil matrixes estimated. 185
The Level II fugacity model accounted for advection processes and degrading reactions in the 186
form of residence times and half lives. The calculations assumed steady state conditions – i.e. 187
the amount entering the system was mass balanced by the amount leaving the system. If a 188
chemical is introduced at a rate of E mol h-1, then the rate of removal must also be E mol h-1. If 189
the amount in the system is M mol, then on average the amount of time, τ, each molecule spends 190
in the steady-state system is (Equation 5): 191
192
!
" = M /E;M = "E (5) 193
194
There are two primary mechanisms by which a chemical may be removed from a biopile system: 195
advection and reaction. Since a steady-state applies, we assume that inflow and outflow are 196
equal and that a mass-balance applies. If G is the advecting medium (m3 h-1) and C the 197
concentration of contaminant in G (mol m-3), then the rate of advection, N, is GC (mol h-1). The 198
total influx of chemical is at a rate GACBA in air, GWCBW in water, GNAPLCBNAPL in NAPL, 199
GSCBS in mineral soil. Therefore, the total influx I is (Equation 6): 200
201
!
I = E +GACBA
+GWCBW
+GNAPL
CBNAPL
+GSCBS
(6) 202
203
If we assume a constant fugacity, f, to apply within the biopile system and to the out-flowing 204
media (air and water), then we can write (Equation 7 and 8): 205
206
9
!
I = (GAZAf +GWZW f ) + (VAZAkA f +VWZWkW f +VNAPLZNAPLkNAPL f +VSZSkS f ) = f"DAi + f"DRi 207
(7) 208
209
!
F =I
"(DAi
+ DRi)
=I
"DT
(8) 210
211
RESULTS AND DISCUSSION 212
The fugacity of a chemical in a multiphase system is analogous to the partial pressure of an 213
ideal gas and related to concentration through the fugacity capacity (Mackay, 2001). For the 214
three soils as an entire environmental compartment, there were no significant differences (P> 215
0.05) between the estimated level I fugacities (f) for the five priority contaminants, though the 216
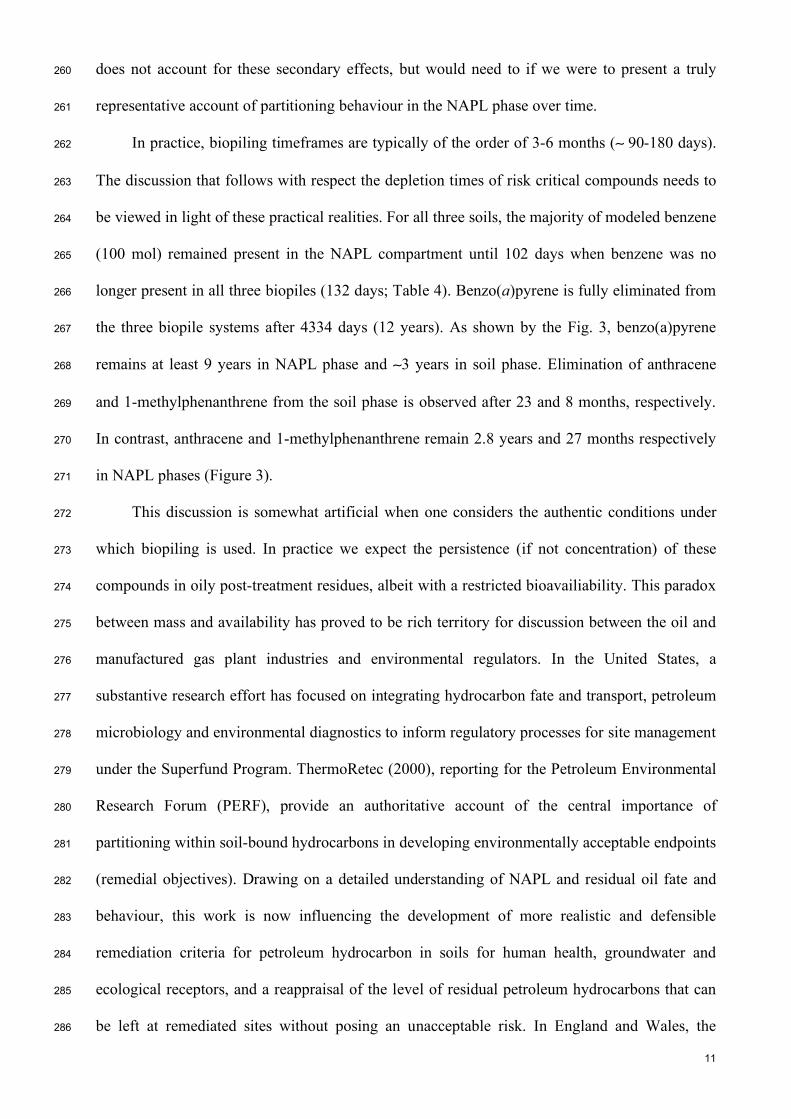
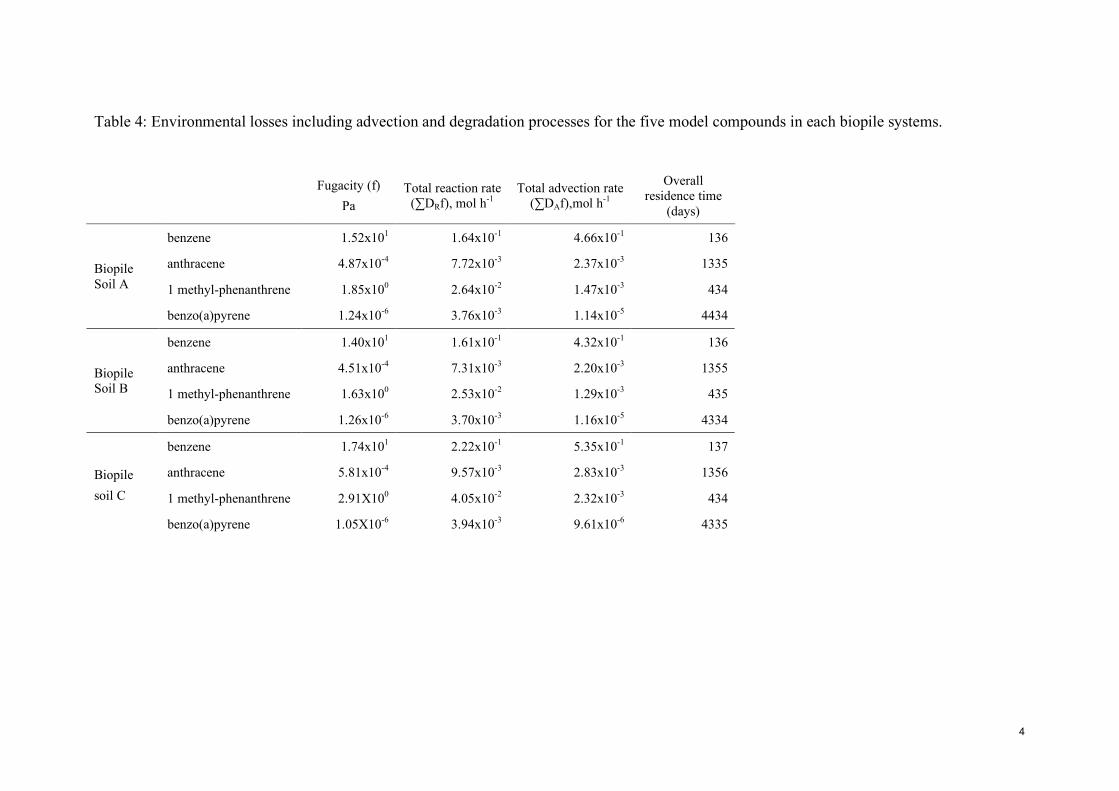
contaminants differed markedly in their fugacities (Table 4). 217
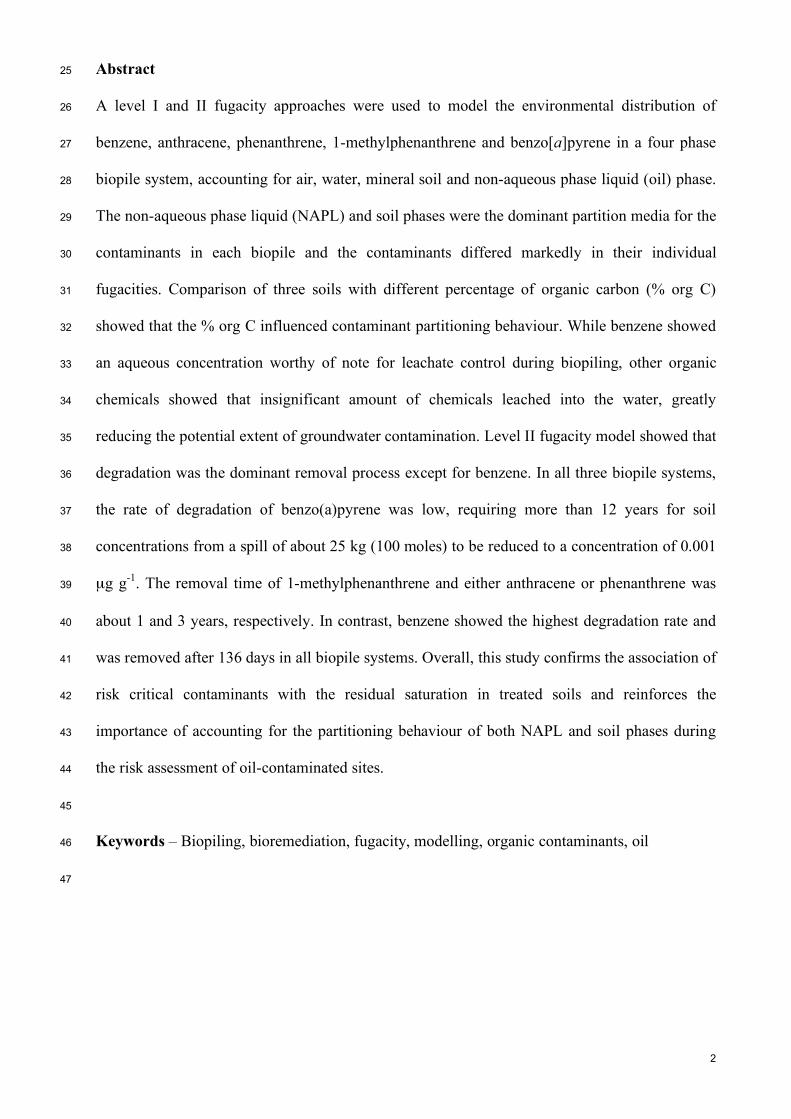
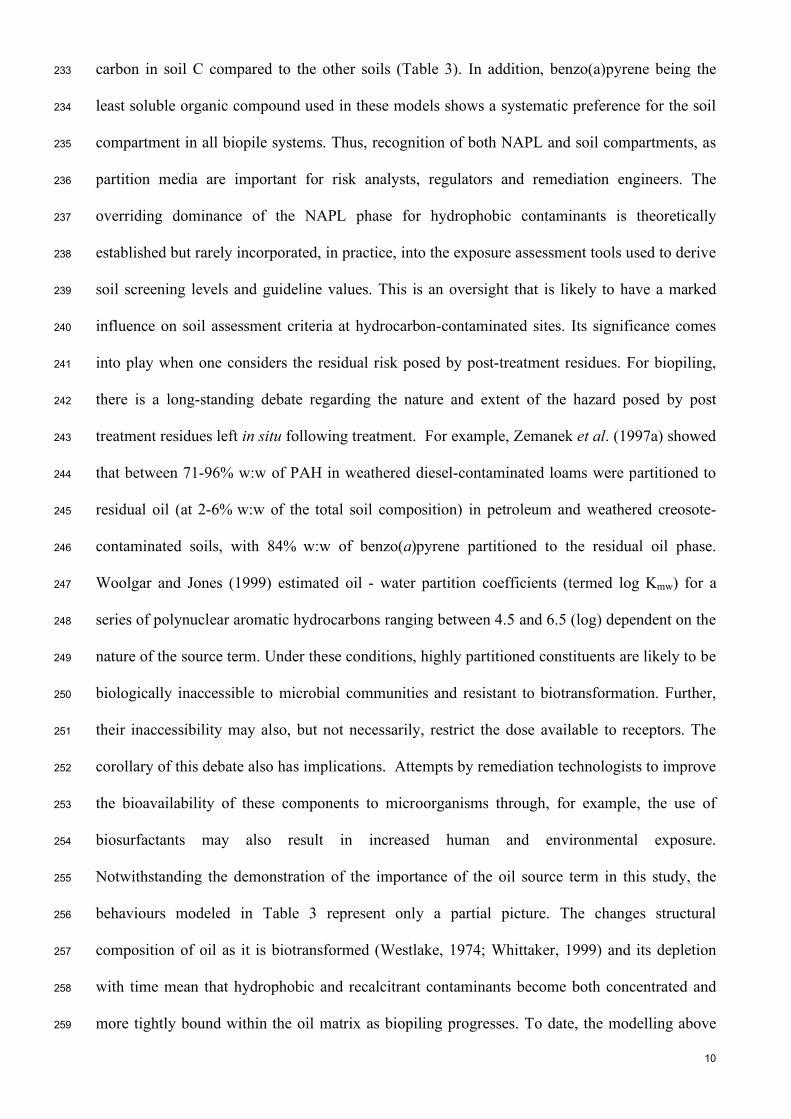
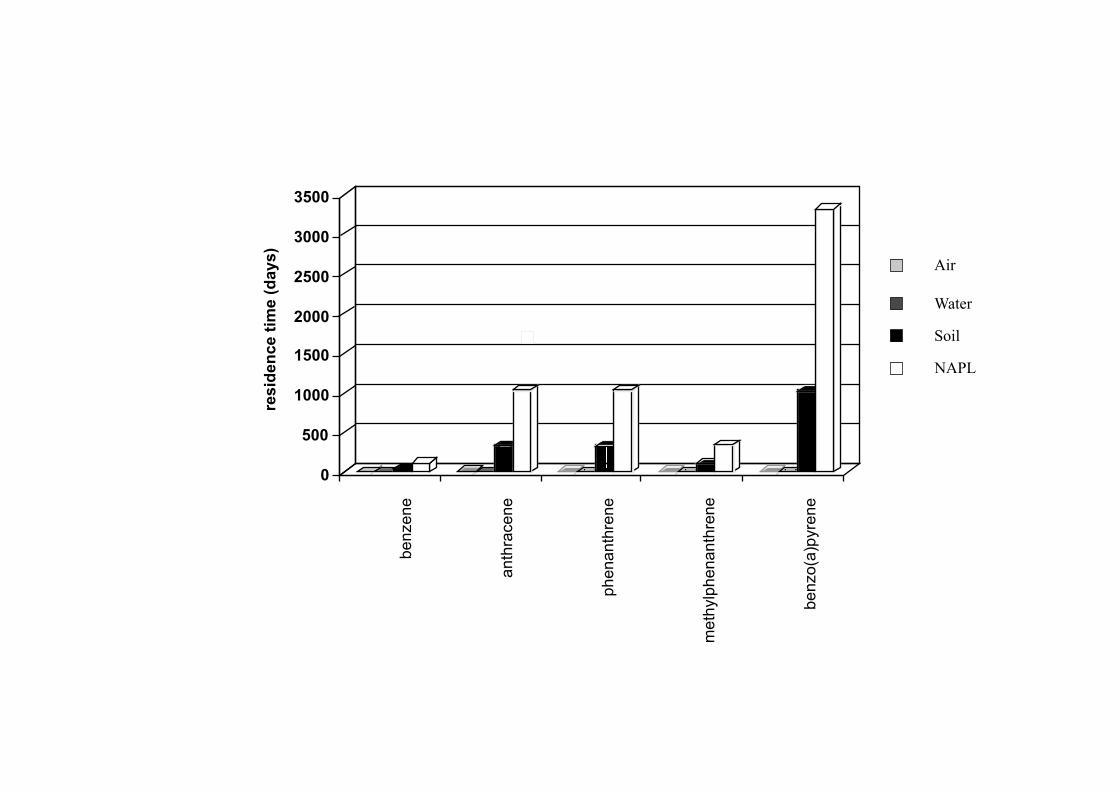
Here we are principally interested in the relative phase partitioning of these contaminants 218
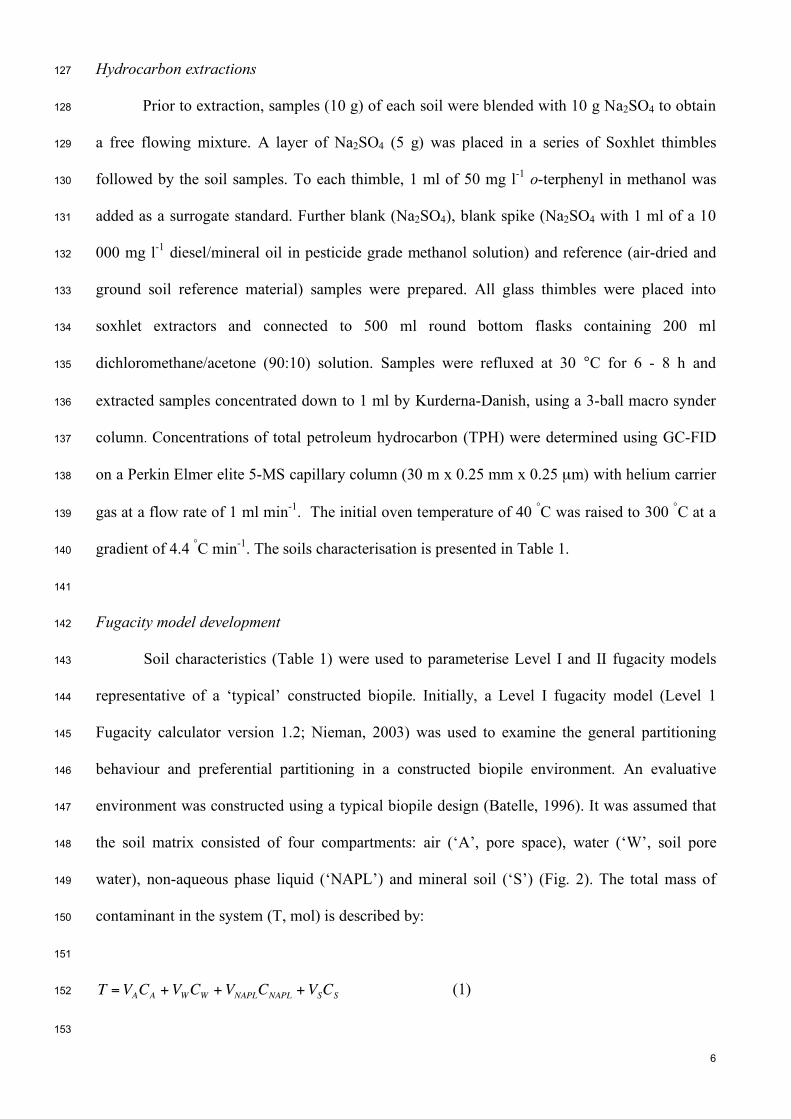
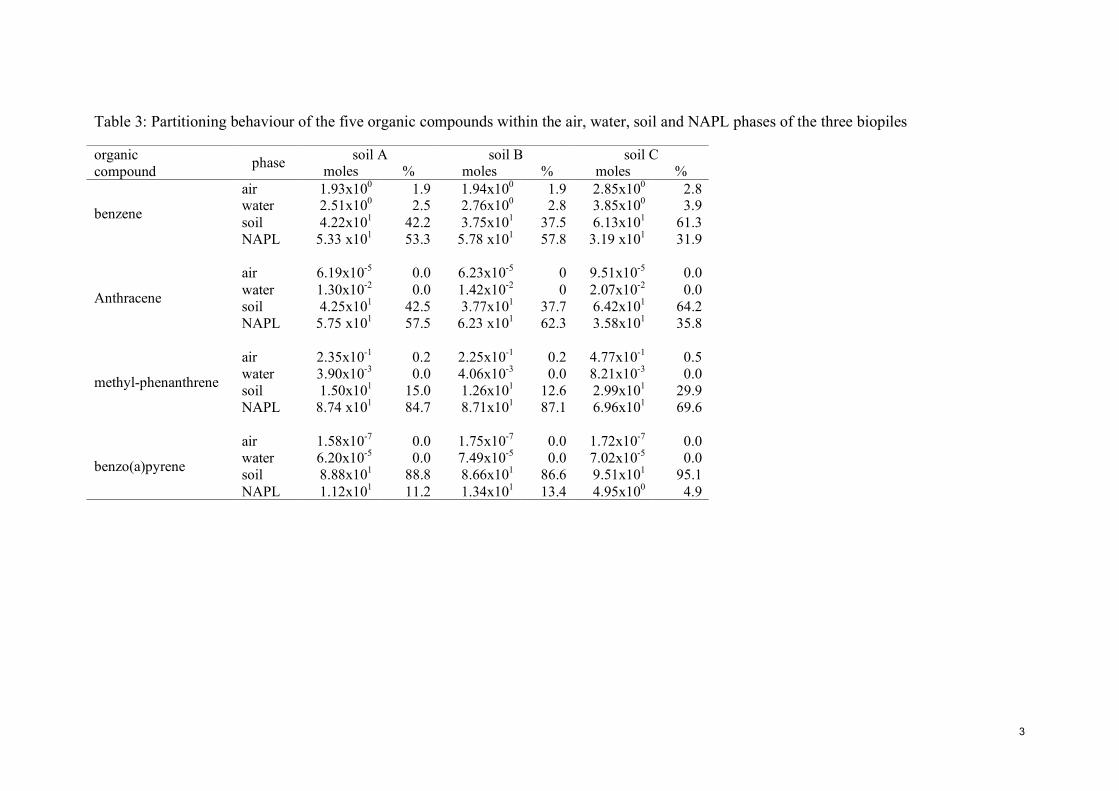
(Table 3) and, from the level II calculations, their time dependent behaviour (Fig. 3 and Table 4) 219
within modeled biopiles. The results for phenanthrene are not presented because its level II 220
model output was not significantly different to anthracene. 221
NAPL and soil are the dominant partition media for these contaminants in each biopile 222
systems (Table 3). The partition behaviour of the compounds is mainly influenced by their water 223
solubility and the percentage of organic carbon in soil. In comparison to NAPL and soil phase 224
concentrations, the water and air phase concentrations are very small except for benzene (Table 225
3). Benzene expresses an aqueous concentration worthy of note for leachate control during 226
biopiling; the air phase concentrations appear insignificant in relation to NAPL and soil phase 227
concentrations. The model provides some comfort, but odour events at biopiling facilities are 228
sufficiently common to warrant further examination of air phase fluxes of risk critical 229
contaminants. 230
Interestingly, benzene and anthracene in soil C shows a greater propensity to transfer to the soil 231
compartment, than in soils A and B. This appears to be due to the higher percentage of organic 232
10
carbon in soil C compared to the other soils (Table 3). In addition, benzo(a)pyrene being the 233
least soluble organic compound used in these models shows a systematic preference for the soil 234
compartment in all biopile systems. Thus, recognition of both NAPL and soil compartments, as 235
partition media are important for risk analysts, regulators and remediation engineers. The 236
overriding dominance of the NAPL phase for hydrophobic contaminants is theoretically 237
established but rarely incorporated, in practice, into the exposure assessment tools used to derive 238
soil screening levels and guideline values. This is an oversight that is likely to have a marked 239
influence on soil assessment criteria at hydrocarbon-contaminated sites. Its significance comes 240
into play when one considers the residual risk posed by post-treatment residues. For biopiling, 241
there is a long-standing debate regarding the nature and extent of the hazard posed by post 242
treatment residues left in situ following treatment. For example, Zemanek et al. (1997a) showed 243
that between 71-96% w:w of PAH in weathered diesel-contaminated loams were partitioned to 244
residual oil (at 2-6% w:w of the total soil composition) in petroleum and weathered creosote-245
contaminated soils, with 84% w:w of benzo(a)pyrene partitioned to the residual oil phase. 246
Woolgar and Jones (1999) estimated oil - water partition coefficients (termed log Kmw) for a 247
series of polynuclear aromatic hydrocarbons ranging between 4.5 and 6.5 (log) dependent on the 248
nature of the source term. Under these conditions, highly partitioned constituents are likely to be 249
biologically inaccessible to microbial communities and resistant to biotransformation. Further, 250
their inaccessibility may also, but not necessarily, restrict the dose available to receptors. The 251
corollary of this debate also has implications. Attempts by remediation technologists to improve 252
the bioavailability of these components to microorganisms through, for example, the use of 253
biosurfactants may also result in increased human and environmental exposure. 254
Notwithstanding the demonstration of the importance of the oil source term in this study, the 255
behaviours modeled in Table 3 represent only a partial picture. The changes structural 256
composition of oil as it is biotransformed (Westlake, 1974; Whittaker, 1999) and its depletion 257
with time mean that hydrophobic and recalcitrant contaminants become both concentrated and 258
more tightly bound within the oil matrix as biopiling progresses. To date, the modelling above 259
11
does not account for these secondary effects, but would need to if we were to present a truly 260
representative account of partitioning behaviour in the NAPL phase over time. 261
In practice, biopiling timeframes are typically of the order of 3-6 months (∼ 90-180 days). 262
The discussion that follows with respect the depletion times of risk critical compounds needs to 263
be viewed in light of these practical realities. For all three soils, the majority of modeled benzene 264
(100 mol) remained present in the NAPL compartment until 102 days when benzene was no 265
longer present in all three biopiles (132 days; Table 4). Benzo(a)pyrene is fully eliminated from 266
the three biopile systems after 4334 days (12 years). As shown by the Fig. 3, benzo(a)pyrene 267
remains at least 9 years in NAPL phase and ∼3 years in soil phase. Elimination of anthracene 268
and 1-methylphenanthrene from the soil phase is observed after 23 and 8 months, respectively. 269
In contrast, anthracene and 1-methylphenanthrene remain 2.8 years and 27 months respectively 270
in NAPL phases (Figure 3). 271
This discussion is somewhat artificial when one considers the authentic conditions under 272
which biopiling is used. In practice we expect the persistence (if not concentration) of these 273
compounds in oily post-treatment residues, albeit with a restricted bioavailiability. This paradox 274
between mass and availability has proved to be rich territory for discussion between the oil and 275
manufactured gas plant industries and environmental regulators. In the United States, a 276
substantive research effort has focused on integrating hydrocarbon fate and transport, petroleum 277
microbiology and environmental diagnostics to inform regulatory processes for site management 278
under the Superfund Program. ThermoRetec (2000), reporting for the Petroleum Environmental 279
Research Forum (PERF), provide an authoritative account of the central importance of 280
partitioning within soil-bound hydrocarbons in developing environmentally acceptable endpoints 281
(remedial objectives). Drawing on a detailed understanding of NAPL and residual oil fate and 282
behaviour, this work is now influencing the development of more realistic and defensible 283
remediation criteria for petroleum hydrocarbon in soils for human health, groundwater and 284
ecological receptors, and a reappraisal of the level of residual petroleum hydrocarbons that can 285
be left at remediated sites without posing an unacceptable risk. In England and Wales, the 286
12
Environment Agency (2003) have also recognised the importance of a authentic representation 287
of partitioning in their consultation, and subsequent framework, (Environment Agency 2005) on 288
evaluating the human health risks from petroleum hydrocarbons in soils. We will be exploring 289
these influences and attempting to validate the modeled behaviours described here with data 290
from microcosms and pilot biopile trials. Ultimately, we are interested in providing a more 291
sound evidence base for the derivation of realistic soil assessment criteria and directing remedial 292
efforts towards risk critical compounds, exposures and environmental media. 293
294
295
13
CONCLUSIONS 295
We have demonstrated the propensity for risk critical compounds in hydrocarbon contaminated 296
soils to be preferentially partitioned to the NAPL and soil phases and modeled their behaviour 297
using typical biopile design parameters. Small differences in the partitioning behaviours of the 298
compounds studied between individual soils were dwarfed by the relative partitioning observed 299
between the air, water, NAPL and soil phases in the evaluative environments. Modeled depletion 300
times for individual contaminants in the context of authentic biopiling are immaterial and thus 301
research efforts should be focused on the likely exposures of humans and other receptors to 302
residual saturation at hydrocarbon-contaminated sites. Further, the results indicate the need for 303
modifications to the exposure assessment models used to generate soil screening guidelines or 304
guideline values, so to better represent contaminant fate in the multimedia systems. 305
306
ACKNOWLEDGEMENTS 307
This work was funded by a Department for Business Enterprise and Regulatory 308
Reform/BBSRC/Environment Agency Grant (BIOREM_35). Work at Cranfield, Aberdeen and 309
Lancaster Universities was funded under BBSRC Grant BB/B512432/1. The authors gratefully 310
acknowledge members of the PROMISE Consortium and especially Dr Gordon Lethbridge 311
(Industrial Chair) for their contributions. 312
313
REFERENCES 314
Allan, S.E., 1989. Chemical analysis of ecological materials. Second edition. Oxford, Blackwells 315
Scientific Publications. 316
Allan, I. J., Semple, K. T., Hare, R., Reid, B. J., 2006. Prediction of mono- and polycyclic 317
aromatic hydrocarbon degradation in spiked soils using cyclodextrin extraction. Environ. 318
Pollut. 144, 562-571. 319
Alexander, M., 2000. Aging, bioavailability, and overestimation of risk from environmental 320
pollutants. Environ. Sci. Technol. 34, 4259-4265. 321
14
Battelle, 1996. Biopile design and construction manual. Technical Memorandum TM-2189-ENV 322
for Naval Facilities Engineering Service Center (NFESC), Port Hueneme, California, 323
USA. 324
Boyd, S.A., Sun, S., 1990. Residual petroleum and polychlorinated oils as sorptive phases for 325
organic contaminants in soils. Environ. Sci. Technol. 24, 142-144. 326
Brassington, K.J., Hough, R.L., Paton, G.I., Semple, K.T., Risdon, G., Crossley, J., Lethbridge, 327
G., Hay, I., Askari, K., Pollard, S.J.T., 2007. Weathered hydrocarbons: a risk management 328
primer. Crit. Rev. Env. Sci. Technol. 37, 199-232 329
Doick, K.J., Dew, N.M., Semple, K.T., 2005. Linking catabolism to cyclodextrin extractability: 330
Determination of the microbial availability of PAHs in soil. Environ. Sci. Technol. 39, 331
8858-8864. 332
Environment Agency, 2003. Principles for evaluating the human health risks from petroleum 333
hydrocarbons in soils: a consultation paper. R&D technical report P5-080/TR1, 334
Environment Agency, Almondsbury, Bristol. 335
Environment Agency, 2005. The UK approach for evaluating human health risks from 336
petroleum hydrocarbons in soils. Science report P5-080/TR3, Environment Agency, 337
Almondsbury, Bristol. 338
Hatzinger, P.B., Alexander, M., 1997. Biodegradation of organic compounds sequestered in 339
organic solids or in nanopores within silica particles. Environ. Toxicol. Chem. 16, 2215-340
2221. 341
Heyes, E., Augustijn, D., Rao, P.S.C. and Delfino, J.J., 2002. Nonaqueous phase liquid 342
dissolution and soil organic matter sorption in porous media: review of system similarities. 343
Crit. Rev. Sci. Technol. 32, 337-397. 344
Huesemann, M.H., 1997. Incomplete hydrocarbon biodegradation in contaminated soils: 345
limitations in bioavailability or inherent recalcitrance? Biorem. J. 1, 27-39. 346
15
Huesemann, M.H., Hausmann, T.S., Fortman, T.J., 2003. Assessment of bioavailaibility 347
limitations during slurry bioremediation of petroleum hydrocarbons in aged soils. Environ. 348
Toxicol. Chem. 22, 2853-5860. 349
Huesemann, M.H., Hausmann, T.S., Fortman, T.J., 2004. Does bioavailability limit 350
biodegradability? A comparison of hydrocarbon biodegradation and desorption rates in 351
aged soils. Biodegradation 15, 261-274. 352
Huesemann, M.H., Hausmann, T.S., Fortman, T.J., 2005. Leaching of BTEX from aged crude 353
oil contaminated model soils: experimental and modelling results. Soil Sediment Contam. 354
14, 545-558. 355
Kirk, J.L., Klironomos, J.N., Lee, H., Trevors, J.T., 2005. The effects of perennial ryegrass and 356
alfalfa on microbial abundance and diversity in petroleum contaminated soil. Environ. 357
Pollut. 133, 455-465. 358
Kjeldsen, P., Christensen, T.H., 2001. A simple model for the distribution and fate of organic 359
chemicals in a landfill: MOCLA. Waste Manage. Res. 19, 201-216. 360
Mackay, D., 2001. Multimedia environmental models: the fugacity approach, second edition. 361
Lewis Publishers, MI. 362
Mills, W.J., Bennett, E.R., Schmidt, C.E., Thibodeaux, L.J., 2004. Obtaining quantitative vapour 363
emissions estimates of polychlorinated biphenyls and other semi-volatile organic 364
compounds from contaminated sites. Environ. Toxicol. Chem. 23, 2457-2464. 365
Nieman, K.C., 2003. How to use a level I fugacity model to estimate contaminant partitioning in 366
the subsurface. Clearinghouse ENV06. 367
Paton, G.I., Viventsova, E., Kumpene, J., Wilson, M.J., Weitz, H.J., Dawson, J.J.C., 2006. An 368
ecotoxicity assessment of contaminated forest soils from the Kola Peninsula. Sci. Total 369
Environ. 355, 106-117. 370
Pignatello, J.J., Xing, B., 1996. Mechanisms of slow sorption of organic chemicals to natural 371
particles. Environ. Sci. Technol. 30, 1-11. 372
16
Pollard, S.J.T., Hrudey, S.E., Fuhr, B.J., Alex, R.F., Holloway, L.R., Tosto, F., 1992. 373
Hydrocarbon wastes at petroleum and creosote contaminated sites: rapid characterisation 374
of class components by thin layer chromatography with flame ionization detection. 375
Environ. Sci. Technol. 26, 2528-2534. 376
Pollard, S.J.T., Hoffmann, R.E., Hrudey, S.E., 1993. Screening of risk management options for 377
abandoned wood-preserving plant sites in Alberta, Canada. Can. J. Civil Eng. 20, 787-800. 378
Pollard, S.J.T., Whittaker, M., Risdon, G.C., 1999. The fate of heavy oil in soil microcosms i: a 379
performance assessment of biotransformation indices. Sci. Tot. Environ. 226, 1-22. 380
Pollard, S.J.T., Hrudey, S.E., Rawluk, M. and Fuhr, B.J., 2004. Characterisation of weathered 381
hydrocarbon wastes at contaminated sites by GC-simulated distillation and nitrous oxide 382
chemical ionisation GC-MS, with implications for bioremediation. J. Environ. Monit. 6, 383
713-718. 384
Rowell, D.L., 1997. Soil Science: Methods and Applications. Longman Singapore Publishers 385
Ltd. Singapore. 386
Shafi, S., Sweetman, A., Hough, R.L., Smith, R., Rosevear, A., Pollard, S.J.T., 2006. Evaluating 387
fugacity models for trace components in landfill gas. Environ. Pollut. 144, 1013-1023. 388
She, Y., Sleep, B., Mackay, D., 1995. A fugacity model for soil vapour extraction. J. Soil 389
Contam. 4, 227-242. 390
ThermoRetec Consulting Corporation, 2000. Environmentally acceptable endpoints for 391
hydrocarbon-contaminated soils. Prepared for petroleum environmental research forum 392
project 94-06. 393
United States Environmental Protection Agency, 1991. A scientific evaluation of the mobility 394
and degradability of organic contaminants in subsurface environments. Office of Research 395
and Development Report EPA/600/2-91/053. 396
Walter, T., Ederer, H.J., Först, C., Stieglitz, L., 2000. Sorption of selected polycyclic aromatic 397
hydrocarbons on soils in oil-contaminated systems. Chemosphere 41, 387-397. 398
17
Westlake, D.W.S., Jobson, A., Phillippe, R., Cook, F.D., 1974. Biodegradability and crude oil 399
composition. Can J. Microbiol. 20, 915-928. 400
Whittaker, M., Pollard, S.J.T., Risdon, G.C., 1999. The fate of heavy oil in soil microcosms II: a 401
performance assessment of source correlation indices. Sci. Tot. Environ. 226, 23-32. 402
Woolgar, P.J., 1997. The influence of contaminant source materials on the aqueous dissolution 403
of polycyclic aromatic hydrocarbons. Ph.D. Thesis, Institute of Environmental and Natural 404
Sciences, Lancaster University, UK. 405
Woolgar, P, Jones, K., 1999. Studies on the dissolution of polycyclic aromatic hydrocarbons 406
from contaminated materials using a novel dialysis tubing experimental method. Environ. 407
Sci. Technol. 33, 2118-26. 408
Zemanek, M.G., Pollard, S.J.T., Kenefick, S.L., Hrudey, S.E., 1997a. Multiphase partitioning 409
and co-solvent effects for polynuclear aromatic hydrocarbons (PAH) in authentic 410
petroleum- and creosote-contaminated soils. Environ. Pollut. 98, 239-252 411
Zemanek, M.G., Pollard, S.J.T., Kenefick, S.L., Hrudey, S.E., 1997b. Toxicity and mutagenicity 412
of component classes isolated from soils at petroleum- and creosote-contaminated sites. J. 413
Air Waste Manage. Assoc. 47, 1250-1258 414
415
Figures caption 1
2
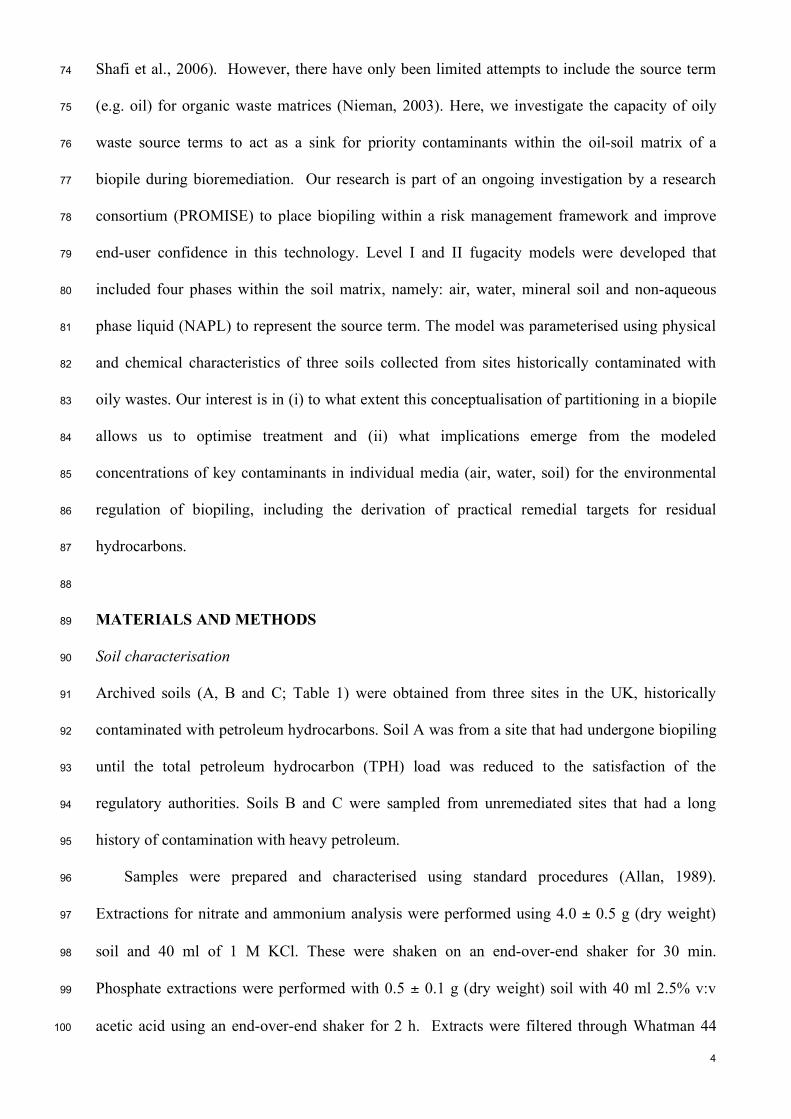
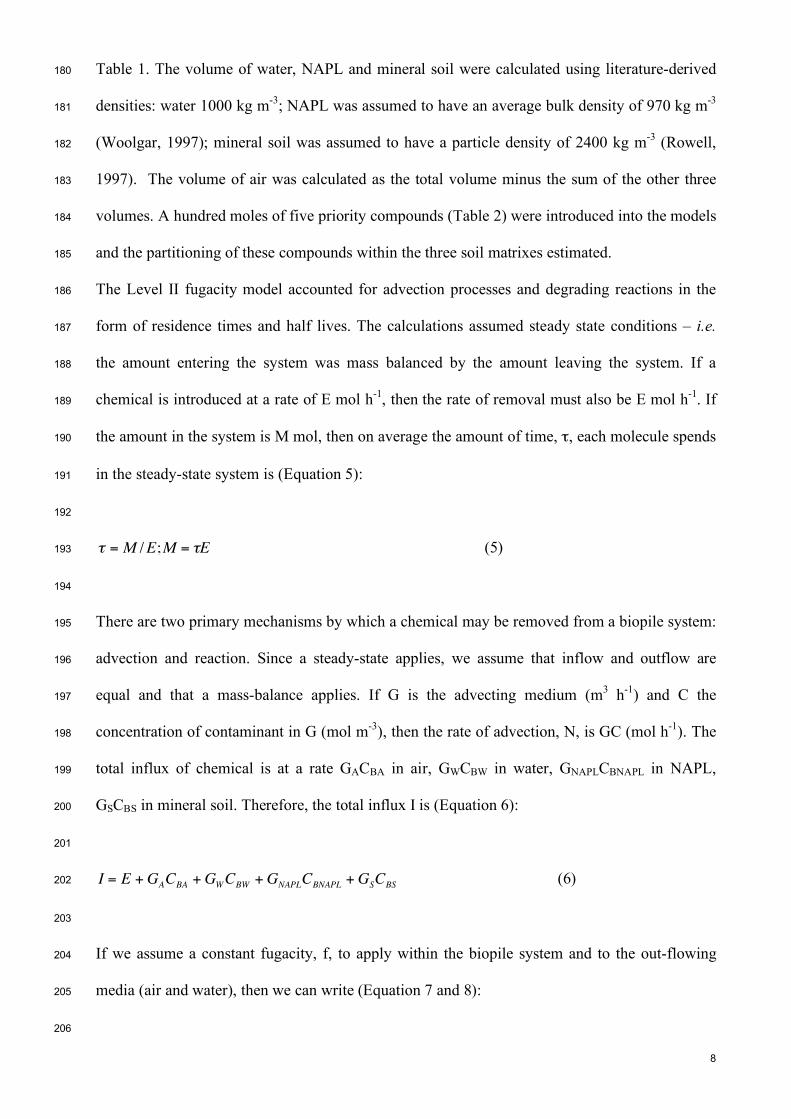
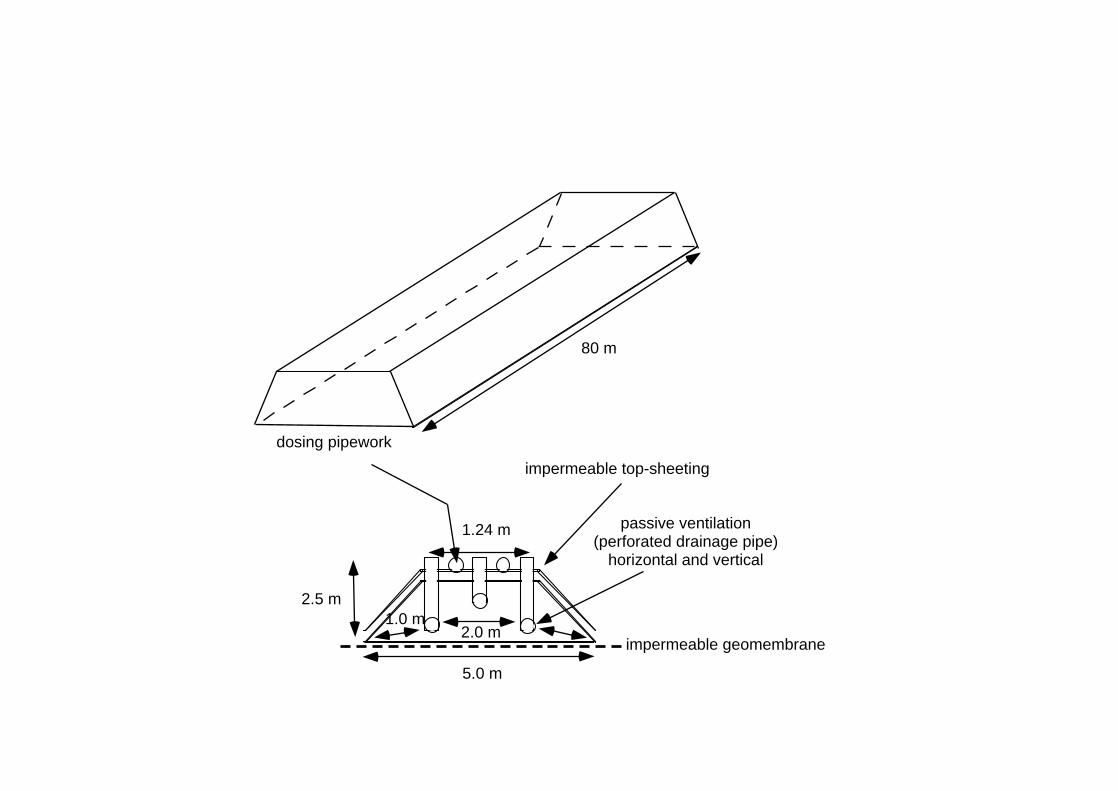
Fig. 1 – Schematic and cross-sectional of the biopile ‘evaluative environment’. The final 3
biopile construction has a volume of 624 m3 and weighs ca.7.5×105 kg. 4
5
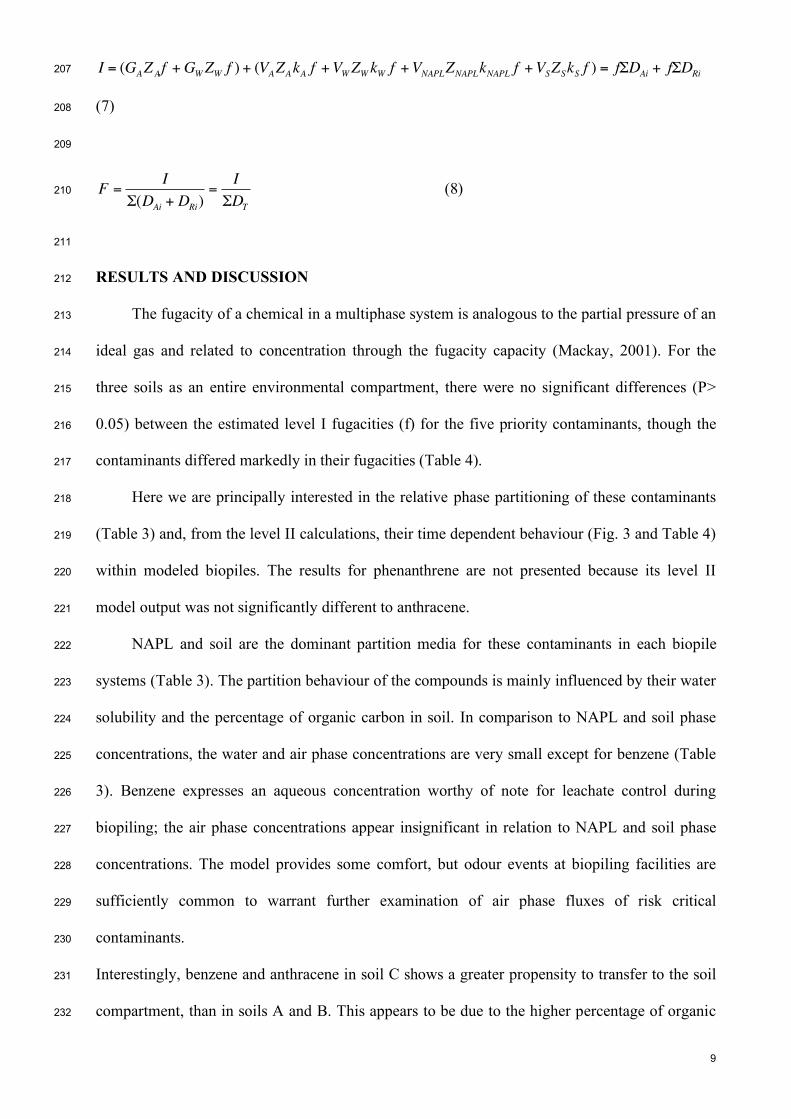
Fig. 2 – Schematic of the fugacity model developed for each soil including definition of 6
fugacity capicities used for each compartiment. Z is the proportionality constant (mol m-3 Pa); 7
H is the Henry’s Law constant (Pa m3 mol-1); R is the gas constant = (8.314 m3 Pa K-1 mol-1); 8
Temperature (K); KS represents a partition coefficient (l kg-1). ρS is the soil bulk density (kg l-9
1). The inflow and outflow of air and water through the biopile system, and the losses of 10
contaminants, are represented by the bold arrows. 11
12
Fig. 3 – Representative partitioning and degradation behaviour of the five model compounds 13
within the soil:oil biopile matrix A. 14
15
16
80 m
dosing pipework
impermeable top-sheeting
passive ventilation(perforated drainage pipe)
horizontal and vertical
impermeable geomembrane
5.0 m
1.24 m
2.5 m
2.0 m1.0 m
“
CNAPL OIL
CW PORE WATER
CS
SORBED ON MINERAL SOIL
f FUGACITY
ZA=1/RT
ZS=KP S/H
ZW=1/H
ZO=KOW/H
SKP KOW
KAW GWCBW
GWCW
GACBA
GACA CA
AIR (PORE SPACE)
0
500
1000
1500
2000
2500
3000
3500
resi
denc
etim
e(d
ays)
benz
ene
anth
race
ne
phen
anth
rene
met
hylp
hena
nthr
ene
benz
o(a)
pyre
ne
Air
Water
Soil
NAPL
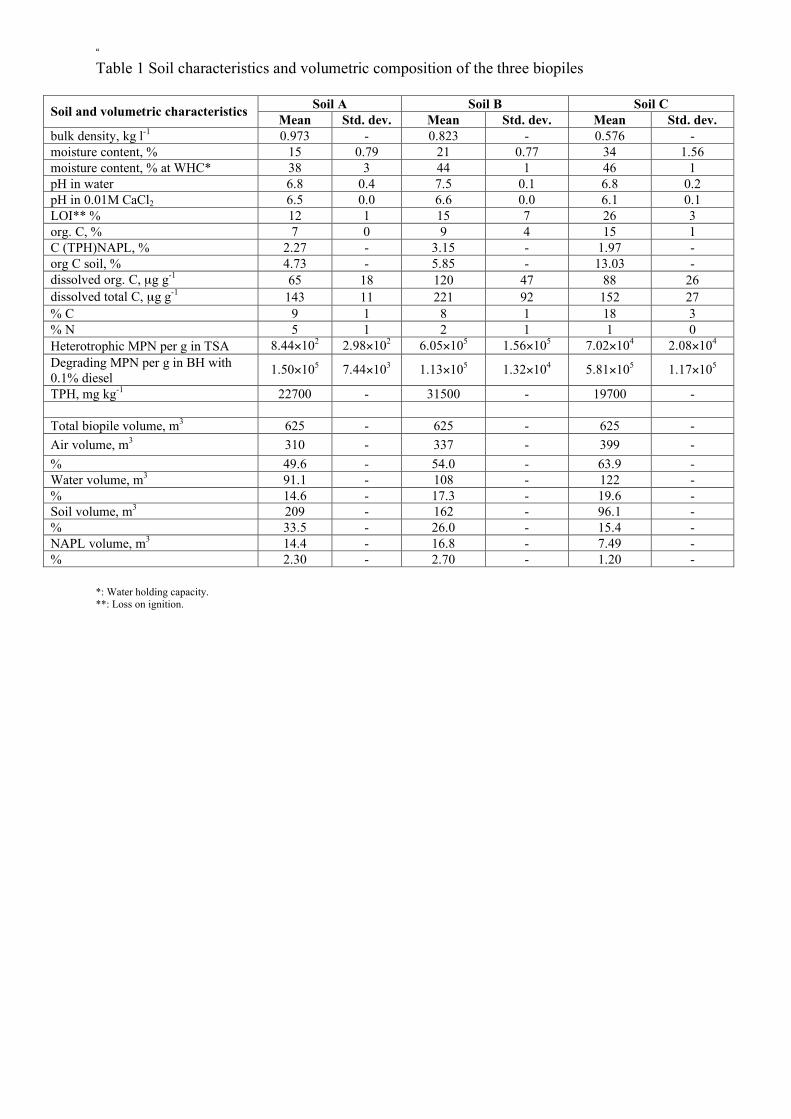
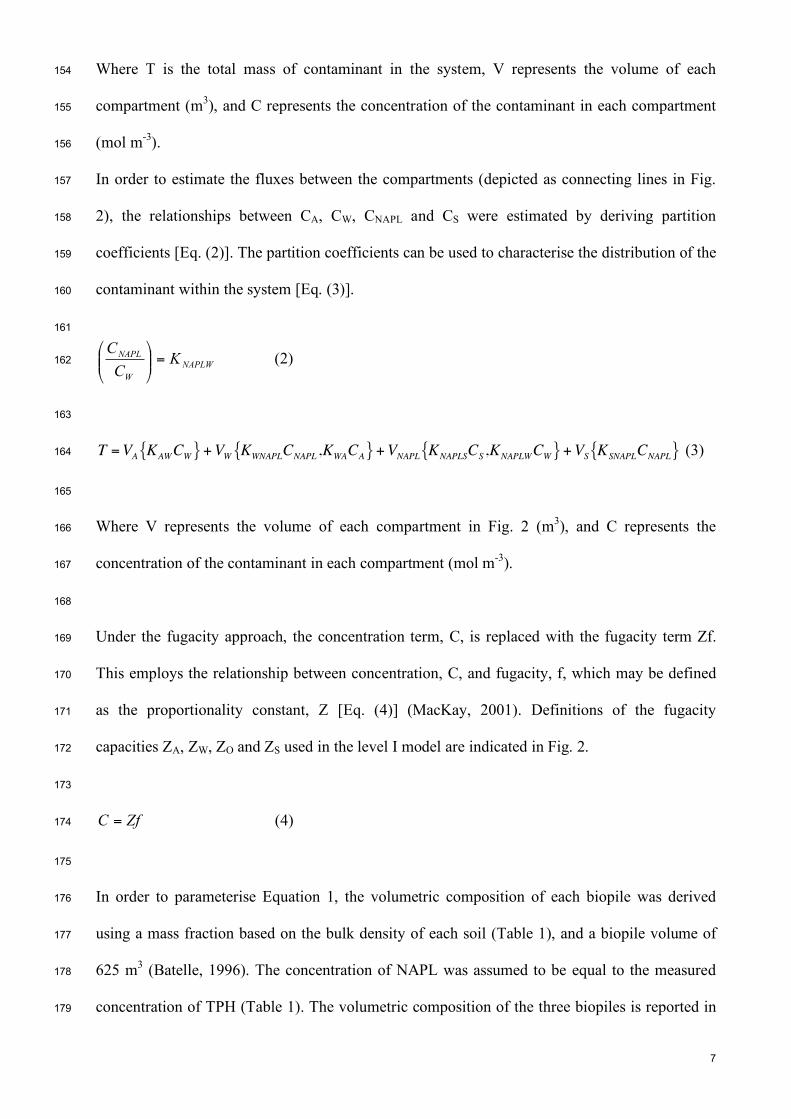
“ Table 1 Soil characteristics and volumetric composition of the three biopiles
Soil A Soil B Soil C Soil and volumetric characteristics Mean Std. dev. Mean Std. dev. Mean Std. dev. bulk density, kg l-1 0.973 - 0.823 - 0.576 - moisture content, % 15 0.79 21 0.77 34 1.56 moisture content, % at WHC* 38 3 44 1 46 1 pH in water 6.8 0.4 7.5 0.1 6.8 0.2 pH in 0.01M CaCl2 6.5 0.0 6.6 0.0 6.1 0.1 LOI** % 12 1 15 7 26 3 org. C, % 7 0 9 4 15 1 C (TPH)NAPL, % 2.27 - 3.15 - 1.97 - org C soil, % 4.73 - 5.85 - 13.03 - dissolved org. C, µg g-1 65 18 120 47 88 26 dissolved total C, µg g-1 143 11 221 92 152 27 % C 9 1 8 1 18 3 % N 5 1 2 1 1 0 Heterotrophic MPN per g in TSA 8.44×10² 2.98×10² 6.05×10⁵ 1.56×10⁵ 7.02×10⁴ 2.08×10⁴ Degrading MPN per g in BH with 0.1% diesel 1.50×10⁵ 7.44×10³ 1.13×10⁵ 1.32×10⁴ 5.81×10⁵ 1.17×10⁵
TPH, mg kg-1 22700 - 31500 - 19700 - Total biopile volume, m3 625 - 625 - 625 - Air volume, m3 310 - 337 - 399 - % 49.6 - 54.0 - 63.9 - Water volume, m3 91.1 - 108 - 122 - % 14.6 - 17.3 - 19.6 - Soil volume, m3 209 - 162 - 96.1 - % 33.5 - 26.0 - 15.4 - NAPL volume, m3 14.4 - 16.8 - 7.49 - % 2.30 - 2.70 - 1.20 -
*: Water holding capacity. **: Loss on ignition.
2
Table 2: Input parameters
Chemical benzene benzo[a]pyrene anthracene phenanthrene 1-methylphenanthrene Molecular Weight, g mol-1 7.81×101 2.52×10² 1.78×10² 1.78×10² 1.92×10²
Water Solubility, mg l-1 1.78×10³ 3.80×10⁻³ 4.50×10⁻² 1.1×100 2.69×10⁻¹ Vapor Pressure, mmHg 7.60×101 5.49×10⁻⁹ 1.08×10⁻⁵ 2.01×10⁻⁴ 7.27×10⁻⁵
Henry’s Law constant, atm m3 mol-1 5.43×10⁻³ 1.80×10⁻⁵ 3.38×10⁻⁵ 3.98×10⁻⁵ 4.27×10⁻¹
log Kow 2.13×100 6.06×100 4.45×100 4.46×100 5.14×100
log Koc 1.81×100 6.74×100 4.10×100 4.10×100 4.17×100
τ1/2 Air 1.70×101 1.70×10² 5.50×101 5.50×101 1.70×101
τ1/2 Water 1.70×10² 1.70×10³ 5.50×10² 5.50×10² 1.70×10²
τ1/2 Soil 5.50×10² 1.70×10⁴ 5.50×10³ 5.50×10³ 1.70×10³
τ1/2 NAPL 1.70×10³ 5.50×10⁴ 1.70×10⁴ 1.70×10⁴ 5.50×10³
3
Table 3: Partitioning behaviour of the five organic compounds within the air, water, soil and NAPL phases of the three biopiles
soil A soil B soil C organic compound phase moles % moles % moles %
air 1.93x100 1.9 1.94x100 1.9 2.85x100 2.8 water 2.51x100 2.5 2.76x100 2.8 3.85x100 3.9 soil 4.22x101 42.2 3.75x101 37.5 6.13x101 61.3 benzene
NAPL 5.33 x101 53.3 5.78 x101 57.8 3.19 x101 31.9
air 6.19x10⁻⁵ 0.0 6.23x10⁻⁵ 0 9.51x10⁻⁵ 0.0 water 1.30x10⁻² 0.0 1.42x10⁻² 0 2.07x10⁻² 0.0 soil 4.25x101 42.5 3.77x101 37.7 6.42x101 64.2 Anthracene
NAPL 5.75 x101 57.5 6.23 x101 62.3 3.58x101 35.8
air 2.35x10⁻¹ 0.2 2.25x10⁻¹ 0.2 4.77x10⁻¹ 0.5 water 3.90x10⁻³ 0.0 4.06x10⁻³ 0.0 8.21x10⁻³ 0.0 soil 1.50x101 15.0 1.26x101 12.6 2.99x101 29.9 methyl-phenanthrene
NAPL 8.74 x101 84.7 8.71x101 87.1 6.96x101 69.6
air 1.58x10⁻⁷ 0.0 1.75x10⁻⁷ 0.0 1.72x10⁻⁷ 0.0 water 6.20x10⁻⁵ 0.0 7.49x10⁻⁵ 0.0 7.02x10⁻⁵ 0.0 soil 8.88x101 88.8 8.66x101 86.6 9.51x101 95.1 benzo(a)pyrene
NAPL 1.12x101 11.2 1.34x101 13.4 4.95x100 4.9
4
Table 4: Environmental losses including advection and degradation processes for the five model compounds in each biopile systems.
Fugacity (f) Pa
Total reaction rate (∑DRf), mol h-1
Total advection rate (∑DAf),mol h-1
Overall residence time
(days)
benzene 1.52x101 1.64x10⁻¹ 4.66x10⁻¹ 136
anthracene 4.87x10⁻⁴ 7.72x10⁻³ 2.37x10⁻³ 1335
1 methyl-phenanthrene 1.85x100 2.64x10⁻² 1.47x10⁻³ 434 Biopile Soil A
benzo(a)pyrene 1.24x10⁻⁶ 3.76x10⁻³ 1.14x10⁻⁵ 4434
benzene 1.40x101 1.61x10⁻¹ 4.32x10⁻¹ 136
anthracene 4.51x10⁻⁴ 7.31x10⁻³ 2.20x10⁻³ 1355
1 methyl-phenanthrene 1.63x100 2.53x10⁻² 1.29x10⁻³ 435 Biopile Soil B
benzo(a)pyrene 1.26x10⁻⁶ 3.70x10⁻³ 1.16x10⁻⁵ 4334
benzene 1.74x101 2.22x10⁻¹ 5.35x10⁻¹ 137
anthracene 5.81x10⁻⁴ 9.57x10⁻³ 2.83x10⁻³ 1356
1 methyl-phenanthrene 2.91X100 4.05x10⁻² 2.32x10⁻³ 434
Biopile soil C
benzo(a)pyrene 1.05X10⁻⁶ 3.94x10⁻³ 9.61x10⁻⁶ 4335
Related Documents