BORNOVA / İZMİR AUGUST 2019 YAŞAR UNIVERSITY GRADUATE SCHOOL OF NATURAL AND APPLIED SCIENCES MASTER THESIS FUEL THEFT DETECTION SYSTEM ASLIGÜL PALA BAYSAK THESIS ADVISOR: PROF. DR. MUSTAFA GÜNDÜZALP ELECTRICAL AND ELECTRONICS ENGINEERING PRESENTATION DATE: 28.08.2019

Welcome message from author
This document is posted to help you gain knowledge. Please leave a comment to let me know what you think about it! Share it to your friends and learn new things together.
Transcript
BORNOVA / İZMİR
AUGUST 2019
YAŞAR UNIVERSITY
GRADUATE SCHOOL OF NATURAL AND APPLIED SCIENCES
MASTER THESIS
FUEL THEFT DETECTION SYSTEM
ASLIGÜL PALA BAYSAK
THESIS ADVISOR: PROF. DR. MUSTAFA GÜNDÜZALP
ELECTRICAL AND ELECTRONICS ENGINEERING
PRESENTATION DATE: 28.08.2019

ii
iii
We

iv
v
ABSTRACT
FUEL THEFT DETECTION SYSTEM
Pala Baysak, Aslıgül
MSc, Electrical and Electronics Engineering
Advisor: Prof. Mustafa GÜNDÜZALP
August 2019
In today's technology, wireless communication devices with Bluetooth have started to
take an important part of daily lives and is rapidly growing. At this point, researches
are made about the low power consumption of the devices, fast and secure
communication. Bluetooth Low Energy (BLE) ensures these requirements and is
developing day by day to provide a low-energy and low-cost solution for the Internet
of Things (IoT). Nowadays, in-vehicle electronics technology is becoming essential
with respect to customer needs. According to the claim report results of one of the
reputable automotive manufacturers indicates that the crucial expectation of prospects
and customers is to have safety electronic systems and following up the status of the
car remotely. Due to this reason consumer electronics and internet of things (IoT)
technologies are depending on the assessment of needs. In order to follow up the status
of the car remotely, Bluetooth Low Energy technology (BLE) and acceleration sensors
are widely used in vehicle electronics.
In this study, a prototype fuel level control system is implemented using wireless
sensor networks via BLE. The fuel level sensor is placed into the fuel tank to collect
the data. Fuel levels are measured inside the fuel cap for different scenarios. If an
abrupt change occurs in the fuel level, the users are informed via a vehicle tracking
system. The data set was generated according to the variation of fuel height and
currents. "Current" is the dependent variable and "height" is the independent factor.
For this reason, to compare the values, one-way analysis of variance (ANOVA) was
implemented. At first, the hypotheses of homogeneity and ANOVA were established.
The significance level was chosen as α=5% (0.05). It means that the results have a
95% chance of being true and have a 5% chance for being false. The SPSS results

vi
represent
95% confidence intervals. As a result of the ANOVA test, it is obtained that the
different hole diameter has the same effect to generate the R (ohm).
The current work aims to process data locally, transmitting via Bluetooth Low Energy
and reporting the output data. The results/outputs of the system implementation are
evaluated statistically with experimental design.
Key Words: IoT, Bluetooth Low Energy (BLE), Smart Sensor, Digital Fuel Level,
Fuel Security System
vii
ÖZ
FUEL THEFT DETECTION SYSTEM
Pala Baysak, Aslıgül
Yüksek Lisans, Elektrik Elektronik Mühendisliği
Danışman: Prof. Dr. Mustafa GÜNDÜZALP
Ağustos 2019
Günümüz teknolojisinde Bluetooth ile kablosuz haberleşen cihazlar günlük hayatta
önemli bir yer almaya ve sıklıkla kullanılmaya başlanmıştır. Bu kapsamda cihazların
düşük güç tüketimi, hızlı ve güvenli bir şekilde haberleşmesi üzerinde araştırmalar
yapılmaktadır. Bu özellikleri sağlayan ve gün geçtikçe gelişmekte olan Bluetooth
Düşük Enerji teknolojisi (BLE), düşük enerji tüketimi ve düşük maliyetli bir çözüm
sunmaktadır. Günümüzde, araç içi elektronik teknolojisi müşteri ihtiyaçlarına göre
değişkenlik göstermektedir. Saygın otomotiv üreticileri potansiyel müşterilerin istek
ve ihtiyaçlarını inceleyerek en önemli beklentilerinin emniyetli elektronik sistemlere
sahip olmak ve aracın durumunu uzaktan izlemek olduğunu göstermiştir. Bu sebeple
aracın uzaktan durumunu takip etmek için, araç elektroniğinde Bluetooth Low Energy
teknolojisi (BLE) ve hızlanma sensörleri yaygın olarak kullanılmaktadır.
Bu çalışmada, BLE yoluyla kablosuz sensör ağları kullanılarak yakıt seviyesi kontrol
sistemi kurulmuştur. Araç park pozisyonunda ve kontak kapalı iken belirli zaman
aralıklarında devreye giren sensör ile yakıt seviyesi ölçümünü sağlayan yakıt ölçüm
sensörünün haberleşmesi sağlanarak verinin araç takip sistemi ile haberleşerek araç
sahiplerine iletilmesi hedeflenmiştir. Veri seti yakıt seviyesi değişimine bağlı yakıt
seviye sensörü üzerinde oluşan direncin ölçümü ile elde edilen akım değerlerinden
oluşmuştur. Akım bağımlı değişken olarak seçilirken, yakıt seviyesi yüksekliği
bağımsız değişken olarak belirlenmiştir. Yakıt tankından yakıt alınması çeşitlerinden
birisi olan tankın alt tarafından delinerek boşalması senaryosu baz alınarak üç farklı
delik çapının boşalmanın yakıt seviye sensörü üzerindeki etkisi incelenmiştir. Bu
nedenle oluşan değerleri kıyaslama amacıyla tek yönlü varyans analizi yöntemi
(ANOVA) seçilmiştir. İlk aşamada homojenlik ve normallik testleri yapılarak

viii
ANOVA analizine uygunluk değerlendirilmiştir. Önem seviyesi %95 olarak seçilerek
sonuçlarda %5 hata payı bırakılmıştır. ANOVA testi sonuçlarına göre üç farklı delik
çapının yakıt seviyesi sensörü üzerinde voltaj oluşturulmasında aynı etkiyi
gösterdikleri saptınmıştır. Mevcut çalışma, yerel olarak veri işlemeyi, Bluetooth Low
Energy ile veri iletmeyi ve çıktı verilerini raporlamayı amaçlamaktadır. Uygulama
istatistiksel deney tasarımı ile analizlenmiştir.
Anahtar Kelimeler: IoT, Bluetooth Düşük Enerji, Akıllı Sensör, Dijital Yakıt
Seviyesi, Yakıt Güvenlik Sistemi

ix
ACKNOWLEDGEMENTS
First of all, I would like to thank my supervisor Prof. Dr. Mustafa Gündüzalp for his
guidance and patience during this study.
I thank to Serhat Sandalcı (General Manager), Adnan Üsküdar (R&D Manager) and
Nesan Otomotiv A.Ş. for their valuable support and cooperation. I would like to thank
my best friend Lecturer Ruti Politi for her continuous advice for academic purposes.
I would like to express my gratitude to the jury members Asst. Prof. Reyat Yılmaz and
Asst. Prof. Gökhan Demirkıran for their valuable advice.
This work would not have been possible without the support of my company VeriPark
and my manager Atakan Pehlivanoğlu (Senior Manager) and Alpaslan Özlü (General
Manager) who have been supportive of my career goals.
I must express my very profound gratitude to my mother Prof. Dr. Ayşegül Pala, my
father Mehmet Mazhar Pala, my husband Emir Arslan Baysak and my aunt Prof. Dr.
Leyla İyilikçi Karaoğlan for providing me with unfailing support and continuous
encouragement throughout my years of study and through the process of researching
and writing this thesis. This accomplishment would not have been possible without
them.
Aslıgül PALA BAYSAK
İzmir, 2019

x
TEXT OF OATH
I declare and honestly confirm that my study, titled “FUEL THEFT DETECTION
SYSTEM” and presented as a Master’s Thesis, has been written without applying to
any assistance inconsistent with scientific ethics and traditions. I declare, to the best of
my knowledge and belief, that all content and ideas drawn directly or indirectly from
external sources are indicated in the text and listed in the list of references.
Aslıgül Pala Baysak
………………………………..
October 4, 2019
xi
TABLE OF CONTENTS
ABSTRACT ............................................................................................................................. v
ÖZ .......................................................................................................................................... vii
ACKNOWLEDGEMENTS .................................................................................................... ix
TEXT OF OATH ..................................................................................................................... x
TABLE OF CONTENTS ........................................................................................................ xi
LIST OF FIGURES .............................................................................................................. xiii
LIST OF TABLES ................................................................................................................. xv
SYMBOLS AND ABBREVIATONS .................................................................................. xvi
CHAPTER 1 INTRODUCTION ............................................................................................. 1
1.1 RESEARCH PROBLEM STATEMENT ...................................................................... 1
1.2 THE OBJECTIVE OF THE THESIS ............................................................................ 3
CHAPTER 2 BACKGROUND – LITERATURE REVIEW .................................................. 4
2.1 VEHICLE ELECTRONICS AND NETWORKS ......................................................... 4
2.2 BLUETOOTH ............................................................................................................... 4
2.3 BLUETOOTH LOW ENERGY (BLE) ......................................................................... 5
2.4 BLE LAYERS ............................................................................................................... 9
2.4.1 APPLICATION .................................................................................................. 9
2.4.2 HOST ................................................................................................................. 9
2.4.3 CONTROLLER ............................................................................................... 10
2.5 SMART SENSOR ....................................................................................................... 15
CHAPTER 3 MATERIAL AND METHODS ....................................................................... 17
3.1 SYSTEM OVERVIEW ............................................................................................... 17
3.2 DEVICES AND PROGRAMS .................................................................................... 18
3.2.1 NRF51824 – NORDIC SEMICONDUCTOR ................................................. 18
3.2.2 NRF51 DONGLE ............................................................................................. 23
xii
3.3 APPLICATION OVERVIEW ..................................................................................... 26
3.3.1 DEVELOPING WITH THE MDK-ARM MICROCONTROLLER
DEVELOPMENT KIT................................................................................................... 26
3.3.2 TESTING ......................................................................................................... 26
3.4 FUEL LEVEL SENSOR ............................................................................................. 28
CHAPTER 4 APPLICATION ............................................................................................... 33
4.1 SYSTEM MODELING ............................................................................................... 33
4.1.1 3 MM OF HOLE DIAMETER ........................................................................ 37
4.1.2 5 MM OF HOLE DIAMETER ........................................................................ 38
4.1.3 10 MM OF HOLE DIAMETER ...................................................................... 38
4.2 STATISTICAL EVALUATION ................................................................................. 39
4.2.1 TEST OF NORMALITY ................................................................................. 42
4.2.2 ANOVA EXPERIMENTAL DESIGN ............................................................ 44
CHAPTER 5 CONCLUSION ................................................................................................ 47
REFERENCES ...................................................................................................................... 49
xiii
LIST OF FIGURES
Figure 2-1 Bluetooth Classic and Smart usage areas .............................................................. 6
Figure 2-2 The evaluation of Bluetooth .................................................................................. 7
Figure 2-3 Star typology of a piconet ..................................................................................... 7
Figure 2-4 BLE Architecture .................................................................................................. 9
Figure 2-5 BLE communication band ................................................................................... 11
Figure 2-6 The stack diagram of the SoftDevice .................................................................. 12
Figure 2-7 BLE link layers of the roles ................................................................................. 13
Figure 2-8 Link-layer change example of a BLE connection ............................................... 13
Figure 2-9 BLE discovery phase ........................................................................................... 14
Figure 2-10 Slave negotiation parameters ............................................................................. 15
Figure 2-11 Wireless sensor topologies ................................................................................ 16
Figure 3-1 Fuel theft detection process ................................................................................. 17
Figure 3-2 The Development Kit content of the nRF51 ....................................................... 19
Figure 3-3 BLE spectrum captured using nRF connection of 40 channels ........................... 20
Figure 3-4 BLE spectrum captured using nRF connection with Advertisement channels.... 20
Figure 3-5 Block diagram of the sensor ................................................................................ 21
Figure 3-6 Pin assignment ..................................................................................................... 21
Figure 3-7 nRF BLE controller architecture diagram for RTOS-free environment .............. 22
Figure 3-8 nRF BLE Controller architecture diagram for RTOS ......................................... 23
Figure 3-9 nRF51 Dongle content......................................................................................... 24
Figure 3-10 nRF Dongle top and bottom .............................................................................. 24
Figure 3-11 nRF51 Dongle block diagram ........................................................................... 24
Figure 3-12 The interface of the microcontroller .................................................................. 25
Figure 3-13 LED configuration of the dongle ....................................................................... 25
xiv
Figure 3-14 Fuel level sensor working principle .................................................................. 29
Figure 3-15 The fuel level sensor ON/OFF mode ................................................................ 29
Figure 3-16 Fuel level sensor on protoype ............................................................................ 30
Figure 3-17 Circuit diagram of the fuel level sensor ............................................................ 30
Figure 3-18 Fuel level sensor section A-A ........................................................................... 31
Figure 3-19 Fuel level sensor ................................................................................................ 32
Figure 3-20 Installation protoype of the fuel level sensor into the fuel tank ........................ 32
Figure 4-1 Product map ......................................................................................................... 33
Figure 4-2 Development Kit -top .......................................................................................... 34
Figure 4-3 Development kit - bottom.................................................................................... 34
Figure 4-4 Connections ......................................................................................................... 35
Figure 4-5 Flow diagram of the project ................................................................................ 35
Figure 4-6 Fuel tank of a commercial truck .......................................................................... 36
Figure 4-7 Fuel Level Height – R trends for three different hole diameter .......................... 40
Figure 4-8 Histogram for D=3 mm ....................................................................................... 40
Figure 4-9 Histogram for D=5 mm ....................................................................................... 41
Figure 4-10 Histogram for D=10 mm ................................................................................... 41
Figure 4-11 Normal Q-Q plot for 3 mm hole diameter ......................................................... 43
Figure 4-12 Normal Q-Q plot for 5 mm hole diameter ......................................................... 43
Figure 4-13 Normal Q-Q plot for 10 mm hole diameter ....................................................... 44

xv
LIST OF TABLES
Table 2-1 The main differences between Bluetooth Classic and BLE .................................... 8
Table 4-1 Discharge volume of the fuel level according to the hole diameters .................... 39
Table 4-2 Test of Normality .................................................................................................. 42
Table 4-3 Descriptive statistics ............................................................................................. 45
Table 4-4 Test of Homogeneity of Variances ....................................................................... 46
Table 4-5 ANOVA ................................................................................................................ 46
xvi
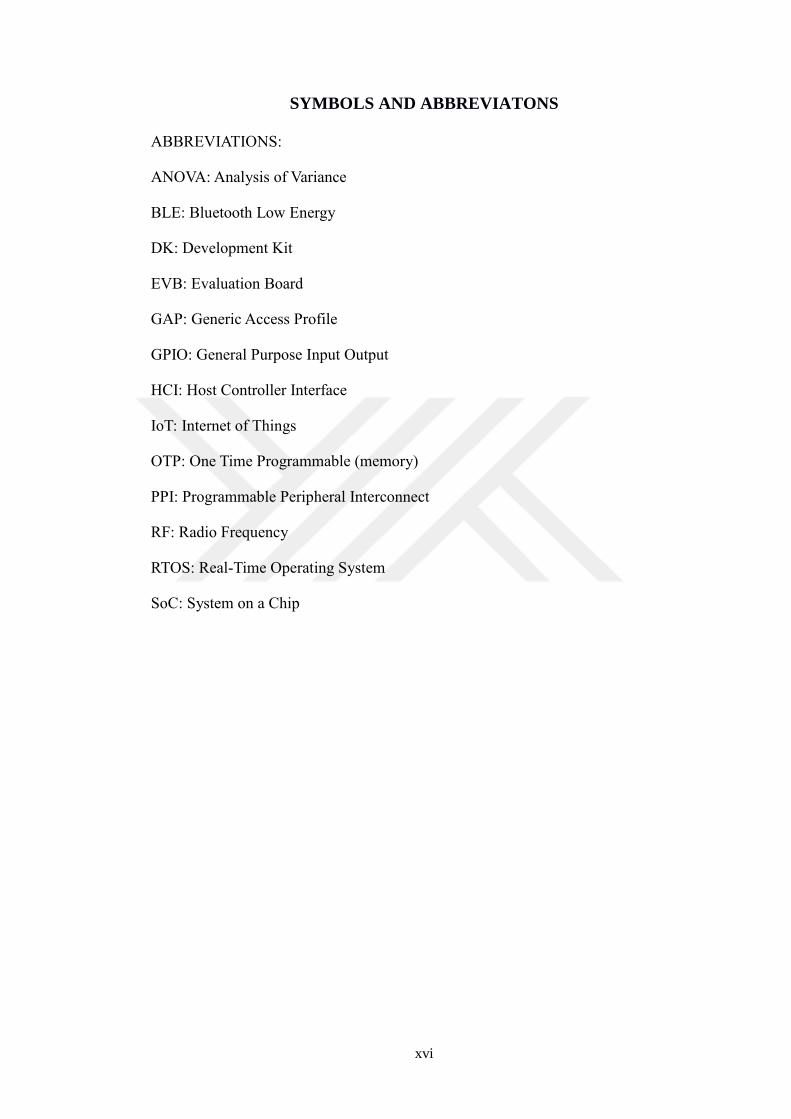
SYMBOLS AND ABBREVIATONS
ABBREVIATIONS:
ANOVA: Analysis of Variance
BLE: Bluetooth Low Energy
DK: Development Kit
EVB: Evaluation Board
GAP: Generic Access Profile
GPIO: General Purpose Input Output
HCI: Host Controller Interface
IoT: Internet of Things
OTP: One Time Programmable (memory)
PPI: Programmable Peripheral Interconnect
RF: Radio Frequency
RTOS: Real-Time Operating System
SoC: System on a Chip
1
CHAPTER 1
INTRODUCTION
Nowadays, in-vehicle electronics technology is becoming essential with respect to
customer needs. According to claim report results of one of the reputable automotive
manufacturers indicates that the crucial expectation of some market prospects and
customers is to have safety electronic systems and following up the status of the fuel
level of the vehicle remotely. Due to this reason consumer electronics and internet of
things (IoT) technologies are depending on the assessment of needs. In order to follow
up the status of the car remotely, Bluetooth Low Energy technology (BLE) and fuel
level sensors are widely used in vehicle electronics. Bluetooth Low Energy is one of
the latest developed technologies feeding consumer electronics. The benefits to design
and implement Bluetooth Low Energy technology on low-cost applications are able to
execute and communicate in mobile environments.
1.1 Research Problem Statement
Fuel costs constitute the biggest expense item of the transportation sector. At this point,
automotive companies want to offer innovative and technological solutions to prevent
fuel discharges as a result of fuel abuse and unauthorized discharge from the tank. Fuel
theft is an event that concern to the police and rural communities. Fuel can be stolen
from trucks and their storage tanks by drilling a hole under the fuel tank with using of
siphoning equipment or by cutting off fuel lines (Warwickshire Police, n.d). The
demand of the companies that have faced with this situation according to the
customer’s feedbacks has increased the studies done in this field and has enabled to
shape the test scenario of this project. According to the rise of diesel fuel prices, it has
been observed that fuel theft has increased especially in big vehicles such as trucks.
Especially, it is happening when the vehicle is in the parking position (Senthil, 2017).
As of 2008, there are 9.653.546 motor vehicles in Turkey. 2.808.789 of them are heavy
vehicles such as vans, buses, and trucks. It can be said that a truck fuel tank capacity
is 500-700 liters and that fuel theft prevention systems are necessary for such type of
2
vehicles. On the other hand, the use of the measurement of the fuel on the fuel tank
simultaneously is a subject that has been extensively researched. The new type of
processors are the main elements of such systems. In addition, fuel level measurement
methods are used in vehicle tracking systems. In some of the studies, nonlinear filters
or wave transformations analyze data from sensors. On the other hand, using many
sensors increases the cost and makes the system very complicated (Köse, et al., 2009).
To overcome the theft problem, researches focus on the combination of the fuel
monitoring system and mobile communication technology which send reports
automatically via SMS to the owner of the vehicle (Senthil, 2017).
It is already stated that the current work aims to process data locally, transmitting via
Bluetooth Low Energy and reporting the output data.
This thesis combines the advantages of the lowest power, and lowest system cost
Bluetooth low energy System-on-Chip with an integrated flash.
The purpose of this thesis is to develop an embedded system, which is communicating
with each other using Bluetooth Low Energy the remote control, which get executed
instantly.
The core concept of the Internet of Things is to enable things to be connected anytime,
anyplace, with anything and anyone ideally using any path/ network and any service.
Goundar et al. (2014) presented a design solution to monitor the fuel level by using a
pressure sensor. An automatic measurement controlling fuel tank fuel level was
designed with BMP085 pressure sensor. The regression analysis was performed to
calculate the volume according to the pressure sensor readings (Goundar et al., 2014).
Lin et al. (2015) examined the potential of BLE technology for vehicular applications.
Intra-vehicular wireless sensor applications in the automotive industry lead to the
removal of the additional wiring system. For this reason, this new technology has great
potential and accompanies many benefits to car manufacturers. An experimental
platform was realized based on BLE technology to implement a passive keyless entry
system. Due to the experiments, the cost of the existing system was decreased during
the system was worked properly and the car was unlocked every time (Ling et al.,
2015).
Winkel (2016) investigated the performance of BLE in the in-vehicle environment.
The parameters were selected as the message error rate, packet error rate and latency
3
of BLE wireless links. The static and dynamic test parameters were described then the
experiments were realized with two different vehicles (Opel Corsa and Honda Accord)
on the same parking area. The experiments were conducted different days and it was
rainy during the experiments. However, the influence of rain was neglected. It can be
said that the BLE link delivery system worked correctly and performed with
remarkable success (Winkel, 2016).
1.2 The objective of the Thesis
Based on this problem statement, this thesis consists of five main chapters and subtitles.
Chapter 2 is providing the necessary background information to understand Vehicle
Electronics and Networks, Bluetooth technology, GPRS and acceleration sensors.
Chapter 3 defines the background of the system. Stakeholder engagement and
elicitation of the business needs are listed for the build, design and test purposes. Both
functional and non-functional requirements are prioritized and committed by the
automotive manufacturer. The methodology of the thesis is also described in this
chapter. In-vehicle communication and smart sensor application technical background
are mentioned respectively. It is focusing on introducing the DA14585 low-power
Bluetooth low energy (4.0) and NRF acceleration sensor. The aim was to implement
Bluetooth 5.0 with another sensor. However, due to the lack of unsuccessful
connections and inefficiency, the thesis is redesigned with respect to Bluetooth 4.0.
Statistical analysis is described in Chapter 4. The results/outputs of the system
implementation are evaluated the statistically experimental design.
Chapter 5 is the final chapter defines conclusion and recommendation to move forward
to improve IoT usage in automotive electronics regarding customer needs and claims.
4
2 CHAPTER 2
BACKGROUND – LITERATURE REVIEW
2.1 Vehicle Electronics and Networks
Nowadays, new features are continuously integrating into vehicles electronics in the
automobile industry (Alam, 2018). Electronic devices used in vehicles are increasing
day by day. This augmentation in vehicles brings the need to communicate with the
central computer of the vehicle. This technology can be divided into two groups as
wired and wireless. The challenges of wired in-vehicle networks have led to alternative
research areas. In order to reduce these difficulties, a solution method is used in which
some part of the wired parts is removed and replaced by wireless connection. Some
parts of the wiring loom can be replaced by Bluetooth, BLE or ultra-wideband link.
Thus, the use of wireless technology provides some advantages such as reduced wiring
loom installation time, reduced vehicle weight, improved fuel economy, and reduced
material costs. However, new challenges are encountered, such as inherent
unreliability, lack of security, and threats to the confidentiality of wireless connections.
The remote keyless entry system or the wireless tire pressure management systems are
examples of existing commercially wireless applications for vehicles. Generally, these
applications need to use proprietary protocols (Winkel, 2016).
2.2 Bluetooth
This section describes the concepts and fundamentals of Bluetooth and Bluetooth Low
Energy (BLE). Bluetooth is a short-range Radio Frequency (RF) wireless
communication technology which provides low cost and low power consumption
(Elhesseawy and Riad, 2018). Ericsson developed Bluetooth technology in 1994 as a
wireless alternative to the RS-232 data cables for close distances and nowadays it has
a wide range of applications today. Bluetooth devices have two different forms: Basic
Rate (BR) and Low Energy (LE). Both systems have main features such as device
recognition and connection generation. The BR systems also include Enhanced Data
5
Rate (EDR) as an option (Bal, 2015). The BR/EDR systems are classified as classic
Bluetooth, and the low energy system is known as BLE, which will be explained in
the following section. Any device that used Bluetooth technology can operate not only
BR or LE technology but also can operate both systems at the same time. The BR and
BLE have similar bit rate and can support a higher bit rate of 1 Mbps, and the EDR
supports a maximum bit rate of 2 or 3 Mbps (Elhesseawy and Riad, 2018). In order to
use both system features, the communication can only be realized in the same form of
the device which recognizes each other (Bal, 2015). The Bluetooth devices operate in
the Industrial, Scientific and Medical (ISM) band at 2.4 GHz which can be used
unlicensed.
The Bluetooth profile is necessary for communication between different Bluetooth
devices. The Bluetooth profile identifies the characteristics of the core specifications
and depends on the application area. For example, the profile must include
standardization to control TV, Hi-Fi or other types of Bluetooth equipment to realize
an audio remote control. The main factor to perform a successful operation is to
support the same protocol (Elhesseawy and Riad, 2018).
2.3 Bluetooth Low Energy (BLE)
Bluetooth Low Energy (BLE) has become a dominant technology to connect the
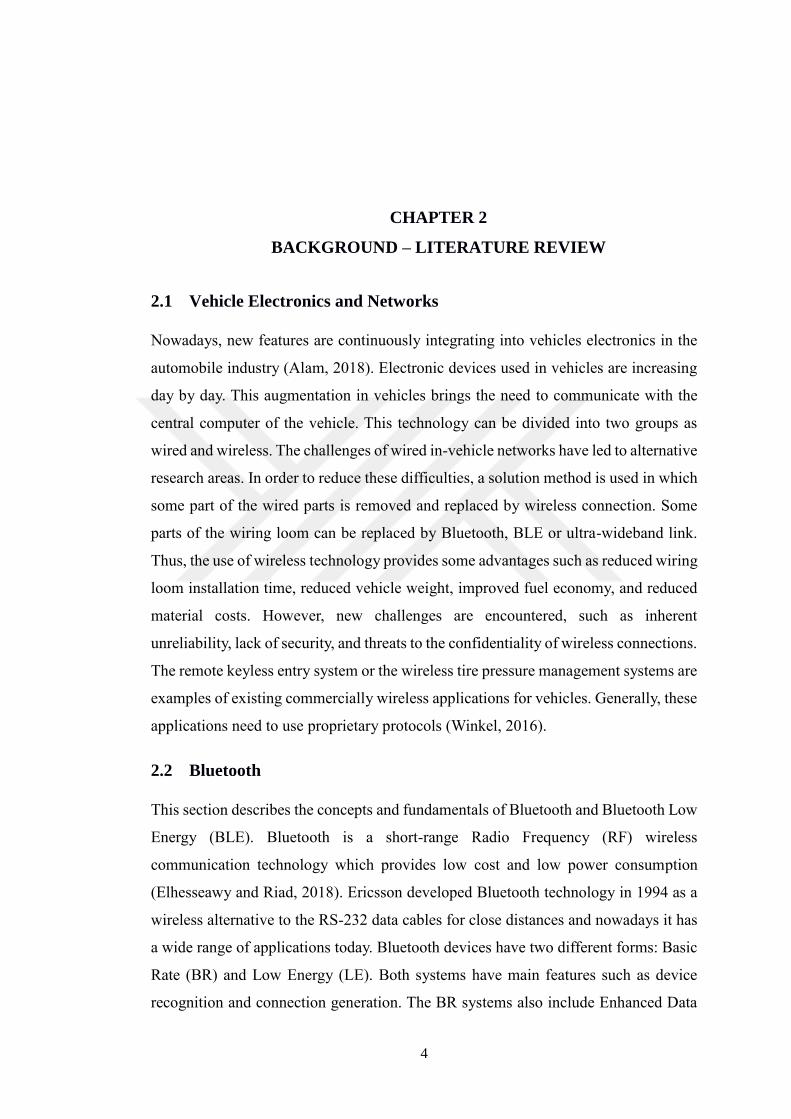
Internet of Things (IoT). It is also known as Bluetooth Smart has become essential in
many devices and has a wide usage area which can be seen in Error! Reference
source not found.. It can be operated in medical devices, smart homes, cell phones,
speakers, printers, keyboards, automobiles, etc. This technology provides remote
monitor and control (Lonzetta et al., 2018). It is a short-range wireless standard to
reduce power consumption through faster connections by transferring data with lower
latency (Digi-Key Electronics, 2016). It provides sensor data over a long period of
time by using a small device. The superiority comes from very low power consumption,
fast connection times and reliable data transfer (Ohlson, 2013).
Bluetooth Classic has a short-range communication with the high audio stream. It has
no regard for power consumption (Embedded Centric, 2019a).
6
Figure 2-1 Bluetooth Classic and Smart usage areas Source: (Digi-Key Electronics, 2016)
The devices can be support Classic or BLE or both of them. In Error! Reference
source not found., there is a type called Bluetooth Smart Ready, which includes both
hardware of Classic and BLE. The application areas can be listed as smartphones,
laptops (Embedded Centric, 2019a). The first BLE version 4.0 was introduced in 2010.
The superiorities over the classical Bluetooth technology and the aim were “to design
a radio standard with the lowest possible power consumption, specifically optimized
for low cost, low bandwidth, low power, and low complexity”. BLE has grown rapidly
by showing great improvement contrary to the other wireless standards (Hearndon,
2016). It has a much shorter transmission start, 3ms, than the classic Bluetooth, which
has 100ms (Bjarnason, 2016). BLE and Bluetooth Classic are not compatible with each
other according to diversity in hardware, architecture, specifications or applications
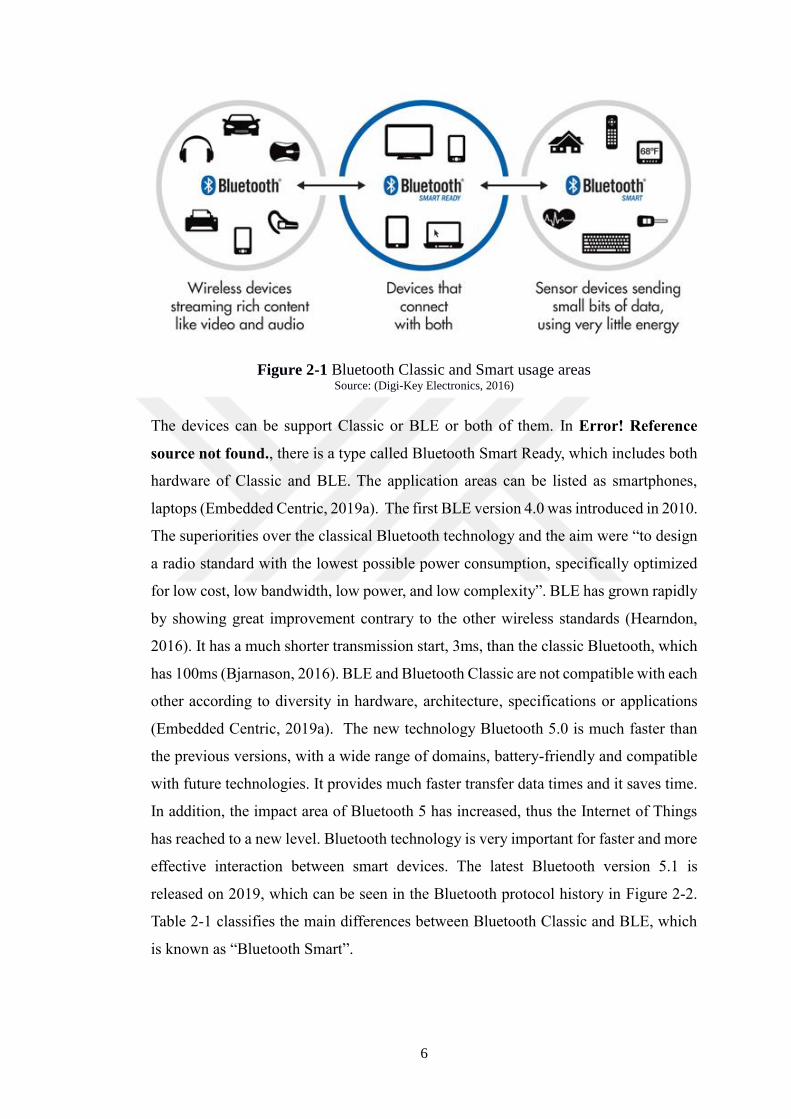
(Embedded Centric, 2019a). The new technology Bluetooth 5.0 is much faster than
the previous versions, with a wide range of domains, battery-friendly and compatible
with future technologies. It provides much faster transfer data times and it saves time.
In addition, the impact area of Bluetooth 5 has increased, thus the Internet of Things
has reached to a new level. Bluetooth technology is very important for faster and more
effective interaction between smart devices. The latest Bluetooth version 5.1 is
released on 2019, which can be seen in the Bluetooth protocol history in Figure 2-2.
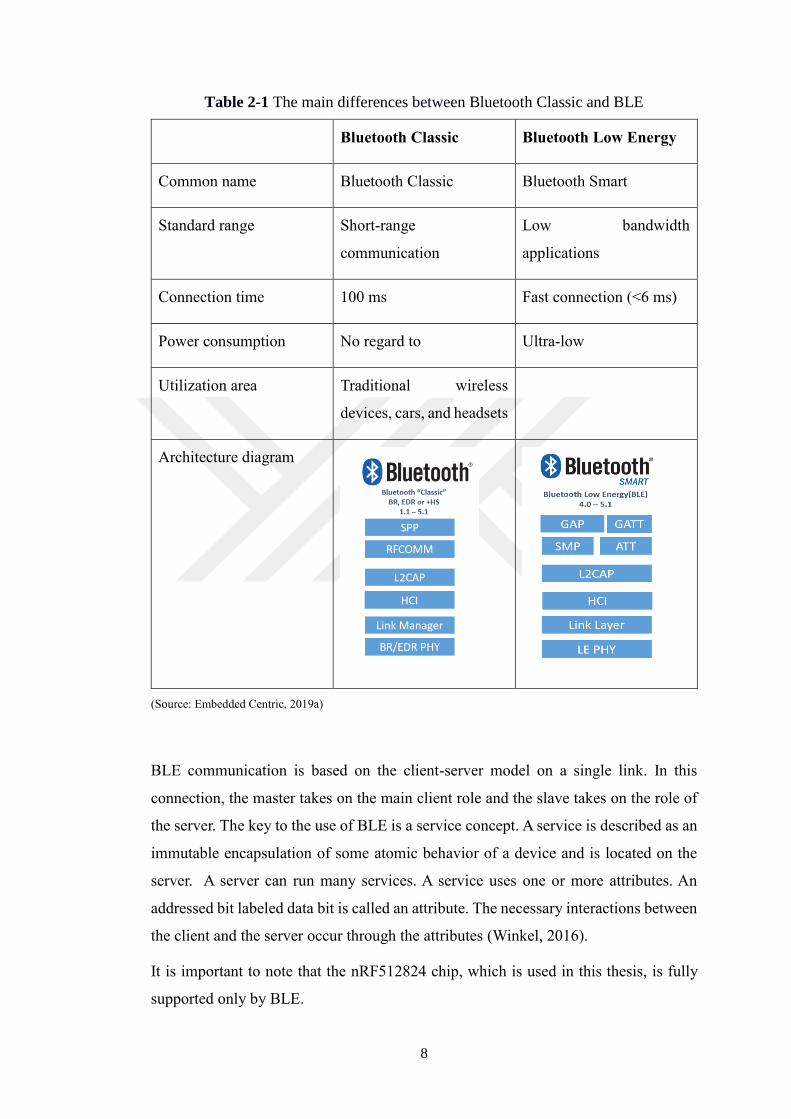
Table 2-1 classifies the main differences between Bluetooth Classic and BLE, which
is known as “Bluetooth Smart”.
7
Figure 2-2 The evaluation of Bluetooth
(Source: (Embedded Centric, 2019a).)
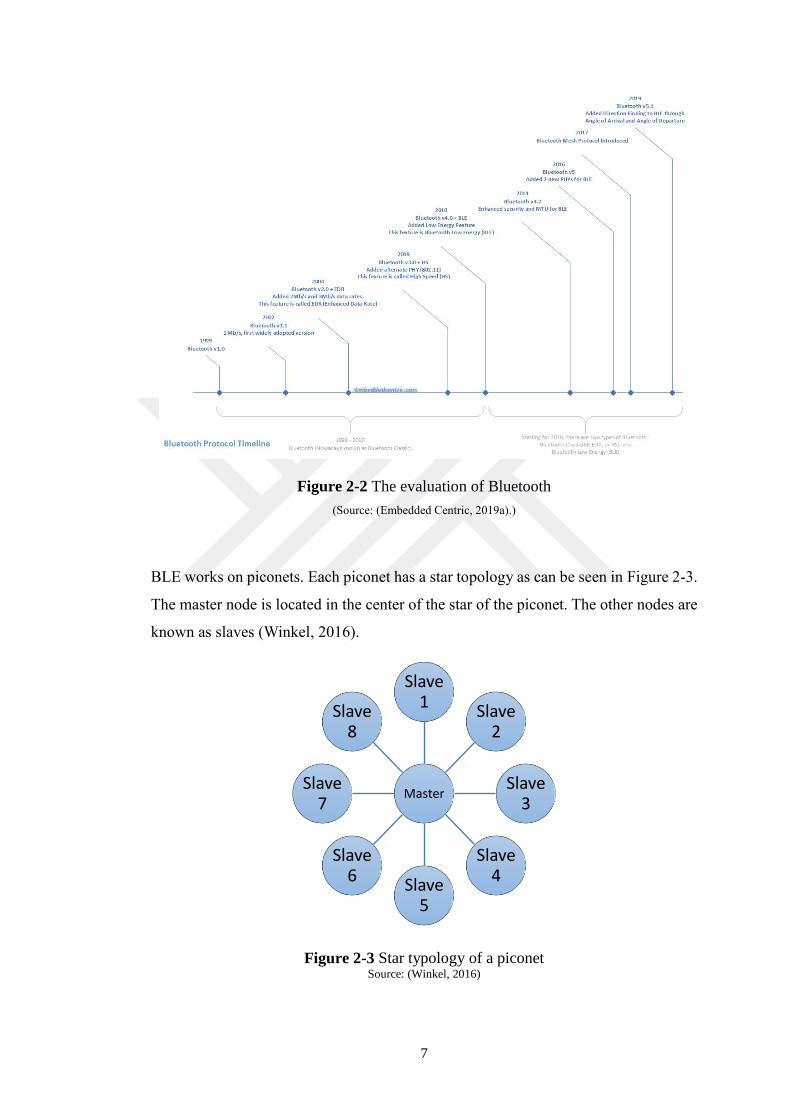
BLE works on piconets. Each piconet has a star topology as can be seen in Figure 2-3.
The master node is located in the center of the star of the piconet. The other nodes are
known as slaves (Winkel, 2016).
Figure 2-3 Star typology of a piconet Source: (Winkel, 2016)
Master
Slave 1
Slave 2
Slave 3
Slave 4
Slave 5
Slave 6
Slave 7
Slave 8
8
Table 2-1 The main differences between Bluetooth Classic and BLE
Bluetooth Classic Bluetooth Low Energy
Common name Bluetooth Classic Bluetooth Smart
Standard range Short-range
communication
Low bandwidth
applications
Connection time 100 ms Fast connection (<6 ms)
Power consumption No regard to Ultra-low
Utilization area Traditional wireless
devices, cars, and headsets
Architecture diagram
(Source: Embedded Centric, 2019a)
BLE communication is based on the client-server model on a single link. In this
connection, the master takes on the main client role and the slave takes on the role of
the server. The key to the use of BLE is a service concept. A service is described as an
immutable encapsulation of some atomic behavior of a device and is located on the
server. A server can run many services. A service uses one or more attributes. An
addressed bit labeled data bit is called an attribute. The necessary interactions between
the client and the server occur through the attributes (Winkel, 2016).
It is important to note that the nRF512824 chip, which is used in this thesis, is fully
supported only by BLE.
9
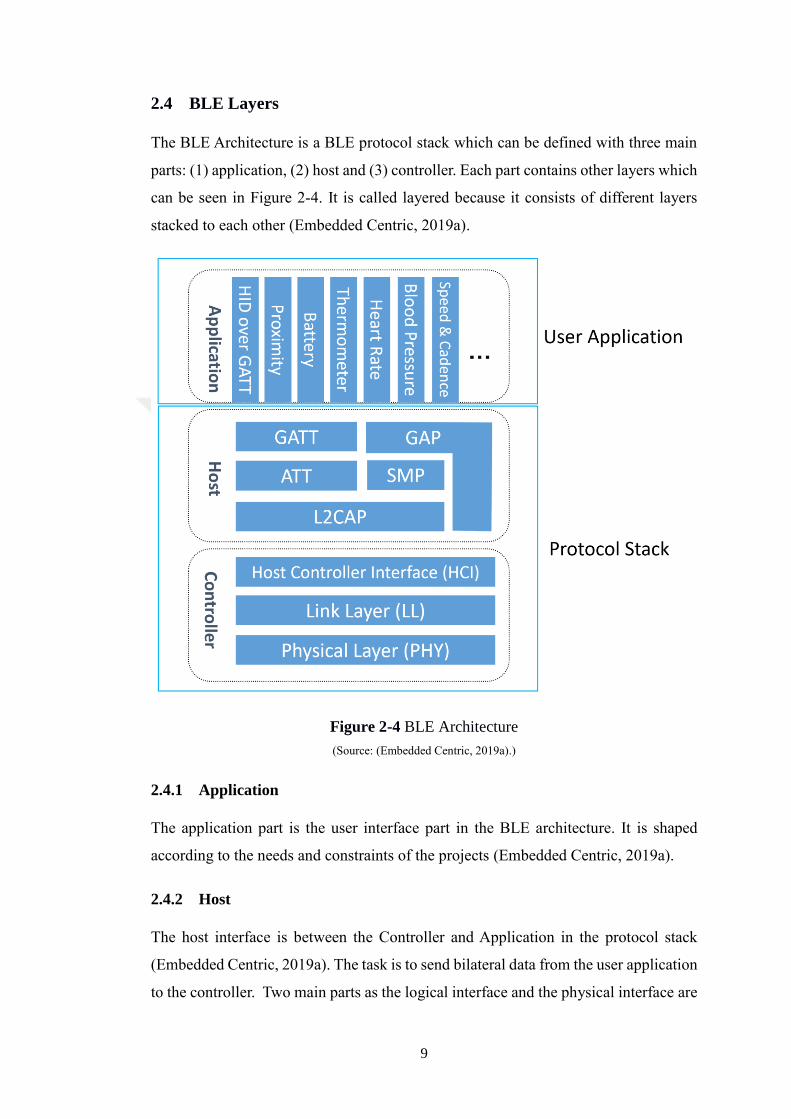
2.4 BLE Layers
The BLE Architecture is a BLE protocol stack which can be defined with three main
parts: (1) application, (2) host and (3) controller. Each part contains other layers which
can be seen in Figure 2-4. It is called layered because it consists of different layers
stacked to each other (Embedded Centric, 2019a).
Figure 2-4 BLE Architecture
(Source: (Embedded Centric, 2019a).)
2.4.1 Application
The application part is the user interface part in the BLE architecture. It is shaped
according to the needs and constraints of the projects (Embedded Centric, 2019a).
2.4.2 Host
The host interface is between the Controller and Application in the protocol stack
(Embedded Centric, 2019a). The task is to send bilateral data from the user application
to the controller. Two main parts as the logical interface and the physical interface are
10
the part of the host. Logical interface part includes Application-programming interface
on the controller. The physical interface includes Universal Serial Bus, Secure Digital
Input-output etc. A tablet, PC or any device that has an operating system can be the
host (Kuchimanchi, 2015).
The host involves Generic Access Profile (GAP), Generic Attribute Profile (GATT),
Logical Link Control and Adaptation Protocol (L2CAP), Attribute Protocol (ATT) and
Security Manager Protocol (SMP). GAP layer performs the base functions between all
Bluetooth devices. It works as a transceiver or operates as a transmitter so the role of
the broadcaster comes from this property. It transmits advertising data at periodic
intervals. This device is also a good observer, which periodically scans the channels to
find out any data from any broadcaster. Moreover, if any connection is active, the
device works like a central to manage all necessary settings to realize the data
exchange. GATT profile is used to investigate how to obtain data from different
profiles to exchange between the BLE devices (Elhesseawy and Riad, 2018). L2CAP
defines as a bidirectional data channel and has two tasks as L2CAP channels and
L2CAP signaling commands. ATT protocol supports information about the device. The
rules to access data in any device are indicated by this protocol. It defines the attribute
that expresses a value. SMP is used to pair and to provide the trust with any device
(Kuchimanchi, 2015).
2.4.3 Controller
The controller is the bottom layer of the architecture. It includes the radio. A controller
embodies a physical layer (PHY), link layer (LL) and host controller interface (HCI).
The receiving and transmitting bits of information is provided by the physical layer,
which is situated at the bottom by using 2.4 GHz radio. BLE coding system is the
Gaussian frequency-shift keying (GFSK) which is provided by zeroes and ones, which
are coded onto the radio by slightly shifting the frequency up and down. It provides to
spread out the energy over a wider range of frequencies if a dramatic frequency shift
occurs. The bits are approved in the link layer as a packet of data and it is checked to
send them to the protocols. This layer has advertising, scanning, creation and
maintenance properties of the connection (Kuchimanchi, 2015).
The RF modulation and demodulation is supported by the PHY. The analog and digital
circuitry communication of PHY provides a translation of the digital data over the air.
11
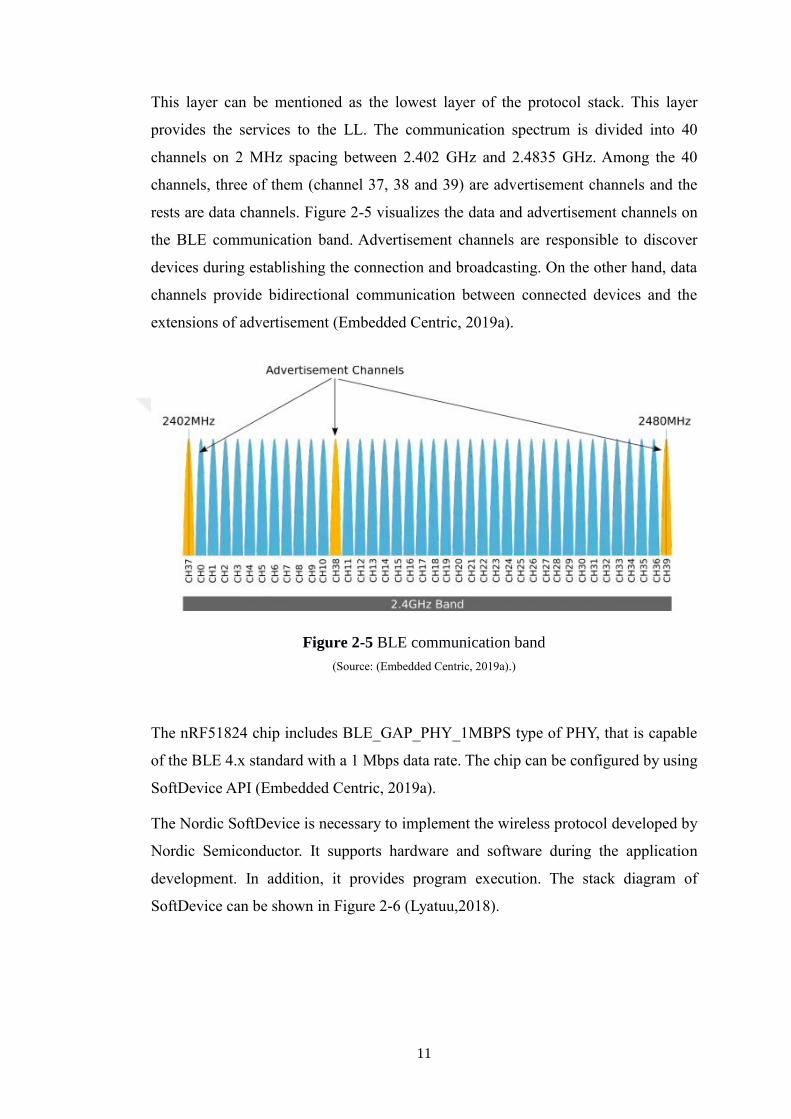
This layer can be mentioned as the lowest layer of the protocol stack. This layer
provides the services to the LL. The communication spectrum is divided into 40
channels on 2 MHz spacing between 2.402 GHz and 2.4835 GHz. Among the 40
channels, three of them (channel 37, 38 and 39) are advertisement channels and the
rests are data channels. Figure 2-5 visualizes the data and advertisement channels on
the BLE communication band. Advertisement channels are responsible to discover
devices during establishing the connection and broadcasting. On the other hand, data
channels provide bidirectional communication between connected devices and the
extensions of advertisement (Embedded Centric, 2019a).
Figure 2-5 BLE communication band
(Source: (Embedded Centric, 2019a).)
The nRF51824 chip includes BLE_GAP_PHY_1MBPS type of PHY, that is capable
of the BLE 4.x standard with a 1 Mbps data rate. The chip can be configured by using
SoftDevice API (Embedded Centric, 2019a).
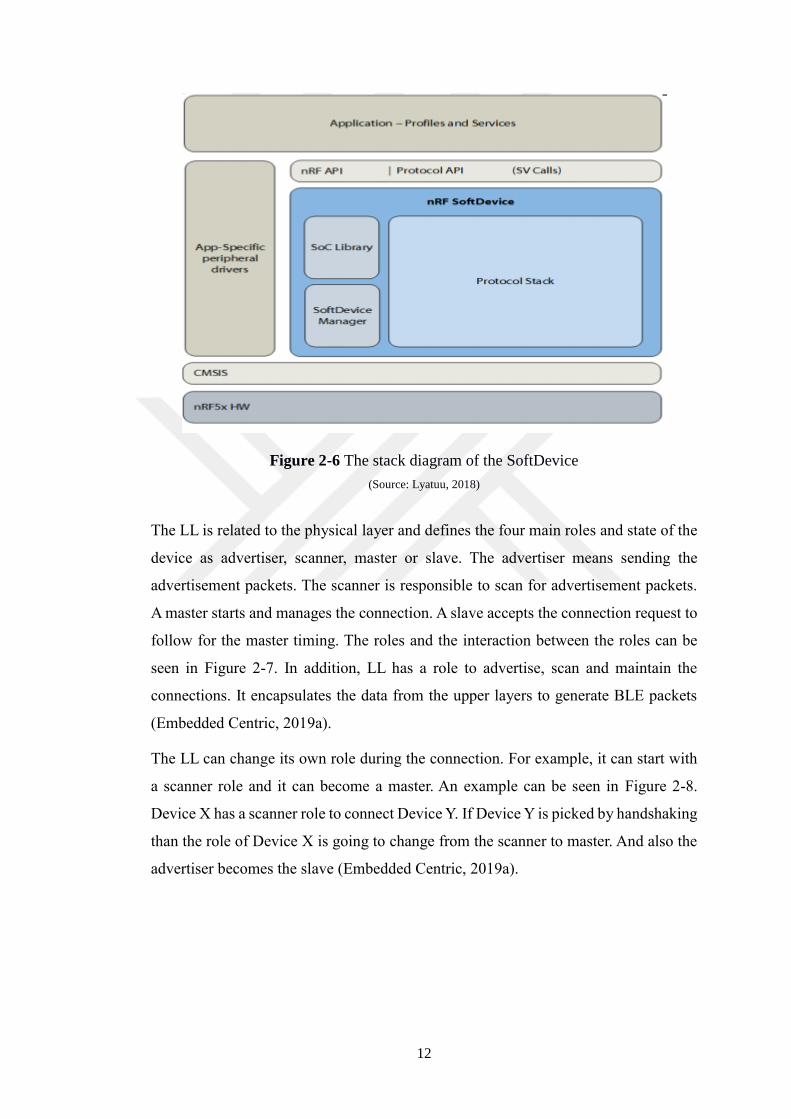
The Nordic SoftDevice is necessary to implement the wireless protocol developed by
Nordic Semiconductor. It supports hardware and software during the application
development. In addition, it provides program execution. The stack diagram of
SoftDevice can be shown in Figure 2-6 (Lyatuu,2018).
12
Figure 2-6 The stack diagram of the SoftDevice
(Source: Lyatuu, 2018)
The LL is related to the physical layer and defines the four main roles and state of the
device as advertiser, scanner, master or slave. The advertiser means sending the
advertisement packets. The scanner is responsible to scan for advertisement packets.
A master starts and manages the connection. A slave accepts the connection request to
follow for the master timing. The roles and the interaction between the roles can be
seen in Figure 2-7. In addition, LL has a role to advertise, scan and maintain the
connections. It encapsulates the data from the upper layers to generate BLE packets
(Embedded Centric, 2019a).
The LL can change its own role during the connection. For example, it can start with
a scanner role and it can become a master. An example can be seen in Figure 2-8.
Device X has a scanner role to connect Device Y. If Device Y is picked by handshaking
than the role of Device X is going to change from the scanner to master. And also the
advertiser becomes the slave (Embedded Centric, 2019a).
13
Figure 2-7 BLE link layers of the roles
(Source: Lyatuu,2018.)
Figure 2-8 Link-layer change example of a BLE connection
(Source: (Embedded Centric, 2019a).)
14
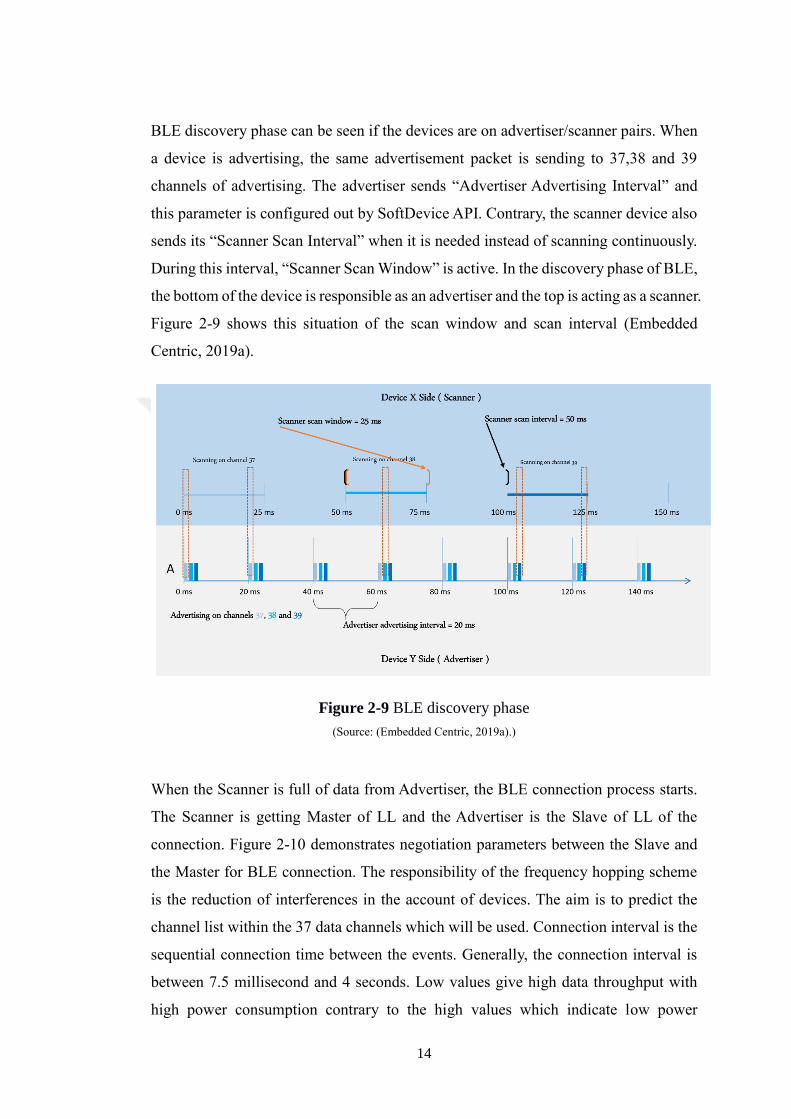
BLE discovery phase can be seen if the devices are on advertiser/scanner pairs. When
a device is advertising, the same advertisement packet is sending to 37,38 and 39
channels of advertising. The advertiser sends “Advertiser Advertising Interval” and
this parameter is configured out by SoftDevice API. Contrary, the scanner device also
sends its “Scanner Scan Interval” when it is needed instead of scanning continuously.
During this interval, “Scanner Scan Window” is active. In the discovery phase of BLE,
the bottom of the device is responsible as an advertiser and the top is acting as a scanner.
Figure 2-9 shows this situation of the scan window and scan interval (Embedded
Centric, 2019a).
Figure 2-9 BLE discovery phase
(Source: (Embedded Centric, 2019a).)
When the Scanner is full of data from Advertiser, the BLE connection process starts.
The Scanner is getting Master of LL and the Advertiser is the Slave of LL of the
connection. Figure 2-10 demonstrates negotiation parameters between the Slave and
the Master for BLE connection. The responsibility of the frequency hopping scheme
is the reduction of interferences in the account of devices. The aim is to predict the
channel list within the 37 data channels which will be used. Connection interval is the
sequential connection time between the events. Generally, the connection interval is
between 7.5 millisecond and 4 seconds. Low values give high data throughput with
high power consumption contrary to the high values which indicate low power
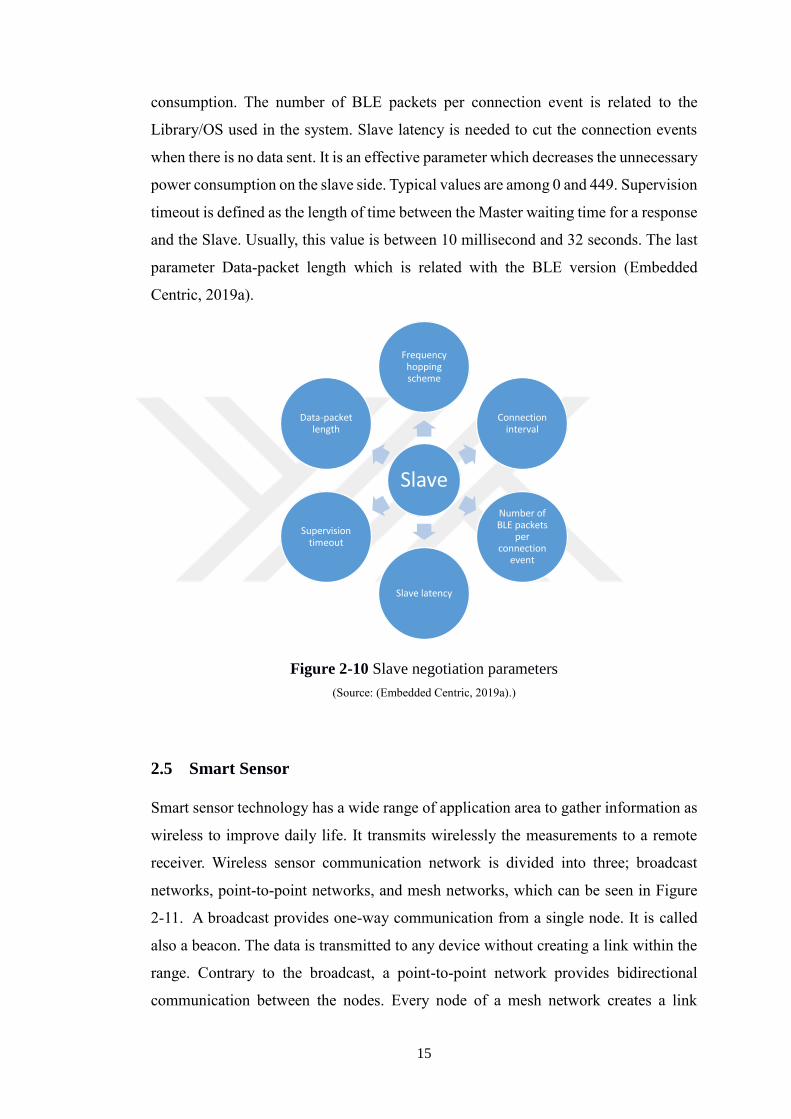
15
consumption. The number of BLE packets per connection event is related to the
Library/OS used in the system. Slave latency is needed to cut the connection events
when there is no data sent. It is an effective parameter which decreases the unnecessary
power consumption on the slave side. Typical values are among 0 and 449. Supervision
timeout is defined as the length of time between the Master waiting time for a response
and the Slave. Usually, this value is between 10 millisecond and 32 seconds. The last
parameter Data-packet length which is related with the BLE version (Embedded
Centric, 2019a).
Figure 2-10 Slave negotiation parameters
(Source: (Embedded Centric, 2019a).)
2.5 Smart Sensor
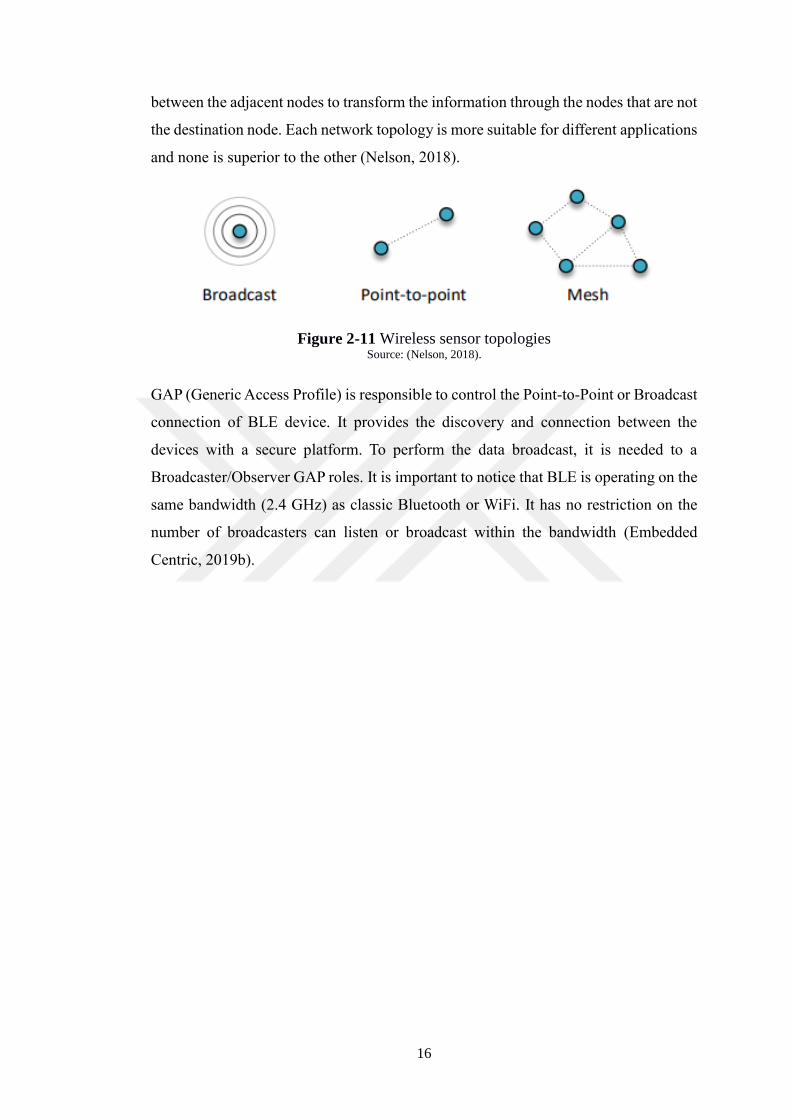
Smart sensor technology has a wide range of application area to gather information as
wireless to improve daily life. It transmits wirelessly the measurements to a remote
receiver. Wireless sensor communication network is divided into three; broadcast
networks, point-to-point networks, and mesh networks, which can be seen in Figure
2-11. A broadcast provides one-way communication from a single node. It is called
also a beacon. The data is transmitted to any device without creating a link within the
range. Contrary to the broadcast, a point-to-point network provides bidirectional
communication between the nodes. Every node of a mesh network creates a link
Slave
Frequency hopping scheme
Connection interval
Number of BLE packets
per connection
event
Slave latency
Supervision timeout
Data-packet length
16
between the adjacent nodes to transform the information through the nodes that are not
the destination node. Each network topology is more suitable for different applications
and none is superior to the other (Nelson, 2018).
Figure 2-11 Wireless sensor topologies Source: (Nelson, 2018).
GAP (Generic Access Profile) is responsible to control the Point-to-Point or Broadcast
connection of BLE device. It provides the discovery and connection between the
devices with a secure platform. To perform the data broadcast, it is needed to a
Broadcaster/Observer GAP roles. It is important to notice that BLE is operating on the
same bandwidth (2.4 GHz) as classic Bluetooth or WiFi. It has no restriction on the
number of broadcasters can listen or broadcast within the bandwidth (Embedded
Centric, 2019b).
17
3 CHAPTER 3
MATERIAL AND METHODS
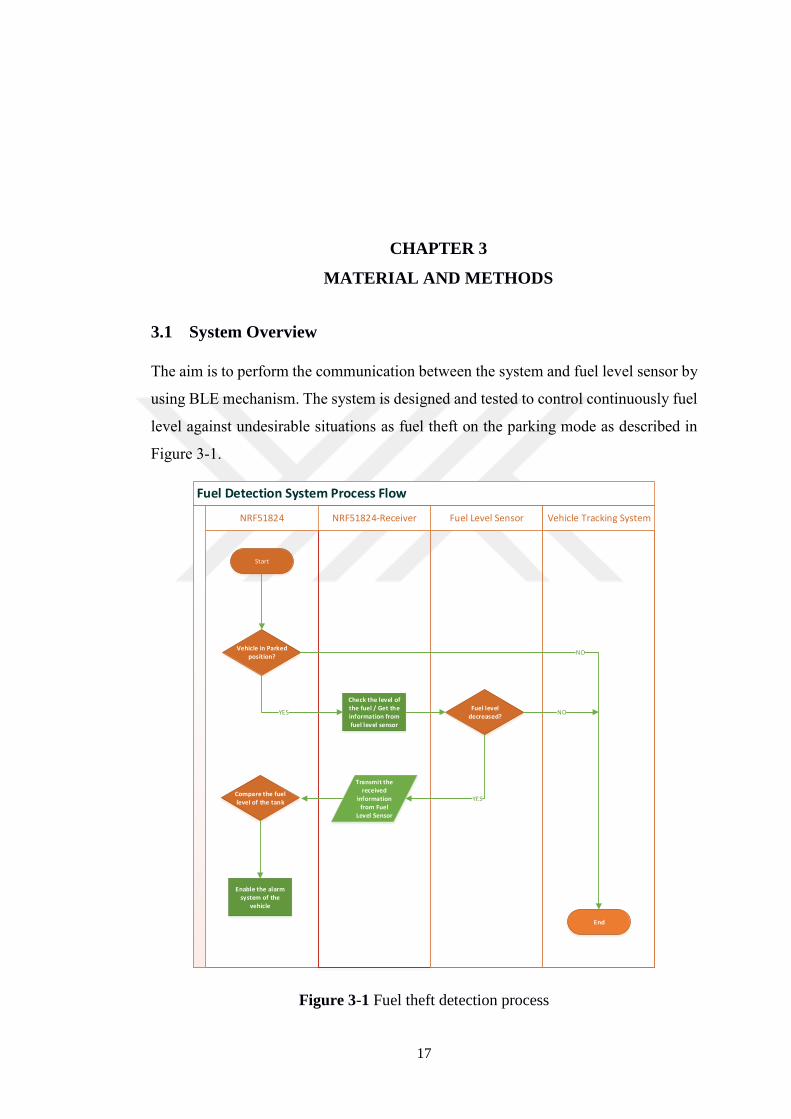
3.1 System Overview
The aim is to perform the communication between the system and fuel level sensor by
using BLE mechanism. The system is designed and tested to control continuously fuel
level against undesirable situations as fuel theft on the parking mode as described in
Figure 3-1.
Figure 3-1 Fuel theft detection process
Fuel Detection System Process Flow
NRF51824 NRF51824-Receiver Fuel Level Sensor Vehicle Tracking System
Start
End
Vehicle in Parked position?
Check the level of the fuel / Get the information from fuel level sensor
YESFuel level
decreased?
YES
Transmit the received
information from Fuel
Level Sensor
Enable the alarm system of the
vehicle
Compare the fuel level of the tank
NO
NO
18
Three main tasks are satisfied before the evaluation of performance and reliability by
statistical analysis. The first task is the installation of the board based on the user's
manual. This project is a prototype of the real system and the real system will have
many other types of equipment. The application is sufficient to carry out the research.
Secondly, the programming of the sensor nodes to gather the information is established.
It contains continuously measurement of fuel level information. The aim is to clarify
how many times does it take to trigger the alarm system before the discharge of the
fuel tank.
3.2 Devices and Programs
Remotely fuel level monitoring is a challenge to prevent undesired fuel tank cap
openings. For this reason, a monitoring system realized to gather automatically the
necessary data from the fuel tank. The system is proposed with an evaluation board
and a fuel level sensor. In this part of the thesis, the characteristics of the devices used
during the design are discussed.
3.2.1 NRF51824 – Nordic Semiconductor
3.2.1.1 nRF51824 Architecture
nRF51824 based on Nordic semiconductor is used for the application of remote control
mechanism. It has a 2.4 GHz operating band with Bluetooth Smart v4.2 wireless
protocol (Keeping, 2016). Typically, it is suitable for the automotive industry for BLE
connection. It has 2.4 GHz ultra-lower power with a system on a chip (SoC). It gives
solutions with AEC Q100 Grade 2 qualification (Nordic Semiconductor, 2017). AEC
Q100 called, as “Stress Test Qualification for Integrated Circuits” is an automotive
industry qualification. It provides an insight to qualify the electronics of the
automotive (Felding, 2017). The standard has five grades numbered from 0 to 4
according to the testing temperature. The temperature range of Grade 2 varies from -
40 to 105 °C for aluminum electrolytic capacitors (Lawrie, 2015). Gazell protocol is
supported by 2.4 GHz radio. It includes a Programmable Peripheral Interconnect (PPI)
system with an analog or digital peripheral without any CPU intervention. The
connection of interferences digitally between master/slave and UART performs with
flexible GPIOs (Nordic Semiconductor, 2017).
19
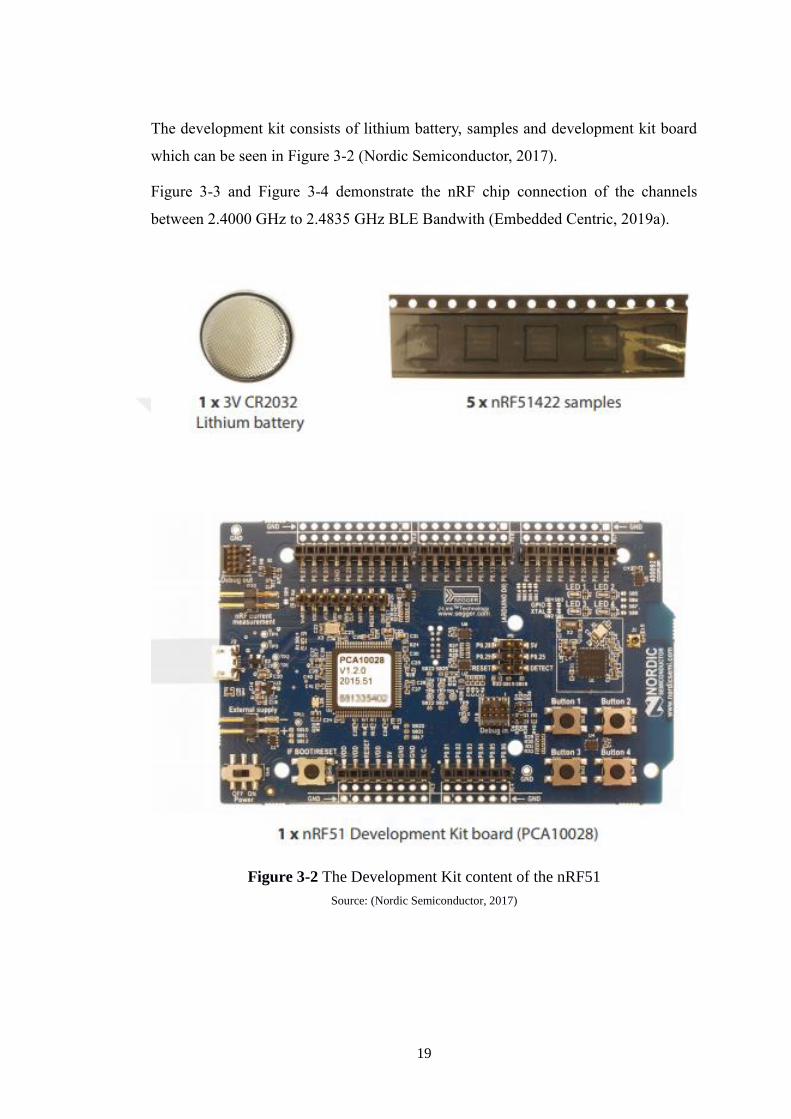
The development kit consists of lithium battery, samples and development kit board
which can be seen in Figure 3-2 (Nordic Semiconductor, 2017).
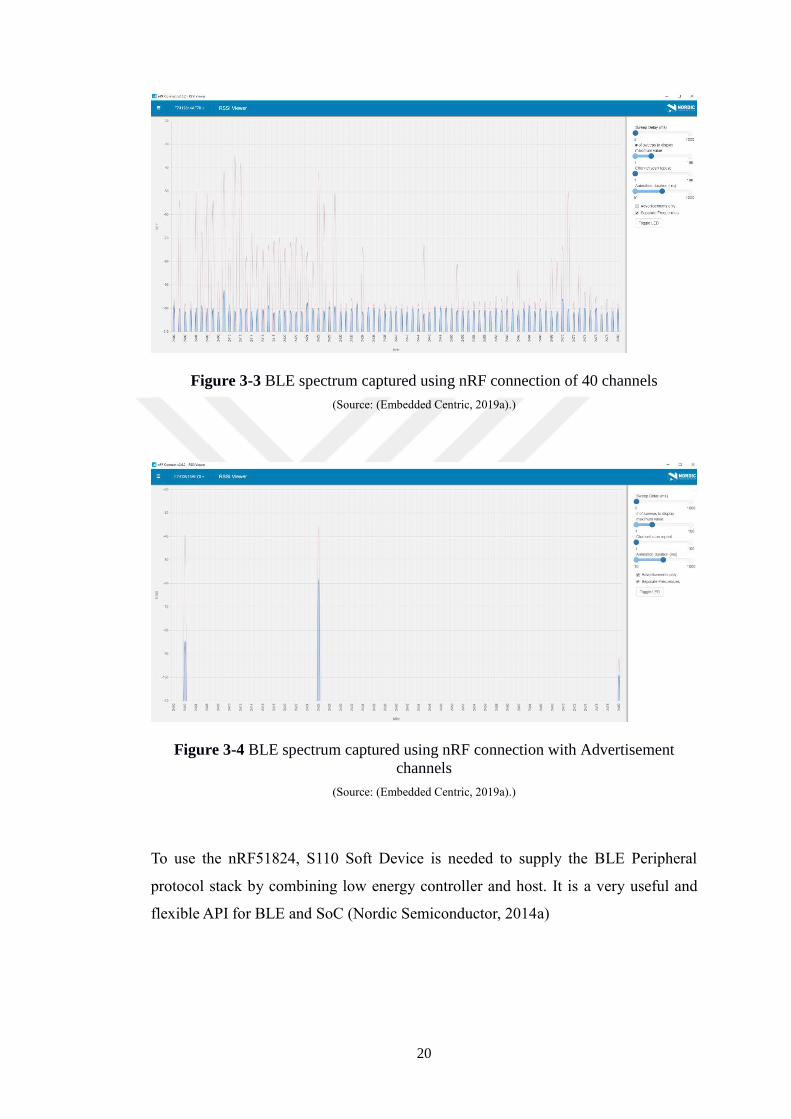
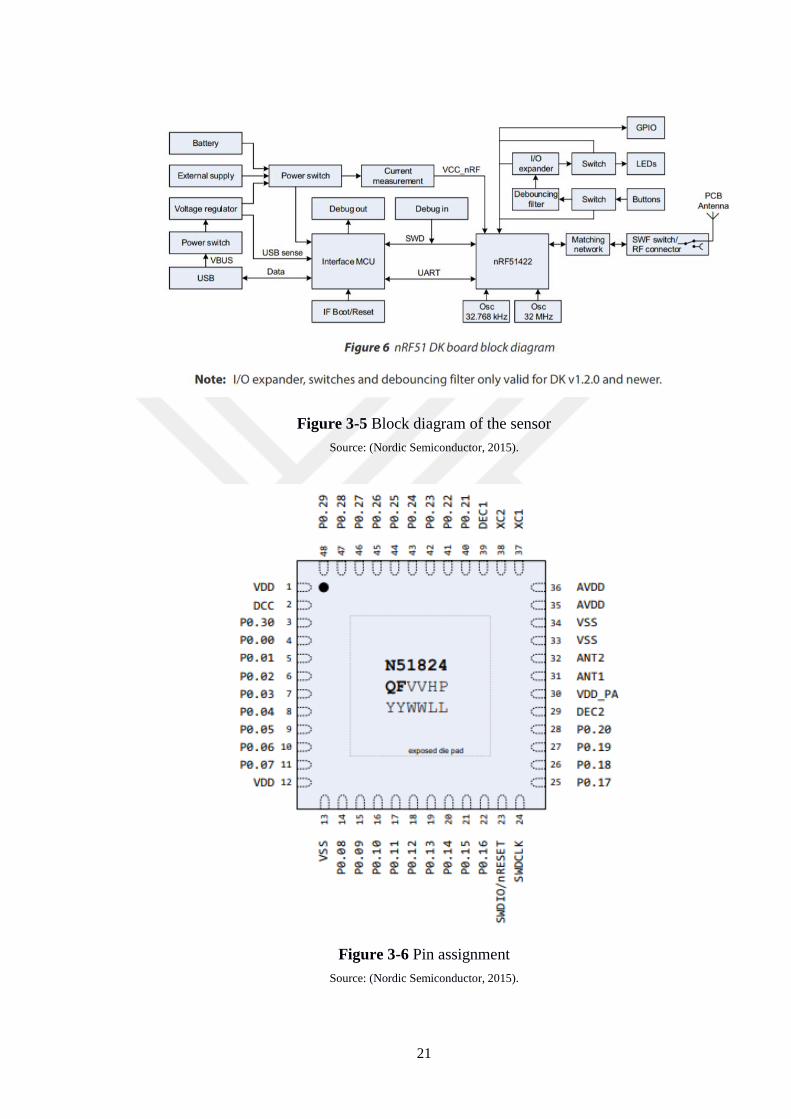
Figure 3-3 and Figure 3-4 demonstrate the nRF chip connection of the channels
between 2.4000 GHz to 2.4835 GHz BLE Bandwith (Embedded Centric, 2019a).
Figure 3-2 The Development Kit content of the nRF51
Source: (Nordic Semiconductor, 2017)
20
Figure 3-3 BLE spectrum captured using nRF connection of 40 channels
(Source: (Embedded Centric, 2019a).)
Figure 3-4 BLE spectrum captured using nRF connection with Advertisement
channels
(Source: (Embedded Centric, 2019a).)
To use the nRF51824, S110 Soft Device is needed to supply the BLE Peripheral
protocol stack by combining low energy controller and host. It is a very useful and
flexible API for BLE and SoC (Nordic Semiconductor, 2014a)
21
Figure 3-5 Block diagram of the sensor
Source: (Nordic Semiconductor, 2015).
Figure 3-6 Pin assignment
Source: (Nordic Semiconductor, 2015).
22
3.2.1.2 nRF BLE Controller
The nRF BLE Controller is generated from the Nordic Semiconductor to provide
library for nRF52 Series which supports Bluetooth 5. The main responsibility is to
provide a BLE HCI interface. In addition, it implements a multiprotocol through APIs
to access the flash memory by radioactivity. Figure 3-7 demonstrates the nRF BLE
Controller library integration in a real-time operating system (RTOS)-free
environment. On the other hand, Figure 3-8 shows the nRF BLE Controller library
integration with RTOS. While the BLE Controller Library protocol remains the same,
a BLE adoption layer is inserted between the BLE host and BLE Controller library
with the integration of RTOS (Nordic Semiconductor, 2018c).
Figure 3-7 nRF BLE controller architecture diagram for RTOS-free environment
Source: (Nordic Semiconductor, 2018c)

23
Figure 3-8 nRF BLE Controller architecture diagram for RTOS
Source: (Nordic Semiconductor, 2018c)
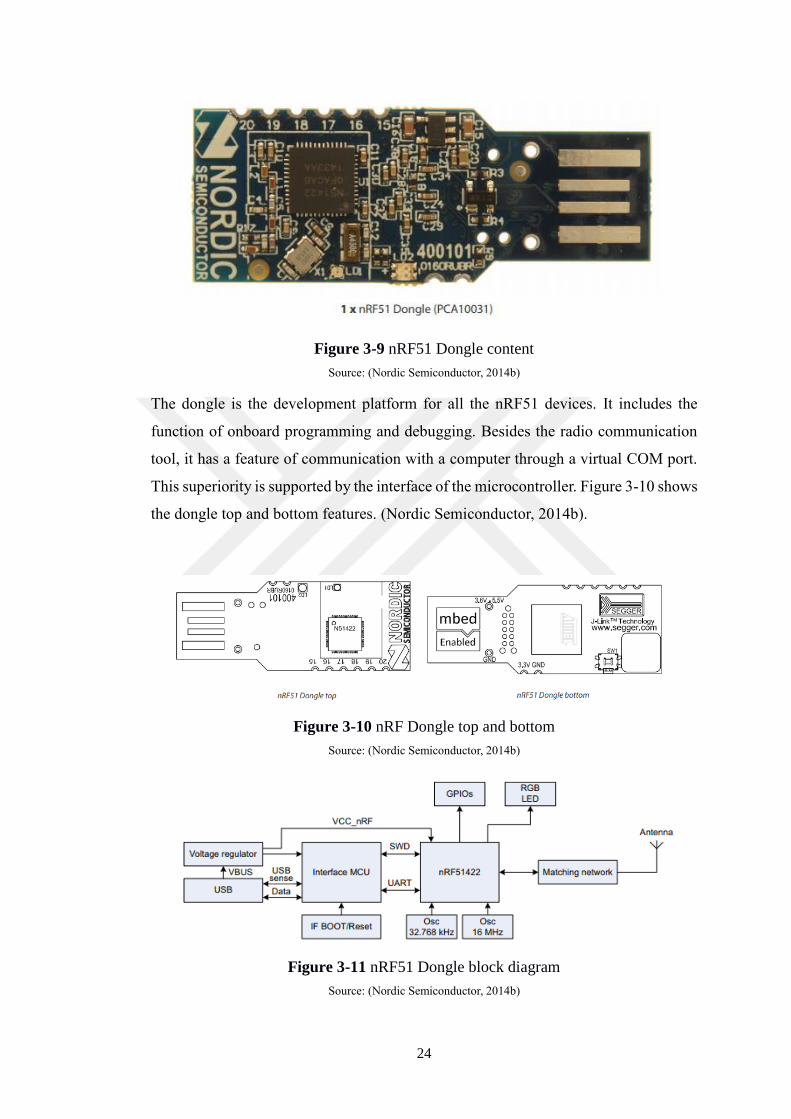
3.2.2 nRF51 Dongle
The nRF51 Dongle is with the chip to secure the illegal utilization. Figure 3-9 and
Figure 3-10 indicate the Dongle content of the nRF51. At first, the dongle must be
connected with the computer. If it has power, the status light will be lightening. The
nRF51 Dongle block diagram is in Figure 3-11 (Nordic Semiconductor, 2014b).
24
Figure 3-9 nRF51 Dongle content
Source: (Nordic Semiconductor, 2014b)
The dongle is the development platform for all the nRF51 devices. It includes the
function of onboard programming and debugging. Besides the radio communication
tool, it has a feature of communication with a computer through a virtual COM port.
This superiority is supported by the interface of the microcontroller. Figure 3-10 shows
the dongle top and bottom features. (Nordic Semiconductor, 2014b).
Figure 3-10 nRF Dongle top and bottom
Source: (Nordic Semiconductor, 2014b)
Figure 3-11 nRF51 Dongle block diagram
Source: (Nordic Semiconductor, 2014b)
25
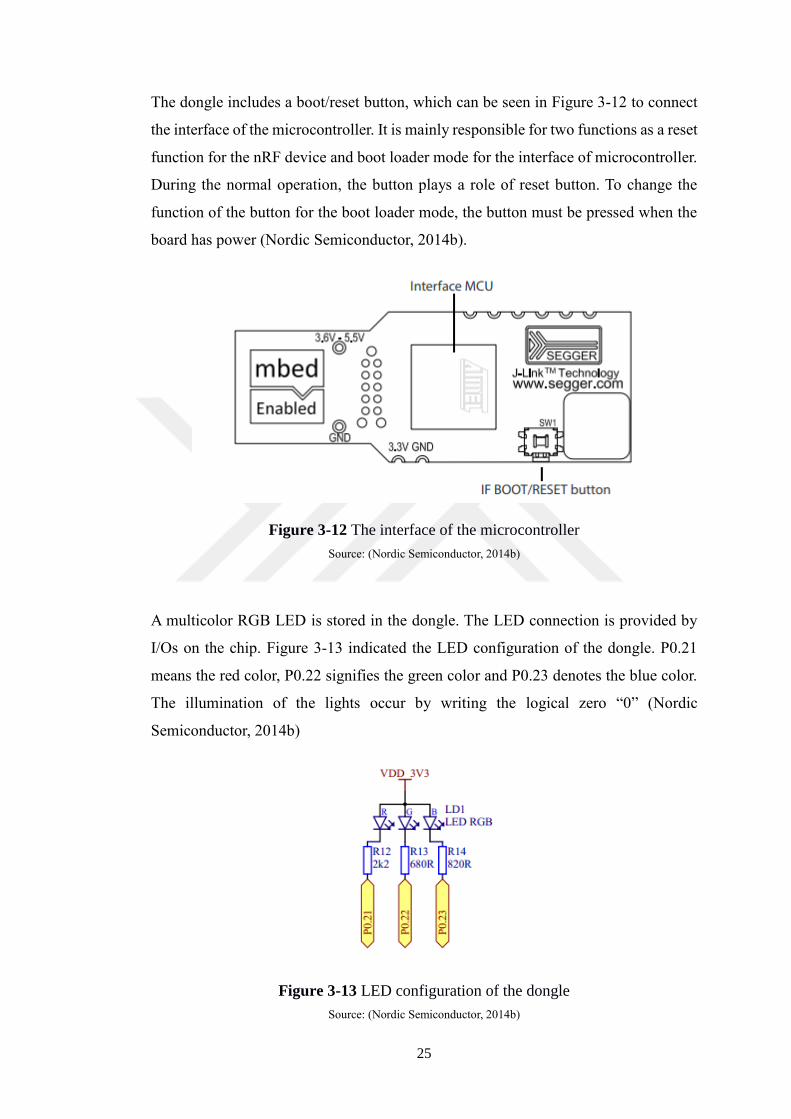
The dongle includes a boot/reset button, which can be seen in Figure 3-12 to connect
the interface of the microcontroller. It is mainly responsible for two functions as a reset
function for the nRF device and boot loader mode for the interface of microcontroller.
During the normal operation, the button plays a role of reset button. To change the
function of the button for the boot loader mode, the button must be pressed when the
board has power (Nordic Semiconductor, 2014b).
Figure 3-12 The interface of the microcontroller
Source: (Nordic Semiconductor, 2014b)
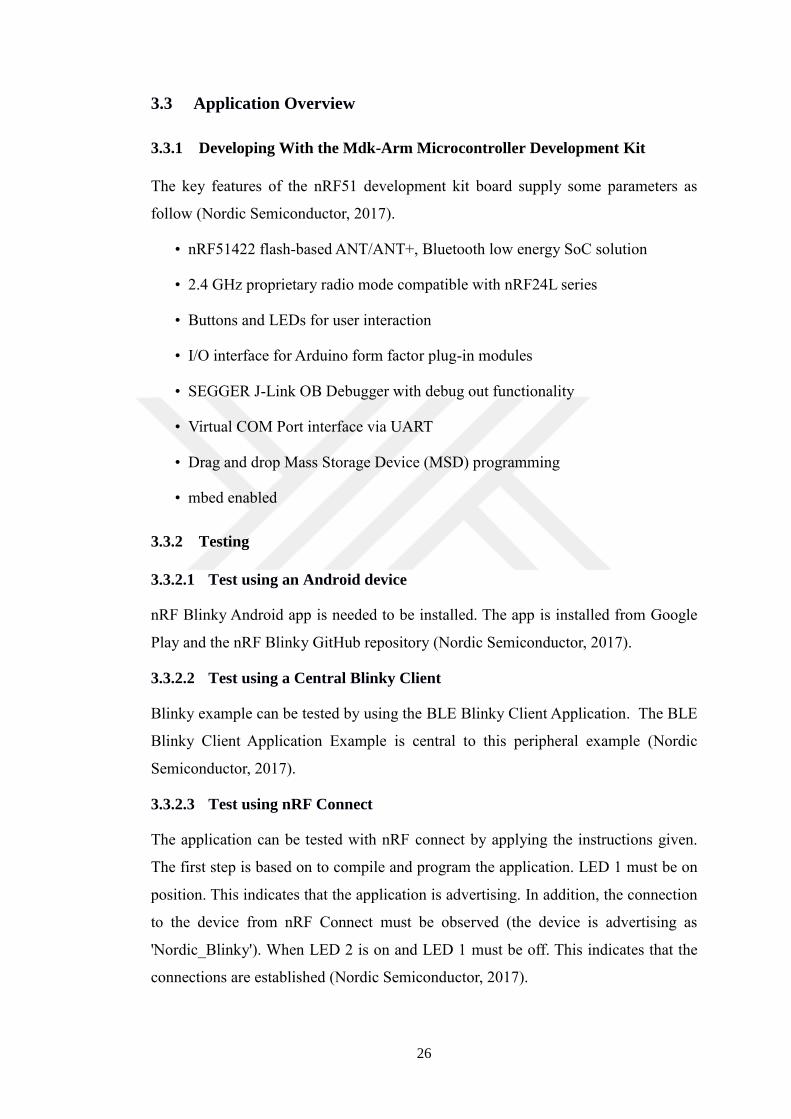
A multicolor RGB LED is stored in the dongle. The LED connection is provided by
I/Os on the chip. Figure 3-13 indicated the LED configuration of the dongle. P0.21
means the red color, P0.22 signifies the green color and P0.23 denotes the blue color.
The illumination of the lights occur by writing the logical zero “0” (Nordic
Semiconductor, 2014b)
Figure 3-13 LED configuration of the dongle
Source: (Nordic Semiconductor, 2014b)
26
3.3 Application Overview
3.3.1 Developing With the Mdk-Arm Microcontroller Development Kit
The key features of the nRF51 development kit board supply some parameters as
follow (Nordic Semiconductor, 2017).
• nRF51422 flash-based ANT/ANT+, Bluetooth low energy SoC solution
• 2.4 GHz proprietary radio mode compatible with nRF24L series
• Buttons and LEDs for user interaction
• I/O interface for Arduino form factor plug-in modules
• SEGGER J-Link OB Debugger with debug out functionality
• Virtual COM Port interface via UART
• Drag and drop Mass Storage Device (MSD) programming
• mbed enabled
3.3.2 Testing
3.3.2.1 Test using an Android device
nRF Blinky Android app is needed to be installed. The app is installed from Google
Play and the nRF Blinky GitHub repository (Nordic Semiconductor, 2017).
3.3.2.2 Test using a Central Blinky Client
Blinky example can be tested by using the BLE Blinky Client Application. The BLE
Blinky Client Application Example is central to this peripheral example (Nordic
Semiconductor, 2017).
3.3.2.3 Test using nRF Connect
The application can be tested with nRF connect by applying the instructions given.
The first step is based on to compile and program the application. LED 1 must be on
position. This indicates that the application is advertising. In addition, the connection
to the device from nRF Connect must be observed (the device is advertising as
'Nordic_Blinky'). When LED 2 is on and LED 1 must be off. This indicates that the
connections are established (Nordic Semiconductor, 2017).
27
3.3.2.4 Blinky
To make the Blinky example, at first it is needed to install the SoftDevice program. It
uses the LED Button Server to receive the button modes from nRF development board
(Nordic Semiconductor, 2018a).
The Central and Client roles are assigned to GAP and GATT roles, respectively.
“Nordic Blinky” is searched by the Blinky Client to make the connection. The
responsibility of the Blinky Client is to configure the button characteristics to provide
bilateral notifications. The Button notification has a meaning to trigger the LED1 of
the Blinky Client board to reflect the status of the button press. If Button 1 is pressing,
it is sending the values to the LED characteristics (0x1525). The aim is to stimulate
LED1 on the Blinky Server board to reflect the status of the button (Nordic
Semiconductor, 2018b).
If Button 1 is connected, it assigns the ON/OFF status into the LED characteristics of
the server. For LED assignments, LED 1 indicates the ON status when the scanning
process is in progress. LED 2 refers to the ON status when it has a connection and OFF
status when it is scanning. In addition, LED 3 demonstrates the ON/OFF notifications
from the server if it is connected (Nordic Semiconductor, 2018b).
The UART setup settings include a 115.200 of baud rate with 8 data bits and 1 stop bit
without parity. After the implementation of the necessary conditions, the test is
implemented by using two development board as Client board and Server board. Client
board contains the BLE Blinky Client application while Server board includes the BLE
Blinky application. To initialize the performance, LED 1 on the Client board must be
on status ON. It means that the application implements the scanning process for a
Blinky Server. After this situation, the two boards must be connected to each other. In
this step, instead of LED 1, LED 2 will be on ON mode. LED 3 on the Server board
will be ON status if it is pressed to the Button 1 on the Client board. Concurrently, by
pressing the Button 1 on the Server board, the LED 3 on the Client board will be ON
mode during the press. The disconnection of the system can be observed by pressing
the Reset Button on the Client board (Nordic Semiconductor, 2018b).
28
3.4 Fuel Level Sensor
Fuel level sensor is designed for precise measurement in the fuel tank of any type of
vehicle in the automotive industry. This sensor can be used as a subsystem of the fuel
monitoring system or to prevent diesel fuel losses instead of the existing fuel meter
(Apl,2019).
Fuel level sensors provide accurate and reliable data about fuel level in the automotive
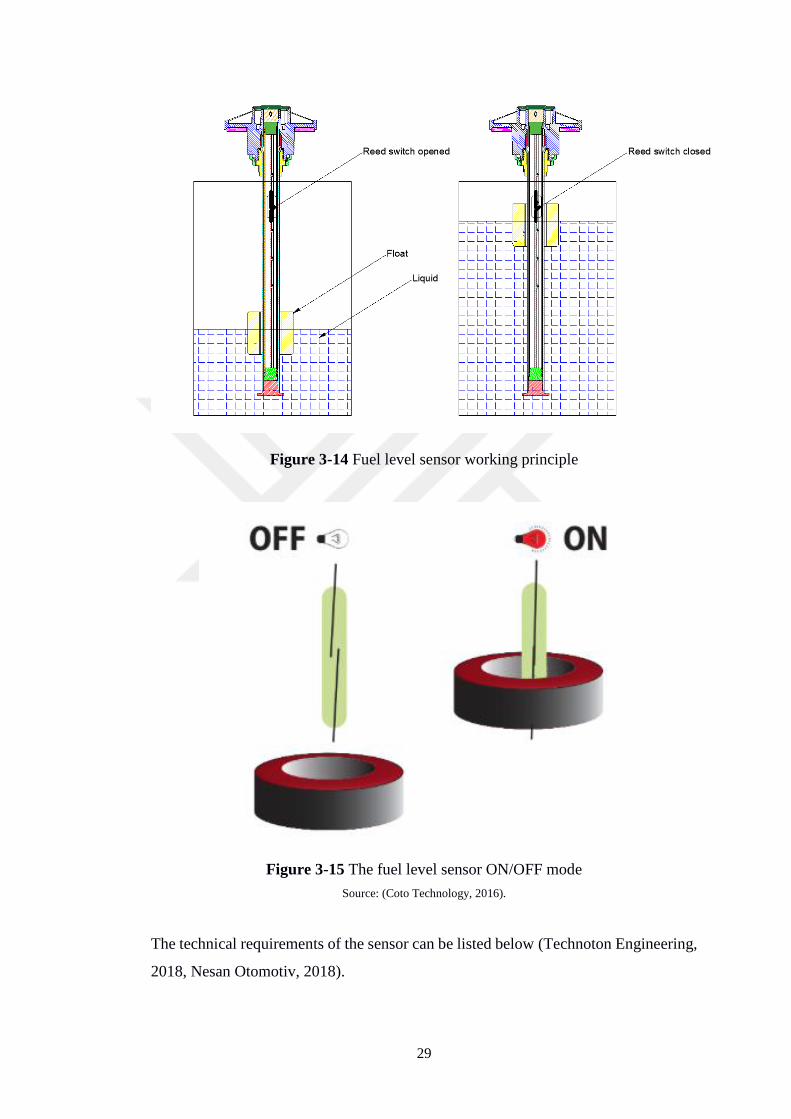
industry. The fuel level sensor working principle is manufactured based on magnetic
field effect. A magnetic magnet is installed to the sensor. The magnet rotary movement
is proportional to the float movement (Wekhande and Farakate, 2019). The magnet is
mounted on the magnetic float which involves a magnetic reed switch. Usually, the
reed switch appends and seals to plastic or non-magnetic metal tube. It includes a ring
magnet which is mounted on a float to provide up and down movement based on the
liquid level which can be seen in Figure 3-14. The liquid is completely isolated from
the electrical system and circuit, thus a healthy and long-lasting level measurement
system is established. The magnetic field is formed on the tube where the float ball
moves together upward or downward with the liquid. Reed switch placed inside the
pipe during the manufacturing process is affected by the magnetic field and change to
the electrical value. The obtained electrical value change in accordance with the needs
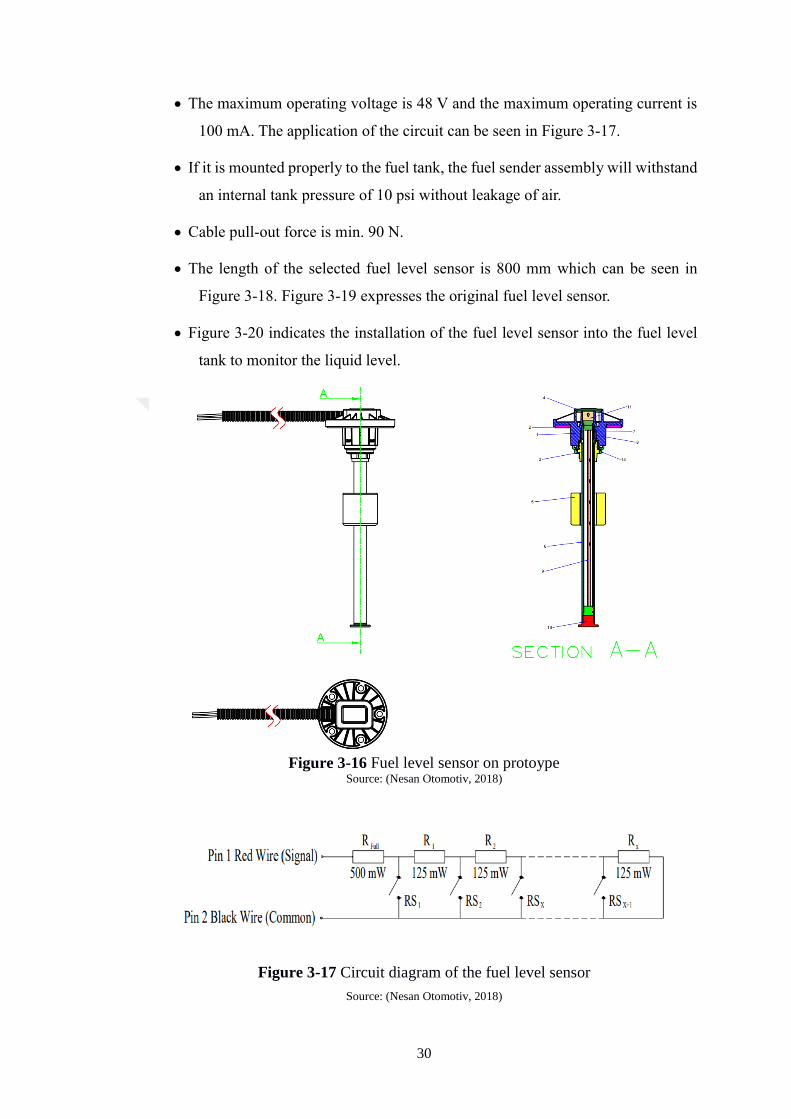
and system of the user. Figure 3-15 demonstrates the reed switch open and closed
position depending on the liquid level. If the fuel level is low, then the reed switch
open. In contrast, if the fuel level is high, the reed switch will close. The aim to use a
ring magnet depends on the magnet sweeping event by the reed switch (Coto
Technology, 2016).
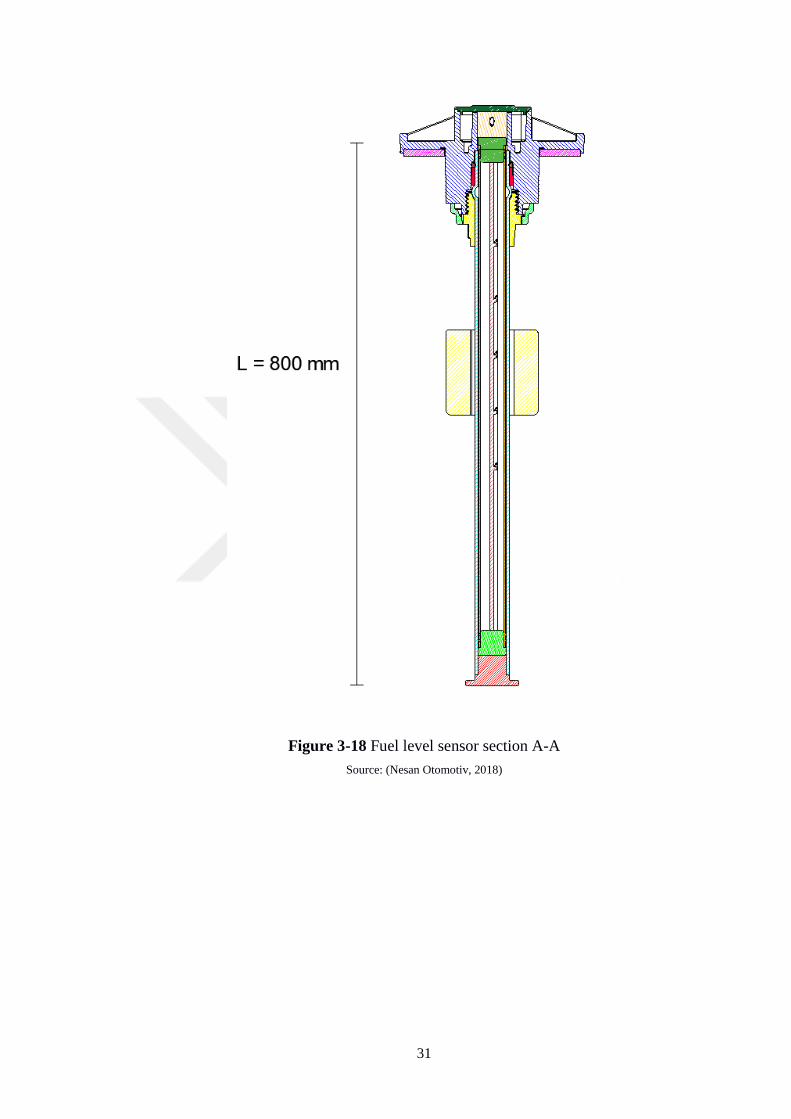
Figure 3-16 demonstrates the fuel level sensor technical drawing which is used in this
project. BLE wireless sensor is powered by a battery with an operating temperature
range between -40oC and +85oC. This sensor can be resisted for harsh environmental
conditions. BLE wireless sensor sends the gathered data to all BLE compatible devices.
29
Figure 3-14 Fuel level sensor working principle
Figure 3-15 The fuel level sensor ON/OFF mode
Source: (Coto Technology, 2016).
The technical requirements of the sensor can be listed below (Technoton Engineering,
2018, Nesan Otomotiv, 2018).
30
The maximum operating voltage is 48 V and the maximum operating current is
100 mA. The application of the circuit can be seen in Figure 3-17.
If it is mounted properly to the fuel tank, the fuel sender assembly will withstand
an internal tank pressure of 10 psi without leakage of air.
Cable pull-out force is min. 90 N.
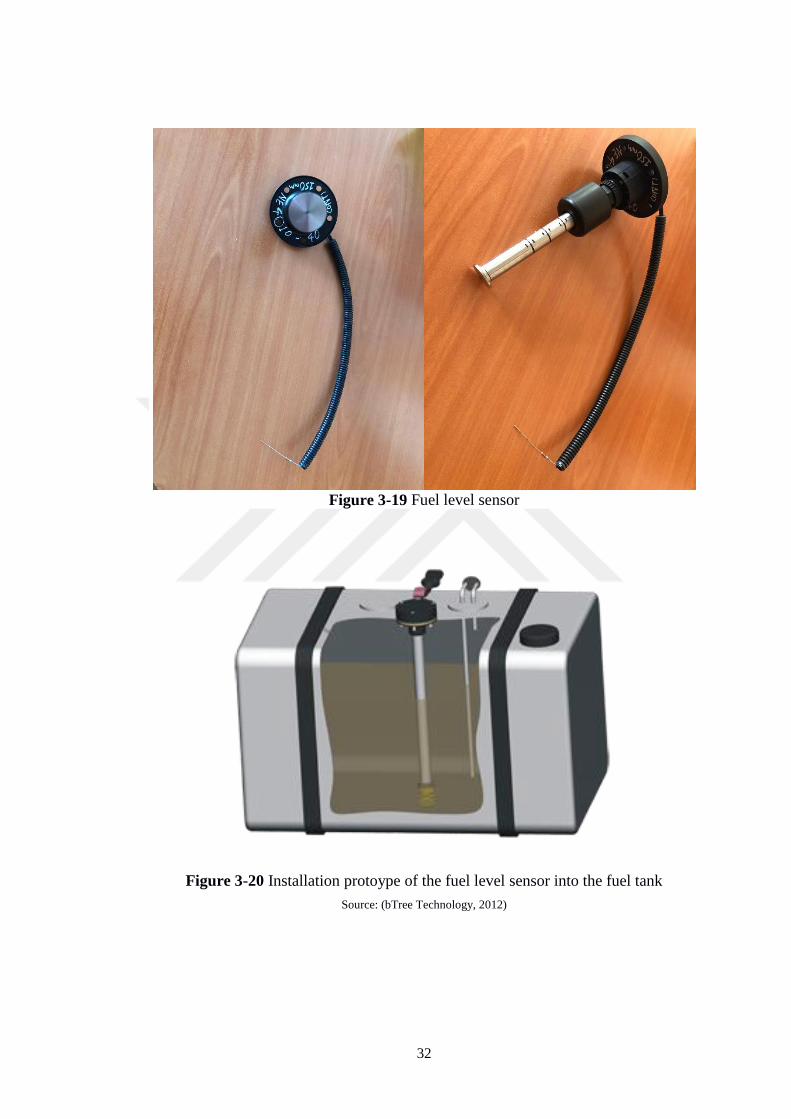
The length of the selected fuel level sensor is 800 mm which can be seen in
Figure 3-18. Figure 3-19 expresses the original fuel level sensor.
Figure 3-20 indicates the installation of the fuel level sensor into the fuel level
tank to monitor the liquid level.
Figure 3-16 Fuel level sensor on protoype
Source: (Nesan Otomotiv, 2018)
Figure 3-17 Circuit diagram of the fuel level sensor
Source: (Nesan Otomotiv, 2018)
31
Figure 3-18 Fuel level sensor section A-A
Source: (Nesan Otomotiv, 2018)
32
Figure 3-19 Fuel level sensor
Figure 3-20 Installation protoype of the fuel level sensor into the fuel tank
Source: (bTree Technology, 2012)
33
4 CHAPTER 4
APPLICATION
4.1 System Modeling
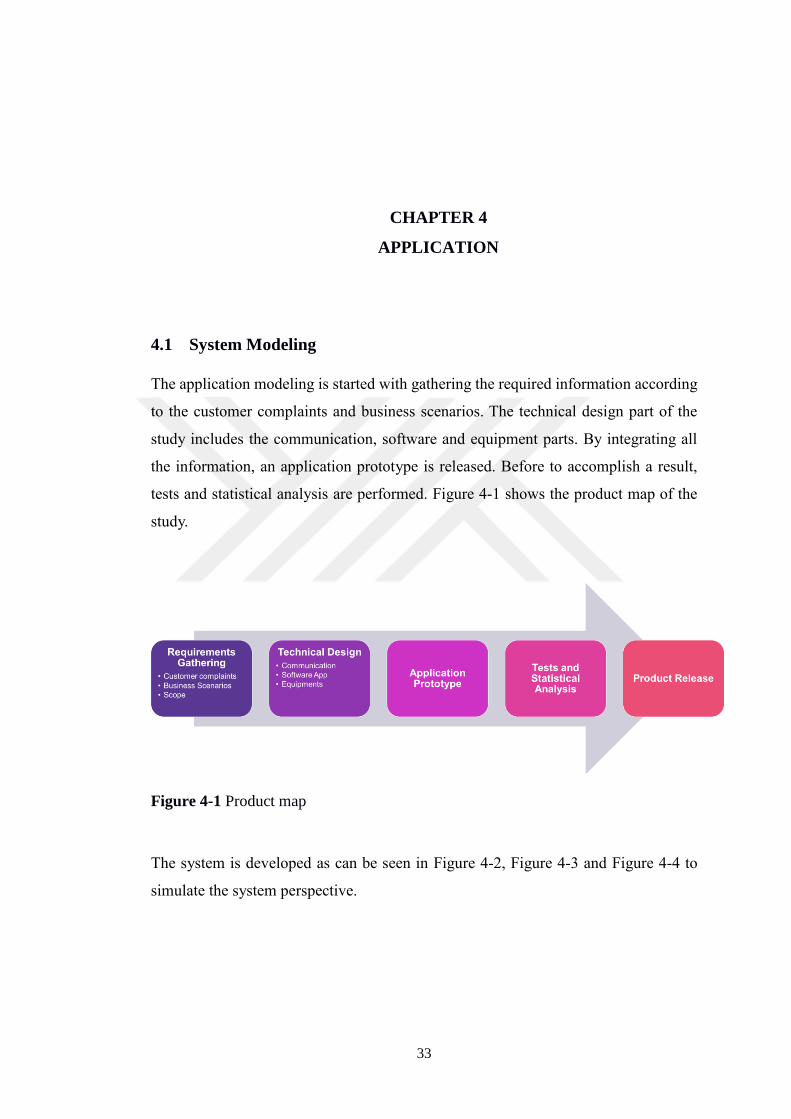
The application modeling is started with gathering the required information according
to the customer complaints and business scenarios. The technical design part of the
study includes the communication, software and equipment parts. By integrating all
the information, an application prototype is released. Before to accomplish a result,
tests and statistical analysis are performed. Figure 4-1 shows the product map of the
study.
Figure 4-1 Product map
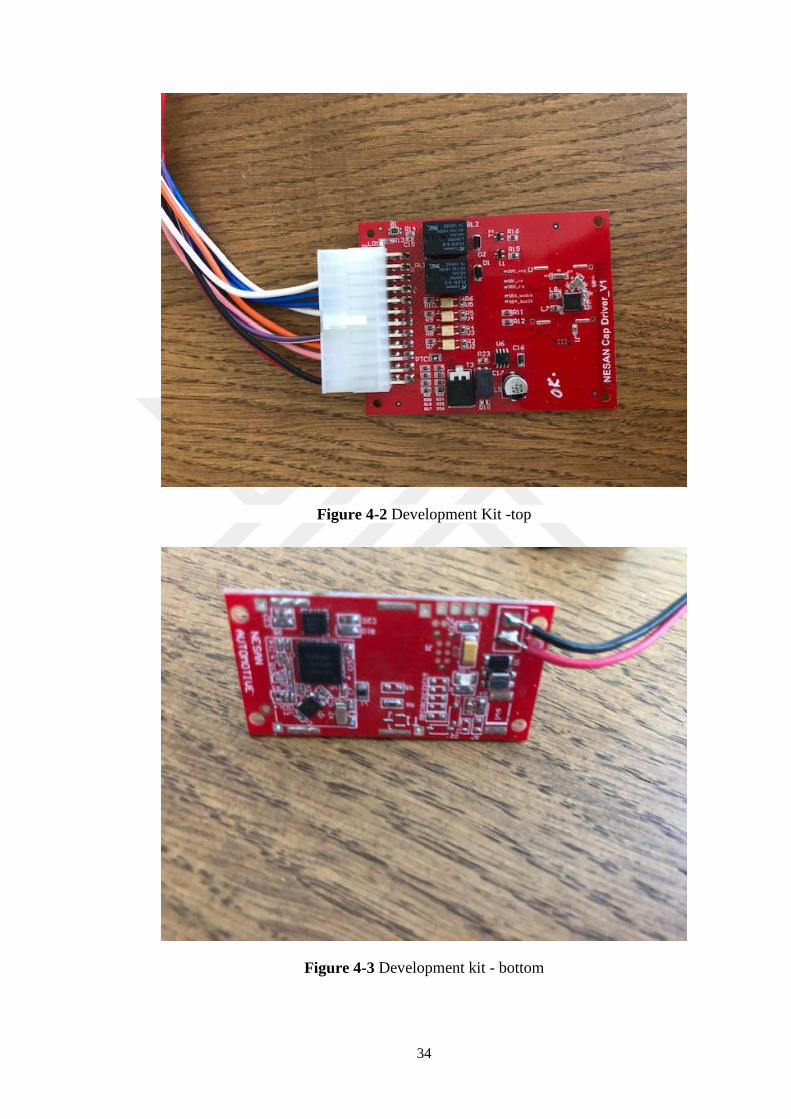
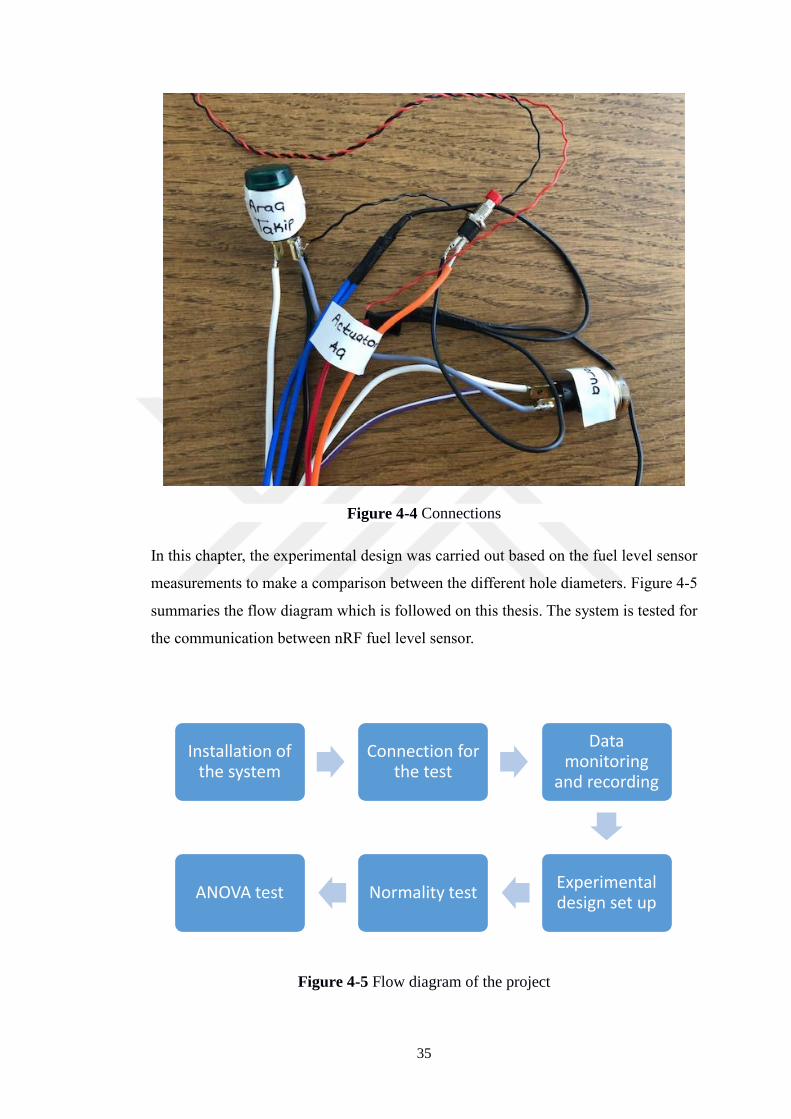
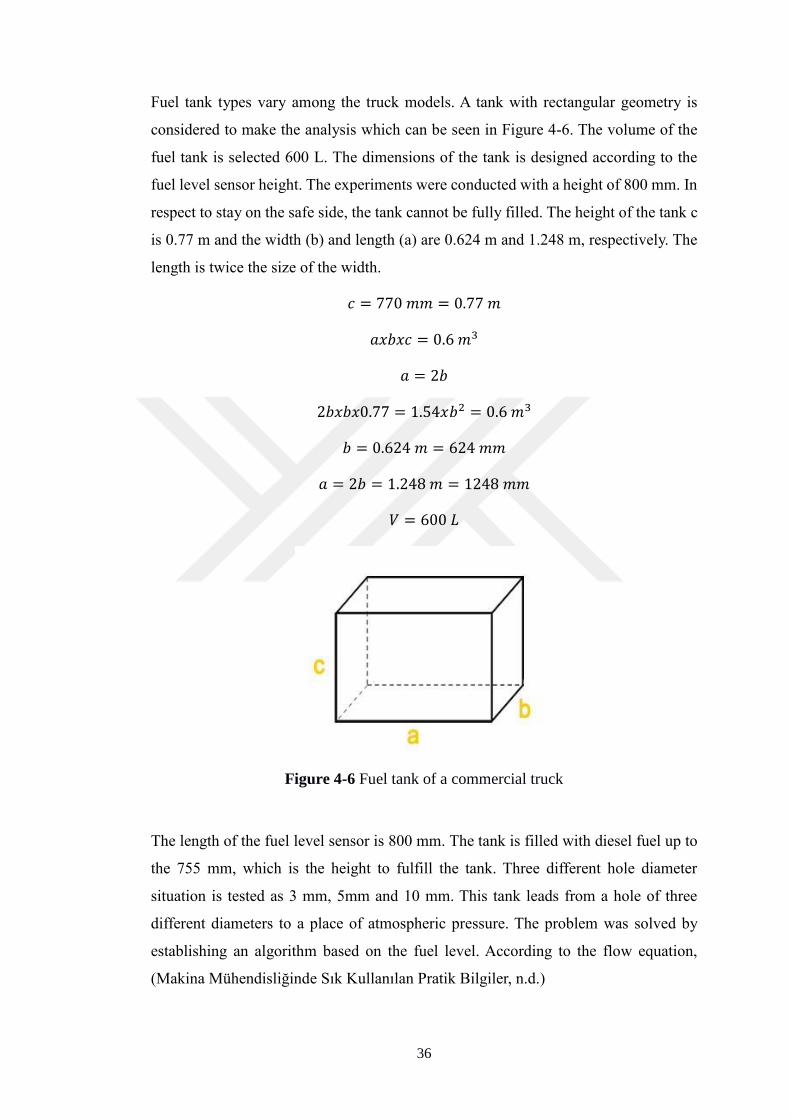
The system is developed as can be seen in Figure 4-2, Figure 4-3 and Figure 4-4 to
simulate the system perspective.
34
Figure 4-2 Development Kit -top
Figure 4-3 Development kit - bottom
35
Figure 4-4 Connections
In this chapter, the experimental design was carried out based on the fuel level sensor
measurements to make a comparison between the different hole diameters. Figure 4-5
summaries the flow diagram which is followed on this thesis. The system is tested for
the communication between nRF fuel level sensor.
Figure 4-5 Flow diagram of the project
Installation of the system
Connection for the test
Data monitoring
and recording
Experimental design set up
Normality testANOVA test
36
Fuel tank types vary among the truck models. A tank with rectangular geometry is
considered to make the analysis which can be seen in Figure 4-6. The volume of the
fuel tank is selected 600 L. The dimensions of the tank is designed according to the
fuel level sensor height. The experiments were conducted with a height of 800 mm. In
respect to stay on the safe side, the tank cannot be fully filled. The height of the tank c
is 0.77 m and the width (b) and length (a) are 0.624 m and 1.248 m, respectively. The
length is twice the size of the width.
𝑐 = 770 𝑚𝑚 = 0.77 𝑚
𝑎𝑥𝑏𝑥𝑐 = 0.6 𝑚3
𝑎 = 2𝑏
2𝑏𝑥𝑏𝑥0.77 = 1.54𝑥𝑏2 = 0.6 𝑚3
𝑏 = 0.624 𝑚 = 624 𝑚𝑚
𝑎 = 2𝑏 = 1.248 𝑚 = 1248 𝑚𝑚
𝑉 = 600 𝐿
Figure 4-6 Fuel tank of a commercial truck
The length of the fuel level sensor is 800 mm. The tank is filled with diesel fuel up to
the 755 mm, which is the height to fulfill the tank. Three different hole diameter
situation is tested as 3 mm, 5mm and 10 mm. This tank leads from a hole of three
different diameters to a place of atmospheric pressure. The problem was solved by
establishing an algorithm based on the fuel level. According to the flow equation,
(Makina Mühendisliğinde Sık Kullanılan Pratik Bilgiler, n.d.)
37
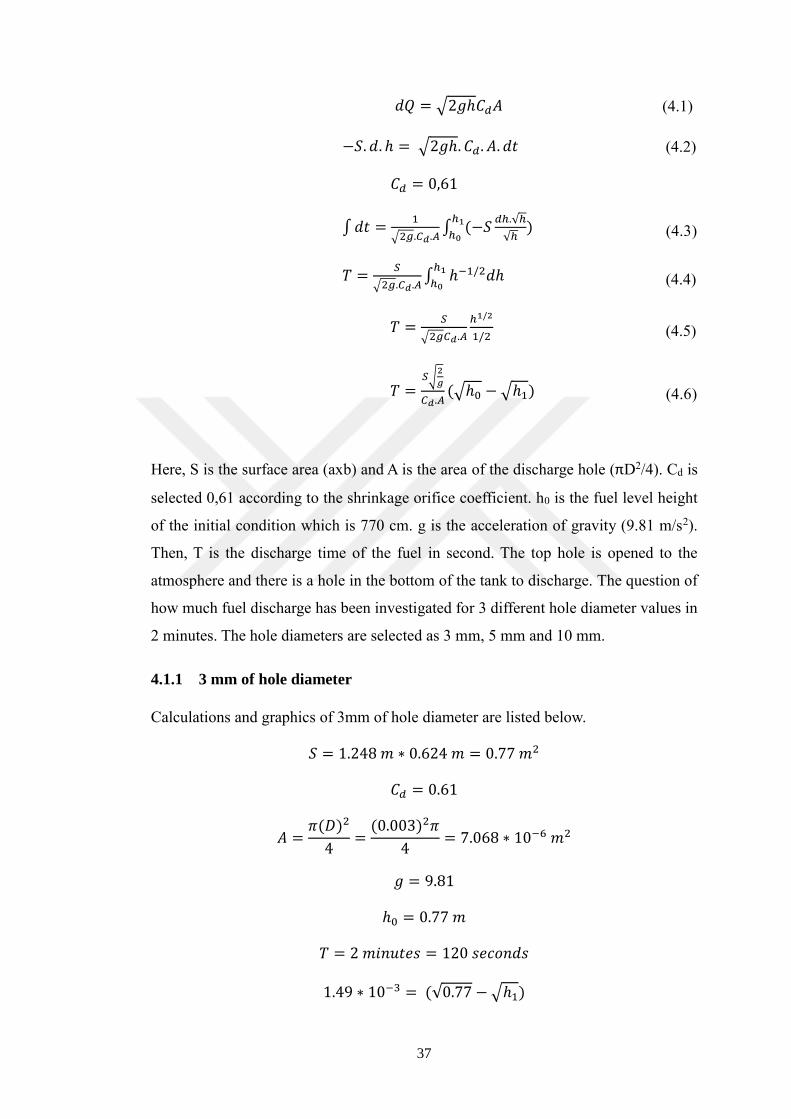
𝑑𝑄 = √2𝑔ℎ𝐶𝑑𝐴 (4.1)
−𝑆. 𝑑. ℎ = √2𝑔ℎ. 𝐶𝑑. 𝐴. 𝑑𝑡 (4.2)
𝐶𝑑 = 0,61
∫ 𝑑𝑡 =1
√2𝑔.𝐶𝑑.𝐴∫ (−𝑆
𝑑ℎ.√ℎ
√ℎ)
ℎ1
ℎ0 (4.3)
𝑇 =𝑆
√2𝑔.𝐶𝑑.𝐴∫ ℎ−1/2𝑑ℎ
ℎ1
ℎ0 (4.4)
𝑇 =𝑆
√2𝑔𝐶𝑑.𝐴
ℎ1/2
1/2 (4.5)
𝑇 =𝑆√
2
𝑔
𝐶𝑑.𝐴(√ℎ0 − √ℎ1) (4.6)
Here, S is the surface area (axb) and A is the area of the discharge hole (πD2/4). Cd is
selected 0,61 according to the shrinkage orifice coefficient. h0 is the fuel level height
of the initial condition which is 770 cm. g is the acceleration of gravity (9.81 m/s2).
Then, T is the discharge time of the fuel in second. The top hole is opened to the
atmosphere and there is a hole in the bottom of the tank to discharge. The question of
how much fuel discharge has been investigated for 3 different hole diameter values in
2 minutes. The hole diameters are selected as 3 mm, 5 mm and 10 mm.
4.1.1 3 mm of hole diameter
Calculations and graphics of 3mm of hole diameter are listed below.
𝑆 = 1.248 𝑚 ∗ 0.624 𝑚 = 0.77 𝑚2
𝐶𝑑 = 0.61
𝐴 =𝜋(𝐷)2
4=
(0.003)2𝜋
4= 7.068 ∗ 10−6 𝑚2
𝑔 = 9.81
ℎ0 = 0.77 𝑚
𝑇 = 2 𝑚𝑖𝑛𝑢𝑡𝑒𝑠 = 120 𝑠𝑒𝑐𝑜𝑛𝑑𝑠
1.49 ∗ 10−3 = (√0.77 − √ℎ1)

38
ℎ1 = 0.76 𝑚
𝑉𝑜𝑙𝑢𝑚𝑒 (𝑉) = (0.77 − 0.767)𝑥0,77 𝑚2 = 2.01 ∗ 10−3 𝑚3 = 2.01 𝑙𝑖𝑡𝑒𝑟
The total discharge volume in 2 minutes is 2.01 liters. It means that 2.01 liter is
discharged from the 600-liter tank in 2 minutes.
4.1.2 5 mm of hole diameter
Calculations of 5 mm of hole diameter are listed below.
𝑆 = 1.248 𝑚 ∗ 0.624 𝑚 = 0.77 𝑚2
𝐶𝑑 = 0.61
𝐴 =𝜋(𝐷)2
4=
(0.005)2𝜋
4= 1.96 ∗ 10−5 𝑚2
𝑔 = 9.81
ℎ0 = 0.77 𝑚
𝑇 = 2 𝑚𝑖𝑛𝑢𝑡𝑒𝑠 = 120 𝑠𝑒𝑐𝑜𝑛𝑑𝑠
4.14 ∗ 10−3 = (√0.77 − √ℎ1)
ℎ1 = 0.763 𝑚
𝑉𝑜𝑙𝑢𝑚𝑒 (𝑉) = (0.77 − 0.763)𝑥0,77 𝑚2 = 5.58 ∗ 10−3 𝑚3 = 5.58 𝑙𝑖𝑡𝑒𝑟
5.58 liter is discharged from the 600-liter tank in 2 minutes.
4.1.3 10 mm of hole diameter
Calculations of 10 mm of hole diameter are listed below.
𝑆 = 1.248 𝑚 ∗ 0.624 𝑚 = 0.77 𝑚2
𝐶𝑑 = 0.61
𝐴 =𝜋(𝐷)2
4=
(0.01)2𝜋
4= 7.85 ∗ 10−5 𝑚2
𝑔 = 9.81
ℎ0 = 0.77 𝑚
𝑇 = 2 𝑚𝑖𝑛𝑢𝑡𝑒𝑠 = 120 𝑠𝑒𝑐𝑜𝑛𝑑𝑠
39
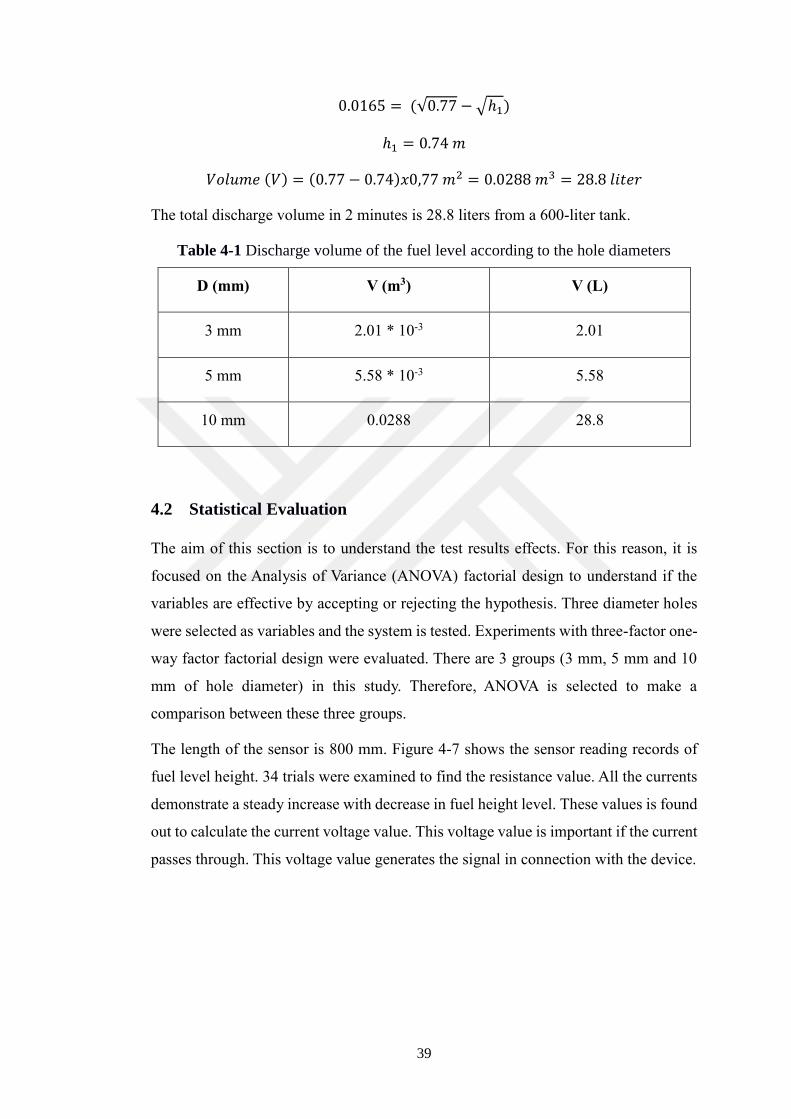
0.0165 = (√0.77 − √ℎ1)
ℎ1 = 0.74 𝑚
𝑉𝑜𝑙𝑢𝑚𝑒 (𝑉) = (0.77 − 0.74)𝑥0,77 𝑚2 = 0.0288 𝑚3 = 28.8 𝑙𝑖𝑡𝑒𝑟
The total discharge volume in 2 minutes is 28.8 liters from a 600-liter tank.
Table 4-1 Discharge volume of the fuel level according to the hole diameters
D (mm) V (m3) V (L)
3 mm 2.01 * 10-3 2.01
5 mm 5.58 * 10-3 5.58
10 mm 0.0288 28.8
4.2 Statistical Evaluation
The aim of this section is to understand the test results effects. For this reason, it is
focused on the Analysis of Variance (ANOVA) factorial design to understand if the
variables are effective by accepting or rejecting the hypothesis. Three diameter holes
were selected as variables and the system is tested. Experiments with three-factor one-
way factor factorial design were evaluated. There are 3 groups (3 mm, 5 mm and 10
mm of hole diameter) in this study. Therefore, ANOVA is selected to make a
comparison between these three groups.
The length of the sensor is 800 mm. Figure 4-7 shows the sensor reading records of
fuel level height. 34 trials were examined to find the resistance value. All the currents
demonstrate a steady increase with decrease in fuel height level. These values is found
out to calculate the current voltage value. This voltage value is important if the current
passes through. This voltage value generates the signal in connection with the device.
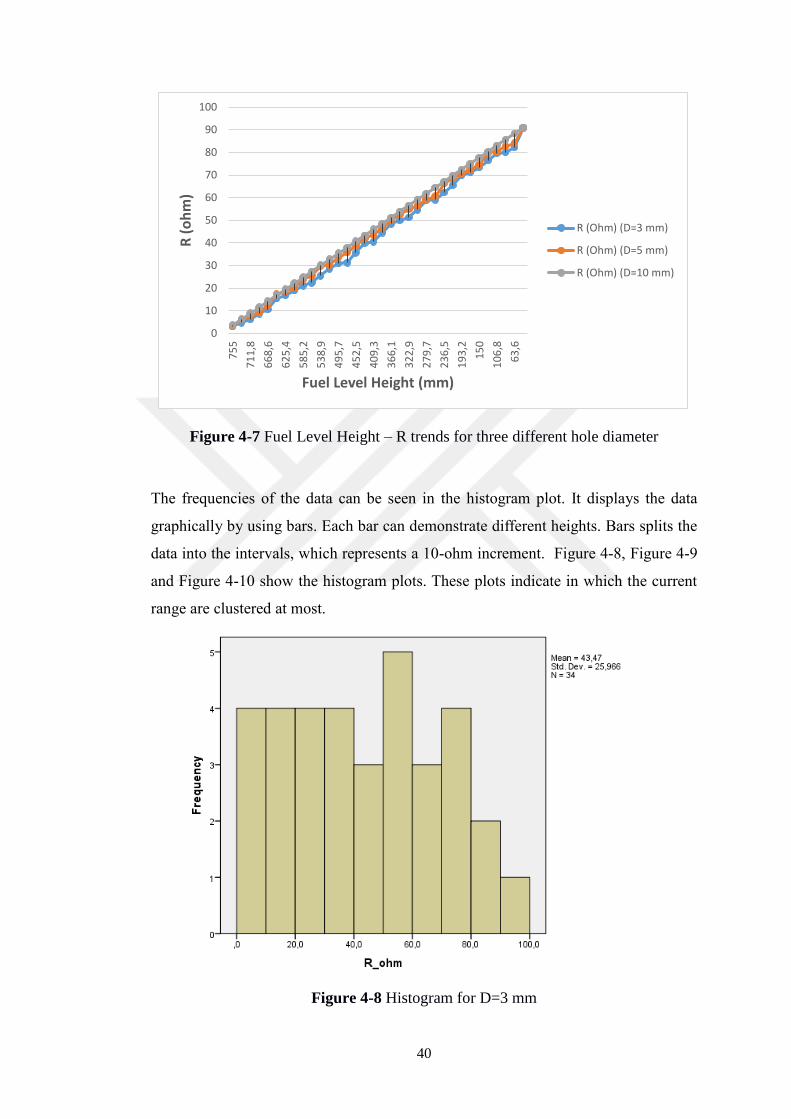
40
Figure 4-7 Fuel Level Height – R trends for three different hole diameter
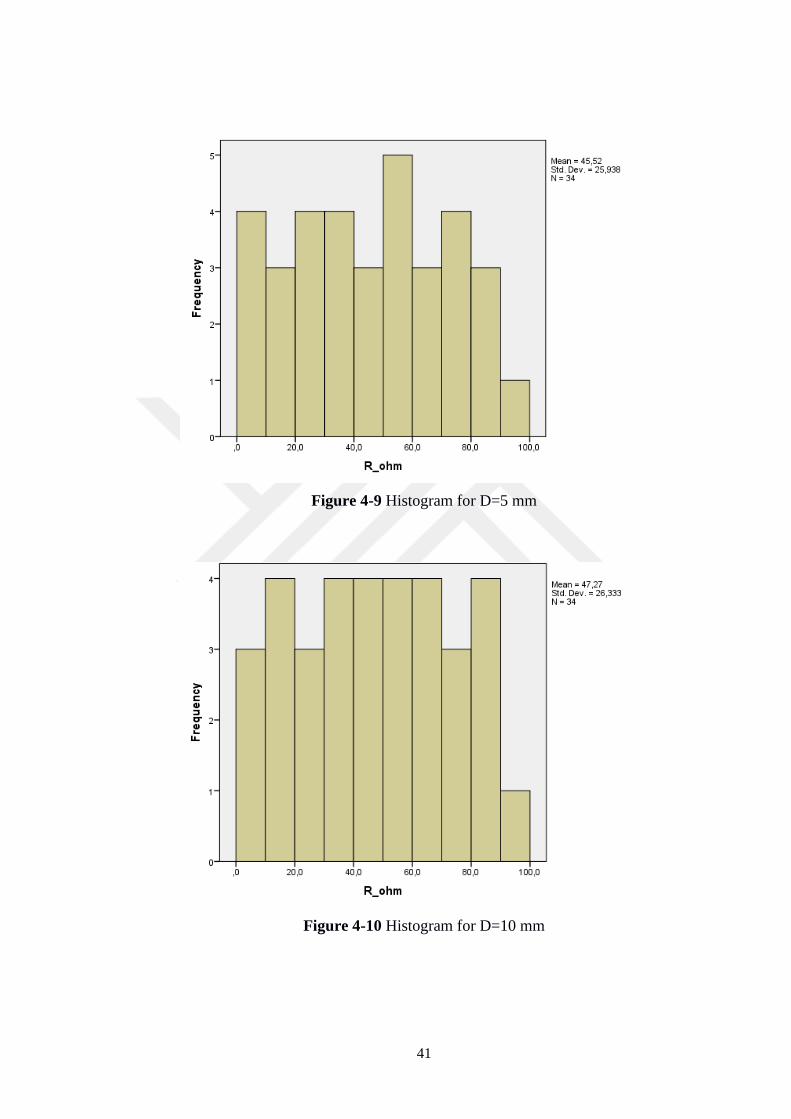
The frequencies of the data can be seen in the histogram plot. It displays the data
graphically by using bars. Each bar can demonstrate different heights. Bars splits the
data into the intervals, which represents a 10-ohm increment. Figure 4-8, Figure 4-9
and Figure 4-10 show the histogram plots. These plots indicate in which the current
range are clustered at most.
Figure 4-8 Histogram for D=3 mm
0
10
20
30
40
50
60
70
80
90
100
75
5
71
1,8
66
8,6
62
5,4
58
5,2
53
8,9
49
5,7
45
2,5
40
9,3
36
6,1
32
2,9
27
9,7
23
6,5
19
3,2
15
0
10
6,8
63
,6
R (
oh
m)
Fuel Level Height (mm)
R (Ohm) (D=3 mm)
R (Ohm) (D=5 mm)
R (Ohm) (D=10 mm)
41
Figure 4-9 Histogram for D=5 mm
Figure 4-10 Histogram for D=10 mm
42
4.2.1 Test of Normality
To examine statistically meaning of the test results and to compare the differences
between the groups, One Way ANOVA method is selected among the statistical
approaches. There are two basic assumptions in one way analysis of variance. Each
group must be normally distributed and the variances of the groups must be
homogenous (İset, 2014, SPSS: Test of Normality).
In this dataset, the current conditions of the fuel level sensor are given for 3 different
tank hole diameters. To test the normality of these 3 different groups, first of all,
hypotheses should be established (İset, 2014, SPSS: Test of Normality).
A hypothesis test begins with two types of hypotheses: Zero hypothesis (null
hypothesis) (Ho) and Alternative hypothesis (H1). The purpose of a hypothesis test is
to decide whether to reject the null hypothesis or not. Zero hypothesis demonstrates
that there is no statistically significant difference in the predetermined value of the
parameter is expected. An alternative hypothesis is the opposite of the zero hypothesis
(Çelik, 2012).
H0 = The data is normally distributed with 95% of the confidence interval.
H1 = The data is not normally distributed with 95% of the confidence interval.
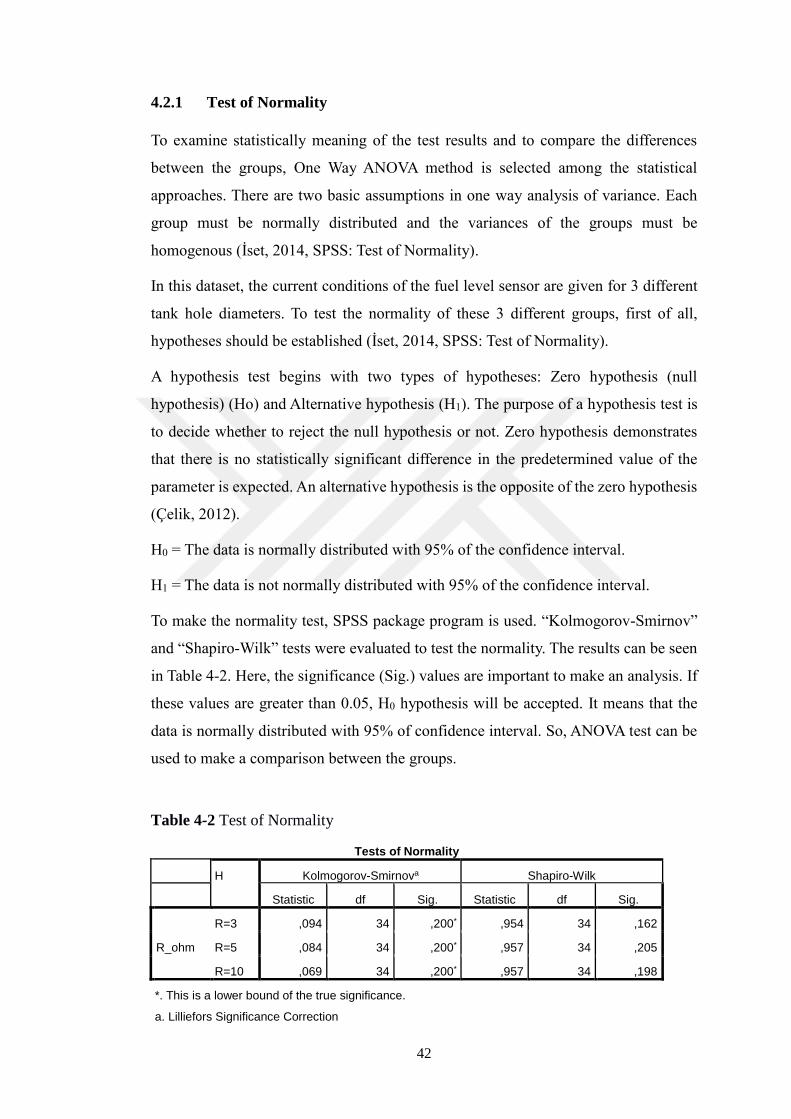
To make the normality test, SPSS package program is used. “Kolmogorov-Smirnov”
and “Shapiro-Wilk” tests were evaluated to test the normality. The results can be seen
in Table 4-2. Here, the significance (Sig.) values are important to make an analysis. If
these values are greater than 0.05, H0 hypothesis will be accepted. It means that the
data is normally distributed with 95% of confidence interval. So, ANOVA test can be
used to make a comparison between the groups.
Table 4-2 Test of Normality
Tests of Normality
H Kolmogorov-Smirnova Shapiro-Wilk
Statistic df Sig. Statistic df Sig.
R_ohm
R=3 ,094 34 ,200* ,954 34 ,162
R=5 ,084 34 ,200* ,957 34 ,205
R=10 ,069 34 ,200* ,957 34 ,198
*. This is a lower bound of the true significance.
a. Lilliefors Significance Correction
43
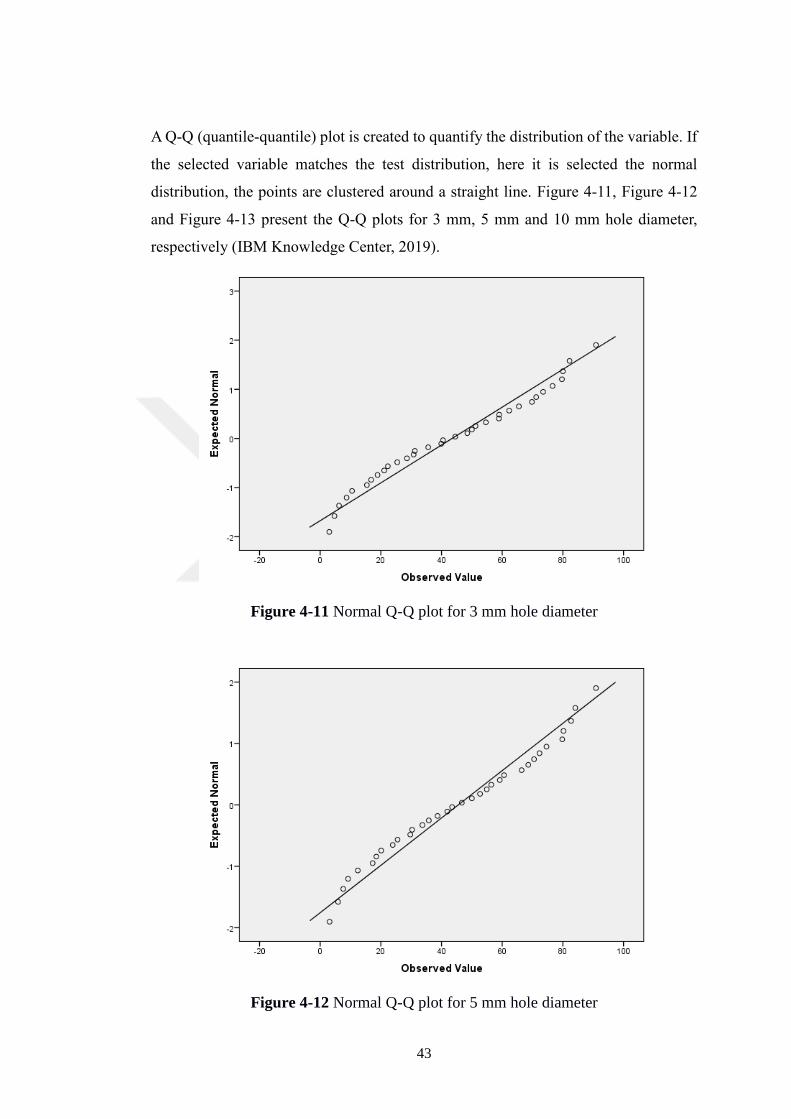
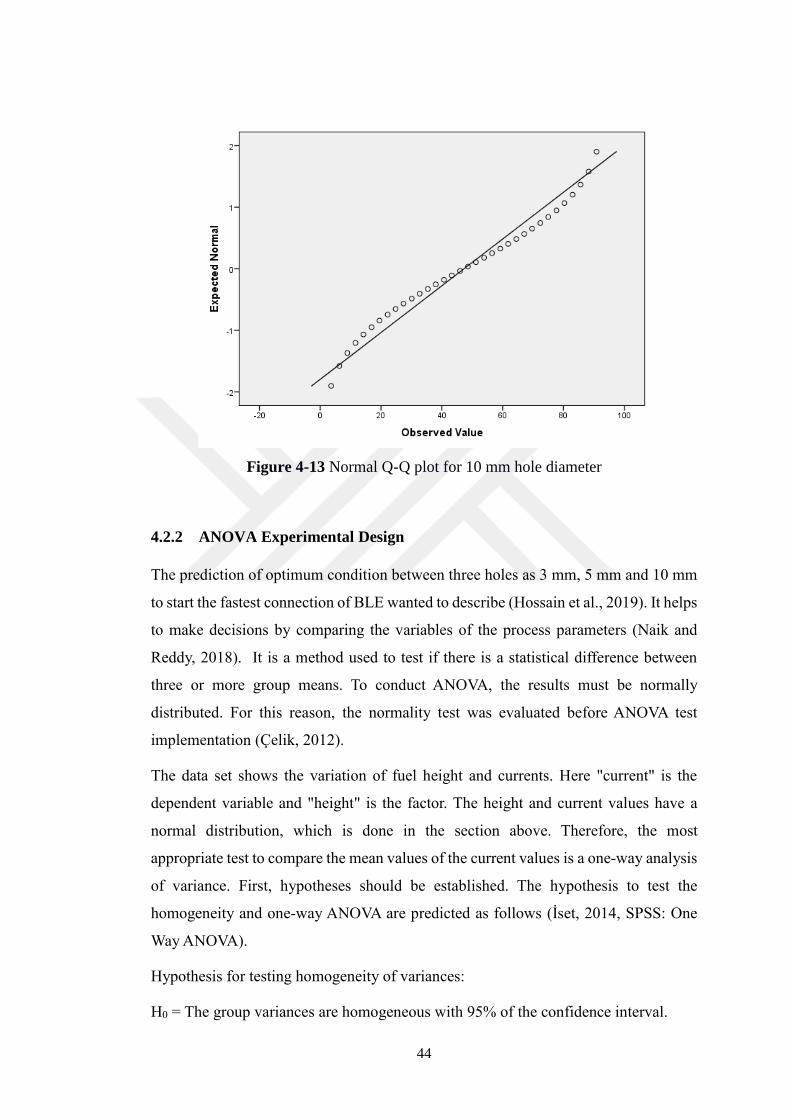
A Q-Q (quantile-quantile) plot is created to quantify the distribution of the variable. If
the selected variable matches the test distribution, here it is selected the normal
distribution, the points are clustered around a straight line. Figure 4-11, Figure 4-12
and Figure 4-13 present the Q-Q plots for 3 mm, 5 mm and 10 mm hole diameter,
respectively (IBM Knowledge Center, 2019).
Figure 4-11 Normal Q-Q plot for 3 mm hole diameter
Figure 4-12 Normal Q-Q plot for 5 mm hole diameter
44
Figure 4-13 Normal Q-Q plot for 10 mm hole diameter
4.2.2 ANOVA Experimental Design
The prediction of optimum condition between three holes as 3 mm, 5 mm and 10 mm
to start the fastest connection of BLE wanted to describe (Hossain et al., 2019). It helps
to make decisions by comparing the variables of the process parameters (Naik and
Reddy, 2018). It is a method used to test if there is a statistical difference between
three or more group means. To conduct ANOVA, the results must be normally
distributed. For this reason, the normality test was evaluated before ANOVA test
implementation (Çelik, 2012).
The data set shows the variation of fuel height and currents. Here "current" is the
dependent variable and "height" is the factor. The height and current values have a
normal distribution, which is done in the section above. Therefore, the most
appropriate test to compare the mean values of the current values is a one-way analysis
of variance. First, hypotheses should be established. The hypothesis to test the
homogeneity and one-way ANOVA are predicted as follows (İset, 2014, SPSS: One
Way ANOVA).
Hypothesis for testing homogeneity of variances:
H0 = The group variances are homogeneous with 95% of the confidence interval.
45
H1 = The group variances are not homogeneous with 95% of the confidence interval.
Hypothesis for one-way analysis of variance:
H0 = There is no statistically significant difference between the means of the groups
with 95% of the confidence interval.
H1 = There is a statistically significant difference between the means of the groups
with 95% of the confidence interval.
ANOVA is used to analyze how independent variables interact among themselves and
the effects of these interactions on the dependent variable. The significance level is
chosen by α=5% (0.05). It means that the results have 95% chance of being true and
have a 5% chance for being false. The SPSS results represent 95% confidence intervals.
Here, the height of the fuel level is selected as independent variable and R (ohm) is a
dependent variable. If, Table 4-3 is examined which indicates the descriptive statistics;
mean and standard deviation of the model. It summarizes the data meaningful. The
first column demonstrates the dependent variable names. The second column, N,
shows the test size which is 34 for each test. The following columns express the mean
and standard deviation for different hole diameter data set. Last columns signify the
maximum and minimum values of each test. It can be seen from the table that the
highest mean is 47,274 with a 10 mm hole diameter.
Table 4-3 Descriptive statistics
Descriptives
N Mean Std.
Deviation
Std.
Error
95% Confidence Interval for
Mean
Minimu
m
Maximu
m
Lower Bound Upper Bound
R=3 34 43,471 25,9660 4,4531 34,411 52,531 3,0 90,9
R=5 34 45,521 25,9377 4,4483 36,471 54,571 3,1 90,9
R=10 34 47,274 26,3331 4,5161 38,085 56,462 3,6 90,9
Total 102 45,422 25,8673 2,5612 40,341 50,502 3,0 90,9
Table 4-4 expresses the test of homogeneity of variances. Since the significance (Sig.)
value is 0.995 which is greater than 0.05, H0 hypothesis is accepted for homogeneity
test. For this reason, it can be said that the group variances are homogenous with 95%
of confidence.
46
Table 4-4 Test of Homogeneity of Variances
Levene Statistic df1 df2 Sig.
,005 2 99 ,995
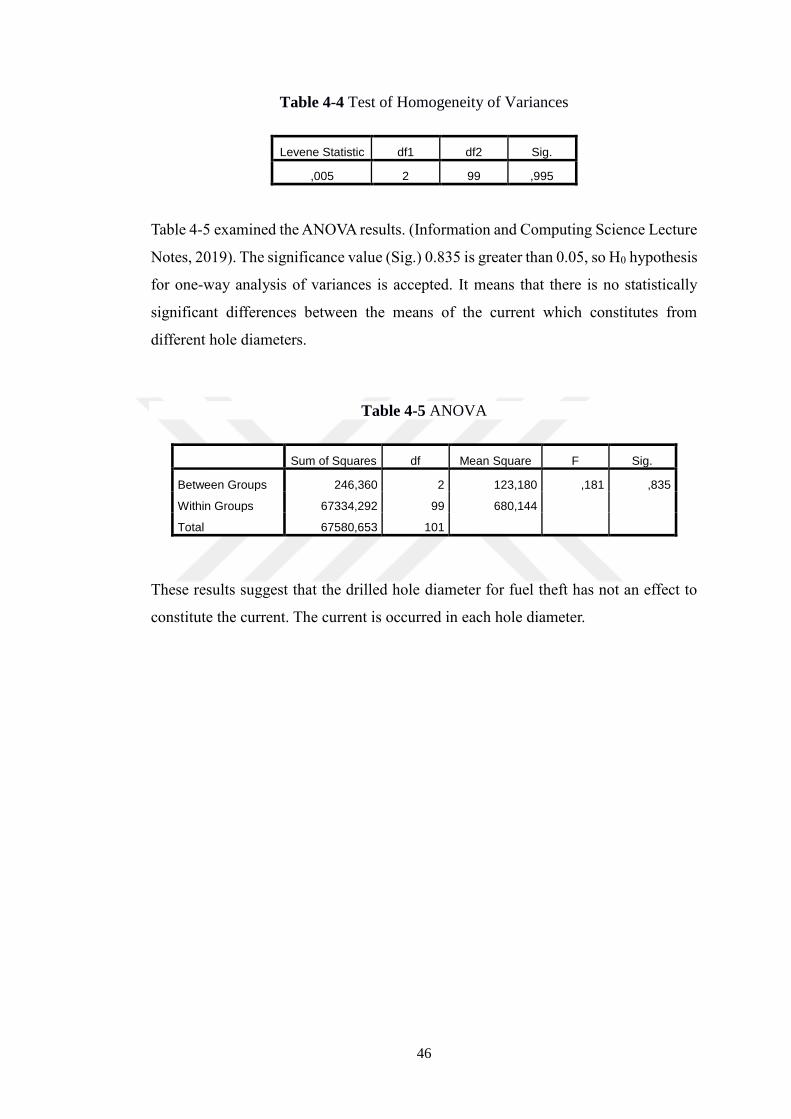
Table 4-5 examined the ANOVA results. (Information and Computing Science Lecture
Notes, 2019). The significance value (Sig.) 0.835 is greater than 0.05, so H0 hypothesis
for one-way analysis of variances is accepted. It means that there is no statistically
significant differences between the means of the current which constitutes from
different hole diameters.
Table 4-5 ANOVA
Sum of Squares df Mean Square F Sig.
Between Groups 246,360 2 123,180 ,181 ,835
Within Groups 67334,292 99 680,144
Total 67580,653 101
These results suggest that the drilled hole diameter for fuel theft has not an effect to
constitute the current. The current is occurred in each hole diameter.
47
CHAPTER 5
CONCLUSION
In today's technology, wireless communication devices with Bluetooth have started to
take an important part of daily lives and are creating new market trends. At this point,
researches are made about the low power consumption of the devices, fast and secure
communication. Bluetooth Low Energy (BLE) or also known Bluetooth Smart ensures
low-energy and low-cost solution for the Internet of Things (IoT) and is developing
day by day.
Nowadays, in-vehicle electronics technology is becoming essential with respect to
customer needs. According to claim report results of one of the reputable automotive
manufacturers indicates that, the crucial expectation of prospects and customers is to
have safety electronic systems and following up the status of the car remotely. Due to
this reason consumer electronics and internet of things (IoT) technologies are
depending on the assessment of needs. In order to follow up status of car remotely,
Bluetooth Low Energy technology (BLE) and acceleration sensors are widely used in
vehicle electronics.
BLE technology is attracting attention on wireless sensor applications with a
connection of a mobile phone. The new technology Bluetooth 5.0 is much faster than
the previous versions, with a wide range of domains, battery-friendly and compatible
with future technologies. The impact area of Bluetooth Smart has increased and thus
the Internet of Things has reached to a new level. Bluetooth technology is very
important for faster and more effective interaction between smart devices. Thanks to
the Internet of things, Bluetooth is more common in daily life and provides quality,
speed, and battery life.
48
The aim was to design and test for continuous monitoring of fuel level control
mechanisms against undesirable situations. A prototype fuel level control system is
implemented using wireless sensor networks via BLE and SMS. The fuel level sensor
is placed into the fuel tank to collect the data. Temperature and fuel levels are measured
inside the fuel tank. If an abrupt change occurs in the temperature and fuel level, the
users are informed via SMS. the current work aims to process data locally, transmitting
via Bluetooth Low Energy and reporting the output data. The results/outputs of the
system implementation are evaluated statistically with experimental design.
One-way ANOVA was conducted to compare the effect of different hole diameter
during the fuel theft. The data set was generated according to the variation of fuel
height and currents. "Current" is the dependent variable and "height" is the
independent factor. First, the normality test conducted if the data is suitable to perform
ANOVA test. The results showed that height and current values have normally
distributed and suitable for normal distribution. For this reason, to compare the values,
one-way analysis of variance (ANOVA) was implemented. At first, the hypotheses of
homogeneity and ANOVA were established. The significance level was chosen as
α=5% (0.05). It means that the results have 95% chance of being true and have a 5%
of for being false. The SPSS results represent 95% confidence intervals. As a result of
the ANOVA test, it is obtained that the different hole diameter has the same effect to
generate the R (ohm).
There are several steps that should be realized in order to further this project. The
connection between the sensor and PC must be improved. To move forward, the factors
that affect the processing time to send SMS must be analyzed. The number of
experiments with the processing time should be increased. Furthermore, the remote
monitoring system which depends on the BLE network should be redesigned in order
to make the system more accurate.
49
REFERENCES
Aerd Statisitcs. 2018. Linear Regression Analysis using SPSS Statistics,
https://statistics.laerd.com/spss-tutorials/linear-regression-using-spss-
statistics.php
Alam, M.S.U. 2018. “Securing Vehicle Electronic Control Unit (ECU)
Communications and Stored Data.” Master Thesis. Queen’s University.
Alidori, E. (2013). A wireless sensor network architecture for solid waste management.
Poster abstract.
Apl (2019). Yakıt Seviyesi Sensörü – DUT. Retrieved from http://www.apl.com.tr/dut-
e-yak305t-seviye-sensoumlruuml.html
Avşaroğlu, F. A. et all. 2010. “Software Requirements Specification Greenhouse
Monitoring With Wireless Sensor Network”. Senior Design Project. Middle East
Technical University.
Bal, O. 2015. “Mikroişlemcilerin Bluetooth Üzerinden Güvenli Haberleşmesinin
Gerçeklenmesi.” Bachelor Thesis. Istanbul Technical University.
Baz, M. O. M. 2014. “Use of Inferential Statistics to Design Effective Communication
Protocols for Wireless Sensor Networks”. PhD Thesis. University of York.
Bjarnason, J. 2016. “Evaluation of Bluetooth Low Energy in Agriculture
Environments.” Bachelor Thesis. Malmö University.
bTree Technologies (2012). Fuel Monitoring. Retrieved from
http://btreetechnologies.com/products/gps/btVTS-fuel.html.
Coto Technology. 2016. Liquid Level Sensing Using Reed Switch Technoloy,
Application Note – AN 1602-1.
Çağlı, A. S. 2012, “İstatistik 2”, Beykent University lecture notes, Ankara, 21 Mart
2012.
Çelik, N. 2012. “ANOVA Modellerinde Çarpik Dağilimlar Kullanilarak Dayanikli
İstatistiksel Sonuç Çikarimi ve Uygulamalari.” Doctoral Thesis. Ankara
Üniversitesi.
50
DA14585/586 SDK 6 Software Developer’s Guide UM-B-080 User Manual, Dialog
Semiconductor, 2018.
Digi-Key's North American Editors. 2016. Bluetooth® Low Energy Design 101: From
Chipsets to Protocol Stacks to Modules, 14 July 2016, Retrieved from: <
https://www.digikey.com/en/articles/techzone/2016/jul/bluetooth-low-energy-
design-101-from-chipsets-to-protocol-stacks-to-modules>. ,
Elhesseawy, H. and Riad, L. “Bluetooth Low Energy Industrial Sensor.” Master Thesis.
Lund University.
Embedded Centric. (2019a). Introduction to Bluetooth Low Energy/Bluetooth 5.
Retrieved from https://embeddedcentric.com/introduction-to-bluetooth-low-
energy-bluetooth-5/
Embedded Centric. (2019b). Lesson 2 – BLE Profiles, Services, Characteristics,
Device Roles and Network Topology. Retrieved from
https://embeddedcentric.com/lesson-2-ble-profiles-services-characteristics-
device-roles-and-network-topology/
Felding, H. “Automotive Test Advances.” Master Thesis. Lund University.
Lawrie, E. from Golledge Electronics (2015). The AEC-Q200 Standard, what does it
really mean?. Retrieved from https://www.golledge.com/news/the-aec-q200-
standard-what-does-it-really-mean/
Garcia, A. C. B. et all. 2011. Sensor Data Analysis for Equipment Monitoring.
Knowledge and Information Systems 28(2):333-364.
Goundar, J. et al. (2014). Mechatronic design solution for fuel level monitoring using
pressure sensor: IEEE Asia Pacific World Conference on Computer Science and
Engineering, Nadi, Fiji.
Haithem, E. and Lamiaa, R. 2018. “Bluetooth Low Energy Industrial Sensor.” Master
Thesis. Lund University.
Hearndon, S. L. 2016. “An Analysis of Bluetooth Low Energy in the Context of
Intermittently Powered Devices.” Master Thesis. Clemson University.
51
Hossain, M.O., Rahim, N.A., Aman, M.M. and Selvaraj, J. 2019. Application of
ANOVA method to study solar energy for hydrogen production. Interational
Journal of Hydrogen Energy. Vol 44 (79): 14571-14579.
IBM Knowledge Center (2019). Q-Q Çizimi Oluşturma. Retrieved from
https://www.ibm.com/support/knowledgecenter/tr/SSEP7J_10.1.1/com.ibm.sw
g.ba.cognos.ug_cr_rptstd.10.1.1.doc/t_id_stat_qq.html.
Information and Computing Science Lecture Notes, Academic Year 2019. Universiteit
Utrecht. Retrieved from http://www.cs.uu.nl/docs/vakken/arm/SPSS/spss4.pdf.
İset, Volkan (2014). SPSS: Test of Normality. Retrieved from
http://volkaniset.blogspot.com/p/spsstest-of-normality-normallik-testi.html.
İset, Volkan (2014). SPSS: One Way ANOVA. Retrieved from
http://volkaniset.blogspot.com/p/spssone-way-anovatek-yonlu-varyans.html
Kambham, N. K. 2018. “Predicting Personality Traits Using Smartphone Sensor Data
and App Usage Data.” Master Thesis. University of Saskatchewan.
Keeping, S. from Nordic Semiconductor (2016, Summer). Ultra low power wireless
connectivity solutions. Ultra Low Power Wireless Quarter 2, 15-16. Retrieved
from http://freqchina.com/uploads/soft/201611/11_09122221.pdf
Köse, E., Yaşar, E., Yamaçlı, S. 2009. Dijital Yakıt Seviye, Yol Göstergesi ve Yakıt
Güvenlik Sistemin Ağır Vasıta Araçlarına Uygulanması. Politeknik Dergisi. Vol
12 (1): 7-11.
Kuchimanchi, S. 2015. “Bluetooth Low Energy Based Ticketing Systems.” Master
Thesis. Aalto University.
Lin, J.-R., Talty, T. and Tonguz, O. K. 2015. On the Potential of Bluetooth Low Energy
Technology for Vehicular Applications. IEEE Communications Magazine 53 (1).
Lockefeer, L. 2010. “Encrypted SMS, an analysis of the theoretical necessities and
implementation possibilities.” Bachelor Thesis. Radboud University.
Lonzetta, A. M. et all. 2018. Security Vulnerabilities in Bluetooth Technology as Used
in IoT. Journal of Sensor and Actuator Networks. Vol. 7 (3): 28.
Lyatuu, Cornel Andrew. 2018. “An Analysis of Bluetooth 5 Protocol in Comparison to
the Preceding Bluetooth Versions”. Master’s Thesis. Kocaeli University.
52
Makina Mühendisliğinde Sık Kullanılan Pratik Bilgiler (n.d). Retrieved from
(http://www.muhendislikbilgileri.com/?pnum=129&pt=PROBLEM+4)
Naik, A.B. and Reddy, C. Optimization of tensile strength in TIG welding using the
Taguchi method and analysis of variance (ANOVA). Thermal Science and
Engineering Progress. Vol 8, 327-339.
Nelson, B. 2018. “A Bluetooth Low-Energy Wireless Sensor Platform for Continuous
Monitoring of a Bioreactor Environment during Cell Manufacturing.” Master
Thesis. Michigan Technological University.
Nesan Otomotiv A.Ş. Fuel Level Sensor Technical Drawing Sheet, 2018.
Nordic Semiconductor. (2014a).Creating Bluetooth Low Energy Applications Using
nRF51822 Application Note v1.1. Retrieved from
https://infocenter.nordicsemi.com/pdf/nan_36.pdf.
Nordic Semiconductor. (2014b). nRF51 Dongle Developing with MDK-ARM
Microcontroller Development Kit User Guide v1.0. Retrieved from
https://infocenter.nordicsemi.com/pdf/nRF51_Dongle_UG_v1.0.pdf?cp=4_1_1.
Nordic Semiconductor. (2015). nRF51824 Multiprotocol Bluetooth® low energy/2.4
GHz RF System on Chip Product Specification v1.0. Retrieved from:
https://infocenter.nordicsemi.com/pdf/nRF51824_PS_v1.0.pdf?cp=4_3_0_0.
Nordic Semiconductor. (2017). nRF51 Development Kit Developing with MDK-ARM
Microcontroller Development Kit User Guide v1.2. Retrieved from
https://infocenter.nordicsemi.com/pdf/nRF51_Development_Kit_User_Guide_
v1.2.pdf.
Nordic Semiconductor. (2018a). BLE Blinky Application. Retrieved from:
https://infocenter.nordicsemi.com/index.jsp?topic=%2Fcom.nordic.infocenter.s
dk5.v15.0.0%2Fble_sdk_app_blinky.html&cp=4_0_0_4_1_2_3
Nordic Semiconductor. (2018b). BLE Blinky Client Application. Retrieved from:
https://infocenter.nordicsemi.com/index.jsp?topic=%2Fcom.nordic.infocenter.s
dk5.v15.0.0%2Fble_sdk_app_blinky_c.html
Nordic Semiconductor. (2018c). nRF BLE Controller. Retrieved from
http://developer.nordicsemi.com/nRF_Connect_SDK/doc/1.0.0/nrfxlib/ble_con
troller/doc/README.html
53
Ohlson, T. 2013. “Digitising statistics handling through hardware and mobile web
technology.” Master Thesis. Chalmers University of Technology.
Rasshofer, R. H. 2007. Functional requirements of future automotive radar systems:
2007 European Radar Conference.
Sarstedt, M and Mooi, E. (2011) A Concise Guide to Market Research – Chapter 7.
Berlin: Springer
Senthil, K. R.., Ganapathi, M., Arunkamar. D., Goutham, G. and Karthick, M. 2017.
Fuel Monitoring System for Fuel Management. International Journal of Science,
Engineering and Technology Research (IJSETR). Vol 6 (4): 565-571).
Technoton Engineering. 2018. Fuel Level BLE Wireless Sensor, 20 August 2018,
Retreived from: < https://rd-technoton.com/fuel-level-ble-wireless-sensor.html>.
Tonta, Y. 2008, “Varyans Analizi”, Haccettepe University lecture notes, Ankara.
Warwickshire Police, n.d. Retrieved from
https://www.westmercia.police.uk/media/5830/Fuel-theft-advice-
sheet/pdf/Fuel_Theft_Advice_Sheet.pdf
Wekhande, S. and Farakate, R. 2019, “Fuel Level Sensor Using Hall-Effect Sensor
ICs”, Application Information, Allegro Microsystems
Winkel, T.T.L. 2016. “Robustness of bluetooth low energy in in-vehicle networks.”
Master Thesis. Eindhoven University of Technology.
Related Documents


