DOCKETED Docket Number: 19-DECARB-01 Project Title: Decarbonization TN #: 233106 Document Title: Fuel Substitution Forecasting Tools Methods Supporting Senate Bill 350 Analysis Description: Methodology of the Fuel Substitution Scenario Analysis Tool. Filer: Brian Samuelson Organization: California Energy Commission Submitter Role: Commission Staff Submission Date: 5/26/2020 7:23:47 AM Docketed Date: 5/26/2020

Welcome message from author
This document is posted to help you gain knowledge. Please leave a comment to let me know what you think about it! Share it to your friends and learn new things together.
Transcript

DOCKETED Docket Number: 19-DECARB-01
Project Title: Decarbonization
TN #: 233106
Document Title: Fuel Substitution Forecasting Tools Methods Supporting
Senate Bill 350 Analysis
Description: Methodology of the Fuel Substitution Scenario Analysis Tool.
Filer: Brian Samuelson
Organization: California Energy Commission
Submitter Role: Commission Staff
Submission Date: 5/26/2020 7:23:47 AM
Docketed Date: 5/26/2020

California Energy Commission
CONSULTANT REPORT
Fuel Substitution Forecasting Tools
Methods Supporting Senate Bill 350 Analysis
Prepared for: California Energy Commission
Prepared by: Guidehouse Inc.
Gavin Newsom, Governor
May 2020 | CEC-200-2020-001

California Energy Commission
Primary Authors:
Amul Sathe, Guidehouse
Karen Maoz, Guidehouse
John Aquino, Guidehouse
Abhijeet Pande, TRC Companies, Inc.
Floyd Keneipp, Tierra Resource Consultants
Guidehouse Inc.
101 California Street, Suite 4100
San Francisco, CA 94111
guidehouse.com
Contract Number: 800-16-006
Prepared for:
California Energy Commission
Brian Samuelson
Contract Manager
Brian Samuelson
Project Manager
Matt Coldwell
Office Manager
DEMAND ANALYSIS OFFICE
Siva Gunda Deputy Director
ENERGY ASSESSMENTS DIVISION
Drew Bohan Executive Director

DISCLAIMER
This report was prepared as the result of work sponsored
by the he California Energy Commission. It does not
necessarily represent the views of the CEC, its employees,
or the State of California. The CEC, the State of California,
its employees, contractors, and subcontractors make no
warrant, express or implied, and assume no legal liability
for the information in this report; nor does any party
represent that the uses of this information will not infringe
upon privately owned rights. This report has not been
approved or disapproved by the California Energy
Commission, nor has the California Energy Commission
passed upon the accuracy or adequacy of the information in
this report.


i
ACKNOWLEDGEMENTS
The authors would like to thank the following California Energy Commission staff members for
their valuable input on the draft study and accompanying analysis framework: Aida Escala,
Brian Samuelson, Cynthia Rogers, Ingrid Neumann, Martha Brook, Mike Jaske, Nicholas
Janusch, Bill Pennington, Anne Fisher, and Laith Younis.
The authors would also like to acknowledge the effort of the following staff in support of this
work:
Megan McEnaney, Guidehouse
Dustin Bailey, Guidehouse
Suraj Patel, Guidehouse
Karl Walter, Guidehouse
Leo Barlach, Guidehouse
Trina Horner, Guidehouse
Alexandria Davis, Guidehouse
Richard Williams, TRC Companies, Inc.
Dove Feng, TRC Companies, Inc.
Nick Snyder, Tierra Resource Consultants

ii
ABSTRACT
Mandated by Assembly Bill (AB) 3232 (Friedman, Chapter 373, Statutes of 2018), the
California Energy Commission (CEC) must assess the potential for the state to reduce
greenhouse gas (GHG) emissions from its residential and commercial building stock by at least
40 percent below 1990 levels by 2030. Furthermore, under Senate Bill (SB) 350 (De León,
Chapter 547, Statutes of 2015), the CEC must set annual targets to achieve a statewide
cumulative doubling of energy efficiency savings in electricity and natural gas by January 1,
2030. One method the state will use to achieve the AB 3232 and SB 350 goals is by
decarbonizing buildings through fuel substitution. Fuel substitution, when electricity substitutes
natural gas, results in an overall increase of electricity consumption and may result in an
increase in electric generation capacity needed. Therefore, it is important to understand how
fuel substitution affects the GHG emissions from California buildings and the carbon emissions
resulting from increased electric load.
The report looks at all sectors and evaluates the potential barriers and opportunities for fuel
substitution in new construction and retrofit situations. This report includes information on
setting a 2030 GHG emissions target; researching decarbonization technologies, costs, and
potential barriers; and identifying the possible grid impacts of building decarbonization.
The CEC conducted a preliminary assessment of the relative value and feasibility for
substituting electricity for natural gas in residential and commercial buildings. That 2019 study
developed a tool to assess annual and hourly natural impacts at an end-use level. The project
team used the 2019 analysis to develop the fuel substitution scenario analysis tool described in
this report. This new tool provides the CEC the ability to forecast GHG emissions, electricity,
natural gas, and cost impacts under various fuel substitution scenarios at the utility, sector,
and end-use levels.
Keywords: Senate Bill 350, SB 350, fuel substitution, electrification, barriers, solutions,
electricity, natural gas, scenario analysis, tool
Please use the following citation for this report:
Sathe, Amul Sathe (Guidehouse), Karen Maoz (Guidehouse), John Aquino (Guidehouse),
Abhijeet Pande (TRC), and Floyd Keneipp (Tierra Resource Consultants). 2020. Fuel Substitution Reporting Tools. California Energy Commission. Publication Number: CEC-
200-2020-001.

iii
TABLE OF CONTENTS
Page
Acknowledgements ......................................................................................................... i
Abstract.........................................................................................................................ii
Table of Contents ......................................................................................................... iii
List of Figures ............................................................................................................... vi
List of Tables .............................................................................................................. viii
Executive Summary ....................................................................................................... 1
Study Scope/Objective ................................................................................................. 1
Tool Objectives and Scope ........................................................................................... 2
Organization of This Report .......................................................................................... 3
CHAPTER 1: Background ................................................................................................ 5
CHAPTER 2: Cross-Utility and Infrastructure Implications .................................................. 7
Utility Customer Impacts .............................................................................................. 7
Overview of Customers Served by California Utilit ies ..........................................................................................8
Requirements for Electric and Gas Service.....................................................................10
Cost Impacts............................................................................................................................................ 10
Technology Impacts .................................................................................................................................. 11
Public Health and Safety Impacts .................................................................................11
Gas Utility Impacts .....................................................................................................13
Gas Utility Cost and Revenue....................................................................................................................... 14
Gas Utility Technology ............................................................................................................................... 15
Electric Utility Impacts ................................................................................................15
Electric Utility Infrastructure Upgrades .......................................................................................................... 16
Changing Electric Utility Demand Load Shapes ................................................................................................ 18
Housing Vintage Stock and Increased Electric Loads ........................................................................................ 19
Smart Transition Planning ...........................................................................................20
Data Gaps .................................................................................................................21
CHAPTER 3: Residential and Commercial Sectors..............................................................22
Market and End-Use Characterization ...........................................................................22
Residential............................................................................................................................................... 22
Commercial ............................................................................................................................................. 24
Residential Versus Commercial .................................................................................................................... 25
New Construction Versus Retrofit ................................................................................................................. 26
End-User Barriers and Needs .......................................................................................26
Policy Barriers and Solutions........................................................................................28
Barriers................................................................................................................................................... 28

iv
Solutions ................................................................................................................................................. 31
Technical Barriers and Solutions ..................................................................................40
Barriers................................................................................................................................................... 41
Technical Solutions.................................................................................................................................... 46
Market Barriers and Solutions ......................................................................................48
Market Barriers......................................................................................................................................... 48
Market Solutions ....................................................................................................................................... 51
Cost Barriers and Solutions..........................................................................................52
Costs Barriers........................................................................................................................................... 53
Cost Solutions .......................................................................................................................................... 57
Data Gaps .................................................................................................................58
CHAPTER 4: Industrial and Agricultural Fuel Substitution ..................................................60
Market and End-Use Characterization ...........................................................................60
End-Use Barriers and Needs ........................................................................................63
Policy Barriers and Solutions........................................................................................66
Barriers................................................................................................................................................... 66
Solutions ................................................................................................................................................. 67
Technical Barriers and Solutions ..................................................................................69
Barriers................................................................................................................................................... 70
Solutions ................................................................................................................................................. 71
Cost Barriers and Solutions..........................................................................................72
Barriers................................................................................................................................................... 72
Solutions ................................................................................................................................................. 73
Data Gaps .................................................................................................................74
CHAPTER 5: Fuel Substitution Scenario Analysis Tool .......................................................76
Tool Description .........................................................................................................76
Tool Objectives and Scope ..........................................................................................78
Scope of FSSAT Capabilit ies ........................................................................................................................ 78
Analysis Framework....................................................................................................79
FSSAT Inputs ........................................................................................................................................... 80
FSSAT Outputs ......................................................................................................................................... 83
R Processes ............................................................................................................................................. 87
Scenario Definitions.................................................................................................. 105
Scenario Tool Results ............................................................................................... 107
Abatement Cost Curves............................................................................................. 115
Alignment of the Definition of Costs............................................................................................................ 116
Abatement Curves Results and Analysis ....................................................................................................... 117
Hourly Demand and Emissions................................................................................... 121
Hourly Analysis Results ............................................................................................................................ 122
Future Research....................................................................................................... 124
APPENDIX A: Utility and Customer Fuel Substitution Costs.................................................. 1

v
Utility Costs ................................................................................................................ 1
Customer Costs ..........................................................................................................................................4
Life-Cycle Customer Costs ............................................................................................................................9
APPENDIX B: Electrification Incentive Pathways ................................................................ 1
APPENDIX C: Industrial and Agricultural Technologies........................................................ 1
Fuel Substitution Opportunities by Segment ................................................................... 1
Select Fuel Substitution Technologies ............................................................................ 1
Mechanical Dewatering ................................................................................................................................2
Heat Pump Drying.......................................................................................................................................2
Large-Scale Industrial Heat Pump ..................................................................................................................3
Ohmic Heating ...........................................................................................................................................4
Induction Heating of Liquids..........................................................................................................................5
Gas Boiler vs. Electric Boilers ........................................................................................ 6
Steam Turbine Drive vs. Electric Motor Drive .................................................................. 7
Solar Air Heating ......................................................................................................... 7
UV Pasteurization ........................................................................................................ 8
Ozone Cleaning........................................................................................................... 9
APPENDIX D: Building Climate Zone to Forecasting Climate Zone ........................................ 1
APPENDIX E: Building Stock Description ........................................................................... 1
APPENDIX F: Fuel Substitution Technology Characterization ............................................... 1
Characterization Method .............................................................................................. 1
Residential and Commercial Natural Gas Technology ..........................................................................................1
Residential and Commercial Electric Environment ..............................................................................................5
Agricultural and Industrial Natural Gas and Electric Consumption Baseline ............................................................ 11
Agricultural and Industrial Electric Replacement .............................................................................................. 11
Data Sources .............................................................................................................12
APPENDIX G: Fuel Substitution Load Shapes ..................................................................... 1
Background ................................................................................................................ 1
Fuel Substitution Load Shapes ...................................................................................... 1
Load Shape Development Standard Methods ....................................................................................................2
ADM Load Shapes .......................................................................................................................................3
2017 Navigant AAEE Load Shapes ..................................................................................................................4
California Building Energy Code Compliance Heat Pump Load-Shape Development ............. 4
Climate Zone Selection.................................................................................................................................5
Residential Heat Pump Model Parameters ........................................................................................................5
Commercial Heat Pump Model Parameters .......................................................................................................7
APPENDIX H: Hourly Impacts Method .............................................................................. 1
Hourly Impacts Segmentation and Mapping ................................................................... 1
Segmentation.............................................................................................................................................1
Tool Inputs, Calculations, and Outputs .......................................................................... 3
vi
Hourly Impacts Tool Inputs...........................................................................................................................4
Hourly Impacts Tool Calculations ...................................................................................................................4
Hourly Impacts Tool Outputs.........................................................................................................................5
APPENDIX I: Glossary ................................................................................................... 1
APPENDIX J: Reference List ............................................................................................ 1
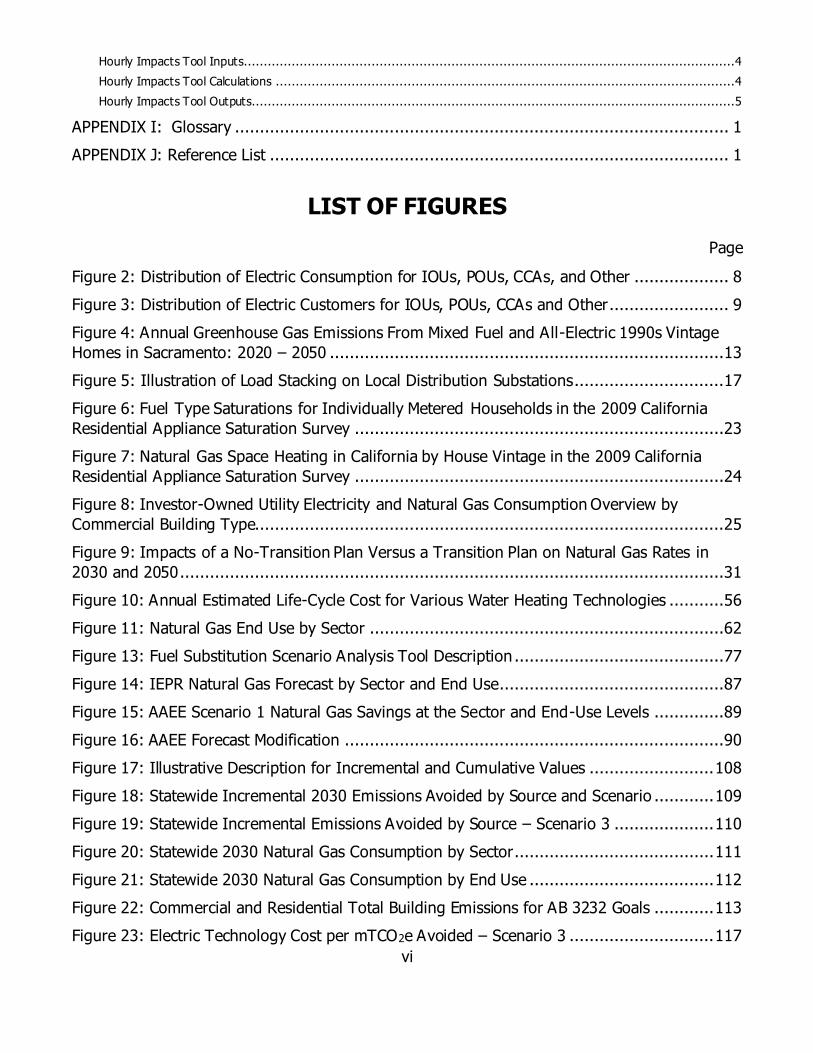
LIST OF FIGURES
Page
Figure 2: Distribution of Electric Consumption for IOUs, POUs, CCAs, and Other ................... 8
Figure 3: Distribution of Electric Customers for IOUs, POUs, CCAs and Other ........................ 9
Figure 4: Annual Greenhouse Gas Emissions From Mixed Fuel and All-Electric 1990s Vintage
Homes in Sacramento: 2020 – 2050 ...............................................................................13
Figure 5: Illustration of Load Stacking on Local Distribution Substations ..............................17
Figure 6: Fuel Type Saturations for Individually Metered Households in the 2009 California
Residential Appliance Saturation Survey ..........................................................................23
Figure 7: Natural Gas Space Heating in California by House Vintage in the 2009 California
Residential Appliance Saturation Survey ..........................................................................24
Figure 8: Investor-Owned Utility Electricity and Natural Gas Consumption Overview by
Commercial Building Type..............................................................................................25
Figure 9: Impacts of a No-Transition Plan Versus a Transition Plan on Natural Gas Rates in
2030 and 2050 .............................................................................................................31
Figure 10: Annual Estimated Life-Cycle Cost for Various Water Heating Technologies ...........56
Figure 11: Natural Gas End Use by Sector .......................................................................62
Figure 13: Fuel Substitution Scenario Analysis Tool Description ..........................................77
Figure 14: IEPR Natural Gas Forecast by Sector and End Use.............................................87
Figure 15: AAEE Scenario 1 Natural Gas Savings at the Sector and End-Use Levels ..............89
Figure 16: AAEE Forecast Modification ............................................................................90
Figure 17: Illustrative Description for Incremental and Cumulative Values ......................... 108
Figure 18: Statewide Incremental 2030 Emissions Avoided by Source and Scenario ............ 109
Figure 19: Statewide Incremental Emissions Avoided by Source – Scenario 3 .................... 110
Figure 20: Statewide 2030 Natural Gas Consumption by Sector ........................................ 111
Figure 21: Statewide 2030 Natural Gas Consumption by End Use ..................................... 112
Figure 22: Commercial and Residential Total Building Emissions for AB 3232 Goals ............ 113
Figure 23: Electric Technology Cost per mTCO2e Avoided – Scenario 3 ............................. 117

vii
Figure 24: 2020–2045 Cumulative Emissions Avoided by Technology – Scenario 3 ............. 118
Figure 25: 2020-2045 Cumulative Marginal Abatement Curve by Technology – Scenario 3 .. 119
Figure 26: 2030 Incremental Emissions Avoided by Technology – Scenario 3 ..................... 120
Figure 27: 2030 Incremental Marginal Abatement Curve by Technology – Scenario 3 ......... 121
Figure 28: 2030 Hourly Added Electric Load on Summer Peak Day – Scenario 3 ................. 123
Figure 29: 2030 Hourly Added Electric Load on Winter Peak Day – Scenario 3 ................... 124
Figure A-1: Heat Pump vs. Natural Gas Furnace Lifetime Net-Present Cost Comparison
(Oakland, California) ...................................................................................................... 2
Figure D-1: California Forecasting and Building Climate Zones ............................................ 1
Figure D-2: California Forecasting and Building Climate Zone Overlap .................................. 2
Figure F-1: Illustration for Efficiency Saturation by Technology ........................................... 4
Figure H-1: Overall Hourly Impacts Tool Structure ............................................................. 4
Figure H-2: The Data and Calculation Flow of the Hourly Impacts Tool ................................ 5

viii
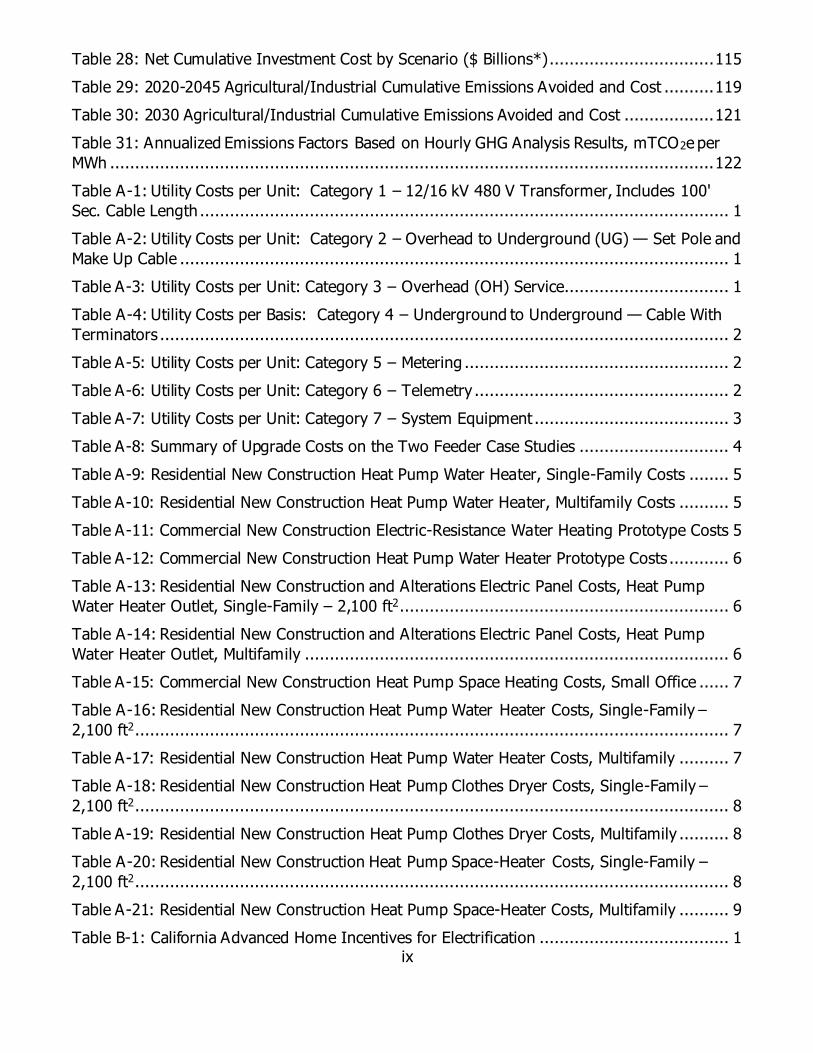
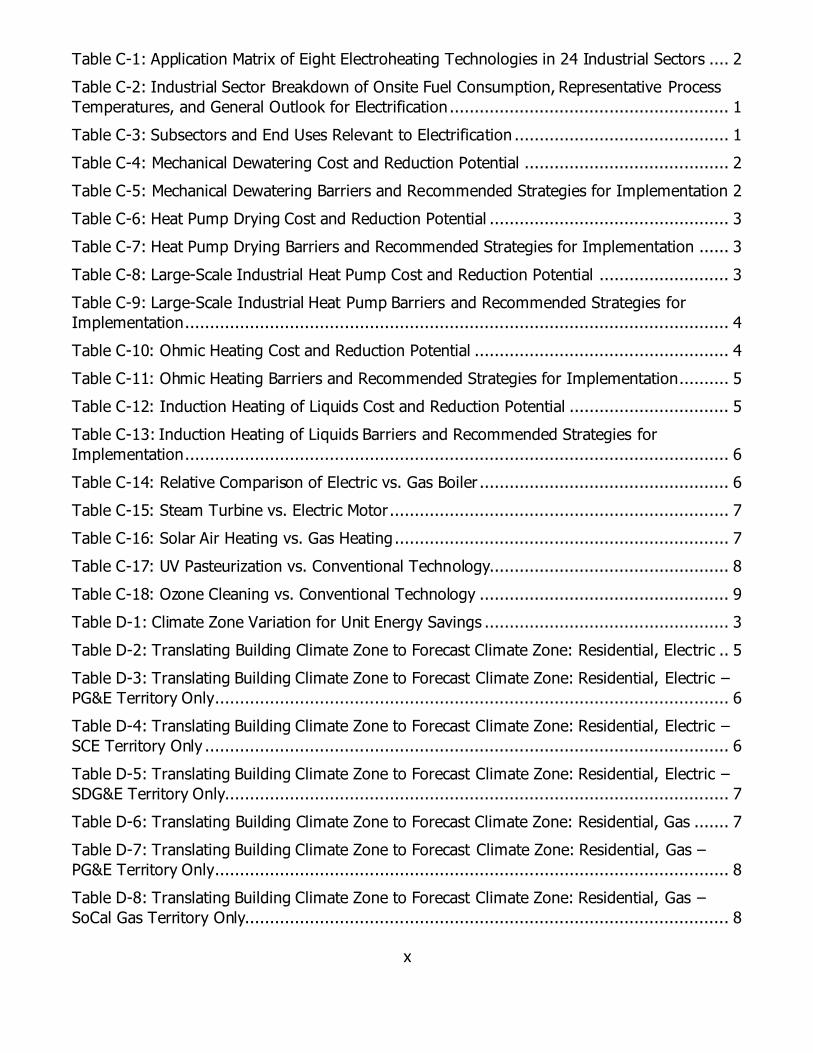
LIST OF TABLES
Page
Table 1: Residential and Commercial End-User Needs and Barriers .....................................26
Table 2: Summary of Advanced Energy Rebuild Incentive Offerings....................................38
Table 3: Status of California Jurisdictions Adoption of Legislation Regarding Fuel Substitution
(as of August 2019) ......................................................................................................40
Table 4: Agricultural Electricity and Natural Gas Consumption by Segment: 2017 .................60
Table 5: Industrial Electricity and Natural Gas Consumption by Segment: 2017....................61
Table 6: Industrial and Agriculture Electricity and Natural Gas End Uses..............................62
Table 7: Industrial End-User Needs and Barriers...............................................................64
Table 8: FSSAT Global Inputs .........................................................................................80
Table 9: FSSAT Technology Characterization Inputs..........................................................81
Table 10: FSSAT User-Defined Inputs .............................................................................82
Table 11: FSSAT Interim Output Data .............................................................................83
Table 12: FSSAT Final Output Data – Annual Consumption and Emissions ...........................83
Table 13: FSSAT Final Output Data – Costs......................................................................84
Table 14: FSSAT Final Output Data – Hourly Analysis (Detailed).........................................85
Table 15: Utility Disaggregation......................................................................................85
Table 16: Fuel Substitution End-Use Description ...............................................................86
Table 17: IEPR Disaggregation Forecast Inputs, Outputs, and Assumptions .........................88
Table 18: Modify AAEE Forecast Inputs, Outputs, and Assumptions ....................................91
Table 19: Example Electric Load Increase From Fuel Substitution – Electrification of Gas Load
..................................................................................................................................94
Table 20: Example Electric Load Increase from Fuel Substitution – Added Cooling................96
Table 21: Default 100-Year Global Warming Potentials in FSSAT ...................................... 100
Table 22: Substitute Technologies Inputs, Outputs, and Assumptions ............................... 104
Table 23: FSSAT Scenario Input Variables .................................................................... 106
Table 24: Scenario Definition ....................................................................................... 107
Table 25: Commercial and Residential Building Emissions Progress to AB 3232 Goals (%
Change from 1990 Baseline) ........................................................................................ 114
Table 26: 2030 Electricity Consumption Added by Scenario (GWh) ................................... 114
Table 27: Cumulative Cost for Panel Upgrades ($ Billions) ............................................... 115
ix
Table 28: Net Cumulative Investment Cost by Scenario ($ Billions*) ................................. 115
Table 29: 2020-2045 Agricultural/Industrial Cumulative Emissions Avoided and Cost .......... 119
Table 30: 2030 Agricultural/Industrial Cumulative Emissions Avoided and Cost .................. 121
Table 31: Annualized Emissions Factors Based on Hourly GHG Analysis Results, mTCO2e per
MWh ......................................................................................................................... 122
Table A-1: Utility Costs per Unit: Category 1 – 12/16 kV 480 V Transformer, Includes 100'
Sec. Cable Length .......................................................................................................... 1
Table A-2: Utility Costs per Unit: Category 2 – Overhead to Underground (UG) — Set Pole and
Make Up Cable .............................................................................................................. 1
Table A-3: Utility Costs per Unit: Category 3 – Overhead (OH) Service ................................. 1
Table A-4: Utility Costs per Basis: Category 4 – Underground to Underground — Cable With
Terminators .................................................................................................................. 2
Table A-5: Utility Costs per Unit: Category 5 – Metering ..................................................... 2
Table A-6: Utility Costs per Unit: Category 6 – Telemetry ................................................... 2
Table A-7: Utility Costs per Unit: Category 7 – System Equipment ....................................... 3
Table A-8: Summary of Upgrade Costs on the Two Feeder Case Studies .............................. 4
Table A-9: Residential New Construction Heat Pump Water Heater, Single-Family Costs ........ 5
Table A-10: Residential New Construction Heat Pump Water Heater, Multifamily Costs .......... 5
Table A-11: Commercial New Construction Electric-Resistance Water Heating Prototype Costs 5
Table A-12: Commercial New Construction Heat Pump Water Heater Prototype Costs ............ 6
Table A-13: Residential New Construction and Alterations Electric Panel Costs, Heat Pump
Water Heater Outlet, Single-Family – 2,100 ft2 .................................................................. 6
Table A-14: Residential New Construction and Alterations Electric Panel Costs, Heat Pump
Water Heater Outlet, Multifamily ..................................................................................... 6
Table A-15: Commercial New Construction Heat Pump Space Heating Costs, Small Office ...... 7
Table A-16: Residential New Construction Heat Pump Water Heater Costs, Single-Family –
2,100 ft2 ....................................................................................................................... 7
Table A-17: Residential New Construction Heat Pump Water Heater Costs, Multifamily .......... 7
Table A-18: Residential New Construction Heat Pump Clothes Dryer Costs, Single-Family –
2,100 ft2 ....................................................................................................................... 8
Table A-19: Residential New Construction Heat Pump Clothes Dryer Costs, Multifamily .......... 8
Table A-20: Residential New Construction Heat Pump Space-Heater Costs, Single-Family –
2,100 ft2 ....................................................................................................................... 8
Table A-21: Residential New Construction Heat Pump Space-Heater Costs, Multifamily .......... 9
Table B-1: California Advanced Home Incentives for Electrification ...................................... 1
x
Table C-1: Application Matrix of Eight Electroheating Technologies in 24 Industrial Sectors .... 2
Table C-2: Industrial Sector Breakdown of Onsite Fuel Consumption, Representative Process
Temperatures, and General Outlook for Electrification ........................................................ 1
Table C-3: Subsectors and End Uses Relevant to Electrification ........................................... 1
Table C-4: Mechanical Dewatering Cost and Reduction Potential ......................................... 2
Table C-5: Mechanical Dewatering Barriers and Recommended Strategies for Implementation 2
Table C-6: Heat Pump Drying Cost and Reduction Potential ................................................ 3
Table C-7: Heat Pump Drying Barriers and Recommended Strategies for Implementation ...... 3
Table C-8: Large-Scale Industrial Heat Pump Cost and Reduction Potential .......................... 3
Table C-9: Large-Scale Industrial Heat Pump Barriers and Recommended Strategies for
Implementation ............................................................................................................. 4
Table C-10: Ohmic Heating Cost and Reduction Potential ................................................... 4
Table C-11: Ohmic Heating Barriers and Recommended Strategies for Implementation.......... 5
Table C-12: Induction Heating of Liquids Cost and Reduction Potential ................................ 5
Table C-13: Induction Heating of Liquids Barriers and Recommended Strategies for
Implementation ............................................................................................................. 6
Table C-14: Relative Comparison of Electric vs. Gas Boiler .................................................. 6
Table C-15: Steam Turbine vs. Electric Motor .................................................................... 7
Table C-16: Solar Air Heating vs. Gas Heating ................................................................... 7
Table C-17: UV Pasteurization vs. Conventional Technology................................................ 8
Table C-18: Ozone Cleaning vs. Conventional Technology .................................................. 9
Table D-1: Climate Zone Variation for Unit Energy Savings ................................................. 3
Table D-2: Translating Building Climate Zone to Forecast Climate Zone: Residential, Electric .. 5
Table D-3: Translating Building Climate Zone to Forecast Climate Zone: Residential, Electric –
PG&E Territory Only ....................................................................................................... 6
Table D-4: Translating Building Climate Zone to Forecast Climate Zone: Residential, Electric –
SCE Territory Only ......................................................................................................... 6
Table D-5: Translating Building Climate Zone to Forecast Climate Zone: Residential, Electric –
SDG&E Territory Only..................................................................................................... 7
Table D-6: Translating Building Climate Zone to Forecast Climate Zone: Residential, Gas ....... 7
Table D-7: Translating Building Climate Zone to Forecast Climate Zone: Residential, Gas –
PG&E Territory Only ....................................................................................................... 8
Table D-8: Translating Building Climate Zone to Forecast Climate Zone: Residential, Gas –
SoCal Gas Territory Only................................................................................................. 8

xi
Table D-9: Translating Building Climate Zone to Forecast Climate Zone: Residential, Gas –
SDG&E Territory Only..................................................................................................... 9
Table D-10: Translating Building Climate Zone to Forecast Climate Zone: Commercial, Electric 9
Table D-11: Translating Building Climate Zone to Forecast Climate Zone: Commercial, Electric
– PG&E Territory Only ...................................................................................................10
Table D-12: Translating Building Climate Zone to Forecast Climate Zone: Commercial, Electric
– SCE Territory Only .....................................................................................................11
Table D-13: Translating Building Climate Zone to Forecast Climate Zone: Commercial, Electric
– SDG&E Territory Only .................................................................................................11
Table D-14: Translating Building Climate Zone to Forecast Climate Zone: Commercial, Gas ...12
Table D-15: Translating Building Climate Zone to Forecast Climate Zone: Commercial, Gas –
PG&E Territory Only ......................................................................................................13
Table D-16: Translating Building Climate Zone to Forecast Climate Zone: Commercial, Gas –
SoCal Gas Territory Only................................................................................................14
Table D-17: Translating Building Climate Zone to Forecast Climate Zone: Commercial, Gas –
SDG&E Territory Only....................................................................................................14
Table D-18: Translating Building Climate Zone to Forecast Climate Zone: Industrial, Electric 15
Table D-19: Translating Building Climate Zone to Forecast Climate Zone: Agricultural, Electric
..................................................................................................................................16
Table D-20: Translating Building Climate Zone to Forecast Climate Zone: Industrial, Gas ......17
Table D-21: Translating Building Climate Zone to Forecast Climate Zone: Agricultural, Gas...18
Table E-1: Integrated Energy Policy Report Characterized Building Stock by Sector and
Building Type ................................................................................................................ 1
Table F-1: Residential Natural Gas Technology List ............................................................ 2
Table F-2: Commercial Natural Gas Technology List ........................................................... 2
Table F-3: Key Metrics for Measure Characterization .......................................................... 3
Table F-4: Sources for Potential and Goals Study Density and Saturation Characterization...... 4
Table F-5: Residential Electric Technologies ...................................................................... 5
Table F-6: Commercial Electric Technologies ..................................................................... 6
Table F-7: Residential and Commercial Electric Technology Performance Metrics ................... 8
Table F-8: Method for Developing Overhead and Profit Costs .............................................. 9
Table F-9: Performance Curve Residential Heat Pump Technology List ................................10
Table F-10: Performance-Curve Commercial Heat Pump Technology List .............................10
Table F-11: High-Impact Agricultural and Industrial End Uses Selected for Characterization ..11
Table F-12: Data Sources by Technology .........................................................................12

xii
Table G-1: Load Shape List by Sector and End Use ............................................................ 1
Table G-2: Representative Climate Zone(s) by Utility ......................................................... 5
Table G-3: Envelope Metrics for Residential Average Existing Building Model ........................ 6
Table G-4: Envelope Metrics for Commercial Code-Compliant Building Model ........................ 7
Table H-1: AAEE Hourly Impacts Segmentation ................................................................. 1
Table H-2: IOU to POU Map ............................................................................................ 3

1
EXECUTIVE SUMMARY
Mandated by law, the California Energy Commission (CEC) must assess the potential for the
state to reduce greenhouse gas (GHG) emissions from residential and commercial buildings by
at least 40 percent below 1990 levels by 2030. Also mandated by law, the CEC must set
annual targets to double energy efficiency savings by 2030. One method the state will use to
achieve the targets in these two mandates is by removing GHG emissions from the building
energy sources (known as decarbonizing buildings) through fuel substitution.
“Fuel substitution” in this study is defined as the replacement of natural gas by electricity as
the source of energy in California’s buildings and appliances. As low-carbon renewable energy
generation grows in California, it reduces the rate of GHG emissions of electricity generation in
the state. At a certain point, using electricity to generate heat (for space heating, water
heating, industrial processes, cooking, and so forth) becomes less carbon intensive than
directly burning fossil fuel based natural gas for those same purposes.
While fuel substitution offers GHG savings, it has other implications as well. Increased use of
electricity may result in an increase in electric generation capacity needed. It also means
additional costs for equipment and installation that must be borne by building owners or state
programs. Therefore, it is important to understand how fuel substitution affects California as a
whole. This responsibility falls a multitude of entities, including the CEC.
Study Scope/Objective
The CEC contracted Guidehouse (the research team) to address its need for a clearer
understanding of the impacts of fuel substitution. The research team was tasked with
developing an analytic framework that identifies the barriers and opportunities of fuel
substitution and creates an initial assessment of opportunities to reduce GHG emissions. More
specifically, the research team was tasked with:
Reviewing the policy, technical, and cost barriers to fuel substitution across various
sectors and end uses (the energy consumed by the user and defined by the designated
function for ultimate use — for example, space and water heating) and discussing
possible solutions.
Analyzing implications for the utility customer and utility infrastructure.
Characterizing fuel substitution technologies including costs, energy use/savings,
performance attributes, and hourly energy use profiles.
Developing a Fuel Substitution Scenario Analysis Tool (the tool), a software tool that
implements a framework to assess the following impacts of fuel substitution on the five
largest California electric utilities: decreased natural gas use, increased electricity use,
emissions impacts, and cost implications.
Using the tool to analyze the effect of fuel substitution under three CEC defined
scenarios on an annual basis from 2020 to 2030
Using the results of the tool to develop emissions graphs that show the estimate of the
volume and costs of opportunities to reduce GHG emissions (known as abatement cost
curves) for fuel substitution technologies that could be compared to other emissions
2
reduction strategies identified by the California Air Resource Board’s AB 32 Scoping
Plan. The scoping plan describes the approach California will take to achieve the goal of
reducing GHG emissions to 1990 levels by 2020.
Training CEC staff on using the tool.
The product of this study is the tool itself. As such the research team and CEC staff placed
highest priority on designing a flexible, functional tool that can be updated/enhanced by CEC
staff. Initial results presented in this report are meant to be viewed as preliminary and
illustrative. Results found in this report should not be used to inform policy or be interpreted
by stakeholders as the CEC’s definitive forecast for fuel substitution. Rather, CEC staff should
conduct its own scenarios analysis using the tool and share results with stakeholders before
policy decisions are made.
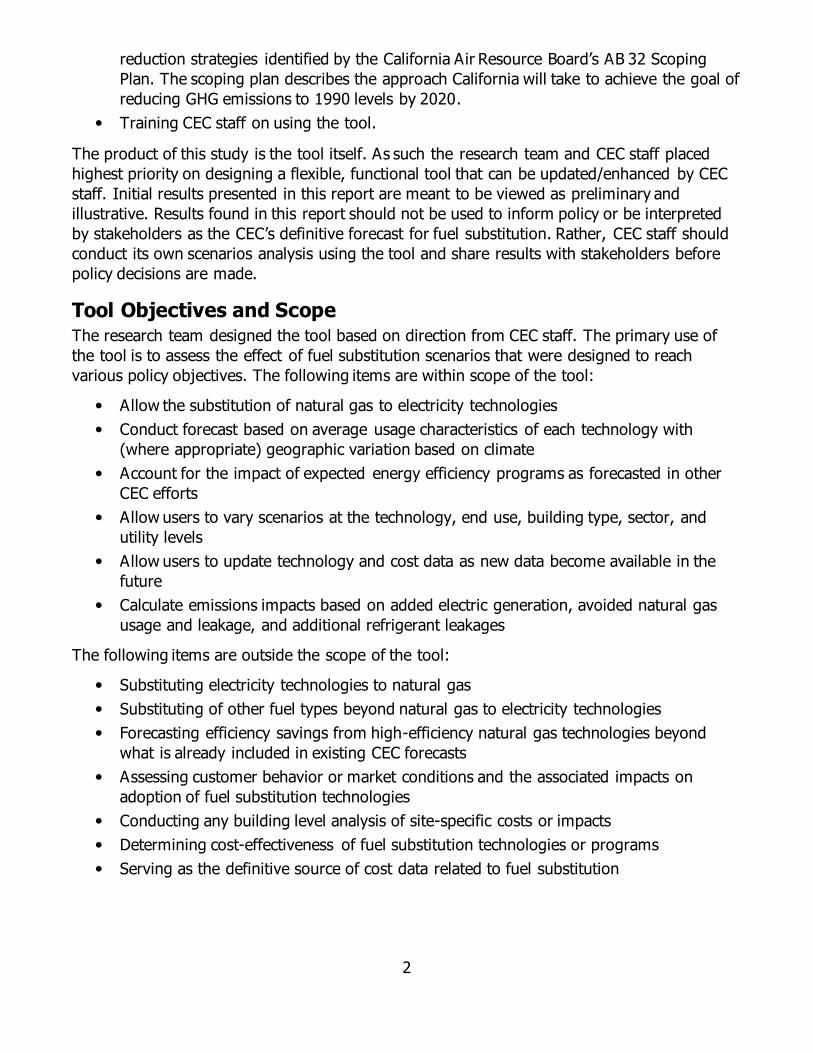
Tool Objectives and Scope The research team designed the tool based on direction from CEC staff. The primary use of
the tool is to assess the effect of fuel substitution scenarios that were designed to reach
various policy objectives. The following items are within scope of the tool:
Allow the substitution of natural gas to electricity technologies
Conduct forecast based on average usage characteristics of each technology with
(where appropriate) geographic variation based on climate
Account for the impact of expected energy efficiency programs as forecasted in other
CEC efforts
Allow users to vary scenarios at the technology, end use, building type, sector, and
utility levels
Allow users to update technology and cost data as new data become available in the
future
Calculate emissions impacts based on added electric generation, avoided natural gas
usage and leakage, and additional refrigerant leakages
The following items are outside the scope of the tool:
Substituting electricity technologies to natural gas
Substituting of other fuel types beyond natural gas to electricity technologies
Forecasting efficiency savings from high-efficiency natural gas technologies beyond
what is already included in existing CEC forecasts
Assessing customer behavior or market conditions and the associated impacts on
adoption of fuel substitution technologies
Conducting any building level analysis of site-specific costs or impacts
Determining cost-effectiveness of fuel substitution technologies or programs
Serving as the definitive source of cost data related to fuel substitution

3
Organization of This Report This report is structured as follows
Chapter 1 provides policy background on the topic of fuel substitution.
Chapter 2 discusses the implications for customers, public safety, and utility
infrastructure in a future with increasing fuel substitution. This discussion includes a
review and summary the literature available to date, identification of gaps in the
research available, and recommendations for future research.
Chapter 3 provides the research team’s findings related to the policy, technical, and
cost barriers associated with fuel substitution for major end uses in the residential and
commercial sectors.
Chapter 4 provides the research team’s findings related to the policy, technical, and
cost barriers associated with fuel substitution for major end uses in the industrial and
agricultural sectors.
Chapter 5 describes the Fuel Substitution Scenario Analysis Tool, including the detailed
scope, analysis methods, input data, and scenario capabilities. It also provided example
output graphics/results.
Appendices provide additional details from the team’s literature reviews and
documentation of the team’s methods and input assumptions.

4

5
CHAPTER 1:
Background
Senate Bill (SB) 350 (De León, Chapter 547, Statutes of 2015)1 directed the California Energy
Commission (CEC) to establish energy efficiency targets that achieve a statewide, cumulative
doubling of energy efficiency savings by 2030. The SB 350 Energy Efficiency Report2 forecast
of energy efficiency savings included potential savings from utility programs, codes and
standards, and a set of beyond-utility programs — that is, programs and initiatives that may
contribute to reduced energy use throughout the state that occur beyond any reported utility
program savings. One of these programs included savings estimates from fuel substitution —
specifically moving from natural gas to electricity — as a beyond-utility program.
Fuel substitution opportunities exist in residential, commercial, agricultural, and industrial
sectors across various end uses,3 but the opportunity is not uniform because the use of natural
gas and electric appliances/systems differs among these sectors. CEC staff directed this study
to define fuel substitution as replacing gas technologies with electric technologies. In
buildings, the primary gas end uses are space heating, water heating, and appliances such as
clothes dryers and cooktops. For the industrial and agricultural sectors, the primary gas end
use is process heating, which is the thermal energy used to prepare or treat materials for
production. This report looks at all sectors and evaluates the potential barriers and
opportunities for fuel substitution in new construction and retrofits.
Assembly Bill (AB) 3232 (Friedman, Chapter 373, Statutes of 2018)4 mandates the CEC assess
the potential to reduce greenhouse gas (GHG) emissions to 40 percent below 1990 levels in
residential and commercial buildings by 2030. More broadly, the Legislature has mandated
through Senate Bill 32 (Pavley, Chapter 249, Statutes of 2016) that the California Air
Resources Board (CARB) reduce statewide GHG emissions to at least 40 percent below the
1990 emissions level by 2030.5 The SB 350 statewide energy efficiency doubling target
considers natural gas and electricity final end uses and includes possible energy savings from
the agricultural and industrial sectors. CEC staff needs to assess numerous aspects of building
decarbonization and compile that information into a combined SB 350 and AB 3232 action plan
and future reporting. This action plan will include:
Information on setting a 2030 GHG emissions target.
1 Senate Bill No. 350. De Leon, Clean Energy and Pollution Reduction Act of 2015, Chapter 547, Statutes of 2015.
2 Navigant Consulting, Inc. January 2020. Senate Bill 350 Doubling Energy Savings by 2030 Method Report, prepared for California Energy Commission.
3 “End use” is the energy consumed by the user and defined by the designated function for ultimate use. For
example, a gas furnace is used for the heating end use.
4 Assembly Bill No. 3232. Friedman, Zero-Emissions Building and Sources of Heat Energy, Chapter 373, Statutes
of 2018.
5 Senate Bill No. 32. Pavley, California Global Warming Solutions Act of 2006: Emissions Limit. Chapter 249,
Statutes of 2016.

6
Research on fuel substitution technologies, costs, and potential barriers.
Identification of possible grid impacts of building decarbonization — in other words,
removing GHG emissions from the building energy sources.
The California Public Utilities Commission (CPUC) is implementing fuel substitution activities to
comply with Senate Bill 1477 (Stern, Chapter 378, Statutes of 2018).6
Because many state and local initiatives are driving the state toward aggressive
decarbonization goals and GHG emissions reductions, the CEC requested a study that analyzes
the full potential of fuel substitution to meet policy goals. However, fuel substitution requires
an increase in overall electricity consumption and may result in an increase in the electric
generation capacity needed. It is important to understand how fuel substitution affects the
carbon emissions from California buildings as well as the carbon emissions resulting from
increased electric load. In the context of the recent legislation and understanding of the
barriers and potential solution, this study also developed a tool to allow the CEC to measure
the fuel substitution potential for GHG reductions and peak-demand grid impacts.
As a result, this report also documents the CEC scenario analysis for fuel substitution as a
strategy under AB 3232. In 2019, the CEC conducted a preliminary assessment of the relative
value and feasibility of substituting electricity for natural gas in residential and commercial
buildings.7 The CEC developed a tool that can assess annual and hourly natural gas and
electric load impacts at an end-use level. The CEC’s analysis became a starting point for
forecasting the amount and type of additional electrical generation resources that may be
needed to accommodate fuel substitution. The research team used the structure of the CEC’s
analysis to develop the framework of the fuel substitution scenario analysis tool (FSSAT)
described in this section. The FSSAT enhances the CEC’s ability to forecast GHG emissions,
electricity, natural gas, and cost impacts under various fuel substitution scenarios at the utility,
sector, and end-use levels.
This report reconciles SB 350 requirements with the CPUC ’s policy and rulemaking decisions,
including the fuel substitution test (formerly the “three-prong test”), program design, and the
effect on ratemaking processes. While this study did not evaluate of the benefits and market
changes achieved because of recent CPUC decisions, some electric publicly owned utilities
(POUs) started planning and implementing fuel substitution programs. Research on this topic
is ongoing across California. The research team attempted to assemble the most recent and
best available information and summarize the findings in this report as of September 20, 2019.
Appendix K includes a comprehensive list of the referenced data sources.
6 Senate Bill No. 1477. Stern, Low-emissions Buildings and Source of Heat Energy, Chapter 378, Statues of 2018.
7 Jaske, Michael. 2020. Fuel Substitution: An Exploratory Assessment of Electric Load Impacts, California Energy
Commission. <To be published>

7
CHAPTER 2:
Cross-Utility and Infrastructure Implications
This chapter discusses the implications for customers, public safety, and utility infrastructure in
a future with increasing fuel substitution. In the following sections, the research team reviews
and summarizes the literature available to date, identifies gaps in the research available, and
provides recommendations for future research in the following topic areas:
Customer experience when served by one or more utilities
o Overview of customers served by California utilities
o Requirements for electric and gas service
o Cost impacts
o Technology impacts
Public health and safety impacts
Gas utility impacts
o Gas costs and revenue
o Gas utility technology
Electric utility impacts
o Electric utility infrastructure upgrades
o Changing electric utility demand load shapes8
o Housing vintage stock and increased electric loads
Smart transition planning for consideration when launching high levels of fuel
substitution
Utility Customer Impacts
The research team analyzed the customer distribution across the use cases (in other words,
example of applicable situations) before identifying the specific needs and recommendations to
reduce barriers to fuel substitution. The specific combination of utilities serving the customers
of interest in this report are as follows:
An investor-owned utility (IOU) providing gas and electric service to the customer
Two IOUs providing separate gas and electric service
An IOU providing gas service to the customer while a POU provides electricity
8 A “load shape” is the annual normalized hourly contribution of energy use.

8
Overview of Customers Served by California Utilities
The service market for energy utilities in California consists primarily of IOUs and POUs.
Customers are also served by community choice aggregators (CCAs).9 The electric and natural
gas utility service areas are split across many different utilities. Overlapping utilities and
different regulatory structures lead to complications for fuel substitution. A sticking point is
that the CPUC regulates the IOUs, oversees certain elements of CCA operations, and does not
regulate California’s POUs; POUs are governed by their respective local governments or their
designees. This section discusses how customers can be served by different combinations of
IOUs and POUs. Figure 1 and Figure 2 break down the energy consumption and customer
allocation by each utility company type.
Figure 1: Distribution of Electric Consumption for IOUs, POUs, CCAs, and Other
IOUs, POUs, CCAs, and other utility entities serve the California market. IOUs are at 56
percent of the state electric consumption.
Source: Guidehouse analysis. Merged the average of CCA existing and projected values from CCA/IOU Load
Data Spreadsheet, August 2017 workbook and CEC’s 2018 statewide electricity consumption extract.
9 “Community choice aggregators” are local governments that procure power on behalf of their residents,
businesses, and municipal properties from a non-investor owned utility supplier.
IOU56%
CCA Estimate
9%
POU24%
Other11%
9
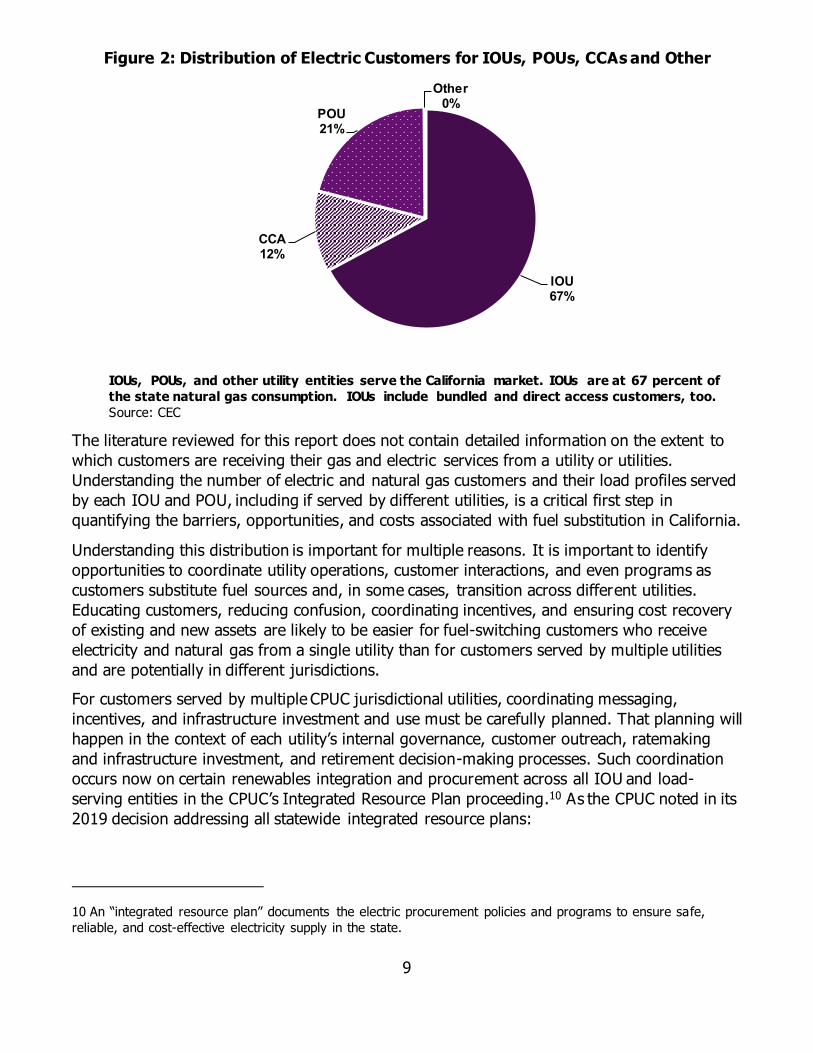
Figure 2: Distribution of Electric Customers for IOUs, POUs, CCAs and Other
IOUs, POUs, and other utility entities serve the California market. IOUs are at 67 percent of
the state natural gas consumption. IOUs include bundled and direct access customers, too.
Source: CEC
The literature reviewed for this report does not contain detailed information on the extent to
which customers are receiving their gas and electric services from a utility or utilities.
Understanding the number of electric and natural gas customers and their load profiles served
by each IOU and POU, including if served by different utilities, is a critical first step in
quantifying the barriers, opportunities, and costs associated with fuel substitution in California.
Understanding this distribution is important for multiple reasons. It is important to identify
opportunities to coordinate utility operations, customer interactions, and even programs as
customers substitute fuel sources and, in some cases, transition across different utilities.
Educating customers, reducing confusion, coordinating incentives, and ensuring cost recovery
of existing and new assets are likely to be easier for fuel-switching customers who receive
electricity and natural gas from a single utility than for customers served by multiple utilities
and are potentially in different jurisdictions.
For customers served by multiple CPUC jurisdictional utilities, coordinating messaging,
incentives, and infrastructure investment and use must be carefully planned. That planning will
happen in the context of each utility’s internal governance, customer outreach, ratemaking
and infrastructure investment, and retirement decision-making processes. Such coordination
occurs now on certain renewables integration and procurement across all IOU and load-
serving entities in the CPUC’s Integrated Resource Plan proceeding.10 As the CPUC noted in its
2019 decision addressing all statewide integrated resource plans:
10 An “integrated resource plan” documents the electric procurement policies and programs to ensure safe,
reliable, and cost-effective electricity supply in the state.
IOU67%
CCA12%
POU21%
Other0%
10
While local resource preferences may vary and should be respected to a degree,
ultimately the electricity grid must operate as a system. With more than 40
entities (and counting), the Commission is charged with evaluating whether
resource procurement by all of these entities collectively will result in a reliable
and affordable electric system that meets the GHG emissions reduction
requirements of state law and policy.11
If the gas and electric utilities serving a fuel substituting customer are in separate jurisdictions
(for example, provided gas service from an IOU regulated by the CPUC and electricity service
by a POU that is municipally regulated), planning and coordination are complicated as specific
regulatory and oversight requirements, goals, and timelines do not necessarily align across
jurisdictional boundaries.
Requirements for Electric and Gas Service When applying for new service or a change in current service, end users need to address the
following according to their situation:
New construction barriers to utility connection: Investigate any rules that bar
customers from applying for electric and not applying for gas by service territory.
Existing construction barriers to change in utility consumption: Investigate the
conditions to disconnect from gas service.
Connections between customer program incentives: For customers with service
from two utilities, does a customer have to receive services to access electric or fuel
substitution program incentives?
Cost Impacts
Changing the fuel use mix may result in upstream cost changes that affect the downstream
customer:12
Are there estimates for the magnitude of stranded costs for unused gas transmission,
distribution, or supply contracts that may be used less or underused if utility gas
demand decreases because of electrification? For example, identify the infrastructure
investments, supply contract, and operations and maintenance costs associated with
utility gas service.
What are the precedents for easing natural gas service exits or other fees for recovering
potential stranded natural gas system costs? Investigate parallels between fuel
substitution cost effects and:
o New solar adopters in Pacific Gas and Electric (PG&E) territory.
11 California Public Utilities Commission. D.19-04-040. Decision Adopting Preferred System Portfolio and Plan for
2017-2018 Integrated Resource Plan Cycle, p. 104.
12 Upstream refers to the utility side of fuel delivery versus the customer or end user who is downstream from
the fuel supply.
11
o Power charge indifference adjustment and other departing load charges.13
The recently adopted fuel substitution test14 addresses the program savings targets and
budgets as it relates to allocating funds between gas and electricity customers for
combined utilities — specifically for Southern California Edison (SCE) and Southern
California Gas (SoCal Gas).
Technology Impacts
To prioritize targeted fuel substitution promotions to certain end users, program designers
may rely on the immediate technical feasibility of changing technologies in specific segments.
The programs should identify segments and distribution of customers unable or unwilling to
implement fuel substitution and the effects on those customers:
Is there a segment of the gas customer base that it is operationally or technologically
impossible to switch from one fuel to another or for which it would be financially
infeasible (for example, a bakery that has gas ovens and would have to replace all
existing operational equipment)? If so, who are those customers, how many of them
are there, and what are their loads and load shapes?
Is there a segment of gas customers that is financially unable to implement fuel
substitution (for example, low-income customers)? The Building Initiative for Low-
Emissions Development (BUILD) program allocates at least 30 percent of funds to low-
income homes, as defined by SB 1477.15
Public Health and Safety Impacts Using less natural gas in the future decreases overall health and safety risks for customers.
Existing literature does not detail any safety concerns to eliminating gas infrastructure or any
increase in potential gas leaks. The safety discussion in this report is directed toward customer
gas use in homes. Heat pump water heaters, air-source heat pumps, and ground-
source/geothermal heat pumps are generally safer than gas-provided heating due to the lack
of indoor gas combustion.16 Generally, electrification at the site level decreases the risk for
accidental combustion. There will be safety concerns during fuel substitution technology
conversion, such as electric load increase to a home, if the electric panel is not sized properly.
These concerns will need to be carefully coordinated among utilities, contractors, and laborers,
especially when a customer receives gas and electric services from different sources.
Furthermore, burning natural gas in homes can result in poor indoor air quality by potential
13 Per the CPUC: “Public Utility Code Sections 366.1 and 366.2 require the CPUC to make sure that customers
leaving the utility do not burden remaining utility customers with costs which were incurred to serve them.”
14 California Public Utilities Commission. 2019. Decision Modifying The Energy Efficiency Three-Prong Test Related to Fuel Substitution.
15 The BUILD program provides incentives for using near-zero emissions technology to reduce GHG emissions in
new single-family and multifamily homes.
16 Confidential research Navigant conducted for a northeast utility.

12
exposure to nitrogen dioxide (which may induce asthma attacks) and particulate matter (under
investigation).17
Gas leakage is a health and safety concern with natural gas infrastructure. GHG emitted by
natural gas leakage takes the form of methane, which has a global warming potential 25 times
greater than carbon dioxide (CO2). A 1 percent leakage corresponds to a 9 percent effective
increase in GHG emissions per unit of gas burned. Alvarez et al. estimates that there is a
“national average leakage rate of 2.3 percent of consumption across the entire national natural
gas supply chain.”18 While California has more rigorous goals for decarbonization, the state still
imports roughly 90 percent19 of its natural gas; therefore, the national average leakage rate
provides better insight into the potential harm. California’s gas utilities’ systemwide leakage
rate in 2017 was 0.33 percent, far below the national average.20
A CEC-sponsored and Lawrence Berkeley National Laboratory (Berkeley Lab) led project from
2015 to 2018 studied methane emissions from whole-house leaks and unburned methane from
natural gas appliances. The study found an emissions rate of 0.5 percent from the residential
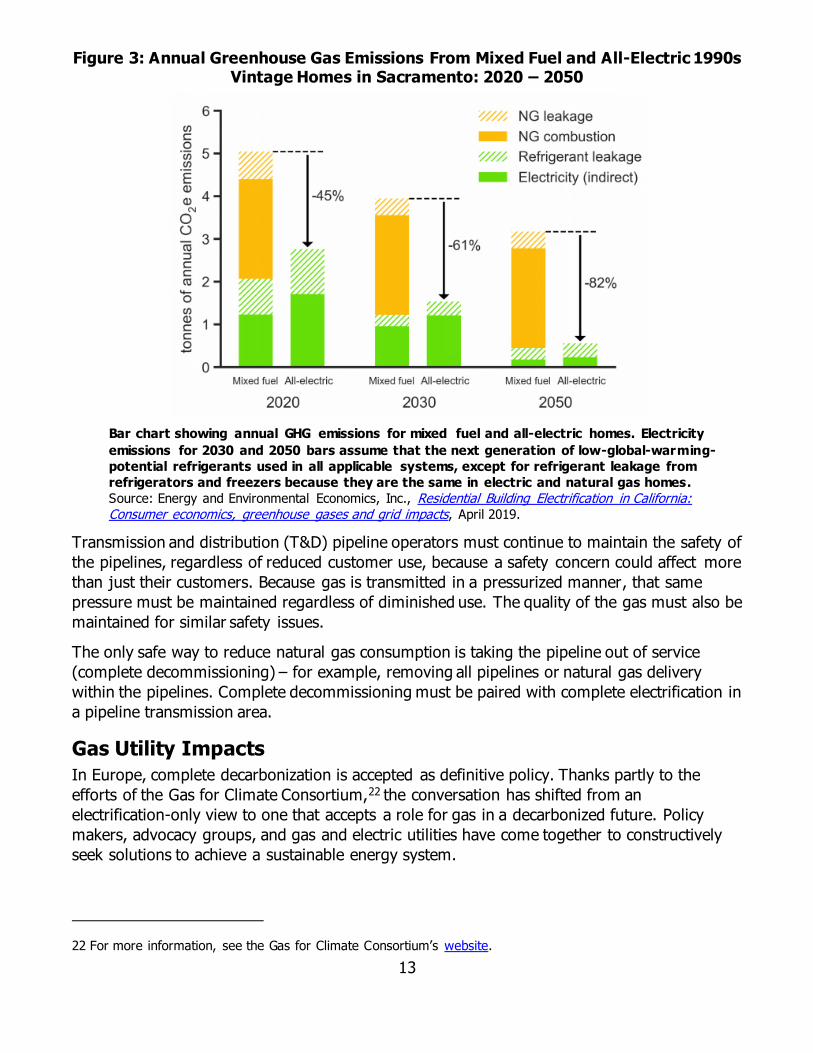
sector.21 Figure 3 shows projected changes in fuel leakage from Sacramento homes as the
building stock transitions to all-electric through 2050. The methane leakage rate will likely
continue as utilities maintain the gas infrastructure; as gas use and infrastructure decreases,
the leakage rate should also decrease, reducing GHG emissions.
17 California Energy Commission, “CEC Research on GHG impacts on the Natural Gas System,” presented August
27, 2019.
18 Alvarez, Ramon et al. July 2018. “Assessment of Methane Emissions From the U.S. Oil and Gas Supply Chain,”
Science, Vol. 361, no. 6398.
19 Energy and Environmental Economics, Inc. April 2019. Residential Building Electrification In California: Consumer Economics, Greenhouse Gases And Grid Impacts.
20 CPUC and CARB. January 2018. Analysis of the Utilities' June 16, 2017, Natural Gas Leak and Emission Reports.
21 California Energy Commission, “CEC Research on GHG impacts on the Natural Gas System,” presented on
August 27, 2019.
13
Figure 3: Annual Greenhouse Gas Emissions From Mixed Fuel and All-Electric 1990s Vintage Homes in Sacramento: 2020 – 2050
Bar chart showing annual GHG emissions for mixed fuel and all-electric homes. Electricity
emissions for 2030 and 2050 bars assume that the next generation of low-global-warming-
potential refrigerants used in all applicable systems, except for refrigerant leakage from
refrigerators and freezers because they are the same in electric and natural gas homes.
Source: Energy and Environmental Economics, Inc., Residential Building Electrification in California: Consumer economics, greenhouse gases and grid impacts, April 2019.
Transmission and distribution (T&D) pipeline operators must continue to maintain the safety of
the pipelines, regardless of reduced customer use, because a safety concern could affect more
than just their customers. Because gas is transmitted in a pressurized manner, that same
pressure must be maintained regardless of diminished use. The quality of the gas must also be
maintained for similar safety issues.
The only safe way to reduce natural gas consumption is taking the pipeline out of service
(complete decommissioning) – for example, removing all pipelines or natural gas delivery
within the pipelines. Complete decommissioning must be paired with complete electrification in
a pipeline transmission area.
Gas Utility Impacts
In Europe, complete decarbonization is accepted as definitive policy. Thanks partly to the
efforts of the Gas for Climate Consortium,22 the conversation has shifted from an
electrification-only view to one that accepts a role for gas in a decarbonized future. Policy
makers, advocacy groups, and gas and electric utilities have come together to constructively
seek solutions to achieve a sustainable energy system.
22 For more information, see the Gas for Climate Consortium’s website.

14
While alternatives to natural gas are being considered in other parts of the world, those
options are not discussed in this report. This section addresses only the move to electrification.
Gas Utility Cost and Revenue
With increased fuel substitution, the number of natural gas customers and the volume of
natural gas sold are likely to significantly decrease. However, gas-providing utilities will expect
to recover the costs of their prior investments and contracts in natural gas infrastructure and
supply. Further, even if natural gas customer demand decreases due to successful
electrification initiatives, the need for the utility to provide natural gas services for legacy end-
use customers that do not electrify is likely to be ongoing, at least in the next 10 years.
There are four primary cost components to providing natural gas service. These components
must be considered when evaluating the historical investments and contract costs utilities will
want to recover:
Commodity
Transmission
Storage
Distribution
The only variable costs in these components are the commodity costs (including gas
pressurization), which vary based on the volume sold and used by end users.
Natural gas transmission costs consist of two pieces:
Interstate gas transmission to the California border, regulated under Federal Energy
Regulatory Commission jurisdiction
Intrastate transmission pipeline costs
As a state operating under the Hinshaw Exemption,23 California exerts jurisdiction over the
regulation of all intrastate natural gas pipelines serving the state. Natural gas utilities reserve
capacity on interstate and intrastate natural gas pipelines on behalf of their residential and
small commercial and industrial customers (that is, the core customer base). These capacity
reservations often consist of a mix of long- and short-term contracts or reservations on the
intrastate and interstate pipelines; utility procurement designs these reservations to meet the
peak winter demands of the utility’s core customer base. Larger end-use customers, natural
gas-based generators, and aggregators (the noncore customer segment) make their own long-
and short-term natural gas transmission pipeline reservations, often based on their respective
peak demands.
Depending on the structure, the price and duration of these core and noncore customer
contracts differ for intrastate and interstate capacity reservation. Decreasing natural gas
demand may reduce the revenue from these sales over the long term and may be considered
a stranded contract utility cost over the short term in any fuel-switching scenario. Essentially,
pipeline (T&D costs) contracts are long-term and already-sunk costs for gas-providing utilities.
23 “NGA Hinshaw Pipelines,” General Information – Intrastate Transportation, Federal Energy Regulatory
Commission, last updated December 2, 2016.
15
The research team recommends identifying the terms of such contracts, to the extent
commercially available, as a factor in optimizing in any fuel-switching plan.
The literature does not directly discuss the future of gas corporations; rather, it focuses on
delegating gas connection costs. Energy and Environmental Economics suggests shifting the
costs of gas hookups to the builders to reduce cost increases to existing gas customers.24 To
date, the cost burden has been on the utility. Based on the literature and experts’ ideas, the
researchers made some inferences. Natural gas firms will want to maintain their revenue or, at
a minimum, recoup the costs of any stranded assets, but the dollars-per-unit volume will need
to increase because there will be less volume traveling through the pipelines.
Natural gas commodity gas costs are typically calculated and recovered separately from gas
infrastructure revenue requirements. Capital investments and ongoing maintenance of systems
are about equal.25 If the industry can reduce the costs of natural gas pipeline replacement and
expansion, there will still be a strong operations and maintenance component to maintain the
system for existing users and overall public safety for any natural gas service requirements
that remain. In some cases, systems will require replacement infrastructure for some
components deemed still useful as the systems age or become obsolete.
The mechanisms that gas utilities will use to recoup costs are unclear. The revenue loss for
the gas utilities will continue occur for the ongoing maintenance for system safety and delivery
to remaining customers. Implementing exit fees, passing on costs to other customers, and
continuing to bill exited customers are a few options for utilities. The experiences of direct
access utility customers26 and CCA end users provide guidance and ideas; other solutions may
exist.
Gas Utility Technology
One factor not addressed here is the possibility of gas utilities converting natural gas to
renewable natural gas or hydrogen. This topic is addressed in other studies — for example,
studies completed for SoCal Gas and the CEC.27
Electric Utility Impacts
Proponents of the electrification-only decarbonization pathway often focus on low-cost
renewables and the GHG emissions of natural gas. What is often missed is the cost to electrify
the entire energy system — including electric infrastructure upgrades, storage and other
resources required to support system reliability, and the costs associated with stranded natural
24 Energy and Environmental Economics, Inc. April 2019. Residential Building Electrification in California: Consumer Economics, Greenhouse Gases and Grid Impacts.
25 Energy and Environmental Economics, Inc. “Draft Results: Future of Natural Gas Distribution in California.”
CEC Staff Workshop for CEC PIER-16-011. June 6, 2019.
26 “Direct Access (DA) service is retail electric service where customers purchase electricity from a competitive
provider called an Electric Service Provider (ESP), instead of from a regulated electric utility. The utility delivers
the electricity that the customer purchases from the ESP to the customer over its distribution system.” California
Public Utilities Commission, California Direct Access Program, accessed February 2020.
27 Navigant Consulting, Inc. July 2018. Analysis of the Role of Gas for a Low-Carbon California Future; Energy
and Environmental Economics, Inc. “Draft Results: Future of Natural Gas Distribution in California.” CEC Staff
Workshop for CEC PIER-16-011. June 6, 2019.
16
gas assets (discussed in the prior section). Regulators and the market will also need to
address equity issues, as widespread electrification could have disproportionate effects on the
low-income demographic.
In reviewing the various elements affecting the electric distribution grid, researchers found
that electrification may or may not have a major impact at the local level. Distribution nodes
such as feeders have multiple triggers that may affect the ability of the grid to meet loads. In
allocating the costs and value of the potential changes to load on a distribution node, the
decision makers will need to assess the contribution of each item, including:
Percentage under capacity.
Scheduled upgrade due to aging infrastructure.
Grid modernization needs.
Distributed energy resources (DER)28 — photovoltaics (PV), electric vehicles (EVs),
energy storage — served by the feeder or on the receiving end.
End-use load types and sectors.
Wildfire management/prevention requirements.
Growth in fuel substitution.
Amount of available flexible load: Electrification adds to the potential revenue streams
of flexible loads, including the opportunity to grow the virtual power plant model.29 A
virtual power plant consists of aggregated and optimized distributed resources that
virtually provide the same service as a power plant. The more electrification occurs, the
more loads are available to support the virtual power plant model.
Fuel substitution is just one of many considerations distribution resource planners need to
account for when assessing infrastructure costs; fuel substitution may or may not be the
tipping point that affects actual costs. Utilities must analyze the costs and barriers of an
upgrade on a feeder-by-feeder basis.
Electric Utility Infrastructure Upgrades
The literature contained minimal information about the necessary infrastructure changes due
to increasing fuel substitution. Aside from natural load growth due to population growth,
multiple variables may affect the changes on the utility side of the meter. Figure 4 exhibits the
different variables that may affect the need to upgrade the utility side of the meter.
28 DER, as defined by the California Public Utilities Commission, are “distribution-connected distributed
generation resources, energy efficiency, energy storage, electric vehicles, and demand response technologies.”
California Public Utilities Commission. May 2017. California’s Distributed Energy Resources Action Plan: Aligning Vision and Action.
29 Tarbish, Herman K. ”Hollywood’s Next Star Could Be Virtual Power Plants as LADWP Closes Out Natural Gas,”
Utility Dive, August 13, 2019.

17
Figure 4: Illustration of Load Stacking on Local Distribution Substations
Illustration of the potential reduction and growth on the electrical system infrastructure
where the need to upgrade depends on the percent capacity of the distribution substation.
Source: Guidehouse
Figure 4 exhibits the variables that may affect system upgrades on the utility side of the meter
because of demand variations. Demand is not the only factor that drive grid-side updates. The
following factors may affect the need for an electric utility infrastructure upgrade:
Grid side
o Station nearing capacity
o Aged system
o Grid modernization plan
o Wildfire management improvement
Customer side
o Load mix (by sector and local population and business growth)
o Proliferation of distributed generation, for example, solar PV systems
o Availability of flexible loads
Storage
Demand response (DR)30
30 “Demand response” is a voluntary program that end users may participate in to reduce their electricity usage
during a period of higher prices.

18
o EVs
o Energy efficiency
o Electrification
Figure 4 also illustrates how conditions of each customer side factor listed can decrease or
increase the load on a substation. The effects of the changing demand would need to be
compared to the existing maximum load as well as the capacity of the substation. The
research team presents several hypothetical substations to illustrate how increased customer
side electrification may affect the grid:
Example A: Substation capacity far exceeds the current maximum load to the point
that load growth from electrification may not require a substation upgrade.
Example B: Substation capacity exceeds the current maximum load; electrification will
cause load growth that will exceed that capacity. However, customer-side DER may
counteract electrification such that substation upgrades may not be needed.
Example C: Substation capacity barely exceeds the current maximum load, and
electrification will cause load growth that will significantly exceed the capacity.
Customer-side DERs are not enough to counteract the load increase, requiring
substation upgrades.
Example D: The substation is scheduled for a capacity expansion tied to external
needs (grid modernization, resiliency hardening) regardless of fuel substitution.
Without appropriate data on actual capacity constraints and other factors not related to
electrification, researchers do not know what kinds of costs would affect various substations
because of widespread fuel substitution. Researchers can assume what percentage of feeders
exceed a certain threshold capacity and are in danger of not meeting load. However, they may
not be able to quantify the incremental cost associated with upgrading the feeder because of
fuel substitution or other reasons that may have triggered the need for an upgrade.
The actual electric utility infrastructure T&D upgrades needed will differ based on who owns
the channels since they are owned by various entities. Some POUs such as Palo Alto own their
transmission lines, while some use transmission lines owned by larger entities such as PG&E.
Major infrastructure changes may include larger wires and updated planning to accommodate
a winter peaking system, but these changes should not greatly alter the means of delivery.
Changing Electric Utility Demand Load Shapes
As fuel substitution proliferates, the load shape of combined consumption will change because
of the increased contribution from heating, cooling, and water heating shapes. One example
includes the penetration of space cooling where no air conditioning was present and space
heating is electric in the place of natural gas. A Berkeley Lab electrification study31 states that
incremental electrification changes within specific buildings are unlikely to affect the grid;
however, extensive changes to large industrial plants or an accumulation of smaller changes
within a major city could require distribution system upgrades — and, in the long run,
31 Lawrence Berkeley National Laboratory. March 2018. Electrification of Buildings and Industry in the United States: Drivers, Barriers, Prospects, and Policy Approaches.

19
transmission system upgrades. The change to electric heating systems in regions lacking large
air-conditioning loads such as San Francisco could trigger a new winter and summer peak
period, subsequently requiring local distribution upgrades to meet these new peak loads.
These upgrades have long lifetimes, which means they will be operating in 2050 when electric
power producers may be required to reduce GHG emissions by 80 percent.32 Section Hourly
Demand and Emissions include the hourly analysis results from the FSSAT to forecast potential
grid impacts. Figure 26 and Figure 27 provides hourly peak impacts for the summer and winter
peak due to fuel substitution. Because of increased heat pump penetration, winter morning
electricity spikes from electric heating are expected to occur.
Service Upgrades
An Energy and Environmental Economics study described infrastructure costs incurred by the
builders of new construction but did not consider utility infrastructure costs. The study implies
that the builders would incur capital cost savings, but if the study included utility costs in the
cost-effectiveness analysis, “the capital cost savings for all-electric new construction would
likely be significantly larger.”33 The electrical panel capacity of most commercial buildings can
accommodate increased electric loads, and the most likely needed update is increasing circuit
capacity.
Comments during the CEC’s Zero Emission Buildings workshop34 highlight how California’s Title
24 Building Energy Code does not require that gas infrastructure be cost-effective, as is done
with all newly adopted measures. Gas and electricity service connections have always been
assumed as no-cost in Title 24. A commenter suggested that amendments to California’s Title
24 Building Energy Code include the cost of gas infrastructure to allow appropriate burdening
of costs and allow holistic comparisons to the baseline requirements, highlighting the effects of
gas versus electric infrastructure in new construction. The comments suggest an electric
infrastructure upgrade rather than replacing gas infrastructure once pipelines reach the end of
useful life.
Housing Vintage Stock and Increased Electric Loads
Many older homes will require upgrades to infrastructure to accommodate fuel substitution.
Many of these homes are inhabited by lower-income and disadvantaged California residents,
so policies, programs, and incentives should be targeted toward those customers to make
electrification upgrades accessible to all California residents. Understanding where the fuel
substitution penetration may occur and how it may affect the grid locally is important. In
planning for targeted electrification, the utility must consider the implications for delivering
32 Energy and Environmental Economics, Inc. April 2019. Residential Building Electrification in California: Consumer Economics, Greenhouse Gases and Grid Impacts.
33 Ibid.
34 “Presentations – June 14, 2018, IEPR Commissioner Workshop on Achieving Zero Emission Buildings,”
California Energy Commission, accessed August 2019.
20
more power in areas where delivery was previously lower than average for similar building
stock.
The CPUC has a stated directive to focus on disadvantaged communities to encourage
widespread participation but has not defined the details of these programs.35 POUs have
developed their own rebates and incentive programs to encourage broader electrification. The
programs include rebates for heat pump installations and solar water heaters, among other
measures. The Sacramento Municipal Utility District (SMUD), for example, developed rebates
for electric water heaters, sealing and insulating programs, and gas-to-electric conversion.36
Pre-1978 vintage homes with 60 amperes (A) or 100 A service may require upgrades to 200 A.
Specifically, homes with 60 A or 100 A service that have central air conditioning or a heat
pump (a small proportion of homes) will likely require an upgrade. While most studies state
the difficulty in determining the precise number of existing homes that fit these criteria, the
California Residential Appliance Saturation Study37 estimates that roughly one-third of homes
in California have no central air conditioning and were built before 1982. A Navigant (now
Guidehouse) report for an IOU assumes 50 percent of California homes will need a 200 A
panel upgrade; however, the report does not provide a basis for this estimate.38
Smart Transition Planning Several reports and studies recommend smart transition planning as key to fuel substitution to
minimize the impacts to the gas and electrical infrastructure. In a Gridworks report, several
strategies are outlined to help achieve this transition plan:
“Initiate interagency, integrated long-term planning for gas demand,
infrastructure, and the transition of the delivery system.”
“Consider requiring all new residential and commercial construction to be all-
electric as quickly as possible, to mitigate future stranded gas infrastructure costs
and to avoid committing to decades of future GHG emissions from gas combustion in
buildings. Consider elimination of gas line extension allowances as a first step in that
direction.”
“Identify alternatives to significant new investments in the gas delivery
system, not otherwise needed to maintain system safety and reliability, such as
electrifying neighborhoods to avoid replacing aging gas infrastructure or downrating
local transmission lines to distribution by reducing the pressure as a means of reducing
future maintenance costs.”
“Anticipate and organize a just transition for the gas delivery system
workforce and any corresponding support services, such as customer service center
staff and ‘call before you dig’ workers.”
35 California Energy Commission and CPUC. July 2019. California Public Utilities Commission and California Energy Commission Staff Proposal for Building Decarbonization Pilots – Draft.
36 Sacramento Municipal Utilities District, for example, includes electric technologies with higher rebates when
switching from gas-to-electric, SMUD Residential Rebates, accessed Feb 2020.
37 KEMA, Inc. 2009. 2009 California Residential Appliance Saturation Study.
38 Navigant Consulting, Inc. July 2018. Analysis of the Role of Gas for a Low-Carbon California Future.

21
“Develop a comprehensive strategy to ensure low-income and disadvantaged
communities are empowered through, benefit from, and are not left behind in the
transition.”
“Clarify that a gas utility’s ‘obligation to serve’ could be met with alternative
fuels when doing so would avoid significant future investments in the gas system,
reducing costs for all gas customers.”
“Consider aligning financial recovery of new gas infrastructure investments
with the time horizons determined in the integrated long-term gas infrastructure plan.”
“Consider ratemaking adjustments such as the following to cushion the impact of
the transition on customers, particularly low-income customers.”
“Explore external funding sources to recover gas transition costs from sources
beyond gas utility customers, such as the electric customers who benefit from increased
electric load and taxpayers more broadly.”39
Data Gaps While a lot of information is in circulation, there are significant gaps in what the literature
provides, and significant questions are left unanswered. Fuel substitution data gathering and
analysis would benefit from having estimates of the distribution of electricity and natural gas
utility customers served by one or more utilities. Such data can be compiled against California
census and other ZIP code data to estimate the distribution of gas and electricity customers by
utilities serving the customers. Furthermore, the literature does not detail the effect on
revenue to natural gas-providing utility companies, nor does it detail specific necessary
upgrades for customers. Many of these gaps are due to a lack of information regarding how
many sources provide consumers with their utilities. Most of the literature focused on end-user
costs rather than detailing specific utility infrastructure upgrades. Consequently, further study
on how customer classes are using natural gas would prove useful.
The literature briefly touched on differences between more modern buildings and buildings
with older infrastructure that need upgrades; however, insufficient data provide proper
information about the effects on vintage housing and lower income communities. It is also
unclear whether decreasing the volume of natural gas provided to the grid will affect overall
health and safety for California residents.
39 Gridworks. 2019. California’s Gas System in Transition – Equitable, Affordable, Decarbonized and Smaller, pp.
4-23.

22
CHAPTER 3:
Residential and Commercial Sectors
This chapter provides the research team’s findings related to the policy, technical, and cost
barriers associated with fuel substitution for major end uses in the residential and commercial
sectors in existing and new construction buildings. The team prioritized a literature review to
identify possible solutions, as well as associated policy implementation and costs, to fuel
substitution adoption barriers.
This section summarizes the market as well as the barriers and opportunities for fuel
substitution in the residential and commercial sectors in three subsections:
Market and End-Use Characterization: Overview of the fuel substitution
opportunities in various end uses in the residential and commercial sectors.
End-Use Barriers and Needs: Literature review findings for the policy, technical, and
cost barriers for fuel substitution in the residential and commercial sectors and a
description of associated solutions and opportunities for electrifying these sectors.
Data Gaps: Existing data gaps to support future research plans.
Market and End-Use Characterization The U.S. Census estimated that of around 14 million housing units in California, single-family
units compose 64 percent of the building stock, while multifamily and mobile home units
combine for 36 percent.40
When combining these data with the 2009 California Residential Appliance Saturation Study
(RASS),41 the research team estimates that roughly 76 percent of existing homes have natural
gas space heating and 72 percent have gas water heating, about 10.7 million housing units
have gas space heating, and about 10.1 million housing units have gas water heating. Thus,
there is significant technical potential for fuel substitution for these two end uses in homes.
Gas space heating and water heating have a high penetration in the existing commercial
building stock, another high-potential area for fuel substitution.
Residential
The 2009 RASS, sponsored by the CEC, generated unit energy consumption42 estimates for 37
existing residential end uses and appliance saturations within California service areas of the
following utilities:
40 “Selected Housing Characteristics” U.S. Census Bureau, 2018: California Housing Units, accessed February
2020. These values are based on 1-year estimates.
41 California Energy Commission. 2009. Residential Appliance Saturation Survey.
42 “Unit energy consumption” is the energy consumption on a per household or per square footage basis (typical
scaling for commercial buildings).
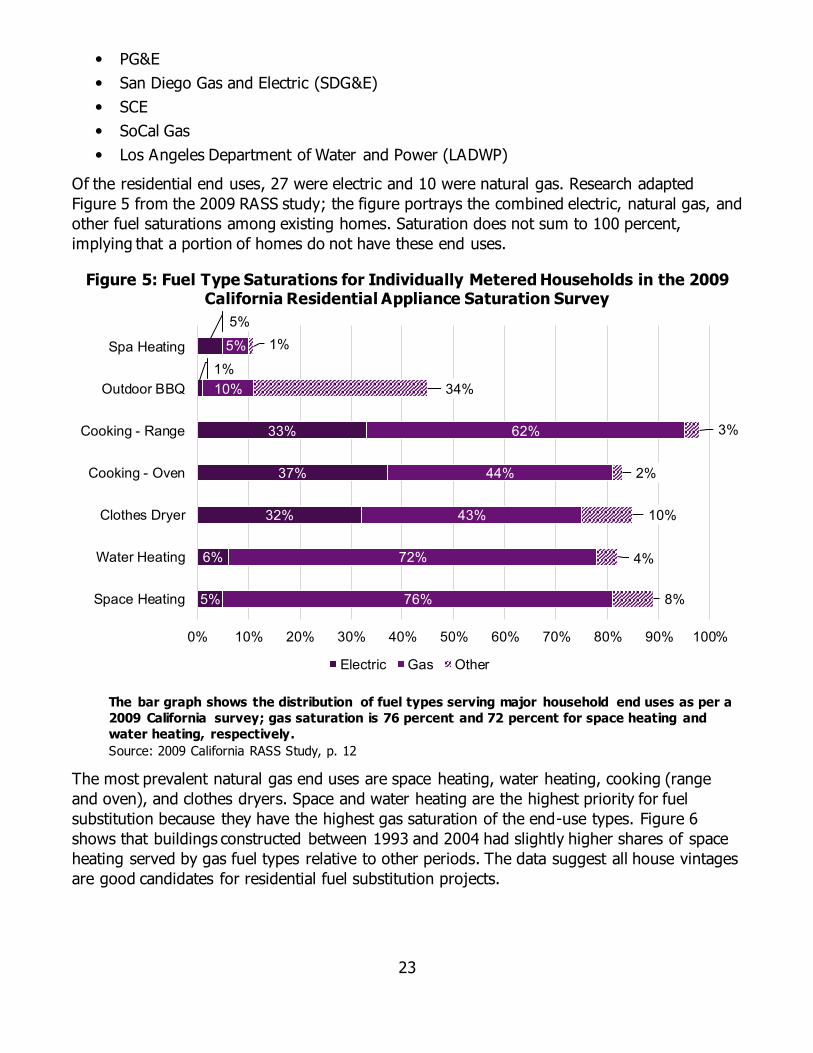
23
PG&E
San Diego Gas and Electric (SDG&E)
SCE
SoCal Gas
Los Angeles Department of Water and Power (LADWP)
Of the residential end uses, 27 were electric and 10 were natural gas. Research adapted
Figure 5 from the 2009 RASS study; the figure portrays the combined electric, natural gas, and
other fuel saturations among existing homes. Saturation does not sum to 100 percent,
implying that a portion of homes do not have these end uses.
Figure 5: Fuel Type Saturations for Individually Metered Households in the 2009 California Residential Appliance Saturation Survey
The bar graph shows the distribution of fuel types serving major household end uses as per a
2009 California survey; gas saturation is 76 percent and 72 percent for space heating and
water heating, respectively.
Source: 2009 California RASS Study, p. 12
The most prevalent natural gas end uses are space heating, water heating, cooking (range
and oven), and clothes dryers. Space and water heating are the highest priority for fuel
substitution because they have the highest gas saturation of the end-use types. Figure 6
shows that buildings constructed between 1993 and 2004 had slightly higher shares of space
heating served by gas fuel types relative to other periods. The data suggest all house vintages
are good candidates for residential fuel substitution projects.
5%
6%
32%
37%
33%
1%
5%
76%
72%
43%
44%
62%
10%
5%
8%
4%
10%
2%
3%
34%
1%
0% 10% 20% 30% 40% 50% 60% 70% 80% 90% 100%
Space Heating
Water Heating
Clothes Dryer
Cooking - Oven
Cooking - Range
Outdoor BBQ
Spa Heating
Electric Gas Other

24
Figure 6: Natural Gas Space Heating in California by House Vintage in the 2009 California Residential Appliance Saturation Survey
This side-by-side bar chart depicts the high saturation (75 percent and greater) of natural gas
space heating among dwellings built during the last 40 years.
Source: 2009 RASS Study, p. 15
Commercial
The 2006 California Commercial End-Use Survey report — prepared by Itron, Inc. for the CEC
— details mixed fuel usage by end use throughout 2,800 commercial facilities in the PG&E,
SDG&E, SCE, SoCal Gas, and SMUD service territories.43 Figure 7 illustrates the proportions of
energy use by various end uses among commercial buildings.
43 Itron, Inc. 2006. California Commercial End-Use Survey.
5%9%
6% 5% 3%7%
3%
79%75% 76% 77%
82% 83%78%
6%9%
12% 12% 11% 10%13%
0%
10%
20%
30%
40%
50%
60%
70%
80%
90%
Before 1975 1975-1977 1978-1982 1983-1992 1993-2000 2001-2004 2005-2008
Sp
ace
He
atin
g F
ue
l Sh
are
Electric Gas Other
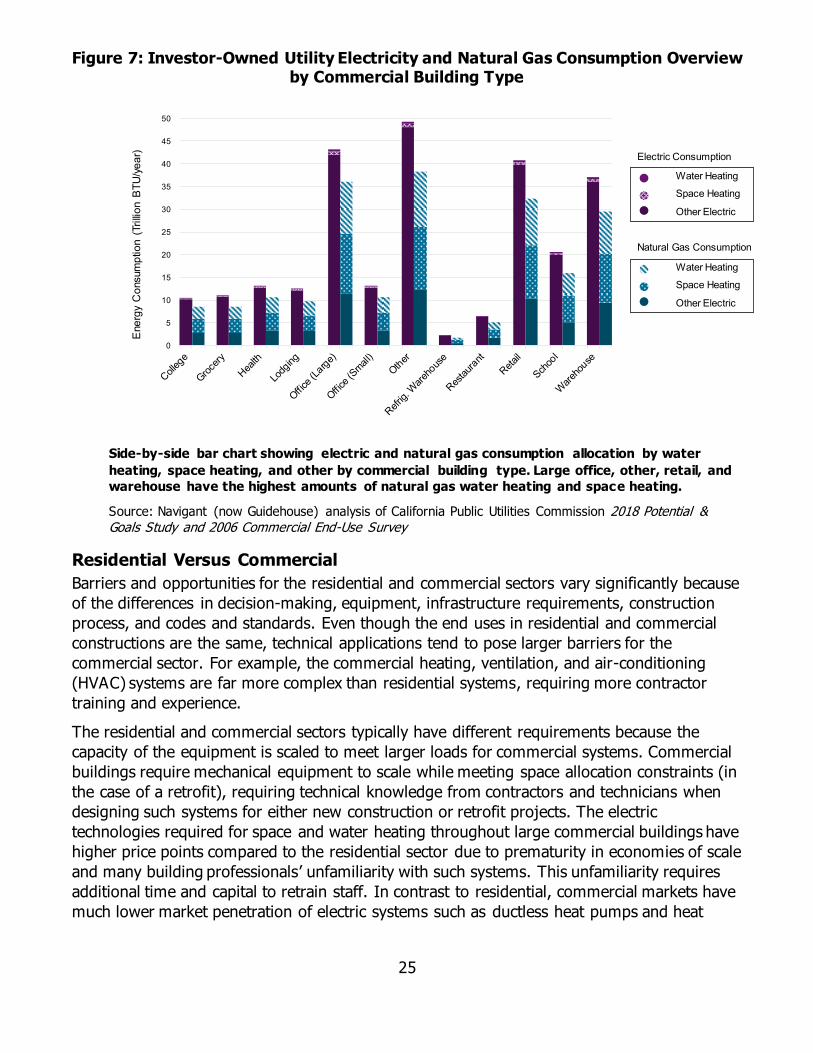
25
Figure 7: Investor-Owned Utility Electricity and Natural Gas Consumption Overview by Commercial Building Type
Side-by-side bar chart showing electric and natural gas consumption allocation by water
heating, space heating, and other by commercial building type. Large office, other, retail, and
warehouse have the highest amounts of natural gas water heating and space heating.
Source: Navigant (now Guidehouse) analysis of California Public Utilities Commission 2018 Potential & Goals Study and 2006 Commercial End-Use Survey
Residential Versus Commercial
Barriers and opportunities for the residential and commercial sectors vary significantly because
of the differences in decision-making, equipment, infrastructure requirements, construction
process, and codes and standards. Even though the end uses in residential and commercial
constructions are the same, technical applications tend to pose larger barriers for the
commercial sector. For example, the commercial heating, ventilation, and air-conditioning
(HVAC) systems are far more complex than residential systems, requiring more contractor
training and experience.
The residential and commercial sectors typically have different requirements because the
capacity of the equipment is scaled to meet larger loads for commercial systems. Commercial
buildings require mechanical equipment to scale while meeting space allocation constraints (in
the case of a retrofit), requiring technical knowledge from contractors and technicians when
designing such systems for either new construction or retrofit projects. The electric
technologies required for space and water heating throughout large commercial buildings have
higher price points compared to the residential sector due to prematurity in economies of scale
and many building professionals’ unfamiliarity with such systems. This unfamiliarity requires
additional time and capital to retrain staff. In contrast to residential, commercial markets have
much lower market penetration of electric systems such as ductless heat pumps and heat
0
5
10
15
20
25
30
35
40
45
50
Ene
rgy
Co
nsum
ptio
n (
Tri
llio
n B
TU
/ye
ar)
Water Heating
Space Heating
Other Electric
Water Heating
Space Heating
Other Electric
Electric Consumption
Natural Gas Consumption
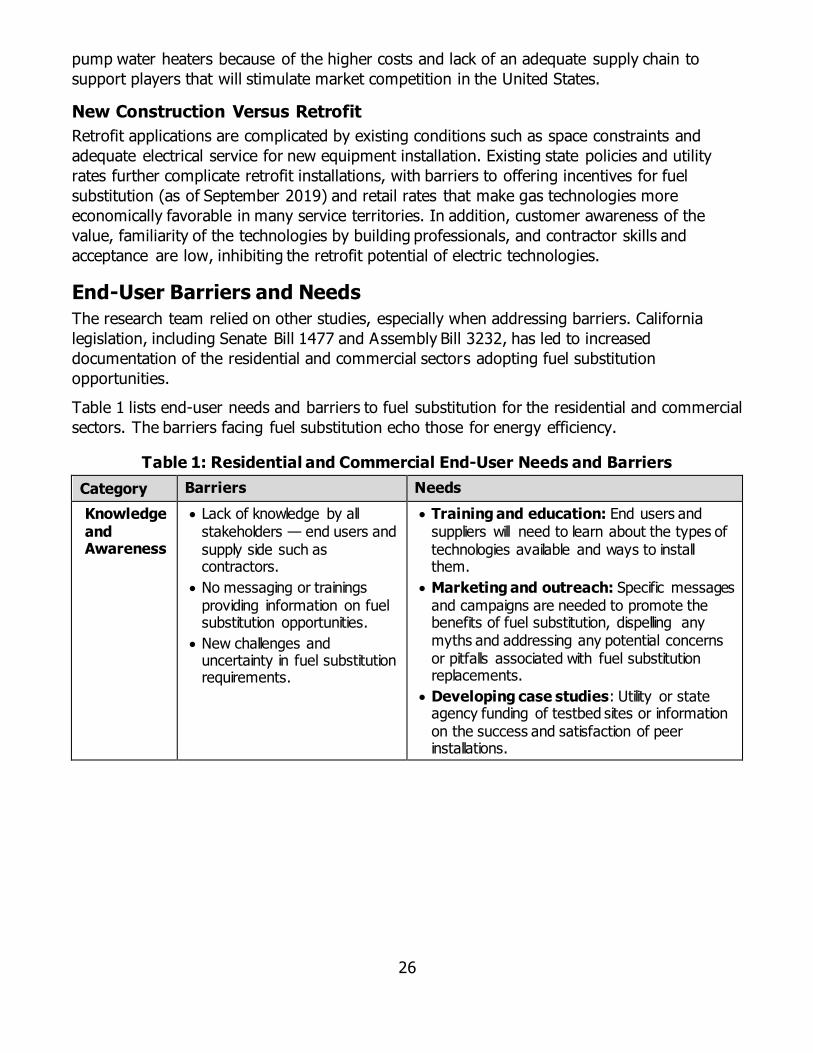
26
pump water heaters because of the higher costs and lack of an adequate supply chain to
support players that will stimulate market competition in the United States.
New Construction Versus Retrofit
Retrofit applications are complicated by existing conditions such as space constraints and
adequate electrical service for new equipment installation. Existing state policies and utility
rates further complicate retrofit installations, with barriers to offering incentives for fuel
substitution (as of September 2019) and retail rates that make gas technologies more
economically favorable in many service territories. In addition, customer awareness of the
value, familiarity of the technologies by building professionals, and contractor skills and
acceptance are low, inhibiting the retrofit potential of electric technologies.
End-User Barriers and Needs
The research team relied on other studies, especially when addressing barriers. California
legislation, including Senate Bill 1477 and Assembly Bill 3232, has led to increased
documentation of the residential and commercial sectors adopting fuel substitution
opportunities.
Table 1 lists end-user needs and barriers to fuel substitution for the residential and commercial
sectors. The barriers facing fuel substitution echo those for energy efficiency.
Table 1: Residential and Commercial End-User Needs and Barriers
Category Barriers Needs
Knowledge and Awareness
Lack of knowledge by all stakeholders — end users and supply side such as contractors.
No messaging or trainings providing information on fuel substitution opportunities.
New challenges and uncertainty in fuel substitution requirements.
Training and education: End users and suppliers will need to learn about the types of technologies available and ways to install them.
Marketing and outreach: Specific messages and campaigns are needed to promote the benefits of fuel substitution, dispelling any myths and addressing any potential concerns or pitfalls associated with fuel substitution replacements.
Developing case studies: Utility or state agency funding of testbed sites or information on the success and satisfaction of peer installations.

27
Category Barriers Needs
Financial Upfront cost and effort to
replace equipment that still works.
Demand charges within the rate structure increase focus to reduce peak demand and diminish the attention given to reduce energy consumption.
Preference for short payback and return on investment (ROI).
More rebates: The rebates are often critical
to provide messaging of the benefits and lower the ROI.
Financing options: To compensate for high initial costs, utilities or other parties should offer favorable financing options to encourage adoption and offset risk.
Price signals: Either through carbon tax or utility rates, the price signals should align to
allow flexible demand management44 for the end user.
Reliable
Equipment and Technical Applicability
Lack of demand for electric
equipment in the United States has stunted technical development and innovation to accommodate lower amperage service and climate constraints.
Insufficient electrical panel capacity at the building level and datasets differentiating between buildings requiring circuit, panel, or service upgrades.
Lack of knowledge of cost-effective system options, equipment performance data, and design guidance for central heating and water-heating systems for high-rise multifamily buildings.
Lack of knowledge of systems options for high-rise residential and commercial buildings to accommodate multiple all-electric outdoor units when many thermal zones are needed.
More rebates: More utility-offered programs
to subsidize panel upgrades, specifically in retrofit projects.
Better building stock data: Access and identification of building stock data documenting panel service, recent panel upgrades, and associated electrical permits can help inform incentive programs.
Low-cost or low-power retrofit-ready products: Use less power than available systems, allowing retrofits to be completed in buildings with constrained budgets or constrained electrical capacity.
Technology availability: Researchers are developing and testing cold climate-rated heat pumps to address reliability and generate datasets. Ductless heat pumps can help reduce spatial constraints by replacing the indoor wall-mounted units one-for-one.
Source: Guidehouse
The following subsections explore the barriers from policy, technical, and cost perspectives
and discuss possible solutions and opportunities.
44 Flexible demand management can shift electric use to periods of low grid load and low GHG emissions.
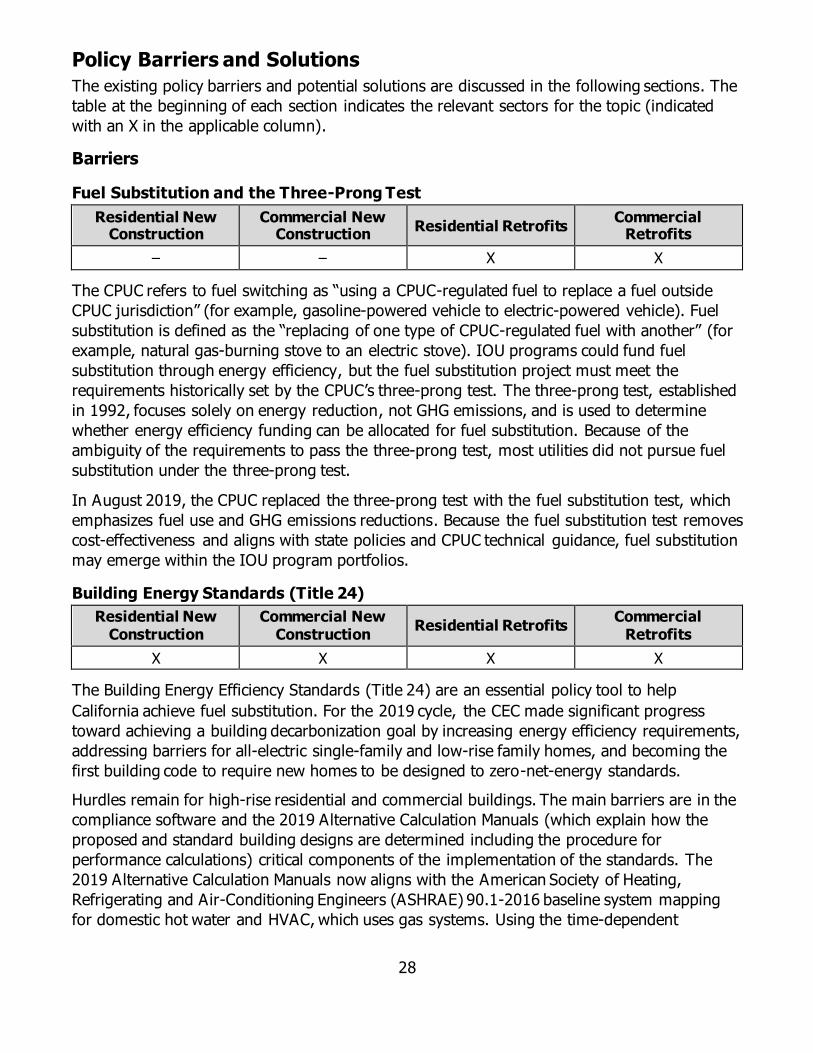
28
Policy Barriers and Solutions
The existing policy barriers and potential solutions are discussed in the following sections. The
table at the beginning of each section indicates the relevant sectors for the topic (indicated
with an X in the applicable column).
Barriers
Fuel Substitution and the Three-Prong Test
Residential New Construction
Commercial New Construction
Residential Retrofits Commercial
Retrofits
– – X X
The CPUC refers to fuel switching as “using a CPUC-regulated fuel to replace a fuel outside
CPUC jurisdiction” (for example, gasoline-powered vehicle to electric-powered vehicle). Fuel
substitution is defined as the “replacing of one type of CPUC-regulated fuel with another” (for
example, natural gas-burning stove to an electric stove). IOU programs could fund fuel
substitution through energy efficiency, but the fuel substitution project must meet the
requirements historically set by the CPUC’s three-prong test. The three-prong test, established
in 1992, focuses solely on energy reduction, not GHG emissions, and is used to determine
whether energy efficiency funding can be allocated for fuel substitution. Because of the
ambiguity of the requirements to pass the three-prong test, most utilities did not pursue fuel
substitution under the three-prong test.
In August 2019, the CPUC replaced the three-prong test with the fuel substitution test, which
emphasizes fuel use and GHG emissions reductions. Because the fuel substitution test removes
cost-effectiveness and aligns with state policies and CPUC technical guidance, fuel substitution
may emerge within the IOU program portfolios.
Building Energy Standards (Title 24)
Residential New Construction
Commercial New Construction
Residential Retrofits Commercial
Retrofits
X X X X
The Building Energy Efficiency Standards (Title 24) are an essential policy tool to help
California achieve fuel substitution. For the 2019 cycle, the CEC made significant progress
toward achieving a building decarbonization goal by increasing energy efficiency requirements,
addressing barriers for all-electric single-family and low-rise family homes, and becoming the
first building code to require new homes to be designed to zero-net-energy standards.
Hurdles remain for high-rise residential and commercial buildings. The main barriers are in the
compliance software and the 2019 Alternative Calculation Manuals (which explain how the
proposed and standard building designs are determined including the procedure for
performance calculations) critical components of the implementation of the standards. The
2019 Alternative Calculation Manuals now aligns with the American Society of Heating,
Refrigerating and Air-Conditioning Engineers (ASHRAE) 90.1-2016 baseline system mapping
for domestic hot water and HVAC, which uses gas systems. Using the time-dependent
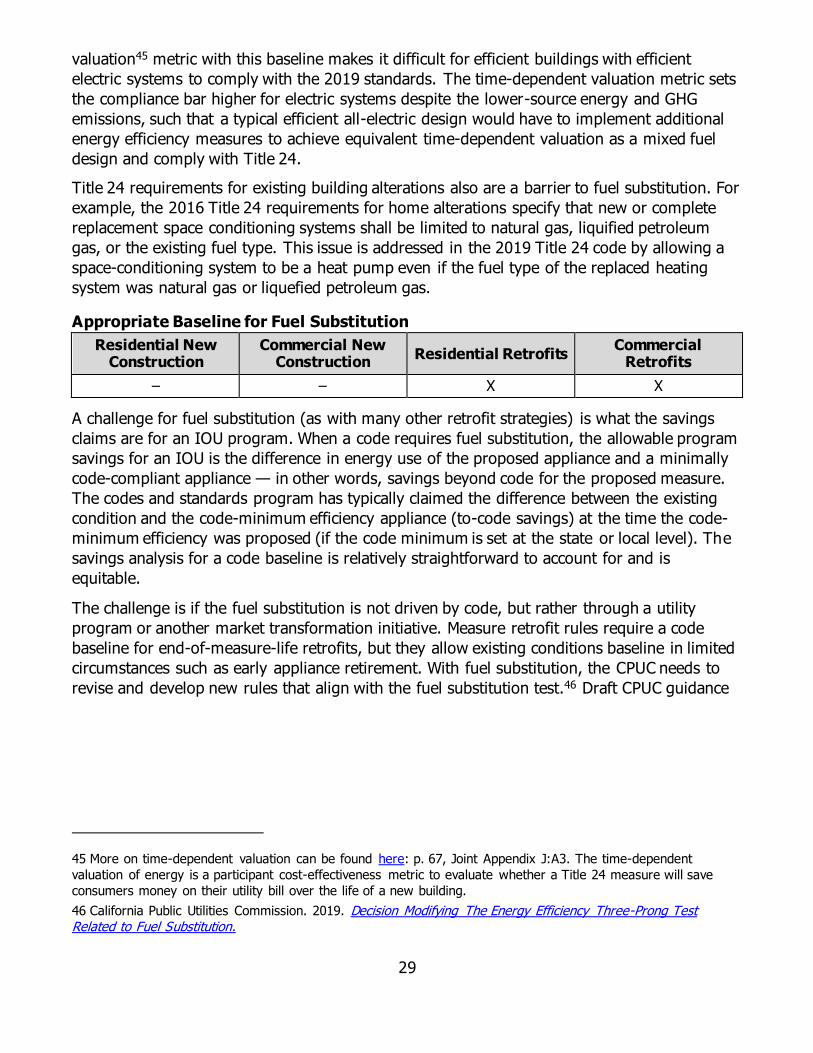
29
valuation45 metric with this baseline makes it difficult for efficient buildings with efficient
electric systems to comply with the 2019 standards. The time-dependent valuation metric sets
the compliance bar higher for electric systems despite the lower-source energy and GHG
emissions, such that a typical efficient all-electric design would have to implement additional
energy efficiency measures to achieve equivalent time-dependent valuation as a mixed fuel
design and comply with Title 24.
Title 24 requirements for existing building alterations also are a barrier to fuel substitution. For
example, the 2016 Title 24 requirements for home alterations specify that new or complete
replacement space conditioning systems shall be limited to natural gas, liquified petroleum
gas, or the existing fuel type. This issue is addressed in the 2019 Title 24 code by allowing a
space-conditioning system to be a heat pump even if the fuel type of the replaced heating
system was natural gas or liquefied petroleum gas.
Appropriate Baseline for Fuel Substitution
Residential New Construction
Commercial New Construction
Residential Retrofits Commercial
Retrofits
– – X X
A challenge for fuel substitution (as with many other retrofit strategies) is what the savings
claims are for an IOU program. When a code requires fuel substitution, the allowable program
savings for an IOU is the difference in energy use of the proposed appliance and a minimally
code-compliant appliance — in other words, savings beyond code for the proposed measure.
The codes and standards program has typically claimed the difference between the existing
condition and the code-minimum efficiency appliance (to-code savings) at the time the code-
minimum efficiency was proposed (if the code minimum is set at the state or local level). The
savings analysis for a code baseline is relatively straightforward to account for and is
equitable.
The challenge is if the fuel substitution is not driven by code, but rather through a utility
program or another market transformation initiative. Measure retrofit rules require a code
baseline for end-of-measure-life retrofits, but they allow existing conditions baseline in limited
circumstances such as early appliance retirement. With fuel substitution, the CPUC needs to
revise and develop new rules that align with the fuel substitution test.46 Draft CPUC guidance
45 More on time-dependent valuation can be found here: p. 67, Joint Appendix J:A3. The time-dependent
valuation of energy is a participant cost-effectiveness metric to evaluate whether a Title 24 measure will save
consumers money on their utility bill over the life of a new building.
46 California Public Utilities Commission. 2019. Decision Modifying The Energy Efficiency Three-Prong Test Related to Fuel Substitution.

30
is leaning toward using the measure application type (replace on burnout vs. accelerated
replacement)47 to define the comparison (baseline) technology of the original fuel.48
Appropriate Metrics for Fuel Substitution
Residential New Construction
Commercial New Construction
Residential Retrofits Commercial
Retrofits
X X X X
Because fuel substitution increases the target energy source (that is, electricity) and reduces
the existing energy source (that is, natural gas), the typical energy and demand savings
metrics based on a single fuel source between existing and retrofit do not work. For example,
energy efficiency program savings for an electric utility assume electricity savings compared to
code or existing electricity use. However, in a fuel substitution scenario, the electric utility
would see a net increase in electricity use, whereas the natural gas utility would see a net
decrease in natural gas use. This shift makes program savings claims difficult under the
existing framework for a single fuel CPUC-regulated utility.49 The CPUC needs to develop and
promote alternate metrics that capture the inherent GHG emissions savings that result from
beneficial fuel substitution. The changes in metrics need a CPUC rulemaking for IOUs to
address effectively and send a clear signal to the market.
Another metric-related issue is whether annual benefits (for example, annual kilowatt-hour
savings) are appropriate for all fuel substitution measures. Current rules for energy efficiency
and DR value annual energy savings and peak energy demand, respectively. With the
increased use of renewables, a need is emerging to redefine when and how demand should be
curtailed. For example, there is a long history of HVAC programs supporting demand
reductions between 12 p.m. and 4 p.m., whereas the current system peaks are from 4 p.m. to
9 p.m. These peaks may eventually vary with potential new winter peak periods. New metrics
to address grid impacts and time-of-use aspects of fuel substitution are needed.
Natural Gas Ratemaking
As decarbonization and electrification efforts increase and market uptake grows, the cost of
the natural gas infrastructure may be borne by an increasingly smaller number of customers (a
disproportionate number of which may be in low-income and disadvantaged communities)
unless regulatory and other mechanisms keep the gas rates in check. A recent report by
Gridworks50 summarizes this challenge:
“Since most of the capital and ongoing maintenance costs of the gas delivery
system do not vary much with changes in the volume of gas consumed, a decline
47 Replace-on-burnout baseline uses code or industry standard practice. Accelerated replacement is early
retirement, where the existing conditions baseline is used for calculating savings through the remaining useful
life; the second baseline for energy savings calculation for the remaining EUL of the replacement is code or
industry standard practice.
48 California Public Utilities Commission. October 2019. Fuel Substitution Technical Guidance for Energy Efficiency, Version 1.0.
49 Building electrification programs operated by POUs do not have such constraints.
50 Gridworks. 2019. California’s Gas System in Transition – Equitable, Affordable, Decarbonized and Smaller.
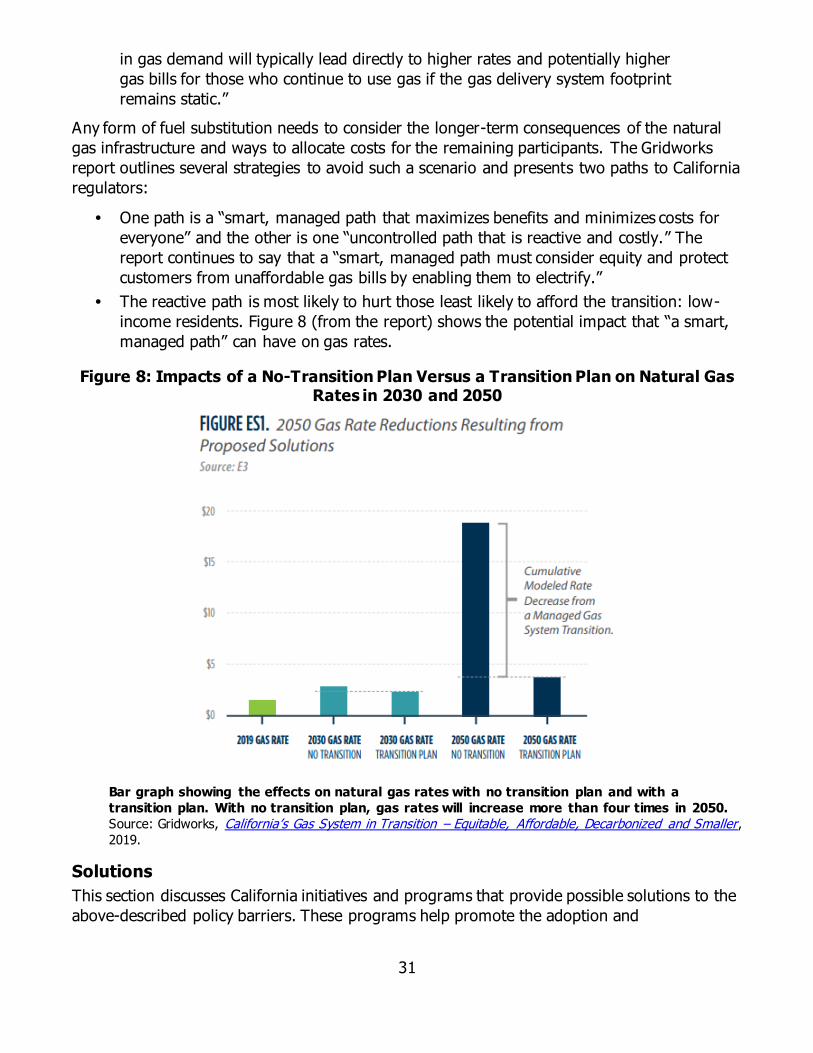
31
in gas demand will typically lead directly to higher rates and potentially higher
gas bills for those who continue to use gas if the gas delivery system footprint
remains static.”
Any form of fuel substitution needs to consider the longer-term consequences of the natural
gas infrastructure and ways to allocate costs for the remaining participants. The Gridworks
report outlines several strategies to avoid such a scenario and presents two paths to California
regulators:
One path is a “smart, managed path that maximizes benefits and minimizes costs for
everyone” and the other is one “uncontrolled path that is reactive and costly.” The
report continues to say that a “smart, managed path must consider equity and protect
customers from unaffordable gas bills by enabling them to electrify.”
The reactive path is most likely to hurt those least likely to afford the transition: low-
income residents. Figure 8 (from the report) shows the potential impact that “a smart,
managed path” can have on gas rates.
Figure 8: Impacts of a No-Transition Plan Versus a Transition Plan on Natural Gas Rates in 2030 and 2050
Bar graph showing the effects on natural gas rates with no transition plan and with a
transition plan. With no transition plan, gas rates will increase more than four times in 2050.
Source: Gridworks, California’s Gas System in Transition – Equitable, Affordable, Decarbonized and Smaller, 2019.
Solutions
This section discusses California initiatives and programs that provide possible solutions to the
above-described policy barriers. These programs help promote the adoption and
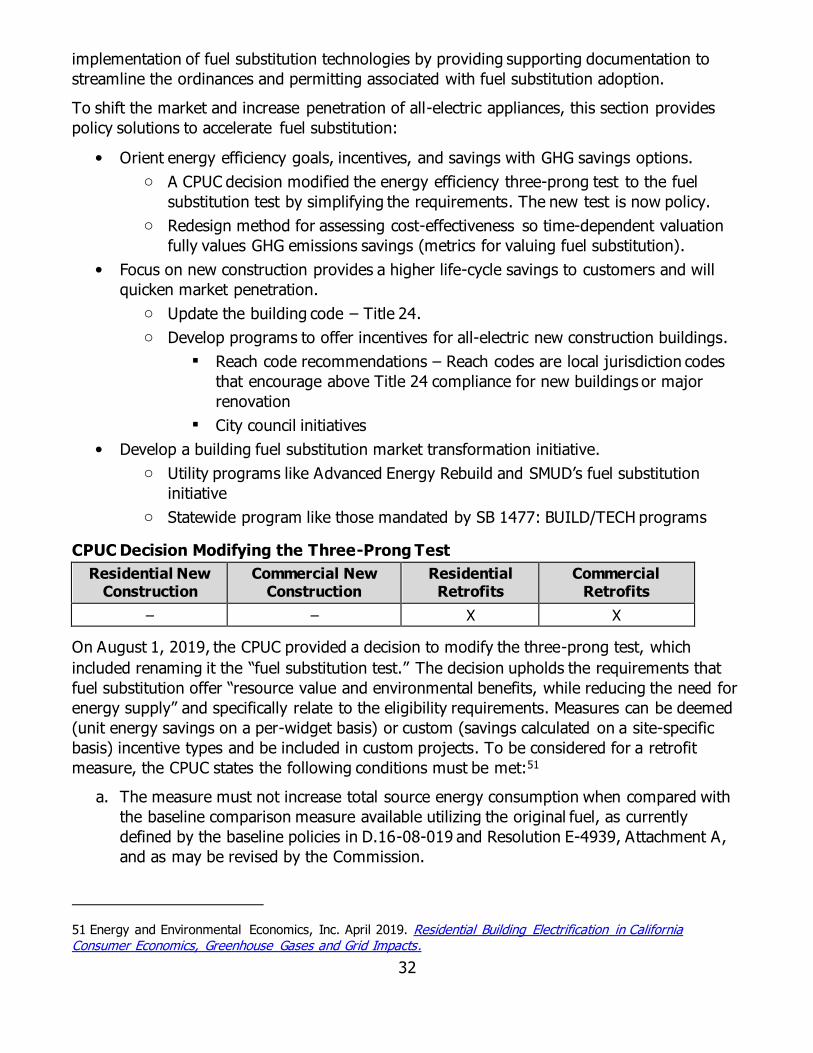
32
implementation of fuel substitution technologies by providing supporting documentation to
streamline the ordinances and permitting associated with fuel substitution adoption.
To shift the market and increase penetration of all-electric appliances, this section provides
policy solutions to accelerate fuel substitution:
Orient energy efficiency goals, incentives, and savings with GHG savings options.
o A CPUC decision modified the energy efficiency three-prong test to the fuel
substitution test by simplifying the requirements. The new test is now policy.
o Redesign method for assessing cost-effectiveness so time-dependent valuation
fully values GHG emissions savings (metrics for valuing fuel substitution).
Focus on new construction provides a higher life-cycle savings to customers and will
quicken market penetration.
o Update the building code – Title 24.
o Develop programs to offer incentives for all-electric new construction buildings.
Reach code recommendations – Reach codes are local jurisdiction codes
that encourage above Title 24 compliance for new buildings or major
renovation
City council initiatives
Develop a building fuel substitution market transformation initiative.
o Utility programs like Advanced Energy Rebuild and SMUD’s fuel substitution
initiative
o Statewide program like those mandated by SB 1477: BUILD/TECH programs
CPUC Decision Modifying the Three-Prong Test
Residential New Construction
Commercial New Construction
Residential Retrofits
Commercial Retrofits
– – X X
On August 1, 2019, the CPUC provided a decision to modify the three-prong test, which
included renaming it the “fuel substitution test.” The decision upholds the requirements that
fuel substitution offer “resource value and environmental benefits, while reducing the need for
energy supply” and specifically relate to the eligibility requirements. Measures can be deemed
(unit energy savings on a per-widget basis) or custom (savings calculated on a site-specific
basis) incentive types and be included in custom projects. To be considered for a retrofit
measure, the CPUC states the following conditions must be met:51
a. The measure must not increase total source energy consumption when compared with
the baseline comparison measure available utilizing the original fuel, as currently
defined by the baseline policies in D.16-08-019 and Resolution E-4939, Attachment A,
and as may be revised by the Commission.
51 Energy and Environmental Economics, Inc. April 2019. Residential Building Electrification in California Consumer Economics, Greenhouse Gases and Grid Impacts.

33
b. The measure must not adversely impact the environment. This means that the use or
operation of the measure must not increase forecasted CO2-equivalent emissions
impacts as compared to the comparison measure utilizing the original fuel.
The comparison measure using the original fuel, against which the fuel substitution
measures is compared, must be the same for both items a and b above.
The fuel substitution test does not apply to new construction applications, but it does apply to
renovations of existing buildings. The test had a few major decisions that may affect
immediate program implementation:
The test defined the applicable costs and benefits of the fuel substitution measure —
for example, if a panel upgrade is required, this cost is not allocated to the measure.52
Programs are reflected in the cost-effectiveness analysis of the total portfolio of the
program administrator sponsoring the measures rather than on a measure-by-measure
basis. The default net-to-gross ratio for fuel substitution measures should be 1.0
because there is little-to-no uptake in fuel substitution measures in the market so far.
Pending any CPUC updates, the decision allows program administrators and
implementers to use the current cost-effectiveness tool53 to evaluate annual cost-
effectiveness.
The baseline against which a fuel substitution measure is compared should be
determined in the same manner for other measures in the energy efficiency portfolio
(namely, using code baseline, industry standard practice, or existing conditions
depending on the circumstances of the measure installation).
The fuel substitution test requires that the measure save energy and not harm the
environment (as measured by GHG emissions). According to the existing decision and the
September 16, 2019, guidance, the test does not include any considerations on refrigerant use
and potential leakage or fugitive emissions from methane.
The draft guidance document provides the data sources and analysis algorithm for source
energy and emissions calculations over the lifetime of the measure savings. For example,
renewable energy sources such as wind and solar have zero source energy. Depending on the
load shape of the fuel substitution measure, the measure will add more or less emissions or
source energy. Like the energy efficiency portfolio, the GHG adder54 values may change if the
GHG emissions intensity changes. Furthermore, the cost-effectiveness calculation values a
kilowatt-hour GHG ton reduction higher than the same reduction in therms (favoring
gasification over electrification instead of being neutral). Per CPUC Decision 19-08-009
52 The decision authors did not want to burden the potential benefits of fuel substitution with the full cost of a
panel upgrade. End-user decisions for a panel upgrade are not limited to the fuel substitution measure.
53 “Cost-effectiveness,” Consumer Energy Resources, California Public Utilities Commission, accessed September
2019.
54 The “GHG adder” is the valuation of the GHG emissions reduction within the avoided cost calculation. The GHG
adder value depends on the quantification of the abatement cost savings, integration costs, and low-value
emissions.
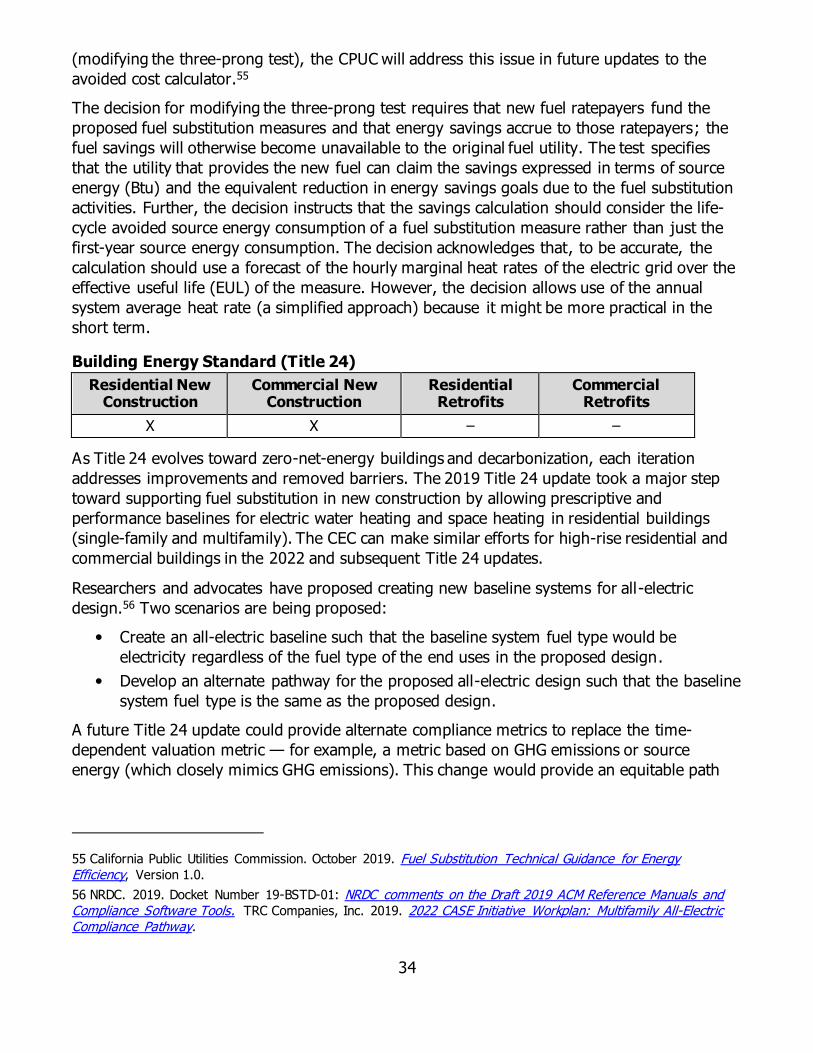
34
(modifying the three-prong test), the CPUC will address this issue in future updates to the
avoided cost calculator.55
The decision for modifying the three-prong test requires that new fuel ratepayers fund the
proposed fuel substitution measures and that energy savings accrue to those ratepayers; the
fuel savings will otherwise become unavailable to the original fuel utility. The test specifies
that the utility that provides the new fuel can claim the savings expressed in terms of source
energy (Btu) and the equivalent reduction in energy savings goals due to the fuel substitution
activities. Further, the decision instructs that the savings calculation should consider the life-
cycle avoided source energy consumption of a fuel substitution measure rather than just the
first-year source energy consumption. The decision acknowledges that, to be accurate, the
calculation should use a forecast of the hourly marginal heat rates of the electric grid over the
effective useful life (EUL) of the measure. However, the decision allows use of the annual
system average heat rate (a simplified approach) because it might be more practical in the
short term.
Building Energy Standard (Title 24)
Residential New Construction
Commercial New Construction
Residential Retrofits
Commercial Retrofits
X X – –
As Title 24 evolves toward zero-net-energy buildings and decarbonization, each iteration
addresses improvements and removed barriers. The 2019 Title 24 update took a major step
toward supporting fuel substitution in new construction by allowing prescriptive and
performance baselines for electric water heating and space heating in residential buildings
(single-family and multifamily). The CEC can make similar efforts for high-rise residential and
commercial buildings in the 2022 and subsequent Title 24 updates.
Researchers and advocates have proposed creating new baseline systems for all-electric
design.56 Two scenarios are being proposed:
Create an all-electric baseline such that the baseline system fuel type would be
electricity regardless of the fuel type of the end uses in the proposed design.
Develop an alternate pathway for the proposed all-electric design such that the baseline
system fuel type is the same as the proposed design.
A future Title 24 update could provide alternate compliance metrics to replace the time-
dependent valuation metric — for example, a metric based on GHG emissions or source
energy (which closely mimics GHG emissions). This change would provide an equitable path
55 California Public Utilities Commission. October 2019. Fuel Substitution Technical Guidance for Energy Efficiency, Version 1.0.
56 NRDC. 2019. Docket Number 19-BSTD-01: NRDC comments on the Draft 2019 ACM Reference Manuals and Compliance Software Tools. TRC Companies, Inc. 2019. 2022 CASE Initiative Workplan: Multifamily All-Electric Compliance Pathway.
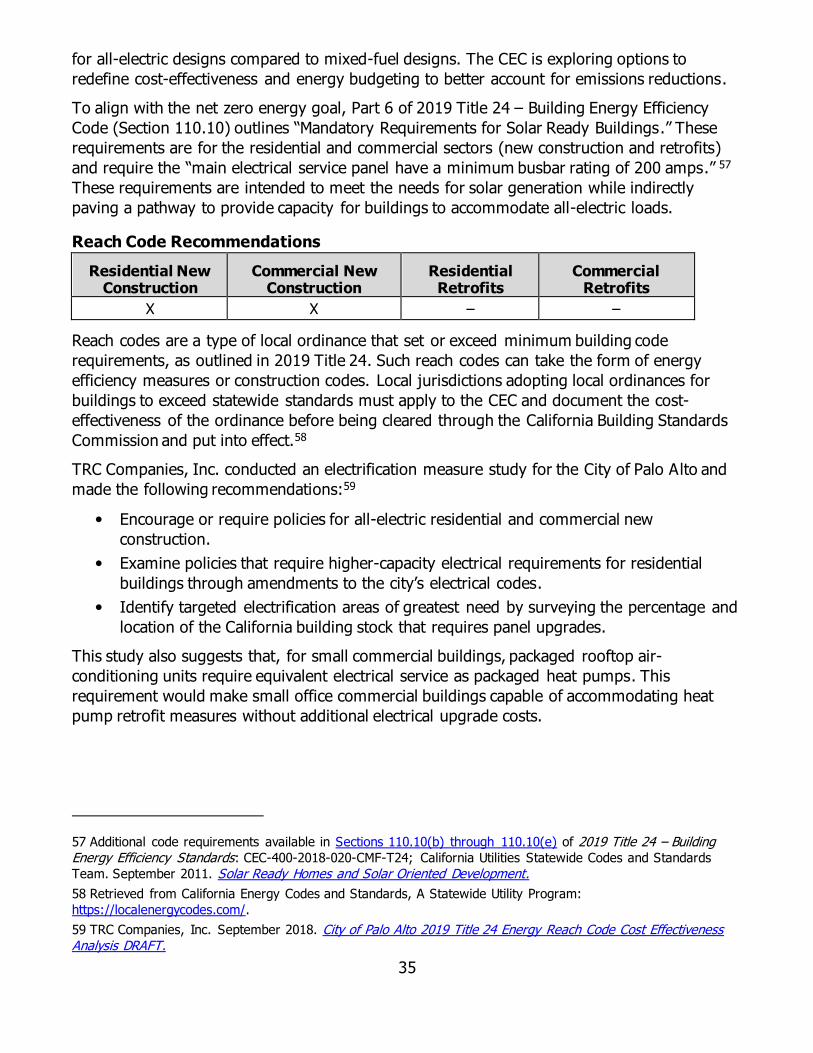
35
for all-electric designs compared to mixed-fuel designs. The CEC is exploring options to
redefine cost-effectiveness and energy budgeting to better account for emissions reductions.
To align with the net zero energy goal, Part 6 of 2019 Title 24 – Building Energy Efficiency
Code (Section 110.10) outlines “Mandatory Requirements for Solar Ready Buildings.” These
requirements are for the residential and commercial sectors (new construction and retrofits)
and require the “main electrical service panel have a minimum busbar rating of 200 amps.” 57
These requirements are intended to meet the needs for solar generation while indirectly
paving a pathway to provide capacity for buildings to accommodate all-electric loads.
Reach Code Recommendations
Residential New Construction
Commercial New Construction
Residential Retrofits
Commercial Retrofits
X X – –
Reach codes are a type of local ordinance that set or exceed minimum building code
requirements, as outlined in 2019 Title 24. Such reach codes can take the form of energy
efficiency measures or construction codes. Local jurisdictions adopting local ordinances for
buildings to exceed statewide standards must apply to the CEC and document the cost-
effectiveness of the ordinance before being cleared through the California Building Standards
Commission and put into effect.58
TRC Companies, Inc. conducted an electrification measure study for the City of Palo Alto and
made the following recommendations:59
Encourage or require policies for all-electric residential and commercial new
construction.
Examine policies that require higher-capacity electrical requirements for residential
buildings through amendments to the city’s electrical codes.
Identify targeted electrification areas of greatest need by surveying the percentage and
location of the California building stock that requires panel upgrades.
This study also suggests that, for small commercial buildings, packaged rooftop air-
conditioning units require equivalent electrical service as packaged heat pumps. This
requirement would make small office commercial buildings capable of accommodating heat
pump retrofit measures without additional electrical upgrade costs.
57 Additional code requirements available in Sections 110.10(b) through 110.10(e) of 2019 Title 24 – Building Energy Efficiency Standards: CEC-400-2018-020-CMF-T24; California Utilities Statewide Codes and Standards
Team. September 2011. Solar Ready Homes and Solar Oriented Development.
58 Retrieved from California Energy Codes and Standards, A Statewide Utility Program:
https://localenergycodes.com/.
59 TRC Companies, Inc. September 2018. City of Palo Alto 2019 Title 24 Energy Reach Code Cost Effectiveness Analysis DRAFT.

36
Valuing Fuel Substitution
Residential New Construction
Commercial New Construction
Residential Retrofits Commercial
Retrofits
X X X X
Different considerations are needed to value fuel substitution than the standard kWh or
therms reduction in energy efficiency. The fuel substitution test provides guidance on
qualifying the measure in the context of reducing emissions and fuel use but does not provide
guidance for cost-effectiveness neutral of fuel and utility provider.
SMUD developed a metric to value fuel substitution that it presented at a CEC workshop on
August 27, 2019. The metric uses carbon to maximize local benefits for planning and is based
on calculating marginal carbon savings instead of first-year kilowatt-hour or therm savings.
SMUD adopted in January 2020 to use carbon as the metric to value benefits from energy
efficiency and fuel substitution.60 Its analysis uses:
Hourly marginal carbon emissions from the grid.
Hourly load/savings profiles of efficiency and electrification measures.
Carbon reduction from fossil fuels eliminated by the customer.
SMUD is also reviewing how to calculate a programmatic carbon reduction by shifting the
annual stream of carbon reductions to the first year as part of program optimization planning.
This stream includes changing the electricity grid fuel mix and emissions.61
Another option to consider is a method to assess cost-effectiveness so time-dependent
valuation fully values GHG emissions savings (metrics for valuing fuel substitution). A cost-
effectiveness analysis must incorporate an hourly valuation over the lifetime of the measure to
properly value the benefits. As the bulk electricity grid decarbonizes, hourly GHG emissions
from the grid will decrease over time as well. Forecasting or assuming how much the bulk grid
decarbonizes involves some uncertainty. A publicly vetted singular forecast of hourly GHG
emissions factors to use in such analysis will address this uncertainty.
Furthermore, the valuing of energy efficiency-DR potential integration assumes added
significance in electrification. Fuel substitution will increase the electric system load, increasing
the need for DR to provide grid services. Representation of DR impacts from these
technologies and the interactive effects between energy efficiency and DR from these
technologies would assume increasing importance as the portfolio of electrification
technologies grows over time.
60 SMUD. “SMUD first in US to change efficiency metric to ‘avoided carbon,” news release, February 3, 2020.
61 SMUD, “SMUD – Using Carbon as an EE Metric,” presented August 27, 2019.
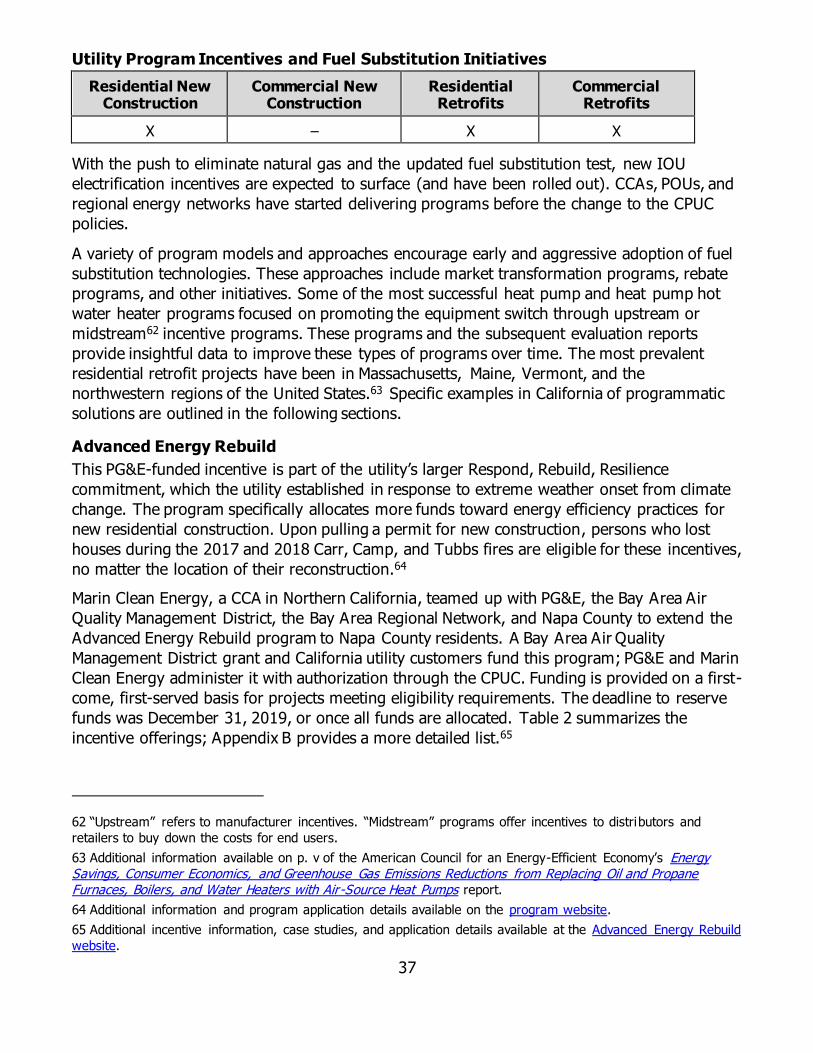
37
Utility Program Incentives and Fuel Substitution Initiatives
Residential New Construction
Commercial New Construction
Residential Retrofits
Commercial Retrofits
X – X X
With the push to eliminate natural gas and the updated fuel substitution test, new IOU
electrification incentives are expected to surface (and have been rolled out). CCAs, POUs, and
regional energy networks have started delivering programs before the change to the CPUC
policies.
A variety of program models and approaches encourage early and aggressive adoption of fuel
substitution technologies. These approaches include market transformation programs, rebate
programs, and other initiatives. Some of the most successful heat pump and heat pump hot
water heater programs focused on promoting the equipment switch through upstream or
midstream62 incentive programs. These programs and the subsequent evaluation reports
provide insightful data to improve these types of programs over time. The most prevalent
residential retrofit projects have been in Massachusetts, Maine, Vermont, and the
northwestern regions of the United States.63 Specific examples in California of programmatic
solutions are outlined in the following sections.
Advanced Energy Rebuild
This PG&E-funded incentive is part of the utility’s larger Respond, Rebuild, Resilience
commitment, which the utility established in response to extreme weather onset from climate
change. The program specifically allocates more funds toward energy efficiency practices for
new residential construction. Upon pulling a permit for new construction, persons who lost
houses during the 2017 and 2018 Carr, Camp, and Tubbs fires are eligible for these incentives,
no matter the location of their reconstruction.64
Marin Clean Energy, a CCA in Northern California, teamed up with PG&E, the Bay Area Air
Quality Management District, the Bay Area Regional Network, and Napa County to extend the
Advanced Energy Rebuild program to Napa County residents. A Bay Area Air Quality
Management District grant and California utility customers fund this program; PG&E and Marin
Clean Energy administer it with authorization through the CPUC. Funding is provided on a first-
come, first-served basis for projects meeting eligibility requirements. The deadline to reserve
funds was December 31, 2019, or once all funds are allocated. Table 2 summarizes the
incentive offerings; Appendix B provides a more detailed list.65
62 “Upstream” refers to manufacturer incentives. “Midstream” programs offer incentives to distributors and
retailers to buy down the costs for end users.
63 Additional information available on p. v of the American Council for an Energy-Efficient Economy’s Energy Savings, Consumer Economics, and Greenhouse Gas Emissions Reductions from Replacing Oil and Propane Furnaces, Boilers, and Water Heaters with Air-Source Heat Pumps report.
64 Additional information and program application details available on the program website.
65 Additional incentive information, case studies, and application details available at the Advanced Energy Rebuild
website.

38
Table 2: Summary of Advanced Energy Rebuild Incentive Offerings
Options Incentive Incentive Overview
Above-Code Home
$2,200 (starting)
Marin Clean Energy add-on available (up to $7,640), including solar
Advanced Energy Home
$7,500 Mixed fuel with $3,000-$5,000 available for solar with storage
All-Electric Home
$12,500 All-electric with $3,000-$5,000 available for solar with storage
Solar Option $5,000 Designed to offset annual electric usage with a 7.5 kWh battery energy storage system coupled with the PV array
Source: California Advanced Homes Initiative, accessed August 2019
SMUD Fuel Substitution Initiative
SMUD initiated a program to replace gas equipment with electric options and a separate
rebate to pursue defined steps toward achieving an all-electric home.6 6 The Home
Performance Program provides an avenue for SMUD customers to pursue whole-house
bundled energy efficiency upgrades, including a Go-Electric Bonus Package. This package
includes a rebate up to $13,500, broken into the following steps:67
$2,500 for a gas furnace replacement with a heat pump HVAC system.
$3,000 for a gas water heater replacement with a heat pump water heater.
$2,500 to make the home all-electric-ready by wiring for an EV charger and all-electric
appliances.
o This rebate provides $500 for each new electric circuit, up to $2,500 if a panel
upgrade is required.
o EV charger, cooktop/range, and clothes dryer circuits are eligible.
SMUD is structuring a rebate offering for new construction all-electric homes and an additional
rebate for electric-ready homes that have enough electric infrastructure such as wiring,
breakers, service panels, and plugs; this infrastructure allows an easier transition to all-electric
equipment and appliances.
SB 1477: BUILD/TECH Programs
Rules at the CPUC separate funding streams into energy efficiency, DR, renewables, and
storage. These funding streams are independent and generally not allowed to be intermingled
at the project level. It is hard to have an integrated DER program that encourages efficiency,
renewables, and storage under one funding source.
To address this barrier, the California Legislature passed SB 1477 to develop two clean-
building pilot programs focused on GHG emissions from buildings:
66 Nadel, Steven. August 1, 2018. “New Programs Nudge Homeowners to Switch to Electric Heat Pumps.” ACEEE Blog.
67 More information available on SMUD’s website.

39
Building Initiative for Low-Emissions Development (BUILD) program: Offers
incentives for buildings (specifically new construction) to “build clean from the start” via
high-efficiency heat pumps, solar thermal storage, energy efficiency, battery storage,
and home energy management systems.
Technology and Equipment for Clean Heating (TECH) program: Aims to spur
the state’s market for low-emissions space and water heating technologies in new and
existing homes by offering incentives to distributors and retailers to stock the
equipment. It also provides consumer, contractor, and vendor training to support these
technologies.68
Other Examples
Some electrification programs have already been developed, and implementers are prepared
to incorporate upon CPUC approval. The Bay Area Regional Network’s multifamily building
energy efficiency programs have program rules in place for retrofit packages; these rules
require that at least three measures cumulatively reduce consumption by no less than 10 to 15
percent. After meeting this requirement, the program offers a $750 rebate per dwelling to
eligible property owners. Programs such as this promote fuel substitution by electrifying
appliances that yield energy savings through the higher efficiency appliances (for example,
washers and heat pump dryers); the savings from these appliances count toward the 10 to 15
percent savings mark required to receive rebates. These rebates could also help customers
maintain the all-electric appliance when replaced on burnout or accelerated replacement
instances arise.
City Council Initiatives
Residential New Construction
Commercial New Construction
Residential Retrofits
Commercial Retrofits
X – X –
Cities and other California jurisdictions have added building decarbonization (electrification)
into their local ordinances. In a new ordinance taking effect January 1, 2020, Berkeley (via its
city council) is banning natural gas hookups for new low-rise multifamily buildings. San Luis
Obispo and San Jose City Council put a similar measure in motion. This phasing-out of gas is
also being pursued by U.S. and European governments — California’s aggressive GHG
reduction goals have been a catalyst to these initiatives to meet the 100 percent zero-carbon-
energy goal by 2045.69
Other jurisdictions are moving to either ban new gas connections, promoting electrification,
reducing emissions, or a combination in their local legislature. Table 3 provides an overview of
cities and counties’ progress toward these initiatives.
64 More information available at SMUD Residential Programs, accessed August 2019, and Building
Decarbonization Pilots.
69 Gerdes, Justin. August 23, 2019. “2020 Looks Like the Breakout Year for Building Decarbonization in
California,” Greentech Media.

40
Table 3: Status of California Jurisdictions Adoption of Legislation Regarding Fuel Substitution (as of August 2019)
Jurisdiction Status Ban All-Electric
Reach Electric-Preferred
Berkeley Approved X
Carlsbad Approved X
Davis Second Reading X
Marin County Second Reading X
Menlo Park Approved X X
San Jose Second Reading X
San Luis Obispo
Second Reading X
San Mateo Approved X
Santa Monica Approved X
Windsor Second Reading X
Source: TRC Companies, Inc., Reach Code Update Tracking on behalf of Peninsula Clean Energy, Silicon
Valley Clean Energy, East Bay Community Energy, City of San Luis Obispo and the Statewide IOU Codes
and Standards Team
Technical Barriers and Solutions Technical barriers to electrification and decarbonization exist for various parties, including the
utility, customer, contractor, and policy-governing agencies. This section discusses the
residential and commercial sector-specific equipment, infrastructure upgrade, and consumer-
based barriers to implementing and dispatching electric equipment and appliances for retrofit
and new construction projects.
One of the major barriers within the residential sector is the capacity of the electrical panel
and the upgrades needed to address fuel substitution in older homes. This technical barrier
stems from older homes having 100 A or lower panel capacities; retrofit electric technologies,
such as heat pump dryers and hot water heaters, are not available in lower wattage/amperage
options in the United States. Moreover, when it is time for a replacement (typically under
replace-on-burnout situations), there is no time to wait for planning and construction, which
may be needed when changing fuels. Therefore, most replacement technologies operate on
the same fuel as the removed technology.
Based on current incentive offerings and policies, the Energy and Environmental Economics
study expects new construction all-electric homes to be at lower cost than gas or mixed-fuel
new construction homes. New construction electrification offers a short-term payback and life-
cycle savings compared to retrofit projects.70 When comparing life-cycle savings of a retrofit to
new construction, retrofit homes see less cost savings, which is because of the required 200 A
70 Energy and Environmental Economics, Inc. April 2019. Residential Building Electrification in California: Consumer Economics, Greenhouse Gases and Grid Impacts.
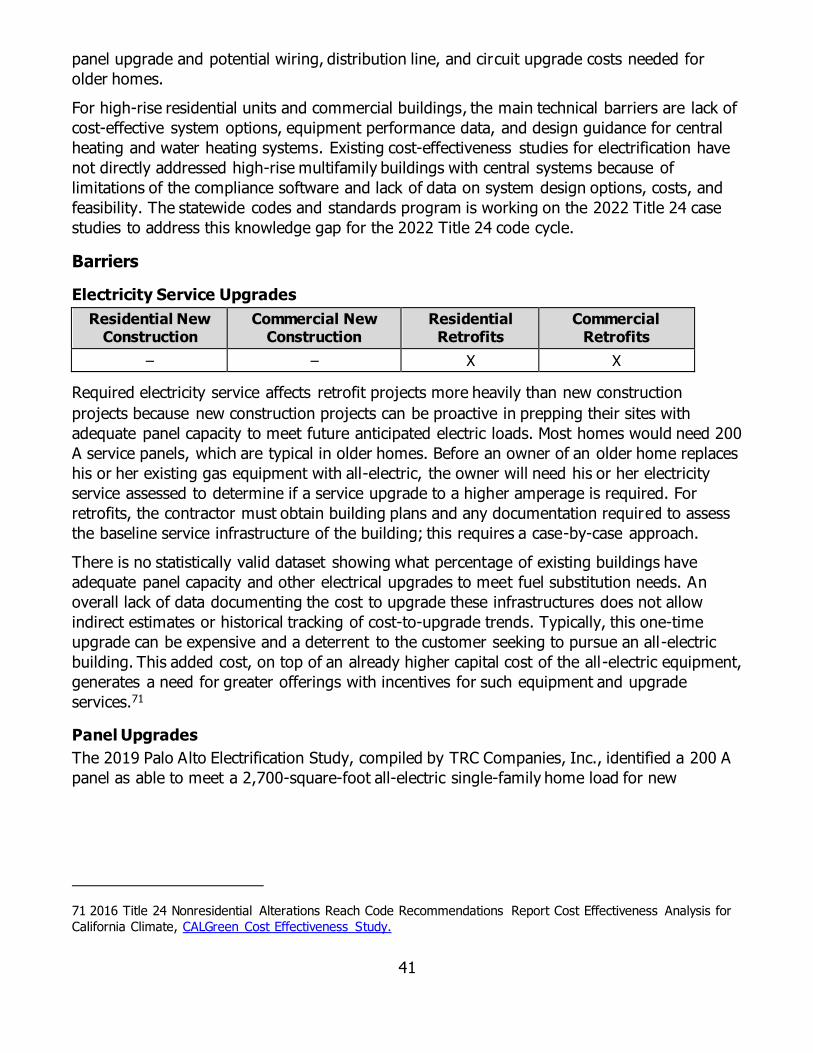
41
panel upgrade and potential wiring, distribution line, and circuit upgrade costs needed for
older homes.
For high-rise residential units and commercial buildings, the main technical barriers are lack of
cost-effective system options, equipment performance data, and design guidance for central
heating and water heating systems. Existing cost-effectiveness studies for electrification have
not directly addressed high-rise multifamily buildings with central systems because of
limitations of the compliance software and lack of data on system design options, costs, and
feasibility. The statewide codes and standards program is working on the 2022 Title 24 case
studies to address this knowledge gap for the 2022 Title 24 code cycle.
Barriers
Electricity Service Upgrades
Residential New Construction
Commercial New Construction
Residential Retrofits
Commercial Retrofits
– – X X
Required electricity service affects retrofit projects more heavily than new construction
projects because new construction projects can be proactive in prepping their sites with
adequate panel capacity to meet future anticipated electric loads. Most homes would need 200
A service panels, which are typical in older homes. Before an owner of an older home replaces
his or her existing gas equipment with all-electric, the owner will need his or her electricity
service assessed to determine if a service upgrade to a higher amperage is required. For
retrofits, the contractor must obtain building plans and any documentation required to assess
the baseline service infrastructure of the building; this requires a case-by-case approach.
There is no statistically valid dataset showing what percentage of existing buildings have
adequate panel capacity and other electrical upgrades to meet fuel substitution needs. An
overall lack of data documenting the cost to upgrade these infrastructures does not allow
indirect estimates or historical tracking of cost-to-upgrade trends. Typically, this one-time
upgrade can be expensive and a deterrent to the customer seeking to pursue an all-electric
building. This added cost, on top of an already higher capital cost of the all -electric equipment,
generates a need for greater offerings with incentives for such equipment and upgrade
services.71
Panel Upgrades
The 2019 Palo Alto Electrification Study, compiled by TRC Companies, Inc., identified a 200 A
panel as able to meet a 2,700-square-foot all-electric single-family home load for new
71 2016 Title 24 Nonresidential Alterations Reach Code Recommendations Report Cost Effectiveness Analysis for
California Climate, CALGreen Cost Effectiveness Study.

42
construction and retrofits.72 The 200 A panels are the market standard for panel replacement
given typical heat pump, heat pump water heater, and all-electric appliance loads.73
New construction homes, specifically those with EV charging and PV systems incorporated into
the building design and construction, do not typically require electrical infrastructure upgrades.
However, homes with sub-200 A panels or larger existing homes that are approaching or
exceeding capacity on existing 200 A panels may need options to upgrade a branch circuit to
serve a new heat pump water heater.74 This option decreases the investment required but
caters to consumers who may already have most all-electric appliances and only wish to add
an electric or heat pump hot water heater.
It is hard to determine what stock of homes would need a simple branch circuit upgrade
versus the full panel upgrade. California electrical code requirements for electrical panel
capacity are updated regularly. New homes constructed in the past decade-plus would have
200 A panels based on the electrical code requirements. Older homes are unlikely to have 200
A panels solely due to code requirements; however, some fraction of those older homes may
have upgraded to a 200 A panel during home remodels, electrical upgrades to the house, or
reconstruction after natural disasters and other events. Therefore, code vintages do not
directly correlate with what fraction of existing homes have 200 A panels.
Electrical Wiring
Electrical wiring requirements and standards have changed over time and require large
appliances such as dryers, heaters, and water heaters to be on dedicated circuits. Further,
these larger appliances typically require larger capacity circuit breakers (30 A – 50 A) than
typical for lighting and general plug-in fixtures (typically 20 A). For most new construction
homes, adding separate circuits and wiring for fuel substitution is not costly. Title 24, Part 6
requires water heaters to be electric-ready by having a dedicated circuit and outlet next to a
gas water heater so that a replacement can be an electrical water heater.
In older homes, the type, gauge, and quality of the electrical wiring vary significantly. Homes
built before 1950 commonly have knob-and-tube wiring, which uses single insulated copper
conductors encased in porcelain tubes and supported by porcelain knob insulators. Building
codes now prohibit knob-and-tube wiring from new construction because of concerns about
safety, fire, and lack of adequate capacity. Several generations of power cables have replaced
knob and tube, each iteration safer and higher capacity than the previous version. As with
panel sizes, no one-to-one correlation among house vintage, location, and type of wiring
exists. It is not uncommon to have different generations of wires within an existing building
based on repairs, additions, and partial upgrades to the electrical wiring.
72 According to California Title 24, Part 6, Section 110.10 (b)1: for solar, “the main electrical service panel shall
have a minimum busbar rating of 200 A.” This is assuming that new construction single-family homes will have
solar, as per California’s Title 24 mandate for 2020.
73 TRC Companies, Inc., City of Palo Alto 2019 Title 24 Energy Reach Code Cost Effectiveness Analysis DRAFT,
September 2018.
74 Navigant Consulting, Inc. 2018. Impacts of Residential Appliance Electrification. California Building Industry
Association.
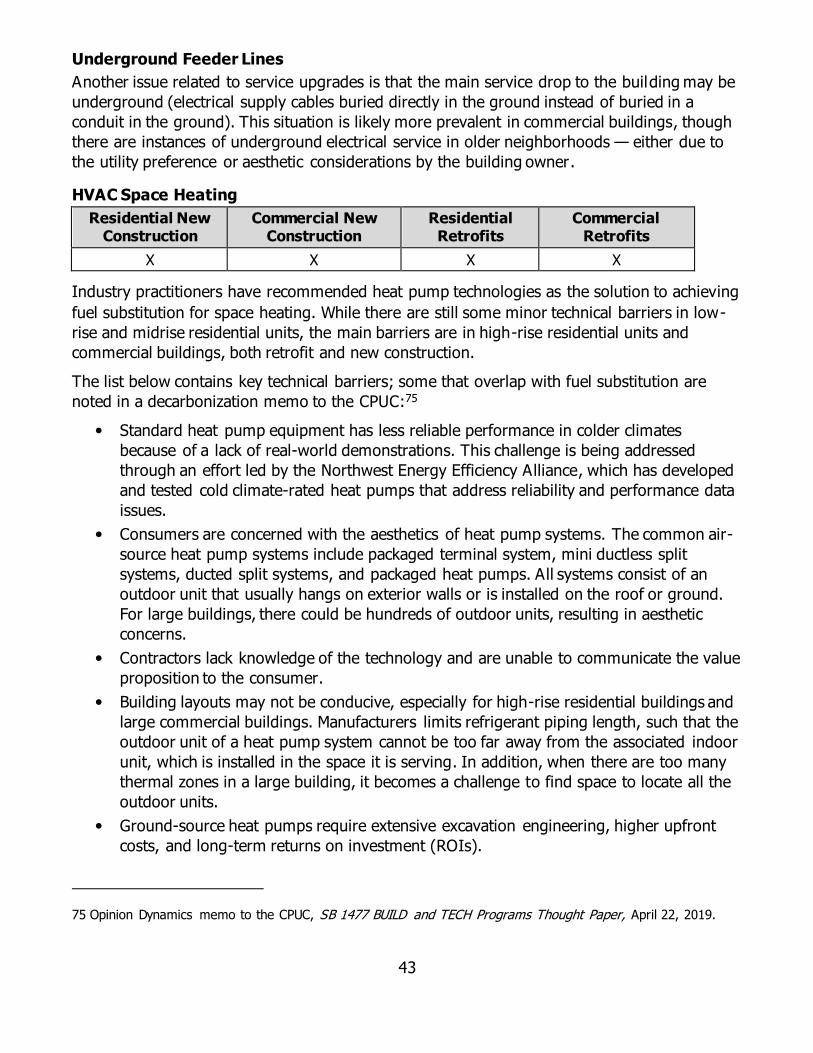
43
Underground Feeder Lines
Another issue related to service upgrades is that the main service drop to the building may be
underground (electrical supply cables buried directly in the ground instead of buried in a
conduit in the ground). This situation is likely more prevalent in commercial buildings, though
there are instances of underground electrical service in older neighborhoods — either due to
the utility preference or aesthetic considerations by the building owner.
HVAC Space Heating
Residential New Construction
Commercial New Construction
Residential Retrofits
Commercial Retrofits
X X X X
Industry practitioners have recommended heat pump technologies as the solution to achieving
fuel substitution for space heating. While there are still some minor technical barriers in low-
rise and midrise residential units, the main barriers are in high-rise residential units and
commercial buildings, both retrofit and new construction.
The list below contains key technical barriers; some that overlap with fuel substitution are
noted in a decarbonization memo to the CPUC:75
Standard heat pump equipment has less reliable performance in colder climates
because of a lack of real-world demonstrations. This challenge is being addressed
through an effort led by the Northwest Energy Efficiency Alliance, which has developed
and tested cold climate-rated heat pumps that address reliability and performance data
issues.
Consumers are concerned with the aesthetics of heat pump systems. The common air-
source heat pump systems include packaged terminal system, mini ductless split
systems, ducted split systems, and packaged heat pumps. All systems consist of an
outdoor unit that usually hangs on exterior walls or is installed on the roof or ground.
For large buildings, there could be hundreds of outdoor units, resulting in aesthetic
concerns.
Contractors lack knowledge of the technology and are unable to communicate the value
proposition to the consumer.
Building layouts may not be conducive, especially for high-rise residential buildings and
large commercial buildings. Manufacturers limits refrigerant piping length, such that the
outdoor unit of a heat pump system cannot be too far away from the associated indoor
unit, which is installed in the space it is serving. In addition, when there are too many
thermal zones in a large building, it becomes a challenge to find space to locate all the
outdoor units.
Ground-source heat pumps require extensive excavation engineering, higher upfront
costs, and long-term returns on investment (ROIs).
75 Opinion Dynamics memo to the CPUC, SB 1477 BUILD and TECH Programs Thought Paper, April 22, 2019.
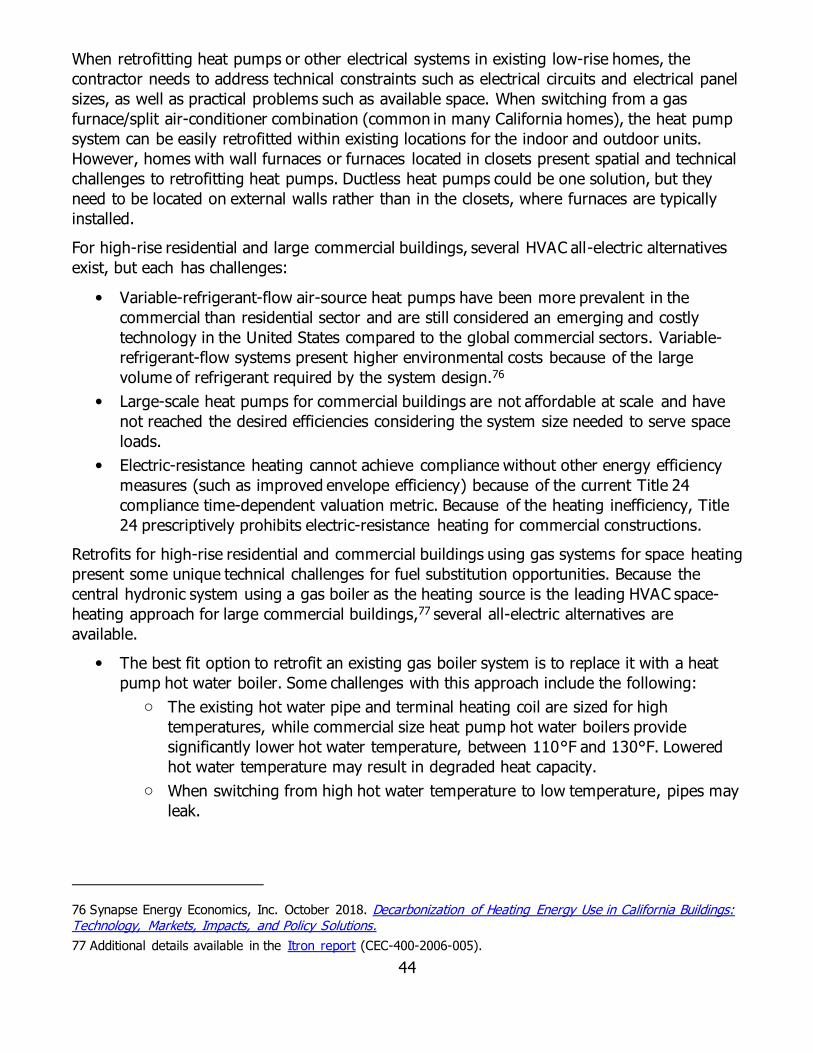
44
When retrofitting heat pumps or other electrical systems in existing low-rise homes, the
contractor needs to address technical constraints such as electrical circuits and electrical panel
sizes, as well as practical problems such as available space. When switching from a gas
furnace/split air-conditioner combination (common in many California homes), the heat pump
system can be easily retrofitted within existing locations for the indoor and outdoor units.
However, homes with wall furnaces or furnaces located in closets present spatial and technical
challenges to retrofitting heat pumps. Ductless heat pumps could be one solution, but they
need to be located on external walls rather than in the closets, where furnaces are typically
installed.
For high-rise residential and large commercial buildings, several HVAC all-electric alternatives
exist, but each has challenges:
Variable-refrigerant-flow air-source heat pumps have been more prevalent in the
commercial than residential sector and are still considered an emerging and costly
technology in the United States compared to the global commercial sectors. Variable-
refrigerant-flow systems present higher environmental costs because of the large
volume of refrigerant required by the system design.76
Large-scale heat pumps for commercial buildings are not affordable at scale and have
not reached the desired efficiencies considering the system size needed to serve space
loads.
Electric-resistance heating cannot achieve compliance without other energy efficiency
measures (such as improved envelope efficiency) because of the current Title 24
compliance time-dependent valuation metric. Because of the heating inefficiency, Title
24 prescriptively prohibits electric-resistance heating for commercial constructions.
Retrofits for high-rise residential and commercial buildings using gas systems for space heating
present some unique technical challenges for fuel substitution opportunities. Because the
central hydronic system using a gas boiler as the heating source is the leading HVAC space-
heating approach for large commercial buildings,77 several all-electric alternatives are
available.
The best fit option to retrofit an existing gas boiler system is to replace it with a heat
pump hot water boiler. Some challenges with this approach include the following:
o The existing hot water pipe and terminal heating coil are sized for high
temperatures, while commercial size heat pump hot water boilers provide
significantly lower hot water temperature, between 110°F and 130°F. Lowered
hot water temperature may result in degraded heat capacity.
o When switching from high hot water temperature to low temperature, pipes may
leak.
76 Synapse Energy Economics, Inc. October 2018. Decarbonization of Heating Energy Use in California Buildings: Technology, Markets, Impacts, and Policy Solutions.
77 Additional details available in the Itron report (CEC-400-2006-005).
https://www.synapse-energy.com/sites/default/files/Decarbonization-Heating-CA-Buildings-17-092-1.pdf

45
Electric-resistance heating is a viable option to replacing the existing hot water coil in a
terminal unit, such as the fan coil and variable air volume terminal unit. However, as
mentioned above, this option cannot easily achieve compliance.
Domestic Hot Water
Residential New Construction
Commercial New Construction
Residential Retrofits
Commercial Retrofits
X X X X
Alternative-fuel-source water heating options are electric hot water heaters, tankless electric
hot water heaters, heat pump hot water heaters, and CO2 heat pump water heaters, which
typically have the highest installed cost.
Commercial-scale heat pump water heaters are a relatively new design approach to
decarbonize domestic water heating; no design guidelines exist to ensure appropriate design.78
Industry modeling software, such as CBECC-Res,79 lacks the product design specifications to
model central heat pump water heaters.80 With a lack of uniform design guidelines within the
technician community, market penetration is stunted by the more common plumbing skillset of
natural gas system technicians. With the relatively new introduction of these systems in the
market, the National Appliance Energy Conservation Act has not published standards, which is
a barrier to the residential and commercial sectors. Overall, researchers identified the following
barriers to entry for heat pump water heaters:81
For residential:
o Customers may be unfamiliar with the technologies.
o There is a misconception that heat pump water heaters are noisy
o Retrofits can involve electric panel upgrades for larger volume units if other
wiring upgrades and additional service delivery upgrades are also required.
For commercial:
o For new constructions and retrofits, contractors may not be accustomed to
designing large storage tanks for central heat pump water heaters and
identifying adequate footprint spaces for wall-mounted and roof-mounted tanks.
o There is a lack of case studies and pilot projects associated with central heat
pump water heater savings.
o Disagreement about system sizing, configuration, or application of the central
heat pump water heater.
78 California Energy Commission and CPUC. July 2019. California Public Utilities Commission and California Energy Commission Staff Proposal for Building Decarbonization Pilots – Draft.
79 This is the standard Title 24 code-compliance software for residential. It models individual heat pump water
heaters, and the CEC is developing central heat pump water heater capabilities.
80 Statewide CASE Team, Work Plan: Central Heat Pump Water Heater: 2022 CASE Initiative,
https://title24stakeholders.com/measures/cycle-2022/multifamily-domestic-hot-water/.
81 Synapse Energy Economics, Inc. October 2018. Decarbonization of Heating Energy Use in California Buildings: Technology, Markets, Impacts, and Policy Solutions.

46
o Insufficient products available on the market.
o Code compliance simulation software not properly configured for this technology
analysis.
Technicians, contractors, and tradesperson jobs will be affected by switching gas to electric —
for example, where a plumber was required to perform gas water heater repairs, now an
electrician is also needed to fix an electric water heater or heat pump water heater.
Technical Solutions
Technical solutions include:
Supporting research efforts to improve the understanding of the technologies.
Developing design guidelines and tools to enable technology adoption for retrofit and
new construction applications.
Providing workforce training.
Collaborating with manufacturers to bring emerging technologies to the U.S. market.
Low-Power Heat Pump Water Heater/Retrofit-Ready Products
Residential New Construction
Commercial New Construction
Residential Retrofits
Commercial Retrofits
– – X X
Many studies refer to the integration of heat pump water heaters in new construction buildings
as the easiest adoption for fuel substitution.82 In new construction, the constraints that
retrofits face are typically not present due to 200 A panels, higher capacity service being
standard in new building code construction, and the ability to design around such electric
appliance requirements. Program design catered to the existing building market in California is
needed. The New Buildings Institute for the Building Decarbonization Coalition suggests a 12-
step design and implementation program for IOUs to adopt.83
The retrofit upgrades for homes with 60 A or 100 A services can be expensive for residents.
The CPUC is working on programs, incentives, and policies that will assist low-income
California residents and those in disadvantaged communities with these changes; the CPUC
has not defined the details of these programs.84 Another solution is developing a 120 V heat
pump water heater that can be installed in electrically constrained and space-constrained
locations. While an electric-resistance water heater would not have enough capacity with a
standard 110 V circuit, the technical potential for a heat pump water heater could meet this
constraint. To date, manufacturers have expressed some interest, but most have not publicly
communicated any plans to invest — presumably because of the still small market share for
82 New Buildings Institute for the Building Decarbonization Coalition. March 2019. California Retrofit-Ready Heat
Pump Water Heater Program Elements Framework, Version 4.
83 New Buildings Institute for the Building Decarbonization Coalition. California Retrofit-Ready Heat Pump Water Heater Program Elements Framework.
84 California Energy Commission and CPUC. July 2019. California Public Utilities Commission and California Energy Commission Staff Proposal for Building Decarbonization Pilots – Draft.

47
the 220 V heat pump water heaters. The introduction of the 15 A Rheem heat pump water
heater in 2018 may mean electrification is possible without upgrading the panel.85 Increasing
market availability and awareness of these systems should help programmatic efforts gain
more participation.
Heat Pump Water Heater Design Guidelines and Tools
Residential New Construction
Commercial New Construction
Residential Retrofits
Commercial Retrofits
X X X X
Centralized heat pump water heating is a key design strategy to fuel substitution for water
heating for residential and commercial buildings. Designers have implemented several
successful field demonstrations in Washington and California. System performance and
efficiency depend highly on design and are not guaranteed. No design guidelines exist to
ensure appropriate design, but several efforts are ongoing to address this issue:
IOU-sponsored laboratory testing of heat pump products and system design
configurations to develop heat pump water heating system models to include in
compliance software. Based on the testing results, stakeholders can develop installation
criteria for heat pump water heating systems.
2022 Title 24 Statewide Utility Codes and Standards Enhancement effort to develop a
prescriptive compliance pathway for central heat pump water heater systems. This work
involves market assessment, cost-effectiveness analysis, data collection from
demonstration projects, and real-world projects to understand system performance and
integrate best practices into code language.
Efforts for demonstration projects and design guide development would also improve the
technology adoption rate.
Variable Capacity Heat Pump for Space Heating Demonstration Projects
Residential New Construction
Commercial New Construction
Residential Retrofits
Commercial Retrofits
X X X X
Like heat pumps for water heating, there is no well-established design guideline to support
applications of large-scale air-to-water heat pumps. Case studies and technology
demonstration studies could support guideline development. The CEC sponsored a study of all-
electric technologies for water heating and HVAC in four zero-net-energy demonstration
projects in California.86 Two of the demonstration projects used large-scale air-to-water heat
pump systems that produce hot water for space heating and cooling. The study offers
opportunities to investigate the technologies in-depth and provides lessons learned.
85 Redwood Energy. 2019. A Zero Emissions All-Electric Multifamily Construction Guide;
Rheem Water Heating. July 2019. “Product Guide: Rheem Hybrid Electric Water Heaters.”
86 Build It Green. August 31, 2016. “Build It Green Wins Research Grant to Advance Multifamily Zero Net
Energy.”

48
For the variable-capacity air-to-air heat pumps, one major barrier is a lack of proof-of-concept
performance data. This issue could be addressed by demonstration research, development of
quality specifications accompanied by design, and installation and verification protocol:
IOU-sponsored demonstration projects — Central Valley Research Homes Variable
Capacity Heat Pumps, Evaluation of Ducted and Ductless Configurations 2016 – 2017,
PGE 2018_3 — explicitly and intentionally test systems relative to the proposed
prescriptive measure requirements and proposed performance modeling benefits.87
The research team suggests creating and using a heat pump quality specification, a
qualifying product list, and an accompanying design, installation, and verification
protocol across incentive programs to ensure performance of variable-capacity heat
pumps. The quality specifications could also support energy code calculations used
within Title 24, Part 6.
Workforce Training and Education
Residential New Construction
Commercial New Construction
Residential Retrofits
Commercial Retrofits
X X X X
Several reports have suggested the need for workforce training to promote
electrification.88Poorly installed heat pumps and heat pump water heaters could create
customer backlash against the technology. Workforce training, combined with a voluntary
certification program for building electrification, could provide quality assurance to customers
interested in switching to electric HVAC or water heating. Similarly, with CPUC guidance,
utilities could consider direct install and midstream programs to ensure fuel substitution
technologies are readily available by retailers, distributors, and contractors so that the
equipment can be installed immediately.
Market Barriers and Solutions
Even if the above-described technical barriers are resolved, significant market barriers still
stand in the way of fuel substitution. This section discusses barriers and solutions specific to
individual sectors and end uses.
Market Barriers
A study by Synapse Energy Economics identifies customer and contractor unfamiliarity with
heat pump technologies as a primary market barrier.89 This unfamiliarity makes it difficult for
residential customers to break the trend of replacing heating systems with the same fuel type
and equipment previously installed, specifically in replace-on-burnout situations. A lack of
87 California Energy Commission, Central Valley Research Homes Project, November 2018.
88 Energy and Environmental Economics, Inc, Residential Building Electrification in California Consumer economics, greenhouse gases and grid impacts, April 2019. New Buildings Institute for the Building
Decarbonization Coalition, California Retrofit-Ready Heat Pump Water Heater Program Elements Framework,
Version 4, March 2019.
89 Synapse Energy Economics, Inc., Decarbonization of Heating Energy Use in California Buildings: Technology, Markets, Impacts, and Policy Solutions, October 2018.

49
knowledge transfer from contractors to customers can also deter customers interested in but
not familiar with these technologies.
Commercial HVAC
Like the residential sector, high installed costs and capital constraints, along with the lack of
consumer awareness and staff training, pose major barriers to electrification. A lack of case
studies associated with the electrification of larger HVAC systems presents a data validation
and overall reassurance gap for prospective customers to use as a knowledge base to support
the higher capital investment such systems generally require.
Regarding retrofit projects, the commercial sector also faces limitations associated with
building owners and operators pursuing lower upfront cost options, opting to use existing
ductwork infrastructure rather than transitioning to ductless, ground, or variable-refrigerant-
flow90 systems typical of larger commercial building HVAC loads. Even with a lack of data and
the present apprehension toward higher-sticker-price electric systems, variable-refrigerant-
flow systems require much less space for new construction projects because of the
substitution of large duct runs for refrigerant lines.
Residential Domestic Hot Water
Immediate replacement on burnout is a major barrier because consumers typically have an
urgent need for hot water service. Due to unfamiliarity with all-electric units, purchasing a
one-for-one natural gas unit replacement is most common for users. Two reasons for low
penetration are most typical:
Higher capital cost for heat pump water heaters or electric-resistance units makes these
units unappealing.
For existing homes, an adequate electrical panel or building circuit capacity to
accommodate the electric water heater may not be present.91
Adoption of electric water heaters may increase with more end-user education and outreach
about the cost- and non-cost-related benefits. Such benefits include incentives to shift usage
to cheaper times of day, which may provide savings to the customer; DR program enrollment
options that can increase grid reliability; and participant incentives in some IOU territories.
Commercial Domestic Hot Water
Due to the low market penetration data, case studies are scarce, and the U.S. Department of
Energy92 excluded heat pump water heaters because the number of consumers adopting heat
90 Variable refrigerant flow or VRF systems vary the flow of the refrigerant to the indoor units providing cooling
to a space.
91 Additional variable refrigerant flow market penetration available on p. 80 of the National Renewable Energy
Laboratory’s, Proven Energy -Saving Technologies for Commercial Properties (2015) report.
92 U.S. Department of Energy. April 2016. Technical Support Document: Energy Efficiency Program for Consumer Products and Commercial and Industrial Equipment: Commercial Water Heating Equipment.
50
pump water heaters has been low.93 There is a gap in the best practices for sizing such electric
systems for commercial applications because no code or guidelines reference is uniformly
adopted. This barrier again is marked by the lack of penetration of these products in the
commercial sector, an issue that utilities can begin to address through incentives, rebates, and
programs to promote consumer adoption of such electric-resistance or heat pump water
heater units.
Appliances
Aside from costs, electric stoves and heat pump dryers94 are faced with heavy consumer
preference and usage modification requirements. In general, because cooking is considered a
lifestyle choice, purchasing is mostly driven by performance and cost, while energy
consumption is considered secondary. For example, consumers may prefer the quick heating
and controllability of natural gas, while electric induction heating is just as fast, if not faster,
but requires different cooking habits.95 Changing consumer preference and allowing them time
to accept modifications to his or her cooking habits could slow all-electric cooktop and oven
adoption. Though electric stoves have been prevalent in the market and serve as a great
alternative to gas stoves, induction stoves provide a greater efficiency benefit overall. Because
induction stoves use the electromagnetic field to heat the pot (rather than radiant heat), some
additional hurdles exist for this technology. Researchers identified the following market
barriers for induction stoves and dryers:96
Customer bias toward gas stoves due to tradeoffs associated with cooking habits,
recipes, and new cookware, including transitioning to equipment that behaves
differently.
These cooktops do not have actual flames that can char foods, which is a preference for
some customers; the magnetic field can interfere with digital thermometers and other
digital kitchen equipment.
For heat pump dryers, costs are higher than typical ENERGY STAR®-rated gas dryers,
and drying times can be greater than those of traditional electric or gas dryers.
Market availability for heat pump dryers is limited due to the introduction of the technology to
the market. Given this entry, manufacturers are uncertain about the ability for the U.S. market
infrastructure to accommodate these products and turn a profit.97
93 Additional information on existing commercial heat pump water heaters is available in the National Renewable
Energy Laboratory’s Electrification Futures Study.
94 A “heat pump dryer” uses a refrigerant system that can be heated and cooled.
95 Northeast Energy Efficiency Partnership. December 2018. Developing a Pathway to Decarbonize Existing
Buildings.
96 Synapse Energy Economics, Inc. October 2018. Decarbonization of Heating Energy Use in California Buildings: Technology, Markets, Impacts, and Policy Solutions.
97 More information available in Appendix C: Customer Barriers Analysis of EMI Consulting’s, Pacific Gas & Electric ENERGY STAR Retail Product Platform (ESRPP) Program Pilot Early Evaluation (January 2019).
https://www.synapse-energy.com/sites/default/files/Decarbonization-Heating-CA-Buildings-17-092-1.pdf
51
Market Solutions
Residential and Commercial HVAC
The major hurdles to be cleared are ways to funnel information effectively to potential
consumers on these newer electric-based technologies, the long-term payback of the
technologies, and associated environmental benefits to adoption.98 To address the lack of
technical knowledge transfer of heat pump benefits to customers, utilities could bear a portion
of this responsibility by providing educational materials on these products; these materials can
translate the technical information associated with heat pumps to promote informed decisions
regarding technology adoption.
For commercial HVAC, variable-refrigerant-flow systems are considered innovative and yield
project-specific energy savings, which qualify these measures for custom financial energy
efficiency measure incentives. With the newly available funds for electrification because of the
changes to the fuel substitution test, funding and programs for such will likely increase.
Residential and Commercial Domestic Hot Water
Solutions to promote the adoption of the heat pump water-heater technologies come in a few
forms. Early retirement programs offered by utilities help customers make more informed
decisions by providing information regarding electric water heaters when they are deciding on
a replacement unit. These programs reduce the stress and urgency that replace-on-burnout
situations place on the ratepayer.
Utility-offered discounts for customers enrolling in grid-control or demand response programs
are one of the most basic solutions and help reduce the effects of the installation and
operating costs. Applying control systems to electric-resistance and heat pump hot water
heaters enables these units to be used as grid management components, which is becoming
increasingly important as electric usage grows. The control systems allow customers, grid
operators, and third parties to control the state of charge99 of the water heater and employ DR
signals and load shifting, which can decrease customer bills and increase grid reliability by
alleviating load during peak usage periods.100 To promote higher penetration of these electric-
resistance and heat pump hot water heater units into the market, utility incentives by way of
DR programs are a prime entry point.101
A potential pathway and major incentive to the adoption of heat pump water heaters in
commercial buildings are the dual service these units provide. Heat pump water heaters
produce hot water and cool air, which have the potential to significantly offset capital costs in
98 Lawrence Berkeley National Laboratory. March 2018. Electrification of Buildings and industry in the United States: Drivers, Barriers, Prospects, and Policy Approaches.
99 The state of charge for a water heater is the equivalent to the level of charge an electric battery as a
percentage of capacity. To use water heaters as a DR-enabled device, the water must be heated (state of
charge) to be available for DR signals.
100 The Regulatory Assistance Project. January 2019. Beneficial Electrification of Water Heating.
101 Additional information of existing commercial heat pump water heaters is available in the National Renewable
Energy Laboratory’s Electrification Futures Study.

52
service spaces such as laundries, hotels, restaurants, and other building types where
simultaneous demand for hot water and space conditioning is needed.
Cost Barriers and Solutions
Balancing the costs and benefits of fuel substitution opportunities is a challenge because many
benefits are associated with longer-term GHG emissions reductions and not necessarily short-
term customer bill savings. Many studies conducted on fuel substitution to reduce GHG
emissions in residential and commercial markets suggest that low-rise residential all-electric
new construction options provide the most promising capital cost, bill, and life-cycle potential
savings — specifically those savings associated with near-term emissions reductions. This
conclusion indirectly highlights retrofit options and commercial sector projects as not being as
promising for consumer cost savings.102
The industry will need to continue developing fuel substitution technologies for buildings.
Contractors will need to abide by best practices during project scoping and electric equipment
installations to reduce overall costs. The lack of retrofit-ready heat pump unit options in the
United States means a barrier to entry as well as an opportunity in the market. Furthermore,
an overall lack of lower-cost electrical panel upgrade packages in the market bars owners of
older homes in lower income brackets to transition to electric equipment and appliances to
safely accommodate the added loads of electric heat pumps, water heaters, and appliances.
A Navigant (now Guidehouse) study notes that required electrical infrastructure upgrades to
existing homes pursuing fuel substitution could experience total cost increases from $4,600 to
$7,300 and $5,000 to $8,500 for 2020 and 2030, respectively. These costs include appliance
and infrastructure upgrades. Homes that have the electrical infrastructure capacity to meet the
additional load because of electrification are estimated to experience total cost increases from
$250 to $3,000 in 2020 and $400 to $2,700 in 2030.103 The electrical system upgrades range
from $2,000 to $4,000 in added capital costs and are one of the only options given the
industry standard amperage of heat pump options in the United States.
Total construction costs for new mixed fuel homes include the cost associated with electric and
gas utility connections. Historically, gas utilities have subsided a portion of the gas connection
cost (as high as 50 percent). Energy and Environmental Economics points out that as the
population of gas consumers decreases, gas utilities may choose to adjust these subsidies,
which could affect the cost borne by the builder and ultimately be passed on to the consumers
that still opt for mixed-fuel homes.104
102 Energy and Environmental Economics, Inc. April 2019. Residential Building Electrification In California Consumer Economics, Greenhouse Gases and Grid Impacts.
103 Navigant Consulting, Inc. 2018. Impacts of Residential Appliance Electrification, for California Building
Industry Association.
104 Merchant, Emma. June 18, 2018. “Electric Heating Accelerates the Push for Deep Decarbonization, but Cost
Remains an Issue.” Greentech Media.

53
Costs Barriers
This section covers the costs associated with fuel substitution for the customer and the utility.
Some of these costs have been discussed as part of the Technical and Market Barriers
sections.
Customer-Side Electrical Upgrades
For electrical upgrade costs, customers are responsible for behind-the-meter costs such as
panel upgrades. For existing homes, one study estimates the cost of upgrading from a 100 A
capacity panel to 200 A capacity panel to be around $2,000-$4,000, while branch circuit
upgrades for heat pump water heaters going from a 15 A circuit to 20 A circuit were estimated
at $600-$700.105 One study estimates utility service fees for residential new construction to be
about $800-$900.106 A detailed breakdown of associated electrical costs for customers can be
found in Appendix A, which details the cost findings of reach code studies.
Utility-Side Infrastructure Upgrades
Increased electricity usage will lead to costs on the utility side in the form of electrical
infrastructure upgrades and grid modifications to accommodate the increased electrification
loading. The literature available covering the utility cost barriers to fuel substitution that
addresses the increased electricity load is oriented primarily around distributed generation.
While this scenario is not directly reflective of fuel substitution, the research team considers
these findings and recommendations enough to address the increased capacity of the electric
grid. The utility costs are typically low or negligible when changes in load are below 20 percent
of the peak load on the distribution feeder. If the newly connected devices are managed to
minimize use during peak hours, there will be a lower need for utility-side upgrades.
A distributed generation integration cost study conducted by Navigant (now Guidehouse)107
evaluated three location scenarios and summarized the cost findings:
The cost depends highly on locational factors for necessary upgrades for the feeder,
distribution and transmission systems a.
Integration impacts and costs are lower when distributed generation is installed in
urban areas, where feeders are shorter and often equipped with larger conductor or
cable along the entire length of the circuit.
Integration costs increase significantly as greater amounts are clustered or installed
near the end of distribution lines.
Policies that encourage implementing fuel substitution opportunities (beneficial or
targeted electrification) in areas with fewer impacts would minimize grid integration
105 Navigant Consulting, Inc. 2018. Impacts of Residential Appliance Electrification, for California Building
Industry Association.
106 Cost assumes a need to upgrade the wire from the utility to the home; source: TRC Companies, Inc.
September 2018. City of Palo Alto 2019 Title 24 Energy Reach Code Cost Effectiveness Analysis DRAFT.
107 Navigant Consulting, Inc. November 2013. Distributed Generation Integration Cost Study.
54
costs; however, the lowest total cost solutions would need to factor in procurement
costs of the systems.
The integration costs range along an urban-to-rural deployment spectrum, where lower
integration costs occurred toward the highly urban deployment and higher integration costs
fell toward the highly rural deployment. The total integration costs range from $190/kW to
$270/kW for the distribution system,108 following the same trend of increasing costs with
decreased urban locational classification. Location can greatly affect integration costs and
updating electrical equipment to increase the load from accompanying electrification will follow
a similar trend.
The National Renewable Energy Laboratory (NREL) studied the cost of electric distribution
system upgrades with a focus on distribution feeder systems. Feeder upgrade costs pose a
barrier in terms of executing the required electrical system upgrades to accommodate new
load. Appendix A provides two case studies.
While these studies provide reference for utility pricing upgrades on a dollar-per-watt basis,
the unknowns associated with electricity demand market trends and specific needs to update
feeders and distribution systems make it difficult to ascertain exact systemwide deployment
costs. The variability in increased electrification load adoption creates high uncertainty, and
this uncertainty is a major fuel substitution cost barrier.
HVAC Costs
A wider range of high-efficiency electric technologies, available in Europe and Japan, need to
penetrate the U.S. market to enable new construction, and specifically retrofit fuel substitution
projects, to succeed at scale. When owners of older homes without air conditioning would like
to pursue switching to an electric heat pump, they encounter a cost barrier because there is a
notably higher incremental upfront capital cost for fuel substitution. This increased cost is
because the prescribed heat pump provides heating and cooling, while the baseline did not
include cooling equipment. Further, utility costs increase because the house can now provide
cooling in addition to heating, so the heat pump can run longer than in a heating-only
scenario. For example, homes on the north coast of California typically do not have air-
conditioning units because of temperate coast climates, so they face a higher cost for the heat
pump versus a gas furnace replacement.
Residential
The Rocky Mountain Institute109 performed a detailed assessment of electrification upgrades in
the residential sector, with case studies completed in multiple locations. This cost comparison
showed that cost barriers still exist for retrofit heat pumps compared to natural gas
alternatives in extremely hot climates. The Oakland, California, example indicates that natural
gas with existing air conditioning is cheaper on the 15-year net-present cost scale110 for
retrofits compared to standard and high efficiency heat pumps. New construction does not
108 Typically, interconnection costs are borne by the customer, not the utility.
109 Rocky Mountain Institute. 2018. The Economics of Electrifying Buildings.
110 “Net-present costs” values the cash flow of the difference between the benefits and costs in current year
dollars.

55
present the same cost barriers because heat pump installations are cheaper than natural gas
with air conditioning on the same 15-year net-present cost scale in both scenarios. Appendix A
contains a figure showing the cost comparison from this study, which also pertains to hot
water heating.
Specific factors affect these costs:
If electric rates are higher than gas based on energy content, the economics of
switching to a heat pump are less favorable for the customer, specifically for replace-
on-burnout situations.
An appropriate adjustment to end-user behavior and time-of-use rates must be made.
Commercial
The 2020 projections for commercial technologies indicate a higher capital cost for heat pumps
and electric appliances relative to the gas counterparts.111 In models using the economics of
current heat pump technologies, projections through 2050 for space heating in warm and cool
climates show air-source heat pumps reaching the lowest cost in warm and moderate climates.
These findings suggest larger barriers to adoption for commercial all-electric HVAC will be
prevalent in cooler climates.
An additional barrier will be the demand charges associated with the commercial rate tariffs.
Baseline and peak demand of commercial customers switching to all-electric heating and water
heating loads will increase along with the customer’s electric bill, which was considerably lower
with gas-fueled equipment.
Domestic Hot Water
A standalone replacement of an existing gas storage or tankless gas water heater with a heat
pump water heater does not generate life-cycle cost savings. Rather, life-cycle savings are
seen when heat pump water heater and heat pump HVAC retrofits are combined, which may
not be conducive to the consumer’s remaining useful life on either of the current gas-
consuming units. The two major financial barriers specific to heat pump hot waters heaters
are:112
The space constraints needed to provide enough air volume for the heat pump (that is,
large rooms, basements, garages, or laundry rooms). In the event the baseline gas or
electric water heater is not placed in a space with adequate air volume, installation
costs will increase or require more costly solutions compared to a standard water
heater.
Life-cycle costs vary from effective to ineffective depending on climate zone, utility rate,
and equipment efficiency.
Figure 9 compares the projected life-cycle costs for various California residential water heating
appliances under different inflation scenarios. The first inflation scenario compares the life-
cycle costs of water heating technologies with a price increase of 2 percent per year for both
111 Lawrence Berkeley National Laboratory. March 2018. Electrification Of Buildings And Industry In The United States – Drivers, Barriers, Prospects, and Policy Approaches.
112 Ibid.
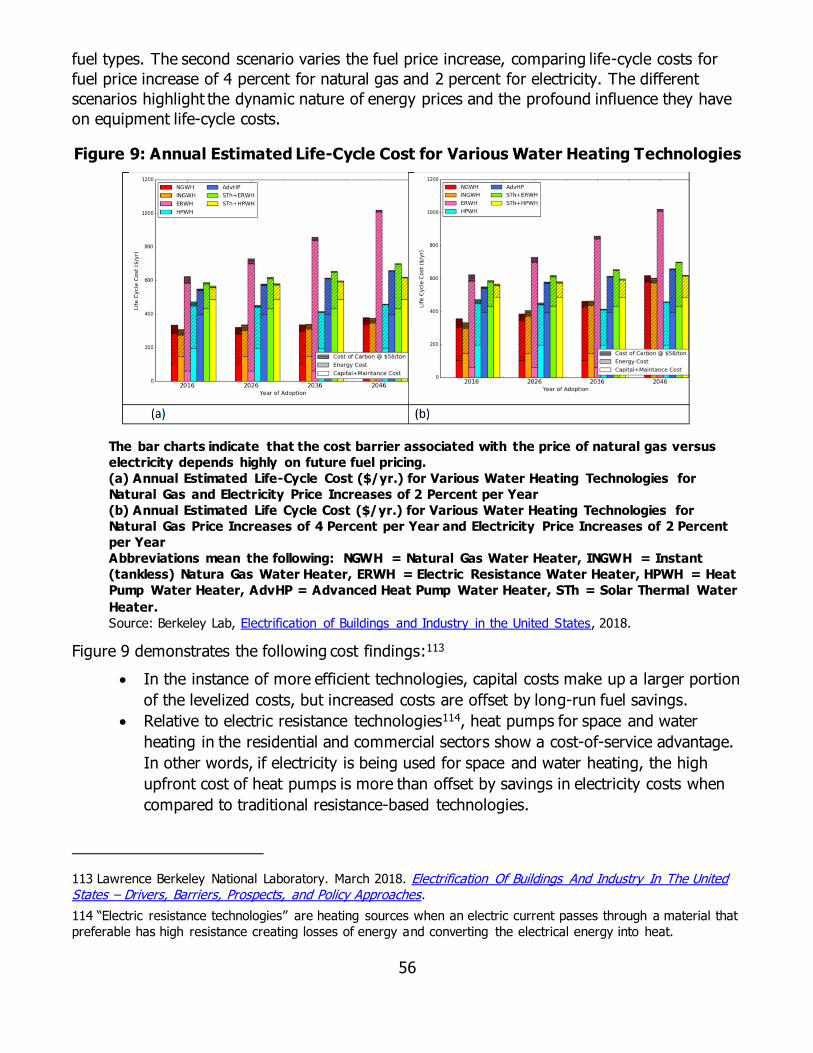
56
fuel types. The second scenario varies the fuel price increase, comparing life-cycle costs for
fuel price increase of 4 percent for natural gas and 2 percent for electricity. The different
scenarios highlight the dynamic nature of energy prices and the profound influence they have
on equipment life-cycle costs.
Figure 9: Annual Estimated Life-Cycle Cost for Various Water Heating Technologies
The bar charts indicate that the cost barrier associated with the price of natural gas versus
electricity depends highly on future fuel pricing.
(a) Annual Estimated Life-Cycle Cost ($/yr.) for Various Water Heating Technologies for
Natural Gas and Electricity Price Increases of 2 Percent per Year
(b) Annual Estimated Life Cycle Cost ($/yr.) for Various Water Heating Technologies for
Natural Gas Price Increases of 4 Percent per Year and Electricity Price Increases of 2 Percent
per Year
Abbreviations mean the following: NGWH = Natural Gas Water Heater, INGWH = Instant
(tankless) Natura Gas Water Heater, ERWH = Electric Resistance Water Heater, HPWH = Heat
Pump Water Heater, AdvHP = Advanced Heat Pump Water Heater, STh = Solar Thermal Water
Heater.
Source: Berkeley Lab, Electrification of Buildings and Industry in the United States, 2018.
Figure 9 demonstrates the following cost findings:113
In the instance of more efficient technologies, capital costs make up a larger portion
of the levelized costs, but increased costs are offset by long-run fuel savings.
Relative to electric resistance technologies114, heat pumps for space and water
heating in the residential and commercial sectors show a cost-of-service advantage.
In other words, if electricity is being used for space and water heating, the high
upfront cost of heat pumps is more than offset by savings in electricity costs when
compared to traditional resistance-based technologies.
113 Lawrence Berkeley National Laboratory. March 2018. Electrification Of Buildings And Industry In The United States – Drivers, Barriers, Prospects, and Policy Approaches.
114 “Electric resistance technologies” are heating sources when an electric current passes through a material that
preferable has high resistance creating losses of energy and converting the electrical energy into heat.

57
Current (or near future expected) residential air-source heat pumps and heat pump
water heaters are approaching cost parity with incumbent natural gas technologies
in moderate-to-warm climates. In cold climates, however, incumbent gas
technologies continue to exhibit an advantage relative to cold-climate air-source
heat pumps. As a result, with modest improvements in the cost and performance of
residential air-source heat pumps, the adoption of these technologies over natural
gas technologies could be driven by pure cost advantages in moderate-to-warm
climates, but greater improvements would likely be needed for adoption in cold
climates.
Appliances
Under current utility rates, electric stoves, convection ovens, and dryers have not yielded life-
cycle cost savings relative to the gas counterparts because of the initial cost. Many customers
are unfamiliar with these technologies, and the appeal of the lifetime savings of these
technologies is typically shadowed by the upfront capital cost. With initial installation costs
typically higher than convention gas appliances to install, consumers are more inclined to stick
with a gas appliance repair or replacement when faced with a failing gas appliance. Due to low
turnover and the high capital investments for stoves and clothes dryers, the most cost-
effective time to switch to electric appliances is during new construction and replace-on-
burnout projects or home renovations. A study by Synapse Energy Economics identifies the
following market barriers:115
Additional costs for the required magnetic cookware, which contain steel or iron, used
to transmit the magnetic field and subsequently the heat.
Capital costs — induction cooktops are more expensive then electric units using glass-
ceramic surfaces; the switch from gas to electric units can require panel upgrades for
higher-amperage capacities.
Upfront costs for convection ovens are typically higher than traditional ovens.
Consumer expectations require users to adjust recipes and approach to account for
changes in cooking time.
Cost Solutions
Several potential solutions address the cost barriers:
Industry advances in technology and research and development to create economies of
scale to drive electric appliances and HVAC costs down. For example, residential heat
pump water heater initiatives can drive down the cost of systems by creating greater
market demand, thus reducing the cost premium for the technology.
Potential IOU, POU, and CCA emerging program incentives to reduce financial barriers
to consumers. As identified in the Solutions section, a few programmatic efforts are
already underway.
115 Synapse Energy Economics, Inc. October 2018. Decarbonization of Heating Energy Use in California Buildings: Technology, Markets, Impacts, and Policy Solutions.

58
Emerging technology options for heat pump water heaters, heat pump space heating,
induction cooking, and heat pump dryers that run on lower wattages. These are
typically smaller capacity but are perfectly suited for smaller residential applications,
including multifamily. These could reduce panel upgrade costs and design constraints.
Demand flexibility optimized for typical time-of-use rates that can reduce energy costs.
However, it is not usually significant enough to tip the scales in favor of fuel
substitution. Different pricing structures that capture more of the flexible capability of
these devices could provide greater value and improve customer economics.116
New programs supporting systematic electrification of blocks or neighborhoods to
deenergize segments of the gas distribution system, such as panel box upgrades. These
programs could result in more cost-efficient retrofits than one-off projects with a local
electrician.
Studies that review the cost barriers, similar to the U.S. Department of Energy’s Solar
Energy Technologies Office review of the soft costs of solar installations. These studies
could help reduce fuel substitution implementation costs.117
Data Gaps
The following summarizes the data gaps researchers identified when evaluating the policy,
technical, and cost barriers and solutions in residential and commercial sectors:
General: Efforts are underway to identify appropriate systems for central water
heating using heat pumps. Limited data on the performance of various system choices
exist, and no standardized methods for design, specification, and installation enable
these technologies to have wider applications.
Electrical service upgrades: No statistically valid dataset showing what percentage
of existing buildings have adequate panel capacity and other electrical upgrades to
meet fuel substitution needs exists. Moreover, an overall lack of data documenting costs
to upgrade these infrastructures does not allow indirect estimates or historical tracking
of cost-to-upgrade trends. For retrofits, the main service to the building may have
inadequate capacity to serve the required wattage when electrifying major end uses in
the building. There is no statistically sound dataset available to evaluate the prevalence
of this issue. The CEC and CPUC are implementing the BUILD and TECH programs,
which may present an opportunity to address this data gap through data collection and
evaluation.
Commercial space heating: The major gap is product availability and performance
data for large-capacity heat pump systems. Limited options are available for upgrading
existing variable-air-volume systems that use natural gas for reheating. Electric
resistance retrofits are feasible, but there are cost implications in terms of first costs
and operational costs. Case studies and technology demonstration studies that present
a savings data validation for electrifying larger HVAC systems could provide overall
116 Rocky Mountain Institute. 2018 The Economics of Electrifying Buildings.
117 “Soft Costs,” Solar Energy Technologies Office, U.S. Department of Energy, accessed August 2019.

59
reassurance for prospective customers to support the higher capital investment such
systems generally require.
Multifamily water heating: Especially for large residential buildings, case studies and
technology demonstration studies are needed to provide lessons learned and improve
customer confidence and acceptance of the technology. Efforts are underway to identify
appropriate systems for central water heating using heat pumps.
Residential cooking: Limited data on consumer acceptance of induction cooktops
exist. Discussions and efforts to date have focused on getting the word out, but
significant efforts are necessary to promote induction cooktops to address consumer
apprehensions about the effect of the technology on cooking methods. Specific efforts
are needed to address technology options for nonwestern cooking that rely on high
heat or open flames.
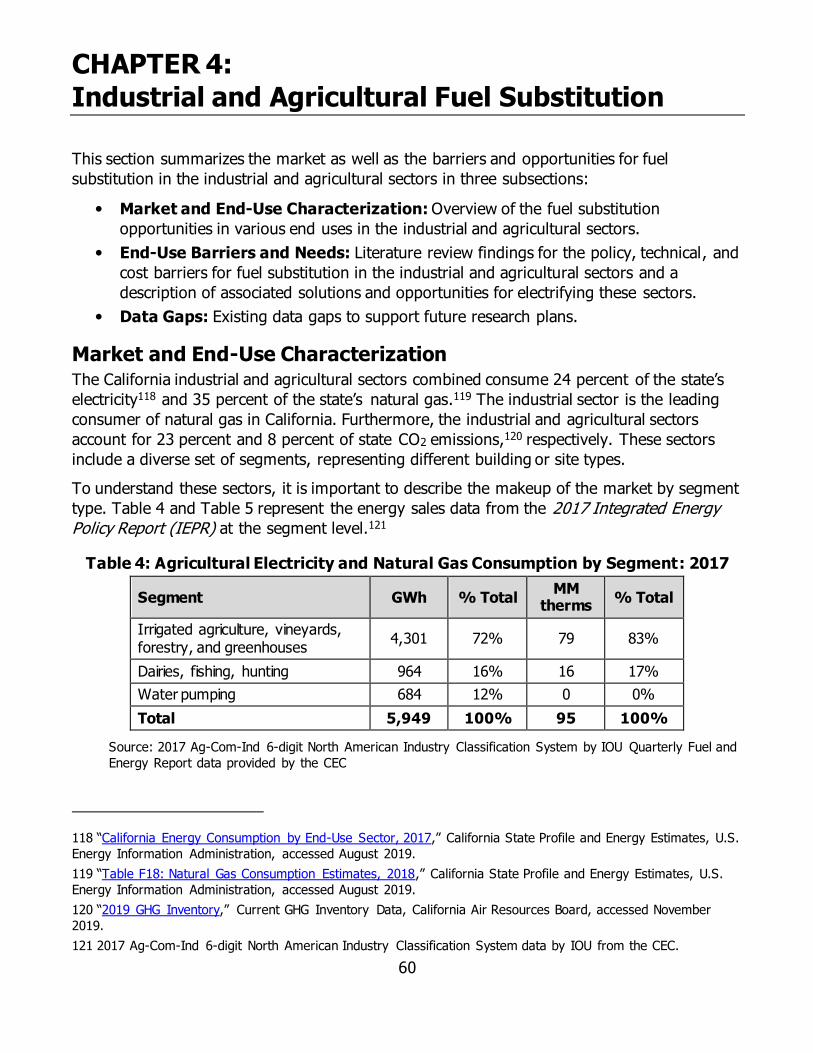
60
CHAPTER 4:
Industrial and Agricultural Fuel Substitution
This section summarizes the market as well as the barriers and opportunities for fuel
substitution in the industrial and agricultural sectors in three subsections:
Market and End-Use Characterization: Overview of the fuel substitution
opportunities in various end uses in the industrial and agricultural sectors.
End-Use Barriers and Needs: Literature review findings for the policy, technical, and
cost barriers for fuel substitution in the industrial and agricultural sectors and a
description of associated solutions and opportunities for electrifying these sectors.
Data Gaps: Existing data gaps to support future research plans.
Market and End-Use Characterization The California industrial and agricultural sectors combined consume 24 percent of the state’s
electricity118 and 35 percent of the state’s natural gas.119 The industrial sector is the leading
consumer of natural gas in California. Furthermore, the industrial and agricultural sectors
account for 23 percent and 8 percent of state CO2 emissions,120 respectively. These sectors
include a diverse set of segments, representing different building or site types.
To understand these sectors, it is important to describe the makeup of the market by segment
type. Table 4 and Table 5 represent the energy sales data from the 2017 Integrated Energy Policy Report (IEPR) at the segment level.121
Table 4: Agricultural Electricity and Natural Gas Consumption by Segment: 2017
Segment GWh % Total MM
therms % Total
Irrigated agriculture, vineyards, forestry, and greenhouses
4,301 72% 79 83%
Dairies, fishing, hunting 964 16% 16 17%
Water pumping 684 12% 0 0%
Total 5,949 100% 95 100%
Source: 2017 Ag-Com-Ind 6-digit North American Industry Classification System by IOU Quarterly Fuel and
Energy Report data provided by the CEC
118 “California Energy Consumption by End-Use Sector, 2017,” California State Profile and Energy Estimates, U.S.
Energy Information Administration, accessed August 2019.
119 “Table F18: Natural Gas Consumption Estimates, 2018,” California State Profile and Energy Estimates, U.S.
Energy Information Administration, accessed August 2019.
120 “2019 GHG Inventory,” Current GHG Inventory Data, California Air Resources Board, accessed November
2019.
121 2017 Ag-Com-Ind 6-digit North American Industry Classification System data by IOU from the CEC.
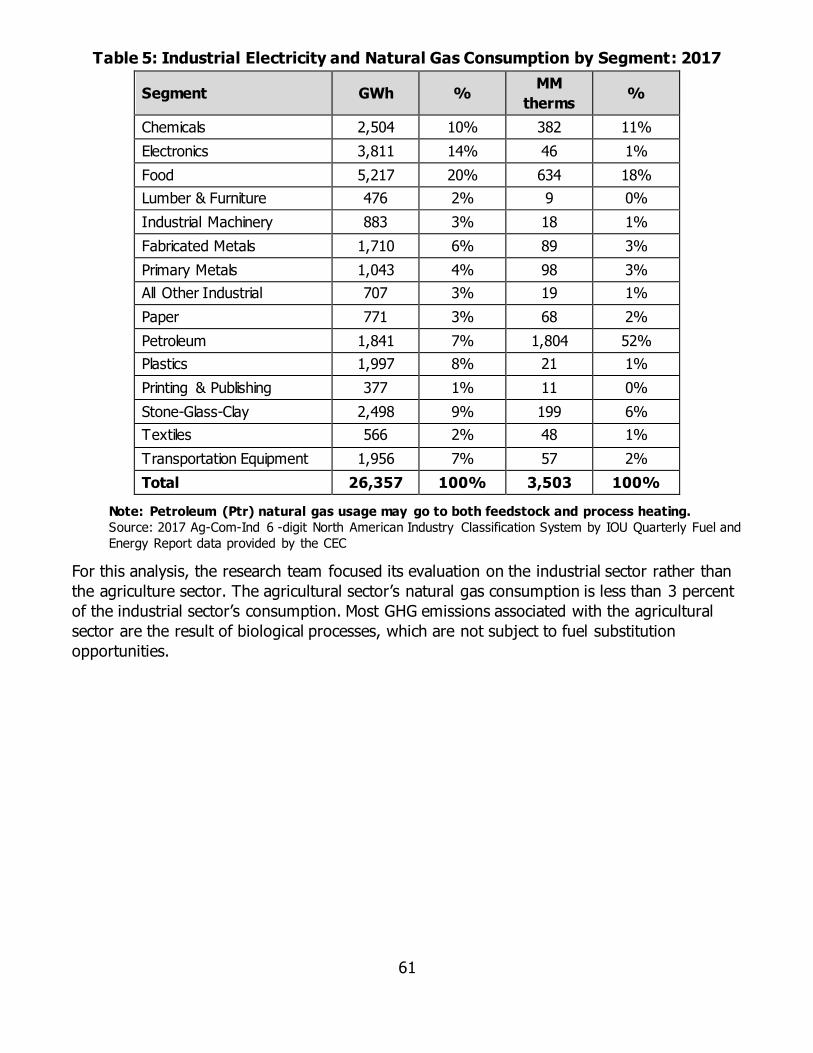
61
Table 5: Industrial Electricity and Natural Gas Consumption by Segment: 2017
Segment GWh % MM
therms %
Chemicals 2,504 10% 382 11%
Electronics 3,811 14% 46 1%
Food 5,217 20% 634 18%
Lumber & Furniture 476 2% 9 0%
Industrial Machinery 883 3% 18 1%
Fabricated Metals 1,710 6% 89 3%
Primary Metals 1,043 4% 98 3%
All Other Industrial 707 3% 19 1%
Paper 771 3% 68 2%
Petroleum 1,841 7% 1,804 52%
Plastics 1,997 8% 21 1%
Printing & Publishing 377 1% 11 0%
Stone-Glass-Clay 2,498 9% 199 6%
Textiles 566 2% 48 1%
Transportation Equipment 1,956 7% 57 2%
Total 26,357 100% 3,503 100%
Note: Petroleum (Ptr) natural gas usage may go to both feedstock and process heating.
Source: 2017 Ag-Com-Ind 6 -digit North American Industry Classification System by IOU Quarterly Fuel and
Energy Report data provided by the CEC
For this analysis, the research team focused its evaluation on the industrial sector rather than
the agriculture sector. The agricultural sector’s natural gas consumption is less than 3 percent
of the industrial sector’s consumption. Most GHG emissions associated with the agricultural
sector are the result of biological processes, which are not subject to fuel substitution
opportunities.

62
Table 6 lists the energy end uses in the industrial and agricultural sectors. Guidehouse focused
on only natural gas end uses in this review because of the potential for fuel substitution.
Table 6: Industrial and Agriculture Electricity and Natural Gas End Uses
Electricity Natural Gas
Compressed Air HVAC
HVAC Process Heating
Lighting Water Heating
Motors Other
Other Process
Process Cooling
Process Heating
Other
Source: Guidehouse analysis
The charts in Figure 10 provide the breakdown of the natural gas end uses within each sector.
Figure 10: Natural Gas End Use by Sector
In the industrial sector, process heat is the largest consumer of natural gas, whereas hot
water and HVAC consume the largest amount of natural gas in the agricultural sector.
Source: Industrial: Guidehouse analysis of Industrial Assessment Center data; Agriculture: Guidehouse
analysis of multiple sources
Industrial fuel substitution opportunities vary by segment and the nature of the production
process. The opportunities discussed in this report exclude natural gas as a feedstock used to
produce a product such as plastics, fertilizers, and various chemicals. When natural gas is used
for heating, the technological and economic potential is dictated by the operating parameters
of the production process (for example, temperature, duration, and frequency of the heating
cycle). Natural gas consumption is the main fuel source for conventional boiler use, combined
HVAC, 23%
Hot Water,
22%
Process Heat, 39%
Other, 16%
Industrial
HVAC, 35%
Hot Water, 38%
Process Heat, 17%
Other, 9%
Agriculture
63
heat and power (CHP) and cogeneration processes,122 process heating, and HVAC.
Consequently, these end uses provide the greatest opportunities for fuel substitution, though
the economics of fuel substitution in CHP applications are complex.123
Within the agricultural sector, HVAC, water heating, and process heating provide the greatest
opportunity for fuel substitution and GHG emissions reductions. The potential for these end
uses is still minimal compared to the industrial sector.
This study focuses on process heating, which may be from furnaces, boilers, or waste heat
from CHP applications. Process heating is the leading end use in industrial, whereas HVAC
leads the agricultural sector. In agricultural, greenhouses use HVAC to heat conditions during
the winter season, for example.124
End-Use Barriers and Needs The research team relied on previous research, including results from the Measure,
Application, Segment, Industry study,125 and primary data collection to understand the overall
needs and barriers for the industrial and agricultural sectors. The Measure, Application,
Segment, Industry study documented barriers related to energy efficiency, which also apply to
fuel substitution. Many of these barriers translate to specific needs that are unmet or
challenges to facilities that prevent measure implementation. While the original Measure,
Application, Segment, Industry work focused on the food processing segment, the research
team used this work to draw conclusions to apply to other segments, even if each segment
has unique characterizations. These generalizations work to address the industrial sector’s
needs and potential barriers to fuel substitution.
In general, any changes to facilities (including energy systems) must not negatively affect
product quality. Facility managers mentioned a hesitance to adopt energy-efficient measures
because they fear they may jeopardize the compliance of the facility with product safety and
standards or affect operational efficiency.
Table 7 lists the overall barriers and end-user needs for fuel substitution for the industrial sector. The barriers facing fuel substitution are like the barrier for implementing energy
efficiency retrofits.
122 This study does not include electrifying fossil fuel generation. Combined heat and power and cogeneration
are synonymous words, meaning the production of electricity while producing useful heat for with water, space,
or process heating.
123 NREL, pg. 53 of the Electrification of Industry: Summary of Electrifications Future Study Industrial Sector Analysis, 2018
124 Even though this section focuses on the industrial sector, there is crossover in the barriers and solutions
with the agricultural sector. This information regarding the highest gas end use in the agricultural sector helps
prioritize research and analysis going forward.
125 The California IOUs commissioned Navigant to complete studies for certain large customer segments in 2015.
One such study was the Measure, Application, Segment, Industry: New Opportunities in the Food Processing Industry study, which included detailed interviews with food processing customers; these interviews provided
information regarding pain points and barriers.

64
Table 7: Industrial End-User Needs and Barriers
Category Barriers Needs
Knowledge and Awareness
Lack of knowledge sharing across the industry. There is no platform for connecting with other similar facilities, whether that is via regular industry meetings or online discussion forums.
Lack of measure information and interaction from the energy utilities.
Lack of understanding of energy flows and savings potential.
New challenges and uncertainty in fuel substitution requirements
Energy management tools/ equipment: Many sites would benefit from tools or equipment that could help them better understand where the associated energy is being consumed.
Expert advice in energy audits and in planning stages of construction: A comprehensive energy audit would identify potential opportunities. Moreover, receiving expert advice during the early stages of construction would allow the project to implement fuel substitution measures at a lower cost.
Identifying existing industry resources (case studies): The CEC could provide a central authoritative source on what tools and information are available.
OEM engagements: These engagements include equipment providers to identify the potential to convert processing equipment from natural gas to electricity and financial, technical, and market support to capture early adopters.
Financial Upfront cost and effort to replace equipment that still works.
High costs for critical energy management and monitoring systems to understand energy consumption at a more localized level.
Demand charges within the current rate structure increase focus on reducing peak demand and diminish the attention given to reduce energy consumption.
Preference for payback and ROI of 3 years or less.
More rebates: The rebates are often critical to achieve a minimum internal ROI target.
Financing options: To compensate for high initial costs, utilities or other parties should offer favorable financing options to promote adoption and offset risk.
Price signals: Either through cap and trade, carbon tax, or utility rates, the price signals should align to allow flexible demand management for the end user.
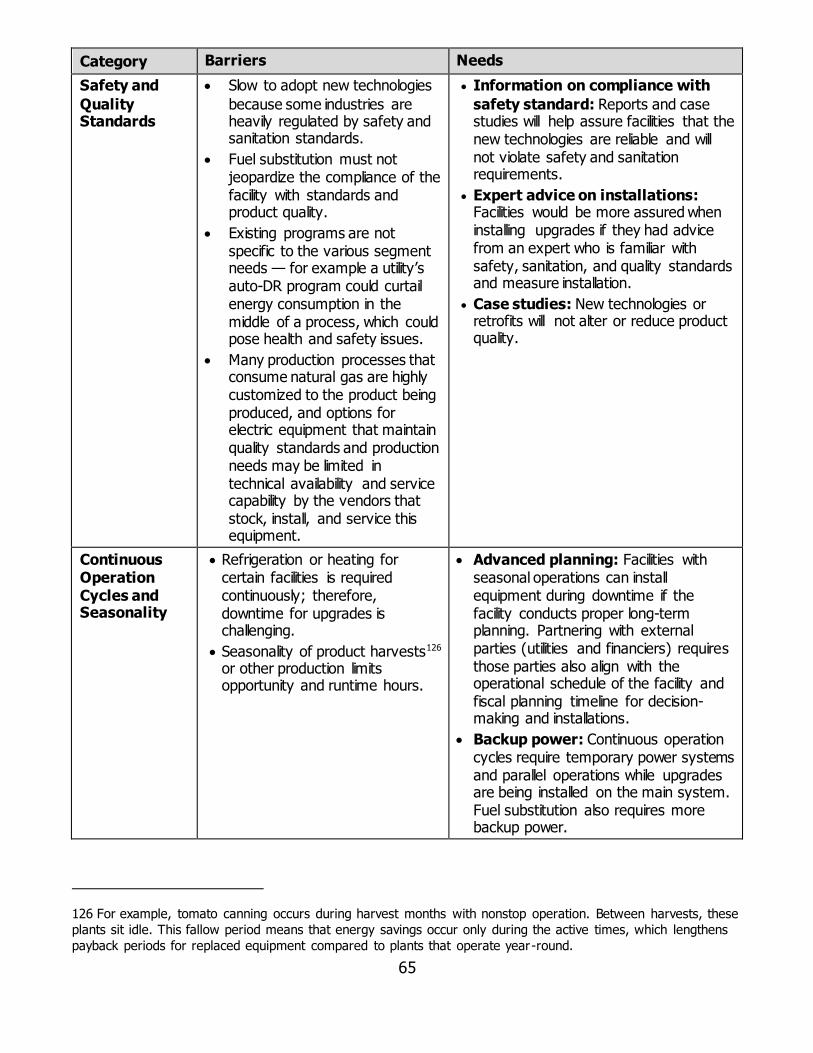
65
Category Barriers Needs
Safety and
Quality Standards
Slow to adopt new technologies
because some industries are heavily regulated by safety and sanitation standards.
Fuel substitution must not jeopardize the compliance of the facility with standards and product quality.
Existing programs are not specific to the various segment needs — for example a utility’s auto-DR program could curtail energy consumption in the middle of a process, which could pose health and safety issues.
Many production processes that consume natural gas are highly customized to the product being produced, and options for electric equipment that maintain quality standards and production needs may be limited in technical availability and service capability by the vendors that stock, install, and service this equipment.
Information on compliance with
safety standard: Reports and case studies will help assure facilities that the new technologies are reliable and will not violate safety and sanitation requirements.
Expert advice on installations: Facilities would be more assured when installing upgrades if they had advice from an expert who is familiar with safety, sanitation, and quality standards and measure installation.
Case studies: New technologies or retrofits will not alter or reduce product quality.
Continuous Operation Cycles and Seasonality
Refrigeration or heating for certain facilities is required continuously; therefore, downtime for upgrades is challenging.
Seasonality of product harvests126
or other production limits opportunity and runtime hours.
Advanced planning: Facilities with seasonal operations can install equipment during downtime if the facility conducts proper long-term planning. Partnering with external parties (utilities and financiers) requires those parties also align with the operational schedule of the facility and fiscal planning timeline for decision-making and installations.
Backup power: Continuous operation cycles require temporary power systems and parallel operations while upgrades are being installed on the main system. Fuel substitution also requires more backup power.
126 For example, tomato canning occurs during harvest months with nonstop operation. Between harvests, these
plants sit idle. This fallow period means that energy savings occur only during the active times, which lengthens
payback periods for replaced equipment compared to plants that operate year-round.

66
Category Barriers Needs
Organizational Barriers
Without a clear company
program, trained internal champion, or energy manager in place, opportunities to improve may not be promoted or implemented effectively, even if known.
Lack of communication among plants, a poor understanding of how to create support for an energy efficiency project, limited finances, poor accountability for measures, or organizational inertia to changes from the status quo. Even when energy is a significant cost, many companies still lack a strong commitment to improve energy management.
Strong commitment: Companies can
communicate a strong commitment to become energy-efficient.
Training: Program provide educational opportunities to industry professionals on the financial and energy savings opportunities available through fuel substitution
Multiyear planning: Consider budgeting and capital improvements over multiple years to meet organizational planning cycles; understanding the future energy landscape is critical.
Reliability Concerns about grid outages with natural gas as the heating unit still operates when there is a grid outage.
Maintaining temperature and pressure requirements for process heating loads.
Backup power source: Companies need to know that if there is a grid outage, their critical systems will continue to operate, either with onsite generation or other grid-side resources.
Case studies: Facilities need to know that electric furnaces or boilers can maintain system requirements consistently like the equivalent natural gas systems.
Source: Guidehouse
The following subsections explore the barriers from policy, technical, and cost perspectives
and discuss possible solutions and opportunities.
Policy Barriers and Solutions
Policy drivers creating pathways to fuel substitution in the industrial sector can contribute to
achieving the ambitious SB 350 goals and GHG emissions reduction targets. This section
addresses the policy barriers and potential solutions for this sector.
Barriers
Unlike the residential and commercial sectors,127 limited targeted policy exists to motivate the
industrial sector to participate in fuel substitution. This situation is partly because industrial
electric technologies do not have high profiles like technologies in other sectors, such as EVs in
the transportation sector. Adoption rate is also an issue — as highlighted earlier in Table 7,
industry resists changing the way it operates. Industry fuel substitution policy progression is
127 For example, the SB 1477 pilot programs: the BUILD program and the TECH program.

67
further hindered because “researchers and policymakers face significant gaps in data (for
example, energy use, cost) and analysis tools.”128
Barriers for fuel substitution vary by customer type and size. For example, larger operations
know what to do but do not feel supported by policies and utilities, while smaller plants may
have limited staff (for example, a mechanic on staff stretched too thin with no energy
manager). A better understanding, including data that segments the market at the facility-size
level, would help policy makers address the diverse needs of the industrial segment.
Furthermore, policy and program designers need more segment-specific studies on the
requirements of each industrial type to increase fuel substitution. Some segment-level
documentation exists for food processing and oil refineries, but other facility types have
minimal information, inhibiting meaningful policy that addresses the segment level respective
needs.
Program funding and planning cycles are another policy barrier. Often there can be a
mismatch between industrial planning cycles and utility and state energy program cycles.
Consequently, cyclical issues can keep industry from moving forward with an energy
project.129
Solutions
State Regulation
Assembly Bill 32 (Núñez, Chapter 488, Statutes of 2006) and Senate Bill 32 (Pavley, Chapter
249, Statutes of 2016), California’s major initiatives to reduce GHG emissions, contain policy
that supports fuel substitution in the industrial sector:
AB 32: Also known as the California Global Warming Solutions Act of 2006, this bill
aims to cut emissions to 1990 levels by 2020. It also aspires to cut emissions below
1990 levels by 2050, although this target was not explicitly marked in this bil l.
SB 32: In 2016, the governor signed SB 32, which succeeds and expands on AB 32 to
reduce statewide emissions to 40 percent below 1990 levels by 2030.130
In addition, through these bills, the California Air Resources Board (CARB) implements
mandatory GHG reporting regulation. To fund this emissions regulation and other emissions
agencies funded under this bill, CARB collects an annual fee from large sources of GHG
emissions, including industrial sources.131 In 2010, 250 sources paid fees when they exceeded
their emissions target; in the latest report, this number has increased to 265.132 Industrial
plants are often large sources of emissions incurring these annual fees, which encourages the
128 National Renewable Energy Laboratory. 2018. Electrification of Industry: Summary of Electrifications Future Study Industrial Sector Analysis.
129 U.S. Department of Energy. June 2015. Barriers to Industrial Energy Efficiency.
130 Senate Bill No. 32. Pavley, California Global Warming Solutions Act of 2006: emissions limit, Chapter 249,
Statues of 2016,
131 “Assembly Bill 32 Overview,” Climate Change Programs, California Air Resources Board, accessed August
2019.
132 California Air Resources Board. August 2019. “AB 32 Cost of Implementation Fee Regulation Fact Sheet.”
68
sector to pursue fuel substitution opportunities. While these bills focus on emissions reduction
targets, their targets support the adoption of fuel substitution in the industrial sector.
Consequently, the industrial sector is affected most by emissions regulations because of the
high GHG emissions levels that accompany this consumption. Fuel substitution is a viable
alternative that provides ample opportunity to reduce emissions and decrease the financial
fees incurred as a result of these bills. In this way, policy encourages the adoption fuel
substitution in the industrial sector.
In the 2018 Electrification of Buildings and Industry in the United States report, Berkeley Lab
provides insights on the GHG regulatory policies driving the effect of fuel substitution on air
quality. Attaining existing air quality standards could encourage greater use of electrified
equipment. Targeted policies and incentives to improve air quality and public health in
disadvantaged communities would also promote fuel substitution, as air quality tends to be
poor in such communities.133
Rate Design
Electricity rate design presents another opportunity to encourage the fuel substitution of the
industrial sector. Specifically, demand charges and time-varying pricing offer potential savings:
Demand charges: Electricity users can be flexible about usage and manage it to avoid
creating large peaks. Those users may experience lower electric bills in the presence of
demand charges than they would without them, encouraging fuel substitution.
Time-varying pricing: Given the diversity of industrial loads, industrial peaks vary.
Some industrial processes can shift runtimes with relative ease, allowing industrial
facilities to take advantage of times with lower electricity prices. To the extent that
newly electrified end uses would face below-average prices on time-varying rates, their
economic prospects would improve.134
Adapt European Framework
California could adapt the European Union’s recommended policy agenda framework (below)
for fuel substitution to create its own framework:135
1. Recognize heat electrification from renewable energy sources.
2. Contribute to energy savings in the framework of the Energy Efficiency Directive.136
3. Include explicit focus on possibilities for substituting fossil fuels with renewable electricity, primarily in high temperature industrial processes applied to furnace
technologies
133 Lawrence Berkeley National Laboratory. March 2018. Electrification of Buildings and Industry in the United States – Drivers, Barriers, Prospects, and Policy Approaches.
134 Ibid.
135 Navigant Consulting, Inc. (Ecofys). March 2018. Opportunities for Electrification of Industry in the European Union.
136 The Energy Efficiency Directive mandates that certain facilities must implement energy efficiency
improvements.
69
4. Define guidance on electrification of heat in best available technologies reference documents.137
5. Facilitate development of innovative electrification processes through research.
6. Support knowledge sharing by establishing a competence network.
7. Demonstrate the potential of novel electrification technologies through pilot and
demonstration projects.
Additional Policy Adjustments
California can consider opportunities that mostly adapt or leverage existing policies and
programs from the residential and commercial sectors. These approaches may include:
Using the new fuel substitution test. (See the CPUC Decision Modifying the Three-Prong
Test section for a description of this test.)
Providing program incentives and financing support via utility programs and streamlined
pathways through custom analysis or normalized meter energy consumption.
Expanding the energy as a service market into the industrial sector for a comprehensive
DER outlook, which should encourage fuel substitution.
Developing utility or state agency programs (like BUILD and TECH) for the industrial
and agricultural sectors that:
o Engage over multiple years for long lead times before a facility investment.
o Employ trusted technical experts.
o Provide a strategic energy managementlike support network.138
Altering the CPUC cost-effectiveness tool139 to conduct hourly analysis to more
accurately calculate the GHG benefit, including DR (or flexible load) benefits.
Developing additional codes and standards for the industrial and agricultural sectors.
The only standard is based on limiting carbon emissions for larger emitters.
Encouraging additional load shifting capabilities frameworks through the CPUC,
independent system operator, or other markets.
Technical Barriers and Solutions Limited opportunities are available for electric technologies to replace gas equipment across
the industrial and agricultural sectors. The technology solutions exist, but there are technical
barriers for market adoption. Some of these technology solutions are provided in Appendix C.
Many of the technical barriers and solutions relate to the highly customized nature of the
production processes that consume natural gas. These processes are customized to the
product being produced; options for electric equipment that maintain quality standards and
137 The best available technology for each building type is outlined in the reference documents developed under
the directive.
138 The CPUC designed a program that includes objectives to have peers talking to one another. Sergio Dias
Consulting. February 2017. California Industrial SEM Design Guide.
139 “Cost-effectiveness,” Consumer Energy Resources, California Public Utilities Commission, accessed August
2019.

70
production needs may be limited in technical availability and service capability by the vendors
that stock, install, and service this equipment.
Barriers
The most prevalent technical barriers for the industrial sector are the availability and feasibility
of electrifying processes. Many industrial processes are not designed to use electricity, or
electrically based alternatives are not available. For example, some higher-temperature
processes like those found in cement manufacturing140 do not have many electrified
alternatives but are good targets for hydrogen alternatives (a topic this study does not cover).
Fuel substitution alternatives that do exist for high-temperature processes can be difficult to
implement, and the overall transition is intensive.
When electric alternatives are available, they cannot always replace the nonelectrified process
because of the intended purpose and design of the equipment. For example, an electric motor
cannot always directly replace a steam-turbine motor (driven by steam generated with carbon
fuel combustion) because steam-driven motors serve different purposes than electric-drive
motors. Steam-driven turbines, typically pumps, are used for specific applications such as
pumping material of varying viscosity, and the turbines are built to accommodate specific
material viscosity ranges. Generally, steam turbines are built to handle denser, more viscose
materials relative to electric turbines because it is more efficient due to the different fuel
sources. In most cases, the applications limit the replacement of these steam-driven turbines
with electric motors.
Another industry fuel substitution complication is best described by Berkeley Lab:
“…the intensive degree of integrated process design including extensive use of
CHP in several sectors and in the oil and gas refining and
chemicals/petrochemical sectors… [The] oil refining industry has extensive ‘own-
use’ fuel consumption where by-products of the oil refining process (e.g.,
refinery or still gases obtained during the distillation of crude oil) are used as fuel
in upstream or downstream processes. Attempting to substitute the fuel for
these processes would complicate the design and increase the energy cost over
and above a sector that does not have this type of extensive process integration
and own-use energy consumption.”141
The lack of information on electric alternatives to gas is an additional technical barrier. The
lack of information exists at the end user level and the delivery agent to the end user. The end
user may have concerns that the electric alternative could not provide the same level of
service, may affect product quality, and reduce productivity. Furthermore, the vendors and
service providers do not have information or experience with the alternatives.
140 Lawrence Berkeley National Laboratory. March 2018. Electrification of Buildings and Industry in the United States – Drivers, Barriers, Prospects, and Policy Approaches.
141 Ibid.

71
Solutions
The technical opportunities that exist depend on the industrial building type because of the
variable processing of each building type. The solutions include:
Using existing technologies.
Funding research, development, and demonstration.
Providing education and training.
Using Existing Technologies
Many alternative technologies provide fuel substitution solutions. For example, mature
electroheating technologies such as induction, resistance, infrared, electric-arc and radio
frequency, and microwave heating could be used in high-temperature processes. The
applicability of these technological opportunities is segment-specific.
In addition to process heating fuel substitution solutions, electrified process alternatives for
boiler systems, CHP, process heat, and facility HVAC exist for a variety of segments.
Researchers found overlap among the segment type-specific fuel substitution suggestions
across a variety of references, indicating that some end uses are more feasible to electrify.
The research team reviewed several data tables (shown in Appendix C), which showed that
process heat was the most prevalent end use for fuel substitution. Process heat provides the
largest opportunity for fuel substitution across segments, and specific fuel substitution
strategies can be matched to the requirements of the specific process.
Funding Research, Development, and Demonstration
An NREL study found that the primary drivers of new technology adoption are productivity and
profitability benefits rather than simple payback. These benefits can be observed in terms of
improved product quality, higher throughput, and reduced scrap and labor costs.142 In most
cases, the solution to a technology barrier is research, development, and demonstration
funding/initiatives. One potential solution is to use the CEC’s Energy Research and
Development Division and the Electric Program Investment Charge program to advance
industrial fuel substitution technologies.
The Sustainable Gas Institute is developing an industrial modeling software to provide a
stimulatory approach to whole energy systems. The institute can use the ModUlar energy
system Simulation Environment model to evaluate processes and technologies suitable for
increasing fuel substitution of the industrial sector and to analyze the effect of a portfolio of
technologies on energy and emissions reductions.143 This software is a potential resource for
industrial fuel substitution modeling in the future.
142 National Renewable Energy Laboratory. 2018. Electrification of Industry: Summary of Electrifications Future Study Industrial Sector Analysis.
143 Sustainable Gas Institute. “Finding Ways to Electrify the Industrial Sector.” Imperial College London,
accessed August 2019.
72
Providing Education and Training
Many industrial and agricultural customers are knowledgeable about their operations and cost
savings opportunities. However, they are weary of doing something different from the status
quo. There is an opportunity to offer education and training services through:
Case studies.
Training sessions.
Utility or government programs.
Collaborative forms such as strategic energy management.144
Through education, facilities may embrace focusing more on design than technologies, like
industrial heat pumps via process re-engineering. Facility owners may be hesitant because it is
changing what they are used to. One solution is encouraging plants and companies to employ
an energy manager who can disseminate knowledge about fuel substitution opportunities. The
energy manager can dispel myths about certain changes to fuel types disrupting plant
operations.
Cost Barriers and Solutions Decision-making in these sectors is tied to the costs: financial, time needed to implement a
solution, and energy. It is important to consider the operational and first costs. Many industrial
and agricultural facilities have limited funding for capital improvements. For the funding that is
available, it is prioritized toward improvements in production efficiencies. If there are
unknowns on how to improve production or what the benefits are for the technology in
question (such as fuel substitution), then the facility decision makers move on to what is
known and has a with a quantifiable, favorable ROI.
Barriers
The low cost of natural gas presents a major cost barrier to industry fuel substitution, leading
to unfavorable economics. In California, the average retail price of electricity for the industrial
sector in the IOU territories is $0.124/kWh, and the price of commercial natural gas is
$0.70/therm.145 However, “[on] an energy basis, the price of natural gas is four times cheaper
than for electricity, so an electric heating application would need to be four times more
efficient than its natural gas counterpart to have the same energy costs.”146 Thus, converting
the price of electricity to an equivalent natural gas basis because of this differing energy
content results in the equivalent price to be $3.63/therm of natural gas.147 From a cost-per-
energy unit perspective, this pricing difference profoundly affects operating costs and presents
a cost barrier. This cost calculation does not take into consideration the cost of carbon or the
144 Sergio Dias Consulting LLC. February 2017. California Industrial SEM Design Guide.
145 California Energy Commission, 2017 IEPR Update and Demand Forecast Forms. Adopted Feb. 2017. Excel
Demand Forecast Forms available at http://www.energy.ca.gov/2017_energypolicy/documents and California Energy Consumption Database (ECDMS), accessed Oct. 2018.
146 Lawrence Berkeley National Laboratory. March 2018. Electrification of Buildings and Industry in the United States – Drivers, Barriers, Prospects, and Policy Approaches.
147 Conversion based on ratio of 29.3 kWh = 1 therms of natural gas.

73
potential ability to provide grid resources via flexible loads. Most industrial customers use retail
energy rates when making financial decisions related to energy use.
This energy cost disadvantage that persists in fuel costs is affected greatly by equipment
efficiency. Two varying examples of this equipment cost comparison are as follows:
“For an electric boiler with 100 percent end use efficiency versus a gas-fired boiler with
80 percent efficiency, the cost of energy is 4.2 times higher for the electric boiler.”148
For an electric heat pump water heater with a coefficient of performance (COP) of
4.0149 in the commercial and industrial sector versus a gas-fired heater at 0.8 COP,150
the cost of energy is 1.04 times higher for the electric case. This cost differential used
to be greater, but efficiency advancements in heat pump technologies have closed the
gap.
Further cost barriers exist related to the capital costs associated with the equipment transition.
While capital costs are sometimes lower for electrical machinery, replacing an operational
nonelectric machine in favor of an electrified alternative adds capital costs to transition fuel
sources. These added costs mean that plants will be incurring nonessential capital costs for
machinery that will cost more to operate. Additional costs may exist if the end user exceeds
the local grid capacity availability. Additional cost burdens exist for some large end users that
own their substations and may exceed the substation capacity when electrifying processes.
The U.S. Department of Energy provides some additional cost barriers applicable to industry
fuel substitution:
Infrastructure manipulation costly: High capital costs to transition machinery fuel from
fossil fuel over to electric, often losing efficiency
Internal competition for capital: Manufacturers often have limited capital available for
end-use projects and frequently require very short payback periods (one to three
years).
Energy price trends: Volatile energy prices can create uncertainty in investment returns,
leading to delayed decisions on energy efficiency projects.
Split incentives: Companies often split costs and benefits for energy projects among
business units, which complicates decision-making
Corporate tax structures: U.S. tax policies, such as depreciation periods, the treatment
of energy bills, and other provisions, can be a deterrent.151
Solutions
While industrial users participate in a competitive industry and have an incentive for cost-
minimization, solutions to these cost barriers still depend heavily on policy and technical
148 Lawrence Berkeley National Laboratory. March 2018. Electrification of Buildings and Industry in the United States – Drivers, Barriers, Prospects, and Policy Approaches.
149 Navigant Consulting, Inc. July 2018. Analysis of the Role of Gas for a Low-Carbon California Future.
150 Lawrence Berkeley National Laboratory. March 2018. Electrification of Buildings and Industry in the United States – Drivers, Barriers, Prospects, and Policy Approaches.
151 U.S. Department of Energy. June 2015. Barriers to Industrial Energy Efficiency.

74
drivers. Policy changes provide cost solutions in the form of monetary incentives for fuel
substitution. On the technical side, advancements that increase the efficiency or transitional
feasibility of electrical equipment provide additional cost solutions. These solutions include
addressing the overall costs (first and operational costs). In most cases, there is not a capital
expenditure barrier (even though end users bring it up in surveys); there is a need to provide
a high ROI to engage decision makers in an investment.
Possible solutions to the first cost barrier include:
Engaging energy as a service companies to help provide the financing streams to
pursue retrofits that reduce initial costs via the service model.
Supporting the development of financing products specifically targeting this market, like
how the property assessed clean energy and commercial property assessed clean
energy152 programs have addressed access to financing for energy savings solutions.
Encouraging and supporting utility programs for technical support, decision-maker
engagement, and monetary incentives.
Encouraging sites to quantify nonenergy benefits to fully incorporate the benefits into
analysis. Some benefits may include reduced risk (safety due to natural gas usage),
health benefits (less combustion), improved productivity, and improved product quality.
Possible solutions to the operating cost barrier include:
Informing and encouraging industrial and agricultural facilities to participate in ancillary
services and be a demand-side resource via flexible load (that is, demand
management).
Promoting ongoing decreases in renewable generation costs; this has the potential to
reduce energy supply costs and provide price stability, which is key to most
manufacturers.
Fostering the emergence of carbon markets that might allow GHG reductions to be
more fully monetized, improving the economics of the fuel substitution in larger-scale
industrial applications.
Data Gaps When attempting to evaluate fuel substitution for the industrial sector, significant data gaps
exist in terms of energy, use, cost, and analysis tools. There is little publicly available cost data
for electrotechnologies, and most available data are anecdotal. “Although some data are
available for certain industries, end uses, and technologies, the lack of consistent metrics limits
their use for developing projections.”153 Furthermore, available literature is often old and
cannot be easily generalized for analysis.
Further research in the industry needed, including:
152 Property assessed clean energy, https://pacenation.us/.
153 National Renewable Energy Laboratory. 2017. Electrification Futures Study: End-Use Electric Technology Cost and Performance Projections through 2050.
75
Data for analysts/modelers and tools to estimate results and to identify opportunities
for fuel substitution.
o Hourly load shapes to fully quantify the benefits of carbon abatement and grid-
level impacts related to potential feeder upgrade requirements for electric
process heating for targeted segments.
o Data for policy makers to supplement the incomplete picture of opportunities and
effects from analysts/modelers.
More exploration on emerging technologies and fuel substitution technology research,
development, and demonstration for the sectors:154
o Applicability and expansion of induction and other forms of electric heating.
o Comparisons of costs and benefits of direct versus indirect (via hydrogen
production) fuel substitution.155
Industrial process improvements effect on productivity and product quality:
o Further process-level analysis and modeling to identify which segments or
processes to prioritize for fuel substitution.
o Development of direct fuel substitution process designs, equipment costs, and
demonstrations.
o Studies to understand potential effects to product quality.
o Case studies and technology demonstration studies exploring and documenting
successful industrial fuel substitution.
The general data trends appear to be that industry data are not widely or consistently
collected for public use. Moreover, any data that are collected lack the granularity necessary to
evaluate effectively the industry based on specific segments and end uses.
154 Global Efficiency Intelligence. April 9, 2018. Infographic: Deep Electrification of Manufacturing Industries.”
155 Lawrence Berkeley National Laboratory. March 2018. Electrification of Buildings and Industry in the United States – Drivers, Barriers, Prospects, and Policy Approaches.

76
CHAPTER 5:
Fuel Substitution Scenario Analysis Tool
The FSSAT functions as a flexible analysis tool that provides the CEC user with the data and
framework necessary to understand the effects of fuel substitution in California at the
technology level. The tool functionality allows users to update input data and scenarios and
provides granular control of technology replacement.
Tool Description The objective of the FSSAT is to determine the change in GHG emissions in the residential,
commercial, agricultural, and industrial sectors based on user inputs, focused on 2030 in
accordance with AB 3232. The FSSAT outputs include annual forecasts of the natural gas
displaced and additional electric energy consumed at the end-use level, electric technology
stock, and consumer costs at the technology level. Where appropriate, these outputs are also
given at the hourly level to determine hourly GHG emissions impacts. Combined, the FSSAT
tool outputs are used to determine the resulting change in overall GHG emissions.
The FSSAT completes five tasks for a given scenario:
1. IEPR disaggregation. Disaggregation of the IEPR natural gas forecast from the end-
use level to the technology level.
2. Additional achievable energy efficiency (AAEE) modification. Modification of the
IEPR natural gas forecast to incorporate the natural gas energy efficiency planned
savings accounted for in the AAEE forecast disaggregated to the technology level.
3. Technology substitution. Substitution as specified in the user-defined inputs. Fuel
substitution targets are defined by the user specifically for calendar year 2030. Years
prior to 2030 are populated using static adoption curves defined by the user.
Technology substitution results in the following calculated forecasts:
a. Annual reduction of natural gas at the end-use level.
b. Annual change in electric technology stock and increase in electric consumption
at the technology level.
c. Overall costs associated with the defined fuel substitution scheme including
technology, installation, fuel, and ancillary costs.
d. Overall annual GHG emissions reduction at the end-use level based on natural
gas consumption reduction, electric generation addition, additional refrigerant
leakage, and natural gas leakage emissions reduction.
4. Hourly calculation. Calculation uses hourly normalized load shapes specific to the
utility, sector, and end-use level to disaggregate the annual electric load increase and
GHG emissions reduction forecast to the hourly level.
5. Abatement curve generation. Development of supply curves based on calculations
for GHG emissions reductions and overall costs.

77
The research team built the FSSAT using two linked platforms: Microsoft Excel® and R scripts.
Excel input files are imported into the R script, which contains the core analysis algorithms.
The R script generates output files into Excel workbooks. Figure 11 illustrates the FSSAT tasks
and distinguishes each item as an input, R process, or output.
Figure 11: Fuel Substitution Scenario Analysis Tool Description
Flow chart depicting the inputs, outputs, and R processes of the FSSAT. Inputs include IEPR
natural gas forecast, gas technology characterization, AAEE forecast, scenario definitions,
electric technology characterization, hourly profiles, and emissions factors. Annual outputs
include interim and final natural gas reduction, electric consumption increase, electric
technology stock, costs, and emissions. Hourly outputs include electric consumption increase
and GHG emissions reductions. Output analysis includes abatement curves. The R processes
include IEPR disaggregation, AAEE modification, technology substitution, hourly calculation,
and abatement curve generation.
Source: Guidehouse
78
Tool Objectives and Scope
The FSSAT objectives, as directed by CEC staff, were to calculate fuel substitution scenarios to
achieve various policy objectives. The FSSAT has several functions:
Calculate and output natural gas reduction and electric energy increase based on
replacement scenario inputs at the utility,156 sector, end-use, building-type, and
replacement type (replace-on-burnout, new construction, or retrofit) levels.157
Calculate and output electric stock added due to fuel substitution at the utility, sector,
end-use, building type, and replacement type levels.
Calculate and output an emissions forecast for substitution based on natural gas
removed, electric load added, refrigerant leaks, and natural gas leaks.
Calculate and output the costs associated with a fuel substitution scenario (technology,
fuel, and panel upgrade costs).
Modify the IEPR forecast baseline according to a specific AAEE savings scenario
(described in “Modify Forecast Based on AAEE” section).
Allow the user to modify input data, as needed.
The tool allows only for the substitution of natural gas to electricity technologies. It does not
allow for substitution of natural gas to high-efficiency natural gas technologies or electricity to
natural gas technologies. The tool does account for expected energy efficiency replacements
as prescribed in the Scenario 1 of the AAEE forecast.158
The tool features allow users to vary existing baselines and scenarios at the technology, end-
use, building-type, sector, and utility levels. The user can configure technology adjustments by
the new construction, accelerated replacement, and replace-on-burnout replacement (or
measure application) types.
The emissions calculated in this study are from electricity generation carbon emissions,
methane leakage, or refrigerant leakages. The reported values are quantified in kilograms of
carbon equivalent (kg CO2e).
Scope of FSSAT Capabilities
The FSSAT uses customizable baseline data combined with user-specified input parameters to
define fuel substitution and the resulting effects to statewide natural gas consumption, electric
consumption, GHG emissions, and customer costs in 2030, which are extrapolated over the
forecast period.
156 Specific utility disaggregation is provided in Table 15.
157 The added electric load also incorporates added load from residential space cooling due to heat pump
installation where there was no space-cooling load. For example, in the case where a household replaces a
natural gas furnace and no air conditioning with a heat pump, there may additional load (and subsequent electric
generation emissions) from space cooling. The tool analysis assumes no new commercial space cooling
consumption.
158 Users may update the FSSAT AAEE inputs to examine the impacts of different forecasts of energy efficiency,
some of which in AAEE are more aggressive than Scenario 1.

79
Measure Characterization
The tool characterized technologies at the building-type level and leveraged existing data
sources, if available. The building-type level characterization means that it is not at the
facility/building level. Therefore, any analysis of per household or per 1,000 square feet (units
used to define the commercial building stock) is based on market average equipment density
assumptions per unit of building stock. The results represent the entire population of buildings
of that type in a given segment rather than a single building of that type. In future work,
assumptions could be made about electric technology adoption to approximate building-level
results. An analysis at this level would require data that define customer behavior in adopting
multiple electric technologies. This limitation also affects reporting costs at the end-use level
because the panel costs are allocated on an installed-heat pump basis, not at the building
level.
In leveraging existing data sources, the electric technologies performance and cost
characterizations are based on best available data. In many cases, data regarding
performance and costs in California available from thorough and well-vetted program
evaluation or market research are limited. As better data become available, the tool user
should update the technology characterization accordingly.
Technology Adoption
The tool does not complete any adoption modeling based on customer behavior or market
conditions. Instead, the FSSAT uses static user-defined adoption curves to determine adoption
of technologies by the 2030 target year. As utility rates and the cost of technology change
over time, the user must modify the adoption curve to reflect changes in the market as an
input to the tool. Default values in the FSSAT for adoption do not represent any program
designs that would provide a basis for shaping adoption through subpopulation targeting and
incentives, nor any consumer behavior that would inform organic transition from natural gas to
electric appliances.
Nonfuel Substitution Building Emissions
The tool does not incorporate refrigerant emissions from the installed air-conditioning and
refrigeration equipment throughout the forecast period. As detailed in the Refrigerant
Emissions section, the FSSAT calculates refrigerant emissions for additional heat pumps and
relies on user inputs to account for any additional non-heat pump refrigerant leakage through
the forecast period. The tool does correct for refrigerant emissions when heat pumps replace
air conditioners and natural gas furnaces because this technology replacement assumes no
new refrigerant emissions when the baseline technology had refrigerant (for the residential
sector only). Using the tool for Senate Bill 1383 (Lara, Chapter 395, Statutes of 2016) analysis
will be limited to only the effects of heat pumps and heat pump water heaters, not refrigerant-
type changes when retrofitting other technologies. The tool requires user assumptions on the
mix of refrigerants used per technology.
Analysis Framework
The research team chose a combination of Excel workbooks and R scripts to host the tool. The
FSSAT Inputs and FSSAT Outputs sections describe the Excel input and output workbooks

80
from the FSSAT. The R Processes section describes all data manipulation and calculations that
occur in the R environment.
FSSAT Inputs
There are two sets of inputs to the model: global inputs and user-defined inputs. The global
inputs are defined by a variety of California-based data sources and studies. The user defines
the user inputs during the fuel substitution scenario building process. The research team
designed the FSSAT for maximum user flexibility to modify inputs, global or user-defined, as
better or more updated data become available.
Table 8 describes the global inputs. The research team obtained most of the global inputs
from CEC sources. The CEC typically updates these sources biennially. The global inputs Excel
workbook provides specific sources and instructions on how to update each dataset.
Table 8: FSSAT Global Inputs
Dataset Data Description
Building Stock Forecast
Building forecast and demolition rate at the utility and IEPR-defined building-type level* through 2030 (demolition rate included).
Utility Rates Forecast
Electricity and natural gas retail rates by sector and utility through 2030 used to calculate user technology fuel costs.
IEPR Natural Gas Demand Forecast
Natural gas consumption at the utility, sector, and end-use level through 2030.
Utility To Climate Zone Mappings
Mapping between gas utility, electric utility, forecast climate zone (FCZ), and building climate zone (BCZ).
AAEE Forecast Energy efficiency savings at the FCZ, sector, and end-use level through 2030.
*Appendix E lists the defined building types. Building types are segmented based on
geography and building function. There is no differentiation for building vintage.
Source: Guidehouse
The technology-level characterization inputs are predefined and based on best available data.
The technology characterization, described in Appendix F, has parameters that users can
define. As needed, the user may modify the natural gas and fuel substitution technology
environments in the scenario building process. For example, the user may choose to modify
the COP and costs unique to a specific scenario in the fuel substitution characterization
environment or the saturation and densities specific to a utility in the natural gas technology
characterization environment.
Like the global inputs, the user should update this dataset as more and/or better data
becomes available. The original source for most of the technology characterization is the CPUC
2019 Potential and Goals study.159 The Potential and Goals study relies on the CPUC’s
159 Navigant Consulting, Inc. 2019. 2019 Energy Efficiency Potential and Goals Study. California Public Utilities
Commission.
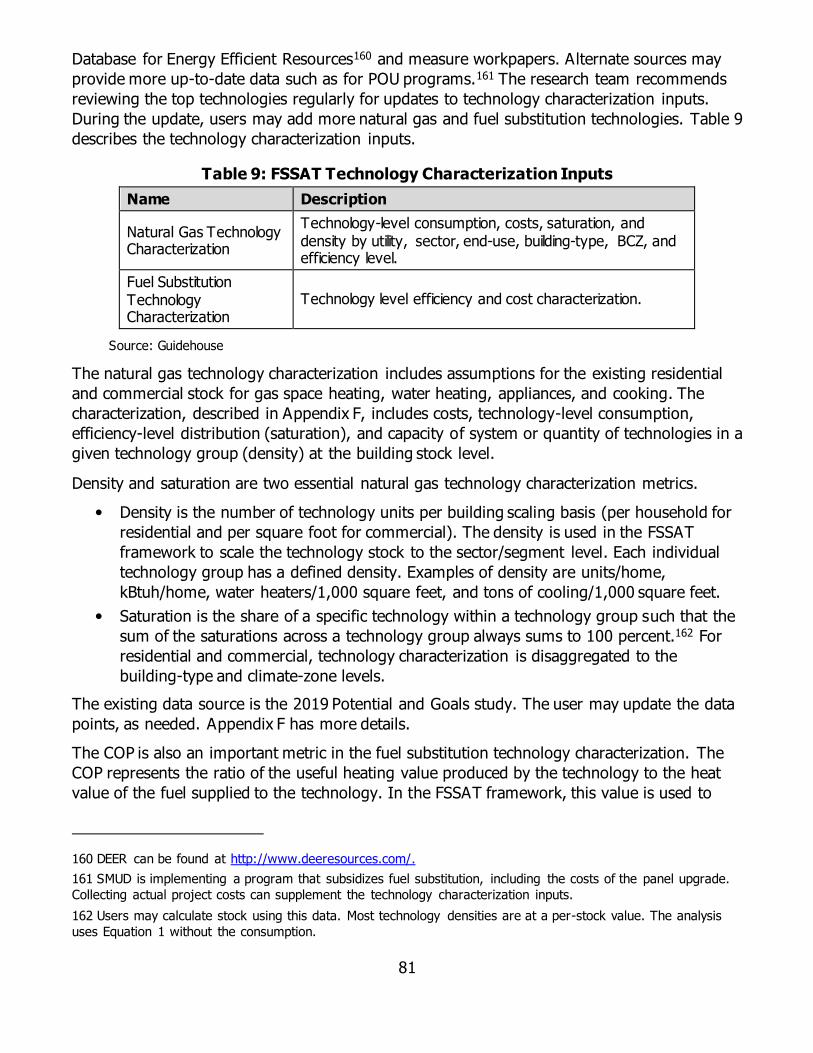
81
Database for Energy Efficient Resources160 and measure workpapers. Alternate sources may
provide more up-to-date data such as for POU programs.161 The research team recommends
reviewing the top technologies regularly for updates to technology characterization inputs.
During the update, users may add more natural gas and fuel substitution technologies. Table 9
describes the technology characterization inputs.
Table 9: FSSAT Technology Characterization Inputs
Name Description
Natural Gas Technology Characterization
Technology-level consumption, costs, saturation, and density by utility, sector, end-use, building-type, BCZ, and efficiency level.
Fuel Substitution Technology Characterization
Technology level efficiency and cost characterization.
Source: Guidehouse
The natural gas technology characterization includes assumptions for the existing residential
and commercial stock for gas space heating, water heating, appliances, and cooking. The
characterization, described in Appendix F, includes costs, technology-level consumption,
efficiency-level distribution (saturation), and capacity of system or quantity of technologies in a
given technology group (density) at the building stock level.
Density and saturation are two essential natural gas technology characterization metrics.
Density is the number of technology units per building scaling basis (per household for
residential and per square foot for commercial). The density is used in the FSSAT
framework to scale the technology stock to the sector/segment level. Each individual
technology group has a defined density. Examples of density are units/home,
kBtuh/home, water heaters/1,000 square feet, and tons of cooling/1,000 square feet.
Saturation is the share of a specific technology within a technology group such that the
sum of the saturations across a technology group always sums to 100 percent.162 For
residential and commercial, technology characterization is disaggregated to the
building-type and climate-zone levels.
The existing data source is the 2019 Potential and Goals study. The user may update the data
points, as needed. Appendix F has more details.
The COP is also an important metric in the fuel substitution technology characterization. The
COP represents the ratio of the useful heating value produced by the technology to the heat
value of the fuel supplied to the technology. In the FSSAT framework, this value is used to
160 DEER can be found at http://www.deeresources.com/.
161 SMUD is implementing a program that subsidizes fuel substitution, including the costs of the panel upgrade.
Collecting actual project costs can supplement the technology characterization inputs.
162 Users may calculate stock using this data. Most technology densities are at a per-stock value. The analysis
uses Equation 1 without the consumption.

82
convert natural gas heating consumption to electric heating consumption. In heat pumps, the
dominant electric heating resource, operation is sensitive to ambient air temperature.
Increasing the COP values in the characterization (indicating a more efficient heating system)
results in reduced energy consumption and more GHG emissions abated. Appendix G describes
the analysis conducted to address variations in COP by technology and climate zone.
The tool user defines the user-defined inputs and modifies each scenario in the user inputs
Excel workbook. Table 10 describes each user-defined input type.
Table 10: FSSAT User-Defined Inputs
Name Description
Scenario Definition Set the scenario names, AAEE scenario, cost year, discount rates, emissions factors, and input/output workbook file locations.
Scenario Parameters Set the target for 2030 fuel substitution activity for calculating adoption by replacement type, efficiency level, sector, and utility .
Replacement Map Map existing (gas) technology to one or more electric replacement technologies.
Adoption Scheme Map adoption curves defined in adoption curves input tab to replacement technologies.
Adoption Curves Input the rate of technology change from gas to electric year-over-year. The researchers provided general assumptions for current values.
R Input
Input sheet that feeds into the FSSAT R script. Any changes made in the other input tabs (for example, scenario parameters, replacement map, adoption scheme, and adoption curves) feed into here. The user may override inputs line by line on this tab.
Refrigerant Inputs Input for refrigerant emissions analysis, which includes percentage leakage and charge size by electric technology.
Natural Gas Leakage Emissions Inputs
Inputs for natural gas leakage emissions analysis, which includes percentage leakage as a function of natural gas consumption.
Panel Costs Input facility-level cost inputs — for example, an electrical panel upgrade.
Effective Useful Life Distribution
Input the EUL and stock turnover decay by electric technology.
Buildings With AC Proportions
Input for proportion of residential buildings with air conditioning units at the gas utility, BCZ, building type, and sector levels.
Source: Guidehouse
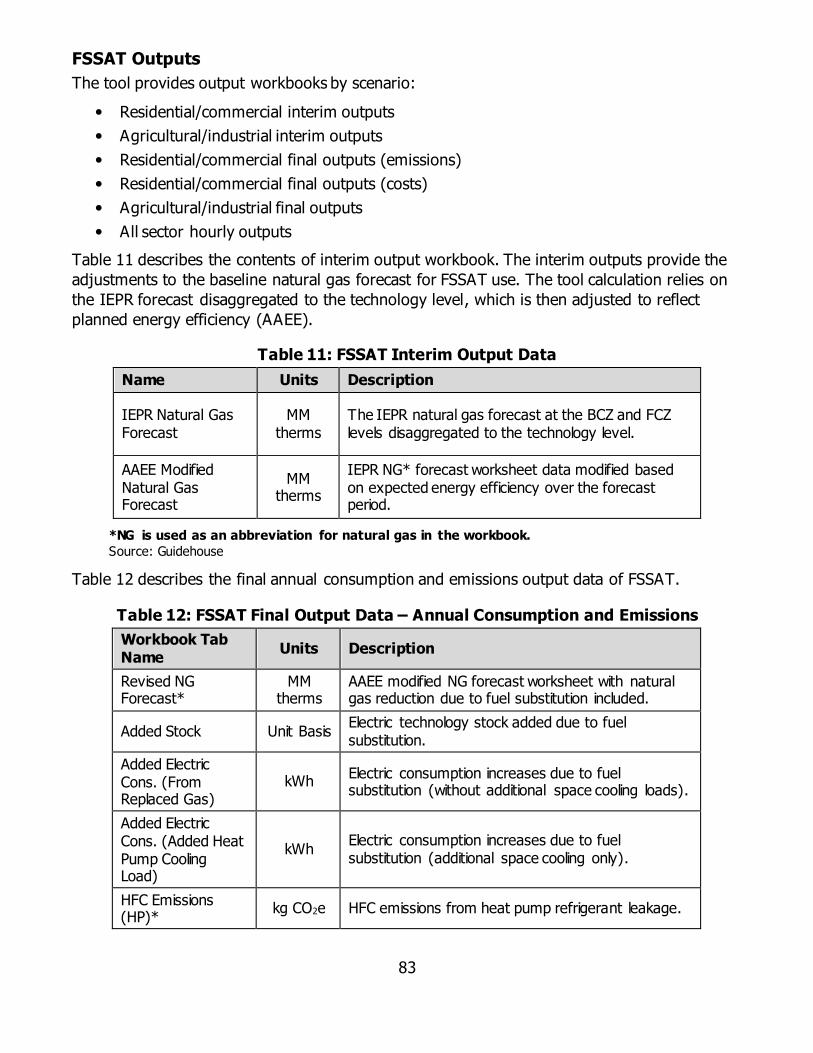
83
FSSAT Outputs
The tool provides output workbooks by scenario:
Residential/commercial interim outputs
Agricultural/industrial interim outputs
Residential/commercial final outputs (emissions)
Residential/commercial final outputs (costs)
Agricultural/industrial final outputs
All sector hourly outputs
Table 11 describes the contents of interim output workbook. The interim outputs provide the
adjustments to the baseline natural gas forecast for FSSAT use. The tool calculation relies on
the IEPR forecast disaggregated to the technology level, which is then adjusted to reflect
planned energy efficiency (AAEE).
Table 11: FSSAT Interim Output Data
Name Units Description
IEPR Natural Gas Forecast
MM therms
The IEPR natural gas forecast at the BCZ and FCZ levels disaggregated to the technology level.
AAEE Modified Natural Gas Forecast
MM therms
IEPR NG* forecast worksheet data modified based on expected energy efficiency over the forecast period.
*NG is used as an abbreviation for natural gas in the workbook.
Source: Guidehouse
Table 12 describes the final annual consumption and emissions output data of FSSAT.
Table 12: FSSAT Final Output Data – Annual Consumption and Emissions
Workbook Tab Name
Units Description
Revised NG Forecast*
MM therms
AAEE modified NG forecast worksheet with natural gas reduction due to fuel substitution included.
Added Stock Unit Basis Electric technology stock added due to fuel substitution.
Added Electric Cons. (From Replaced Gas)
kWh Electric consumption increases due to fuel substitution (without additional space cooling loads).
Added Electric Cons. (Added Heat Pump Cooling Load)
kWh Electric consumption increases due to fuel substitution (additional space cooling only).
HFC Emissions (HP)*
kg CO2e HFC emissions from heat pump refrigerant leakage.

84
Workbook Tab Name
Units Description
HFC Emissions (Non-HP)
mTCO2e* HFC emissions from non-heat pump refrigerant leakage.
NG Leakage Emissions
kg CO2e Emissions from natural gas leaks downstream of the commercial and residential meter.
NG Emissions Added*
kg CO2e Direct emissions from additional natural gas consumption due to fuel substitution.
Electric Emissions Added
kg CO2e Indirect generation emissions from additional electric consumption due to fuel substitution.
Total Emissions Added
kg CO2e The net aggregate emissions added due to fuel substitution.
Emissions Reduction Cost
Various
This tab includes cumulative avoided emissions, cumulative net present cost incremental to the gas technology, and cumulative cost per metric ton avoided ($/mTCO2e).
*NG = natural gas, AC = air conditioning, mT = metric tonne, HFC = hydrofluorocarbon, HP =
heat pump
Source: Guidehouse
Table 13 describes the final cost output data of FSSAT.
Table 13: FSSAT Final Output Data – Costs
Workbook Tab Name
Description
Added Tech. Cost (Split)
Fuel substitution technology cost expected due to fuel substitution split by cost type:
Equipment cost
Installation cost
Overhead and profit cost
Added Tech. Cost (Total)
Total (not including electric or gas supply-side infrastructure costs) technology cost expected due to fuel substitution.
Added Tech. Cost (Inc Total)
Total (not including electric or gas supply-side infrastructure costs) technology incremental cost expected due to fuel substitution.
Fuel Costs (Split) Fuel costs split into natural gas costs mitigated and electric costs added due to fuel substitution.
Fuel Costs (Net) Net fuel costs of added electricity and reduced natural gas.
Panel Costs Aggregate costs of panel upgrades at the utility, sector, building type, and BCZ levels.
Source: Guidehouse

85
Table 14 describes the final hourly analysis output data of FSSAT.
Table 14: FSSAT Final Output Data – Hourly Analysis (Detailed)
Workbook Tab Name
Description
FS Hourly Impacts Out (MW)
The hourly electric load impacts for the input utility or utility group at the sector level.
FS Hourly Impacts Out (GHG)
The hourly electric emissions impacts for the input utility or utility group at the sector level.
FS Hourly Impacts Scenario Out
The statewide hourly electric load impacts for the input utility or utility group.
Hourly Impacts Compare
The annualized summary of hourly emissions factors to be compared against the user input annual emissions factors.
Load shape Map Input
A record of the load shape mappings defined in the master map.
Transmission Inputs
A record of the transmission inputs defined in the master map.
Distribution Inputs A record of the distribution inputs defined in the master map.
Residential End Use Output
The hourly electric load impacts for the input utility or utility group at the end use level in the residential sector.
Commercial End Use Output
The hourly electric load impacts for the input utility or utility group at the end use level in the commercial sector.
Agricultural End Use Output
The hourly electric load impacts for the input utility or utility group at the end use level in the agricultural sector.
Industrial End Use Output
The hourly electric load impacts for the input utility or utility group at the end-use level in the industrial sector.
Source: Guidehouse
Data outputs are provided at the utility (Table 15) including mapping to FCZ, sector, and end-
use levels (Table 16). Not all end uses are included in the outputs because the tool addresses
only electricity end uses substituting natural gas. Some data outputs are available at the FCZ
and building type level. Appendix D provides the BCZ to FCZ mapping.
Table 15: Utility Disaggregation
Forecasting Climate Zone
Electricity Natural Gas
1 PG&E PG&E
2 PG&E PG&E
3 PG&E PG&E
4 PG&E PG&E
5 PG&E PG&E
6 PG&E PG&E*
6 PG&E SCG*
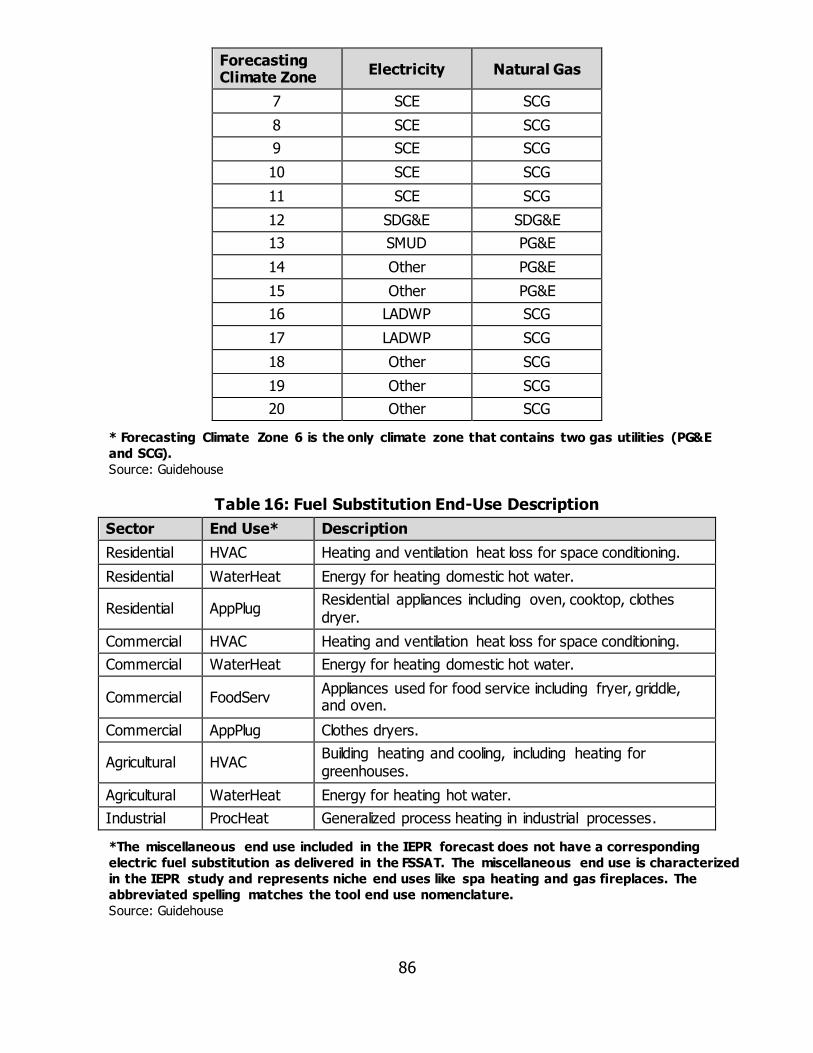
86
Forecasting Climate Zone
Electricity Natural Gas
7 SCE SCG
8 SCE SCG
9 SCE SCG
10 SCE SCG
11 SCE SCG
12 SDG&E SDG&E
13 SMUD PG&E
14 Other PG&E
15 Other PG&E
16 LADWP SCG
17 LADWP SCG
18 Other SCG
19 Other SCG
20 Other SCG
* Forecasting Climate Zone 6 is the only climate zone that contains two gas utilities (PG&E
and SCG).
Source: Guidehouse
Table 16: Fuel Substitution End-Use Description
Sector End Use* Description
Residential HVAC Heating and ventilation heat loss for space conditioning.
Residential WaterHeat Energy for heating domestic hot water.
Residential AppPlug Residential appliances including oven, cooktop, clothes dryer.
Commercial HVAC Heating and ventilation heat loss for space conditioning.
Commercial WaterHeat Energy for heating domestic hot water.
Commercial FoodServ Appliances used for food service including fryer, griddle, and oven.
Commercial AppPlug Clothes dryers.
Agricultural HVAC Building heating and cooling, including heating for greenhouses.
Agricultural WaterHeat Energy for heating hot water.
Industrial ProcHeat Generalized process heating in industrial processes.
*The miscellaneous end use included in the IEPR forecast does not have a corresponding
electric fuel substitution as delivered in the FSSAT. The miscellaneous end use is characterized
in the IEPR study and represents niche end uses like spa heating and gas fireplaces. The
abbreviated spelling matches the tool end use nomenclature.
Source: Guidehouse

87
R Processes
Five main analysis processes occur with the R script in FSSAT, each with specific
functionalities. This section describes each process.
Disaggregate IEPR Forecast to Technology Level
The CEC develops, adopts, and reports a natural gas forecast every two years through the
IEPR process. The research team used the IEPR 2017 mid case as the starting baseline gas
demand in the FSSAT framework.163 Figure 12 shows the mid case IEPR natural gas demand
forecast at the sector and end-use levels.
Figure 12: IEPR Natural Gas Forecast by Sector and End Use
Stacked bar chart showing annual sector and end-use allocation of the natural gas forecast.
Industrial and residential HVAC have the largest end-use consumption. The miscellaneous end
use includes niche energy users such as spa heating and pool heating. No fuel substitution
takes place in miscellaneous end uses.
Source: IEPR 2017
The first R process uses the IEPR natural gas demand forecast and data from the 2019
California Potential and Goals study natural gas technology characterization to approximate the
relative proportion of consumption that can be attributed to unique technologies across all
residential and commercial end uses. This R process does not affect industrial and agricultural
sector data.
The overall gas consumption of a given technology as shown in Equation 1 relies on the
characterized unit consumption, saturation, density, and building stock. The technology-level
gas consumption varies by year with changing stock levels. Equation 1 also shows the
163 California Energy Commission. January 2020. CED 2019 - AAEE Savings by Planning Area and End Use.
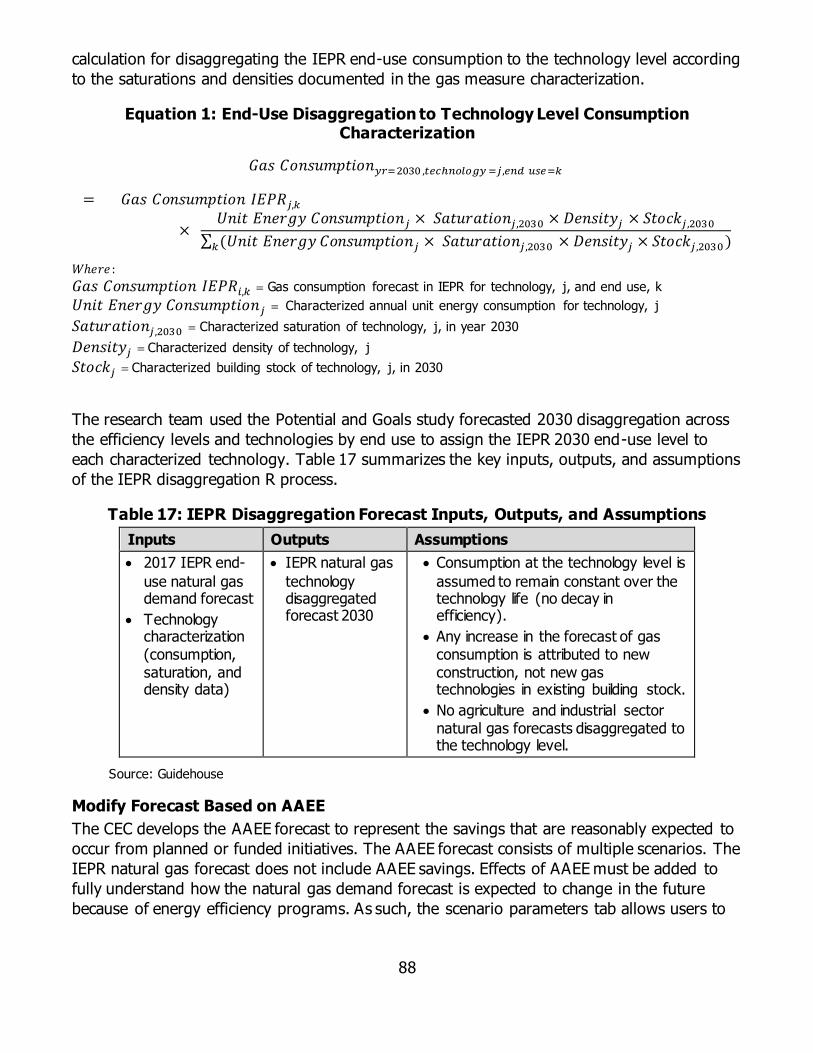
88
calculation for disaggregating the IEPR end-use consumption to the technology level according
to the saturations and densities documented in the gas measure characterization.
Equation 1: End-Use Disaggregation to Technology Level Consumption Characterization
𝐺𝑎𝑠 𝐶𝑜𝑛𝑠𝑢𝑚𝑝𝑡𝑖𝑜𝑛𝑦𝑟=2030 ,𝑡𝑒𝑐ℎ𝑛𝑜𝑙𝑜𝑔𝑦=𝑗,𝑒𝑛𝑑 𝑢𝑠𝑒=𝑘
= 𝐺𝑎𝑠 𝐶𝑜𝑛𝑠𝑢𝑚𝑝𝑡𝑖𝑜𝑛 𝐼𝐸𝑃𝑅𝑗,𝑘
× 𝑈𝑛𝑖𝑡 𝐸𝑛𝑒𝑟𝑔𝑦 𝐶𝑜𝑛𝑠𝑢𝑚𝑝𝑡𝑖𝑜𝑛𝑗 × 𝑆𝑎𝑡𝑢𝑟𝑎𝑡𝑖𝑜𝑛𝑗,2030 × 𝐷𝑒𝑛𝑠𝑖𝑡𝑦𝑗 × 𝑆𝑡𝑜𝑐𝑘𝑗,2030
∑ (𝑈𝑛𝑖𝑡 𝐸𝑛𝑒𝑟𝑔𝑦 𝐶𝑜𝑛𝑠𝑢𝑚𝑝𝑡𝑖𝑜𝑛𝑗 × 𝑆𝑎𝑡𝑢𝑟𝑎𝑡𝑖𝑜𝑛𝑗,2030 × 𝐷𝑒𝑛𝑠𝑖𝑡𝑦𝑗 × 𝑆𝑡𝑜𝑐𝑘𝑗,2030)𝑘
𝑊ℎ𝑒𝑟𝑒 :
𝐺𝑎𝑠 𝐶𝑜𝑛𝑠𝑢𝑚𝑝𝑡𝑖𝑜𝑛 𝐼𝐸𝑃𝑅𝑖,𝑘 = Gas consumption forecast in IEPR for technology, j, and end use, k
𝑈𝑛𝑖𝑡 𝐸𝑛𝑒𝑟𝑔𝑦 𝐶𝑜𝑛𝑠𝑢𝑚𝑝𝑡𝑖𝑜𝑛𝑗 = Characterized annual unit energy consumption for technology, j
𝑆𝑎𝑡𝑢𝑟𝑎𝑡𝑖𝑜𝑛𝑗,2030 = Characterized saturation of technology, j, in year 2030
𝐷𝑒𝑛𝑠𝑖𝑡𝑦𝑗 = Characterized density of technology, j
𝑆𝑡𝑜𝑐𝑘𝑗 = Characterized building stock of technology, j, in 2030
The research team used the Potential and Goals study forecasted 2030 disaggregation across
the efficiency levels and technologies by end use to assign the IEPR 2030 end-use level to
each characterized technology. Table 17 summarizes the key inputs, outputs, and assumptions
of the IEPR disaggregation R process.
Table 17: IEPR Disaggregation Forecast Inputs, Outputs, and Assumptions
Inputs Outputs Assumptions
2017 IEPR end-
use natural gas demand forecast
Technology characterization (consumption, saturation, and density data)
IEPR natural gas
technology disaggregated forecast 2030
Consumption at the technology level is
assumed to remain constant over the technology life (no decay in efficiency).
Any increase in the forecast of gas consumption is attributed to new construction, not new gas technologies in existing building stock.
No agriculture and industrial sector natural gas forecasts disaggregated to the technology level.
Source: Guidehouse
Modify Forecast Based on AAEE
The CEC develops the AAEE forecast to represent the savings that are reasonably expected to
occur from planned or funded initiatives. The AAEE forecast consists of multiple scenarios. The
IEPR natural gas forecast does not include AAEE savings. Effects of AAEE must be added to
fully understand how the natural gas demand forecast is expected to change in the future
because of energy efficiency programs. As such, the scenario parameters tab allows users to
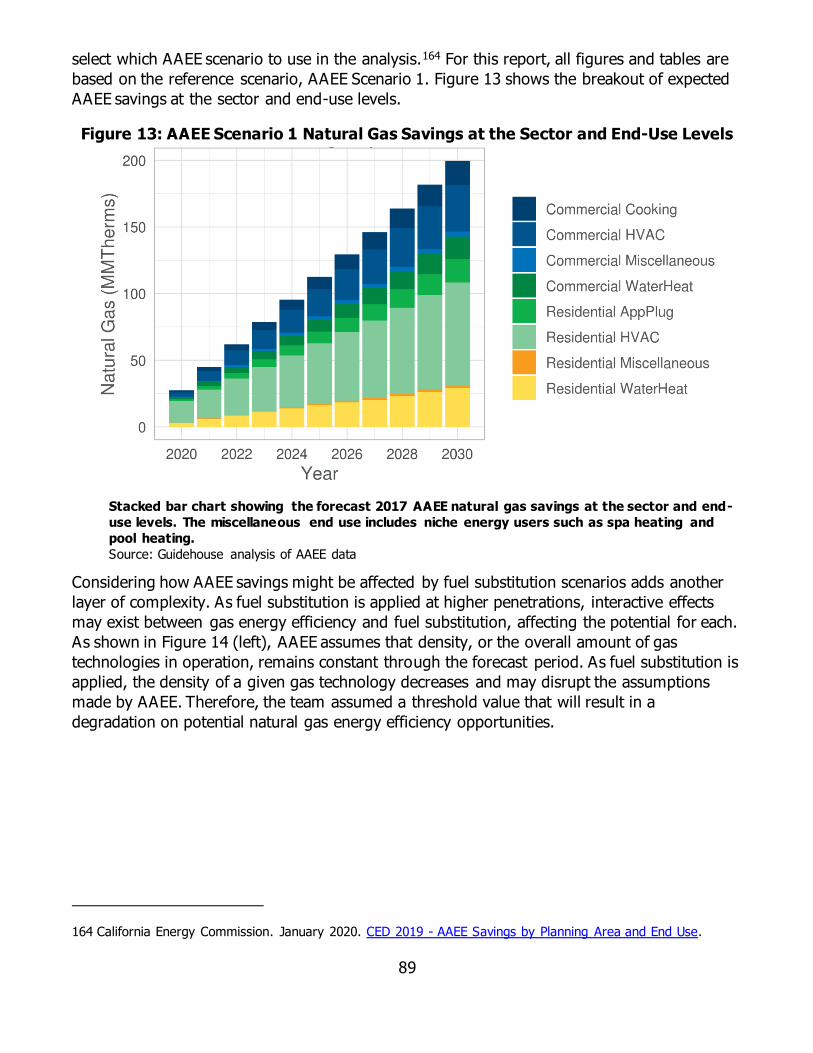
89
select which AAEE scenario to use in the analysis.164 For this report, all figures and tables are
based on the reference scenario, AAEE Scenario 1. Figure 13 shows the breakout of expected
AAEE savings at the sector and end-use levels.
Figure 13: AAEE Scenario 1 Natural Gas Savings at the Sector and End-Use Levels
Stacked bar chart showing the forecast 2017 AAEE natural gas savings at the sector and end-
use levels. The miscellaneous end use includes niche energy users such as spa heating and
pool heating.
Source: Guidehouse analysis of AAEE data
Considering how AAEE savings might be affected by fuel substitution scenarios adds another
layer of complexity. As fuel substitution is applied at higher penetrations, interactive effects
may exist between gas energy efficiency and fuel substitution, affecting the potential for each.
As shown in Figure 14 (left), AAEE assumes that density, or the overall amount of gas
technologies in operation, remains constant through the forecast period. As fuel substitution is
applied, the density of a given gas technology decreases and may disrupt the assumptions
made by AAEE. Therefore, the team assumed a threshold value that will result in a
degradation on potential natural gas energy efficiency opportunities.
164 California Energy Commission. January 2020. CED 2019 - AAEE Savings by Planning Area and End Use.
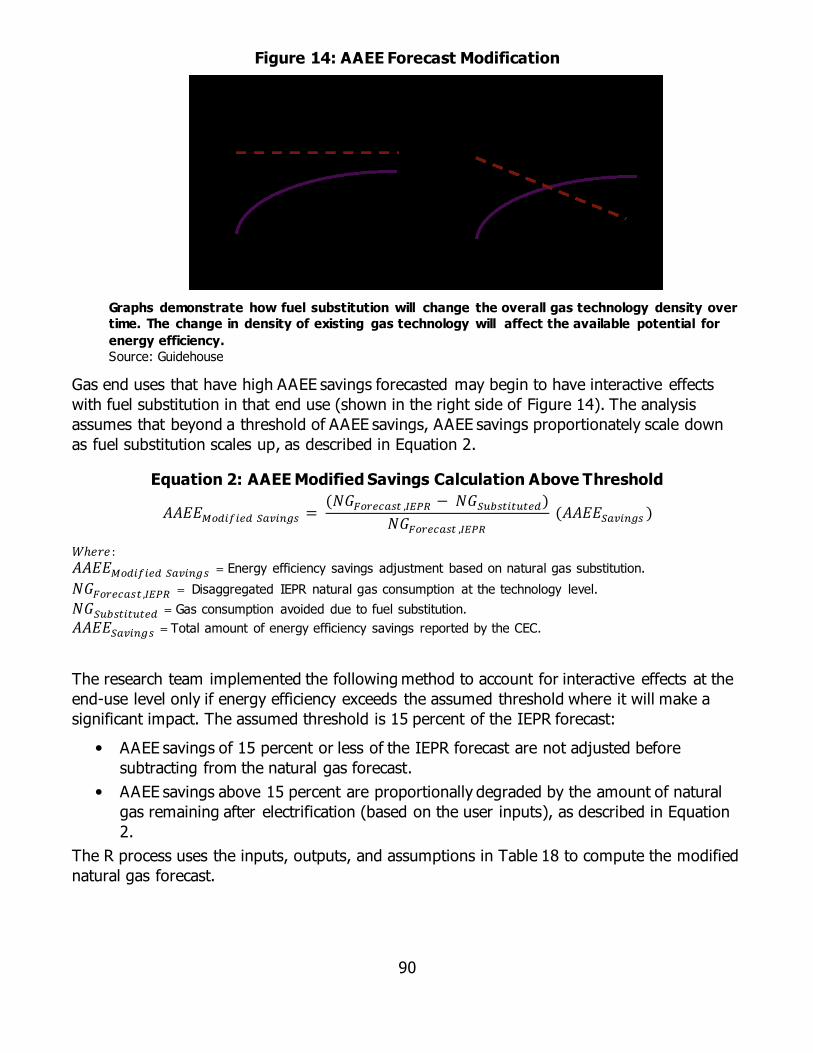
90
Figure 14: AAEE Forecast Modification
Graphs demonstrate how fuel substitution will change the overall gas technology density over
time. The change in density of existing gas technology will affect the available potential for
energy efficiency.
Source: Guidehouse
Gas end uses that have high AAEE savings forecasted may begin to have interactive effects
with fuel substitution in that end use (shown in the right side of Figure 14). The analysis
assumes that beyond a threshold of AAEE savings, AAEE savings proportionately scale down
as fuel substitution scales up, as described in Equation 2.
Equation 2: AAEE Modified Savings Calculation Above Threshold
𝐴𝐴𝐸𝐸𝑀𝑜𝑑𝑖𝑓𝑖𝑒𝑑 𝑆𝑎𝑣𝑖𝑛𝑔𝑠 = (𝑁𝐺𝐹𝑜𝑟𝑒𝑐𝑎𝑠𝑡 ,𝐼𝐸𝑃𝑅 − 𝑁𝐺𝑆𝑢𝑏𝑠𝑡𝑖𝑡𝑢𝑡𝑒𝑑)
𝑁𝐺𝐹𝑜𝑟𝑒𝑐𝑎𝑠𝑡 ,𝐼𝐸𝑃𝑅 (𝐴𝐴𝐸𝐸𝑆𝑎𝑣𝑖𝑛𝑔𝑠 )
𝑊ℎ𝑒𝑟𝑒 :
𝐴𝐴𝐸𝐸𝑀𝑜𝑑𝑖𝑓𝑖𝑒𝑑 𝑆𝑎𝑣𝑖𝑛𝑔𝑠 = Energy efficiency savings adjustment based on natural gas substitution.
𝑁𝐺𝐹𝑜𝑟𝑒𝑐𝑎𝑠𝑡 ,𝐼𝐸𝑃𝑅 = Disaggregated IEPR natural gas consumption at the technology level.
𝑁𝐺𝑆𝑢𝑏𝑠𝑡𝑖𝑡𝑢𝑡𝑒𝑑 = Gas consumption avoided due to fuel substitution.
𝐴𝐴𝐸𝐸𝑆𝑎𝑣𝑖𝑛𝑔𝑠 = Total amount of energy efficiency savings reported by the CEC.
The research team implemented the following method to account for interactive effects at the
end-use level only if energy efficiency exceeds the assumed threshold where it will make a
significant impact. The assumed threshold is 15 percent of the IEPR forecast:
AAEE savings of 15 percent or less of the IEPR forecast are not adjusted before
subtracting from the natural gas forecast.
AAEE savings above 15 percent are proportionally degraded by the amount of natural
gas remaining after electrification (based on the user inputs), as described in Equation
2.
The R process uses the inputs, outputs, and assumptions in Table 18 to compute the modified
natural gas forecast.

91
Table 18: Modify AAEE Forecast Inputs, Outputs, and Assumptions
Key Inputs Key Outputs Key Assumptions
Disaggregated IEPR technology-level natural gas demand forecast
AAEE savings (reference case)*
AAEE modified technology-level natural gas forecast
Beyond a threshold of 15 percent savings, AAEE savings proportionately scale down as fuel substitution scales up per Equation 2.
*Actual AAEE scenario is user input and may vary.
Source: Guidehouse
Substitute Technologies
The main objective of the substitute technologies R process is to determine the gas reduction
and the electric load increase as well as the cost impacts of fuel substitution. A key assumption
for this process is that the electric technology consumption is a function of the existing gas
consumption. In addition, this R process also calculates the associated GHG emissions
reductions and ancillary costs.
The user input workbook has a scenario parameters tab (Table 10). This tab allows the user to
set parameters to define the tool calculations for fuel substitution scenarios. The tab also
provides a high-level adjustment to all technologies by sector and utility. However, users can
override these options at a more granular level (at the building type and BCZ level) in the R
input-substitution map tab. The adjustable parameters include the following:
Replacement Percentage Parameters
Percentage replacement-on-burnout electric replacement parameter: This
parameter defines the cumulative replace-on-burnout replacement of a gas technology
with an electric technology over the forecast period for a given sector and end-use
combination.
Percentage accelerated retrofit electric replacement parameter: This
parameter defines the cumulative accelerated retrofit replacement of a gas technology
with an electric technology over the forecast period for a given sector and end-use
combination.
Percentage new construction electric installation parameter: This parameter
defines the cumulative proportion of electric technology installed in newly constructed
buildings over the forecast period for a given sector and end-use combination.
Replacement Technology Parameters
Maximum allowable measure cost per savings percentile parameter: This
percentile parameter defines the maximum allowable $/(therm saved) that the analysis
framework will consider. Only technologies that meet the $/(therm saved) percentile
defined are included in replacements unless overridden in the R inputs worksheet.
Replacement efficiency weighting parameter: The replacement efficiency is
assigned one of three values:

92
o High-efficiency weighted: With this selection, the highest-efficiency technology is
weighted most heavily, and then weightings decrease linearly in order of
decreasing efficiency.
o Evenly weighted: All technologies are weighted evenly.
o Low-efficiency weighted: With this selection, the lowest-efficiency technology is
weighted most heavily, and then weightings decrease linearly in order of
increasing efficiency.
Before substitution takes place, the tool segments the IEPR-forecasted gas consumption into
new construction consumption, replace-on-burnout eligible consumption, and acceleration
retrofit eligible consumption using the following three steps:
1. The IEPR 2030 forecasted natural gas consumption is segmented into existing
consumption and new construction consumption based on the IEPR-predicted increase
in natural gas consumption over the forecast period. This segmentation is based on two
main assumptions:
a. All new natural gas consumption over the forecast period is attributable to newly
constructed buildings.
b. Existing natural gas consumption at the beginning of the forecast period
decreases at the same rate as the building demolition rate.
2. The existing stock developed in step 1 is further segmented based on the proportion of
technologies that are expected to expire during the forecast period based on the
associated EUL. These technologies become eligible for replace-on-burnout
replacement. The FSSAT framework assumes annual burnout rate is constant through
the forecast period by technology.
3. The makeup of technologies in the existing stock that are not expected to expire over
the forecast period become eligible for accelerated retrofit replacement.
Natural Gas Reduction
Per the scenario description, the user assigns the maximum cumulative percentage
substitution for natural gas consumption by 2030 for new construction, replace-on-burnout,
and accelerated replacement. Replacement is carried out for existing stock (replace on burnout
and accelerated retrofit) and new stock (new construction) according to the scenario
parameter inputs. The simplest user entry is to assign percentages by utility, sector, and end
use. However, a user may provide fine tuning of all inputs for a given scenario at the
technology, building-type, and BCZ level (on the R input-substitution map tab). The tool
applies the percentage at the technology level to the disaggregated forecast in 2030
developed in the disaggregate IEPR forecast R process. The tool calculates the natural gas
consumption reduction for prior years (2020–2029) based on the user-defined adoption curves
mapped in the user inputs. Equation 3 describes this calculation.

93
Equation 3: Avoided Gas Consumption by Year by Technology
𝐺𝑎𝑠 𝐴𝑣𝑜𝑖𝑑𝑒𝑑𝑖,𝑗,𝑘= 𝐺𝑎𝑠 𝐶𝑜𝑛𝑠𝑢𝑚𝑝𝑡𝑖𝑜𝑛2030,𝑗 ∗ 𝑅𝑒𝑝𝑙𝑎𝑐𝑒𝑚𝑒𝑛𝑡 %𝑗 ∗ 𝐸𝑙𝑒𝑐 𝑇𝑒𝑐ℎ 𝑆𝑢𝑏𝑠𝑡𝑖𝑡𝑢𝑡𝑖𝑜𝑛 𝑆ℎ𝑎𝑟𝑒 %𝑘
∗ 𝐴𝑑𝑜𝑝𝑡𝑖𝑜𝑛 𝐶𝑢𝑟𝑣𝑒𝑖,𝑘
𝑊ℎ𝑒𝑟𝑒 :
𝐺𝑎𝑠 𝐴𝑣𝑜𝑖𝑑𝑒𝑑𝑦𝑟=𝑖,𝑔𝑎𝑠𝑡𝑒𝑐ℎ=𝑗,𝑒𝑙𝑒𝑐𝑡𝑒𝑐ℎ=𝑘 = Gas consumption avoided by substituting gas technology, j, with electric
technology type and efficiency, k, in year i, for a given gas and electric utility territory, sector, climate zone, and
building type.
𝐺𝑎𝑠 𝐶𝑜𝑛𝑠𝑢𝑚𝑝𝑡𝑖𝑜𝑛2030,𝑗 = Business-as-usual technology-level gas consumption in 2030 for gas technology, j, for a
given gas and electric utility territory, sector, climate zone, and building type.
𝑅𝑒𝑝𝑙𝑎𝑐𝑒𝑚𝑒𝑛𝑡 %𝑗 = User-defined percentage of gas technology, j, which will be replaced with an electric
technology by 2030 (may vary by utility, sector, end use, and replacement type).165
𝐸𝑙𝑒𝑐 𝑇𝑒𝑐ℎ 𝑆𝑢𝑏𝑠𝑡𝑖𝑡𝑢𝑡𝑖𝑜𝑛 𝑆ℎ𝑎𝑟𝑒 %𝑘 = Proportion of gas technology consumption substituted with electric
technology, k, by 2030.
𝐴𝑑𝑜𝑝𝑡𝑖𝑜𝑛 𝐶𝑢𝑟𝑣𝑒𝑖 ,𝑘 = Percentage of adoption defined in user inputs for electric technology, k in year, i, with the
cumulative adoption percentage at 100 percent over the forecast period.
Natural Gas Reduction — Agricultural and Industrial
The industrial and agricultural sectors use a different calculation of the avoided gas
consumption compared to the residential and commercial sectors. Before this study,
characterizing these sectors for energy efficiency potential has been on a consumption basis
versus a widget or square footage basis. The load intensity varies greatly across building types
within the agricultural and industrial sector. The fuel substitution end-use characterization is
based on a percentage of consumption estimate, as described in Equation 4.
Equation 4: Avoided Gas Consumption for Agricultural and Industrial
𝐺𝑎𝑠 𝐴𝑣𝑜𝑖𝑑𝑒𝑑𝑦𝑟 = 𝑖,𝐸𝑛𝑑 𝑈𝑠𝑒= (𝐺𝑎𝑠 𝐶𝑜𝑛𝑠𝑢𝑚𝑝𝑡𝑖𝑜𝑛2020 ,𝑆𝑒𝑐𝑡𝑜𝑟 − 𝐴𝐴𝐸𝐸 𝐺𝑎𝑠 𝑆𝑎𝑣𝑖𝑛𝑔𝑠2020 ,𝑆𝑒𝑐𝑡𝑜𝑟 )∗ 𝑌𝑒𝑎𝑟𝑙𝑦 𝐺𝑎𝑠 𝐶𝑜𝑛𝑠𝑢𝑚𝑝𝑡𝑖𝑜𝑛 𝐶ℎ𝑎𝑛𝑔𝑒 %𝑖,𝐸𝑛𝑑 𝑈𝑠𝑒 ∗ 𝑈𝑠𝑒𝑟 𝐼𝑛𝑝𝑢𝑡 𝑆𝑢𝑏𝑠𝑡𝑖𝑡𝑢𝑡𝑖𝑜𝑛 %𝐸𝑛𝑑 𝑈𝑠𝑒
𝑊ℎ𝑒𝑟𝑒 :
𝐺𝑎𝑠 𝐴𝑣𝑜𝑖𝑑𝑒𝑑𝑦𝑟=𝑖,𝐸𝑛𝑑 𝑈𝑠𝑒 = Gas consumption avoided due to fuel substitution at the end-use level in year, i.
𝐺𝑎𝑠 𝐶𝑜𝑛𝑠𝑢𝑚𝑝𝑡𝑖𝑜𝑛2020,𝑆𝑒𝑐𝑡𝑜𝑟 = Gas consumption in the baseline year (2020) at the sector level.
𝐴𝐴𝐸𝐸 𝐺𝑎𝑠 𝑆𝑎𝑣𝑖𝑛𝑔𝑠2020 ,𝑆𝑒𝑐𝑡𝑜𝑟 = Energy efficiency savings in the baseline year (2020) at the sector level.
𝑌𝑒𝑎𝑟𝑙𝑦 𝐺𝑎𝑠 𝐶𝑜𝑛𝑠𝑢𝑚𝑝𝑡𝑖𝑜𝑛 𝐶ℎ𝑎𝑛𝑔𝑒 %𝑖 ,𝐸𝑛𝑑 𝑈𝑠𝑒 = Proportion of gas consumption substituted with electric
technologies at the end-use level in year, i.166
𝑈𝑠𝑒𝑟 𝐼𝑛𝑝𝑢𝑡 𝑆𝑢𝑏𝑠𝑡𝑖𝑡𝑢𝑡𝑖𝑜𝑛 %𝐸𝑛𝑑 𝑈𝑠𝑒 = Percentage of the total technical potential of fuel substitution that is likely to
occur at the end-use level in year, i, over the forecast period.
165 Replacement type is either replace on burnout, accelerated replacement, or new construction.
166 The yearly gas consumption change percentage is defined by the technology characterization of industrial
and agricultural fuel substitution, as defined in Appendix F.
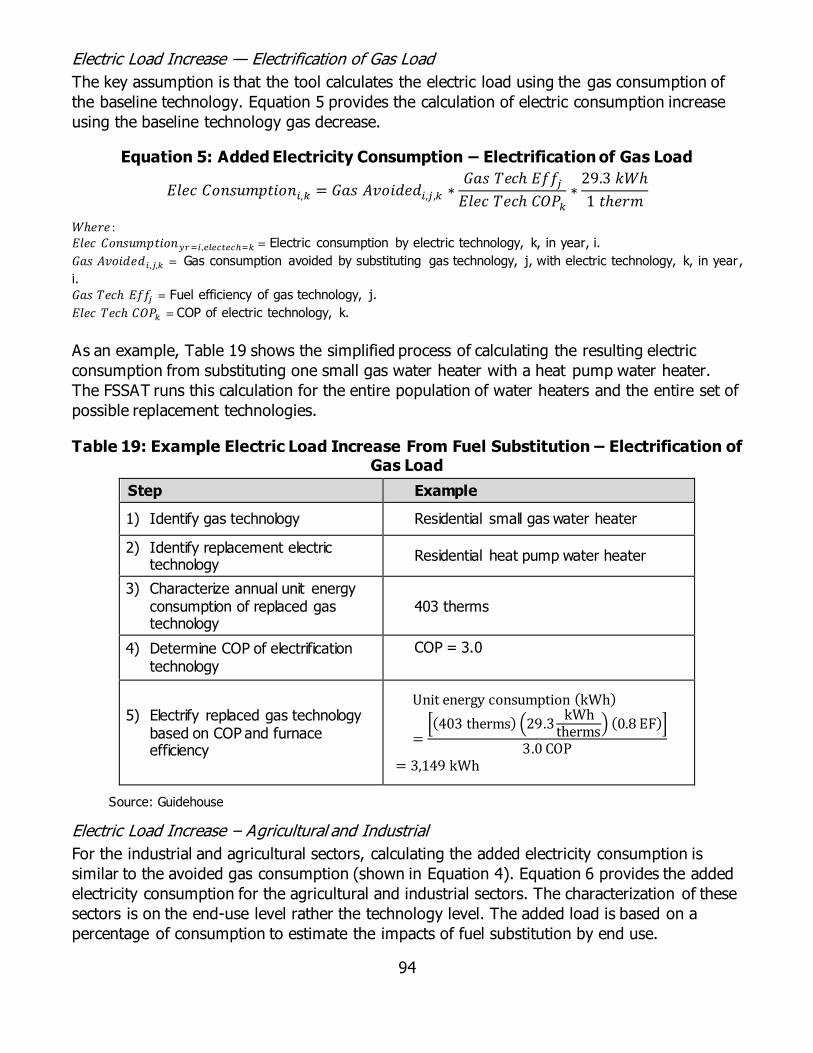
94
Electric Load Increase — Electrification of Gas Load
The key assumption is that the tool calculates the electric load using the gas consumption of
the baseline technology. Equation 5 provides the calculation of electric consumption increase
using the baseline technology gas decrease.
Equation 5: Added Electricity Consumption – Electrification of Gas Load
𝐸𝑙𝑒𝑐 𝐶𝑜𝑛𝑠𝑢𝑚𝑝𝑡𝑖𝑜𝑛𝑖,𝑘 = 𝐺𝑎𝑠 𝐴𝑣𝑜𝑖𝑑𝑒𝑑𝑖,𝑗,𝑘 ∗𝐺𝑎𝑠 𝑇𝑒𝑐ℎ 𝐸𝑓𝑓𝑗𝐸𝑙𝑒𝑐 𝑇𝑒𝑐ℎ 𝐶𝑂𝑃𝑘
∗29.3 𝑘𝑊ℎ
1 𝑡ℎ𝑒𝑟𝑚
𝑊ℎ𝑒𝑟𝑒 : 𝐸𝑙𝑒𝑐 𝐶𝑜𝑛𝑠𝑢𝑚𝑝𝑡𝑖𝑜𝑛𝑦𝑟=𝑖,𝑒𝑙𝑒𝑐𝑡𝑒𝑐ℎ=𝑘 = Electric consumption by electric technology, k, in year, i.
𝐺𝑎𝑠 𝐴𝑣𝑜𝑖𝑑𝑒𝑑𝑖 ,𝑗,𝑘 = Gas consumption avoided by substituting gas technology, j, with electric technology, k, in year,
i. 𝐺𝑎𝑠 𝑇𝑒𝑐ℎ 𝐸𝑓𝑓𝑗 = Fuel efficiency of gas technology, j.
𝐸𝑙𝑒𝑐 𝑇𝑒𝑐ℎ 𝐶𝑂𝑃𝑘 = COP of electric technology, k.
As an example, Table 19 shows the simplified process of calculating the resulting electric
consumption from substituting one small gas water heater with a heat pump water heater.
The FSSAT runs this calculation for the entire population of water heaters and the entire set of
possible replacement technologies.
Table 19: Example Electric Load Increase From Fuel Substitution – Electrification of Gas Load
Step Example
1) Identify gas technology Residential small gas water heater
2) Identify replacement electric technology
Residential heat pump water heater
3) Characterize annual unit energy consumption of replaced gas technology
403 therms
4) Determine COP of electrification technology
COP = 3.0
5) Electrify replaced gas technology based on COP and furnace efficiency
Unit energy consumption (kWh)
=[(403 therms) (29.3
kWhtherms
) (0.8 EF)]
3.0 COP
= 3,149 kWh
Source: Guidehouse
Electric Load Increase – Agricultural and Industrial
For the industrial and agricultural sectors, calculating the added electricity consumption is
similar to the avoided gas consumption (shown in Equation 4). Equation 6 provides the added
electricity consumption for the agricultural and industrial sectors. The characterization of these
sectors is on the end-use level rather the technology level. The added load is based on a
percentage of consumption to estimate the impacts of fuel substitution by end use.

95
Equation 6: Added Electricity Consumption for Agricultural and Industrial
𝐸𝑙𝑒𝑐 𝐶𝑜𝑛𝑠𝑢𝑚𝑝𝑡𝑖𝑜𝑛𝑦𝑟 = 𝑖 ,𝐸𝑛𝑑 𝑈𝑠𝑒
= (𝐸𝑙𝑒𝑐 𝐶𝑜𝑛𝑠𝑢𝑚𝑝𝑡𝑖𝑜𝑛2020,𝑆𝑒𝑐𝑡𝑜𝑟−𝐴𝐴𝐸𝐸 𝐸𝑙𝑒𝑐 𝑆𝑎𝑣𝑖𝑛𝑔𝑠2020,𝑆𝑒𝑐𝑡𝑜𝑟)
× 𝑌𝑒𝑎𝑟𝑙𝑦 𝐸𝑙𝑒𝑐 𝐶𝑜𝑛𝑠𝑢𝑚𝑝𝑡𝑖𝑜𝑛 𝐶ℎ𝑎𝑛𝑔𝑒 %𝑖,𝐸𝑛𝑑 𝑈𝑠𝑒 × 𝑈𝑠𝑒𝑟 𝐼𝑛𝑝𝑢𝑡 𝑆𝑢𝑏𝑠𝑡𝑖𝑡𝑢𝑡𝑖𝑜𝑛 %𝐸𝑛𝑑 𝑈𝑠𝑒
𝑊ℎ𝑒𝑟𝑒 :
𝐸𝑙𝑒𝑐 𝐶𝑜𝑛𝑠𝑢𝑚𝑝𝑡𝑖𝑜𝑛𝑦𝑟=𝑖,𝐸𝑛𝑑 𝑈𝑠𝑒 = Added electricity consumption due to fuel substitution at the end-use level in
year, i.
𝐸𝑙𝑒𝑐 𝐶𝑜𝑛𝑠𝑢𝑚𝑝𝑡𝑖𝑜𝑛2020 ,𝑆𝑒𝑐𝑡𝑜𝑟 = Electricity consumption in the baseline year (2020) at the sector level.
𝐴𝐴𝐸𝐸 𝐸𝑙𝑒𝑐 𝑆𝑎𝑣𝑖𝑛𝑔 𝑠2020,𝑆𝑒𝑐𝑡𝑜𝑟 = Energy efficiency savings in the baseline year (2020) at the sector level.
𝑌𝑒𝑎𝑟𝑙𝑦 𝐸𝑙𝑒𝑐 𝐶𝑜𝑛𝑠𝑢𝑚𝑝𝑡𝑖𝑜𝑛 𝐶ℎ𝑎𝑛𝑔𝑒 %𝑖,𝐸𝑛𝑑 𝑈𝑠𝑒 = Increased proportion of electricity consumption due to fuel
substitution at the end-use level in year, i. 167
𝑈𝑠𝑒𝑟 𝐼𝑛𝑝𝑢𝑡 𝑆𝑢𝑏𝑠𝑡𝑖𝑡𝑢𝑡𝑖𝑜𝑛 %𝐸𝑛𝑑 𝑈𝑠𝑒 = Percentage of the total technical potential of fuel substitution that is likely to
occur at the end-use level in year, i, over the forecast period.
Electric Load Increase – Additional Cooling
The electric load added by new electric technologies is not limited to the consumption
introduced by the electrification of gas technologies load. In the case of heat pump
technologies capable of providing heating and cooling, the tool must account for the added
electric consumption resulting from the introduction of cooling to buildings that previously
lacked space cooling.
Equation 7: Added Electricity Consumption – Added Cooling
𝐴𝑑𝑑𝑒𝑑 𝐶𝑜𝑜𝑙𝑖𝑛𝑔 𝐸𝑙𝑒𝑐𝑡𝑟𝑖𝑐 𝐶𝑜𝑛𝑠𝑢𝑚𝑝𝑡𝑖𝑜𝑛𝑖 ,𝑘
= 𝐻𝑒𝑎𝑡 𝑃𝑢𝑚𝑝 𝑆𝑡𝑜𝑐𝑘𝑖,𝑘 × 𝐸𝑙𝑒𝑐 𝐶𝑜𝑛𝑠𝑢𝑚𝑝𝑡𝑖𝑜𝑛, 𝐴𝐶𝑘 × (1 −% 𝐵𝑢𝑖𝑙𝑑𝑖𝑛𝑔𝑠 𝑤𝑖𝑡ℎ 𝐴𝐶)
𝑊ℎ𝑒𝑟𝑒 : 𝐴𝑑𝑑𝑒𝑑 𝐶𝑜𝑜𝑙𝑖𝑛𝑔 𝐸𝑙𝑒𝑐𝑡𝑟𝑖𝑐 𝐶𝑜𝑛𝑠𝑢𝑚𝑝𝑡𝑖𝑜𝑛
𝑦𝑟=𝑖,𝑒𝑙𝑒𝑐𝑡𝑒𝑐ℎ=𝑘= Added electric cooling consumption by electric technology, k, in
year, i.
𝐻𝑒𝑎𝑡 𝑃𝑢𝑚𝑝 𝑆𝑡𝑜𝑐𝑘 (𝑘)𝑖 = Cumulative number of heat pumps of type and efficiency, k, installed by year, i. 𝐸𝑙𝑒𝑐 𝐶𝑜𝑛𝑠𝑢𝑚𝑝𝑡𝑖𝑜𝑛 , 𝐴𝐶𝑘 = Electric consumption of air conditioning with equivalent use case and efficiency level of
heat pump, k. % 𝐵𝑢𝑖𝑙𝑑𝑖𝑛𝑔𝑠 𝑤𝑖𝑡ℎ 𝐴𝐶= Percentage of buildings with air conditioning given a gas utility territory, BCZ, and building
type.
The buildings with AC proportions tab allows the user to input the proportion of buildings with
air conditioning at the building type, gas utility, and BCZ levels.
The buildings with AC proportions worksheet has air conditioning densities characterized at the
gas utility level, making the densities identical across BCZs.168 However, the probability of a
home having an air conditioner depends on the associated BCZ. Custom values are permitted
167 The yearly electric consumption change percentage is based on the adoption curve value for the specific
year.
168 The current dataset is based on the Potential and Goals study measure characterization.

96
in the buildings with AC proportions tab to allow the user to override these default
percentages if data on existing saturation are available. The worksheet also characterizes only
air-conditioning proportions for homes — all uncharacterized buildings (that is, commercial
buildings) are assumed to have air conditioning. The user may add a characterization of the
proportion of commercial buildings with air conditioning. Table 20 provides an example
calculation of the electric load increase for when cooling capability due to heat pumps is added
to buildings where air conditioning was not previously present.
Table 20: Example Electric Load Increase from Fuel Substitution – Added Cooling
Step Example
1) Identify replacement electric technology
Packaged/split heat pump where SEER = 13
2) Identify equivalent air conditioning technology
Res packaged/split system AC (SEER 13)
3) Look up electricity consumption for
equivalent air conditioning technology
583.8 kWh
4) Look up percentage of buildings with air conditioning
62.8%
5) Calculate added electricity consumption from additional cooling
𝐴𝑑𝑑𝑒𝑑 𝐶𝑜𝑜𝑙𝑖𝑛𝑔 𝑝𝑒𝑟 𝑈𝑛𝑖𝑡 (𝑘𝑊ℎ)
= (583.8 𝑘𝑊ℎ)(1 − 0.628)
= 217.2 𝑘𝑊ℎ
Source: Guidehouse
Stock Forecast
The tool calculated the added electric technologies stock forecast by dividing the added
electric forecast for each technology by the associated unit energy consumption (Equation 8).
Equation 8: Added Electric Technologies Stock
𝑆𝑡𝑜𝑐𝑘𝑖,𝑘 =𝐸𝑙𝑒𝑐 𝐶𝑜𝑛𝑠𝑢𝑚𝑝𝑡𝑖𝑜𝑛𝑖,𝑘
𝑈𝑛𝑖𝑡 𝐸𝑛𝑒𝑟𝑔𝑦 𝐶𝑜𝑛𝑠𝑢𝑚𝑝𝑡𝑖𝑜𝑛𝑘
𝑊ℎ𝑒𝑟𝑒 : 𝑆𝑡𝑜𝑐𝑘𝑦𝑟=𝑖,𝑒𝑙𝑒𝑐𝑡𝑒𝑐ℎ=𝑘 = Stock of added electric technologies, k, in year, i.
𝐸𝑙𝑒𝑐 𝐶𝑜𝑛𝑠𝑢𝑚𝑝𝑡𝑖𝑜𝑛𝑦𝑟=𝑖,𝑒𝑙𝑒𝑐𝑡𝑒𝑐ℎ=𝑘 = Electric consumption by electric technology, k, in year, i.
𝑈𝑛𝑖𝑡 𝐸𝑛𝑒𝑟𝑔𝑦 𝐶𝑜𝑛𝑠𝑢𝑚𝑝𝑡𝑖𝑜𝑛𝑖 ,𝑗 ,𝑘 = Annual kWh consumed by electric technology, k.

97
Technology and Fuel Costs
Technology costs, described in Equation 9, use the forecast electric technology stock increase
and the three characterized technology cost components (equipment, installation, and
overhead and profit).
Equation 9: Added Technology Costs
𝐸𝑞𝑢𝑖𝑝𝑚𝑒𝑛𝑡 𝐶𝑜𝑠𝑡𝑦𝑟=𝑖,𝑒𝑙𝑒𝑐𝑡𝑒𝑐ℎ=𝑘 = 𝑆𝑡𝑜𝑐𝑘𝑦𝑟=𝑖,𝑒𝑙𝑒𝑐𝑡𝑒𝑐ℎ=𝑘 ∗ 𝑈𝑛𝑖𝑡 𝐸𝑞𝑢𝑖𝑝.𝐶𝑜𝑠𝑡𝑒𝑙𝑒𝑐𝑡𝑒𝑐ℎ=𝑘
𝐼𝑛𝑠𝑡𝑎𝑙𝑙𝑎𝑡𝑖𝑜𝑛 𝐶𝑜𝑠𝑡𝑦𝑟=𝑖,𝑒𝑙𝑒𝑐𝑡𝑒𝑐ℎ=𝑘 = 𝑆𝑡𝑜𝑐𝑘𝑦𝑟=𝑖,𝑒𝑙𝑒𝑐𝑡𝑒𝑐ℎ=𝑘 ∗ 𝑈𝑛𝑖𝑡 𝐼𝑛𝑠𝑡𝑎𝑙𝑙. 𝐶𝑜𝑠𝑡𝑒𝑙𝑒𝑐𝑡𝑒𝑐ℎ=𝑘
𝑂𝐻&𝑃 𝐶𝑜𝑠𝑡𝑦𝑟=𝑖,𝑒𝑙𝑒𝑐𝑡𝑒𝑐ℎ=𝑘 = 𝑆𝑡𝑜𝑐𝑘𝑦𝑟=𝑖,𝑒𝑙𝑒𝑐𝑡𝑒𝑐ℎ=𝑘 ∗ 𝑈𝑛𝑖𝑡 𝑂𝐻&𝑃 𝐶𝑜𝑠𝑡𝑒𝑙𝑒𝑐𝑡𝑒𝑐ℎ=𝑘
𝑇𝑜𝑡𝑎𝑙 𝑇𝑒𝑐ℎ𝑛𝑜𝑙𝑜𝑔𝑦 𝐶𝑜𝑠𝑡𝑦𝑟=𝑖,𝑒𝑙𝑒𝑐𝑡𝑒𝑐ℎ=𝑘= (𝐸𝑞𝑢𝑖𝑝𝑚𝑒𝑛𝑡 𝐶𝑜𝑠𝑡 + 𝐼𝑛𝑠𝑡𝑎𝑙𝑙𝑎𝑡𝑖𝑜𝑛 𝐶𝑜𝑠𝑡 + 𝑂𝐻&𝑃)𝑦𝑟=𝑖,𝑒𝑙𝑒𝑐𝑡𝑒𝑐ℎ=𝑘
𝑊ℎ𝑒𝑟𝑒 : 𝐸𝑞𝑢𝑖𝑝𝑚𝑒𝑛𝑡 𝐶𝑜𝑠𝑡𝑦𝑟=𝑖,𝑒𝑙𝑒𝑐𝑡𝑒𝑐ℎ=𝑘 = Equipment costs of added electric technologies, k, in year, i.
𝑆𝑡𝑜𝑐𝑘𝑦𝑟=𝑖,𝑒𝑙𝑒𝑐𝑡𝑒𝑐ℎ=𝑘 = Stock of added electric technologies, k, in year, i.
𝑈𝑛𝑖𝑡 𝐸𝑞𝑢𝑖𝑝 . 𝐶𝑜𝑠𝑡𝑒𝑙𝑒𝑐𝑡𝑒𝑐ℎ=𝑘 = Unit equipment costs of electric technology, k.
𝐼𝑛𝑠𝑡𝑎𝑙𝑙𝑎𝑡𝑖𝑜𝑛 𝐶𝑜𝑠𝑡𝑦𝑟=𝑖,𝑒𝑙𝑒𝑐𝑡𝑒𝑐ℎ=𝑘 = Installation costs of added electric technologies, k, in year, i.
𝑈𝑛𝑖𝑡 𝐼𝑛𝑠𝑡𝑎𝑙𝑙 . 𝐶𝑜𝑠𝑡𝑒𝑙𝑒𝑐𝑡𝑒𝑐ℎ=𝑘 = Unit installation costs of electric technology, k.
𝑂𝐻&𝑃 𝐶𝑜𝑠𝑡𝑦𝑟=𝑖,𝑒𝑙𝑒𝑐𝑡𝑒𝑐ℎ=𝑘 = Installation costs of added electric technologies, k, in year, i.
𝑈𝑛𝑖𝑡 𝑂𝐻&𝑃 𝐶𝑜𝑠𝑡𝑒𝑙𝑒𝑐𝑡𝑒𝑐ℎ=𝑘 = Unit overhead and profit costs of electric technology, k. 𝑇𝑜𝑡𝑎𝑙 𝑇𝑒𝑐ℎ𝑛𝑜𝑙𝑜𝑔𝑦 𝐶𝑜𝑠𝑡𝑦𝑟=𝑖,𝑒𝑙𝑒𝑐𝑡𝑒𝑐ℎ=𝑘 = Technology costs of added electric technologies, k, in year, i.
The tool calculates the fuel costs using the forecast electric load increase and natural gas
reduction from the IEPR electric and gas price forecasts (Equation 10).
Equation 10: Added Fuel Costs
𝐴𝑑𝑑𝑒𝑑 𝐸𝑙𝑒𝑐𝑡𝑟𝑖𝑐 𝐶𝑜𝑠𝑡𝑦𝑟=𝑖,𝑒𝑙𝑒𝑐𝑡𝑒𝑐ℎ=𝑘 = 𝐸𝑙𝑒𝑐 𝐶𝑜𝑛𝑠𝑢𝑚𝑝𝑡𝑖𝑜𝑛𝑦𝑟=𝑖,𝑒𝑙𝑒𝑐𝑡𝑒𝑐ℎ=𝑘 ∗$
𝑘𝑊ℎ𝑦𝑟=𝑖
𝑅𝑒𝑑𝑢𝑐𝑒𝑑 𝐺𝑎𝑠 𝐶𝑜𝑠𝑡𝑦𝑟=𝑖,𝑒𝑙𝑒𝑐𝑡𝑒𝑐ℎ=𝑘 = −𝐺𝑎𝑠 𝐴𝑣𝑜𝑖𝑑𝑒𝑑𝑖,𝑗,𝑘 ∗$
𝑡ℎ𝑒𝑟𝑚𝑦𝑟=𝑖
𝑊ℎ𝑒𝑟𝑒 : 𝐴𝑑𝑑𝑒𝑑 𝐸𝑙𝑒𝑐𝑡𝑟𝑖𝑐 𝐶𝑜𝑠𝑡𝑦𝑟=𝑖,𝑒𝑙𝑒𝑐𝑡𝑒𝑐ℎ=𝑘 = Added annual electric cost by electric technology, k, in year, i.
𝐸𝑙𝑒𝑐 𝐶𝑜𝑛𝑠𝑢𝑚𝑝𝑡𝑖𝑜𝑛𝑦𝑟=𝑖,𝑒𝑙𝑒𝑐𝑡𝑒𝑐ℎ=𝑘 = Electric consumption by electric technology, k, in year, i. $
𝑘𝑊ℎ𝑦𝑟=𝑖= Cost per kWh in year, i.
𝑅𝑒𝑑𝑢𝑐𝑒𝑑 𝐺𝑎𝑠 𝐶𝑜𝑠𝑡𝑦𝑟=𝑖,𝑒𝑙𝑒𝑐𝑡𝑒𝑐ℎ=𝑘 = Added annual gas cost by electric technology, k, in year, i (note that this value
is negative — the electric technology will avoid gas costs). 𝐺𝑎𝑠 𝐴𝑣𝑜𝑖𝑑𝑒𝑑𝑦𝑟=𝑖,𝑔𝑎𝑠𝑡𝑒𝑐ℎ=𝑗,𝑒𝑙𝑒𝑐𝑡𝑒𝑐ℎ=𝑘 = Gas consumption avoided by substituting gas technology, j, with electric
technology, k, in year, i. $
𝑡ℎ𝑒𝑟𝑚𝑦𝑟=𝑖= Cost per therm in year, i.
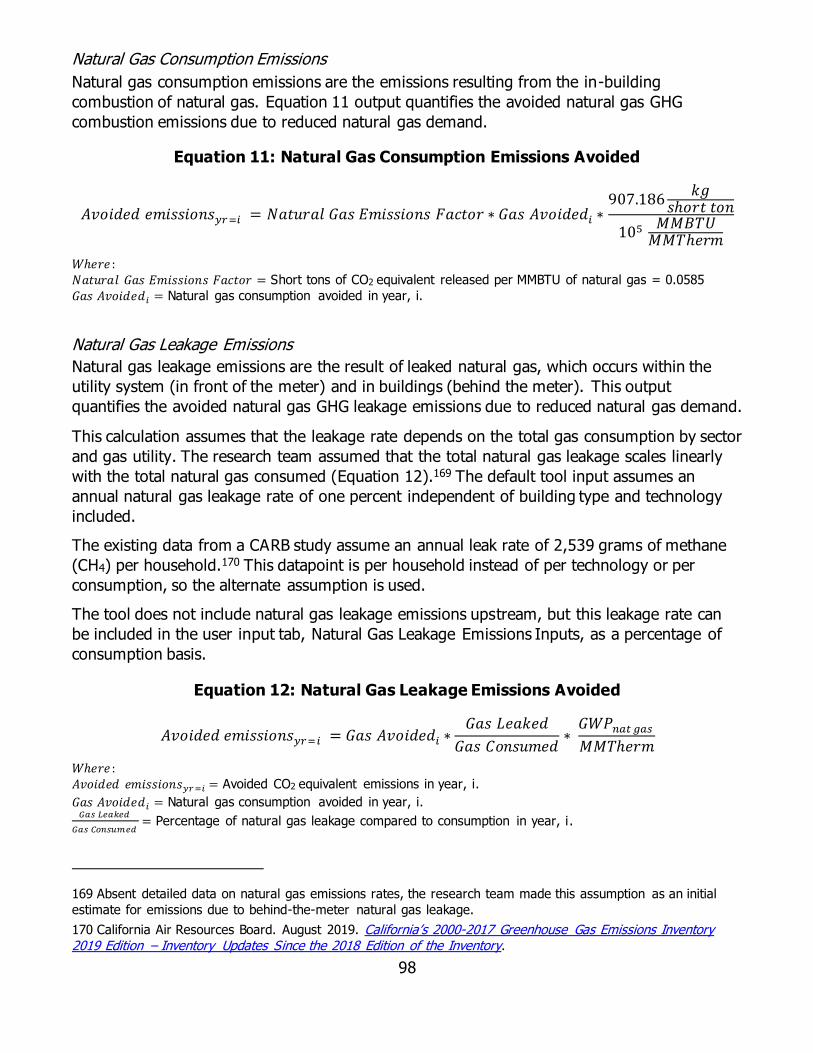
98
Natural Gas Consumption Emissions
Natural gas consumption emissions are the emissions resulting from the in-building
combustion of natural gas. Equation 11 output quantifies the avoided natural gas GHG
combustion emissions due to reduced natural gas demand.
Equation 11: Natural Gas Consumption Emissions Avoided
𝐴𝑣𝑜𝑖𝑑𝑒𝑑 𝑒𝑚𝑖𝑠𝑠𝑖𝑜𝑛𝑠𝑦𝑟=𝑖 = 𝑁𝑎𝑡𝑢𝑟𝑎𝑙 𝐺𝑎𝑠 𝐸𝑚𝑖𝑠𝑠𝑖𝑜𝑛𝑠 𝐹𝑎𝑐𝑡𝑜𝑟 ∗ 𝐺𝑎𝑠 𝐴𝑣𝑜𝑖𝑑𝑒𝑑𝑖 ∗907.186
𝑘𝑔𝑠ℎ𝑜𝑟𝑡 𝑡𝑜𝑛
105 𝑀𝑀𝐵𝑇𝑈𝑀𝑀𝑇ℎ𝑒𝑟𝑚
𝑊ℎ𝑒𝑟𝑒 : 𝑁𝑎𝑡𝑢𝑟𝑎𝑙 𝐺𝑎𝑠 𝐸𝑚𝑖𝑠𝑠𝑖𝑜𝑛𝑠 𝐹𝑎𝑐𝑡𝑜𝑟 = Short tons of CO2 equivalent released per MMBTU of natural gas = 0.0585
𝐺𝑎𝑠 𝐴𝑣𝑜𝑖𝑑𝑒𝑑𝑖 = Natural gas consumption avoided in year, i.
Natural Gas Leakage Emissions
Natural gas leakage emissions are the result of leaked natural gas, which occurs within the
utility system (in front of the meter) and in buildings (behind the meter). This output
quantifies the avoided natural gas GHG leakage emissions due to reduced natural gas demand.
This calculation assumes that the leakage rate depends on the total gas consumption by sector
and gas utility. The research team assumed that the total natural gas leakage scales linearly
with the total natural gas consumed (Equation 12).169 The default tool input assumes an
annual natural gas leakage rate of one percent independent of building type and technology
included.
The existing data from a CARB study assume an annual leak rate of 2,539 grams of methane
(CH4) per household.170 This datapoint is per household instead of per technology or per
consumption, so the alternate assumption is used.
The tool does not include natural gas leakage emissions upstream, but this leakage rate can
be included in the user input tab, Natural Gas Leakage Emissions Inputs, as a percentage of
consumption basis.
Equation 12: Natural Gas Leakage Emissions Avoided
𝐴𝑣𝑜𝑖𝑑𝑒𝑑 𝑒𝑚𝑖𝑠𝑠𝑖𝑜𝑛𝑠𝑦𝑟=𝑖 = 𝐺𝑎𝑠 𝐴𝑣𝑜𝑖𝑑𝑒𝑑𝑖 ∗𝐺𝑎𝑠 𝐿𝑒𝑎𝑘𝑒𝑑
𝐺𝑎𝑠 𝐶𝑜𝑛𝑠𝑢𝑚𝑒𝑑∗ 𝐺𝑊𝑃𝑛𝑎𝑡 𝑔𝑎𝑠𝑀𝑀𝑇ℎ𝑒𝑟𝑚
𝑊ℎ𝑒𝑟𝑒 : 𝐴𝑣𝑜𝑖𝑑𝑒𝑑 𝑒𝑚𝑖𝑠𝑠𝑖𝑜𝑛𝑠𝑦𝑟=𝑖 = Avoided CO2 equivalent emissions in year, i.
𝐺𝑎𝑠 𝐴𝑣𝑜𝑖𝑑𝑒𝑑𝑖 = Natural gas consumption avoided in year, i. 𝐺𝑎𝑠 𝐿𝑒𝑎𝑘𝑒𝑑
𝐺𝑎𝑠 𝐶𝑜𝑛𝑠𝑢𝑚𝑒𝑑= Percentage of natural gas leakage compared to consumption in year, i.
169 Absent detailed data on natural gas emissions rates, the research team made this assumption as an initial
estimate for emissions due to behind-the-meter natural gas leakage.
170 California Air Resources Board. August 2019. California’s 2000-2017 Greenhouse Gas Emissions Inventory 2019 Edition – Inventory Updates Since the 2018 Edition of the Inventory.
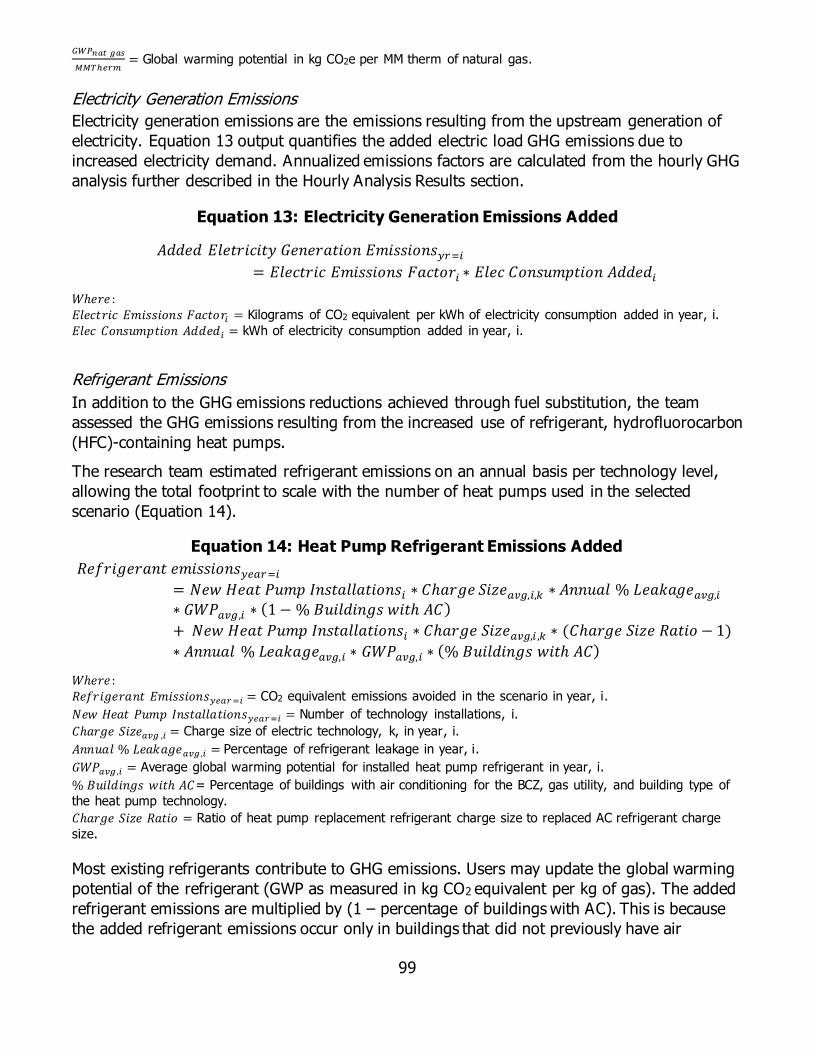
99
𝐺𝑊𝑃𝑛𝑎𝑡 𝑔𝑎𝑠
𝑀𝑀𝑇ℎ𝑒𝑟𝑚= Global warming potential in kg CO2e per MM therm of natural gas.
Electricity Generation Emissions
Electricity generation emissions are the emissions resulting from the upstream generation of
electricity. Equation 13 output quantifies the added electric load GHG emissions due to
increased electricity demand. Annualized emissions factors are calculated from the hourly GHG
analysis further described in the Hourly Analysis Results section.
Equation 13: Electricity Generation Emissions Added
𝐴𝑑𝑑𝑒𝑑 𝐸𝑙𝑒𝑡𝑟𝑖𝑐𝑖𝑡𝑦 𝐺𝑒𝑛𝑒𝑟𝑎𝑡𝑖𝑜𝑛 𝐸𝑚𝑖𝑠𝑠𝑖𝑜𝑛𝑠𝑦𝑟=𝑖
= 𝐸𝑙𝑒𝑐𝑡𝑟𝑖𝑐 𝐸𝑚𝑖𝑠𝑠𝑖𝑜𝑛𝑠 𝐹𝑎𝑐𝑡𝑜𝑟𝑖 ∗ 𝐸𝑙𝑒𝑐 𝐶𝑜𝑛𝑠𝑢𝑚𝑝𝑡𝑖𝑜𝑛 𝐴𝑑𝑑𝑒𝑑𝑖
𝑊ℎ𝑒𝑟𝑒 : 𝐸𝑙𝑒𝑐𝑡𝑟𝑖𝑐 𝐸𝑚𝑖𝑠𝑠𝑖𝑜𝑛𝑠 𝐹𝑎𝑐𝑡𝑜𝑟𝑖 = Kilograms of CO2 equivalent per kWh of electricity consumption added in year, i.
𝐸𝑙𝑒𝑐 𝐶𝑜𝑛𝑠𝑢𝑚𝑝𝑡𝑖𝑜𝑛 𝐴𝑑𝑑𝑒𝑑𝑖 = kWh of electricity consumption added in year, i.
Refrigerant Emissions
In addition to the GHG emissions reductions achieved through fuel substitution, the team
assessed the GHG emissions resulting from the increased use of refrigerant, hydrofluorocarbon
(HFC)-containing heat pumps.
The research team estimated refrigerant emissions on an annual basis per technology level,
allowing the total footprint to scale with the number of heat pumps used in the selected
scenario (Equation 14).
Equation 14: Heat Pump Refrigerant Emissions Added
𝑅𝑒𝑓𝑟𝑖𝑔𝑒𝑟𝑎𝑛𝑡 𝑒𝑚𝑖𝑠𝑠𝑖𝑜𝑛𝑠𝑦𝑒𝑎𝑟=𝑖
= 𝑁𝑒𝑤 𝐻𝑒𝑎𝑡 𝑃𝑢𝑚𝑝 𝐼𝑛𝑠𝑡𝑎𝑙𝑙𝑎𝑡𝑖𝑜𝑛𝑠𝑖 ∗ 𝐶ℎ𝑎𝑟𝑔𝑒 𝑆𝑖𝑧𝑒𝑎𝑣𝑔,𝑖,𝑘 ∗ 𝐴𝑛𝑛𝑢𝑎𝑙 % 𝐿𝑒𝑎𝑘𝑎𝑔𝑒𝑎𝑣𝑔,𝑖∗ 𝐺𝑊𝑃𝑎𝑣𝑔,𝑖 ∗ (1 − % 𝐵𝑢𝑖𝑙𝑑𝑖𝑛𝑔𝑠 𝑤𝑖𝑡ℎ 𝐴𝐶)
+ 𝑁𝑒𝑤 𝐻𝑒𝑎𝑡 𝑃𝑢𝑚𝑝 𝐼𝑛𝑠𝑡𝑎𝑙𝑙𝑎𝑡𝑖𝑜𝑛𝑠𝑖 ∗ 𝐶ℎ𝑎𝑟𝑔𝑒 𝑆𝑖𝑧𝑒𝑎𝑣𝑔,𝑖 ,𝑘 ∗ (𝐶ℎ𝑎𝑟𝑔𝑒 𝑆𝑖𝑧𝑒 𝑅𝑎𝑡𝑖𝑜 − 1)
∗ 𝐴𝑛𝑛𝑢𝑎𝑙 % 𝐿𝑒𝑎𝑘𝑎𝑔𝑒𝑎𝑣𝑔,𝑖 ∗ 𝐺𝑊𝑃𝑎𝑣𝑔,𝑖 ∗ (% 𝐵𝑢𝑖𝑙𝑑𝑖𝑛𝑔𝑠 𝑤𝑖𝑡ℎ 𝐴𝐶)
𝑊ℎ𝑒𝑟𝑒 : 𝑅𝑒𝑓𝑟𝑖𝑔𝑒𝑟𝑎𝑛𝑡 𝐸𝑚𝑖𝑠𝑠𝑖𝑜𝑛𝑠𝑦𝑒𝑎𝑟=𝑖 = CO2 equivalent emissions avoided in the scenario in year, i.
𝑁𝑒𝑤 𝐻𝑒𝑎𝑡 𝑃𝑢𝑚𝑝 𝐼𝑛𝑠𝑡𝑎𝑙𝑙𝑎𝑡𝑖𝑜𝑛𝑠𝑦𝑒𝑎𝑟=𝑖 = Number of technology installations, i.
𝐶ℎ𝑎𝑟𝑔𝑒 𝑆𝑖𝑧𝑒𝑎𝑣𝑔 ,𝑖 = Charge size of electric technology, k, in year, i.
𝐴𝑛𝑛𝑢𝑎𝑙 % 𝐿𝑒𝑎𝑘𝑎𝑔𝑒𝑎𝑣𝑔,𝑖 = Percentage of refrigerant leakage in year, i.
𝐺𝑊𝑃𝑎𝑣𝑔,𝑖 = Average global warming potential for installed heat pump refrigerant in year, i.
% 𝐵𝑢𝑖𝑙𝑑𝑖𝑛𝑔𝑠 𝑤𝑖𝑡ℎ 𝐴𝐶= Percentage of buildings with air conditioning for the BCZ, gas utility, and building type of
the heat pump technology.
𝐶ℎ𝑎𝑟𝑔𝑒 𝑆𝑖𝑧𝑒 𝑅𝑎𝑡𝑖𝑜 = Ratio of heat pump replacement refrigerant charge size to replaced AC refrigerant charge
size.
Most existing refrigerants contribute to GHG emissions. Users may update the global warming
potential of the refrigerant (GWP as measured in kg CO2 equivalent per kg of gas). The added
refrigerant emissions are multiplied by (1 – percentage of buildings with AC). This is because
the added refrigerant emissions occur only in buildings that did not previously have air

100
conditioning. According to the CARB, the ratio between heat pump replacement and replaced
AC unit refrigerant charge sizes is about 1.1.
The preliminary values of the tool (Table 21) are intended to provide initial estimates with the
expectation they will be reviewed and replaced with more accurate values as available.
Table 21: Default 100-Year Global Warming Potentials in FSSAT
Gas Year(s) GWP Source
CO2 All 1.0 Engineering constant
Natural Gas All 25 California ARB 100-yr GWPs*
Average Refrigerant – HVAC
2020 – 2022
2,088 Assumption: GWP for a common heat pump refrigerant: R-410A (GWP = 2,088)**
Average Refrigerant – Heat Pump HVAC
2023 - 2030
675 Assumption: GWP for R-32 (GWP = 675) which will meet the proposed 750 GWP cap effective in 2023**
Average Refrigerant – Heat Pump Water Heater
2020 - 2030
1,430 Assumption: GWP for most common heat pump water heater refrigerant: R-134a (GWP = 1,430)**
*CARB. https://ww2.arb.ca.gov/ghg-gwps, accessed March 2020
**CARB. December 2019. “Low-GWP Alternatives for Space and Water Heating CARB.docx”
Draft – Deliberative and Confidential. Table 1: Low-GWP Refrigerants for Residential Heat
Pump Technologies.
R-410A, R-134a, and R-32 are refrigerant types
Source: Guidehouse
In parallel to AB 3232, Senate Bill 1383 (Lara, Chapter 395, Statutes of 2016)171 has
committed to reducing California’s refrigerant emissions by 40 percent by 2030 (from 2013
levels). This reduction will be achieved largely by requiring that new refrigerant-containing
technologies, such as supermarket refrigeration systems and air-conditioning units, use
refrigerants with a lower GWP.
A central question is if the AB 3232 goal contributes to increasing refrigerant emissions
because of the higher penetration of technologies using refrigerants. The research team
included the increased refrigerant emissions from heat pump deployments with the
simultaneous decrease in HFC emissions from the implementation of SB 1383.
The FSSAT has a toggle in the refrigerant user input worksheet that allows the user to select
whether SB 1383 is reached.
171 Senate Bill No. 1383, Short-Lived Climate Pollutants: Methane Emissions: Dairy and Livestock: Organic Waste: Landfills.

101
Toggle Off: SB 1383 Not in Effect
If SB 1383 is not in effect (that is, the SB 1383 reached toggle is set to NO), then the tool will
use the user input forecast of non-heat pump HFC emissions when calculating combined
refrigerant emissions.
Toggle On: SB 1383 in Effect
If SB 1383 is in effect (that is, the SB 1383 reached toggle is set to YES), then the tool will
assume total HFC emissions in 2030 will be 10 MMTCO2e based on CARB estimates.172
The CARB estimate does not assume any amount of building electrification; estimated
reductions will be achieved through other measures and applied to non-heat pump
technologies.173 This implies added heat pumps as a result of electrification will either increase
GHG emissions from HFCs above 10 MMTCO2e in 2030 or other savings measures will be
required to offset the added emissions from electrification. With the SB 1383 toggle on, FSSAT
assumes the latter: that overall HFC emissions in 2030 are fixed based on the assumption that
the state will meet its SB 1383 target by developing additional measures to offset the impact
of electrification. FSSAT calculates the amount of leakage from additional heat pumps to
inform users of the magnitude of savings needed from additional measures. However, this
study does not examine what specific measures can meet this additional need.
Ancillary Costs (Panel Upgrades)
Many existing households may require a panel upgrade because of the increased electric load
from fuel substitution. Calculating the costs of aggregate panel upgrades across the fuel
substitution population is challenging. A triggered panel upgrade is not directly related to a
specific technology; rather, it relates to the number and type of electric technologies installed
in a specific building. Further, panel upgrades may also be triggered by recharging electric
vehicles, rooftop photovoltaic systems with or without storage, or combinations of these with
fuel substitution changes.
There is a lack of primary data that detail the number of buildings that require a panel
upgrade in California or how much additional electric load will trigger a need for panel
upgrades.174 To predict more accurately expected overall panel upgrade costs associated with
fuel substitution, more data on the existing panel landscape need to be collected and
processed.175
The research team calculated aggregate panel upgrade costs in the FSSAT by assuming when
buildings will require a panel upgrade and how many panel upgrades are necessary each year.
The team used the percentage of natural gas removed due to fuel substitution as an indicator
to estimate when a panel upgrade is required. When the percentage of natural gas removed
exceeds the user-defined inputted threshold, that year and all following years will incur a panel
172 California Air Resources Board. March 2017. Short-Lived Climate Pollutant Reduction Strategy.
173 The reduction measures do not include an end-of-life decommissioning reduction of the refrigerant leak.
Strategies to reduce end-of-life venting may lead to additional HFC emissions reductions.
174 Building Decarbonization Coalition. January 2020. Decoding Grid Integrated Buildings Report.
175 In some cases, older homes may require panel upgrades; however, it is unknown how many have upgraded
because of other renovations or for other reasons.

102
upgrade cost. Any year before this threshold is met will not have any associated panel
upgrade costs. Because HVAC is the largest added electric load to a home and the most likely
to trigger a panel upgrade, the research team associates a panel upgrade with the addition of
every HVAC unit installed after meeting the threshold. Equation 15 details the calculation.
Equation 15: Approximation of Combined Panel Upgrade Costs
𝐴𝑔𝑔𝑟𝑒𝑔𝑎𝑡𝑒 𝑃𝑎𝑛𝑒𝑙 𝐶𝑜𝑠𝑡𝑠𝑦𝑟= 𝑖 = 𝑈𝑝𝑔𝑟𝑎𝑑𝑒 𝐶𝑜𝑠𝑡 ∗ 𝑆𝑡𝑜𝑐𝑘 𝑜𝑓 𝐴𝑑𝑑𝑒𝑑 𝐻𝑉𝐴𝐶𝑖𝐴𝑣𝑒𝑟𝑎𝑔𝑒 𝐻𝑉𝐴𝐶 𝑆𝑖𝑧𝑒
∗ 𝑃𝑎𝑛𝑒𝑙 𝐶𝑜𝑠𝑡 𝐷𝑒𝑐𝑖𝑠𝑖𝑜𝑛𝑖
𝑃𝑎𝑛𝑒𝑙 𝐶𝑜𝑠𝑡 𝐷𝑒𝑐𝑖𝑠𝑖𝑜𝑛𝑦𝑟 = 𝑖 =
{
1,𝐺𝑎𝑠 𝐴𝑣𝑜𝑖𝑑𝑒𝑑𝑖
𝐺𝑎𝑠 𝐶𝑜𝑛𝑠𝑢𝑚𝑝𝑡𝑖𝑜𝑛2030≥ 𝑃𝑎𝑛𝑒𝑙 𝑈𝑝𝑔𝑟𝑎𝑑𝑒 𝑇ℎ𝑟𝑒𝑠ℎ𝑜𝑙𝑑
0,𝐺𝑎𝑠𝐴𝑣𝑜𝑖𝑑𝑒𝑑𝑖
𝐺𝑎𝑠 𝐶𝑜𝑛𝑠𝑢𝑚𝑝𝑡𝑖𝑜𝑛2030 < 𝑃𝑎𝑛𝑒𝑙 𝑈𝑝𝑔𝑟𝑎𝑑𝑒 𝑇ℎ𝑟𝑒𝑠ℎ𝑜𝑙𝑑
𝑊ℎ𝑒𝑟𝑒 : 𝐴𝑔𝑔𝑟𝑒𝑔𝑎𝑡𝑒 𝑃𝑎𝑛𝑒𝑙 𝐶𝑜𝑠𝑡𝑠𝑦𝑟= 𝑖 = Aggregate territory panel upgrade costs ($) in year, i.
𝑈𝑝𝑔𝑟𝑎𝑑𝑒 𝐶𝑜𝑠𝑡 = Dollar cost ($) to update a panel in a single home.
𝑆𝑡𝑜𝑐𝑘 𝑜𝑓 𝐴𝑑𝑑𝑒𝑑 𝐻𝑉𝐴𝐶𝑖 = Amount of the replaced HVAC systems in the unit basis [Cap-Tons] in year, i.
𝐴𝑣𝑒𝑟𝑎𝑔𝑒 𝐻𝑉𝐴𝐶 𝑆𝑖𝑧𝑒 = Size of a typical residential HVAC system [Cap-Ton/unit] . 𝑃𝑎𝑛𝑒𝑙 𝐶𝑜𝑠𝑡 𝐷𝑒𝑐𝑖𝑠𝑖𝑜𝑛𝑦𝑟= 𝑖 = Value either 0 or 1 indicating whether a panel upgrade is necessary in year, i.
𝐺𝑎𝑠 𝐴𝑣𝑜𝑖𝑑𝑒𝑑𝑖 = Replaced consumption (MM therms) due to fuel substitution of an existing home in the year, i.
𝐺𝑎𝑠 𝐶𝑜𝑛𝑠𝑢𝑚𝑝𝑡𝑖𝑜𝑛2030 = Consumption (MM therms) of an existing home in the year 2030.
𝑃𝑎𝑛𝑒𝑙 𝑈𝑝𝑔𝑟𝑎𝑑𝑒 𝑇ℎ𝑟𝑒𝑠ℎ𝑜𝑙𝑑 = The percentage of removed natural gas due to fuel substitution that will trigger a
panel upgrade in that year.
FSSAT allows for user input for the panel upgrade cost by utility territory and BCZ for homes.
The tool calculates costs in real dollars for the year of installation based on a user’s chosen
inflation rate.
The key inputs used to determine the annual cost are:
Panel upgrade threshold: The percentage of reduced natural gas consumption due
to fuel substitution that will trigger a panel upgrade in that year. The research team
assumes any HVAC unit installed after the threshold will incur a panel upgrade cost.
Average HVAC size (tons): Size of a residential HVAC system. The stock value of
added HVAC systems is in the unit basis (Cap-Tons or capacity in tons). To determine
the number of installed HVAC systems in a given a year, the tool divides the stock value
by the inputted HVAC size.
Panel cost: Total cost to upgrade the size of an electrical panel in the base year.
Emissions Reductions Cost
FSSAT calculates abatement cost on a per-metric-ton (mtCO2e)176 basis to compare fuel
substitution to other AB 32 scoping plan measures. The calculation must include the total net
cumulative investment cost over the defined period (2020–2030).
176 “Metric-ton” or mt is equal to 1,000 kilograms.

103
The annualized investment costs are determined using a capital recovery factor, shown in
Equation 16, which is based on the real discount rate177 and equipment useful life.
Equation 16: Capital Recovery Factor
𝐶𝑅𝐹 =𝑑
[1 − (1 + 𝑑)−𝐸𝑈𝐿]
Where:
d is the real discount rate.
EUL represents the equipment useful life.
The annualized incremental equipment cost in each year is the annualized cost of the electric
technology minus the annualized cost of the gas replacement technology, plus the annualized
costs of ancillary equipment.
The net investment cost in each year is the annualized incremental equipment cost plus the
net fuel costs. The net cumulative investment present cost, Equation 17, is the sum of the net
investment cost in each year discounted at the real discount rate.
Equation 17: Total Net Cumulative Investment Cost
𝑇𝑜𝑡𝑎𝑙 𝑁𝑒𝑡 𝐶𝑢𝑚𝑢𝑙𝑎𝑡𝑖𝑣𝑒 𝐼𝑛𝑣𝑒𝑠𝑡𝑚𝑒𝑛𝑡 𝐶𝑜𝑠𝑡 = ∑ [(𝐶𝑢𝑚𝑢𝑙𝑎𝑡𝑖𝑣𝑒 𝑇𝑒𝑐ℎ𝑛𝑜𝑙𝑜𝑔𝑦 𝐶𝑜𝑠𝑡𝑦𝑟=𝑖,𝑒𝑙𝑒𝑐𝑡𝑒𝑐ℎ =𝑘
−𝑦𝑒𝑎𝑟𝑖
𝐶𝑢𝑚𝑢𝑙𝑎𝑡𝑖𝑣𝑒 𝐵𝑎𝑠𝑒𝑙𝑖𝑛𝑒 𝑇𝑒𝑐ℎ𝑛𝑜𝑙𝑜𝑔𝑦 𝐶𝑜𝑠𝑡𝑦𝑟=𝑖,𝑔𝑎𝑠𝑡𝑒𝑐ℎ=𝑗
+ 𝐴𝑛𝑐𝑖𝑙𝑙𝑖𝑎𝑟𝑦 𝐶𝑜𝑠𝑡𝑠) ∗ 𝐶𝑅𝐹 +
(𝐴𝑑𝑑𝑒𝑑 𝐸𝑙𝑒𝑐𝑡𝑟𝑖𝑐 𝐶𝑜𝑠𝑡𝑦𝑟=𝑖,𝑒𝑙𝑒𝑐𝑡𝑒𝑐ℎ=𝑘 + 𝑅𝑒𝑑𝑢𝑐𝑒𝑑 𝐺𝑎𝑠 𝐶𝑜𝑠𝑡𝑦𝑟=𝑖,𝑒𝑙𝑒𝑐𝑡𝑒𝑐ℎ=𝑘)] /(1 + 𝑅𝑒𝑎𝑙 𝑅𝑎𝑡𝑒)^(𝑦𝑒𝑎𝑟 𝑖 − 𝑏𝑎𝑠𝑒 𝑦𝑒𝑎𝑟)
𝑊ℎ𝑒𝑟𝑒 : 𝑇𝑜𝑡𝑎𝑙 𝑇𝑒𝑐ℎ𝑛𝑜𝑙𝑜𝑔𝑦 𝐶𝑜𝑠𝑡𝑦𝑟=𝑖,𝑒𝑙𝑒𝑐𝑡𝑒𝑐ℎ=𝑘 = Technology costs of electric technologies, k, in year, i.
𝑇𝑜𝑡𝑎𝑙𝑎𝑠𝑒𝑙𝑖𝑛𝑒𝑇𝑒𝑐ℎ𝑛𝑜𝑙𝑜𝑔𝑦𝐶𝑜𝑠𝑡𝑦𝑟=𝑖,𝑔𝑎𝑠𝑡𝑒𝑐ℎ=𝑗 = Technology costs of gas technology replacement option, j, in year, i.
𝐴𝑑𝑑𝑒𝑑 𝐸𝑙𝑒𝑐𝑡𝑟𝑖𝑐 𝐶𝑜𝑠𝑡𝑦𝑟=𝑖,𝑒𝑙𝑒𝑐𝑡𝑒𝑐ℎ=𝑘 = Added annual electric cost by electric technology, k, in year, i.
𝑅𝑒𝑑𝑢𝑐𝑒𝑑 𝐺𝑎𝑠 𝐶𝑜𝑠𝑡𝑦𝑟=𝑖,𝑒𝑙𝑒𝑐𝑡𝑒𝑐ℎ=𝑘 = Added annual gas cost by electric technology, k, in year, i (note that this value
is negative — the electric technology will avoid gas costs).
𝐴𝑛𝑐𝑖𝑙𝑙𝑎𝑟𝑦 𝐶𝑜𝑠𝑡 = Cost of ancillary costs.
𝐶𝑅𝐹 = Capital recovery factor.
The substitute technologies R process includes inputs, outputs, and assumptions listed in Table
22.
177 Rate of return used to discount to the present value of future cash flows. The real discount rate removes the
effects of inflation to reflect the real cost and is typically the nominal discount rate minus inflation rate.

104
Table 22: Substitute Technologies Inputs, Outputs, and Assumptions
Topic Inputs Outputs Assumptions
Natural Gas Reduction and Electric Load Increase
Modified AAEE technology-level natural gas forecast
Scenario inputs defined in scenario input workbook
Revised natural gas forecast
Added electric consumption (including increased cooling)
Electric energy consumed in fuel substitution is directly related to gas consumption.
Electric technology performance does not degrade over time.
Tool does not calculate end user choice algorithms between technologies or model any interactions of market dynamics for adoption. Adoption is user-defined algorithm per technology.
Stock Forecast
Added electric consumption
Fuel substitution characterization
Added stock Technology unit energy consumption at the utility, building, BCZ, and technology efficiency level is consistent across the forecast years.
Technology and Fuel Costs
Added stock
Revised natural gas forecast
Electric load increase
Utility forecasted rates
Added technology cost (split and total)
Fuel costs (split and net)
Technology, installation, and overhead and profit costs are relatively consistent at the utility, building, BCZ, and technology efficiency levels.
Refrigerant and Natural Gas Leakage Emissions
Refrigerant leakage input
Natural gas leakage input
Added stock
Revised natural gas forecast
HFC emissions
Natural gas leakage emissions
Refrigerant and natural gas leakage emissions are relatively consistent at the utility, building, BCZ, and technology efficiency levels.
Natural gas leakage emissions are directly related to overall natural gas consumption.
Added refrigerant emissions from HVAC heat pumps are assumed to be zero for all buildings with AC. All commercial buildings are assumed to have existing AC.

105
Topic Inputs Outputs Assumptions
Increased Electricity Generation Emissions
Revised natural gas forecast
Added electric consumption (including increased cooling)
Fuel substitution characterization
Electricity
generation emissions added
The electric consumption is
described by the natural gas consumption being replaced combined with the relevant efficiency factors of the electric technology.
Added AC load is considered only for the residential sector and only for the proportion of homes that did not previously have AC installed.
Ancillary Costs (Panel Costs)
Panel costs input sheet
AAEE modified natural gas forecast
Added stock
Revised natural gas forecast
Panel costs The total amount of installed HVAC systems after the natural gas removed threshold is met is equivalent to the number of required panel upgrades.
Emissions Reduction Cost
Scenario Parameters
Total Emissions
Incremental technology and fuel costs
Emissions Reduction Cost, $/mTCO2e
Same assumptions present in all cost and emissions outputs
Source: Guidehouse
Write Scenario Definitions
This R process does not complete any new analysis. The process summarizes the user inputs
defining the scenario as outputs. The resulting workbook is used for record-keeping only.
Scenario Definitions The scenarios developed for this report are potential pathways for fuel substitution potential
based on the goals established by AB 3232. The CEC published the “Building Decarbonization
Assessment Project Scope” memorandum in November 2019178 to ensure alignment of
specifications across the various building decarbonization initiatives and analysis and seek
stakeholder comments. The memorandum informs the chosen scenarios and savings analysis.
The FSSAT has flexibility to modify many inputs.179 The R Input tab allows overrides for the
inputs. Table 23 summarizes the range of inputs for the variables.
178 California Energy Commission. November 2019. Building Decarbonization Assessment Project Scope.
179 The modeled scenarios for this report are applied across all technologies within the relevant categories. The
tool has the capability to fine-tune targets by 2030.

106
Table 23: FSSAT Scenario Input Variables
Scenario Parameter
Definition Variable Range
New construction Percentage of eligible technologies that will be
electric in the last year of the forecast period (2030).
0%–100%
Replace on burnout
Percentage of existing gas technologies that will burn out by the end of the forecast period (2030) and be replaced by an electric technology.
0%–100%
Early replacement
Percentage of existing gas technologies that will not burn out by the end of the forecast period (2030) and will be replaced by an electric technology.
0%–100%
Technology efficiency
A weighting that determines the distribution among potential electric replacement technologies according to the relative efficiencies.
Low efficiency weighted
Evenly weighted
High efficiency weighted
Cost threshold (% of maximum)
There is a range of technology costs by end use. This percentage defines the highest allowable technology cost by end use. When it is 100 percent, the highest-cost electric technology may be used as a substitute. When it is 65 percent, only technologies at or below the sixty-fifth percentile cost are eligible electric substitutes.
Minimum value: 0%–100%
Maximum value: 0%–100%
Maximum value > minimum value
Ancillary costs Designation if ancillary (that is, panel) costs are included in total costs.
Not included
Include panel
SB 1383 goals
On: SB 1383 HFC reduction goals are assumed to be achieved.
Off: SB 1383 HFC reduction goals are assumed to not be achieved, and output emissions are defined by the user input HFC emissions scenario.
On
Off
Industrial and agricultural
Percentage of eligible industrial and agricultural gas technologies replaced by electric technologies by the end of the forecast period (2030).
0%–100%
Source: Guidehouse
For the results presented in this report, the CEC specified three scenarios, each of which uses
a specific setting for each input (defined in Table 24). The CEC designed these scenarios to
help identify any gaps toward achieving decarbonization goals. The percentage values for the
new construction, replace on burnout, and early replacement indicate the cumulative
percentage of eligible equipment stock replaced by 2030.

107
Table 24: Scenario Definition
Scenario Parameter
Scenario 1: Minimize Cost to End Users
Scenario 2: Limited Cost Impacts to End Users
Scenario 3: Major Decarbonization Program
New construction
Residential
- All end uses: 35%
Commercial
- All end uses: 0%
Residential
- All end uses: 50%
Commercial
- All end uses: 50%
Residential
- All end uses: 95%
Commercial
- All end uses: 50%
Replace on burnout
Residential
- HVAC: 40%
- WaterHeat: 40%
- AppPlug: 30%
Commercial
- All end uses: 0%
Residential
- HVAC: 50%
- WaterHeat: 50%
- AppPlug: 40%
Commercial
- All end uses: 0%
Residential
- HVAC: 75%
- WaterHeat: 75%
- AppPlug: 60%
Commercial
- HVAC: 50%
- WaterHeat: 50%
- AppPlug: 40%
- FoodServ: 40%
Early replacement
Residential
- All end uses: 0%
Commercial
- All end uses: 0%
Residential
- HVAC: 15%
- WaterHeat: 15%
- AppPlug: 10%
Commercial
- All end uses: 0%
Residential
- HVAC: 20%
- WaterHeat: 20%
- AppPlug: 15%
Commercial
- HVAC: 15%
- WaterHeat: 15%
- AppPlug: 10%
- FoodServ: 10%
Technology efficiency
Evenly weighted Efficiency weighted Efficiency weighted
Cost threshold (% of maximum)
Residential: 25%
Commercial: 0%
Residential: 60%
Commercial: 60%
Residential: 60%
Commercial: 60%
Ancillary costs Not included* Not included* Include panel
SB 1383 goals On On On
Industrial and agricultural
No fuel substitution No fuel substitution 50% of eligible technologies replaced
*In Scenarios 1 and 2, panel costs are not included. Each of these scenarios assumes that
homes with the appropriate panel size are targeted in fuel substitution, and no upgrades are
necessary.
Source: Guidehouse
Scenario Tool Results This section summarizes the results for the three scenarios described in the Scenario
Definitions section; specifically, these results show the contribution of each scenario toward
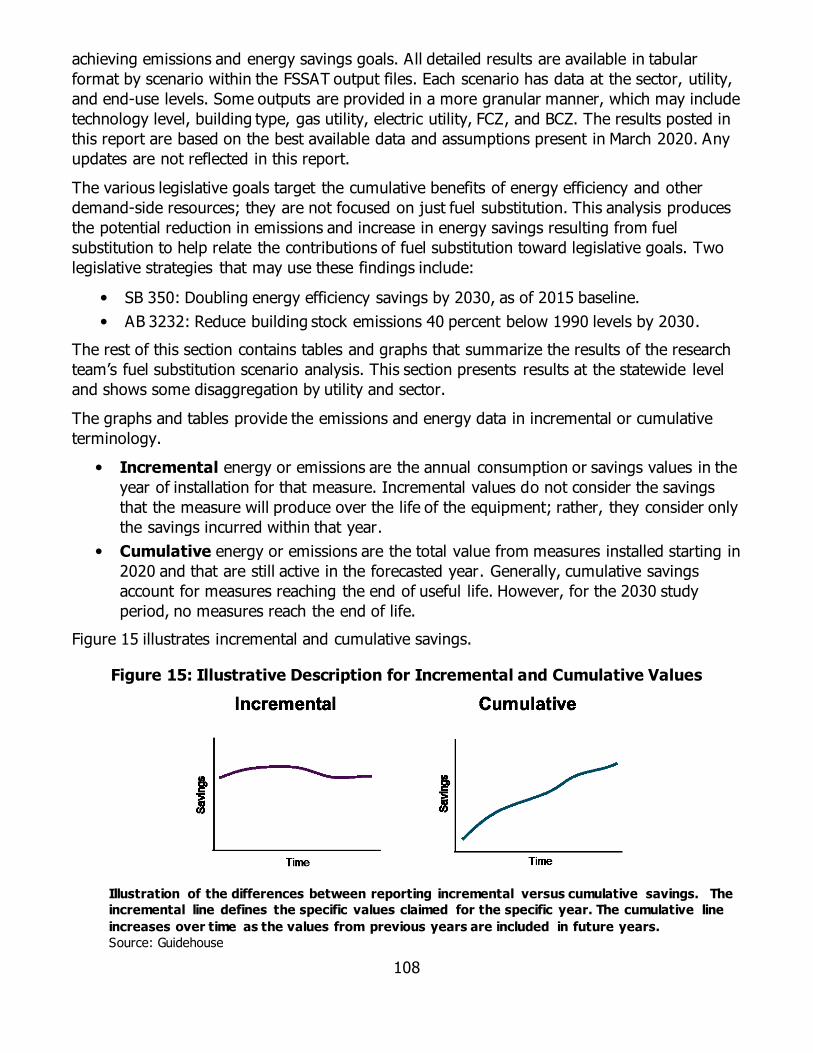
108
achieving emissions and energy savings goals. All detailed results are available in tabular
format by scenario within the FSSAT output files. Each scenario has data at the sector, utility,
and end-use levels. Some outputs are provided in a more granular manner, which may include
technology level, building type, gas utility, electric utility, FCZ, and BCZ. The results posted in
this report are based on the best available data and assumptions present in March 2020. Any
updates are not reflected in this report.
The various legislative goals target the cumulative benefits of energy efficiency and other
demand-side resources; they are not focused on just fuel substitution. This analysis produces
the potential reduction in emissions and increase in energy savings resulting from fuel
substitution to help relate the contributions of fuel substitution toward legislative goals. Two
legislative strategies that may use these findings include:
SB 350: Doubling energy efficiency savings by 2030, as of 2015 baseline.
AB 3232: Reduce building stock emissions 40 percent below 1990 levels by 2030.
The rest of this section contains tables and graphs that summarize the results of the research
team’s fuel substitution scenario analysis. This section presents results at the statewide level
and shows some disaggregation by utility and sector.
The graphs and tables provide the emissions and energy data in incremental or cumulative
terminology.
Incremental energy or emissions are the annual consumption or savings values in the
year of installation for that measure. Incremental values do not consider the savings
that the measure will produce over the life of the equipment; rather, they consider only
the savings incurred within that year.
Cumulative energy or emissions are the total value from measures installed starting in
2020 and that are still active in the forecasted year. Generally, cumulative savings
account for measures reaching the end of useful life. However, for the 2030 study
period, no measures reach the end of life.
Figure 15 illustrates incremental and cumulative savings.
Figure 15: Illustrative Description for Incremental and Cumulative Values
Illustration of the differences between reporting incremental versus cumulative savings. The
incremental line defines the specific values claimed for the specific year. The cumulative line
increases over time as the values from previous years are included in future years.
Source: Guidehouse

109
Figure 16 compares fuel substitution scenarios for the incremental emissions reduction by the
source of the emissions in 2030.
Figure 16: Statewide Incremental 2030 Emissions Avoided by Source and Scenario
The stacked bar chart shows the emissions avoided or added by source, including emissions
from electric generation, natural gas consumption, natural gas leakage, refrigerant leakage,
and net emissions reduction, for the three scenarios in 2030. More aggressive fuel substitution
schemes result in larger amounts of emissions reduced. Scenario 2 offers nearly double the
net emissions savings relative to Scenario 1. Scenario 3 offers more than triple net emissions
reductions compared to Scenario 1. While there are emissions increases due electric
generation and refrigerant leakage, they are eclipsed by emissions reductions from reduced
natural gas consumption.
Source: Guidehouse FSSAT output
Figure 17 provides Scenario 3 statewide incremental emissions avoided by source on an
annual basis over the 2020–2030 period. The incremental emissions avoided forecast is shown
here for Scenario 3 only because it is the most aggressive forecast. Other scenario outputs are
available from the FSSAT.

110
Figure 17: Statewide Incremental Emissions Avoided by Source – Scenario 3
The stacked bar chart shows the emissions avoided in Scenario 3 for all years within the
forecast period. Emissions avoided or added include those from electric generation, natural
gas consumption, natural gas leakage, refrigerant leakage, and net emissions reduction. The
figure shows a linear increase in emissions over the forecast period, which is driven largely by
the adoption curves chosen in the FSSAT inputs. Electric emissions show nonlinear growth due
an expected decrease in GHG intensity of electric generation in California over the forecast
period.
Source: Guidehouse FSSAT output
Figure 18 provides the 2030 natural gas consumption by sector and scenario. This figure
compares the scenarios to the baseline consumption forecast (IEPR) and the adjusted baseline
forecast after including the AAEE impacts (AAEE modification).

111
Figure 18: Statewide 2030 Natural Gas Consumption by Sector
This side-by-side bar chart shows the natural gas consumption in 2030 by sector. The
residential sector represents the largest decrease in forecasted natural gas consumption in
2030, with a reduction of more than 3,000 MMTherms in Scenario 3 compared to the IEPR.
This result equals a 44 percent reduction for the residential sector and a 21 percent reduction
of overall natural gas consumption statewide. While natural gas consumption is also reduced
in the commercial, agricultural, and industrial sectors in the prescribed scenarios, the
residential fuel substitution represents the majority of natural gas consumption reduction.
Source: Guidehouse FSSAT output
Figure 19 provides the 2030 natural gas consumption by end use and scenario. Like in Figure
18, this figure compares the scenarios to the baseline consumption forecast (IEPR) and
adjusted baseline forecast after including the AAEE impacts (AAEE modification).

112
Figure 19: Statewide 2030 Natural Gas Consumption by End Use
The side-by-side bar chart shows the natural gas consumption forecasted in 2030 at the end-
use level. The HVAC and water heating end uses represent the largest decrease in forecasted
natural gas consumption in 2030, representing 90 percent of natural gas reduction due to fuel
substitution in Scenario 3.
Source: Guidehouse FSSAT output
Figure 20 shows the overall building emissions recorded in 1990 and forecasted in 2020 and
2030, according to the IEPR forecast and FSSAT scenario outputs. The data represented in
Figure 20 are used to relate the FSSAT scenario results to AB 3232 goals. None of the
scenarios as modeled appear to result in GHG emissions reductions to the 1990 levels.
However, the research team notes the following caveats:
HFC refrigerant leakage is the only quantified refrigerant GHG emissions impact in the
baseline and forecast for this study. In 1990, chlorofluorocarbons (CFCs) were the
dominant refrigerant in use, though they have been phased out by 2020. Figure 20
excluded emissions from CFCs. Thus, total refrigerant leakage emissions in 1990 appear
miniscule (because they are driven by the very low use of HFCs at the time and exclude
CFCs) compared to 2020 (where all refrigerants are converted from CFCs to HFCs). CEC
staff directed the research team to account for total refrigerant leakage in this way.
FSSAT users can generate additional scenarios that show savings beyond the three
scenarios initially designed by the CEC.
Alternate means of decarbonizing buildings beyond fuel substitution exist (for example,
fixing/reducing natural gas leaks and additional energy efficiency).

113
Figure 20: Commercial and Residential Total Building Emissions for AB 3232 Goals
The stacked bar chart shows the overall emissions in 1990 (51.6 MMTCO2e) for residential and
commercial buildings and relates this amount to building emissions forecasted in 2020 and
2030. The figure shows that since 1990, California natural gas demand grew. The IEPR
forecast predicts further growth in natural gas consumption through 2030, as shown in the
2020 base and 2030 base data.
Source: Guidehouse FSSAT output
Table 25 shows the progress toward AB 3232 goals based on building emissions in the commercial and residential sectors. In this table, positive percentages represent an increase in emissions and negative percentages represent a decrease in emissions compared to 1990. The residential and commercial emissions forecasted in 2020 and 2030 overall are expected to
constitute a 63 percent and 41 percent increase in emissions compared to 1990. Much of this emissions increase is due to the way CEC staff directed the research team to account for total refrigerant leakage. Table 25 shows a subtotal row that removes consideration of total
refrigerant leakage to illustrate the impact purely from an end-use energy perspective. When considering refrigerants in the accounting framework as directed by CEC staff, all FSSAT
scenarios do not result in an emissions decrease below 1990 values nor do they reach the emissions reduction goal set by AB 3232. When the impacts of total refrigerant leakage are removed and the focus is on energy use and natural gas leakage, Scenario 3 shows a net
decrease in emissions.180
180 Including the impact of added refrigerant leakage due to electrification would have a minimal effect on the
subtotal results from Table 25 because this incremental impact is so small compared the end-use energy
emissions impacts (previously illustrated in Figure 16).

114
Table 25: Commercial and Residential Building Emissions Progress to AB 3232 Goals (% Change from 1990 Baseline)
Emissions Type 2020 IEPR 2030 IEPR Scenario 1 Scenario 2 Scenario 3
Electric Generation - - 8.9% 12.0% 18.9%
Natural Gas Consumption
15% 24% 1.0% -10.3% -29%
Natural Gas Leakage
1% 2% 0.1% -3.3% -2.7%
Subtotal 16% 26% 10.0% -1.6% -12.8%
Refrigerant Leakage
46% 15% 15.5% 15.5% 15.5%
Total 63% 41% 26% 14% 3%
AB 3232 Goal - -40% -40% -40% -40%
Note: Totals may not reflect the sum of their components due to rounding. Furthermore, the
light gray columns are to indicate business as usual data points.
Source: Guidehouse FSSAT output
Table 26 provides the added electricity consumption by electric utility and by scenario in 2030 based on the FSSAT scenario outputs. The electric energy added included all electrified
heating and load for cooling in homes without access to cooling before fuel substitution. Scenario 3 results in an estimated 52,015 GWh added.
Table 26: 2030 Electricity Consumption Added by Scenario (GWh)
Electric Utility Scenario 1 Scenario 2 Scenario 3
LADWP 2,398 3,306 5,276
PG&E 8,875 12,202 19,492
SCE 8,307 11,376 18,080
SDG&E 1,187 2,604 4,116
SMUD 1,184 1,629 2,583
Other 1,138 1,564 2,468
Statewide 23,789 32,681 52,015
Source: Guidehouse FSSAT output
Table 27 provides the total net cumulative investment cost (in billions of dollars) to the
consumer by scenario through 2030 at the sector level.
115
Table 27: Cumulative Cost for Panel Upgrades ($ Billions)
Sector Scenario 1 Scenario 2 Scenario 3
Residential $ - $ - $ 7.2
Source: Guidehouse FSSAT output
Table 28 provides the total net cumulative investment cost (in billions of dollars) to the
consumer by scenario through 2030 at the sector level. The total net cumulative investment
cost is the net cumulative cost for each year of installation, annualized at the real discount
rate, and represented in 2020 dollars. Table 29 shows that fuel substitution is expected to cost
$19.1 billion, $40.4 billion, and $75.5 billion in Scenarios 1, 2, and 3, respectively, over the
forecast period. These costs included technology costs, installation costs, contractor overhead
and profit, fuel costs, and electric panel upgrade costs. Where appropriate, these costs are
incremental to the cost of the comparable baseline gas technology.
Table 28: Net Cumulative Investment Cost by Scenario ($ Billions*)
Sector Scenario 1 Scenario 2 Scenario 3
Residential $ 34.5 $ 51.9 $ 81.8
Commercial $ - $ 2.5 $ 5.8
Agricultural/Industrial $ - $ - $ 10.4
Total $ 34.5 $ 54.4 $ 97.9
*Costs in 2020 dollars
Source: Guidehouse FSSAT output
Abatement Cost Curves The FSSAT produces GHG abatement cost curves based on the identified method in the
California ARB’s AB 32 Scoping Plan (scoping plan).181 The scoping plan includes the cost to
implement policies or measures (marginal abatement costs) across all economic sectors. Social
costs do not represent the cost of abatement or the cost of GHG emissions reductions; rather,
social costs estimate the harm avoided by reducing GHG emissions.
FSSAT calculates abatement cost on a per-metric-ton (mtCO2e) basis to compare fuel
substitution technologies to each other. To be consistent with the scoping plan model
framework calculation of costs per ton reduced,182 the user will have the option to select
whether to discount the emissions. If that option is set to no, the cumulative emissions will be
the simple sum of the annual emissions up to each year. If the option to discount emissions is
turned on, the cumulative emissions savings are discounted using the real discount rate.
181 California Air Resources Board. November 2017. California’s 2017 Climate Change Scoping Plan.
182 The PATHWAYS model is the scenario analysis for calculating the emissions reduction forecast of various
GHG abatement measures reported in the AB 32 Scoping Plan: Energy and Environmental Economics, Inc.,
California PATHWAYS Model Framework and Methods, Model Version 2.4, January 2017.

116
Alignment of the Definition of Costs
For the marginal abatement costs, the scoping plan calculates the total cost required from
2020 to 2030 to achieve emissions reductions for each measure during that same period
(including incremental capital costs and incremental fuel savings/expenditures). To calculate
this, the team reviewed the scoping plan analysis, which uses the PATHWAYS model
framework.183 This cost is a cumulative value (cost per metric ton abatement) for each
mitigation option over the years 2020–2030 and reported in 2020 dollars.
The PATHWAYS model annualizes the capital costs to a dollar/year basis using a capital
recovery factor. This factor is based on a 10 percent real discount rate.184 The total technology
cost across the study period (2020–2030) as defined in Equation 9 is annualized in Equation
18 using the real discount rate and the life of the fuel substituted equipment.
Equation 18: Annualized Equipment Cost
𝐴𝑛𝑛𝑢𝑎𝑙𝑖𝑧𝑒𝑑 𝐸𝑞𝑢𝑖𝑝𝑚𝑒𝑛𝑡 𝐶𝑜𝑠𝑡 = 𝑇𝑜𝑡𝑎𝑙 𝐸𝑞𝑢𝑖𝑝𝑚𝑒𝑛𝑡 𝐶𝑜𝑠𝑡 ×𝑑
[1 − (1 + 𝑑)−𝐸𝑈𝐿]
𝑊ℎ𝑒𝑟𝑒 : 𝑑 = the real discount rate
𝐸𝑈𝐿 = the effective useful life of a given technology
The second component of the annual cost is the net electricity and natural gas costs, which
Equation 10 defined.
For each measure, the annual costs from 2020 to 2030 are calculated and then discounted to
2020 using the discount rate to levelized capital costs over the life of equipment. This discounted cost for each measure was divided by the associated cumulative emissions reductions from 2020 to 2030 to calculate a cost per ton for the measure for the period.
Equation 19 provides the calculation of the discounted costs over the study period.
Equation 19: Net Present Value of the Annualized Costs
𝑁𝑒𝑡 𝑃𝑟𝑒𝑠𝑒𝑛𝑡 𝑉𝑎𝑙𝑢𝑒 𝐶𝑜𝑠𝑡 = ∑ ∑ 𝑁𝑃𝑉[𝐴𝑛𝑛𝑢𝑎𝑙𝑖𝑧𝑒𝑑 𝐸𝑞𝑢𝑖𝑝𝑚𝑒𝑛𝑡 𝐶𝑜𝑠𝑡𝑦𝑟=𝑖,𝑒𝑙𝑒𝑐𝑡𝑒𝑐ℎ=𝑘
+𝑦𝑒𝑎𝑟𝑖
𝐸𝑙𝑒𝑐𝑇𝑒𝑐ℎ𝑘
(𝐴𝑑𝑑𝑒𝑑 𝐸𝑙𝑒𝑐𝑡𝑟𝑖𝑐 𝐶𝑜𝑠𝑡𝑦𝑟=𝑖,𝑒𝑙𝑒𝑐𝑡𝑒𝑐ℎ=𝑘 + 𝑅𝑒𝑑𝑢𝑐𝑒𝑑 𝐺𝑎𝑠 𝐶𝑜𝑠𝑡𝑦𝑟=𝑖,𝑒𝑙𝑒𝑐𝑡𝑒𝑐ℎ=𝑘)+ 𝐴𝑛𝑐𝑖𝑙𝑙𝑎𝑟𝑦 𝐶𝑜𝑠𝑡𝑖], 𝑑, 𝐸𝑈𝐿)
𝑊ℎ𝑒𝑟𝑒 : 𝐴𝑛𝑛𝑢𝑎𝑙𝑖𝑧𝑒𝑑 𝐸𝑞𝑢𝑖𝑝𝑚𝑒𝑛𝑡 𝐶𝑜𝑠𝑡 = As explained on Equation 18
𝐴𝑑𝑑𝑒𝑑 𝐸𝑙𝑒𝑐𝑡𝑟𝑖𝑐 𝐶𝑜𝑠𝑡 = Additional annual cost of electricity consumed
𝑅𝑒𝑑𝑢𝑐𝑒𝑑 𝐺𝑎𝑠 𝐶𝑜𝑠𝑡 = Reduced annual cost of gas consumption saved
𝐴𝑛𝑐𝑖𝑙𝑙𝑎𝑟𝑦 𝐶𝑜𝑠𝑡 = Additional capital cost in ancillary equipment for electric demand
𝑁𝑃𝑉 = Net present value calculation
𝑑 = the real discount rate
𝐸𝑈𝐿 = the effective useful life of a given technology
FSSAT uses the same analysis equations and applies them to fuel substitution costs. FSSAT
allows users to adjust the discount rate. (CARB’s default is 10 percent.) In addition, the FSSAT
183 Energy and Environmental Economics, Inc. January 2017. California PATHWAYS Model Framework and Methods, Model Version 2.4.
184 P. 28 of the PATHWAYS model framework details this value.
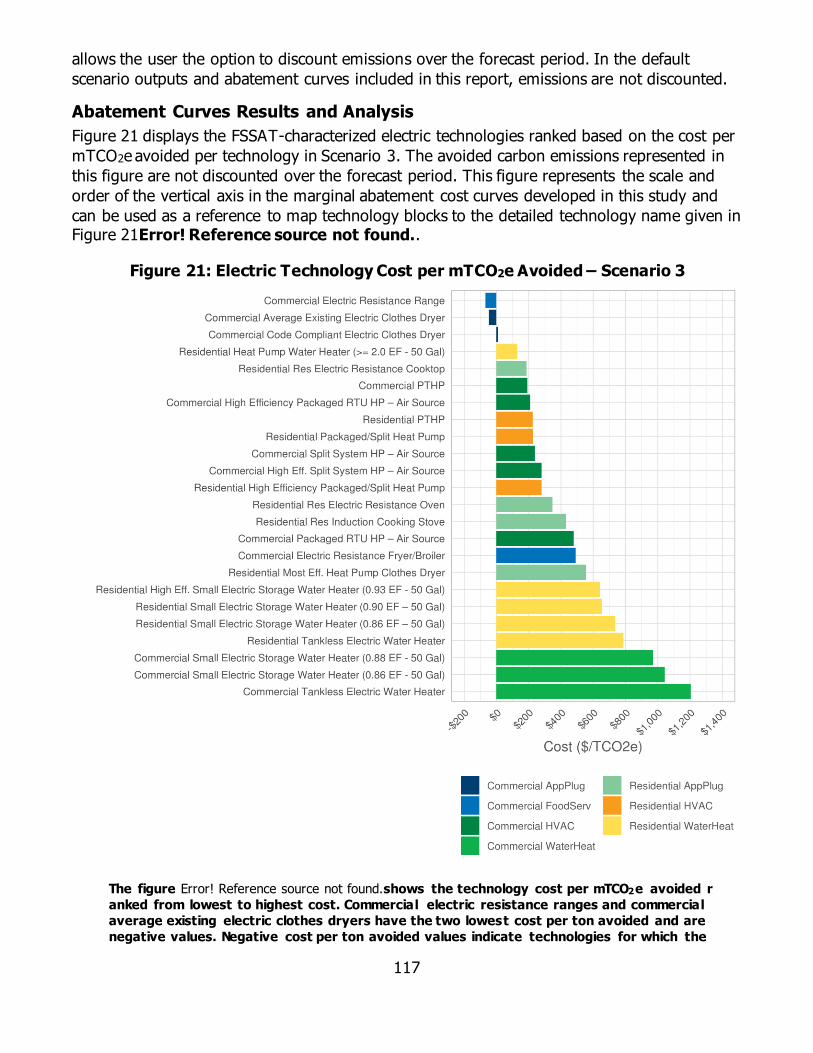
117
allows the user the option to discount emissions over the forecast period. In the default
scenario outputs and abatement curves included in this report, emissions are not discounted.
Abatement Curves Results and Analysis
Figure 21 displays the FSSAT-characterized electric technologies ranked based on the cost per
mTCO2e avoided per technology in Scenario 3. The avoided carbon emissions represented in
this figure are not discounted over the forecast period. This figure represents the scale and
order of the vertical axis in the marginal abatement cost curves developed in this study and
can be used as a reference to map technology blocks to the detailed technology name given in Figure 21Error! Reference source not found..
Figure 21: Electric Technology Cost per mTCO2e Avoided – Scenario 3
The figure Error! Reference source not found.shows the technology cost per mTCO2e avoided r
anked from lowest to highest cost. Commercial electric resistance ranges and commercial
average existing electric clothes dryers have the two lowest cost per ton avoided and are
negative values. Negative cost per ton avoided values indicate technologies for which the

118
electric replacement is less expensive over the lifetime than the comparable gas equipment.
The technologies with highest cost per ton avoided are all commercial electric resistance
water heaters.
Source: Guidehouse FSSAT output
Figure 22 provides cumulative emissions avoided at the technology level over the forecast
period through the end of life of the technology (2020–2045). The carbon emissions avoided
represented in this figure are not discounted over the forecast period. This figure represents
the scale of the horizontal axis in the marginal abatement cost curve in Figure 23 for the same
scenario and period.
Figure 22: 2020–2045 Cumulative Emissions Avoided by Technology – Scenario 3
The figure shows the cumulative emissions avoided by technology from 2020 to 2045 in
Scenario 3. Residential packaged terminal heat pumps and residential heat pump water
heaters represent the two technologies with highest emissions avoided. Residential heat
pumps are the third highest technology.
Source: Guidehouse FSSAT output
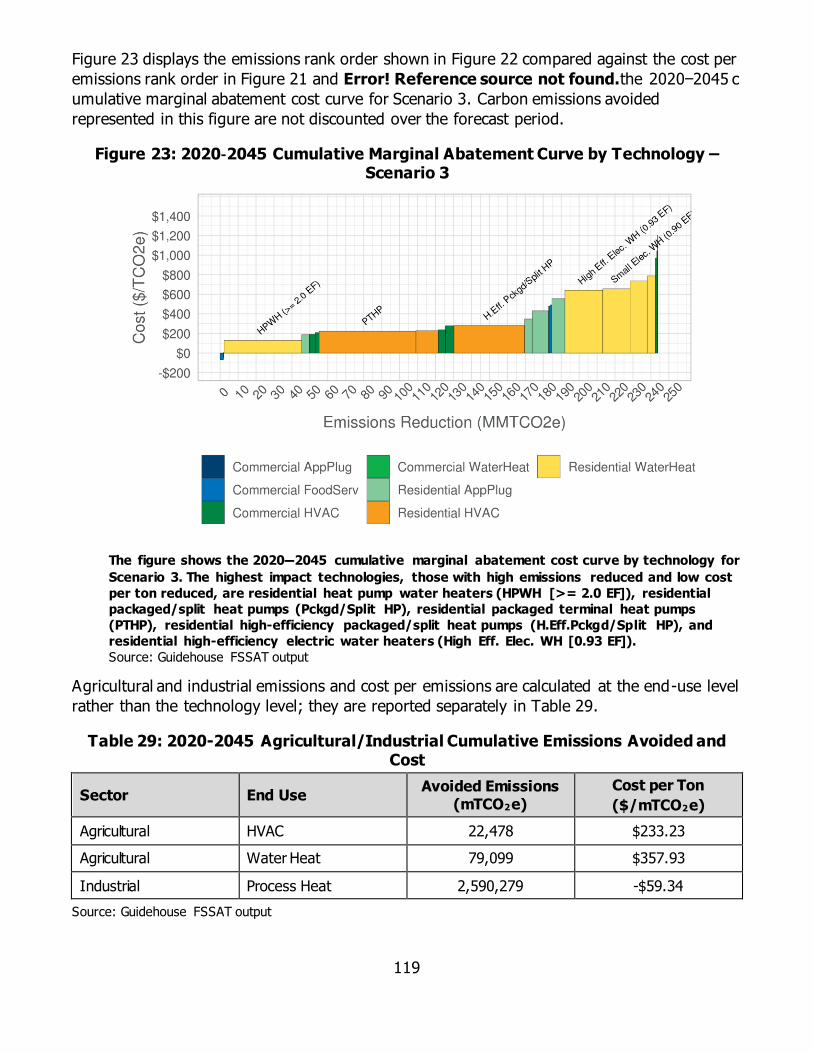
119
Figure 23 displays the emissions rank order shown in Figure 22 compared against the cost per
emissions rank order in Figure 21 and Error! Reference source not found.the 2020–2045 c
umulative marginal abatement cost curve for Scenario 3. Carbon emissions avoided
represented in this figure are not discounted over the forecast period.
Figure 23: 2020-2045 Cumulative Marginal Abatement Curve by Technology – Scenario 3
The figure shows the 2020–2045 cumulative marginal abatement cost curve by technology for
Scenario 3. The highest impact technologies, those with high emissions reduced and low cost
per ton reduced, are residential heat pump water heaters (HPWH [>= 2.0 EF]), residential
packaged/split heat pumps (Pckgd/Split HP), residential packaged terminal heat pumps
(PTHP), residential high-efficiency packaged/split heat pumps (H.Eff.Pckgd/Split HP), and
residential high-efficiency electric water heaters (High Eff. Elec. WH [0.93 EF]).
Source: Guidehouse FSSAT output
Agricultural and industrial emissions and cost per emissions are calculated at the end-use level
rather than the technology level; they are reported separately in Table 29.
Table 29: 2020-2045 Agricultural/Industrial Cumulative Emissions Avoided and Cost
Sector End Use Avoided Emissions
(mTCO2e)
Cost per Ton
($/mTCO2e)
Agricultural HVAC 22,478 $233.23
Agricultural Water Heat 79,099 $357.93
Industrial Process Heat 2,590,279 -$59.34
Source: Guidehouse FSSAT output
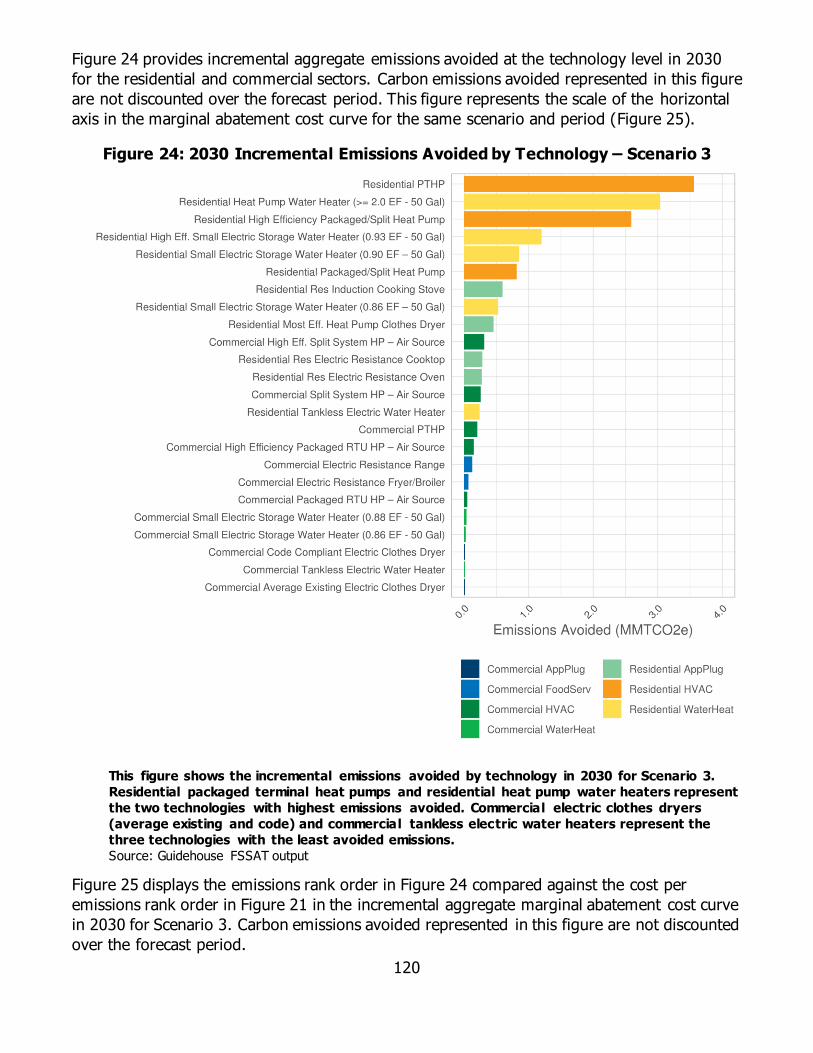
120
Figure 24 provides incremental aggregate emissions avoided at the technology level in 2030
for the residential and commercial sectors. Carbon emissions avoided represented in this figure
are not discounted over the forecast period. This figure represents the scale of the horizontal
axis in the marginal abatement cost curve for the same scenario and period (Figure 25).
Figure 24: 2030 Incremental Emissions Avoided by Technology – Scenario 3
This figure shows the incremental emissions avoided by technology in 2030 for Scenario 3.
Residential packaged terminal heat pumps and residential heat pump water heaters represent
the two technologies with highest emissions avoided. Commercial electric clothes dryers
(average existing and code) and commercial tankless electric water heaters represent the
three technologies with the least avoided emissions.
Source: Guidehouse FSSAT output
Figure 25 displays the emissions rank order in Figure 24 compared against the cost per
emissions rank order in Figure 21 in the incremental aggregate marginal abatement cost curve
in 2030 for Scenario 3. Carbon emissions avoided represented in this figure are not discounted
over the forecast period.
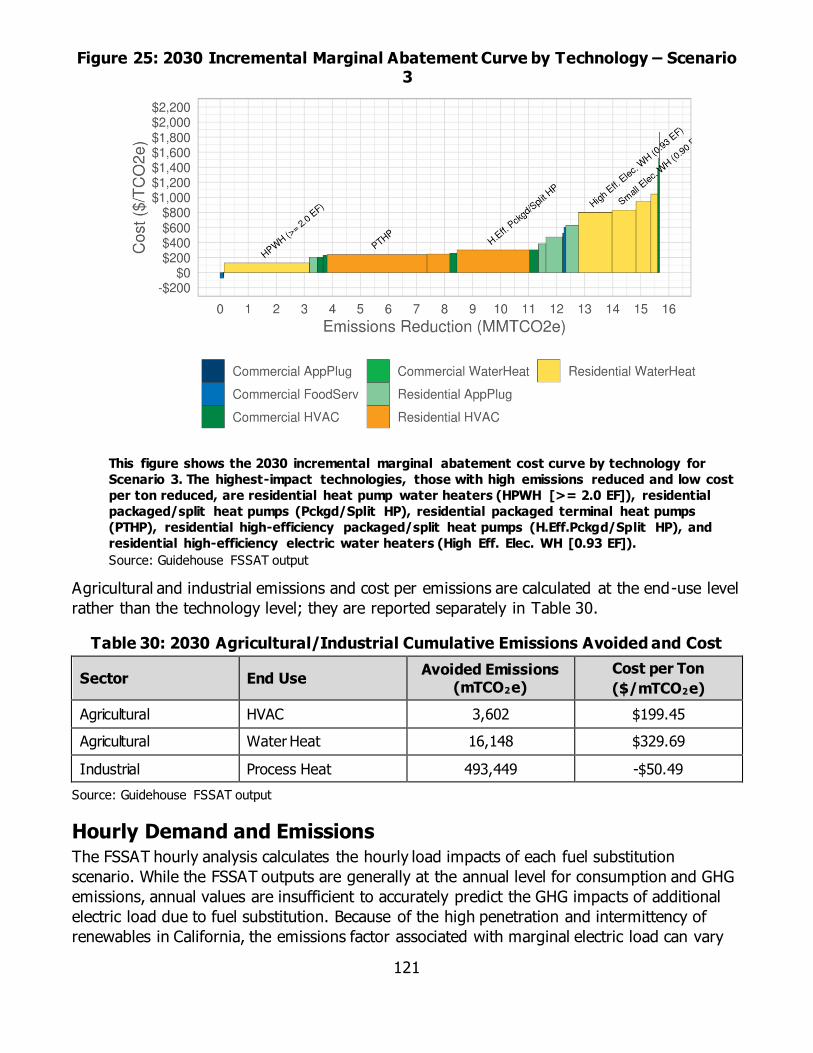
121
Figure 25: 2030 Incremental Marginal Abatement Curve by Technology – Scenario 3
This figure shows the 2030 incremental marginal abatement cost curve by technology for
Scenario 3. The highest-impact technologies, those with high emissions reduced and low cost
per ton reduced, are residential heat pump water heaters (HPWH [>= 2.0 EF]), residential
packaged/split heat pumps (Pckgd/Split HP), residential packaged terminal heat pumps
(PTHP), residential high-efficiency packaged/split heat pumps (H.Eff.Pckgd/Split HP), and
residential high-efficiency electric water heaters (High Eff. Elec. WH [0.93 EF]).
Source: Guidehouse FSSAT output
Agricultural and industrial emissions and cost per emissions are calculated at the end-use level
rather than the technology level; they are reported separately in Table 30.
Table 30: 2030 Agricultural/Industrial Cumulative Emissions Avoided and Cost
Sector End Use Avoided Emissions
(mTCO2e)
Cost per Ton
($/mTCO2e)
Agricultural HVAC 3,602 $199.45
Agricultural Water Heat 16,148 $329.69
Industrial Process Heat 493,449 -$50.49
Source: Guidehouse FSSAT output
Hourly Demand and Emissions The FSSAT hourly analysis calculates the hourly load impacts of each fuel substitution
scenario. While the FSSAT outputs are generally at the annual level for consumption and GHG
emissions, annual values are insufficient to accurately predict the GHG impacts of additional
electric load due to fuel substitution. Because of the high penetration and intermittency of
renewables in California, the emissions factor associated with marginal electric load can vary

122
substantially at the hourly level. The hourly calculation in the FSSAT applies the annual
additional electric load FSSAT output to normalized load shapes at the utility and end-use
levels. The resulting hourly load impacts are converted to hourly emissions impacts using
hourly emissions factors developed by CEC staff.
At higher penetrations of renewable generation as expected in future years, it is more
accurate to apply hourly electric generation emissions factors to determine GHG emissions
effects. Hourly demand data also help analyze potential grid constraint concerns as
systemwide peak demand may shift to different periods. For example, large increases in
electric heating may produce a significant winter peak that rivals the traditional summer peak.
Furthermore, the winter mornings will not have any solar PV contribution, potentially
exacerbating the winter peak. The nature and magnitude of this potential winter peak can be
better analyzed using hourly data from FSSAT.
The FSSAT uses the hourly calculation R process, detailed in Appendix H, to determine the
hourly electric load impacts of the added electricity due to fuel substitution. Representative
load shapes for all technologies are available, including space-heating heat pumps. Appendix G
describes the development of space-heating and space-cooling heat pump load shapes. The
hourly emissions factors provided by the CEC represent the emissions factor for marginal
electric generation due to fuel substitution and does not represent the electric generation mix
as a whole. As such, when these hourly values are aggregated to an annual value, they are
not directly comparable to the annual emissions factors of the full California electric generation
mix.
Hourly Analysis Results
Table 31 shows the annualized emissions factors calculated from the hourly GHG analysis.
These values are the quotient of the annual aggregate GHG emissions calculated from the sum
of the hourly GHG emissions and the annual additional electric load from fuel substitution.
Table 31 shows that fuel substitution in the FSSAT scenario outputs become progressively less
emissions-intensive from Scenario 1 to Scenario 2 to Scenario 3. This finding would indicate
that the additional load from fuel substitution in these scenarios is coincident with generation
with lower emissions intensity, on average.
Table 31: Annualized Emissions Factors Based on Hourly GHG Analysis Results, mTCO2e per MWh
Year Scenario 1 Scenario 2 Scenario 3
2020 0.334 0.334 0.335
2021 0.334 0.334 0.334
2022 0.333 0.333 0.333
2023 0.296 0.294 0.293
2024 0.261 0.255 0.254
2025 0.222 0.213 0.211
2026 0.216 0.206 0.204
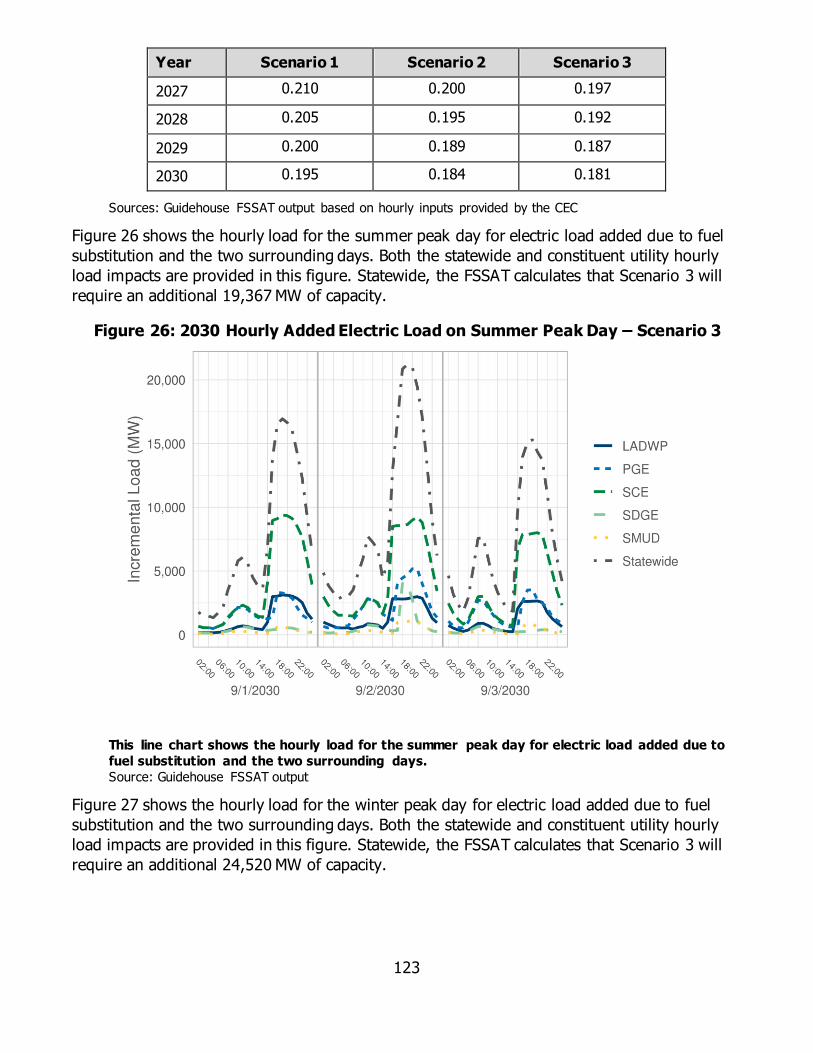
123
Year Scenario 1 Scenario 2 Scenario 3
2027 0.210 0.200 0.197
2028 0.205 0.195 0.192
2029 0.200 0.189 0.187
2030 0.195 0.184 0.181
Sources: Guidehouse FSSAT output based on hourly inputs provided by the CEC
Figure 26 shows the hourly load for the summer peak day for electric load added due to fuel
substitution and the two surrounding days. Both the statewide and constituent utility hourly
load impacts are provided in this figure. Statewide, the FSSAT calculates that Scenario 3 will
require an additional 19,367 MW of capacity.
Figure 26: 2030 Hourly Added Electric Load on Summer Peak Day – Scenario 3
This line chart shows the hourly load for the summer peak day for electric load added due to
fuel substitution and the two surrounding days.
Source: Guidehouse FSSAT output
Figure 27 shows the hourly load for the winter peak day for electric load added due to fuel
substitution and the two surrounding days. Both the statewide and constituent utility hourly
load impacts are provided in this figure. Statewide, the FSSAT calculates that Scenario 3 will
require an additional 24,520 MW of capacity.

124
Figure 27: 2030 Hourly Added Electric Load on Winter Peak Day – Scenario 3
This line chart shows the hourly load for the winter peak day for electric load added due to
fuel substitution and the two surrounding days.
Source: Guidehouse FSSAT output
Future Research
The CEC tasked the research team with prioritizing tool infrastructure and functionality
development. The collection and vetting of input data were a secondary priority and depended
on available secondary research. As such, the research team built assumptions into the current
tool in the absence of data. The drive toward building decarbonization and fuel substitution is
a nascent strategy for reducing GHG emissions. As the electricity grid decarbonizes, the overall
effectiveness for abating GHG emissions at a cost-effective dollar per metric ton improves.
Given this result, the following specific assumptions merit further research as the market
develops.
The propensity and rate of electrification adoption by sector and building segment are
unknown. The FSSAT uses simplified assumptions. Research should be conducted at the
technology level and in technology bundles. Once a customer adopts, for example, an
electric water heater, the likelihood of adopting additional electric technologies will
change.
Electric technology characterization metrics should be based on technology field
performance. Electric technology consumption is calculated assuming the technology
achieves the associated rated performance over the lifetime of the technology. Future
research may vet this assumption with field data and a better understanding of heat
pump technology.
125
Hourly GHG emissions factors for electric generation are based on one year and
extrapolated to other years in the forecast period. In future research, interpolation and
extrapolation could be minimized by developing hourly emissions factors for each
forecast year.
No data exist on the adoption rate of fuel substitution. The FSSAT does not include
these consumer decision and behavior parameters. The tool designed for this study is
meant to forecast policy objective scenarios. These scenario efforts are important
because they help articulate a vision of the mid- and high-level parameter outcomes
and metrics that correspond to policy goals. Forecasts that employ bottom-up consumer
decision theories are necessary to make precise forecasts that rely on changes in
customer behavior. Near-term changes in behavior may be sufficiently captured by
slight changes to high-level calibrated parameters because drastic changes are unlikely.
For longer-term forecasts where widespread changes could be expected, better decision
models and regularly tracked metrics are needed.

A-1
APPENDIX A:
Utility and Customer Fuel Substitution Costs
Utility Costs Fuel substitution will result in an increase in electricity loads on the electric grid. California
utilities will have to upgrade equipment to adequately handle this increased load. The
following tables outline utility costs on a unit basis for a variety of electrical upgrades. Pacific
Gas and Electric (PG&E) costs are provided because it is the largest utility provider in California
and the only utility with public cost data on a per-unit basis.
Table A-1: Utility Costs per Unit: Category 1 – 12/16 kV 480 V Transformer, Includes 100' Sec. Cable Length
Item #
Equipment Unit Cost
1 150kva & Sec. Cable (120/208V) $39,000
2 300kva & Sec. Cable (120/208V) $47,000
3 500kva & Sec. Cable - 500kvz is not current standard size for PG&E N/A
4 750kva & Sec. Cable (480/277V) $58,000
5 1000kva & Sec. Cable (480/277V) $72,000
6 1500kva & Sec. Cable (480/277V) $98,000
7 2500kva & Sec. Cable - Not generally used for distribution interconnections N/A
Source: Pacific Gas and Electric Company's Unit Cost Guide, updated: April 1, 2019
Table A-2: Utility Costs per Unit: Category 2 – Overhead to Underground (UG) — Set Pole and Make Up Cable
Item #
Equipment Unit Cost
1 Primary UG Service up to 200ft cable $45,000
2 Pri 350 Cable - PG&E does not separate costs for different cable size N/A
3 Pri 1000 Cable - PG&E does not separate costs for different cable size N/A
Source: Pacific Gas and Electric Company's Unit Cost Guide, updated: April 1, 2019
Table A-3: Utility Costs per Unit: Category 3 – Overhead (OH) Service
Item #
Equipment Unit Cost
1 Primary Service-OH include 1 span ovh line $20,000
2 New Conductor extension from POI to PCC $120/ft
Source: Pacific Gas and Electric Company's Unit Cost Guide, updated: April 1, 2019
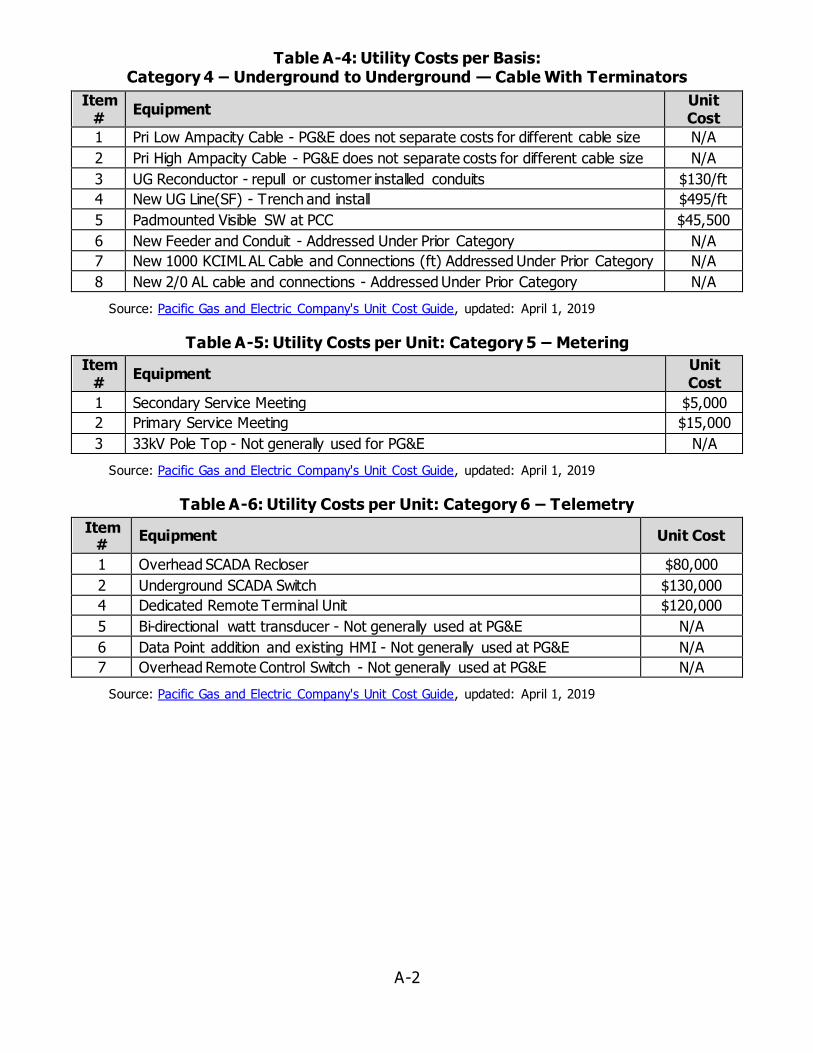
A-2
Table A-4: Utility Costs per Basis: Category 4 – Underground to Underground — Cable With Terminators
Item #
Equipment Unit Cost
1 Pri Low Ampacity Cable - PG&E does not separate costs for different cable size N/A
2 Pri High Ampacity Cable - PG&E does not separate costs for different cable size N/A
3 UG Reconductor - repull or customer installed conduits $130/ft
4 New UG Line(SF) - Trench and install $495/ft
5 Padmounted Visible SW at PCC $45,500
6 New Feeder and Conduit - Addressed Under Prior Category N/A
7 New 1000 KCIML AL Cable and Connections (ft) Addressed Under Prior Category N/A
8 New 2/0 AL cable and connections - Addressed Under Prior Category N/A
Source: Pacific Gas and Electric Company's Unit Cost Guide, updated: April 1, 2019
Table A-5: Utility Costs per Unit: Category 5 – Metering
Item #
Equipment Unit Cost
1 Secondary Service Meeting $5,000
2 Primary Service Meeting $15,000
3 33kV Pole Top - Not generally used for PG&E N/A
Source: Pacific Gas and Electric Company's Unit Cost Guide, updated: April 1, 2019
Table A-6: Utility Costs per Unit: Category 6 – Telemetry
Item #
Equipment Unit Cost
1 Overhead SCADA Recloser $80,000
2 Underground SCADA Switch $130,000
4 Dedicated Remote Terminal Unit $120,000
5 Bi-directional watt transducer - Not generally used at PG&E N/A
6 Data Point addition and existing HMI - Not generally used at PG&E N/A
7 Overhead Remote Control Switch - Not generally used at PG&E N/A
Source: Pacific Gas and Electric Company's Unit Cost Guide, updated: April 1, 2019

A-3
Table A-7: Utility Costs per Unit: Category 7 – System Equipment
Item #
Equipment Unit Cost
1 New overhead Air Switch $30,000
2 New Capacitor OH $33,000
3 PME 5 Padmount Switch $57,000
4 New Capacitor Pad mounted $47,000
5 New Regulator - Close Delta $150,000
6 33kV Regulator 3-690/722 - Not generally used at PG&E N/A
7 New Voltage Regulator 600A Padmount with two switches - Not generally used at SCE
N/A
8 Grounding/Stabiliz ing Transformer - Pole Mounted $20,000
9 Grounding/Stabiliz ing Transformer – Pad Mounted $52,000
10 Conductor (Per feet) - Overhead - Urban $220/ft
11 Reconductor (Per feet) - Overhead - Rural $130/ft
12 Reconductor (Per feet) - UG $260/ft
13 New Steel Pole (not priced separately, would be part of facility supporting need for pole)
N/A
14 New Wooden Pole (not priced separately, would be part of facility supporting need for pole)
N/A
15 Overhead Fuses $10,000
16 Fuse Cabinet UG 3 phase - Not generally use at PG&E N/A
17 Relocate Capacitor Bank $18,000
18 Regulator Control settings modifications $2,500
19 Relocate Regulator $50,000
20 Add a third Regulator to close the Delta $55,000
21 New Regulator - Closed Delta $150,000
22 Reclose blocking $145,000
23 Hardwire Tripping from Transformer Hi-side $60,000
24 Substation LTC Control change out $60,000
25 New IPAC relay cabinet for bi-direction power flow $125,000
26 Direct Transfer Trip $600,000
27 New Substation Circuit Breaker - Not generally used for distribution interconnections
N/A
28 New 28MVA 69/12kV Transformer - Not generally used for distribution interconnections
N/A
29 New 28MVA 138/12kV Transformer - Not generally used for distribution interconnections
N/A
Source: Pacific Gas and Electric Company's Unit Cost Guide, updated: April 1, 2019
The National Renewable Energy Laboratory (NREL) studied the cost of distributed system
upgrades and provided a focus on feeder modeling. Feeder costs pose a cost barrier in terms
of electrical upgrades. Two case studies (Feeder A and Feeder B) in the study were in
California; Table A-8 shows a breakdown of costs.

A-4
Table A-8: Summary of Upgrade Costs on the Two Feeder Case Studies
Upgrade Selected Unit Cost
(Low, Mid, High)
Units
Required
Total Cost
(Low, Mid,
High)
Relevant
Spatial DPV
Deployment
Scenarios
Advanced inverter
functionality: set all
inverter absorbing PF
of 0.95 or using
volt/VAR control
$0 for all for the
baseline case, $143
for all for the high-
inverter cost case
Depends on
penetration
level
All scenarios
New line voltage
regulator (Feeder A)*
$150,000,
$166,000, $183,000 1
$150,000,
$166,000,
$183,000
All scenarios
New LTC at the
substation
transformer (Feeder
A)
$310,000,
$310,000, $310,000 1
$310,000,
$310,000,
$310,000
All scenarios
New 3-phase, 300
kVar capacitor
(Feeder B)
$6,000, $8,290,
$10,700 1
$6,000, $8,290,
$10,700
Close to the
substation only
Reduce LTC set point
(Feeder B)
$500, $8,000,
$26,000 1
$500, $8,000,
$26,000
Close to the
substation only
New 3-phase, 50 kVA
transformer (OH)**
(Feeder B)
$10,400, $10,400,
$10,400 1
$10,400,
$10,400, $10,400
Close to the
substation only
New 3-phase, 100
kVA transformer
(OH)** (Feeder B)
$15,600, $32,500,
$49,300 9
$140,000,
$292,000,
$444,000
Close to the
substation only
*These upgrades were undertaken simultaneously.
**OH = overhead
Source: National Renewable Energy Laboratory, The Cost of Distribution System Upgrades to Accommodate Increasing Penetrations of Distributed Photovoltaic Systems on Real Feeders in the United States, 2018
Customer Costs
TRC Companies, Inc. conducted a variety of reach code studies in California to appraise the
costs associated with various equipment installations. The baseline scenario represents the
existing or standard equipment status as outlined in the 2019 Title 24 measure requirements.
The proposed scenario represents the electrification upgrade beyond Title 24 requirements.
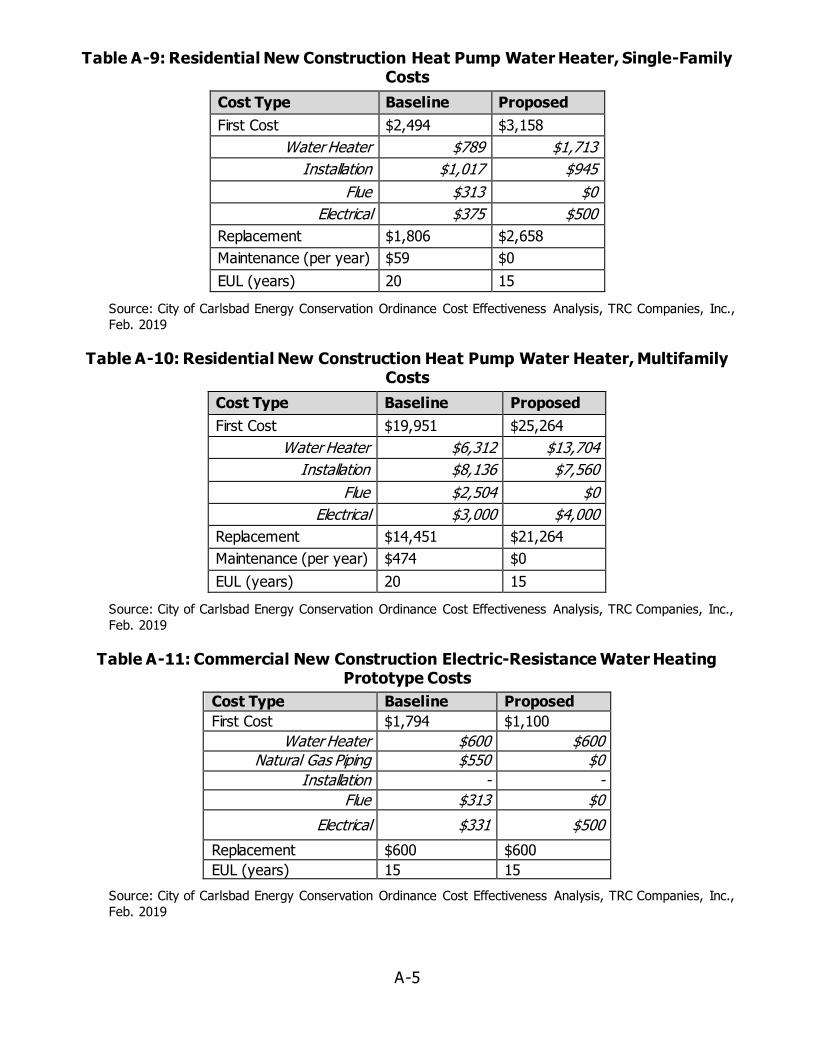
A-5
Table A-9: Residential New Construction Heat Pump Water Heater, Single-Family Costs
Cost Type Baseline Proposed
First Cost $2,494 $3,158
Water Heater $789 $1,713
Installation $1,017 $945
Flue $313 $0
Electrical $375 $500
Replacement $1,806 $2,658
Maintenance (per year) $59 $0
EUL (years) 20 15
Source: City of Carlsbad Energy Conservation Ordinance Cost Effectiveness Analysis, TRC Companies, Inc.,
Feb. 2019
Table A-10: Residential New Construction Heat Pump Water Heater, Multifamily Costs
Cost Type Baseline Proposed
First Cost $19,951 $25,264
Water Heater $6,312 $13,704
Installation $8,136 $7,560
Flue $2,504 $0
Electrical $3,000 $4,000
Replacement $14,451 $21,264
Maintenance (per year) $474 $0
EUL (years) 20 15
Source: City of Carlsbad Energy Conservation Ordinance Cost Effectiveness Analysis, TRC Companies, Inc.,
Feb. 2019
Table A-11: Commercial New Construction Electric-Resistance Water Heating Prototype Costs
Cost Type Baseline Proposed
First Cost $1,794 $1,100
Water Heater $600 $600 Natural Gas Piping $550 $0
Installation - -
Flue $313 $0
Electrical $331 $500
Replacement $600 $600
EUL (years) 15 15
Source: City of Carlsbad Energy Conservation Ordinance Cost Effectiveness Analysis, TRC Companies, Inc.,
Feb. 2019

A-6
Table A-12: Commercial New Construction Heat Pump Water Heater Prototype Costs
Cost Type Baseline Proposed
First Cost $1,919 $2,658
Water Heater $941 $1,713
Natural Gas Piping - - Installation $666 $945
Flue $313 $0
Electrical
Replacement $1,606 $2,658
EUL (years) 15 15
Source: City of Carlsbad Energy Conservation Ordinance Cost Effectiveness Analysis, TRC Companies, Inc.,
Feb. 2019
Table A-13: Residential New Construction and Alterations Electric Panel Costs, Heat Pump Water Heater Outlet, Single-Family – 2,100 ft2
First Measure Cost Baseline Proposed
Electrical Panel* $2,480 $2,480
Incremental Cost $0
*200 A panel was determined to be enough for an all-electric single-family building and
matches common baseline of 200 A for new construction and alterations. Multifamily baseline
is 125 A and proposed is 150 A.
Source: City of Palo Alto 2019 Title 24 Energy Reach Code Cost Effectiveness Analysis DRAFT, TRC
Companies, Inc., Sept. 2018
Table A-14: Residential New Construction and Alterations Electric Panel Costs, Heat Pump Water Heater Outlet, Multifamily
First Measure Cost Baseline Proposed
Electrical Panel* $12,603 $16,859
Incremental Cost $4,256
*200 A panel was determined enough for an all-electric single-family building and matches
common baseline of 200 A for new construction and alterations. Multifamily baseline is 125 A
and proposed is 150 A.
Source: City of Palo Alto 2019 Title 24 Energy Reach Code Cost Effectiveness Analysis DRAFT, TRC
Companies, Inc., Sept. 2018
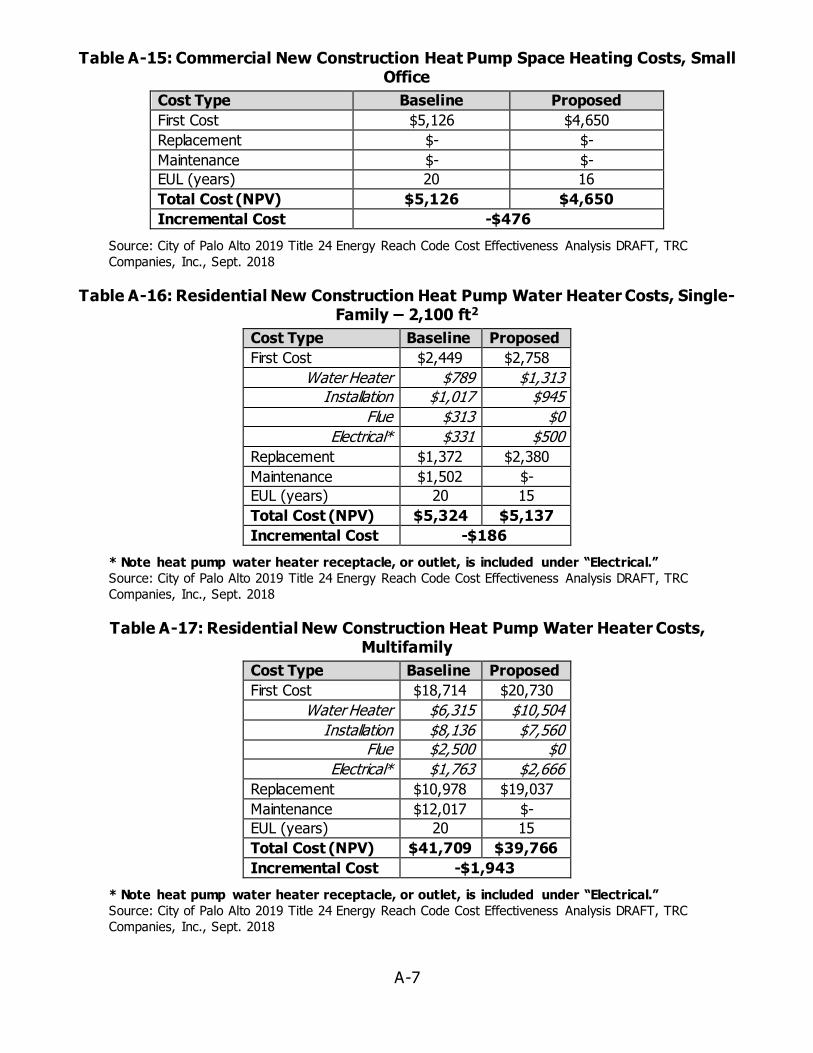
A-7
Table A-15: Commercial New Construction Heat Pump Space Heating Costs, Small Office
Cost Type Baseline Proposed
First Cost $5,126 $4,650
Replacement $- $-
Maintenance $- $-
EUL (years) 20 16
Total Cost (NPV) $5,126 $4,650
Incremental Cost -$476
Source: City of Palo Alto 2019 Title 24 Energy Reach Code Cost Effectiveness Analysis DRAFT, TRC
Companies, Inc., Sept. 2018
Table A-16: Residential New Construction Heat Pump Water Heater Costs, Single-Family – 2,100 ft2
Cost Type Baseline Proposed
First Cost $2,449 $2,758
Water Heater $789 $1,313 Installation $1,017 $945
Flue $313 $0
Electrical* $331 $500
Replacement $1,372 $2,380
Maintenance $1,502 $-
EUL (years) 20 15
Total Cost (NPV) $5,324 $5,137
Incremental Cost -$186
* Note heat pump water heater receptacle, or outlet, is included under “Electrical.”
Source: City of Palo Alto 2019 Title 24 Energy Reach Code Cost Effectiveness Analysis DRAFT, TRC
Companies, Inc., Sept. 2018
Table A-17: Residential New Construction Heat Pump Water Heater Costs, Multifamily
Cost Type Baseline Proposed
First Cost $18,714 $20,730
Water Heater $6,315 $10,504
Installation $8,136 $7,560 Flue $2,500 $0
Electrical* $1,763 $2,666
Replacement $10,978 $19,037
Maintenance $12,017 $-
EUL (years) 20 15
Total Cost (NPV) $41,709 $39,766
Incremental Cost -$1,943
* Note heat pump water heater receptacle, or outlet, is included under “Electrical.”
Source: City of Palo Alto 2019 Title 24 Energy Reach Code Cost Effectiveness Analysis DRAFT, TRC
Companies, Inc., Sept. 2018

A-8
Table A-18: Residential New Construction Heat Pump Clothes Dryer Costs, Single-Family – 2,100 ft2
Cost Type Baseline Proposed
First Cost $1,334 $1,807
Dryer $956 $1,245
Electrical $378 $1,245 Replacement $1,094 $1,425
Maintenance $- $-
EUL (years) 13 13
Total Cost (NPV) $2,428 $3,232
Incremental Cost $804
Source: City of Palo Alto 2019 Title 24 Energy Reach Code Cost Effectiveness Analysis DRAFT, TRC
Companies, Inc., Sept. 2018
Table A-19: Residential New Construction Heat Pump Clothes Dryer Costs, Multifamily
Cost Type Baseline Proposed
First Cost $9,664603 $12,958
Dryer $7,646 $9,961
Electrical $2,108 $2,997
Replacement $8,752 $11,402
Maintenance $- $-
EUL (years) 13 13
Total Cost (NPV) $18,416 $24,361
Incremental Cost $5,945
Source: City of Palo Alto 2019 Title 24 Energy Reach Code Cost Effectiveness Analysis DRAFT, TRC
Companies, Inc., Sept. 2018
Table A-20: Residential New Construction Heat Pump Space-Heater Costs, Single-Family – 2,100 ft2
Cost Type Baseline Proposed
First Cost $2,369 $2,102
Package Unit/Heat Pump $2,019 $2,102 Installation (Pad/Fuel) $350 $0
Replacement $1,543 $2,215
Maintenance $0 $0
EUL (years) 20 15
Total Cost (NPV) $3,903 $4,317
Incremental Cost $414
Source: City of Palo Alto 2019 Title 24 Energy Reach Code Cost Effectiveness Analysis DRAFT, TRC
Companies, Inc., Sept. 2018
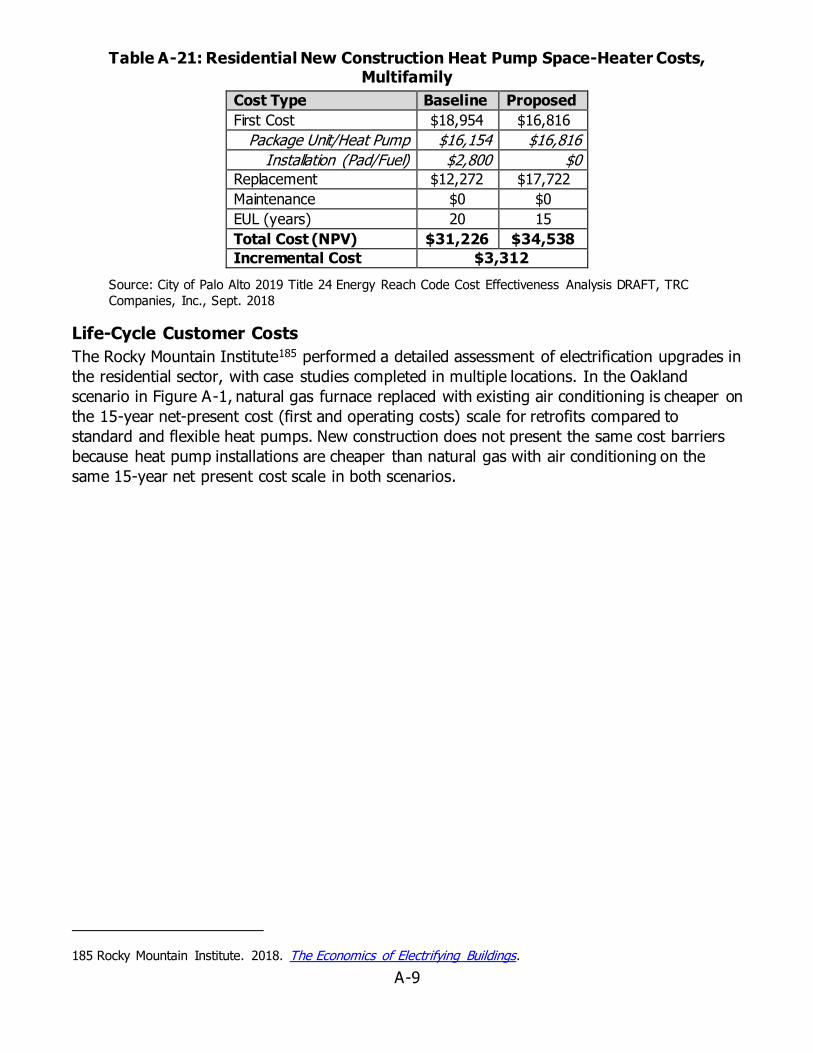
A-9
Table A-21: Residential New Construction Heat Pump Space-Heater Costs, Multifamily
Cost Type Baseline Proposed
First Cost $18,954 $16,816
Package Unit/Heat Pump $16,154 $16,816
Installation (Pad/Fuel) $2,800 $0 Replacement $12,272 $17,722
Maintenance $0 $0
EUL (years) 20 15
Total Cost (NPV) $31,226 $34,538
Incremental Cost $3,312
Source: City of Palo Alto 2019 Title 24 Energy Reach Code Cost Effectiveness Analysis DRAFT, TRC
Companies, Inc., Sept. 2018
Life-Cycle Customer Costs
The Rocky Mountain Institute185 performed a detailed assessment of electrification upgrades in
the residential sector, with case studies completed in multiple locations. In the Oakland
scenario in Figure A-1, natural gas furnace replaced with existing air conditioning is cheaper on
the 15-year net-present cost (first and operating costs) scale for retrofits compared to
standard and flexible heat pumps. New construction does not present the same cost barriers
because heat pump installations are cheaper than natural gas with air conditioning on the
same 15-year net present cost scale in both scenarios.
185 Rocky Mountain Institute. 2018. The Economics of Electrifying Buildings.
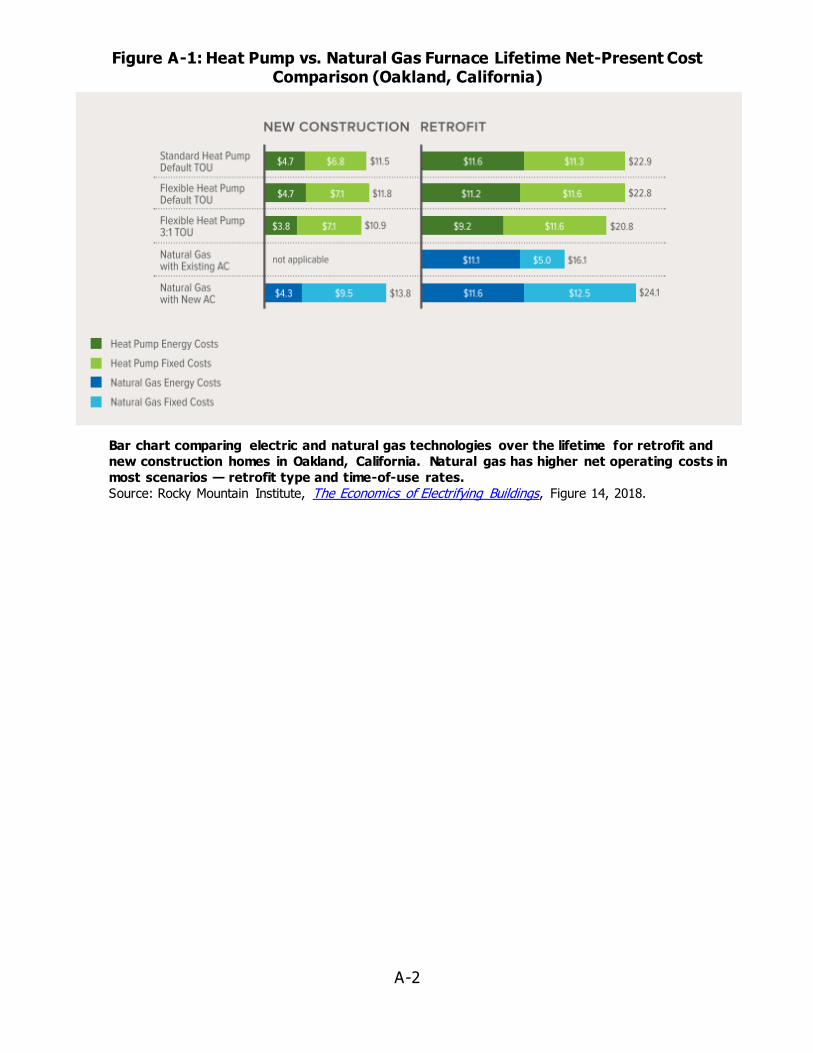
A-2
Figure A-1: Heat Pump vs. Natural Gas Furnace Lifetime Net-Present Cost Comparison (Oakland, California)
Bar chart comparing electric and natural gas technologies over the lifetime for retrofit and
new construction homes in Oakland, California. Natural gas has higher net operating costs in
most scenarios — retrofit type and time-of-use rates.
Source: Rocky Mountain Institute, The Economics of Electrifying Buildings, Figure 14, 2018.

B-1
APPENDIX B:
Electrification Incentive Pathways
California provides unique incentive opportunities for new home construction in response to
homes destroyed by wildfires. Error! Reference source not found. provides an overview of t
he home energy upgrades that new home construction could claim and the incentives by
upgrade. New homes can claim multiple upgrades. The Simple Menu-based Path (in orange)
lists the requirements necessary to fulfill this upgrade — for example, new homes must include
a smart thermostat. The Flexible Performance Path (in orange) provides flexibility in the
requirements, allowing upgrade variability — for example, 20 percent above Title 24 energy
code for all-electric end uses.
Table B-22: California Advanced Home Incentives for Electrification
Type of Home Single
Family Multifamily
Advanced Energy Home (mixed fuel) $7,500 $3,750
All-Electric Home $12,500 $6,250
Solar and Battery Option $5,000 $5,000
Source: Incentive Pathways, California Advanced Homes

C-1
APPENDIX C:
Industrial and Agricultural Technologies
Fuel Substitution Opportunities by Segment Electroheating solutions provide additional benefits by reducing final energy demand by a
factor of 1.5 to 8 compared to conventional fossil fuel heating. Reductions can reach a factor
of 2-3, especially when considering the reduced oxidation losses in electrical furnaces. Other
benefits include improved economic productivity, product quality, and worker conditions.
These benefits result from the contained electric heating conditions, which provide less
variability in the heating process from increased heating control and overall safer conditions
relative to those produced under fossil fuel conditions.186 Table C-1 and Table C-2 provide
feasibility and opportunities for electrifying end uses by segment. The matrix presented in
Table C-1 evaluates boiler systems, combined heat and power (CHP), process heat, and facility
heating, ventilation, and air conditioning (HVAC) for a variety of building types and designates
the possible alternatives and the associated potential. This matrix provides higher granularity
in terms of industrial process evaluation and solution specificity compared to Table C-2.
186 U.S. Department of Energy. 2016. Quadrennial Technology Review 2015 – Chapter 6: Innovating Clean Energy Technologies in Advanced Manufacturing – Process Heating.

C-2
Table C-1: Application Matrix of Eight Electroheating Technologies in 24 Industrial Sectors
Industry Sector
Infr
are
d
He
ati
ng
Re
sis
tan
ce
He
ati
ng
Ult
rav
iole
t
Cu
rin
g
Mic
row
av
e
He
ati
ng
Ra
dio
Fre
qu
en
cy
He
ati
ng
Ind
ucti
on
He
ati
ng
/
Ha
rde
nin
g
Ind
ucti
on
Me
ltin
g
Ele
ctr
ic A
rc
Fu
rna
ce
Food products X X
Beverages
Tobacco X
Textiles X X X X X X
Wearing apparel X X X
Leather products X X X
Wood products X X X X
Paper & paper
products X X X X
Printing X X
Coke & refined
petroleum X X
Chemicals X X X X
Pharmaceuticals X X X
Rubber & plastics X X X X X X
Nonmetallic
minerals X X X X X X
Basic metals X X X X X
Fabricated metal
products X X X X X X
Computers &
electronics X X X X X
Electrical
equipment X X X X X X
Machinery &
equipment X X X X X X X
Motor vehicles X X X X X X
Other transport
equipment X X X X X X
Furniture X X X X
Other
manufacturing X X X X X
Repair and
installation X X X X
Source: Navigant Consulting, Inc. (Ecofys), Opportunities for electrification of industry in the European Union, 2018

C-1
Table C-2: Industrial Sector Breakdown of Onsite Fuel Consumption, Representative Process Temperatures, and General Outlook for Electrification
Industrial Sector
Bo
ile
r S
yste
m P
erc
en
tag
e
On
sit
e F
ue
l C
on
su
mp
tio
n
CH
P P
erc
en
tag
e O
nsit
e F
ue
l
Co
nsu
mp
tio
n
Pro
ce
ss H
ea
tin
g P
erc
en
tag
e
On
sit
e F
ue
l C
on
su
mp
tio
n
Fa
cil
ity
HV
AC
Pe
rce
nta
ge
On
sit
e F
ue
l C
on
su
mp
tio
n
High-temperature process steps Temp
L/M/H
Ap
pro
xim
ate
d P
ote
nti
al
for
Ele
ctr
ific
ati
on
Disposition for
electrification
Primary metals
excluding steel 3.9% 7.4% 74.8% 5.8%
Primary Al Furnace 2200F (1200C); Copper
furnace 1200C; Zinc Furnace (1260C) HIGH HIGH Induction melting candidate
Fabricated metal
products 7.2% 6.6% 61.2% 19.7%
Al sheet, foil furnace melting 1250F (680C);
preheating 1000F (540C); annealing 800F
(430C)
HIGH HIGH
Induction heating/melting
candidate, but low overall
energy consumption
Machinery 4.2% 4.2% 38.9% 45.8% Farm and construction equipment Heat
treatment 1350F (732C) HIGH HIGH
Induction heating candidate,
but low overall energy
consumption
Iron and steel mills 0.0% 0.0% 87.0% 4.1% Blast furnace 2600F(1430C) Basic oxygen
furnace 2800F (1540C) HIGH HIGH
Electric arc furnace;
electrowinning
Wood Products 4.8% 14.3% 50.0% 9.5% Fiberboard Stabilization/Drying 350F (180C) MED HIGH
Good candidate for
electrification, but low
overall energy consumption
Transportation
equipment 13.6% 12.1% 32.6% 31.1%
Motor vehicle car body Drier 300F (150C);
Vehicle parts furnace 2900F (1600C)
MED/
HIGH HIGH
Driers ok for electrification,
but furnace challenging; but
low overall energy
consumption
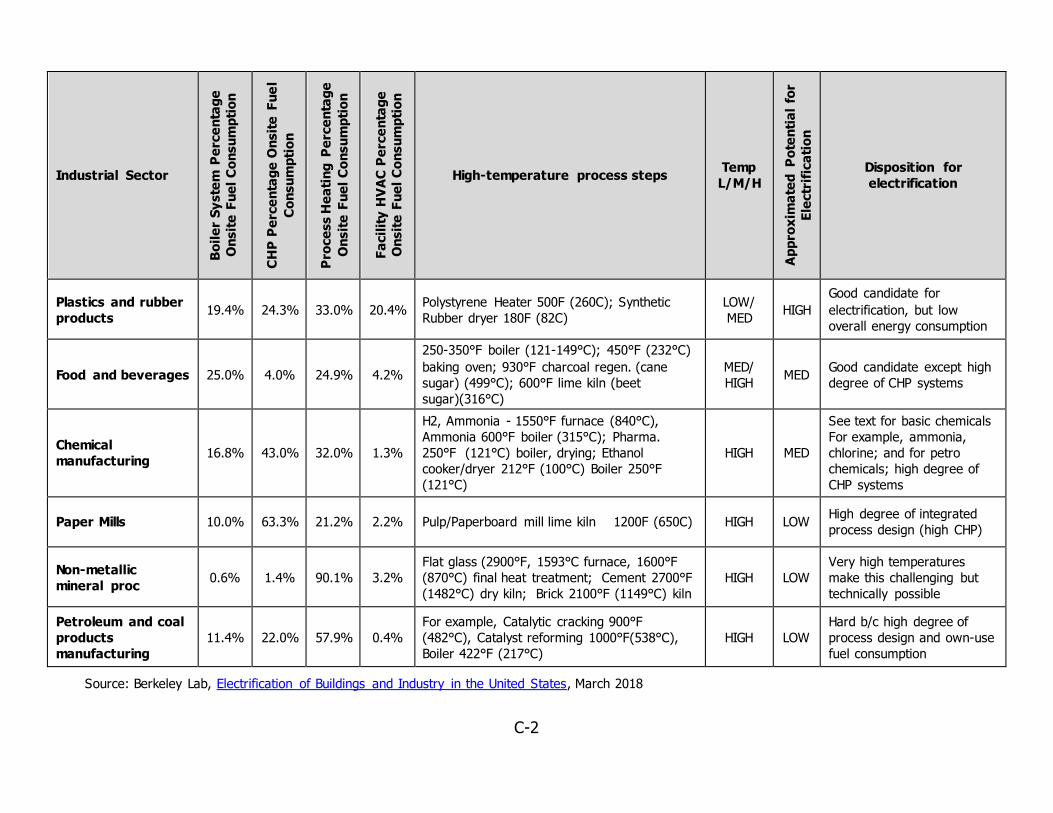
C-2
Industrial Sector
Bo
ile
r S
yste
m P
erc
en
tag
e
On
sit
e F
ue
l C
on
su
mp
tio
n
CH
P P
erc
en
tag
e O
nsit
e F
ue
l
Co
nsu
mp
tio
n
Pro
ce
ss H
ea
tin
g P
erc
en
tag
e
On
sit
e F
ue
l C
on
su
mp
tio
n
Fa
cil
ity
HV
AC
Pe
rce
nta
ge
On
sit
e F
ue
l C
on
su
mp
tio
n
High-temperature process steps Temp
L/M/H
Ap
pro
xim
ate
d P
ote
nti
al
for
Ele
ctr
ific
ati
on
Disposition for
electrification
Plastics and rubber
products 19.4% 24.3% 33.0% 20.4%
Polystyrene Heater 500F (260C); Synthetic
Rubber dryer 180F (82C)
LOW/
MED HIGH
Good candidate for
electrification, but low
overall energy consumption
Food and beverages 25.0% 4.0% 24.9% 4.2%
250-350°F boiler (121-149°C); 450°F (232°C)
baking oven; 930°F charcoal regen. (cane
sugar) (499°C); 600°F lime kiln (beet
sugar)(316°C)
MED/
HIGH MED
Good candidate except high
degree of CHP systems
Chemical
manufacturing 16.8% 43.0% 32.0% 1.3%
H2, Ammonia - 1550°F furnace (840°C),
Ammonia 600°F boiler (315°C); Pharma.
250°F (121°C) boiler, drying; Ethanol
cooker/dryer 212°F (100°C) Boiler 250°F
(121°C)
HIGH MED
See text for basic chemicals
For example, ammonia,
chlorine; and for petro
chemicals; high degree of
CHP systems
Paper Mills 10.0% 63.3% 21.2% 2.2% Pulp/Paperboard mill lime kiln 1200F (650C) HIGH LOW High degree of integrated
process design (high CHP)
Non-metallic
mineral proc 0.6% 1.4% 90.1% 3.2%
Flat glass (2900°F, 1593°C furnace, 1600°F
(870°C) final heat treatment; Cement 2700°F
(1482°C) dry kiln; Brick 2100°F (1149°C) kiln
HIGH LOW
Very high temperatures
make this challenging but
technically possible
Petroleum and coal
products
manufacturing
11.4% 22.0% 57.9% 0.4%
For example, Catalytic cracking 900°F
(482°C), Catalyst reforming 1000°F(538°C),
Boiler 422°F (217°C)
HIGH LOW
Hard b/c high degree of
process design and own-use
fuel consumption
Source: Berkeley Lab, Electrification of Buildings and Industry in the United States, March 2018

D-1
Table C-3 provides a more straightforward breakdown of relevant fuel substitution pursuits by
building type, as identified by the National Renewable Energy Laboratory (NREL). While less
granular, it provides broader solutions.
Table C-3: Subsectors and End Uses Relevant to Electrification
Industrial Subsector End Use Representative Electrotechnology
All manufacturing industries and agriculture
Building HVAC Industrial heat pump
All manufacturing industries and agriculture
Machine drive Electric machine drive
Food, chemicals, transportation equipment, plastics, and other manufacturing
Process heat Electric boiler
Food Process heat Industrial heat pump
Chemicals Process heat Resistance heating
Chemicals Process heat Industrial heat pump
Glass and glass products Process heat Direct resistance melting (electric glass melt furnace)
Primary metals Process heat Induction furnace
Transportation equipment Process heat Induction furnace
Plastic and rubber products Process heat Resistance heating
Plastic and rubber products Process heat Infrared processing
Other manufacturing Process heat Resistance heating
Other wood products and printing and related support
Process heat: curing
Ultraviolet curing
Source: National Renewable Energy Laboratory, Electrification Futures Study, 2017
Select Fuel Substitution Technologies In Navigant (now Guidehouse)’s Energy Technologies for the Food Processing Industry study
(released January 2018), the research team identified specific opportunities that can provide
greenhouse gas (GHG) reduction benefits, including fuel substitution technologies. These
technologies are transferable to other industrial and agricultural segments, as applicable.
These technologies may be a cost-effective and appropriate solution in the future. The study
chose to characterize the following fuel substitution technologies because enough information
was available:
Mechanical dewatering
Heat pump drying
Large-scale industrial heat pump
Ohmic heating – the process of heating food by passing electric current
Induction heating

D-2
Mechanical Dewatering
Mechanical dewatering, using mechanical movement to pre-dry or dry product, can reduce the
moisture loading on the dryer and save significant amounts of energy. As a rule of thumb, for
each 1 percent reduction in product moisture, the dryer energy input can be reduced by up to
4 percent. Mechanical dewatering methods include filtration, using centrifugal force, gravity,
mechanical compression, and high-velocity air.
Table C-4: Mechanical Dewatering Cost and Reduction Potential
Metric Units Result
Estimated annual energy savings (% of Site) 1.25% of total therms, with a
0.31% increase in kWh
Estimated measure life (Years) 15
Cost to implement ($/kWh)
There is insufficient information
to properly quantify the cost of
this measure.
GHG reduction per site (Metric Tonnes of
CO2) 124.6–205.7
Estimated percentage of GHG
emissions reductions (%) 0.58%–1.07%
Total Measure Potential (Metric Tonnes
of CO2) 12,929
Source: Guidehouse
Table C-5: Mechanical Dewatering Barriers and Recommended Strategies for Implementation
Barriers to Implementation Recommended Strategies for
Implementation
• Lack of process-specific knowledge
• High initial cost
• Product quality concerns
• Potential to affect primary process
equipment and require long periods of shut
down
• Lack of awareness of measure
• Favorable incentives to cover initial cost
• Process-specific examples to highlight
benefits
• Provide process-specific solution
Source: Guidehouse
Heat Pump Drying
Dry heated air is passed continuously over the product; as it picks up moisture, it condenses
on the heat pump, giving up the latent heat of vaporization, which is taken up by the
refrigerant in the evaporator. This heat is used to reheat the cool dry air passing over the hot
condenser of the heat pump.

D-3
Table C-6: Heat Pump Drying Cost and Reduction Potential
Metric Units Result
Estimated annual energy savings (% of Site) 5% of total therms, with a
0.83% increase in kWh
Estimated measure life (Years) 15
Cost to implement ($/kWh)
There is insufficient information
to properly quantify the cost of
this measure, likely due to the
process-specific nature.
GHG reduction per site (Metric Tonnes of
CO2) 504.0-885.4
Estimated percentage of GHG
emissions reductions (%) 2.51%-4.33%
Total Measure Potential (Metric Tonnes
of CO2) 53,098
Source: Guidehouse
Table C-7: Heat Pump Drying Barriers and Recommended Strategies for Implementation
Barriers to Implementation Recommended Strategies for
Implementation
• Reduced load on the boiler but may
require maintenance
• Process-specific replacement options
• Gas-only incentives to cover initial costs
• Process-specific case studies to highlight benefits
Source: Guidehouse
Large-Scale Industrial Heat Pump
A large-scale industrial heat pump is a specialized heat recovery system meant to recover heat
from major processes or from ambient air and through the refrigeration cycle to create high-
temperature useful heat at high efficiency levels. This system can generate heat four or five
times more efficiently than a standard electric boiler.
Table C-8: Large-Scale Industrial Heat Pump Cost and Reduction Potential
Metric Units Result
Estimated annual energy savings (% of Site) 10% of total therms, with a
1.67% increase in kWh
Estimated measure life (Years) 15
Cost to implement ($/kWh)
There is insufficient information to properly quantify the cost of this measure, likely due to the
process-specific nature.
GHG reduction per site (Metric Tonnes of
CO2) 5.7-1,770.7
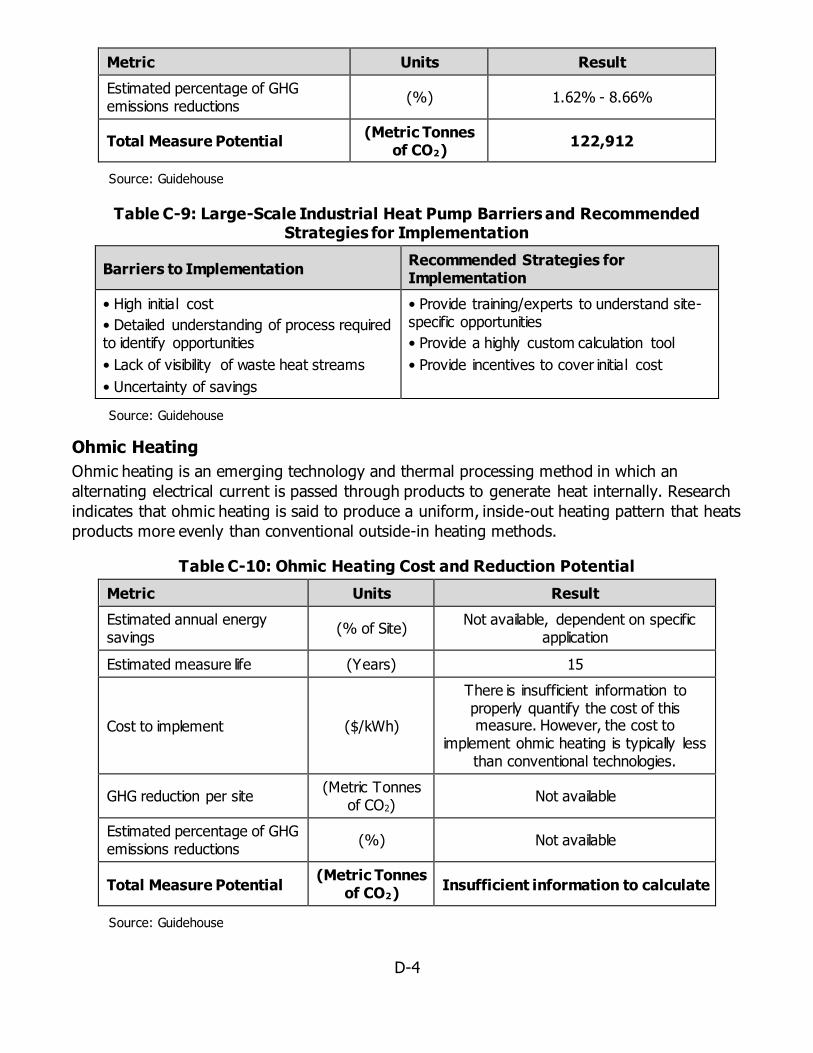
D-4
Metric Units Result
Estimated percentage of GHG emissions reductions
(%) 1.62% - 8.66%
Total Measure Potential (Metric Tonnes
of CO2) 122,912
Source: Guidehouse
Table C-9: Large-Scale Industrial Heat Pump Barriers and Recommended Strategies for Implementation
Barriers to Implementation Recommended Strategies for Implementation
• High initial cost
• Detailed understanding of process required to identify opportunities
• Lack of visibility of waste heat streams
• Uncertainty of savings
• Provide training/experts to understand site-specific opportunities
• Provide a highly custom calculation tool
• Provide incentives to cover initial cost
Source: Guidehouse
Ohmic Heating
Ohmic heating is an emerging technology and thermal processing method in which an
alternating electrical current is passed through products to generate heat internally. Research
indicates that ohmic heating is said to produce a uniform, inside-out heating pattern that heats
products more evenly than conventional outside-in heating methods.
Table C-10: Ohmic Heating Cost and Reduction Potential
Metric Units Result
Estimated annual energy savings
(% of Site) Not available, dependent on specific
application
Estimated measure life (Years) 15
Cost to implement ($/kWh)
There is insufficient information to properly quantify the cost of this measure. However, the cost to
implement ohmic heating is typically less than conventional technologies.
GHG reduction per site (Metric Tonnes
of CO2) Not available
Estimated percentage of GHG emissions reductions
(%) Not available
Total Measure Potential (Metric Tonnes
of CO2) Insufficient information to calculate
Source: Guidehouse

D-5
Table C-11: Ohmic Heating Barriers and Recommended Strategies for Implementation
Barriers to Implementation Recommended Strategies for Implementation
• Lack of in-use data/best practices for industrial application
• Potential difficulty in monitoring and control of unit
• Complex coupling between temperature and electrical filed distribution
• Pilot units in field to develop data, best practices, and confidence in technology
• Develop predictive, determinable, and reliable models of ohmic heating patterns
• Develop a reliable feedback control system to adjust the supply power according to the conductivity change in the process stream
Source: Guidehouse
Induction Heating of Liquids
Induction heaters are an established technology that work by dissipating the energy generated
when the secondary winding of a transformer is short-circuited, which instantly imparts heat to
liquid circulating in a coil around the transformer core.
Table C-12: Induction Heating of Liquids Cost and Reduction Potential
Metric Units Result
Estimated annual energy savings (% of Site)
80%–90% more efficient than a conventional gas fired heater and 15%–20% more efficient than an electric coil heater.
Estimated measure life (Years) 20
Cost to implement ($/kWh) There is insufficient information to properly quantify the cost of
this measure.
GHG reduction per site (Metric Tonnes of
CO2) Not available
Estimated percentage of GHG emissions reductions
(%) Not available
Total Measure Potential (Metric Tonnes
of CO2) Insufficient information to
calculate
Source: Guidehouse

D-6
Table C-13: Induction Heating of Liquids Barriers and Recommended Strategies for Implementation
Barriers to Implementation Recommended Strategies for Implementation
• High capital cost
• Applicable only to heating relatively simple shapes
• Relatively complex peripheral equipment requirements required for operation (impedance matching network, water cooling systems, control electronics)
• Pilot units in field to develop data, best practices, and confidence in technology
• Provide rebate program to overcome initial high capital cost of nascent technology
Source: Guidehouse
Gas Boiler vs. Electric Boilers
Many industrial processes are dominated by high-temperature procedures and typically use
gas boilers to provide the necessary energy to meet operational needs. In some instances, an
electric boiler could meet gas boiler capacity and temperature requirements. Replacing a gas
boiler with an electric boiler would require higher operating costs and larger equipment to
meet the process requirements. The barriers for electric boilers to meet these requirements
are mostly based on energy costs. Table C-14 lists an example of the costs.
Table C-14: Relative Comparison of Electric vs. Gas Boiler
Component Gas Electric
Capacity requirements 50 therms 50 therms x 29.3
kWh/therm = 1,465 kWh
Boiler efficiency 80% 99%
Energy cost $1/therm $0.20/kWh
Monthly energy cost $50 $193
Source: Guidehouse analysis; for energy costs: PG&E Electric Schedule A-15 and PG&E Gas Schedule G-
NR2
Customers would pay an increase of around four times as much per month if they switched
from a gas boiler to an electric boiler. Although an electric boiler is more efficient, the cost of
gas per unit of energy is less than that of electricity. This cost may change. Electric boilers and
gas boilers are priced similarly; however, electric boilers have lower installation costs for new
properties because the cost of providing electric service to an electric boiler is less than
installing gas service. Electric boilers are quieter to run and require less maintenance because
of an absence of mechanical parts. The decision to pursue electric boilers will depend largely
on the cost of electricity from renewable sources and the potential to leverage oversupply
conditions and thermal storage opportunities.

D-7
Steam Turbine Drive vs. Electric Motor Drive
Machine drives are typically used for direct or indirect product movement, the requirements for
which vary widely across the industry. As such, the choice of motor is closely tied to the
desired application. Steam-turbine motors are driven primarily by steam generated with
carbon fuel combustion, while electric motors are driven by electricity generated from the grid
or local generation. Steam-driven turbines, typically pumps, are used for specific applications
such as pumping material of varying viscosity. In most cases, the applications limit the
replacement of these steam-driven turbines with electric motors, so Guidehouse decided to not
pursue this measure.
Table C-15: Steam Turbine vs. Electric Motor
Component Steam Turbine Electric Motor
Power output Typically capable of higher-output
power than an electric motor. Typically capable of lower-
output power than a steam turbine drive.
Variable speed capability
Capable of variable speed but typically with a lower range of variability than electric variable-frequency drives and at high cost to efficiency.
Capable of robust and responsive variability in speed using a variable-frequency drive with some sacrifices in torque with changing speed.
Initial capital cost Comparatively high capital cost
reliant on source of steam. Comparatively low capital cost.
Operating cost Continued operating costs via fuel
procurement for heat production. Continued operating cost via
electricity costs.
Source: Guidehouse
Solar Air Heating Convection via heated air has long been used in industry drying processes. Air is heated for
this process using primarily carbon fuels. Solar air heating uses heat from the sun rather than
carbon fuels to heat air that then is used to dry foods via convection. This technology is used
primarily for food product preservation.187,188
Table C-16: Solar Air Heating vs. Gas Heating
Component Conventional Technology Solar Air Heating
Product Quality Drying is even and continuous Drying is even but only capable
during sunlight hours (discontinuous)
187 Eswara, Amruta R., and M. Ramakrishnarao. “Solar Energy in Food Processing — A Critical Appraisal.” Journal of Food Science and Technology, vol. 50, no. 2, June 2012, pp. 209–227., doi:10.1007/s13197-012-0739-3.
188 Aravindh, M. A., and A. Sreekumar. “Solar Drying — A Sustainable Way of Food Processing.” Sustainability Through Green Energy Green Energy and Technology, 2015, pp. 27–46., doi:10.1007/978-81-322-2337-5_2.189
UV disinfection is a common technology used in advanced recycled water treatment plants in California.

D-8
Component Conventional Technology Solar Air Heating
Initial Capital Cost High initial cost of equipment High initial cost of equipment
Operating Cost Continued operating costs via fuel
procurement for heat production No operating cost for heat
production
Other
Higher drying temperatures lead to more complete drying and therefore longer shelf life
Can be easily adopted into carbon fuel systems.
Source: Guidehouse
UV Pasteurization
Sterilization requirements in the food processing industry are typically rigorous internationally.
These requirements have historically been achieved using thermal heating of food using
carbon fuels. Sterilization/pasteurization using UV light189 provides an opportunity in industrial
processing to reduce the use of carbon fuels, improve the quality of processed goods, and
increase the magnitude of sterilization in a given process.
UV pasteurization is most applicable to the dairy, juice, and beverage industries but also has
potential application for controlling contamination in meats and egg shells. Many applications
are still being tested and validated industrywide, but the low capital and operating cost of the
technology, as well as superior resulting food product, make it an attractive emerging
technology in the industry. Table C-17 tabulates further comparison between the conventional
technology and UV pasteurization.190
Table C-17: UV Pasteurization vs. Conventional Technology
Component Conventional Technology UV Pasteurization
Product quality Some degradation of products Minimal collateral effect on
products
Initial capital cost
High initial cost of equipment Medium initial capital cost
Operating cost Continued operating costs via
fuel procurement for heat production
Lower electricity cost with high energy efficiency
189 UV disinfection is a common technology used in advanced recycled water treatment plants in California.
190 Choudhary, Ruplal, and Srinivasarao Bandla. “Ultraviolet Pasteurization for Food Industry.” International Journal of Food Science and Nutrition Engineering, vol. 2, no. 1, Jan. 2012, pp. 12–15.,
doi:10.5923/j.food.20120201.03.

D-9
Component Conventional Technology UV Pasteurization
Other Robust operating ability
Short processing time
Reliability for different food products to be established
Certain products and process may not be applicable to UV such as pasteurizing cans or canned food
Source: Neetoo, Hudaa, and Haiqiang Chen. “Alternative Food Processing Technologies.” Food Processing,
Nov. 2014, pp. 137–169., doi:10.1002/9781118846315.ch7.
Ozone Cleaning Ozone cleaning is another sterilization technique that could be used to replace traditional
thermal sterilization in food processing. The technology uses UV radiation and corona
discharge methods to generate ozone, which is subsequently used as a strong oxidant and
potent disinfecting agent.
Ozone cleaning has been used in bottled water processing and has potential application in
food surface hygiene and fruit, vegetable, meat, and seafood processing. Table C-18 tabulates
further comparison between the conventional technology and ozone cleaning.191
Table C-18: Ozone Cleaning vs. Conventional Technology
Component Conventional Technology Ozone Cleaning
Food Product Quality
Some degradation of products Reduced weight loss and
spoilage of plant products
Initial Capital Cost High initial cost of equipment High initial capital cost
Operating Cost Continued operating costs via
fuel procurement for heat production
Lower electricity cost with high energy efficiency
Continued cost to produce and store ozone (relatively high due to toxicity)
Other Robust operating ability
Short contact time
No hazardous residues in treatment medium
Reliability for different food products to be established
Source: Guidehouse
191 Guzel-Seydim, Zeynep B. January 14, 2004. “Use of Ozone in the Food Industry.” LWT - Food Science and Technology, Academic Press.

E-1
APPENDIX D: Building Climate Zone to Forecasting Climate
Zone
To support statewide locational planning, the team provided the CEC with factors to break
down IOU service territory consumption into the CEC’s forecasting climate zones (FCZs).192
The CEC’s FCZs are used in the IEPR and differ from the building climate zones (BCZs) used in
the Database for Energy-Efficient Resources and Title 24 analysis. Both sets of zones are
illustrated in Figure D-1, and an overlap map is illustrated in Figure D-2. As shown in Figure D-
2, no direct relationship exists between the two systems — each FCZ consists of multiple BCZs
and vice versa.
Figure D-1: California Forecasting and Building Climate Zones
This figure shows the FCZ map on the left and BCZ map on the right. There is some overlap of
the building and forecast climate zones. The T&D planning is grouped into FCZs, whereas
climate impacts on building energy consumption define the geography for the BCZs.
Source: CEC. Building Climate Zones.
192 The research team recognizes locational planning often entails more detailed granularity than climate zones.
Climate zones are the most detailed level of granularity the Potential and Goals study produces due to its scope.

E-2
Figure D-2: California Forecasting and Building Climate Zone Overlap
This figure shows the overlap between the FCZs and BCZs.
Source: CEC. Energy Code Data: Maps
The Potential and Goals model operates using BCZs. The research team conducted analysis to
estimate savings at the BCZ level and then translated the findings from BCZs to FCZs before
delivering the data.
Outputs varying by BCZ are a function of key input data, building stock and unit energy
savings. BCZ variation in building stock comes from the CEC’s Demand Analysis Office (further
discussed in Section 3.1.2 of the 2019 Potential and Goals Study report193). Because savings
data are sourced from Database for Energy-Efficient Resources and IOU workpapers, they vary
by BCZ (aligning like climate conditions geographically), not by FCZ. Furthermore, not all unit
energy savings values vary by BCZ, as Table D-1 shows.
193 Navigant Consulting, Inc. July 2019. 2019 Energy Efficiency Potential and Goals Study, California Public
Utilities Commission.

E-3
Table D-1: Climate Zone Variation for Unit Energy Savings
Sector End Use Unit Energy Savings Varies by BCZ
Commercial Appliances/Plug Loads Only for freezer and pool cover
Commercial Building Envelope Yes
Commercial Com. Refrigeration Yes
Commercial Data Center No
Commercial Food Service No
Commercial HVAC Yes
Commercial Lighting No
Commercial Water Heating Yes
Commercial Whole Building Only for code and zero net energy measures
Residential Appliances/Plug Loads Only for refrigerators/freezers and pool pumps
Residential Building Envelope Yes
Residential HVAC Yes
Residential Lighting No
Residential Water Heating Yes194
Residential Whole Building Only for code and zero net energy measures
Agriculture All No
Industrial All No
Source: Guidehouse
To generate disaggregation percentages by FCZ, the research team followed a two-step
process. First, the 2019 Potential and Goals team modified the model to run at the BCZ level.
As published, the 2019 Potential and Goals model contains IOU-wide average savings values
for all weather-sensitive measures. The analysis team calculated the average savings values by
weighting unit energy savings by the building stock in each BCZ. As a result, the IOU-wide
average tends to represent the largest BCZs by population. For the AAEE analysis, the
research team reimported measure input data at the BCZ level (before the weighted averaging
exercise) to run the model at the BCZ level instead of the aggregate IOU level.
The research team ran the model for weather-sensitive end uses (listed above in Table D-1)
for AAEE Scenario 3 to produce results that show the percentage distribution of savings for
each sector and end-use combination across the BCZs within an IOU territory. Savings
disaggregation factors for nonweather-sensitive measures match the BCZ building stock
distributions.
194 With the exception of drain water heat recovery and water heating controls, all water heating measures are
weather sensitive.

E-4
The second step was to translate these disaggregation factors from BCZ to FCZ. To do this,
the research team mapped IOU customer energy use data at the sector and ZIP code level.
Each ZIP code and the corresponding consumption from the IOUs195 were mapped to the
appropriate BCZs and FCZs based on CEC energy maps196 and data obtained from the CEC.197
Each ZIP code corresponds only to a maximum of one BCZ and one FCZ. Some ZIP codes in
the IOU datasets did not map to any BCZs or FCZs based on the CEC data. The analysis team
proportionally redistributed consumption from these ZIP codes to the other zones within the
IOU. From this combined dataset (IOU, sector, ZIP code, BCZ, FCZ, consumption), the team
developed tables representing the proportion of consumption from a BCZ that falls within each
FCZ.
Table D-2 through Table D-17 show these percentages for residential and commercial and
electric and gas. The tables that show FCZ by IOU territory only are normalized such that the
translation percentages within each BCZ and IOU sum up to 100 percent. While drafting these
tables, the research team noticed that data for commercial gas within BCZs 14 to 16 were
vastly different from what was observed in the residential sector for the same BCZs. Digging
into the data, the team observed that many of the ZIP codes in the IOU datasets mapping to
these BCZs were missing data. These missing data were likely due to data reporting policies
set by the CPUC.198 As a result, the research team assumed commercial gas disaggregation
factors are the same as residential for BCZs 14 to 16.
195 Quarterly Customer Data Reports available on IOU websites. The research team analyzed values for 2017.
196 Source: CEC’s California energy maps
197 Chris Kavelec. September 5, 2019. Personal communication.
198 “Customer Confidentiality: The IOUs are authorized to provide aggregated usage data to the extent
customer confidentiality is not compromised. The “15/15 Rule” was adopted by the CPUC in the Direct Access
Proceeding (CPUC Decision 97-10-031) to protect customer confidentiality. The 15/15 Rule requires that any
aggregated information provided by the IOUs without customer written authorization must be made up of at least
15 customers and a single customer’s load must be less than 15 percent of an aggregated category. If the
number of customers in any one group falls below 15, or if a single customer’s load accounts for more than 15
percent of the total group data, data must be further aggregated before the information is released. If the 15/15
Rule is triggered for a second time after the data has been screened once already using the 15/15 Rule, the Rule
further requires that the customer be dropped from the aggregated data. The 15/15 Rule ensures that the
identities of larger customers are protected from disclosure.” California Public Utilities Commission, October 1997,
CPUC Decision 97-10-031.
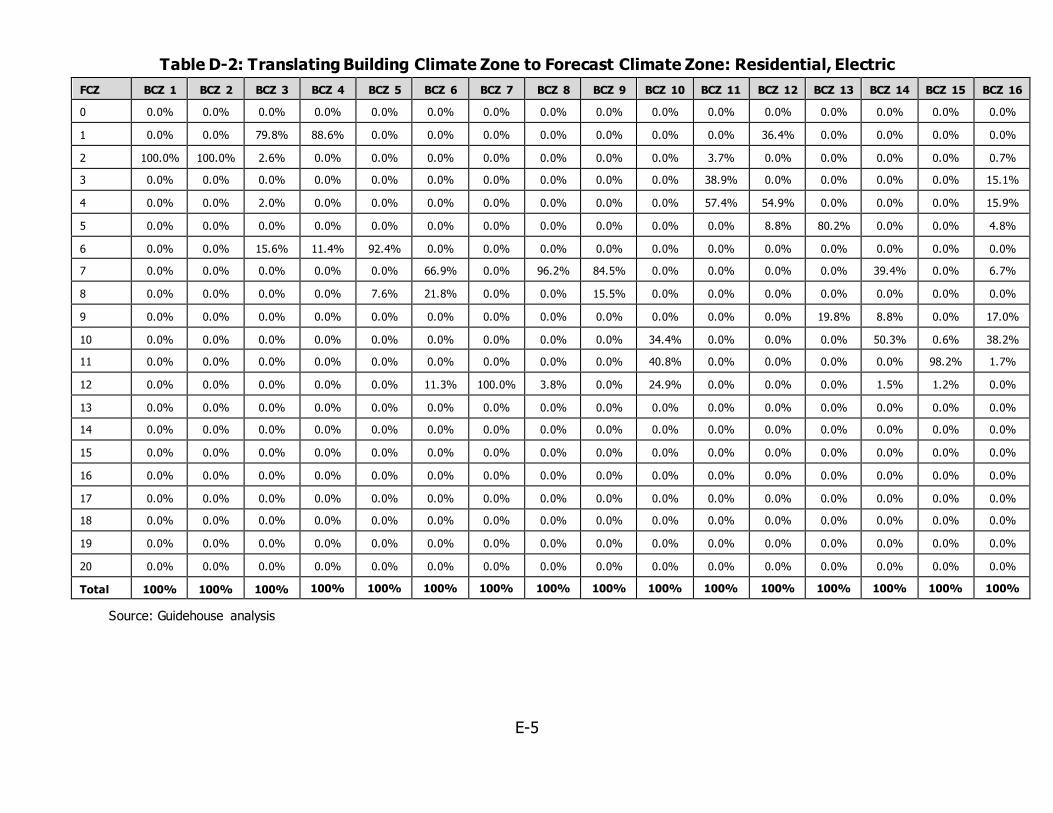
E-5
Table D-2: Translating Building Climate Zone to Forecast Climate Zone: Residential, Electric
FCZ BCZ 1 BCZ 2 BCZ 3 BCZ 4 BCZ 5 BCZ 6 BCZ 7 BCZ 8 BCZ 9 BCZ 10 BCZ 11 BCZ 12 BCZ 13 BCZ 14 BCZ 15 BCZ 16
0 0.0% 0.0% 0.0% 0.0% 0.0% 0.0% 0.0% 0.0% 0.0% 0.0% 0.0% 0.0% 0.0% 0.0% 0.0% 0.0%
1 0.0% 0.0% 79.8% 88.6% 0.0% 0.0% 0.0% 0.0% 0.0% 0.0% 0.0% 36.4% 0.0% 0.0% 0.0% 0.0%
2 100.0% 100.0% 2.6% 0.0% 0.0% 0.0% 0.0% 0.0% 0.0% 0.0% 3.7% 0.0% 0.0% 0.0% 0.0% 0.7%
3 0.0% 0.0% 0.0% 0.0% 0.0% 0.0% 0.0% 0.0% 0.0% 0.0% 38.9% 0.0% 0.0% 0.0% 0.0% 15.1%
4 0.0% 0.0% 2.0% 0.0% 0.0% 0.0% 0.0% 0.0% 0.0% 0.0% 57.4% 54.9% 0.0% 0.0% 0.0% 15.9%
5 0.0% 0.0% 0.0% 0.0% 0.0% 0.0% 0.0% 0.0% 0.0% 0.0% 0.0% 8.8% 80.2% 0.0% 0.0% 4.8%
6 0.0% 0.0% 15.6% 11.4% 92.4% 0.0% 0.0% 0.0% 0.0% 0.0% 0.0% 0.0% 0.0% 0.0% 0.0% 0.0%
7 0.0% 0.0% 0.0% 0.0% 0.0% 66.9% 0.0% 96.2% 84.5% 0.0% 0.0% 0.0% 0.0% 39.4% 0.0% 6.7%
8 0.0% 0.0% 0.0% 0.0% 7.6% 21.8% 0.0% 0.0% 15.5% 0.0% 0.0% 0.0% 0.0% 0.0% 0.0% 0.0%
9 0.0% 0.0% 0.0% 0.0% 0.0% 0.0% 0.0% 0.0% 0.0% 0.0% 0.0% 0.0% 19.8% 8.8% 0.0% 17.0%
10 0.0% 0.0% 0.0% 0.0% 0.0% 0.0% 0.0% 0.0% 0.0% 34.4% 0.0% 0.0% 0.0% 50.3% 0.6% 38.2%
11 0.0% 0.0% 0.0% 0.0% 0.0% 0.0% 0.0% 0.0% 0.0% 40.8% 0.0% 0.0% 0.0% 0.0% 98.2% 1.7%
12 0.0% 0.0% 0.0% 0.0% 0.0% 11.3% 100.0% 3.8% 0.0% 24.9% 0.0% 0.0% 0.0% 1.5% 1.2% 0.0%
13 0.0% 0.0% 0.0% 0.0% 0.0% 0.0% 0.0% 0.0% 0.0% 0.0% 0.0% 0.0% 0.0% 0.0% 0.0% 0.0%
14 0.0% 0.0% 0.0% 0.0% 0.0% 0.0% 0.0% 0.0% 0.0% 0.0% 0.0% 0.0% 0.0% 0.0% 0.0% 0.0%
15 0.0% 0.0% 0.0% 0.0% 0.0% 0.0% 0.0% 0.0% 0.0% 0.0% 0.0% 0.0% 0.0% 0.0% 0.0% 0.0%
16 0.0% 0.0% 0.0% 0.0% 0.0% 0.0% 0.0% 0.0% 0.0% 0.0% 0.0% 0.0% 0.0% 0.0% 0.0% 0.0%
17 0.0% 0.0% 0.0% 0.0% 0.0% 0.0% 0.0% 0.0% 0.0% 0.0% 0.0% 0.0% 0.0% 0.0% 0.0% 0.0%
18 0.0% 0.0% 0.0% 0.0% 0.0% 0.0% 0.0% 0.0% 0.0% 0.0% 0.0% 0.0% 0.0% 0.0% 0.0% 0.0%
19 0.0% 0.0% 0.0% 0.0% 0.0% 0.0% 0.0% 0.0% 0.0% 0.0% 0.0% 0.0% 0.0% 0.0% 0.0% 0.0%
20 0.0% 0.0% 0.0% 0.0% 0.0% 0.0% 0.0% 0.0% 0.0% 0.0% 0.0% 0.0% 0.0% 0.0% 0.0% 0.0%
Total 100% 100% 100% 100% 100% 100% 100% 100% 100% 100% 100% 100% 100% 100% 100% 100%
Source: Guidehouse analysis

E-6
Table D-3: Translating Building Climate Zone to Forecast Climate Zone: Residential, Electric – PG&E Territory Only
FCZ BCZ 1 BCZ 2 BCZ 3 BCZ 4 BCZ 5 BCZ 6 BCZ 7 BCZ 8 BCZ 9 BCZ 10 BCZ 11 BCZ 12 BCZ 13 BCZ 14 BCZ 15 BCZ 16
1 0% 0% 80% 89% 0% 0% 0% 0% 0% 0% 0% 36% 0% 0% 0% 0%
2 100% 100% 3% 0% 0% 0% 0% 0% 0% 0% 4% 0% 0% 0% 0% 2%
3 0% 0% 0% 0% 0% 0% 0% 0% 0% 0% 39% 0% 0% 0% 0% 41%
4 0% 0% 2% 0% 0% 0% 0% 0% 0% 0% 57% 55% 0% 0% 0% 43%
5 0% 0% 0% 0% 0% 0% 0% 0% 0% 0% 0% 9% 100% 0% 0% 13%
6 0% 0% 16% 11% 100% 0% 0% 0% 0% 0% 0% 0% 0% 0% 0% 0%
Total 100% 100% 100% 100% 100% 0% 0% 0% 0% 0% 100% 100% 100% 0% 0% 100%
Source: Guidehouse analysis
Table D-4: Translating Building Climate Zone to Forecast Climate Zone: Residential, Electric – SCE Territory Only
FCZ BCZ 1 BCZ 2 BCZ 3 BCZ 4 BCZ 5 BCZ 6 BCZ 7 BCZ 8 BCZ 9 BCZ 10 BCZ 11 BCZ 12 BCZ 13 BCZ 14 BCZ 15 BCZ 16
7 0% 0% 0% 0% 0% 75% 0% 100% 84% 0% 0% 0% 0% 40% 0% 11%
8 0% 0% 0% 0% 100% 25% 0% 0% 16% 0% 0% 0% 0% 0% 0% 0%
9 0% 0% 0% 0% 0% 0% 0% 0% 0% 0% 0% 0% 100% 9% 0% 27%
10 0% 0% 0% 0% 0% 0% 0% 0% 0% 46% 0% 0% 0% 51% 1% 60%
11 0% 0% 0% 0% 0% 0% 0% 0% 0% 54% 0% 0% 0% 0% 99% 3%
Total 0% 0% 0% 0% 100% 100% 0% 100% 100% 100% 0% 0% 100% 100% 100% 100%
Source: Guidehouse analysis
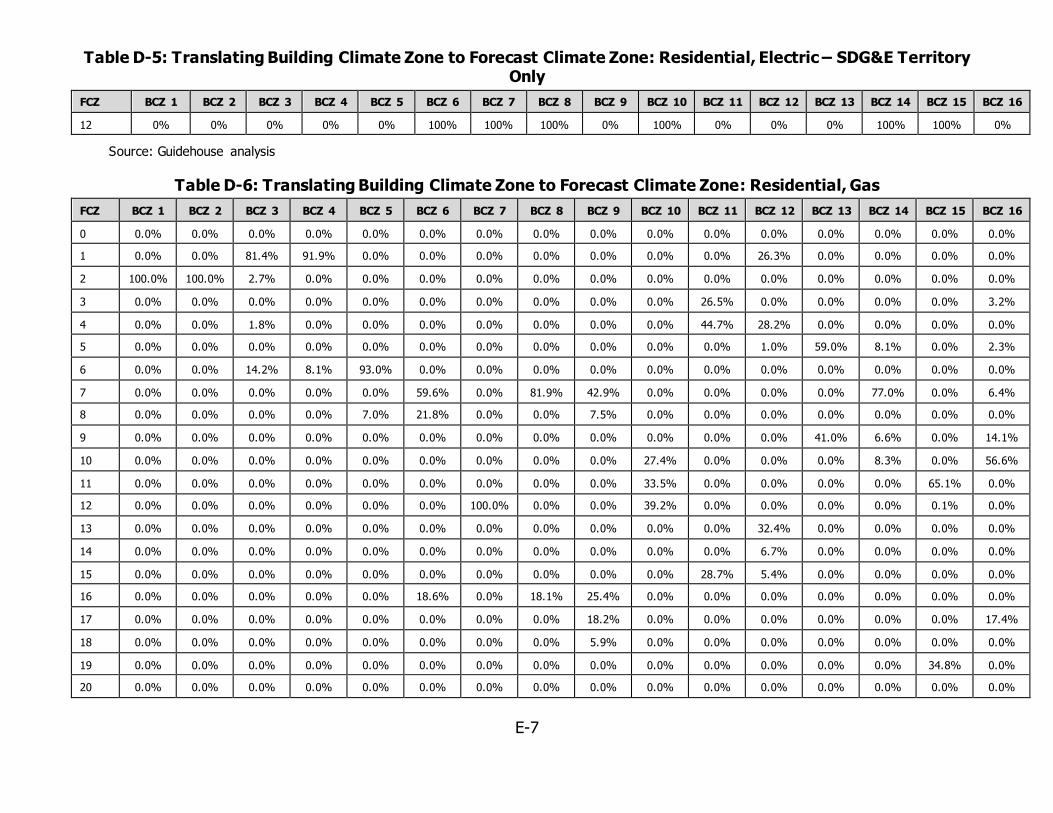
E-7
Table D-5: Translating Building Climate Zone to Forecast Climate Zone: Residential, Electric – SDG&E Territory Only
FCZ BCZ 1 BCZ 2 BCZ 3 BCZ 4 BCZ 5 BCZ 6 BCZ 7 BCZ 8 BCZ 9 BCZ 10 BCZ 11 BCZ 12 BCZ 13 BCZ 14 BCZ 15 BCZ 16
12 0% 0% 0% 0% 0% 100% 100% 100% 0% 100% 0% 0% 0% 100% 100% 0%
Source: Guidehouse analysis
Table D-6: Translating Building Climate Zone to Forecast Climate Zone: Residential, Gas
FCZ BCZ 1 BCZ 2 BCZ 3 BCZ 4 BCZ 5 BCZ 6 BCZ 7 BCZ 8 BCZ 9 BCZ 10 BCZ 11 BCZ 12 BCZ 13 BCZ 14 BCZ 15 BCZ 16
0 0.0% 0.0% 0.0% 0.0% 0.0% 0.0% 0.0% 0.0% 0.0% 0.0% 0.0% 0.0% 0.0% 0.0% 0.0% 0.0%
1 0.0% 0.0% 81.4% 91.9% 0.0% 0.0% 0.0% 0.0% 0.0% 0.0% 0.0% 26.3% 0.0% 0.0% 0.0% 0.0%
2 100.0% 100.0% 2.7% 0.0% 0.0% 0.0% 0.0% 0.0% 0.0% 0.0% 0.0% 0.0% 0.0% 0.0% 0.0% 0.0%
3 0.0% 0.0% 0.0% 0.0% 0.0% 0.0% 0.0% 0.0% 0.0% 0.0% 26.5% 0.0% 0.0% 0.0% 0.0% 3.2%
4 0.0% 0.0% 1.8% 0.0% 0.0% 0.0% 0.0% 0.0% 0.0% 0.0% 44.7% 28.2% 0.0% 0.0% 0.0% 0.0%
5 0.0% 0.0% 0.0% 0.0% 0.0% 0.0% 0.0% 0.0% 0.0% 0.0% 0.0% 1.0% 59.0% 8.1% 0.0% 2.3%
6 0.0% 0.0% 14.2% 8.1% 93.0% 0.0% 0.0% 0.0% 0.0% 0.0% 0.0% 0.0% 0.0% 0.0% 0.0% 0.0%
7 0.0% 0.0% 0.0% 0.0% 0.0% 59.6% 0.0% 81.9% 42.9% 0.0% 0.0% 0.0% 0.0% 77.0% 0.0% 6.4%
8 0.0% 0.0% 0.0% 0.0% 7.0% 21.8% 0.0% 0.0% 7.5% 0.0% 0.0% 0.0% 0.0% 0.0% 0.0% 0.0%
9 0.0% 0.0% 0.0% 0.0% 0.0% 0.0% 0.0% 0.0% 0.0% 0.0% 0.0% 0.0% 41.0% 6.6% 0.0% 14.1%
10 0.0% 0.0% 0.0% 0.0% 0.0% 0.0% 0.0% 0.0% 0.0% 27.4% 0.0% 0.0% 0.0% 8.3% 0.0% 56.6%
11 0.0% 0.0% 0.0% 0.0% 0.0% 0.0% 0.0% 0.0% 0.0% 33.5% 0.0% 0.0% 0.0% 0.0% 65.1% 0.0%
12 0.0% 0.0% 0.0% 0.0% 0.0% 0.0% 100.0% 0.0% 0.0% 39.2% 0.0% 0.0% 0.0% 0.0% 0.1% 0.0%
13 0.0% 0.0% 0.0% 0.0% 0.0% 0.0% 0.0% 0.0% 0.0% 0.0% 0.0% 32.4% 0.0% 0.0% 0.0% 0.0%
14 0.0% 0.0% 0.0% 0.0% 0.0% 0.0% 0.0% 0.0% 0.0% 0.0% 0.0% 6.7% 0.0% 0.0% 0.0% 0.0%
15 0.0% 0.0% 0.0% 0.0% 0.0% 0.0% 0.0% 0.0% 0.0% 0.0% 28.7% 5.4% 0.0% 0.0% 0.0% 0.0%
16 0.0% 0.0% 0.0% 0.0% 0.0% 18.6% 0.0% 18.1% 25.4% 0.0% 0.0% 0.0% 0.0% 0.0% 0.0% 0.0%
17 0.0% 0.0% 0.0% 0.0% 0.0% 0.0% 0.0% 0.0% 18.2% 0.0% 0.0% 0.0% 0.0% 0.0% 0.0% 17.4%
18 0.0% 0.0% 0.0% 0.0% 0.0% 0.0% 0.0% 0.0% 5.9% 0.0% 0.0% 0.0% 0.0% 0.0% 0.0% 0.0%
19 0.0% 0.0% 0.0% 0.0% 0.0% 0.0% 0.0% 0.0% 0.0% 0.0% 0.0% 0.0% 0.0% 0.0% 34.8% 0.0%
20 0.0% 0.0% 0.0% 0.0% 0.0% 0.0% 0.0% 0.0% 0.0% 0.0% 0.0% 0.0% 0.0% 0.0% 0.0% 0.0%
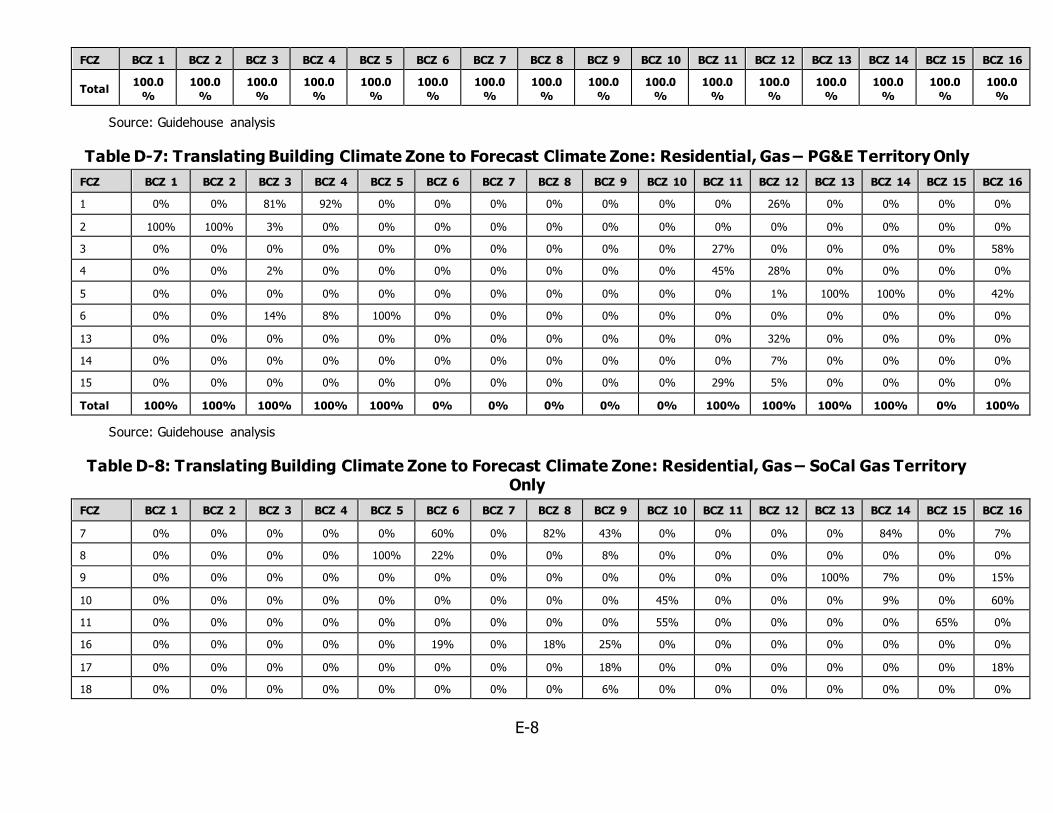
E-8
FCZ BCZ 1 BCZ 2 BCZ 3 BCZ 4 BCZ 5 BCZ 6 BCZ 7 BCZ 8 BCZ 9 BCZ 10 BCZ 11 BCZ 12 BCZ 13 BCZ 14 BCZ 15 BCZ 16
Total 100.0
%
100.0
%
100.0
%
100.0
%
100.0
%
100.0
%
100.0
%
100.0
%
100.0
%
100.0
%
100.0
%
100.0
%
100.0
%
100.0
%
100.0
%
100.0
%
Source: Guidehouse analysis
Table D-7: Translating Building Climate Zone to Forecast Climate Zone: Residential, Gas – PG&E Territory Only
FCZ BCZ 1 BCZ 2 BCZ 3 BCZ 4 BCZ 5 BCZ 6 BCZ 7 BCZ 8 BCZ 9 BCZ 10 BCZ 11 BCZ 12 BCZ 13 BCZ 14 BCZ 15 BCZ 16
1 0% 0% 81% 92% 0% 0% 0% 0% 0% 0% 0% 26% 0% 0% 0% 0%
2 100% 100% 3% 0% 0% 0% 0% 0% 0% 0% 0% 0% 0% 0% 0% 0%
3 0% 0% 0% 0% 0% 0% 0% 0% 0% 0% 27% 0% 0% 0% 0% 58%
4 0% 0% 2% 0% 0% 0% 0% 0% 0% 0% 45% 28% 0% 0% 0% 0%
5 0% 0% 0% 0% 0% 0% 0% 0% 0% 0% 0% 1% 100% 100% 0% 42%
6 0% 0% 14% 8% 100% 0% 0% 0% 0% 0% 0% 0% 0% 0% 0% 0%
13 0% 0% 0% 0% 0% 0% 0% 0% 0% 0% 0% 32% 0% 0% 0% 0%
14 0% 0% 0% 0% 0% 0% 0% 0% 0% 0% 0% 7% 0% 0% 0% 0%
15 0% 0% 0% 0% 0% 0% 0% 0% 0% 0% 29% 5% 0% 0% 0% 0%
Total 100% 100% 100% 100% 100% 0% 0% 0% 0% 0% 100% 100% 100% 100% 0% 100%
Source: Guidehouse analysis
Table D-8: Translating Building Climate Zone to Forecast Climate Zone: Residential, Gas – SoCal Gas Territory Only
FCZ BCZ 1 BCZ 2 BCZ 3 BCZ 4 BCZ 5 BCZ 6 BCZ 7 BCZ 8 BCZ 9 BCZ 10 BCZ 11 BCZ 12 BCZ 13 BCZ 14 BCZ 15 BCZ 16
7 0% 0% 0% 0% 0% 60% 0% 82% 43% 0% 0% 0% 0% 84% 0% 7%
8 0% 0% 0% 0% 100% 22% 0% 0% 8% 0% 0% 0% 0% 0% 0% 0%
9 0% 0% 0% 0% 0% 0% 0% 0% 0% 0% 0% 0% 100% 7% 0% 15%
10 0% 0% 0% 0% 0% 0% 0% 0% 0% 45% 0% 0% 0% 9% 0% 60%
11 0% 0% 0% 0% 0% 0% 0% 0% 0% 55% 0% 0% 0% 0% 65% 0%
16 0% 0% 0% 0% 0% 19% 0% 18% 25% 0% 0% 0% 0% 0% 0% 0%
17 0% 0% 0% 0% 0% 0% 0% 0% 18% 0% 0% 0% 0% 0% 0% 18%
18 0% 0% 0% 0% 0% 0% 0% 0% 6% 0% 0% 0% 0% 0% 0% 0%

E-9
FCZ BCZ 1 BCZ 2 BCZ 3 BCZ 4 BCZ 5 BCZ 6 BCZ 7 BCZ 8 BCZ 9 BCZ 10 BCZ 11 BCZ 12 BCZ 13 BCZ 14 BCZ 15 BCZ 16
19 0% 0% 0% 0% 0% 0% 0% 0% 0% 0% 0% 0% 0% 0% 35% 0%
20 0% 0% 0% 0% 0% 0% 0% 0% 0% 0% 0% 0% 0% 0% 0% 0%
Total 0% 0% 0% 0% 100% 100% 0% 100% 100% 100% 0% 0% 100% 100% 100% 100%
Source: Guidehouse analysis
Table D-9: Translating Building Climate Zone to Forecast Climate Zone: Residential, Gas – SDG&E Territory Only
FCZ BCZ 1 BCZ 2 BCZ 3 BCZ 4 BCZ 5 BCZ 6 BCZ 7 BCZ 8 BCZ 9 BCZ 10 BCZ 11 BCZ 12 BCZ 13 BCZ 14 BCZ 15 BCZ 16
12 0% 0% 0% 0% 0% 0% 100% 0% 0% 100% 0% 0% 0% 0% 100% 0%
Source: Guidehouse analysis
Table D-10: Translating Building Climate Zone to Forecast Climate Zone: Commercial, Electric
FCZ BCZ 1 BCZ 2 BCZ 3 BCZ 4 BCZ 5 BCZ 6 BCZ 7 BCZ 8 BCZ 9 BCZ 10 BCZ 11 BCZ 12 BCZ 13 BCZ 14 BCZ 15 BCZ 16
0 0.0% 0.0% 0.0% 0.0% 0.0% 0.0% 0.0% 0.0% 0.0% 0.0% 0.0% 0.0% 0.0% 0.0% 0.0% 0.0%
1 0.0% 0.0% 86.8% 93.7% 0.0% 0.0% 0.0% 0.0% 0.0% 0.0% 0.0% 40.7% 0.0% 0.0% 0.0% 0.0%
2 100.0% 100.0% 1.4% 0.0% 0.0% 0.0% 0.0% 0.0% 0.0% 0.0% 0.8% 0.0% 0.0% 0.0% 0.0% 0.0%
3 0.0% 0.0% 0.0% 0.0% 0.0% 0.0% 0.0% 0.0% 0.0% 0.0% 40.7% 0.0% 0.0% 0.0% 0.0% 11.1%
4 0.0% 0.0% 1.3% 0.0% 0.0% 0.0% 0.0% 0.0% 0.0% 0.0% 58.4% 54.8% 0.0% 0.0% 0.0% 11.8%
5 0.0% 0.0% 0.0% 0.0% 0.0% 0.0% 0.0% 0.0% 0.0% 0.0% 0.0% 4.5% 85.0% 0.0% 0.0% 2.6%
6 0.0% 0.0% 10.6% 6.3% 93.5% 0.0% 0.0% 0.0% 0.0% 0.0% 0.0% 0.0% 0.0% 0.0% 0.0% 0.0%
7 0.0% 0.0% 0.0% 0.0% 0.0% 70.6% 0.0% 98.4% 87.9% 0.0% 0.0% 0.0% 0.0% 41.6% 0.0% 2.8%
8 0.0% 0.0% 0.0% 0.0% 6.5% 23.6% 0.0% 0.0% 12.1% 0.0% 0.0% 0.0% 0.0% 0.0% 0.0% 0.0%
9 0.0% 0.0% 0.0% 0.0% 0.0% 0.0% 0.0% 0.0% 0.0% 0.0% 0.0% 0.0% 15.0% 10.1% 0.0% 18.3%
10 0.0% 0.0% 0.0% 0.0% 0.0% 0.0% 0.0% 0.0% 0.0% 43.8% 0.0% 0.0% 0.0% 46.7% 0.0% 49.9%
11 0.0% 0.0% 0.0% 0.0% 0.0% 0.0% 0.0% 0.0% 0.0% 30.4% 0.0% 0.0% 0.0% 0.0% 100.0% 3.4%
12 0.0% 0.0% 0.0% 0.0% 0.0% 5.8% 100.0% 1.6% 0.0% 25.8% 0.0% 0.0% 0.0% 1.7% 0.0% 0.0%
13 0.0% 0.0% 0.0% 0.0% 0.0% 0.0% 0.0% 0.0% 0.0% 0.0% 0.0% 0.0% 0.0% 0.0% 0.0% 0.0%
14 0.0% 0.0% 0.0% 0.0% 0.0% 0.0% 0.0% 0.0% 0.0% 0.0% 0.0% 0.0% 0.0% 0.0% 0.0% 0.0%
15 0.0% 0.0% 0.0% 0.0% 0.0% 0.0% 0.0% 0.0% 0.0% 0.0% 0.0% 0.0% 0.0% 0.0% 0.0% 0.0%
16 0.0% 0.0% 0.0% 0.0% 0.0% 0.0% 0.0% 0.0% 0.0% 0.0% 0.0% 0.0% 0.0% 0.0% 0.0% 0.0%

E-10
FCZ BCZ 1 BCZ 2 BCZ 3 BCZ 4 BCZ 5 BCZ 6 BCZ 7 BCZ 8 BCZ 9 BCZ 10 BCZ 11 BCZ 12 BCZ 13 BCZ 14 BCZ 15 BCZ 16
17 0.0% 0.0% 0.0% 0.0% 0.0% 0.0% 0.0% 0.0% 0.0% 0.0% 0.0% 0.0% 0.0% 0.0% 0.0% 0.0%
18 0.0% 0.0% 0.0% 0.0% 0.0% 0.0% 0.0% 0.0% 0.0% 0.0% 0.0% 0.0% 0.0% 0.0% 0.0% 0.0%
19 0.0% 0.0% 0.0% 0.0% 0.0% 0.0% 0.0% 0.0% 0.0% 0.0% 0.0% 0.0% 0.0% 0.0% 0.0% 0.0%
20 0.0% 0.0% 0.0% 0.0% 0.0% 0.0% 0.0% 0.0% 0.0% 0.0% 0.0% 0.0% 0.0% 0.0% 0.0% 0.0%
Total 100.0
%
100.0
%
100.0
%
100.0
%
100.0
%
100.0
%
100.0
%
100.0
%
100.0
%
100.0
%
100.0
%
100.0
%
100.0
%
100.0
%
100.0
%
100.0
%
Source: Guidehouse analysis
Table D-11: Translating Building Climate Zone to Forecast Climate Zone: Commercial, Electric – PG&E Territory Only
FCZ BCZ 1 BCZ 2 BCZ 3 BCZ 4 BCZ 5 BCZ 6 BCZ 7 BCZ 8 BCZ 9 BCZ 10 BCZ 11 BCZ 12 BCZ 13 BCZ 14 BCZ 15 BCZ 16
1 0% 0% 87% 94% 0% 0% 0% 0% 0% 0% 0% 41% 0% 0% 0% 0%
2 100% 100% 1% 0% 0% 0% 0% 0% 0% 0% 1% 0% 0% 0% 0% 0%
3 0% 0% 0% 0% 0% 0% 0% 0% 0% 0% 41% 0% 0% 0% 0% 43%
4 0% 0% 1% 0% 0% 0% 0% 0% 0% 0% 58% 55% 0% 0% 0% 46%
5 0% 0% 0% 0% 0% 0% 0% 0% 0% 0% 0% 5% 100% 0% 0% 10%
6 0% 0% 11% 6% 100% 0% 0% 0% 0% 0% 0% 0% 0% 0% 0% 0%
Total 100% 100% 100% 100% 100% 0% 0% 0% 0% 0% 100% 100% 100% 0% 0% 100%
Source: Guidehouse analysis

E-11
Table D-12: Translating Building Climate Zone to Forecast Climate Zone: Commercial, Electric – SCE Territory Only
FCZ BCZ 1 BCZ 2 BCZ 3 BCZ 4 BCZ 5 BCZ 6 BCZ 7 BCZ 8 BCZ 9 BCZ 10 BCZ 11 BCZ 12 BCZ 13 BCZ 14 BCZ 15 BCZ 16
7 0% 0% 0% 0% 0% 75% 0% 100% 88% 0% 0% 0% 0% 42% 0% 4%
8 0% 0% 0% 0% 100% 25% 0% 0% 12% 0% 0% 0% 0% 0% 0% 0%
9 0% 0% 0% 0% 0% 0% 0% 0% 0% 0% 0% 0% 100% 10% 0% 25%
10 0% 0% 0% 0% 0% 0% 0% 0% 0% 59% 0% 0% 0% 47% 0% 67%
11 0% 0% 0% 0% 0% 0% 0% 0% 0% 41% 0% 0% 0% 0% 100% 5%
Total 0% 0% 0% 0% 100% 100% 0% 100% 100% 100% 0% 0% 100% 100% 100% 100%
Source: Guidehouse analysis
Table D-13: Translating Building Climate Zone to Forecast Climate Zone: Commercial, Electric – SDG&E Territory Only
FCZ BCZ 1 BCZ 2 BCZ 3 BCZ 4 BCZ 5 BCZ 6 BCZ 7 BCZ 8 BCZ 9 BCZ 10 BCZ 11 BCZ 12 BCZ 13 BCZ 14 BCZ 15 BCZ 16
12 0% 0% 0% 0% 0% 100% 100% 100% 0% 100% 0% 0% 0% 100% 0% 0%
Source: Guidehouse analysis
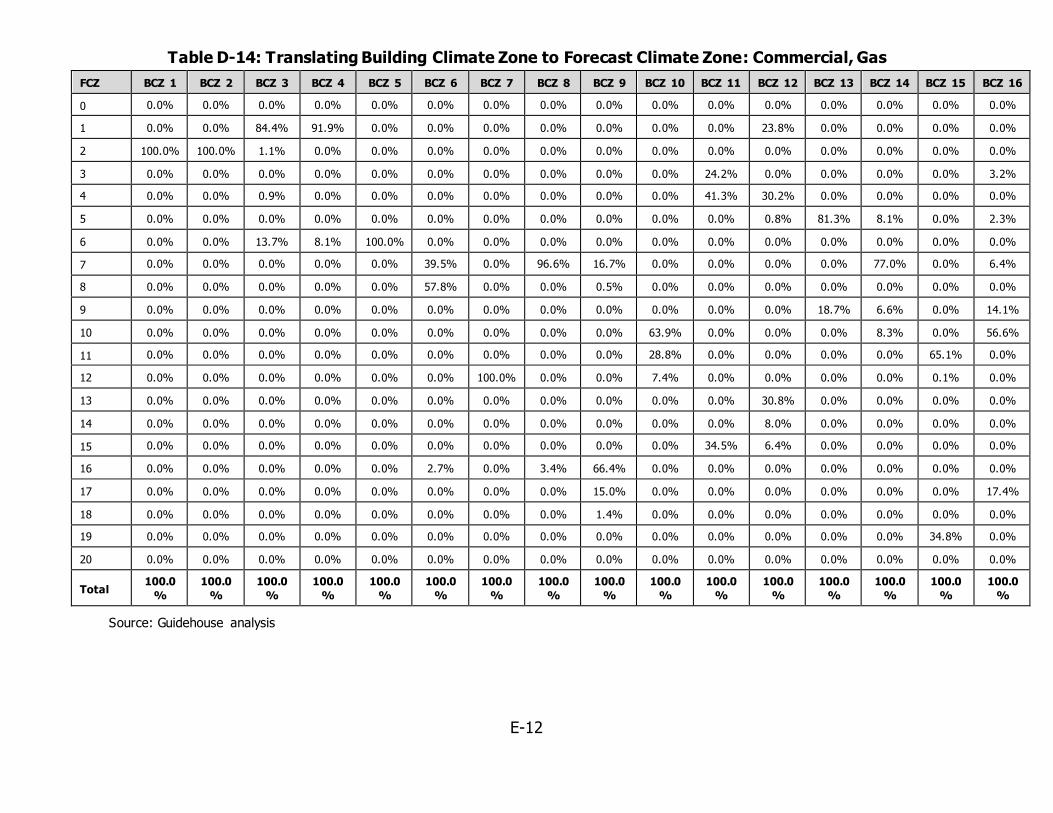
E-12
Table D-14: Translating Building Climate Zone to Forecast Climate Zone: Commercial, Gas
FCZ BCZ 1 BCZ 2 BCZ 3 BCZ 4 BCZ 5 BCZ 6 BCZ 7 BCZ 8 BCZ 9 BCZ 10 BCZ 11 BCZ 12 BCZ 13 BCZ 14 BCZ 15 BCZ 16
0 0.0% 0.0% 0.0% 0.0% 0.0% 0.0% 0.0% 0.0% 0.0% 0.0% 0.0% 0.0% 0.0% 0.0% 0.0% 0.0%
1 0.0% 0.0% 84.4% 91.9% 0.0% 0.0% 0.0% 0.0% 0.0% 0.0% 0.0% 23.8% 0.0% 0.0% 0.0% 0.0%
2 100.0% 100.0% 1.1% 0.0% 0.0% 0.0% 0.0% 0.0% 0.0% 0.0% 0.0% 0.0% 0.0% 0.0% 0.0% 0.0%
3 0.0% 0.0% 0.0% 0.0% 0.0% 0.0% 0.0% 0.0% 0.0% 0.0% 24.2% 0.0% 0.0% 0.0% 0.0% 3.2%
4 0.0% 0.0% 0.9% 0.0% 0.0% 0.0% 0.0% 0.0% 0.0% 0.0% 41.3% 30.2% 0.0% 0.0% 0.0% 0.0%
5 0.0% 0.0% 0.0% 0.0% 0.0% 0.0% 0.0% 0.0% 0.0% 0.0% 0.0% 0.8% 81.3% 8.1% 0.0% 2.3%
6 0.0% 0.0% 13.7% 8.1% 100.0% 0.0% 0.0% 0.0% 0.0% 0.0% 0.0% 0.0% 0.0% 0.0% 0.0% 0.0%
7 0.0% 0.0% 0.0% 0.0% 0.0% 39.5% 0.0% 96.6% 16.7% 0.0% 0.0% 0.0% 0.0% 77.0% 0.0% 6.4%
8 0.0% 0.0% 0.0% 0.0% 0.0% 57.8% 0.0% 0.0% 0.5% 0.0% 0.0% 0.0% 0.0% 0.0% 0.0% 0.0%
9 0.0% 0.0% 0.0% 0.0% 0.0% 0.0% 0.0% 0.0% 0.0% 0.0% 0.0% 0.0% 18.7% 6.6% 0.0% 14.1%
10 0.0% 0.0% 0.0% 0.0% 0.0% 0.0% 0.0% 0.0% 0.0% 63.9% 0.0% 0.0% 0.0% 8.3% 0.0% 56.6%
11 0.0% 0.0% 0.0% 0.0% 0.0% 0.0% 0.0% 0.0% 0.0% 28.8% 0.0% 0.0% 0.0% 0.0% 65.1% 0.0%
12 0.0% 0.0% 0.0% 0.0% 0.0% 0.0% 100.0% 0.0% 0.0% 7.4% 0.0% 0.0% 0.0% 0.0% 0.1% 0.0%
13 0.0% 0.0% 0.0% 0.0% 0.0% 0.0% 0.0% 0.0% 0.0% 0.0% 0.0% 30.8% 0.0% 0.0% 0.0% 0.0%
14 0.0% 0.0% 0.0% 0.0% 0.0% 0.0% 0.0% 0.0% 0.0% 0.0% 0.0% 8.0% 0.0% 0.0% 0.0% 0.0%
15 0.0% 0.0% 0.0% 0.0% 0.0% 0.0% 0.0% 0.0% 0.0% 0.0% 34.5% 6.4% 0.0% 0.0% 0.0% 0.0%
16 0.0% 0.0% 0.0% 0.0% 0.0% 2.7% 0.0% 3.4% 66.4% 0.0% 0.0% 0.0% 0.0% 0.0% 0.0% 0.0%
17 0.0% 0.0% 0.0% 0.0% 0.0% 0.0% 0.0% 0.0% 15.0% 0.0% 0.0% 0.0% 0.0% 0.0% 0.0% 17.4%
18 0.0% 0.0% 0.0% 0.0% 0.0% 0.0% 0.0% 0.0% 1.4% 0.0% 0.0% 0.0% 0.0% 0.0% 0.0% 0.0%
19 0.0% 0.0% 0.0% 0.0% 0.0% 0.0% 0.0% 0.0% 0.0% 0.0% 0.0% 0.0% 0.0% 0.0% 34.8% 0.0%
20 0.0% 0.0% 0.0% 0.0% 0.0% 0.0% 0.0% 0.0% 0.0% 0.0% 0.0% 0.0% 0.0% 0.0% 0.0% 0.0%
Total 100.0
%
100.0
%
100.0
%
100.0
%
100.0
%
100.0
%
100.0
%
100.0
%
100.0
%
100.0
%
100.0
%
100.0
%
100.0
%
100.0
%
100.0
%
100.0
%
Source: Guidehouse analysis

E-13
Table D-15: Translating Building Climate Zone to Forecast Climate Zone: Commercial, Gas – PG&E Territory Only
FCZ BCZ 1 BCZ 2 BCZ 3 BCZ 4 BCZ 5 BCZ 6 BCZ 7 BCZ 8 BCZ 9 BCZ 10 BCZ 11 BCZ 12 BCZ 13 BCZ 14 BCZ 15 BCZ 16
1 0% 0% 84% 92% 0% 0% 0% 0% 0% 0% 0% 24% 0% 0% 0% 0%
2 100% 100% 1% 0% 0% 0% 0% 0% 0% 0% 0% 0% 0% 0% 0% 0%
3 0% 0% 0% 0% 0% 0% 0% 0% 0% 0% 24% 0% 0% 0% 0% 58%
4 0% 0% 1% 0% 0% 0% 0% 0% 0% 0% 41% 30% 0% 0% 0% 0%
5 0% 0% 0% 0% 0% 0% 0% 0% 0% 0% 0% 1% 100% 100% 0% 42%
6 0% 0% 14% 8% 100% 0% 0% 0% 0% 0% 0% 0% 0% 0% 0% 0%
13 0% 0% 0% 0% 0% 0% 0% 0% 0% 0% 0% 31% 0% 0% 0% 0%
14 0% 0% 0% 0% 0% 0% 0% 0% 0% 0% 0% 8% 0% 0% 0% 0%
15 0% 0% 0% 0% 0% 0% 0% 0% 0% 0% 34% 6% 0% 0% 0% 0%
Total 100% 100% 100% 100% 100% 0% 0% 0% 0% 0% 100% 100% 100% 100% 0% 100%
Source: Guidehouse analysis

E-14
Table D-16: Translating Building Climate Zone to Forecast Climate Zone: Commercial, Gas – SoCal Gas Territory Only
FCZ BCZ 1 BCZ 2 BCZ 3 BCZ 4 BCZ 5 BCZ 6 BCZ 7 BCZ 8 BCZ 9 BCZ 10 BCZ 11 BCZ 12 BCZ 13 BCZ 14 BCZ 15 BCZ 16
7 0% 0% 0% 0% 0% 39% 0% 97% 17% 0% 0% 0% 0% 84% 0% 7%
8 0% 0% 0% 0% 0% 58% 0% 0% 1% 0% 0% 0% 0% 0% 0% 0%
9 0% 0% 0% 0% 0% 0% 0% 0% 0% 0% 0% 0% 100% 7% 0% 15%
10 0% 0% 0% 0% 0% 0% 0% 0% 0% 69% 0% 0% 0% 9% 0% 60%
11 0% 0% 0% 0% 0% 0% 0% 0% 0% 31% 0% 0% 0% 0% 65% 0%
16 0% 0% 0% 0% 0% 3% 0% 3% 66% 0% 0% 0% 0% 0% 0% 0%
17 0% 0% 0% 0% 0% 0% 0% 0% 15% 0% 0% 0% 0% 0% 0% 18%
18 0% 0% 0% 0% 0% 0% 0% 0% 1% 0% 0% 0% 0% 0% 0% 0%
19 0% 0% 0% 0% 0% 0% 0% 0% 0% 0% 0% 0% 0% 0% 35% 0%
20 0% 0% 0% 0% 0% 0% 0% 0% 0% 0% 0% 0% 0% 0% 0% 0%
Total 0% 0% 0% 0% 0% 100% 0% 100% 100% 100% 0% 0% 100% 100% 100% 100%
Source: Guidehouse analysis
Table D-17: Translating Building Climate Zone to Forecast Climate Zone: Commercial, Gas – SDG&E Territory Only
FCZ BCZ 1 BCZ 2 BCZ 3 BCZ 4 BCZ 5 BCZ 6 BCZ 7 BCZ 8 BCZ 9 BCZ 10 BCZ 11 BCZ 12 BCZ 13 BCZ 14 BCZ 15 BCZ 16
12 0% 0% 0% 0% 0% 0% 100% 0% 0% 100% 0% 0% 0% 0% 100% 0%
Source: Guidehouse analysis

D-15
Table D-18, Table D-19, Table D-20, and Table D-21 show IOU to FCZ mapping based on
consumption for the industrial and agricultural sectors. The research team used commercial
data as a proxy for industrial electric, industrial gas, and agricultural gas199 data. Table D-18,
Table D-19, Table D-20, and Table D-21 do not show BCZs because none of the savings for
the industrial and agriculture sector are weather-sensitive in the Potential and Goals model, so
no BCZ level output is available.
Table D-18: Translating Building Climate Zone to Forecast Climate Zone: Industrial, Electric
FCZ PG&E SCE SDG&E
FCZ 0 0.00% 0.00% 0.00%
FCZ 1 52.07% 0.00% 0.00%
FCZ 2 8.81% 0.00% 0.00%
FCZ 3 2.39% 0.00% 0.00%
FCZ 4 14.23% 0.00% 0.00%
FCZ 5 14.91% 0.00% 0.00%
FCZ 6 7.59% 0.00% 0.00%
FCZ 7 0.00% 64.61% 0.00%
FCZ 8 0.00% 7.83% 0.00%
FCZ 9 0.00% 3.65% 0.00%
FCZ 10 0.00% 13.45% 0.00%
FCZ 11 0.00% 10.46% 0.00%
FCZ 12 0.00% 0.00% 100.00%
FCZ 13 0.00% 0.00% 0.00%
FCZ 14 0.00% 0.00% 0.00%
FCZ 15 0.00% 0.00% 0.00%
FCZ 16 0.00% 0.00% 0.00%
FCZ 17 0.00% 0.00% 0.00%
FCZ 18 0.00% 0.00% 0.00%
FCZ 19 0.00% 0.00% 0.00%
FCZ 20 0.00% 0.00% 0.00%
Total 100.00% 100.00% 100.00%
Source: Guidehouse analysis
199 Agricultural electric mapping is available directly from the IOUs with no need for additional analysis.

D-16
Table D-19: Translating Building Climate Zone to Forecast Climate Zone: Agricultural, Electric
FCZ PG&E SCE SDG&E
FCZ 0 0.00% 0.00% 0.00%
FCZ 1 0.00% 0.00% 0.00%
FCZ 2 2.68% 0.00% 0.00%
FCZ 3 4.23% 0.00% 0.00%
FCZ 4 15.42% 0.00% 0.00%
FCZ 5 54.92% 0.00% 0.00%
FCZ 6 22.75% 0.00% 0.00%
FCZ 7 0.00% 2.64% 0.00%
FCZ 8 0.00% 20.67% 0.00%
FCZ 9 0.00% 59.26% 0.00%
FCZ 10 0.00% 7.92% 0.00%
FCZ 11 0.00% 9.51% 0.00%
FCZ 12 0.00% 0.00% 100.00%
FCZ 13 0.00% 0.00% 0.00%
FCZ 14 0.00% 0.00% 0.00%
FCZ 15 0.00% 0.00% 0.00%
FCZ 16 0.00% 0.00% 0.00%
FCZ 17 0.00% 0.00% 0.00%
FCZ 18 0.00% 0.00% 0.00%
FCZ 19 0.00% 0.00% 0.00%
FCZ 20 0.00% 0.00% 0.00%
Total 100.00% 100.00% 100.00%
Source: Guidehouse analysis

D-17
Table D-20: Translating Building Climate Zone to Forecast Climate Zone: Industrial, Gas
FCZ PG&E SCE SDG&E
FCZ 0 0.00% 0.00% 0.00%
FCZ 1 51.10% 0.00% 0.00%
FCZ 2 7.30% 0.00% 0.00%
FCZ 3 1.61% 0.00% 0.00%
FCZ 4 11.69% 0.00% 0.00%
FCZ 5 7.66% 0.00% 0.00%
FCZ 6 5.28% 0.97% 0.00%
FCZ 7 0.00% 36.90% 0.00%
FCZ 8 0.00% 6.98% 0.00%
FCZ 9 0.00% 1.57% 0.00%
FCZ 10 0.00% 18.07% 0.00%
FCZ 11 0.00% 9.56% 0.00%
FCZ 12 0.00% 0.00% 100.00%
FCZ 13 8.98% 0.00% 0.00%
FCZ 14 2.32% 0.00% 0.00%
FCZ 15 4.06% 0.00% 0.00%
FCZ 16 0.00% 20.93% 0.00%
FCZ 17 0.00% 4.61% 0.00%
FCZ 18 0.00% 0.41% 0.00%
FCZ 19 0.00% 0.00% 0.00%
FCZ 20 0.00% 0.00% 0.00%
Total 100.00% 100.00% 100.00%
Source: Guidehouse analysis

D-18
Table D-21: Translating Building Climate Zone to Forecast Climate Zone: Agricultural, Gas
FCZ PG&E SCE SDG&E
FCZ 0 0.00% 0.00% 0.00%
FCZ 1 51.10% 0.00% 0.00%
FCZ 2 7.30% 0.00% 0.00%
FCZ 3 1.61% 0.00% 0.00%
FCZ 4 11.69% 0.00% 0.00%
FCZ 5 7.66% 0.00% 0.00%
FCZ 6 5.28% 0.97% 0.00%
FCZ 7 0.00% 36.90% 0.00%
FCZ 8 0.00% 6.98% 0.00%
FCZ 9 0.00% 1.57% 0.00%
FCZ 10 0.00% 18.07% 0.00%
FCZ 11 0.00% 9.56% 0.00%
FCZ 12 0.00% 0.00% 100.00%
FCZ 13 8.98% 0.00% 0.00%
FCZ 14 2.32% 0.00% 0.00%
FCZ 15 4.06% 0.00% 0.00%
FCZ 16 0.00% 20.93% 0.00%
FCZ 17 0.00% 4.61% 0.00%
FCZ 18 0.00% 0.41% 0.00%
FCZ 19 0.00% 0.00% 0.00%
FCZ 20 0.00% 0.00% 0.00%
Total 100.00% 100.00% 100.00%
Source: Guidehouse analysis

F-1
APPENDIX E:
Building Stock Description
Building stock data are the total population metrics of a given sector. Residential building
stocks are based on the number of households in a utility service territory. Commercial
building stocks are represented by total floor space for each commercial building type.
Industrial and agricultural building stocks are represented by energy consumption. The
residential, commercial, industrial, and agriculture building stock metrics are derived from the
CEC’s IEPR.
The FSSAT requires building stocks by sector, scenario, and utility for 2013 – 2030. Table E-1
lists the building stocks characterized by IEPR and used in the FSSAT. The FSSAT does not
differentiate the industrial and agricultural sectors into building types.
Table E-1: Integrated Energy Policy Report Characterized Building Stock by Sector and Building Type
Sector Building Type
Residential Res - Single Family
Residential Res - Multi Family
Commercial Com - College
Commercial Com - Grocery
Commercial Com - Health
Commercial Com - Lodging
Commercial Com - Office (Large)
Commercial Com - Other
Commercial Com - Refrig. Warehouse
Commercial Com - Restaurant
Commercial Com - Retail
Commercial Com - School
Commercial Com - Office (Small)
Commercial Com - Warehouse
Source: Guidehouse

F-1
APPENDIX F:
Fuel Substitution Technology Characterization
Characterization Method This appendix describes the technology characterization the research team used to develop an
analytical framework. The team used this analytical framework to understand the opportunities
for fuel substitution in California. The research team completed characterization for two main
environments: the existing natural gas technology environment and the existing/emerging
electric technology environment. This study considers fuel substitution for building
decarbonization in the residential, commercial, agricultural, and industrial sectors. The
residential and commercial sectors are characterized at a technology level, while the
agricultural and industrial sectors are characterized at an end-use level. For these reasons, the
residential and commercial sectors characterization and the agricultural and industrial sectors
characterization follow different methods and are discussed separately.
Natural gas technology environment: As part of the 2019 CPUC Potential and
Goals study, the research team characterized the natural gas technology environment
for the three California natural gas IOUs.200 This study characterized more than 100 gas
technologies spanning the residential, commercial, agricultural, and industrial sectors.
The team used this dataset to understand and quantify the natural gas technology
environment for this work.
Electric technology environment: The research team used existing electric
replacement technology characterization where available in the 2019 CPUC Potential
and Goals study. For technologies where no prior characterization was available, the
team developed new performance and cost characterizations.
Residential and Commercial Natural Gas Technology
The research used the technology characterization work completed for the 2019 CPUC
Potential and Goals study to develop the natural gas technology list and key metrics for this
study.
200 Navigant Consulting, Inc. July 2019. 2019 Energy Efficiency Potential and Goals Study, prepared for the
California Public Utilities Commission.

F-2
Technology List
As part of the Potential and Goals study, the team had characterized the natural gas
technologies, provided in Table F-1 and Table F-2, at the sector, end-use, utility, building, and
climate zone levels.
Table F-1: Residential Natural Gas Technology List
End Use Natural Gas Technologies
Space Heating Furnace*
Space Heating Condensing Furnace
Water Heating Gas Storage Water Heater*
Water Heating Condensing Gas Storage Water Heater
Water Heating Instantaneous Gas Water Heater
Laundry Gas Clothes Dryer*
*This technology is characterized at multiple efficiency levels.
Source: Guidehouse
Table F-2: Commercial Natural Gas Technology List
End Use Natural Gas Technologies
Space Heating Furnace*
Space Heating Condensing Furnace
Space Heating Boiler*
Space Heating Condensing Boiler
Water Heating Gas Storage Water Heater*
Water Heating Condensing Gas Storage Water Heater
Water Heating Instantaneous Gas Water Heater
Water Heating Gas Water Heating Boiler*
Water Heating Condensing Gas Water Heating Boiler
Cooking Convection Oven*
Cooking Steamer*
Cooking Fryer*
Laundry Gas Clothes Dryer*
*This technology is characterized at multiple efficiency levels.
Source: Guidehouse
Key Metrics
Characterizing technologies involves developing the various inputs for each technology to
calculate potential impact on electricity and gas consumption as well as the associated costs.
Table F-3 summarizes the key metrics the research team used to characterize the gas
environment technologies.
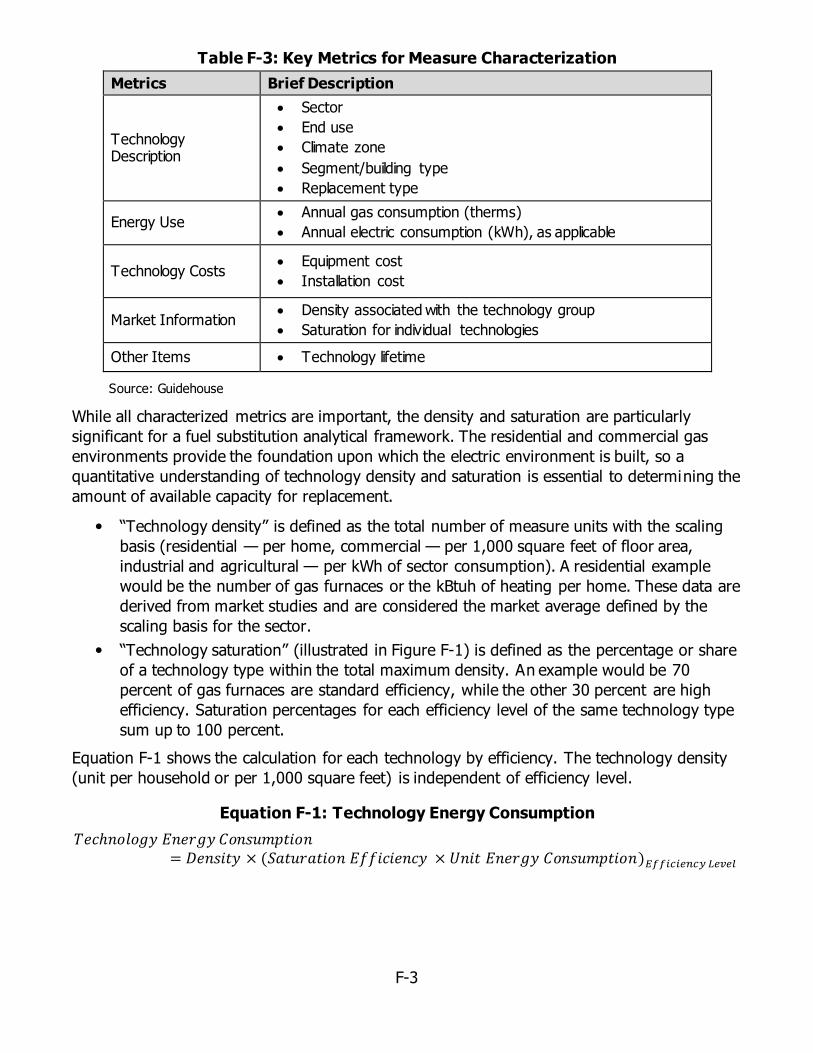
F-3
Table F-3: Key Metrics for Measure Characterization
Metrics Brief Description
Technology Description
Sector
End use
Climate zone
Segment/building type
Replacement type
Energy Use Annual gas consumption (therms)
Annual electric consumption (kWh), as applicable
Technology Costs Equipment cost
Installation cost
Market Information Density associated with the technology group
Saturation for individual technologies
Other Items Technology lifetime
Source: Guidehouse
While all characterized metrics are important, the density and saturation are particularly
significant for a fuel substitution analytical framework. The residential and commercial gas
environments provide the foundation upon which the electric environment is built, so a
quantitative understanding of technology density and saturation is essential to determining the
amount of available capacity for replacement.
“Technology density” is defined as the total number of measure units with the scaling
basis (residential — per home, commercial — per 1,000 square feet of floor area,
industrial and agricultural — per kWh of sector consumption). A residential example
would be the number of gas furnaces or the kBtuh of heating per home. These data are
derived from market studies and are considered the market average defined by the
scaling basis for the sector.
“Technology saturation” (illustrated in Figure F-1) is defined as the percentage or share
of a technology type within the total maximum density. An example would be 70
percent of gas furnaces are standard efficiency, while the other 30 percent are high
efficiency. Saturation percentages for each efficiency level of the same technology type
sum up to 100 percent.
Equation F-1 shows the calculation for each technology by efficiency. The technology density
(unit per household or per 1,000 square feet) is independent of efficiency level.
Equation F-1: Technology Energy Consumption
𝑇𝑒𝑐ℎ𝑛𝑜𝑙𝑜𝑔𝑦 𝐸𝑛𝑒𝑟𝑔𝑦 𝐶𝑜𝑛𝑠𝑢𝑚𝑝𝑡𝑖𝑜𝑛= 𝐷𝑒𝑛𝑠𝑖𝑡𝑦 × (𝑆𝑎𝑡𝑢𝑟𝑎𝑡𝑖𝑜𝑛 𝐸𝑓𝑓𝑖𝑐𝑖𝑒𝑛𝑐𝑦 × 𝑈𝑛𝑖𝑡 𝐸𝑛𝑒𝑟𝑔𝑦 𝐶𝑜𝑛𝑠𝑢𝑚𝑝𝑡𝑖𝑜𝑛)𝐸𝑓𝑓𝑖𝑐𝑖𝑒𝑛𝑐𝑦 𝐿𝑒𝑣𝑒𝑙

F-4
Figure F-1: Illustration for Efficiency Saturation by Technology
This stacked bar chart illustrates saturation by technology. For example, Technology A1 has
75 percent penetration in buildings, and Technology A2 has 25 percent. Each technology
group adds up to 100 percent.
Source: Guidehouse
The PG study sources of saturation and density values are from a variety of sources. Table F-4
lists the resources used for density and saturation in the residential and commercial sectors in
2017.201 The research team used primarily California-specific sources for density and
saturation data and referred to non-California sources only in cases California-specific sources
did not have the required data.
Table F-4: Sources for Potential and Goals Study Density and Saturation Characterization
Sources Description
2012 California Lighting & Appl. Saturation Survey
Residential baseline study of 1,987 homes across California.
2012 Commercial Saturation Survey
Baseline study of 1,439 commercial buildings across California.
2009 Residential Appliance Saturation Study (RASS)202
Residential end-use saturations for 24,000 households in California. Planned study update in 2020.
201 Even though a more recent Potential and Goals study has been completed since 2017, the research team
used the 2017 data because the 2017 IEPR is the basis for the current scenario analysis. Furthermore, the data
sources for the 2019 and 2017 Potential and Goals studies have not changed.
202 The team referred to this source only in cases where Commercial Lighting and Appliance Saturation Survey and Commercial Saturation Survey did not have the required data.
0%
10%
20%
30%
40%
50%
60%
70%
80%
90%
100%
A1 A2 B1 B2 C1 C2
High Efficiency Low Efficiency

F-5
Sources Description
2014 Northwest Energy Efficiency Alliance:
Residential Building Stock Assessment
Comm. Building Stock Assessment
Residential Building Stock Assessment and Commercial Building Stock Assessment survey residential and commercial building stock, respectively, across the Northwest states (Idaho, Montana, Oregon, Washington).
2009 U.S. Department of Energy:*
Res. Energy Consumption Survey (RECS)
Comm. Bldg. Energy Cons. Survey (CBECS)
RECS and CBECS are surveys of residential and commercial building stock in the United States by region. Used west regional data only. Next update is pending for the 2018 CBECS.
Environmental Protection Agency 2003-2016 ENERGY STAR Shipment Database
Unit shipment data of ENERGY STAR-certified products collected to evaluate market penetration and performance.
*Updates for RECS in 2015 and CBECS in 2012 may not have included the data points used for
the Potential and Goals study. The Potential and Goals study used only 2009 datasets.
Source: Guidehouse
Further information about key metrics and data sources for the 2019 CPUC Potential and Goals
study are available via the publicly available report.203
Residential and Commercial Electric Environment
Technology List
The research team considered a broad set of residential and commercial fuel substitution
technologies when developing the final technology list. In coordination with CEC staff, the
team prioritized this list to a final technology list (for characterization in this version of the
FSSAT) based on the relative impact of a given technology and project capacity. The final
technology list is presented in Table F-5 and Table F-6 (split by residential and commercial);
the tables include the full reviewed list, noting which technologies are included in the current
analytical framework. The final analytical framework will allow adding new technology
characterization as they are developed.
Table F-5: Residential Electric Technologies
End Use Electric Technologies Reviewed Electric Technologies
Included (Y/N)
Space Heating Standard and High Efficiency Packaged/Split Heat Pump Y
Space Heating Standard and High-Efficiency, Variable-Capacity Heat Pump
Y
Space Heating Radiant Heating N
Space Heating Space and Water Heating Combination Systems N
203 Navigant Consulting, Inc. July 2019. 2019 Energy Efficiency Potential and Goals Study, for the California
Public Utilities Commission.

F-6
End Use Electric Technologies Reviewed Electric Technologies
Included (Y/N)
Space Heating Packaged Terminal Heat Pump Y
Space Heating Layered Envelope Improvements a Y
Water Heating Small Electric Water Heater (0.86, 0.88 and 0.93 EF) Y
Water Heating Tankless Resistance Water Heater Y
Water Heating Heat Pump Water Heater (>= 2.0 EF) Y
Water Heating Solar Water Heater N
Water Heating Space and Water Heating Combination Systems N
Cooking Electric Cooktop (Resistance) Y
Cooking Electric Range (Resistance) Y
Cooking Electric Cooktop (Induction Heating) Y
Laundry Heat Pump Clothes Dryer Y
a Layered envelope improvements indicate separate technology characterization for each
specified space-heating technology operating in a building with an improved envelope.
Source: Guidehouse
Table F-6: Commercial Electric Technologies
End Use Electric Technologies Reviewed Electric Technologies
Included (Y/N)
Space Heating Standard and High-Efficiency Variable Capacity Heat Pump
Y
Space Heating Geothermal Heat Pump N
Space Heating Standard and High-Efficiency Packaged Rooftop Unit Heat Pump
Y
Space Heating Standard and High-Efficiency Split System Heat Pump Y
Space Heating Variable-Refrigerant-Flow Systems N
Space Heating Packaged Terminal Heat Pump (PTHP) Y
Space Heating Layered Envelope Improvement a N
Water Heating Tankless Electric Resistance Water Heater Y
Water Heating Electric Resistance Water Heater (0.86, 0.88 and 0.93 EF)
Y
Water Heating Heat Pump Water Heater Y
Water Heating Pool Heating Equipment N
Cooking Electric Fryer/Broiler Y
Cooking Electric Stove N
Cooking Electric Oven Y
Cooking Electric Overhead Broiler N
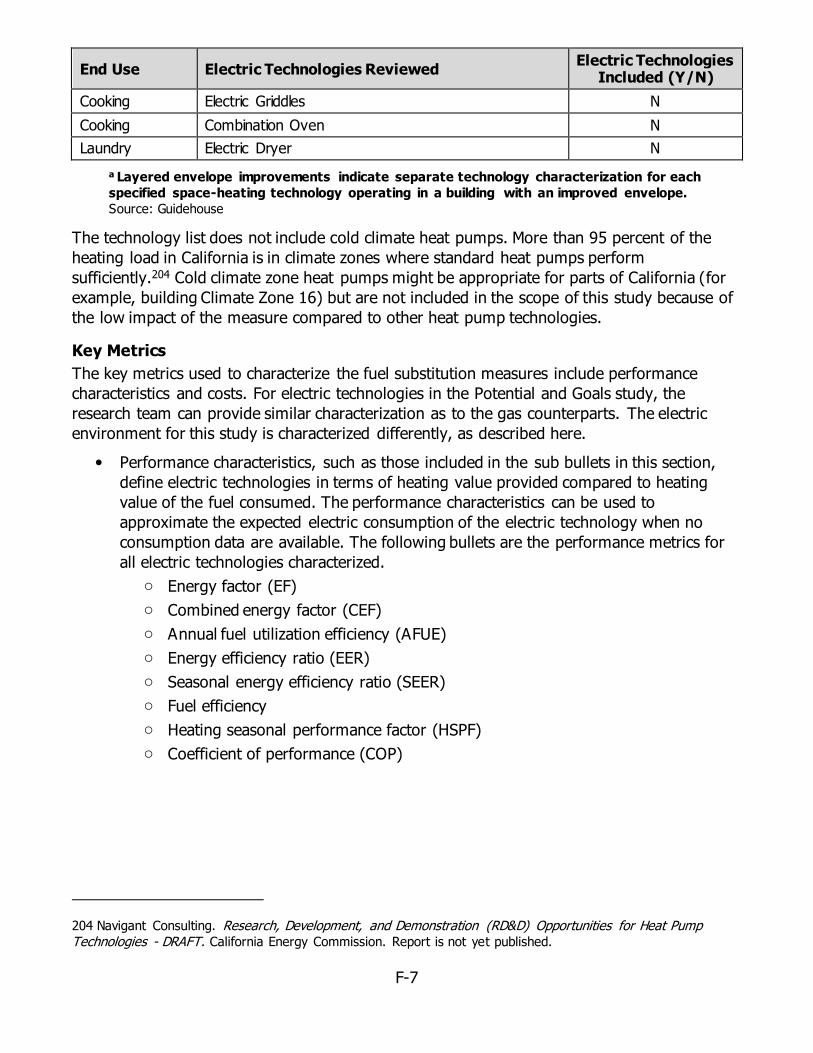
F-7
End Use Electric Technologies Reviewed Electric Technologies
Included (Y/N)
Cooking Electric Griddles N
Cooking Combination Oven N
Laundry Electric Dryer N
a Layered envelope improvements indicate separate technology characterization for each
specified space-heating technology operating in a building with an improved envelope.
Source: Guidehouse
The technology list does not include cold climate heat pumps. More than 95 percent of the
heating load in California is in climate zones where standard heat pumps perform
sufficiently.204 Cold climate zone heat pumps might be appropriate for parts of California (for
example, building Climate Zone 16) but are not included in the scope of this study because of
the low impact of the measure compared to other heat pump technologies.
Key Metrics
The key metrics used to characterize the fuel substitution measures include performance
characteristics and costs. For electric technologies in the Potential and Goals study, the
research team can provide similar characterization as to the gas counterparts. The electric
environment for this study is characterized differently, as described here.
Performance characteristics, such as those included in the sub bullets in this section,
define electric technologies in terms of heating value provided compared to heating
value of the fuel consumed. The performance characteristics can be used to
approximate the expected electric consumption of the electric technology when no
consumption data are available. The following bullets are the performance metrics for
all electric technologies characterized.
o Energy factor (EF)
o Combined energy factor (CEF)
o Annual fuel utilization efficiency (AFUE)
o Energy efficiency ratio (EER)
o Seasonal energy efficiency ratio (SEER)
o Fuel efficiency
o Heating seasonal performance factor (HSPF)
o Coefficient of performance (COP)
204 Navigant Consulting. Research, Development, and Demonstration (RD&D) Opportunities for Heat Pump Technologies - DRAFT. California Energy Commission. Report is not yet published.

F-8
Table F-7: Residential and Commercial Electric Technology Performance Metrics
End Use Performance Metric
Space Heating HSPF, SEER, EER, COP
Water Heating EF, COP
Cooking EF, COP
Laundry EF, COP
Source: Guidehouse
Electric technology costs encapsulate equipment costs, installation costs, and contractor
overhead and profit.
o Equipment costs are defined as the capital cost of the specific technology.
o Installation costs are defined as the cost of labor and additional equipment,
including wiring costs where pertinent, needed to install the specific technology.
o Contractor overhead and profit costs are defined as the additional costs required
to allow contractors to sustain their businesses though profits.
Broadly, the research team characterized the performance characteristics and costs using one
of two methods:
For electric measures that existed in the 2019 CPUC Potential and Goals study
database, where possible, the team mapped measures in the replacement technology
environment to an electric measure for which performance factors (that is, HSPF, EF,
and so forth), values, or costs were readily available. For electric measures that were
characterized in the Potential and Goals study, all metrics that are referenced in Table
F-3 are readily available.
For measures in the electric technology environment for which there were no
performance factors or costs identified in the Potential and Goals study database, the
team reviewed reputable alternative sources to develop the characterizations.
o Performance factors were typically extracted from sources including Title 24
Building Codes and Title 20 Appliance Efficiency Regulations, other state and
federal guidance documents, and industry sources and other Web materials. The
team compared the materials for consistency of reported values. Commonly used
conversion factors for each type of performance factor were then used to
convert common performance values to general COPs. The COP represents the
ratio of the useful heating value produced by the technology to the heat value of
the fuel supplied to the technology.
o The team developed material costs from a Web market review of retail prices
from relevant dealer websites or recent IOU workpapers. See Table F-12 for
detailed source(s) by measure.
o Installation costs (that is, labor costs) were developed from RSMeans estimates
of labor hours to complete an installation task multiplied by a labor wage rate for
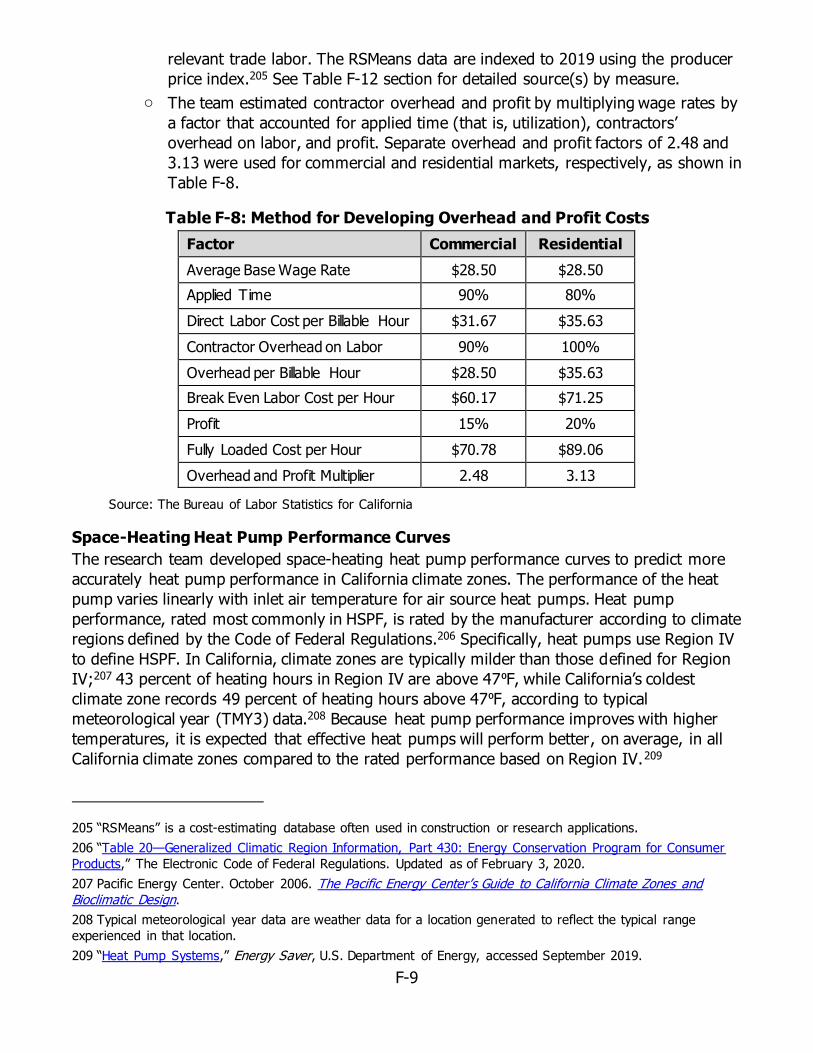
F-9
relevant trade labor. The RSMeans data are indexed to 2019 using the producer
price index.205 See Table F-12 section for detailed source(s) by measure.
o The team estimated contractor overhead and profit by multiplying wage rates by
a factor that accounted for applied time (that is, utilization), contractors’
overhead on labor, and profit. Separate overhead and profit factors of 2.48 and
3.13 were used for commercial and residential markets, respectively, as shown in
Table F-8.
Table F-8: Method for Developing Overhead and Profit Costs
Factor Commercial Residential
Average Base Wage Rate $28.50 $28.50
Applied Time 90% 80%
Direct Labor Cost per Billable Hour $31.67 $35.63
Contractor Overhead on Labor 90% 100%
Overhead per Billable Hour $28.50 $35.63
Break Even Labor Cost per Hour $60.17 $71.25
Profit 15% 20%
Fully Loaded Cost per Hour $70.78 $89.06
Overhead and Profit Multiplier 2.48 3.13
Source: The Bureau of Labor Statistics for California
Space-Heating Heat Pump Performance Curves
The research team developed space-heating heat pump performance curves to predict more
accurately heat pump performance in California climate zones. The performance of the heat
pump varies linearly with inlet air temperature for air source heat pumps. Heat pump
performance, rated most commonly in HSPF, is rated by the manufacturer according to climate
regions defined by the Code of Federal Regulations.206 Specifically, heat pumps use Region IV
to define HSPF. In California, climate zones are typically milder than those defined for Region
IV;207 43 percent of heating hours in Region IV are above 47⁰F, while California’s coldest
climate zone records 49 percent of heating hours above 47⁰F, according to typical
meteorological year (TMY3) data.208 Because heat pump performance improves with higher
temperatures, it is expected that effective heat pumps will perform better, on average, in all
California climate zones compared to the rated performance based on Region IV.209
205 “RSMeans” is a cost-estimating database often used in construction or research applications.
206 “Table 20—Generalized Climatic Region Information, Part 430: Energy Conservation Program for Consumer
Products,” The Electronic Code of Federal Regulations. Updated as of February 3, 2020.
207 Pacific Energy Center. October 2006. The Pacific Energy Center’s Guide to California Climate Zones and Bioclimatic Design.
208 Typical meteorological year data are weather data for a location generated to reflect the typical range
experienced in that location.
209 “Heat Pump Systems,” Energy Saver, U.S. Department of Energy, accessed September 2019.

F-10
The team used data from manufacturer performance ratings at various temperatures to
develop linear regressions of heat pump performance as a function of outdoor air temperature.
These performance curves were developed for two residential heat pump technologies and
two commercial heat pump technologies, as presented in Table F-9 and Table F-10.
Performance curves were developed for heat pump categories to the extent that data were
publicly available from manufacturers.
Table F-9: Performance Curve Residential Heat Pump Technology List
Technology Performance Curve
Applicable Technologies
Heat Pump Packaged/Split Heat Pumps
Heat Pump Variable Capacity Heat Pump
Heat Pump Packaged Terminal Heat Pump
Efficient Heat Pump Efficient Packaged/Split Heat Pumps
Efficient Heat Pump Efficient Variable Capacity Heat Pump
Source: Guidehouse
Table F-10: Performance-Curve Commercial Heat Pump Technology List
Technology Performance Curve
Applicable Technologies
Packaged Rooftop Unit Heat Pump
Packaged Rooftop Unit Heat Pump – Air Source
Packaged Rooftop Unit Heat Pump
High-Efficiency Packaged Rooftop Unit Heat Pump – Air Source
Split-System Heat Pump Variable-Capacity Heat Pump
Packaged Rooftop Unit Heat Pump
High-Efficiency Variable-Capacity Heat Pump
Packaged Rooftop Unit Heat Pump
Split-System Heat Pump – Air Source
Packaged Rooftop Unit Heat Pump
High-Eff. Split System Heat Pump – Air Source
Packaged Rooftop Unit Heat Pump
Packaged Terminal Heat Pump
Source: Guidehouse
The research team developed performance curves for a standard heat pump and efficient heat
pump in the residential sector and a packaged rooftop unit heat pump and split-system heat
pump in the commercial sector. Ideally, unique performance curves are developed for each
characterized technology. Because of limited publicly available data, the team developed
generalized performance curves applicable to multiple heat pump technologies — for example,
variable-capacity heat pumps. As more publicly available manufacturer data become available,
the team recommends that more specific performance curves be developed.

F-11
The team applied each-heat pump performance curve to California BCZs based on TMY3
weather data.210 Using TMY3 data, the team translated hourly temperatures to equivalent COP
values for each heat pump technology using the developed heat pump performance curves.
The team averaged the hourly COP data to develop effective COP values for each California
climate zone. The team used the effective COP values to characterize effective heat pump
performance values specific to California climate zones for each heat pump space-heating
technology.
Agricultural and Industrial Natural Gas and Electric Consumption Baseline
The team characterized the agricultural and industrial sectors differently than the residential
and commercial sectors. The characterization of fuel substitution in these sectors was based
on a percentage increase of electric consumption coincident with a percentage decrease in gas
consumption. As such, the baseline environment consists of the total natural gas and
electricity consumption for these sectors. The characterization workbooks use the 2019 CPUC
Potential and Goals study global data to build the agricultural and industrial total consumption
environment.
Agricultural and Industrial Electric Replacement
The research team identified the highest impact electric replacement end uses in the
agricultural and industrial sectors to characterize. The team based the potential for impact
according to the percentage of gas consumption by end use in these sectors provided in
Figure 10. The end uses chosen for the agricultural sector represent 73 percent of total sector
gas consumption, and the end use chosen for industrial represents 39 percent of total sector
gas consumption, as presented in Table F-11.
Table F-11: High-Impact Agricultural and Industrial End Uses Selected for Characterization
Sector End Use Percentage of End-
Use Natural Gas Consumption
Agricultural Water Heating 38%
Agricultural HVAC 35%
Industrial Process Heating 39%
Source: Guidehouse
The Industrial Assessment Center211 database was used in combination with professional
judgement as the primary source to characterize these end uses. The Industrial Assessment
Centers are university-based groups that complete audits for the industrial sector. These
centers complete hundreds of audits resulting in thousands of measure recommendations each
year. These centers have characterized more than 300,000 measures since the 1970s. This
210 National Renewable Energy Laboratory. National Solar Radiation Data Base: 1991—2005 Update: Typical Meteorological Year 3, accessed 2019.
211 Office of Energy Efficiency & Renewable Energy, U.S. Department of Energy (DOE). “Industrial Assessment
Centers (IACs),” accessed 2019.
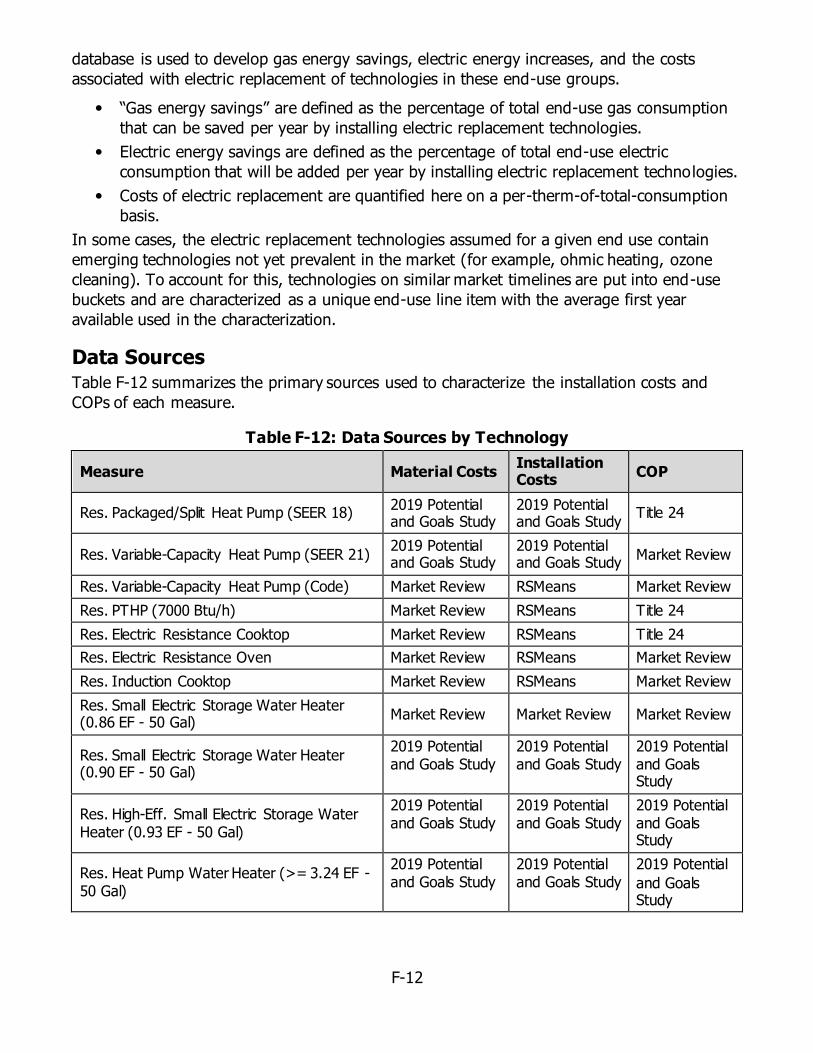
F-12
database is used to develop gas energy savings, electric energy increases, and the costs
associated with electric replacement of technologies in these end-use groups.
“Gas energy savings” are defined as the percentage of total end-use gas consumption
that can be saved per year by installing electric replacement technologies.
Electric energy savings are defined as the percentage of total end-use electric
consumption that will be added per year by installing electric replacement technologies.
Costs of electric replacement are quantified here on a per-therm-of-total-consumption
basis.
In some cases, the electric replacement technologies assumed for a given end use contain
emerging technologies not yet prevalent in the market (for example, ohmic heating, ozone
cleaning). To account for this, technologies on similar market timelines are put into end-use
buckets and are characterized as a unique end-use line item with the average first year
available used in the characterization.
Data Sources Table F-12 summarizes the primary sources used to characterize the installation costs and
COPs of each measure.
Table F-12: Data Sources by Technology
Measure Material Costs Installation Costs
COP
Res. Packaged/Split Heat Pump (SEER 18) 2019 Potential and Goals Study
2019 Potential and Goals Study
Title 24
Res. Variable-Capacity Heat Pump (SEER 21) 2019 Potential and Goals Study
2019 Potential and Goals Study
Market Review
Res. Variable-Capacity Heat Pump (Code) Market Review RSMeans Market Review
Res. PTHP (7000 Btu/h) Market Review RSMeans Title 24
Res. Electric Resistance Cooktop Market Review RSMeans Title 24
Res. Electric Resistance Oven Market Review RSMeans Market Review
Res. Induction Cooktop Market Review RSMeans Market Review
Res. Small Electric Storage Water Heater (0.86 EF - 50 Gal)
Market Review Market Review Market Review
Res. Small Electric Storage Water Heater (0.90 EF - 50 Gal)
2019 Potential and Goals Study
2019 Potential and Goals Study
2019 Potential and Goals Study
Res. High-Eff. Small Electric Storage Water Heater (0.93 EF - 50 Gal)
2019 Potential and Goals Study
2019 Potential and Goals Study
2019 Potential and Goals Study
Res. Heat Pump Water Heater (>= 3.24 EF - 50 Gal)
2019 Potential and Goals Study
2019 Potential and Goals Study
2019 Potential
and Goals Study
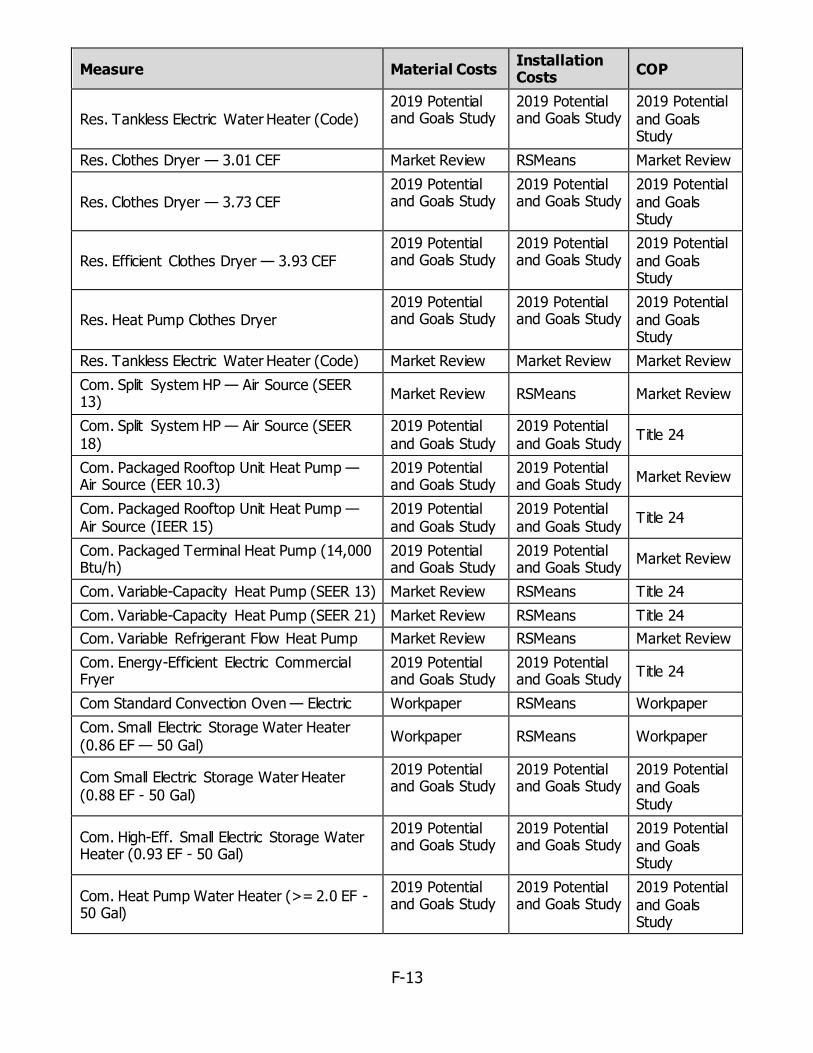
F-13
Measure Material Costs Installation Costs
COP
Res. Tankless Electric Water Heater (Code) 2019 Potential and Goals Study
2019 Potential and Goals Study
2019 Potential and Goals Study
Res. Clothes Dryer — 3.01 CEF Market Review RSMeans Market Review
Res. Clothes Dryer — 3.73 CEF 2019 Potential and Goals Study
2019 Potential and Goals Study
2019 Potential and Goals Study
Res. Efficient Clothes Dryer — 3.93 CEF 2019 Potential and Goals Study
2019 Potential and Goals Study
2019 Potential and Goals Study
Res. Heat Pump Clothes Dryer 2019 Potential and Goals Study
2019 Potential and Goals Study
2019 Potential and Goals Study
Res. Tankless Electric Water Heater (Code) Market Review Market Review Market Review
Com. Split System HP — Air Source (SEER 13)
Market Review RSMeans Market Review
Com. Split System HP — Air Source (SEER 18)
2019 Potential and Goals Study
2019 Potential and Goals Study
Title 24
Com. Packaged Rooftop Unit Heat Pump — Air Source (EER 10.3)
2019 Potential and Goals Study
2019 Potential and Goals Study
Market Review
Com. Packaged Rooftop Unit Heat Pump — Air Source (IEER 15)
2019 Potential and Goals Study
2019 Potential and Goals Study
Title 24
Com. Packaged Terminal Heat Pump (14,000 Btu/h)
2019 Potential and Goals Study
2019 Potential and Goals Study
Market Review
Com. Variable-Capacity Heat Pump (SEER 13) Market Review RSMeans Title 24
Com. Variable-Capacity Heat Pump (SEER 21) Market Review RSMeans Title 24
Com. Variable Refrigerant Flow Heat Pump Market Review RSMeans Market Review
Com. Energy-Efficient Electric Commercial Fryer
2019 Potential and Goals Study
2019 Potential and Goals Study
Title 24
Com Standard Convection Oven — Electric Workpaper RSMeans Workpaper
Com. Small Electric Storage Water Heater (0.86 EF — 50 Gal)
Workpaper RSMeans Workpaper
Com Small Electric Storage Water Heater (0.88 EF - 50 Gal)
2019 Potential and Goals Study
2019 Potential and Goals Study
2019 Potential and Goals Study
Com. High-Eff. Small Electric Storage Water Heater (0.93 EF - 50 Gal)
2019 Potential and Goals Study
2019 Potential and Goals Study
2019 Potential and Goals Study
Com. Heat Pump Water Heater (>= 2.0 EF - 50 Gal)
2019 Potential and Goals Study
2019 Potential and Goals Study
2019 Potential and Goals Study

F-14
Measure Material Costs Installation Costs
COP
Com. Tankless Electric Water Heater (Code) 2019 Potential and Goals Study
2019 Potential and Goals Study
2019 Potential and Goals Study
Com. Average Existing Electric Clothes Dryer Market Review RSMeans Market Review
Com. Code-Compliant Electric Clothes Dryer 2019 Potential and Goals Study
2019 Potential and Goals Study
2019 Potential and Goals Study
Com. Electric Clothes Dryer — High-Efficiency 2019 Potential and Goals Study
2019 Potential and Goals Study
2019 Potential and Goals Study
Source: Guidehouse
The following provides additional data on various sources:
The 2019 Potential and Goals study costs for material and installation costs are as
recorded in the study database and were obtained from the Itron — 2010–2012 WO017
— Ex Ante Measure Cost Study.212 The research team did not adjust these costs for
inflation as part of the characterization, but they will be adjusted in the model.
The RSMeans Electrical Cost Data and RSMeans Mechanical Cost Data database
provided labor hours for relevant installation tasks.
The PG&E workpaper PGECOFST102213 provided the energy efficient electric commercial
fryer material costs. Costs represent estimated equipment costs; they are based on list
cost data for electric and gas fryers and apply an industry standard 50 percent discount
to the manufacturer published list prices, as discussed in the workpaper at Table 12.
The SDG&E workpaper WPSDGENRCC0006214 provided the standard convection oven
material costs.
The team conducted a Web market review of equipment providers for various
equipment; the most used sites are listed below. List prices were recorded, and the
team excluded outliers if cost factors, such as efficiency rating, could not be clearly
identified.
o eComfort.com at https://www.ecomfort.com/
o Factory Furnace Outlet at https://www.ecomfort.com/
o HVAC Direct at https://hvacdirect.com/
o Grainger Industrial Supply at https://www.grainger.com/
o Sears at https://www.sears.com/
o The Home Depot at https://www.homedepot.com/
212 Itron. May 27, 2014. 2010-2012 WO017 Ex Ante Measure Cost Study Final Report.
213 Pacific Gas and Electric, Commercial Fryer-Electric and Gas (search for PGECOFST102 with the 2016 date
approved at http://www.deeresources.net/workpapers).
214 San Diego Gas & Electric, Commercial Convection Oven-Electric and Gas (search for WPSDGENRCC0006 with
the 2016 date approved at http://www.deeresources.net/workpapers).

F-15
The Bureau of Labor Statistics for California (at
https://www.bls.gov/oes/current/oes_ca.htma, accessed September 2019) provided the
wage rate data. An average hourly wage rate of $28.50 was used for all measures
based on the hourly mean wage rate (H_MEAN) for the trades construction laborers,
electricians, plumbers, and heating, air conditioning, and refrigeration mechanics and
installers.
Estimates of applied time (that is, utilization), contractors overhead on labor, and profit
applicable to California are professional judgment.
The effect of certain measures that were not well defined in the Industrial Assessment
Center database had to be estimated by internal subject matter experts. These
measures were typically new or emerging technology and have minimal supporting
data. The research used secondary sources where available but often had to use
professional judgement when estimating the effect of these measures at the sector
level. These measures fed into the end-use level savings used in this study. The subject
matter experts leveraged for this work helped develop the industrial section of the
Potential and Goals study in California and provided guidance regarding industrial and
agriculture energy efficiency for the CEC.

G-1
APPENDIX G:
Fuel Substitution Load Shapes
Background Fuel substitution load shapes are developed and used to understand how the implementation
of fuel substitution technologies will affect consumption and GHG emissions at an hourly level.
The load shapes are developed at an end-use level and then applied to technologies that
belong to that end use.
Fuel Substitution Load Shapes To the extent possible, fuel substitution end-use load shapes leveraged existing load shapes.
Existing load shapes were sourced from either the ADM California IOU Electricity Load Shapes
study (ADM IOU Load Shape Study) or Navigant’s (now Guidehouse’s) 2017 Additional
Achievable Energy Efficiency (AAEE) Load Shape Analysis.215,216 This work also developed new
load shapes, when necessary. Table G-1 presents a list of load shapes used or developed for
each fuel substitution end use.
No existing load shape is available for combined space heating and cooling with a heat pump
in the residential and commercial sectors. In the past, the team has approximated a heat
pump space heating and cooling load shape by combining a HVAC cooling load shape and a
gas furnace load shape.217 This method, while useful in lieu of a heat pump specific profile,
does not capture air source heat pump efficiency fluctuations based on outdoor air
temperature. For more accurate load shapes, the research team used the California Building
Energy Code Compliance residential and commercial models to generate hourly heat pump
load shapes.218
Table G-1: Load Shape List by Sector and End Use
Sector End Use Load Shape Source
Residential Space Heating/Cooling
Residential Heat Pump
Navigant (now Guidehouse) – California Building Energy Code Compliance — Res. Model
Residential Water Heating Residential Water Heating ADM IOU Load Shape Study
Residential Cooking Residential Cooking ADM IOU Load Shape Study
Residential Laundry Residential Dryer ADM IOU Load Shape Study
Residential Whole Building Residential Whole Building ADM IOU Load Shape Study
215 ADM Associates, Inc. April 2019. California Investor-Owned Utility Electricity Load Shapes.
216 Navigant Consulting, Inc. January 2018. Investor Owned Utilities 2017 Additional Achievable Energy Efficiency Savings: Methodology Documentation.
217 In this method, the electrified gas furnace is approximated using an assumed fuel efficiency and COP at the
end-use level.
218 “2019 Building Energy Efficiency Standards Approved Computer Compliance Programs ,” Title 24, California
Energy Commission, accessed August 2019.

G-2
Sector End Use Load Shape Source
Commercial Space Heating/Cooling
Commercial Heat Pump Navigant (now Guidehouse) — California Building Energy Code Compliance — Com. Model
Commercial Water Heating Commercial Water Heating ADM IOU Load Shape Study
Commercial Cooking Commercial Cooking ADM IOU Load Shape Study
Commercial Laundry Residential Dryer* ADM IOU Load Shape Study
Commercial Whole Building Commercial Whole Building ADM IOU Load Shape Study
Agricultural HVAC Agricultural Whole Building** 2017 Navigant (now Guidehouse) AAEE Analysis
Agricultural Water Heating Agricultural Livestock Whole Building † ADM IOU Load Shape Study
Agricultural Whole Building Agricultural Whole Building 2017 Navigant (now Guidehouse) AAEE Analysis
Industrial Process Heating Industrial Whole Building † † 2017 Navigant (now Guidehouse) AAEE Analysis
Industrial Whole Building Industrial Whole Building 2017 Navigant (now Guidehouse) AAEE Analysis
*The residential dryer load shape is used as a proxy for the commercial laundry end use.
**Most agricultural HVAC is devoted to building/greenhouse HVAC. The agricultural whole
building shape follows similar seasonal trends as a general HVAC shape and is used as a proxy
in lieu of an agricultural HVAC-specific load shape.
† The ADM livestock facility-level load shape is used as a proxy. Agricultural water heating is
driven by dairy cattle, milk production, and other animal production. These end uses are
assumed to be primarily process driven and align with the total facility load shape.
† † The industrial whole-building load shape is used as a proxy. Industrial process heating
makes up a large share of electric consumption in industrial buildings; so the whole building
shape is considered a sufficient approximation in lieu of any end-use-specific data.
Source: Guidehouse
Load Shape Development Standard Methods
Load shape development is typically conducted following one of three methods: end-use
metering, prototypical building modeling, or smart meter disaggregation. In many cases, a
hybrid approach that combines two or all three approaches is taken.
End-Use Metering
The end-use metering approach is the most intrusive and expensive approach to develop end-
use load profiles, but it is also the most accurate. This method collects customer-site data at
the end-use circuit level and requires a monitoring device to be installed directly to the load.
This approach is used both for developing year-long hourly 8,760 load profiles and performing
shorter-term technology evaluations.
Prototypical Building Modeling
Prototypical building modeling uses building models, typically sourced from the U.S.
Department of Energy, combined with a weather data file to simulate end-use-level 8,760 load

G-3
profiles.219 This technique provides a method for quickly changing weather types and is useful
for territories with multiple climates. The Department of Energy building models are not
location-specific, so they must be edited to develop regional specificity, such as local building
characteristics sourced from California Commercial End-Use Survey.220 This load-shape-
development method does not require any interaction with customer sites nor does it require
data requests from load-serving entities. Once output from the model, the load profiles can be
made more representative of a region or territory by calibrating to combined load data.
Further, the prototypical building models are open source and can be edited to better match
the building type of interest.
Smart Meter Disaggregation
This method uses whole building load profiles obtained from advanced metering infrastructure
(AMI) 22115-minute interval data as a starting point and then breaks down these profiles by
end-use level. There are many different methods to disaggregate the whole-building load
profile, but all methods generally use some simulated or real data to estimate the relative
proportions of load contributed by end uses on an hourly basis. These proportions are then
applied to the whole-building load profiles to develop the end-use-level load profiles. This
method is advantageous because it is based on real and typically recent data and there is no
intrusion at the customer site. That said, AMI data can be difficult to obtain, and the overall
accuracy of this method rests on the accuracy of the estimated end-use load proportions.
Hybrid Approach
The hybrid approach tries to combine several other approaches to benefit from the advantages
and avoid the associated disadvantages. Rarely are any of the other methods used in isolation.
For example, building modeling is often used as a starting point to generate load profiles
because it requires little input data and all input data are publicly available. Next, the entire
output or perhaps a single end use might be calibrated based on an end-use metering study.
AMI or meter data may also be used to calibrate the results so that the overall load profile is
more representative of reality.
ADM Load Shapes
The ADM IOU Load Shapes study developed the load shapes by using a hybrid approach. The
study method employs a combination of end-use metering and prototypical building modeling.
AMI load data are also used and disaggregated to an end-use level based on demand
forecasts. These techniques are combined into ADM Associates’ Hourly Electric Load Model 2.0
model, which uses a similar approach to the CEC’s legacy Hourly Electric Load Model used to
generate load shapes.222
219 The U.S. Department of Energy developed and maintains the EnergyPlus whole building simulation program.
220 Itron, Inc. 2006. California Commercial End-Use Survey.
221 “AMI” refers to the two-way communication between utilities and customers with full measurement and data
collection systems.
222 ADM Associates, Inc. April 2019. California Investor-Owned Utility Electricity Load Shapes.

G-4
2017 Navigant AAEE Load Shapes
Navigant (now Guidehouse) performed an extensive load shape data search to compile
representative 8,760 load profiles for measures in the named end-use categories. Where
possible, Navigant sourced California-specific load shapes. Where California-specific data were
not available, Navigant used additional secondary resources to fill gaps using load shapes from
other states, only for nonweather-sensitive end uses.223
California Building Energy Code Compliance Heat Pump Load-Shape Development While the research team used the best available end-use load shapes for most fuel substitution
end uses, no satisfactory load shape was available for an electric heat pump. Residential and
commercial electric space heating are high-impact end uses for fuel substitution. Residential
space heating represents 45 percent of residential gas use, and commercial space heating
represents 36 percent of commercial gas use.224
Gas space heating load shapes for the residential and commercial sector are readily available,
but these end-use load shapes do not sufficiently approximate electric space-heating load.
Electric space heating is expected to be primarily achieved through the use of heat pump
space heaters. Unlike a gas furnace, the heating efficiency of an air-source heat pump
changes based on outdoor temperature.
The team employed uncalibrated prototypical models in the California Building Energy Code
Compliance residential and commercial models for developing hourly heat pump load shape for
each sector. As metered heat pump data become available in California, the team recommends
that modeled load shapes are updated with calibrated end-use (or whole-building) data.
The research team developed unique heat pump load shapes at the utility, building type, and
building vintage level. The following are the load shapes developed:
Utility: PG&E, SCE, SDG&E, SMUD, LADWP
Building types: Single-family, multifamily, lodging, office, restaurant, retail, and
miscellaneous
Vintage: Code-compliant225 and average existing (for residential only). The average
existing models use envelope metrics based on the Residential Appliance Saturation
Survey (RASS), Title 24 standards, and the average existing building data from the
2019 Navigant Potential & Goals Study.226
223 Navigant Consulting, Inc. January 2018. Investor Owned Utilities 2017 Additional Achievable Energy
Efficiency Savings: Methodology Documentation.
224 California Energy Commission. 2018. 2018 IEPR Update, Volume II; California Energy Commission, California Commercial End-Use Survey.
225 The code-compliant models use envelope metrics according to the 2019 California Building Energy Efficiency
Standards. California Energy Commission, 2019 Building Energy Efficiency Standards, accessed August 2019
226 California Energy Commission. 2009. Residential Appliance Saturation Survey; California Energy Commission,
2019 Building Energy Efficiency Standards; Navigant Consulting, Inc. July 2019. 2019 Energy Efficiency Potential and Goals Study, California Public Utilities Commission.

G-5
To develop unique load shapes by utility and building vintage, the research team ran the
prototypical models for the representative BCZs and modified prototypical building envelope
characteristics. This study uses representative climate zones available in the California Building
Energy Code Compliance models to approximate expected weather in the five utilities
modeled.
Climate Zone Selection
The team selected representative climate zone(s) with the highest proportion of electric sales
territorywide for each utility territory. Table G-2 presents the climate zone(s) selected for each
utility.
Table G-2: Representative Climate Zone(s) by Utility
Utilities Climate Zone(s)
PG&E CZ3, CZ12*
SCE CZ9, CZ10*
SDG&E CZ7
SMUD CZ12
LADWP CZ9
* Climate zone load shapes are combined using a weighted average of utility-specific electric
consumption in each zone.
Source: Guidehouse
Residential Heat Pump Model Parameters
The research team developed residential heat pump load shapes for single-family and
multifamily homes. The team developed unique load shapes for code-compliant and average
existing buildings in the residential sector.
Code-compliant. The code-compliant building model envelope metrics use the
standard design California Building Energy Code Compliance residential prototypical
model. The energy features and envelope metrics of this building model are input to
reflect the 2019 California Building Energy Efficiency Standards (Section 150.1 [c] and
Table 150.1-A) and is ready-made in the California Building Energy Code Compliance
residential software.227
Average existing. The average existing building model insulation and air-leakage
metrics are based on the insulation and leakage values from each vintage period in the
Title 24 Residential Appliance manual228 and the percentage of homes associated with
those vintage periods in the 2009 RASS.229 The window U-factor (rate of heat loss for
227 California Energy Commission. 2019 Residential Alternative Calculation Method Reference Manual (CBECC-Res)
228 California Energy Commission. January 2017. 2016 Residential Compliance Manual, Table 8-1.
229 California Energy Commission. April 2010. Residential Appliance Saturation Survey 2009 Banner subset — CEC Forecast Zone and RASS Total.
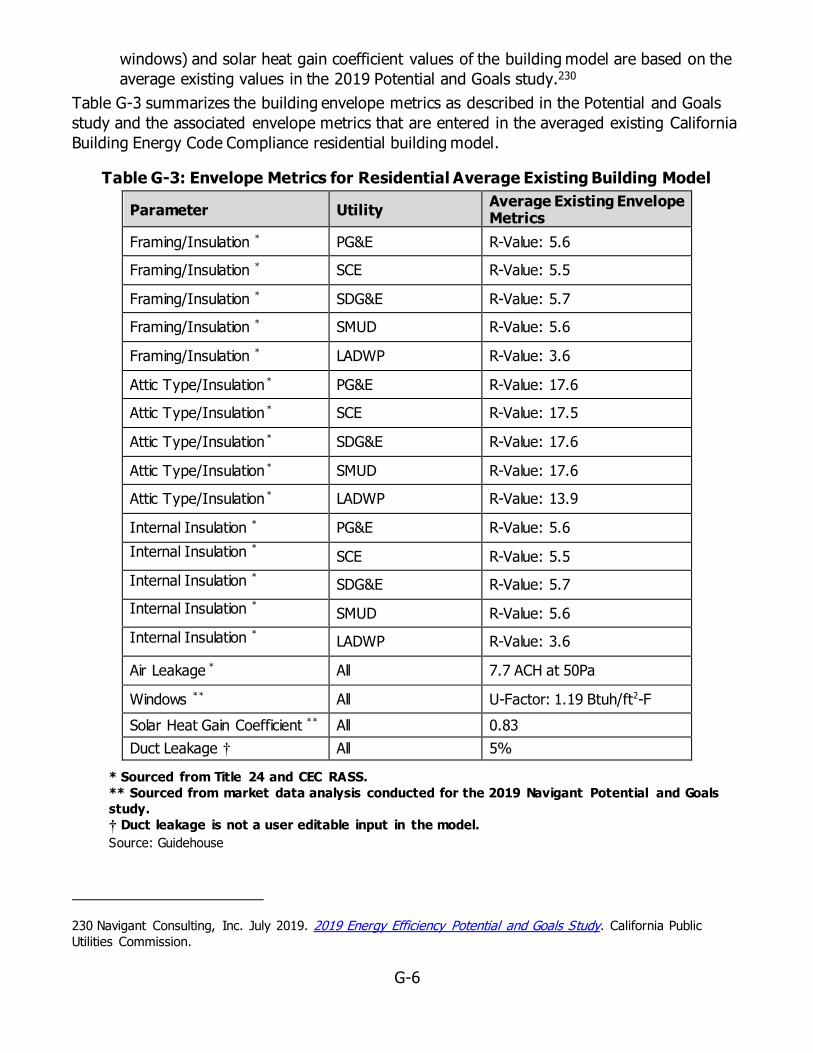
G-6
windows) and solar heat gain coefficient values of the building model are based on the
average existing values in the 2019 Potential and Goals study.230
Table G-3 summarizes the building envelope metrics as described in the Potential and Goals
study and the associated envelope metrics that are entered in the averaged existing California
Building Energy Code Compliance residential building model.
Table G-3: Envelope Metrics for Residential Average Existing Building Model
Parameter Utility Average Existing Envelope Metrics
Framing/Insulation * PG&E R-Value: 5.6
Framing/Insulation * SCE R-Value: 5.5
Framing/Insulation * SDG&E R-Value: 5.7
Framing/Insulation * SMUD R-Value: 5.6
Framing/Insulation * LADWP R-Value: 3.6
Attic Type/Insulation * PG&E R-Value: 17.6
Attic Type/Insulation * SCE R-Value: 17.5
Attic Type/Insulation * SDG&E R-Value: 17.6
Attic Type/Insulation * SMUD R-Value: 17.6
Attic Type/Insulation * LADWP R-Value: 13.9
Internal Insulation * PG&E R-Value: 5.6
Internal Insulation * SCE R-Value: 5.5
Internal Insulation * SDG&E R-Value: 5.7
Internal Insulation * SMUD R-Value: 5.6
Internal Insulation * LADWP R-Value: 3.6
Air Leakage * All 7.7 ACH at 50Pa
Windows ** All U-Factor: 1.19 Btuh/ft2-F
Solar Heat Gain Coefficient ** All 0.83
Duct Leakage † All 5%
* Sourced from Title 24 and CEC RASS.
** Sourced from market data analysis conducted for the 2019 Navigant Potential and Goals
study.
† Duct leakage is not a user editable input in the model.
Source: Guidehouse
230 Navigant Consulting, Inc. July 2019. 2019 Energy Efficiency Potential and Goals Study. California Public
Utilities Commission.

G-7
Commercial Heat Pump Model Parameters
The research team developed commercial heat pump load shapes for lodging, office,
restaurant, retail, and miscellaneous building types. The commercial buildings selected for
modeling are building types with the most opportunity for heat pump adoption in the
commercial sector.231
The team modeled commercial heat pumps using code-compliant prototypical building models
in the California Building Energy Code Compliance commercial model. While researchers
believe the load shape from this vintage is enough for approximating heat pump hourly load in
the commercial sector at this level of effort, understanding heat pump hourly load and
performance in the average existing building as well will become more important as
commercial heat pump penetration grows in the existing commercial building stock.
Table G-4 displays the envelope metrics used to develop the code-compliant building models
for the commercial sector. These models are run in different climate zone conditions to
approximate heat pump hourly load by utility.
Table G-4: Envelope Metrics for Commercial Code-Compliant Building Model
Parameter Lodging Office Restaurant Retail Miscellaneous
Exterior Wall R-Value: 14 R-Value: 14 R-Value: 14 R-Value: 14 R-Value: 14
Roof R-Value: 14 R-Value: 14 R-Value: 14 R-Value: 14 R-Value: 14
Exterior Floor R-Value: 10 N/A* R-Value: 10 N/A* N/A*
Interior Wall N/A* N/A* N/A* R-Value: 11 N/A*
*There is no option to modify this parameter in the California Building Energy Code
Compliance commercial 2019 model.
Source: Guidehouse
231 Navigant. 2019. Research, Development, and Demonstration (RD&D) Opportunities for Heat Pump Technologies, delivered to the California Energy Commission.

H-1
APPENDIX H:
Hourly Impacts Method
The primary purpose of the hourly impacts tool is to break down annual electrical energy
savings (load additions) or GHG emissions abated to an hourly impacts level based on
available load shapes at a utility, sector, and end-use level. To complete this work, research
team staff worked with the CEC to:
1. Map available load shapes to utility, sector, and end-use combinations.
2. Tailor existing load shapes where needed at the utility, sector, and end-use levels to
complete the load shape library.
3. Develop a tool that automates the process of applying annual values to hourly load
shapes and produces an hourly impacts output.
The development of this tool originated to break down AAEE savings to hourly impacts. The
description in this appendix applies to the AAEE hourly impact analysis and fuel substitution
hour load increase impacts.
Hourly Impacts Segmentation and Mapping
Segmentation
The research team worked with CEC staff to develop a set of named end uses at the utility
and sector levels deemed representative of AAEE savings and fuel substitution. The
representative set of utility, sector, and end-use combinations are included in Table H-1. This
set also aligns with the SB 350 beyond-utility-savings segmentation. No specific load shapes
were developed for the POUs, except for SMUD and LADWP. The representative set of sector
and end-use combinations apply to PG&E, SCE, SDG&E, LADWP, SMUD, and a general POU
category.
Table H-1: AAEE Hourly Impacts Segmentation
Sector End Use
Commercial Whole Building
Commercial HVAC – Cooling
Commercial HVAC – Heating
Commercial HVAC – Ventilation
Commercial HVAC – Controls
Commercial HVAC – General
Commercial HVAC – Heat Pump
Commercial Cooking
Commercial Lighting – General
Commercial Lighting – Indoor Equipment

H-2
Sector End Use
Commercial Lighting Indoor Controls
Commercial Lighting Outdoor
Commercial Office Equipment
Commercial Refrigeration
Commercial Water Heating
Commercial Heat Pump Water Heater
Commercial Machine Drive
Commercial Behavior
Commercial Miscellaneous
Residential HVAC – Cooling
Residential HVAC – Heating
Residential HVAC – General
Residential HVAC – Heat Pump
Residential Whole Building
Residential Plug Load – Appliance
Residential Plug Load – Consumer Electronics
Residential Refrigerator/Freezer
Residential Miscellaneous
Residential Behavior
Residential Water Heating
Residential Heat Pump Water Heater
Residential Lighting – Indoor Controls
Residential Lighting – General
Residential Lighting – Indoor Equipment
Residential Lighting Outdoor
Agricultural Lighting
Agricultural Machine Drive
Agricultural Process Refrigeration
Agricultural Whole Building
Agricultural Miscellaneous
Industrial Lighting
Industrial Machine Drive
Industrial HVAC
Industrial Process Heat
Industrial Whole Building
Industrial Miscellaneous

H-3
Sector End Use
Mining Oil & Gas Extraction
Streetlighting Streetlighting
Source: Guidehouse
To develop hourly impacts for the POUs, the research team mapped each POU to an IOU
based on its geographic proximity. Table H-2 shows the mapping used to develop POU hourly
impacts.
Table H-2: IOU to POU Map
POU IOU
Modesto PG&E
Roseville PG&E
Palo Alto PG&E
San Francisco PG&E
Santa Clara PG&E
Turlock PG&E
Redding PG&E
NorCal Other PG&E
Glendale SCE
Burbank SCE
Anaheim SCE
Imperial SCE
Riverside SCE
Pasadena SCE
Vernon SCE
SoCal Other SCE
Source: Guidehouse
Tool Inputs, Calculations, and Outputs
The hourly impacts tool takes in a set of load shape, savings, and mapping inputs; calculates
hourly impacts; and outputs the resultant impacts to an Excel workbook. This process is shown
at a high level in Figure H-1 and detailed throughout this section.
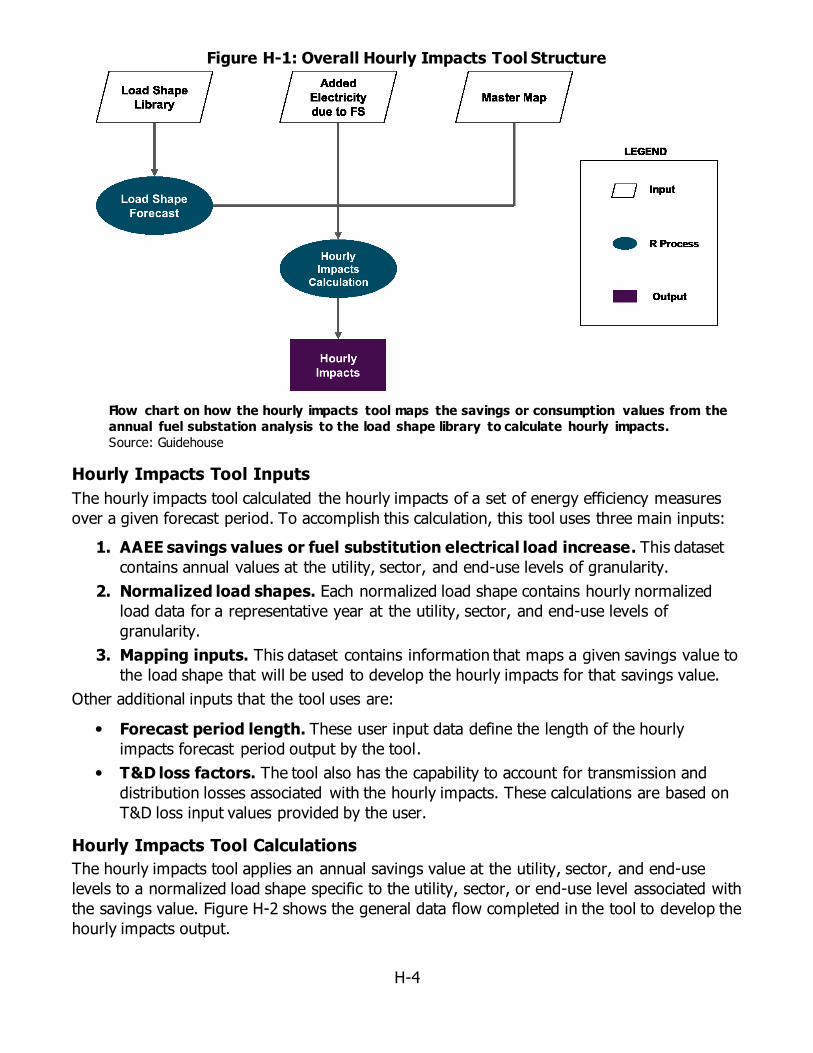
H-4
Figure H-1: Overall Hourly Impacts Tool Structure
Flow chart on how the hourly impacts tool maps the savings or consumption values from the
annual fuel substation analysis to the load shape library to calculate hourly impacts.
Source: Guidehouse
Hourly Impacts Tool Inputs
The hourly impacts tool calculated the hourly impacts of a set of energy efficiency measures
over a given forecast period. To accomplish this calculation, this tool uses three main inputs:
1. AAEE savings values or fuel substitution electrical load increase. This dataset
contains annual values at the utility, sector, and end-use levels of granularity.
2. Normalized load shapes. Each normalized load shape contains hourly normalized
load data for a representative year at the utility, sector, and end-use levels of
granularity.
3. Mapping inputs. This dataset contains information that maps a given savings value to
the load shape that will be used to develop the hourly impacts for that savings value.
Other additional inputs that the tool uses are:
Forecast period length. These user input data define the length of the hourly
impacts forecast period output by the tool.
T&D loss factors. The tool also has the capability to account for transmission and
distribution losses associated with the hourly impacts. These calculations are based on
T&D loss input values provided by the user.
Hourly Impacts Tool Calculations
The hourly impacts tool applies an annual savings value at the utility, sector, and end-use
levels to a normalized load shape specific to the utility, sector, or end-use level associated with
the savings value. Figure H-2 shows the general data flow completed in the tool to develop the
hourly impacts output.

H-5
Figure H-2: The Data and Calculation Flow of the Hourly Impacts Tool
Note: Values are illustrative.
Visual depiction of the hourly impacts tool calculation where the annual value is
disaggregated to the hourly value using the normalized load shape. Then the calculator
multiples the hourly value with the transmission and distribution loss factors to calculate the
hourly impact.
Source: Guidehouse
The tool is written in the R programming language, so all data flow and calculations are
completed in the R Foundation for Statistical Computing environment. As the number of values
and associated load shapes grow, the data handling associated with developing hourly impacts
become too intensive for traditional data handling programs like Microsoft Excel. Handling
these calculations in the R environment is more efficient and, in part, automates the process
of developing the hourly impacts.
Hourly Impacts Tool Outputs
The output of the hourly impacts tool is provided at the utility, sector, or end-use level by year
based on the output selected by the user. The tool produces either a simple output or a
detailed output based on a user’s selection.
Simple output. The simple output provides the hourly impacts at a scenario, utility,
and sector level aggregation. This output is less computationally intensive; it is
preferable if all quality control/review is complete, and the user would like to quickly
output finalized results. The simple output also prints all inputs to the tool as a record
for the output run.
Detailed output. The detailed output contains all the same information provided in
the simple output but also includes hourly impacts at the end-use level. This output is
more computationally intensive but is useful for quality control/review. The detailed
output is expected to take longer than five minutes to process for most savings inputs.

I-1
APPENDIX I:
Glossary
A Amperes: Unit of electric current or the rate of electron flow
AAEE
Additional achievable energy efficiency: An accounting for future
potential installed energy efficiency savings in the California energy
demand forecast.
AB Assembly Bill
AC Air conditioning
AFUE Annual fuel utilization efficiency: AFUE is a measure of gas furnace
efficiency.
AMI
Advanced metering infrastructure: AMI refers to the two-way communication between utilities and customers with full measurement
and data collection systems. AMI also enables collecting consumption
data at the subhourly level.
BCZ
Building climate zone: There are 16 in California based on energy use,
temperature, weather, and other factors. Each one has unique conditions that dictates which minimum efficiency requirements are
needed.
Benefit-cost ratio
Most utility programs are measured by a benefit-cost ratio. The benefits are typically energy savings, and the costs can be the
measure installation costs and program administrator costs.
Berkeley Lab Lawrence Berkeley National Laboratory
BUILD
Building Initiative for Low-Emissions Development by providing incentives for electric space and water heat pumps, solar hot water
with electric backup, heat pump dryers, and induction cooktops with a
specific allocation to income-eligible energy users, too.
Btu
British thermal unit: Btu is a measurement of heat energy. One Btu of heat is required to raise the temperature of one pound of water 1°
Fahrenheit.
Capital recovery
factor Ratio of the present value of a series of equal annual cost allocation.
CBECS
Commercial Buildings Energy Consumption Survey: CBECS is a national survey on the commercial building stock, including their
energy-related building characteristics and energy usage data.
CCA
Community choice aggregator: Local governments that procure power on behalf of their residents, businesses, and municipal properties from
a non-investor-owned utility supplier.

I-2
CEC California Energy Commission
CEF Combined energy factor: The CEF is the energy performance metric
for clothes dryers.
CHP Combined heat and power: CHP is also known as cogeneration. It is
the simultaneous production of electricity and useful thermal energy.
CO2
Carbon dioxide: Carbon and greenhouse gas (GHG) are used interchangeably. Carbon dioxide is one type of GHG. GHG emissions are typically quantified in terms of metric ton of carbon dioxide
equivalent (mtCO2e). The conversation of emissions for each GHG to
mtCO2e uses a global warming potential (GWP) factor.
COP Coefficient of performance: COP is the ratio of useful heating or
cooling provided to work required.
CPUC California Public Utilities Commission
Demand-side Term used to describe customer energy use on the customer side of
the utility meter.
Density
The scaling to identify the quantity of the technology or the capacity within the population. Typically, it is per household for homes and per
square foot for commercial.
DER
Distributed energy resources, “defined as distribution-connected
distributed generation resources, energy efficiency, energy storage,
electric vehicles, and demand response technologies.”232
DOE U.S. Department of Energy
DR
Demand response: DR is a voluntary program that end users may
participate in to reduce their electricity usage during a period of
higher prices.
EER Energy efficiency ratio: EER is the ratio of output cooling energy (in
Btu) to input electrical energy (in watts).
Emissions intensity
factor or emissions
factor
Representative value to relate emissions of a pollutant, for example
carbon dioxide, to an activity, for example electricity generation.
EF
Energy factor: Measurement of the energy efficiency of a water heater where the amount of energy the water heater makes divided by the
total amount of energy that powered the unit.
End user Consumers of utility electricity or natural gas.
232 California Public Utilities Commission. May 2017. “California’s Distributed Energy Resources Action Plan:
Aligning Vision and Action.”
I-3
EUI
Energy use intensity: EUI refers to the energy use intensity at the building or end-use level, typically expressed as an energy unit per
household for residential and per square feet for nonresidential.
EUL Effective useful life: EUL is characterized as the median length of time
(in years) that an energy efficiency measure is in place and operable.
EV Electric vehicle
FCZ Forecasting climate zone: 20 electricity planning areas to support
demand forecasting.
FSSAT
Fuel substitution scenario analysis tool: FSSAT is a software tool that implements a framework to assess the following impacts of fuel substitution on the five largest California electric utilities: decreased
natural gas use, increased electricity use, emissions impacts, and cost
implications.
GHG Greenhouse gas
GWh Gigawatt hours (1,000,000 kWh) — unit of electricity use
GWP
Global warming potential compares the global warming impacts of one ton of different gases relative to one tonne of CO2. CO2 has a
GWP of 1.
HERS Home energy rating system
HFC Hydrofluorocarbon is a greenhouse gas typically used as a refrigerant.
HSPF Heating seasonal performance factor
HVAC Heating, ventilation, and air conditioning
IEPR Integrated Energy Policy Report: The IEPR assesses the major energy
trends in California.
IOU Investor-owned utility. An IOU is a private electricity and/or natural
gas provider.
kBtu 1,000 British thermal units
kWh kilowatt hours — unit of electricity use
LADWP Los Angeles Department of Water and Power
mTCO2e Metric ton of carbon dioxide equivalent. One metric ton is 1,000
kilograms.
MMTCO2e Million metric tons of carbon dioxide equivalent.
Net-to-gross
Net-to-gross is the ratio of the changes in energy use directly
attributable to the program intervention to the changes in energy
consumption calculated by the program activities.
NG Natural gas
NREL National Renewable Energy Laboratory
I-4
PG&E Pacific Gas and Electric
POU Publicly owned utility: A POU is subject to local public control and
regulation.
PTHP Packaged terminal heat pump: PTHPs are a through the wall,
ductless, all-in-one heating and cooling unit.
PV Photovoltaic
RASS Residential Appliance Saturation Survey: RASS is a comprehensive
look at residential energy use collected by surveys of residents.
RECS
Residential Energy Consumption Survey: RECS is a national survey on housing units, including their energy-related characteristics, usage
patterns, and demographics.
Real discount rate
Rate of return used to discount to the present value of future cash
flows. The real discount rate removes the effects of inflation to reflect the real cost and is typically the nominal discount rate minus inflation
rate.
ROI Return on investment
Saturation Defines the fraction of the stock that is represented by the efficient
technology.
SB Senate Bill
SCE Southern California Edison
SDG&E Sand Diego Gas & Electric
SEER
Seasonal energy efficiency ratio: SEER is an efficiency rating at which air conditioners produce cooling. It is the ratio of the amount of cooling produced (Btu) divided by the amount of electricity (watts)
used.
SMUD Sacramento Municipal Utility District
SoCal Gas Southern California Gas
T&D Transmission and distribution
TECH
The Technology and Equipment for Clean Heating goal is to deploy low-emissions space and water heating equipment for new and
existing homes, mostly through the upstream market, consumer education, and contractor and vendor training via incentives to the
upstream and midstream channels.
therms Unit of heat used to measure gas consumption. It is equivalent to
100,000 Btu.

I-5
Time-dependent
valuation (TDV)
Metric to incorporate nonenergy impacts into the cost of energy during a given hour of the year. The resulting TDV aligns energy
savings for the end users with the cost of producing and delivering
energy to consumers.
Unit basis Value depends on referenced technology — for example, dishwasher
is per unit and heat pumps are capacity tons.
J-1
APPENDIX J:
Reference List
Advanced Energy Rebuild, https://cahp-pge.com/advanced-energy-rebuild/
Alvarez, Ramon et al. 2018. Assessment of methane emissions from the U.S. oil and gas supply chain, Science, vol. 361, no. 6398, July 13.
Armstrong, Sean. 2019. Retrofit-Ready Electrification - The Fast and Cheap Way. Berkeley, CA,
July 11.
California Public Utilities Commission. 2019. Decision Modifying The Energy Efficiency Three-Prong Test Related to Fuel Substitution. San Francisco, California, June 28.
California Public Utilities Commission. 2018. R.13-11-005 CAP/JF2/VUK/lil. California, April 26.
Energy and Environmental Economics, Inc. (E3). 2019. Residential Building Electrification in California Consumer economics, greenhouse gases and grid impacts. San Francisco,,
California, April.
Frontier Energy. 2018. Existing Building Efficiency Upgrade Cost-Effectiveness Study. California, June 8.
Greentech Media (GTM). 2018. Electric Heating Accelerates the Push for Deep Decarbonization, but Cost Remains an Issue. June 18.
https://www.greentechmedia.com/articles/read/electric-heating-deep-decarbonization-
cost.
LBNL, Lawrence Berkeley National Laboratory. 2018. Electrification of buildings and industry in the United States Drivers, barriers, prospects, and policy approaches. Berkeley,
California, March.
2019. Local Energy Codes. https://localenergycodes.com/.
Navigant, Navigant Consulting, Inc. 2018. Impacts of Residential Appliance Electrification. Boulder, Colorado, August 31.
NEEP. 2018. Developing A Pathway to Decarbonie Existing Buildings. December 11.
https://neep.org/blog/developing-pathway-decarbonize-existing-buildings.
New Buildings Institute for the Building Decarbonization Coalition. 2019. California Retrofit-Ready Heat Pump Water Heater Program Elements Framework. March 11.
NRDC. 2018. "Docket number19-BSTD-01: NRDC comments on the Draft 2019 ACM Reference
Manuals and Compliance Software Tools ."
NREL, National Renewable Energy Laboratory. 2017. Electrification Futures Study: End-Use Electric Technology Cost and Performance Projections through 2050. Golden, Colorado.
Opinion Dynamics. 2019. Senate Bill 1477. Waltham, Massachusetts, April 22.

J-2
Synapse, Synapse Energy Conomics, Inc. 2018. Decarbonization of Heating Energy Use in California Buildings Technology, Markets, Impacts, and Policy Solutions. California,
October.
TRC. 2019. 2016 Title 24 Nonresidential Alterations Reach Code Recommendations Report Cost Effectiveness Analysis for California Climate. California, March 29.
TRC. 2019a. "2022 CASE Initiative Workplan: Multifamily All-Electric Compliance Pathway."
TRC. 2018. City of Palo Alto 2019 Title 24 Energy Reach Code Cost Effectiveness Analysis. September 2018.
TRC. 2019b. Work Plan: Central Heat Pump Water Heater: 2020 CASE Initiative.
U.S. Census Bureau. 2019. "Census Reporter Profile page for California ." American Community Survey. August 23. http://censusreporter.org/profiles/04000us06-
california/.
Related Documents