FUEL PROPERTY IMPACT ON A PREMIXED DIESEL COMBUSTION MODE by Andrew M. Ickes A dissertation submitted in partial fulfillment of the requirements for the degree of Doctor of Philosophy (Mechanical Engineering) in the University of Michigan 2009 Doctoral Committee: Professor Dionissios N. Assanis, Co-Chair Assistant Research Scientist Stani V. Bohac, Co-Chair Professor James F. Driscoll Professor Volker Sick Patrick G. Szymkowicz, General Motors Corporation

Welcome message from author
This document is posted to help you gain knowledge. Please leave a comment to let me know what you think about it! Share it to your friends and learn new things together.
Transcript
FUEL PROPERTY IMPACT ON A PREMIXED DIESEL COMBUSTION MODE
by
Andrew M. Ickes
A dissertation submitted in partial fulfillment of the requirements for the degree of
Doctor of Philosophy (Mechanical Engineering)
in the University of Michigan 2009
Doctoral Committee:
Professor Dionissios N. Assanis, Co-Chair Assistant Research Scientist Stani V. Bohac, Co-Chair Professor James F. Driscoll Professor Volker Sick Patrick G. Szymkowicz, General Motors Corporation

© Andrew M. Ickes
2009

ii
ACKNOWLEDGEMENTS
As expected, there are many people whose contribution over the course of my graduate
studies bears acknowledgement. I am gratefully indebted to all who either contributed to
the work described within this dissertation or to me personally during the time spent
working on it.
First and foremost, I must thank Professor Dennis Assanis for the opportunity to work in
his laboratory and for his years of support. Additionally, I must acknowledge the
contributions of Research Scientist Stani Bohac, my other co-chair, who has provided
substantial guidance for this work. I am grateful for the financial support of General
Motors Corporation, who sponsored this work through the framework of the General
Motors/University of Michigan Collaborative Research Laboratory in Engine Systems
Research. I am additionally thankful for the technical reviews, planning, and intellectual
advice offered by staff of the GM Diesel Research group.
I must also recognize two people who have provided and coordinated opportunities that
have contributed significantly to where I am now: Scott Fiveland of Caterpillar, and
Professor Bryan Willson of Colorado State University.
I am ever so grateful for my longstanding friendship with Kristen Mills. A true friend,
and present through so much of my graduate school years.
Finally, but certainly not of least merit, I thank my family: my parents, who pushed me
over the years and whose support was absolutely essential, and my brother Nathan whom
I could commiserate with as we worked towards our degrees.
iii
TABLE OF CONTENTS
ACKNOWLEDGEMENTS ................................................................................................ ii LIST OF FIGURES ......................................................................................................... viii LIST OF TABLES ........................................................................................................... xiv
LIST OF ACRONYMS .................................................................................................... xv
ABSTRACT .................................................................................................................... xvii CHAPTER 1
INTRODUCTION AND MOTIVATION .......................................................................... 1
1.1 Engine Research and Development .......................................................................... 1
1.2 Exhaust Emission Regulatory Legislation ................................................................ 1
1.3 Addressing New Emissions Standards...................................................................... 4
1.3.1 Advanced Combustion Strategies ...................................................................... 4
1.3.2 Implementation in Production Engines .............................................................. 6
1.4 Project Objective and Motivation ............................................................................. 7
1.5 Expansion of Published Research ............................................................................. 7
1.6 Overview of Dissertation .......................................................................................... 9
CHAPTER 2
BACKGROUND .............................................................................................................. 10
2.1 Summary ................................................................................................................. 10
2.2 Premixed Diesel Combustion – Historical Perspective .......................................... 10
2.2.1 Required Combustion Properties ..................................................................... 11
2.2.2 Achieving Low Temperature Combustion ....................................................... 11
2.2.3 Achieving Premixed Combustion .................................................................... 11
2.3 Diesel Fuel .............................................................................................................. 14
2.3.1 Diesel Fuel Chemical Composition ................................................................. 14
2.3.2 Principal Fuel Property - Ignitability ............................................................... 15
iv
2.3.3 Legislated Diesel Fuel Properties .................................................................... 17
2.4 Fuel Property Effect on Conventional Diesel Combustion ..................................... 20
2.4.1 Influence on Mixing Process and Ignition Delay ............................................ 20
2.4.2 Cetane Number Effect...................................................................................... 21
2.4.3 Effect of Aromatics .......................................................................................... 23
2.5 Fuel Effect on Premixed Diesel Combustion – Existing Literature ....................... 25
CHAPTER 3
EXPERIMENTAL METHODS........................................................................................ 28
3.1 Experimental Setup ................................................................................................. 28
3.1.1 Engine System ................................................................................................. 28
3.1.2 Engine Swirl Control ....................................................................................... 30
3.1.3 Fuel Injection System ...................................................................................... 30
3.1.4 Intake System ................................................................................................... 31
3.1.5 Exhaust System ................................................................................................ 31
3.1.6 Exhaust Gas Recirculation ............................................................................... 32
3.1.7 Engine Coolant System .................................................................................... 32
3.1.8 Lubrication System .......................................................................................... 33
3.1.9 Fuel System ...................................................................................................... 33
3.1.10 Exhaust Emissions Measurement .................................................................. 33
3.1.11 Data Acquisition ............................................................................................ 34
3.2 Principal Operating Condition Development.......................................................... 35
3.2.1 Derivation of Single-Cylinder Equivalent Condition ...................................... 36
3.2.2 Operating Condition Parameters ...................................................................... 37
3.3 Measurements ......................................................................................................... 37
3.3.1 Gaseous Emissions Indexes ............................................................................. 37
3.3.2 EGR Rate ......................................................................................................... 38
3.3.3 Particulate Emissions ....................................................................................... 38
3.3.4 Equivalence Ratio ............................................................................................ 39
3.3.5 Intake Oxygen Concentration .......................................................................... 40
3.3.6 Combustion Efficiency .................................................................................... 40
3.3.7 Noise ................................................................................................................ 41
3.4 Heat Release Analysis Based Parameters ............................................................... 41
3.4.1 Heat Release Details ........................................................................................ 41
v
3.4.2 Ignition Delay .................................................................................................. 42
3.4.3 Combustion Phasing ........................................................................................ 44
3.5 Determination of Experimental Uncertainty ........................................................... 45
3.5.1 Combining Uncertainties and Uncertainty Propagation .................................. 46
3.5.2 Operating Range .............................................................................................. 47
3.5.3 Soot Emissions ................................................................................................. 47
3.5.4 Gaseous Emissions Indices .............................................................................. 48
3.5.5 Other Emissions-based Calculated Parameters ................................................ 49
3.5.6 Ignition Delay .................................................................................................. 49
3.5.7 Combustion Phasing ........................................................................................ 50
3.5.8 Temperatures.................................................................................................... 50
CHAPTER 4
FUEL CETANE NUMBER EFFECT .............................................................................. 51
4.1 Introduction ............................................................................................................. 51
4.2 Test Methodology ................................................................................................... 51
4.2.1 Test Fuels ......................................................................................................... 51
4.2.2 Operating Conditions ....................................................................................... 53
4.3 Results and Discussion ........................................................................................... 54
4.3.1 Effect on Combustion Behavior....................................................................... 54
4.3.2 Emissions as a Function of Combustion Phasing ............................................ 59
4.3.3 Emissions as a Function of Ignition Timing .................................................... 66
4.3.4 Maximum Rate of Pressure Rise and Combustion Noise ................................ 68
4.3.5 Combustion Efficiency .................................................................................... 70
4.3.6 Effect of Injection Pressure on Emissions ....................................................... 72
4.3.7 Acceptable Injection Timing Range ................................................................ 75
4.3.8 Perceived Emissions Trends with Fixed Injection Timing .............................. 79
4.4 Summary and Conclusions ..................................................................................... 83
CHAPTER 5
EFFECT OF 2-ETHYLHEXYL NITRATE CETANE IMPROVER .............................. 84
5.1 Introduction ............................................................................................................. 84
5.1.1 Overview .......................................................................................................... 84
5.1.2 Ignition Improvement Behavior ....................................................................... 85
vi
5.1.3 NOx Formation Mechanism ............................................................................. 86
5.1.4 Testing Motivation ........................................................................................... 87
5.2 Testing Methodology .............................................................................................. 87
5.2.1 Test Fuels ......................................................................................................... 87
5.2.2 Experimental Conditions ................................................................................. 89
5.3 Results and Discussion ........................................................................................... 90
5.3.1 Injector Fouling ................................................................................................ 90
5.3.2 General Combustion Behavior ......................................................................... 91
5.3.3 Cylinder Pressure – Cylinder Conditions ........................................................ 93
5.3.4 NOx Emissions ................................................................................................. 95
5.3.5 Carbon Monoxide and Hydrocarbon Emissions ............................................ 101
5.3.6 Particulate Emissions ..................................................................................... 103
5.4 Summary and Conclusions ................................................................................... 106
CHAPTER 6
PREMIXED DIESEL COMBUSTION LOAD LIMITS AND FUEL EFFECTS ......... 107
6.1 Introduction ........................................................................................................... 107
6.2 Test Methodology ................................................................................................. 108
6.2.1 Test Fuels ....................................................................................................... 108
6.2.2 Operating Conditions and Test Procedures.................................................... 108
6.3 Results and Discussion ......................................................................................... 110
6.3.1 Smoke Emissions ........................................................................................... 111
6.3.2 Carbon Monoxide and Hydrocarbon Emissions ............................................ 114
6.3.3 Peak Load Levels ........................................................................................... 116
6.3.4 Injection Timing Effect on Peak Load ........................................................... 117
6.3.5 Injection Pressure Effect on Peak Load ......................................................... 118
6.3.6 Peak Load Limitations ................................................................................... 120
6.3.7 Emissions-Based Oxidation Catalyst Implications ........................................ 121
6.4 Summary and Conclusions ................................................................................... 132
CHAPTER 7
SUMMARY, CONCLUSIONS, AND FUTURE RESEARCH DIRECTION .............. 134
7.1 Project Summary ................................................................................................... 134
7.2 Research Conclusions ........................................................................................... 135
vii
7.3 Recommended Future Research Direction ........................................................... 137
7.3.1 Expanded Fuel Matrix.................................................................................... 137
7.3.2 Enhanced Particulate Matter Investigation .................................................... 137
7.3.3 Expanding the Premixed Diesel Combustion Load Range ............................ 138
7.3.4 Diesel Oxidation Catalyst Behavior............................................................... 138
BIBLIOGRAPHY ........................................................................................................... 139
viii
LIST OF FIGURES
Figure 1: Single-cylinder GM Circle-L derivative diesel research engine ................. 29
Figure 2: Average versus cylinder 1 IMEP for operating condition on multi-cylinder engine. Tests at 3.75 bar IMEP with varied injection timing and injection pressure. Both average and cylinder one IMEP center around 5 bar IMEP. Data courtesy of Alex Knafl ....................................... 36
Figure 3: Start of injection location, defined as the location where injector current signal reaches 70% of opening value. 13 °BTDC injection timing shown................................................................................................ 42
Figure 4: Start of combustion location for cool-flame region, defined as the location where rate of heat release returns to zero after fuel evaporation endotherm. Condition is 40% EGR, 14 °BTDC injection timing, with US mid-cetane fuel ...................................................................................... 43
Figure 5: Start of combustion location for main combustion, defined as the location of 10% mass fraction burned. Condition is 40% EGR, 14 °BTDC injection timing, with US mid-cetane fuel ................................ 44
Figure 6: Interrelation of combustion phasing metrics, including location of peak burn rate (a) and location of peak pressure (b) versus location of 50% mass fraction burned. Timing sweeps at 40% EGR with varied US fuels .............................................................................................................. 45
Figure 7: Distillation curves for the four cetane number test fuels. Error bars are withheld for figure clarity. Uncertainty levels are set by the ASTM D86 standard (ASTM, D86), with uncertainty range as follows: ± 3-6 °C (repeatability), and ± 8-16 °C (reproducibility) ............................ 53
Figure 8: Mean ignition delays for each fuel at varying EGR mass fractions. (a) Cool-flame ignition delay. (b) Main combustion ignition delay. Ignition delays averaged across timing sweep at given EGR level ............. 54
ix
Figure 9: Rate of heat release traces showing behavior in cool-flame region. Cool flame is the heat release following the endotherm caused by fuel evaporation and heating but prior to the main heat release. Condition is 40% EGR, 1000 bar injection pressure, 15 °BTDC injection timing. Plotted against crankangle degrees after start of injection (ASOI) ............. 56
Figure 10: Location of 50% MFB versus injection timing. Injection timing sweeps at 40% EGR, 1000 bar injection pressure, varied fuels ............................... 58
Figure 11: NOx emissions versus combustion phasing at 40% EGR. Injection timing sweeps at 1000 bar injection pressure, varied fuels ......................... 60
Figure 12: Peak pressure versus combustion phasing. Injection timing sweeps at 40% EGR, 1000 bar injection pressure, varied fuels ................................... 60
Figure 13: NOx emissions versus combustion phasing with 45% EGR. Injection timing sweeps at 1000 bar injection pressure, varied fuels ......................... 63
Figure 14: CO (a) and HC (b) emissions versus combustion phasing at 40% EGR. Injection timing sweeps at 1000 bar injection pressure, varied fuels .......... 64
Figure 15: CO (a) and HC (b) emissions versus combustion phasing at 45% EGR. Injection timing sweeps at 1000 bar injection pressure, varied fuels .......... 66
Figure 16: Combustion phasing versus start of combustion. Injection timing sweeps at 40% EGR, 1000 bar injection pressure, varied fuels .................. 67
Figure 17: NOx emissions versus start of combustion. Injection timing sweeps at 40% EGR, 1000 bar injection pressure, varied fuels ................................... 67
Figure 18: Maximum pressure rise rate versus combustion phasing. Injection timing sweeps at 40% EGR, 1000 bar injection pressure, varied fuels ....... 68
Figure 19: Combustion noise versus combustion phasing. Injection timing sweeps at 40% EGR, 1000 bar injection pressure, varied fuels ............................... 69
Figure 20: Combustion efficiency versus combustion phasing. Injection timing sweeps at 40% EGR, 1000 bar injection pressure, varied fuels .................. 71
Figure 21: Normalized injection duration versus combustion phasing. Injection timing sweeps at 40% EGR, 1000 bar injection pressure, varied fuels. Commanded injection durations are normalized against the injection duration which yields 90 dB combustion noise for a specific fuel .............. 72
Figure 22: Combustion phasing versus injection pressure. US high cetane fuel, 40% EGR, 15° BTDC injection timing ....................................................... 73
x
Figure 23: Injection pressure effect on gaseous emissions referenced to combustion phasing sweep. (a) NOx, (b) CO, (c) HC. US high cetane test fuel, 40% EGR. Injection pressure sweep conducted at 14 °BTDC injection timing. ‘HCN’ and ‘HCN Retest’ were identical timing sweeps conducted a week apart ................................................................... 74
Figure 24: Smoke emissions versus injection pressure. US high cetane fuel, 40% EGR, 15 °BTDC injection timing ................................................................ 75
Figure 25: Acceptable injection timing window for the test fuels at different EGR levels and 1000 bar injection pressure. Injection advance limit: combustion noise less than 90 dB. Injection retard limit: loss of recoverable power ........................................................................................ 77
Figure 26: Combustion noise versus combustion phasing. All tested data plotted, including variations in fuel cetane number, injection timing, injection pressure, and EGR flow rate. Gray band covers data points in excess of the 90 dB noise limit .................................................................................... 79
Figure 27: Cylinder pressure and rate of heat release traces at fixed injection timing. (a) Cylinder pressure, (b) Rate of heat release. US certification fuels, 40% EGR, 15 °BTDC injection timing .............................................. 80
Figure 28: Perceived cetane number effect on NOx emissions with fixed injection timing. (a) Apparent NOx effect, (b) NOx effect within context of combustion phasing. Injection timing sweeps with US certification fuels. Apparent effect noted at only overlapping injection timing: 15 °BTDC. Swedish fuel extrapolated to matching timing – actual data not measured ................................................................................................ 81
Figure 29: Perceived cetane number effect on CO/HC emissions with fixed injection timing. (a) Apparent CO effect, (b) CO effect within context of combustion phasing, (c) Apparent HC effect, (d) HC effect within context of combustion phasing. 40% EGR. Injection timing sweeps with US certification fuels. Apparent effect noted at only overlapping injection timing: 15 °BTDC ......................................................................... 82
Figure 30: Chemical structure of 2-ethylhexyl nitrate molecule ................................... 84
Figure 31: Distillation curves for different test fuels. (a) Matched set of 53 CN fuels. (b) Matched set of 47 CN fuels. Error bars are withheld for figure clarity. Uncertainty levels are set by the ASTM D86 standard (ASTM, D86), with uncertainty range as follows: ± 3-6 °C (repeatability), and ± 8-16 °C (reproducibility) ............................ 89
xi
Figure 32: Location of 50% MFB (CA50) versus start of injection for fuels with matching cetane number of 53. (a) 40% EGR condition. (b) 45% EGR condition. There is a time-dependent injector fouling effect on the HCN+EHN fuel data set, resulting in the increasingly delayed 50% MFB location. Timing sweeps were run in retarding direction, with the 40% EGR dataset run before the 45% EGR case. Injection timing sweeps at 1000 bar injection pressure. Fitlines solely for illustrative purposes – no specific relation implied ....................................................... 92
Figure 33: Location of 50% MFB (CA50) versus start of injection for fuels with matching cetane number of 47. (a) 40% EGR condition. (b) 45% EGR condition. Injection timing sweeps at 1000 bar injection pressure .............. 93
Figure 34: Peak cylinder pressure versus location of 50% MFB (CA50) for fuels with matching cetane number of 53. (a) 40% EGR condition. (b) 45% EGR condition. Injection timing sweeps at 1000 bar injection pressure ..... 94
Figure 35: Representative matching cylinder pressure (a) and rate of heat release (b) traces for the 53 CN set of test fuels. Injection timing as follows: Swedish fuel and HCN+C (HCN doped with 15% n-cetane) at 13 °BTDC, and HCN+EHN (HCN doped with 1150 ppm 2-EHN) at 14 °BTDC .................................................................................................... 95
Figure 36: NOx emissions as a function of combustion phasing for matching cetane test fuels. Higher cetane (53 CN) fuels at (a) 40% EGR, (b) 45% EGR, and lower cetane (47 CN) fuels at (c) 40% EGR, (d) 45% EGR. Injection timing sweeps at 1000 bar injection pressure. Fitlines solely for illustrative purposes – no specific relation implied ..................... 96
Figure 37: NOx emissions with bounds of theoretical maximum NOx produced from EHN decomposition. High cetane (53 CN) fuels at (a) 40% EGR, (b) 45% EGR, and lower cetane (47 CN) fuels at (c) 40% EGR, (d) 45% EGR. Bounds calculated assuming all nitrogen from EHN in fuel exits as NOx. Fitlines for illustrative purposes – no specific relation implied ............................................................................................ 98
Figure 38: Carbon monoxide (a) and hydrocarbon (b) emissions for matched high cetane (53 CN) fuels at 40% EGR. Injection timing sweeps at 1000 bar injection pressure ....................................................................................... 102
Figure 39: Carbon monoxide (a) and hydrocarbon (b) emissions for matched high cetane (53 CN) fuels at 45% EGR. Injection timing sweeps at 1000 bar injection pressure ....................................................................................... 103
Figure 40: Smoke emissions for matched high cetane (53 CN) fuels. (a) 40% EGR, (b) 45% EGR. Injection timing sweeps at 1000 bar injection pressure. Fitlines solely for illustrative purposes – no specific relation implied ....................................................................................................... 104
xii
Figure 41: Smoke emissions versus engine load for four primary test fuels .............. 111
Figure 42: Equivalence ratio (φ) versus engine load for the four primary test fuels .. 112
Figure 43: Intake oxygen concentration versus engine load for the four primary test fuels ..................................................................................................... 113
Figure 44: Carbon monoxide (a) and hydrocarbon (b) emissions versus engine load............................................................................................................. 114
Figure 45: Carbon monoxide (a) and hydrocarbon (b) emissions concentrations versus engine load ...................................................................................... 115
Figure 46: Effect of injection timing on soot emissions and peak load conditions. Swedish fuel showed here – other fuels exhibited complementary behavior. Testing progression as follows: initial baseline point (A), followed by a two degree retard in injection timing (B), followed by increased injection duration (C) ................................................................. 117
Figure 47: Effect of injection pressure on soot emissions and peak load conditions. Swedish fuel showed here – all other fuels exhibited complementary behavior. Point A is baseline peak load condition taken at 1000 bar injection pressure. Points B-D used 1200 bar injection pressure, while points C-E-F used 1400 bar injection pressure. Testing progression as follows: initial point (A), increases injection pressure (B, C), increased injection duration (D, E-F) ............................................ 119
Figure 48: Smoke versus load conditions for varying intake manifold pressures. (a) Load sweep, (b) Increasing injection pressure at the higher MAP condition .................................................................................................... 121
Figure 49: Composite average CO (a) and HC (b) emissions used for calculation of required DOC conversion efficiencies .................................................. 124
Figure 50: Required DOC conversion efficiency versus engine load for different emissions standards. (a) Required CO conversion efficiency (Euro 5 and Euro 6 specify the same maximum CO levels), (b) Required HC conversion efficiency ................................................................................. 125
Figure 51: Light-off and light-down curves for CO and HC when subjected to exhaust gas from a PCI combustion mode. Figures reprinted with permission from Knafl (2007) with two-range fit lines added to represent the catalyst behavior. (a) CO conversion: light-off, (b) CO conversion: light-down, (c) HC conversion: light-off, (d) HC conversion: light-down .................................................................. 127
xiii
Figure 52: Exhaust gas port temperature (EGT) and turbine outlet temperature (TTO) plotted against combustion phasing. EGT measured on single-cylinder engine, and TTO measured on multi-cylinder engine (multi-cylinder engine data courtesy of Tim Jacobs). ‘TTO (calc)’ uses the correlation given in Equation 12, and is shown calculated for the four EGT levels plotted ..................................................................................... 128
Figure 53: Calculated turbine outlet temperature (TTO) versus engine load for the four test fuels ............................................................................................. 129
Figure 54: Required DOC conversion efficiency versus engine load along with estimated temperature-dependent catalyst light-off performance. (a) Required CO conversion efficiency (Euro 5 and Euro 6 specify the same maximum CO levels), (b) Required HC conversion efficiency. ‘DOC LO’ represents estimated delivered DOC conversion efficiency.... 130
Figure 55: Required DOC conversion efficiency versus engine load along with 92% DOC conversion level indicated. (a) Full view, (b) Close up of high conversion range ................................................................................ 132
Figure 56: Summary of test fuels used in this study ................................................... 134
Figure 57: Summary of test conditions used in this study. Solid points are primary conditions. Solid lines represent primary variation levels, with dashed lines being variations outside main region of investigation ...................... 135
xiv
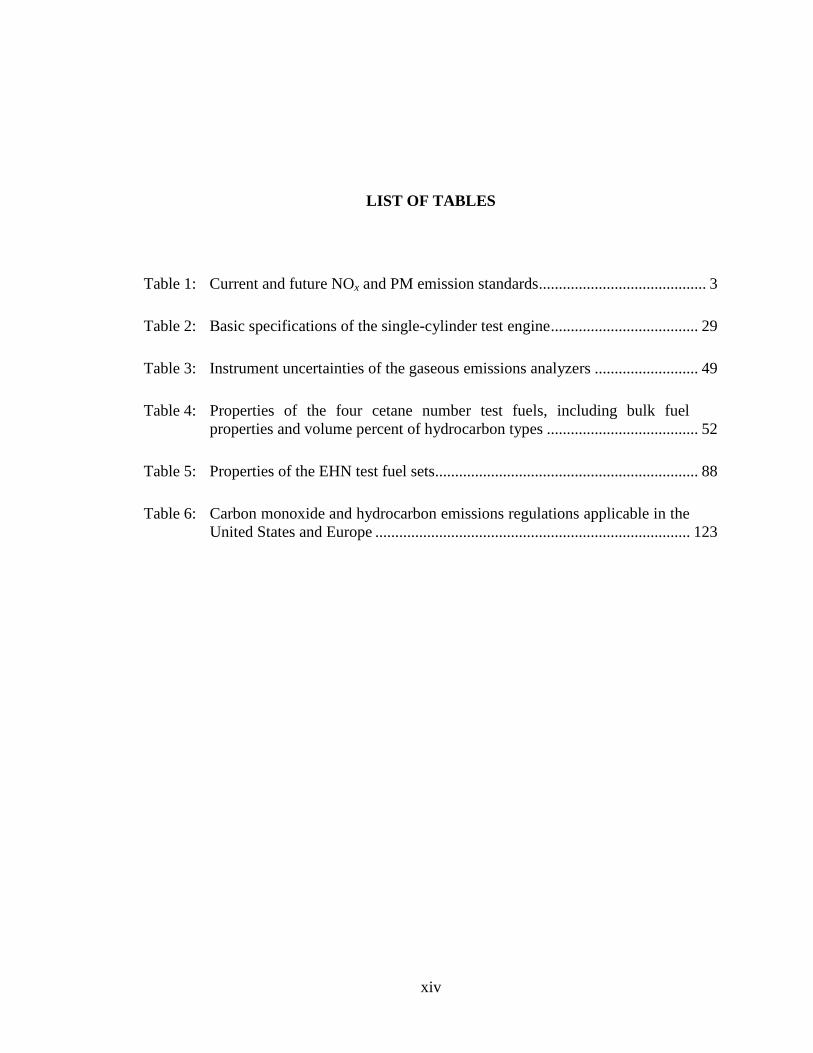
LIST OF TABLES
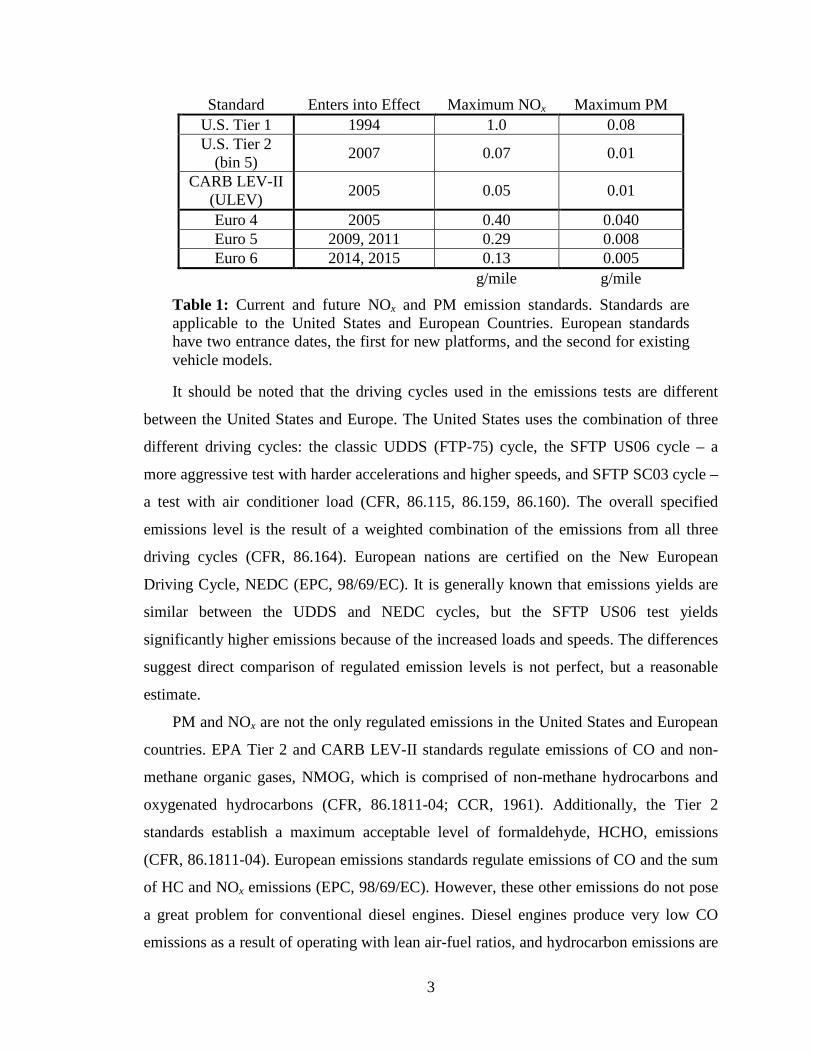
Table 1: Current and future NOx and PM emission standards .......................................... 3
Table 2: Basic specifications of the single-cylinder test engine ..................................... 29
Table 3: Instrument uncertainties of the gaseous emissions analyzers .......................... 49
Table 4: Properties of the four cetane number test fuels, including bulk fuel properties and volume percent of hydrocarbon types ...................................... 52
Table 5: Properties of the EHN test fuel sets .................................................................. 88
Table 6: Carbon monoxide and hydrocarbon emissions regulations applicable in the United States and Europe ............................................................................... 123
xv
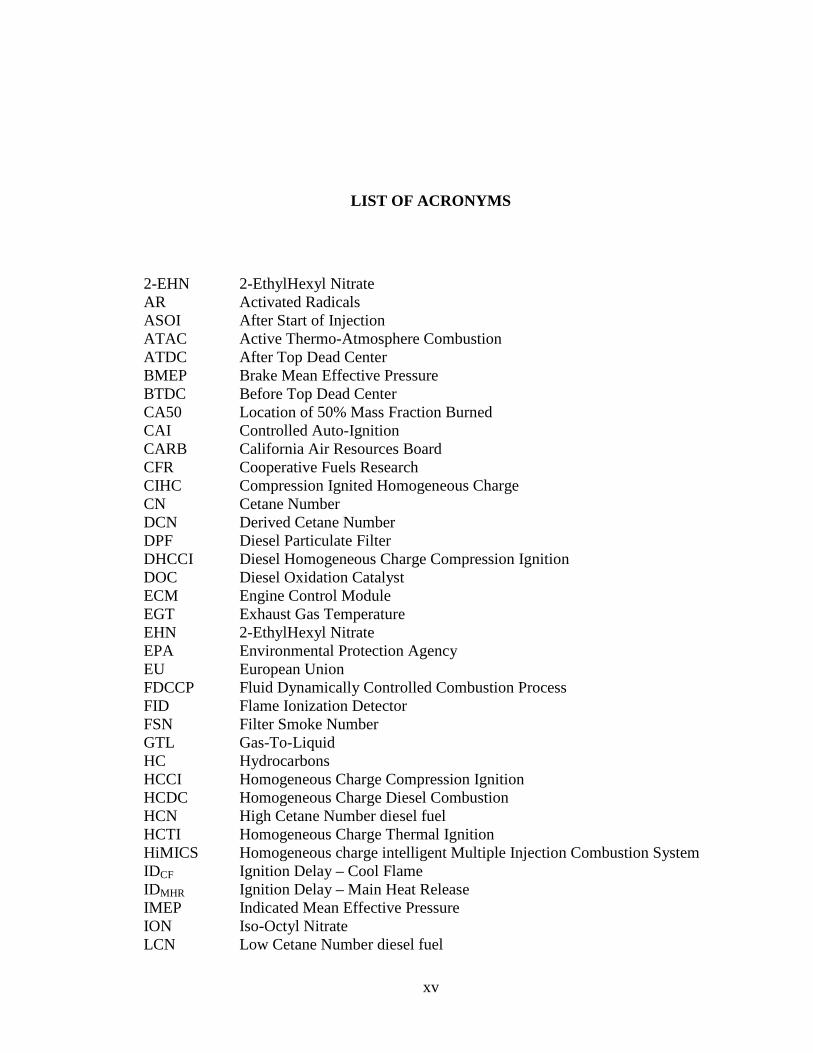
LIST OF ACRONYMS
2-EHN 2-EthylHexyl Nitrate AR Activated Radicals ASOI After Start of Injection ATAC Active Thermo-Atmosphere Combustion ATDC After Top Dead Center BMEP Brake Mean Effective Pressure BTDC Before Top Dead Center CA50 Location of 50% Mass Fraction Burned CAI Controlled Auto-Ignition CARB California Air Resources Board CFR Cooperative Fuels Research CIHC Compression Ignited Homogeneous Charge CN Cetane Number DCN Derived Cetane Number DPF Diesel Particulate Filter DHCCI Diesel Homogeneous Charge Compression Ignition DOC Diesel Oxidation Catalyst ECM Engine Control Module EGT Exhaust Gas Temperature EHN 2-EthylHexyl Nitrate EPA Environmental Protection Agency EU European Union FDCCP Fluid Dynamically Controlled Combustion Process FID Flame Ionization Detector FSN Filter Smoke Number GTL Gas-To-Liquid HC Hydrocarbons HCCI Homogeneous Charge Compression Ignition HCDC Homogeneous Charge Diesel Combustion HCN High Cetane Number diesel fuel HCTI Homogeneous Charge Thermal Ignition HiMICS Homogeneous charge intelligent Multiple Injection Combustion System IDCF Ignition Delay – Cool Flame IDMHR Ignition Delay – Main Heat Release IMEP Indicated Mean Effective Pressure ION Iso-Octyl Nitrate LCN Low Cetane Number diesel fuel
xvi
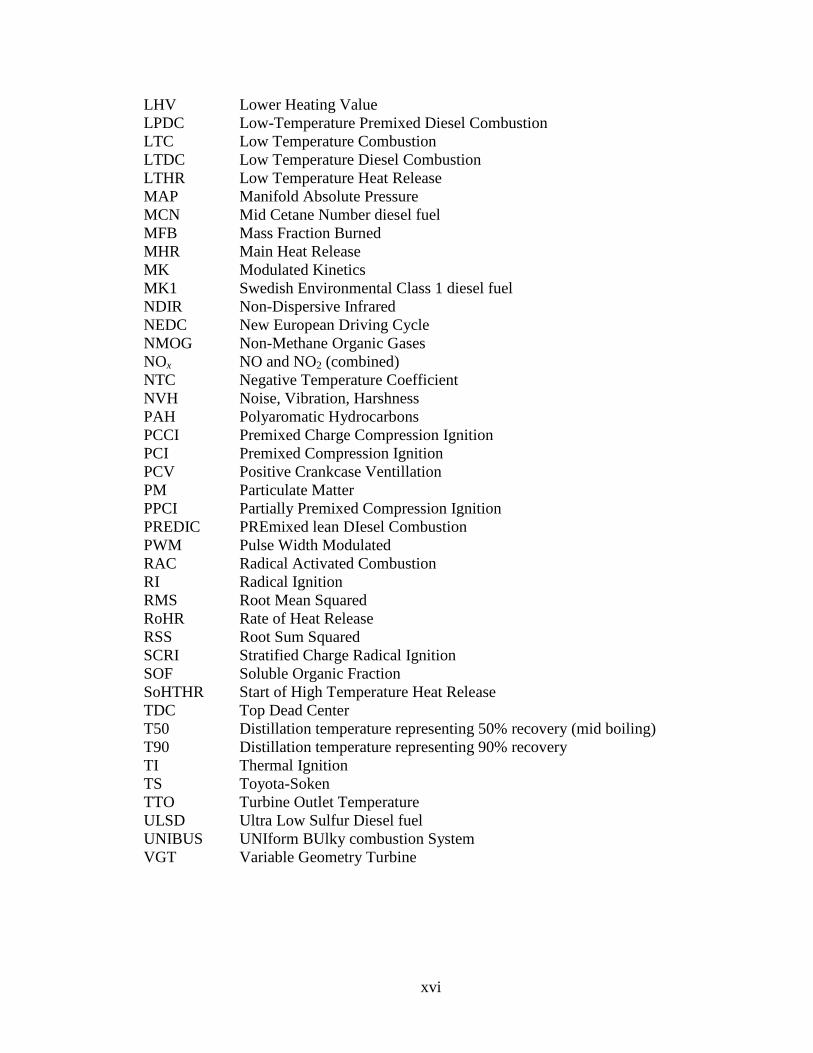
LHV Lower Heating Value LPDC Low-Temperature Premixed Diesel Combustion LTC Low Temperature Combustion LTDC Low Temperature Diesel Combustion LTHR Low Temperature Heat Release MAP Manifold Absolute Pressure MCN Mid Cetane Number diesel fuel MFB Mass Fraction Burned MHR Main Heat Release MK Modulated Kinetics MK1 Swedish Environmental Class 1 diesel fuel NDIR Non-Dispersive Infrared NEDC New European Driving Cycle NMOG Non-Methane Organic Gases NOx NO and NO2 (combined) NTC Negative Temperature Coefficient NVH Noise, Vibration, Harshness PAH Polyaromatic Hydrocarbons PCCI Premixed Charge Compression Ignition PCI Premixed Compression Ignition PCV Positive Crankcase Ventillation PM Particulate Matter PPCI Partially Premixed Compression Ignition PREDIC PREmixed lean DIesel Combustion PWM Pulse Width Modulated RAC Radical Activated Combustion RI Radical Ignition RMS Root Mean Squared RoHR Rate of Heat Release RSS Root Sum Squared SCRI Stratified Charge Radical Ignition SOF Soluble Organic Fraction SoHTHR Start of High Temperature Heat Release TDC Top Dead Center T50 Distillation temperature representing 50% recovery (mid boiling) T90 Distillation temperature representing 90% recovery TI Thermal Ignition TS Toyota-Soken TTO Turbine Outlet Temperature ULSD Ultra Low Sulfur Diesel fuel UNIBUS UNIform BUlky combustion System VGT Variable Geometry Turbine
xvii
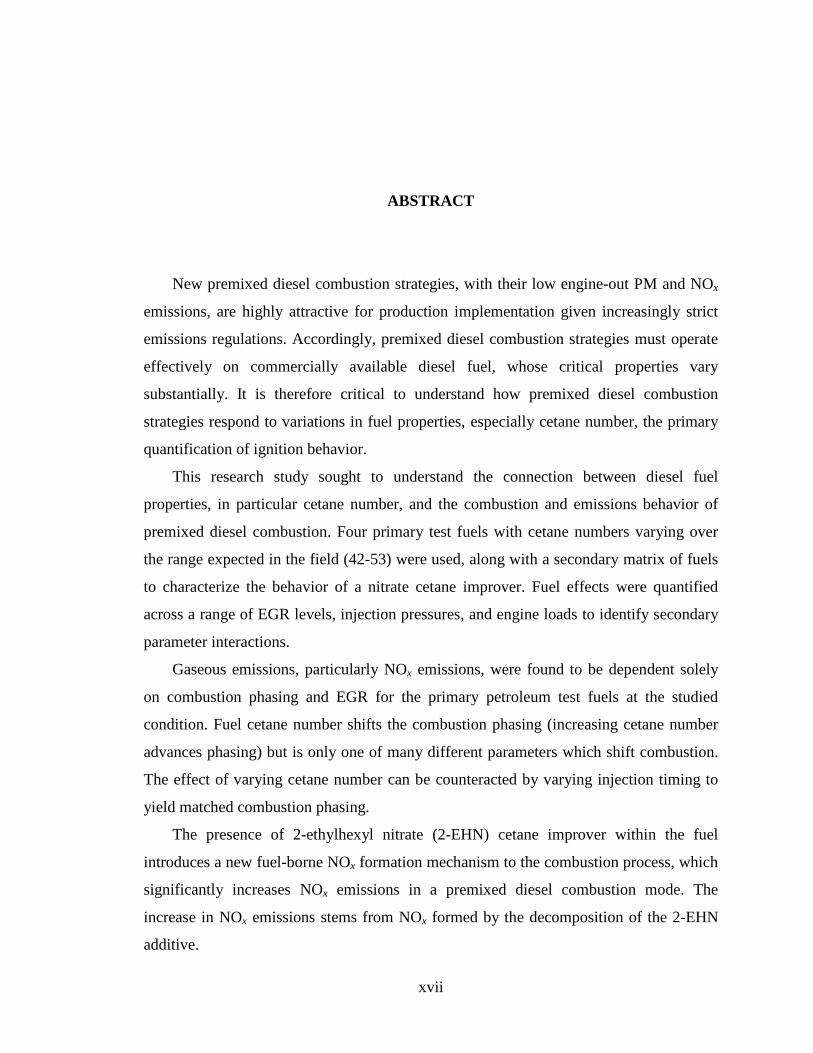
ABSTRACT
New premixed diesel combustion strategies, with their low engine-out PM and NOx
emissions, are highly attractive for production implementation given increasingly strict
emissions regulations. Accordingly, premixed diesel combustion strategies must operate
effectively on commercially available diesel fuel, whose critical properties vary
substantially. It is therefore critical to understand how premixed diesel combustion
strategies respond to variations in fuel properties, especially cetane number, the primary
quantification of ignition behavior.
This research study sought to understand the connection between diesel fuel
properties, in particular cetane number, and the combustion and emissions behavior of
premixed diesel combustion. Four primary test fuels with cetane numbers varying over
the range expected in the field (42-53) were used, along with a secondary matrix of fuels
to characterize the behavior of a nitrate cetane improver. Fuel effects were quantified
across a range of EGR levels, injection pressures, and engine loads to identify secondary
parameter interactions.
Gaseous emissions, particularly NOx emissions, were found to be dependent solely
on combustion phasing and EGR for the primary petroleum test fuels at the studied
condition. Fuel cetane number shifts the combustion phasing (increasing cetane number
advances phasing) but is only one of many different parameters which shift combustion.
The effect of varying cetane number can be counteracted by varying injection timing to
yield matched combustion phasing.
The presence of 2-ethylhexyl nitrate (2-EHN) cetane improver within the fuel
introduces a new fuel-borne NOx formation mechanism to the combustion process, which
significantly increases NOx emissions in a premixed diesel combustion mode. The
increase in NOx emissions stems from NOx formed by the decomposition of the 2-EHN
additive.
xviii
The trends and magnitudes of soot, CO, and HC emissions remain constant for all
tested fuels across a range of engine loads. The high load limit of the tested premixed
diesel combustion mode is primarily limited by equivalence ratio, with excessive soot,
CO, and HC emissions resulting as the overall equivalence ratio approaches
stoichiometric. The light load limit is limited by high CO and HC emissions and the
ability of a diesel oxidation catalyst to reduce these emissions to acceptable levels.
1
CHAPTER 1
INTRODUCTION AND MOTIVATION
1.1 Engine Research and Development
The motivation for engine research and development has long been a balance
between legislated requirements and market forces. Since the introduction of the Clean
Air Act in 1970, ensuring that engines pass legislated emissions standards has been a
prime focus of research and development. However, the focus of engine research is also
directed by consumer requirements. Of interest to consumers is total lifetime vehicle cost,
which is comprised of several elements including initial equipment cost and usage costs
including the fuel and repair costs. Increasing the life of the equipment and reducing the
repair costs are prime goals of production development groups, and not particularly the
focus of research groups. However, fuel costs and initial costs are certainly elements that
affect engine research goals. Overall, the end desire is to minimize consumer cost by
minimizing the cost of the powertrain system, maximizing engine efficiency for high fuel
economy, while ensuring that the engine emissions are lower than the mandated
maximum levels.
1.2 Exhaust Emission Regulatory Legislation
Maximum allowable emissions from engines in vehicles used in the United States
are controlled by two standards: all vehicles must meet the levels prescribed by the
Environmental Protection Agency (EPA), but vehicles registered in California, and other
states that adopted the California emissions standards, must also meet the standards set by
the California Air Resources Board (CARB).
2
Tier 2 emissions requirements set by the EPA for U.S. passenger vehicles specify the
same maximum level of emissions from vehicles with compression ignition diesel
engines and spark ignition gasoline engines. For vehicles made in 2007 and beyond,
whether gasoline or diesel, the new (bin 5) standards require the fleet average particulate
matter (PM) emissions be less than 0.01 g/mile, and the fleet average NOx (NO + NO2)
emissions be less than 0.07 g/mile (CFR, 86.1811-04). This is a change from the Tier 1
emissions standards, which came into effect in 1994. Under the older standard, PM
emissions was limited to 0.08 g/mile, eight times the level mandated under the new 2007
Tier 2 (bin 5) standards (CFR, 86.708-94). Furthermore, the Tier 1 emission standard
only required NOx emissions from a diesel engine be less than 1.0 g/mile, which is more
lax than the 0.04 g/mile that gasoline engines were required to achieve (CFR, 86.708-94).
Starting in 2005, vehicles sold and registered in California must meet the CARB
LEV-II emissions standards. Additionally, four other states (Maine, Massachusetts, New
York, and Vermont) have also adopted CARB’s LEV-II emissions standards. Five more
states are slated to adopt the LEV-II standards by 2009. LEV-II (ULEV) mandates PM
emission not exceed 0.01 g/mile, and NOx emissions not exceed 0.05 g/mile (CCR,
1961). The PM emission level required currently by the LEV-II standard is the same as
the Tier 2 (bin 5) US standard, but the required NOx level is even lower than Tier 2
(bin 5).
New emissions standards have also been set for European vehicles. Euro 4 emissions
standards implemented in 2005 mandate maximum PM emissions be less than
0.025 g/km (0.04 g/mile), and NOx emissions be less than 0.25 g/km (0.40 g/mile) (EPC,
98/69/EC). Euro 5 legislation that comes into effect for new cars in 2009 and existing
models in 2011, reduces these limits substantially, to 0.005 g/km (0.008 g/mile) for PM
emissions and 0.18 g/km (0.29 g/mile) for NOx emissions (EPC, 715/2007). Euro 6
regulations further reduces these limits for diesel passenger cars starting in 2014 for new
platforms and 2015 for existing vehicles. The Euro 6 emissions limits are 0.080 g/km
(0.13 g/mile) of NOx, and 0.003 g/km (0.005 g/mile) of particulates, with a new limit on
the number of particles added as well (EPC, 715/2007).
3
Standard Enters into Effect Maximum NOx Maximum PM U.S. Tier 1 1994 1.0 0.08 U.S. Tier 2
(bin 5) 2007 0.07 0.01
CARB LEV-II (ULEV) 2005 0.05 0.01
Euro 4 2005 0.40 0.040 Euro 5 2009, 2011 0.29 0.008 Euro 6 2014, 2015 0.13 0.005
g/mile g/mile
Table 1: Current and future NOx and PM emission standards. Standards are applicable to the United States and European Countries. European standards have two entrance dates, the first for new platforms, and the second for existing vehicle models.
It should be noted that the driving cycles used in the emissions tests are different
between the United States and Europe. The United States uses the combination of three
different driving cycles: the classic UDDS (FTP-75) cycle, the SFTP US06 cycle – a
more aggressive test with harder accelerations and higher speeds, and SFTP SC03 cycle –
a test with air conditioner load (CFR, 86.115, 86.159, 86.160). The overall specified
emissions level is the result of a weighted combination of the emissions from all three
driving cycles (CFR, 86.164). European nations are certified on the New European
Driving Cycle, NEDC (EPC, 98/69/EC). It is generally known that emissions yields are
similar between the UDDS and NEDC cycles, but the SFTP US06 test yields
significantly higher emissions because of the increased loads and speeds. The differences
suggest direct comparison of regulated emission levels is not perfect, but a reasonable
estimate.
PM and NOx are not the only regulated emissions in the United States and European
countries. EPA Tier 2 and CARB LEV-II standards regulate emissions of CO and non-
methane organic gases, NMOG, which is comprised of non-methane hydrocarbons and
oxygenated hydrocarbons (CFR, 86.1811-04; CCR, 1961). Additionally, the Tier 2
standards establish a maximum acceptable level of formaldehyde, HCHO, emissions
(CFR, 86.1811-04). European emissions standards regulate emissions of CO and the sum
of HC and NOx emissions (EPC, 98/69/EC). However, these other emissions do not pose
a great problem for conventional diesel engines. Diesel engines produce very low CO
emissions as a result of operating with lean air-fuel ratios, and hydrocarbon emissions are
4
reduced to the specified level on current engines with a diesel oxidation catalyst (DOC).
It is expected that current research on DOCs will result in a catalyst capable of achieving
the lower NMOG emissions levels. However, achieving the low PM and NOx
requirements require substantial development in both diesel combustion and
aftertreatment systems. As such, NOx and PM are critical emissions for diesel engine
development. However, it is acknowledged and foreshadowed that combustion
development modes required to meet NOx and PM emissions levels may place increasing
CO and HC burden on the aftertreatment systems. Accordingly, CO and HC emissions
remain important.
1.3 Addressing New Emissions Standards
Creating diesel engines that meet the forthcoming emissions standards requires
substantial development of the diesel engine system. While development is necessary on
catalytic after-treatment systems, improving combustion is also required and is highly
beneficial. Decreasing the level of engine-out emissions reduces demand on the
aftertreatment system. Further, improving an engine by altering the combustion strategy
and retaining existing components can more cost-effective - overall engine performance
increases without a substantial increase in engine hardware cost. However, methods of
reducing the engine emissions must not sacrifice fuel economy too significantly as this
will increase end user fuel costs, making the engine less desirable to consumers.
1.3.1 Advanced Combustion Strategies
In response to the new restrictions on exhaust gas emissions, particularly PM and
NOx, new strategies for diesel combustion have been developed. Many different
researchers have developed slightly different strategies, and most created their own
moniker for their strategy. Acronyms including PCI, PCCI, PPCI, TS, UNIBUS, MK,
PREDIC, DHCCI, CIHC, AR, CAI, FDCCP, HiMICS, ATAC, RI, SCRI, TI, HCTI,
RAC, LPDC, HCDC, LTDC, and LSC all represent individual strategies, though they all
share both similar objectives and general characteristics.
To achieve a simultaneous reduction in PM and NOx emissions, these novel
combustion strategies seek to exhibit two seemingly contradictory properties: a well
mixed cylinder charge prior to ignition and relatively low combustion temperatures. The
5
fuel and air in the cylinder must be well mixed to avoid regions with unfavorable carbon-
oxygen ratios that lead to PM formation. The temperature in the combustion process must
remain low to prevent NOx from forming in significant quantities, and prevent the
formation of soot precursors. Many different researchers have formulated strategies that
simultaneously achieve the two stated requirements for low PM, low NOx combustion.
Characteristics of these strategies include heavy use of cooled exhaust gas recirculation
(EGR), where a portion of the exhaust gas is cooled and drafted back into the intake
system, and altered injection timings. Strategies have been established using both
advanced and retarded injection timings to achieve the desired combustion.
While charge conditions with premixed diesel combustion are considered ‘well
mixed’, this does not indicate that they are homogeneous. There is significant variation in
mixture conditions (including local equivalence ratio) within the cylinder charge, owing
to the combination of highly turbulent nature of the gas flows within the cylinder (heavily
influenced by the combustion chamber shape and swirl of the intake flow), injection
method (a direct injection usually near firing TDC), and the fuel used (diesel fuel has a
relatively low volatility and slow evaporation and mixing rates). The cylinder conditions
are considered well mixed compared to conventional diesel combustion, where a
significant portion of the combustion is mixing-limited diffusion burning, but are not as
uniform as the conditions within a homogeneous charge compression ignition (HCCI)
engine. Conditions for HCCI combustion have a narrow range of local equivalence ratios
compared to premixed diesel combustion. The ignition behavior also differs between
HCCI and premixed diesel combustion. There is usually a strong link between the
injection and ignition timing with premixed diesel combustion, but not for HCCI
combustion, where the mixture is set very early in the cycle and then compressed until
cylinder conditions reach a point where chemical kinetics initiate combustion. So, while
control of HCCI ignition is a complex problem with thermal management highly critical
to successful implementation, premixed diesel combustion offers more predictive control
with the injection. This is indicative of premixed diesel combustion being an evolution of
HCCI, an ‘HCCI-ish’ strategy, which yields some of the emissions benefits of HCCI over
a narrow load range but with more manageable control over ignition timing. Thus, the
main differences between premixed diesel combustion and HCCI are encapsulated:
6
(1) premixed diesel combustion, while well mixed relative to conventional diesel
combustion, has less uniform cylinder conditions than HCCI, and (2) ignition control is
linked to the injection timing with premixed diesel combustion, whereas it is highly
dependent on thermal management and predictive control over cylinder conditions with
HCCI. As a result of the inhomogeneity of the mixture with premixed diesel combustion
relative to HCCI, emissions at higher equivalence ratios are increased, and subsequent
emissions-based equivalence ratio limits are lower.
1.3.2 Implementation in Production Engines
More than ten years of development time have been invested in studying and
developing these strategies for implementation in future vehicles. With new emissions
regulations set to take effect in upcoming years, implementation of these strategies in
production vehicles is becoming increasingly imminent. The principal implementation
concern is whether these strategies work outside the research laboratory where variables
are not as well controlled. Part of this concern is how these strategies will behave when
exposed to the wide range of diesel fuel that is publicly available.
Diesel fuel properties are rather loosely regulated: the primary diesel fuel properties
currently controlled by legislation are maximum sulfur content, maximum aromatic
content, and minimum cetane number or index. Diesel fuels in the US and Europe are
largely free of sulfur (US limit of 15 ppm, EU limit of 50 ppm but mandate complete
availability of sulfur-free diesel fuel) (CFR, 80.520; EPC, 98/70; EPC, 2003/17). Diesel
fuels in the United States must have a cetane index of at least 40 or a maximum aromatics
concentration of 35%, while European fuels must have a cetane number of 51 or greater
(CFR, 80.29; EPC, 98/70). The range of cetane number, however, is substantial. In the
United States, the cetane number of diesel fuels available at filling stations can range
anywhere from 38 to the mid 50s, with an average value of around 46 (NAFS, 2003;
Peckham, 2003). A 15-point variation in cetane number represents a very significant
variation in fuel ignition behavior.
With the wide cetane number range of diesel fuels available to consumers,
understanding how the newly developed advanced diesel combustion strategies respond
to changes in cetane number is critical for production implementation. Additionally,
optimizing an engine for one fuel specification likely will not give optimum performance
7
when the fuel is altered. It is then important to understand both the effects of running an
engine on a different fuel with similar conditions, and what can be done to improve the
engine’s performance if a fuel causes sub-optimal behavior.
1.4 Project Objective and Motivation
This research study sought to understand the connection between diesel fuel
properties and the combustion and emissions behavior of premixed diesel combustion. At
the start of this project, very few researchers had studied the effect of fuel properties on
premixed diesel combustion and all focused on specially blended fuels (which were
substantially different than common diesel fuel) to enable the combustion mode. A
desired to understand how changes in fuel affected the combustion process and resulting
emissions provided motivation for this work. Since implementation of these combustion
modes in future vehicles is highly probable, understanding issues which could complicate
their introduction is of great utility. Thus, the objective was to understand which diesel
fuel properties are critical to premixed diesel combustion modes, how they impact the
combustion process and resulting emissions, why they cause these effects, and how to
correct for or eliminate undesired behavior stemming from fuel changes.
1.5 Expansion of Published Research
This work extends beyond the existing published research on the effect of fuel
properties on advanced combustion strategies by focusing on a direct-injection premixed
diesel combustion mode, narrowing the range of test fuels, and conducting more detailed
sweeps of main engine operating parameters.
A sizeable portion of the existing research in this field focuses on HCCI combustion
(Risberg et al., 2005; Szybist et al., 2005; Bunting et al., 2007-1; Bunting et al., 2007-2).
Due to the differences between HCCI and premixed diesel combustion (level of mixture
homogeneity, temperature dependencies, combustion phasing, operating load level),
HCCI combustion results often do not directly translate to premixed diesel combustion
modes. It features more homogeneous mixtures than premixed diesel combustion
reflecting different fuel induction methods (port injection, heated vaporizers). Also,
HCCI ignition is dictated by chemical kinetics and therefore strongly dependent on
cylinder thermal conditions: initial cylinder conditions, especially the intake charge
8
temperature, are critical to HCCI control. Intake temperature becomes a primary variable
within HCCI studies, while being of little interest in premixed diesel combustion studies
where ignition timing is controlled by injection timing. There are further differences as
well: several principal HCCI fuel studies (Szybist et al., 2005; Bunting et al., 2007-1;
Bunting et al., 2007-2) feature combustion which has lower heat release rates, is phased
earlier than, and produces lower engine loads than the premixed diesel combustion mode
tested within this study.
The previously noted HCCI combustion studies, along with the principal studies of
premixed diesel combustion fuel effects (Kitano et al., 2003; Sugano et al., 2005; Li et
al., 2006), use test fuels which vary substantially from standard diesel fuel. The test fuels
cover a wide range of cetane number (17-90) and include gasoline-type fuels and primary
reference fuels (two component hydrocarbon fuels). Changes of combustion behavior
across a wide range of cetane number, as reported in the prior literature, do not reflect the
effects found with test fuels featuring a more narrowly specified range of cetane number.
While the work of Risberg et al. (2005) features both port injected HCCI and a late-
injection, high-EGR combustion mode comparable to premixed diesel combustion, no
corrections were made to account for differences in resulting combustion phasing
between test fuels. Several of the studies on fuel effects with premixed diesel combustion
also use singular test conditions with fixed injection timing (Li et al., 2006) or fixed
ignition timing (Kitano et al., 2003). As discussed within this work (Chapter 4),
differences in combustion phasing resulting from fixed injection timing with varied
cetane number give rise to apparent cetane number effects. A portion of the present work
clarifies this perceived effect.
Extending beyond these prior studies, the present work demonstrates the effect of
fuel properties on a premixed diesel combustion mode. The test fuels are specified to
cover a narrower range of fuels which is consistent with commercially available diesel
fuel. Further, the fuel matrix is expanded to detail the effects of using a nitrate cetane
number improver. Finally, principal control parameters including EGR, injection timing,
injection pressure, and operating load are swept to quantify the significance of the fuel-
caused combustion effects and understand their interdependence on other engine
parameters.
9
1.6 Overview of Dissertation
Chapter 2 provides background material relating to premixed diesel combustion, fuel
properties and specifications, and the effect of critical fuel properties on diesel
combustion, both conventional and premixed. Chapter 3 provides details about the
experimental setup, testing methods, and operating conditions used within this study.
Chapters 4-6 cover results and observations of three distinct areas of study related to fuel
effects on premixed diesel combustion. Chapter 4 covers the effect of cetane number on
combustion and emissions behavior along with injection timing limits. A secondary study
demonstrating the impact of using a nitrate cetane improver, 2-ethylhexyl nitrate, on
operating behavior and emissions is contained in Chapter 5. A characterization of the
tested combustion mode’s usable load range, including the effect of varied cetane
number, is demonstrated in Chapter 6. The final chapter, Chapter 7, provides an overall
summary of the work, a highlight of the important conclusions, and recommendations for
future studies.
10
CHAPTER 2
BACKGROUND
2.1 Summary
There are two elements inherent to an investigation into fuel effects on premixed
diesel combustion: (1) premixed diesel combustion, and (2) fuels. Accordingly, this
chapter seeks to provide appropriate background about those two subjects. Initially, a
background into premixed diesel combustion strategies will be given, followed by a
three-part discussion of fuels. The fuels discussion begins with background information
about diesel fuels, followed by their effects on conventional diesel combustion (important
because of the wealth of information and its ability to explain phenomena within
premixed diesel combustion), and finally discussion of recent research results focusing on
fuel effects on premixed diesel combustion modes.
2.2 Premixed Diesel Combustion – Historical Perspective
Conventional diesel combustion has long struggled with the tradeoff that exists
between particulate matter (PM) and NOx emissions. Generally, methods of reducing PM
lead to increases in NOx emissions and vice-versa. NOx emissions are highly dependent
on the combustion temperature: higher combustion temperatures yield higher NOx
emissions. In conventional diesel combustion, combustion temperature is largely
dependent on the amount of energy released during the early stages of combustion, the
bulk of which is premixed combustion. Increasing the ignition delay (the time between
the start of fuel injection and the start of combustion) allows for improved fuel-air
mixing, resulting in a more substantial premixed burn. This yields higher peak cylinder
temperatures and NOx emissions. However, the enhanced mixing allowed by a greater
ignition delay also results in fewer zones within the cylinder possessing unfavorable
11
(rich) carbon-oxygen ratios, zones that are known to form PM. As a result, when mixing
time is increased or mixing is enhanced, PM emissions decrease while NOx emissions
increase. The perennial desire of a diesel combustion engineer is to avoid this tradeoff,
causing simultaneous reductions in both PM and NOx emissions, while not incurring a
large increase in other gaseous emissions or a significant decrease in engine efficiency.
2.2.1 Required Combustion Properties
To achieve a simultaneous reduction in PM and NOx emissions, the combustion
process must exhibit two seemingly contradictory properties: it must be well premixed
and result in low temperatures. The fuel and air in the cylinder must be mixed well
enough to avoid regions with unfavorable carbon-oxygen ratios, but the mixture must
also be able to sustain combustion to prevent misfires. Second, the temperatures in the
combustion process must remain low enough so NOx is not formed in significant
quantities.
2.2.2 Achieving Low Temperature Combustion
Many different researchers have formulated strategies that attempt to simultaneously
achieve the two requirements stated above for low PM, low NOx combustion. Most of the
strategies use cooled exhaust gas recirculation, EGR, where a portion of the exhaust gas
is cooled and drafted back into the intake system. Cooled EGR reduces NOx formation
through several mechanisms. The first results from EGR dilution of the intake mixture
(Ladommatos et al., 1996-1). Additionally the water concentration and CO2 in the
recirculated exhaust gas acts as a thermal sink, absorbing energy released by the
combustion process and decreasing the combustion temperature (Ladommatos et al.,
1997-1). Finally, the CO2 in the recirculated exhaust gas slows the production rate of soot
precursors (Lida and Sato, 1988). The high levels of EGR used in premixed combustion
modes decrease the combustion temperatures enough that the dissociation effect of the
CO2 noted by Ladommatos et al. (1996-2) will be minimal.
2.2.3 Achieving Premixed Combustion
Achieving the desired premixed combustion requires increasing the mixing of the
fuel and air prior to ignition. The goal of having the entire combustion event be premixed
combustion with no diffusion portion following requires a high degree of fuel-air mixing
12
prior to ignition. However, it is imperative to prevent the fuel and air from becoming
mixed to the point where it is too lean to sustain combustion (overleaning). To
accomplish this, most new combustion strategies focus on achieving a well-mixed zone.
The contents of the zone are well mixed and between the lean and rich limits, but regions
outside the mixed zone do not contain any fuel. Therefore, the combustion chamber is
locally homogeneous and stratified overall.
Several of the strategies seek to create these well mixed regions by injecting the fuel
very early in the engine cycle. The extreme case is early attempts at diesel HCCI
(Homogeneous Charge Compression Ignition) where diesel fuel was mixed with the
intake air in the intake manifold prior to being inducted into the cylinder (Gray and Ryan,
1997). The low volatility of diesel fuel requires preheating the intake air, and the
difficulty of combustion control creates limits on operating conditions. These two factors
make this method impractical for implementation anywhere but in a laboratory research
engine.
To eliminate the need for intake heating systems, most methods inject the fuel
directly into the cylinder, using part of the compression stroke to heat the air in the
cylinder to a temperature that will cause the injected fuel to vaporize. In-cylinder direct
injection occurring early in the compression stroke is the centerpiece of several methods.
Fuel is injected very early in the cycle to give the fuel a long period of time to vaporize
and mix, resulting in solely premixed combustion.
To prevent the fuel from mixing over too wide a region, which would result in too-
lean mixtures, or wetting the cylinder wall, which would lead to high PM and HC
emissions, many of the very early injection timing strategies employ a specialized
injector configuration. Toyota’s Uniform Bulky Combustion System, UNIBUS, uses a
fuel injector with a pintle-type nozzle featuring a large hole and a bulbous protrusion to
reduce penetration and keep the fuel mixture in the center of the cylinder away from the
walls (Yanigahara et al., 1997). During different stages of New ACE Institute’s
development of their Premixed Diesel Combustion strategy, PREDIC, they utilized two
different injection methods to provide spray behavior such that the fuel was in the desired
location. Two different injector configurations were used in the early portion of their
work: a centrally mounted injector with a three stage (multiple cone angle) injector
13
nozzle, and two opposing injectors such that the fuel sprays from each injector impinge at
the center of the cylinder (Takeda et al., 1996). Both strategies create a nucleus of fuel at
the center of the cylinder, away from all of the cylinder surfaces. A later strategy utilized
the two injector format, but used pintle-type injector nozzles similar to those used by
Toyota to reduce the spray penetration (Akagawa et al., 1999). Several studies used
injector tips with narrow cone angles to target the spray at the combustion bowl even
during advanced injection timings (Walter and Gatellier, 2002; Lechner, 2003; Wåhlin
and Cronhjort, 2004; Okude et al., 2004).
One of the main problems with implementing any of the very early injection
strategies in a production engine is the strategies are only applicable for a narrow range
of operating conditions. Further, the nature of the special injectors used to implement
these methods make it impossible to achieve clean conventional combustion at higher
load conditions, where premixed combustion cannot be sustained and early injection
timings yield poor combustion quality.
Other methods for achieving low soot, low NOx premixed diesel combustion focus
on injecting the fuel at more retarded locations than conventional. Nissan’s Modulated
Kinetics, MK, strategy injects fuel at retarded timings, even after top dead center (TDC)
(Kimura, 2001). The methodology proposed by Jacobs utilizes a single injection
occurring before TDC, but still retarded from conventional timings (Jacobs, 2005). These
strategies use high levels of cooled EGR to help extend the ignition delay. For the
strategies to work, the ignition delay must be extended until it is longer than the duration
of the fuel injection and the time required for the fuel to mix effectively. They also utilize
the high swirl and turbulence present when the piston is near TDC to enhance mixing,
decreasing the time required to achieve the well mixed conditions required for low soot
combustion.
The retarded injection timing strategies are more suitable for implementation in a
production engine because implementation requires changes required to the engine
control software, not to engine hardware. Since both conventional and these novel
combustion strategies inject the fuel near TDC, the injection spray targeting is the same
and the same injectors can be used during conventional or premixed operation.
14
2.3 Diesel Fuel
2.3.1 Diesel Fuel Chemical Composition
Diesel fuel is not a single component entity, but composed of numerous different
hydrocarbons. The hydrocarbons are classified by their chemical structure into groups
exhibiting similar chemical structure, properties, and behavior. Paraffins, also referred to
as alkanes, are hydrocarbons with either straight or branched structures and with all
single bonds between the atoms. The structure of the chemical is based off the layout of
the carbon atoms: in a straight molecule, all of the carbon atoms are in a line, while a
branched molecule has carbon atoms lying in multiple planes. Napthenes, also called
cycloparaffins, feature a ring structure with single bonds between carbon atoms. Olefins,
or alkenes, are similar to paraffins being straight chain or branched hydrocarbon
structures, but have at least one double bond between the carbon atoms. Finally,
aromatics are hydrocarbons based on one or more benzene rings. Monoaromatics are
based around one benzene ring, and polyaromatics, commonly abbreviated PAH, are
made up of multiple benzene rings.
The resulting properties of a diesel fuel depend on the concentrations of the different
groups of hydrocarbons in the final fuel blend. Within each molecular structure
classification, there are variances in properties due to exact number of atoms and
structure of the hydrocarbon. Generally, larger hydrocarbons with more carbon atoms
have higher density, higher boiling temperature, and lower heat of combustion than other
members of their structural class. As classes, the paraffins, napthenes, and olefins all
have similar densities, boiling points, and heating values, but olefins are much more
reactive because of the presence of an unstable double bond between carbon atoms.
Aromatics generally have a higher density and lower heat of combustion than paraffins,
napthenes, or olefins, but are also much less reactive due to the stable nature of the
benzene ring upon which they are based. The multiple benzene rings in a polyaromatic
compound make it very unreactive, even in comparison to monoaromatics.
With the different properties of each hydrocarbon group contributing to the overall
characteristics of a fuel, understanding the nature of a fuel is dependent on the
hydrocarbon makeup. For example, a fuel with a high aromatic content will be less
reactive (resulting in lower ignitability), denser, and have a higher boiling point
15
(indicating a heavier distillate) than a comparable fuel with lower aromatic content. This
shows how fuel properties become very interrelated: the final fuel characteristics are
based off the properties of a set of groups with interrelated properties. Varying the
concentration of one group will change multiple fuel properties simultaneously.
2.3.2 Principal Fuel Property - Ignitability
Cetane Number
Cetane number is a qualitative expression of the ignitability of a fuel. The concept of
cetane number was presented by Boerlage and Broeze in a 1932 paper, where they
compared the ignition quality of different blends of two reference fuels: cetane (C16H34)
and mesitylene (C9H12). Cetane is an ignition-prone paraffin, while mesitylene is an
aromatic hydrocarbon that would not combust in the test engine. They measured the
ignition delay of the different blends of cetane and mesitylene to establish a chart relating
measured ignition delay to cetane concentration in the fuel blend.
The current standard method for determining the cetane number of a fuel, detailed in
ASTM International Standard D-613, compares the compression ratio required to achieve
a specified ignition delay (ASTM, D613). The base reference fuels are n-cetane (C16H34)
with a cetane number of 100, and heptamethylnonane (C16H34) with a cetane number
of 15. Alphamethylnapthalene (C11H10), with a cetane number of zero, was used to
establish the cetane scale. Current cetane number testing uses two secondary reference
fuels: T, a reference fuel with a cetane number of approximately 74-77, and U, a
reference fuel with a cetane number of 18-20 (Chevron, T-23, U-16). The test engine
used is a Waukesha single-cylinder CFR (Cooperative Fuels Research) variable-
compression-ratio prechamber diesel engine. With the CFR engine operating at 900 rpm,
fuel is injected at 13 ºBTDC (Before Top Dead Center) and the compression ratio is
varied by changing the volume of the prechamber until the fuel ignition point is at top
dead center (TDC), giving an ignition delay of 13 crankshaft degrees. This same
procedure is carried out with different blends of the T and U reference fuels until the
compression ratio required to achieve the 13 degree ignition delay of two reference fuel
blends bracket the required compression ratio of the test fuel. The test fuel’s cetane
16
number is a linear interpolation, based on the compression ratios, between the blend
cetane numbers of the bracketing fuel blends.
Cetane Index
Cetane index is a parameter calculated from a fuel’s distillation characteristics and
density, and is an alternative to the engine experimentally determined cetane number.
Accepted methods for calculating cetane index are given by ASTM International
Standards D976 and D4737, with the latter being the more recent, detailed, and common
procedure (Totten et al., 2003). The difference between the two standards is that D976
relates cetane index to the fuel density and mid-boiling (50% recovery) temperature,
while D4737 relates the cetane index to density, 10%, 50% and 90% distillation
(recovery) temperatures (ASTM, D976, D4737). The cetane index parameter is an
approximate prediction of cetane number based on easily measureable distillation
parameters.
IQT Derived Cetane Number
The most recent method of quantifying a fuel’s ignitability characteristics is to use an
Ignition Quality Tester (IQT™). ASTM International Standard D6890 covers the
measurement procedure and correlation to derived cetane number (ASTM, D6890). This
device injects fuel, using a representative diesel fuel injector, into a pressurized
combustion bomb at controlled conditions. By monitoring the conditions within the
bomb, the device measures the ignition delay between time of fuel injection and the start
of combustion. This ignition delay itself can be compared across fuels to compare
properties, or it can be converted into a derived cetane number, DCN, using a linear
correlation.
Limitations of Cetane Number, Cetane Index, and Derived Cetane Number
Cetane number has one main limitation: it is an experimentally determined
parameter. As such, the result is subject to experimental variations and uncertainty. Even
though the operating conditions are carefully specified, a degree of variation in
repeatability does still exist. ASTM International reports the repeatability (repeated tests
of a single sample on one engine) of the D613 test at ± 1, and the reproducibility (tests of
a fuel at different facilities and times) at ± 5 cetane numbers (ASTM, D613). Several
17
studies into the data scatter associated with the D613 method of determining cetane
number established the measurement uncertainty due to repeatability variation ranged
from ± 1.6 cetane numbers to ± 5 cetane numbers (Totten, 2003). Furthermore, the cetane
number established with the D613 test does not offer a clear prediction of ignition delay
in a modern diesel engine, since the CFR engine used in the tests is not representative of
most modern diesel engines (Totten, 2003).
Also, the working range of the cetane number test is limited to cetane numbers less
than 74, because the T reference fuel (high CN) used in the D613 tests has a cetane
number of 74-77. It is not possible to correctly bracket a fuel whose cetane number is
outside the range of the secondary reference fuels. This is a limitation because many
synthetic (Fischer-Tropsch) fuels have a cetane number exceeding 74.
Calculated cetane index is not applicable for many fuel comparisons, especially not
with pure hydrocarbons, synthetic fuels, fuels with cetane-improving additives, or as a
comparison between fuels with vastly different chemical compositions (Totten et al.,
2003). The correlation was developed based on a limited set of petroleum fuels – fuels
possessing properties substantially different than the original set may not follow the
trend. As such, the experimentally derived parameter, cetane number, is preferred over
the calculated parameter, cetane index.
Derived cetane number, measured by an IQT, was developed to address many of the
issues and limitations of cetane number and cetane index. It has the ability to test fuels of
a wide range of ignitability characteristics, can correctly quantify fuels with cetane
improving additives, uses a combustion system comparable to current engines, and has
respectable repeatability characteristics. However, the reproducibility characteristics are
not especially improved (on paper at least) over the cetane number engine tests.
2.3.3 Legislated Diesel Fuel Properties
Maximum sulfur content, maximum aromatic content, and minimum cetane number
are the primary diesel fuel properties currently controlled by legislation. Within the
United States, there are two different fuel standards: one set out by the EPA applicable to
all fifty states, and a separate standard established by CARB applicable only to
California.
18
Established in 1993 as an extension to the Clean Air Act, the current EPA standard
requires all diesel fuels sold in the US destined for vehicular use have a maximum sulfur
content of 500 ppm, a maximum aromatic content of 35%, and a minimum cetane index
of 40 (CFR, 80.29). The same legislation decreased the maximum sulfur level to 15 ppm
in June 2006, with the maximum aromatic content and minimum cetane index remaining
at 35% and 40 respectively (CFR, 80.520).
The fuel requirements established by CARB for diesel fuel used in all non-stationary
engine applications in California set the maximum sulfur content at 500 ppm starting in
1993, but this was reduced to 15 ppm in June 2006 (CCR, 2281). There is not a specified
minimum cetane number or index, but the federal minimum cetane index of 40 still
applies. The maximum aromatic content is 10%, but with the exception that fuels can
have an aromatic content up to 20% provided the fuel, when tested in a standardized
engine, shows similar cold-start performance and emission levels as a certification fuel
with an aromatic content of 10% (CCR, 2282).
European countries also legislate the properties of diesel fuel for vehicular use. The
European Union has established an outer set of limits on fuel properties, but some
countries have enacted stricter standards. European Union directives establish that,
starting in 2005, all fuels destined for on-road use must have a maximum sulfur content
less than 50 ppm (EPC, 98/70). Additionally, by 2009, there must be a complete Europe-
wide availability of diesel fuels with zero sulfur content (EPC, 2003/17). The minimum
cetane number of European diesel fuels is 51, and the maximum aromatic content is 11%
(EPC, 98/70).
Along with the property controlling legislation, there are also other controlling
standards for diesel fuels. In the United States, diesel fuels are classified according to
ASTM International Standard D975 into three different grades: 1-D, 2-D, or 4-D (ASTM,
D975). The lowest grade, 4-D, is for heavy distillations of diesel fuel that are solely used
on stationary or marine engines, and therefore is not applicable to automobile bound fuel.
The two lighter grades, 1-D and 2-D, are the two grades used in automotive applications.
Diesel fuel classified as 1-D is a lighter distillation than 2-D diesel fuel, with a lower
boiling temperature range. As a result, numerous other properties are different between
the two different grades of diesel fuel. European diesel fuels are classified into 11
19
different grades by the EN590 standard (CEN, EN 590:2004). The classifications, like
those set out by the ASTM D975 standard, relate to the distillation properties of the fuel,
which are dictated by the climate the fuel is destined for. Both the D975, and EN 590 fuel
standards set either a wide range of acceptable values or a limit value for the different
fuel properties. As an example, the boiling range limits set by the D975 standard mandate
the 1-D diesel fuel have a T90 (90% recovery temperature) less than 288 ºC and 2-D
diesel have a T90 between 282 ºC and 338 ºC. Fuels can vary substantially and still be
within these standards.
With these fairly loose fuel property requirements, there is wide variation in
properties of the fuels produced for these markets. Fuels are also modified to give
different properties depending on the climate and time of year. For example, a fuel
destined for a colder geographic region in the winter will tend to be lighter and have a
higher cetane number than a fuel for a warm climate to make it easier to start the
vehicle’s engine in cold weather.
Fuel properties are also not consistent across a single fuel company. The fuel
distribution system (interstate transport – pipelines, rail, and trucking) in the United
States is separate from the fuel companies (refineries, local transport, and fueling
stations). A fuel company puts a certain quantity of fuel into the distribution system at the
refinery, and then takes that quantity out of the distribution system at a different hub.
However, the fuel they take from the system is not necessarily the same exact fuel they
put into the system, but rather a blend of fuels with similar properties from different
refineries. This is especially true when the fuel is transported in pipelines, as pipeline
companies prefer to operate in fungible mode where they ship bulk quantities of material
that meet a set of specifications, and the delivered product is not the product submitted
for shipment (EIA, 2001). Fungible shipping through pipelines is the preferred method of
regional transport for non-specialized fuels because of its low cost, short shipping time,
and undemanding storage requirements (EIA, 2001). Because fuel companies decrease
their transportation cost by using fungible shipping methods, the fuel they sell is a mix of
fuels refined by different companies. The exact fuel makeup is normally slightly different
from batch to batch, even though all the batches meet ASTM standards and are legal
within EPA or CARB regulations.
20
2.4 Fuel Property Effect on Conventional Diesel Combustion
Copious research has been published which analyzes the effect of different fuel
properties on engine performance and emissions. Primarily, this prior research focuses on
running a carefully prescribed set of fuels in a production engine over either a transient
driving cycle or multiple point steady state mode tests, and comparing the overall
emissions produced. Unfortunately, the effects measured may not be universal effects,
but more the effect on a specific set of engine hardware and controls. Several studies
have noted that fuel property effects can be highly engine specific. A study which tested
30 fuels on five different engines found that each engine behaved differently, and that the
differences could neither be attributed to the technological level of the engine, nor to the
specifics of the test setup (Cowley et al., 1993). A literature review of diesel fuel tests,
which included Cowley et al., also shows the same phenomenon across a wider range of
engines and test programs (Lee et al., 1998). Additionally, another paper establishes that
the engine response to a fuel property change is affected by the reaction of the Engine
Control Module, ECM, to sensor feedback related to the fuel property change (Mann et
al., 1998).
2.4.1 Influence on Mixing Process and Ignition Delay
Much of the impact fuel properties have on combustion relates to their impact on the
mixing process and ignition delay. Therefore, understanding the effect of these changes
on the combustion process is critical.
An improvement in the mixing process results in a greater quantity of fuel and air
being premixed before ignition. When this larger fuel/air mixture combusts, it does so in
a rapid and intense manner. An increase in the premixed portion of combustion causes a
corresponding reduction in the diffusion portion of the combustion, leading to higher
post-flame gas temperatures. The heat release rate for premixed combustion is
substantially higher than that of diffusion combustion, and occurs prior to it.
Accordingly, an increase in the premixed fraction results in more energy being released
over a short time scale close to TDC with a nearly constant combustion chamber volume,
resulting in higher gas temperatures. NOx forms in the high post flame gas temperature
conditions by the thermal mechanism (Zeldovich, 1946; Lavoie et al., 1970). However,
these higher gas temperatures also lead to the increased oxidation of soot particles.
21
Additionally, soot formation is tied to the amount of diffusion combustion, so a decrease
in diffusion combustion reduces the amount of soot formation. An improvement in the
mixing process results in a decrease in soot formation due to the reduced diffusion burn
and the increase in soot oxidation by the high gas temperatures. However, NOx emissions
are higher because of the high gas temperatures resulting from increased premixed burn.
Reducing the effectiveness of the mixing process results in a smaller quantity of fuel
that is well mixed with the air by the time of ignition. This translates into a smaller
premixed burn, resulting in a larger diffusion burn and lower combustion gas
temperatures. The reduced gas temperatures lead to a decrease in NOx formation, but also
a decrease in soot oxidation. Additionally, the increase in diffusion burning leads to an
increase in soot formation. The combination of these factors results in an overall increase
in soot emissions.
2.4.2 Cetane Number Effect
The cetane number of a fuel is a general indication of ignition delay length, with
higher cetane fuels exhibiting shorter ignition delays in a test engine (Boerlage and
Broege, 1932). However, this is not necessarily a direct correlation. Wilson and Rose
(1937), using an open chamber diesel engine showed that there was a fundamental
minimum ignition delay for all fuels regardless of cetane. By maintaining a constant
compression ratio and varying the ignition timing, they noted that when the injection
occurred after a set timing, the ignition delay was constant for all fuels; earlier injection
timing caused an increase in ignition delay, generally corresponding with cetane number.
In a more modern engine, it was noted that ignition delay was correlated, albeit in a non-
linear way, with cetane number (Wong and Steere, 1982).
With all other fuel properties constant, a fuel with a higher cetane number will
generally have a shorter ignition delay, resulting in a smaller premixed burn portion of
combustion. The shorter ignition delay allows less time for the fuel and air to mix
properly, resulting in the smaller premixed burn. A longer ignition delay gives the fuel
and air more time to mix, so a greater degree of fuel/air is mixed at the time of ignition,
which results in a larger premixed burn. Too long an ignition delay results in mixture
overleaning (mixture becomes too lean for ignition) causing a misfire.
22
The magnitude of emissions effects to variations in cetane number is dependent on
the original level of emissions produced by the engine. In modern diesel engines
producing a relatively low level of emissions, changing the cetane number of the test fuel
often resulted in a negligible change in the output emission (Lee et al., 1998). The effect
is more apparent on older higher polluting engines, or engines with older, less advanced,
ECM software calibrations (Ullman et al., 1994).
Increasing the fuel cetane number improves HC and CO emissions in older, higher
polluting engines, with negligible effect on modern engines (Ullman et al., 1994; Lee et
al., 1998; Kidoguchi et al., 2000). CO and especially HC emissions are linked to
injection behavior and especially to the interaction between fuel properties and the
injection process. Fuel parameters which are frequently complimentary to cetane number
(density, hydrocarbon composition, and individual hydrocarbon species levels) cause
slight perturbations in fuel injection behavior which lead to significant shifts in CO and
HC emissions production. The change in ignition behavior (as indicated by cetane
number) is not responsible for the effect, but simply a reflection of the responsible
properties. The high-pressure, multiple-injection strategies used by modern engines are
less responsive to these effects than the single injection strategies used on older engines.
The impact of increasing cetane number on NOx emissions is favorable, producing a
slight reduction in most engines, including many modern engines, but the effect is still
quite small. The reduction of NOx with increasing cetane is due to the resulting shortened
ignition delay causing less premixed burn and a greater diffusion controlled portion
(Ullman et al., 1994; Lee et al., 1998; Kidoguchi et al., 2000). It is generally known that
decreasing the amount of premixed burn reduces the peak pressures and temperatures in
conventional diesel combustion causing a decrease in NOx production (Heywood, 1988).
Balancing this, a decrease in premixed burn with higher cetane fuels causes an extended
diffusion burn, increasing combustion duration and resulting in increased PM emissions
(Kidoguchi et al., 2000). Thus, a PM - NOx tradeoff can exist between combustion of
fuels with different cetane numbers.
Furthermore, cetane variations can cause load specific effects: at low engine loads,
the ignition delay is long enough with low cetane number fuels that they tend to overmix,
leading to lean mixtures incapable of supporting combustion (Kidoguchi et al., 2000). For
23
engines with a single injection, this can lead to misfires and resulting high HC emissions.
For engines with multiple injections (pilot + main), lack of pilot combustion can lead to
an unintended large premixed combustion during the main injection, resulting in high
NOx emissions and loud combustion noise (diesel knock).
2.4.3 Effect of Aromatics
Conclusions of prior research often disagree on the exact effect of aromatic content
on combustion behavior and emission formation. Many of the changes appear to be due
to engine specific responses and, perhaps more importantly, the method the researchers
used to isolate the effect of aromatics. Many other fuel properties are strongly affected by
aromatics concentration, and the specification of the fuels tested has a significant impact
on the results of the work. Especially relevant is the connection between aromatic content
and cetane number. Increasing the aromatic content of a fuel has been shown to decrease
the fuel cetane number (Gülder et al., 1985). The implications of this are important, as
cetane number is correlated to ignition delay, which will have an impact on the nature of
the combustion (Wong and Steere, 1982).
A literature survey by Lee et al. (1998) reports that HC, CO, and PM emissions
generally remain unchanged with variations in fuel total aromatic content. NOx emissions
from their tests are slightly reduced by decreasing the total aromatic content of a fuel.
The impact of reducing polyaromatic hydrocarbon, PAH, concentration in the fuel is
more consistent and beneficial. A reduction in PAHs yields a decrease in NOx and HC
emissions, and has no effect of PM or CO emissions. Decreasing aromatics slightly
reduces the flame temperature, and reduces the number of oxygen radicals due to a more
beneficial C/H ratio in the fuel. Both of these phenomena correspondingly reduce NOx
formation.
Ladommatos et al. (2000) completed a series of tests on a single-cylinder CFR
engine that analyzed the impact of total aromatic, monoaromatic, and diaromatic content
on diesel combustion. Starting with a GTL synthetic diesel fuel with zero measurable
aromatic content, they doped the fuel with different levels of European low sulfur diesel
(containing mono, di, and triaromatic compounds totaling 27%), toluene (a
monoaromatic compound), and methylnaphthalene (a diaromatic compound) to create a
series of fuels with varying aromatic content. Due to the similar base fuel stock, the
24
resulting fuels had similar distillation characteristics and sulfur levels. Cetane numbers of
the fuels varied according to aromatic content, and were generally higher than typical
available diesel fuels (CN = 60-64). Results of engine tests based on the ASTM
International D613 test show that ignition delay is directly related to total and
monoaromatic content in a linear fashion. Replacing monoaromatic content with
diaromatic content in two test fuels causes a small, but consistent, increase in ignition
delay. Reflecting ignition delay effects, cetane number decreases in a linear fashion with
total and monoaromatic content, illustrating a direct connection between changes in
aromatic content and cetane number for their fuel blend.
The results of Ladommatos et al. show HC, NOx, and smoke emissions generally
trending upwards with an increase in total and monoaromatic content, with smoke being
the most linear effect. However, inconsistencies within the emissions measurements
indicate that engine specific details may be playing a role. It should be noted that the
CFR engine used in cetane number tests is an indirect injection prechamber engine,
which is drastically different from current production engines. The correlation showing
HC and smoke emissions increase with monoaromatic content disagree with the
conclusions of prior research work (Lee et al., 1998), further illustrating the impact of
engine specific effects, and the interrelation of fuel properties.
A test where total aromatic content was varied while keeping cetane number constant
by changing the ratio of normal and iso-paraffins demonstrates that aromatic content does
not affect the combustion characteristics of an engine when cetane number is held
constant (Kidoguchi et al., 2000). The primary impact of increasing the aromatic
concentration is to increase soot and PM emissions, believed to be a result of
incompletely oxidized aromatic compounds polymerizing directly into polycyclic
hydrocarbons, PAHs. The benzene ring that an aromatic compound is based on is
inherently stable, making oxidation difficult, and incomplete oxidation likely (Owen and
Coley, 1995).
Kouremenos et al. (1999) sought to isolate the effect of mono, di, and triaromatics on
combustion and emissions. The total aromatic content was kept constant across their test
fuels, and the cetane numbers of the test fuels were adjusted to be as close as possible.
The conclusion of their work is that for a given total aromatic content, the ratio of mono,
25
di, and triaromatics does not have a significant effect on combustion behavior or
emissions. This does not contradict the findings of Ladommatos et al., as the fuels in this
test were doped so that the cetane number remained constant across all of the fuels. This
adjustment of the cetane number insured that the ignition delay, which was the bulk of
the Ladommatos et al. study, remained nearly constant.
2.5 Fuel Effect on Premixed Diesel Combustion – Existing Literature
At the beginning of this research project, there was very little published work
regarding the effect of fuel properties on low-temperature premixed combustion
strategies. Significant work had been conducted and published on fuel effects on
conventional diesel combustion, but only one main group had published on premixed
diesel combustion fuel effects.
Kitano et al. (2003) investigated the effect of distillation characteristics and cetane
number on premixed diesel combustion, termed PCCI combustion in their work. Their
work indicates lighter and more volatile fuels improve mixture formation. However, as a
result of this improved mixture formation, the mixture becomes increasingly too well
mixed, with larger areas that are too lean to support combustion, leading to increased HC
emissions. Decreasing the fuel cetane number increases the ignition delay, allowing the
injection timing to be advanced and premixed combustion sustained under higher load
conditions, yielding a decrease in NOx emissions at the high load conditions compared to
conventional. However, at lower loads, the poor ignitability of the lower cetane number
fuels requires a decrease in EGR rate to prevent misfires, which increases NOx emissions
compared to the higher cetane number fuels. Thus, they established that the optimum
cetane number for PCCI combustion is dependent on the engine load: high load requires a
low cetane fuel to have a long enough ignition delay, but low load requires a higher
cetane number fuel to enable the EGR rate to be optimized for minimal emissions.
Since the study by Kitano et al., there have been further studies investigating the
effects of various fuel properties on many of the various forms of premixed diesel
combustion or diesel fueled HCCI combustion. The differences between these
combustion strategies frequently make it difficult to apply the results of the different
studies (e.g. late injection vs. early injection vs. port injection). The primary variable in
26
most previous studies was cetane number, not surprising since cetane number is one of
the foremost methods of quantifying diesel fuel.
Using experimental and modeling methods, prior studies investigated various aspects
of novel diesel combustion with respect to cetane number. The general finding is that
increasing the fuel cetane number results in a shorter ignition delay (Kitano et al., 2003;
Sugano et al., 2004; Risberg et al., 2005; Li et al., 2006; Bunting et al., 2007-1, Bunting
et al., 2007-2). This can be viewed as an expected result, since cetane number itself is
essentially an experimental characterization of ignition delay in a standardized engine
(ASTM, D613). However, it is noteworthy since small changes in cetane number have
been reported to not have a strong effect on modern engines operating with conventional
diesel combustion (Massa et al., 2007). Significant changes to fuel composition and
cetane number have been shown to make a difference, however (Maly et al., 2007).
Also common are studies that investigated the operable load range as a function of
cetane number. The general holding is that lower cetane number fuels yield larger
operating ranges since their longer ignition delay allows for additional premixing, even as
load and/or engine speed increases (Kitano et al., 2003; Li et al., 2006). Other studies
detail changes in general combustion phenomenon with respect to fuel variances,
including characterization of low temperature heat release (Bunting et al., 2007-2) and
combustion as a whole (Kusaka et al., 2004).
Implications of cetane number on emissions show strong dependency on the
combustion strategy, and particularly the analysis methods. One study reports NOx
increases with increasing cetane number in a late injection premixed diesel combustion
mode (Kitano et al., 2003), while another shows NOx decreasing with an increase in
cetane number in a diesel HCCI engine (Szybist et al., 2005). Additionally, another
indicates that NOx emissions from heavy-duty diesel HCCI combustion can be minimized
to similar values if the combustion was optimized for each fuel, with the exact method
unspecified (Bessonnette et al., 2007). A further paper suggests that NOx appears higher
for higher cetane number fuels in a diesel HCCI engine, but is principally a function of
the ignition delay, and if ignition delay is held constant, NOx is independent of cetane
number (Risberg et al., 2005). Additionally, it reports that CO emissions are tied to
ignition delay, and HC emissions to combustion phasing, with both remaining relatively
27
independent of cetane number (Risberg et al., 2005). However, in a different study, the
hydrocarbon and carbon monoxide emissions are shown to be a function of cetane
number, though they trend in a similar fashion as the previously noted study
(Szybist et al., 2005).
28
CHAPTER 3
EXPERIMENTAL METHODS
3.1 Experimental Setup
The test engine used in this study is a single-cylinder version of a production diesel
engine. The cylinder head and intake manifold system are kept as unmodified as possible
so that the in-cylinder flow characteristics of the single-cylinder engine are similar to the
production engine. However, unlike the production engine, all other engine systems are
controlled individually to give the highest degree of freedom possible. For example,
changes in boost on the parent production engine require changing the turbocharger VGT
settings, which cause changes in other parameters such as backpressure and EGR rate. On
the single-cylinder engine, these effects are decoupled: boost can be adjusted mainly
independent of other parameters. Finally, the engine is well instrumented to provide
detailed and accurate measurements of its behavior.
3.1.1 Engine System
The work of this research project was carried out on a single-cylinder version of a
General Motors (GM) 1.7 liter high-speed direct-injection four-cylinder diesel engine.
The engine is based on a Ricardo Hydra crankcase, but utilizes a specially built cylinder
jug and liner. A cylinder head from a production GM 1.7 liter Circle-L engine is
employed with the valve gear removed from the three unused cylinders. Figure 1 shows
the test engine system, and Table 2 gives detailed specifications of the test engine
geometry.
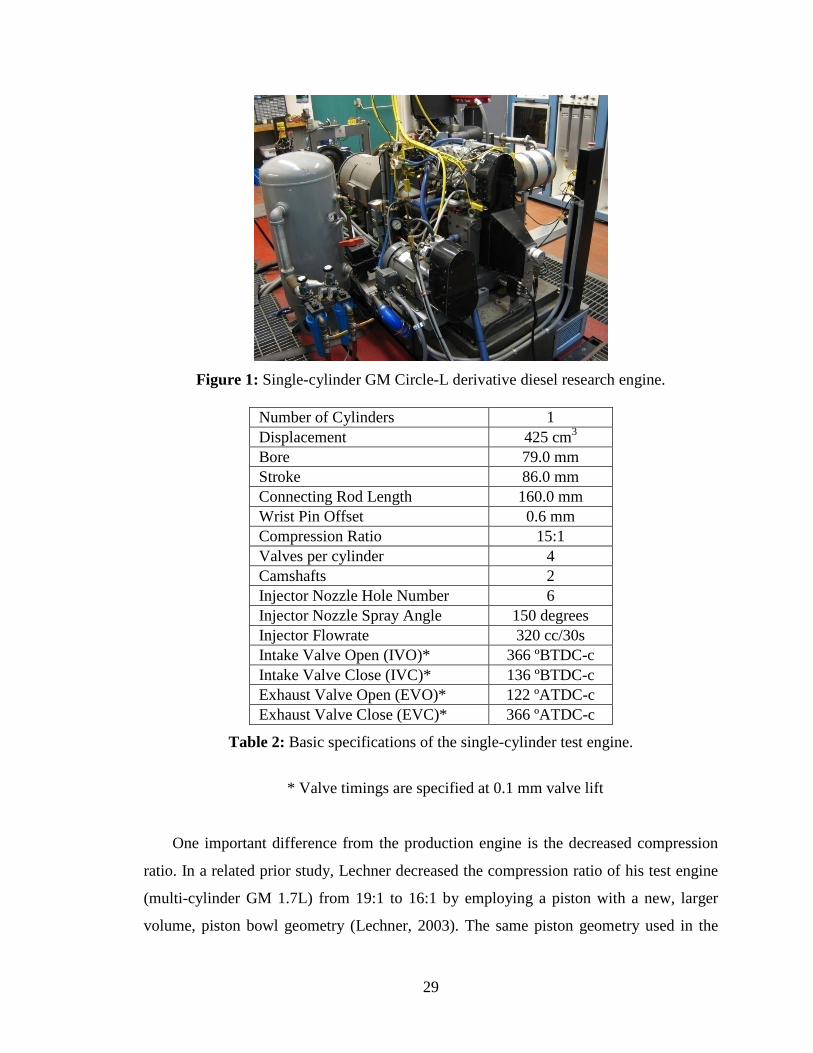
29
Figure 1: Single-cylinder GM Circle-L derivative diesel research engine.
Number of Cylinders 1 Displacement 425 cm3 Bore 79.0 mm Stroke 86.0 mm Connecting Rod Length 160.0 mm Wrist Pin Offset 0.6 mm Compression Ratio 15:1 Valves per cylinder 4 Camshafts 2 Injector Nozzle Hole Number 6 Injector Nozzle Spray Angle 150 degrees Injector Flowrate 320 cc/30s Intake Valve Open (IVO)* 366 ºBTDC-c Intake Valve Close (IVC)* 136 ºBTDC-c Exhaust Valve Open (EVO)* 122 ºATDC-c Exhaust Valve Close (EVC)* 366 ºATDC-c
Table 2: Basic specifications of the single-cylinder test engine.
* Valve timings are specified at 0.1 mm valve lift
One important difference from the production engine is the decreased compression
ratio. In a related prior study, Lechner decreased the compression ratio of his test engine
(multi-cylinder GM 1.7L) from 19:1 to 16:1 by employing a piston with a new, larger
volume, piston bowl geometry (Lechner, 2003). The same piston geometry used in the
30
prior work by Lechner (2003), Jacobs (2005), and Knafl (2007) is utilized in this single-
cylinder test engine. However, engine specific differences (different valve cutout profiles
in the piston, possible head gasket thickness) results in a lower, 15:1, compression ratio.
3.1.2 Engine Swirl Control
Swirl can be controlled with a manually selectable valve that restricts flow entering
through one of the intake ports. The two different intake ports cause different levels of
swirl in the cylinder, with the overall swirl in the cylinder the balance of the high and low
swirl from the two ports. Closing a throttle in the low-swirl port generates higher levels
of swirl but with a corresponding increase in flow losses due to the reduction in port area.
The production port throttle is used in the single-cylinder engine with 10 different
positions, every 10 degrees from open to closed. The production port throttle does not
fully block the low-swirl port, so the swirl ratio varies over a small range, from 2.8 to 3.2.
This is a reflection of its intended use – calibration engineers use the swirl control to
provide small tweaks to the final engine control calibration. Extending the port throttle
plate to fully block the port would increase the range of swirl numbers up to 5.6. Testing
revealed that changing the position of the swirl throttle between 2.8 and 3.2 did not
enhance combustion, but rather merely lead to increased flow losses. Accordingly, all
tests were operated with the swirl valve fully open, yielding the overall swirl number of
2.8.
3.1.3 Fuel Injection System
The single-cylinder test engine uses the Bosch 1400 bar common rail injection
system from the production engine. The stock Bosch 1210 common rail injector is
retained, along with the factory selected copper depth spacer which sets the injector at the
depth optimized during factory assembly. The timing, duration, and number of injections
are controlled with an engine controller made by GENOTEC Electronik. This unit allows
for up to nine independent injection events per engine cycle. Injection timing is
controlled to within ± 0.1 crankangle degrees, based off the minimum resolution of the
encoder. Injection duration (pulsewidth) is adjusted in increments of 1 μs.
A Bosch CP3 high pressure pump, driven through a 4:3 reduction belt drive by a
3.7 kW (5 hp) electric motor, supplies high pressure fuel to the production fuel rail. The
31
production supply line and injector for the number one cylinder are retained, with the
three unused ports sealed off. Fuel rail (injection) pressure is modulated by a flow control
valve on the CP3 pump, which restricts inlet fuel flow. Adjusting and maintaining fuel
pressure requires balancing the controlled flow into the pump and the quantity of fuel
injected into the cylinder. A Labview based Pulse Width Modulation (PWM) controller
manufactured in-house provides PID control over the fuel control valve, and therefore
rail pressure.
3.1.4 Intake System
The engine is operated on oil-free, dry compressed air. Entering the test cell at
6.2 bar (90 psi), the compressed air runs through two desiccant air dryers which reduce
the humidity to a dew point temperature of -40 °C. The dry air is then filtered with grade
three coalescing air filters to remove oil down to a concentration of 1 part per billion. A
large surge tank is employed to damp out abrupt changes in supply pressure. Downstream
of the supply surge tank is a two-stage set of electrically operated valves that provide
pressure and flow control for the intake air. A process-controlled 3500 Watt electric
heater is used to heat and maintain the intake air at 65 °C, measured in the intake
manifold. A second smaller surge tank is used to damp out the pulsating intake flow into
the single-cylinder engine to allow for accurate measurement of intake pressure. For
accurate pressure measurements, the intake surge tank for a single-cylinder engine needs
to be at least 50 times the displaced cylinder volume (Taylor and Taylor, 1962). The
surge tank used for this test engine has a 22.4 liter volume, or 53 times the engine
displacement. Following the surge tank, the intake air joins the production intake system.
The production intake system is retained from the port throttle/EGR valve unit through
the intake manifold. A three millimeter thick blanking plate blocks the flow from the
manifold to the cylinder ports of the three unused cylinders.
3.1.5 Exhaust System
The production engine exhaust manifold and turbocharger are not used on the single-
cylinder engine. Instead, a short exhaust runner attached to a 7.85 liter (18.5 times the
engine displacement) exhaust surge tank. This, like the intake surge tank, dampens the
pulsating flow that occurs from a single-cylinder engine. Mounted downstream of the
32
surge tank is a manually adjusted ball valve used to control the exhaust backpressure
(manifold pressure).
3.1.6 Exhaust Gas Recirculation
Exhaust gas recirculation (EGR) is heavily used on this test engine. Exhaust gas is
drawn off the main exhaust pipe immediately after the surge tank. A needle valve
provides control over the amount of EGR flowing into the intake system and a cooler is
used to decrease the EGR temperature. Typical EGR coolers, including the cooler used
on the production 4-cylinder version of this engine, cool the EGR by circulating engine
coolant through a heat exchanger, but the EGR cooling setup on the single-cylinder
engine uses a separate cooling system that is independent of the engine cooling loop. This
allows for independent control over the temperature of the coolant, giving more
flexibility in the EGR temperature. The cooling system is a simple single loop system
similar in design to the oil and engine coolant systems, and the coolant is a 50:50 mixture
of ethylene glycol and distilled water.
EGR is fed into the intake system directly before the intake surge tank to allow for
proper mixing to take place in the tank before the intake air goes into the engine. The
quantity of EGR inducted into the engine is computed by comparing the concentration of
CO2 in the intake stream to CO2 concentration in the exhaust gas, with the calculations
described further in the Section 3.2. The CO2 in the intake stream is measured on a dry
basis by a Siemens Ultramat 23 Infrared analyzer. This analyzer is mounted in a stand-
alone sample cart with full gas conditioning including a sample pump, a filter to remove
soot, and a chiller to remove the water from the sample gas. The sample port for the CO2
measurement is located in the intake manifold, immediately after the intake throttle
where EGR is normally introduced into the engine. By this point, the EGR and fresh
intake air should be well mixed.
3.1.7 Engine Coolant System
The engine cooling system is a single loop system with a 0.18 kW pump, an
immersion heating element, and a heat exchanger. The immersion heater is used for
coolant preheating and remains on throughout engine operation. A process temperature
controller monitors the coolant temperature and when coolant temperature exceeds the
33
desired setpoint, opens an electrically actuated valve allowing city water to flow through
the heat exchanger. The city water cools the engine coolant and then is drained into the
trench. This system does not provide the same degree of stability as a two-loop simulated
radiator system, but is smaller and less complex. The coolant is a 50:50 mixture of
ethylene glycol and distilled water.
3.1.8 Lubrication System
A five quart wet sump oiling system provides lubrication and, with the piston oiljet,
piston cooling to the test engine. Oil pressure is set at 4.2 bar (60 psi) with the oil at
85 °C for all engine test conditions. Temperature control of the lubricating oil is achieved
using a cooling system similar to the system used for the engine coolant system. The
production Positive Crankcase Ventilation (PCV) system is not used. Instead, breather
hoses to provide crankcase and valve cover ventilation are tied together and vented to
atmosphere near the test cell’s ventilation system exit.
3.1.9 Fuel System
Fuel is measured and supplied by a Max 710-100 Fuel Flow Measuring System. Fuel
supply comes from either the Autolab main fuel tanks or from a 5 gallon can. In either
case, the fuel passes through a 10 micron and then a 2 micron fuel filter before entering
the fuel measurement and supply unit, which consists of a variable pressure transfer
pump, fuel cooler, and flowmeter. A second 2 micron fuel filter is mounted downstream
of the fuel supply unit before the high pressure pump. The fuel unit supplies the fuel to
the high pressure pump on the engine at 1.05 bar (15 psi). Fuel flowrate is measured by a
MAX model 213 positive displacement piston flowmeter.
3.1.10 Exhaust Emissions Measurement
Gaseous engine emissions are measured with a Horiba 200 Series emissions bench.
This machine gives steady state measurement of carbon dioxide (CO2), oxygen (O2),
carbon monoxide (CO), and NOx (NO + NO2). Hydrocarbon (HC) emissions are
measured with a separate Horiba emissions bench.
The NOx analyzer is a Horiba CLA-22A chemiluminescent analyzer. Both the carbon
monoxide and carbon dioxide analyzers are Horiba AIA-23 Non Disruptive Infrared
(NDIR) analyzers. The oxygen analyzer is a Horiba MPA-21A paramagnetic analyzer. A
34
Horiba FIA-34A-2 heated flame ionization detector (FID) measures the total hydrocarbon
emissions.
Two separate ports for the emissions benches are located downstream of the variable
exhaust backpressure valve. Heated remote sample filters remove particulates from the
gaseous emissions samples before the gaseous exhaust sample flows to the emissions
benches through heated lines operating at 190 ºC.
Particulate emissions are measured with an AVL 415S particulate smokemeter. This
instrument compares the reflectivity of clean filter paper to filter paper where 3000 mL of
exhaust have flowed through it. The system outputs Filter Smoke Number on an AVL
4210 Instrument Controller and the data is logged manually. Filter Smoke Number (FSN)
is defined as the function of post flow reflectivities for a set flow quantity through the
filter paper (ISO, 10054). Four smokemeter samples are taken at each operating condition
and their results averaged.
3.1.11 Data Acquisition
Cylinder pressure is measured in the engine with a water-cooled Kistler 6041
piezoelectric pressure transducer. Filtered city water at 3.4 bar (50 psi) is used to cool the
transducer. The signal from the pressure transducer is sent to a DSP Technologies
1104CA charge amplifier, and then to the DSP technologies high-speed data acquisition
system. Within the DSP Technologies charge amplifier, a low-pass filter with a cutoff
frequency of 12.5 kHz removed noise from the cylinder pressure signal. The pressure
transducer was calibrated before the engine tests using a dead-weight pressure calibration
at six different pressures, with each point repeated three times for consistency.
The high speed data acquisition system is a DSP Technologies CAMAC crate based
system. A 100 kHz model 2812 digitizer provided a sampling rate that, along with a BEI
1800 pulse per revolution optical encoder, gives measurements every 0.2 crankangle
degree up to the maximum engine speed of 2000 rpm. Three 4325 TRAQ RTP real time
processing units provide real time calculation of pressure based parameters including
Indicated Mean Effective Pressure (IMEP), the parameter used to monitor engine load.
The high speed data acquisition system software was DSP Red Line ACAP 5.0d.
Since the piezoelectric cylinder pressure transducer measures gauge pressure fluctuations
only, not absolute pressure, the pressure must be referenced (pegged) to a point in the
35
cycle. During all tests, the software averages the cylinder pressure for the five degrees
after bottom dead center of the intake stroke. The absolute pressure at this point in the
engine cycle is pegged to the pressure in the intake manifold, as measured by the
manifold absolute pressure (MAP) sensor.
Other signals measured by the high-speed data acquisition system include manifold
pressure (used for pegging the cylinder pressure transducer), fuel injection line pressure,
and injector current. Fuel injection line pressure and the injector signal are monitored to
provide details of actual injector and injection behavior in the absence of a needle lift
sensor which would directly measure the opening and closing of the injector needle.
Needle lift sensors are not available for the Bosch injector used in the test engine. Fuel
line pressure is measured with a Kistler model 4329A2000 piezoresistive transducer.
Injector signal current is monitored with a Pearson model 411 current sensor with the
wire wrapped through twice to give improved measurement resolution. The GENOTEC
controller also provides a secondary current measurement which closely matches the one
from the external current monitor.
Combustion noise is measured using an AVL 450 Combustion Noise Meter. This
instrument uses correlations based off a filtered version of the cylinder pressure to output
an estimated engine noise level in decibels.
Low speed data acquisition of engine and emissions parameters is conducted using a
32 channel Measurement Computing A-D converter board, with logging and display
handled by in-house developed Labview program. The data sample rate is 10 Hz, and 10-
cycle averages were logged for 200 seconds. The sample time is long to eliminate cyclic
variations in emissions and fuel measurements.
3.2 Principal Operating Condition Development
The primary operating condition is a light load condition based off a condition from
related prior research on the parent multi-cylinder GM engine. This prior research
specifies a condition with a speed of 1500 rpm and a brake mean effecting pressure,
BMEP, of 375 kPa (Jacobs, 2005; Knafl, 2007). An equivalent of this point, redefined for
the single-cylinder engine, is used as the primary operating condition.
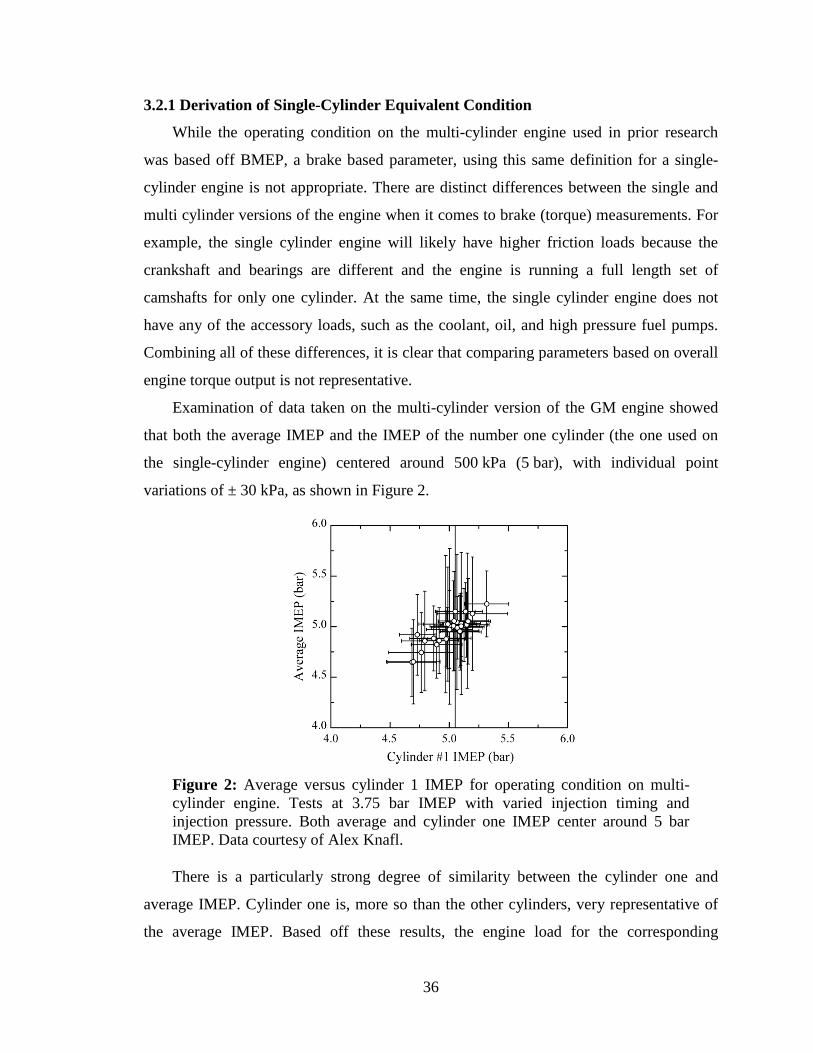
36
3.2.1 Derivation of Single-Cylinder Equivalent Condition
While the operating condition on the multi-cylinder engine used in prior research
was based off BMEP, a brake based parameter, using this same definition for a single-
cylinder engine is not appropriate. There are distinct differences between the single and
multi cylinder versions of the engine when it comes to brake (torque) measurements. For
example, the single cylinder engine will likely have higher friction loads because the
crankshaft and bearings are different and the engine is running a full length set of
camshafts for only one cylinder. At the same time, the single cylinder engine does not
have any of the accessory loads, such as the coolant, oil, and high pressure fuel pumps.
Combining all of these differences, it is clear that comparing parameters based on overall
engine torque output is not representative.
Examination of data taken on the multi-cylinder version of the GM engine showed
that both the average IMEP and the IMEP of the number one cylinder (the one used on
the single-cylinder engine) centered around 500 kPa (5 bar), with individual point
variations of ± 30 kPa, as shown in Figure 2.
Figure 2: Average versus cylinder 1 IMEP for operating condition on multi-cylinder engine. Tests at 3.75 bar IMEP with varied injection timing and injection pressure. Both average and cylinder one IMEP center around 5 bar IMEP. Data courtesy of Alex Knafl. There is a particularly strong degree of similarity between the cylinder one and
average IMEP. Cylinder one is, more so than the other cylinders, very representative of
the average IMEP. Based off these results, the engine load for the corresponding
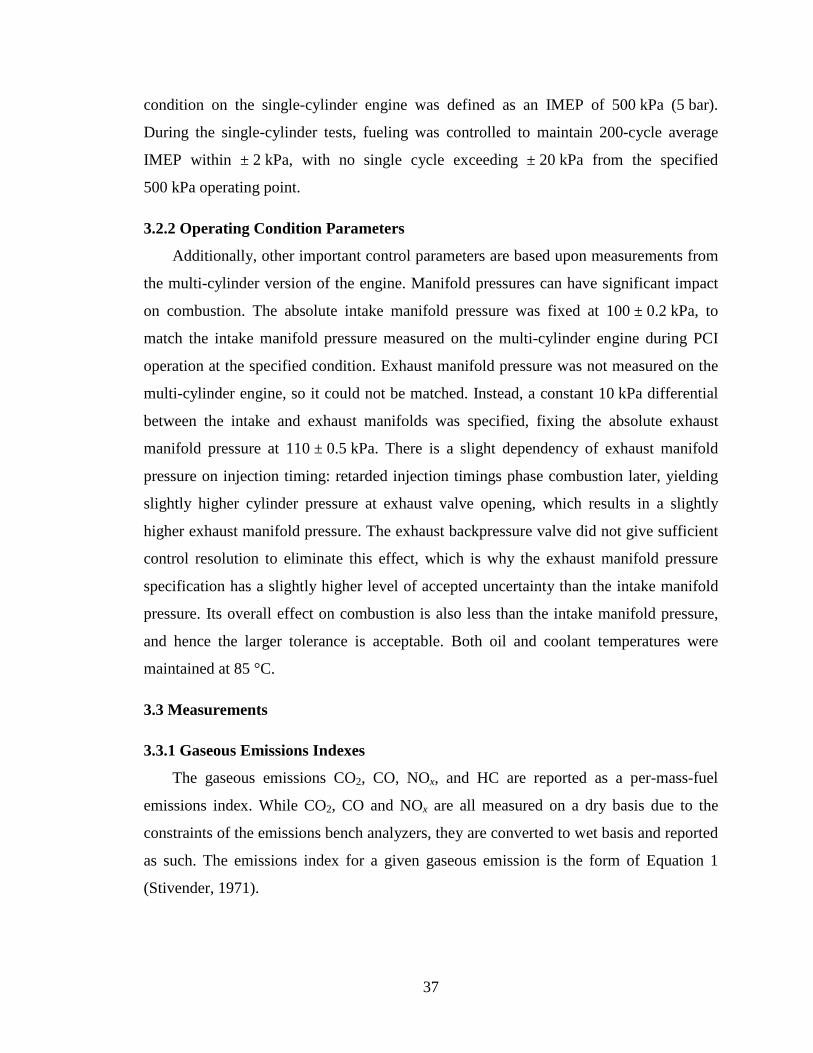
37
condition on the single-cylinder engine was defined as an IMEP of 500 kPa (5 bar).
During the single-cylinder tests, fueling was controlled to maintain 200-cycle average
IMEP within ± 2 kPa, with no single cycle exceeding ± 20 kPa from the specified
500 kPa operating point.
3.2.2 Operating Condition Parameters
Additionally, other important control parameters are based upon measurements from
the multi-cylinder version of the engine. Manifold pressures can have significant impact
on combustion. The absolute intake manifold pressure was fixed at 100 ± 0.2 kPa, to
match the intake manifold pressure measured on the multi-cylinder engine during PCI
operation at the specified condition. Exhaust manifold pressure was not measured on the
multi-cylinder engine, so it could not be matched. Instead, a constant 10 kPa differential
between the intake and exhaust manifolds was specified, fixing the absolute exhaust
manifold pressure at 110 ± 0.5 kPa. There is a slight dependency of exhaust manifold
pressure on injection timing: retarded injection timings phase combustion later, yielding
slightly higher cylinder pressure at exhaust valve opening, which results in a slightly
higher exhaust manifold pressure. The exhaust backpressure valve did not give sufficient
control resolution to eliminate this effect, which is why the exhaust manifold pressure
specification has a slightly higher level of accepted uncertainty than the intake manifold
pressure. Its overall effect on combustion is also less than the intake manifold pressure,
and hence the larger tolerance is acceptable. Both oil and coolant temperatures were
maintained at 85 °C.
3.3 Measurements
3.3.1 Gaseous Emissions Indexes
The gaseous emissions CO2, CO, NOx, and HC are reported as a per-mass-fuel
emissions index. While CO2, CO and NOx are all measured on a dry basis due to the
constraints of the emissions bench analyzers, they are converted to wet basis and reported
as such. The emissions index for a given gaseous emission is the form of Equation 1
(Stivender, 1971).
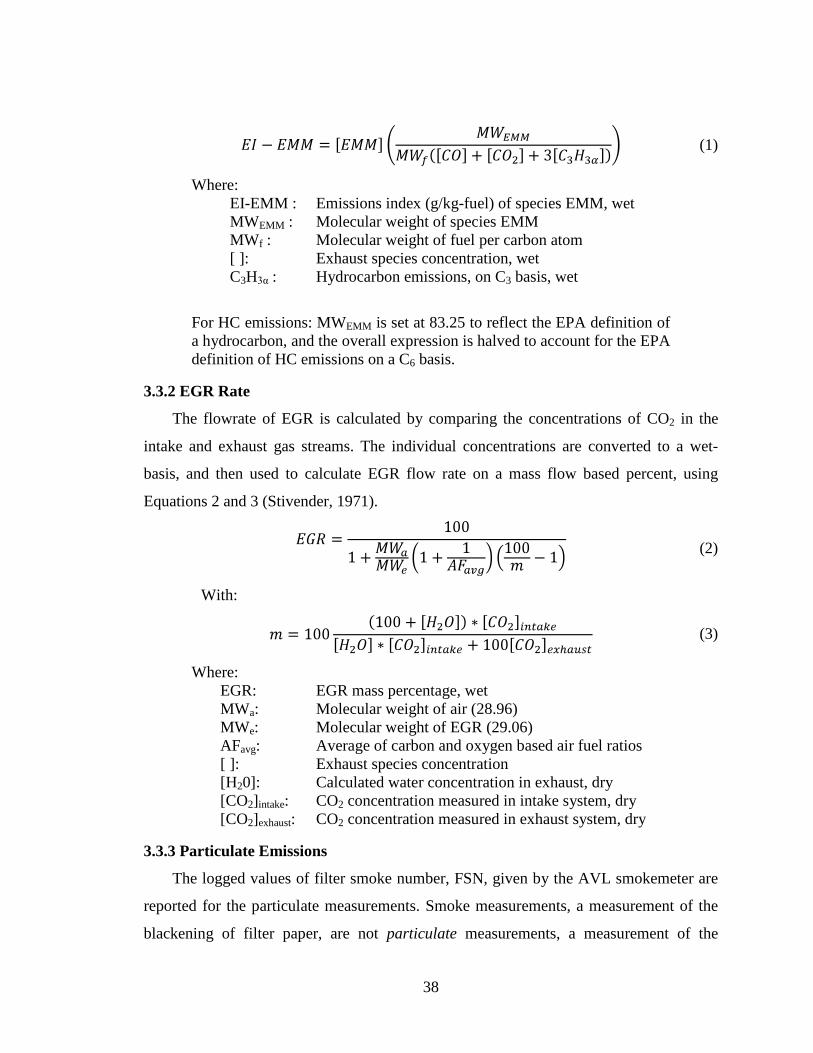
38
(1)
Where: EI-EMM : Emissions index (g/kg-fuel) of species EMM, wet MWEMM : Molecular weight of species EMM MWf : Molecular weight of fuel per carbon atom [ ]: Exhaust species concentration, wet C3H3α : Hydrocarbon emissions, on C3 basis, wet
For HC emissions: MWEMM is set at 83.25 to reflect the EPA definition of a hydrocarbon, and the overall expression is halved to account for the EPA definition of HC emissions on a C6 basis.
3.3.2 EGR Rate
The flowrate of EGR is calculated by comparing the concentrations of CO2 in the
intake and exhaust gas streams. The individual concentrations are converted to a wet-
basis, and then used to calculate EGR flow rate on a mass flow based percent, using
Equations 2 and 3 (Stivender, 1971).
(2)
With:
(3)
Where: EGR: EGR mass percentage, wet MWa: Molecular weight of air (28.96) MWe: Molecular weight of EGR (29.06) AFavg: Average of carbon and oxygen based air fuel ratios [ ]: Exhaust species concentration [H20]: Calculated water concentration in exhaust, dry [CO2]intake: CO2 concentration measured in intake system, dry [CO2]exhaust: CO2 concentration measured in exhaust system, dry
3.3.3 Particulate Emissions
The logged values of filter smoke number, FSN, given by the AVL smokemeter are
reported for the particulate measurements. Smoke measurements, a measurement of the
blackening of filter paper, are not particulate measurements, a measurement of the
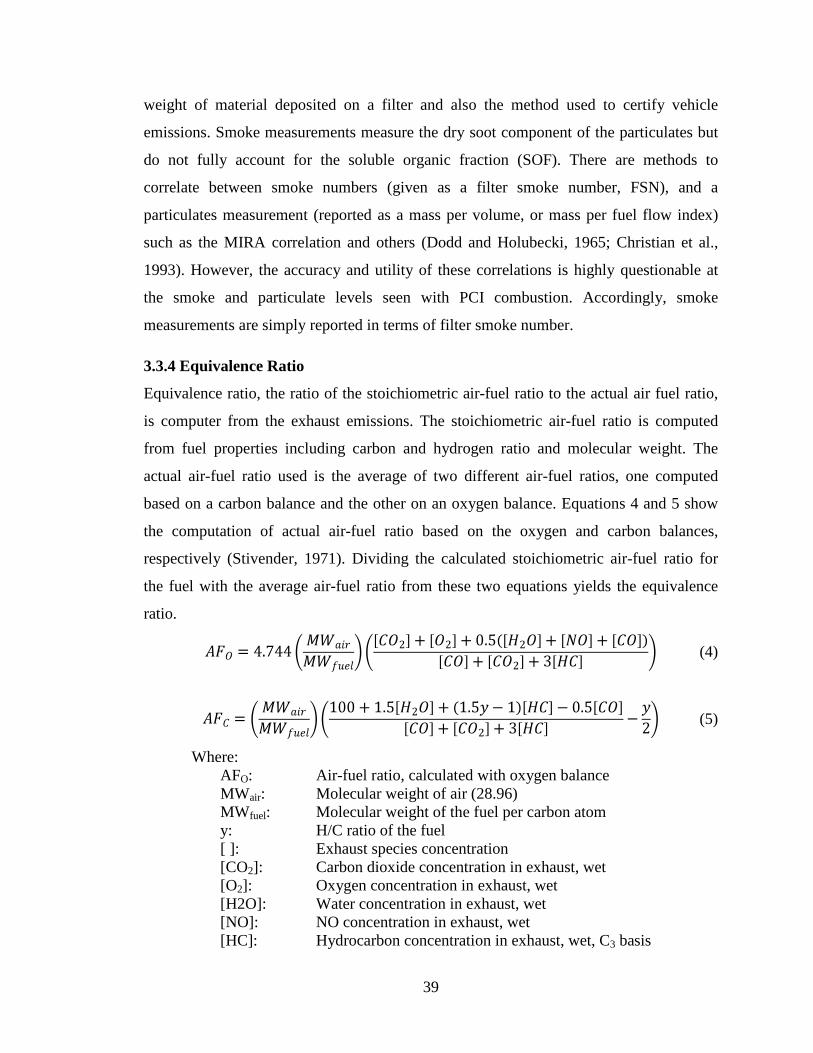
39
weight of material deposited on a filter and also the method used to certify vehicle
emissions. Smoke measurements measure the dry soot component of the particulates but
do not fully account for the soluble organic fraction (SOF). There are methods to
correlate between smoke numbers (given as a filter smoke number, FSN), and a
particulates measurement (reported as a mass per volume, or mass per fuel flow index)
such as the MIRA correlation and others (Dodd and Holubecki, 1965; Christian et al.,
1993). However, the accuracy and utility of these correlations is highly questionable at
the smoke and particulate levels seen with PCI combustion. Accordingly, smoke
measurements are simply reported in terms of filter smoke number.
3.3.4 Equivalence Ratio
Equivalence ratio, the ratio of the stoichiometric air-fuel ratio to the actual air fuel ratio,
is computer from the exhaust emissions. The stoichiometric air-fuel ratio is computed
from fuel properties including carbon and hydrogen ratio and molecular weight. The
actual air-fuel ratio used is the average of two different air-fuel ratios, one computed
based on a carbon balance and the other on an oxygen balance. Equations 4 and 5 show
the computation of actual air-fuel ratio based on the oxygen and carbon balances,
respectively (Stivender, 1971). Dividing the calculated stoichiometric air-fuel ratio for
the fuel with the average air-fuel ratio from these two equations yields the equivalence
ratio.
(4)
(5)
Where: AFO: Air-fuel ratio, calculated with oxygen balance MWair: Molecular weight of air (28.96) MWfuel: Molecular weight of the fuel per carbon atom y: H/C ratio of the fuel [ ]: Exhaust species concentration [CO2]: Carbon dioxide concentration in exhaust, wet [O2]: Oxygen concentration in exhaust, wet [H2O]: Water concentration in exhaust, wet [NO]: NO concentration in exhaust, wet [HC]: Hydrocarbon concentration in exhaust, wet, C3 basis
40
3.3.5 Intake Oxygen Concentration
Absent a direct measurement, the oxygen concentration in the intake air is calculated
from measurements of oxygen in the exhaust gas and the volumetric ratio of EGR flow.
The intake oxygen concentration is reported on a wet, volumetric basis, accounting for
combustion sourced water content in the EGR gas. The concentration is calculated from
the ratio of the intake flow which is EGR versus fresh air. The oxygen content in the
fresh air of the intake is a standard value, while the oxygen concentration in the EGR
flow is the same as in the exhaust gas, which is measured with the emissions bench.
Accordingly, the intake oxygen concentration can be calculated using Equation 6.
(6)
Where: [ ]: Exhaust species concentration [O2]intake: Intake oxygen concentration, wet EGRVOL: EGR volume percentage, wet [O2]exhaust: Oxygen concentration in exhaust, wet [O2]air: Oxygen concentration in air, 20.9% (standard)
3.3.6 Combustion Efficiency
Accordingly, the combustion efficiency is calculated using Equation 7.
(7)
Where: ηcomb: Combustion efficiency [ ]: Exhaust species concentration [CO]: Carbon monoxide concentration in exhaust, wet [CO2]: Carbon dioxide concentration in exhaust, wet [HC]: Hydrocarbon concentration in exhaust, wet, C3 basis [H2]: Hydrogen concentration in exhaust, wet (Equation 8) hfuel: Lower heating value of the fuel (MJ/kg) MWfuel: Molecular weight of the fuel per carbon atom
(8)
Where: [H2]: Hydrogen concentration in exhaust, wet y: H:C ratio of fuel [CO]: Carbon monoxide concentration in exhaust, wet [CO2]: Carbon dioxide concentration in exhaust, wet [H2O]: Water concentration in exhaust, wet
41
3.3.7 Noise
An AVL 450S Combustion Noisemeter is used to estimate the sound level of
combustion. This device applies two filters to the cylinder pressure data, one to simulate
the structural attenuation of a typical engine block and another to meter a subjective
loudness criteria of a human ear, passes the data through a root mean square (RMS)
converter and displays the result in decibels (AVL, 450). The intent is to estimate the
sound level heard from outside the engine during operation.
3.4 Heat Release Analysis Based Parameters
3.4.1 Heat Release Details
Central to much of the analysis following in this dissertation is the use of parameters
calculated by heat release analysis of the cylinder pressure data. Using cylinder pressure
data taken on a crank angle basis, the heat release tracks the progression of combustion
through the cycle. The heat release code used here was a General Motors internal code,
and uses a single-zone, ideal-gas model of the combustion process of the form published
by Gatowski et al. (1984).
The quantity of residual gases in the cylinder impacts the ability of heat release
calculations to reasonably represent the combustion process. An accurate model for
calculating the residual content is therefore highly important. Mass of residuals is
calculated using the expression published by Yun and Mirsky (1974). The final
blowdown conditions are specified in the same manner of the original publication:
cylinder pressure and volume at exhaust valve closing
To account for the heat transfer out of the cylinder, the apparent heat losses are
calculated using a simple pipe flow convective heat transfer correlation. The wall
temperature is assumed to be the same as the bulk gas temperature of the cylinder charge
at intake valve closing. The Hohenberg expression for determining the convection heat
transfer coefficient, the standard for use with compression ignition engines, is used here
as well (Hohenberg, 1979). Once calculated, the heat losses are scaled so that the sum of
the apparent heat released and the calculated heat losses is equal to the total energy
expected from the fuel, based on the fuel flow measurement and lower heating value.
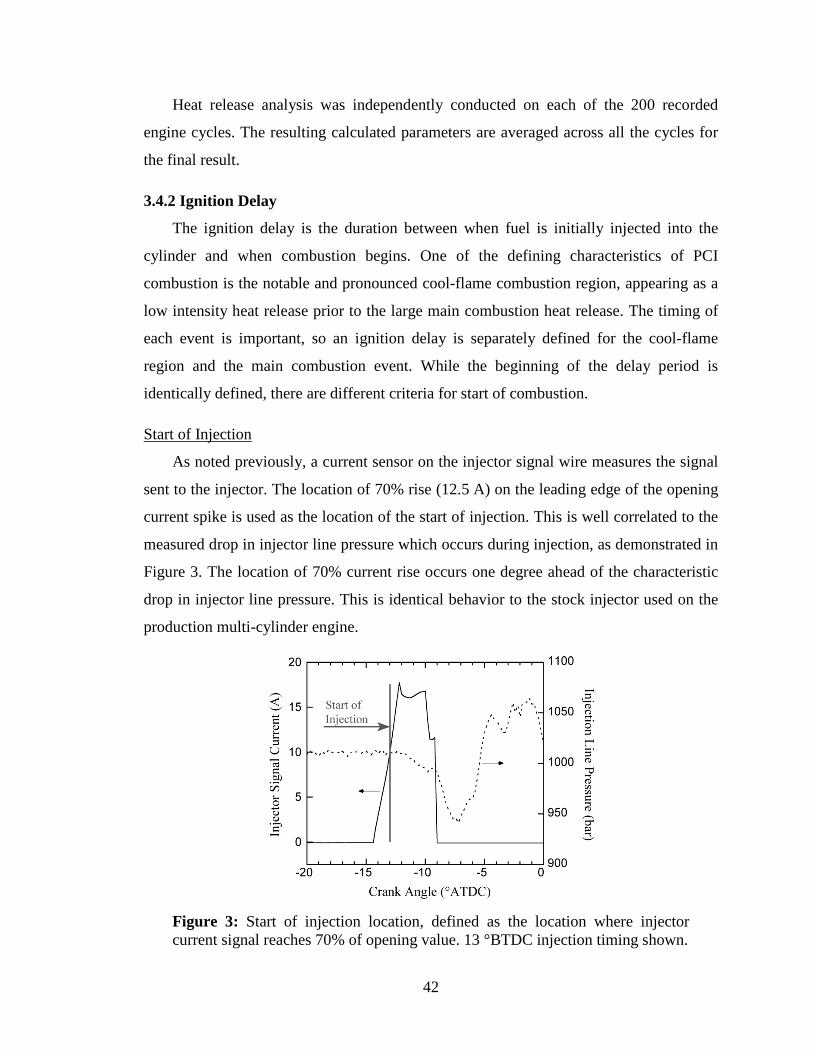
42
Heat release analysis was independently conducted on each of the 200 recorded
engine cycles. The resulting calculated parameters are averaged across all the cycles for
the final result.
3.4.2 Ignition Delay
The ignition delay is the duration between when fuel is initially injected into the
cylinder and when combustion begins. One of the defining characteristics of PCI
combustion is the notable and pronounced cool-flame combustion region, appearing as a
low intensity heat release prior to the large main combustion heat release. The timing of
each event is important, so an ignition delay is separately defined for the cool-flame
region and the main combustion event. While the beginning of the delay period is
identically defined, there are different criteria for start of combustion.
Start of Injection
As noted previously, a current sensor on the injector signal wire measures the signal
sent to the injector. The location of 70% rise (12.5 A) on the leading edge of the opening
current spike is used as the location of the start of injection. This is well correlated to the
measured drop in injector line pressure which occurs during injection, as demonstrated in
Figure 3. The location of 70% current rise occurs one degree ahead of the characteristic
drop in injector line pressure. This is identical behavior to the stock injector used on the
production multi-cylinder engine.
Figure 3: Start of injection location, defined as the location where injector current signal reaches 70% of opening value. 13 °BTDC injection timing shown.
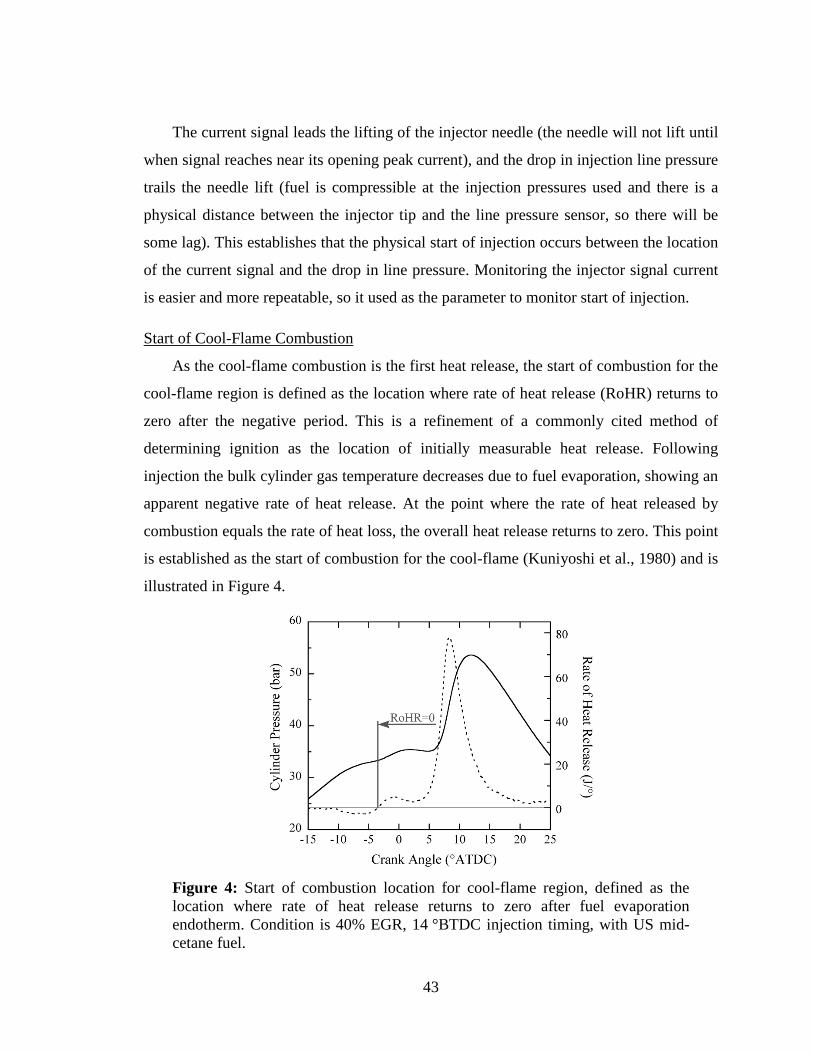
43
The current signal leads the lifting of the injector needle (the needle will not lift until
when signal reaches near its opening peak current), and the drop in injection line pressure
trails the needle lift (fuel is compressible at the injection pressures used and there is a
physical distance between the injector tip and the line pressure sensor, so there will be
some lag). This establishes that the physical start of injection occurs between the location
of the current signal and the drop in line pressure. Monitoring the injector signal current
is easier and more repeatable, so it used as the parameter to monitor start of injection.
Start of Cool-Flame Combustion
As the cool-flame combustion is the first heat release, the start of combustion for the
cool-flame region is defined as the location where rate of heat release (RoHR) returns to
zero after the negative period. This is a refinement of a commonly cited method of
determining ignition as the location of initially measurable heat release. Following
injection the bulk cylinder gas temperature decreases due to fuel evaporation, showing an
apparent negative rate of heat release. At the point where the rate of heat released by
combustion equals the rate of heat loss, the overall heat release returns to zero. This point
is established as the start of combustion for the cool-flame (Kuniyoshi et al., 1980) and is
illustrated in Figure 4.
Figure 4: Start of combustion location for cool-flame region, defined as the location where rate of heat release returns to zero after fuel evaporation endotherm. Condition is 40% EGR, 14 °BTDC injection timing, with US mid-cetane fuel.
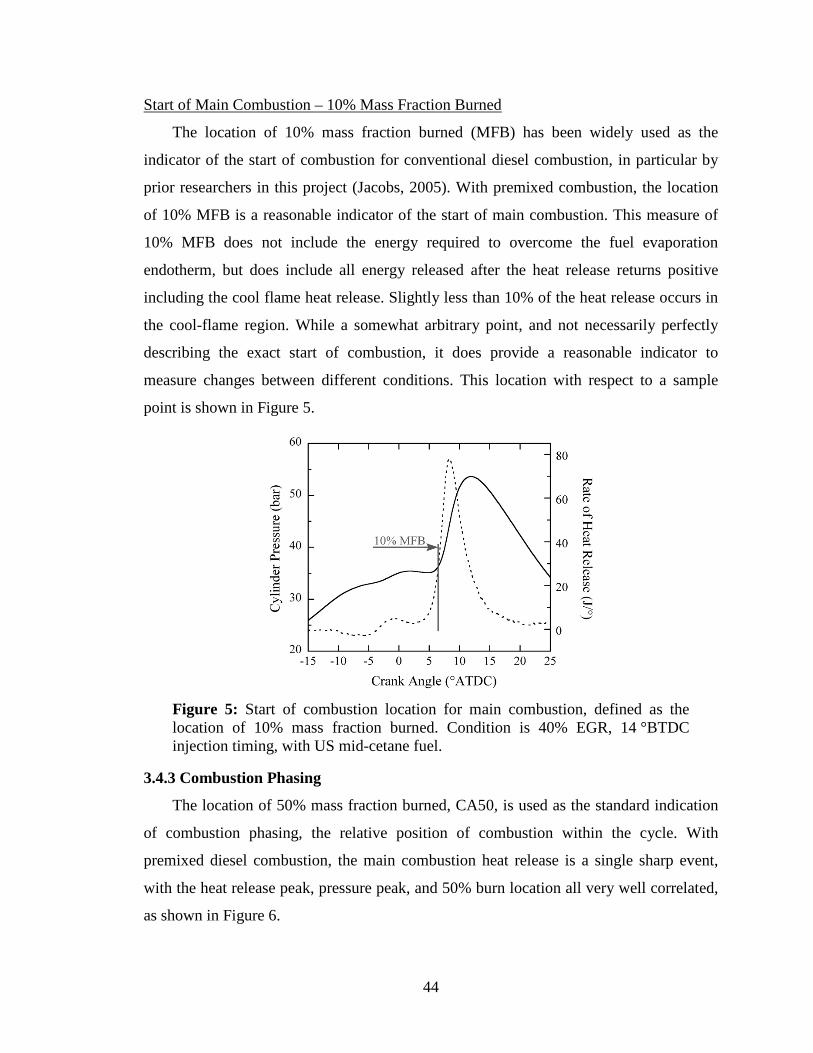
44
Start of Main Combustion – 10% Mass Fraction Burned
The location of 10% mass fraction burned (MFB) has been widely used as the
indicator of the start of combustion for conventional diesel combustion, in particular by
prior researchers in this project (Jacobs, 2005). With premixed combustion, the location
of 10% MFB is a reasonable indicator of the start of main combustion. This measure of
10% MFB does not include the energy required to overcome the fuel evaporation
endotherm, but does include all energy released after the heat release returns positive
including the cool flame heat release. Slightly less than 10% of the heat release occurs in
the cool-flame region. While a somewhat arbitrary point, and not necessarily perfectly
describing the exact start of combustion, it does provide a reasonable indicator to
measure changes between different conditions. This location with respect to a sample
point is shown in Figure 5.
Figure 5: Start of combustion location for main combustion, defined as the location of 10% mass fraction burned. Condition is 40% EGR, 14 °BTDC injection timing, with US mid-cetane fuel.
3.4.3 Combustion Phasing
The location of 50% mass fraction burned, CA50, is used as the standard indication
of combustion phasing, the relative position of combustion within the cycle. With
premixed diesel combustion, the main combustion heat release is a single sharp event,
with the heat release peak, pressure peak, and 50% burn location all very well correlated,
as shown in Figure 6.
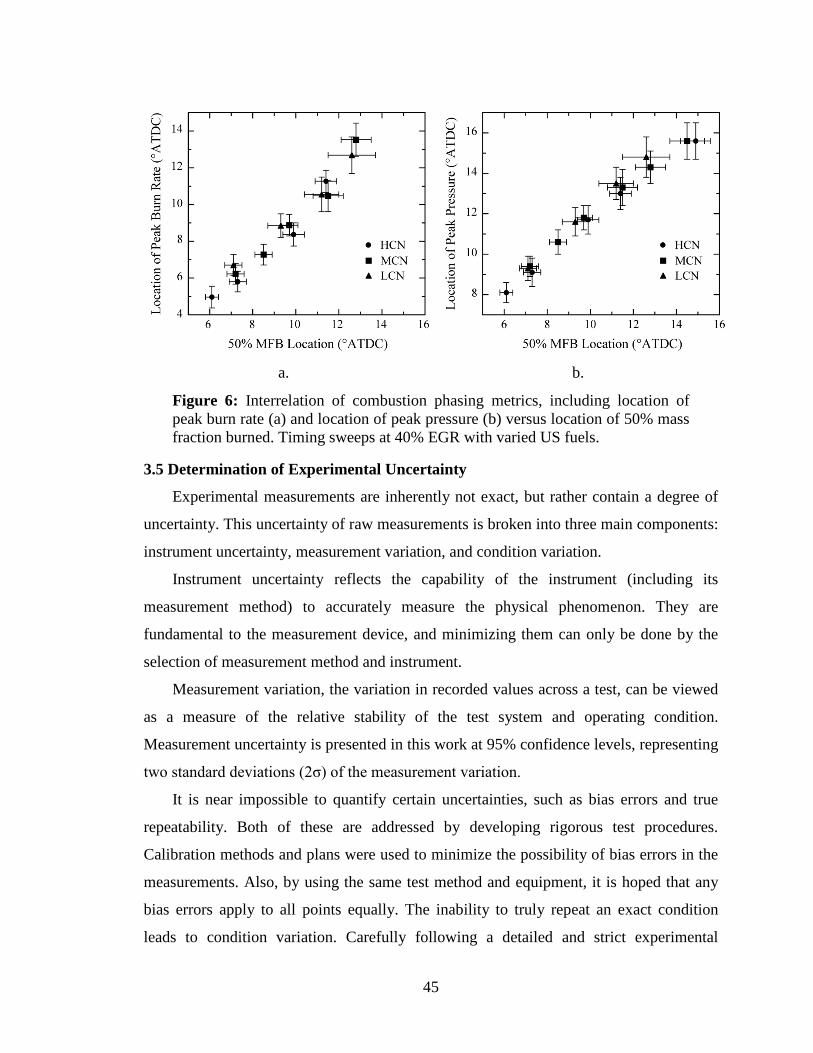
45
a. b.
Figure 6: Interrelation of combustion phasing metrics, including location of peak burn rate (a) and location of peak pressure (b) versus location of 50% mass fraction burned. Timing sweeps at 40% EGR with varied US fuels.
3.5 Determination of Experimental Uncertainty
Experimental measurements are inherently not exact, but rather contain a degree of
uncertainty. This uncertainty of raw measurements is broken into three main components:
instrument uncertainty, measurement variation, and condition variation.
Instrument uncertainty reflects the capability of the instrument (including its
measurement method) to accurately measure the physical phenomenon. They are
fundamental to the measurement device, and minimizing them can only be done by the
selection of measurement method and instrument.
Measurement variation, the variation in recorded values across a test, can be viewed
as a measure of the relative stability of the test system and operating condition.
Measurement uncertainty is presented in this work at 95% confidence levels, representing
two standard deviations (2σ) of the measurement variation.
It is near impossible to quantify certain uncertainties, such as bias errors and true
repeatability. Both of these are addressed by developing rigorous test procedures.
Calibration methods and plans were used to minimize the possibility of bias errors in the
measurements. Also, by using the same test method and equipment, it is hoped that any
bias errors apply to all points equally. The inability to truly repeat an exact condition
leads to condition variation. Carefully following a detailed and strict experimental
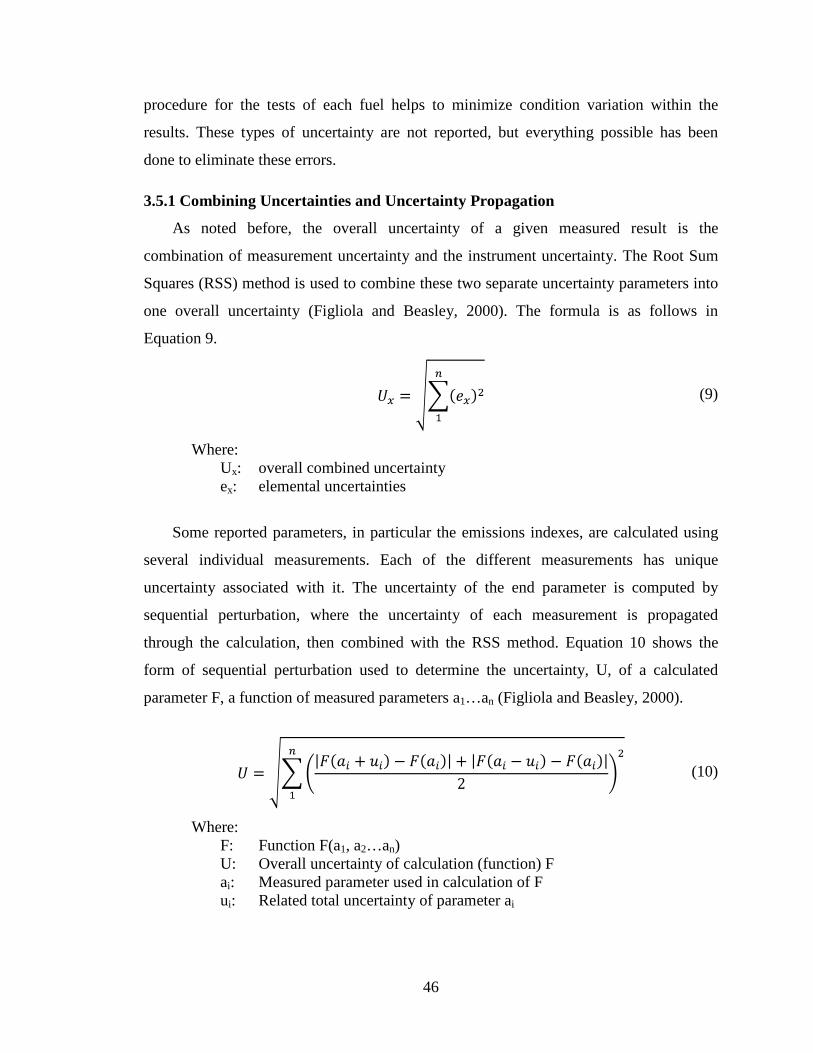
46
procedure for the tests of each fuel helps to minimize condition variation within the
results. These types of uncertainty are not reported, but everything possible has been
done to eliminate these errors.
3.5.1 Combining Uncertainties and Uncertainty Propagation
As noted before, the overall uncertainty of a given measured result is the
combination of measurement uncertainty and the instrument uncertainty. The Root Sum
Squares (RSS) method is used to combine these two separate uncertainty parameters into
one overall uncertainty (Figliola and Beasley, 2000). The formula is as follows in
Equation 9.
(9)
Where: Ux: overall combined uncertainty ex: elemental uncertainties
Some reported parameters, in particular the emissions indexes, are calculated using
several individual measurements. Each of the different measurements has unique
uncertainty associated with it. The uncertainty of the end parameter is computed by
sequential perturbation, where the uncertainty of each measurement is propagated
through the calculation, then combined with the RSS method. Equation 10 shows the
form of sequential perturbation used to determine the uncertainty, U, of a calculated
parameter F, a function of measured parameters a1…an (Figliola and Beasley, 2000).
(10)
Where: F: Function F(a1, a2…an) U: Overall uncertainty of calculation (function) F ai: Measured parameter used in calculation of F ui: Related total uncertainty of parameter ai
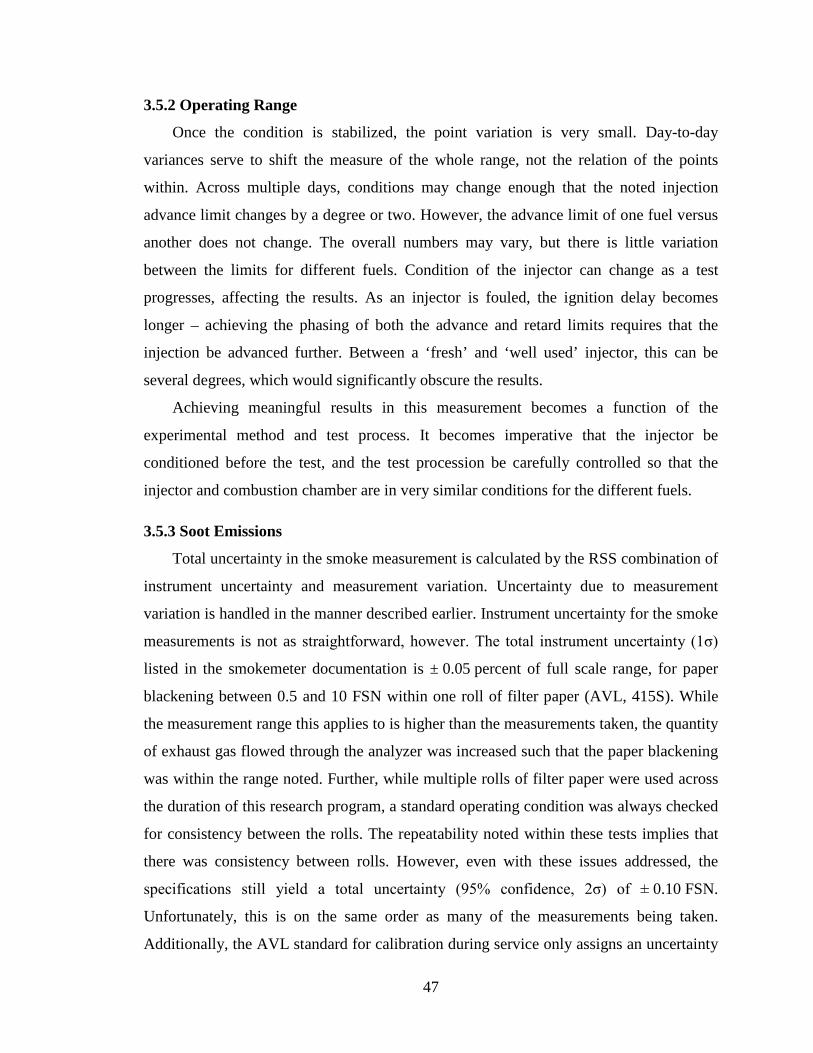
47
3.5.2 Operating Range
Once the condition is stabilized, the point variation is very small. Day-to-day
variances serve to shift the measure of the whole range, not the relation of the points
within. Across multiple days, conditions may change enough that the noted injection
advance limit changes by a degree or two. However, the advance limit of one fuel versus
another does not change. The overall numbers may vary, but there is little variation
between the limits for different fuels. Condition of the injector can change as a test
progresses, affecting the results. As an injector is fouled, the ignition delay becomes
longer – achieving the phasing of both the advance and retard limits requires that the
injection be advanced further. Between a ‘fresh’ and ‘well used’ injector, this can be
several degrees, which would significantly obscure the results.
Achieving meaningful results in this measurement becomes a function of the
experimental method and test process. It becomes imperative that the injector be
conditioned before the test, and the test procession be carefully controlled so that the
injector and combustion chamber are in very similar conditions for the different fuels.
3.5.3 Soot Emissions
Total uncertainty in the smoke measurement is calculated by the RSS combination of
instrument uncertainty and measurement variation. Uncertainty due to measurement
variation is handled in the manner described earlier. Instrument uncertainty for the smoke
measurements is not as straightforward, however. The total instrument uncertainty (1σ)
listed in the smokemeter documentation is ± 0.05 percent of full scale range, for paper
blackening between 0.5 and 10 FSN within one roll of filter paper (AVL, 415S). While
the measurement range this applies to is higher than the measurements taken, the quantity
of exhaust gas flowed through the analyzer was increased such that the paper blackening
was within the range noted. Further, while multiple rolls of filter paper were used across
the duration of this research program, a standard operating condition was always checked
for consistency between the rolls. The repeatability noted within these tests implies that
there was consistency between rolls. However, even with these issues addressed, the
specifications still yield a total uncertainty (95% confidence, 2σ) of ± 0.10 FSN.
Unfortunately, this is on the same order as many of the measurements being taken.
Additionally, the AVL standard for calibration during service only assigns an uncertainty
48
of ± 0.15 FSN, indicating the uncertainty is even larger than the value quoted in the
specifications. Repeatability, however, is quite good and is less of an issue than the
measurement uncertainty, but is still factored in to the overall uncertainty calculations.
Due to the equivalence of the range of instrument uncertainty with the measurements
being taken, only gross trends and sizeable changes will be discussed. Two different
uncertainty ranges will be used in figures showing smoke emissions. For the bulk of the
work (which produces low smoke levels), the combination of only resolution and
measurement uncertainty will be used (neglecting instrument uncertainty). For the higher
smoke data reported in Chapter Seven, the full measurement + resolution + instrument
uncertainty will be presented. With each figure presenting smoke data, the uncertainty
method used will be denoted in the accompanying caption.
3.5.4 Gaseous Emissions Indices
All of the gaseous emissions are reported on an emissions index basis. As discussed
earlier, the emissions index calculations use several exhaust gas emissions in each
calculation: CO, CO2, and HC. The overall uncertainty is therefore a function of all the
emissions used in the calculation. The uncertainty for the gaseous emissions is therefore
calculated using the sequential perturbation method of combining the uncertainties of
each emission measurement used in the overall index calculation.
The uncertainty of the individual gaseous emissions measurements are a combination
of the instrument uncertainty and measurement variation. Measurement variation is
calculated in the manner noted previously. Instrument uncertainty is the combination of
uncertainties for a given analyzer: resolution (display uncertainty), sensitivity (calibration
uncertainty), repeatability (variation in measurement accuracy over one day/test), and
drift (day-to-day change in measurement accuracy). These component uncertainties are
combined using the RSS method to determine an overall instrument uncertainty. For each
of the gaseous emissions, and related analyzers, the component and total instrument
uncertainty is listed in Table 3.
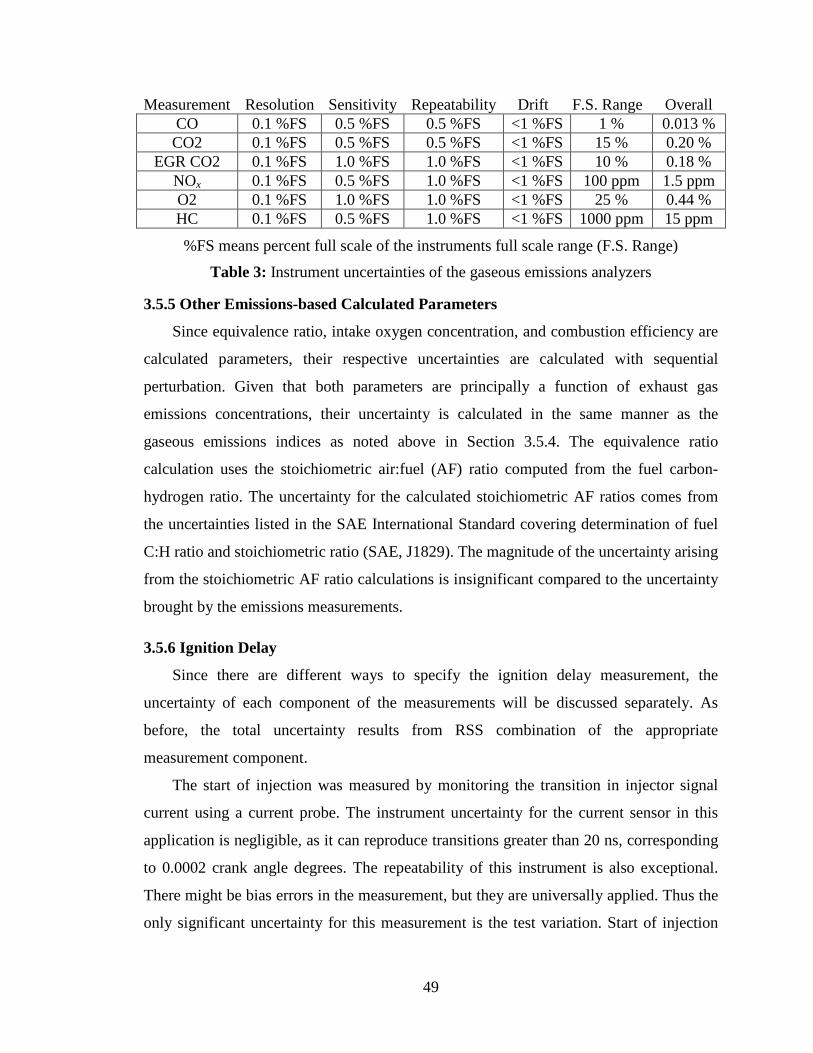
49
Measurement Resolution Sensitivity Repeatability Drift F.S. Range Overall CO 0.1 %FS 0.5 %FS 0.5 %FS <1 %FS 1 % 0.013 % CO2 0.1 %FS 0.5 %FS 0.5 %FS <1 %FS 15 % 0.20 %
EGR CO2 0.1 %FS 1.0 %FS 1.0 %FS <1 %FS 10 % 0.18 % NOx 0.1 %FS 0.5 %FS 1.0 %FS <1 %FS 100 ppm 1.5 ppm O2 0.1 %FS 1.0 %FS 1.0 %FS <1 %FS 25 % 0.44 % HC 0.1 %FS 0.5 %FS 1.0 %FS <1 %FS 1000 ppm 15 ppm
%FS means percent full scale of the instruments full scale range (F.S. Range)
Table 3: Instrument uncertainties of the gaseous emissions analyzers
3.5.5 Other Emissions-based Calculated Parameters
Since equivalence ratio, intake oxygen concentration, and combustion efficiency are
calculated parameters, their respective uncertainties are calculated with sequential
perturbation. Given that both parameters are principally a function of exhaust gas
emissions concentrations, their uncertainty is calculated in the same manner as the
gaseous emissions indices as noted above in Section 3.5.4. The equivalence ratio
calculation uses the stoichiometric air:fuel (AF) ratio computed from the fuel carbon-
hydrogen ratio. The uncertainty for the calculated stoichiometric AF ratios comes from
the uncertainties listed in the SAE International Standard covering determination of fuel
C:H ratio and stoichiometric ratio (SAE, J1829). The magnitude of the uncertainty arising
from the stoichiometric AF ratio calculations is insignificant compared to the uncertainty
brought by the emissions measurements.
3.5.6 Ignition Delay
Since there are different ways to specify the ignition delay measurement, the
uncertainty of each component of the measurements will be discussed separately. As
before, the total uncertainty results from RSS combination of the appropriate
measurement component.
The start of injection was measured by monitoring the transition in injector signal
current using a current probe. The instrument uncertainty for the current sensor in this
application is negligible, as it can reproduce transitions greater than 20 ns, corresponding
to 0.0002 crank angle degrees. The repeatability of this instrument is also exceptional.
There might be bias errors in the measurement, but they are universally applied. Thus the
only significant uncertainty for this measurement is the test variation. Start of injection
50
never varied by more than ± 0.1 degrees, so this is used as the uncertainty for the start of
injection measurement.
Establishing the uncertainty for the start of cool-flame combustion, RoHR=0, was a
tedious examination of individual rate of heat release curves. Individual rate of heat
release curves were calculated for each of the 200 cycles in a representative case, and the
variation across the each cycle was compiled. Due to the labor intensive nature of this
process, a single typical operating case was examined, and the results are taken to be
representative. The variation across engine cycles is also judged to be large enough to
dwarf any instrument uncertainty for this particular measurement. The uncertainty used
for all case of the RoHR=0 point is ± 0.5 degrees.
Uncertainty for the location of 10% MFB is two standard deviations of the 200-cycle
values calculated within the heat release program.
3.5.7 Combustion Phasing
Uncertainty for the location of 50% MFB, used as the metric for combustion
phasing, is calculated the same as it was for 10% MFB: two standard deviations of the
200-cycle values calculated within the heat release program.
3.5.8 Temperatures
Temperature measurements are taken exclusively with K-type thermocouples from
Omega. The uncertainty for the thermocouples used is ± 2.4 °C or 0.75% of measurement
value, whichever is larger. This quoted uncertainty is used for the instrument uncertainty,
and combined with the measurement variation using the RSS method.
51
CHAPTER 4
FUEL CETANE NUMBER EFFECT
4.1 Introduction
Cetane number is an obvious property to vary in a diesel fuels study, as it is one of
the foremost methods of quantifying diesel fuel. It is a qualitative measurement of basic
ignition behavior and ignition quality which effectively lumps all fuel properties into one
main parameter. Given the potential importance of ignition behavior to novel diesel
combustion modes, examination of cetane number behavior is critical. The wide variation
in fuel properties seen in the field is well represented by the significant variation in
cetane number.
The fuel cetane number is varied across a relatively small range which covers what
fuels are available in the field. Initial focus is the effect of cetane number on combustion
phenomena and behavior. Implications for combustion and emissions of varying cetane
number are then detailed within the context of combustion phasing. Additionally, other
engine parameter effects are examined relative to the fuel behavioral results. The range of
injection timing and combustion phasing which yield acceptable operation is also
reviewed. Finally, combustion and emissions behavior is framed through a more
commonly referenced context, injection timing, to elucidate perceived trends.
4.2 Test Methodology
4.2.1 Test Fuels
A set of four test fuels is used for this portion of the study: three US ultra-low sulfur
diesel (ULSD) certification fuels of varying cetane number, and one light distillation
Swedish Environmental Class 1 (MK1) diesel fuel. The three US certification fuels were
blended by the supplier to possess cetane numbers across an approximate range of 40-50,
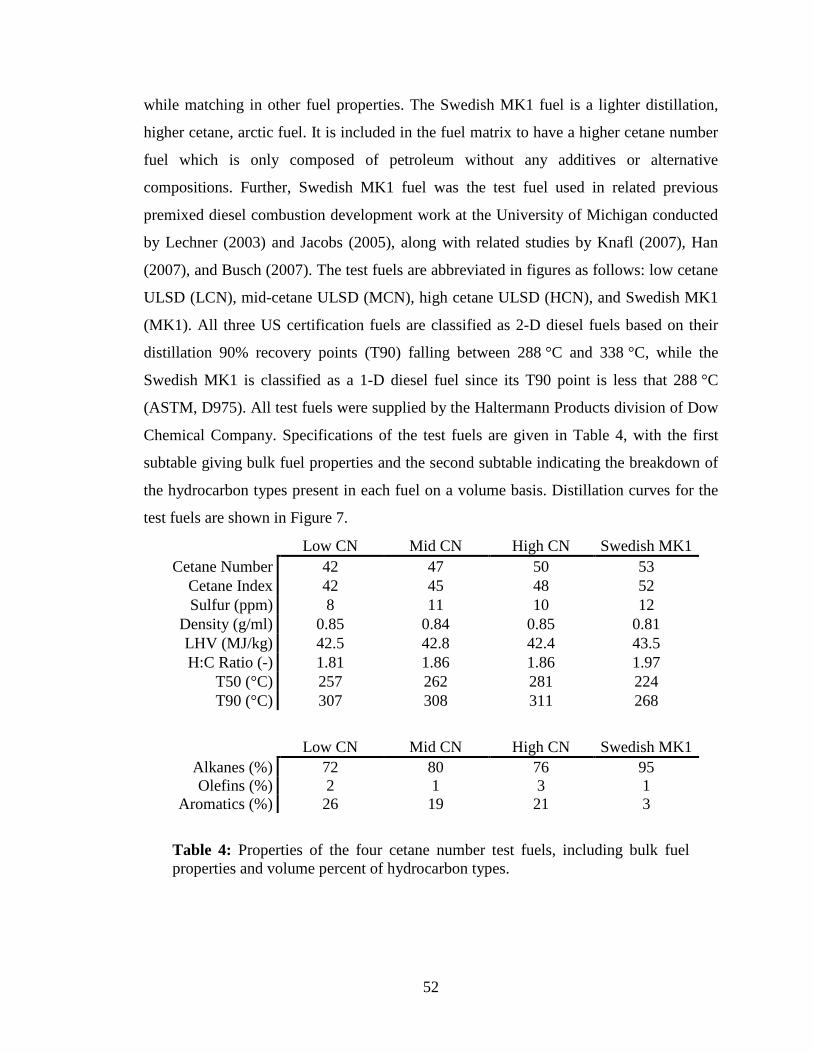
52
while matching in other fuel properties. The Swedish MK1 fuel is a lighter distillation,
higher cetane, arctic fuel. It is included in the fuel matrix to have a higher cetane number
fuel which is only composed of petroleum without any additives or alternative
compositions. Further, Swedish MK1 fuel was the test fuel used in related previous
premixed diesel combustion development work at the University of Michigan conducted
by Lechner (2003) and Jacobs (2005), along with related studies by Knafl (2007), Han
(2007), and Busch (2007). The test fuels are abbreviated in figures as follows: low cetane
ULSD (LCN), mid-cetane ULSD (MCN), high cetane ULSD (HCN), and Swedish MK1
(MK1). All three US certification fuels are classified as 2-D diesel fuels based on their
distillation 90% recovery points (T90) falling between 288 °C and 338 °C, while the
Swedish MK1 is classified as a 1-D diesel fuel since its T90 point is less that 288 °C
(ASTM, D975). All test fuels were supplied by the Haltermann Products division of Dow
Chemical Company. Specifications of the test fuels are given in Table 4, with the first
subtable giving bulk fuel properties and the second subtable indicating the breakdown of
the hydrocarbon types present in each fuel on a volume basis. Distillation curves for the
test fuels are shown in Figure 7.
Low CN Mid CN High CN Swedish MK1 Cetane Number 42 47 50 53
Cetane Index 42 45 48 52 Sulfur (ppm) 8 11 10 12
Density (g/ml) 0.85 0.84 0.85 0.81 LHV (MJ/kg) 42.5 42.8 42.4 43.5 H:C Ratio (-) 1.81 1.86 1.86 1.97
T50 (°C) 257 262 281 224 T90 (°C) 307 308 311 268
Low CN Mid CN High CN Swedish MK1 Alkanes (%) 72 80 76 95 Olefins (%) 2 1 3 1
Aromatics (%) 26 19 21 3
Table 4: Properties of the four cetane number test fuels, including bulk fuel properties and volume percent of hydrocarbon types.
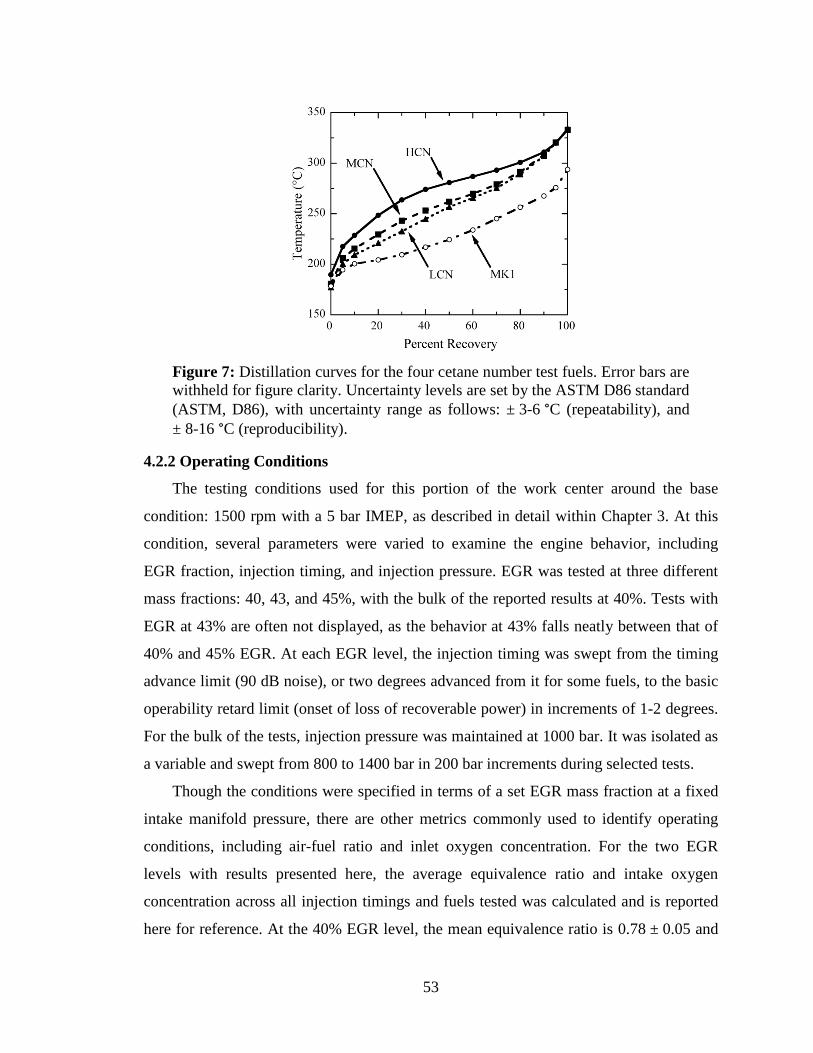
53
Figure 7: Distillation curves for the four cetane number test fuels. Error bars are withheld for figure clarity. Uncertainty levels are set by the ASTM D86 standard (ASTM, D86), with uncertainty range as follows: ± 3-6 °C (repeatability), and ± 8-16 °C (reproducibility).
4.2.2 Operating Conditions
The testing conditions used for this portion of the work center around the base
condition: 1500 rpm with a 5 bar IMEP, as described in detail within Chapter 3. At this
condition, several parameters were varied to examine the engine behavior, including
EGR fraction, injection timing, and injection pressure. EGR was tested at three different
mass fractions: 40, 43, and 45%, with the bulk of the reported results at 40%. Tests with
EGR at 43% are often not displayed, as the behavior at 43% falls neatly between that of
40% and 45% EGR. At each EGR level, the injection timing was swept from the timing
advance limit (90 dB noise), or two degrees advanced from it for some fuels, to the basic
operability retard limit (onset of loss of recoverable power) in increments of 1-2 degrees.
For the bulk of the tests, injection pressure was maintained at 1000 bar. It was isolated as
a variable and swept from 800 to 1400 bar in 200 bar increments during selected tests.
Though the conditions were specified in terms of a set EGR mass fraction at a fixed
intake manifold pressure, there are other metrics commonly used to identify operating
conditions, including air-fuel ratio and inlet oxygen concentration. For the two EGR
levels with results presented here, the average equivalence ratio and intake oxygen
concentration across all injection timings and fuels tested was calculated and is reported
here for reference. At the 40% EGR level, the mean equivalence ratio is 0.78 ± 0.05 and
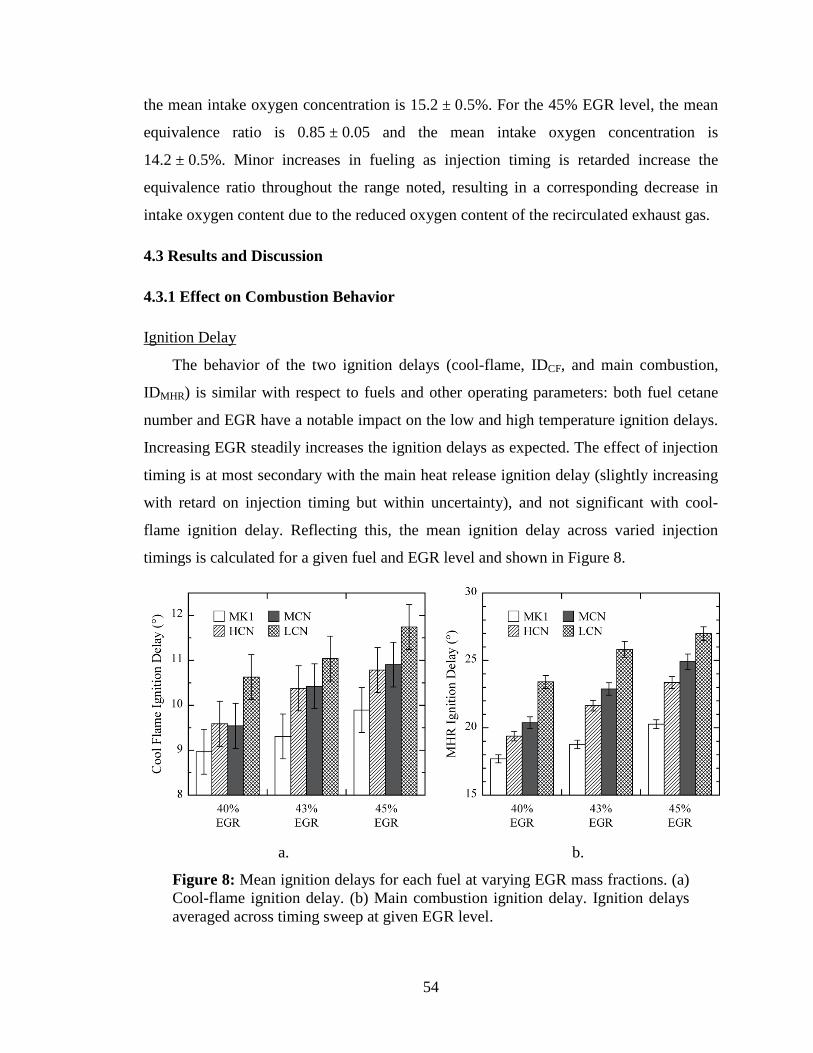
54
the mean intake oxygen concentration is 15.2 ± 0.5%. For the 45% EGR level, the mean
equivalence ratio is 0.85 ± 0.05 and the mean intake oxygen concentration is
14.2 ± 0.5%. Minor increases in fueling as injection timing is retarded increase the
equivalence ratio throughout the range noted, resulting in a corresponding decrease in
intake oxygen content due to the reduced oxygen content of the recirculated exhaust gas.
4.3 Results and Discussion
4.3.1 Effect on Combustion Behavior
Ignition Delay
The behavior of the two ignition delays (cool-flame, IDCF, and main combustion,
IDMHR) is similar with respect to fuels and other operating parameters: both fuel cetane
number and EGR have a notable impact on the low and high temperature ignition delays.
Increasing EGR steadily increases the ignition delays as expected. The effect of injection
timing is at most secondary with the main heat release ignition delay (slightly increasing
with retard on injection timing but within uncertainty), and not significant with cool-
flame ignition delay. Reflecting this, the mean ignition delay across varied injection
timings is calculated for a given fuel and EGR level and shown in Figure 8.
a. b.
Figure 8: Mean ignition delays for each fuel at varying EGR mass fractions. (a) Cool-flame ignition delay. (b) Main combustion ignition delay. Ignition delays averaged across timing sweep at given EGR level.
55
Decreases in fuel cetane number increase both the cool-flame and main combustion
ignition delays. There is, however, relative parity between the cool-flame ignition delays
for the high and mid cetane fuels. The cetane numbers of these two fuels are close and the
uncertainty in the cool-flame ignition delay measurement is substantial due to high cycle-
to-cycle variation in the start of combustion location. The effect of cetane number on the
MHR ignition delay is more clear, with distinct differences between each fuel of different
cetane number. The difference in MHR ignition delay between fuels is relatively
proportional to their separation in cetane number. The high temperature ignition process,
being controlled primarily by the fuel ignition chemistry, is notably very dependent on
the cetane number. This is expected, since cetane number is inherently tied to a
measurement of ignition delay (ASTM, D613).
Cool-Flame Behavior
One of the defining characteristics of premixed diesel combustion, and of most
diesel-fueled low temperature combustion strategies, is the presence of a distinctly
identifiable cool-flame heat release. Also known as Low Temperature Heat Release,
LTHR, the cool-flame is a small combustion heat release occurring prior to the main,
high temperature, heat release. Cool-flames are present with most diesel fuels, and some
diesel-like gasoline. Since gasoline and diesel are both petroleum blends, extremes of
each can act similarly – very low octane gasoline is very similar to high cetane diesel
fuel. Prior researchers note the cool-flame heat release for HCCI type operation with
gasoline-like petroleum fuels exhibiting an octane number lower than 83 (Christensen et
al., 1999), and for diesel-like petroleum fuels with a cetane number higher than 34
(Bunting et al., 2007). The amount of cool-flame heat release in each case increases with
decreasing octane number and increasing cetane number, respectively.
It should be noted that prior research shows cool-flame reactions occur during diesel
combustion of appropriate fuels, not just during HCCI type operation (Garner et al.,
1956). However, under conventional conditions, the high temperature heat release starts
at nearly the same time as the low temperature heat release and overshadows it. In
premixed diesel combustion, and other similar combustion modes, the main high
temperature heat release is delayed enough that the low temperature heat release is
separately visible.
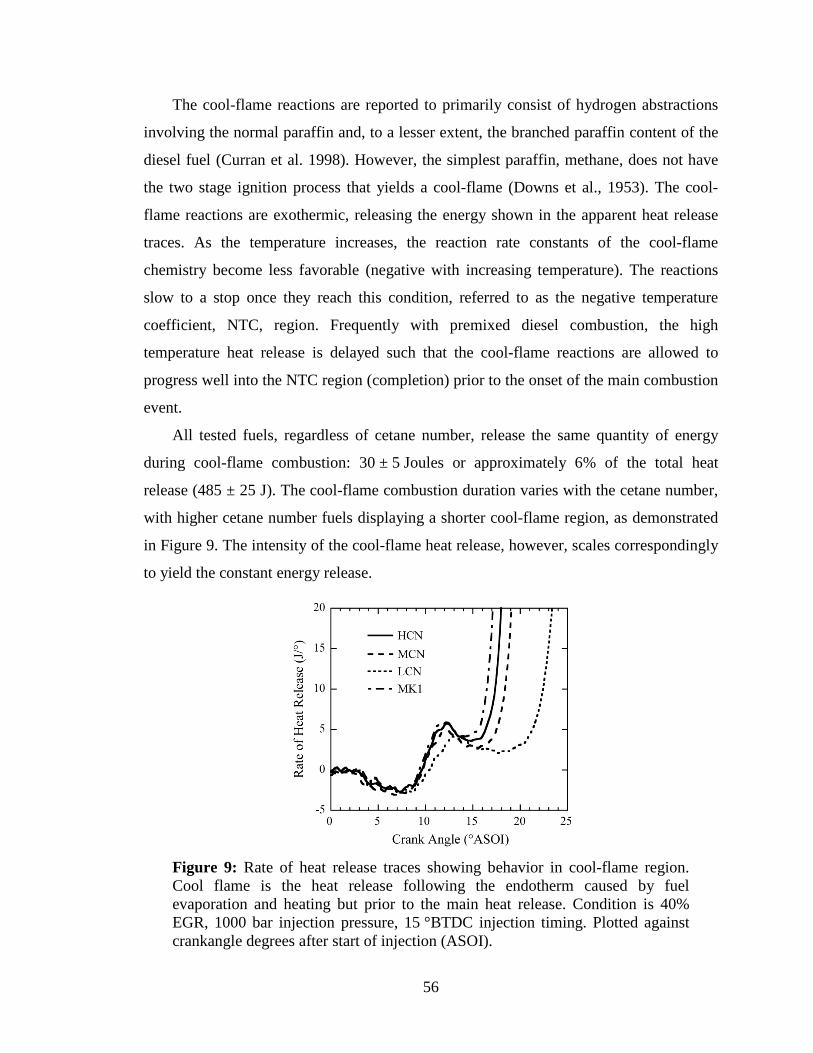
56
The cool-flame reactions are reported to primarily consist of hydrogen abstractions
involving the normal paraffin and, to a lesser extent, the branched paraffin content of the
diesel fuel (Curran et al. 1998). However, the simplest paraffin, methane, does not have
the two stage ignition process that yields a cool-flame (Downs et al., 1953). The cool-
flame reactions are exothermic, releasing the energy shown in the apparent heat release
traces. As the temperature increases, the reaction rate constants of the cool-flame
chemistry become less favorable (negative with increasing temperature). The reactions
slow to a stop once they reach this condition, referred to as the negative temperature
coefficient, NTC, region. Frequently with premixed diesel combustion, the high
temperature heat release is delayed such that the cool-flame reactions are allowed to
progress well into the NTC region (completion) prior to the onset of the main combustion
event.
All tested fuels, regardless of cetane number, release the same quantity of energy
during cool-flame combustion: 30 ± 5 Joules or approximately 6% of the total heat
release (485 ± 25 J). The cool-flame combustion duration varies with the cetane number,
with higher cetane number fuels displaying a shorter cool-flame region, as demonstrated
in Figure 9. The intensity of the cool-flame heat release, however, scales correspondingly
to yield the constant energy release.
Figure 9: Rate of heat release traces showing behavior in cool-flame region. Cool flame is the heat release following the endotherm caused by fuel evaporation and heating but prior to the main heat release. Condition is 40% EGR, 1000 bar injection pressure, 15 °BTDC injection timing. Plotted against crankangle degrees after start of injection (ASOI).
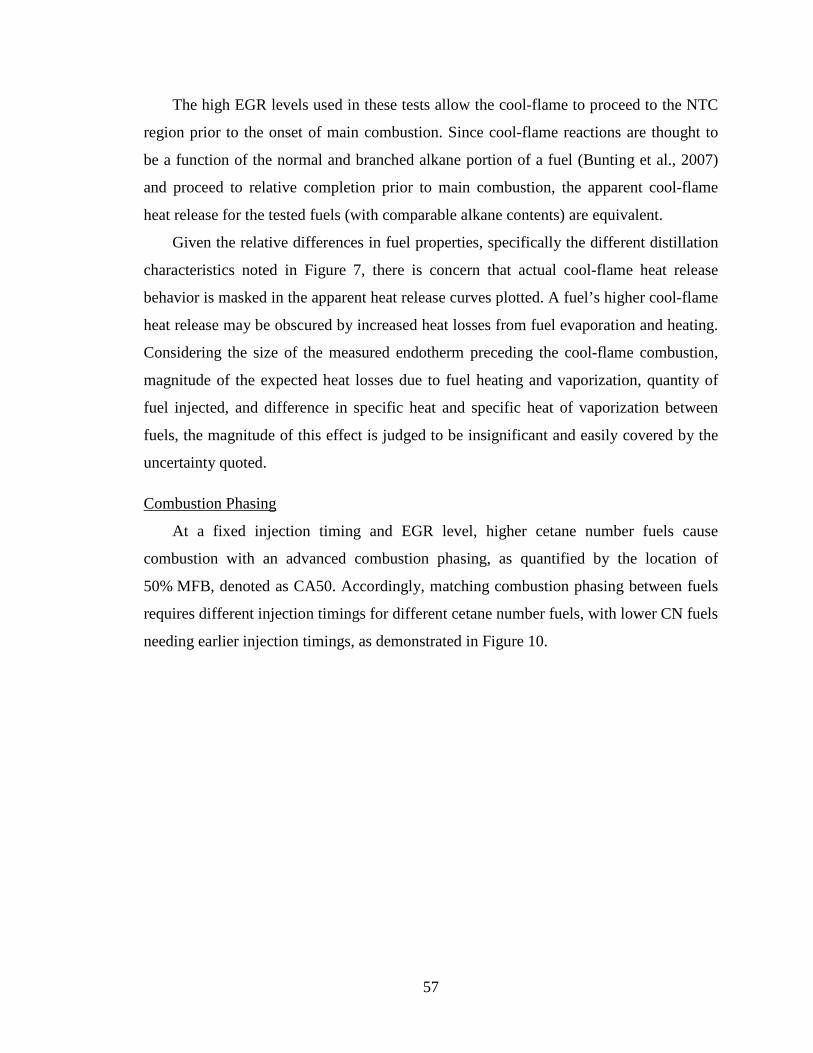
57
The high EGR levels used in these tests allow the cool-flame to proceed to the NTC
region prior to the onset of main combustion. Since cool-flame reactions are thought to
be a function of the normal and branched alkane portion of a fuel (Bunting et al., 2007)
and proceed to relative completion prior to main combustion, the apparent cool-flame
heat release for the tested fuels (with comparable alkane contents) are equivalent.
Given the relative differences in fuel properties, specifically the different distillation
characteristics noted in Figure 7, there is concern that actual cool-flame heat release
behavior is masked in the apparent heat release curves plotted. A fuel’s higher cool-flame
heat release may be obscured by increased heat losses from fuel evaporation and heating.
Considering the size of the measured endotherm preceding the cool-flame combustion,
magnitude of the expected heat losses due to fuel heating and vaporization, quantity of
fuel injected, and difference in specific heat and specific heat of vaporization between
fuels, the magnitude of this effect is judged to be insignificant and easily covered by the
uncertainty quoted.
Combustion Phasing
At a fixed injection timing and EGR level, higher cetane number fuels cause
combustion with an advanced combustion phasing, as quantified by the location of
50% MFB, denoted as CA50. Accordingly, matching combustion phasing between fuels
requires different injection timings for different cetane number fuels, with lower CN fuels
needing earlier injection timings, as demonstrated in Figure 10.
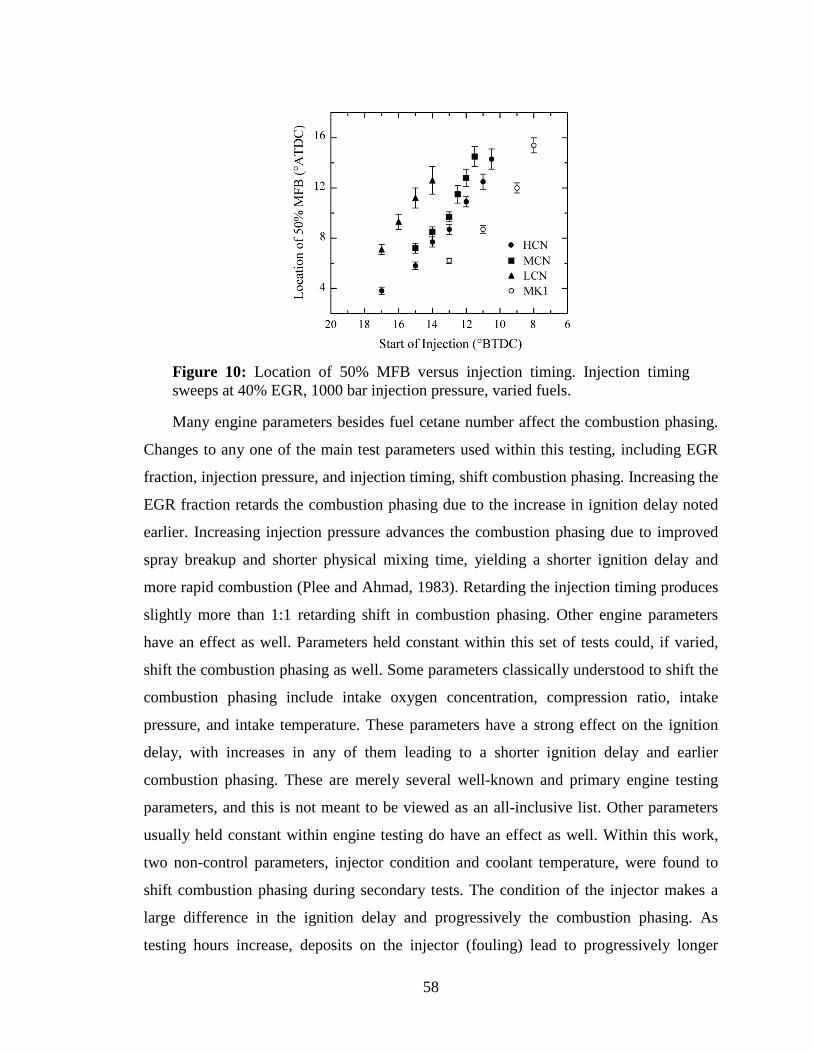
58
Figure 10: Location of 50% MFB versus injection timing. Injection timing sweeps at 40% EGR, 1000 bar injection pressure, varied fuels.
Many engine parameters besides fuel cetane number affect the combustion phasing.
Changes to any one of the main test parameters used within this testing, including EGR
fraction, injection pressure, and injection timing, shift combustion phasing. Increasing the
EGR fraction retards the combustion phasing due to the increase in ignition delay noted
earlier. Increasing injection pressure advances the combustion phasing due to improved
spray breakup and shorter physical mixing time, yielding a shorter ignition delay and
more rapid combustion (Plee and Ahmad, 1983). Retarding the injection timing produces
slightly more than 1:1 retarding shift in combustion phasing. Other engine parameters
have an effect as well. Parameters held constant within this set of tests could, if varied,
shift the combustion phasing as well. Some parameters classically understood to shift the
combustion phasing include intake oxygen concentration, compression ratio, intake
pressure, and intake temperature. These parameters have a strong effect on the ignition
delay, with increases in any of them leading to a shorter ignition delay and earlier
combustion phasing. These are merely several well-known and primary engine testing
parameters, and this is not meant to be viewed as an all-inclusive list. Other parameters
usually held constant within engine testing do have an effect as well. Within this work,
two non-control parameters, injector condition and coolant temperature, were found to
shift combustion phasing during secondary tests. The condition of the injector makes a
large difference in the ignition delay and progressively the combustion phasing. As
testing hours increase, deposits on the injector (fouling) lead to progressively longer
59
ignition delays and retarded combustion phasing. Changing the coolant temperature also
has an effect: reducing coolant temperature by 25 °C increases the ignition delay and
retards the combustion phasing by three degrees across the range of conditions. Given the
sensitivity to these parameters, it is likely that variations in many other engine parameters
held constant in these tests have an effect as well.
4.3.2 Emissions as a Function of Combustion Phasing
With the PCI combustion strategy and fuel used, gaseous emissions, in particular
NOx (NO + NO2), are principally a function of the EGR fraction and combustion phasing.
Fuel cetane number does not have a direct effect on gaseous emissions: it is only one of
many parameters that shift combustion phasing. These resulting shifts in combustion
phasing drive the change in emissions. Changes in EGR fraction affect the gaseous
emissions in the manner predicted by previous literature: increasing the fraction of cooled
EGR decreases NOx emissions while increasing emissions of carbon monoxide (CO), and
hydrocarbons (HC) (Ladommatos et al., 1996-1, 1996-2, 1997-1, 1997-2).
NOx emissions, in particular, are highly dependent on combustion phasing and
independent of cetane number. The NOx generated by each fuel follows the same trend,
with NOx levels decreasing with a retard in combustion phasing within the range of
injection timing values tested. There are no significant differences between the NOx
emissions from the different cetane number test fuels at a particular EGR level and
combustion phasing, as demonstrated in Figure 11.
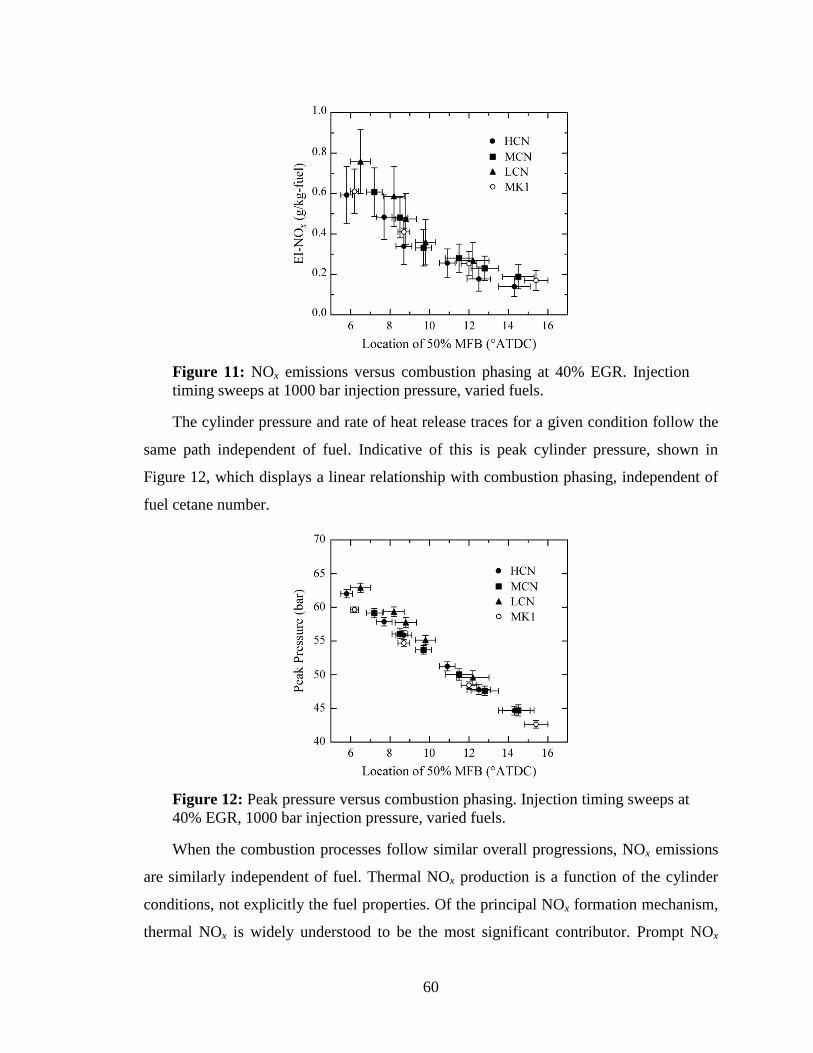
60
Figure 11: NOx emissions versus combustion phasing at 40% EGR. Injection timing sweeps at 1000 bar injection pressure, varied fuels.
The cylinder pressure and rate of heat release traces for a given condition follow the
same path independent of fuel. Indicative of this is peak cylinder pressure, shown in
Figure 12, which displays a linear relationship with combustion phasing, independent of
fuel cetane number.
Figure 12: Peak pressure versus combustion phasing. Injection timing sweeps at 40% EGR, 1000 bar injection pressure, varied fuels.
When the combustion processes follow similar overall progressions, NOx emissions
are similarly independent of fuel. Thermal NOx production is a function of the cylinder
conditions, not explicitly the fuel properties. Of the principal NOx formation mechanism,
thermal NOx is widely understood to be the most significant contributor. Prompt NOx
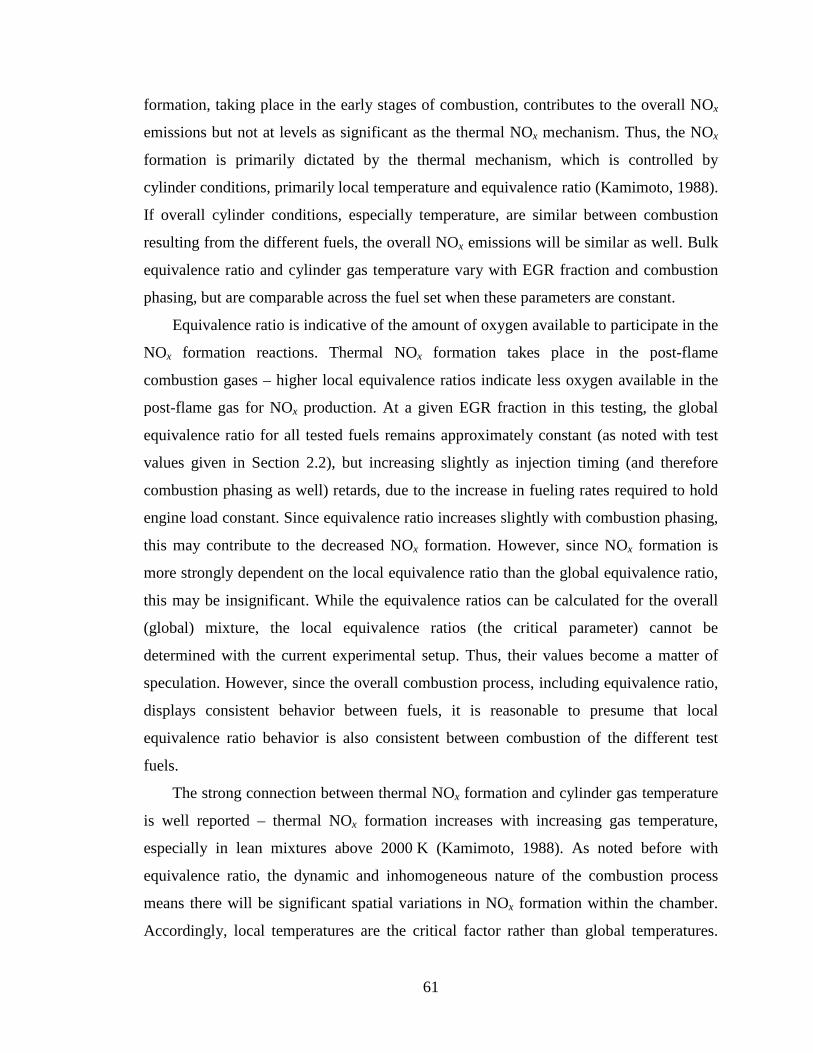
61
formation, taking place in the early stages of combustion, contributes to the overall NOx
emissions but not at levels as significant as the thermal NOx mechanism. Thus, the NOx
formation is primarily dictated by the thermal mechanism, which is controlled by
cylinder conditions, primarily local temperature and equivalence ratio (Kamimoto, 1988).
If overall cylinder conditions, especially temperature, are similar between combustion
resulting from the different fuels, the overall NOx emissions will be similar as well. Bulk
equivalence ratio and cylinder gas temperature vary with EGR fraction and combustion
phasing, but are comparable across the fuel set when these parameters are constant.
Equivalence ratio is indicative of the amount of oxygen available to participate in the
NOx formation reactions. Thermal NOx formation takes place in the post-flame
combustion gases – higher local equivalence ratios indicate less oxygen available in the
post-flame gas for NOx production. At a given EGR fraction in this testing, the global
equivalence ratio for all tested fuels remains approximately constant (as noted with test
values given in Section 2.2), but increasing slightly as injection timing (and therefore
combustion phasing as well) retards, due to the increase in fueling rates required to hold
engine load constant. Since equivalence ratio increases slightly with combustion phasing,
this may contribute to the decreased NOx formation. However, since NOx formation is
more strongly dependent on the local equivalence ratio than the global equivalence ratio,
this may be insignificant. While the equivalence ratios can be calculated for the overall
(global) mixture, the local equivalence ratios (the critical parameter) cannot be
determined with the current experimental setup. Thus, their values become a matter of
speculation. However, since the overall combustion process, including equivalence ratio,
displays consistent behavior between fuels, it is reasonable to presume that local
equivalence ratio behavior is also consistent between combustion of the different test
fuels.
The strong connection between thermal NOx formation and cylinder gas temperature
is well reported – thermal NOx formation increases with increasing gas temperature,
especially in lean mixtures above 2000 K (Kamimoto, 1988). As noted before with
equivalence ratio, the dynamic and inhomogeneous nature of the combustion process
means there will be significant spatial variations in NOx formation within the chamber.
Accordingly, local temperatures are the critical factor rather than global temperatures.
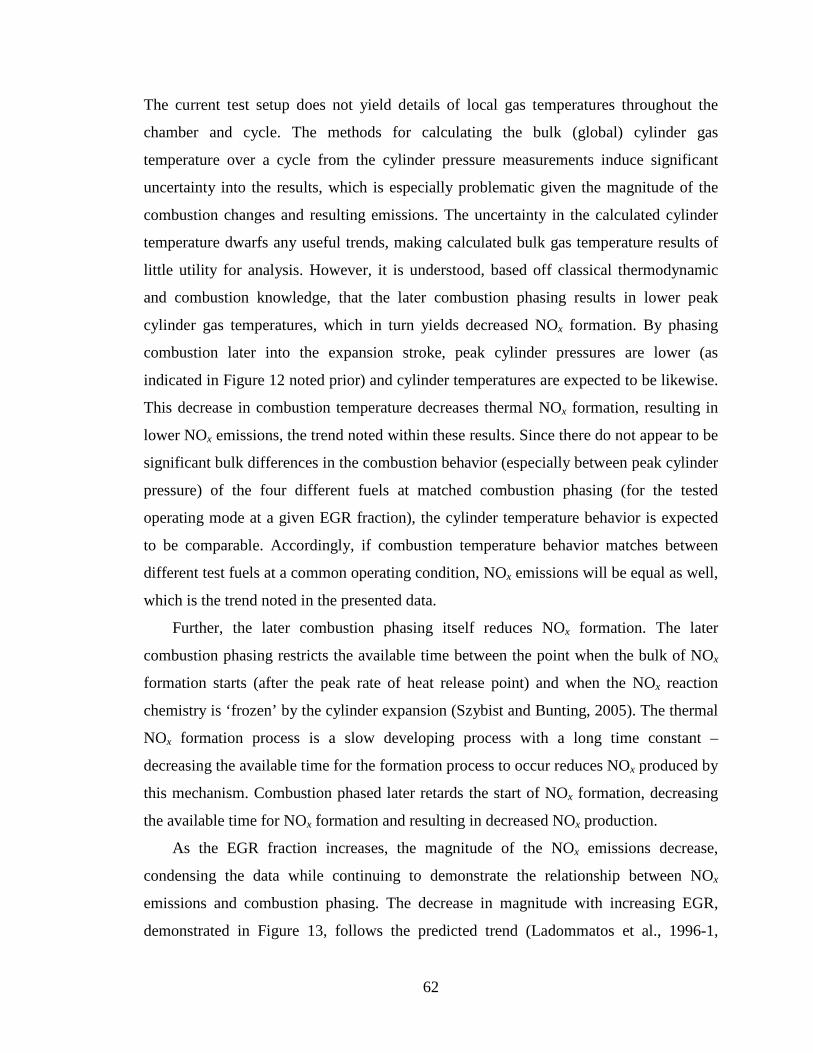
62
The current test setup does not yield details of local gas temperatures throughout the
chamber and cycle. The methods for calculating the bulk (global) cylinder gas
temperature over a cycle from the cylinder pressure measurements induce significant
uncertainty into the results, which is especially problematic given the magnitude of the
combustion changes and resulting emissions. The uncertainty in the calculated cylinder
temperature dwarfs any useful trends, making calculated bulk gas temperature results of
little utility for analysis. However, it is understood, based off classical thermodynamic
and combustion knowledge, that the later combustion phasing results in lower peak
cylinder gas temperatures, which in turn yields decreased NOx formation. By phasing
combustion later into the expansion stroke, peak cylinder pressures are lower (as
indicated in Figure 12 noted prior) and cylinder temperatures are expected to be likewise.
This decrease in combustion temperature decreases thermal NOx formation, resulting in
lower NOx emissions, the trend noted within these results. Since there do not appear to be
significant bulk differences in the combustion behavior (especially between peak cylinder
pressure) of the four different fuels at matched combustion phasing (for the tested
operating mode at a given EGR fraction), the cylinder temperature behavior is expected
to be comparable. Accordingly, if combustion temperature behavior matches between
different test fuels at a common operating condition, NOx emissions will be equal as well,
which is the trend noted in the presented data.
Further, the later combustion phasing itself reduces NOx formation. The later
combustion phasing restricts the available time between the point when the bulk of NOx
formation starts (after the peak rate of heat release point) and when the NOx reaction
chemistry is ‘frozen’ by the cylinder expansion (Szybist and Bunting, 2005). The thermal
NOx formation process is a slow developing process with a long time constant –
decreasing the available time for the formation process to occur reduces NOx produced by
this mechanism. Combustion phased later retards the start of NOx formation, decreasing
the available time for NOx formation and resulting in decreased NOx production.
As the EGR fraction increases, the magnitude of the NOx emissions decrease,
condensing the data while continuing to demonstrate the relationship between NOx
emissions and combustion phasing. The decrease in magnitude with increasing EGR,
demonstrated in Figure 13, follows the predicted trend (Ladommatos et al., 1996-1,
63
1996-2, 1997-1, 1997-2). Increased EGR fraction lowers the intake oxygen concentration
by diluting the intake charge (replacing oxygen with EGR species), thus increasing the
cylinder equivalence ratio, leading to decreased NOx emissions (Ladommatos et al.,
1996-1). Further, the water and CO2 components of the EGR mixture serve as thermal
sinks, absorbing energy and decreasing cylinder temperatures (Ladommatos et al.,
1996-2, 1997-1, 1997-2). Finally, the increased EGR fraction lowers the ratio of the
specific heat of the cylinder charge, resulting in lower compression temperatures which
subsequently decreased peak combustion temperatures (Jacobs, 2005). Again, no
significant fuel differences are noted.
Figure 13: NOx emissions versus combustion phasing with 45% EGR. Injection timing sweeps at 1000 bar injection pressure, varied fuels.
The other principal emission of concern for compression ignition engines,
particulates, is very insensitive to any of the tested parameters, with all smoke
measurements in the range of 0.10-0.15 FSN. The low combustion temperatures and
fairly well mixed conditions minimize the soot emissions – some soot is still formed
within localized regions, however, where the local temperature and equivalence ratio are
more favorable to soot formation (higher local temperature, richer mixture conditions).
The low measured smoke levels fall within the instrument uncertainty of the smokemeter
used for the measurements, making it impossible to ascertain any significant differences
between the test fuels at the given operating condition. This issue has been reported
before in previous studies (Risberg et al., 2005). However, smoke measurements only
account for the carbon soot emissions, and do not include any measure of the soluble
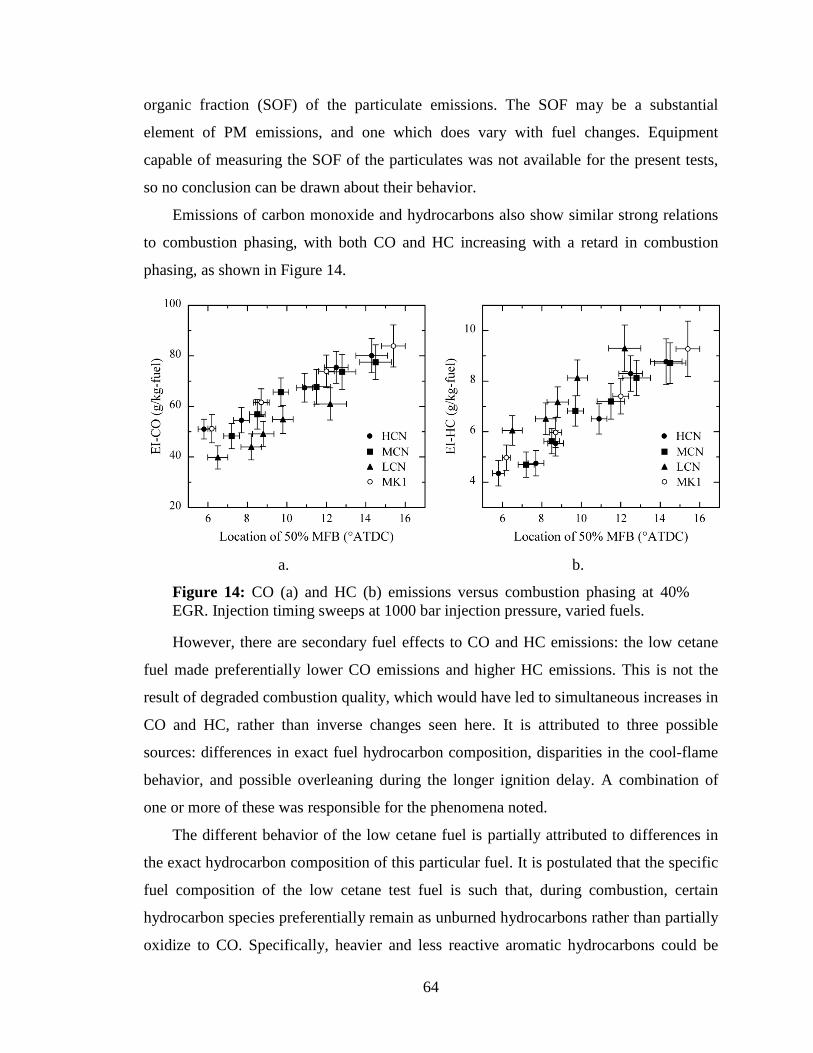
64
organic fraction (SOF) of the particulate emissions. The SOF may be a substantial
element of PM emissions, and one which does vary with fuel changes. Equipment
capable of measuring the SOF of the particulates was not available for the present tests,
so no conclusion can be drawn about their behavior.
Emissions of carbon monoxide and hydrocarbons also show similar strong relations
to combustion phasing, with both CO and HC increasing with a retard in combustion
phasing, as shown in Figure 14.
a. b.
Figure 14: CO (a) and HC (b) emissions versus combustion phasing at 40% EGR. Injection timing sweeps at 1000 bar injection pressure, varied fuels.
However, there are secondary fuel effects to CO and HC emissions: the low cetane
fuel made preferentially lower CO emissions and higher HC emissions. This is not the
result of degraded combustion quality, which would have led to simultaneous increases in
CO and HC, rather than inverse changes seen here. It is attributed to three possible
sources: differences in exact fuel hydrocarbon composition, disparities in the cool-flame
behavior, and possible overleaning during the longer ignition delay. A combination of
one or more of these was responsible for the phenomena noted.
The different behavior of the low cetane fuel is partially attributed to differences in
the exact hydrocarbon composition of this particular fuel. It is postulated that the specific
fuel composition of the low cetane test fuel is such that, during combustion, certain
hydrocarbon species preferentially remain as unburned hydrocarbons rather than partially
oxidize to CO. Specifically, heavier and less reactive aromatic hydrocarbons could be
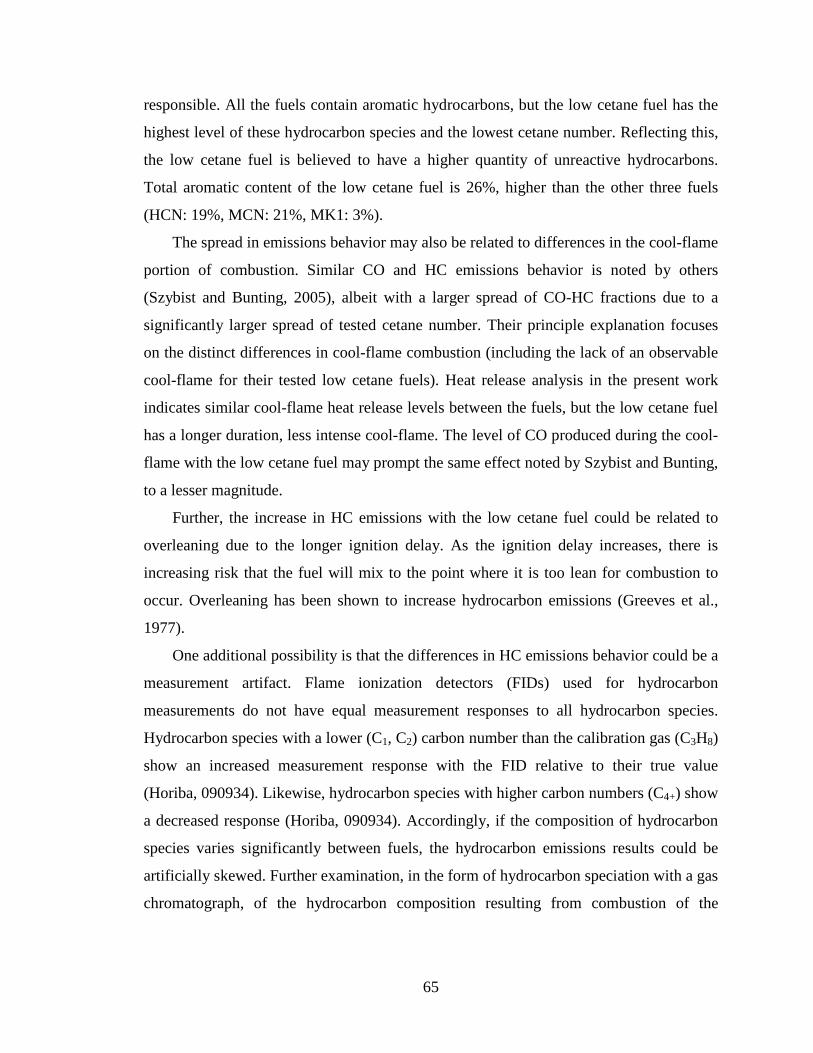
65
responsible. All the fuels contain aromatic hydrocarbons, but the low cetane fuel has the
highest level of these hydrocarbon species and the lowest cetane number. Reflecting this,
the low cetane fuel is believed to have a higher quantity of unreactive hydrocarbons.
Total aromatic content of the low cetane fuel is 26%, higher than the other three fuels
(HCN: 19%, MCN: 21%, MK1: 3%).
The spread in emissions behavior may also be related to differences in the cool-flame
portion of combustion. Similar CO and HC emissions behavior is noted by others
(Szybist and Bunting, 2005), albeit with a larger spread of CO-HC fractions due to a
significantly larger spread of tested cetane number. Their principle explanation focuses
on the distinct differences in cool-flame combustion (including the lack of an observable
cool-flame for their tested low cetane fuels). Heat release analysis in the present work
indicates similar cool-flame heat release levels between the fuels, but the low cetane fuel
has a longer duration, less intense cool-flame. The level of CO produced during the cool-
flame with the low cetane fuel may prompt the same effect noted by Szybist and Bunting,
to a lesser magnitude.
Further, the increase in HC emissions with the low cetane fuel could be related to
overleaning due to the longer ignition delay. As the ignition delay increases, there is
increasing risk that the fuel will mix to the point where it is too lean for combustion to
occur. Overleaning has been shown to increase hydrocarbon emissions (Greeves et al.,
1977).
One additional possibility is that the differences in HC emissions behavior could be a
measurement artifact. Flame ionization detectors (FIDs) used for hydrocarbon
measurements do not have equal measurement responses to all hydrocarbon species.
Hydrocarbon species with a lower (C1, C2) carbon number than the calibration gas (C3H8)
show an increased measurement response with the FID relative to their true value
(Horiba, 090934). Likewise, hydrocarbon species with higher carbon numbers (C4+) show
a decreased response (Horiba, 090934). Accordingly, if the composition of hydrocarbon
species varies significantly between fuels, the hydrocarbon emissions results could be
artificially skewed. Further examination, in the form of hydrocarbon speciation with a gas
chromatograph, of the hydrocarbon composition resulting from combustion of the
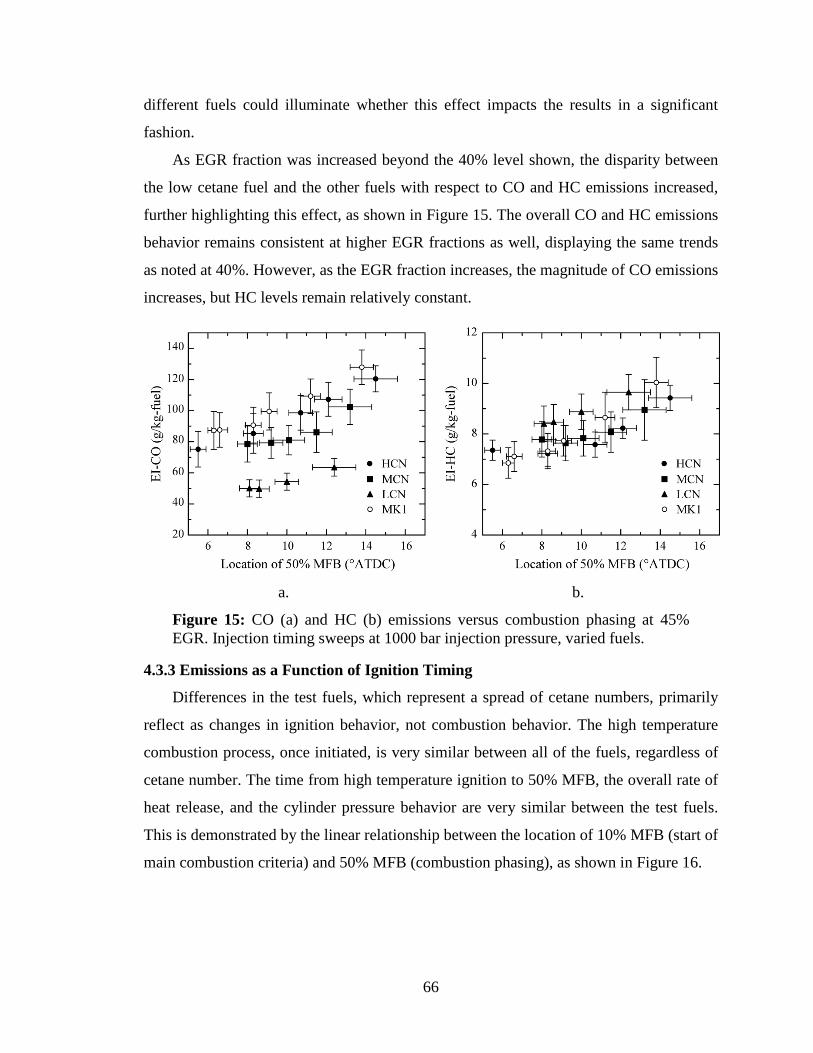
66
different fuels could illuminate whether this effect impacts the results in a significant
fashion.
As EGR fraction was increased beyond the 40% level shown, the disparity between
the low cetane fuel and the other fuels with respect to CO and HC emissions increased,
further highlighting this effect, as shown in Figure 15. The overall CO and HC emissions
behavior remains consistent at higher EGR fractions as well, displaying the same trends
as noted at 40%. However, as the EGR fraction increases, the magnitude of CO emissions
increases, but HC levels remain relatively constant.
a. b.
Figure 15: CO (a) and HC (b) emissions versus combustion phasing at 45% EGR. Injection timing sweeps at 1000 bar injection pressure, varied fuels.
4.3.3 Emissions as a Function of Ignition Timing
Differences in the test fuels, which represent a spread of cetane numbers, primarily
reflect as changes in ignition behavior, not combustion behavior. The high temperature
combustion process, once initiated, is very similar between all of the fuels, regardless of
cetane number. The time from high temperature ignition to 50% MFB, the overall rate of
heat release, and the cylinder pressure behavior are very similar between the test fuels.
This is demonstrated by the linear relationship between the location of 10% MFB (start of
main combustion criteria) and 50% MFB (combustion phasing), as shown in Figure 16.
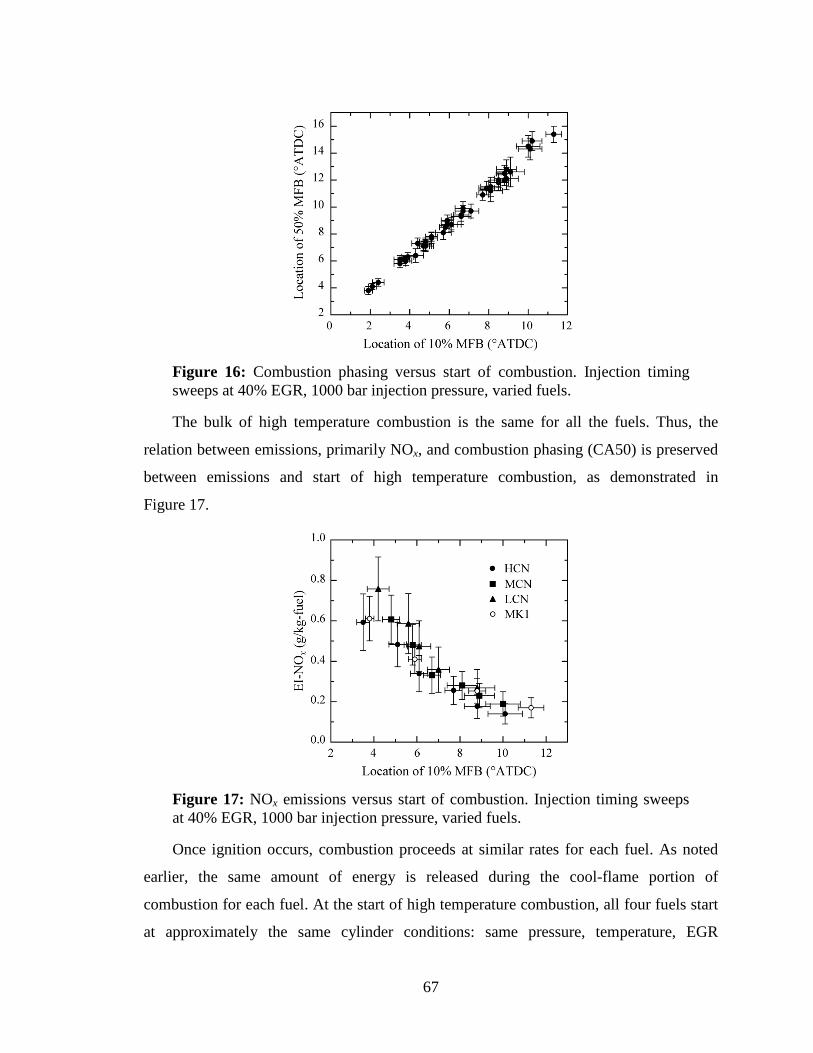
67
Figure 16: Combustion phasing versus start of combustion. Injection timing sweeps at 40% EGR, 1000 bar injection pressure, varied fuels.
The bulk of high temperature combustion is the same for all the fuels. Thus, the
relation between emissions, primarily NOx, and combustion phasing (CA50) is preserved
between emissions and start of high temperature combustion, as demonstrated in
Figure 17.
Figure 17: NOx emissions versus start of combustion. Injection timing sweeps at 40% EGR, 1000 bar injection pressure, varied fuels.
Once ignition occurs, combustion proceeds at similar rates for each fuel. As noted
earlier, the same amount of energy is released during the cool-flame portion of
combustion for each fuel. At the start of high temperature combustion, all four fuels start
at approximately the same cylinder conditions: same pressure, temperature, EGR
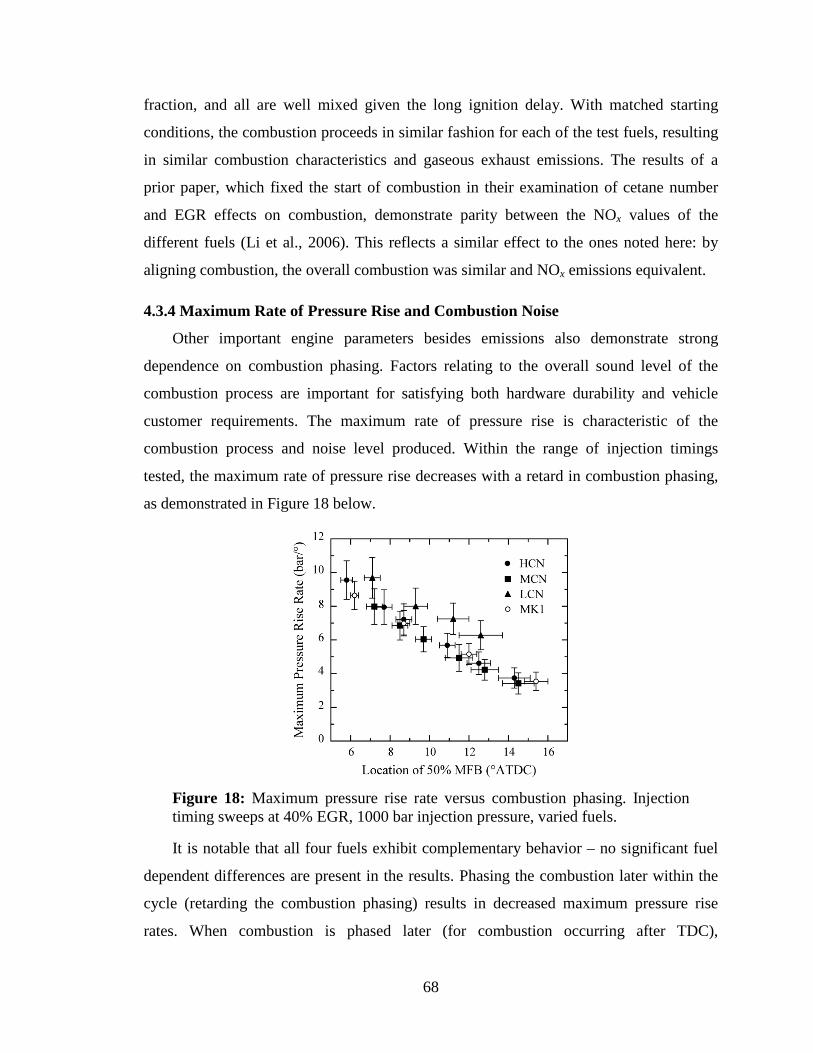
68
fraction, and all are well mixed given the long ignition delay. With matched starting
conditions, the combustion proceeds in similar fashion for each of the test fuels, resulting
in similar combustion characteristics and gaseous exhaust emissions. The results of a
prior paper, which fixed the start of combustion in their examination of cetane number
and EGR effects on combustion, demonstrate parity between the NOx values of the
different fuels (Li et al., 2006). This reflects a similar effect to the ones noted here: by
aligning combustion, the overall combustion was similar and NOx emissions equivalent.
4.3.4 Maximum Rate of Pressure Rise and Combustion Noise
Other important engine parameters besides emissions also demonstrate strong
dependence on combustion phasing. Factors relating to the overall sound level of the
combustion process are important for satisfying both hardware durability and vehicle
customer requirements. The maximum rate of pressure rise is characteristic of the
combustion process and noise level produced. Within the range of injection timings
tested, the maximum rate of pressure rise decreases with a retard in combustion phasing,
as demonstrated in Figure 18 below.
Figure 18: Maximum pressure rise rate versus combustion phasing. Injection timing sweeps at 40% EGR, 1000 bar injection pressure, varied fuels.
It is notable that all four fuels exhibit complementary behavior – no significant fuel
dependent differences are present in the results. Phasing the combustion later within the
cycle (retarding the combustion phasing) results in decreased maximum pressure rise
rates. When combustion is phased later (for combustion occurring after TDC),
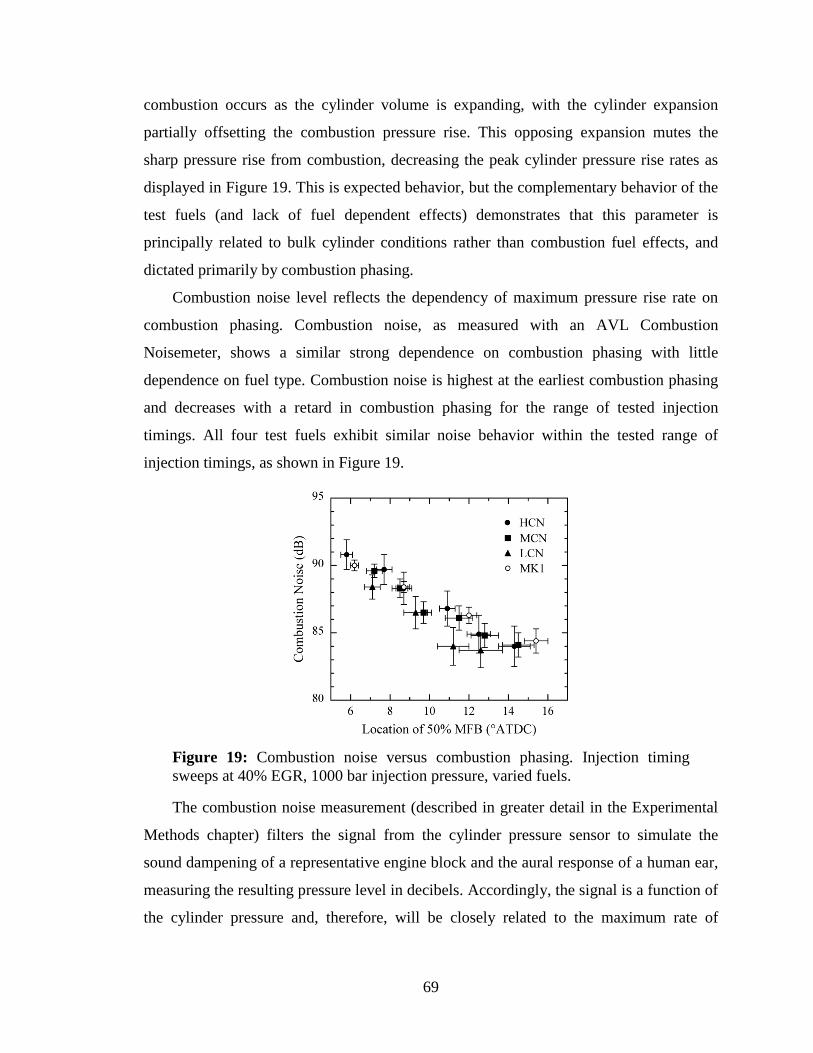
69
combustion occurs as the cylinder volume is expanding, with the cylinder expansion
partially offsetting the combustion pressure rise. This opposing expansion mutes the
sharp pressure rise from combustion, decreasing the peak cylinder pressure rise rates as
displayed in Figure 19. This is expected behavior, but the complementary behavior of the
test fuels (and lack of fuel dependent effects) demonstrates that this parameter is
principally related to bulk cylinder conditions rather than combustion fuel effects, and
dictated primarily by combustion phasing.
Combustion noise level reflects the dependency of maximum pressure rise rate on
combustion phasing. Combustion noise, as measured with an AVL Combustion
Noisemeter, shows a similar strong dependence on combustion phasing with little
dependence on fuel type. Combustion noise is highest at the earliest combustion phasing
and decreases with a retard in combustion phasing for the range of tested injection
timings. All four test fuels exhibit similar noise behavior within the tested range of
injection timings, as shown in Figure 19.
Figure 19: Combustion noise versus combustion phasing. Injection timing sweeps at 40% EGR, 1000 bar injection pressure, varied fuels.
The combustion noise measurement (described in greater detail in the Experimental
Methods chapter) filters the signal from the cylinder pressure sensor to simulate the
sound dampening of a representative engine block and the aural response of a human ear,
measuring the resulting pressure level in decibels. Accordingly, the signal is a function of
the cylinder pressure and, therefore, will be closely related to the maximum rate of
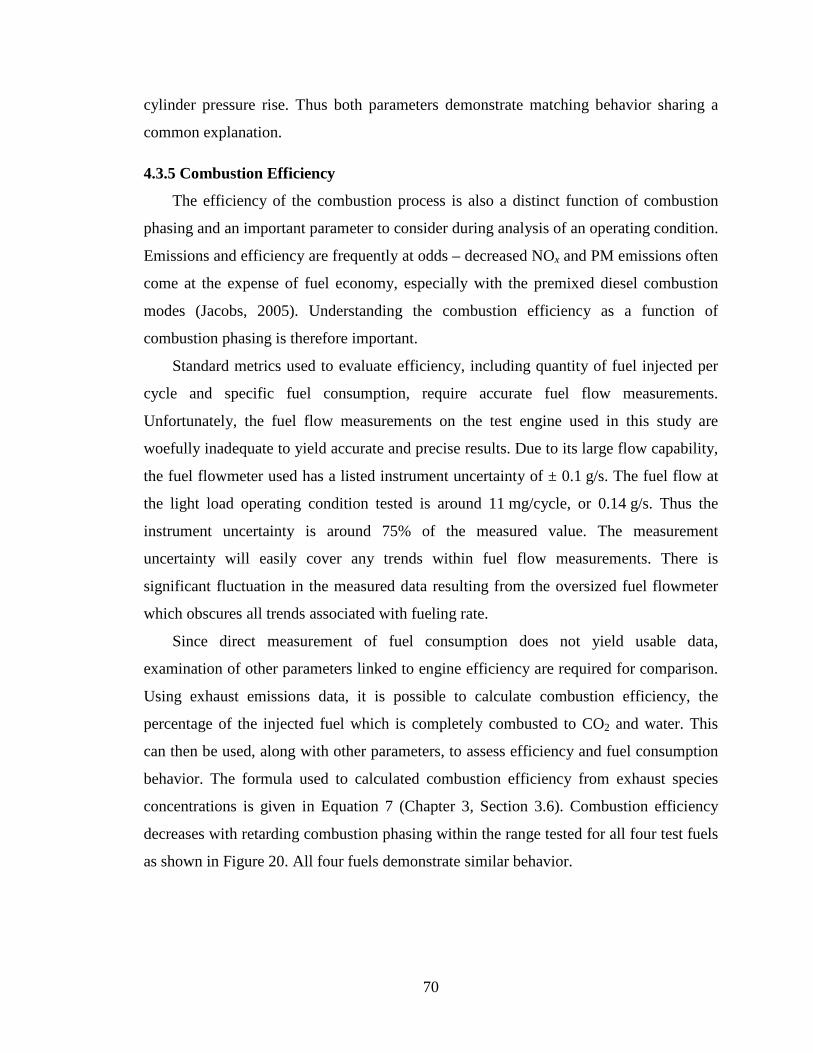
70
cylinder pressure rise. Thus both parameters demonstrate matching behavior sharing a
common explanation.
4.3.5 Combustion Efficiency
The efficiency of the combustion process is also a distinct function of combustion
phasing and an important parameter to consider during analysis of an operating condition.
Emissions and efficiency are frequently at odds – decreased NOx and PM emissions often
come at the expense of fuel economy, especially with the premixed diesel combustion
modes (Jacobs, 2005). Understanding the combustion efficiency as a function of
combustion phasing is therefore important.
Standard metrics used to evaluate efficiency, including quantity of fuel injected per
cycle and specific fuel consumption, require accurate fuel flow measurements.
Unfortunately, the fuel flow measurements on the test engine used in this study are
woefully inadequate to yield accurate and precise results. Due to its large flow capability,
the fuel flowmeter used has a listed instrument uncertainty of ± 0.1 g/s. The fuel flow at
the light load operating condition tested is around 11 mg/cycle, or 0.14 g/s. Thus the
instrument uncertainty is around 75% of the measured value. The measurement
uncertainty will easily cover any trends within fuel flow measurements. There is
significant fluctuation in the measured data resulting from the oversized fuel flowmeter
which obscures all trends associated with fueling rate.
Since direct measurement of fuel consumption does not yield usable data,
examination of other parameters linked to engine efficiency are required for comparison.
Using exhaust emissions data, it is possible to calculate combustion efficiency, the
percentage of the injected fuel which is completely combusted to CO2 and water. This
can then be used, along with other parameters, to assess efficiency and fuel consumption
behavior. The formula used to calculated combustion efficiency from exhaust species
concentrations is given in Equation 7 (Chapter 3, Section 3.6). Combustion efficiency
decreases with retarding combustion phasing within the range tested for all four test fuels
as shown in Figure 20. All four fuels demonstrate similar behavior.
71
Figure 20: Combustion efficiency versus combustion phasing. Injection timing sweeps at 40% EGR, 1000 bar injection pressure, varied fuels.
As shown, similar levels of combustion phasing occur for all four test fuels, and all
are decreasing over the range of combustion phasing tested. This trend is complemented
by the CO and HC emissions trends, both of which increase with a retard in combustion
phasing. Both CO and HC are products of incomplete combustion: increases in them
imply fuel is not being fully combusted. If combustion efficiency is decreasing with a
retard in combustion phasing, it is likely that overall efficiency could be following a
similar trend. Further support comes from an examination of the fuel injection duration.
As combustion phasing is retarded for a given fuel in these tests, the fueling rate
increases to maintain the fixed IMEP load condition. If fueling was not adjusted, the most
retarded injection timing conditions would have a 2% (0.1 bar) lower IMEP than the most
advanced timings.
To further illustrate this, fuel injection durations are normalized as a function of each
fuel’s injection duration at the combustion phasing yielding 90 dB combustion noise. The
combustion phasing yielding 90 dB combustion noise is a standard condition used in
these tests and is the most advanced combustion phasing common between fuels. Each
fuel is normalized against its own injection duration at the 90 dB point to account for the
differences in fuel energy content and density that exist between test fuels. Figure 21
demonstrates the change in relative injection timing as a function of combustion phasing.
Y-axis error bars are not displayed as the injection durations plotted are commanded
(absolute, discrete) values, and the overall trend is more important than the exact value.
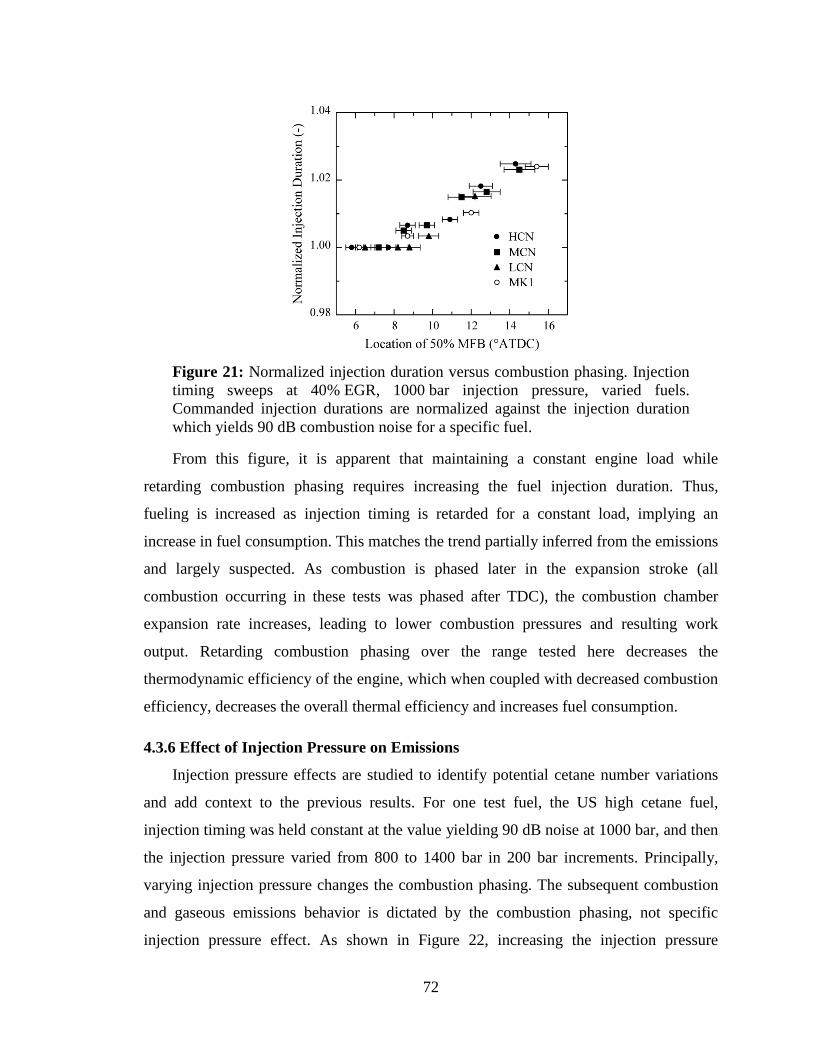
72
Figure 21: Normalized injection duration versus combustion phasing. Injection timing sweeps at 40% EGR, 1000 bar injection pressure, varied fuels. Commanded injection durations are normalized against the injection duration which yields 90 dB combustion noise for a specific fuel.
From this figure, it is apparent that maintaining a constant engine load while
retarding combustion phasing requires increasing the fuel injection duration. Thus,
fueling is increased as injection timing is retarded for a constant load, implying an
increase in fuel consumption. This matches the trend partially inferred from the emissions
and largely suspected. As combustion is phased later in the expansion stroke (all
combustion occurring in these tests was phased after TDC), the combustion chamber
expansion rate increases, leading to lower combustion pressures and resulting work
output. Retarding combustion phasing over the range tested here decreases the
thermodynamic efficiency of the engine, which when coupled with decreased combustion
efficiency, decreases the overall thermal efficiency and increases fuel consumption.
4.3.6 Effect of Injection Pressure on Emissions
Injection pressure effects are studied to identify potential cetane number variations
and add context to the previous results. For one test fuel, the US high cetane fuel,
injection timing was held constant at the value yielding 90 dB noise at 1000 bar, and then
the injection pressure varied from 800 to 1400 bar in 200 bar increments. Principally,
varying injection pressure changes the combustion phasing. The subsequent combustion
and gaseous emissions behavior is dictated by the combustion phasing, not specific
injection pressure effect. As shown in Figure 22, increasing the injection pressure
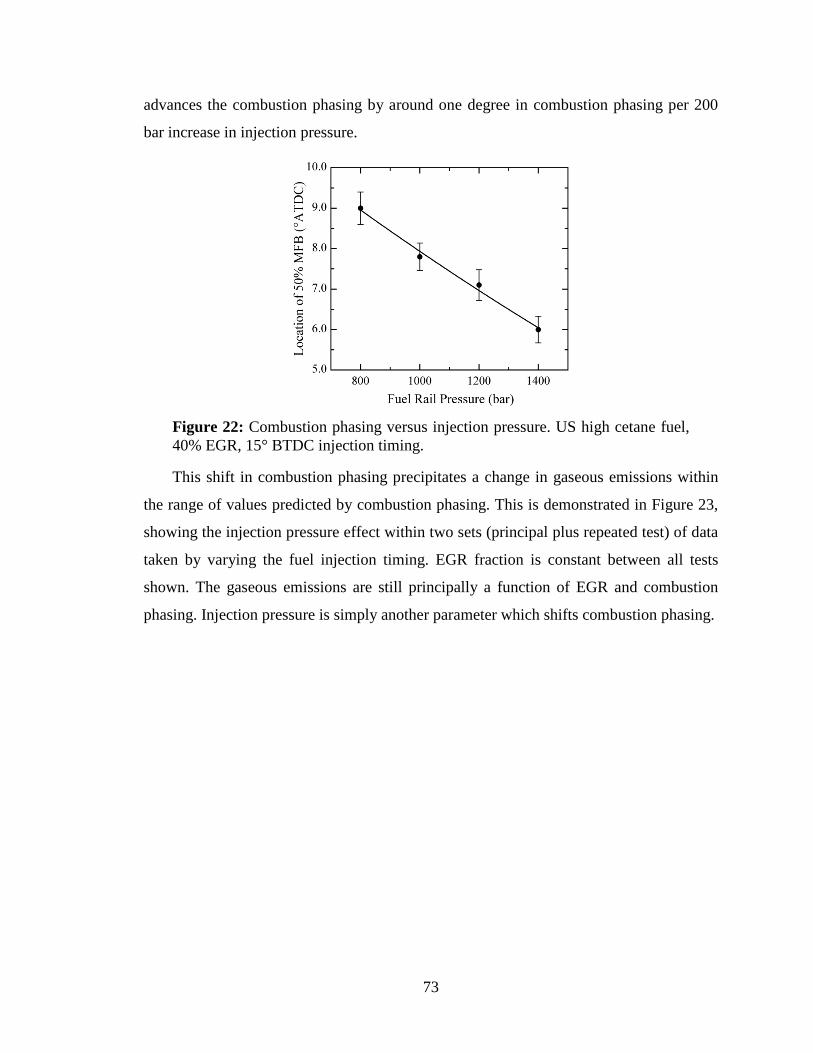
73
advances the combustion phasing by around one degree in combustion phasing per 200
bar increase in injection pressure.
Figure 22: Combustion phasing versus injection pressure. US high cetane fuel, 40% EGR, 15° BTDC injection timing.
This shift in combustion phasing precipitates a change in gaseous emissions within
the range of values predicted by combustion phasing. This is demonstrated in Figure 23,
showing the injection pressure effect within two sets (principal plus repeated test) of data
taken by varying the fuel injection timing. EGR fraction is constant between all tests
shown. The gaseous emissions are still principally a function of EGR and combustion
phasing. Injection pressure is simply another parameter which shifts combustion phasing.
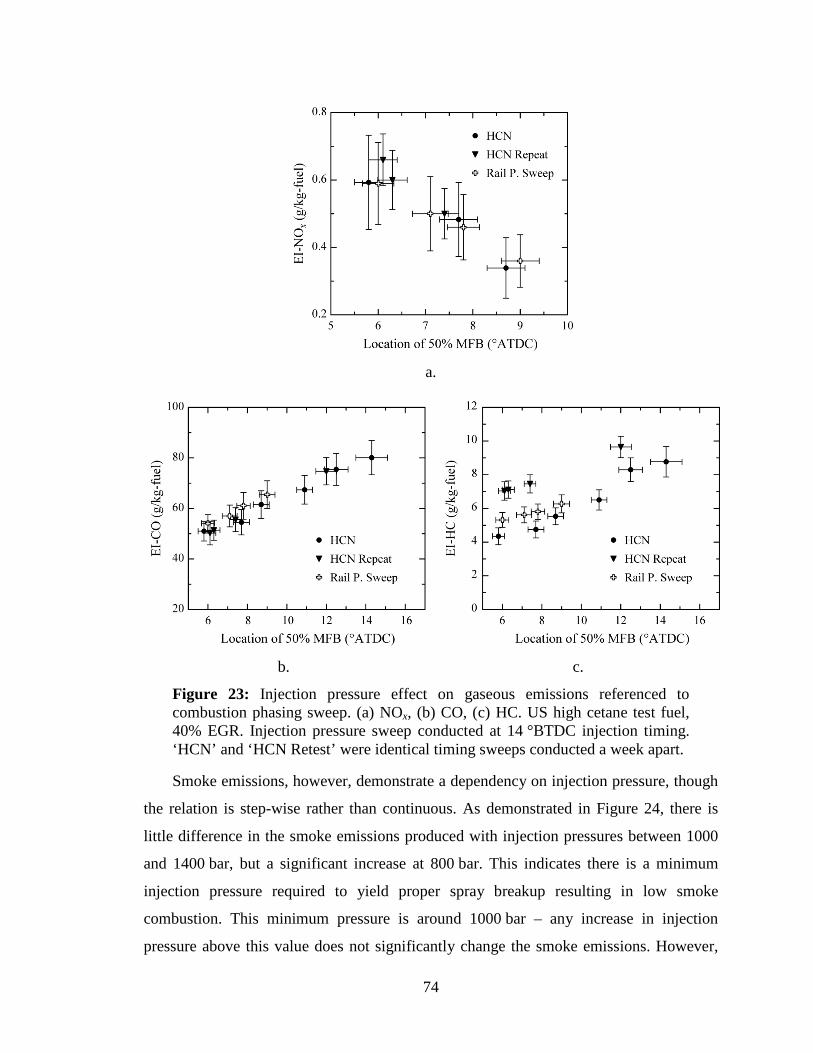
74
a.
b. c.
Figure 23: Injection pressure effect on gaseous emissions referenced to combustion phasing sweep. (a) NOx, (b) CO, (c) HC. US high cetane test fuel, 40% EGR. Injection pressure sweep conducted at 14 °BTDC injection timing. ‘HCN’ and ‘HCN Retest’ were identical timing sweeps conducted a week apart.
Smoke emissions, however, demonstrate a dependency on injection pressure, though
the relation is step-wise rather than continuous. As demonstrated in Figure 24, there is
little difference in the smoke emissions produced with injection pressures between 1000
and 1400 bar, but a significant increase at 800 bar. This indicates there is a minimum
injection pressure required to yield proper spray breakup resulting in low smoke
combustion. This minimum pressure is around 1000 bar – any increase in injection
pressure above this value does not significantly change the smoke emissions. However,
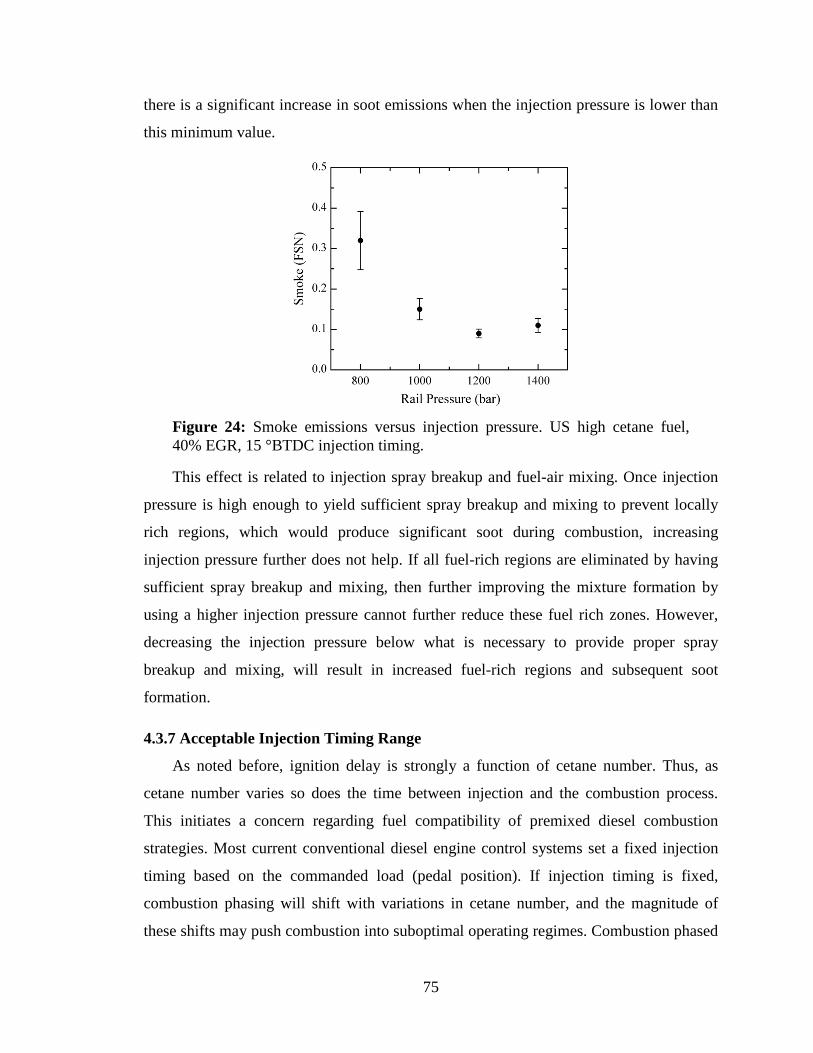
75
there is a significant increase in soot emissions when the injection pressure is lower than
this minimum value.
Figure 24: Smoke emissions versus injection pressure. US high cetane fuel, 40% EGR, 15 °BTDC injection timing.
This effect is related to injection spray breakup and fuel-air mixing. Once injection
pressure is high enough to yield sufficient spray breakup and mixing to prevent locally
rich regions, which would produce significant soot during combustion, increasing
injection pressure further does not help. If all fuel-rich regions are eliminated by having
sufficient spray breakup and mixing, then further improving the mixture formation by
using a higher injection pressure cannot further reduce these fuel rich zones. However,
decreasing the injection pressure below what is necessary to provide proper spray
breakup and mixing, will result in increased fuel-rich regions and subsequent soot
formation.
4.3.7 Acceptable Injection Timing Range
As noted before, ignition delay is strongly a function of cetane number. Thus, as
cetane number varies so does the time between injection and the combustion process.
This initiates a concern regarding fuel compatibility of premixed diesel combustion
strategies. Most current conventional diesel engine control systems set a fixed injection
timing based on the commanded load (pedal position). If injection timing is fixed,
combustion phasing will shift with variations in cetane number, and the magnitude of
these shifts may push combustion into suboptimal operating regimes. Combustion phased
76
earlier than desired leads to excessive and unacceptable combustion noise and NOx
emissions. Combustion phased too late in the cycle results in excessive CO and HC
emissions or, if late enough, instability and misfire. To address these concerns, this
portion of the work examines the range of injection timing which yields acceptable
combustion, as determined by a series of criteria reflecting operability concerns, an
expansive and highly inclusive set of operating limits. Injection timings falling within
these limits will achieve stable combustion with acceptable combustion noise levels.
Requiring combustion noise levels to not exceed limits, set to insure acceptable NVH
conditions in a vehicle, limits the injection timing advance. A common rule is to maintain
combustion noise less than 90 dB. If held at these levels, vehicle noiseproofing
adequately mitigates engine sound so it is unobtrusive in the vehicle cabin. Reflecting
this production implementation guideline, the advance limit is set by requiring
combustion noise, as measured with an AVL 450S Combustion Noisemeter, remain less
than 90 dB.
The retard limit is defined to reflect misfire and basic operability limits. This defines
the retard limit as the point where a further retard in injection timing results in a non-
recoverable loss in power. As injection timing is retarded, there is a point where it is no
longer possible to maintain the specified load condition of 5 bar IMEP. Increasing fueling
at this point does not recover load but rather creates higher exhaust CO and HC
emissions. Injection timing limit is one degree advanced from the condition where this
occurs. Retarding the timing one degree further (two degrees retarded from the listed
limit) results in additional power loss and frequent misfires. Another degree further
retarded (three degrees retarded from the stated limit) results in complete misfire – no
combustion in any cycles.
The operating window existing between the advance and retard limits discussed
above is shown in Figure 25 for each of the test fuels at 40%, 43%, and 45% EGR mass
fractions and 1000 bar injection pressure.
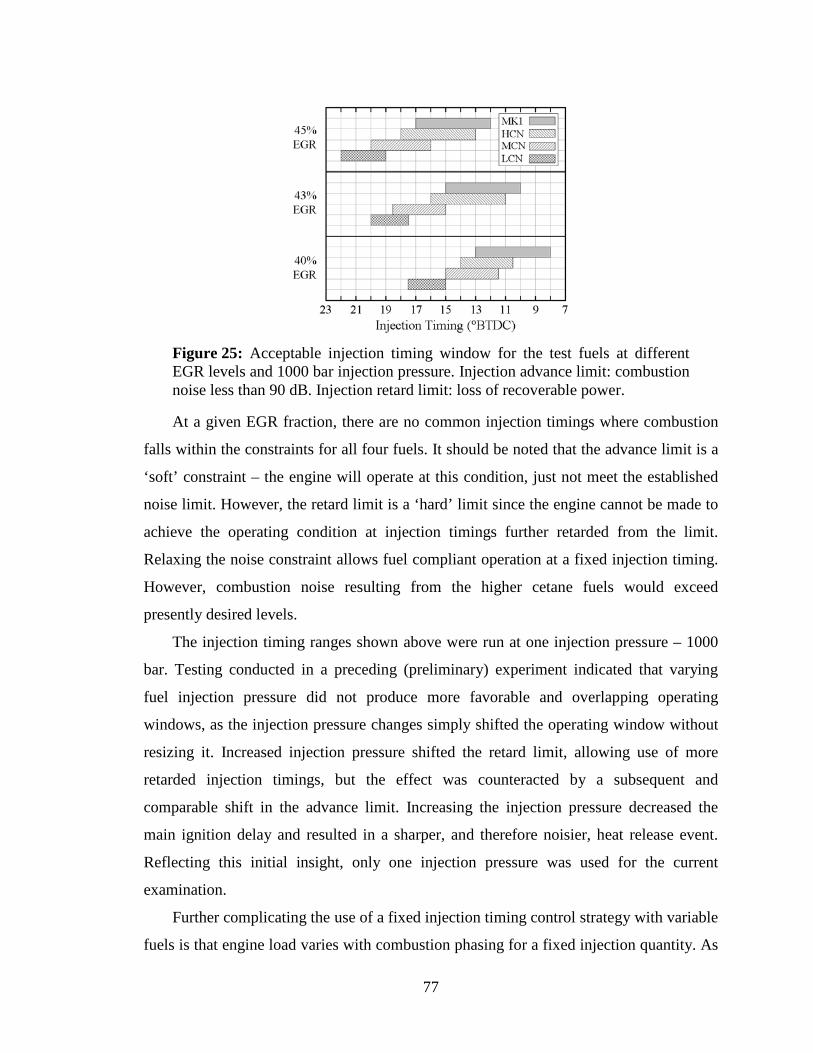
77
Figure 25: Acceptable injection timing window for the test fuels at different EGR levels and 1000 bar injection pressure. Injection advance limit: combustion noise less than 90 dB. Injection retard limit: loss of recoverable power.
At a given EGR fraction, there are no common injection timings where combustion
falls within the constraints for all four fuels. It should be noted that the advance limit is a
‘soft’ constraint – the engine will operate at this condition, just not meet the established
noise limit. However, the retard limit is a ‘hard’ limit since the engine cannot be made to
achieve the operating condition at injection timings further retarded from the limit.
Relaxing the noise constraint allows fuel compliant operation at a fixed injection timing.
However, combustion noise resulting from the higher cetane fuels would exceed
presently desired levels.
The injection timing ranges shown above were run at one injection pressure – 1000
bar. Testing conducted in a preceding (preliminary) experiment indicated that varying
fuel injection pressure did not produce more favorable and overlapping operating
windows, as the injection pressure changes simply shifted the operating window without
resizing it. Increased injection pressure shifted the retard limit, allowing use of more
retarded injection timings, but the effect was counteracted by a subsequent and
comparable shift in the advance limit. Increasing the injection pressure decreased the
main ignition delay and resulted in a sharper, and therefore noisier, heat release event.
Reflecting this initial insight, only one injection pressure was used for the current
examination.
Further complicating the use of a fixed injection timing control strategy with variable
fuels is that engine load varies with combustion phasing for a fixed injection quantity. As
78
noted before in Section 3.5, when injection timing (and therefore phasing) is retarded for
a given fuel in these tests, the fueling rate must be increased to maintain the fixed IMEP
load condition. The increase is relative to combustion phasing, and the relative position
within the operating window. Hence, to maintain load at a given injection timing, the low
cetane fuel requires a longer injection duration than high cetane fuel because the resulting
combustion is phased later in the operating window. When fueling is not adjusted, the
most retarded injection timing conditions have a 2% (0.1 bar) lower IMEP than the most
advance timings. This further exacerbates the difficulty of finding a fuel compliant
injection condition. The injection timing range which allows fueling to remain constant
while maintaining load is very narrow (at most three crankangle degrees, but usually less
and often nonexistent), and not close to overlapping between different cetane number
fuels.
Remapping the operating window in terms of combustion phasing (location of 50%
mass burned fraction, CA50), rather than injection timing, results in identical operating
windows for all four test fuels. At all EGR fractions, and with all injection pressures, the
advance limit (90 dB) occurs at a CA50 of 7 ± 1 °ATDC, while the retard limit (loss of
recoverable power) is at 15 ± 1 °ATDC, independent of fuel cetane number. Cumulative
data illustrating these limits is shown in Figure 26. The 90 dB noise limit is marked, and
the misfire/operability limit is denoted by the lack of data with a CA50 later than
15 °ATDC.
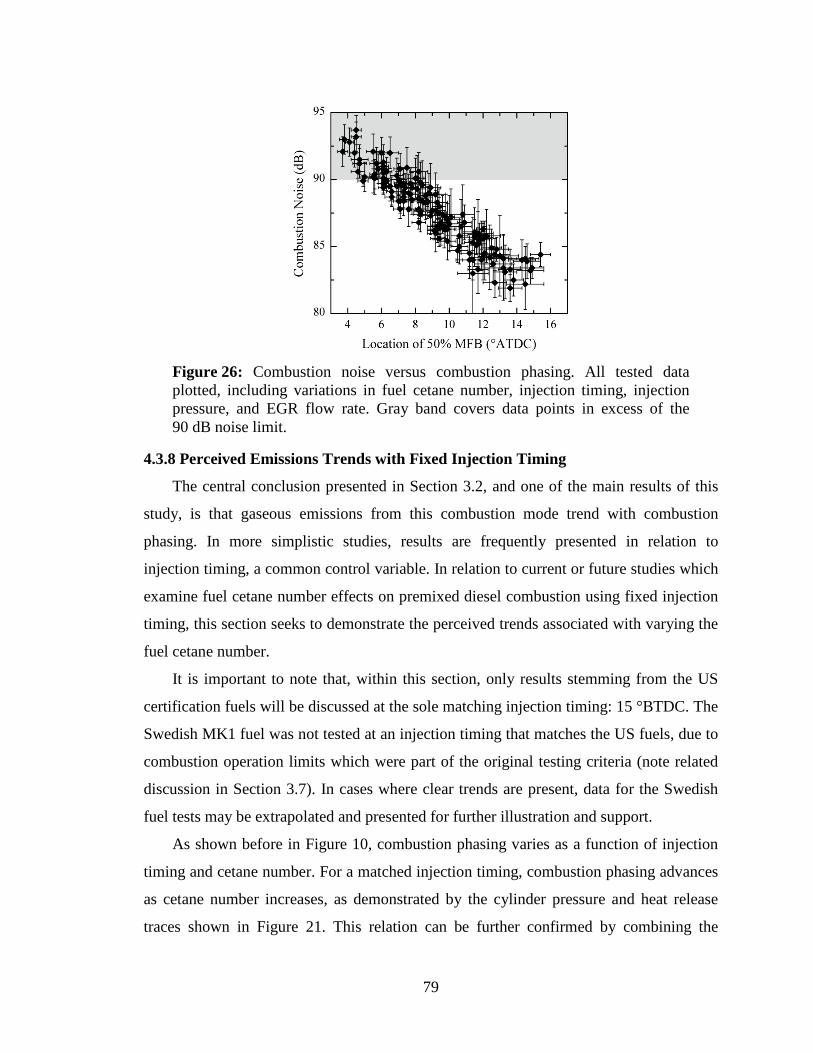
79
Figure 26: Combustion noise versus combustion phasing. All tested data plotted, including variations in fuel cetane number, injection timing, injection pressure, and EGR flow rate. Gray band covers data points in excess of the 90 dB noise limit.
4.3.8 Perceived Emissions Trends with Fixed Injection Timing
The central conclusion presented in Section 3.2, and one of the main results of this
study, is that gaseous emissions from this combustion mode trend with combustion
phasing. In more simplistic studies, results are frequently presented in relation to
injection timing, a common control variable. In relation to current or future studies which
examine fuel cetane number effects on premixed diesel combustion using fixed injection
timing, this section seeks to demonstrate the perceived trends associated with varying the
fuel cetane number.
It is important to note that, within this section, only results stemming from the US
certification fuels will be discussed at the sole matching injection timing: 15 °BTDC. The
Swedish MK1 fuel was not tested at an injection timing that matches the US fuels, due to
combustion operation limits which were part of the original testing criteria (note related
discussion in Section 3.7). In cases where clear trends are present, data for the Swedish
fuel tests may be extrapolated and presented for further illustration and support.
As shown before in Figure 10, combustion phasing varies as a function of injection
timing and cetane number. For a matched injection timing, combustion phasing advances
as cetane number increases, as demonstrated by the cylinder pressure and heat release
traces shown in Figure 21. This relation can be further confirmed by combining the
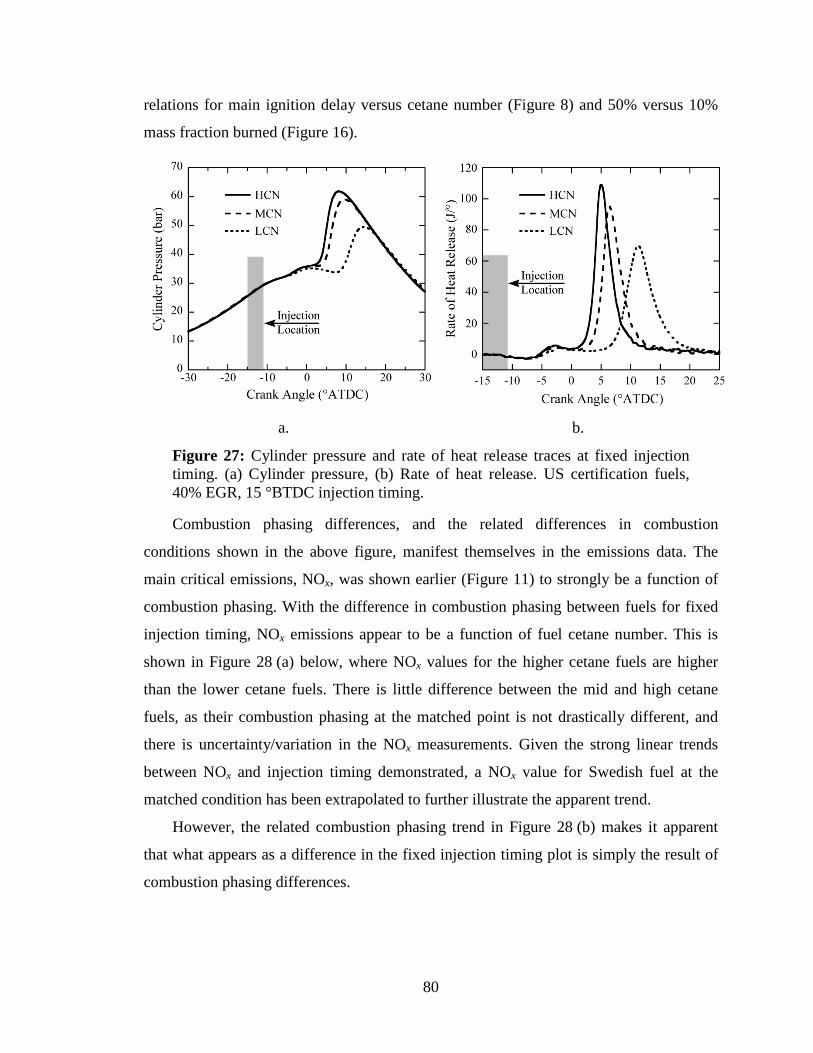
80
relations for main ignition delay versus cetane number (Figure 8) and 50% versus 10%
mass fraction burned (Figure 16).
a. b.
Figure 27: Cylinder pressure and rate of heat release traces at fixed injection timing. (a) Cylinder pressure, (b) Rate of heat release. US certification fuels, 40% EGR, 15 °BTDC injection timing.
Combustion phasing differences, and the related differences in combustion
conditions shown in the above figure, manifest themselves in the emissions data. The
main critical emissions, NOx, was shown earlier (Figure 11) to strongly be a function of
combustion phasing. With the difference in combustion phasing between fuels for fixed
injection timing, NOx emissions appear to be a function of fuel cetane number. This is
shown in Figure 28 (a) below, where NOx values for the higher cetane fuels are higher
than the lower cetane fuels. There is little difference between the mid and high cetane
fuels, as their combustion phasing at the matched point is not drastically different, and
there is uncertainty/variation in the NOx measurements. Given the strong linear trends
between NOx and injection timing demonstrated, a NOx value for Swedish fuel at the
matched condition has been extrapolated to further illustrate the apparent trend.
However, the related combustion phasing trend in Figure 28 (b) makes it apparent
that what appears as a difference in the fixed injection timing plot is simply the result of
combustion phasing differences.
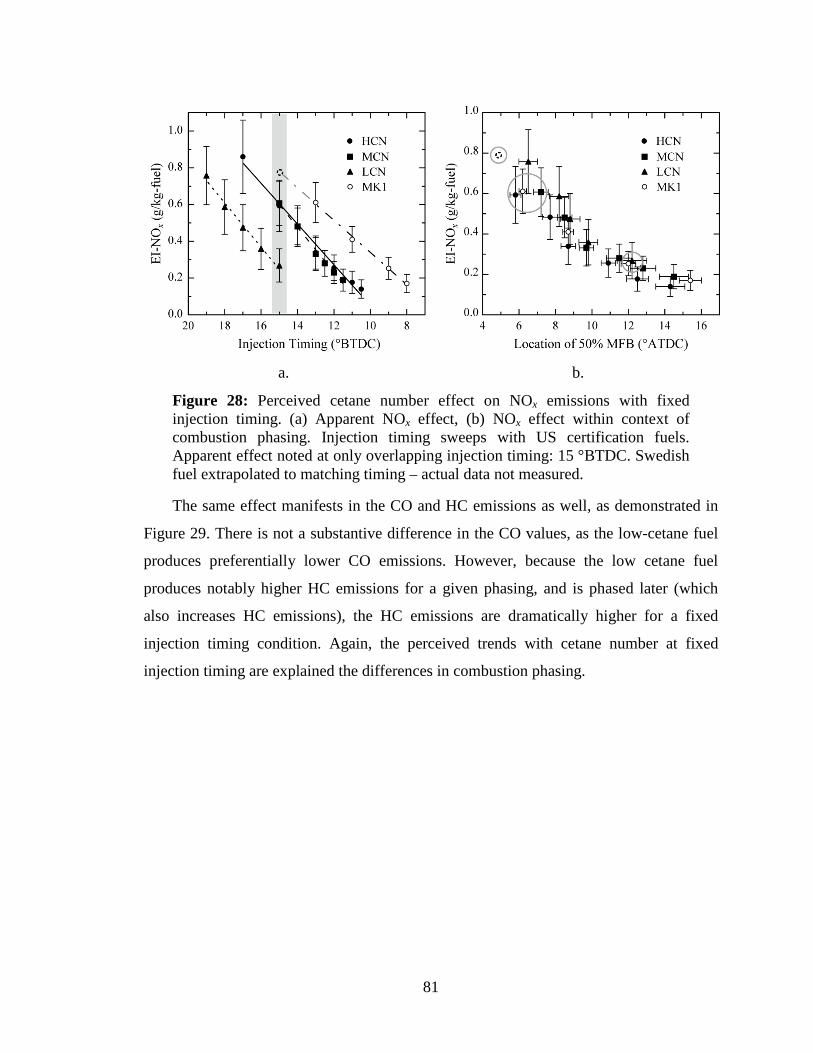
81
a. b.
Figure 28: Perceived cetane number effect on NOx emissions with fixed injection timing. (a) Apparent NOx effect, (b) NOx effect within context of combustion phasing. Injection timing sweeps with US certification fuels. Apparent effect noted at only overlapping injection timing: 15 °BTDC. Swedish fuel extrapolated to matching timing – actual data not measured.
The same effect manifests in the CO and HC emissions as well, as demonstrated in
Figure 29. There is not a substantive difference in the CO values, as the low-cetane fuel
produces preferentially lower CO emissions. However, because the low cetane fuel
produces notably higher HC emissions for a given phasing, and is phased later (which
also increases HC emissions), the HC emissions are dramatically higher for a fixed
injection timing condition. Again, the perceived trends with cetane number at fixed
injection timing are explained the differences in combustion phasing.
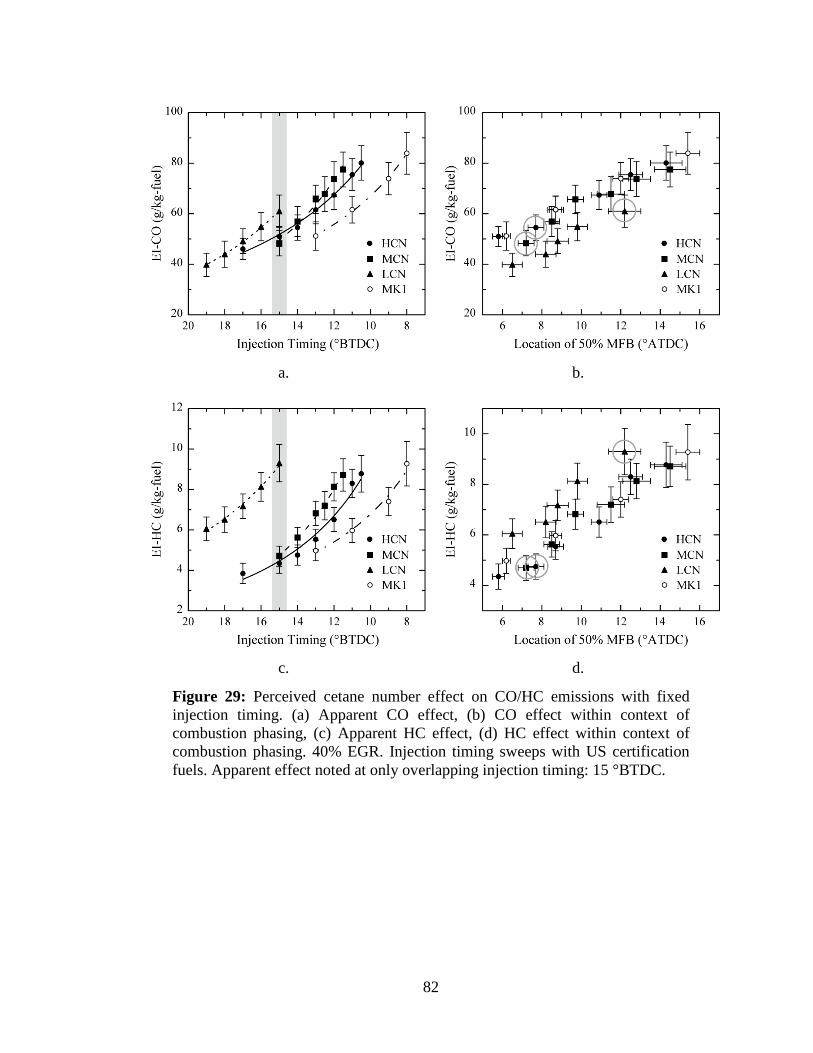
82
a. b.
c. d.
Figure 29: Perceived cetane number effect on CO/HC emissions with fixed injection timing. (a) Apparent CO effect, (b) CO effect within context of combustion phasing, (c) Apparent HC effect, (d) HC effect within context of combustion phasing. 40% EGR. Injection timing sweeps with US certification fuels. Apparent effect noted at only overlapping injection timing: 15 °BTDC.
83
4.4 Summary and Conclusions
Fuel cetane number strongly affects the ignition delay and combustion phasing of
this single-injection premixed diesel combustion mode. Increasing cetane number results
in a shorter ignition delay, which for a given injection timing results in earlier
combustion phasing.
Gaseous emissions, particularly NOx, resulting from this premixed diesel combustion
strategy are principally a function of the cooled EGR fraction and the combustion
phasing. Fuel cetane number does not directly impact these emissions. Rather, changes in
cetane number shift the combustion phasing – the corresponding shift in bulk combustion
behavior alters the gaseous emissions. When combustion phasing and EGR fraction are
matched, fuel cetane number has no effect. Fuel hydrocarbon composition has, in certain
cases, a secondary effect on CO and HC emissions, but the bulk effect remains EGR and
combustion phasing.
Additionally, the most important fuel property is cetane number. Though not
sequentially varied, fuel distillation does not appear to have an impact on the combustion
process or emissions. Both the Swedish MK1 and high cetane US fuel possess distillation
curves differing from the other two fuels (which are, themselves, closely matched).
However, their combustion and emissions behavior is comparable, indicating that fuel
distillation is relatively unimportant.
Basic operability and production environment constraints restrict the operating
window and demonstrate the impact of varying cetane number on the combustion mode.
Fuel compliant behavior at fixed injection timing is not delivered for the fuels tested here.
Across a ten-point range of cetane number, no injection timings yield combustion
meeting noise and operability constraints at the tested operating conditions. When
characterized in terms of combustion phasing, the operating window becomes very
consistent. All fuels show the same operating window independent of fuel cetane
number: the noise based advance limit is reached at a CA50 of 7 ± 1 °ATDC, and the loss
of power based retard limit at 15 ± 1 °ATDC.
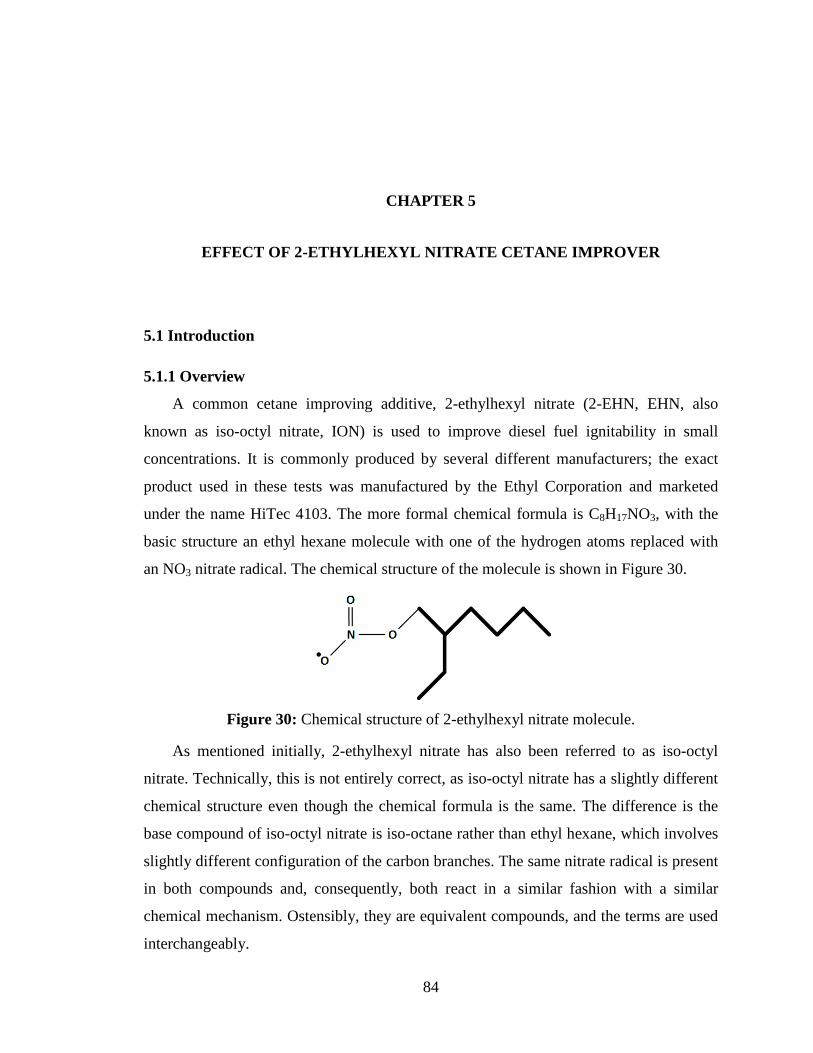
84
CHAPTER 5
EFFECT OF 2-ETHYLHEXYL NITRATE CETANE IMPROVER
5.1 Introduction
5.1.1 Overview
A common cetane improving additive, 2-ethylhexyl nitrate (2-EHN, EHN, also
known as iso-octyl nitrate, ION) is used to improve diesel fuel ignitability in small
concentrations. It is commonly produced by several different manufacturers; the exact
product used in these tests was manufactured by the Ethyl Corporation and marketed
under the name HiTec 4103. The more formal chemical formula is C8H17NO3, with the
basic structure an ethyl hexane molecule with one of the hydrogen atoms replaced with
an NO3 nitrate radical. The chemical structure of the molecule is shown in Figure 30.
Figure 30: Chemical structure of 2-ethylhexyl nitrate molecule.
As mentioned initially, 2-ethylhexyl nitrate has also been referred to as iso-octyl
nitrate. Technically, this is not entirely correct, as iso-octyl nitrate has a slightly different
chemical structure even though the chemical formula is the same. The difference is the
base compound of iso-octyl nitrate is iso-octane rather than ethyl hexane, which involves
slightly different configuration of the carbon branches. The same nitrate radical is present
in both compounds and, consequently, both react in a similar fashion with a similar
chemical mechanism. Ostensibly, they are equivalent compounds, and the terms are used
interchangeably.
85
EHN, though a nitrate compound, is rather stable at room temperature conditions.
The kinetics of its decomposition reaction give very slow reaction rates at temperatures
below 100 °C (Bornemann et al., 2001). Additionally, of interest for its use in diesel
engines, the decomposition reaction rates are even slower when EHN is in a fuel solution
at high pressure (Bornemann et al., 2001). This is very important because it infers that the
EHN will remain stable within the fuel injection system, only decomposing within the
cylinder after injection.
Generally, the additive doping concentration remains relatively low to achieve a
specified increase in cetane number. The increase in cetane number responds in a non-
linear fashion with additive concentration, and is dependent upon the base fuel, with
higher cetane number base fuels seeing a larger increase in cetane number for given
additive concentration. For basic quantification, adding 1500 ppm by volume of 2-EHN
to low sulfur diesel fuel with a cetane number of 36-52 yields a 5-6 point increase in
cetane number (Ethyl, 2004).
5.1.2 Ignition Improvement Behavior
The addition of EHN to diesel fuel increases the ignitability, and therefore the cetane
number, of the fuel. The addition of EHN improves ignition (makes fuel more ignition
prone) because it causes the creation of radicals participating in the ignition process (Li
and Simmons, 1998). Adding to the stock of these ignition precursors promotes ignition.
However, once ignition occurs the effect of the EHN is mute and the combustion process
is dictated by the properties of the bulk fuel (Higgins et al., 1998). Further, the primary
effect of EHN is on the low-temperature (cool-flame reactions) portion of the diesel
combustion process. If the pre-ignition conditions feature higher temperatures, the cool-
flame portion is quickly overtaken by the high temperature portion faster, and EHN has
less of an effect on the combustion process (Higgins et al., 1998).
The reaction process is identified from the works of Zaslonko et al. (1988), Pritchard
(1989), Clothier et al. (1990, 1993), and Stein et al. (1999). The process described is
simplified to show the overall process: the details of formation/decomposition processes
of intermediate species (or those not intimately involved in the ignition improving effect)
are not discussed, as they exceed the scope of necessary detail. With temperatures in the
range of 450-550 K (175-275 °C), EHN decomposes into formaldehyde (CH2O),
86
nitroheptane (C7NO2), nitrogen monoxide and dioxide (NO or NO2), and assorted
radicals. As temperature exceeds 650 K (375 °C) the nitroheptane decomposes, further
increasing the concentration levels of formaldehyde and nitrogen dioxide (NO2). The
NO2 reacts through two separate sets of reactions listed below, one with the
formaldehyde formed from EHN decomposition and the other with unburned diesel fuel,
to form hydrogen nitrite, HNO2.
(Nitrogen dioxide reaction with diesel fuel)
(Nitrogen dioxide reactions with formaldehyde)
The HNO2 dissociates into NO and the hydroxyl radical (OH). The hydroxyl radical
plays a role in the chemical reaction initiating combustion. Increasing the concentration
of OH radicals improves the likelihood of ignition, thereby improving the ignition quality
and perceived ignitability of the fuel. It should also be noted that this overall reaction is
self sustaining (cyclic) to a degree. Thermal decomposition of EHN results in the
formation of NO2 and formaldehyde, which then react to form the HNO2. This
subsequently decomposes leaving NO which, if oxidized to NO2, can continue to react
with formaldehyde or petroleum molecules to form additional HNO2.
5.1.3 NOx Formation Mechanism
Examination of the EHN decomposition process described previously illuminates
that NO and NO2 are formed by the initial decomposition, and the final reaction products
include NO. This implies that introducing EHN into the combustion process results in an
additional NOx formation mechanism that would otherwise not be present. In contrast to
the prompt and thermal NOx mechanisms, which emanate from the nitrogen in the
cylinder air charge either reacting with the hydrocarbon fuel to form NO (prompt NOx
87
formation) or being directly oxidized (thermal NOx formation), the EHN NOx mechanism
results from nitrogen contained within the fuel.
5.1.4 Testing Motivation
The addition of a new NOx formation mechanism would suggest that fuels laden with
EHN would be likely to have higher NOx emissions. The results of some initial engine
tests suggested that this could be correct. Accordingly, a series of more structured in-
depth tests were conducted to quantify the effect of fuels doped with 2-EHN on premixed
diesel combustion and emissions, specifically NOx emissions.
5.2 Testing Methodology
5.2.1 Test Fuels
Two sets of fuels were prepared to examine the impact of EHN on premixed diesel
combustion. Both fuels sets were designed so that cetane number was matched between a
fuel doped with EHN and one that consisted solely of petroleum components. Using the
basic test fuels, two sets of fuels were prepared at differing cetane levels. The pairings are
as follows:
Set A:
Swedish MK1
US ULSD High Cetane, doped with 15% (volume) n-cetane
US ULSD High Cetane, doped with 1150 ppm (volume) 2-ethylhexyl nitrate
Set B:
US ULSD Mid Cetane
US ULSD Low Cetane, doped with 900 ppm (volume) 2-ethylhexyl nitrate
The first set of fuels (Set A), are three different fuels with equivalent cetane numbers
of approximately 53. Swedish MK1 is a light distillation fuel, with a natural cetane
number in the desired range. The US ultra low sulfur diesel (ULSD) fuel used as a base
fuel had a natural cetane number of around 48. In two cases, addition of a doping
compound was used to increase the cetane number to match the Swedish MK1. In one
case, normal cetane (n-cetane), possessing a cetane number of 100, was added at a
concentration of 15% by volume to achieve the desired cetane number increase while
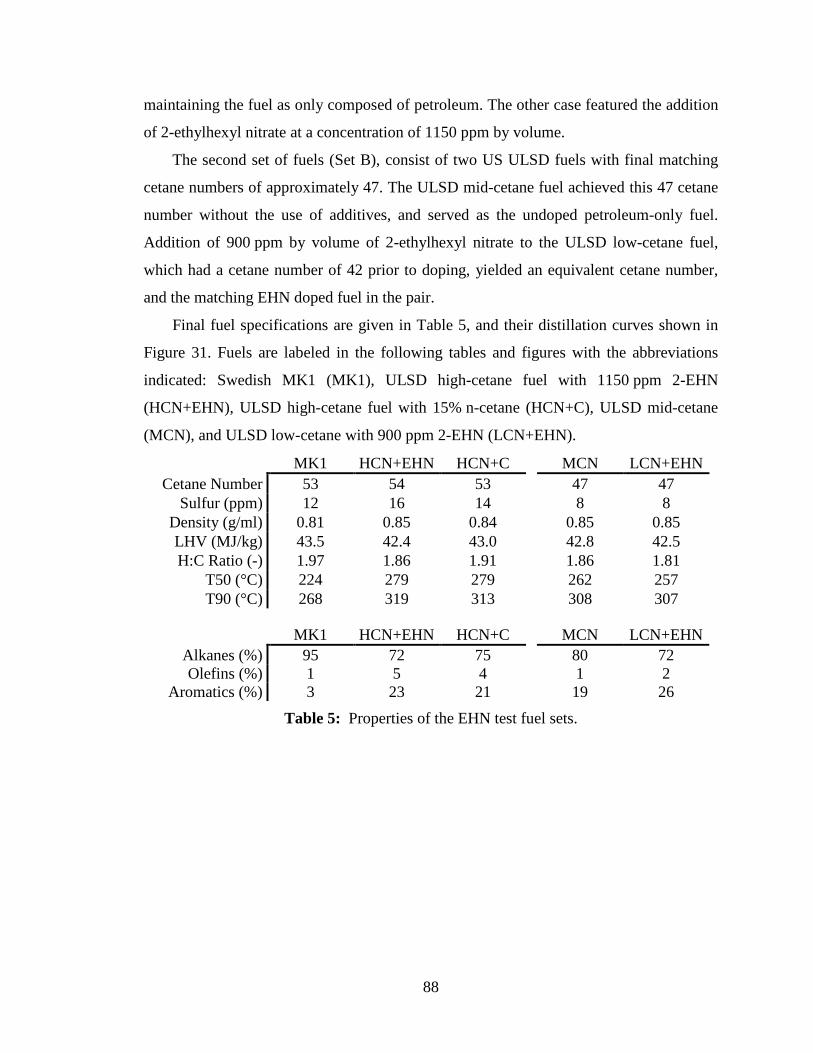
88
maintaining the fuel as only composed of petroleum. The other case featured the addition
of 2-ethylhexyl nitrate at a concentration of 1150 ppm by volume.
The second set of fuels (Set B), consist of two US ULSD fuels with final matching
cetane numbers of approximately 47. The ULSD mid-cetane fuel achieved this 47 cetane
number without the use of additives, and served as the undoped petroleum-only fuel.
Addition of 900 ppm by volume of 2-ethylhexyl nitrate to the ULSD low-cetane fuel,
which had a cetane number of 42 prior to doping, yielded an equivalent cetane number,
and the matching EHN doped fuel in the pair.
Final fuel specifications are given in Table 5, and their distillation curves shown in
Figure 31. Fuels are labeled in the following tables and figures with the abbreviations
indicated: Swedish MK1 (MK1), ULSD high-cetane fuel with 1150 ppm 2-EHN
(HCN+EHN), ULSD high-cetane fuel with 15% n-cetane (HCN+C), ULSD mid-cetane
(MCN), and ULSD low-cetane with 900 ppm 2-EHN (LCN+EHN).
MK1 HCN+EHN HCN+C MCN LCN+EHN Cetane Number 53 54 53 47 47
Sulfur (ppm) 12 16 14 8 8 Density (g/ml) 0.81 0.85 0.84 0.85 0.85 LHV (MJ/kg) 43.5 42.4 43.0 42.8 42.5 H:C Ratio (-) 1.97 1.86 1.91 1.86 1.81
T50 (°C) 224 279 279 262 257 T90 (°C) 268 319 313 308 307
MK1 HCN+EHN HCN+C MCN LCN+EHN Alkanes (%) 95 72 75 80 72 Olefins (%) 1 5 4 1 2
Aromatics (%) 3 23 21 19 26
Table 5: Properties of the EHN test fuel sets.
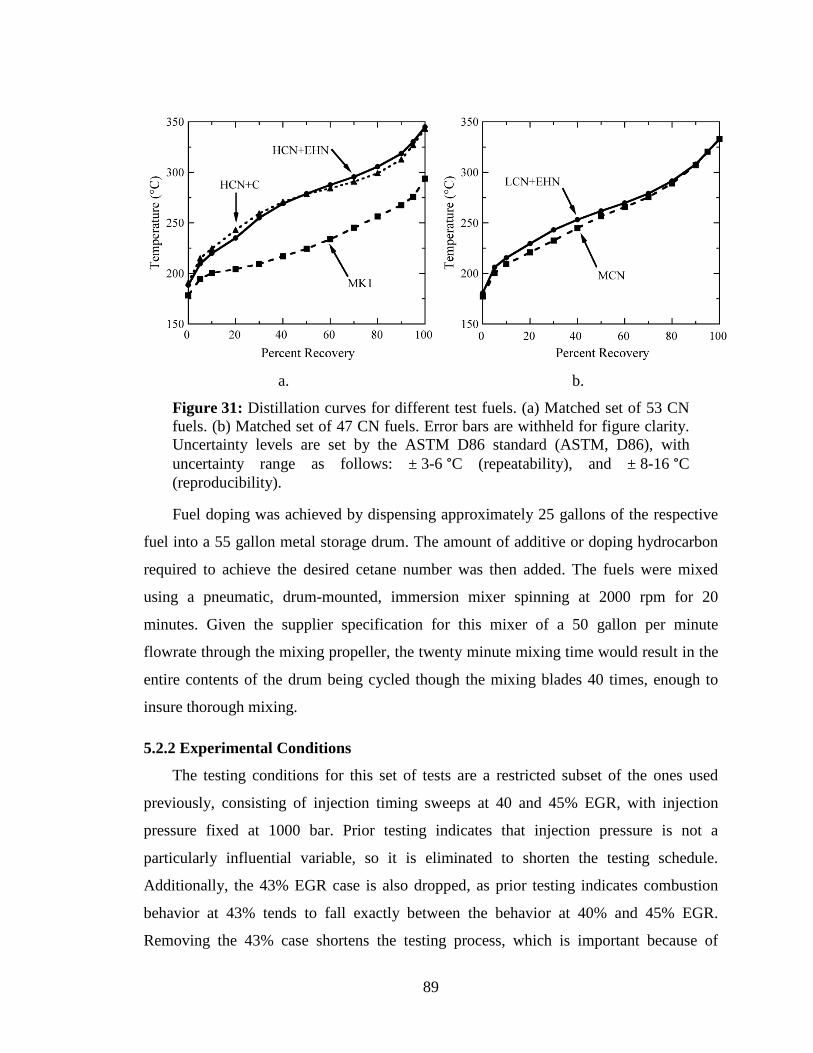
89
a. b.
Figure 31: Distillation curves for different test fuels. (a) Matched set of 53 CN fuels. (b) Matched set of 47 CN fuels. Error bars are withheld for figure clarity. Uncertainty levels are set by the ASTM D86 standard (ASTM, D86), with uncertainty range as follows: ± 3-6 °C (repeatability), and ± 8-16 °C (reproducibility).
Fuel doping was achieved by dispensing approximately 25 gallons of the respective
fuel into a 55 gallon metal storage drum. The amount of additive or doping hydrocarbon
required to achieve the desired cetane number was then added. The fuels were mixed
using a pneumatic, drum-mounted, immersion mixer spinning at 2000 rpm for 20
minutes. Given the supplier specification for this mixer of a 50 gallon per minute
flowrate through the mixing propeller, the twenty minute mixing time would result in the
entire contents of the drum being cycled though the mixing blades 40 times, enough to
insure thorough mixing.
5.2.2 Experimental Conditions
The testing conditions for this set of tests are a restricted subset of the ones used
previously, consisting of injection timing sweeps at 40 and 45% EGR, with injection
pressure fixed at 1000 bar. Prior testing indicates that injection pressure is not a
particularly influential variable, so it is eliminated to shorten the testing schedule.
Additionally, the 43% EGR case is also dropped, as prior testing indicates combustion
behavior at 43% tends to fall exactly between the behavior at 40% and 45% EGR.
Removing the 43% case shortens the testing process, which is important because of
90
concerns stemming from initial tests that EHN doped fuels cause excessive combustion
chamber fouling, which can negatively impact the test results. Minimizing the testing
time is a strategic move to help negate this impact.
Thus the two primary tested EGR levels are 40% and 45%. Much of the testing for
other parts of the work covered in the dissertation was conducted at 40% EGR, so it
remains a natural choice for inclusion. The 45% EGR case is selected because very low
levels of NOx are produced during it. Additionally, the fact that varying the injection
timing or combustion phasing does not notably affect the NOx emissions indicates that
thermal NOx formation is essentially eliminated with this high level of EGR. If thermal
NOx was forming, NOx emissions should correlate with cylinder pressures/temperatures,
which are affected by combustion phasing. Results show that they do not, indicating
minimal thermal NOx formation. Minimizing the NOx formation levels should make the
EHN effect more clearly visible.
5.3 Results and Discussion
5.3.1 Injector Fouling
In all tests conducted as part of this study (the tests yielding the results presented
here, along with initial exploratory tests), the EHN laden fuels demonstrated behavior
consistent with injector fouling of a substantially more accelerated and severe nature than
the other test fuels. The exact nature of this effect is hard to quantify, but the end results
are apparent. Inspections of the injector after tests with the EHN-doped fuel revealed
visual indication of substantial injector fouling. The injector deposits were more
substantial than what resulted from using the other fuels which lacked EHN.
Unfortunately, photographic documentation was not taken to visually demonstrate the
effect. Thus, the fouling is not demonstrated a priori, but rather through observed
combustion and emissions behavior. Combustion degrades over time as injector deposits
(fouling) affect the fuel spray coming from the injector nozzle. This effects changes in
the combustion behavior and engine emissions for the EHN doped fuels in contrast to the
petroleum only fuels. The effects on individual results (combustion and emissions) are
noted in their respective section.
91
It is important to note that increased engine fouling from EHN use is not generally
noted within the literature. No studies of EHN treated fuels report fouling issues, though
this is not a direct indication that no fouling problems existed. Only one study formally
examined engine durability issues with EHN laden fuels, and it was conducted by Ethyl,
one of the common producers of EHN and the maker of the EHN product used in these
tests (Kulinowski et al., 1998). Their testing consisted of 1000 hour engine durability
studies on a pair of Detroit Diesel Series 60 heavy duty truck engines, with one engine
fueled with untreated diesel fuel and the other with the same fuel treated with a very high
concentration (7500 ppm) of EHN. Measurement of combustion surface deposits and
injector flowrates indicated that EHN did not have a negative effect – and actually may
have lead to decreased deposits and fouling. However, there are several important
caveats: this testing was conducted on a 1993 series heavy-duty engine without EGR over
a durability testing cycle with fuels of vastly different cetane number. Issues of fouling
are more pronounced when operating in premixed diesel combustion modes with high
EGR rates – the lack of EGR in the Kulinowski et al. compared to the current study’s
high rate may yield diverging trends. Further, the operating modes of the durability test,
though not explicitly described, are likely vastly different from the operating modes in
the current work, leading to different deposit formation issues. Finally, the two fuels
tested in the durability study had vastly different cetane numbers: there was a nine point
difference in cetane number between the untreated (42.5) and treated (51.5) fuel. In an
engine of the vintage used in the durability study, this cetane number difference gives
vastly different combustion characteristics between the two fuels. The possible
improvement in durability criteria may result more from the notably higher cetane
number than anything directly related to the additive.
5.3.2 General Combustion Behavior
The EHN doped fuels initially act in a very similar manner to the petroleum-only
fuels of equivalent cetane number. The ignition delay and the time from start of injection
to location of 50% MFB is constant between the fuels at the beginning of testing.
However, after the onset of what is understood to be injector fouling, the EHN-doped
fuels behavior diverges from that of the petroleum only fuels.
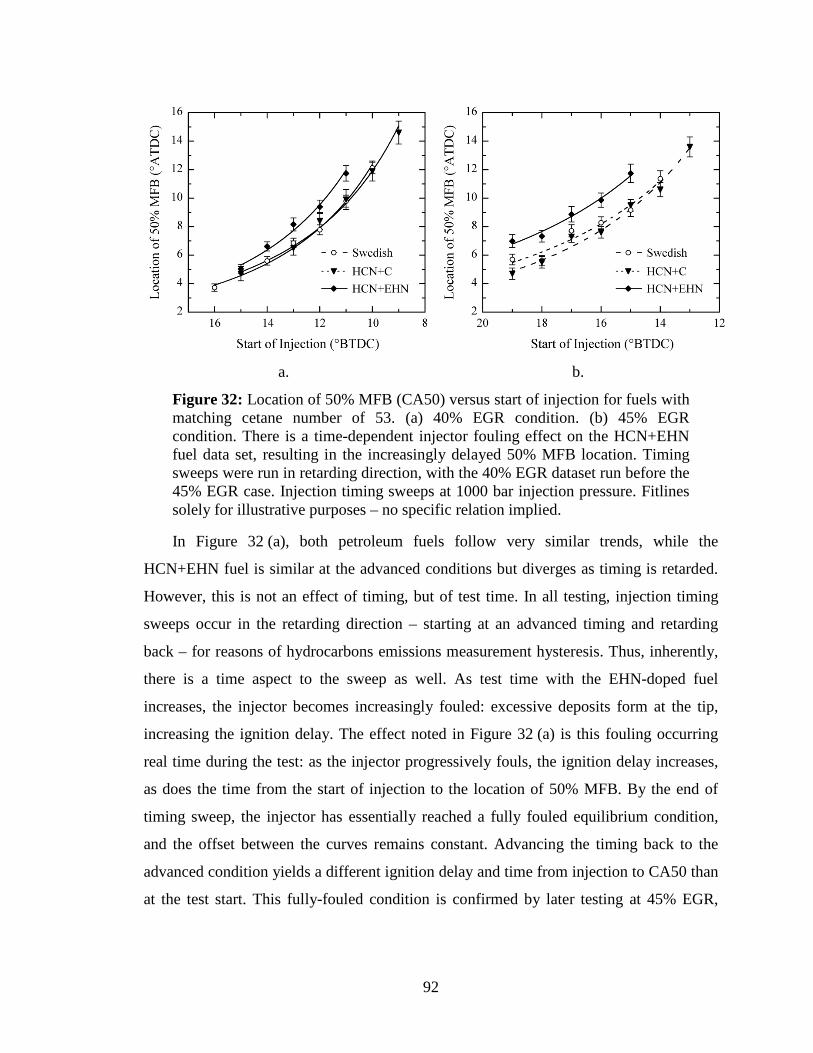
92
a. b.
Figure 32: Location of 50% MFB (CA50) versus start of injection for fuels with matching cetane number of 53. (a) 40% EGR condition. (b) 45% EGR condition. There is a time-dependent injector fouling effect on the HCN+EHN fuel data set, resulting in the increasingly delayed 50% MFB location. Timing sweeps were run in retarding direction, with the 40% EGR dataset run before the 45% EGR case. Injection timing sweeps at 1000 bar injection pressure. Fitlines solely for illustrative purposes – no specific relation implied.
In Figure 32 (a), both petroleum fuels follow very similar trends, while the
HCN+EHN fuel is similar at the advanced conditions but diverges as timing is retarded.
However, this is not an effect of timing, but of test time. In all testing, injection timing
sweeps occur in the retarding direction – starting at an advanced timing and retarding
back – for reasons of hydrocarbons emissions measurement hysteresis. Thus, inherently,
there is a time aspect to the sweep as well. As test time with the EHN-doped fuel
increases, the injector becomes increasingly fouled: excessive deposits form at the tip,
increasing the ignition delay. The effect noted in Figure 32 (a) is this fouling occurring
real time during the test: as the injector progressively fouls, the ignition delay increases,
as does the time from the start of injection to the location of 50% MFB. By the end of
timing sweep, the injector has essentially reached a fully fouled equilibrium condition,
and the offset between the curves remains constant. Advancing the timing back to the
advanced condition yields a different ignition delay and time from injection to CA50 than
at the test start. This fully-fouled condition is confirmed by later testing at 45% EGR,
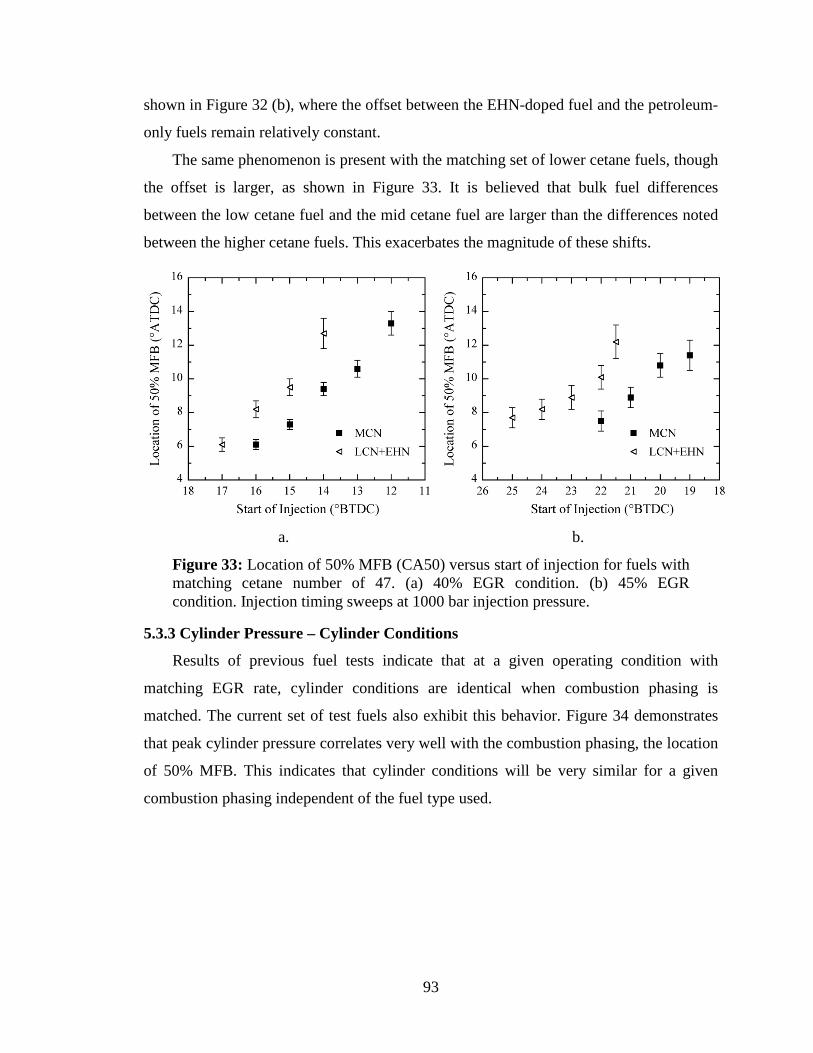
93
shown in Figure 32 (b), where the offset between the EHN-doped fuel and the petroleum-
only fuels remain relatively constant.
The same phenomenon is present with the matching set of lower cetane fuels, though
the offset is larger, as shown in Figure 33. It is believed that bulk fuel differences
between the low cetane fuel and the mid cetane fuel are larger than the differences noted
between the higher cetane fuels. This exacerbates the magnitude of these shifts.
a. b.
Figure 33: Location of 50% MFB (CA50) versus start of injection for fuels with matching cetane number of 47. (a) 40% EGR condition. (b) 45% EGR condition. Injection timing sweeps at 1000 bar injection pressure.
5.3.3 Cylinder Pressure – Cylinder Conditions
Results of previous fuel tests indicate that at a given operating condition with
matching EGR rate, cylinder conditions are identical when combustion phasing is
matched. The current set of test fuels also exhibit this behavior. Figure 34 demonstrates
that peak cylinder pressure correlates very well with the combustion phasing, the location
of 50% MFB. This indicates that cylinder conditions will be very similar for a given
combustion phasing independent of the fuel type used.
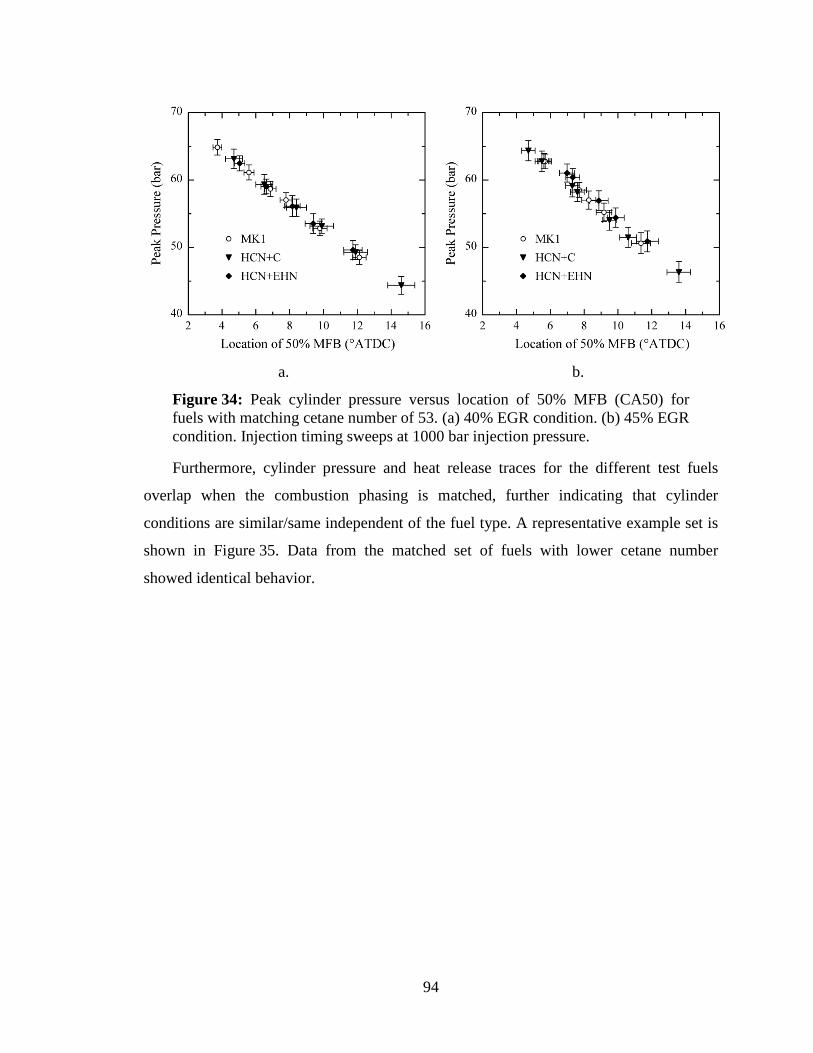
94
a. b.
Figure 34: Peak cylinder pressure versus location of 50% MFB (CA50) for fuels with matching cetane number of 53. (a) 40% EGR condition. (b) 45% EGR condition. Injection timing sweeps at 1000 bar injection pressure.
Furthermore, cylinder pressure and heat release traces for the different test fuels
overlap when the combustion phasing is matched, further indicating that cylinder
conditions are similar/same independent of the fuel type. A representative example set is
shown in Figure 35. Data from the matched set of fuels with lower cetane number
showed identical behavior.
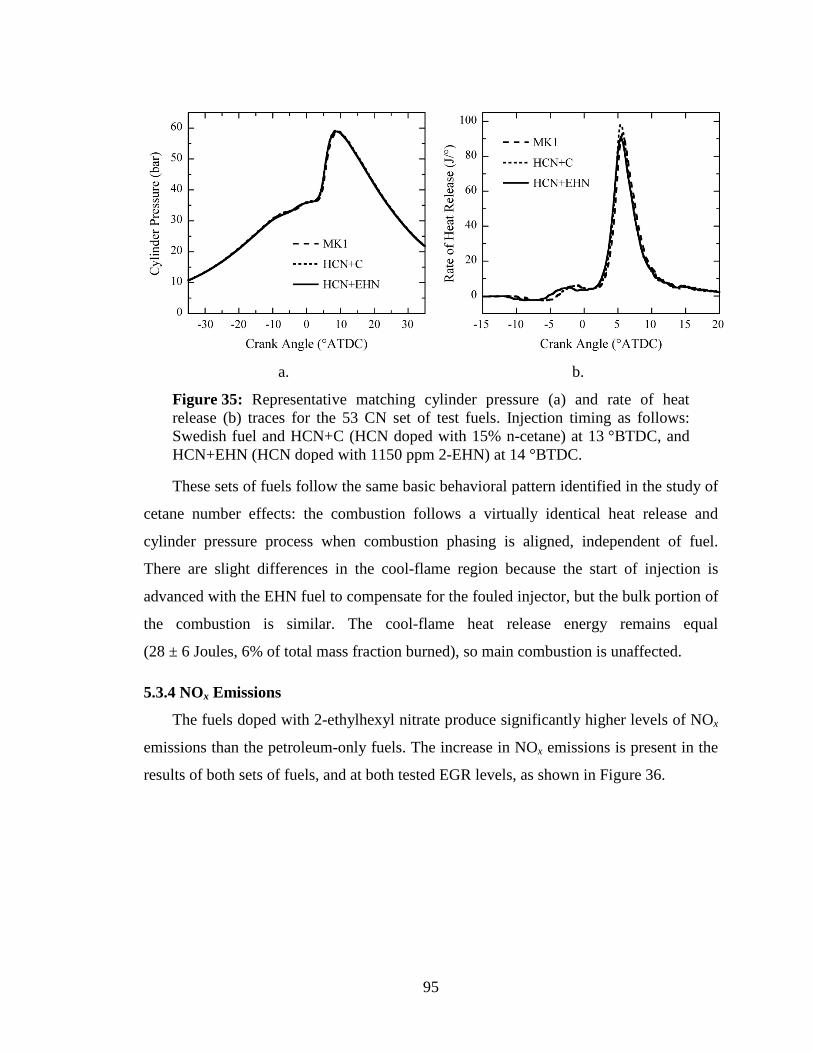
95
a. b.
Figure 35: Representative matching cylinder pressure (a) and rate of heat release (b) traces for the 53 CN set of test fuels. Injection timing as follows: Swedish fuel and HCN+C (HCN doped with 15% n-cetane) at 13 °BTDC, and HCN+EHN (HCN doped with 1150 ppm 2-EHN) at 14 °BTDC.
These sets of fuels follow the same basic behavioral pattern identified in the study of
cetane number effects: the combustion follows a virtually identical heat release and
cylinder pressure process when combustion phasing is aligned, independent of fuel.
There are slight differences in the cool-flame region because the start of injection is
advanced with the EHN fuel to compensate for the fouled injector, but the bulk portion of
the combustion is similar. The cool-flame heat release energy remains equal
(28 ± 6 Joules, 6% of total mass fraction burned), so main combustion is unaffected.
5.3.4 NOx Emissions
The fuels doped with 2-ethylhexyl nitrate produce significantly higher levels of NOx
emissions than the petroleum-only fuels. The increase in NOx emissions is present in the
results of both sets of fuels, and at both tested EGR levels, as shown in Figure 36.
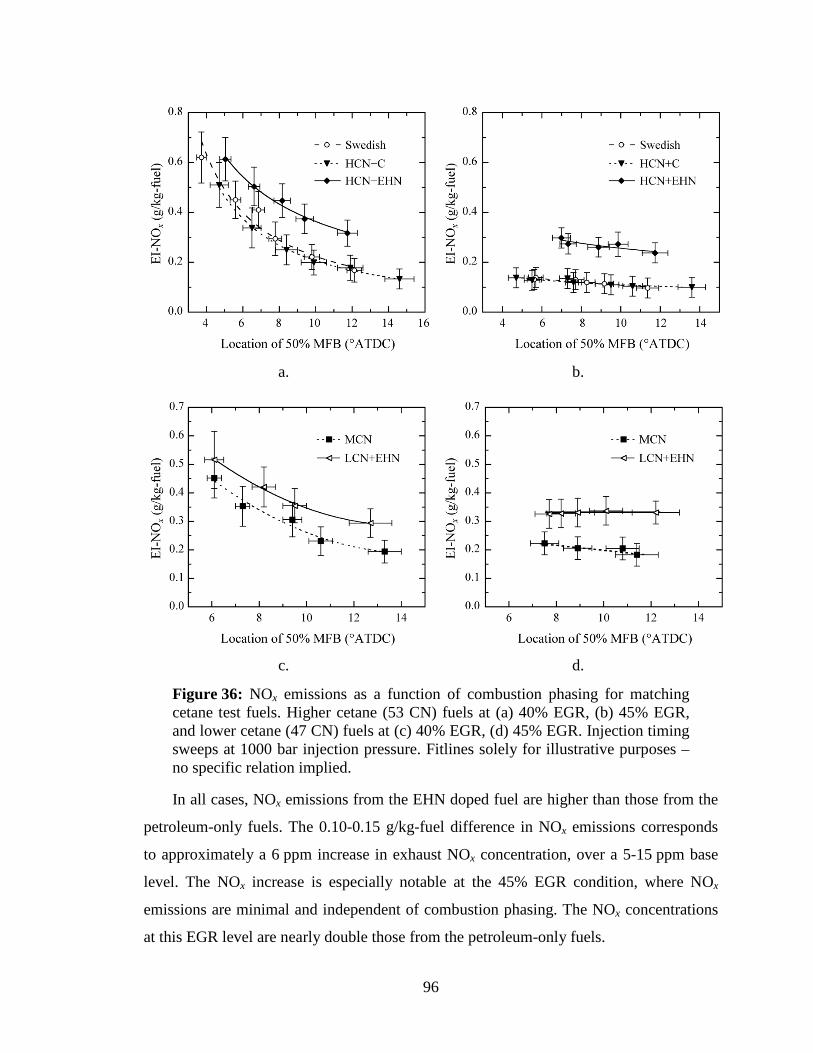
96
a. b.
c. d.
Figure 36: NOx emissions as a function of combustion phasing for matching cetane test fuels. Higher cetane (53 CN) fuels at (a) 40% EGR, (b) 45% EGR, and lower cetane (47 CN) fuels at (c) 40% EGR, (d) 45% EGR. Injection timing sweeps at 1000 bar injection pressure. Fitlines solely for illustrative purposes – no specific relation implied.
In all cases, NOx emissions from the EHN doped fuel are higher than those from the
petroleum-only fuels. The 0.10-0.15 g/kg-fuel difference in NOx emissions corresponds
to approximately a 6 ppm increase in exhaust NOx concentration, over a 5-15 ppm base
level. The NOx increase is especially notable at the 45% EGR condition, where NOx
emissions are minimal and independent of combustion phasing. The NOx concentrations
at this EGR level are nearly double those from the petroleum-only fuels.
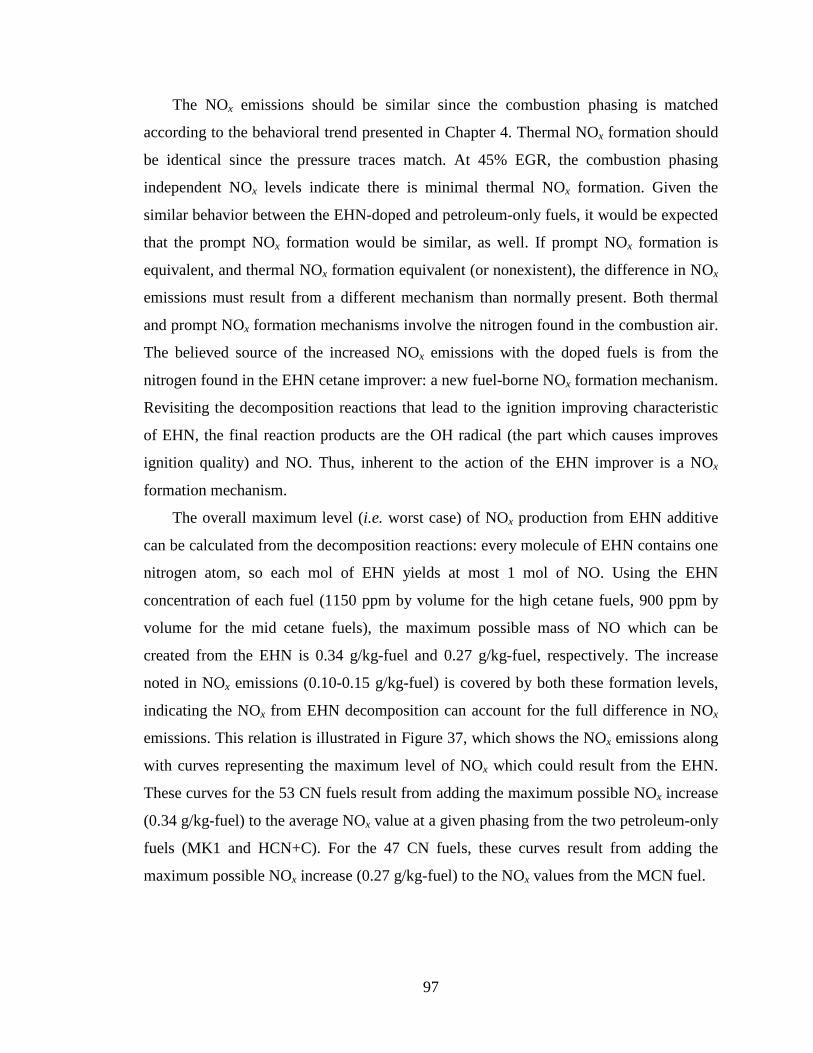
97
The NOx emissions should be similar since the combustion phasing is matched
according to the behavioral trend presented in Chapter 4. Thermal NOx formation should
be identical since the pressure traces match. At 45% EGR, the combustion phasing
independent NOx levels indicate there is minimal thermal NOx formation. Given the
similar behavior between the EHN-doped and petroleum-only fuels, it would be expected
that the prompt NOx formation would be similar, as well. If prompt NOx formation is
equivalent, and thermal NOx formation equivalent (or nonexistent), the difference in NOx
emissions must result from a different mechanism than normally present. Both thermal
and prompt NOx formation mechanisms involve the nitrogen found in the combustion air.
The believed source of the increased NOx emissions with the doped fuels is from the
nitrogen found in the EHN cetane improver: a new fuel-borne NOx formation mechanism.
Revisiting the decomposition reactions that lead to the ignition improving characteristic
of EHN, the final reaction products are the OH radical (the part which causes improves
ignition quality) and NO. Thus, inherent to the action of the EHN improver is a NOx
formation mechanism.
The overall maximum level (i.e. worst case) of NOx production from EHN additive
can be calculated from the decomposition reactions: every molecule of EHN contains one
nitrogen atom, so each mol of EHN yields at most 1 mol of NO. Using the EHN
concentration of each fuel (1150 ppm by volume for the high cetane fuels, 900 ppm by
volume for the mid cetane fuels), the maximum possible mass of NO which can be
created from the EHN is 0.34 g/kg-fuel and 0.27 g/kg-fuel, respectively. The increase
noted in NOx emissions (0.10-0.15 g/kg-fuel) is covered by both these formation levels,
indicating the NOx from EHN decomposition can account for the full difference in NOx
emissions. This relation is illustrated in Figure 37, which shows the NOx emissions along
with curves representing the maximum level of NOx which could result from the EHN.
These curves for the 53 CN fuels result from adding the maximum possible NOx increase
(0.34 g/kg-fuel) to the average NOx value at a given phasing from the two petroleum-only
fuels (MK1 and HCN+C). For the 47 CN fuels, these curves result from adding the
maximum possible NOx increase (0.27 g/kg-fuel) to the NOx values from the MCN fuel.
98
a. b.
c. d.
Figure 37: NOx emissions with bounds of theoretical maximum NOx produced from EHN decomposition. High cetane (53 CN) fuels at (a) 40% EGR, (b) 45% EGR, and lower cetane (47 CN) fuels at (c) 40% EGR, (d) 45% EGR. Bounds calculated assuming all nitrogen from EHN in fuel exits as NOx. Fitlines for illustrative purposes – no specific relation implied.
The difference between the maximum possible formation and measured NOx
emissions is accounted for by partial completion of the decomposition reactions and
shifts in NOx equilibrium reactions. All of the classical NOx formation mechanisms
present in combustion are equilibrium reactions: the sudden influx of NO from the fuel
increases the NO concentration, shifting the reaction equilibrium. Thus, NOx which
would have been formed due to the normal mechanism does not form, leading the lower
99
than expected NOx levels. Also, the analyzer used to measure NOx emissions only
measures the concentrations of NO and NO2. The nitrogen from the fuel which does not
show up in the exhaust as NOx is simply leaving in the form of other nitrogen compounds
which are not measured by the NOx analyzer.
Trying to identify the relative fraction of these two effects is fraught with peril. Two
primary factors make further subdivision of the effects difficult: (1) the magnitude of the
difference in NOx level between maximum and viewed results, and (2) the highly
dynamic and inhomogeneous nature of the diesel combustion process. The magnitude of
the difference between measured and calculated maximum possible NOx level is on the
order of 6-8 ppm. Accurately subdividing this into subcategories of effects (partial
decomposition reactions vs. NOx equilibrium shift) will be difficult simply because the
magnitude examined is small, especially relative to the uncertainty of the measurements.
Second, the in-cylinder dynamics of the diesel combustion process are extremely
complex, with large variations in temperature, fluid motion, particle interaction, and
composition, which are all factors that exert strong influence on the chemical reactions
and NOx formation behavior. Fully accounting for these effects is required to reasonably
subdivide the small difference in NOx levels, and yet doing so is highly impractical.
Potentially, fully characterizing all nitrogen containing species in the exhaust of the
engine when operated on fuels with and without EHN additive may offer some inference
as to the relative percentage of the two effects. The relative complexity of the experiment
should be weighed against to the likelihood of generating useful results before
undertaking, however.
These results indicating that EHN leads to higher NOx emissions contrast the
findings of previous research with EHN, which conclude that EHN addition does not
increase NOx emissions, and in many cases results in a slight decrease (Ullman et al.,
1995; Spreen et al., 1995; Gairing et al., 1995; Li et al., 1997; Starr, 1997; Higgins et al.,
1998; Higgins and Siebers, 2001; McCormick et al., 2002; Szybist et al., 2005;
McCormick et al., 2005). The principal differences between these published cases and the
current research work is the magnitude of the engine-out NOx emissions, and the type of
diesel combustion employed.
100
The magnitude of NOx emissions in published studies is substantially higher than the
range produced here. Normalizing the literature results into g/kg-fuel emissions indices
demonstrates how much higher the NOx levels in those tests were. For the first nine
references, comprised of tests on older heavy duty and industrial diesel engines, the NOx
emissions are in the range of 25-45 g/kg-fuel, two orders of magnitude higher than the
test results of this work. The final reference (McCormick et al., 2005), used a more recent
heavy duty diesel engine in a multi-mode test, producing NOx emissions of
approximately 10 g/kg-fuel, still substantially more than the levels of NOx found in this
test. The amount of NOx formed by the EHN decomposition is insignificant compared to
the overall emission level in the prior tests, and would be usurped by the experimental
uncertainty and condition variation. However, in the current case, where high rates of
EGR are used to minimize the thermal NOx formation, the amount of NOx formed by
EHN decomposition becomes increasingly significant.
With the exception of the most recent reference (McCormick et al., 2005) the
combustion mode used in all these earlier studies is classified as conventional diesel
combustion. Given the dates of publication and test engines used, it is unlikely any of
these engines use significant quantities of EGR for NOx reduction. With conventional
diesel combustion, featuring both a premixed and diffusion portion of combustion,
increasing fuel cetane number decreases mixing time and, as a result, the premixed
portion of combustion. By decreasing the amount of premixed combustion, overall peak
pressures and temperatures decrease, causing decreased thermal NOx formation. As such,
the decrease in thermal NOx formation, due to the higher cetane number causing a
reduction in premixed fraction, likely overshadows any NOx production from EHN
decomposition. The more recent (2004 calibration) heavy duty diesel engines used in the
last reference (McCormick et al., 2005), which were likely using some levels of EGR and
multiple fuel injections, the EHN did not alter NOx emissions. This is expected since
cetane number has been shown to have little effect on the combustion of engines using
multiple injections (Massa et al., 2007). The cetane improving quality of EHN therefore
did not affect the combustion in a manner which would change the thermal NOx
formation.
101
However, one source in the literature indicates partial support for EHN doping
leading to increased NOx emissions. A principal components analysis study conducted on
a diesel HCCI engine reports that, for all other parameters being held equal, increasing
the concentration of EHN added to the fuel increases NOx emissions (Bunting et al.,
2007). Their study tested a series of fuels with varied properties, then analyzed the results
to correlate between different individual parameters. Accordingly, the authors of this
prior study give only modest confidence in the reported correlation between EHN
concentration and NOx emissions. The relation published in their study suggests that the
concentration of EHN found in the test fuels of the current study should yield
approximately a 0.05 g/kg-fuel increase in NOx emissions, less than the measured
increase of 0.10-0.15 g/kg-fuel. However, the relation in the Bunting et al. paper was
determined using only three different EHN concentrations: 200, 3200, and 5000 ppm.
There is a sizeable gap between the two bracketing concentrations (200, 3200) to those
tested here (900, 1150). Due to the sensitivity of the equilibrium NOx equilibrium
reactions, which are affected by the increased NOx production, it is possible that the
higher concentrations of EHN improver yield similar levels of NOx emissions as the
lower ones tested here. Remember, the NOx emissions measured are less than the
theoretical maximum amount which would be generated if there was complete
conversion and no destruction of all the EHN to NOx. Increased NOx destruction is likely
with the higher EHN concentrations, muting the level of NOx emissions with the higher
EHN concentration. At an EHN concentration of 200 ppm, it will be very difficult to
measure any significant level of NOx increase. Consequently, the reported correlation for
NOx emissions may not be accurate in the range between 200 and 3200 ppm. The shape
of the correlation presented is likely not representative within this range.
5.3.5 Carbon Monoxide and Hydrocarbon Emissions
The EHN additive does not have a direct impact on the carbon monoxide (CO) and
hydrocarbon (HC) emissions levels. Results initially follow the expected trend, with both
CO and HC emissions increasing with a retard in combustion phasing. However, due to
combustion fouling, there are EGR specific differences. At 40% EGR, the CO and HC
emissions were equal between the EHN treated and petroleum only fuels. This behavior
was noted for both the matching high and low cetane sets of fuels. Carbon monoxide and
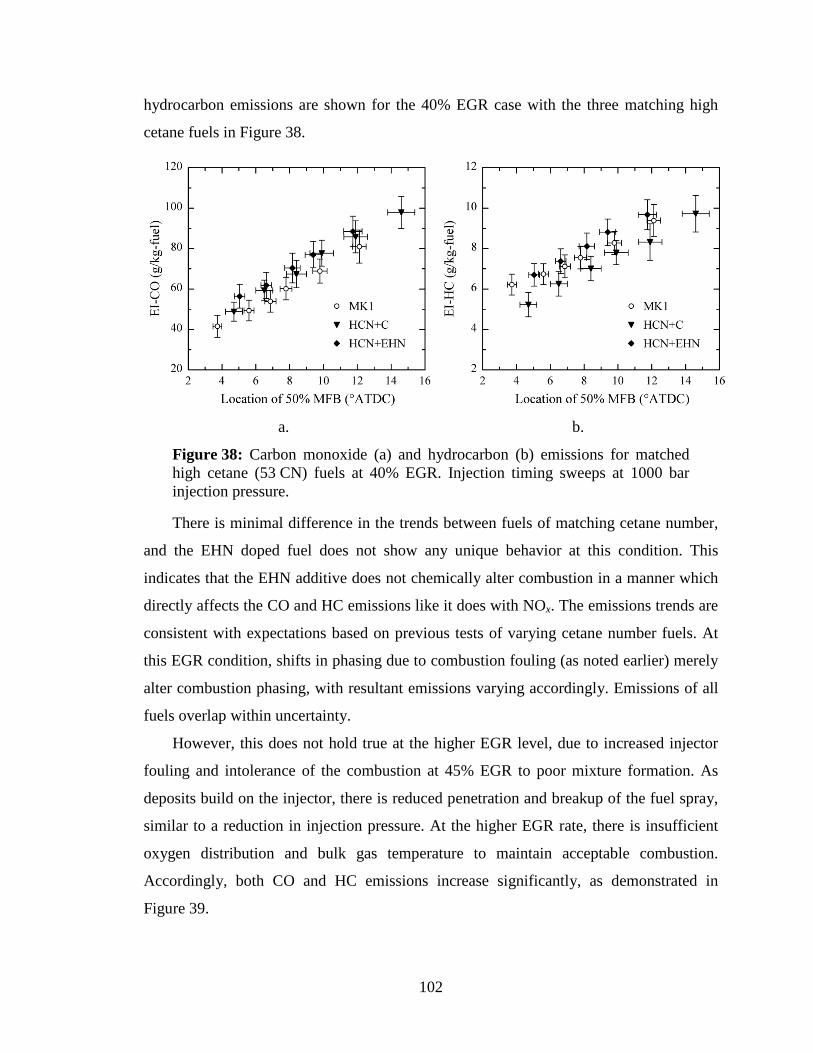
102
hydrocarbon emissions are shown for the 40% EGR case with the three matching high
cetane fuels in Figure 38.
a. b.
Figure 38: Carbon monoxide (a) and hydrocarbon (b) emissions for matched high cetane (53 CN) fuels at 40% EGR. Injection timing sweeps at 1000 bar injection pressure.
There is minimal difference in the trends between fuels of matching cetane number,
and the EHN doped fuel does not show any unique behavior at this condition. This
indicates that the EHN additive does not chemically alter combustion in a manner which
directly affects the CO and HC emissions like it does with NOx. The emissions trends are
consistent with expectations based on previous tests of varying cetane number fuels. At
this EGR condition, shifts in phasing due to combustion fouling (as noted earlier) merely
alter combustion phasing, with resultant emissions varying accordingly. Emissions of all
fuels overlap within uncertainty.
However, this does not hold true at the higher EGR level, due to increased injector
fouling and intolerance of the combustion at 45% EGR to poor mixture formation. As
deposits build on the injector, there is reduced penetration and breakup of the fuel spray,
similar to a reduction in injection pressure. At the higher EGR rate, there is insufficient
oxygen distribution and bulk gas temperature to maintain acceptable combustion.
Accordingly, both CO and HC emissions increase significantly, as demonstrated in
Figure 39.
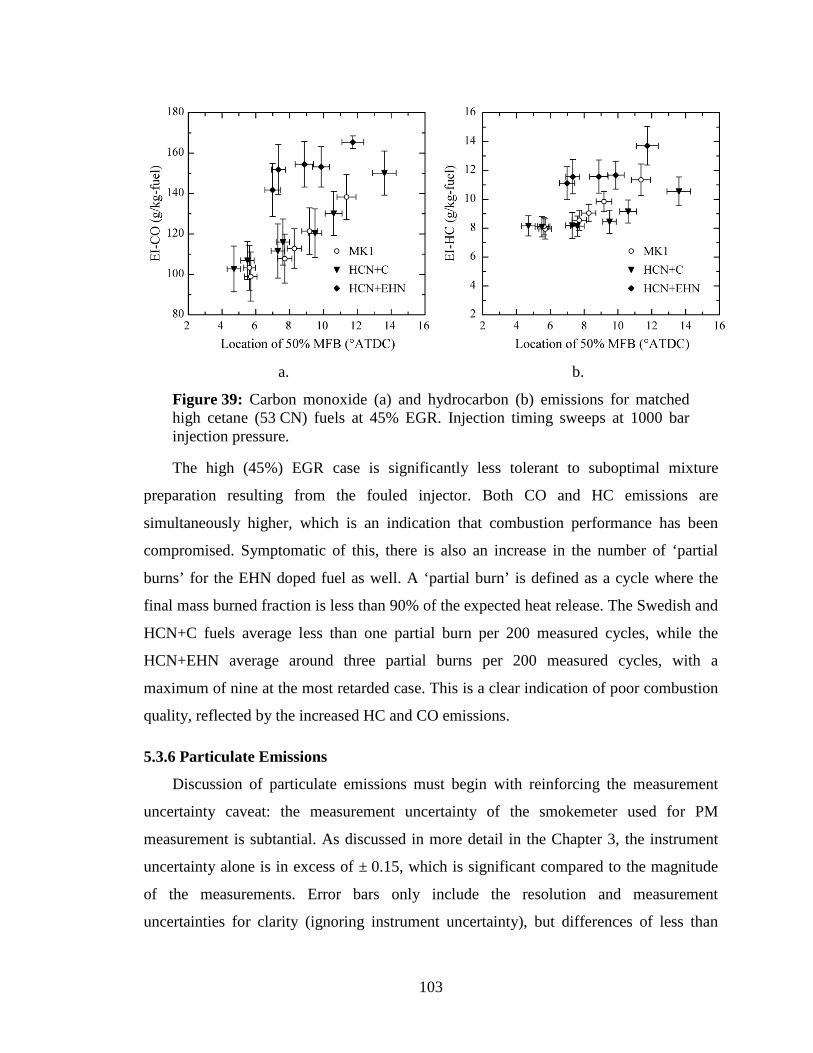
103
a. b.
Figure 39: Carbon monoxide (a) and hydrocarbon (b) emissions for matched high cetane (53 CN) fuels at 45% EGR. Injection timing sweeps at 1000 bar injection pressure.
The high (45%) EGR case is significantly less tolerant to suboptimal mixture
preparation resulting from the fouled injector. Both CO and HC emissions are
simultaneously higher, which is an indication that combustion performance has been
compromised. Symptomatic of this, there is also an increase in the number of ‘partial
burns’ for the EHN doped fuel as well. A ‘partial burn’ is defined as a cycle where the
final mass burned fraction is less than 90% of the expected heat release. The Swedish and
HCN+C fuels average less than one partial burn per 200 measured cycles, while the
HCN+EHN average around three partial burns per 200 measured cycles, with a
maximum of nine at the most retarded case. This is a clear indication of poor combustion
quality, reflected by the increased HC and CO emissions.
5.3.6 Particulate Emissions
Discussion of particulate emissions must begin with reinforcing the measurement
uncertainty caveat: the measurement uncertainty of the smokemeter used for PM
measurement is subtantial. As discussed in more detail in the Chapter 3, the instrument
uncertainty alone is in excess of ± 0.15, which is significant compared to the magnitude
of the measurements. Error bars only include the resolution and measurement
uncertainties for clarity (ignoring instrument uncertainty), but differences of less than
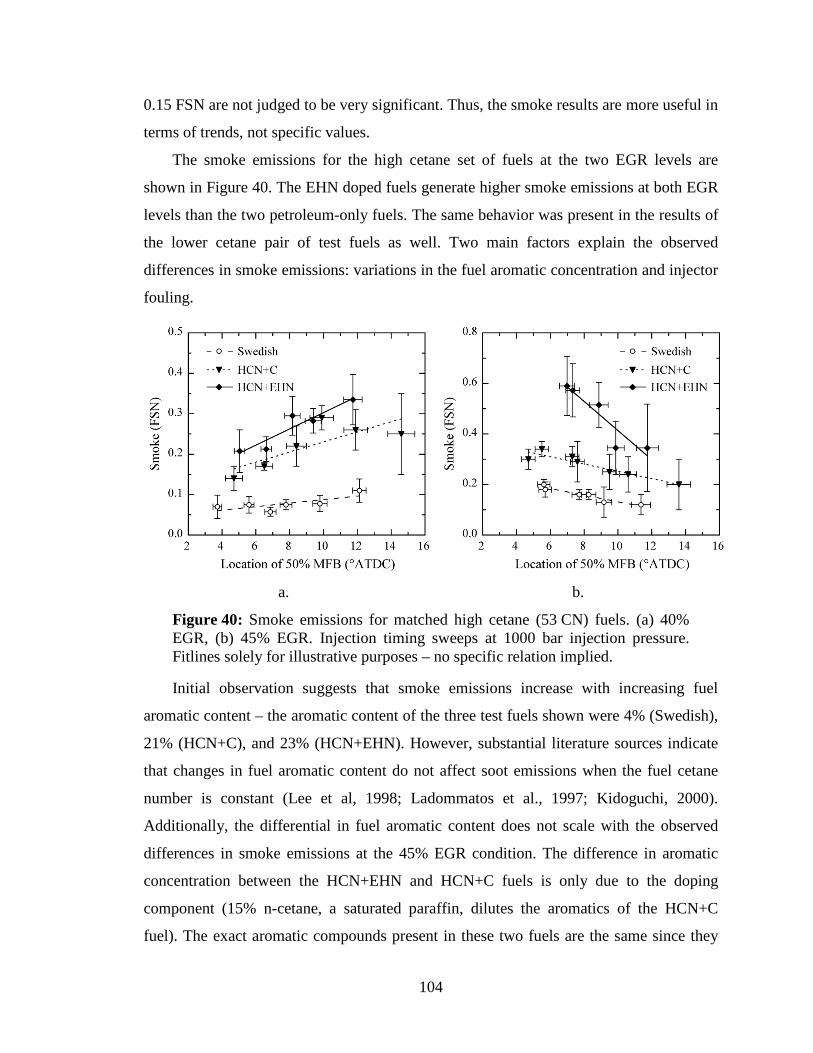
104
0.15 FSN are not judged to be very significant. Thus, the smoke results are more useful in
terms of trends, not specific values.
The smoke emissions for the high cetane set of fuels at the two EGR levels are
shown in Figure 40. The EHN doped fuels generate higher smoke emissions at both EGR
levels than the two petroleum-only fuels. The same behavior was present in the results of
the lower cetane pair of test fuels as well. Two main factors explain the observed
differences in smoke emissions: variations in the fuel aromatic concentration and injector
fouling.
a. b.
Figure 40: Smoke emissions for matched high cetane (53 CN) fuels. (a) 40% EGR, (b) 45% EGR. Injection timing sweeps at 1000 bar injection pressure. Fitlines solely for illustrative purposes – no specific relation implied.
Initial observation suggests that smoke emissions increase with increasing fuel
aromatic content – the aromatic content of the three test fuels shown were 4% (Swedish),
21% (HCN+C), and 23% (HCN+EHN). However, substantial literature sources indicate
that changes in fuel aromatic content do not affect soot emissions when the fuel cetane
number is constant (Lee et al, 1998; Ladommatos et al., 1997; Kidoguchi, 2000).
Additionally, the differential in fuel aromatic content does not scale with the observed
differences in smoke emissions at the 45% EGR condition. The difference in aromatic
concentration between the HCN+EHN and HCN+C fuels is only due to the doping
component (15% n-cetane, a saturated paraffin, dilutes the aromatics of the HCN+C
fuel). The exact aromatic compounds present in these two fuels are the same since they

105
share a common base fuel. A two percent difference in concentration of the same set of
aromatics does not explain the difference in smoke emissions noted at 45% EGR.
The most substantial increase in smoke emissions is at 45% EGR condition. This is
also where the largest increases in CO and HC emissions occur, which are tied to a
decline in combustion quality due to injector fouling. As deposits on the injector increase,
fuel sprays achieve less penetration, breakup, and mixing. This is the same result a
decrease in injection pressure causes (for relevant discussion, see injection pressure
effects discussion in Chapter 4, Section 3.6). The effect may be identical, with deposits
acting to throttle the fuel injection. Accordingly, the behavior is similar to a decrease in
injection pressure: increasing smoke emissions. However, there are two concerns with
this theory. First, the smoke number decreases with combustion phasing from
significantly higher than the other fuels at advanced phasings to approximately the same
level at retarded phasing locations. Second, symptoms indicate the injector fouling
occurred during the 40% EGR tests, which do not display the same level of increased
smoke emissions. For this to be an issue of injector fouling, there is clearly also a
secondary EGR effect present.
The phasing dependency of smoke emissions is common at high EGR levels. The
smoke emissions for all the fuels decrease as combustion phasing is retarded. This
behavior, smoke emissions decreasing with phasing at 45% EGR, shows in the results of
the lower cetane matched pair of fuels, along with the varied cetane number petroleum
fuels from earlier in this work, and in prior research by Jacobs et al. (2005). At 45%
EGR, the cylinder temperatures drops below the soot formation threshold as combustion
phasing is retarded. Thus, even when injector fouling should cause notably higher smoke
emissions (as evidenced by the high smoke numbers at advanced phasings), the
magnitude is limited by combustion conditions not promoting soot formation.
Additionally, the smoke measurements only indicate carbon soot emissions – examining
particulate matter as a whole (including the soluble organic fraction, SOF) may have
yielded a more consistent increase in PM emissions with the EHN.
The second concern, that injector fouling occurs during the 40% EGR conditions but
is not reflected in the smoke measurements, can be reasonably explained. The smoke
emissions for the EHN treated fuel trend higher than the petroleum-only fuels at 40%
106
EGR. The offset is not as significant as at higher EGR levels, and is nearly covered by
measurement uncertainty, but it is still present. Furthermore, there is an observed and
documented effect of EGR affecting the behavior of smoke measurements, and the
observed trend falls within this phenomenon. It is expected that the effect would be
amplified at the higher EGR condition.
5.4 Summary and Conclusions
The presence of 2-EHN within the fuel introduces a new fuel-borne NOx formation
mechanism into the combustion process, which significantly increases NOx emissions in
a premixed diesel combustion mode. The increase in emissions is not reported by prior
researchers due to their use of a conventional combustion mode and large magnitude of
the NOx emissions in their tests, both of which lead to other effects overshadowing the
NOx formed by the EHN decomposition. The NOx emissions levels resulting from
premixed diesel combustion are low enough to reveal a consistent increase in NOx
emissions that is directly tied to the addition of 2-EHN to the test fuel.
The use of 2-ethylhexyl nitrate causes significantly worse injector fouling under the
specified test conditions than petroleum-only (undoped) fuels. Observed changes in
combustion and emissions behavior lead to this assertion. Test results indicate that 2-
ethylhexyl nitrate is not directly responsible for changes in carbon monoxide,
hydrocarbon, or smoke emissions. However, especially at high EGR rates (45% in this
case), injector fouling caused by the 2-EHN in the test fuel leads to distinct increases in
all three emissions compared to fuels without the additive.
107
CHAPTER 6
PREMIXED DIESEL COMBUSTION LOAD LIMITS AND FUEL EFFECTS
6.1 Introduction
Though desired, it is understood that premixed diesel combustion will not be used
throughout the full operating range of future diesel engines. The intent is for it to supplant
conventional combustion in the light to mid load range. Even within this range, different
premixed diesel combustion strategies will be used based on their characteristics,
advantages, and deficiencies. Thus, premixed operating modes will always be limited to a
range of engine speeds and loads. Combustion modes, like the one used within this
dissertation’s study, often classified as a ‘late’ injection premixed diesel combustion
(PCI) strategy, are envisioned to be used for the upper portion of the load range covered
by premixed combustion modes, with ‘early’ injection strategies covering the lower
range. Early injection strategies are very similar in nature to the strategy used here,
differing primarily in that they utilize significantly earlier injection timings and increased
EGR levels. The resulting combustion is phased closer to TDC for reduced CO, HC, and
PM emissions and improved efficiency over comparable conventional or late injection
premixed strategies, but uses higher EGR levels to maintain low NOx emissions.
However, noise constraints limit their use to lower engine loads. As load increases
beyond the limits of the early injection premixed strategies, late injection PCI becomes
more advantageous. Eventually, emissions from premixed combustion modes become
excessive and require transition to more conventional diesel strategies for high load
operation.
After studying the fuel effects on the emissions of a premixed diesel combustion
mode at a fixed engine load (5 bar IMEP), the effect on the operable load range is
108
examined to both further determine the effects of fuel type and bring global perspective
and overall context to the project.
6.2 Test Methodology
6.2.1 Test Fuels
The main four fuel test matrix was used for this portion of the work: three US ULSD
certification fuels of varying cetane number (low – 42 CN, medium – 47 CN, high –
50 CN) plus Swedish MK1 (53 CN) diesel fuel. These are abbreviated in figures as LCN,
MCN, HCN, and MK1, respectively. Further discussion, relevant fuel properties, and
distillation curves for the test fuels can be found in Chapter 4, Section 2.1, specifically
Table 4 and Figure 7.
6.2.2 Operating Conditions and Test Procedures
Load testing was conducted starting with the main operating condition used in the
bulk of the work: 1500 rpm with 5 bar IMEP. Engine speed was held constant at 1500
rpm throughout the load sweep. Intake and exhaust manifold absolute pressures were
maintained at 100 kPa and 110 kPa, respectively. The turbocharger on a multi-cylinder
version of this engine would likely be affected by a sweep in load – higher loads yield
higher exhaust energy which could translate to higher boost levels (depending on the
turbocharger boost map and variable geometry turbine control maps). However,
attempting to include this effect dramatically increases the complexity of the study while
further complicating the results. Accordingly, the intake manifold pressures were held
constant for simplicity and to isolate the load trends. Injection pressure was held constant
at 1000 bar through the bulk of the load sweep. However, it was increased as part of a
parametric study of the high load operating condition, the details of which are discussed
later in this section.
EGR mass fraction was maintained at 40% throughout the load sweeps. This does
not, however, indicate that equivalence ratio and intake oxygen concentration were held
constant throughout the tests. In fact, both these parameters vary across load. Since EGR
mass fraction, intake boost level, and engine speed were all held constant while the
fueling was altered, the equivalence ratio varies with fueling (and therefore, engine load).
As a consequence of the changing equivalence ratio, the oxygen concentration within the
109
exhaust gas (and accordingly the EGR flow) varies with load. Given the substantial flow
of EGR, changing the oxygen concentration in the EGR flow alters the intake oxygen
concentration as well, so it too varies with load. Of course, there is some interrelation
between equivalence ratio and intake oxygen concentration. These last two parameters,
equivalence ratio and intake oxygen concentration, are discussed in further detail
(including figures detailing their variation with engine load) within the result discussion
in Section 3.1.
The load sweeps began with the engine operating at the baseline operating load used
in previous portions of this work: 5 bar IMEP. The load was initially decreased from the
5 bar IMEP condition by reducing the injection duration in increments of 20-30 μs. Load
was decreased until a limit was reached – typically combustion stability. Combustion was
viewed as unstable when the COV of IMEP exceeded 4% or the engine began misfiring.
While operating at the 5 bar IMEP condition, injection timing was adjusted so that
combustion noise was at the 90 dB limit (approximate location of CA50: 7 ± 1 °ATDC).
This injection timing was maintained throughout the load decrease.
After reaching the minimum load level, fueling was increased to yield 5 bar IMEP,
and the condition allowed to stabilize for a period of time, with data taken to insure
combustion behavior returned to match the starting conditions. When combustion and
related emissions returned to initial levels, load was increased by extending the duration
of the injection pulsewidth in 20-30 μs increments. However, increasing the injection
duration often leads to increased combustion noise, which was counteracted by retarding
the injection timing to bring the combustion noise back under the 90 dB limit. Load was
increased until one (or more) of the four (very generous) operating limits were reached:
(1) smoke measurements exceeded 2.0 FSN (visible smoke limit), (2) IMEP reached a
maximum level (increasing fueling no longer brought about an increase in load), (3)
hydrocarbon measurements exceeded 1000 ppm-C3, (4) engine began misfiring. The test
was suspended when the engine achieved one or more of these limits (most fuels reached
limits 1-3 simultaneously at a particular load). It is important to note that these are very
generous limits – it was felt that emissions based restrictions would be the load limiting
factor, but that these limits could be applied during data postprocessing following the
conclusion of testing. The justification behind the second and fourth operating limits
110
(peak load, misfire) should be self explanatory. The smoke and hydrocarbon emissions
criteria bear explanation. The smoke limit of 2.0 FSN is a general industry guideline from
historical tests – it is the point where smoke emissions become visible (which was to be
avoided). The use of a particulate filter (DPF) will likely be required to meet the stringent
PM emissions regulations which are part of new regulations. By maintaining smoke
emissions less than 2.0 FSN, particulates are within a range which can be effectively
treated by the DPF. The 1000 ppm-C3 hydrocarbon limit is an arbitrary limit, but HC
emissions of this level are excessive, and will be difficult to convert in a DOC to meet the
regulated standards. It is felt that operating modes producing HC emissions higher than
this are of little utility.
Once a high load limit was achieved, injection timing and injection pressure
adjustments were made to evaluate whether the peak load could be increased or
emissions reduced. Injection timing was retarded by two degrees (advancing the timing
would cause combustion noise to exceed 90 dB), while maintaining other engine
parameters (including injection duration). If the engine was no longer exceeding any of
the set limits, fueling was subsequently increased until a limit was again reached,
establishing a new load limit. A similar procedure was used when injection pressure was
increased to 1200 and 1400 bar. However, with higher injection pressure, the injection
duration was reduced to give initially comparable fueling rates. Further, the injection
timing was retarded, when necessary, to maintain the combustion noise less than 90 dB.
Coupling the data taken from these tests with inferred DOC behavior allows for an
examination of the load range of the utilized combustion mode, analysis of fuel cetane
number effect on this load range, and understanding the critical limits of the combustion
mode.
6.3 Results and Discussion
Examination of emissions behavior is central to this analysis, since engine load limits
are defined primarily by emissions criteria. The primary limiting emissions species are
smoke, HC, and CO. NOx emissions are less relevant to this study as (1) they remain less
than the specified emissions standards throughout the tests, and (2) NOx emissions are a
strong function of combustion phasing, which was not explicitly constant in these load
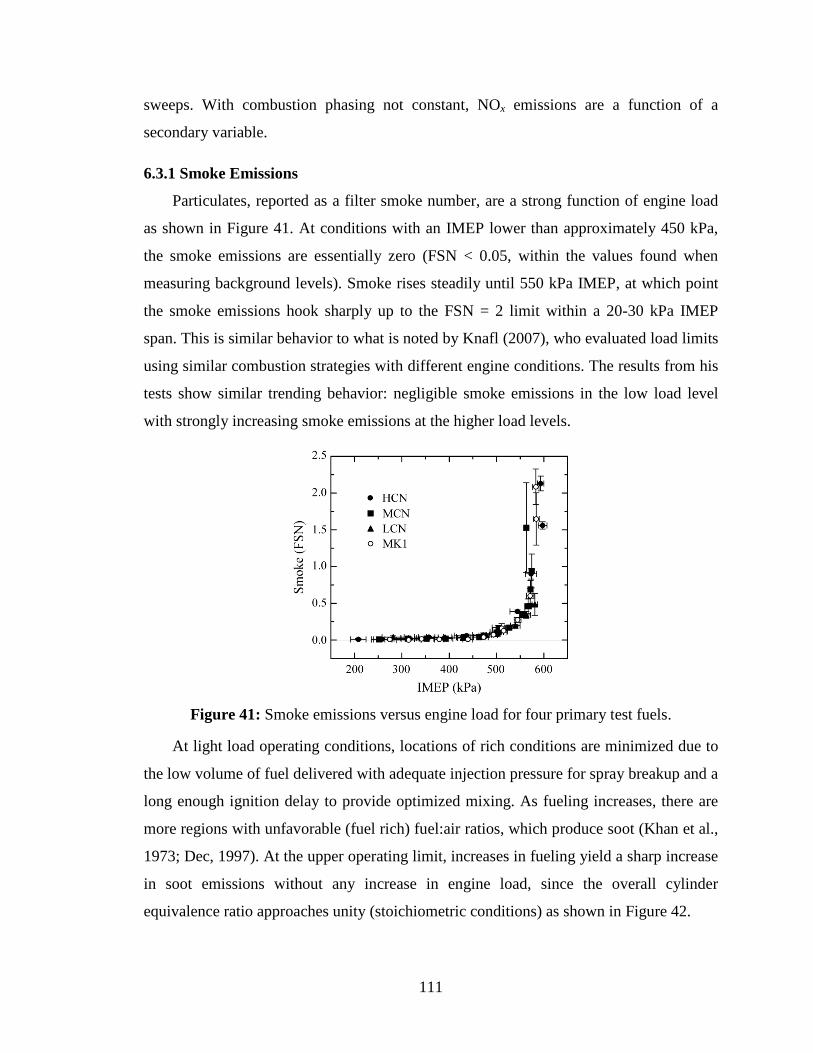
111
sweeps. With combustion phasing not constant, NOx emissions are a function of a
secondary variable.
6.3.1 Smoke Emissions
Particulates, reported as a filter smoke number, are a strong function of engine load
as shown in Figure 41. At conditions with an IMEP lower than approximately 450 kPa,
the smoke emissions are essentially zero (FSN < 0.05, within the values found when
measuring background levels). Smoke rises steadily until 550 kPa IMEP, at which point
the smoke emissions hook sharply up to the FSN = 2 limit within a 20-30 kPa IMEP
span. This is similar behavior to what is noted by Knafl (2007), who evaluated load limits
using similar combustion strategies with different engine conditions. The results from his
tests show similar trending behavior: negligible smoke emissions in the low load level
with strongly increasing smoke emissions at the higher load levels.
Figure 41: Smoke emissions versus engine load for four primary test fuels.
At light load operating conditions, locations of rich conditions are minimized due to
the low volume of fuel delivered with adequate injection pressure for spray breakup and a
long enough ignition delay to provide optimized mixing. As fueling increases, there are
more regions with unfavorable (fuel rich) fuel:air ratios, which produce soot (Khan et al.,
1973; Dec, 1997). At the upper operating limit, increases in fueling yield a sharp increase
in soot emissions without any increase in engine load, since the overall cylinder
equivalence ratio approaches unity (stoichiometric conditions) as shown in Figure 42.
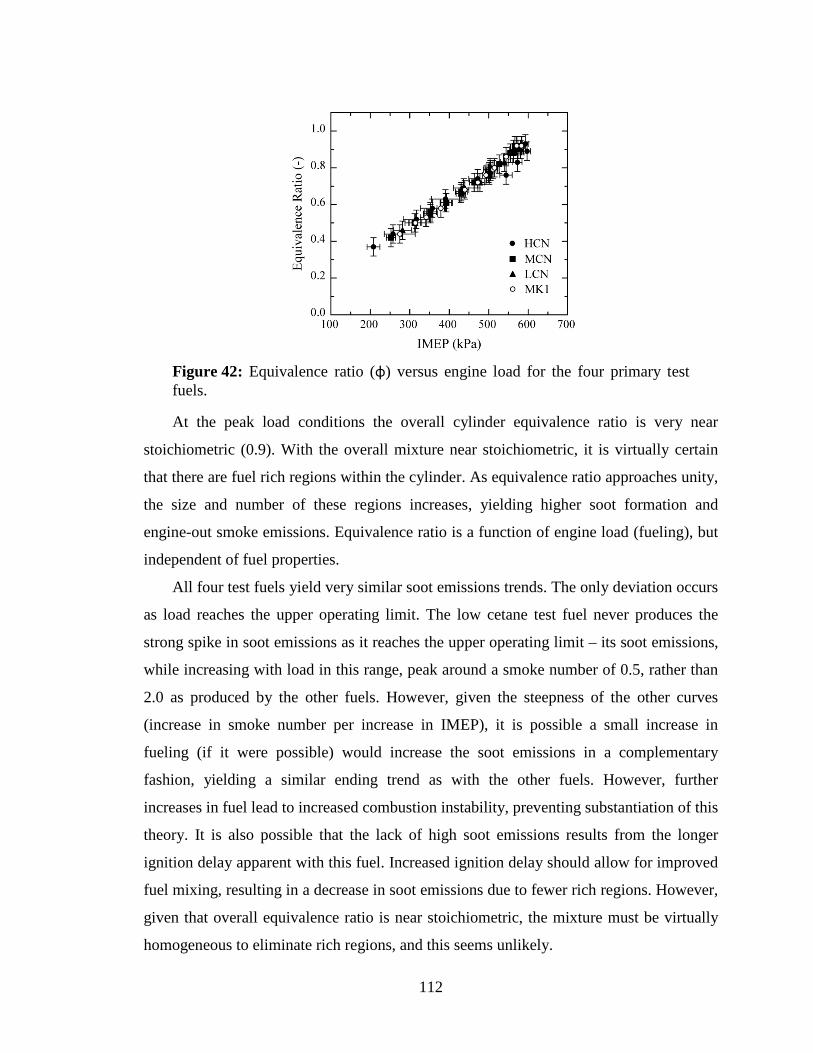
112
Figure 42: Equivalence ratio (φ) versus engine load for the four primary test fuels.
At the peak load conditions the overall cylinder equivalence ratio is very near
stoichiometric (0.9). With the overall mixture near stoichiometric, it is virtually certain
that there are fuel rich regions within the cylinder. As equivalence ratio approaches unity,
the size and number of these regions increases, yielding higher soot formation and
engine-out smoke emissions. Equivalence ratio is a function of engine load (fueling), but
independent of fuel properties.
All four test fuels yield very similar soot emissions trends. The only deviation occurs
as load reaches the upper operating limit. The low cetane test fuel never produces the
strong spike in soot emissions as it reaches the upper operating limit – its soot emissions,
while increasing with load in this range, peak around a smoke number of 0.5, rather than
2.0 as produced by the other fuels. However, given the steepness of the other curves
(increase in smoke number per increase in IMEP), it is possible a small increase in
fueling (if it were possible) would increase the soot emissions in a complementary
fashion, yielding a similar ending trend as with the other fuels. However, further
increases in fuel lead to increased combustion instability, preventing substantiation of this
theory. It is also possible that the lack of high soot emissions results from the longer
ignition delay apparent with this fuel. Increased ignition delay should allow for improved
fuel mixing, resulting in a decrease in soot emissions due to fewer rich regions. However,
given that overall equivalence ratio is near stoichiometric, the mixture must be virtually
homogeneous to eliminate rich regions, and this seems unlikely.
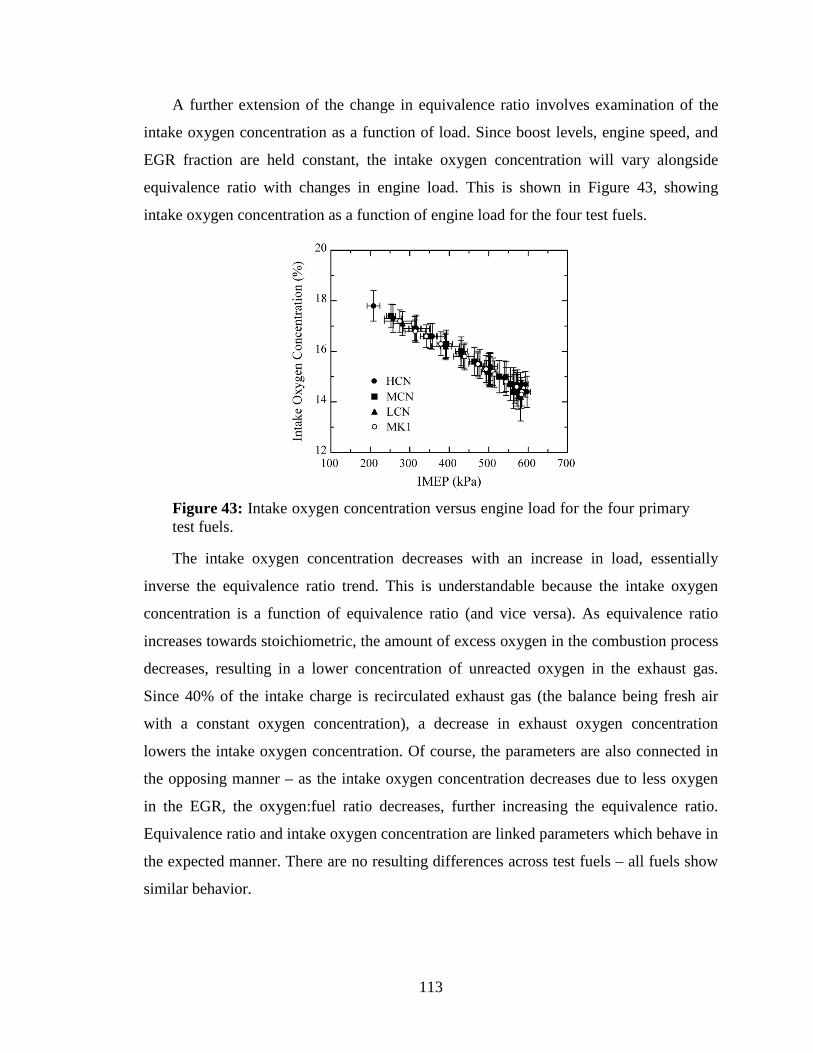
113
A further extension of the change in equivalence ratio involves examination of the
intake oxygen concentration as a function of load. Since boost levels, engine speed, and
EGR fraction are held constant, the intake oxygen concentration will vary alongside
equivalence ratio with changes in engine load. This is shown in Figure 43, showing
intake oxygen concentration as a function of engine load for the four test fuels.
Figure 43: Intake oxygen concentration versus engine load for the four primary test fuels.
The intake oxygen concentration decreases with an increase in load, essentially
inverse the equivalence ratio trend. This is understandable because the intake oxygen
concentration is a function of equivalence ratio (and vice versa). As equivalence ratio
increases towards stoichiometric, the amount of excess oxygen in the combustion process
decreases, resulting in a lower concentration of unreacted oxygen in the exhaust gas.
Since 40% of the intake charge is recirculated exhaust gas (the balance being fresh air
with a constant oxygen concentration), a decrease in exhaust oxygen concentration
lowers the intake oxygen concentration. Of course, the parameters are also connected in
the opposing manner – as the intake oxygen concentration decreases due to less oxygen
in the EGR, the oxygen:fuel ratio decreases, further increasing the equivalence ratio.
Equivalence ratio and intake oxygen concentration are linked parameters which behave in
the expected manner. There are no resulting differences across test fuels – all fuels show
similar behavior.
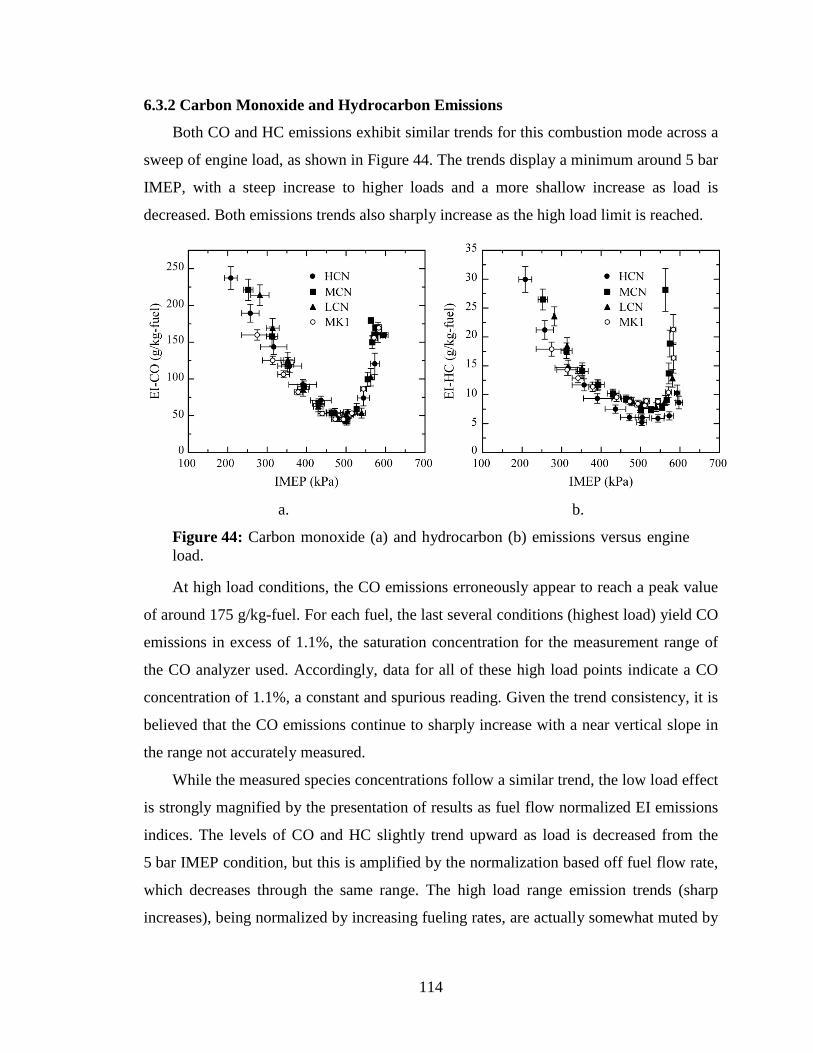
114
6.3.2 Carbon Monoxide and Hydrocarbon Emissions
Both CO and HC emissions exhibit similar trends for this combustion mode across a
sweep of engine load, as shown in Figure 44. The trends display a minimum around 5 bar
IMEP, with a steep increase to higher loads and a more shallow increase as load is
decreased. Both emissions trends also sharply increase as the high load limit is reached.
a. b.
Figure 44: Carbon monoxide (a) and hydrocarbon (b) emissions versus engine load.
At high load conditions, the CO emissions erroneously appear to reach a peak value
of around 175 g/kg-fuel. For each fuel, the last several conditions (highest load) yield CO
emissions in excess of 1.1%, the saturation concentration for the measurement range of
the CO analyzer used. Accordingly, data for all of these high load points indicate a CO
concentration of 1.1%, a constant and spurious reading. Given the trend consistency, it is
believed that the CO emissions continue to sharply increase with a near vertical slope in
the range not accurately measured.
While the measured species concentrations follow a similar trend, the low load effect
is strongly magnified by the presentation of results as fuel flow normalized EI emissions
indices. The levels of CO and HC slightly trend upward as load is decreased from the
5 bar IMEP condition, but this is amplified by the normalization based off fuel flow rate,
which decreases through the same range. The high load range emission trends (sharp
increases), being normalized by increasing fueling rates, are actually somewhat muted by
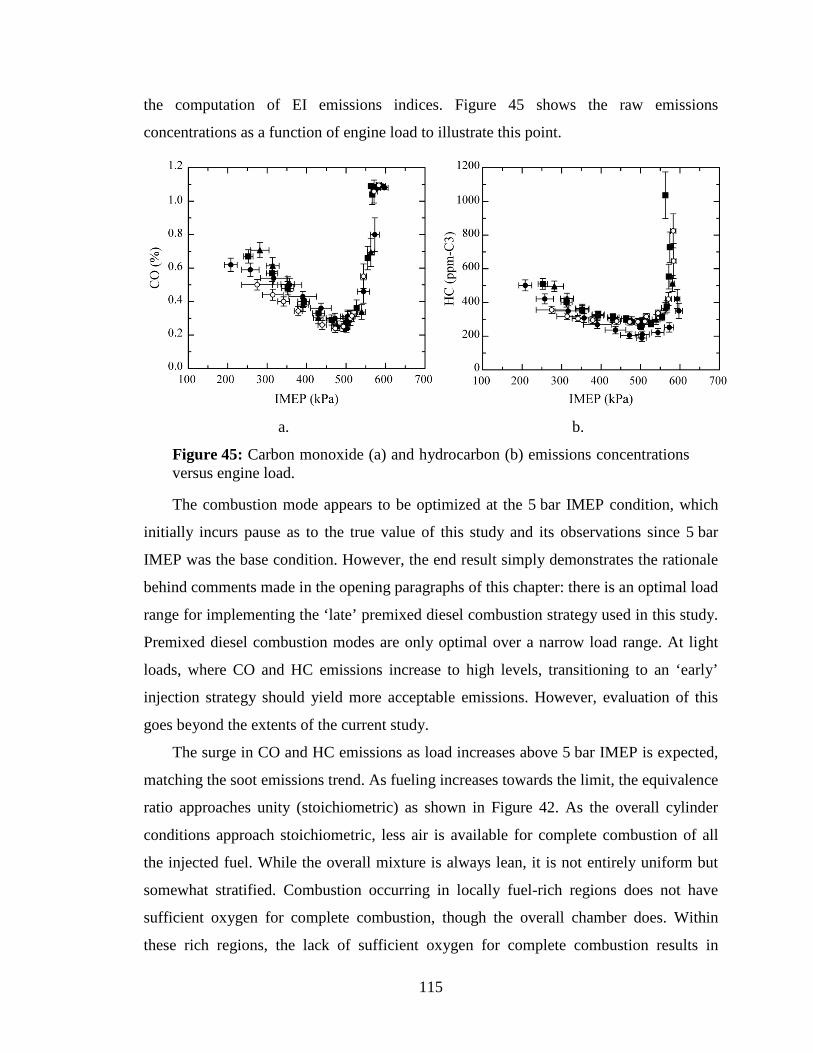
115
the computation of EI emissions indices. Figure 45 shows the raw emissions
concentrations as a function of engine load to illustrate this point.
a. b.
Figure 45: Carbon monoxide (a) and hydrocarbon (b) emissions concentrations versus engine load.
The combustion mode appears to be optimized at the 5 bar IMEP condition, which
initially incurs pause as to the true value of this study and its observations since 5 bar
IMEP was the base condition. However, the end result simply demonstrates the rationale
behind comments made in the opening paragraphs of this chapter: there is an optimal load
range for implementing the ‘late’ premixed diesel combustion strategy used in this study.
Premixed diesel combustion modes are only optimal over a narrow load range. At light
loads, where CO and HC emissions increase to high levels, transitioning to an ‘early’
injection strategy should yield more acceptable emissions. However, evaluation of this
goes beyond the extents of the current study.
The surge in CO and HC emissions as load increases above 5 bar IMEP is expected,
matching the soot emissions trend. As fueling increases towards the limit, the equivalence
ratio approaches unity (stoichiometric) as shown in Figure 42. As the overall cylinder
conditions approach stoichiometric, less air is available for complete combustion of all
the injected fuel. While the overall mixture is always lean, it is not entirely uniform but
somewhat stratified. Combustion occurring in locally fuel-rich regions does not have
sufficient oxygen for complete combustion, though the overall chamber does. Within
these rich regions, the lack of sufficient oxygen for complete combustion results in
116
products of partial combustion: CO, HC, and PM emissions. All three of these emissions
can be tied to incomplete fuel oxidation (CO is an incompletely oxidized combustion
product, HC is unburned and partially burned fuel, and soot is pyrolyzed fuel).
Moreover, as load increases, combustion phasing is retarded, from both a shift due
to the increased quantity of fuel combusted, and injection timing retards used to hold
combustion noise under 90 dB. Combustion phasing is shifted due to increased fueling,
because the heat release curve follows a similar initial trajectory, only extending higher
and longer due to the higher level of heat output from the increased fueling. Accordingly,
combustion phasing is retarded as well. Recalling results presented in Chapter 4, both CO
and HC emissions increase with a retard in combustion phasing.
As the load decreases below 5 bar IMEP, CO and HC emissions also increase. As
engine load decreases from reduced fueling, the combustion temperature decreases as
well. As noted within the classic equivalence ratio versus temperature plot (Kook et al.,
2005), this moves combustion into a region of increased CO production. As equivalence
ratio drops, there is also increased risk of overmixing, creating regions where the fuel-air
mixture is too lean for ignition (overleaning). The ensuing lack of combustion results in
increased HC emissions. Additionally, the combustion is phased later in the cycle than
would be optimum. Recalling results presented in earlier chapters, both CO and HC
emissions increase with a retard in combustion phasing. However, the NOx emissions are
close enough to the limits that advancing the combustion phasing forward would result in
NOx emissions exceeding the acceptable limits. To operate effectively with low
emissions in this range requires significantly advancing the injection timing – the result
of which is ‘early’ premixed diesel combustion. However, to effectively utilize
dramatically advanced fuel injections, different levels of EGR are normally used, which
substantially change the combustion conditions.
6.3.3 Peak Load Levels
As discussed in the preceding section, all three primary load function emissions
(soot, CO, HC) increase sharply at similar load levels. The trends indicate that as fueling
is increased beyond this point, higher engine load will not result but emissions will
continue to increase. Effectively, the slope of the emissions trend versus engine load
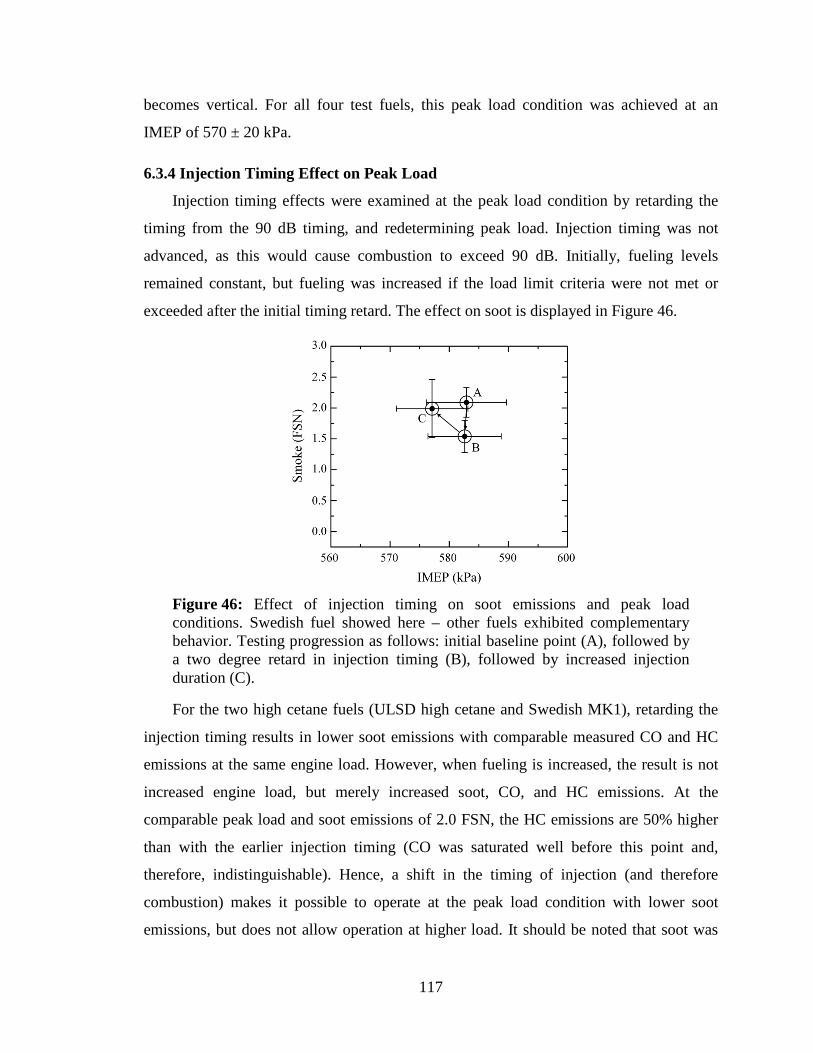
117
becomes vertical. For all four test fuels, this peak load condition was achieved at an
IMEP of 570 ± 20 kPa.
6.3.4 Injection Timing Effect on Peak Load
Injection timing effects were examined at the peak load condition by retarding the
timing from the 90 dB timing, and redetermining peak load. Injection timing was not
advanced, as this would cause combustion to exceed 90 dB. Initially, fueling levels
remained constant, but fueling was increased if the load limit criteria were not met or
exceeded after the initial timing retard. The effect on soot is displayed in Figure 46.
Figure 46: Effect of injection timing on soot emissions and peak load conditions. Swedish fuel showed here – other fuels exhibited complementary behavior. Testing progression as follows: initial baseline point (A), followed by a two degree retard in injection timing (B), followed by increased injection duration (C).
For the two high cetane fuels (ULSD high cetane and Swedish MK1), retarding the
injection timing results in lower soot emissions with comparable measured CO and HC
emissions at the same engine load. However, when fueling is increased, the result is not
increased engine load, but merely increased soot, CO, and HC emissions. At the
comparable peak load and soot emissions of 2.0 FSN, the HC emissions are 50% higher
than with the earlier injection timing (CO was saturated well before this point and,
therefore, indistinguishable). Hence, a shift in the timing of injection (and therefore
combustion) makes it possible to operate at the peak load condition with lower soot
emissions, but does not allow operation at higher load. It should be noted that soot was
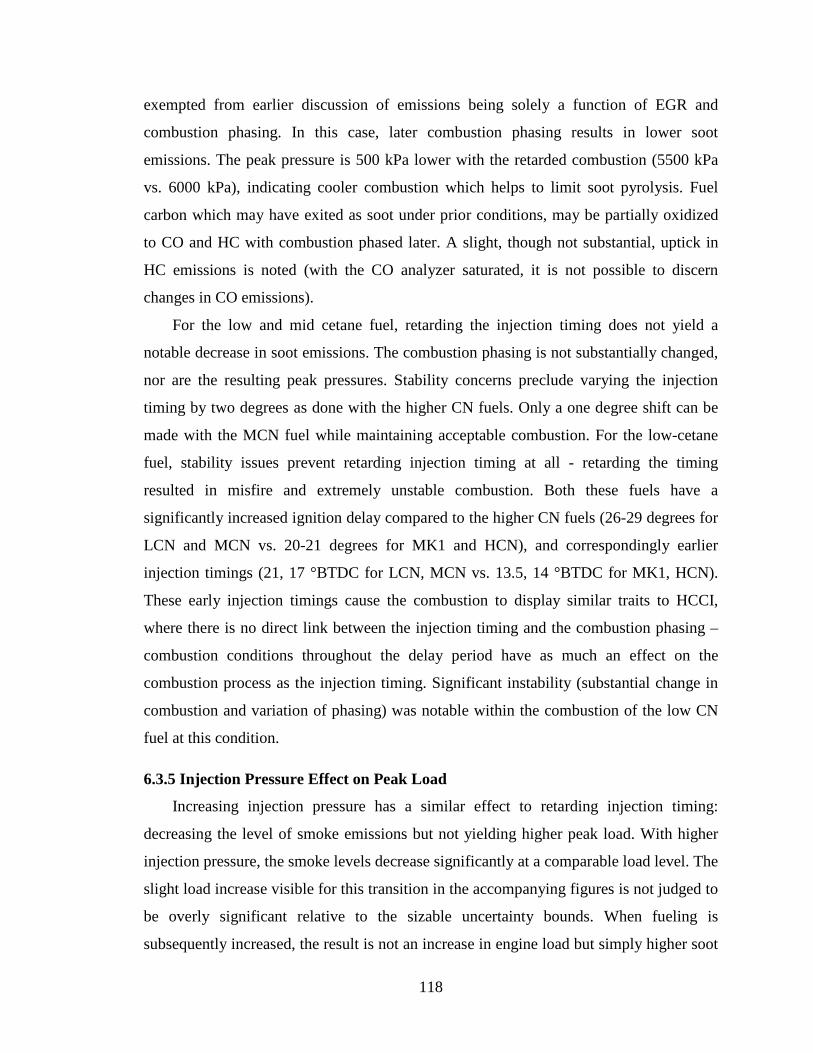
118
exempted from earlier discussion of emissions being solely a function of EGR and
combustion phasing. In this case, later combustion phasing results in lower soot
emissions. The peak pressure is 500 kPa lower with the retarded combustion (5500 kPa
vs. 6000 kPa), indicating cooler combustion which helps to limit soot pyrolysis. Fuel
carbon which may have exited as soot under prior conditions, may be partially oxidized
to CO and HC with combustion phased later. A slight, though not substantial, uptick in
HC emissions is noted (with the CO analyzer saturated, it is not possible to discern
changes in CO emissions).
For the low and mid cetane fuel, retarding the injection timing does not yield a
notable decrease in soot emissions. The combustion phasing is not substantially changed,
nor are the resulting peak pressures. Stability concerns preclude varying the injection
timing by two degrees as done with the higher CN fuels. Only a one degree shift can be
made with the MCN fuel while maintaining acceptable combustion. For the low-cetane
fuel, stability issues prevent retarding injection timing at all - retarding the timing
resulted in misfire and extremely unstable combustion. Both these fuels have a
significantly increased ignition delay compared to the higher CN fuels (26-29 degrees for
LCN and MCN vs. 20-21 degrees for MK1 and HCN), and correspondingly earlier
injection timings (21, 17 °BTDC for LCN, MCN vs. 13.5, 14 °BTDC for MK1, HCN).
These early injection timings cause the combustion to display similar traits to HCCI,
where there is no direct link between the injection timing and the combustion phasing –
combustion conditions throughout the delay period have as much an effect on the
combustion process as the injection timing. Significant instability (substantial change in
combustion and variation of phasing) was notable within the combustion of the low CN
fuel at this condition.
6.3.5 Injection Pressure Effect on Peak Load
Increasing injection pressure has a similar effect to retarding injection timing:
decreasing the level of smoke emissions but not yielding higher peak load. With higher
injection pressure, the smoke levels decrease significantly at a comparable load level. The
slight load increase visible for this transition in the accompanying figures is not judged to
be overly significant relative to the sizable uncertainty bounds. When fueling is
subsequently increased, the result is not an increase in engine load but simply higher soot
119
emissions. This behavior is consistent for all four fuels, for injection pressures of 1200
and 1400 bar. The effect is shown for one fuel, Swedish MK1, in Figure 47.
Figure 47: Effect of injection pressure on soot emissions and peak load conditions. Swedish fuel showed here – all other fuels exhibited complementary behavior. Point A is baseline peak load condition taken at 1000 bar injection pressure. Points B-D used 1200 bar injection pressure, while points C-E-F used 1400 bar injection pressure. Testing progression as follows: initial point (A), increases injection pressure (B, C), increased injection duration (D, E-F).
Tests decreasing the injection pressure to less than 1000 bar was not conducted, as
prior injection pressure sweeps at 5 bar IMEP show decreasing injection pressure below a
certain value (1000 bar in those cases) causes a substantial increase in soot emissions.
Since soot levels were already at the limit, making an adjustment previously shown to
increase soot emissions was judged to be of little utility.
Increasing injection pressure decreases the soot emissions by improving the spray
breakup, enhancing the in-cylinder mixing processes and decreasing the quantity of
locally rich regions within the cylinder. While global cylinder average temperatures
remain reasonably low and the mixture overall is still lean, the in-cylinder mixture is still
rather inhomogeneous, and soot forms in the localized rich regions. The low cylinder
temperatures prevent substantial post flame soot oxidation, so most soot formed during
combustion remains and exits in the exhaust. Enhancing the mixing process by increasing
injection pressure reduces these local rich regions and the resulting soot production.
120
6.3.6 Peak Load Limitations
From the above noted effects, there seem to be two principal factors limiting the
operating range: cylinder mixing conditions partially dictating emissions, and overall
equivalence ratio dictating peak producible load and partially dictating emissions as well.
Increasing peak engine load requires addressing both concerns.
CO, HC, and soot emissions all increase dramatically at higher loads. Various
strategies can be used to enhance the mixing process to reduce these emissions. Common
strategies include increasing the injection pressure (as demonstrated in this study),
increasing the number of holes in the injector nozzle (Alkidas, 1988), increasing cylinder
turbulence by increasing chamber swirl/tumble (Khan et al., 1972) or using a turbulence
sustaining/enhancing combustion chamber shape (Williams and Tindal, 1980).
Across parameter tests, engine load always peaks at a similar point (in these tests, an
IMEP of 570 ± 20 kPa) and is unresponsive to increases in fueling. This suggests a
fundamental limitation of the condition, which is not dependent on any of the tested
variables. The test variables (fuel CN, injection pressure and timing) are all related to the
fuel side of the combustion process. The primary limitation on load results from the air
side of the process – fueling is limited by the amount of air within the cylinder and
maximum equivalence ratios. Examining the equivalence ratios indicates that combustion
is lean overall, but at high loads is moving disconcertingly close to stoichiometric ratios.
The closer the overall process is to stoichiometric, the more likely there are to be regions
of locally rich equivalence ratios which form CO, HC, and PM. Increasing intake
pressure increases the quantity of air within the cylinder, decreasing the overall air:fuel
ratio, and improving the volumetric efficiency of the engine. More air mass within the
cylinder allows higher fueling levels at the limiting equivalence ratio, resulting in
increased energy release, and therefore increased load. A quick test was conducted with
lightly boosted intake conditions (130 kPa intake MAP, maintaining a 10 kPa exhaust to
intake differential for EGR flow) which confirm that boosting the intake pressure results
in higher peak load, as shown in Figure 48 (a). This small increase in intake pressure
leads to a 15% increase in load range. At the peak load conditions, the equivalence ratio
was 0.85 ± 0.05, essentially the same as the equivalence ratio at the smoke limit for the
lower intake pressure condition (0.90 ± 0.05).
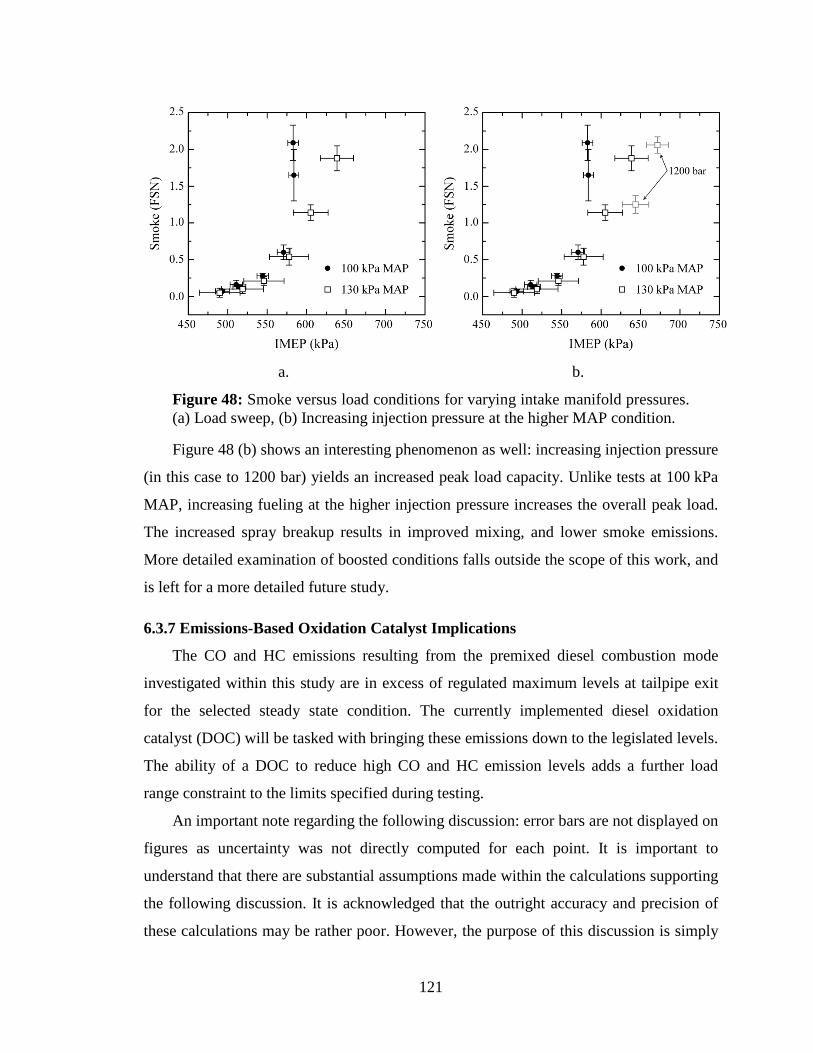
121
a. b.
Figure 48: Smoke versus load conditions for varying intake manifold pressures. (a) Load sweep, (b) Increasing injection pressure at the higher MAP condition.
Figure 48 (b) shows an interesting phenomenon as well: increasing injection pressure
(in this case to 1200 bar) yields an increased peak load capacity. Unlike tests at 100 kPa
MAP, increasing fueling at the higher injection pressure increases the overall peak load.
The increased spray breakup results in improved mixing, and lower smoke emissions.
More detailed examination of boosted conditions falls outside the scope of this work, and
is left for a more detailed future study.
6.3.7 Emissions-Based Oxidation Catalyst Implications
The CO and HC emissions resulting from the premixed diesel combustion mode
investigated within this study are in excess of regulated maximum levels at tailpipe exit
for the selected steady state condition. The currently implemented diesel oxidation
catalyst (DOC) will be tasked with bringing these emissions down to the legislated levels.
The ability of a DOC to reduce high CO and HC emission levels adds a further load
range constraint to the limits specified during testing.
An important note regarding the following discussion: error bars are not displayed on
figures as uncertainty was not directly computed for each point. It is important to
understand that there are substantial assumptions made within the calculations supporting
the following discussion. It is acknowledged that the outright accuracy and precision of
these calculations may be rather poor. However, the purpose of this discussion is simply
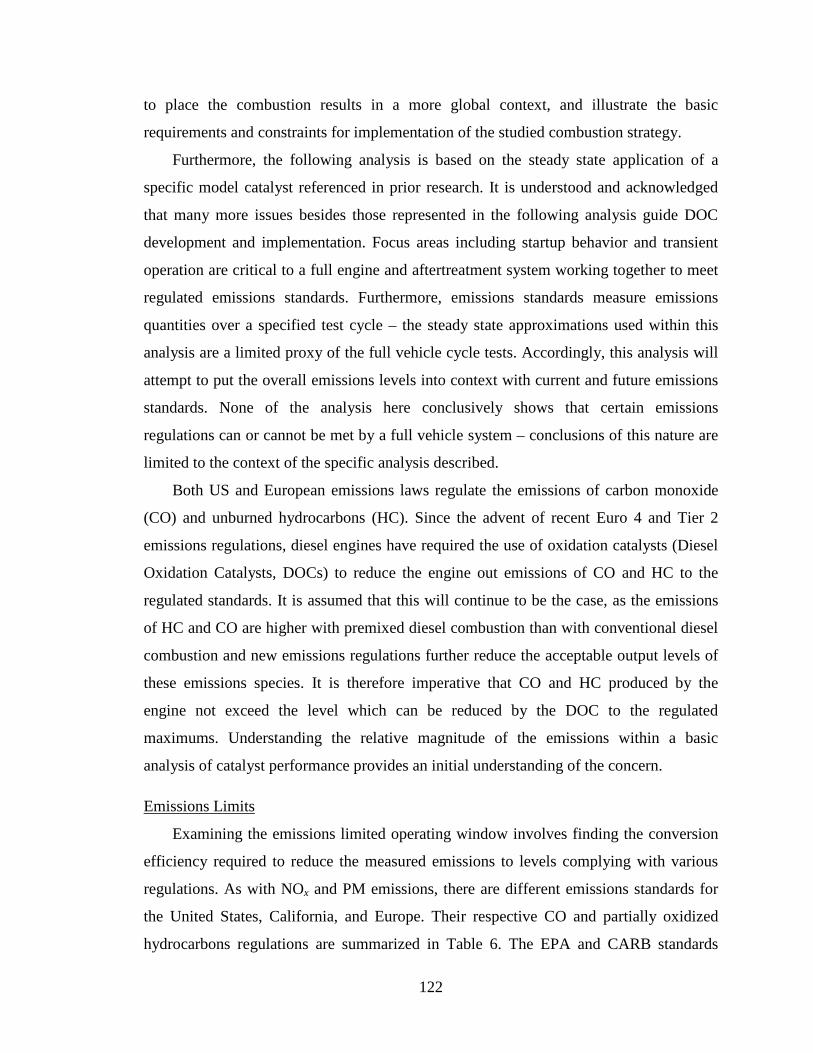
122
to place the combustion results in a more global context, and illustrate the basic
requirements and constraints for implementation of the studied combustion strategy.
Furthermore, the following analysis is based on the steady state application of a
specific model catalyst referenced in prior research. It is understood and acknowledged
that many more issues besides those represented in the following analysis guide DOC
development and implementation. Focus areas including startup behavior and transient
operation are critical to a full engine and aftertreatment system working together to meet
regulated emissions standards. Furthermore, emissions standards measure emissions
quantities over a specified test cycle – the steady state approximations used within this
analysis are a limited proxy of the full vehicle cycle tests. Accordingly, this analysis will
attempt to put the overall emissions levels into context with current and future emissions
standards. None of the analysis here conclusively shows that certain emissions
regulations can or cannot be met by a full vehicle system – conclusions of this nature are
limited to the context of the specific analysis described.
Both US and European emissions laws regulate the emissions of carbon monoxide
(CO) and unburned hydrocarbons (HC). Since the advent of recent Euro 4 and Tier 2
emissions regulations, diesel engines have required the use of oxidation catalysts (Diesel
Oxidation Catalysts, DOCs) to reduce the engine out emissions of CO and HC to the
regulated standards. It is assumed that this will continue to be the case, as the emissions
of HC and CO are higher with premixed diesel combustion than with conventional diesel
combustion and new emissions regulations further reduce the acceptable output levels of
these emissions species. It is therefore imperative that CO and HC produced by the
engine not exceed the level which can be reduced by the DOC to the regulated
maximums. Understanding the relative magnitude of the emissions within a basic
analysis of catalyst performance provides an initial understanding of the concern.
Emissions Limits
Examining the emissions limited operating window involves finding the conversion
efficiency required to reduce the measured emissions to levels complying with various
regulations. As with NOx and PM emissions, there are different emissions standards for
the United States, California, and Europe. Their respective CO and partially oxidized
hydrocarbons regulations are summarized in Table 6. The EPA and CARB standards
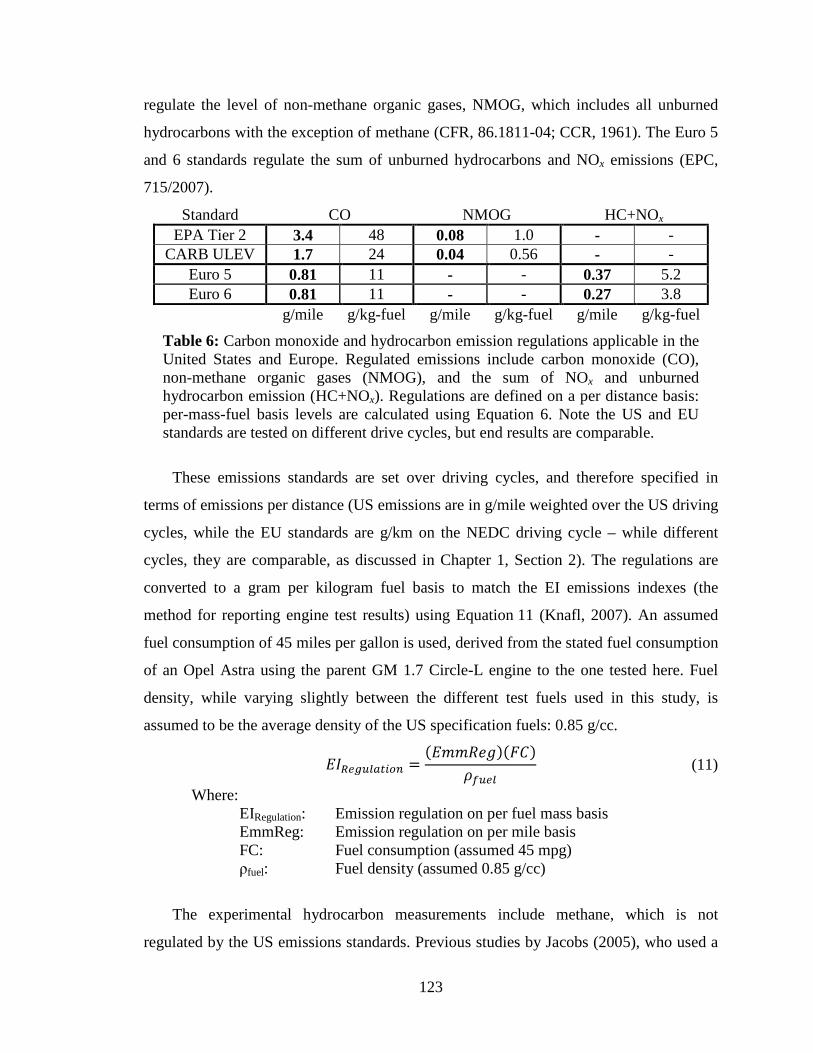
123
regulate the level of non-methane organic gases, NMOG, which includes all unburned
hydrocarbons with the exception of methane (CFR, 86.1811-04; CCR, 1961). The Euro 5
and 6 standards regulate the sum of unburned hydrocarbons and NOx emissions (EPC,
715/2007).
Standard CO NMOG HC+NOx EPA Tier 2 3.4 48 0.08 1.0 - -
CARB ULEV 1.7 24 0.04 0.56 - - Euro 5 0.81 11 - - 0.37 5.2 Euro 6 0.81 11 - - 0.27 3.8
g/mile g/kg-fuel g/mile g/kg-fuel g/mile g/kg-fuel
Table 6: Carbon monoxide and hydrocarbon emission regulations applicable in the United States and Europe. Regulated emissions include carbon monoxide (CO), non-methane organic gases (NMOG), and the sum of NOx and unburned hydrocarbon emission (HC+NOx). Regulations are defined on a per distance basis: per-mass-fuel basis levels are calculated using Equation 6. Note the US and EU standards are tested on different drive cycles, but end results are comparable.
These emissions standards are set over driving cycles, and therefore specified in
terms of emissions per distance (US emissions are in g/mile weighted over the US driving
cycles, while the EU standards are g/km on the NEDC driving cycle – while different
cycles, they are comparable, as discussed in Chapter 1, Section 2). The regulations are
converted to a gram per kilogram fuel basis to match the EI emissions indexes (the
method for reporting engine test results) using Equation 11 (Knafl, 2007). An assumed
fuel consumption of 45 miles per gallon is used, derived from the stated fuel consumption
of an Opel Astra using the parent GM 1.7 Circle-L engine to the one tested here. Fuel
density, while varying slightly between the different test fuels used in this study, is
assumed to be the average density of the US specification fuels: 0.85 g/cc.
(11)
Where: EIRegulation: Emission regulation on per fuel mass basis EmmReg: Emission regulation on per mile basis FC: Fuel consumption (assumed 45 mpg) ρfuel: Fuel density (assumed 0.85 g/cc)
The experimental hydrocarbon measurements include methane, which is not
regulated by the US emissions standards. Previous studies by Jacobs (2005), who used a
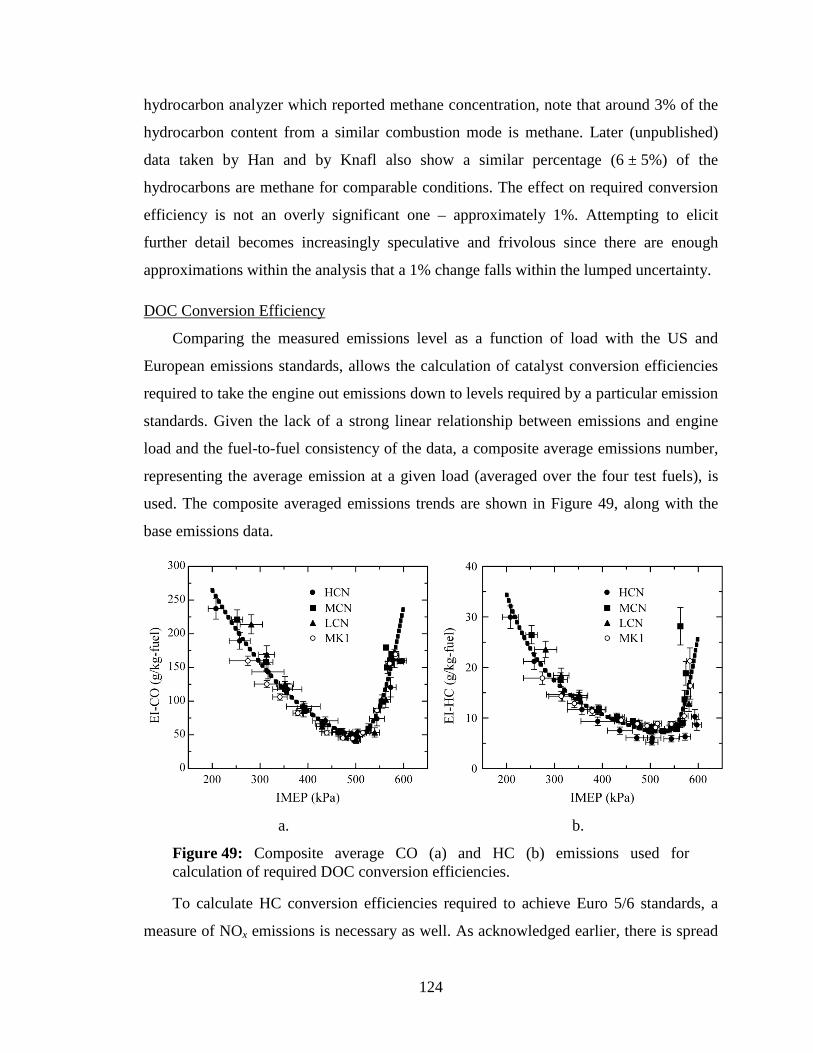
124
hydrocarbon analyzer which reported methane concentration, note that around 3% of the
hydrocarbon content from a similar combustion mode is methane. Later (unpublished)
data taken by Han and by Knafl also show a similar percentage (6 ± 5%) of the
hydrocarbons are methane for comparable conditions. The effect on required conversion
efficiency is not an overly significant one – approximately 1%. Attempting to elicit
further detail becomes increasingly speculative and frivolous since there are enough
approximations within the analysis that a 1% change falls within the lumped uncertainty.
DOC Conversion Efficiency
Comparing the measured emissions level as a function of load with the US and
European emissions standards, allows the calculation of catalyst conversion efficiencies
required to take the engine out emissions down to levels required by a particular emission
standards. Given the lack of a strong linear relationship between emissions and engine
load and the fuel-to-fuel consistency of the data, a composite average emissions number,
representing the average emission at a given load (averaged over the four test fuels), is
used. The composite averaged emissions trends are shown in Figure 49, along with the
base emissions data.
a. b.
Figure 49: Composite average CO (a) and HC (b) emissions used for calculation of required DOC conversion efficiencies.
To calculate HC conversion efficiencies required to achieve Euro 5/6 standards, a
measure of NOx emissions is necessary as well. As acknowledged earlier, there is spread
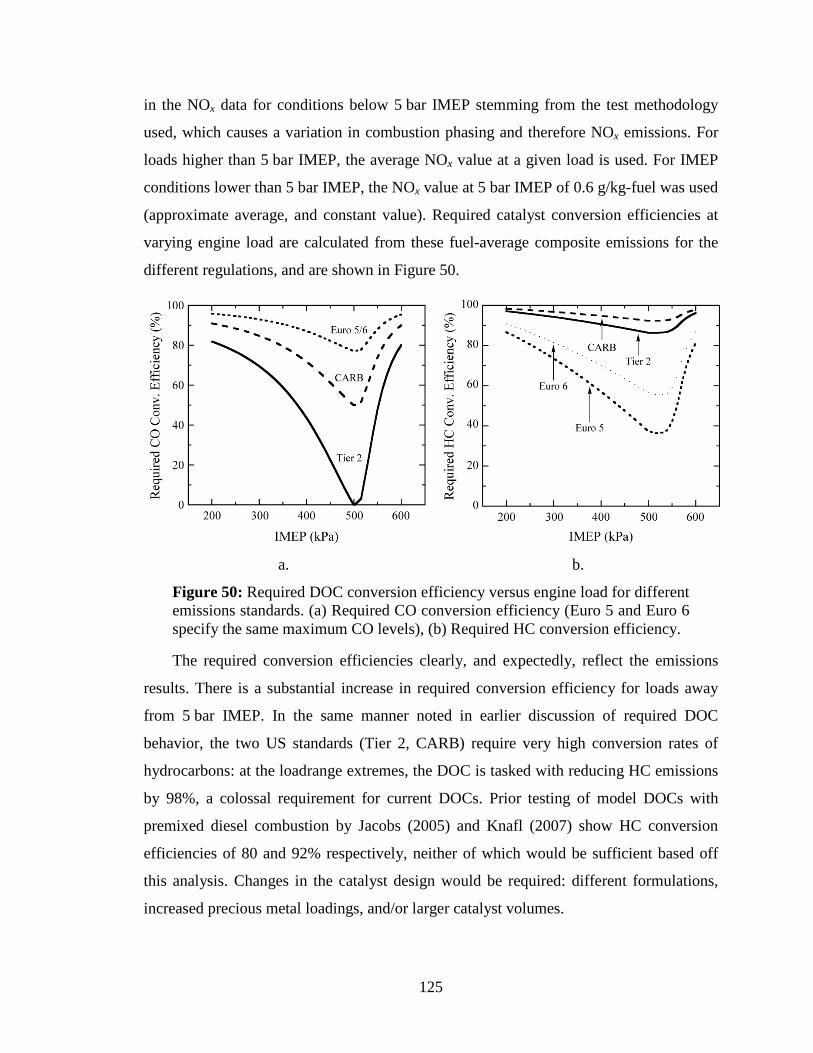
125
in the NOx data for conditions below 5 bar IMEP stemming from the test methodology
used, which causes a variation in combustion phasing and therefore NOx emissions. For
loads higher than 5 bar IMEP, the average NOx value at a given load is used. For IMEP
conditions lower than 5 bar IMEP, the NOx value at 5 bar IMEP of 0.6 g/kg-fuel was used
(approximate average, and constant value). Required catalyst conversion efficiencies at
varying engine load are calculated from these fuel-average composite emissions for the
different regulations, and are shown in Figure 50.
a. b.
Figure 50: Required DOC conversion efficiency versus engine load for different emissions standards. (a) Required CO conversion efficiency (Euro 5 and Euro 6 specify the same maximum CO levels), (b) Required HC conversion efficiency.
The required conversion efficiencies clearly, and expectedly, reflect the emissions
results. There is a substantial increase in required conversion efficiency for loads away
from 5 bar IMEP. In the same manner noted in earlier discussion of required DOC
behavior, the two US standards (Tier 2, CARB) require very high conversion rates of
hydrocarbons: at the loadrange extremes, the DOC is tasked with reducing HC emissions
by 98%, a colossal requirement for current DOCs. Prior testing of model DOCs with
premixed diesel combustion by Jacobs (2005) and Knafl (2007) show HC conversion
efficiencies of 80 and 92% respectively, neither of which would be sufficient based off
this analysis. Changes in the catalyst design would be required: different formulations,
increased precious metal loadings, and/or larger catalyst volumes.
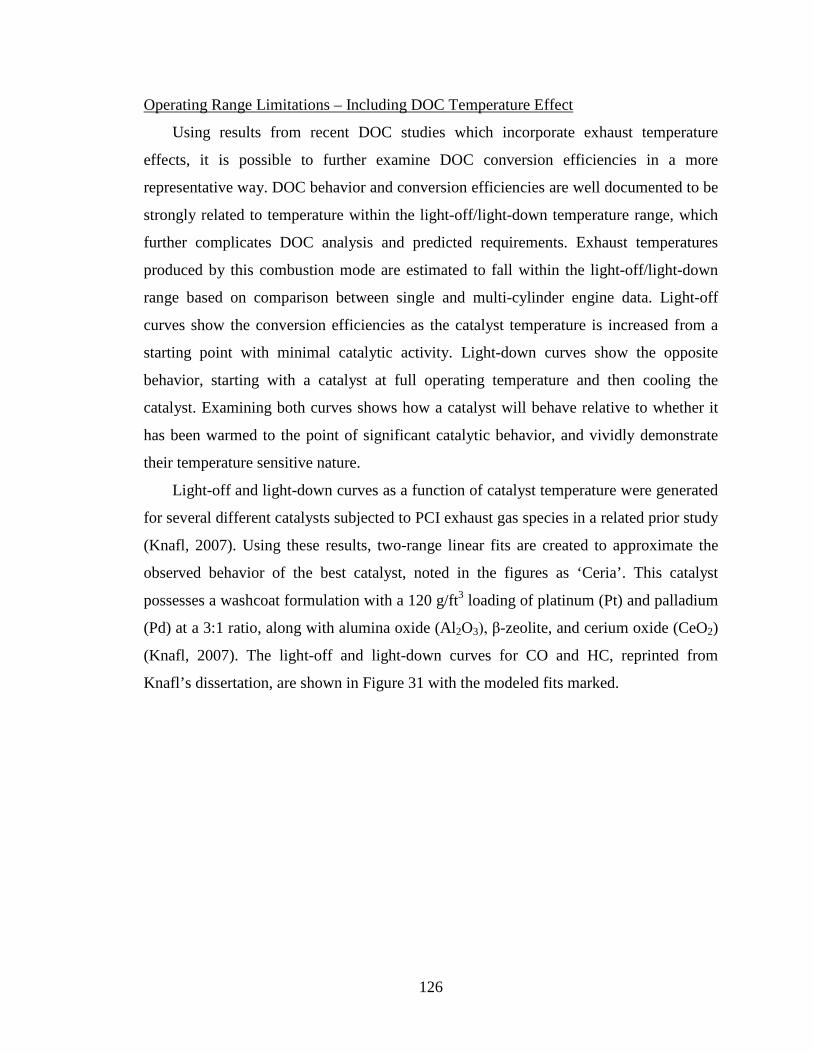
126
Operating Range Limitations – Including DOC Temperature Effect
Using results from recent DOC studies which incorporate exhaust temperature
effects, it is possible to further examine DOC conversion efficiencies in a more
representative way. DOC behavior and conversion efficiencies are well documented to be
strongly related to temperature within the light-off/light-down temperature range, which
further complicates DOC analysis and predicted requirements. Exhaust temperatures
produced by this combustion mode are estimated to fall within the light-off/light-down
range based on comparison between single and multi-cylinder engine data. Light-off
curves show the conversion efficiencies as the catalyst temperature is increased from a
starting point with minimal catalytic activity. Light-down curves show the opposite
behavior, starting with a catalyst at full operating temperature and then cooling the
catalyst. Examining both curves shows how a catalyst will behave relative to whether it
has been warmed to the point of significant catalytic behavior, and vividly demonstrate
their temperature sensitive nature.
Light-off and light-down curves as a function of catalyst temperature were generated
for several different catalysts subjected to PCI exhaust gas species in a related prior study
(Knafl, 2007). Using these results, two-range linear fits are created to approximate the
observed behavior of the best catalyst, noted in the figures as ‘Ceria’. This catalyst
possesses a washcoat formulation with a 120 g/ft3 loading of platinum (Pt) and palladium
(Pd) at a 3:1 ratio, along with alumina oxide (Al2O3), β-zeolite, and cerium oxide (CeO2)
(Knafl, 2007). The light-off and light-down curves for CO and HC, reprinted from
Knafl’s dissertation, are shown in Figure 31 with the modeled fits marked.
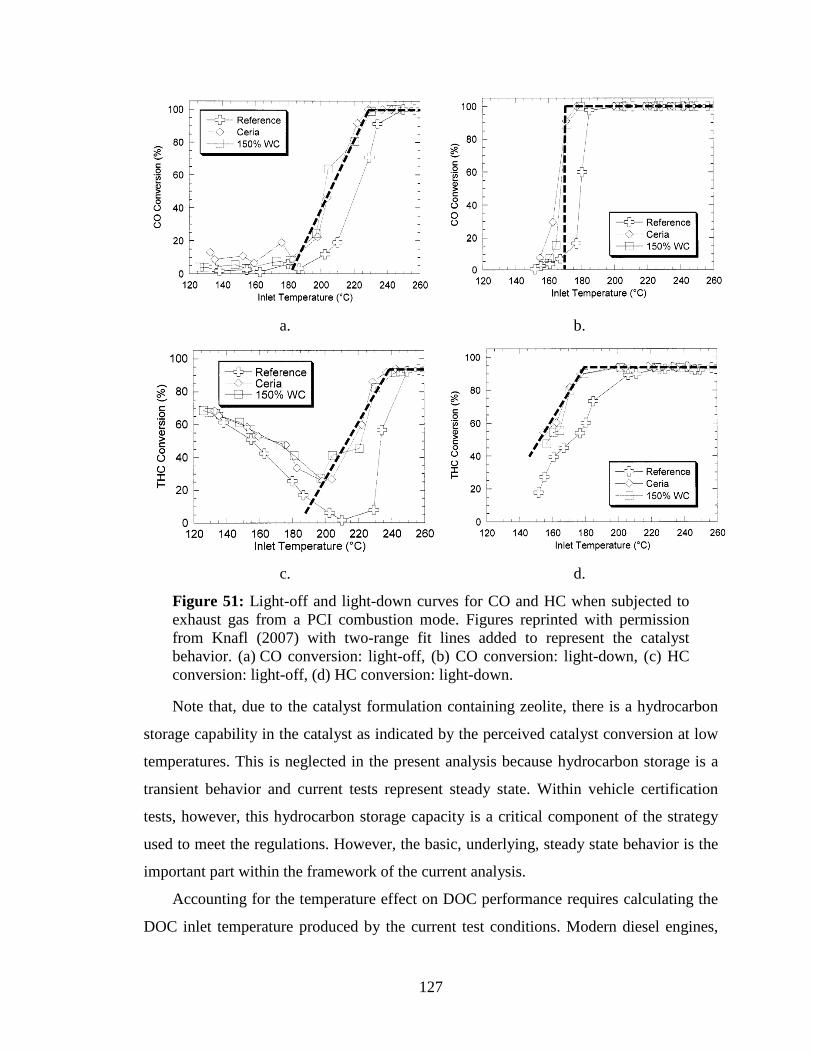
127
a. b.
c. d.
Figure 51: Light-off and light-down curves for CO and HC when subjected to exhaust gas from a PCI combustion mode. Figures reprinted with permission from Knafl (2007) with two-range fit lines added to represent the catalyst behavior. (a) CO conversion: light-off, (b) CO conversion: light-down, (c) HC conversion: light-off, (d) HC conversion: light-down.
Note that, due to the catalyst formulation containing zeolite, there is a hydrocarbon
storage capability in the catalyst as indicated by the perceived catalyst conversion at low
temperatures. This is neglected in the present analysis because hydrocarbon storage is a
transient behavior and current tests represent steady state. Within vehicle certification
tests, however, this hydrocarbon storage capacity is a critical component of the strategy
used to meet the regulations. However, the basic, underlying, steady state behavior is the
important part within the framework of the current analysis.
Accounting for the temperature effect on DOC performance requires calculating the
DOC inlet temperature produced by the current test conditions. Modern diesel engines,
128
including the production version of the GM 1.7L engine, use a close-coupled DOC
mounted directly to the turbocharger exit. The single-cylinder engine does not have a
turbocharger, nor a full exhaust manifold, so it is not possible to directly measure a
turbocharger outlet temperature (TTO). Exhaust port temperature (EGT) is measured in
the single-cylinder engine, but not in the partner multi-cylinder engine. As such, it is not
possible to directly correlate EGT and TTO from a single engine. There is matching
multi-cylinder engine data of exhaust temperature at the turbine outlet (TTO) at fixed
5 bar IMEP load which can be used to estimate the appropriate catalyst inlet temperature,
assuming a characteristic heat loss through the manifold and turbocharger. However,
there is no TTO data from the multi-cylinder engine across a load sweep. Generating
appropriate estimates of TTO for each load condition requires developing a rough
correlation between measurements of EGT (measured only on the single cylinder engine)
and TTO (measured only on the multi cylinder engine). There should be a reasonable
connection between the two temperatures if the engine is operating at a similar condition,
given the similarity of the two engines. Figure 52 shows single-cylinder EGT plotted
against multi-cylinder TTO for a timing sweep at a fixed load (5 bar IMEP) using a
common fuel (Swedish MK1). Temperatures are plotted against combustion phasing,
since both are strong functions of it.
Figure 52: Exhaust gas port temperature (EGT) and turbine outlet temperature (TTO) plotted against combustion phasing. EGT measured on single-cylinder engine, and TTO measured on multi-cylinder engine (multi-cylinder engine data courtesy of Tim Jacobs). ‘TTO (calc)’ uses the correlation given in Equation 12, and is shown calculated for the four EGT levels plotted.
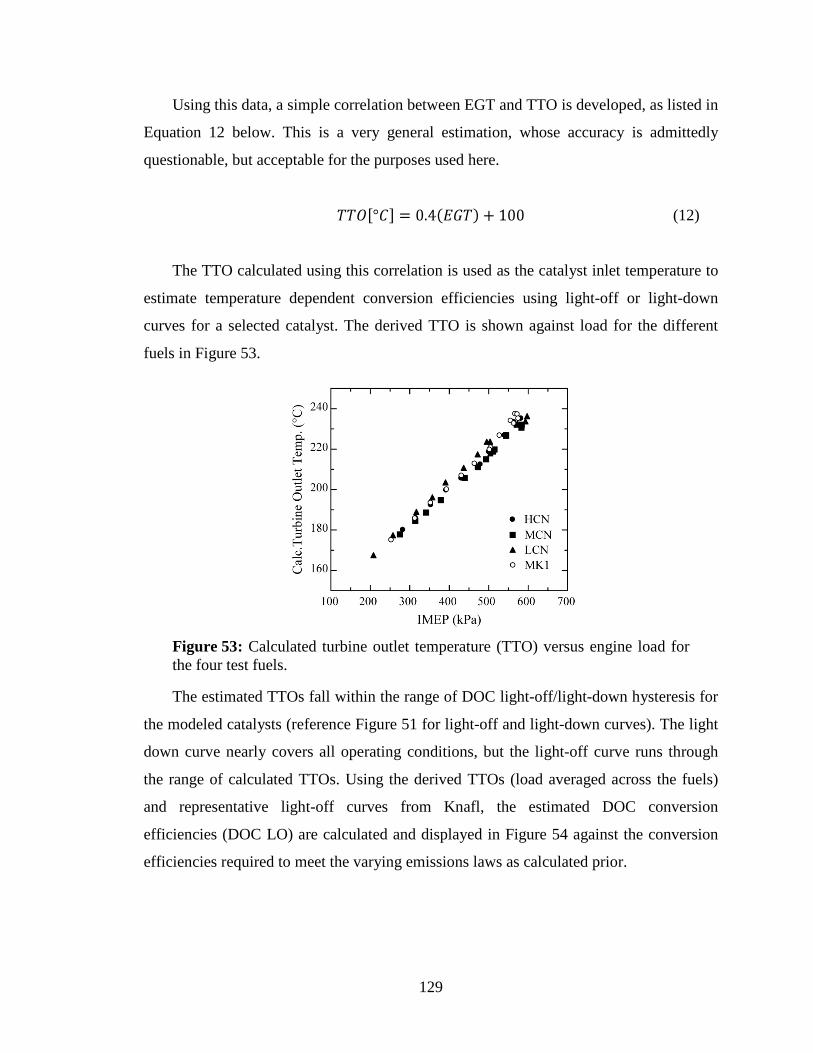
129
Using this data, a simple correlation between EGT and TTO is developed, as listed in
Equation 12 below. This is a very general estimation, whose accuracy is admittedly
questionable, but acceptable for the purposes used here.
(12)
The TTO calculated using this correlation is used as the catalyst inlet temperature to
estimate temperature dependent conversion efficiencies using light-off or light-down
curves for a selected catalyst. The derived TTO is shown against load for the different
fuels in Figure 53.
Figure 53: Calculated turbine outlet temperature (TTO) versus engine load for the four test fuels.
The estimated TTOs fall within the range of DOC light-off/light-down hysteresis for
the modeled catalysts (reference Figure 51 for light-off and light-down curves). The light
down curve nearly covers all operating conditions, but the light-off curve runs through
the range of calculated TTOs. Using the derived TTOs (load averaged across the fuels)
and representative light-off curves from Knafl, the estimated DOC conversion
efficiencies (DOC LO) are calculated and displayed in Figure 54 against the conversion
efficiencies required to meet the varying emissions laws as calculated prior.
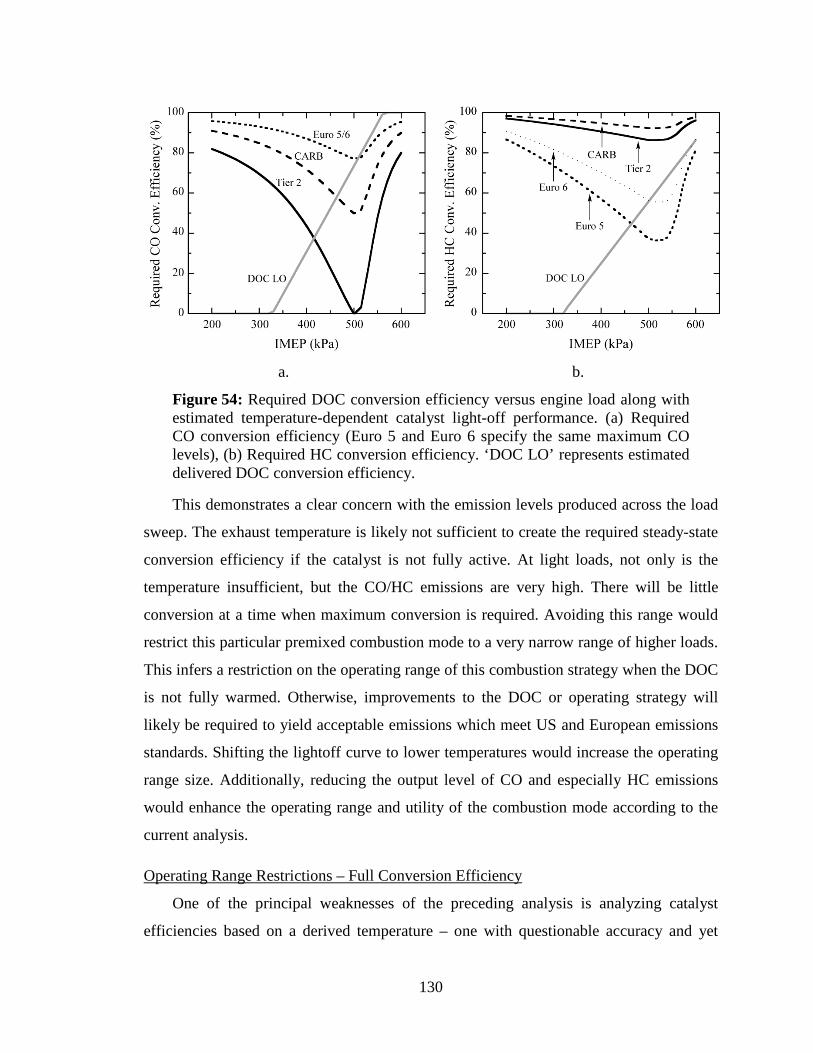
130
a. b.
Figure 54: Required DOC conversion efficiency versus engine load along with estimated temperature-dependent catalyst light-off performance. (a) Required CO conversion efficiency (Euro 5 and Euro 6 specify the same maximum CO levels), (b) Required HC conversion efficiency. ‘DOC LO’ represents estimated delivered DOC conversion efficiency.
This demonstrates a clear concern with the emission levels produced across the load
sweep. The exhaust temperature is likely not sufficient to create the required steady-state
conversion efficiency if the catalyst is not fully active. At light loads, not only is the
temperature insufficient, but the CO/HC emissions are very high. There will be little
conversion at a time when maximum conversion is required. Avoiding this range would
restrict this particular premixed combustion mode to a very narrow range of higher loads.
This infers a restriction on the operating range of this combustion strategy when the DOC
is not fully warmed. Otherwise, improvements to the DOC or operating strategy will
likely be required to yield acceptable emissions which meet US and European emissions
standards. Shifting the lightoff curve to lower temperatures would increase the operating
range size. Additionally, reducing the output level of CO and especially HC emissions
would enhance the operating range and utility of the combustion mode according to the
current analysis.
Operating Range Restrictions – Full Conversion Efficiency
One of the principal weaknesses of the preceding analysis is analyzing catalyst
efficiencies based on a derived temperature – one with questionable accuracy and yet
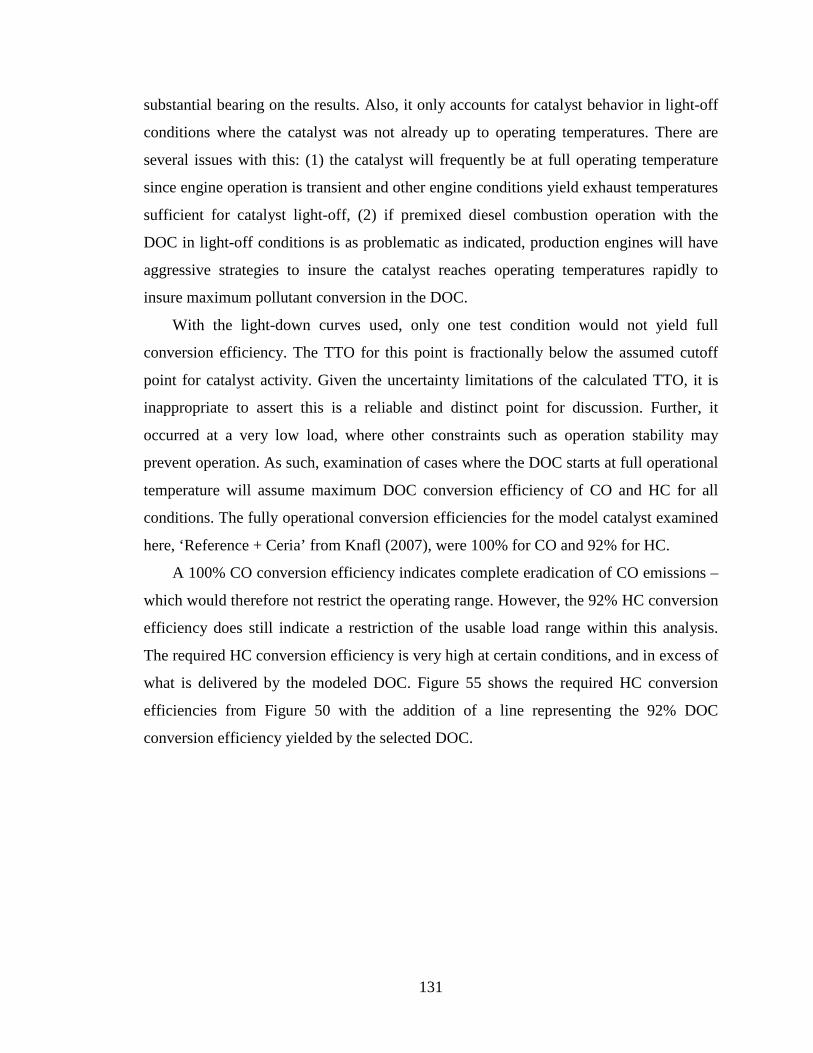
131
substantial bearing on the results. Also, it only accounts for catalyst behavior in light-off
conditions where the catalyst was not already up to operating temperatures. There are
several issues with this: (1) the catalyst will frequently be at full operating temperature
since engine operation is transient and other engine conditions yield exhaust temperatures
sufficient for catalyst light-off, (2) if premixed diesel combustion operation with the
DOC in light-off conditions is as problematic as indicated, production engines will have
aggressive strategies to insure the catalyst reaches operating temperatures rapidly to
insure maximum pollutant conversion in the DOC.
With the light-down curves used, only one test condition would not yield full
conversion efficiency. The TTO for this point is fractionally below the assumed cutoff
point for catalyst activity. Given the uncertainty limitations of the calculated TTO, it is
inappropriate to assert this is a reliable and distinct point for discussion. Further, it
occurred at a very low load, where other constraints such as operation stability may
prevent operation. As such, examination of cases where the DOC starts at full operational
temperature will assume maximum DOC conversion efficiency of CO and HC for all
conditions. The fully operational conversion efficiencies for the model catalyst examined
here, ‘Reference + Ceria’ from Knafl (2007), were 100% for CO and 92% for HC.
A 100% CO conversion efficiency indicates complete eradication of CO emissions –
which would therefore not restrict the operating range. However, the 92% HC conversion
efficiency does still indicate a restriction of the usable load range within this analysis.
The required HC conversion efficiency is very high at certain conditions, and in excess of
what is delivered by the modeled DOC. Figure 55 shows the required HC conversion
efficiencies from Figure 50 with the addition of a line representing the 92% DOC
conversion efficiency yielded by the selected DOC.
132
a. b.
Figure 55: Required DOC conversion efficiency versus engine load along with 92% DOC conversion level indicated. (a) Full view, (b) Close up of high conversion range.
The modeled 92% HC conversion efficiency is substantial enough that exit HC
emissions for all load conditions tested are less than the level indicated as necessary to
meet Euro 5 and Euro 6 emissions standards based on the current analysis. However, this
level of modeled conversion is less than the indicated level required for the CARB
standards. With regards to Tier 2 standards, the conversion from the modeled DOC is
comparable to the required level. So while all loads are not excluded, there is some
restriction on operating range. Adequate conversion is only reached for loads between
350 kPa and 570 kPa IMEP, which excludes the low and high load range where the
engine-out HC emissions are very high. This is not a severe restriction on operating
range, as loads falling outside of this range are very much on the borderline of acceptable
operation – the high loads are polluting heavily (with accompanying efficiency problems)
and the low loads have borderline combustion stability (high COV).
6.4 Summary and Conclusions
All four test fuels behave similarly, encountering the same load limits and producing
comparable emissions trends. The usable load range for all the fuels operating in the
tested combustion mode is limited to IMEP values between 250 and 580 kPa. Trends and
magnitudes of CO, HC, and soot emissions are identical for all four test fuels.
133
Changes to injection timing or injection pressure do not increase the peak usable
load. Varying injection timing or injection pressure can reduce emissions at a specific
load, but the overall peak load value is not affected.
The high load range of the tested combustion mode is primarily limited by
equivalence ratio. As the overall equivalence ratio approaches stoichiometric, emissions
of smoke, CO, and hydrocarbons all increase sharply due to locations of localized rich
regions becoming increasingly prevalent. Increasing intake manifold pressure increases
the maximum load limit by increasing the quantity of fuel which can be injected at the
limiting equivalence ratio, notwithstanding the increased volumetric efficiency due to the
higher inlet pressures.
High DOC conversion efficiencies are required to reduce engine-out CO and HC
emissions levels to ranges which would be acceptable for European and US emissions
requirements. Using a simplified analysis and DOC behavior modeled from a specific
catalyst used in prior testing, basic catalyst behavior is examined. When the modeled
DOC is at operational temperatures, the resulting 100% CO conversion should be
adequate for all load levels. The 92% conversion efficiency of the modeled catalyst
should yield acceptable performance with regards to European emissions standards (Euro
5, Euro 6), but may restrict operating range if trying to meet US standards (Tier 2, and
especially CARB ULEV). When the modeled DOC is not at full operational temperature,
it has insufficient conversion to reduce the emissions levels produced to meet most
emissions standards. Different catalyst formulations, precious metal loadings, and
physical designs may be required for vehicle implementation – issues that fall more
within the scope of product engineering.
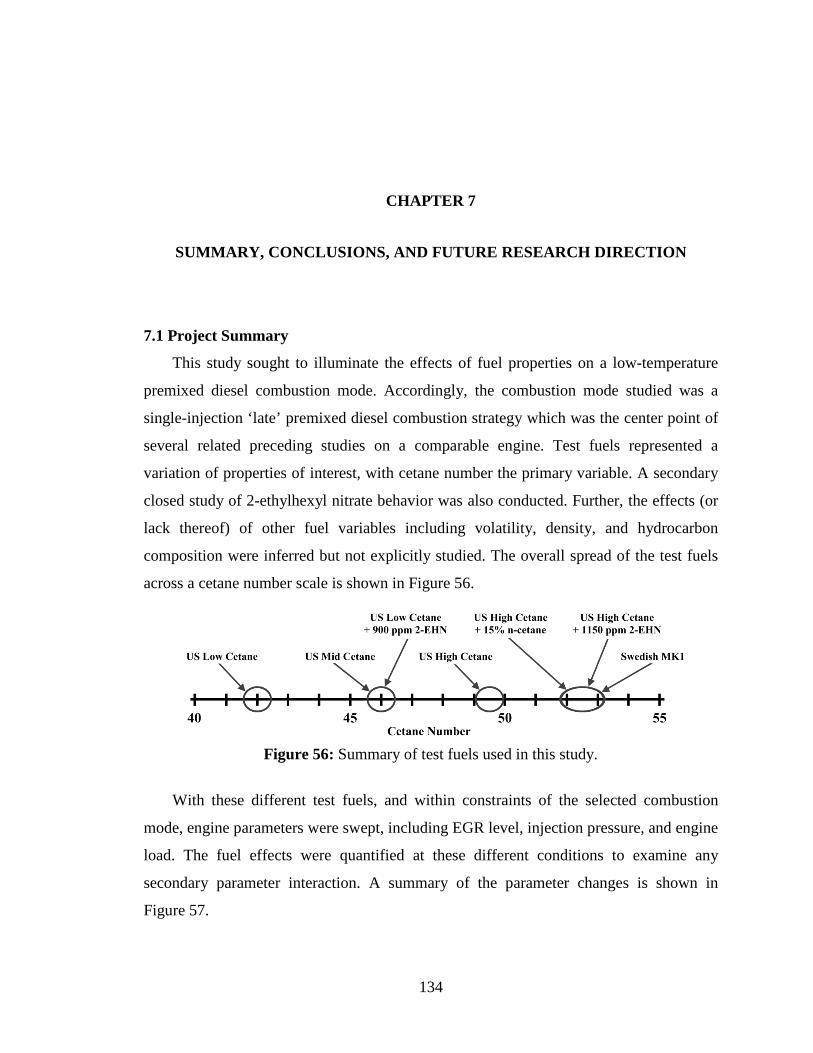
134
CHAPTER 7
SUMMARY, CONCLUSIONS, AND FUTURE RESEARCH DIRECTION
7.1 Project Summary
This study sought to illuminate the effects of fuel properties on a low-temperature
premixed diesel combustion mode. Accordingly, the combustion mode studied was a
single-injection ‘late’ premixed diesel combustion strategy which was the center point of
several related preceding studies on a comparable engine. Test fuels represented a
variation of properties of interest, with cetane number the primary variable. A secondary
closed study of 2-ethylhexyl nitrate behavior was also conducted. Further, the effects (or
lack thereof) of other fuel variables including volatility, density, and hydrocarbon
composition were inferred but not explicitly studied. The overall spread of the test fuels
across a cetane number scale is shown in Figure 56.
Figure 56: Summary of test fuels used in this study.
With these different test fuels, and within constraints of the selected combustion
mode, engine parameters were swept, including EGR level, injection pressure, and engine
load. The fuel effects were quantified at these different conditions to examine any
secondary parameter interaction. A summary of the parameter changes is shown in
Figure 57.
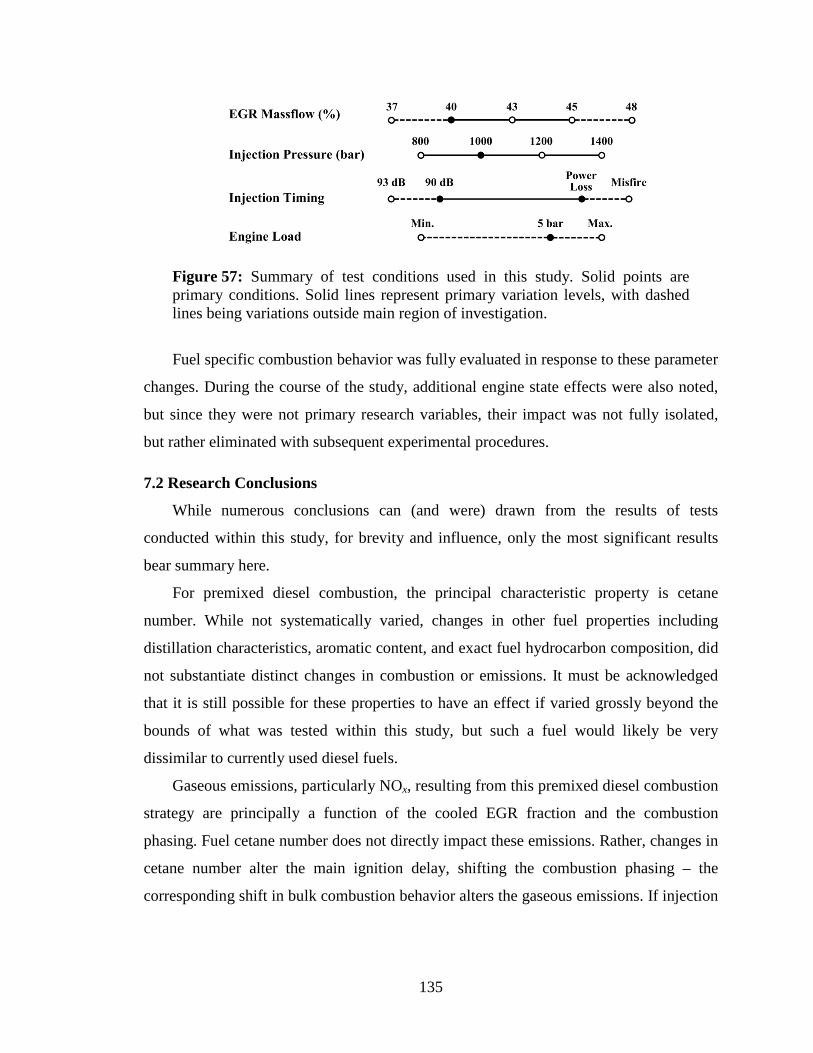
135
Figure 57: Summary of test conditions used in this study. Solid points are primary conditions. Solid lines represent primary variation levels, with dashed lines being variations outside main region of investigation.
Fuel specific combustion behavior was fully evaluated in response to these parameter
changes. During the course of the study, additional engine state effects were also noted,
but since they were not primary research variables, their impact was not fully isolated,
but rather eliminated with subsequent experimental procedures.
7.2 Research Conclusions
While numerous conclusions can (and were) drawn from the results of tests
conducted within this study, for brevity and influence, only the most significant results
bear summary here.
For premixed diesel combustion, the principal characteristic property is cetane
number. While not systematically varied, changes in other fuel properties including
distillation characteristics, aromatic content, and exact fuel hydrocarbon composition, did
not substantiate distinct changes in combustion or emissions. It must be acknowledged
that it is still possible for these properties to have an effect if varied grossly beyond the
bounds of what was tested within this study, but such a fuel would likely be very
dissimilar to currently used diesel fuels.
Gaseous emissions, particularly NOx, resulting from this premixed diesel combustion
strategy are principally a function of the cooled EGR fraction and the combustion
phasing. Fuel cetane number does not directly impact these emissions. Rather, changes in
cetane number alter the main ignition delay, shifting the combustion phasing – the
corresponding shift in bulk combustion behavior alters the gaseous emissions. If injection
136
timing is adjusted to counteract the combustion phasing shift due to fuel cetane number,
the resulting combustion phasing is matched and gaseous emissions remain constant.
There is no injection timing which gives acceptable behavior subject to the specified
criteria for fuels over a ten-point range of cetane number, the range of cetane number
expected in commercially available fuels. Using cylinder-pressure feedback to provide
combustion phasing control (rather than using fixed injection timing) is highly
recommended: by controlling to a fixed combustion phasing the effect of varying cetane
number is eliminated.
The presence of 2-EHN within the fuel introduces a new fuel-borne NOx formation
mechanism into the combustion process, which significantly increases NOx emissions in
a premixed diesel combustion mode. The increase in emissions is not reported by prior
researchers due to their use of a conventional combustion mode and the high level of NOx
emissions in their tests, both of which lead to other effects overshadowing the NOx
formed by the EHN decomposition. The NOx emissions levels resulting from premixed
diesel combustion are low enough to reveal a consistent increase in NOx emissions that is
directly tied to the addition of 2-EHN to the test fuel. For the tested EHN concentrations
(900 ppm, 1150 ppm), the increase in NOx emissions is around 0.1 g/kg-fuel – an
increase of 20-50% (varying with EGR level and combustion phasing) over fuels not
containing the additive. Finally, the use of 2-ethylhexyl nitrate appeared to cause
significantly worse injector fouling under the specified test conditions than the fuels
lacking the additive.
Variations in fuel cetane number impacted neither the operating load limits nor
emissions behavior across a range of loads. Trends and magnitudes of soot, CO, and HC
emissions are identical for all tested fuels. High DOC conversion efficiencies will be
required to reduce the CO and HC emissions to levels which meet US and European
emissions requirements.
The high load limit of the tested premixed diesel combustion mode is primarily
limited by equivalence ratio. As bulk cylinder equivalence ratio nears stoichiometric,
soot, CO, and HC emissions become excessive and load reaches a maximum level,
establishing the combustion mode’s high load limit. Varying injection timing or injection
pressure can reduce emissions at the peak load condition, but do not increase the load
137
limit of the combustion mode. Increasing intake manifold pressure does increase the load
limit by increasing the quantity of fuel which can be fully combusted at the limiting
equivalence ratio, notwithstanding the increased volumetric efficiency due to the higher
inlet pressures.
7.3 Recommended Future Research Direction
Research begets research. The current investigation has answered a few questions,
but has also created the opportunity for, and identified areas for, further exploration and
future work.
7.3.1 Expanded Fuel Matrix
Within this study, the fuel cetane number was varied over a range that was consistent
with commercially available fuels. However, this is not inclusive of all fuels which future
engines will operate on. Already ongoing is a study into one of the currently politically-
correct future fuels, biodiesel. More expansive testing of biofuels and other petroleum-
alternative fuels should be conducted. Within the petroleum fuels, there should be
motivation to study synthetic fuels, both derived from biological material and from
natural gas, as there is significant public policy driven motivation to implement these
fuels in the future.
7.3.2 Enhanced Particulate Matter Investigation
Measurements of particulates (PM) in this study were limited to soot measurements
taken with a smokemeter. This does not provide highly accurate results in the range that
is produced by premixed diesel combustion modes. Additionally, smoke measurements
only measure the carbon soot portion of PM emissions, and not any of the soluble organic
fraction (SOF). While soot emissions did not vary with the different fuel compositions, it
is entirely possible that the SOF would vary, along with the overall mass of particulates.
More detailed research should be conducted into what impact the fuel type has on
particulates, and the related implications this has on a diesel particulate filter (DPF)
which will almost certainly be employed on future vehicles.
138
7.3.3 Expanding the Premixed Diesel Combustion Load Range
One of the findings of this work was that the premixed diesel combustion operating
range was limited by the air-handling capabilities of the engine. Increasing the intake
boost range was noted to significantly increase the peak load that was available from the
premixed combustion mode. The capabilities of the single-cylinder test cell lend
themselves handily to further research in this area. The air handling system for the
engine, with a few upgrades, could easily supply very high levels of boost and EGR for a
study on expanding the operating range. Increasing the range where it is possible to
operate in the premixed diesel combustion mode is of substantial utility, and with the
capabilities of the test cell, should be investigated further.
7.3.4 Diesel Oxidation Catalyst Behavior
Central to both studies on operating limits (injection timing range, load range) was
the behavior of a diesel oxidation catalyst. Accordingly, future work in this field should
centrally include examination of the behavior and characteristics of this device. Within
this work, it was assumed that a DOC will oxidize all hydrocarbon emissions with
matching efficiency. However, different fuels may produce different hydrocarbon
species, which may display different oxidation behavior in a DOC. Future work in this
direction should focus on the following areas:
1. Fuel specific effects on the DOC conversion behavior
2. Effect of different exhaust hydrocarbon species on the DOC
3. Improved DOC performance, through new formulations and improved models
139
BIBLIOGRAPHY
Akagawa, H., Miyamoto, T., Harada, A., Sasaki, S., Shimizaki, N., Hashizume, T., Tsujimura, K. Approaches to Solve Problems of the Premixed Lean Diesel Combustion. Society of Automotive Paper 1999-01-0183. 1999. Alkidas, A. Effects of Injector Tip Configuration on the Performance and Emissions of an Uncooled Diesel. Society of Automotive Engineers Paper 881613. 1988. ASTM. Standard Test Method for Distillation of Petroleum Products at Atmospheric Pressure. Standard D86-07b. ASTM International. 2007. ASTM. Standard Test Method for Cetane Number of Diesel Fuel Oil. Standard D613-05. ASTM International. 2005. ASTM. Standard Specification for Diesel Fuel Oils. D975-08a. ASTM International. 2008. ASTM. Standard Test Method for Calculated Cetane Index of Distillate Fuels. Standard D976-04B. ASTM International. 2004. ASTM. Standard Test Method for Calculated Cetane Index by Four Variable Equation. Standard D4737-04. ASTM International. 2004. ASTM. Standard Test Method for Determination of Ignition Delay and Derived Cetane Number (DCN) of Diesel Fuel Oils by Combustion In a Constant Volume Chamber. Standard D6890-08. ASTM International. 2008. AVL. AVL 415S Variable Sampling Smoke Meter Operating Manual. AVL GMBH. Graz. 2000. AVL. AVL 450 Combustion Noise Meter Operating Manual. AVL GMBH. Graz. 2000. Bessonette, P., Schleyer, C., Duffy, K., Hardy, W., and Liechty, M. Effects of Fuel Property Changes on Heavy-Duty HCCI Combustion. Society of Automotive Engineers Paper 2007-01-0191. 2007. Boerlage, G., and Broeze, J. Ignition Quality of Diesel Fuel as Expressed in Cetane Numbers. S.A.E. Journal. 31(1). pp. 283-295. 1932.
140
Bornemann, H., Scheidt, F., Sander, W. Thermal Decomposition of 2-Ethylhexyl Nitrate (2-EHN). International Journal of Chemical Kinetics. 34(1). 2001. pp. 34-38. Bunting, B., Crawford, R., Wolf, L., Xu, Y. The Relationships of Diesel Fuel Properties, Chemistry, and HCCI Engine Performance as Determined by Principal Components Analysis. Society of Automotive Paper 2007-01-4059. 2007. Bunting, B., Wildman, C., Szybist, J., Lewis, S., Storey, J. Fuel chemistry and cetane effects on diesel homogeneous charge compression ignition performance, combustion, and emissions. International Journal of Engine Research. 8(1). 2007. pp. 15-27. Busch, S., Bohac, S., Assanis, D. A Study of the Transition Between Lean Conventional Diesel Combustion and Lean, Premixed, Low-Temperature Diesel Combustion. Journal of Engineering for Gas Turbines and Power. 130(5). 2008. CCR. Aromatic Hydrocarbon Content of Diesel Fuel. Title 13 California Code of Regulations. Division 3, Chapter 5, Article 2, Section 2282. 2005 Edition. CCR. Exhaust Emissions Standards and Test Procedures -- 2004 and Subsequent Model Passenger Cars, Light-Duty Trucks, and Medium-Duty Vehicles. Title 13 California Code of Regulations. Division 3, Chapter 1, Article 2, Section 1961. 2005 Edition. CCR. Sulfur Content of Diesel Fuel. Title 13 California Code of Regulations. Division 3, Chapter 5, Article 2, Section 2281. 2005 Edition. CEN. Automotive Fuels – Diesel – Requirements and Test Method. Standard EN 590:2004. European Committee for Standardization. 2004. CFR. Control of Emissions from New and In-Use Highway Vehicles and Engines. Title 40 Code of Federal Regulations. Part 86.1811-04. 2005 Edition. pp. 463-477. CFR. Control of Emissions from New and In-Use Highway Vehicles and Engines. Title 40 Code of Federal Regulations. Part 86.708-94. 2003 Edition. pp. 49-52. CFR. EPA Urban Dynamometer Driving Schedule. Title 40 Code of Federal Regulations. Part 86.115. 2006 Edition. pp. 464-466. CFR. Exhaust Emissions Test for SC03 Emissions. Title 40 Code of Federal Regulations. Part 86.160. 2006 Edition. pp. 572-575. CFR. Exhaust Emissions Test Procedure for US06 Emissions. Title 40 Code of Federal Regulations. Part 86.159. 2006 Edition. pp. 570-572. CFR. Regulation of Fuels and Fuel Additives. Title 40 Code of Federal Regulations. Part 80.29. 2004 Edition. p. 596.
141
CFR. Regulation of Fuels and Fuel Additives. Title 40 Code of Federal Regulations. Part 80.520. 2004 Edition. pp. 835-836. CFR. Supplemental Federal Test Procedure Calculations. Title 40 Code of Federal Regulations. Part 86.164. 2006 Edition. p. 581. Chevron. Diesel Reference Fuel T-23. Reference Fuel Specification Sheet. Chevron Phillips Chemical Company LP. 2005. Chevron. Diesel Reference Fuel U-16. Reference Fuel Specification Sheet. Chevron Phillips Chemical Company LP. 2005. Christensen, M., Hultqvist, A., Johansson, B. Demonstrating the multi fuel capability of a homogeneous charge compression ignition engine with variable compression ratio. Society of Automotive Engineers Paper 1999-01-3679. 1999. Christian, R., Knopf, F., Jaschek, A. Eine neue Meßmethodik der Bosch-Zal mit erhöhter Empfindlichkeit. Motertechnische Zeitschrift. 54. pp. 16-22. 1993. Clothier, P., Aguda, B., Moise, A., Pritchard, H. How Do Diesel-fuel Ignition Improvers Work? Chemical Society Reviews. 22. pp. 101-108. 1993. Clothier, P., Moise, A., Pritchard, H. Effect of Free-Radical Release on Diesel Ignition Delay Under Simulated Cold-Starting Conditions. Combustion and Flame. 81. pp. 242-250. 1990. Cowley, L., Stradling, R., Doyon, J., The Influence of Composition and Properties of Diesel Fuel on Particulates Emissions from Heavy Duty Diesel Engines. Society of Automotive Engineers Paper 932732. 1997. Curran, H., Gaffuri, P., Pitj, W., Westbrook, C. A Comprehensive Model of n-Heptane Oxidation. Combustion and Flame. 114. 1998. pp. 149-177. Dec, J. A Conceptual Model of DI Diesel Combustion Based on Laser-Sheet Imaging. Society of Automotive Engineers Paper 970873. 1997. Dodd, A., Holubecki, Z. The Measurement of Diesel Exhaust Smoke. MIRA Research Report 1965/10. 1965. Downs, D., Street, J., Wheeler, R. Cool Flame Formation in a Motored Engine. Fuel. 32(3). pp. 279-309. 1953. EIA. The Transition to Ultra-Low Sulfur Diesel Fuel: Effects on Price and Supply. Energy Information Administration. Report SR/OIAF/2001-01. Washington, DC. pp. 89-96. 2001.
142
EPC. Directive 2003/17/EC of the European Parliament and of the Council of 3 March 2003 amending Directive 98/70/EC relating to the quality of petrol and diesel fuels. Official Journal of the European Communities. L76. Luxembourg. pp. 10-19. 2003. EPC. Directive 98/69/EC of the European Parliament and of the Council of 13 October 1998 relating to measures to be taken against air pollution by emissions from motor vehicles and amending council directive 70/220/EEC. Official Journal of the European Communities. L350. Luxembourg. pp. 1-56. 1998. EPC. Directive 98/70/EC of the European Parliament and of the Council of 13 October 1998 relating to the quality of petrol and diesel fuels and amending Council Directive 93/12/EEC. Official Journal of the European Communities. L350. Luxembourg. pp. 58-68. 1998. EPC. Regulation (EC) No 715/2007 of the European Parliament and of the Council of 20 June 2007 on type approval of motor vehicles with respect to emissions from light passenger and commercial vehicles (Euro 5 and Euro 6) and on access to vehicle repair and maintenance information. Official Journal of the European Communities. 50, L171. Luxembourg. pp. 1-16. 2007. Ethyl. Ethyl Asia Pacific Company response to the National Fuel Quality Discussion Paper Measuring the Cetane Number: Options for Diesel and Alternative Diesel Fuels. Australian Government Department of the Environment and Heritage. 2004. Figliola, R., Beasley, D. Theory and Design for Mechanical Measurements. Third Edition. John Wiley & Sons. New York. 2000. Gairing, M., Marriott, J., Reders, K., Reglitzky, A., Wolveridge, P. The Effect of Modern Additive Technology on Diesel Fuel Performance. Society of Automotive Engineers Paper 950252. 1995. Garner, F., Grigg, G., Morton, F., Reid, W. Pre-Flame Reactions in Diesel Engines Part III. Journal of the Institute of Petroleum. 42(387). pp. 69-87. 1956. Gatowski, J., Balles, E., Chun, K., Nelson, F., Ekchian, J., Heywood, J. Heat Release Analysis of Engine Pressure Data. Society of Automotive Engineers Paper 841359. 1984. Greeves, G., Khan, I., Wang, C., Fenne, I. Origins of Hydrocarbon Emissions From Diesel Engines. Society of Automotive Engineers Paper 770259. 1977. Gray, A., Ryan, T. Homogenous Charge Compression Ignition (HCCI) of Diesel Fuel. Society of Automotive Engineers Paper 971676. 1997. Gülder, Ö., Glavinčevski, B., Burton, G. Ignition Quality Rating Methods for Diesel Fuels – A Critical Appraisal. Society of Automotive Engineers Paper 852080. 1985.
143
Han, M. Species Resolved Hydrocarbon Emissions Profiles from Advanced Diesel Combustion and Characterization of Heat-Up Oxidation Catalysts. Dissertation. University of Michigan. Ann Arbor. 2007. Heywood, J. Internal Combustion Engine Fundamentals. McGraw-Hill. New York. 1988. Higgins, B., Siebers, D. Comparison of 2-ethylhexyl nitrate and fuel composition induced changes in the diesel spray ignition process. International Journal of Engine Research. 2(1). 2001. pp.47-67. Higgins, B., Siebers, D., Mueller, C., Aradi, A. Effects of an Ignition-Enhancing, Diesel-Fuel Additive on Diesel Spray Evaporation, Mixing, Ignition, and Combustion. Twenty-Seventh Symposium (International) on Combustion, Volume Two. The Combustion Institute. Pittsburgh, PA. 1998. pp. 1873-1880. Hohenberg, G. Advanced Approaches for Heat Transfer Calculations. Society of Automotive Engineers Paper 790825. 1979. Horiba. Instruction Manual: High Temperature Total Hydrocarbon Analyzer Model FIA-34A with Electronics Module Model OPE-415. Manual Number 090934. HORIBA Ltd. 1985. ISO. Internal Combustion Compression-Ignition Engines – Measurement Apparatus for Smoke from Engines Operating Under Steady-State Conditions – Filter Type Smokemeter. Standard 10054-98. International Standards Organization. 1998. Jacobs, T. Simultaneous Reduction of Nitric Oxide and Particulate Matter Emissions from a Light-Duty Diesel Engine Using Combustion Development and Diesel Oxidation Catalyst. Dissertation. University of Michigan. Ann Arbor. 2005. Kamimoto, T., Bae, M. High Combustion Temperature for the Reduction of Particulate in Diesel Engines. Society of Automotive Engineers Paper 880423. 1988. Khan, I., Wang, C., Langridge, B. Effect of Air Swirl on Smoke and Gaseous Emissions from Direct-Injection Diesel Engines. Society of Automotive Engineers Paper 720102. 1972. Khan, I., Greeves, G, Wang, C. Factors Affecting Smoke and Gaseous Emissions From Direct Injection Engines and a Method of Calculation. Society of Automotive Engineers Paper 730169. 1973. Kidoguchi, Y., Yang, C., Miwa, K. Effects of Fuel Properties on Combustion and Emission Characteristics of a Direct Injection Diesel Engine. Society of Automotive Engineers Paper 2000-01-1851. 2000.
144
Kimura, S., Aoki, O., Kitahara, Y., Aiyoshizawa, E. Ultra-clean Combustion Technology Combining a Low-Temperature and Premixed Combustion Concept for Meeting Future Emissions Standards. Socieity of Automotive Engineers Paper 2001-01-0200. 2001. Kitano, K., Nishiumi, R., Tsukasaki, T., Tanaka, T. and Morinaga, M. Effects of Fuel Properties on Premixed Charge Compression Ignition Combustion in a Direct Injection Diesel Engine. Society of Automotive Engineers Paper 2003-01-1815. 2003. Knafl, A. Development of Low-Temperature Premixed Diesel Combustion Strategies and Formulation of Suitable Diesel Oxidation Catalysts. Dissertation. University of Michigan. 2007. Kook, S., Bae, C., Miles, P., Choi, D., Pickett, L. The Influence of Charge Dilution and Injection Timing on Low-Temperature Diesel Combustion and Emissions. Society of Automotive Engineers Paper 2005-01-3837. 2005. Kouremenos, D., Hountalas, A., Kouremenos, A. Experimental Investigation of the Effect of Fuel Composition on the Formation of Pollutants in Direct Injection Diesel Engines. Society of Automotive Engineers Paper 1999-01-0189. 1999. Kulinowski, A., Henly, T., Stocky, T. The Effect of 2-Ethylhexyl Nitrate Cetane Improver on Engine Durability. Society of Automotive Engineers Paper 981364. 1998. Kuniyoshi, H., Tanabe, H., Sato, G., Fujimoto, H. Investigation on the Characteristics of Diesel Fuel Spray. Society of Automotive Engineers Paper 800968. 1980. Kusaka, J., Suzuki, K., Miyoshi, A., and Daisho, Y. Study on Combustion in Light Duty Diesel Engines – The effect of fuel properties for PCI (Premixed Compression Ignition) combustion. Society of Automotive Engineers of Japan Paper 20045751. 2004. Ladommatos, N., Abdelhalim, S., Zhao, H., Hu, Z. The Dilution, Chemical, and Thermal Effects of Exhaust Gas Recirculation on Diesel Engine Emissions – Part 1: Effect of Reducing Inlet Charge Oxygen. Society of Automotive Engineers Paper 961165. 1996. Ladommatos, N., Abdelhalim, S., Zhao, H., Hu, Z. The Dilution, Chemical, and Thermal Effects of Exhaust Gas Recirculation on Diesel Engine Emissions – Part 2: Effects of Carbon Dioxide. Society of Automotive Engineers Paper 961167. 1996. Ladommatos, N., Abdelhalim, S., Zhao, H., Hu, Z. The Dilution, Chemical, and Thermal Effects of Exhaust Gas Recirculation on Diesel Engine Emissions – Part 3: Effects of Water Vapour. Society of Automotive Engineers Paper 971659. 1997. Ladommatos, N., Abdelhalim, S., Zhao, H., Hu, Z. The Dilution, Chemical, and Thermal Effects of Exhaust Gas Recirculation on Diesel Engine Emissions – Part 4: Effects of Carbon Dioxide and Water Vapour. Society of Automotive Engineers Paper 971660. 1997.
145
Ladommatos, N., Xiao, Z., Zhao, H. Effects of Fuels with a Low Aromatic Content on Diesel Engine Exhaust Emissions. Proceedings of the Institution of Mechanical Engineers Journal of Automobile Engineering. 214. pp. 779-794. 2000. Lavoie, G., Heywood, J., Keck, J. Experimental and Theoretical Study of Nitric Oxide Formation in Internal Combustion Engines. Combustion Science and Technology. 1(4). pp. 313-326. 1970. Lechner, G. Feasibility and Limitations of Premixed Diesel Combustion in Multi-Cylinder Engines. Dissertation. University of Michigan. Ann Arbor. 2003. Lee, R., Pedley, J, Hobbes, C. Fuel Quality Impact on Heavy Duty Diesel Emissions: A Literature Review. Society of Automotive Engineers Paper 982649. 1998. Li, T., Okabe, Y., Izumi, H., Shudo, T., Ogawa, H. Dependence of Ultra-High EGR Low Temperature Diesel Combustion on Fuel Properties. Society of Automotive Engineers Paper 2006-01-3387. 2006. Li, T., Simmons, R. The Action of Ignition Improvers in Diesel Fuels. Twenty-First Symposium (International) on Combustion. The Combustion Institute. Pittsburgh, PA. 1988. pp. 455-462. Li, X., Chippior, W., Gülder, Ö. Effects of Cetane Enhancing Additives and Ignition Quality on Diesel Engine Emissions. Society of Automotive Engineers Paper 972968. 1997. Lida, N., Sato, G. Temperature and Mixing Effects on NOx and Particulates. Society of Automotive Engineers Paper 880424. 1988. Maly, R., Schaefer, V., Hass, H., Cahill, G., Rouveirolles, P., Röj, A., Wegener, R., Montagne X., Di Pancrazio, A., and Kashdan, J. Optimum Diesel Fuel for Future Clean Diesel Engines. Society of Automotive Engineers Paper 2007-01-0035. 2007. Mann, N., Kvinge, F., Wilson, G. Diesel Fuel Effects on Emissions: Towards a Better Understanding. Society of Automotive Engineers Paper 982486. 1998. Massa, C., Diaz, M., da Silva, R., Ferreira, A., Fontes, S. Influence of Cetane Number on Euro III Emissions. Society of Automotive Engineers Paper 2007-01-2000. 2007. McCormick, R., Alvarez, J., Graboski, M., Tyson, K., Vertin, K. Fuel Additive Blending Approaches to Reducing NOx Emissions from Biodiesel. Society of Automotive Engineers Paper 2002-01-1658. 2002.
146
McCormick, R., Tennant, C., Hayes, R., Black, S., Ireland, J., McDaniel, T., Williams, A., Frailey, M., Sharp, C. Regulated Emissions From Biodiesel Tested in Heavy-Duty Engines Meeting 2004 Emissions Standards. Society of Automotive Engineers Paper 2005-01-2200. 2005. NAFS. North American Fuel Survey – Diesel Fuel 2003 Summer. Alliance of Automobile Manufacturers. Washington D.C. 2003. Okude, K., Mori, K., Shiino, S., Moriya, T. Premixed Compression Ignition (PCI) Combustion for Simultaneous Reduction of NOx and Soot in Diesel Engines. Society of Automotive Engineers Paper 2004-01-1907. 2004. Owen, K., Coley, T. Automotive Fuels Reference Book. Second Edition. Society of Automotive Engineers. Warrendale, PA. 1995. Peckham, J. ‘Higher Quality Diesel Fuel’ Could Boost, Hinder North American Light-Duty Prospects. Diesel Fuel News. 7(21). November 10, 2003. pp. 3-4. Plee, S., Ahmad, T. Relative Roles of Premixed and Diffusion Burning in Diesel Combustion. Society of Automotive Engineers Paper 831733. 1983. Pritchard, H. Thermal Decomposition of Isooctyl Nitrate. Combustion and Flame. 75. pp. 415-416. 1989. Risberg, P., Kalghatgi, G., Ångstrom, H., Wåhlin, F. Auto-ignition quality of Diesel-like fuels in HCCI engines. Society of Automotive Engineers Paper 2005-01-2127. 2005. SAE. Stoichiometric Air-Fuel Ratios of Automotive Fuels. Standard J1829. SAE International. 1992. Spreen, K., Ullman, T., Mason, R. Effects of Cetane Number, Aromatics, and Oxygenates on Emissions From a 1994 Heavy-Duty Diesel Engine with Exhaust Catalyst. Society of Automotive Engineers Paper 950250. 1995. Starr, M. Influence on Transient Emissions at Various Injection Timings, Using Cetane-Improvers, Bio-Diesel, and Low Aromatic Fuels. Society of Automotive Engineers Paper 972904. 1997. Stein, Y., Yetter, R., Dryer, F., Aradi, A. The Autoignition Behavior of Surrogate Diesel Fuel Mixtures and the Chemical Effects of 2-Ethylhexyl Nitrate (2-EHN) Cetane Improver. Society of Automotive Engineers Paper 1999-01-1504. 1999. Stivender, D. Development of a Fuel-Based Mass Emission Measurement Procedure. Society of Automotive Engineers Paper 710604. 1971.
147
Sugano, H., Nemoto, K., Kuwayama, S., Mitsui, Y., Kusaka, J., and Daisho, Y. An Experimental Study on the Effects of Combustion and Fuel Factors on DI Diesel Engine Performance (Second Report): Effects of fuel properties on premixed charge compression ignition combustion and the conventional diesel combustion. Society of Automotive Engineers of Japan Paper 20045786. 2004. Szybist, J., Boehman, A., Taylor, J., McCormick, R. Evaluation of Formulation Strategies to Eliminate the Biodiesel NOx Effect. Fuel Processing Technology. 86. 2005. pp. 1109-1126. Szybist, J., Bunting, B. Cetane Number and Engine Speed Effects on Diesel HCCI Performance and Emissions. Society of Automotive Engineers Paper 2005-01-3723. 2005. Takeda, Y., Keiichi, N., Keiichi, N. Emission Characteristics of Premixed Lean Diesel Combustion with Extremely Early Staged Fuel Injection. Society of Automotive Engineers Paper 961163. 1996. Taylor, C., Taylor E. The Internal Combustion Engine. 2nd Edition. International Textbook Company. Scranton, PA. 1962. Totten, G., Westbrook, S., Shah, R. Fuels and Lubricants Handbook: Technology, Properties, Performance, and Testing. ASTM International. West Conshohocken, PA. 2003. Ullman, T., Spreen, K., Mason, R. Effects of Cetane Number, Cetane Improver, Aromatics, and Oxygenates on 1994 Heavy Duty Diesel Engine Emissions. Society of Automotive Engineers Paper 941020. 1994. Ullman, T., Spreen, K., Mason, R. Effect of Cetane Number on Emissions From a Prototype 1998 Heavy-Duty Diesel Engine. Society of Automotive Engineers Paper 950251. 1995. Wåhlin, F., Cronhjort, A. Fuel Sprays for Premixed Compression Ignited Combustion – Characteristics of Impinging Sprays. Society of Automotive Engineers Paper 2004-01-1776. 2004. Walter, B., Gatellier, B. Development of the High Power NADITM Concept Using Dual Mode Diesel Combustion to Achieve Zero NOx and Particulate Emissions. Society of Automotive Engineers Paper 2002-01-1744. 2002. Williams, T., Tindal, M. Gas Flow Studies in Direct Injection Diesel Engines with Re-entrant Combustion Chambers. Society of Automotive Engineers Paper 800027. 1980. Wilson, G., Rose, R. Behavior of High- and Low-Cetane Fuels. S.A.E. Transactions. 32. pp. 343-348. 1937.
148
Wong, C., Steere, D. The Effects of Diesel Fuel Properties and Engine Operating Conditions on Ignition Delay. Society of Automotive Engineers Paper 821231. 1982. Yanigahara, H., Sato, Y., Mizuta, J. A study of DI Diesel Combustion Under Uniform Higher-Dispersed Mixture Formation. JSAE Review. 18(4). pp. 361-368. 1997. Yun, H., Mirsky, W. Schlieren-Streak Measurements of Instantaneous Exhaust Gas Velocities from a Spark-Ignition Engine. Society of Automotive Engineers Paper 741015. 1974. Zaslonko, I., Smirnov, V., Tereza, A, Tsyganov, S. Kinetics of Energy Liberation During Thermal Decomposition of Nitrates in Shock Waves. Combustion, Explosion, and Shock Waves. 24(2). pp. 251-255. 1988. Zeldovich, J. The Oxidation of Nitrogen in Combustion and Explosions. Acta Physicochimica U.R.S.S. 21(4). pp. 577-628. 1946.
Related Documents


![Fundamental studies of premixed combustion [PhD Thesis]](https://static.cupdf.com/doc/110x72/563db7e7550346aa9a8f0c44/fundamental-studies-of-premixed-combustion-phd-thesis.jpg)

