FUEL CELL SYSTEM ECONOMICS: COMPARING THE COSTS OF GENERATING POWER WITH STATIONARY AND MOTOR VEHICLE PEM FUEL CELL SYSTEMS UCD-ITS-RP-04-21 April 2004 by Timothy Lipman University of California, Berkeley Berkeley, CA 94720 Ph (510) 642-4501 Fax (530) 642-0910 [email protected] with Jennifer L. Edwards and Daniel M. Kammen Institute of Transportation Studies One Shields Avenue University of California Davis, California 95616 Tel: 530-752-0247 Fax: 530-752-6572 http://www.its.ucdavis.edu/ email: [email protected]

Welcome message from author
This document is posted to help you gain knowledge. Please leave a comment to let me know what you think about it! Share it to your friends and learn new things together.
Transcript

FUEL CELL SYSTEM ECONOMICS: COMPARING THE COSTS OF GENERATING POWER WITH STATIONARY
AND MOTOR VEHICLE PEM FUEL CELL SYSTEMS
UCD-ITS-RP-04-21
April 2004
by
Timothy Lipman University of California, Berkeley
Berkeley, CA 94720 Ph (510) 642-4501 Fax (530) 642-0910
with
Jennifer L. Edwards
and
Daniel M. Kammen
Institute of Transportation Studies One Shields Avenue
University of California Davis, California 95616
Tel: 530-752-0247 Fax: 530-752-6572 http://www.its.ucdavis.edu/
email: [email protected]
Energy Policy 32 (2004) 101–125
Fuel cell system economics: comparing the costs of generatingpower with stationary and motor vehicle PEM fuel cell systems
Timothy E. Lipman, Jennifer L. Edwards, Daniel M. Kammen*
Renewable and Appropriate Energy Lab (RAEL), Energy and Resources Group, University of California,
4152 Etcheverry Hall, Berkeley, CA 94720, USA
Abstract
This investigation examines the economics of producing electricity from proton-exchange membrane (PEM) fuel cell systems
under various conditions, including the possibility of using fuel cell vehicles (FCVs) to produce power when they are parked at office
buildings and residences. The analysis shows that the economics of both stationary fuel cell and FCV-based power vary significantly
with variations in key input variables such as the price of natural gas, electricity prices, fuel cell and reformer system costs, and fuel
cell system durability levels. The ‘‘central case’’ results show that stationary PEM fuel cell systems can supply electricity for offices
and homes in California at a net savings when fuel cell system costs reach about $6000 for a 5 kW home system ($1200/kW) and
$175,000 for a 250 kW commercial system ($700/kW) and assuming somewhat favorable natural gas costs of $6/GJ at residences and
$4/GJ at commercial buildings. Grid-connected FCVs in commercial settings can also potentially supply electricity at competitive
rates, in some cases producing significant annual benefits. Particularly attractive is the combination of net metering along with time-
of-use electricity rates that allow power to be supplied to the utility grid at the avoided cost of central power plant generation. FCV-
based power at individual residences does not appear to be as attractive, at least where FCV power can only be used directly or
banked with the utility for net metering and not sold in greater quantity, due to the low load levels at these locations that provide a
poor match to automotive fuel cell operation, higher natural gas prices than are available at commercial settings, and other factors.
r 2002 Elsevier Ltd. All rights reserved.
Keywords: Fuel cell; Distributed generation; Net metering
1. Introduction
California’s net metering program is one of about 40state net metering programs currently in place aroundthe United States. These net metering programs allowexcess local electricity generation to be supplied to theregional utility grid for a credit that can then be usedlater to supply demands that are not met by the localgeneration. In some cases, excess generation must be‘‘taken back’’ from the utility on a monthly basis, withnet energy use calculated each month, and in other casesany excess can be carried over from month to monthwith the final net billing accounted for annually. In a fewstates net excess generation can be credited at theavoided cost of utility generation, but in most states any
excess is simply ignored and customers cannot earn netcredits.A principal motivation for creating policies to allow
net metering has been to make better use out ofintermittent renewable generating systems, such as solarPV and wind power generators. These clean andtherefore socially attractive generating systems tend toproduce electricity with a profile that roughly matchesthe demand profile on the overall utility grid, with peakproduction often occurring in the middle of the day andinto the afternoon. For this reason, excess electricitygeneration is likely to be available when the demands onthe utility grid are greatest, and this strengthens theargument for offering net metered billing for customerswith PV and wind power systems. Of the state netmetering programs, some states like California onlyallow PV and wind systems to be net metered, andothers specify that all renewable power systems, includ-ing hydro-power, can qualify for net metering. However,a few states allow natural gas powered fuel cells,
ARTICLE IN PRESS
*Corresponding author. Tel.: +1-510-642-1640; fax: +1-510-642-
1085.
E-mail address: [email protected]
(D.M. Kammen).
0301-4215/04/$ - see front matter r 2002 Elsevier Ltd. All rights reserved.
PII: S 0 3 0 1 - 4 2 1 5 ( 0 2 ) 0 0 2 8 6 - 0

microturbines, and other non-renewable systems to alsobe net metered.In April of 2001 and under AB 29X, the California
legislature broadened the State’s net metering program(described in Section 2827 of the California PublicUtilities Code) by raising the maximum size of net-metered PV or wind power system from 10 kW to 1MW. AB 29X also lifted the overall limit of 0.1% ofeach utility’s peak demand level that can be net metered.However, this expansion of the State program is set toreach a ‘‘sunset’’ at the end of 2002 and, barring anyfurther legislation, the 0.1% limit will be reinstated andthe previous system limit of 10 kW will be applied againat that time.This paper analyzes the potential for a future change
to California’s net metering program to extend qualify-ing systems to natural gas powered fuel cell systems aswell as fuel cell systems powered by renewably producedhydrogen. The focus of this analysis is on fuel cellsystems that are powered with hydrogen produced fromnatural gas reformers, because such systems are likely tobe more economically feasible in the near term than fuelcell systems that run exclusively on hydrogen producedfrom renewable sources. In the future, technologicaldevelopments and various incentives could help tostimulate the installation of systems to produce hydro-gen renewably. Installing fuel cell systems that run onnatural gas initially could thus prove to be an importantfirst step to renewably powered fuel cell systems, butthese future development paths are far from clear.
2. Fuel cell systems for distributed power generation
Fuel cell technology holds the promise to produceelectricity at local sites from a wide range of fuels, andwith high efficiency. Most types of fuel cells operate onhydrogen fuel, but this hydrogen can be produced fromnatural gas, liquid hydrocarbon fuels including biomassfuels, landfill gases, water and electricity (via the processof electrolysis), biological processes including thoseinvolving algae, and from gasification of biomass,wastes, and coal. Fuel cells are being proposed for usein powering electric vehicles, providing remote powerfor buildings and communication facilities, providingpower as distributed generation (DG) in grid-connectedapplications (as either primary power or backup power),and for small electronic devices such as laptopcomputers and cell phones.One principal attraction of fuel cell technology, as
evidenced by this diverse array of potential applications,is that fuel cells can produce power with high efficiencyin a wide range of system sizes. This feature is a functionof the modular design of fuel cell systems (whereindividual cells are compiled into ‘‘stacks’’ to achievehigher voltage and power levels), as well as the fuel cell
operating principle that allows electricity to be producedwithout combustion. Several types of fuel cells arecurrently being developed, including proton-exchangemembrane (PEM) fuel cells, solid-oxide fuel cells(SOFCs), alkaline fuel cells (AFCs), phosphoric acidfuel cells (PAFCs), molten-carbonate fuel cells(MCFCs), and direct-methanol fuel cells (DMFCs).Low temperature PEM fuel cells are considered theleading contenders for automotive and small stationaryapplications, with SOFC, PAFC, and MCFC operatingat higher temperatures (from 2001C to 10001C) andexpected to be used for larger stationary applications,and DMFCs for portable electronics and possibly forfuture electric vehicles.There are several potential operating methods for
using both stationary fuel cells and fuel cell vehicles(FCVs) as distributed generating resources. Thesesystems could be used to:
* produce power to meet the demands of local loads;* provide additional power to the grid in a net metered
or electricity buy-back scenario, helping to meetdemands in times of capacity constraint;
* provide emergency backup power to residences,offices, hospitals, and municipal facilities;
* provide ‘‘peak shaving’’ for commercial sites, redu-cing demand charges;
* provide ancillary services to the grid, such as spinningreserves, grid frequency regulation, power qualitysupport, reactive power, and possibly other services;and/or
* provide buffering and additional power for grid-independent systems that rely on intermittent renew-ables.
In general, stationary fuel cells are expected tooperate nearly continuously (with the exception of thoseused for emergency backup), and they also have thepotential to act as cogenerators, simultaneously produ-cing electricity and useful waste heat. FCVs wouldprovide power more intermittently, when parked atsuitable locations for obtaining fuel and dischargingelectricity. The fuel cell systems in FCVs would likely beless readily usable for cogeneration (also known ascombined heat and power or CHP) than stationary fuelcells due to the additional cost and complexity of tryingto capture the waste heat from these systems, for usesinside nearby buildings.Depending on the type of fuel cell system, waste heat
is available at different temperatures and can be used forvarious heating and cooling applications. For PEM fuelcells, the waste heat is available at only about 80–901C.Some other types of fuel cells run much hotter, up to9001C or even 10001C. The low grade of waste heat fromPEM fuel cells is suitable for heating water and/orproviding space heating, thereby displacing energy thatis otherwise used for that purpose, while higher grade
ARTICLE IN PRESST.E. Lipman et al. / Energy Policy 32 (2004) 101–125102

waste heat from other fuel cell types can be usedto produce steam and to drive absorption coolingsystems.
3. Net metering of fuel cell systems
There are two basic ways in which commercial fuelcell systems could be ‘‘net metered’’. First, they could benet metered in a manner analogous to current netmetering programs, whereby overall billing would beassessed on a monthly or annual basis and thecustomer could have a zero balance, a negative balance,or in the case where credit is awarded to net excessgeneration, even a positive balance. One argumentagainst including fuel cell systems in these traditionalnet metering programs is that while PV and windsystems tend to have peak availability in the daytimeand afternoon periods, coincident with the grid peak, tothe extent that fuel cell systems are sized to meet most orall of the peak building electrical loads, much excess fuelcell power may be available off-peak when the grid isrunning mainly from baseload power plants. However,net metering policies could be designed to work inconjunction with ‘‘real time’’ electricity meters that arecurrently being installed at many commercial sites toallow excess generation to only be credited at peakhours of the day when the grid is employing peak powerplants. In theory, use of fuel cell systems in this waycould reduce the need to operate peak power plants andto construct new ones to meet peak demand growth. Forthis reason, this paper analyzes cases in which excess fuelcell power added to the grid is only credited for netmetering during hours that coincide with the overall gridpeak power demand, rather than at any time during theday or night.A second type of net metering is ‘‘short term’’ net
metering, where the fuel cell system is again connected inparallel with the utility grid but, in this case, simplyrelies on grid power to take up the transients in thecommercial or residential load. This power used fromthe grid could be purchased, or ‘‘repaid’’ by operatingthe fuel cell system at excess power and supplying netpower to the grid over a short period of time until the‘‘borrowed’’ power had been replaced. The potentialadvantage of this is that if the fuel cell system does notneed to completely meet the demands of, for example, aresidential load that averages only 1 or 2 kW but canspike to 12–15 kW under certain conditions, then it canlikely achieve higher operational efficiency. In addition,system components could be sized more optimally,peak-power battery systems would not be needed, andhydrogen ‘‘buffer’’ storage may also not be needed. Thisuse of the utility grid to ‘‘load-level’’ the fuel cell system,whereby energy that is borrowed from the grid to takeup transients is then repaid with gradual fluctuations in
fuel cell power over a perhaps a 15–30min period oftime, could significantly improve the economics of fuelcell system operation.This paper analyzes the prospects for the first type of
net metering, whereby fuel cell systems can produceadditional power during peak periods, and can receivecredit for the excess power provided that can then bewithdrawn at other times. We believe that the secondtype of ‘‘short term’’ net metering is potentiallypromising, but is more challenging from a utility billingand administration perspective, and thus less likely near-term.We compare cases in which fuel cell systems are net
metered in various ways to those in which they are notnet metered, but simply ‘‘load-follow’’ the building’selectrical load profile. The types of fuel cells consideredare both stationary PEM systems and FCVs that areparked in office building parking lots or householdgarages. We recognize fuel cells other than the PEMtype could be used and net metered, and that other typesof electric-drive vehicles (EVs) could produce power forbuildings and the grid. However, PEM fuel cells areconsidered the primary contender for small-scale powerproduction (especially under 100 kW) and for use inFCVs. Furthermore, among various EV types FCVsmay be particularly attractive for use as DG resourcesbecause they can be operated continuously if connectedto a source of hydrogen fuel and have very lowoperating emissions.We hypothesize that in certain settings net metering
may improve the economics of using small fuel cells fordistributed power generation because it may allow fuelcell operation to be better optimized for high efficiencythan is possible with strict ‘‘load-following’’ operation.We further hypothesize that this may be particularlytrue for the case of FCVs being used to generate powerwhile they are parked at residential settings, due to thefact that the fuel cell systems in the vehicles have beensized and optimized for use as vehicle power, and maynot be particularly well suited to powering smallbuilding electrical loads. Net metering of these systemsmay therefore play an important role in allowing thesystems to be used with realistic ‘‘turndown’’ ratios andin a manner where higher efficiency operation is possiblethan in the absence of a net-metered operationalstrategy.
4. Fuel cell vehicles for stationary power
With regard to using FCVs to generate power, recentresearch has shown that in addition to providing criteriapollutant, greenhouse gas, and energy use reductionsrelative to conventional vehicles, EVs can also inprinciple be used to provide a range of importantservices to utility electrical grids (Kempton and
ARTICLE IN PRESST.E. Lipman et al. / Energy Policy 32 (2004) 101–125 103

Letendre, 1996; Kempton et al., 2001). When not in use,battery EVs could be used for emergency backup poweror to buffer the utility grid by charging off-peak, whenelectricity is plentiful, and supplying it back during timesof peak demand and capacity constraint. Hybridvehicles and FCVs could act as generators, producingelectricity from a liquid or gaseous fuel to meet thedemands of connected local loads or other nearby powerneeds.EVs could also provide certain types of support
services to utility grids, such as spinning reserves andgrid frequency regulation. While contracting for theseservices would likely require a service ‘‘aggregator’’ tobid the reserve or regulation function from EVs to localsystem operators, battery EVs in particular appear to bewell-suited to these uses. Alec Brooks of AC PropulsionInc. has estimated that the grid frequency regulationservice for California could be provided by 50,000–100,000 EVs, and these vehicles could provide thisservice as they were recharging their battery packs(Brooks, 2001).EVs could also provide remote power for construction
and other uses, and Dodge has recently unveiled aprototype hybrid electric pickup truck called the‘‘Contractor Special’’ that is designed for this purpose.EVs with onboard power generating capability couldalso potentially help to make grid-independent renew-able electricity generation more attractive by providingadditional electricity from the vehicle when the capacityof these renewable sources is not fully available or thepeak capacity needs to be supplemented.In fact, the potential for producing electrical power
from vehicles is enormous. We calculate that thegenerating capacity of an electrified US motor vehiclefleet would be approximately 14 times the entirecapacity of all of the stationary power plants in the
country!1 In California, a fleet of 100,000 FCVs couldproduce about 2.9GW of power for the grid, assuming30 kW net fuel cell output power per vehicle and 95%vehicle availability. Even if the vehicles were onlyavailable as generating capacity 50% of the time, about1.5GW of generating capacity could be provided byeach 100,000 vehicles. This 1.5GW of power representsapproximately 5% of California’s peak power demandon a typical day.The use of FCVs in this manner may be particularly
attractive since many automobile companies are cur-rently developing FCVs as replacements to conventionalinternal combustion engine vehicles. Rapid EV andFCV market penetration is expected in California due tothe pressure of the zero-emission vehicle (ZEV) man-date, promulgated by the California Air ResourcesBoard and also adopted by New York, Massachusetts,and Vermont. This mandate requires manufacturers toinclude low-emission and zero-emission vehicles amongthe vehicles that they deliver to the California market,and in increasing numbers beginning in 2003. Under thecurrent set of rules for the ZEV Mandate, which haverecently been revised and have grown more complexsince the mandate was originally approved in 1990,approximately 100,000 ZEVs may be on Californiastreets by 2010. See Fig. 1 for one scenario of ZEVintroduction levels in California as estimated by staff ofthe California Air Resources Board.Under the revised ZEV Mandate rules, the exact
number of ZEVs and other clean vehicles that eachmajor manufacturer will have to produce will varydepending on the strategy that each manufacturerchooses to adopt, and some ZEVs may be battery EVs
ARTICLE IN PRESS
0
50,000
100,000
150,000
200,000
250,000
300,000
350,000
400,000
450,000
2003
2004
2005
2006
2007
2008
2009
2010
2011
2012
2013
2014
2015
2016
2017
2018
Year
Num
ber
of Z
EV
s
Annual ZEV sales
Cumulative ZEV sales
Fig. 1. Annual and cumulative California ZEV sales forecast (example scenario) source: (California Air Resources Board, 2001).
1See Kempton and Letendre (1996) for similar estimates and further
details.
T.E. Lipman et al. / Energy Policy 32 (2004) 101–125104

rather than FCVs. However, most manufacturersappear to be focusing on FCVs as a primary ZEVoption, and even if only half of the ZEVs produced areFCVs, a total fleet of 100,000 FCVs can be expected inCalifornia by about 2015.Thus, with these California and other state regula-
tions encouraging their sale, and with their highpotential operational efficiencies and clean and quietoperation, FCVs may become ubiquitous once they areintroduced and have had time to penetrate motorvehicle fleets. Unlike battery EVs, which store andrelease electricity, FCVs can convert chemical energyinto electrical energy and can therefore act as DGresources. And, unlike hybrid EVs, FCVs can generateelectricity without combustion and with minimal noiseand emissions.Despite this potentially attractive possibility, how-
ever, the use of FCVs as distributed generating resourcesfaces technical, economic, and regulatory hurdles. Theseissues are discussed briefly below, followed by presenta-tion of modeling analysis of the potential costs, benefits,and emissions implications of using FCVs as distributedgenerators in residential and commercial settings. How-ever we first discuss the key findings of previous studies ofstationary fuel cells and FCVs for distributed power.
5. Previous research on PEM fuel cells and/or EVS and
distributed power
Several analyses have been conducted on the potentialfor small stationary PEM fuel cells to produce power forresidences and other buildings. These include studies byArthur D Little (Arthur D Little, 1994; Teagan andFriedman, 1994), Princeton University (Kreutz andOgden, 2000), and Directed Technologies Inc. (Thomaset al., 2000a, b, 1998), among others. These studies havegenerally concluded that PEM fuel cell systems forsingle family residences will only become attractivewhen system capital costs fall to relatively low levels,well below $1000/kW. However, these studies havefound that when larger systems are examined—systemsfor multi-family residential units and commercialapplications—the systems can be cost-effective atsomewhat higher capital cost levels. Furthermore, due
to scale economies fuel cell systems for these applica-tions are expected to cost somewhat less in terms of $/kW than fuel cells for smaller residential applications.These two factors taken together suggest that the multi-family and commercial market segments are likely to bemore attractive for early fuel cell technology, and thatmarkets for larger stationary fuel cell systems, on theorder of 100 kW or more, are likely to develop beforemarkets for smaller single-family fuel cell systems.The most recent published analysis of the potential
for EVs and FCVs to act as DG resources wasconducted by Kempton et al. (2001). This report wasprepared for the California Air Resources Board byresearchers at the University of Delaware, GreenMountain College, and the University of California.The analysis also involved collaboration with EVdrivetrain manufacturer AC Propulsion, Inc. ACPropulsion’s Generation 2 electric motor controller unitallows for bi-directional grid interface that can supportvehicle-to-grid (or ‘‘V2G’’) connections, and this systemhas demonstrated the technical feasibility and lowincremental cost of this type of arrangement. TheKempton et al. effort examined the economic potentialof using various types of EVs to produce power forbuildings and the grid, as well as to provide grid‘‘ancillary services’’ such as spinning reserves, non-spinning reserves, and grid frequency regulation.With regard to FCVs, Kempton et al. concluded that
FCVs could compete in the peak power market, withgenerating costs on the order of $0.18/kWh, but couldnot compete with baseload power. FCVs appear to bewell suited to provide a spinning reserves ancillaryservice to utility grids, but they are not as well suited toprovide a grid frequency regulation ancillary service asother EV types. Table 1 presents some of the keyfindings of the Kempton et al. report, in terms of therange of annual values that might be expected fordifferent EV types and for different services.Also, an earlier analysis of the potential for FCVs to
provide power for buildings was conducted by Kissock(1998). This analysis assumed that FCVs equipped with25 kW nominal (37.5 kW peak) PEM fuel cell systemswould be used to produce electricity, or electricity andheating/cooling in a cogeneration mode, for New Jerseyand Texas residences, for a New Jersey hospital, and for
ARTICLE IN PRESS
Table 1
Estimated vehicle owner’s annual net profit from V2G
Peak power Spinning reserves Regulation services
Battery, full function $267 (510�243) $720 (775�55) $3162 (4479�1317)Battery, city car $75 (230�155) $311(349�38) $2573 (4479�1906)Fuel cell, on-board H2 $-50 (loss) to $1226 (2200�974 to 2250) $2430 to $2685 (3342�657 to 912) $-2984 (loss) to $811 (2567�1756 to 5551)
Hybrid, gasoline $322 (1500�1178) $1581 (2279�698) $-759 (loss) (2567�3326)
Source: Kempton et al. (2001).
Note: The figures represent $net and (revenue�cost). These are representative mid-range figures extracted from full analysis in the report.
T.E. Lipman et al. / Energy Policy 32 (2004) 101–125 105
a Texas office building. The analysis focused extensivelyon the cogeneration prospects from FCVs, and theability of waste heat from the fuel cells to be used forboth space heating and to help to operate an absorptioncooling system for the building. The analysis assumedthat hydrogen would be produced onsite from naturalgas, and that natural gas would cost $7.50/GJ atresidences and $6.38/GJ at commercial locations. Theanalysis used fuel cell efficiency estimates based on aPEM fuel cell operating curve published by the AllisonGas Turbine division of General Motors, and thecalculated efficiencies of the fuel cell systems wererelatively high: on the order of 41–50% electricalefficiency (AC power generated/fuel in) and 79–83%total efficiency with cogeneration. The analysis includedcapital cost estimates for the vehicle ‘‘docking stations’’but we note that no additional maintenance or fuel cellstack refurbishment/replacement costs were assumed forthe additional use of the systems. The analysisconcluded that annual savings of up to $2500 perdocking station could be realized with the residentialsetting (with some cases showing negligible benefits),that annual savings of $1200 to $8800 were possible foreach docking station at the hospital, and that annualsavings of $2300 to $2900 were possible for the officebuilding (Kissock, 1998).
6. Key technical and regulatory issues for FCVs used as
distributed generation
Despite the potential benefits of using FCVs toproduce power when the vehicles are parked, there areseveral key issues confronting the use of FCVs in thismanner. Some of these issues, and some potentialsolutions, are as follows.
6.1. Fuel cell operation
Problems: Non-hybrid fuel cell systems with 75–100 kW peak power (a typical power level for full-sizedvehicles) will likely be power limited to 30 or 40 kW forcontinuous operation while the vehicle is at a standstilldue to thermal management issues. Fuel cell systemsconnected to loads in grid-independent operation maybe subject to transient demands that would require ahydrogen fuel supply buffer and/or battery supportsystem for adequate performance (if no battery pack isincluded in the onboard vehicle power system). Also,operating fuel cell systems in residential settings andmeeting local loads only, which are often as low as 1–2 kW and rarely exceed 4–5 kW, will likely produce lowfuel cell system operating efficiencies (if even possibledue to turndown ratio limitations), particularly forstacks designed to operate at high pressure due to thehigh parasitic compressor loads for these systems.
Solutions: Operate fuel cell systems at 10–30 kW andsupply several buildings or sell excess power to gridthrough net metering or other ‘‘buyback’’ scenarios.Alternately, develop off-board auxiliary ‘‘blower’’ airsupply systems for fuel cell stacks that allow lowpressure, higher efficiency operation at low load levels,or design the FCV fuel cell system to have a second ‘‘lowpower mode’’ for stationary power generation, whereonly a portion of the full fuel cell stack is used (e.g.similar to ‘‘displacement on demand’’ systems inconventional vehicles).
6.2. Fuel supply
Problems: Vehicles designed to operate on purehydrogen may not be able to use reformate (a mix ofhydrogen and other gases, produced from a liquid orgaseous hydrocarbon fuel) due to carbon monoxide andsulfur catalyst poisoning issues. In order to operate forlonger than a few hours, vehicles will require some sortof hydrogen production support system based on steammethane reforming (SMR), electrolysis, partial oxida-tion reforming, or auto thermal reforming.
Solutions: Use vehicle stacks with platinum-ruthe-nium catalysts that can operate on either neat hydrogenor reformate (e.g., Ballard Mark 900), or producepurified hydrogen at commercial sites (and have noresidential option for neat hydrogen vehicles other thanemergency power using the fuel in the vehicle’s tank).Focus R&D on developing low-cost hydrogen refor-mers, particularly continuing the development of multi-fuel reformers for vehicles that can run on natural gas aswell as the vehicle’s primary fuel.
6.3. Grid interconnection
Problems: Reverse flow of electricity from EVs iscurrently not permitted under the National ElectricalCode in event of loss of power in the grid. Power flowinto local distribution systems eventually will reach alimit due to difficulties in reverse flow into high-voltagetransmission system. In the residential scenario, morethan one household in 10 or 20 with grid-connectedFCVs at 5–30 kW could be problematic, depending ondistribution system topology and locations of othergenerators and loads. Utility on/off control of grid-connected EVs may be essential for lineworker safety,requiring a complex control system.
Solutions: Revise National Electrical Code to allowreverse-flow from vehicles for backup generation, withappropriate safeguards, in parallel with efforts to allowresidential PV systems to be used in a similar manner.Analyze retrofitting substations to ensure that ‘‘tapchangers’’ and line-drop compensators are compatiblewith reverse flow into high voltage transmissionssystems, if this can be done with a reasonable level of
ARTICLE IN PRESST.E. Lipman et al. / Energy Policy 32 (2004) 101–125106
efficiency loss. Investigate utility-to-vehicle wirelesscommunication technology to provide emergency shut-down, real time load, and electricity price informationfor utility control centers and vehicle owners.
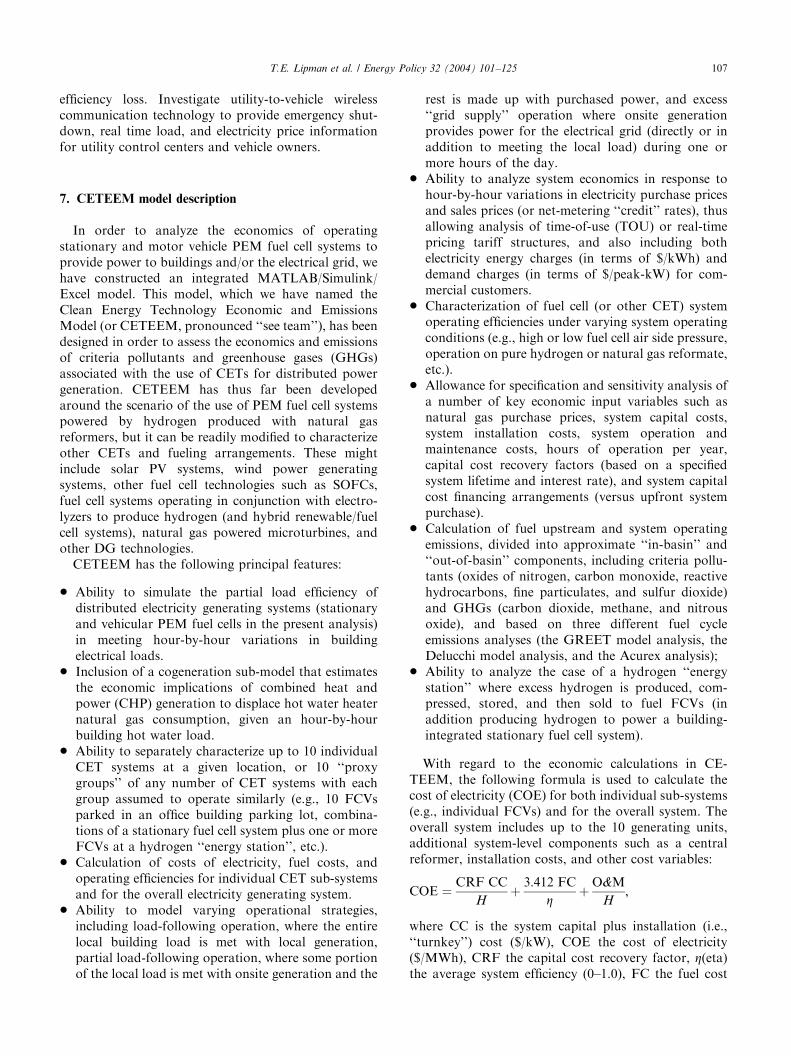
7. CETEEM model description
In order to analyze the economics of operatingstationary and motor vehicle PEM fuel cell systems toprovide power to buildings and/or the electrical grid, wehave constructed an integrated MATLAB/Simulink/Excel model. This model, which we have named theClean Energy Technology Economic and EmissionsModel (or CETEEM, pronounced ‘‘see team’’), has beendesigned in order to assess the economics and emissionsof criteria pollutants and greenhouse gases (GHGs)associated with the use of CETs for distributed powergeneration. CETEEM has thus far been developedaround the scenario of the use of PEM fuel cell systemspowered by hydrogen produced with natural gasreformers, but it can be readily modified to characterizeother CETs and fueling arrangements. These mightinclude solar PV systems, wind power generatingsystems, other fuel cell technologies such as SOFCs,fuel cell systems operating in conjunction with electro-lyzers to produce hydrogen (and hybrid renewable/fuelcell systems), natural gas powered microturbines, andother DG technologies.CETEEM has the following principal features:
* Ability to simulate the partial load efficiency ofdistributed electricity generating systems (stationaryand vehicular PEM fuel cells in the present analysis)in meeting hour-by-hour variations in buildingelectrical loads.
* Inclusion of a cogeneration sub-model that estimatesthe economic implications of combined heat andpower (CHP) generation to displace hot water heaternatural gas consumption, given an hour-by-hourbuilding hot water load.
* Ability to separately characterize up to 10 individualCET systems at a given location, or 10 ‘‘proxygroups’’ of any number of CET systems with eachgroup assumed to operate similarly (e.g., 10 FCVsparked in an office building parking lot, combina-tions of a stationary fuel cell system plus one or moreFCVs at a hydrogen ‘‘energy station’’, etc.).
* Calculation of costs of electricity, fuel costs, andoperating efficiencies for individual CET sub-systemsand for the overall electricity generating system.
* Ability to model varying operational strategies,including load-following operation, where the entirelocal building load is met with local generation,partial load-following operation, where some portionof the local load is met with onsite generation and the
rest is made up with purchased power, and excess‘‘grid supply’’ operation where onsite generationprovides power for the electrical grid (directly or inaddition to meeting the local load) during one ormore hours of the day.
* Ability to analyze system economics in response tohour-by-hour variations in electricity purchase pricesand sales prices (or net-metering ‘‘credit’’ rates), thusallowing analysis of time-of-use (TOU) or real-timepricing tariff structures, and also including bothelectricity energy charges (in terms of $/kWh) anddemand charges (in terms of $/peak-kW) for com-mercial customers.
* Characterization of fuel cell (or other CET) systemoperating efficiencies under varying system operatingconditions (e.g., high or low fuel cell air side pressure,operation on pure hydrogen or natural gas reformate,etc.).
* Allowance for specification and sensitivity analysis ofa number of key economic input variables such asnatural gas purchase prices, system capital costs,system installation costs, system operation andmaintenance costs, hours of operation per year,capital cost recovery factors (based on a specifiedsystem lifetime and interest rate), and system capitalcost financing arrangements (versus upfront systempurchase).
* Calculation of fuel upstream and system operatingemissions, divided into approximate ‘‘in-basin’’ and‘‘out-of-basin’’ components, including criteria pollu-tants (oxides of nitrogen, carbon monoxide, reactivehydrocarbons, fine particulates, and sulfur dioxide)and GHGs (carbon dioxide, methane, and nitrousoxide), and based on three different fuel cycleemissions analyses (the GREET model analysis, theDelucchi model analysis, and the Acurex analysis);
* Ability to analyze the case of a hydrogen ‘‘energystation’’ where excess hydrogen is produced, com-pressed, stored, and then sold to fuel FCVs (inaddition producing hydrogen to power a building-integrated stationary fuel cell system).
With regard to the economic calculations in CE-TEEM, the following formula is used to calculate thecost of electricity (COE) for both individual sub-systems(e.g., individual FCVs) and for the overall system. Theoverall system includes up to the 10 generating units,additional system-level components such as a centralreformer, installation costs, and other cost variables:
COE ¼CRF CC
Hþ3:412 FC
ZþO&M
H;
where CC is the system capital plus installation (i.e.,‘‘turnkey’’) cost ($/kW), COE the cost of electricity($/MWh), CRF the capital cost recovery factor, Z(eta)the average system efficiency (0–1.0), FC the fuel cost
ARTICLE IN PRESST.E. Lipman et al. / Energy Policy 32 (2004) 101–125 107

($/GJ), H the hours of operation per year, divided by1000, and O&M the operation and maintenance costs($/kW-year).This COE formula is a common one that is widely
used, for example in US DOE (2000). It is important tonote that by using a capital cost recovery factor toaccount for system depreciation, this formula assumes aconstant or ‘‘straight-line’’ depreciation schedule. Ana-lysis of system economics with more complicateddepreciation schedules would require the use of adifferent formula, and then the system economics woulddepend to some extent on the year of analysis relative tothe system lifetime. In the CETEEM model, we modifythis formula slightly by using a factor of 1/1000 in orderto produce COE estimates in terms of $/kWh ratherthan $/MWh.With regard to the basic structure of CETEEM, one
important feature is that the model is capable ofanalyzing the efficiency of one or more CET systemsas a function of the load that each individual unit ismeeting. The model thus includes data for each system’sefficiency as a function of load point in relation to thesystem’s gross power rating. This is important particu-larly for cases where loads are varying significantly, andwhere there is a significant potential mismatch betweenthe system’s power level and the load to which it isconnected (such as in the case of large vehicular fuel cellsystems meeting small residential loads). It is also moreimportant for technologies that exhibit strong variationsin efficiency with load, such as high-pressure fuel cellsystems with high auxiliary loads, than it is fortechnologies that have relatively flat efficiency curves.However, it is important to note that CETEEM is
based on hour-by-hour building load profiles, and notmore highly resolved load shape data. In general, evenhour-by-hour load shape data are difficult to obtain, buta more sophisticated analysis of the effects of ‘‘tran-sient’’ operation in load-following applications wouldrequire second-by-second or even greater resolution inload shape data. Such analyses would also require ahighly detailed system performance analysis model thatincludes analysis of the interactions between majorsystem components, component lag times in response tocontrol signals, and so on. Thus, the intent of thisanalysis is to characterize the general efficiencies ofoperation that could be expected based on the loadshape data used, rather than to characterize the detailsof transient operation and the additional efficiencyimplications of detailed second-by-second interactionbetween generating system and load.In fact, meeting the exact transient loads of buildings
in load-following applications represents a formidablechallenge for fuel cell systems. Fuel cell stacks andsystems can respond quite rapidly to transient powerdemands, but natural gas fuel reformers tend to havesomewhat slower response. Furthermore, electrical
loads are often characterized by ‘‘spikes’’ in demandthat last for only short periods, such as when an airconditioner compressor motor suddenly switches on.Meeting these transient demands for power can beaccomplished either by using the utility grid as a buffer(as discussed above in the context of ‘‘short term’’ net-metering), or by including a peak power device in thefuel cell system such as a battery or ultracapacitor thathelps to ‘‘load-level’’ the fuel cell. Furthermore, fuelbuffers can be used to allow faster system response andto avoid the limitations of fuel processor ramp-up rates.Thus, it is important to note that this analysis does notexplicitly consider the issue of short transients in loaddemand and the effects that these have on systemperformance, but rather seeks to characterize the broadsystem efficiency implications of meeting loads that arecharacterized with hour-by-hour variation. We thereforeassume that there are peak power devices in both thestationary and vehicle-based systems that allow the fuelcell systems to operate in response to relatively graduallyfluctuating loads. In the absence of such a peak powerdevice, fuel cell system operation would be morevariable and overall electrical efficiency would likelysuffer to some extent as a result.The efficiency characterizations for PEM fuel cells for
FCVs have been derived from a detailed fuel cell systemmodeling effort that used a MATLAB/Simulink modelto characterize the interactions of PEM fuel cell stackswith air compressors and other system auxiliaries, andto optimize system operation by varying hydrogen andair pressure and mass flow conditions (Friedman et al.,2000). We use optimized fuel cell system efficiencyversus load characterizations (as a function of percent ofpeak system power) from this modeling effort toconstruct ‘‘lookup tables’’ that are then used inCETEEM to estimate system efficiency values with each1% change in load as a function of peak system power.We use these model results to characterize pure
hydrogen and high air-side pressure fuel cell systemoperation, which uses a twin-screw type compressor tomove air through the fuel cell stack, pure hydrogen andlow air-side pressure operation, where a simple blower isused to propel air through the stack, and methanolreformate and high air-side pressure operation. Weassume that when vehicles are operated on natural gasreformate, performance is similar to performance onmethanol reformate since both types of reformate havehydrogen concentrations on the order of 70% (dry).Finally, in order to characterize stationary fuel cellsystem operation on natural gas reformate, we use theprofile for low pressure operation on neat hydrogen butscale the numbers to match company claims for overallefficiency of the Plug Power residential PEM fuel cellsystem, assuming 85% hydrogen utilization and a 75%efficient reformer. These results produce slightly higherefficiencies than the curves for automotive fuel cell
ARTICLE IN PRESST.E. Lipman et al. / Energy Policy 32 (2004) 101–125108

systems, even those for operation on pure hydrogen.While efficiencies for fuel cells operating on purehydrogen will be greater than for operation onreformate when ‘‘all else is equal’’, higher efficiency ismore important for stationary applications (due tonearly continuous operation and the burden of fuel coston overall operating cost). This higher efficiency couldbe achieved by maintaining relatively high cell voltagesand accepting some reduction in stack power density,and this is in effect what we are assuming for stationaryfuel cell operation. Fig. 2 presents the system efficiencycurves used for various system configurations, relative tothe peak efficiency point of the highest curve.
8. Analysis cases and input variables
In this analysis, we consider two basic settings forstationary and FCV-based fuel cell power, and weconsider the potential use of the vehicles as a significantresource that is used routinely by coupling vehicles to astationary natural gas reformer as a hydrogen supplysystem.2 In previous efforts (Kempton et al., 2001) wefound that the use of FCV based power appears to besuited to the peak power market, where power issupplied for short periods only when the generatingcost is high. However, we did not fully investigate thepotential for more expanded use of FCV-based power,
where loads can be powered throughout a several-hourdaily peak building load, net-metered billing can beused, and the capital costs of a separate reformer/hydrogen supply can potentially be justified. Therefore,the goal of the present analysis is to examine thisexpanded case of the use of FCVs for power generation,where each vehicle is used for 2000–4000 h per year toproduce on the order of 30–60MWh per year.The settings analyzed are a medium-sized California
office building, with an electrical load that varies fromabout 30 kW at night to up to about 300 kW duringpeak periods, and a California residential setting with aload that varies from under 1 kW to almost 4 kW at thepeak hour in the summer. The residential householdload profiles that we use are somewhat higher than theaverage California household, and therefore represent arelatively large household, but we hypothesize thatrelatively large households are more likely to be ownersof FCVs in the 2010–2015 timeframe.We also consider two basic operating strategies for
each fuel cell system and building combination. Theseare a ‘‘load following’’ case in which the fuel cell systemsimply follows the electrical load of the building whenthe fuel cell system is available, and a ‘‘net metering’’case in which additional power is allowed to be suppliedto the utility grid and withdrawn later. For purposes ofthis analysis, we consider the case of a net meteringpolicy that allows extra power to be supplied to the gridonly during the hours of 12 PM to 8 PM so that theadditional power is supplied during periods of peakdemands on the utility grid. We believe that this type ofnet metering scheme makes the most sense because,
ARTICLE IN PRESS
0
0.1
0.2
0.3
0.4
0.5
0.6
0.7
0.8
0.9
1
0% 10% 20% 30% 40% 50% 60% 70% 80% 90% 100%
Percent of Peak Power
Rela
tive E
ffic
ien
cy
High Pressure Neat H2 (Vehicle)
Low Pressure Neat H2 (Vehicle)
High Pressure Reformate (Vehicle)
Low Pressure Reformate (Stationary)
Fig. 2. PEM fuel cell system relative efficiency as a function of load and operating condition.
2Hydrogen FCVs used for stationary power could also in principle
be fueled with hydrogen produced from an onboard ‘‘multi-fuel’’
reformer, an on or off-board electrolyzer, or fuel stored onboard.
T.E. Lipman et al. / Energy Policy 32 (2004) 101–125 109

unlike renewable solar PV and wind systems that tend tonaturally produce the most power during the approx-imate times of grid peak, fuel cell systems can beoperated at different power levels at anytime of the dayor night. An unrestricted net metering policy for fuelcells would allow excess power to be supplied at non-peak periods for the grid, and this would be much lessuseful in terms of maximizing the capacity factors ofcentral ‘‘baseload’’ generating plants and minimizing theneed for ‘‘peaker’’ plants.Also, in the FCV cases we consider the case of non-
hybrid FCVs that are entirely powered by a 75 kW(peak) fuel cell system and the case of hybrid FCVs thatare powered by a 20 kW (peak) fuel cell system inconjunction with a battery peak power system. We dothis because we hypothesize that hybrid FCVs withsmaller fuel cell systems will perform better whenmatched up with residential loads than non-hybridFCVs with larger fuel cell systems.However, based on conversations with fuel cell system
developers, we effectively limit the amount of poweravailable from the 75 kW systems to 30 kW. We do thisbecause continuous operation of these 75 kW systems atpower levels higher than 30–40 kW may lead to systemoverheating since, unlike when vehicles are being driven,radiative ‘‘ram air’’ cooling is not available whenvehicles are parked. The actual limits on the level ofFCV power when the fuel cell system is operatedcontinuously while the vehicle is stationary will dependon the design of the vehicle’s cooling system, theambient temperature where the vehicle is operated,and any limits of the electrical system that transmits theelectricity from the vehicle to the building or utility grid.For residential applications, this limit may be closer to16–17 kW than 30 kW due to the electrical limits ofresidential system wiring (see Kempton et al., 2001 forfurther discussion). We therefore do not allow powerlevels over 17 kW in any of our residential casesimulations (when net metering allows higher powerlevels to be provided than the level of the house’s localelectrical load, which never exceeds 3.8 kW).
Unlike in Kissock (1998), for purposes of this analysiswe do not assume that FCVs are used in a cogenerationmode to produce both electricity and heating/cooling forbuildings. In our opinion, it is unlikely that FCVs willprove to be attractive as cogenerators for the followingreasons:
* Use of FCVs for cogeneration would require a set ofheat exchange hookups in addition to electricalconnections, and this would add cost and complexityto the use of FCVs for DG and would potentiallymake this type of arrangement less convenient forconsumers.
* PEM fuel cells operate at relatively low temperaturesof 80–901C and the low grade of waste heat availablewould probably not be practical for absorptioncooling (cooling loads are higher than heating loadsfor many California buildings during many monthsof the year).
* Similarly, use of PEM fuel cell waste heat for hotwater heating would require careful integration withhot water systems and would likely require close-coupling to the hot water heater to be attractive,reducing the likelihood that vehicles parked inparking lots would be practical for use in providinghot water (vehicles parked in residential garages maybe more practical for cogeneration but still wouldrequire potentially expensive heat exchange couplingsystems to be retrofitted with the hot water heater foruse in this way).
Thus, we consider the potential for cogeneration to beunlikely for FCVs, and we consider cogeneration of hotwater to be a potential competitive advantage ofstationary fuel cells compared with FCVs used in DGmode.We consider 10 main cases in this analysis, and these
are shown in Table 2, along with 3 different sets of costassumptions for each case. We also consider a fewadditional cases that include variations in the utilitytariff structures that are available to residential andcommercial customers (e.g., time-of-use billing). For the
ARTICLE IN PRESS
Table 2
Basic cases analyzed
Case Setting FC system FC operation Code
Case 1 Residential Stationary 5 kW hot water cogen Load following low pressure SR5LFLR
Case 2 Residential Stationary 5 kW hot water cogen Net metering low pressure SR5NMLR
Case 3 Office building Stationary 250 kW hot water cogen Load following low pressure SO250LFLR
Case 4 Office building Stationary 250 kW hot water cogen Net metering low pressure SO250NMLR
Case 5 Residential 1 Vehicle 75 kW (30 kW max power) no cogen Load following high pressure VR75LFHR
Case 6 Residential 1 Vehicle 75 kW (30 kW max power) no cogen Net metering high pressure VR75NMHR
Case 7 Residential 1 Vehicle 20 kW (hybrid FC/battery) no cogen Load following high pressure VR20LFHR
Case 8 Residential 1 Vehicle 20 kW (hybrid FC/battery) no cogen Net metering high pressure VR20NMHR
Case 9 Office building 1–10 Vehicles 75 kW (300 kW max power) no cogen Load following high pressure VO75LFHR
Case 10 Office building 1–10 Vehicles 75 kW (300 kW max power) no cogen Net metering high pressure VO75NMHR
T.E. Lipman et al. / Energy Policy 32 (2004) 101–125110

stationary fuel cell system cases, we assume that the fuelcell systems operate under low fuel cell stack air-sidepressure and use natural gas reformate for fuel contain-ing 70% hydrogen by volume. For the vehicle fuel cellsystem cases, we assume that the fuel cell systemsoperate under higher fuel cell stack air-side pressurewith higher auxiliary system parasitic loads (because thisis the type of system that most FCV developers arefocusing on), and again that the fuel source is naturalgas reformate that contains 70% hydrogen by volume.
9. Building electrical and hot water load profiles
With regard to the building electrical load profilesused in the analysis, it is worth noting that hour-by-hourbuilding load profiles, and especially residential loadprofiles, are notoriously difficult to obtain and tend torepresent the average loads of many buildings ratherthan the specific load of a single building. However,there are some hour-by-hour building load profiles inthe public domain. For purposes of this analysis, we useresidential and office building load profiles that havebeen published by Arthur D Little (ADL) (1994) as astarting point. These load profiles are described asrepresenting peak day loads for sites in a southernregion of the US. In order to characterize a typical yearof operation, it is necessary to consider variations inthese building load profiles over the course of the year.We accomplish this by adopting a convention used insome commercial building load profile databases where-by a month of the year is characterized with three ‘‘daytypes’’: a ‘‘peak day’’ that represents the average of thethree peak days of the month; a ‘‘week day’’ thatrepresents the average of the remaining 19 week days in
a typical month, and a ‘‘weekend day’’ that representsthe average of the 8 weekend days in a typical month.Having established these day types, we then apply
statistical variation that we observe in proprietary loadshape databases that are specific to California toapproximate the seasonal variations in load profilesthat might be expected for these two types of buildingloads. In other words, we apply observed annualvariation in California office building loads andresidential loads to the ADL load shapes to develop afamily of load shape curves that can then be used tocharacterize a typical year with multiple runs ofCETEEM. In order to reduce the number of runsnecessary for each case, we characterize the 12 monthsof the year with four representative months: January, torepresent the Winter months of December, January, andFebruary; April to represent the Spring months ofMarch, April, and May; July to represent the Summermonths of June, July, and August; and October torepresent the Fall months of September, October, andNovember. These simplification means that a typicalyear can be modeled with 12 runs of CETEEM; threeday types to characterize each month, and then fourrepresentative months to characterize the 12 months ofthe year.Figs. 3–6 depict the load shapes used to characterize
the office building and residential location electricitydemands. Figs. 3 and 6 show the seasonal variations inload shapes for residential and office building cases. Fig.4 shows an example load shape for one day of theresidential case (a July peak day), along with sample netmetering profile for the same day for power generatedfrom an FCV. As shown in the figure, excess power issupplied when the vehicle arrives home at 6 PM and thiscontinues until 8 PM. From 8 PM until 8 AM, the fuelcell system simply follows the load of the building, and
ARTICLE IN PRESS
0.0
0.5
1.0
1.5
2.0
2.5
3.0
3.5
4.0
1 2 3 4 5 6 7 8 9 10 11 12 13 14 15 16 17 18 19 20 21 22 23 24
Hour
Load
(kW
)
JaWD
JaPD
JaWE
ApWD
ApPD
ApWE
JlWD
JlPD
JlWE
OcWD
OcPD
OcWE
Fig. 3. California large residential site load shape patterns.
T.E. Lipman et al. / Energy Policy 32 (2004) 101–125 111

then when the vehicle is gone during the day the net-metered energy credit is withdrawn. In the base cases, weassume that the buildings have a net energy balance ofzero at the end of every month and that the buildingload is followed when excess energy is not being addedto the grid, but in a sensitivity case we examine thepossibility of optimizing the efficiency of the FCV byhaving the fuel cell system operate only at its peakefficiency point and for some energy credit to be carriedover from month to month, with a net energy balance ofnear zero on an annual basis. Fig. 5 shows one of the netmetering cases, in which an FCV is used to produce upto 17 kW of power at a residential setting when it is firstplugged in at the end of the day (and when the grid still
needs power), while Fig. 7 shows the hot water loadprofiles that are met in the stationary fuel cellcogeneration cases.In the figures, ‘‘Ja’’ stands for January, ‘‘Ap’’ stands
for April, ‘‘Jl’’ stands for July, ‘‘Oc’’ stands for October,‘‘WD’’ stands for weekday, ‘‘PD’’ stands for peak day,and ‘‘WE’’ stands for weekend day. The residential loadshapes characterize a large single family home, while theoffice building load shapes characterize a medium-sizedoffice building with typical electrical demands. Ofcourse, every building is different and these load shapepatterns may not accurately represent specific sites withhighly unique demand patterns, even for similarbuilding types as those assumed here.
ARTICLE IN PRESS
0.0
2.0
4.0
6.0
8.0
10.0
12.0
14.0
16.0
18.0
1 2 3 4 5 6 7 8 9 10 11 12 13 14 15 16 17 18 19 20 21 22 23 24
Hour
Bui
ldin
g or
Fue
l Cel
l Loa
d (k
W)
Excess Power Added
Credited Power Withdrawn
Fig. 4. Residential daily load profile and example FCV net metering load pattern.
0.0
2.0
4.0
6.0
8.0
10.0
12.0
14.0
16.0
18.0
1 2 3 4 5 6 7 8 9 10 11 12 13 14 15 16 17 18 19 20 21 22 23 24
Hour
Load
(kW
)
JaWD
JaPD
JaWE
ApWD
ApPD
ApWE
JlWD
JlPD
JlWE
OcWD
OcPD
OcWE
Fig. 5. California large residential site modified fuel cell load patterns for FCV net metering.
T.E. Lipman et al. / Energy Policy 32 (2004) 101–125112

10. Economic variable input assumptions
This analysis is intended to estimate the potentialcosts of using stationary and automotive fuel cells fordistributed power in the 2010–2015 timeframe. Thus, weanalyze cases with fuel cell system capital costs that aremuch lower than present-day capital costs for PEM fuelcells, which we believe to be on the order $3000–4000per kW3. PEM fuel cells are an emerging technology
that is just beginning to become commercial after adecade of intense development throughout the 1990s, andcosts are expected to fall sharply as production volumeand manufacturing experience grow. However, manufac-turing costs and sale prices of PEM fuel cells and naturalgas reformers in higher volume production are uncertain,owing to several variables that can affect manufacturingcost. These variables include production volume, productdesign, material choices and material utilization rateimprovements, production process development, and costvs. efficiency tradeoffs with regard to fuel cell systemoperation (e.g., higher efficiency levels can be maintainedwith larger and more expensive fuel cell stacks).
ARTICLE IN PRESS
0
50
100
150
200
250
300
350
1 2 3 4 5 6 7 8 9 10 11 12 13 14 15 16 17 18 19 20 21 22 23 24
Hour
Load
(kW
)
JaWD
JaPD
JaWE
ApWD
ApPD
ApWE
JlWD
JlPD
JlWE
OcWD
OcPD
OcWE
Fig. 6. California medium office building site load shape patterns.
0
2
4
6
8
10
12
14
16
18
20
1 2 3 4 5 6 7 8 9 10 11 12 13 14 15 16 17 18 19 20 21 22 23 24
Hour
Hot
Wat
er L
oad
(kW
)
Residential HWL
Office Building HWL
Fig. 7. Residential and office building hot water load profiles source: (Arthur D Little, 1994).
3PEM fuel cell manufacturing costs are proprietary, and even selling
prices are difficult to determine at present because systems in the
5–250 kW size range are not yet commercially available.
T.E. Lipman et al. / Energy Policy 32 (2004) 101–125 113

With regard to the costs associated with FCV-basedpower, we explicitly assume that the additional use ofFCVs to provide power to buildings entails additionalcosts in terms of fuel cell stack refurbishments that arerequired as fuel cell system components wear out.However, we do not include initial capital costs forthese systems because we assume that they arepurchased for use in powering the vehicles and thatthe use for DG is a side-use that entails only theincremental costs associated with the additional use. Weassume that fuel cell systems for vehicles are designedfor the typical operational lifetimes of vehicles, on theorder of 4000–5000 h of operation, and that theadditional use for power generation results in significantcosts that the vehicle owners must pay. We feel that it isimportant to include these costs because PEM fuel cellsystem durability is a key development issue that iscurrently being addressed, and the future level ofdurability of PEM fuel cells for vehicle and stationaryapplications is uncertain. Simultaneously achieving costand durability goals for PEM fuel cells is a significantchallenge, and we therefore assume that fuel cell costsare greatly reduced from present levels by 2010–2015 butthat durability remains an issue. We assume varyinglevels of fuel cell system durability for the automotivefuel cells used for stationary power generation, rangingfrom 4000 h in our high cost cases to 10,000 h in ourmedium cost cases, to 40,000 h in our low cost cases. Weuse this wide range of operational hours between majorrefurbishments because PEM fuel cell systems may ormay not prove to be very durable, and we allow forrelatively long periods between refurbishments becausethe demands on the systems for stationary powergeneration may have a somewhat lesser impact ondurability than during driving owing to the lack ofvibration and the relatively low power levels.We would also like to point out that for the residential
cases, we assume natural gas costs in the range of $4/GJto $10/GJ, with a medium cost case value of $6/GJ. Thehigh cost case value of $10/GJ was selected becauseresidential costs at the retail level were in fact this highin California for several months during the winter of2000–2001, and the spot market price reached anamazing level of $60/GJ at one point in December of2000. At the present time in late 2001, natural gas costshave declined to more reasonable levels, on the order of$5–6/GJ, and it is unlikely that prices as high as $10/GJwill prevail over the course of an entire year. With thebenefit of hindsight we thus consider our high cost caseto be a rather conservative and unlikely case, but at thetime this analysis was being initiated we did not feel thatwe could safely rule out such high natural gas prices andtherefore included them in the high cost case. Tables 3and 4 summarize the basic assumptions that underlie thecases analyzed. See table notes for details of the inputvalues selected for the various cases.
11. Net metering TOU tariff schedules
In addition to the constant electricity price rangesshown in Tables 3 and 4 (coupled with electricity fixedmonthly charges and demand charges in the officebuilding case), we also consider cases in whichcustomers can qualify for time-of-use (TOU) rateschedules. In these cases, the price of electricityfluctuates throughout the day and from season toseason. Under these rate schedules, when excess poweris supplied to the utility grid under the assumption of netmetering, the supplied power is credited with theelectricity price that prevails at that particular time,and when power is withdrawn it is charged the price atthat time. In the primary case, we assume that electricitysupplied to the grid is credited with the ‘‘avoided’’generation cost only and not with the full retail rate.However, we also consider a case in which the customeris credited with the full retail TOU rate, as solar PVcustomers that qualify for both net metering and TOUrates are currently allowed in California.4 Figs. 8 and 9show the full retail and ‘‘generation cost only’’ TOUrates that we assume for those cases. These rates arebased on Southern California Edison rate schedulesSCE TOU-D-2 for residential customers and SCE TOU-GS-1 for commercial customers.
12. Analysis results
A sample of detailed results of this analysis arepresented in Tables 5–12, and key results are summar-ized in Figs. 10–12.5 In our presentation of the analysisresults here, we focus on the office building cases thatcompare a 250-kW stationary fuel cell with the use often 75-kW FCVs (used at up to 30 kW each), and theresidential cases that compare a 5-kW stationary fuelcell with the use of a 20-kW hybrid FCV. With regard tothe general nature of the results of this analysis, wewould first like to point out that for purposes of theanlaysis we deliberately assumed relatively low capitalcosts for stationary fuel cell systems (but did vary themsomewhat in the high/medium/low cases), in order to setup a competitive analysis with regard to the potential forFCV-based power. Our stationary PEM fuel cell casesalso benefit somewhat from our assumption that hot
ARTICLE IN PRESS
4AB 918, passed on September 30, 2000 requires California utilities
to honor retail TOU rates for qualifying net metering customers in
their service territories.5For a complete report of detailed results, please see: Lipman,
Timothy E., Jennifer L. Edwards, and Daniel M. Kammen (2002),
‘‘Economic Implications of Net Metering for Stationary and Motor
Vehicle Fuel Cell Systems in California’’, Program on Workable
Energy Regulation (POWER) Paper Series, PWP-092, University of
California Energy Institute (UCEI), February. Available: http://
socrates.berkeley.edu/Brael/papers.html.
T.E. Lipman et al. / Energy Policy 32 (2004) 101–125114

water cogeneration is possible from stationary fuel cellsystems and not from FCVs.In the case of the 5-kW residential fuel cell system
(Tables 5 and 6), costs of electricity are estimated to vary
from $0.056/kWh to $0.294/kWh depending on eco-nomic variable assumptions, and load following opera-tion versus our example net-metered operation case. Inour medium cost case with installed system capital costs
ARTICLE IN PRESS
Table 3
Basic assumptions for residential and office building stationary fuel cell cases
Residential setting Office building setting
Type Large single family Medium-sized office
Electrical load 0.5–3.8 kW 24–290kW
Fuel cell 5 kW PEM 250 kW PEM
Fuel cell operation Low air side pressure, pipeline NG reformate
fuel
Low air side pressure, pipeline NG reformate
fuel
Cogeneration of hot water (based on hot
water load profile)
Yes Yes
Reformer efficiency 70% SMR or ATRa 70% SMR or ATRa
Fuel cell system efficiency (stack, compressor,
and WTM)
Varies with load (see results) Varies with load (see results)
Hydrogen utilization by FC (natural gas
reformate)
85%b 85%b
Power inversion, control, and conditioning,
efficiency
92%c 92%c
Fuel cell system capital cost $500/kW,$1200/kW, $2500/kWd $400/kW, $700/kW, $1000/kWe
Reformer capital cost Included in FC cap. cost Included in FC cap. cost
Fuel cell O&M cost Varies with casef (see results tables) Varies with caseg (see results tables)
Reformer O&M cost Included in FC O&M Included in FC O&M
Natural gas fuel cost $4/GJ, $6/GJ, S10/GJ $3/GJ, $4/GJ, $6/GJ
Electricity energy charge (see text for TOU
cases)
0.15/kWh, $0.12/kWh, $0.10/kWh 0.08/kWh, $0.06/kWh, $0.05/kWh
Electricity demand charge N/A $12/kW-pk, $9/kW-pk, $7/kW-pk
Electricity monthly charge N/A $200/month
Days of FC operation per year 365 days/yr 365 days/yr
Hours of FC operation per year 8760 (load following), 2520 (net metering) 8760 (load following), 5184 (net metering)
Notes and sources: When three values are listed, the first value refers to the estimate used in the ‘‘low cost’’ case, the second value refers to the estimate
used in the ‘‘medium cost’’ case, and the third value refers to the estimate used in the ‘‘high cost’’ case.aWe assume that by 2010 small steam methane reformer (SMR) or autothermal reformer (ATR) units operate at 70% efficiency, in terms of the
LHV of hydrogen out/the LHV natural gas + accessory loads in, based on Aspen model simulations reported in Kreutz and Ogden (2000).bWe assume that actual hydrogen utilization rates of 85% are achieved in fuel cell stacks operating on natural gas reformate due to the need to
periodically purge impurities from the fuel cell stack anodes and the need to maintain usable hydrogen gas concentrations at the tail ends of the
individual fuel cell flowfields. Higher utilization rates would be achievable with the use of pure hydrogen, rather than reformate, and/or improved
system control strategies.cWe assume that AC inverter plus system control efficiency levels of 92% are achieved in both stationary and vehicle fuel cell systems.d Installed capital costs in the 2010–2015 timeframe of $500/kW, $1200/kW, and $2500/kW are assumed for 5 kW stationary fuel cells based on cost
targets recently suggested by General Motors on the low end, and detailed cost estimates conducted by Directed Technologies Inc. (Thomas et al.,
2000a) on the high end. We assume aggressive cost targets for these systems to set a ‘‘high bar’’ for FCV-based power to compete.eFor 250 kW stationary PEM systems, we assume installed capital costs of $400/kW, $700/kW, and $1000/kW because these systems should have
lower costs per kW than much smaller systems and again to determine whether or not FCV-based power can be competitive with stationary fuel cell
power if these aggressive cost targets are achieved.fOperation and maintenance (O&M) costs for 5 kW stationary fuel cell systems include scheduled maintenance of $100, $150, and $200 every year
in the three cost cases, plus fuel cell stack refurbishment costs of 20%, 33%, and 40% of the total system costs ($500/kW, $1200/kW, and $2500/kW)
every 5 years of typical load-following operation. For the net metering cases, we assume that stack refurbishment costs are a function of total energy
output and not only hours of operation (so that O&M costs are similar between the load following and net metering cases, even though the operating
hours are somewhat different, because the total energy output is about the same). O&M costs in terms of $/kW-year therefore vary between the load
following and net metering cases as a function of the actual hours of operation and average power output in each case (see detailed results tables for
exact values).gOperation and maintenance (O&M) costs for 250 kW stationary fuel cell systems include scheduled maintenance of $500, $1,000, and $1,500 every
year in the three cost cases, plus fuel cell stack refurbishment costs of 20%, 33%, and 40% of the total system costs ($400/kW, $700/kW, and $1000/
kW) every 5 years of typical load-following operation. For the net metering cases, we assume that stack refurbishment costs are a function of total
energy output and not only hours of operation (so that O&M costs are similar between the load following and net metering cases, even though the
operating hours are somewhat different, because the total energy output is about the same). O&M costs in terms of $/kW-year therefore vary between
the load following and net metering cases as a function of the actual hours of operation and average power output in each case (see detailed results
tables for exact values).
T.E. Lipman et al. / Energy Policy 32 (2004) 101–125 115

ARTICLE IN PRESS
Table 4
Basic assumptions for residential and office building FCV cases
Residential setting Office building setting
Type Large single family Medium-sized office
Electrical load 0.5–3.8 kW 24–290kW
Fuel cell 75 or 20 kW PEM 75kW PEM (up to 10 FCVs)
Fuel cell operation High air side pressure, pipeline NG reformate
fuel, 30 kW power limit per FCV
High air side pressure, pipeline NG reformate
fuel, 30 kW power limit per FCV
Cogeneration of hot water (based on hot
water load profile)
No No
Reformer efficiency 70% SMRa 70% SMRa
Fuel cell system efficiency (stack, compressor,
and WTM)
Varies with load (see results) Varies with load (see results)
Hydrogen utilization by FC (natural gas
reformate)
85%b 85%b
Power inversion, control, and conditioning,
efficiency
92%c 92%c
Fuel cell system capital cost Zero (units are purchased for automotive use,
but periodic system refurbishment costs are
included)
Zero (units are purchased for automotive use,
but periodic system refurbishment costs are
included)
Reformer capital cost $1500, $2000, $6000d $40,000, $53,880, $116,500e
Fuel cell O&M cost Varies with case—see detailed results tablesf Varies with case—see detailed results tablesf
Reformer O&M cost $50/kWyr, $100/kWyr, $250/kWyrg $7/kWyr, $13/kWyr, $33/kWyrh
Additional infrastructure costs $800, $1200, $1700i $5500, $8500, $12,000j
Natural gas fuel cost $4/GJ, $6/GJ, $10/GJ $3/GJ, $4/GJ, $6/GJ
Electricity energy charge (see text for TOU
cases)
0.15/kWh, $0.12/kWh, $0.10/kWh 0.08/kWh, $0.06/kWh, $0.05/kWh
Electricity demand charge N/A $12/kW-pk, $9/kW-pk, $7/kW-pk
Electricity monthly charge N/A $200/month
Days of FC operation per year 300 days/yr 250 days/yr
Hours of FC operation per year 4200 (in most cases) 2500 (in most cases)
Notes and sources: When three values are listed, the first value refers to the estimate used in the ‘‘low cost’’ case, the second value refers to the estimate
used in the ‘‘medium cost’’ case, and the third value refers to the estimate used in the ‘‘high cost’’ case.aWe assume that small steam methane reformer (SMR) or autothermal reformer (ATR) units operate at 70% efficiency, in terms of the LHV of
hydrogen out/the LHV natural gas + accessory loads in, based on Aspen model simulations reported in (Kreutz and Ogden, 2000).bWe assume that actual hydrogen utilization rates of 85% are achieved in fuel cell stacks operating on natural gas reformate due to the need to
periodically purge impurities from the fuel cell stack anodes and the need to maintain usable hydrogen gas concentrations at the tail ends of the
individual fuel cell flowfields. Higher utilization rates would be achievable with the use of pure hydrogen, rather than reformate.cWe assume that AC inverter plus system control efficiency levels of 92% are achieved in both stationary and vehicle fuel cell systems.d Installed reformer capital costs in the 2010–2015 timeframe for the residential setting of $1500, $2000, and $6000/kW are assumed based on cost
targets for complete small PEM systems in the low and medium costs cases, and on detailed cost estimates conducted by Directed Technologies Inc.
(Thomas et al., 2000a) for the high cost case. We assume that these cost estimates also include the costs of small buffer storage systems to allow the
reformers to operate at relatively steady output levels.e Installed reformer capital costs in the 2010–2015 timeframe for the office building setting, to support up to 10 FCVs, of $40,000, $53,880, and
$116,500 are assumed based on detailed cost estimates conducted by Directed Technologies Inc. (Thomas et al., 1998) for the medium cost case, by
Ogden (1999) in the high cost case, and on a slightly more optimistic estimate for the low cost case.fOperation and maintenance costs for the FCV fuel cell systems assume that 25%, 33%, and 50% of the complete fuel cell system costs are
incurred every 4000, 10,000, and 40,000h (respectively in the various cases) of additional use for power generation. Fuel cell system capital costs in
2015–2025 (when refurbishments would be required) are assumed to be $50/kW, $75/kW, and $100/kW in the three cost cases, based on automotive
cost targets and detailed, high volume production analysis by Directed Technologies Inc. (Lomax et al., 1997).gOperation and maintenance costs for small residential reformer systems include scheduled maintenance of $100, $200, and $500 every year in the
three cost cases and average output of 2 kW.hOperation and maintenance costs for larger office building reformer systems include scheduled maintenance of $1000, $2000, and $5000 every
year in the three cost cases and average output of 150 kW.iAdditional infrastructure costs include the costs of vehicle modifications to allow reverse-flow of power from the vehicle, an electrical connection
from the vehicle to the residential electrical panel, a hydrogen reformate connection from the reformer to the vehicle, and hydrogen safety equipment.
We assume incremental vehicle costs of $300, $500, and $700 based on an approximate estimate of $500 in Kempton et al. (2001), and $500, $700,
and $1000 for the gas connection and safety gear.jAdditional infrastructure costs for the office building case include the costs of vehicle modifications to allow reverse-flow of power from the
vehicles, electrical connections from the vehicles to conductive EV charging stations in the building parking lot, hydrogen reformate connections
from the reformer to the vehicles, and hydrogen safety equipment. We again assume incremental vehicle costs of $300, $500, and $700 (per vehicle)
based on an approximate estimate of $500 in Kempton et al. (2001) and $2500, $3500, and $5000 for the gas connections and safety gear.
T.E. Lipman et al. / Energy Policy 32 (2004) 101–125116

of $1200/kW combined with $6/GJ natural gas (andvarious other assumptions shown in Table 3), a modestannual savings of about $300 per year can be realized.Savings of over $1000 per year are realized in the lowcost case, but the high cost case reveals a net loss.In comparison, for FCV-based power, the analysis
results show that the cost of generating electricity fromFCVs based at residences varies dramatically from$0.09/kWh to over $1.00/kWh, depending on thescenario, the price of natural gas, and other key inputassumptions (Tables 6 and 7, Fig. 11). On an annualbasis, in the cases in which FCV use is attractive and can
produce cost savings, savings of about $100 to over $600per year are possible. However, we estimate that costsavings at these residential settings are only achieved insome of our ‘‘low cost’’ cases; most cases suggest a netloss and are not attractive. We therefore consider the useof FCVs for power generation at residential settings toonly be attractive under highly favorable conditions, foremergency backup power, to provide additional powerto grid-independent buildings, and/or to provide powerduring peak demand periods in summer months andunder TOU rate schedules. Even under a net meteringscheme with ‘‘efficiency optimized’’ fuel cell operation,
ARTICLE IN PRESS
0
0.05
0.1
0.15
0.2
0.25
0.3
0.35
0.4
0.45
0.5
1 2 3 4 5 6 7 8 9 10 11 12 13 14 15 16 17 18 19 20 21 22 23 24
Hour
Ele
ctric
ity E
nerg
y C
harg
e ($
/kW
h)
SCE TOU-D-2 WINT SCE TOU-D-2 SUMM
SCE TOU-D-2 WINT WE SCE TOU-D-2 SUMM WE
SCE TOU-D-2 WINT GEN SCE TOU-D-2 SUMM GEN
SCE TOU-D-2 WINT WE GEN SCE TOU-D-2 SUMM WE GEN
Fig. 8. Residential TOU retail and ‘‘generation cost only’’ rate schedules. Notes: GEN=generation cost only; SCE=southern California Edison;
SUMM=summer; WE=weekend; WINT=winter.
0.000
0.100
0.200
0.300
0.400
0.500
0.600
0.700
1 2 3 4 5 6 7 8 9 10 11 12 13 14 15 16 17 18 19 20 21 22 23 24
Hour
Ele
ctri
city
Ene
rgy
Cha
rge
($/k
Wh)
SCE TOU GS-1 WINT SCE TOU GS-1 SUMM SCE TOU GS-1 WE
SCE TOU GS-1 WINT GEN SCE TOU GS-1 SUMM GEN SCE TOU GS-1 WE GEN
Fig. 9. Commercial TOU full retail and ‘‘generation cost only’’ rate schedules. Notes: GEN=generation cost only; SCE=southern California
Edison; SUMM=summer; WE=weekend; WINT=winter.
T.E. Lipman et al. / Energy Policy 32 (2004) 101–125 117

ARTICLE IN PRESS
Table 5
Results for residential setting with 5 kW stationary fuel cell and load following operation
Low cost case Medium cost case High cost case
Key assumptions
Natural gas cost $4/GJ $6/GJ S10/GJ
Electricity energy charge $0.15/kWh $0.12/kWh $0.10/kWh
Electricity demand charge N/A N/A N/A
Electricity fixed monthly charge N/A N/A N/A
Fuel cell system cost $500/kW $l200/kW $2500/kW
Fuel cell system O&M $70/kWyr $147/kWyr $300/kWyr
Reformer capital cost Integrated with FC Integrated with FC Integrated with FC
Reformer O&M Integrated with FC Integrated with FC Integrated with FC
Additional infrastructure cost $100(for Cogen) $200 (for Cogen) $300 (for Cogen)
Capital recovery factor (15 year life, 8% interest rate) 0.12 0.12 0.12
Cogeneration of hot water Yes Yes Yes
Calculated results
Cost of electricity $0.056/kWh $0.095/kWh $0.171/kWh
Average FC system efficiency (includes FC, reformer, inverter, and H2 utilization and
on LHV basis)
33.9% 33.9% 33.9%
Natural gas fuel used 111GJ/yr 111GJ/yr 111GJ/yr
Natural gas fuel cost $442/yr $663/yr $1106/yr
Regular maintenance and system refurb. for fuel cell and reformer $88/yr $184/yr $376/yr
Total annual electrical load 10,815 kWh/yr 10,815 kWh/yr 10,815 kWh/yr
FC electricity produced 10,815 kWh/yr 10,815 kWh/yr 10,815 kWh/yr
Net electricity purchased or (sold) 0 kWh/yr 0 kWh/yr 0 kWh/yr
Demand peak reduction (average per month) N/A N/A N/A
Consumer cost per year (includes capital cost, NG and electricity fuel costs, and
maintenance costs)
$537/yr $928/yr $1683/yr
Net cost (or savings) per year (with eliminated electricity energy charges) (�$1085/yr) netsavings/year
(�$370/yr) netsavings/year
$601/yr net cost/year
Notes: see above discussion and tables for details of input value assumptions.
FC=fuel cell; LHV=lower heating value; GJ=gigajoule; O&M=operation and maintenance (not including fuel).
Table 6
Results for residential setting with 5 kW stationary fuel cell and net metered operation
Low cost case Medium cost case High cost case
Key assumptions
Natural gas cost $4/GJ $6/GJ S10/GJ
Electricity energy charge $0.15/kWh $0.12/kWh $0.10/kWh
Electricity demand charge N/A N/A N/A
Electricity fixed monthly charge N/A N/A N/A
Fuel cell system cost $500/kW $l200/kW $2500/kW
Fuel cell system O&M $20/kWyr $42/kWyr $86/kWyr
Reformer capital cost Integrated with FC Integrated with FC Integrated with FC
Reformer O&M Integrated with FC Integrated with FC Integrated with FC
Additional infrastructure cost $100(for Cogen) $200 (for Cogen) $300 (for Cogen)
Capital recovery factor (15 year life, 8% interest rate) 0.12 0.12 0.12
Cogeneration of hot water Yes Yes Yes
Calculated results
Cost of electricity $0088/kWh $0.159/kWh $0.294/kWh
Average FC system efficiency (includes FC, reformer, inverter, and H2 utilization and
on LHV basis)
25.0% 25.0% 25.0%
Natural gas fuel used 156GJ/yr 156GJ/yr 156GJ/yr
Natural gas fuel cost $625/yr $937/yr $1562/yr
Regular maintenance and system refurb. for fuel cell and reformer $88/yr $185/yr $377/yr
Total annual electrical load 10,824 kWh/year 10,824 kWh/yr 10,824 kWh/yr
FC electricity produced 10,824 kWh/yr 10,824 kWh/yr 10,824 kWh/yr
Net electricity purchased (or sold) 0 kWh/yr 0 kWh/yr 0 kWh/yr
Demand peak reduction (average per month) N/A N/A N/A
Consumer cost per year (includes capital cost, NG and electricity fuel costs, and
maintenance costs)
$908/yr $1645/yr $3058/yr
Net cost (or savings) per year (with eliminated electricity energy charges) (�$716/yr) netsavings/year
$347/yr net cost/year $1975/yr net cost/year
Notes: see above discussion and tables for details of input value assumptions.
FC=fuel cell; LHV=lower heating value; GJ=gigajoule; O&M=operation and maintenance (not including fuel).
T.E. Lipman et al. / Energy Policy 32 (2004) 101–125118

ARTICLE IN PRESS
Table 7
Results for residential setting with 20 kW FCV and load following operation
Low cost case Medium cost case High cost case
Key Assumptions
Natural gas cost $4/GJ $6/GJ $10/GJ
Electricity energy charge $0.15/kWh $0.12/kWh $0.10/kWh
Electricity demand charge N/A N/A N/A
Electricity fixed monthly charge N/A N/A N/A
Fuel cell system cost Built in to vehicle Built in to vehicle Built in to vehicle
Fuel cell system O&M $17.50/kWyr $140/kWyr $700/kWyr
Reformer capital cost $1500 $2000 $6000
Reformer O&M $50/kWyr $100/kWyr $250/kWyr
Additional infrastructure cost $800 $1200 $1700
Capital recovery factor (15 year life, 8% interest rate) 0.12 0.12 0.12
Cogeneration of hot water No No No
Calculated results
Cost of electricity $0.122/kWh $0.209/kWh $0.544/kWh
Average FC system efficiency (includes FC, reformer, inverter, and H2 utilization and
on LHV basis)
31.1% 31.1% 31.1%
Natural gas fuel used 47.6GJ/yr 47.6GJ/yr 47.6GJ/yr
Natural gas fuel cost $190/year $286/year $476/yr
Regular maintenance and system refurb. for fuel cell and reformer $60/yr $212/yr $838/yr
Total annual electrical load 10,815 kWh/yr 10,815 kWh/yr 10,815 kWh/yr
FC electricity produced 4444 kWh/yr 4444 kWh/yr 4444 kWh/yr
Net electricity purchased (or sold) 6371 kWh/yr 6371 kWh/yr 6371 kWh/yr
Demand peak reduction (average per month) N/A N/A N/A
Consumer cost per year (includes capital cost, NG and electricity fuel costs, and
maintenance costs)
$535/year $920/year $2391/yr
Net cost (or savings) per year (with eliminated electricity energy charges) (�$132/yr) netsavings/year
$386/yr net cost/year $1947/yr net cost/year
Notes: see above discussion and tables for details of input value assumptions.
FC=fuel cell; LHV=lower heating value; GJ=gigajoule; O&M=operation and maintenance (not including fuel).
Table 8
Results for residential setting with 20 kW FCV and net metered operation
Low cost case Medium cost case High cost case
Key assumptions
Natural gas cost $4/GJ $6/GJ $10/GJ
Electricity energy charge $0.15/kWh $0.12/kWh $0.10/kWh
Electricity demand charge N/A N/A N/A
Electricity fixed monthly charge N/A N/A N/A
Fuel cell system cost Built in to vehicle Built in to vehicle Built in to vehicle
Fuel cell system O&M $13.13/kWyr $105/kWyr $525/kWyr
Reformer capital cost $1500 $2000 $6000
Reformer O&M $50/kWyr $100/kWyr $250/kWyr
Additional infrastructure cost $800 $1200 $1700
Capital recovery factor (15 year life, 8% interest rate) 0.12 0.12 0.12
Cogeneration of hot water No No No
Calculated results
Cost of electricity $0.090/kWh $0.158/kWh $0.398/kWh
Average FC system efficiency (includes FC, reformer, inverter, and H2 utilization and
on LHV basis)
30.7% 30.7% 30.7%
Natural gas fuel used 116GJ/yr 116GJ/yr 116GJ/yr
Natural gas fuel cost $465/yr $698/yr $1163/yr
Regular maintenance and system refurb. for fuel cell and reformer $130/yr $422/yr $l596/yr
Total annual electrical load 10,815 kWh/yr 10,815 kWh/yr 10,815 kWh/yr
FC electricity produced 10,376 kWh/yr 10,376 kWh/yr 10,376 kWh/yr
Net electricity purchased (or sold) 439 kWh/yr 439 kWh/yr 439 kWh/yr
Demand peak reduction (average per month) N/A N/A N/A
Consumer cost per year (includes capital cost, NG and electricity fuel costs, and
maintenance costs)
$926/yr $1628/yr $4102/yr
Net cost (or savings) per year (with eliminated electricity energy charges) (�$631/yr) netsavings/year
$383/yr net cost/year $3064/yr net cost/year
Notes: see above discussion and tables for details of input value assumptions.
FC=fuel cell; LHV=lower heating value; GJ=gigajoule; O&M=operation and maintenance (not including fuel).
T.E. Lipman et al. / Energy Policy 32 (2004) 101–125 119

ARTICLE IN PRESS
Table 9
Results for office building setting with 250 kW stationary fuel cell and load following operation
Low cost case Medium cost case High cost case
Key assumptions
Natural gas cost $3/GJ $4/GJ $6/GJ
Electricity energy charge $0.08/kWh $0.06/kWh $0.05/kWh
Electricity demand charge $12/kW peak $9/kW peak $7/kW peak
Electricity fixed monthly charge $200/month $200/month $200/month
Fuel cell system cost $400/kW $700/kW $1000/kW
Fuel cell system O&M $19/kWyr $49/kWyr $90/kWyr
Reformer capital cost Integrated with FC Integrated with FC Integrated with FC
Reformer O&M Integrated with FC Integrated with FC Integrated with FC
Additional infrastructure cost $500 (for Cogen) $750 (for Cogen) $1000 (for Cogen)
Capital recovery factor(15 year life, 8% interest rate) 0.12 0.12 0.12
Cogeneration of hot water Yes Yes Yes
Calculated results
Cost of electricity $0.040/kWh $0.058/kWh $0.108/kWh
Average FC system efficiency(includes FC, reformer, inverter, and H2 utilization and
on LHV basis)
32.0% 32.0% 32.0%
Natural gas fuel used 10,500GJ/yr 10,500GJ/yr 10,500GJ/yr
Natural gas fuel cost $31,352/yr $41,803/yr $62,704/yr
Regular maintenance and system refurb. for fuel cell and reformer $2030/yr $5114/yr $9449/yr
Total annual electrical load 909,932 kWh/yr 909,932 kWh/yr 909,932 kWh/yr
FC electricity produced 907,144 kWh/yr 907,144 kWh/yr 907,144 kWh/yr
Net electricity purchased (or sold) 2788 kWh/yr 2788 kWh/yr 2788 kWh/yr
Demand peak reduction (average per month) 241 kW 241 kW 241 kW
Consumer cost per year (includes capital cost, NG and electricity fuel costs, and
maintenance costs)
$36,201/yr $52,259/yr $79,322/yr
Net cost (or savings) per year (with eliminated electricity energy and demand charges) (�$71,049/yr) netsavings/year
(�$28,178/yr) netsavings/year
$13,735/yr net cost/
year
Notes: see above discussion and tables for details of input value assumptions.
FC=fuel cell; LHV=lower heating value; GJ=gigajoule; O&M=operation and maintenance (not including fuel).
Table 10
Results for office building setting with Ten 75 kW FCVs and load following operation
Low cost case Medium cost case High cost case
Key assumptions
Natural gas cost $3/GJ $4/GJ $6/GJ
Electricity energy charge $0.08/kWh $0.06/kWh $0.05/kWh
Electricity demand charge $12/kW peak $9/kW peak $7/kW peak
Electricity fixed monthly charge $200/month $200/month $200/month
Fuel cell system cost Built in to vehicle Built in to vehicle Built in to vehicle
Fuel cell system O&M $1.95/kWyr $15.63/kWyr $78.13/kWyr
Reformer capital cost $40,000 $53,880 $116,500
Reformer O&M $6.67 kWyr $13.33 kWyr $33.33 kWyr
Additional infrastructure cost $5500 $8500 $12,000
Capital recovery factor(15 year life, 8% interest rate) 0.12 0.12 0.12
Cogeneration of hot water No No No
Calculated results
Cost of electricity $0.038/kWh $0.058/kWh $0.119/kWh
Average FC system efficiency(includes FC, reformer, inverter, and H2 utilization and
on LHV basis)
31.1% 31.1% 31.1%
Natural gas fuel used 5750GJ/yr 5750GJ/yr 5750GJ/yr
Natural gas fuel cost $17,264/yr $23,916/yr $34,528/yr
Regular maintenance and system refurb. for fuel cell and reformer $1363/yr $4676/yr $17,618/yr
Total annual electrical load 681,842 kWh/yr 681,842 kWh/yr 681,842 kWh/yr
FC electricity produced 523,198 kWh/yr 523,198 kWh/yr 523,198 kWh/yr
Net electricity purchased or (sold) 158,644 kWh/yr 158,644 kWh/yr 158,644 kWh/yr
Demand peak reduction (average per month) 95 kW 95 kW 95kW
Consumer cost per year (includes capital cost, NG and electricity fuel costs, and
maintenance costs)
$32,612/yr $40,083/yr $69,831/yr
Net cost (or savings) per year (with eliminated electricity energy and demand charges) (�$22,976/yr) netsavings/year
(�$1608/yr) netsavings/year
$35,661/yr net cost/
year
Notes: see above discussion and tables for details of input value assumptions.
FC=fuel cell; LHV=lower heating value; GJ=gigajoule; O&M=operation and maintenance (not including fuel).
T.E. Lipman et al. / Energy Policy 32 (2004) 101–125120

none of our medium cost case results are favorable forthis residential setting. Our analysis thus suggests thatusing FCVs to power residences on a routine basis isgenerally unlikely to prove attractive.Our analysis also shows that battery hybrid FCVs,
with smaller B20 kW fuel cell systems, are bettermatched to the low load levels at residential sites. TheseFCVs can be somewhat more economically attractive atproducing power in residential settings than non-hybridFCVs with larger B75 kW fuel cell systems, but stillonly provide net savings to the vehicle owner in our lowcost cases.However, much more attractive is the case in which
several FCVs are used to provide power to thecommercial office building. In this case, the vehiclescan share a common reformer system and can producepower at load levels that are more constant and in ahigher efficiency region of operation. We calculate thatFCVs in this setting can produce power for costs in therange of $0.038–$0.119/kWh, and can also provideadditional savings by reducing peak building demandlevels and monthly demand charges. On an annual basis,we calculate that annual savings of $1,608 are possiblefor the case in which the FCVs load follow the building,and savings of $2161 are possible when net metering is
allowed (under one simple net metering scheme), bothunder our medium cost case. Under our low cost case,however, annual savings of $22,976 to $30,472 arerealized under the load following and net metering cases(Tables 10–12 and Fig. 12).These savings, even divided among 10 vehicle owners,
could provide a significant incentive for this type ofarrangement and could help to pay down the costs ofFCV ownership. We caution, though, that our high costcases do not show a net benefit even in this commercialsettings, and we suggest that the details of natural gasprices, electricity prices, reformer costs, fuel cell systemdurability, and other factors do matter. The potentialbenefits of FCV-based power should therefore beanalyzed on a case-by-case basis, given these sensitiveinput variables.These office building FCV cost-of-electricity results
compare to the case of the 250-kW stationary fuel cell,where costs of electricity are found to vary from $0.040/kWh to $0.117/kWh. With capital costs of $700/kW inthe medium cost case combined with $4/GJ natural gas,an estimated $28,000 in savings per year can beachieved. Savings reach over $70,000 in the low costcase, but the high cost case shows a net loss rather thansavings (Table 9).
ARTICLE IN PRESS
Table 11
Results for office building setting with ten 75 kW FCVs and net metered operation
Low cost case Medium cost case High cost case
Key assumptions
Natural gas cost $3/GJ $4/GJ $6/GJ
Electricity energy charge $0.08/kWh $0.06/kWh $0.05/kWh
Electricity demand charge $12/kW peak $9/kW peak $7/kW peak
Electricity fixed monthly charge $200/month $200/month $200/month
Fuel cell system cost Built in to vehicle Built in to vehicle Built in to vehicle
Fuel cell system O&M $1.95/kWyr $15.63/kWyr $78.13/kWyr
Reformer capital cost $40,000 $53,880 $116,500
Reformer O&M $6.67 kWyr $13.33 kWyr $33.33kWyr
Additional infrastructure cost $5500 $8500 $12,000
Capital recovery factor(15 year life, 8% interest rate) 0.12 0.12 0.12
Cogeneration of hot water No No No
Calculated results
Cost of electricity $0.038/kWh $0.058/kWh $0.118/kWh
Average FC system efficiency(includes FC, reformer, inverter, and H2
utilization and on LHV basis)
31.0% 31.0% 31.0%
Natural gas fuel used 7660GJ/yr 7660GJ/yr 7660GJ/yr
Natural gas fuel cost $22,969/yr $30,625/yr $45,938/yr
Regular maintenance and system refurb. for fuel cell and reformer $1857/yr $6238/yr $24,007/yr
Total annual electrical load 681,842 kWh/yr 681,842 kWh/yr 681,842 kWh/yr
FC electricity produced 694,771 kWh/yr 694,771 kWh/yr 694,771 kWh/yr
Net electricity purchased (or sold) (12,929 kWh/yr) (12,929 kWh/yr) (12,929kWh/yr)
Demand peak reduction (average per month) 95 kW 95kW 95kW
Consumer cost per year (includes capital cost, NG and electricity fuel costs,
and maintenance costs)
$38,842/yr $49,825/yr $89,920/yr
Net cost (or savings) per year (with eliminated electricity energy and demand
charges)
(�$30,472/yr) netsavings/year
(�$2161/yr) netsavings/year
$47,171/yr net cost/
year
Notes: see above discussion and tables for details of input value assumptions.
FC=fuel cell; LHV=lower heating value; GJ=gigajoule; O&M=operation and maintenance (not including fuel).
T.E. Lipman et al. / Energy Policy 32 (2004) 101–125 121

13. Net metering of fuel cell systems
Our analysis also shows that net metering canimprove the economics of fuel cell power, but this onlytends to be true for FCV-based power, and particularlyin the case of the 75 kW fuel cell systems in theresidential setting. This benefit occurs because netmetering allows the fuel cell systems in the FCVs tooperate more efficiently than they can in the mode ofload following operation. For example, net metering canallow a small savings of $264 per year to be realized in aresidential setting with low cost case economics, whereload following operation yielded a small net cost. Underour medium cost case for the residential setting, andwith the 75 kW FCV, net metering improves theeconomics to some extent but still is not sufficient toallow a net profit, even under an ‘‘efficiency optimized’’net metering scheme. This result further underlines thequestionable economics of using FCVs to producepower in residential settings on a routine basis.With stationary fuel cell systems that are relatively
well matched to their building loads, net metering canactually worsen efficiency by encouraging operation at
higher than optimal load levels, and this has adeleterious effect on economics as well. However, suchoperation may provide significant benefits to the utilitygrid, and the ultimate effect therefore may involve atradeoff between slightly worse economics for the fuelcell DG units and the potential for reduced use ofpeaking power plants to meet overall grid peak loads.Perhaps most interesting, the combination of net
metering along with TOU electricity rates offers thepotential for dramatic economic benefits for FCV powerat the office building site. Because FCVs at officebuildings are available to produce extra power duringthe day when it is highly valued (especially duringsummer months), net savings (or actually savings plusrevenue) of $146,000 per year are possible for the settingin which 10 FCVs are used. This is the case even if thepower provided to the utility grid is only compensated atthe avoided cost of generation (with the rate based on aSouthern California Edison TOU rate schedule) andassuming our medium cost case economics. If the fullretail rate were provided for both electricity provided-toand withdrawn-from the grid, net savings/revenue of upto $154,000 per year would be possible in the medium
ARTICLE IN PRESS
Table 12
Results for office building setting with Ten 75 kW FCVs and net metered and TOU operation
Flat rate net
metering medium
cost case
TOU rate net
metering case 1
medium cost case
TOU rate net
metering case 2
medium cost case
Key assumptions
Natural gas cost $4/GJ $4/GJ $4/GJ
Electricity energy charge $0.06/kWh $0.06/kWh $0.06/kWh
Electricity demand charge $9/kW peak $9/kW peak $9/kW peak
Electricity fixed monthly charge $200/month $200/month $200/month
Fuel cell system cost Built in to vehicle Built in to vehicle Built in to vehicle
Fuel cell system O&M $15.63/kWyr $15.63/kWyr $15.63/kWyr
Reformer capital cost $53,880 $53,880 $53,880
Reformer O&M $13.33 kWyr $13.33 kWyr $13.33kWyr
Additional infrastructure cost $8500 $8500 $8500
Capital recovery factor (15 year life, 8% interest rate) 0.12 0.12 0.12
Cogeneration of hot water No No No
Calculated results
Cost of electricity $0.058/kWh $0.058/kWh $0.058/kWh
Average FC system efficiency(includes FC, reformer, inverter, and H2
utilization and on LHV basis)
31.0% 31.0% 31.0%
Natural gas fuel used 7660GJ/yr 7660GJ/yr 7660GJ/yr
Natural gas fuel cost $30,625/yr $30,625/yr $30,625/yr
Regular maintenance and system refurb. for fuel cell and reformer $6238/yr $6238/yr $6238/yr
Total annual electrical load 681,842 kWh/yr 681,842 kWh/yr 681,842 kWh/yr
FC electricity produced 694,771 kWh/yr 694,771 kWh/yr 694,771 kWh/yr
Net electricity purchased (or sold) (12,929 kWh/yr) (12,929 kWh/yr) (12,929kWh/yr)
Demand peak reduction (average per month) 95 kW 95kW 95kW
Consumer cost per year (includes capital cost, NG and electricity fuel costs,
and maintenance costs)
$49,825/yr $57,562/yr $57,562/yr
Net cost (or savings) per year (with eliminated electricity energy and demand
charges)
(�$2161/yr) netsavings/year
(�$145,913/yr) netsavings/year
(�$153,715/yr) netsavings/year
Notes: see above discussion and tables for details of input value assumptions.
FC=fuel cell; LHV=lower heating value; GJ=gigajoule; O&M=operation and maintenance (not including fuel).
T.E. Lipman et al. / Energy Policy 32 (2004) 101–125122
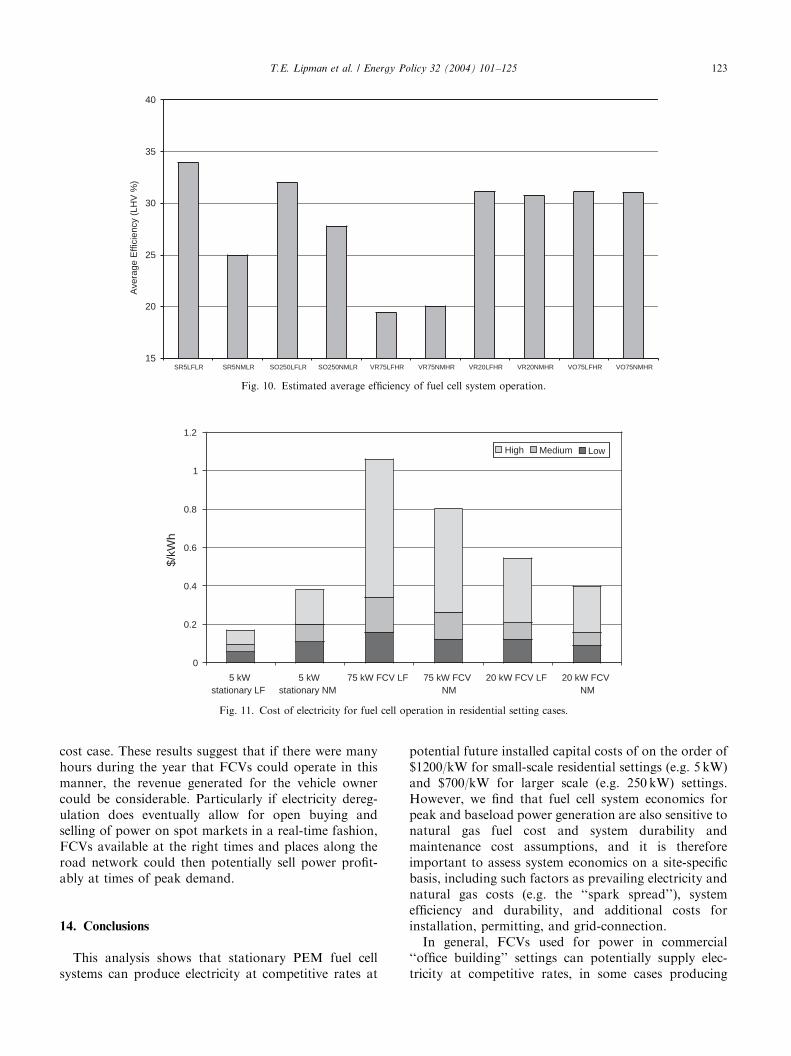
cost case. These results suggest that if there were manyhours during the year that FCVs could operate in thismanner, the revenue generated for the vehicle ownercould be considerable. Particularly if electricity dereg-ulation does eventually allow for open buying andselling of power on spot markets in a real-time fashion,FCVs available at the right times and places along theroad network could then potentially sell power profit-ably at times of peak demand.
14. Conclusions
This analysis shows that stationary PEM fuel cellsystems can produce electricity at competitive rates at
potential future installed capital costs of on the order of$1200/kW for small-scale residential settings (e.g. 5 kW)and $700/kW for larger scale (e.g. 250 kW) settings.However, we find that fuel cell system economics forpeak and baseload power generation are also sensitive tonatural gas fuel cost and system durability andmaintenance cost assumptions, and it is thereforeimportant to assess system economics on a site-specificbasis, including such factors as prevailing electricity andnatural gas costs (e.g. the ‘‘spark spread’’), systemefficiency and durability, and additional costs forinstallation, permitting, and grid-connection.In general, FCVs used for power in commercial
‘‘office building’’ settings can potentially supply elec-tricity at competitive rates, in some cases producing
ARTICLE IN PRESS
0
0.2
0.4
0.6
0.8
1
1.2
5 kW stationary LF
5 kW stationary NM
75 kW FCV LF 75 kW FCV NM
20 kW FCV LF 20 kW FCV NM
$/kW
h
High Medium Low
Fig. 11. Cost of electricity for fuel cell operation in residential setting cases.
15
20
25
30
35
40
SR5LFLR SR5NMLR SO250LFLR SO250NMLR VR75LFHR VR75NMHR VR20LFHR VR20NMHR VO75LFHR VO75NMHR
Ave
rage
Effi
cien
cy (
LHV
%)
Fig. 10. Estimated average efficiency of fuel cell system operation.
T.E. Lipman et al. / Energy Policy 32 (2004) 101–125 123

significant annual benefits to vehicle owners while at thesame time producing additional capacity to utility grids.However, for electricity produced from FCVs to beattractive in competition with all electricity generation,including large base-load power plants, natural gasprices must be on the order of $3–4/GJ, or alternatemethods of fueling the vehicles with economical sourcesof hydrogen must be explored, and fuel cell systemdurability must be on the order of at least 10,000 h ofoperation when the vehicles are used in DG mode. Ingeneral, and the analysis results in all cases dependstrongly on several uncertain variables. These againinclude most notably the cost of natural gas fuel,prevailing electricity energy and demand chargers, thelevel of fuel cell system durability, and the associatedcosts for fuel cell system refurbishment due to theadditional use for power production.For FCV-based power to be economical on a routine
basis, it is vitally important that FCVs be able toproduce electricity at high overall system efficiencies, onthe order of at least 30% (LHV). This suggests thatpowering residential loads from the vehicles, particu-larly without allowing for higher power operation andnet metered or grid sale of electricity, is unlikely to beattractive. In these residential settings, FCV power mayonly be attractive during peak periods and under TOUrate schedules, and in the case of provision of emergencybackup power.With regard to net metering of fuel cell systems, these
analysis results suggest that a net metering policy thatallows power to be added to the grid during the hours of12 PM to 8 PM can be of significance in using FCVs toproduce power, and especially at residential settingswhere net metering allows power to be supplied withimproved efficiency. Net metering would not necessarily
provide much benefit for the economics stationary fuelcell systems, at least based on the profiles of hourlypower supply that we assumed for the net metering casesin this analysis, because these systems have beendesigned to be better matched to the loads to whichthey are connected and tend to suffer slightly reducedefficiency in the net metering cases. Other net-meteredoperating profiles that are more carefully designed tooptimize efficiency, however, can produce improvementsin efficiency for stationary systems and can furtherimprove efficiency for FCVs, but such ‘‘efficiencyoptimized’’ schemes appear to improve the economicresults only slightly compared to the values presented inthe net metering cases shown here.We also note that a different type of ‘‘very short term
net metering’’, whereby momentary needs for surgepower in buildings can be supplied with help from thegrid and then ‘‘paid back’’ over a few minutes by the fuelcell system, could be beneficial for both stationary fuelcells and FCVs used to produce power. This type ofarrangement, if eventually allowed by utilities, couldeliminate the need for batteries or ultracapacitors tohelp meet momentary peak demands, and could lead toimproved system efficiency through reductions intransient and high-load level conditions.It is important to stress that the analysis conducted
here has focused on the potential customer-side benefitsof stationary fuel cell and FCV-based power. Inaddition to these potential benefits, use of fuel cells fordistributed power production can supply additionalbenefits in terms of the reduced need for peak powerplants, alleviation of transmission and distributionbottlenecks, and the potential provision of grid ancillaryservices such as spinning reserves and local voltagesupport. In ongoing work, we are assessing these
ARTICLE IN PRESS
0
0.02
0.04
0.06
0.08
0.1
0.12
0.14
250 kW stationaryLF
250 kW stationary NM
75 kW FCV LF 75 kW FCV NM
$/kW
h
High Medium Low
Fig. 12. Cost of electricity for fuel cell operation in office building setting cases.
T.E. Lipman et al. / Energy Policy 32 (2004) 101–125124

potential benefits as well as criteria pollutant andgreenhouse gas emissions issues, alternative means ofsupplying hydrogen fuel to FCVs (such as throughreformers and electrolyzers that can produce purehydrogen and allow higher operational efficiencies),and other settings for FCV-based power.In conclusion, we find that FCV-based power can be
promising in commercial settings under the rightconditions, even in comparison with baseload gridpower. Net metering policies can have a significantimpact on the economics of FCV-based power, particu-larly if net metering schemes can be combined with TOUrate schedules. Even if FCVs have difficulty competingwith baseload power plants on an economic basis, FCVsand other EVs are likely to find interesting niches inproviding electricity at times when it is highly valued,such as with TOU metering or in real-time electricitymarkets, and through grid ancillary service support.Given this potential, efforts should focus on removingregulatory impediments to reverse power flow fromvehicles, pursuing the development of small, low-costfuel reformers for FCVs, and continuing to assess thecosts and benefits of various market niches for vehicle-to-grid interaction.
Acknowledgements
We would like to acknowledge the assistance of DavidFriedman in helping with a few important aspects of themodeling work upon which this paper is based. We alsowould like to thank Joshua Cunningham, AnthonyEggert, Bob Moore, Chris Marnay, and Bud Beebe foruseful conversations that helped to guide the analysis.Finally, we acknowledge Willett Kempton, StevenLetendre, Jasna Tomic, Alec Brooks, and Tom Gagefor past collaborations that have been instrumental inhelping us to understand the prospects for vehicle-basedpower. However, we emphasize that the analysis andconclusions in this paper are entirely those of theauthors, and we take full responsibility for them.This research has been funded by grants from the US
EPA and the University of California Energy Institute.
References
Arthur D. Little, 1994. Fuel Cells for Building Applications: Market
Analysis, Technology Status, and Program Plan Overview, Vol. 2.
Arthur D Little, Cambridge, MA.
Brooks, A., 2001. Electric drive vehicles: a huge new distributed energy
resource. EVAA Electric Transportation Industry Conference,
Sacramento, CA.
California Air Resources Board, 2001. ARB Fact Sheet: Zero
Emission Vehicle Program Changes. Sacramento, CA.
Friedman, D.J., Lipman, T.E., Eggert, A.R., Ramaswamy, S., Hauer,
K.-H., 2000. Hybridization: cost and efficiency comparisons for
PEM fuel cell vehicles. SAE Future Transportation Technology
Conference, Costa Mesa, CA, August 21–23, 2000, DOFTT-54.
Kempton, W., Letendre, S.E., 1996. Electric vehicles as a new power
source for electric utilities. Transport Research-D 2 (3), 157–175.
Kempton, W., Tomic, J., Letendre, S., Brooks, A., Lipman, T., 2001.
Vehicle-to-Grid Power: Battery, Hybrid, and Fuel Cell Vehicles as
Resources for Distributed Electric Power in California. Inst. of
Transportation Studies, University of California, Davis, UCD-
ITS-RR-01-03.
Kissock, J.K., 1998. Combined heat and power for buildings using
fuel-cell cars. ASME International Solar Energy Conference,
Albuquerque, NM.
Kreutz, T.G., Ogden, J.M., 2000. Assessment of hydrogen-fueled
proton exchange Membrane fuel cells for distributed generation
and cogeneration. Proceedings of the 2000 US DOE Hydrogen
Program Review, NREL/CP-570-28890.
Lomax, F.D., James, B.D., Baum, G.N., Thomas, C.E., 1997. Detailed
Manufacturing Cost Estimates for Polymer Electrolyte Membrane
(PEM) Fuel Cells for Light Duty Vehicles. Directed Technologies,
Inc., Arlington.
Ogden, J., 1999. Hydrogen energy systems studies. Proceedings of the
1999 US DOE Hydrogen Program Review. Denver, CO.
Teagan, W.P., Friedman, D.J., 1994. Fuel cells for building applica-
tions: definition of performance/cost requirements. Proceedings of
the 29th Intersociety Energy Conversion Engineering Conference,
Monterey, CA.
Thomas, C.E., James, B.D., Lomax, F.D., Kuhn, I.F., 1998.
Integrated Analysis of Hydrogen Passenger Vehicle Transportation
Pathways. Directed Technologies, Inc., Arlington.
Thomas, C.E., James, B.D., Franklin, J., Lomax, D., 2000a. Analysis
of residential fuel cell systems and PNGV fuel cell vehicles.
Proceedings of the 2000 US DOE Hydrogen Program Review,
NREL/CP-570-28890.
Thomas, C.E., Reardon, J.F., Lomax, F.D., Pinyan, J., Kuhn, I.F.,
2000b. Distributed hydrogen fueling systems analysis. Final Report
for the US Department of Energy, Grant No. DE-FG01-
99EE35099, October.
US DOE, 2000. Fuel Cell Handbook: Fifth Edition. National Energy
Technology Laboratory, Morgantown, DOE/NETL-2000/1110.
ARTICLE IN PRESST.E. Lipman et al. / Energy Policy 32 (2004) 101–125 125
Related Documents