B&V Project 137064 Fuel Capability Demonstration Test Report 3 for the JEA Large-Scale CFB Combustion Demonstration Project Illinois 6 Coal Fuel Submitted to U.S. DEPARTMENT OF ENERGY National Energy Technology Laboratory (NETL) Pittsburgh, Pennsylvania 15236 Cooperative Agreement No. DE-FC21-90MC27403 March 31, 2005 DOE Issue, Rev. 1 Prepared by Black & Veatch for:

Welcome message from author
This document is posted to help you gain knowledge. Please leave a comment to let me know what you think about it! Share it to your friends and learn new things together.
Transcript

B&V Project 137064
Fuel Capability Demonstration Test Report 3 for the
JEA Large-Scale CFB Combustion Demonstration Project
Illinois 6 Coal Fuel
Submitted to U.S. DEPARTMENT OF ENERGY National Energy Technology Laboratory (NETL) Pittsburgh, Pennsylvania 15236 Cooperative Agreement No. DE-FC21-90MC27403
March 31, 2005 DOE Issue, Rev. 1
Prepared by Black & Veatch for:
B&V Project 137064
TABLE OF CONTENTS
1.0 INTRODUCTION .................................................................................................................1 1.1 TEST SCHEDULE ...............................................................................................................................1 1.2 ABBREVIATIONS ................................................................................................................................3
2.0 SUMMARY OF TEST RESULTS........................................................................................7 2.1 TEST REQUIREMENTS........................................................................................................................7 2.2 VALVE LINE-UP REQUIREMENTS .......................................................................................................7 2.3 TEST RESULTS ..................................................................................................................................7
3.0 BOILER EFFICIENCY TESTS ..........................................................................................11 3.1 CALCULATION METHOD...................................................................................................................11 3.2 DATA AND SAMPLE ACQUISITION.....................................................................................................12
4.0 AQCS INLET AND STACK TESTS ..................................................................................13 4.1 SYSTEM DESCRIPTION.....................................................................................................................13 4.2 UNIT EMISSIONS DESIGN POINTS ....................................................................................................13 4.3 EMISSION DESIGN LIMITS AND RESULTS .........................................................................................13 4.4 FLUE GAS EMISSIONS TEST METHODS ...........................................................................................15 4.5 CONTINUOUS EMISSION MONITORING SYSTEM................................................................................15
ATTACHMENTS.............................................................................................................................17 ATTACHMENT A - FUEL CAPABILITY DEMONSTRATION TEST PROTOCOL ATTACHMENT B - BOILER EFFICIENCY CALCULATION ATTACHMENT C - CAE TEST REPORT ATTACHMENT D - PI DATA SUMMARY ATTACHMENT E - ABBREVIATION LIST ATTACHMENT F - ISOLATION VALVE LIST ATTACHMENT G - FUEL ANALYSES - ILLINOIS 8 ATTACHMENT H - LIMESTONE ANALYSES ATTACHMENT I - BED ASH ANALYSES ATTACHMENT J - FLY ASH (AIR HEATER AND PJFF) ANALYSES ATTACHMENT K - AMBIENT DATA, JUNE 8, 2004 AND JUNE 9, 2004 ATTACHMENT L - PARTIAL LOADS AMBIENT DATA, JUNE 8, 2004 AND JUNE 9, 2004

B&V Project 137064
TABLES
TABLE 1 - TESTS RESULTS - 100% LOAD .................................................................................... 8 TABLE 2 - BOILER & SDA SO2 REMOVAL EFFICIENCY............................................................. 10 TABLE 3 - TEST RESULTS - PARTIAL LOADS ............................................................................ 10
FIGURES
FIGURE 1 - GENERAL ARRANGEMENT PLAN, DRAWING NO. 3847-1-100, REV. 3
FIGURE 2 - GENERAL ARRANGEMENT ELEVATION, DRAWING NO. 3847-1-101, REV. 3
FIGURE 3 - FABRIC FILTER EAST END ELEVATION, DRAWING NO. 3847-9-268, REV. 2
FIGURE 4 - GENERAL ARRANGEMENT UNIT 2 ISO VIEW (RIGHT SIDE), DRAWING NO. 43-7587-5-53
FIGURE 5 - GENERAL ARRANGEMENT UNIT 2 FRONT ELEVATION VIEW A-A, DRAWING NO. 43-7587-5-50, REV. C
FIGURE 6 - GENERAL ARRANGEMENT UNIT 2 SIDE ELEVATION, DRAWING NO. 43-7587-5-51, REV. C
JEA Large-Scale CFB Combustion Demonstration Project
Fuel Capability Demonstration Test Report #3 p-1 Illinois 6 Coal Fuel
B&V Project 137064
1.0 INTRODUCTION
The agreement between the US Department of Energy (DOE) and JEA covering DOE participation in the Northside Unit 2 project required JEA to demonstrate fuel flexibility of the unit to utilize a variety of different fuels. Therefore, it was necessary for JEA to demonstrate this capability through a series of tests. The purpose of the test program was to document the ability of the unit to utilize a variety of fuels and fuel blends in a cost effective and environmentally responsible manner. Fuel flexibility would be quantified by measuring the following parameters: • Boiler efficiency • CFB boiler sulfur capture • AQCS sulfur and particulate capture • The following flue gas emissions
• Particulate matter (PM) • Ammonia (NH3) • Oxides of nitrogen (NOx) • Lead (Pb) • Sulfur dioxide (SO2) • Mercury (Hg) • Carbon monoxide (CO) • Fluorine (F) • Carbon dioxide (CO2) • Dioxin
• Furan
• Stack opacity This test report documents the results of JEA’s Fuel Capability Demonstration Tests firing an Illinois 6 coal for the JEA Large-Scale CFB Combustion Demonstration Project. The tests were conducted in accordance with the Fuel Demonstration Test Protocol in Attachment A. Throughout this report, unless otherwise indicated, the term “unit” refers to the combination of the circulating fluidized bed (CFB) boiler and the air quality control system (AQCS). The AQCS consists of a lime-based spray dryer absorber (SDA) and a pulse jet fabric filter (PJFF).
1.1 Test Schedule Unit 2 of the JEA Northside plant site is a Circulating Fluidized Bed Steam Generator designed and constructed by Foster-Wheeler. The steam generator was designed to deliver main steam to the steam turbine at a flow rate of 1,993,591 lb/hr, at a throttle pressure of 2,500 psig, and at a throttle temperature of 1,000 deg F when firing Pittsburgh 8 coal. The fuel capability demonstration test for the unit firing the coal was conducted over a three (3) day period beginning on June 7, 2004 and completed on June 9, 2004. During that three (3) day period, data were taken in accordance with the Test Protocol (Attachment A) while the unit was operating at 100% load, 80% load , 60% load, and 40% load.

JEA Large-Scale CFB Combustion Demonstration Project
Fuel Capability Demonstration Test Report #3 p-2 Illinois 6 Coal Fuel
B&V Project 137064
The following log represents the sequence of testing: § Day 1 June 7 and June 8, 2004:
o Unit at 100% load - Began ramp down to 180 MW (60%) at approximately 1800 hours.
o Unit stabilized at 2323 hours. o Boiler performance testing commenced at 0100 hours, June 8, 2004;
completed at 0500 hours - no equipment issues.
(June 8, 2004) o At 0623 hours, began ramp up to 100% load - turbine load set and maintained
at approx. 300 MW at 0835 hours. o Flue gas testing and boiler performance testing commenced at 0900 hours. o Boiler performance testing completed at 1600 hours. o The A1 fuel feeder went off-line at approximately 1030 hours. A decision was
made to leave the fuel feeder off-line, redistribute the fuel, and continue the test. The unit was allowed to stabilize. The test continued at 1200 hours. The boiler performance test and the flue gas test were both completed at approximately 1600 hours.
§ Day 2 June 8 - 9, 2004:
o Began ramp down of unit to 40% load - turbine load set and maintained at approx. 120 MW at approximately 2230 hours.
o Unit began 2-hour stabilization period at 120 MW at 2230 hours. (June 9, 2004) o Boiler performance testing commenced at 0100 hours after stabilization period
completed; test completed at 0500 hours - no equipment issues.
§ Day 2 June 9, 2004: (cont’d) o Began ramp up of unit to 100% load at approximately 0600 hours - turbine load
set and maintained at approx. 300 MW. o Boiler performance testing commenced at 1000 hours after stabilization period
completed; test completed at 1400 hours. o Flue gas emissions data taken and recorded by CEMS system.
June 9, 2004 (continued) o Began ramp down to 80% load at 1800 hours; A1 feeder out of service. o Unit reached 240 MW at 1830 hours, began stabilization period. o Test commenced at 1930 hours; test completed at 2330 hours, no equipment
problems. o Test #3 complete.
JEA Large-Scale CFB Combustion Demonstration Project
Fuel Capability Demonstration Test Report #3 p-3 Illinois 6 Coal Fuel
B&V Project 137064
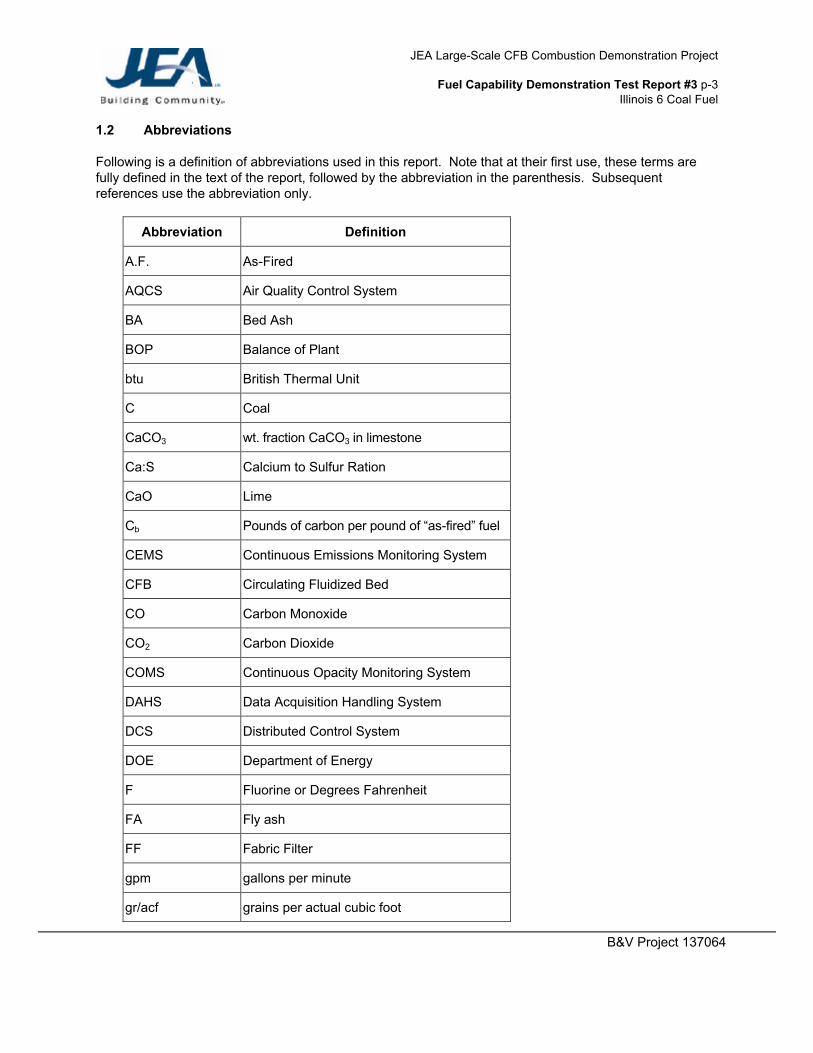
1.2 Abbreviations Following is a definition of abbreviations used in this report. Note that at their first use, these terms are fully defined in the text of the report, followed by the abbreviation in the parenthesis. Subsequent references use the abbreviation only.
Abbreviation Definition
A.F. As-Fired
AQCS Air Quality Control System
BA Bed Ash
BOP Balance of Plant
btu British Thermal Unit
C Coal
CaCO3 wt. fraction CaCO3 in limestone
Ca:S Calcium to Sulfur Ration
CaO Lime
Cb Pounds of carbon per pound of “as-fired” fuel
CEMS Continuous Emissions Monitoring System
CFB Circulating Fluidized Bed
CO Carbon Monoxide
CO2 Carbon Dioxide
COMS Continuous Opacity Monitoring System
DAHS Data Acquisition Handling System
DCS Distributed Control System
DOE Department of Energy
F Fluorine or Degrees Fahrenheit
FA Fly ash
FF Fabric Filter
gpm gallons per minute
gr/acf grains per actual cubic foot
JEA Large-Scale CFB Combustion Demonstration Project
Fuel Capability Demonstration Test Report #3 p-4 Illinois 6 Coal Fuel
B&V Project 137064
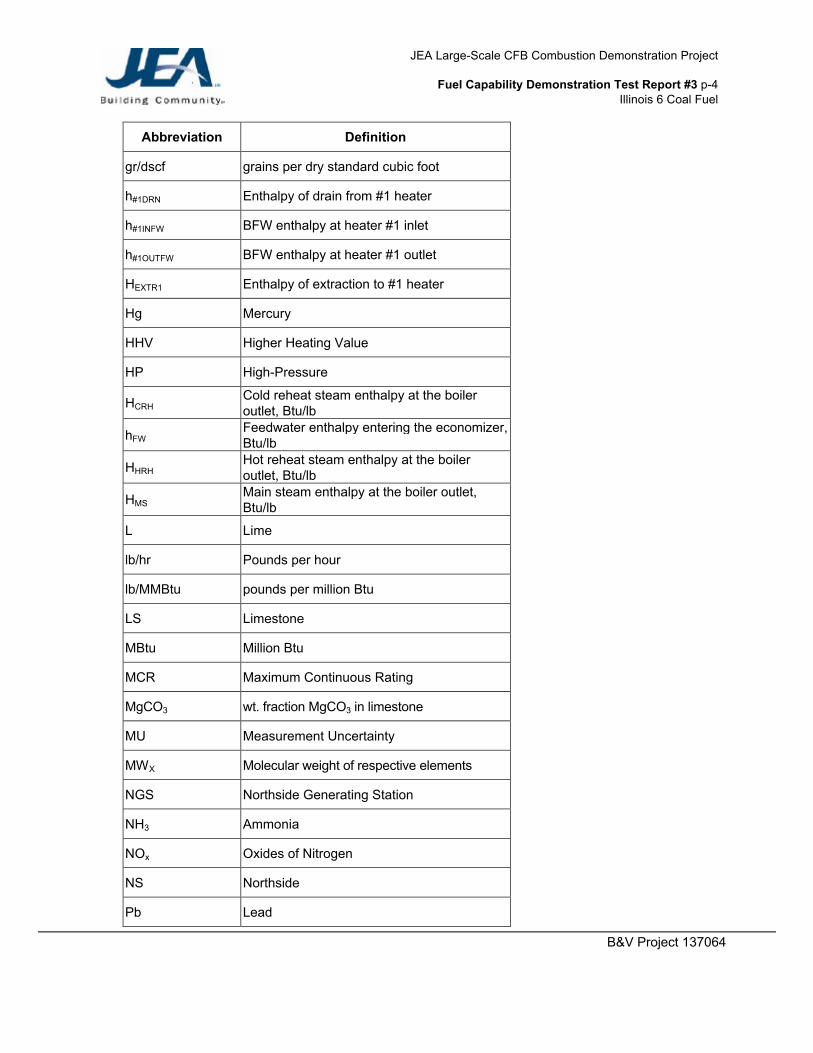
Abbreviation Definition
gr/dscf grains per dry standard cubic foot
h#1DRN Enthalpy of drain from #1 heater
h#1INFW BFW enthalpy at heater #1 inlet
h#1OUTFW BFW enthalpy at heater #1 outlet
HEXTR1 Enthalpy of extraction to #1 heater
Hg Mercury
HHV Higher Heating Value
HP High-Pressure
HCRH Cold reheat steam enthalpy at the boiler outlet, Btu/lb
hFW Feedwater enthalpy entering the economizer, Btu/lb
HHRH Hot reheat steam enthalpy at the boiler outlet, Btu/lb
HMS Main steam enthalpy at the boiler outlet, Btu/lb
L Lime
lb/hr Pounds per hour
lb/MMBtu pounds per million Btu
LS Limestone
MBtu Million Btu
MCR Maximum Continuous Rating
MgCO3 wt. fraction MgCO3 in limestone
MU Measurement Uncertainty
MWX Molecular weight of respective elements
NGS Northside Generating Station
NH3 Ammonia
NOx Oxides of Nitrogen
NS Northside
Pb Lead
JEA Large-Scale CFB Combustion Demonstration Project
Fuel Capability Demonstration Test Report #3 p-5 Illinois 6 Coal Fuel
B&V Project 137064
Abbreviation Definition
PC Petroleum Coke
pcf pounds per cubic foot
Pitt 8 Pittsburgh 8
PJFF Pulse Jet Fabric Filter
PM Particulate Matter
ppm parts per million
ppmdv Pounds per million, dry volume
psia Pounds per square inch pressure absolute
psig pounds per square inch pressure gauge
PTC Power Test Code
RH Reheat
S Capture(AQCS) Sulfur capture by the AQCS, %
SDA Spray Dryer Absorber
Sf Wt. fraction of sulfur in fuel, as-fired
SH Superheat
SNCR Selective Non-Catalytic Reduction
SO2 Sulfur Dioxide
SO2(inlet) SO2 in the AQCS inlet (lb/MBtu)
SO2(stack) SO2 in the stack (lb/MBtu)
SO3 Sulfur Trioxide
TG Turbine Generator
tph tons per hour
VOC Volatile Organic Carbon
W l Limestone feed rate (lb/hr)
WEXTR1 Extraction flow to heater #1
Wfe Fuel feed rate (lb/hr)

JEA Large-Scale CFB Combustion Demonstration Project
Fuel Capability Demonstration Test Report #3 p-6 Illinois 6 Coal Fuel
B&V Project 137064
Abbreviation Definition
WFWH feedwater flow at heaters
WMS Main steam flow, lb/hr
WRH Reheat steam flow, lb/hr
wt % weight percentage
JEA Tag Number Conventions are as follows: AA-BB-CC-xxx AA designates GEMS Group/System, as follows: BK = Boiler Vent and Drains
QF = Feedwater Flow SE = Reheat Piping SH = Reheat Superheating SI = Secondary Superheating SJ = Main Street Piping BB designates major equipment codes, as follows: 12 = Control Valve 14 = Manual Valve 34 = Instrument CC designates instrument type, as follows: FT = Flow transmitter FI = Flow indicator TE = Temperature element xxx designates numerical sequence number
JEA Large-Scale CFB Combustion Demonstration Project
Fuel Capability Demonstration Test Report #3 p-7 Illinois 6 Coal Fuel
B&V Project 137064
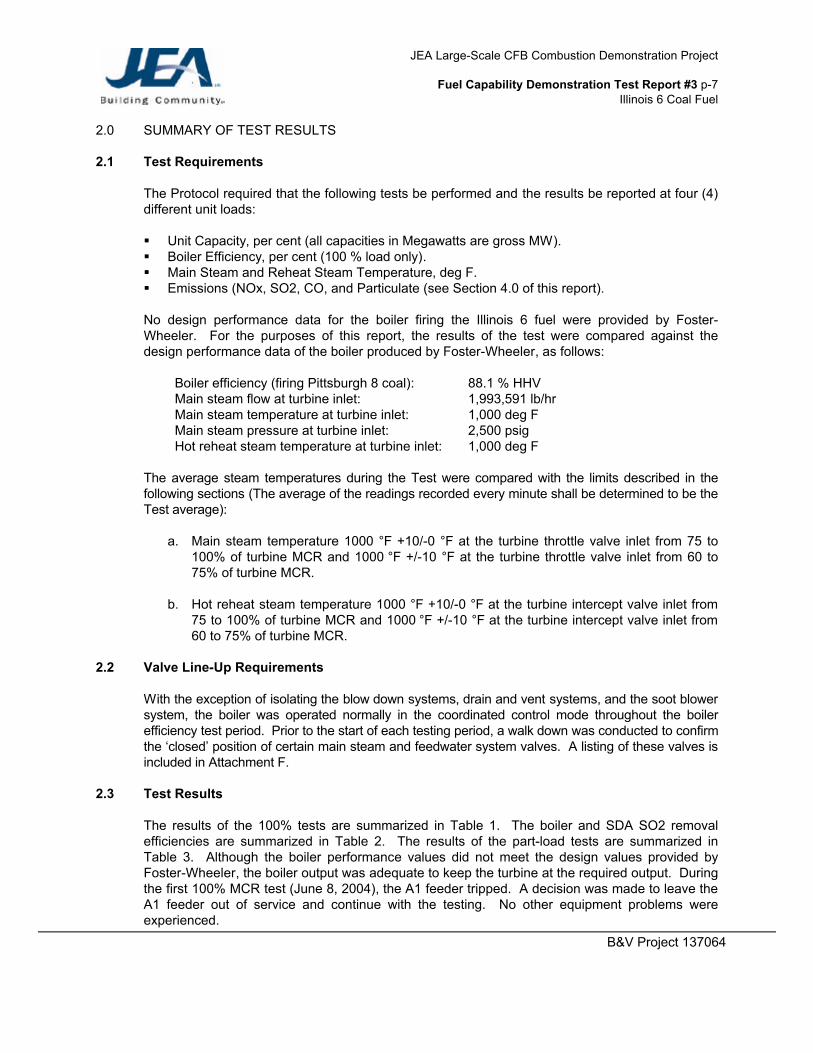
2.0 SUMMARY OF TEST RESULTS 2.1 Test Requirements
The Protocol required that the following tests be performed and the results be reported at four (4) different unit loads: § Unit Capacity, per cent (all capacities in Megawatts are gross MW). § Boiler Efficiency, per cent (100 % load only). § Main Steam and Reheat Steam Temperature, deg F. § Emissions (NOx, SO2, CO, and Particulate (see Section 4.0 of this report). No design performance data for the boiler firing the Illinois 6 fuel were provided by Foster-Wheeler. For the purposes of this report, the results of the test were compared against the design performance data of the boiler produced by Foster-Wheeler, as follows:
Boiler efficiency (firing Pittsburgh 8 coal): 88.1 % HHV Main steam flow at turbine inlet: 1,993,591 lb/hr Main steam temperature at turbine inlet: 1,000 deg F Main steam pressure at turbine inlet: 2,500 psig Hot reheat steam temperature at turbine inlet: 1,000 deg F
The average steam temperatures during the Test were compared with the limits described in the following sections (The average of the readings recorded every minute shall be determined to be the Test average):
a. Main steam temperature 1000 °F +10/-0 °F at the turbine throttle valve inlet from 75 to
100% of turbine MCR and 1000 °F +/-10 °F at the turbine throttle valve inlet from 60 to 75% of turbine MCR.
b. Hot reheat steam temperature 1000 °F +10/-0 °F at the turbine intercept valve inlet from
75 to 100% of turbine MCR and 1000 °F +/-10 °F at the turbine intercept valve inlet from 60 to 75% of turbine MCR.
2.2 Valve Line-Up Requirements
With the exception of isolating the blow down systems, drain and vent systems, and the soot blower system, the boiler was operated normally in the coordinated control mode throughout the boiler efficiency test period. Prior to the start of each testing period, a walk down was conducted to confirm the ‘closed’ position of certain main steam and feedwater system valves. A listing of these valves is included in Attachment F.
2.3 Test Results
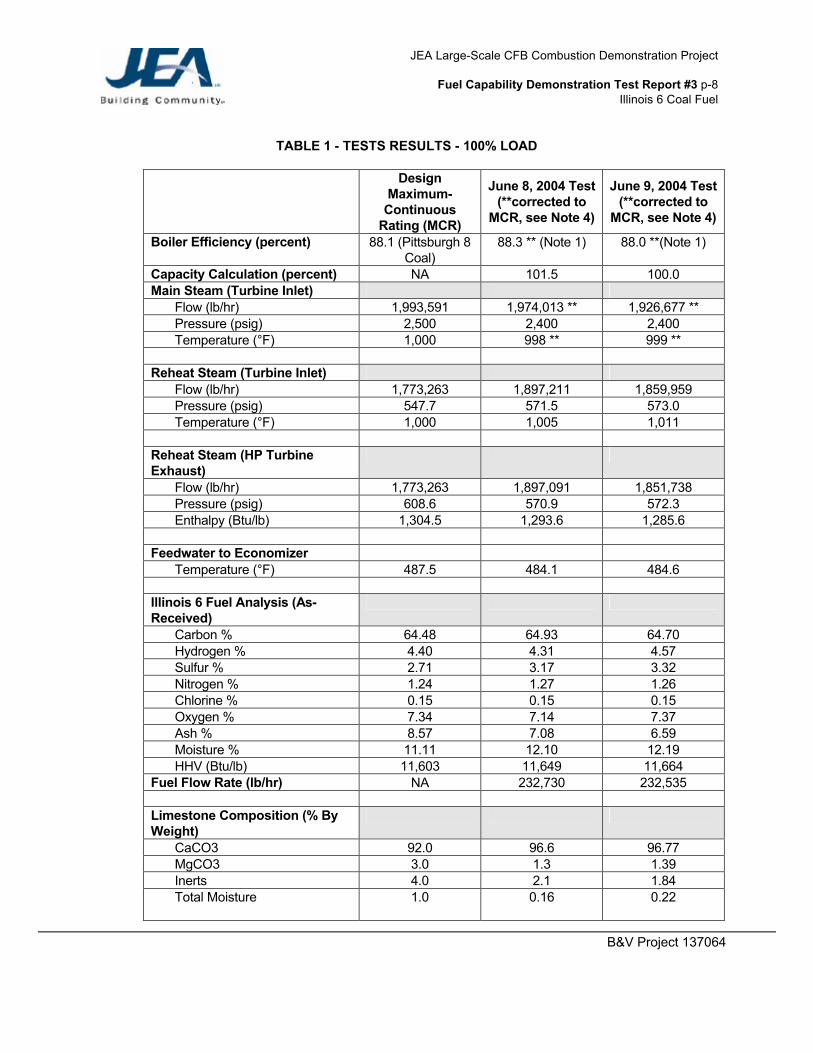
The results of the 100% tests are summarized in Table 1. The boiler and SDA SO2 removal efficiencies are summarized in Table 2. The results of the part-load tests are summarized in Table 3. Although the boiler performance values did not meet the design values provided by Foster-Wheeler, the boiler output was adequate to keep the turbine at the required output. During the first 100% MCR test (June 8, 2004), the A1 feeder tripped. A decision was made to leave the A1 feeder out of service and continue with the testing. No other equipment problems were experienced.
JEA Large-Scale CFB Combustion Demonstration Project
Fuel Capability Demonstration Test Report #3 p-8 Illinois 6 Coal Fuel
B&V Project 137064
TABLE 1 - TESTS RESULTS - 100% LOAD
Design
Maximum-Continuous
Rating (MCR)
June 8, 2004 Test (**corrected to
MCR, see Note 4)
June 9, 2004 Test (**corrected to
MCR, see Note 4)
Boiler Efficiency (percent) 88.1 (Pittsburgh 8 Coal)
88.3 ** (Note 1) 88.0 **(Note 1)
Capacity Calculation (percent) NA 101.5 100.0 Main Steam (Turbine Inlet)
Flow (lb/hr) 1,993,591 1,974,013 ** 1,926,677 ** Pressure (psig) 2,500 2,400 2,400 Temperature (°F) 1,000 998 ** 999 **
Reheat Steam (Turbine Inlet)
Flow (lb/hr) 1,773,263 1,897,211 1,859,959 Pressure (psig) 547.7 571.5 573.0 Temperature (°F) 1,000 1,005 1,011
Reheat Steam (HP Turbine Exhaust)
Flow (lb/hr) 1,773,263 1,897,091 1,851,738 Pressure (psig) 608.6 570.9 572.3 Enthalpy (Btu/lb) 1,304.5 1,293.6 1,285.6
Feedwater to Economizer
Temperature (°F) 487.5 484.1 484.6 Illinois 6 Fuel Analysis (As-Received)
Carbon % 64.48 64.93 64.70 Hydrogen % 4.40 4.31 4.57 Sulfur % 2.71 3.17 3.32 Nitrogen % 1.24 1.27 1.26 Chlorine % 0.15 0.15 0.15 Oxygen % 7.34 7.14 7.37 Ash % 8.57 7.08 6.59 Moisture % 11.11 12.10 12.19 HHV (Btu/lb) 11,603 11,649 11,664
Fuel Flow Rate (lb/hr) NA 232,730 232,535 Limestone Composition (% By Weight)
CaCO3 92.0 96.6 96.77 MgCO3 3.0 1.3 1.39 Inerts 4.0 2.1 1.84 Total Moisture 1.0 0.16 0.22
JEA Large-Scale CFB Combustion Demonstration Project
Fuel Capability Demonstration Test Report #3 p-9 Illinois 6 Coal Fuel
B&V Project 137064
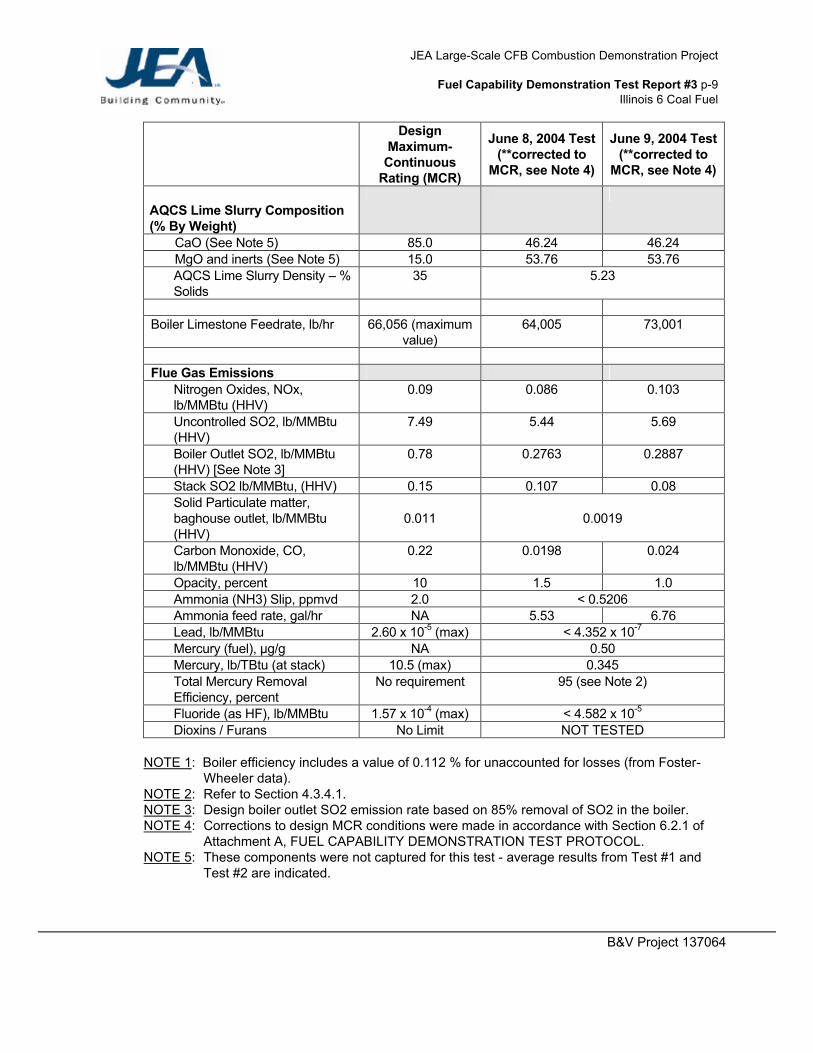
Design Maximum-
Continuous Rating (MCR)
June 8, 2004 Test (**corrected to
MCR, see Note 4)
June 9, 2004 Test (**corrected to
MCR, see Note 4)
AQCS Lime Slurry Composition (% By Weight)
CaO (See Note 5) 85.0 46.24 46.24 MgO and inerts (See Note 5) 15.0 53.76 53.76 AQCS Lime Slurry Density – % Solids
35 5.23
Boiler Limestone Feedrate, lb/hr 66,056 (maximum
value) 64,005 73,001
Flue Gas Emissions
Nitrogen Oxides, NOx, lb/MMBtu (HHV)
0.09 0.086 0.103
Uncontrolled SO2, lb/MMBtu (HHV)
7.49 5.44 5.69
Boiler Outlet SO2, lb/MMBtu (HHV) [See Note 3]
0.78 0.2763 0.2887
Stack SO2 lb/MMBtu, (HHV) 0.15 0.107 0.08 Solid Particulate matter, baghouse outlet, lb/MMBtu (HHV)
0.011
0.0019
Carbon Monoxide, CO, lb/MMBtu (HHV)
0.22 0.0198 0.024
Opacity, percent 10 1.5 1.0 Ammonia (NH3) Slip, ppmvd 2.0 < 0.5206 Ammonia feed rate, gal/hr NA 5.53 6.76 Lead, lb/MMBtu 2.60 x 10⁻⁵ (max) < 4.352 x 10⁻⁷ Mercury (fuel), µg/g NA 0.50 Mercury, lb/TBtu (at stack) 10.5 (max) 0.345 Total Mercury Removal Efficiency, percent
No requirement 95 (see Note 2)
Fluoride (as HF), lb/MMBtu 1.57 x 10⁻⁴ (max) < 4.582 x 10⁻⁵ Dioxins / Furans No Limit NOT TESTED
NOTE 1: Boiler efficiency includes a value of 0.112 % for unaccounted for losses (from Foster-
Wheeler data). NOTE 2: Refer to Section 4.3.4.1. NOTE 3: Design boiler outlet SO2 emission rate based on 85% removal of SO2 in the boiler. NOTE 4: Corrections to design MCR conditions were made in accordance with Section 6.2.1 of
Attachment A, FUEL CAPABILITY DEMONSTRATION TEST PROTOCOL. NOTE 5: These components were not captured for this test - average results from Test #1 and
Test #2 are indicated.
JEA Large-Scale CFB Combustion Demonstration Project
Fuel Capability Demonstration Test Report #3 p-10 Illinois 6 Coal Fuel
B&V Project 137064
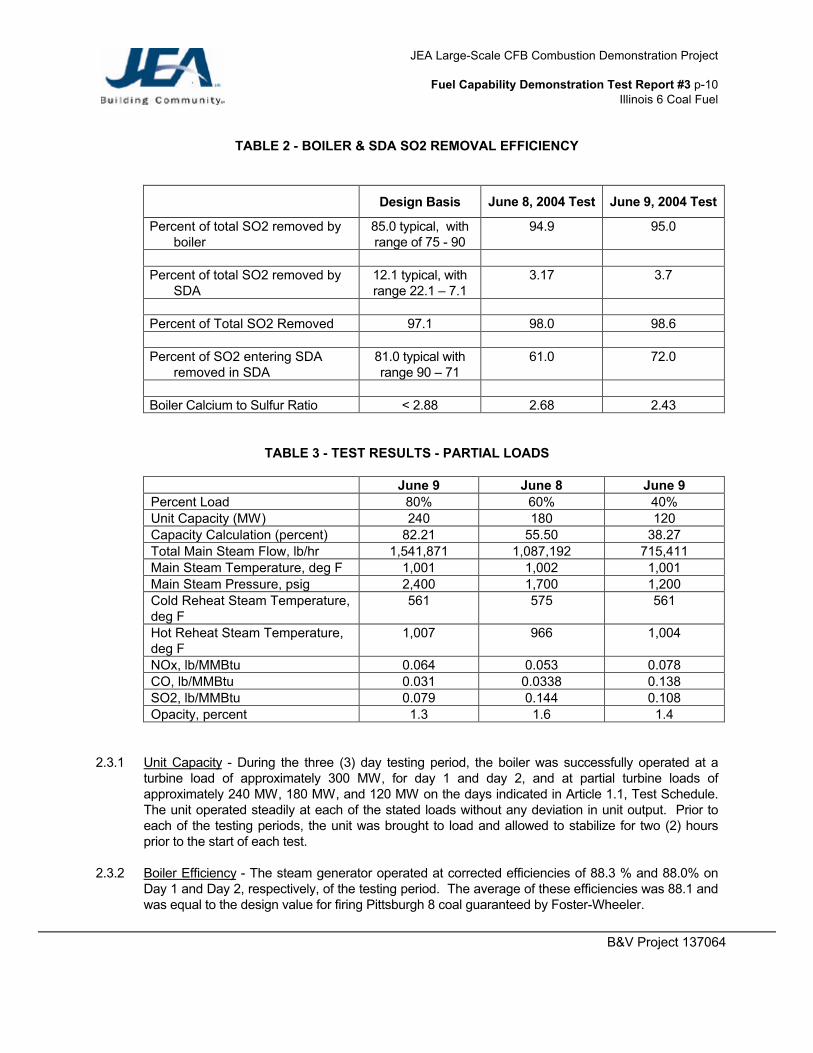
TABLE 2 - BOILER & SDA SO2 REMOVAL EFFICIENCY
Design Basis June 8, 2004 Test June 9, 2004 Test
Percent of total SO2 removed by boiler
85.0 typical, with range of 75 - 90
94.9 95.0
Percent of total SO2 removed by
SDA 12.1 typical, with range 22.1 – 7.1
3.17 3.7
Percent of Total SO2 Removed 97.1 98.0 98.6 Percent of SO2 entering SDA
removed in SDA 81.0 typical with range 90 – 71
61.0 72.0
Boiler Calcium to Sulfur Ratio < 2.88 2.68 2.43
TABLE 3 - TEST RESULTS - PARTIAL LOADS
June 9 June 8 June 9 Percent Load 80% 60% 40% Unit Capacity (MW) 240 180 120 Capacity Calculation (percent) 82.21 55.50 38.27 Total Main Steam Flow, lb/hr 1,541,871 1,087,192 715,411 Main Steam Temperature, deg F 1,001 1,002 1,001 Main Steam Pressure, psig 2,400 1,700 1,200 Cold Reheat Steam Temperature, deg F
561 575 561
Hot Reheat Steam Temperature, deg F
1,007 966 1,004
NOx, lb/MMBtu 0.064 0.053 0.078 CO, lb/MMBtu 0.031 0.0338 0.138 SO2, lb/MMBtu 0.079 0.144 0.108 Opacity, percent 1.3 1.6 1.4
2.3.1 Unit Capacity - During the three (3) day testing period, the boiler was successfully operated at a
turbine load of approximately 300 MW, for day 1 and day 2, and at partial turbine loads of approximately 240 MW, 180 MW, and 120 MW on the days indicated in Article 1.1, Test Schedule. The unit operated steadily at each of the stated loads without any deviation in unit output. Prior to each of the testing periods, the unit was brought to load and allowed to stabilize for two (2) hours prior to the start of each test.
2.3.2 Boiler Efficiency - The steam generator operated at corrected efficiencies of 88.3 % and 88.0% on
Day 1 and Day 2, respectively, of the testing period. The average of these efficiencies was 88.1 and was equal to the design value for firing Pittsburgh 8 coal guaranteed by Foster-Wheeler.
JEA Large-Scale CFB Combustion Demonstration Project
Fuel Capability Demonstration Test Report #3 p-11 Illinois 6 Coal Fuel
B&V Project 137064
2.3.3 Steam Temperature - During both days at 100% load operation, the average corrected main steam temperature measured at the turbine inlet was 998.5 deg F, which is slightly below the design tolerances of the unit. The turbine generator output correction for an initial main steam temperature reduction of 1.5 F would be a reduction of only about 0.06 MW. Additionally, the corrected hot reheat steam temperature measured at the turbine inlet was 1,008 deg F, which is within the design tolerances of the unit. The main steam temperatures and the hot reheat temperatures for the 80% and 40% partial load operating conditions were within the design tolerances previously listed in Section 2.1. The hot reheat temperature for the 60% partial load condition was 966 deg F which is approximately 24 deg F below the minimum tolerance indicated in Section 2.1 of 990 deg F. The unit, however, was able to maintain load, the effect being a slightly worse overall plant heat rate.
2.3.4 Steam Production - The steam flows of the unit at the 100% load operation cases and partial load
operation cases were each determined by adding the main steam desuperheating system flow rates to the feed water system flow rates, and subtracting the continuous blow down flow rates and the sootblowing steam flow rates. The data for each of these systems were retrieved from the plant information system database. The main steam flow rates were corrected for deviations from the design MCR feedwater temperature. Although the corrected main steam flow rates determined for the 100% load operation cases were less than the design flow rates established by Foster-Wheeler, the main steam flow rates were adequate to maintain the steam turbine at the desired plant output. The primary reason plant output could be maintained is that the Foster Wheeler design flow rates included an approximately 2.5% design margin on main steam flow above that required by the turbine generator, to compensate for plant performance degradation over time. The main steam flow rates at the partial load operation cases were adequate to maintain the steam turbine at the required output.
2.3.5 Calcium to Sulfur Ratio (Ca:S) - The calcium to sulfur ratio represents the ability of the CFB boiler
and limestone feed system to effectively remove the sulfur dioxide produced by the combustion process of the boiler. The maximum ratio established for firing the coal was 2.88. The calculated calcium to sulfur ratios for Day 1 and Day 2 are approximately 2.68 and 2.43, respectively. These values represent SO2 removal efficiencies for the boiler of greater than 90 % which are acceptable values for a CFB. SO2 reductions of greater than 90% are typically achieved in a CFB with Ca:S ratios of 2 to 2.5. These values are dependent on the sulfur content in the fuel and the reactivity of the limestone.
3.0 BOILER EFFICIENCY TESTS
The unit was operated at a steady turbine load of approximately 300 MW (100% MCR) for two (2) consecutive days as prescribed in Section 2 of the Attachment A Test Protocol. During these two days, data were recorded via the PI (Plant Information) System and were also collected by independent testing contractors. These data were then used to determine the unit’s boiler efficiency. No significant operational restrictions were observed during testing at the 100% MCR condition.
3.1 Calculation Method
The boiler efficiency calculation method was based on a combination of the abbreviated heat loss method as defined in the ASME Power Test Code (PTC) 4.1, 1974, reaffirmed 1991, and the methods described in ASME PTC 4. The method was modified to account for the heat of calcination and sulfation within the CFB boiler SO2 capture mechanism. The methods have also been modified to account for process differences between conventional and fluidized bed boilers to account for the addition of limestone. These modifications account for difference in the dry gas

JEA Large-Scale CFB Combustion Demonstration Project
Fuel Capability Demonstration Test Report #3 p-12 Illinois 6 Coal Fuel
B&V Project 137064
quantity and the additional heat loss/gain due to calcinations / sulfation. A complete description of the modified procedures is included in Section 4.2 of Attachment A. Some of the heat losses included losses due to the heat in dry flue gas, unburned carbon in the bed ash and the fly ash, and the heat loss due to radiation and convection from the insulated boiler surfaces. A complete list of the heat losses can be found in Section 4.2.1 of Attachment A. The completed efficiency calculations are included in Attachment F to this report.
3.2 Data and Sample Acquisition During the tests, permanently installed plant instrumentation was used to measure most of the data which were required to perform the boiler efficiency calculations. The data were collected electronically utilizing JEA’s Plant Information (PI) system. The data provided by the plant instrumentation is included in Attachment D, PI Data Summary. Additional data required for the boiler efficiency calculations were provided by two independent testing contractors, PGT/ESC, and Clean Air Engineering (CAE). A summary of this information is located in Attachments G, H, I, J, and K, lab analyses provided by PGT/ESC for the fuel, limestone, bed ash, fly ash, and environmental data, and Attachment C, CAE Test Report, respectively. As directed in the test protocol (Attachment A), test data for days 1 and 2 were taken and labeled by CAE and PGT/ESC. No flue gas sampling was performed on the unit during operations at reduced loads. Data were, however, recorded by the CEMS system and are reported in this document. The majority of the data utilized in the boiler efficiency calculation and sulfur capture performance, such as combustion air and flue gas temperatures and flue gas oxygen content, were stored and retrieved by the plant information system, as noted above. Data for the as-fired fuel, limestone, and resulting bed ash, fly ash, and exiting flue gas constituents were provided via laboratory analyses. Samples were taken in the following locations by PGT/ESC and forwarded to a lab for analysis. (Refer to Figures 1 thru 6 for approximate locations). Lime (Figure 1):
Lime slurry samples were taken from the sample valve located on the discharge of the lime slurry transfer pump. This valve is located in the AQCS Spray Dryer Absorber (SDA) pump room.
Fly Ash (Figures 2, 3, and 4):
Fly Ash samples were taken by two different methods. 1) Fly ash was taken by isokinetic sampling at the inlet to the SDA. These samples were taken
to determine ash loading rates and also obtain samples for laboratory analysis of ash constituents.
2) Fly ash was also taken by grab sample method in two different locations. One grab sample was taken every hour at a single air heater outlet hopper and another grab sample at a single bag house fabric filter hopper.
Fuel (Figures 4, 5, and 6):
Fuel samples were taken from the sample port at the discharge end of each gravimetric fuel feeder. The fuel samples were collected using a coal scoop inserted through the 4 inch test port at each operating fuel conveyor.
Limestone (Figures 4 and 6):
Limestone samples were taken from the outlet of each operating limestone rotary feeder. The samples were collected using a scoop passed into the flow stream of the 4 inch test ball valve in the neck of each feeder outlet.
JEA Large-Scale CFB Combustion Demonstration Project
Fuel Capability Demonstration Test Report #3 p-13 Illinois 6 Coal Fuel
B&V Project 137064
Bed Ash (Figure 6):
Bed Ash samples were taken from each of the operating stripper cooler rotary valve outlets. The samples were taken by passing a stainless steel scoop through the 4 inch test port at each operating stripper cooler.
As instructed by the Test Protocol, all of the samples were labeled and transferred to a lab for analysis. The average values were determined and used as input data for performing the boiler efficiency calculation. The results of the lab analyses are included in Attachments G, H, I, and J.
4.0 AQCS INLET AND STACK TESTS 4.1 System Description
The Unit 2 AQCS consists of a single, lime-based spray dryer absorber (SDA) and a multi-compartment pulse jet fabric filter (PJFF). The SDA has sixteen independent dual-fluid atomizers. The fabric filter has eight isolatable compartments. The AQCS system also uses reagent preparation and byproduct handling subsystems. The SDA byproduct solids/fly ash collected by the PJFF is pneumatically transferred from the PJFF hoppers to either the Unit 2 fly ash silo or the Unit 2 AQCS recycle bin. Fly ash from the recycle bin is slurried and reused as the primary reagent by the SDA spray atomizers. The reagent preparation system converts quicklime (CaO), which is delivered dry to the station, into a hydrated lime [Ca(OH)2] slurry, which is fed to the atomizers as a supplemental reagent.
4.2 Unit Emissions Design Points The following sections describe the desired emissions design goals of the unit. The tests were conducted in accordance with standard emissions testing practices and test methods as listed in Section 4.2.7. It should be noted that not all tests conducted fit exactly the 4 hour performance test period that was the basis of the fuel capability demonstration test. Several of the tests (especially those not based on CEMS) had durations that were different than the 4 hour performance period due to the requirements of the testing method and good engineering/testing practice. All sampling tests were done at the 100% load case only. All data at the 100%, 80%, 60% and 40% performance load tests were collected by the CEMS.
4.3 Emission Design Limits and Results 4.3.1 NOx / SO2 / Particulate Emission Design Limits / Results
The following gaseous emissions were measured for each 4-hour interval during the Test (EPA Permit averaging period).
a. Nitrogen oxides (NOx) values in the flue gas as measured in the stack were expected to be less than 0.09 lb/MMBtu HHV fuel heat input. The hourly average lb/MMBtu values reported by the Continuous Emissions Monitoring system (CEMS) were used as the measure of NOx in the flue gas over the course of each fuel test. The average NOx values for Day 1 and Day 2, based on HHV, were 0.086 lb/MMBtu and 0.103 lb/MMBtu, respectively. During Day 2 of the test, operational problems with the ammonia injection system prevented plant operations from limiting NOx levels.
JEA Large-Scale CFB Combustion Demonstration Project
Fuel Capability Demonstration Test Report #3 p-14 Illinois 6 Coal Fuel
B&V Project 137064
b. Sulfur dioxide (SO2) The design operating condition of the unit is to remove 85 percent of the SO2 in the boiler, with the balance to make the permitted emission rate removed in the SDA. Burning performance coal with a boiler SO2 removal efficiency of 85%, the SO2 concentration at the air heater outlet was expected to be 0.78 lb/MMBtu, with an uncontrolled SO2 emission rate (at 0% SO2 removal) calculated to be 7.49 lb/MMBtu. JEA has chosen to operate at a much higher boiler SO2 removal rate than design. Part of the reason for this operating mode is that reliability of the limestone feed system during and after the startup period was inadequate, resulting in a substantial number of periods with excess SO2 emissions. Over time the operations group has learned that if limestone feed is higher than normally desired the likelihood of excess emissions during an upset is reduced. Additionally, control of the AQCS slurry density at the desired density levels has been difficult due to some instrumentation and control issues that are not completely resolved yet. Modifications to increase the reliability and consistency of limestone feed are scheduled to be complete in late 2005, which should permit a change toward lower boiler SO2 removal and increased SDA removal.
The SO2 concentration at the SDA inlet was measured by an independent test contractor, Clean Air Engineering (CAE). These results are included in Attachment C. The average SO2 values for Day 1 and Day 2, based on HHV of the fuel, out of the air heaters and into the SDA, were 0.28 lb/MMBtu and 0.11 lb/MMBtu, respectively. Both of these values were below the expected outlet emission rate. In fact, the boiler removed 94.9% and 95% respectively, in comparison to the design removal rate of 85%. Uncontrolled SO2 emissions rates were calculated to be 5.44 lb/MMBtu and 5.69 lb/MMBtu, respectively, for a decreased SO2 input of 27% and 24% below the design performance coal SO2 input of 7.49 lb/MMBtu.
The SO2 emissions from the stack during the execution of the tests were expected to be less than 0.15 lb/MMBtu. The hourly average lb/MMBtu values (based on HHV of the fuel) reported by CEMS were used as the measure of SO2 emissions from the stack for the test. The average SO2 values for Day 1 and Day 2, (based on HHV of the fuel) were 0.107 lb/MMBtu and 0.08 lb/MMBtu, respectively. These values were 29% and 47% lower than the 0.15 lb/MMBtu permitted emission rate.
c. Solid particulate matter in the flue gas at the fabric filter outlet was expected to be
maintained at less than 0.011 lb/MMBtu HHV fuel heat input. These values were measured at the stack by CAE. The average particulate matter value for the testing period was 0.0019 lb/MMBtu which is below the expected maximum value.
4.3.2 CO Emissions Design Point
Carbon monoxide (CO) in the flue gas was expected to be less than or equal to 0.22 lb/MMBtu HHV fuel heat input at 100% MCR. This sample was measured at the stack by the plant CEMS. The average values for Day 1 and Day 2 were 0.0198 lb/MMBtu and 0.024 lb/MMBtu, respectively. The average values were less than the maximum expected value.
4.3.3 SO3 Emissions Design Point Sulfur Trioxide (SO3) in the flue gas was assumed to be zero due to the high removal efficiency of the SDA. No testing was done for SO3 as explained in the Test Protocol located in Attachment A. See Section 4.2.3 of the Fuel Capability Test Protocol for the rationale.

JEA Large-Scale CFB Combustion Demonstration Project
Fuel Capability Demonstration Test Report #3 p-15 Illinois 6 Coal Fuel
B&V Project 137064
4.3.4 NH3/ Lead/ Mercury/ Fluorine Emissions Design Points NH3, Lead, Mercury, and Fluorine gaseous emissions were measured during the Test (EPA Permit averaging period). Mercury sampling and analysis was performed at the inlet to the AQCS system in addition to the samples taken at the stack. Both samples were taken by CAE. Lead, ammonia and Fluorine were sampled only at the stack by CAE. The average values are indicated in Table 1.
4.3.4.1 Mercury Removal Mercury in the stack flue gas was expected to be less than or equal to 10.5 lb/TBtu HHV fuel heat input at 100% MCR. The average values for the test were 0.345 lb/TBtu. The average mercury value at the inlet to SDA/FF for the test was 7.098 lb/TBtu, for a 95 percent removal efficiency across the SDA/FF. The mercury tests were conducted utilizing the Ontario Hydro Test Method. Refer to the report prepared by CAE, Attachment C, Table 2-5 and Table 2-8.
4.3.5 Dioxin and Furan Emissions Design Points Dioxin and Furan gaseous emissions testing were not required for evaluation of the coal.
4.3.6 Opacity The opacity was measured by the plant CEMS/COMS (Continuous Opacity Monitoring System) to determine the opacity of the unit over a six minute block average during the test period. The maximum expected opacity was 10%. The testing indicated that the maximum opacity of the unit during the two day test was 1.8%, which is much less than the maximum opacity value.
4.4 Flue Gas Emissions Test Methods
The emissions test methods used for the demonstration test were based upon utilizing 40 CFR 60 based testing methods or the plant CEMS. The emissions tests were conducted by CAE. The following test methods were utilized:
• Particulate Matter at SDA Inlet – USEPA Method 17 • Particulate Matter at Stack – USEPA Method 5 • Oxides of Nitrogen at Stack – Plant CEMS • Sulfur Dioxide at SDA Inlet – USEPA Method 6C • Sulfur Dioxide at Stack – Plant CEMS • Carbon Monoxide at Stack – Plant CEMS • Ammonia at Stack – CTM 027 • Lead at Stack – USEPA Method 29 • Mercury at SDA Inlet – Ontario Hydro Method • Fluorine at Stack – USEPA Method 13B • Dioxin/Furans – PCDD/F
Specific descriptions of the testing methods (non-CEMS) are included in the Clean Air Engineering Emissions Test Report located in Attachment D of this document.
4.5 Continuous Emission Monitoring System
The plant CEMS was utilized for measurement of gaseous emissions as a part of the fuel capability demonstration and as listed in Section 4.2.7. The CEMS equipment was integrated by

JEA Large-Scale CFB Combustion Demonstration Project
Fuel Capability Demonstration Test Report #3 p-16 Illinois 6 Coal Fuel
B&V Project 137064
KVB-Entertec (now GE Energy Systems). The system is a dilution extractive system consisting of Thermo Environmental NOX, SO2, and CO2 analyzers. The data listed for CEMS in Section 4.2.7 originated from the certified Data Acquisition Handling System (DAHS).

JEA Large-Scale CFB Combustion Demonstration Project
Fuel Capability Demonstration Test Report #3 p-17 Illinois 6 Coal Fuel
B&V Project 137064
Attachments
Attachment A - Fuel Capability Demonstration Test Protocol Attachment B - Boiler Efficiency Calculation Attachment C - CAE Test Report Attachment D - PI Data Summary Attachment E - Abbreviation List Attachment F - Isolation Valve List Attachment G - Fuel Analyses - Illinois 6 Coal Attachment H - Limestone Analyses Attachment I - Bed Ash Analyses Attachment J - Fly Ash (Air Heater and PJFF) Analyses Attachment K - Ambient Data, June 8, 2004 and June 9, 2004 Attachment L - Partial Loads Ambient Data, June 8, 2004, and June 9, 2004
JEA Large-Scale CFB Combustion Demonstration Project
Fuel Capability Demonstration Test Report #3 - ATTACHMENTS Illinois 6 Coal Fuel
B&V Project 137064
ATTACHMENT A
Fuel Capability Demonstration Test Protocol
This Document is located via the following link:
http://www.netl.doe.gov/cctc/resources/pdfs/jacks/FCTP.pdf

JEA Large-Scale CFB Combustion Demonstration Project
Fuel Capability Demonstration Test Report #3 - ATTACHMENTS Illinois 6 Coal Fuel
B&V Project 137064
ATTACHMENT B
Boiler Efficiency Calculation
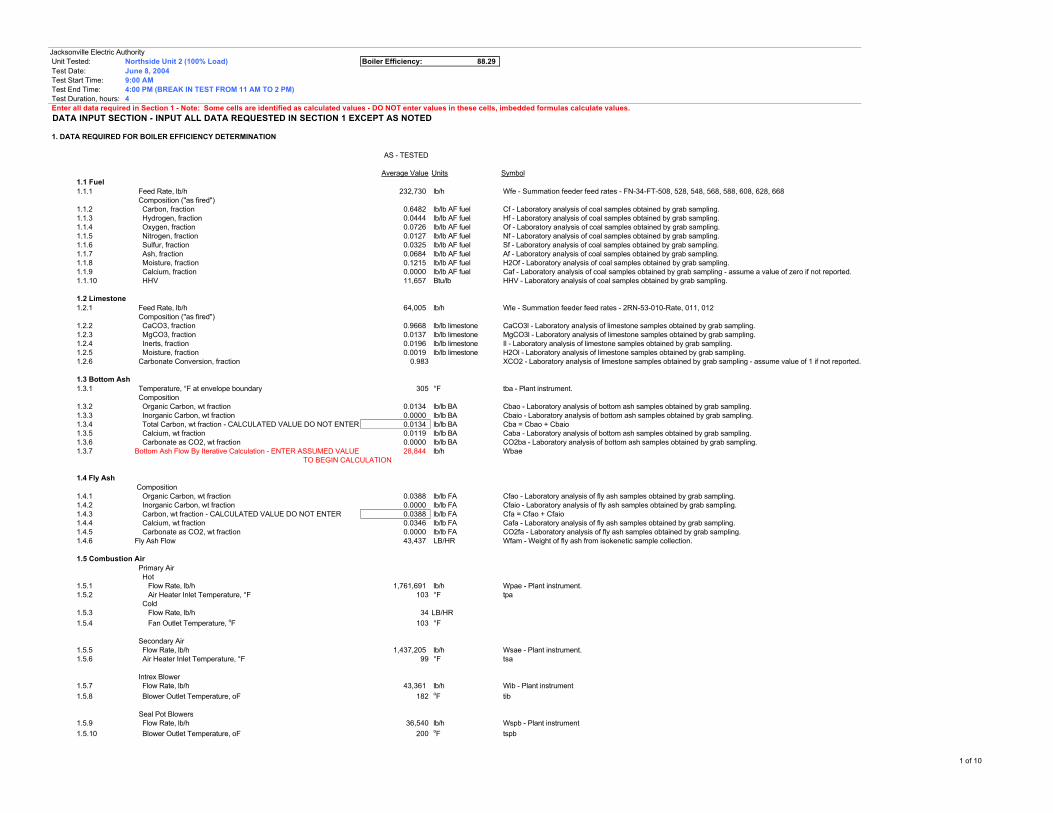
Jacksonville Electric Authority Unit Tested: Northside Unit 2 (100% Load) Boiler Efficiency: 88.29 Test Date: June 8, 2004 Test Start Time: 9:00 AM Test End Time: 4:00 PM (BREAK IN TEST FROM 11 AM TO 2 PM) Test Duration, hours: 4 Enter all data required in Section 1 - Note: Some cells are identified as calculated values - DO NOT enter values in these cells, imbedded formulas calculate values. DATA INPUT SECTION - INPUT ALL DATA REQUESTED IN SECTION 1 EXCEPT AS NOTED
1. DATA REQUIRED FOR BOILER EFFICIENCY DETERMINATION
AS - TESTED
Average Value Units Symbol1.1 Fuel1.1.1 Feed Rate, lb/h 232,730 lb/h Wfe - Summation feeder feed rates - FN-34-FT-508, 528, 548, 568, 588, 608, 628, 668
Composition ("as fired")1.1.2 Carbon, fraction 0.6482 lb/lb AF fuel Cf - Laboratory analysis of coal samples obtained by grab sampling.1.1.3 Hydrogen, fraction 0.0444 lb/lb AF fuel Hf - Laboratory analysis of coal samples obtained by grab sampling.1.1.4 Oxygen, fraction 0.0726 lb/lb AF fuel Of - Laboratory analysis of coal samples obtained by grab sampling.1.1.5 Nitrogen, fraction 0.0127 lb/lb AF fuel Nf - Laboratory analysis of coal samples obtained by grab sampling.1.1.6 Sulfur, fraction 0.0325 lb/lb AF fuel Sf - Laboratory analysis of coal samples obtained by grab sampling.1.1.7 Ash, fraction 0.0684 lb/lb AF fuel Af - Laboratory analysis of coal samples obtained by grab sampling.1.1.8 Moisture, fraction 0.1215 lb/lb AF fuel H2Of - Laboratory analysis of coal samples obtained by grab sampling.1.1.9 Calcium, fraction 0.0000 lb/lb AF fuel Caf - Laboratory analysis of coal samples obtained by grab sampling - assume a value of zero if not reported.1.1.10 HHV 11,657 Btu/lb HHV - Laboratory analysis of coal samples obtained by grab sampling.
1.2 Limestone1.2.1 Feed Rate, lb/h 64,005 lb/h Wle - Summation feeder feed rates - 2RN-53-010-Rate, 011, 012
Composition ("as fired")1.2.2 CaCO3, fraction 0.9668 lb/lb limestone CaCO3l - Laboratory analysis of limestone samples obtained by grab sampling.1.2.3 MgCO3, fraction 0.0137 lb/lb limestone MgCO3l - Laboratory analysis of limestone samples obtained by grab sampling.1.2.4 Inerts, fraction 0.0196 lb/lb limestone Il - Laboratory analysis of limestone samples obtained by grab sampling.1.2.5 Moisture, fraction 0.0019 lb/lb limestone H2Ol - Laboratory analysis of limestone samples obtained by grab sampling.1.2.6 Carbonate Conversion, fraction 0.983 XCO2 - Laboratory analysis of limestone samples obtained by grab sampling - assume value of 1 if not reported.
1.3 Bottom Ash1.3.1 Temperature, °F at envelope boundary 305 °F tba - Plant instrument.
Composition1.3.2 Organic Carbon, wt fraction 0.0134 lb/lb BA Cbao - Laboratory analysis of bottom ash samples obtained by grab sampling.1.3.3 Inorganic Carbon, wt fraction 0.0000 lb/lb BA Cbaio - Laboratory analysis of bottom ash samples obtained by grab sampling.1.3.4 Total Carbon, wt fraction - CALCULATED VALUE DO NOT ENTER 0.0134 lb/lb BA Cba = Cbao + Cbaio1.3.5 Calcium, wt fraction 0.0119 lb/lb BA Caba - Laboratory analysis of bottom ash samples obtained by grab sampling.1.3.6 Carbonate as CO2, wt fraction 0.0000 lb/lb BA CO2ba - Laboratory analysis of bottom ash samples obtained by grab sampling.1.3.7 Bottom Ash Flow By Iterative Calculation - ENTER ASSUMED VALUE 28,844 lb/h Wbae
TO BEGIN CALCULATION
1.4 Fly Ash Composition
1.4.1 Organic Carbon, wt fraction 0.0388 lb/lb FA Cfao - Laboratory analysis of fly ash samples obtained by grab sampling.1.4.2 Inorganic Carbon, wt fraction 0.0000 lb/lb FA Cfaio - Laboratory analysis of fly ash samples obtained by grab sampling.1.4.3 Carbon, wt fraction - CALCULATED VALUE DO NOT ENTER 0.0388 lb/lb FA Cfa = Cfao + Cfaio1.4.4 Calcium, wt fraction 0.0346 lb/lb FA Cafa - Laboratory analysis of fly ash samples obtained by grab sampling.1.4.5 Carbonate as CO2, wt fraction 0.0000 lb/lb FA CO2fa - Laboratory analysis of fly ash samples obtained by grab sampling.1.4.6 Fly Ash Flow 43,437 LB/HR Wfam - Weight of fly ash from isokenetic sample collection.
1.5 Combustion Air Primary Air
Hot1.5.1 Flow Rate, lb/h 1,761,691 lb/h Wpae - Plant instrument.1.5.2 Air Heater Inlet Temperature, °F 103 °F tpa
Cold1.5.3 Flow Rate, lb/h 34 LB/HR1.5.4 Fan Outlet Temperature, oF 103 °F
Secondary Air1.5.5 Flow Rate, lb/h 1,437,205 lb/h Wsae - Plant instrument.1.5.6 Air Heater Inlet Temperature, °F 99 °F tsa
Intrex Blower1.5.7 Flow Rate, lb/h 43,361 lb/h Wib - Plant instrument1.5.8 Blower Outlet Temperature, oF 182 oF tib
Seal Pot Blowers 1.5.9 Flow Rate, lb/h 36,540 lb/h Wspb - Plant instrument1.5.10 Blower Outlet Temperature, oF 200 oF tspb
1 of 10

Jacksonville Electric Authority Unit Tested: Northside Unit 2 (100% Load) Boiler Efficiency: 88.29 Test Date: June 8, 2004 Test Start Time: 9:00 AM Test End Time: 4:00 PM (BREAK IN TEST FROM 11 AM TO 2 PM) Test Duration, hours: 4 Enter all data required in Section 1 - Note: Some cells are identified as calculated values - DO NOT enter values in these cells, imbedded formulas calculate values.
1.6 Ambient Conditions1.6.1 Ambient dry bulb temperature, °F 84.26 °F ta1.6.2 Ambient wet bulb temperature, °F 74.56 °F tawb1.6.3 Barometric pressure, inches Hg 30.14 inches Hg Patm1.6.4 Moisture in air, lbH2O/lb dry air 0.0161 lbH2O/lb dry air Calculated: H2OA - From psychometric chart at temperatures ta and tawb adjusted to test Patm.
1.7 Flue GasAt Air Heater Outlet
1.7.1 Temperature (measured), °F 314.00 °F Tg15 - Weighted average from AH outlet plant instruments (based on PA and SA flow rates)1.7.2 Temperature (unmeasured), °F Calculated
Composition (wet)1.7.3 O2 0.0466 percent volume O2 - Weighted average from test instrument1.7.4 CO2 Not Measured percent volume CO21.7.5 CO Not Measured percent volume CO1.7.6 SO2 Not Measured percent volume SO2
At Air Heater Inlet1.7.7 Temperature, °F 568.82 °F tG14 - Plant Instrument
Composition (wet)1.7.8 O2 0.0360 percent volume1.7.9 CO2 Not Measured percent volume1.7.10 CO Not Measured percent volume1.7.11 SO2 0.0041 percent volume measurement is in ppm
CEM Sample Extraction At Outlet Of Economizer Composition
1.7.12 O2, percent - WET basis 3.600 percent volume O2stk1.7.13 SO2, ppm - dry basis 114.9 ppm SO2stk1.7.14 NOx, ppm - dry basis Not Measured ppm Noxstk1.7.15 CO, ppm - dry basis Not Measured ppm Costk1.7.16 Particulate, mg/Nm³ Not Measured mg/Nm³ - 25° C PARTstk
1.8 Feedwater1.8.1 Pressure, PSIG 1950.5 PSIG pfw - Plant instrument.1.8.2 Temperature, °F 484.1 °F tfw - Plant instrument.1.8.3 Flow Rate, lb/h 1,972,754 lb/h FW - Plant instrument.
1.9 Continuous Blow Down1.9.1 Pressure, PSIG (drum pressure) 2,588.1 PSIG pbd - Plant instrument1.9.2 Temperature, °F (sat. temp. @ drum pressure) 675.2 °F tba - Saturated water temperature from steam table at drum pressure.1.9.3 Flow Rate, lb/h 0.00 lb/h BD - Estimated using flow characteristic of valve and number of turns open.
1.10 Sootblowing1.10.1 Flow Rate, LB/HR 0.00 LB/HR SB - Plant instrument1.10.2 Pressure, PSIG 0.00 PSIG psb - Plant instrument1.10.3 Temperature, F 0.00 F tsb - plant instrument
1.11 Main Steam Desuperheating Water1.11.1 Pressure, PSIG 2,727.5 PSIG pdsw - Plant instrument.1.11.2 Temperature, °F 313.8 °F tdsw - Plant instrument.1.11.3 Flow Rate, lb/h 1,259 lb/h DSW - Plant instrument.
1.12 Main Steam1.12.1 Pressure, PSIG (superheater outlet) 2,400.2 PSIG pms - Plant instrument.1.12.2 Temperature, °F 998.0 °F tms - Plant instrument.1.12.3 Flow Rate, lb/h 1,974,013 lb/h MS - Plant instrument - Not required to determine boiler efficiency - For information only.
1.13 Reheat Steam Desuperheating Water1.13.1 Pressure, PSIG 945.12 PSIG pdswrh - Plant instrument.1.13.2 Temperature, °F 312.27 °F tdswrh - Plant instrument.1.13.3 Flow Rate, lb/h 120 lb/h DSWrh - Plant instrument.
1.14 Reheat Steam1.14.1 Inlet Pressure, PSIG 570.89 PSIG prhin - Plant instrument.1.14.2 Inlet Temperature, °F 601.75 °F trhin - Plant instrument.1.14.3 Outlet Pressure, PSIG 571.53 PSIG prhout - Plant instrument.1.14.4 Outlet Temperature, °F 1,004.75 °F trhout - Plant instrument.1.14.5 Inlet Flow, LB/HR 1,897,091 LB/HR RHin - From turbine heat.
2 of 10
Jacksonville Electric Authority Unit Tested: Northside Unit 2 (100% Load) Boiler Efficiency: 88.29 Test Date: June 8, 2004 Test Start Time: 9:00 AM Test End Time: 4:00 PM (BREAK IN TEST FROM 11 AM TO 2 PM) Test Duration, hours: 4 Enter all data required in Section 1 - Note: Some cells are identified as calculated values - DO NOT enter values in these cells, imbedded formulas calculate values.
2. REFERENCE TEMPERATURES
2.1 Average Air Heater Inlet Temperature 102.47
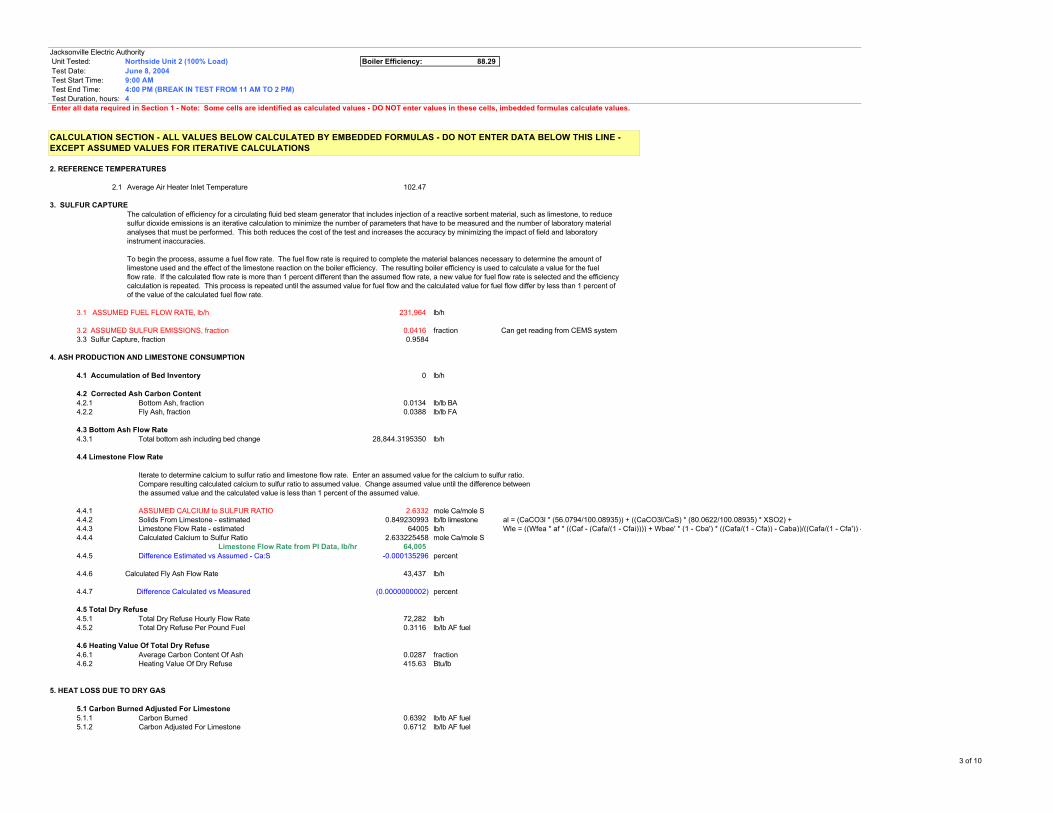
3. SULFUR CAPTURE The calculation of efficiency for a circulating fluid bed steam generator that includes injection of a reactive sorbent material, such as limestone, to reduce sulfur dioxide emissions is an iterative calculation to minimize the number of parameters that have to be measured and the number of laboratory material analyses that must be performed. This both reduces the cost of the test and increases the accuracy by minimizing the impact of field and laboratory instrument inaccuracies.
To begin the process, assume a fuel flow rate. The fuel flow rate is required to complete the material balances necessary to determine the amount of limestone used and the effect of the limestone reaction on the boiler efficiency. The resulting boiler efficiency is used to calculate a value for the fuel flow rate. If the calculated flow rate is more than 1 percent different than the assumed flow rate, a new value for fuel flow rate is selected and the efficiency calculation is repeated. This process is repeated until the assumed value for fuel flow and the calculated value for fuel flow differ by less than 1 percent of of the value of the calculated fuel flow rate.
3.1 ASSUMED FUEL FLOW RATE, lb/h 231,964 lb/h
3.2 ASSUMED SULFUR EMISSIONS, fraction 0.0416 fraction Can get reading from CEMS system3.3 Sulfur Capture, fraction 0.9584
4. ASH PRODUCTION AND LIMESTONE CONSUMPTION
4.1 Accumulation of Bed Inventory 0 lb/h
4.2 Corrected Ash Carbon Content4.2.1 Bottom Ash, fraction 0.0134 lb/lb BA4.2.2 Fly Ash, fraction 0.0388 lb/lb FA
4.3 Bottom Ash Flow Rate4.3.1 Total bottom ash including bed change 28,844.3195350 lb/h
4.4 Limestone Flow Rate
Iterate to determine calcium to sulfur ratio and limestone flow rate. Enter an assumed value for the calcium to sulfur ratio. Compare resulting calculated calcium to sulfur ratio to assumed value. Change assumed value until the difference between the assumed value and the calculated value is less than 1 percent of the assumed value.
4.4.1 ASSUMED CALCIUM to SULFUR RATIO 2.6332 mole Ca/mole S4.4.2 Solids From Limestone - estimated 0.849230993 lb/lb limestone4.4.3 Limestone Flow Rate - estimated 64005 lb/h4.4.4 Calculated Calcium to Sulfur Ratio 2.633225458 mole Ca/mole S
Limestone Flow Rate from PI Data, lb/hr 64,0054.4.5 Difference Estimated vs Assumed - Ca:S -0.000135296 percent
4.4.6 Calculated Fly Ash Flow Rate 43,437 lb/h
4.4.7 Difference Calculated vs Measured (0.0000000002) percent
4.5 Total Dry Refuse4.5.1 Total Dry Refuse Hourly Flow Rate 72,282 lb/h4.5.2 Total Dry Refuse Per Pound Fuel 0.3116 lb/lb AF fuel
4.6 Heating Value Of Total Dry Refuse4.6.1 Average Carbon Content Of Ash 0.0287 fraction4.6.2 Heating Value Of Dry Refuse 415.63 Btu/lb
5. HEAT LOSS DUE TO DRY GAS
5.1 Carbon Burned Adjusted For Limestone5.1.1 Carbon Burned 0.6392 lb/lb AF fuel5.1.2 Carbon Adjusted For Limestone 0.6712 lb/lb AF fuel
al = (CaCO3l * (56.0794/100.08935)) + ((CaCO3l/CaS) * (80.0622/100.08935) * XSO2) + Wle = ((Wfea * af * ((Caf - (Cafa/(1 - Cfai)))) + Wbae' * (1 - Cba') * ((Cafa/(1 - Cfa)) - Caba))/((Cafa/(1 - Cfa')) -
CALCULATION SECTION - ALL VALUES BELOW CALCULATED BY EMBEDDED FORMULAS - DO NOT ENTER DATA BELOW THIS LINE - EXCEPT ASSUMED VALUES FOR ITERATIVE CALCULATIONS
3 of 10
Jacksonville Electric Authority Unit Tested: Northside Unit 2 (100% Load) Boiler Efficiency: 88.29 Test Date: June 8, 2004 Test Start Time: 9:00 AM Test End Time: 4:00 PM (BREAK IN TEST FROM 11 AM TO 2 PM) Test Duration, hours: 4 Enter all data required in Section 1 - Note: Some cells are identified as calculated values - DO NOT enter values in these cells, imbedded formulas calculate values.
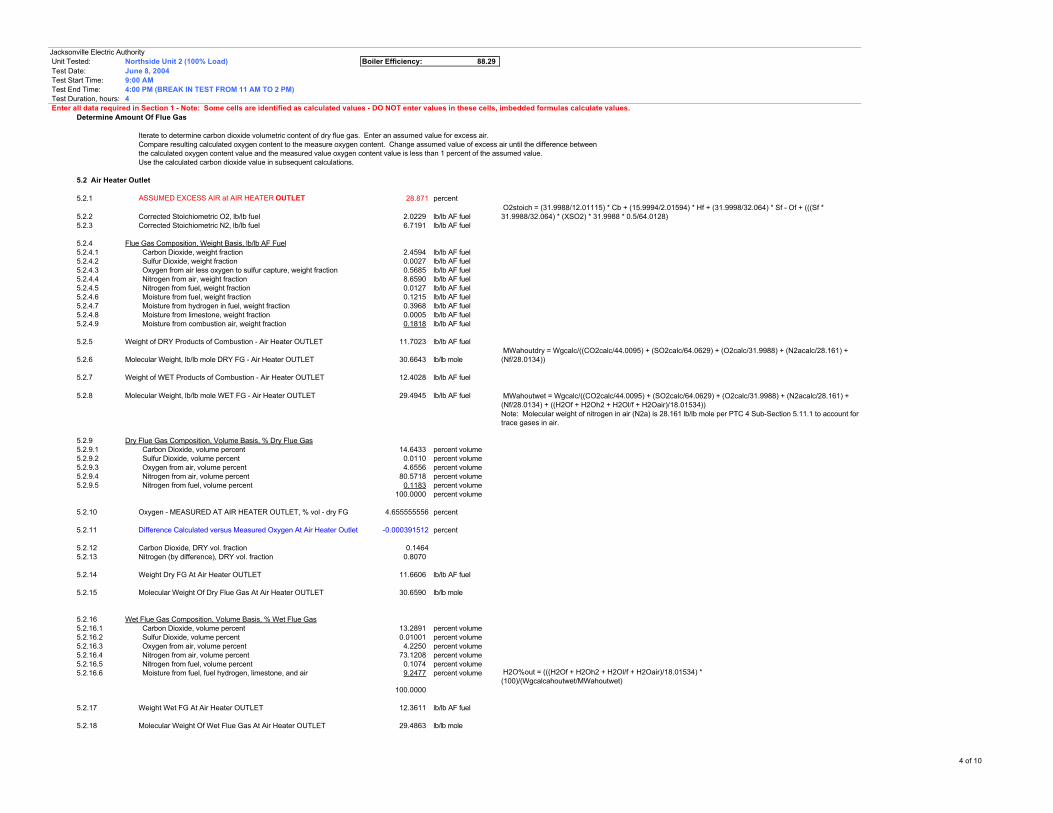
Determine Amount Of Flue Gas
Iterate to determine carbon dioxide volumetric content of dry flue gas. Enter an assumed value for excess air. Compare resulting calculated oxygen content to the measure oxygen content. Change assumed value of excess air until the difference between the calculated oxygen content value and the measured value oxygen content value is less than 1 percent of the assumed value. Use the calculated carbon dioxide value in subsequent calculations.
5.2 Air Heater Outlet
5.2.1 ASSUMED EXCESS AIR at AIR HEATER OUTLET 28.871 percent
5.2.2 Corrected Stoichiometric O2, lb/lb fuel 2.0229 lb/lb AF fuel5.2.3 Corrected Stoichiometric N2, lb/lb fuel 6.7191 lb/lb AF fuel
5.2.4 Flue Gas Composition, Weight Basis, lb/lb AF Fuel5.2.4.1 Carbon Dioxide, weight fraction 2.4594 lb/lb AF fuel5.2.4.2 Sulfur Dioxide, weight fraction 0.0027 lb/lb AF fuel5.2.4.3 Oxygen from air less oxygen to sulfur capture, weight fraction 0.5685 lb/lb AF fuel5.2.4.4 Nitrogen from air, weight fraction 8.6590 lb/lb AF fuel5.2.4.5 Nitrogen from fuel, weight fraction 0.0127 lb/lb AF fuel5.2.4.6 Moisture from fuel, weight fraction 0.1215 lb/lb AF fuel5.2.4.7 Moisture from hydrogen in fuel, weight fraction 0.3968 lb/lb AF fuel5.2.4.8 Moisture from limestone, weight fraction 0.0005 lb/lb AF fuel5.2.4.9 Moisture from combustion air, weight fraction 0.1818 lb/lb AF fuel
5.2.5 Weight of DRY Products of Combustion - Air Heater OUTLET 11.7023 lb/lb AF fuel
5.2.6 Molecular Weight, lb/lb mole DRY FG - Air Heater OUTLET 30.6643 lb/lb mole
5.2.7 Weight of WET Products of Combustion - Air Heater OUTLET 12.4028 lb/lb AF fuel
5.2.8 Molecular Weight, lb/lb mole WET FG - Air Heater OUTLET 29.4945 lb/lb AF fuel
5.2.9 Dry Flue Gas Composition, Volume Basis, % Dry Flue Gas5.2.9.1 Carbon Dioxide, volume percent 14.6433 percent volume5.2.9.2 Sulfur Dioxide, volume percent 0.0110 percent volume5.2.9.3 Oxygen from air, volume percent 4.6556 percent volume5.2.9.4 Nitrogen from air, volume percent 80.5718 percent volume5.2.9.5 Nitrogen from fuel, volume percent 0.1183 percent volume
100.0000 percent volume
5.2.10 Oxygen - MEASURED AT AIR HEATER OUTLET, % vol - dry FG 4.655555556 percent
5.2.11 Difference Calculated versus Measured Oxygen At Air Heater Outlet -0.000391512 percent
5.2.12 Carbon Dioxide, DRY vol. fraction 0.14645.2.13 Nitrogen (by difference), DRY vol. fraction 0.8070
5.2.14 Weight Dry FG At Air Heater OUTLET 11.6606 lb/lb AF fuel
5.2.15 Molecular Weight Of Dry Flue Gas At Air Heater OUTLET 30.6590 lb/lb mole
5.2.16 Wet Flue Gas Composition, Volume Basis, % Wet Flue Gas5.2.16.1 Carbon Dioxide, volume percent 13.2891 percent volume5.2.16.2 Sulfur Dioxide, volume percent 0.01001 percent volume5.2.16.3 Oxygen from air, volume percent 4.2250 percent volume5.2.16.4 Nitrogen from air, volume percent 73.1208 percent volume5.2.16.5 Nitrogen from fuel, volume percent 0.1074 percent volume5.2.16.6 Moisture from fuel, fuel hydrogen, limestone, and air 9.2477 percent volume
100.0000
5.2.17 Weight Wet FG At Air Heater OUTLET 12.3611 lb/lb AF fuel
5.2.18 Molecular Weight Of Wet Flue Gas At Air Heater OUTLET 29.4863 lb/lb mole
H2O%out = (((H2Of + H2Oh2 + H2Ol/f + H2Oair)/18.01534) * (100)/(Wgcalcahoutwet/MWahoutwet)
Note: Molecular weight of nitrogen in air (N2a) is 28.161 lb/lb mole per PTC 4 Sub-Section 5.11.1 to account for trace gases in air.
O2stoich = (31.9988/12.01115) * Cb + (15.9994/2.01594) * Hf + (31.9998/32.064) * Sf - Of + (((Sf * 31.9988/32.064) * (XSO2) * 31.9988 * 0.5/64.0128)
MWahoutwet = Wgcalc/((CO2calc/44.0095) + (SO2calc/64.0629) + (O2calc/31.9988) + (N2acalc/28.161) + (Nf/28.0134) + ((H2Of + H2Oh2 + H2Ol/f + H2Oair)/18.01534))
MWahoutdry = Wgcalc/((CO2calc/44.0095) + (SO2calc/64.0629) + (O2calc/31.9988) + (N2acalc/28.161) + (Nf/28.0134))
4 of 10
Jacksonville Electric Authority Unit Tested: Northside Unit 2 (100% Load) Boiler Efficiency: 88.29 Test Date: June 8, 2004 Test Start Time: 9:00 AM Test End Time: 4:00 PM (BREAK IN TEST FROM 11 AM TO 2 PM) Test Duration, hours: 4 Enter all data required in Section 1 - Note: Some cells are identified as calculated values - DO NOT enter values in these cells, imbedded formulas calculate values.
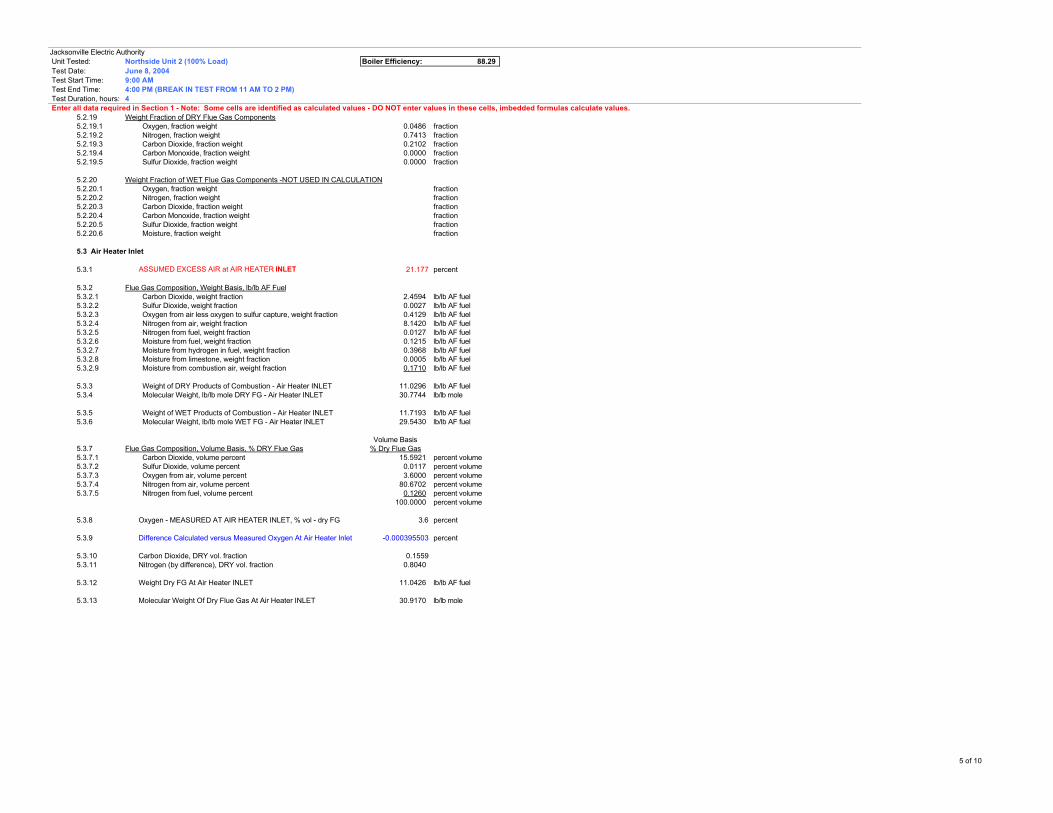
5.2.19 Weight Fraction of DRY Flue Gas Components5.2.19.1 Oxygen, fraction weight 0.0486 fraction5.2.19.2 Nitrogen, fraction weight 0.7413 fraction5.2.19.3 Carbon Dioxide, fraction weight 0.2102 fraction5.2.19.4 Carbon Monoxide, fraction weight 0.0000 fraction5.2.19.5 Sulfur Dioxide, fraction weight 0.0000 fraction
5.2.20 Weight Fraction of WET Flue Gas Components -NOT USED IN CALCULATION5.2.20.1 Oxygen, fraction weight fraction5.2.20.2 Nitrogen, fraction weight fraction5.2.20.3 Carbon Dioxide, fraction weight fraction5.2.20.4 Carbon Monoxide, fraction weight fraction5.2.20.5 Sulfur Dioxide, fraction weight fraction5.2.20.6 Moisture, fraction weight fraction
5.3 Air Heater Inlet
5.3.1 ASSUMED EXCESS AIR at AIR HEATER INLET 21.177 percent
5.3.2 Flue Gas Composition, Weight Basis, lb/lb AF Fuel5.3.2.1 Carbon Dioxide, weight fraction 2.4594 lb/lb AF fuel5.3.2.2 Sulfur Dioxide, weight fraction 0.0027 lb/lb AF fuel5.3.2.3 Oxygen from air less oxygen to sulfur capture, weight fraction 0.4129 lb/lb AF fuel5.3.2.4 Nitrogen from air, weight fraction 8.1420 lb/lb AF fuel5.3.2.5 Nitrogen from fuel, weight fraction 0.0127 lb/lb AF fuel5.3.2.6 Moisture from fuel, weight fraction 0.1215 lb/lb AF fuel5.3.2.7 Moisture from hydrogen in fuel, weight fraction 0.3968 lb/lb AF fuel5.3.2.8 Moisture from limestone, weight fraction 0.0005 lb/lb AF fuel5.3.2.9 Moisture from combustion air, weight fraction 0.1710 lb/lb AF fuel
5.3.3 Weight of DRY Products of Combustion - Air Heater INLET 11.0296 lb/lb AF fuel5.3.4 Molecular Weight, lb/lb mole DRY FG - Air Heater INLET 30.7744 lb/lb mole
5.3.5 Weight of WET Products of Combustion - Air Heater INLET 11.7193 lb/lb AF fuel5.3.6 Molecular Weight, lb/lb mole WET FG - Air Heater INLET 29.5430 lb/lb AF fuel
Volume Basis5.3.7 Flue Gas Composition, Volume Basis, % DRY Flue Gas % Dry Flue Gas5.3.7.1 Carbon Dioxide, volume percent 15.5921 percent volume5.3.7.2 Sulfur Dioxide, volume percent 0.0117 percent volume5.3.7.3 Oxygen from air, volume percent 3.6000 percent volume5.3.7.4 Nitrogen from air, volume percent 80.6702 percent volume5.3.7.5 Nitrogen from fuel, volume percent 0.1260 percent volume
100.0000 percent volume
5.3.8 Oxygen - MEASURED AT AIR HEATER INLET, % vol - dry FG 3.6 percent
5.3.9 Difference Calculated versus Measured Oxygen At Air Heater Inlet -0.000395503 percent
5.3.10 Carbon Dioxide, DRY vol. fraction 0.15595.3.11 Nitrogen (by difference), DRY vol. fraction 0.8040
5.3.12 Weight Dry FG At Air Heater INLET 11.0426 lb/lb AF fuel
5.3.13 Molecular Weight Of Dry Flue Gas At Air Heater INLET 30.9170 lb/lb mole
5 of 10

Jacksonville Electric Authority Unit Tested: Northside Unit 2 (100% Load) Boiler Efficiency: 88.29 Test Date: June 8, 2004 Test Start Time: 9:00 AM Test End Time: 4:00 PM (BREAK IN TEST FROM 11 AM TO 2 PM) Test Duration, hours: 4 Enter all data required in Section 1 - Note: Some cells are identified as calculated values - DO NOT enter values in these cells, imbedded formulas calculate values.
Volume Basis5.3.14 Flue Gas Composition, Volume Basis, % Wet Flue Gas % Wet Flue Gas5.3.14.1 Carbon Dioxide, volume percent 14.0873 percent volume5.3.14.2 Sulfur Dioxide, volume percent 0.01061 percent volume5.3.14.3 Oxygen from air, volume percent 3.2526 percent volume5.3.14.4 Nitrogen from air, volume percent 72.8845 percent volume5.3.14.5 Nitrogen from fuel, volume percent 0.1138 percent volume5.3.14.6 Moisture from fuel, fuel hydrogen, limestone, and air 9.6512 percent volume
100.0000
5.3.15 Weight Wet FG At Air Heater INLET 11.7323 lb/lb AF fuel
5.3.16 Molecular Weight Of Wet Flue Gas At Air Heater INLET 29.6680 lb/lb mole
5.3.17 Weight Fraction of DRY Flue Gas Components5.3.17.1 Oxygen, fraction weight 0.0373 fraction5.3.17.2 Nitrogen, fraction weight 0.7323 fraction5.3.17.3 Carbon Dioxide, fraction weight 0.2219 fraction5.3.17.4 Carbon Monoxide, fraction weight 0.0000 fraction5.3.17.5 Sulfur Dioxide, fraction weight 0.0085 fraction
5.3.18 Weight Fraction of WET Flue Gas Components5.3.18.1 Oxygen, fraction weight 0.0351 fraction5.3.18.2 Nitrogen, fraction weight 0.6893 fraction5.3.18.3 Carbon Dioxide, fraction weight 0.2090 fraction5.3.18.4 Carbon Monoxide, fraction weight 0.0000 fraction5.3.18.5 Sulfur Dioxide, fraction weight 0.0080 fraction5.3.18.6 Moisture, fraction weight 0.0586 fraction
5.4 CEM Sampling Location
5.4.1 ASSUMED EXCESS AIR at CEM SAMPLING LOCATION 23.824 percent
5.4.2 Flue Gas Composition, Weight Basis, lb/lb AF Fuel5.4.2.1 Carbon Dioxide, weight fraction 2.4594 lb/lb AF fuel5.4.2.2 Sulfur Dioxide, weight fraction 0.0027 lb/lb AF fuel5.4.2.3 Oxygen from air less oxygen to sulfur capture, weight fraction 0.4664 lb/lb AF fuel5.4.2.4 Nitrogen from air, weight fraction 8.3199 lb/lb AF fuel5.4.2.5 Nitrogen from fuel, weight fraction 0.0127 lb/lb AF fuel5.4.2.6 Moisture from fuel, weight fraction 0.1215 lb/lb AF fuel5.4.2.7 Moisture from hydrogen in fuel, weight fraction 0.3968 lb/lb AF fuel5.4.2.8 Moisture from limestone, weight fraction 0.0005 lb/lb AF fuel5.4.2.9 Moisture from combustion air, weight fraction 0.1747 lb/lb AF fuel
5.4.3 Weight of DRY Products of Combustion - CEM Sampling Location 11.2610 lb/lb AF fuel5.4.4 Molecular Weight, lb/lb mole DRY FG - CEM Sampling Location 30.7349 lb/lb mole
5.4.5 Weight of WET Products of Combustion - CEM Sampling Location 11.9544 lb/lb AF fuel5.4.6 Molecular Weight, lb/lb mole WET FG - CEM Sampling Location 29.5257 lb/lb mole
Volume Basis5.4.7 Flue Gas Composition, Volume Basis, % WET or DRY Flue Gas % Wet Flue Gas5.4.7.1 a Carbon Dioxide, volume percent 13.8021 percent volume5.4.7.2 a Sulfur Dioxide, volume percent 0.0104 percent volume5.4.7.3 a Oxygen from air, volume percent 3.6000 percent volume5.4.7.4 a Nitrogen from air, volume percent 72.9690 percent volume5.4.7.5 a Nitrogen from fuel, volume percent 0.1115 percent volume5.4.7.6 a Moisture in flue gas, volume percent 9.5070 percent volume
100.0000 percent volume
6 of 10
Jacksonville Electric Authority Unit Tested: Northside Unit 2 (100% Load) Boiler Efficiency: 88.29 Test Date: June 8, 2004 Test Start Time: 9:00 AM Test End Time: 4:00 PM (BREAK IN TEST FROM 11 AM TO 2 PM) Test Duration, hours: 4 Enter all data required in Section 1 - Note: Some cells are identified as calculated values - DO NOT enter values in these cells, imbedded formulas calculate values.
Volume Basis% Dry Flue Gas
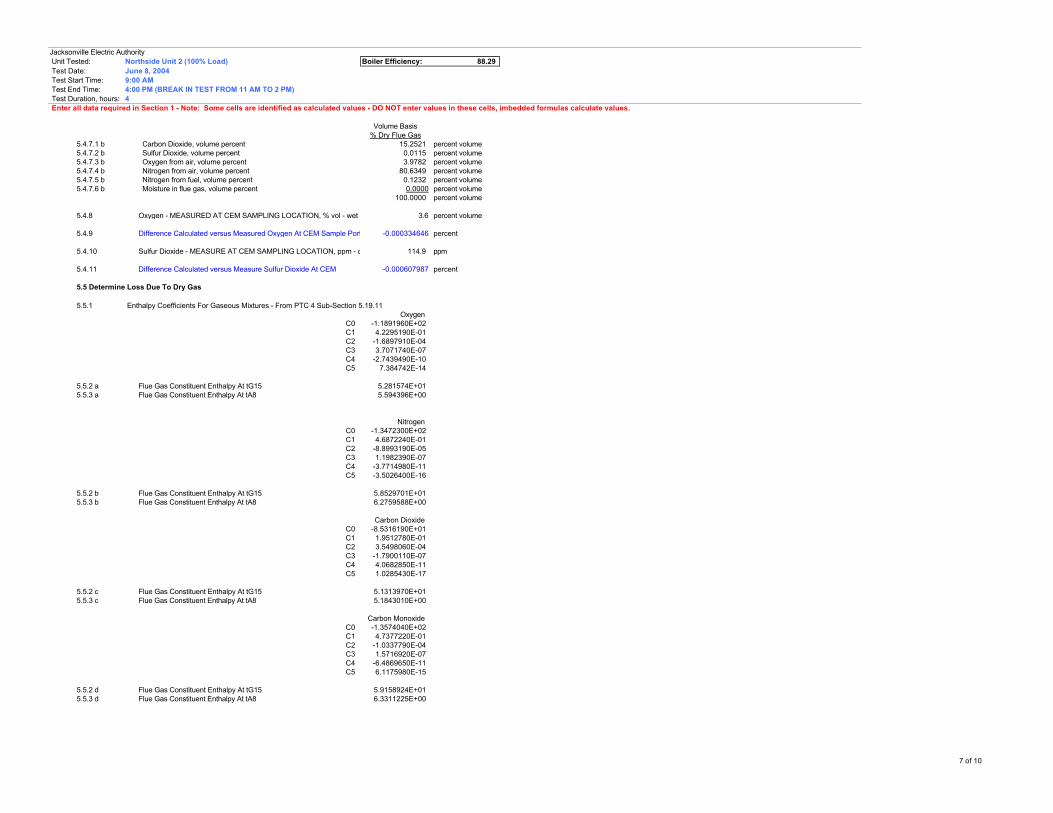
5.4.7.1 b Carbon Dioxide, volume percent 15.2521 percent volume5.4.7.2 b Sulfur Dioxide, volume percent 0.0115 percent volume5.4.7.3 b Oxygen from air, volume percent 3.9782 percent volume5.4.7.4 b Nitrogen from air, volume percent 80.6349 percent volume5.4.7.5 b Nitrogen from fuel, volume percent 0.1232 percent volume5.4.7.6 b Moisture in flue gas, volume percent 0.0000 percent volume
100.0000 percent volume
5.4.8 Oxygen - MEASURED AT CEM SAMPLING LOCATION, % vol - wet FG 3.6 percent volume
5.4.9 Difference Calculated versus Measured Oxygen At CEM Sample Port In Stack-0.000334646 percent
5.4.10 Sulfur Dioxide - MEASURE AT CEM SAMPLING LOCATION, ppm - dry FG 114.9 ppm
5.4.11 Difference Calculated versus Measure Sulfur Dioxide At CEM -0.000607987 percent
5.5 Determine Loss Due To Dry Gas
5.5.1 Enthalpy Coefficients For Gaseous Mixtures - From PTC 4 Sub-Section 5.19.11Oxygen
C0 -1.1891960E+02C1 4.2295190E-01C2 -1.6897910E-04C3 3.7071740E-07C4 -2.7439490E-10C5 7.384742E-14
5.5.2 a Flue Gas Constituent Enthalpy At tG15 5.281574E+015.5.3 a Flue Gas Constituent Enthalpy At tA8 5.594396E+00
Nitrogen C0 -1.3472300E+02C1 4.6872240E-01C2 -8.8993190E-05C3 1.1982390E-07C4 -3.7714980E-11C5 -3.5026400E-16
5.5.2 b Flue Gas Constituent Enthalpy At tG15 5.8529701E+015.5.3 b Flue Gas Constituent Enthalpy At tA8 6.2759588E+00
Carbon Dioxide C0 -8.5316190E+01C1 1.9512780E-01C2 3.5498060E-04C3 -1.7900110E-07C4 4.0682850E-11C5 1.0285430E-17
5.5.2 c Flue Gas Constituent Enthalpy At tG15 5.1313970E+015.5.3 c Flue Gas Constituent Enthalpy At tA8 5.1843010E+00
Carbon Monoxide C0 -1.3574040E+02C1 4.7377220E-01C2 -1.0337790E-04C3 1.5716920E-07C4 -6.4869650E-11C5 6.1175980E-15
5.5.2 d Flue Gas Constituent Enthalpy At tG15 5.9158924E+015.5.3 d Flue Gas Constituent Enthalpy At tA8 6.3311225E+00
7 of 10
Jacksonville Electric Authority Unit Tested: Northside Unit 2 (100% Load) Boiler Efficiency: 88.29 Test Date: June 8, 2004 Test Start Time: 9:00 AM Test End Time: 4:00 PM (BREAK IN TEST FROM 11 AM TO 2 PM) Test Duration, hours: 4 Enter all data required in Section 1 - Note: Some cells are identified as calculated values - DO NOT enter values in these cells, imbedded formulas calculate values.
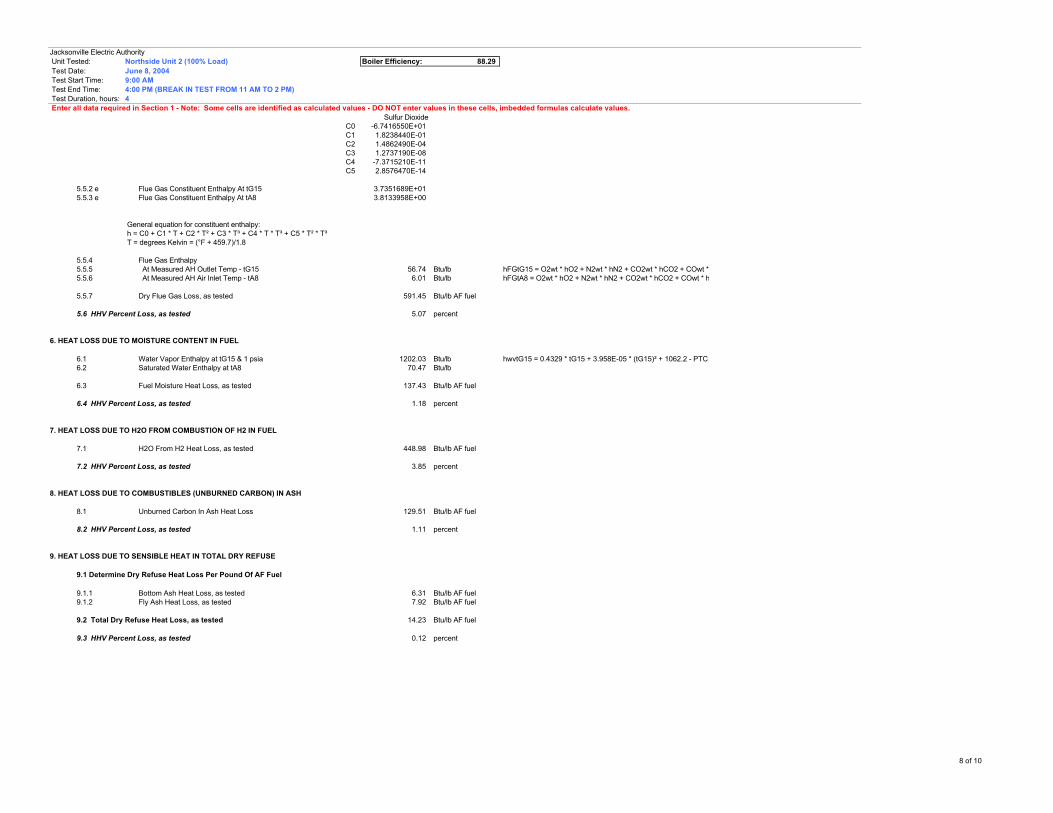
Sulfur DioxideC0 -6.7416550E+01C1 1.8238440E-01C2 1.4862490E-04C3 1.2737190E-08C4 -7.3715210E-11C5 2.8576470E-14
5.5.2 e Flue Gas Constituent Enthalpy At tG15 3.7351689E+015.5.3 e Flue Gas Constituent Enthalpy At tA8 3.8133958E+00
General equation for constituent enthalpy: h = C0 + C1 * T + C2 * T² + C3 * T³ + C4 * T * T³ + C5 * T² * T³ T = degrees Kelvin = (°F + 459.7)/1.8
5.5.4 Flue Gas Enthalpy5.5.5 At Measured AH Outlet Temp - tG15 56.74 Btu/lb5.5.6 At Measured AH Air Inlet Temp - tA8 6.01 Btu/lb
5.5.7 Dry Flue Gas Loss, as tested 591.45 Btu/lb AF fuel
5.6 HHV Percent Loss, as tested 5.07 percent
6. HEAT LOSS DUE TO MOISTURE CONTENT IN FUEL
6.1 Water Vapor Enthalpy at tG15 & 1 psia 1202.03 Btu/lb6.2 Saturated Water Enthalpy at tA8 70.47 Btu/lb
6.3 Fuel Moisture Heat Loss, as tested 137.43 Btu/lb AF fuel
6.4 HHV Percent Loss, as tested 1.18 percent
7. HEAT LOSS DUE TO H2O FROM COMBUSTION OF H2 IN FUEL
7.1 H2O From H2 Heat Loss, as tested 448.98 Btu/lb AF fuel
7.2 HHV Percent Loss, as tested 3.85 percent
8. HEAT LOSS DUE TO COMBUSTIBLES (UNBURNED CARBON) IN ASH
8.1 Unburned Carbon In Ash Heat Loss 129.51 Btu/lb AF fuel
8.2 HHV Percent Loss, as tested 1.11 percent
9. HEAT LOSS DUE TO SENSIBLE HEAT IN TOTAL DRY REFUSE
9.1 Determine Dry Refuse Heat Loss Per Pound Of AF Fuel
9.1.1 Bottom Ash Heat Loss, as tested 6.31 Btu/lb AF fuel9.1.2 Fly Ash Heat Loss, as tested 7.92 Btu/lb AF fuel
9.2 Total Dry Refuse Heat Loss, as tested 14.23 Btu/lb AF fuel
9.3 HHV Percent Loss, as tested 0.12 percent
hwvtG15 = 0.4329 * tG15 + 3.958E-05 * (tG15)² + 1062.2 - PTC 4 Sub-Section 5.19.5
hFGtG15 = O2wt * hO2 + N2wt * hN2 + CO2wt * hCO2 + COwt * hCO + SO2wt * hSO2 hFGtA8 = O2wt * hO2 + N2wt * hN2 + CO2wt * hCO2 + COwt * hCO + SO2wt * hSO2
8 of 10
Jacksonville Electric Authority Unit Tested: Northside Unit 2 (100% Load) Boiler Efficiency: 88.29 Test Date: June 8, 2004 Test Start Time: 9:00 AM Test End Time: 4:00 PM (BREAK IN TEST FROM 11 AM TO 2 PM) Test Duration, hours: 4 Enter all data required in Section 1 - Note: Some cells are identified as calculated values - DO NOT enter values in these cells, imbedded formulas calculate values.
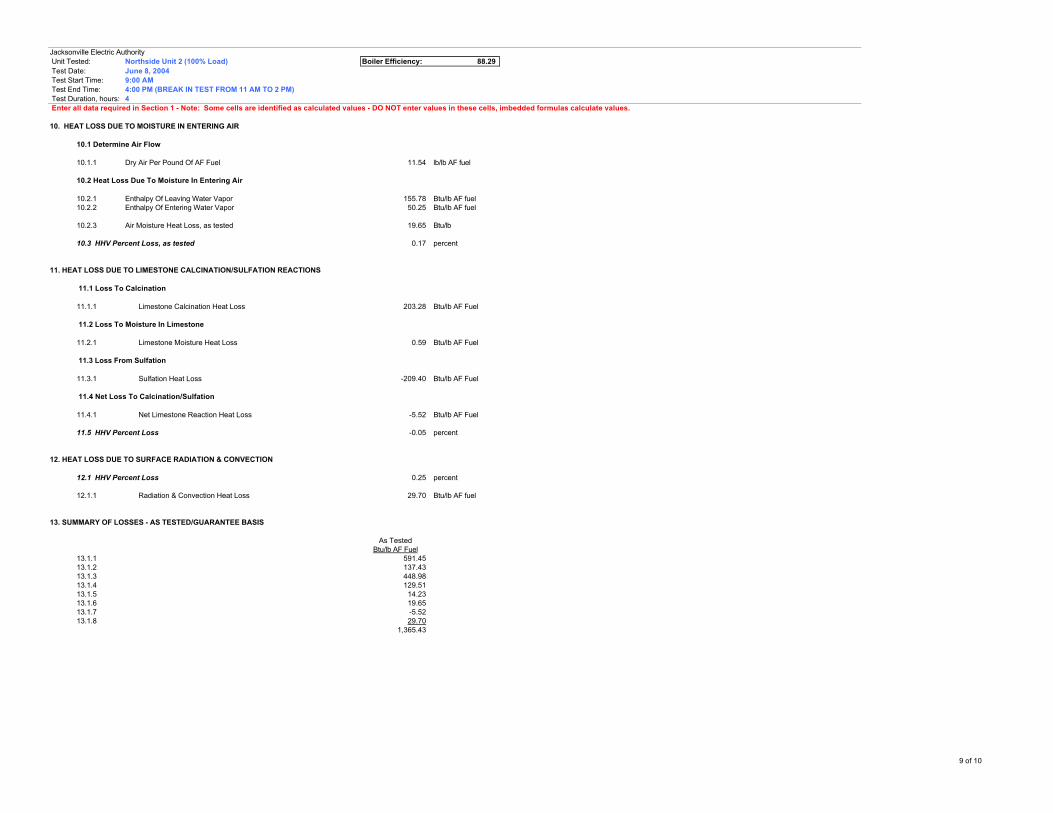
10. HEAT LOSS DUE TO MOISTURE IN ENTERING AIR
10.1 Determine Air Flow
10.1.1 Dry Air Per Pound Of AF Fuel 11.54 lb/lb AF fuel
10.2 Heat Loss Due To Moisture In Entering Air
10.2.1 Enthalpy Of Leaving Water Vapor 155.78 Btu/lb AF fuel10.2.2 Enthalpy Of Entering Water Vapor 50.25 Btu/lb AF fuel
10.2.3 Air Moisture Heat Loss, as tested 19.65 Btu/lb
10.3 HHV Percent Loss, as tested 0.17 percent
11. HEAT LOSS DUE TO LIMESTONE CALCINATION/SULFATION REACTIONS
11.1 Loss To Calcination
11.1.1 Limestone Calcination Heat Loss 203.28 Btu/lb AF Fuel
11.2 Loss To Moisture In Limestone
11.2.1 Limestone Moisture Heat Loss 0.59 Btu/lb AF Fuel
11.3 Loss From Sulfation
11.3.1 Sulfation Heat Loss -209.40 Btu/lb AF Fuel
11.4 Net Loss To Calcination/Sulfation
11.4.1 Net Limestone Reaction Heat Loss -5.52 Btu/lb AF Fuel
11.5 HHV Percent Loss -0.05 percent
12. HEAT LOSS DUE TO SURFACE RADIATION & CONVECTION
12.1 HHV Percent Loss 0.25 percent
12.1.1 Radiation & Convection Heat Loss 29.70 Btu/lb AF fuel
13. SUMMARY OF LOSSES - AS TESTED/GUARANTEE BASIS
As TestedBtu/lb AF Fuel
13.1.1 591.4513.1.2 137.4313.1.3 448.9813.1.4 129.5113.1.5 14.2313.1.6 19.6513.1.7 -5.5213.1.8 29.70
1,365.43
9 of 10

Jacksonville Electric Authority Unit Tested: Northside Unit 2 (100% Load) Boiler Efficiency: 88.29 Test Date: June 8, 2004 Test Start Time: 9:00 AM Test End Time: 4:00 PM (BREAK IN TEST FROM 11 AM TO 2 PM) Test Duration, hours: 4 Enter all data required in Section 1 - Note: Some cells are identified as calculated values - DO NOT enter values in these cells, imbedded formulas calculate values.
As TestedPercent Loss
13.1.9 Dry Flue Gas 5.0713.1.10 Moisture In Fuel 1.1813.1.11 H2O From H2 In Fuel 3.8513.1.12 Unburned Combustibles In Refuse 1.1113.1.13 Dry Refuse 0.1213.1.14 Moisture In Combustion Air 0.1713.1.15 Calcination/Sulfation -0.0513.1.16 Radiation & Convection 0.25
11.71
13.2 Boiler Efficiency (100 - Total Losses), percent 88.29
14. HEAT INPUT TO WATER & STEAM
14.1 Enthalpies14.1.1 Feedwater, Btu/lb 469.28 Btu/lb14.1.2 Blow Down, Btu/lb 741.43 Btu/lb14.1.3 Sootblowing, Btu/lb 0.00 Btu/lb14.1.4 Desuperheating Spray Water - Main Steam, Btu/lb 288.63 Btu/lb14.1.5 Main Steam, Btu/lb 1459.85 Btu/lb14.1.6 Desuperheating Spray Water - Reheat Steam, Btu/lb 283.83 Btu/lb14.1.7 Reheat Steam - Reheater Inlet, Btu/lb 1292.26 Btu/lb14.1.8 Reheat Steam - Reheater Outlet, Btu/lb 1519.65 Btu/lb
14.2 Heat Output 2,387,171,472 Btu/h2,388,856,787
15. HIGHER HEATING VALUE FUEL HEAT INPUT
15.1 Determine Fuel Heat Input Based on Calculated Efficiency
15.1.1 Fuel Heat Input 2,703,905,132 Btu/h
15.1.2 Fuel Burned - CALCULATED 231,965 lb/h
15.1.3 Difference Assumed versus Calculated Fuel Burned -0.000611546 percent
10 of 10
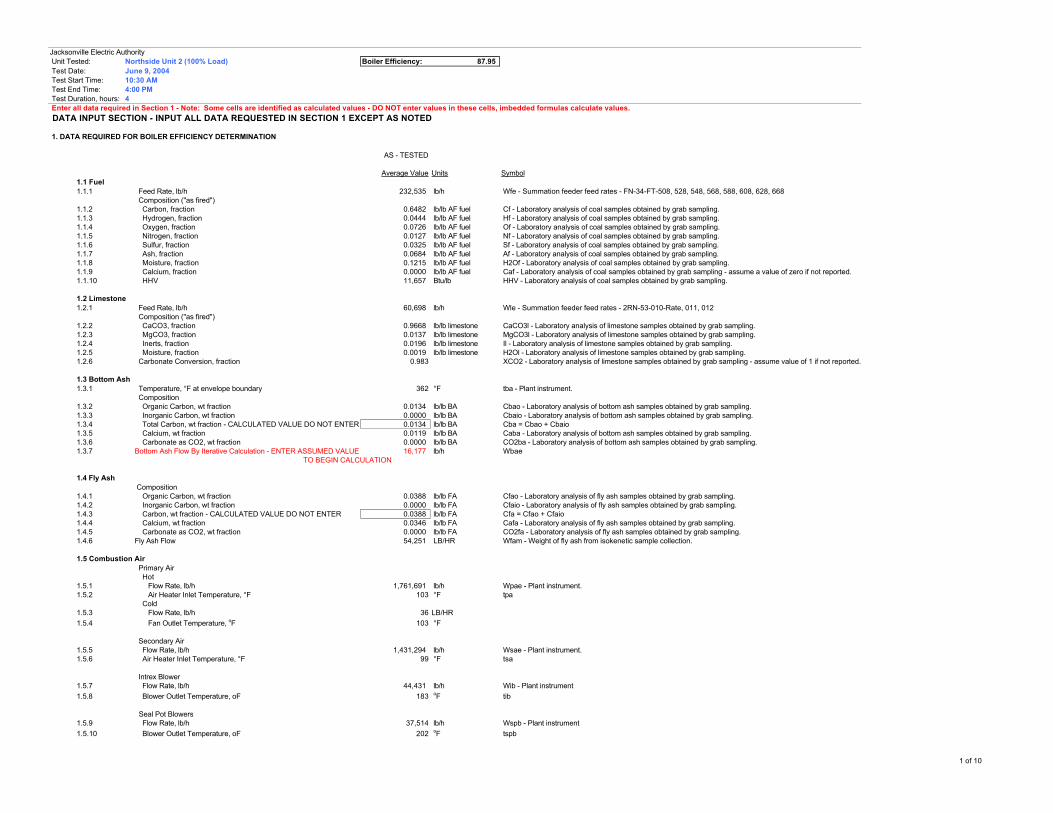
Jacksonville Electric Authority Unit Tested: Northside Unit 2 (100% Load) Boiler Efficiency: 87.95 Test Date: June 9, 2004 Test Start Time: 10:30 AM Test End Time: 4:00 PM Test Duration, hours: 4 Enter all data required in Section 1 - Note: Some cells are identified as calculated values - DO NOT enter values in these cells, imbedded formulas calculate values. DATA INPUT SECTION - INPUT ALL DATA REQUESTED IN SECTION 1 EXCEPT AS NOTED
1. DATA REQUIRED FOR BOILER EFFICIENCY DETERMINATION
AS - TESTED
Average Value Units Symbol1.1 Fuel1.1.1 Feed Rate, lb/h 232,535 lb/h Wfe - Summation feeder feed rates - FN-34-FT-508, 528, 548, 568, 588, 608, 628, 668
Composition ("as fired")1.1.2 Carbon, fraction 0.6482 lb/lb AF fuel Cf - Laboratory analysis of coal samples obtained by grab sampling.1.1.3 Hydrogen, fraction 0.0444 lb/lb AF fuel Hf - Laboratory analysis of coal samples obtained by grab sampling.1.1.4 Oxygen, fraction 0.0726 lb/lb AF fuel Of - Laboratory analysis of coal samples obtained by grab sampling.1.1.5 Nitrogen, fraction 0.0127 lb/lb AF fuel Nf - Laboratory analysis of coal samples obtained by grab sampling.1.1.6 Sulfur, fraction 0.0325 lb/lb AF fuel Sf - Laboratory analysis of coal samples obtained by grab sampling.1.1.7 Ash, fraction 0.0684 lb/lb AF fuel Af - Laboratory analysis of coal samples obtained by grab sampling.1.1.8 Moisture, fraction 0.1215 lb/lb AF fuel H2Of - Laboratory analysis of coal samples obtained by grab sampling.1.1.9 Calcium, fraction 0.0000 lb/lb AF fuel Caf - Laboratory analysis of coal samples obtained by grab sampling - assume a value of zero if not reported.1.1.10 HHV 11,657 Btu/lb HHV - Laboratory analysis of coal samples obtained by grab sampling.
1.2 Limestone1.2.1 Feed Rate, lb/h 60,698 lb/h Wle - Summation feeder feed rates - 2RN-53-010-Rate, 011, 012
Composition ("as fired")1.2.2 CaCO3, fraction 0.9668 lb/lb limestone CaCO3l - Laboratory analysis of limestone samples obtained by grab sampling.1.2.3 MgCO3, fraction 0.0137 lb/lb limestone MgCO3l - Laboratory analysis of limestone samples obtained by grab sampling.1.2.4 Inerts, fraction 0.0196 lb/lb limestone Il - Laboratory analysis of limestone samples obtained by grab sampling.1.2.5 Moisture, fraction 0.0019 lb/lb limestone H2Ol - Laboratory analysis of limestone samples obtained by grab sampling.1.2.6 Carbonate Conversion, fraction 0.983 XCO2 - Laboratory analysis of limestone samples obtained by grab sampling - assume value of 1 if not reported.
1.3 Bottom Ash1.3.1 Temperature, °F at envelope boundary 362 °F tba - Plant instrument.
Composition1.3.2 Organic Carbon, wt fraction 0.0134 lb/lb BA Cbao - Laboratory analysis of bottom ash samples obtained by grab sampling.1.3.3 Inorganic Carbon, wt fraction 0.0000 lb/lb BA Cbaio - Laboratory analysis of bottom ash samples obtained by grab sampling.1.3.4 Total Carbon, wt fraction - CALCULATED VALUE DO NOT ENTER 0.0134 lb/lb BA Cba = Cbao + Cbaio1.3.5 Calcium, wt fraction 0.0119 lb/lb BA Caba - Laboratory analysis of bottom ash samples obtained by grab sampling.1.3.6 Carbonate as CO2, wt fraction 0.0000 lb/lb BA CO2ba - Laboratory analysis of bottom ash samples obtained by grab sampling.1.3.7 Bottom Ash Flow By Iterative Calculation - ENTER ASSUMED VALUE 16,177 lb/h Wbae
TO BEGIN CALCULATION
1.4 Fly Ash Composition
1.4.1 Organic Carbon, wt fraction 0.0388 lb/lb FA Cfao - Laboratory analysis of fly ash samples obtained by grab sampling.1.4.2 Inorganic Carbon, wt fraction 0.0000 lb/lb FA Cfaio - Laboratory analysis of fly ash samples obtained by grab sampling.1.4.3 Carbon, wt fraction - CALCULATED VALUE DO NOT ENTER 0.0388 lb/lb FA Cfa = Cfao + Cfaio1.4.4 Calcium, wt fraction 0.0346 lb/lb FA Cafa - Laboratory analysis of fly ash samples obtained by grab sampling.1.4.5 Carbonate as CO2, wt fraction 0.0000 lb/lb FA CO2fa - Laboratory analysis of fly ash samples obtained by grab sampling.1.4.6 Fly Ash Flow 54,251 LB/HR Wfam - Weight of fly ash from isokenetic sample collection.
1.5 Combustion Air Primary Air
Hot1.5.1 Flow Rate, lb/h 1,761,691 lb/h Wpae - Plant instrument.1.5.2 Air Heater Inlet Temperature, °F 103 °F tpa
Cold1.5.3 Flow Rate, lb/h 36 LB/HR1.5.4 Fan Outlet Temperature, oF 103 °F
Secondary Air1.5.5 Flow Rate, lb/h 1,431,294 lb/h Wsae - Plant instrument.1.5.6 Air Heater Inlet Temperature, °F 99 °F tsa
Intrex Blower1.5.7 Flow Rate, lb/h 44,431 lb/h Wib - Plant instrument1.5.8 Blower Outlet Temperature, oF 183 oF tib
Seal Pot Blowers 1.5.9 Flow Rate, lb/h 37,514 lb/h Wspb - Plant instrument1.5.10 Blower Outlet Temperature, oF 202 oF tspb
1 of 10

Jacksonville Electric Authority Unit Tested: Northside Unit 2 (100% Load) Boiler Efficiency: 87.95 Test Date: June 9, 2004 Test Start Time: 10:30 AM Test End Time: 4:00 PM Test Duration, hours: 4 Enter all data required in Section 1 - Note: Some cells are identified as calculated values - DO NOT enter values in these cells, imbedded formulas calculate values.
1.6 Ambient Conditions1.6.1 Ambient dry bulb temperature, °F 83.60 °F ta1.6.2 Ambient wet bulb temperature, °F 74.52 °F tawb1.6.3 Barometric pressure, inches Hg 30.14 inches Hg Patm1.6.4 Moisture in air, lbH2O/lb dry air 0.0163 lbH2O/lb dry air Calculated: H2OA - From psychometric chart at temperatures ta and tawb adjusted to test Patm.
1.7 Flue GasAt Air Heater Outlet
1.7.1 Temperature (measured), °F 324.11 °F Tg15 - Weighted average from AH outlet plant instruments (based on PA and SA flow rates)1.7.2 Temperature (unmeasured), °F Calculated
Composition (wet)1.7.3 O2 0.0466 percent volume O2 - Weighted average from test instrument1.7.4 CO2 Not Measured percent volume CO21.7.5 CO Not Measured percent volume CO1.7.6 SO2 Not Measured percent volume SO2
At Air Heater Inlet1.7.7 Temperature, °F 581.46 °F tG14 - Plant Instrument
Composition (wet)1.7.8 O2 0.0360 percent volume1.7.9 CO2 Not Measured percent volume1.7.10 CO Not Measured percent volume1.7.11 SO2 0.0030 percent volume measurement is in ppm
CEM Sample Extraction At Outlet Of Economizer Composition
1.7.12 O2, percent - WET basis 3.600 percent volume O2stk1.7.13 SO2, ppm - dry basis 114.9 ppm SO2stk1.7.14 NOx, ppm - dry basis Not Measured ppm Noxstk1.7.15 CO, ppm - dry basis Not Measured ppm Costk1.7.16 Particulate, mg/Nm³ Not Measured mg/Nm³ - 25° C PARTstk
1.8 Feedwater1.8.1 Pressure, PSIG 1948.9 PSIG pfw - Plant instrument.1.8.2 Temperature, °F 484.6 °F tfw - Plant instrument.1.8.3 Flow Rate, lb/h 1,924,448 lb/h FW - Plant instrument.
1.9 Continuous Blow Down1.9.1 Pressure, PSIG (drum pressure) 2,580.5 PSIG pbd - Plant instrument1.9.2 Temperature, °F (sat. temp. @ drum pressure) 674.8 °F tba - Saturated water temperature from steam table at drum pressure.1.9.3 Flow Rate, lb/h 0.00 lb/h BD - Estimated using flow characteristic of valve and number of turns open.
1.10 Sootblowing1.10.1 Flow Rate, LB/HR 0.00 LB/HR SB - Plant instrument1.10.2 Pressure, PSIG 0.00 PSIG psb - Plant instrument1.10.3 Temperature, F 0.00 F tsb - plant instrument
1.11 Main Steam Desuperheating Water1.11.1 Pressure, PSIG 2,719.2 PSIG pdsw - Plant instrument.1.11.2 Temperature, °F 317.1 °F tdsw - Plant instrument.1.11.3 Flow Rate, lb/h 2,230 lb/h DSW - Plant instrument.
1.12 Main Steam1.12.1 Pressure, PSIG (superheater outlet) 2,400.4 PSIG pms - Plant instrument.1.12.2 Temperature, °F 999.5 °F tms - Plant instrument.1.12.3 Flow Rate, lb/h 1,926,677 lb/h MS - Plant instrument - Not required to determine boiler efficiency - For information only.
1.13 Reheat Steam Desuperheating Water1.13.1 Pressure, PSIG 863.00 PSIG pdswrh - Plant instrument.1.13.2 Temperature, °F 330.88 °F tdswrh - Plant instrument.1.13.3 Flow Rate, lb/h 8,221 lb/h DSWrh - Plant instrument.
1.14 Reheat Steam1.14.1 Inlet Pressure, PSIG 572.29 PSIG prhin - Plant instrument.1.14.2 Inlet Temperature, °F 589.56 °F trhin - Plant instrument.1.14.3 Outlet Pressure, PSIG 573.00 PSIG prhout - Plant instrument.1.14.4 Outlet Temperature, °F 1,011.23 °F trhout - Plant instrument.1.14.5 Inlet Flow, LB/HR 1,851,738 LB/HR RHin - From turbine heat.
2 of 10
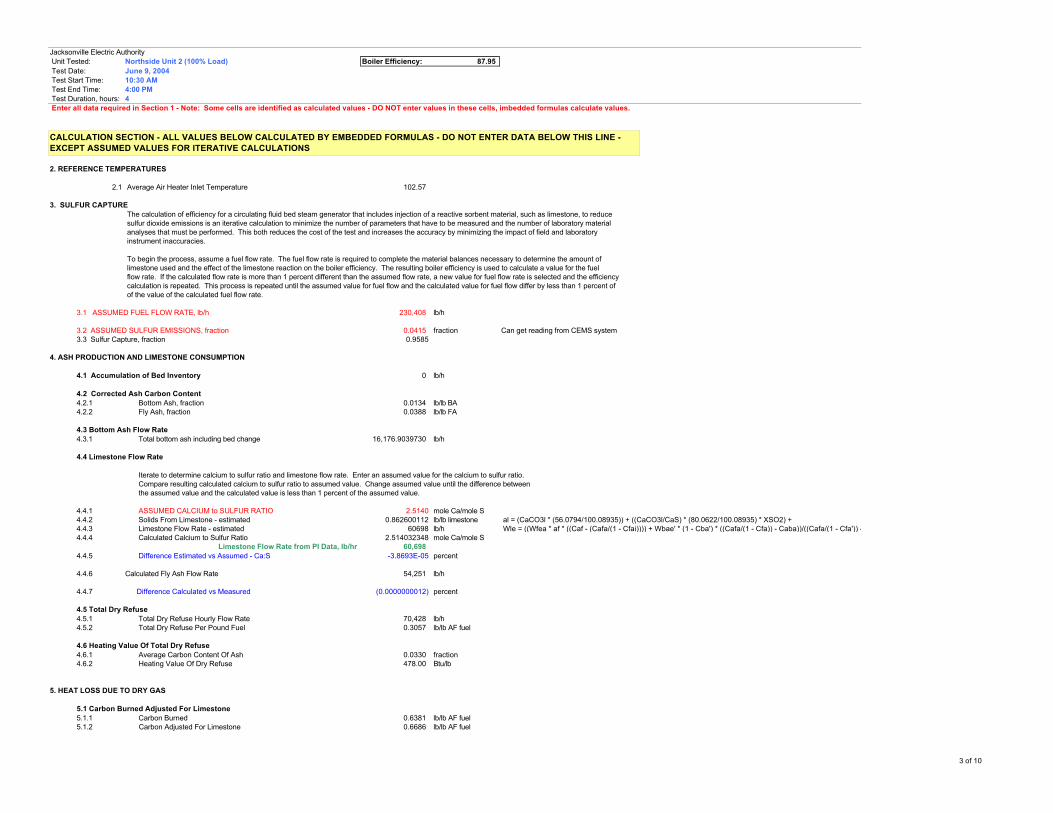
Jacksonville Electric Authority Unit Tested: Northside Unit 2 (100% Load) Boiler Efficiency: 87.95 Test Date: June 9, 2004 Test Start Time: 10:30 AM Test End Time: 4:00 PM Test Duration, hours: 4 Enter all data required in Section 1 - Note: Some cells are identified as calculated values - DO NOT enter values in these cells, imbedded formulas calculate values.
2. REFERENCE TEMPERATURES
2.1 Average Air Heater Inlet Temperature 102.57
3. SULFUR CAPTURE The calculation of efficiency for a circulating fluid bed steam generator that includes injection of a reactive sorbent material, such as limestone, to reduce sulfur dioxide emissions is an iterative calculation to minimize the number of parameters that have to be measured and the number of laboratory material analyses that must be performed. This both reduces the cost of the test and increases the accuracy by minimizing the impact of field and laboratory instrument inaccuracies.
To begin the process, assume a fuel flow rate. The fuel flow rate is required to complete the material balances necessary to determine the amount of limestone used and the effect of the limestone reaction on the boiler efficiency. The resulting boiler efficiency is used to calculate a value for the fuel flow rate. If the calculated flow rate is more than 1 percent different than the assumed flow rate, a new value for fuel flow rate is selected and the efficiency calculation is repeated. This process is repeated until the assumed value for fuel flow and the calculated value for fuel flow differ by less than 1 percent of of the value of the calculated fuel flow rate.
3.1 ASSUMED FUEL FLOW RATE, lb/h 230,408 lb/h
3.2 ASSUMED SULFUR EMISSIONS, fraction 0.0415 fraction Can get reading from CEMS system3.3 Sulfur Capture, fraction 0.9585
4. ASH PRODUCTION AND LIMESTONE CONSUMPTION
4.1 Accumulation of Bed Inventory 0 lb/h
4.2 Corrected Ash Carbon Content4.2.1 Bottom Ash, fraction 0.0134 lb/lb BA4.2.2 Fly Ash, fraction 0.0388 lb/lb FA
4.3 Bottom Ash Flow Rate4.3.1 Total bottom ash including bed change 16,176.9039730 lb/h
4.4 Limestone Flow Rate
Iterate to determine calcium to sulfur ratio and limestone flow rate. Enter an assumed value for the calcium to sulfur ratio. Compare resulting calculated calcium to sulfur ratio to assumed value. Change assumed value until the difference between the assumed value and the calculated value is less than 1 percent of the assumed value.
4.4.1 ASSUMED CALCIUM to SULFUR RATIO 2.5140 mole Ca/mole S4.4.2 Solids From Limestone - estimated 0.862600112 lb/lb limestone4.4.3 Limestone Flow Rate - estimated 60698 lb/h4.4.4 Calculated Calcium to Sulfur Ratio 2.514032348 mole Ca/mole S
Limestone Flow Rate from PI Data, lb/hr 60,6984.4.5 Difference Estimated vs Assumed - Ca:S -3.8693E-05 percent
4.4.6 Calculated Fly Ash Flow Rate 54,251 lb/h
4.4.7 Difference Calculated vs Measured (0.0000000012) percent
4.5 Total Dry Refuse4.5.1 Total Dry Refuse Hourly Flow Rate 70,428 lb/h4.5.2 Total Dry Refuse Per Pound Fuel 0.3057 lb/lb AF fuel
4.6 Heating Value Of Total Dry Refuse4.6.1 Average Carbon Content Of Ash 0.0330 fraction4.6.2 Heating Value Of Dry Refuse 478.00 Btu/lb
5. HEAT LOSS DUE TO DRY GAS
5.1 Carbon Burned Adjusted For Limestone5.1.1 Carbon Burned 0.6381 lb/lb AF fuel5.1.2 Carbon Adjusted For Limestone 0.6686 lb/lb AF fuel
al = (CaCO3l * (56.0794/100.08935)) + ((CaCO3l/CaS) * (80.0622/100.08935) * XSO2) + Wle = ((Wfea * af * ((Caf - (Cafa/(1 - Cfai)))) + Wbae' * (1 - Cba') * ((Cafa/(1 - Cfa)) - Caba))/((Cafa/(1 - Cfa')) -
CALCULATION SECTION - ALL VALUES BELOW CALCULATED BY EMBEDDED FORMULAS - DO NOT ENTER DATA BELOW THIS LINE - EXCEPT ASSUMED VALUES FOR ITERATIVE CALCULATIONS
3 of 10
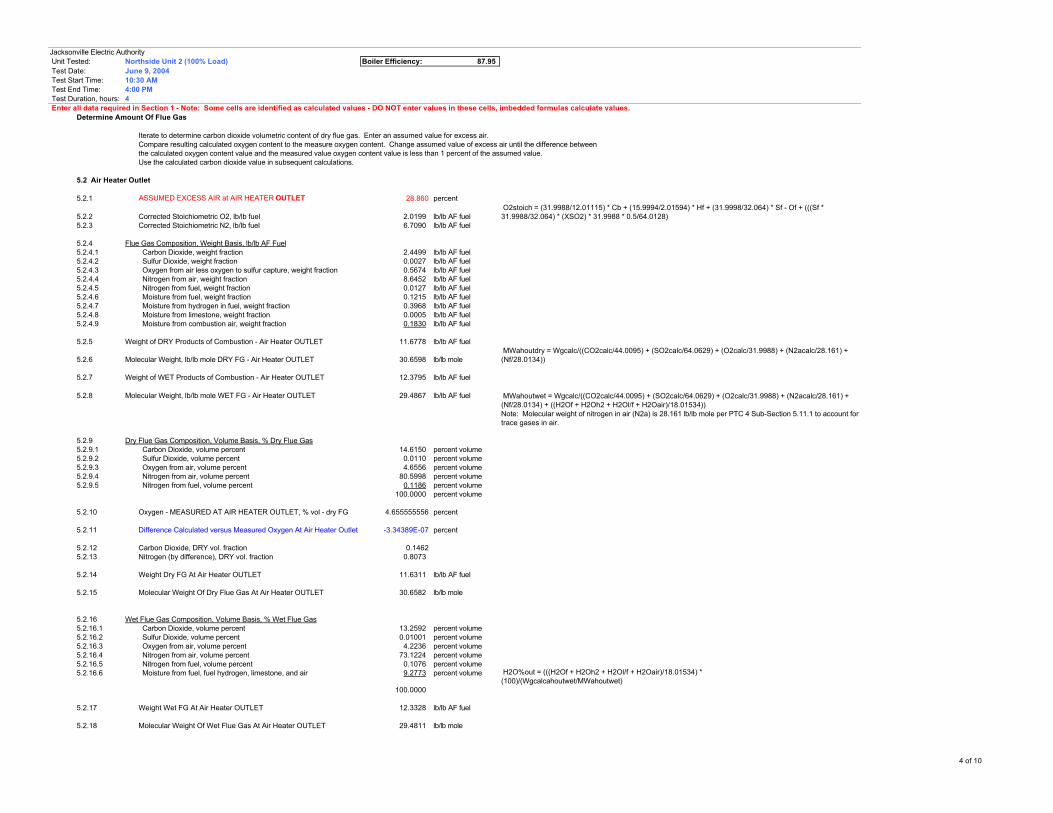
Jacksonville Electric Authority Unit Tested: Northside Unit 2 (100% Load) Boiler Efficiency: 87.95 Test Date: June 9, 2004 Test Start Time: 10:30 AM Test End Time: 4:00 PM Test Duration, hours: 4 Enter all data required in Section 1 - Note: Some cells are identified as calculated values - DO NOT enter values in these cells, imbedded formulas calculate values.
Determine Amount Of Flue Gas
Iterate to determine carbon dioxide volumetric content of dry flue gas. Enter an assumed value for excess air. Compare resulting calculated oxygen content to the measure oxygen content. Change assumed value of excess air until the difference between the calculated oxygen content value and the measured value oxygen content value is less than 1 percent of the assumed value. Use the calculated carbon dioxide value in subsequent calculations.
5.2 Air Heater Outlet
5.2.1 ASSUMED EXCESS AIR at AIR HEATER OUTLET 28.860 percent
5.2.2 Corrected Stoichiometric O2, lb/lb fuel 2.0199 lb/lb AF fuel5.2.3 Corrected Stoichiometric N2, lb/lb fuel 6.7090 lb/lb AF fuel
5.2.4 Flue Gas Composition, Weight Basis, lb/lb AF Fuel5.2.4.1 Carbon Dioxide, weight fraction 2.4499 lb/lb AF fuel5.2.4.2 Sulfur Dioxide, weight fraction 0.0027 lb/lb AF fuel5.2.4.3 Oxygen from air less oxygen to sulfur capture, weight fraction 0.5674 lb/lb AF fuel5.2.4.4 Nitrogen from air, weight fraction 8.6452 lb/lb AF fuel5.2.4.5 Nitrogen from fuel, weight fraction 0.0127 lb/lb AF fuel5.2.4.6 Moisture from fuel, weight fraction 0.1215 lb/lb AF fuel5.2.4.7 Moisture from hydrogen in fuel, weight fraction 0.3968 lb/lb AF fuel5.2.4.8 Moisture from limestone, weight fraction 0.0005 lb/lb AF fuel5.2.4.9 Moisture from combustion air, weight fraction 0.1830 lb/lb AF fuel
5.2.5 Weight of DRY Products of Combustion - Air Heater OUTLET 11.6778 lb/lb AF fuel
5.2.6 Molecular Weight, lb/lb mole DRY FG - Air Heater OUTLET 30.6598 lb/lb mole
5.2.7 Weight of WET Products of Combustion - Air Heater OUTLET 12.3795 lb/lb AF fuel
5.2.8 Molecular Weight, lb/lb mole WET FG - Air Heater OUTLET 29.4867 lb/lb AF fuel
5.2.9 Dry Flue Gas Composition, Volume Basis, % Dry Flue Gas5.2.9.1 Carbon Dioxide, volume percent 14.6150 percent volume5.2.9.2 Sulfur Dioxide, volume percent 0.0110 percent volume5.2.9.3 Oxygen from air, volume percent 4.6556 percent volume5.2.9.4 Nitrogen from air, volume percent 80.5998 percent volume5.2.9.5 Nitrogen from fuel, volume percent 0.1186 percent volume
100.0000 percent volume
5.2.10 Oxygen - MEASURED AT AIR HEATER OUTLET, % vol - dry FG 4.655555556 percent
5.2.11 Difference Calculated versus Measured Oxygen At Air Heater Outlet -3.34389E-07 percent
5.2.12 Carbon Dioxide, DRY vol. fraction 0.14625.2.13 Nitrogen (by difference), DRY vol. fraction 0.8073
5.2.14 Weight Dry FG At Air Heater OUTLET 11.6311 lb/lb AF fuel
5.2.15 Molecular Weight Of Dry Flue Gas At Air Heater OUTLET 30.6582 lb/lb mole
5.2.16 Wet Flue Gas Composition, Volume Basis, % Wet Flue Gas5.2.16.1 Carbon Dioxide, volume percent 13.2592 percent volume5.2.16.2 Sulfur Dioxide, volume percent 0.01001 percent volume5.2.16.3 Oxygen from air, volume percent 4.2236 percent volume5.2.16.4 Nitrogen from air, volume percent 73.1224 percent volume5.2.16.5 Nitrogen from fuel, volume percent 0.1076 percent volume5.2.16.6 Moisture from fuel, fuel hydrogen, limestone, and air 9.2773 percent volume
100.0000
5.2.17 Weight Wet FG At Air Heater OUTLET 12.3328 lb/lb AF fuel
5.2.18 Molecular Weight Of Wet Flue Gas At Air Heater OUTLET 29.4811 lb/lb mole
H2O%out = (((H2Of + H2Oh2 + H2Ol/f + H2Oair)/18.01534) * (100)/(Wgcalcahoutwet/MWahoutwet)
Note: Molecular weight of nitrogen in air (N2a) is 28.161 lb/lb mole per PTC 4 Sub-Section 5.11.1 to account for trace gases in air.
O2stoich = (31.9988/12.01115) * Cb + (15.9994/2.01594) * Hf + (31.9998/32.064) * Sf - Of + (((Sf * 31.9988/32.064) * (XSO2) * 31.9988 * 0.5/64.0128)
MWahoutwet = Wgcalc/((CO2calc/44.0095) + (SO2calc/64.0629) + (O2calc/31.9988) + (N2acalc/28.161) + (Nf/28.0134) + ((H2Of + H2Oh2 + H2Ol/f + H2Oair)/18.01534))
MWahoutdry = Wgcalc/((CO2calc/44.0095) + (SO2calc/64.0629) + (O2calc/31.9988) + (N2acalc/28.161) + (Nf/28.0134))
4 of 10

Jacksonville Electric Authority Unit Tested: Northside Unit 2 (100% Load) Boiler Efficiency: 87.95 Test Date: June 9, 2004 Test Start Time: 10:30 AM Test End Time: 4:00 PM Test Duration, hours: 4 Enter all data required in Section 1 - Note: Some cells are identified as calculated values - DO NOT enter values in these cells, imbedded formulas calculate values.
5.2.19 Weight Fraction of DRY Flue Gas Components5.2.19.1 Oxygen, fraction weight 0.0486 fraction5.2.19.2 Nitrogen, fraction weight 0.7415 fraction5.2.19.3 Carbon Dioxide, fraction weight 0.2099 fraction5.2.19.4 Carbon Monoxide, fraction weight 0.0000 fraction5.2.19.5 Sulfur Dioxide, fraction weight 0.0000 fraction
5.2.20 Weight Fraction of WET Flue Gas Components -NOT USED IN CALCULATION5.2.20.1 Oxygen, fraction weight fraction5.2.20.2 Nitrogen, fraction weight fraction5.2.20.3 Carbon Dioxide, fraction weight fraction5.2.20.4 Carbon Monoxide, fraction weight fraction5.2.20.5 Sulfur Dioxide, fraction weight fraction5.2.20.6 Moisture, fraction weight fraction
5.3 Air Heater Inlet
5.3.1 ASSUMED EXCESS AIR at AIR HEATER INLET 21.169 percent
5.3.2 Flue Gas Composition, Weight Basis, lb/lb AF Fuel5.3.2.1 Carbon Dioxide, weight fraction 2.4499 lb/lb AF fuel5.3.2.2 Sulfur Dioxide, weight fraction 0.0027 lb/lb AF fuel5.3.2.3 Oxygen from air less oxygen to sulfur capture, weight fraction 0.4121 lb/lb AF fuel5.3.2.4 Nitrogen from air, weight fraction 8.1292 lb/lb AF fuel5.3.2.5 Nitrogen from fuel, weight fraction 0.0127 lb/lb AF fuel5.3.2.6 Moisture from fuel, weight fraction 0.1215 lb/lb AF fuel5.3.2.7 Moisture from hydrogen in fuel, weight fraction 0.3968 lb/lb AF fuel5.3.2.8 Moisture from limestone, weight fraction 0.0005 lb/lb AF fuel5.3.2.9 Moisture from combustion air, weight fraction 0.1720 lb/lb AF fuel
5.3.3 Weight of DRY Products of Combustion - Air Heater INLET 11.0065 lb/lb AF fuel5.3.4 Molecular Weight, lb/lb mole DRY FG - Air Heater INLET 30.7696 lb/lb mole
5.3.5 Weight of WET Products of Combustion - Air Heater INLET 11.6973 lb/lb AF fuel5.3.6 Molecular Weight, lb/lb mole WET FG - Air Heater INLET 29.5348 lb/lb AF fuel
Volume Basis5.3.7 Flue Gas Composition, Volume Basis, % DRY Flue Gas % Dry Flue Gas5.3.7.1 Carbon Dioxide, volume percent 15.5620 percent volume5.3.7.2 Sulfur Dioxide, volume percent 0.0117 percent volume5.3.7.3 Oxygen from air, volume percent 3.6000 percent volume5.3.7.4 Nitrogen from air, volume percent 80.7000 percent volume5.3.7.5 Nitrogen from fuel, volume percent 0.1262 percent volume
100.0000 percent volume
5.3.8 Oxygen - MEASURED AT AIR HEATER INLET, % vol - dry FG 3.6 percent
5.3.9 Difference Calculated versus Measured Oxygen At Air Heater Inlet -5.7704E-07 percent
5.3.10 Carbon Dioxide, DRY vol. fraction 0.15565.3.11 Nitrogen (by difference), DRY vol. fraction 0.8054
5.3.12 Weight Dry FG At Air Heater INLET 11.0048 lb/lb AF fuel
5.3.13 Molecular Weight Of Dry Flue Gas At Air Heater INLET 30.8714 lb/lb mole
5 of 10

Jacksonville Electric Authority Unit Tested: Northside Unit 2 (100% Load) Boiler Efficiency: 87.95 Test Date: June 9, 2004 Test Start Time: 10:30 AM Test End Time: 4:00 PM Test Duration, hours: 4 Enter all data required in Section 1 - Note: Some cells are identified as calculated values - DO NOT enter values in these cells, imbedded formulas calculate values.
Volume Basis5.3.14 Flue Gas Composition, Volume Basis, % Wet Flue Gas % Wet Flue Gas5.3.14.1 Carbon Dioxide, volume percent 14.0554 percent volume5.3.14.2 Sulfur Dioxide, volume percent 0.01061 percent volume5.3.14.3 Oxygen from air, volume percent 3.2515 percent volume5.3.14.4 Nitrogen from air, volume percent 72.8871 percent volume5.3.14.5 Nitrogen from fuel, volume percent 0.1140 percent volume5.3.14.6 Moisture from fuel, fuel hydrogen, limestone, and air 9.6813 percent volume
100.0000
5.3.15 Weight Wet FG At Air Heater INLET 11.6956 lb/lb AF fuel
5.3.16 Molecular Weight Of Wet Flue Gas At Air Heater INLET 29.6230 lb/lb mole
5.3.17 Weight Fraction of DRY Flue Gas Components5.3.17.1 Oxygen, fraction weight 0.0373 fraction5.3.17.2 Nitrogen, fraction weight 0.7347 fraction5.3.17.3 Carbon Dioxide, fraction weight 0.2218 fraction5.3.17.4 Carbon Monoxide, fraction weight 0.0000 fraction5.3.17.5 Sulfur Dioxide, fraction weight 0.0062 fraction
5.3.18 Weight Fraction of WET Flue Gas Components5.3.18.1 Oxygen, fraction weight 0.0351 fraction5.3.18.2 Nitrogen, fraction weight 0.6913 fraction5.3.18.3 Carbon Dioxide, fraction weight 0.2088 fraction5.3.18.4 Carbon Monoxide, fraction weight 0.0000 fraction5.3.18.5 Sulfur Dioxide, fraction weight 0.0058 fraction5.3.18.6 Moisture, fraction weight 0.0589 fraction
5.4 CEM Sampling Location
5.4.1 ASSUMED EXCESS AIR at CEM SAMPLING LOCATION 23.824 percent
5.4.2 Flue Gas Composition, Weight Basis, lb/lb AF Fuel5.4.2.1 Carbon Dioxide, weight fraction 2.4499 lb/lb AF fuel5.4.2.2 Sulfur Dioxide, weight fraction 0.0027 lb/lb AF fuel5.4.2.3 Oxygen from air less oxygen to sulfur capture, weight fraction 0.4657 lb/lb AF fuel5.4.2.4 Nitrogen from air, weight fraction 8.3073 lb/lb AF fuel5.4.2.5 Nitrogen from fuel, weight fraction 0.0127 lb/lb AF fuel5.4.2.6 Moisture from fuel, weight fraction 0.1215 lb/lb AF fuel5.4.2.7 Moisture from hydrogen in fuel, weight fraction 0.3968 lb/lb AF fuel5.4.2.8 Moisture from limestone, weight fraction 0.0005 lb/lb AF fuel5.4.2.9 Moisture from combustion air, weight fraction 0.1758 lb/lb AF fuel
5.4.3 Weight of DRY Products of Combustion - CEM Sampling Location 11.2383 lb/lb AF fuel5.4.4 Molecular Weight, lb/lb mole DRY FG - CEM Sampling Location 30.7301 lb/lb mole
5.4.5 Weight of WET Products of Combustion - CEM Sampling Location 11.9328 lb/lb AF fuel5.4.6 Molecular Weight, lb/lb mole WET FG - CEM Sampling Location 29.5176 lb/lb mole
Volume Basis5.4.7 Flue Gas Composition, Volume Basis, % WET or DRY Flue Gas % Wet Flue Gas5.4.7.1 a Carbon Dioxide, volume percent 13.7700 percent volume5.4.7.2 a Sulfur Dioxide, volume percent 0.0104 percent volume5.4.7.3 a Oxygen from air, volume percent 3.6000 percent volume5.4.7.4 a Nitrogen from air, volume percent 72.9715 percent volume5.4.7.5 a Nitrogen from fuel, volume percent 0.1117 percent volume5.4.7.6 a Moisture in flue gas, volume percent 9.5365 percent volume
100.0000 percent volume
6 of 10

Jacksonville Electric Authority Unit Tested: Northside Unit 2 (100% Load) Boiler Efficiency: 87.95 Test Date: June 9, 2004 Test Start Time: 10:30 AM Test End Time: 4:00 PM Test Duration, hours: 4 Enter all data required in Section 1 - Note: Some cells are identified as calculated values - DO NOT enter values in these cells, imbedded formulas calculate values.
Volume Basis% Dry Flue Gas
5.4.7.1 b Carbon Dioxide, volume percent 15.2216 percent volume5.4.7.2 b Sulfur Dioxide, volume percent 0.0115 percent volume5.4.7.3 b Oxygen from air, volume percent 3.9795 percent volume5.4.7.4 b Nitrogen from air, volume percent 80.6640 percent volume5.4.7.5 b Nitrogen from fuel, volume percent 0.1235 percent volume5.4.7.6 b Moisture in flue gas, volume percent 0.0000 percent volume
100.0000 percent volume
5.4.8 Oxygen - MEASURED AT CEM SAMPLING LOCATION, % vol - wet FG 3.6 percent volume
5.4.9 Difference Calculated versus Measured Oxygen At CEM Sample Port In Stack4.61822E-07 percent
5.4.10 Sulfur Dioxide - MEASURE AT CEM SAMPLING LOCATION, ppm - dry FG 114.9 ppm
5.4.11 Difference Calculated versus Measure Sulfur Dioxide At CEM 1.30248E-05 percent
5.5 Determine Loss Due To Dry Gas
5.5.1 Enthalpy Coefficients For Gaseous Mixtures - From PTC 4 Sub-Section 5.19.11Oxygen
C0 -1.1891960E+02C1 4.2295190E-01C2 -1.6897910E-04C3 3.7071740E-07C4 -2.7439490E-10C5 7.384742E-14
5.5.2 a Flue Gas Constituent Enthalpy At tG15 5.511438E+015.5.3 a Flue Gas Constituent Enthalpy At tA8 5.617889E+00
Nitrogen C0 -1.3472300E+02C1 4.6872240E-01C2 -8.8993190E-05C3 1.1982390E-07C4 -3.7714980E-11C5 -3.5026400E-16
5.5.2 b Flue Gas Constituent Enthalpy At tG15 6.1040600E+015.5.3 b Flue Gas Constituent Enthalpy At tA8 6.3022782E+00
Carbon Dioxide C0 -8.5316190E+01C1 1.9512780E-01C2 3.5498060E-04C3 -1.7900110E-07C4 4.0682850E-11C5 1.0285430E-17
5.5.2 c Flue Gas Constituent Enthalpy At tG15 5.3646269E+015.5.3 c Flue Gas Constituent Enthalpy At tA8 5.2062217E+00
Carbon Monoxide C0 -1.3574040E+02C1 4.7377220E-01C2 -1.0337790E-04C3 1.5716920E-07C4 -6.4869650E-11C5 6.1175980E-15
5.5.2 d Flue Gas Constituent Enthalpy At tG15 6.1703045E+015.5.3 d Flue Gas Constituent Enthalpy At tA8 6.3576787E+00
7 of 10
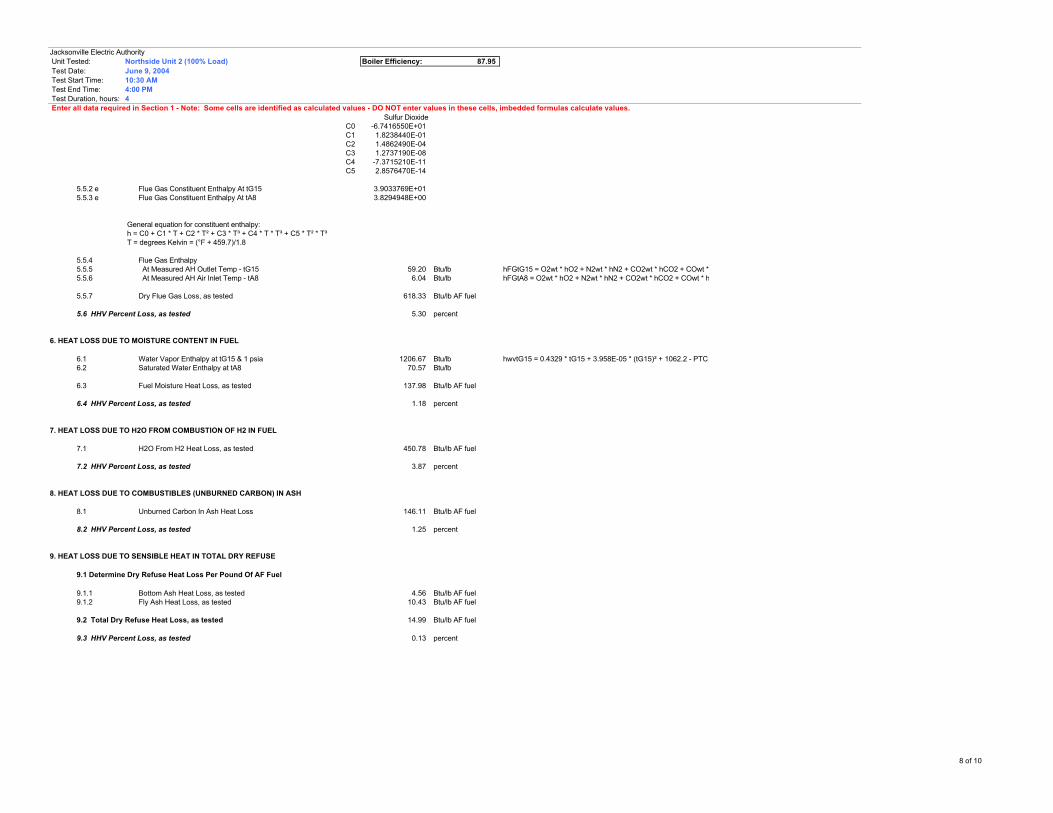
Jacksonville Electric Authority Unit Tested: Northside Unit 2 (100% Load) Boiler Efficiency: 87.95 Test Date: June 9, 2004 Test Start Time: 10:30 AM Test End Time: 4:00 PM Test Duration, hours: 4 Enter all data required in Section 1 - Note: Some cells are identified as calculated values - DO NOT enter values in these cells, imbedded formulas calculate values.
Sulfur DioxideC0 -6.7416550E+01C1 1.8238440E-01C2 1.4862490E-04C3 1.2737190E-08C4 -7.3715210E-11C5 2.8576470E-14
5.5.2 e Flue Gas Constituent Enthalpy At tG15 3.9033769E+015.5.3 e Flue Gas Constituent Enthalpy At tA8 3.8294948E+00
General equation for constituent enthalpy: h = C0 + C1 * T + C2 * T² + C3 * T³ + C4 * T * T³ + C5 * T² * T³ T = degrees Kelvin = (°F + 459.7)/1.8
5.5.4 Flue Gas Enthalpy5.5.5 At Measured AH Outlet Temp - tG15 59.20 Btu/lb5.5.6 At Measured AH Air Inlet Temp - tA8 6.04 Btu/lb
5.5.7 Dry Flue Gas Loss, as tested 618.33 Btu/lb AF fuel
5.6 HHV Percent Loss, as tested 5.30 percent
6. HEAT LOSS DUE TO MOISTURE CONTENT IN FUEL
6.1 Water Vapor Enthalpy at tG15 & 1 psia 1206.67 Btu/lb6.2 Saturated Water Enthalpy at tA8 70.57 Btu/lb
6.3 Fuel Moisture Heat Loss, as tested 137.98 Btu/lb AF fuel
6.4 HHV Percent Loss, as tested 1.18 percent
7. HEAT LOSS DUE TO H2O FROM COMBUSTION OF H2 IN FUEL
7.1 H2O From H2 Heat Loss, as tested 450.78 Btu/lb AF fuel
7.2 HHV Percent Loss, as tested 3.87 percent
8. HEAT LOSS DUE TO COMBUSTIBLES (UNBURNED CARBON) IN ASH
8.1 Unburned Carbon In Ash Heat Loss 146.11 Btu/lb AF fuel
8.2 HHV Percent Loss, as tested 1.25 percent
9. HEAT LOSS DUE TO SENSIBLE HEAT IN TOTAL DRY REFUSE
9.1 Determine Dry Refuse Heat Loss Per Pound Of AF Fuel
9.1.1 Bottom Ash Heat Loss, as tested 4.56 Btu/lb AF fuel9.1.2 Fly Ash Heat Loss, as tested 10.43 Btu/lb AF fuel
9.2 Total Dry Refuse Heat Loss, as tested 14.99 Btu/lb AF fuel
9.3 HHV Percent Loss, as tested 0.13 percent
hwvtG15 = 0.4329 * tG15 + 3.958E-05 * (tG15)² + 1062.2 - PTC 4 Sub-Section 5.19.5
hFGtG15 = O2wt * hO2 + N2wt * hN2 + CO2wt * hCO2 + COwt * hCO + SO2wt * hSO2 hFGtA8 = O2wt * hO2 + N2wt * hN2 + CO2wt * hCO2 + COwt * hCO + SO2wt * hSO2
8 of 10
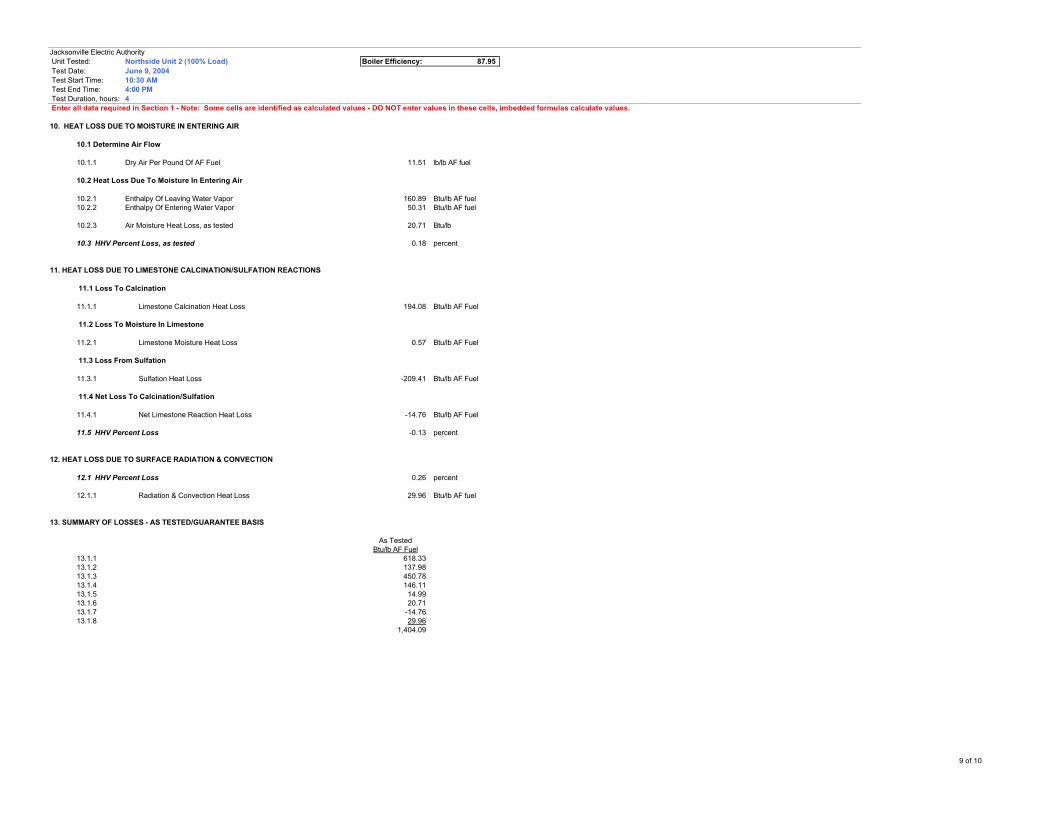
Jacksonville Electric Authority Unit Tested: Northside Unit 2 (100% Load) Boiler Efficiency: 87.95 Test Date: June 9, 2004 Test Start Time: 10:30 AM Test End Time: 4:00 PM Test Duration, hours: 4 Enter all data required in Section 1 - Note: Some cells are identified as calculated values - DO NOT enter values in these cells, imbedded formulas calculate values.
10. HEAT LOSS DUE TO MOISTURE IN ENTERING AIR
10.1 Determine Air Flow
10.1.1 Dry Air Per Pound Of AF Fuel 11.51 lb/lb AF fuel
10.2 Heat Loss Due To Moisture In Entering Air
10.2.1 Enthalpy Of Leaving Water Vapor 160.89 Btu/lb AF fuel10.2.2 Enthalpy Of Entering Water Vapor 50.31 Btu/lb AF fuel
10.2.3 Air Moisture Heat Loss, as tested 20.71 Btu/lb
10.3 HHV Percent Loss, as tested 0.18 percent
11. HEAT LOSS DUE TO LIMESTONE CALCINATION/SULFATION REACTIONS
11.1 Loss To Calcination
11.1.1 Limestone Calcination Heat Loss 194.08 Btu/lb AF Fuel
11.2 Loss To Moisture In Limestone
11.2.1 Limestone Moisture Heat Loss 0.57 Btu/lb AF Fuel
11.3 Loss From Sulfation
11.3.1 Sulfation Heat Loss -209.41 Btu/lb AF Fuel
11.4 Net Loss To Calcination/Sulfation
11.4.1 Net Limestone Reaction Heat Loss -14.76 Btu/lb AF Fuel
11.5 HHV Percent Loss -0.13 percent
12. HEAT LOSS DUE TO SURFACE RADIATION & CONVECTION
12.1 HHV Percent Loss 0.26 percent
12.1.1 Radiation & Convection Heat Loss 29.96 Btu/lb AF fuel
13. SUMMARY OF LOSSES - AS TESTED/GUARANTEE BASIS
As TestedBtu/lb AF Fuel
13.1.1 618.3313.1.2 137.9813.1.3 450.7813.1.4 146.1113.1.5 14.9913.1.6 20.7113.1.7 -14.7613.1.8 29.96
1,404.09
9 of 10
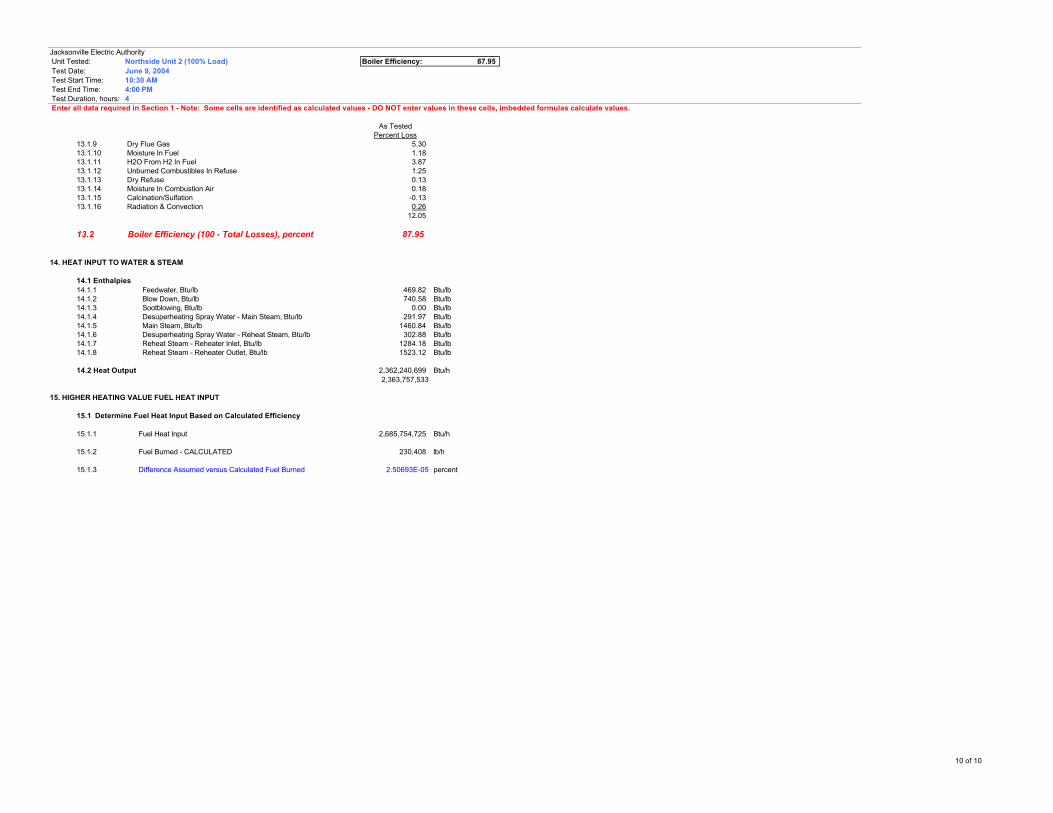
Jacksonville Electric Authority Unit Tested: Northside Unit 2 (100% Load) Boiler Efficiency: 87.95 Test Date: June 9, 2004 Test Start Time: 10:30 AM Test End Time: 4:00 PM Test Duration, hours: 4 Enter all data required in Section 1 - Note: Some cells are identified as calculated values - DO NOT enter values in these cells, imbedded formulas calculate values.
As TestedPercent Loss
13.1.9 Dry Flue Gas 5.3013.1.10 Moisture In Fuel 1.1813.1.11 H2O From H2 In Fuel 3.8713.1.12 Unburned Combustibles In Refuse 1.2513.1.13 Dry Refuse 0.1313.1.14 Moisture In Combustion Air 0.1813.1.15 Calcination/Sulfation -0.1313.1.16 Radiation & Convection 0.26
12.05
13.2 Boiler Efficiency (100 - Total Losses), percent 87.95
14. HEAT INPUT TO WATER & STEAM
14.1 Enthalpies14.1.1 Feedwater, Btu/lb 469.82 Btu/lb14.1.2 Blow Down, Btu/lb 740.58 Btu/lb14.1.3 Sootblowing, Btu/lb 0.00 Btu/lb14.1.4 Desuperheating Spray Water - Main Steam, Btu/lb 291.97 Btu/lb14.1.5 Main Steam, Btu/lb 1460.84 Btu/lb14.1.6 Desuperheating Spray Water - Reheat Steam, Btu/lb 302.88 Btu/lb14.1.7 Reheat Steam - Reheater Inlet, Btu/lb 1284.18 Btu/lb14.1.8 Reheat Steam - Reheater Outlet, Btu/lb 1523.12 Btu/lb
14.2 Heat Output 2,362,240,699 Btu/h2,363,757,533
15. HIGHER HEATING VALUE FUEL HEAT INPUT
15.1 Determine Fuel Heat Input Based on Calculated Efficiency
15.1.1 Fuel Heat Input 2,685,754,725 Btu/h
15.1.2 Fuel Burned - CALCULATED 230,408 lb/h
15.1.3 Difference Assumed versus Calculated Fuel Burned 2.50693E-05 percent
10 of 10
JEA Large-Scale CFB Combustion Demonstration Project
Fuel Capability Demonstration Test Report #3 - ATTACHMENTS Illinois 6 Coal Fuel
B&V Project 137064
ATTACHMENT C
CAE Test Report
Black & Veatch Corporation 10751 Deerwood Park Boulevard, Suite 130
Jacksonville, FL 32256
To the best of our knowledge, the data presented in this report are accurate and complete and error free, legible and representative of the actual emissions during the test program.
REPORT ON
LARGE SCALE CFB COMBUSTION DEMONSTRATION PROJECT 100% ILLINOIS NO. 6 COAL
Performed for:
BLACK & VEATCH CORPORATION UNIT 2, SDA INLET AND STACK
JEA - NORTHSIDE GENERATING STATION
Client Reference No: 137064.96.1400 CleanAir Project No: 9475-3
Revision 0: Draft Release (July 12, 2004)
Submitted by,
Robert A. Preksta Project Manager (412) 787-9130 [email protected]
Reviewed by,
Timothy D. Rodak Manager, Pittsburgh Regional Office

BLACK & VEATCH CORPORATION Client Reference No: 137064.96.1400 JEA - NORTHSIDE GENERATING STATION CleanAir Project No: 9475-3 CONTENTS ii
Revision 0
1 PROJECT OVERVIEW .................................................................................................... 1-1 Table 1-1: Summary of Air Emission Field Test Program............................................ 1-2 Table 1-2: Summary of Test Results............................................................................ 1-3
PROJECT MANAGER’S COMMENTS ............................................................................ 1-4
2 RESULTS......................................................................................................................... 2-1 Table 2-1: Unit 2 – SDA Inlet – Sulfur Dioxide, Run 1 through 3 ................................. 2-1 Table 2-2: Unit 2 – SDA Inlet – Sulfur Dioxide, Run 4 through 7 ................................. 2-2 Table 2-3: Unit 2 – SDA Inlet – Particulate Matter, Runs 1 through 3.......................... 2-3 Table 2-4: Unit 2 – SDA Inlet – Particulate Matter, Runs 4 through 6.......................... 2-4 Table 2-5: Unit 2 – SDA Inlet – Mercury (Ontario Hydro) ............................................. 2-5 Table 2-6: Unit 2 – Stack – Particulate Matter ............................................................. 2-6 Table 2-7: Unit 2 – Stack - Fluoride ............................................................................. 2-7 Table 2-8: Unit 2 – Stack – Lead.................................................................................. 2-8 Table 2-9: Unit 2 – Stack – Mercury (Ontario Hydro) ................................................... 2-9 Table 2-10: Unit 2 – Stack - Ammonia ....................................................................... 2-10
3 DESCRIPTION OF INSTALLATION................................................................................ 3-1 PROCESS DESCRIPTION............................................................................................... 3-1
Figure 3-1: Process Schematic .................................................................................... 3-1 DESCRIPTION OF SAMPLING LOCATION(S) ............................................................... 3-2
Table 3-1: Sampling Points .......................................................................................... 3-2 Figure 3-2: SDA Inlet Sampling Point Determination (EPA Method 1)......................... 3-3 Figure 3-3: Stack Sampling Point Determination (EPA Method 1)............................... 3-4
4 METHODOLOGY............................................................................................................. 4-1 Table 4-1: Summary of Sampling Procedures ............................................................ 4-1
5 APPENDIX........................................................................................................................ 5-1 TEST METHOD SPECIFICATIONS.................................................................................... A SAMPLE CALCULATIONS.................................................................................................. B PARAMETERS .................................................................................................................... C QA/QC DATA....................................................................................................................... D FIELD DATA........................................................................................................................ E FIELD DATA PRINTOUTS.................................................................................................. F LABORATORY DATA..........................................................................................................G FACILITY OPERATING DATA ............................................................................................ H

BLACK & VEATCH CORPORATION Client Reference No: 137064.96.1400 JEA - NORTHSIDE GENERATING STATION CleanAir Project No: 9475-3 PROJECT OVERVIEW 1-1
Revision 0
The Northside Generating Station Repowering project provided JEA (formerly the Jacksonville Electric Authority) with the two largest circulating fluidized bed (CFB) boilers in the world. The agreement between the US Department of Energy (DOE) and JEA covering DOE participation in the Northside Unit 2 project required JEA to demonstrate the ability of the unit to utilize a variety of different fuels. Black and Veatch Corporation (B&V) contracted Clean Air Engineering, Inc. (CleanAir) to perform the air emission measurements required as part of the demonstration test program. This report covers air emission measurements obtained during the firing of 100% Illinois coal to the unit. The test program included the measurement of the following parameters:
• particulate matter (PM), [SDA Inlet and Stack]; • sulfur dioxide (SO2), [SDA Inlet]; • fluoride (F), [Stack]; • lead (Pb), [Stack]; • speciation of mercury (Hg0, Hg2+, Hgtp), [SDA Inlet and Stack]; • ammonia (NH3).
The field portion of the test program took place at the Unit 2 SDA Inlet and Stack locations on June 8 and 9, 2004. Coordinating the field portion of the testing were: T. Compaan – Black and Veatch R. Huggins – Black and Veatch W. Goodrich - JEA K. Davis - JEA J. Stroud - Clean Air Engineering Table 1-1 contains a summary of the specific test locations, various reference methods and sampling periods for each of the sources sampled during the program. The results of the test program are summarized in Table 1-2. A more detailed presentation of the test data is contained in Tables 2-1 through 2-10. Process data collected during the test program is contained in Appendix H.
1 Project Overview

BLACK & VEATCH CORPORATION Client Reference No: 137064.96.1400 JEA - NORTHSIDE GENERATING STATION CleanAir Project No: 9475-3 PROJECT OVERVIEW 1-2
Revision 0
Table 1-1:
Summary of Air Emission Field Test Program Run
Number Location Method Analyte DateStart Time
End Time Notes
1 Unit 2 - SDA Inlet USEPA Method 17 Particulate 6/08/04 09:00 10:262 Unit 2 - SDA Inlet USEPA Method 17 Particulate 6/08/04 11:59 13:193 Unit 2 - SDA Inlet USEPA Method 17 Particulate 6/08/04 14:52 16:121 Unit 2 - SDA Inlet USEPA Method 6C SO2 6/08/04 09:00 10:002 Unit 2 - SDA Inlet USEPA Method 6C SO2 6/08/04 11:59 12:593 Unit 2 - SDA Inlet USEPA Method 6C SO2 6/08/04 14:52 15:521 Unit 2 - SDA Inlet Ontario Hydro Mercury 6/08/04 09:26 11:532 Unit 2 - SDA Inlet Ontario Hydro Mercury 6/08/04 13:03 15:153 Unit 2 - SDA Inlet Ontario Hydro Mercury 6/08/04 15:50 18:03
1 Unit 2 - Stack USEPA Method 5/29 Particulate/Lead 6/08/04 09:00 11:142 Unit 2 - Stack USEPA Method 5/29 Particulate/Lead 6/08/04 11:59 14:123 Unit 2 - Stack USEPA Method 5/29 Particulate/Lead 6/08/04 14:52 17:021 Unit 2 - Stack Ontario Hydro Mercury 6/08/04 09:00 11:422 Unit 2 - Stack Ontario Hydro Mercury 6/08/04 13:03 15:153 Unit 2 - Stack Ontario Hydro Mercury 6/08/04 15:50 18:02
4 Unit 2 - SDA Inlet USEPA Method 17 Particulate 6/09/04 10:30 11:395 Unit 2 - SDA Inlet USEPA Method 17 Particulate 6/09/04 12:08 14:076 Unit 2 - SDA Inlet USEPA Method 17 Particulate 6/09/04 14:58 16:224 Unit 2 - SDA Inlet USEPA Method 6C SO2 6/09/04 10:30 11:305 Unit 2 - SDA Inlet USEPA Method 6C SO2 6/09/04 12:08 13:086 Unit 2 - SDA Inlet USEPA Method 6C SO2 6/09/04 14:58 15:38 (1)7 Unit 2 - SDA Inlet USEPA Method 6C SO2 6/09/04 15:58 16:58 (2)
1 Unit 2 - Stack USEPA Method 13B Total Fluorides 6/09/04 10:30 11:332 Unit 2 - Stack USEPA Method 13B Total Fluorides 6/09/04 12:08 13:103 Unit 2 - Stack USEPA Method 13B Total Fluorides 6/09/04 14:04 15:101 Unit 2 - Stack CTM-027 Ammonia 6/09/04 12:25 13:272 Unit 2 - Stack CTM-027 Ammonia 6/09/04 13:41 14:543 Unit 2 - Stack CTM-027 Ammonia 6/09/04 15:14 16:21
Notes:071204 123150(1) SDA Inlet SO2 Run 6 suspeneded due to problem with Spray Drier.
(2) Gas conditions and volumetric flow data from EPA Method 17 Run 6 were used to convert the SO2 concentration (ppmdv) into the mass emission rate (lb/hr).
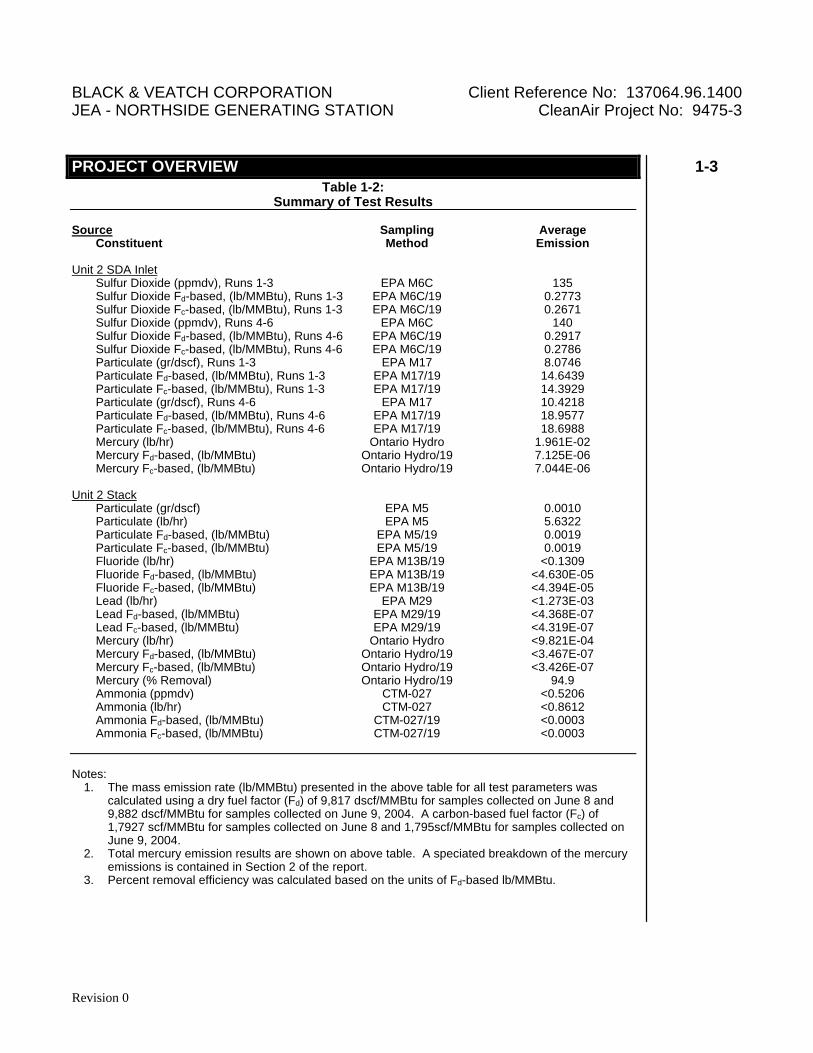
BLACK & VEATCH CORPORATION Client Reference No: 137064.96.1400 JEA - NORTHSIDE GENERATING STATION CleanAir Project No: 9475-3 PROJECT OVERVIEW 1-3
Revision 0
Table 1-2: Summary of Test Results
Source Sampling Average Constituent Method Emission Unit 2 SDA Inlet Sulfur Dioxide (ppmdv), Runs 1-3 EPA M6C 135 Sulfur Dioxide Fd-based, (lb/MMBtu), Runs 1-3 EPA M6C/19 0.2773 Sulfur Dioxide Fc-based, (lb/MMBtu), Runs 1-3 EPA M6C/19 0.2671 Sulfur Dioxide (ppmdv), Runs 4-6 EPA M6C 140 Sulfur Dioxide Fd-based, (lb/MMBtu), Runs 4-6 EPA M6C/19 0.2917 Sulfur Dioxide Fc-based, (lb/MMBtu), Runs 4-6 EPA M6C/19 0.2786 Particulate (gr/dscf), Runs 1-3 EPA M17 8.0746 Particulate Fd-based, (lb/MMBtu), Runs 1-3 EPA M17/19 14.6439 Particulate Fc-based, (lb/MMBtu), Runs 1-3 EPA M17/19 14.3929 Particulate (gr/dscf), Runs 4-6 EPA M17 10.4218 Particulate Fd-based, (lb/MMBtu), Runs 4-6 EPA M17/19 18.9577 Particulate Fc-based, (lb/MMBtu), Runs 4-6 EPA M17/19 18.6988 Mercury (lb/hr) Ontario Hydro 1.961E-02 Mercury Fd-based, (lb/MMBtu) Ontario Hydro/19 7.125E-06 Mercury Fc-based, (lb/MMBtu) Ontario Hydro/19 7.044E-06 Unit 2 Stack Particulate (gr/dscf) EPA M5 0.0010 Particulate (lb/hr) EPA M5 5.6322 Particulate Fd-based, (lb/MMBtu) EPA M5/19 0.0019 Particulate Fc-based, (lb/MMBtu) EPA M5/19 0.0019 Fluoride (lb/hr) EPA M13B/19 <0.1309 Fluoride Fd-based, (lb/MMBtu) EPA M13B/19 <4.630E-05 Fluoride Fc-based, (lb/MMBtu) EPA M13B/19 <4.394E-05 Lead (lb/hr) EPA M29 <1.273E-03 Lead Fd-based, (lb/MMBtu) EPA M29/19 <4.368E-07 Lead Fc-based, (lb/MMBtu) EPA M29/19 <4.319E-07 Mercury (lb/hr) Ontario Hydro <9.821E-04 Mercury Fd-based, (lb/MMBtu) Ontario Hydro/19 <3.467E-07 Mercury Fc-based, (lb/MMBtu) Ontario Hydro/19 <3.426E-07 Mercury (% Removal) Ontario Hydro/19 94.9 Ammonia (ppmdv) CTM-027 <0.5206 Ammonia (lb/hr) CTM-027 <0.8612 Ammonia Fd-based, (lb/MMBtu) CTM-027/19 <0.0003 Ammonia Fc-based, (lb/MMBtu) CTM-027/19 <0.0003
Notes: 1. The mass emission rate (lb/MMBtu) presented in the above table for all test parameters was
calculated using a dry fuel factor (Fd) of 9,817 dscf/MMBtu for samples collected on June 8 and 9,882 dscf/MMBtu for samples collected on June 9, 2004. A carbon-based fuel factor (Fc) of 1,7927 scf/MMBtu for samples collected on June 8 and 1,795scf/MMBtu for samples collected on June 9, 2004.
2. Total mercury emission results are shown on above table. A speciated breakdown of the mercury emissions is contained in Section 2 of the report.
3. Percent removal efficiency was calculated based on the units of Fd-based lb/MMBtu.

BLACK & VEATCH CORPORATION Client Reference No: 137064.96.1400 JEA - NORTHSIDE GENERATING STATION CleanAir Project No: 9475-3 PROJECT OVERVIEW 1-4
Revision 0
PROJECT MANAGER’S COMMENTS Ontario Hydro Test Results Each Ontario Hydro sampling train consists of five (5) sample fractions. These fractions, starting from the sampling nozzle, consist of:
1. 0.1N HNO3 (Front-half Rinse) 2. Filter 3. KCl (Impingers 1 through 3) 4. HNO3-H2O2 (Impinger 4) 5. KMnO4 (Impingers 5 through 7)
An aliquot of each reagent and an unused filter where analyzed for mercury prior to use in the field as an added quality assurance program. All reagent s and the filter blank were below the minimum detection limit for mercury. Results of the pre-blank analysis are contained in Appendix D. Dry and Carbon Based Fuel Factors The fuel factors (dry and carbon based) used calculate the lb/MMBtu results were determined from coal samples collected on June 6 and 7, 2004. Each sample was designated as the coal fired the next day i.e., the coal sample collected on June 6 is designated as fired in unit on June 7. The Fd and Fc factors were calculated based on the “As Received” analysis. A copy of the calculations is included with the coal analysis in Appendix H of this report.
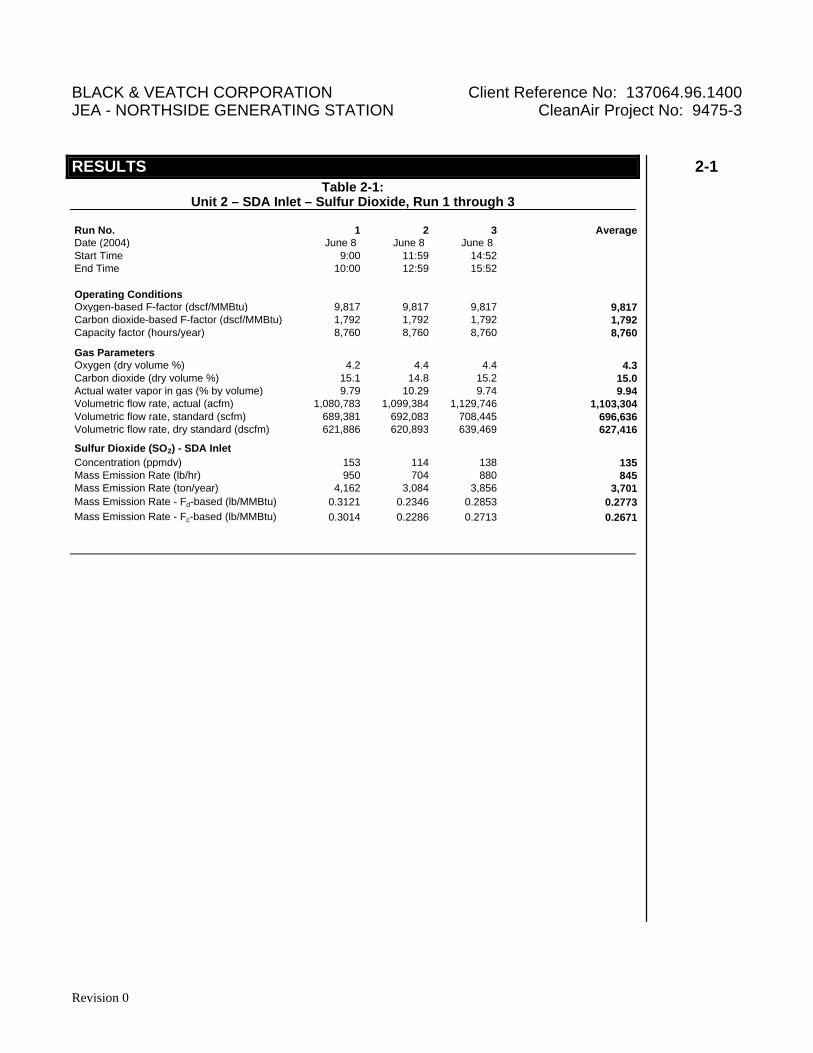
BLACK & VEATCH CORPORATION Client Reference No: 137064.96.1400 JEA - NORTHSIDE GENERATING STATION CleanAir Project No: 9475-3 RESULTS 2-1
Revision 0
Table 2-1: Unit 2 – SDA Inlet – Sulfur Dioxide, Run 1 through 3
Run No. 1 2 3 AverageDate (2004) June 8 June 8 June 8Start Time 9:00 11:59 14:52End Time 10:00 12:59 15:52
Operating ConditionsOxygen-based F-factor (dscf/MMBtu) 9,817 9,817 9,817 9,817Carbon dioxide-based F-factor (dscf/MMBtu) 1,792 1,792 1,792 1,792Capacity factor (hours/year) 8,760 8,760 8,760 8,760
Gas ParametersOxygen (dry volume %) 4.2 4.4 4.4 4.3Carbon dioxide (dry volume %) 15.1 14.8 15.2 15.0Actual water vapor in gas (% by volume) 9.79 10.29 9.74 9.94Volumetric flow rate, actual (acfm) 1,080,783 1,099,384 1,129,746 1,103,304Volumetric flow rate, standard (scfm) 689,381 692,083 708,445 696,636Volumetric flow rate, dry standard (dscfm) 621,886 620,893 639,469 627,416
Sulfur Dioxide (SO2) - SDA InletConcentration (ppmdv) 153 114 138 135Mass Emission Rate (lb/hr) 950 704 880 845Mass Emission Rate (ton/year) 4,162 3,084 3,856 3,701Mass Emission Rate - Fd-based (lb/MMBtu) 0.3121 0.2346 0.2853 0.2773Mass Emission Rate - Fc-based (lb/MMBtu) 0.3014 0.2286 0.2713 0.2671
2 Results
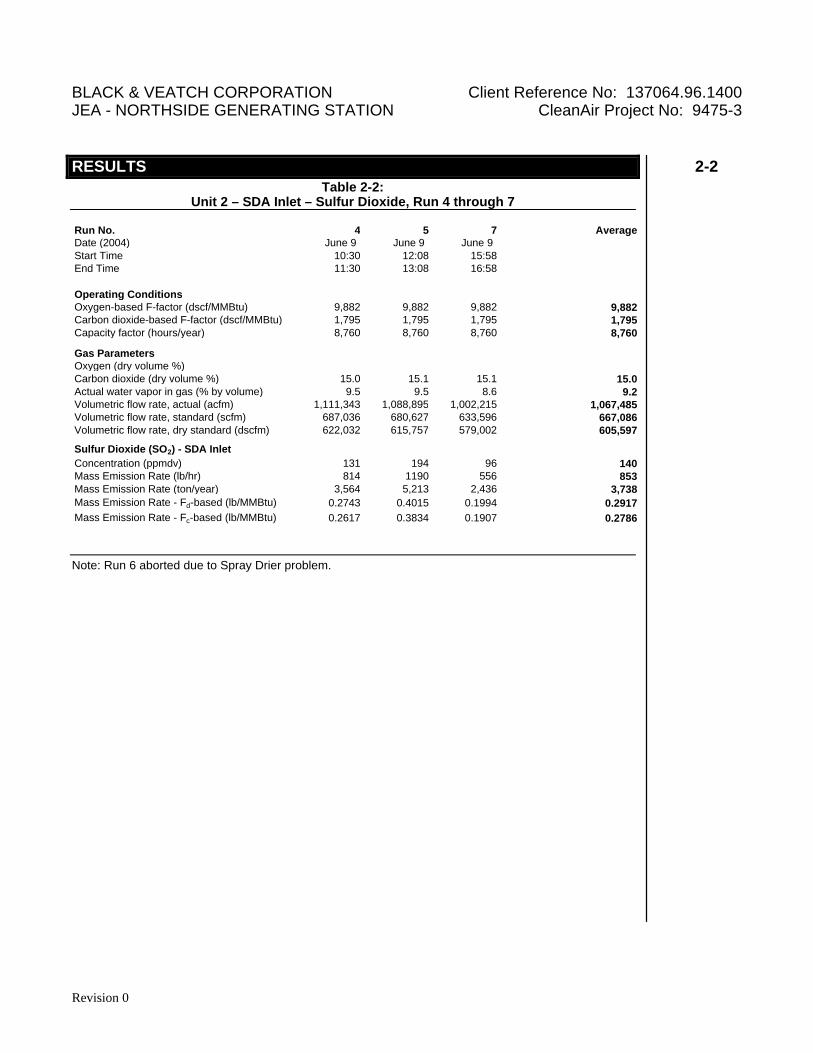
BLACK & VEATCH CORPORATION Client Reference No: 137064.96.1400 JEA - NORTHSIDE GENERATING STATION CleanAir Project No: 9475-3 RESULTS 2-2
Revision 0
Table 2-2: Unit 2 – SDA Inlet – Sulfur Dioxide, Run 4 through 7
Run No. 4 5 7 AverageDate (2004) June 9 June 9 June 9Start Time 10:30 12:08 15:58End Time 11:30 13:08 16:58
Operating ConditionsOxygen-based F-factor (dscf/MMBtu) 9,882 9,882 9,882 9,882Carbon dioxide-based F-factor (dscf/MMBtu) 1,795 1,795 1,795 1,795Capacity factor (hours/year) 8,760 8,760 8,760 8,760
Gas ParametersOxygen (dry volume %)Carbon dioxide (dry volume %) 15.0 15.1 15.1 15.0Actual water vapor in gas (% by volume) 9.5 9.5 8.6 9.2Volumetric flow rate, actual (acfm) 1,111,343 1,088,895 1,002,215 1,067,485Volumetric flow rate, standard (scfm) 687,036 680,627 633,596 667,086Volumetric flow rate, dry standard (dscfm) 622,032 615,757 579,002 605,597
Sulfur Dioxide (SO2) - SDA InletConcentration (ppmdv) 131 194 96 140Mass Emission Rate (lb/hr) 814 1190 556 853Mass Emission Rate (ton/year) 3,564 5,213 2,436 3,738Mass Emission Rate - Fd-based (lb/MMBtu) 0.2743 0.4015 0.1994 0.2917Mass Emission Rate - Fc-based (lb/MMBtu) 0.2617 0.3834 0.1907 0.2786
Note: Run 6 aborted due to Spray Drier problem.
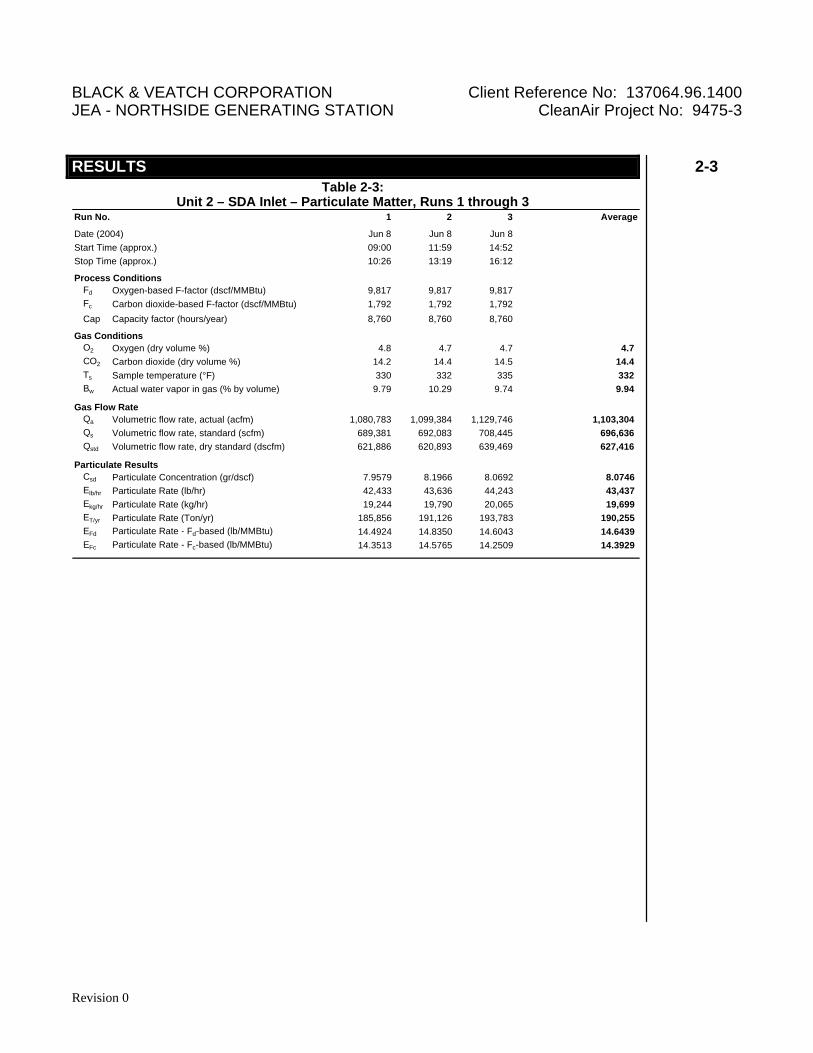
BLACK & VEATCH CORPORATION Client Reference No: 137064.96.1400 JEA - NORTHSIDE GENERATING STATION CleanAir Project No: 9475-3 RESULTS 2-3
Revision 0
Table 2-3: Unit 2 – SDA Inlet – Particulate Matter, Runs 1 through 3
Run No. 1 2 3 Average
Date (2004) Jun 8 Jun 8 Jun 8Start Time (approx.) 09:00 11:59 14:52Stop Time (approx.) 10:26 13:19 16:12
Process ConditionsFd Oxygen-based F-factor (dscf/MMBtu) 9,817 9,817 9,817Fc Carbon dioxide-based F-factor (dscf/MMBtu) 1,792 1,792 1,792
Cap Capacity factor (hours/year) 8,760 8,760 8,760
Gas ConditionsO2 Oxygen (dry volume %) 4.8 4.7 4.7 4.7CO2 Carbon dioxide (dry volume %) 14.2 14.4 14.5 14.4Ts Sample temperature (°F) 330 332 335 332Bw Actual water vapor in gas (% by volume) 9.79 10.29 9.74 9.94
Gas Flow RateQa Volumetric flow rate, actual (acfm) 1,080,783 1,099,384 1,129,746 1,103,304Qs Volumetric flow rate, standard (scfm) 689,381 692,083 708,445 696,636Qstd Volumetric flow rate, dry standard (dscfm) 621,886 620,893 639,469 627,416
Particulate ResultsCsd Particulate Concentration (gr/dscf) 7.9579 8.1966 8.0692 8.0746Elb/hr Particulate Rate (lb/hr) 42,433 43,636 44,243 43,437 Ekg/hr Particulate Rate (kg/hr) 19,244 19,790 20,065 19,699 ET/yr Particulate Rate (Ton/yr) 185,856 191,126 193,783 190,255 EFd Particulate Rate - Fd-based (lb/MMBtu) 14.4924 14.8350 14.6043 14.6439EFc Particulate Rate - Fc-based (lb/MMBtu) 14.3513 14.5765 14.2509 14.3929

BLACK & VEATCH CORPORATION Client Reference No: 137064.96.1400 JEA - NORTHSIDE GENERATING STATION CleanAir Project No: 9475-3 RESULTS 2-4
Revision 0
Table 2-4: Unit 2 – SDA Inlet – Particulate Matter, Runs 4 through 6
Run No. 4 5 6 Average
Date (2004) Jun 9 Jun 9 Jun 9Start Time (approx.) 10:30 12:08 14:58Stop Time (approx.) 11:39 14:07 16:22
Process ConditionsFd Oxygen-based F-factor (dscf/MMBtu) 9,882 9,882 9,882Fc Carbon dioxide-based F-factor (dscf/MMBtu) 1,795 1,795 1,795
Cap Capacity factor (hours/year) 8,760 8,760 8,760
Gas ConditionsO2 Oxygen (dry volume %) 4.8 4.7 4.5 4.7CO2 Carbon dioxide (dry volume %) 14.2 14.3 14.4 14.3Ts Sample temperature (°F) 346 339 330 339Bw Actual water vapor in gas (% by volume) 9.46 9.53 8.62 9.20
Gas Flow RateQa Volumetric flow rate, actual (acfm) 1,111,343 1,088,895 1,002,215 1,067,485Qs Volumetric flow rate, standard (scfm) 687,036 680,627 633,596 667,086Qstd Volumetric flow rate, dry standard (dscfm) 622,032 615,757 579,002 605,597
Particulate ResultsCsd Particulate Concentration (gr/dscf) 9.9480 12.2715 9.0458 10.4218Elb/hr Particulate Rate (lb/hr) 53,057 64,789 44,908 54,251 Ekg/hr Particulate Rate (kg/hr) 24,062 29,383 20,366 24,604 ET/yr Particulate Rate (Ton/yr) 232,389 283,776 196,695 237,620 EFd Particulate Rate - Fd-based (lb/MMBtu) 18.2366 22.3572 16.2793 18.9577EFc Particulate Rate - Fc-based (lb/MMBtu) 17.9703 22.0125 16.1135 18.6988
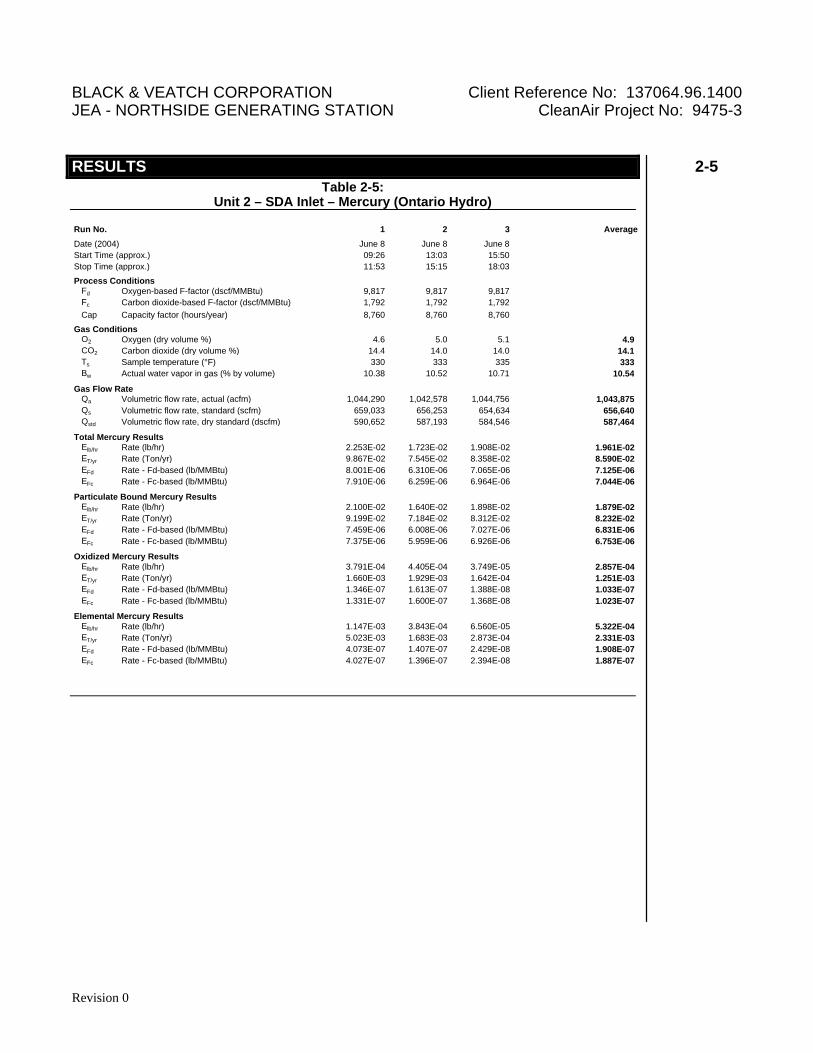
BLACK & VEATCH CORPORATION Client Reference No: 137064.96.1400 JEA - NORTHSIDE GENERATING STATION CleanAir Project No: 9475-3 RESULTS 2-5
Revision 0
Table 2-5: Unit 2 – SDA Inlet – Mercury (Ontario Hydro)
Run No. 1 2 3 Average
Date (2004) June 8 June 8 June 8Start Time (approx.) 09:26 13:03 15:50Stop Time (approx.) 11:53 15:15 18:03
Process ConditionsFd Oxygen-based F-factor (dscf/MMBtu) 9,817 9,817 9,817Fc Carbon dioxide-based F-factor (dscf/MMBtu) 1,792 1,792 1,792Cap Capacity factor (hours/year) 8,760 8,760 8,760
Gas ConditionsO2 Oxygen (dry volume %) 4.6 5.0 5.1 4.9CO2 Carbon dioxide (dry volume %) 14.4 14.0 14.0 14.1Ts Sample temperature (°F) 330 333 335 333Bw Actual water vapor in gas (% by volume) 10.38 10.52 10.71 10.54
Gas Flow RateQa Volumetric flow rate, actual (acfm) 1,044,290 1,042,578 1,044,756 1,043,875Qs Volumetric flow rate, standard (scfm) 659,033 656,253 654,634 656,640Qstd Volumetric flow rate, dry standard (dscfm) 590,652 587,193 584,546 587,464
Total Mercury ResultsElb/hr Rate (lb/hr) 2.253E-02 1.723E-02 1.908E-02 1.961E-02ET/yr Rate (Ton/yr) 9.867E-02 7.545E-02 8.358E-02 8.590E-02EFd Rate - Fd-based (lb/MMBtu) 8.001E-06 6.310E-06 7.065E-06 7.125E-06EFc Rate - Fc-based (lb/MMBtu) 7.910E-06 6.259E-06 6.964E-06 7.044E-06
Particulate Bound Mercury ResultsElb/hr Rate (lb/hr) 2.100E-02 1.640E-02 1.898E-02 1.879E-02ET/yr Rate (Ton/yr) 9.199E-02 7.184E-02 8.312E-02 8.232E-02EFd Rate - Fd-based (lb/MMBtu) 7.459E-06 6.008E-06 7.027E-06 6.831E-06EFc Rate - Fc-based (lb/MMBtu) 7.375E-06 5.959E-06 6.926E-06 6.753E-06
Oxidized Mercury ResultsElb/hr Rate (lb/hr) 3.791E-04 4.405E-04 3.749E-05 2.857E-04ET/yr Rate (Ton/yr) 1.660E-03 1.929E-03 1.642E-04 1.251E-03EFd Rate - Fd-based (lb/MMBtu) 1.346E-07 1.613E-07 1.388E-08 1.033E-07EFc Rate - Fc-based (lb/MMBtu) 1.331E-07 1.600E-07 1.368E-08 1.023E-07
Elemental Mercury ResultsElb/hr Rate (lb/hr) 1.147E-03 3.843E-04 6.560E-05 5.322E-04ET/yr Rate (Ton/yr) 5.023E-03 1.683E-03 2.873E-04 2.331E-03EFd Rate - Fd-based (lb/MMBtu) 4.073E-07 1.407E-07 2.429E-08 1.908E-07EFc Rate - Fc-based (lb/MMBtu) 4.027E-07 1.396E-07 2.394E-08 1.887E-07

BLACK & VEATCH CORPORATION Client Reference No: 137064.96.1400 JEA - NORTHSIDE GENERATING STATION CleanAir Project No: 9475-3 RESULTS 2-6
Revision 0
Table 2-6: Unit 2 – Stack – Particulate Matter
Run No. 1 2 3 Average
Date (2004) Jun 8 Jun 8 Jun 8Start Time (approx.) 09:00 11:59 14:52Stop Time (approx.) 11:14 14:12 17:02
Process ConditionsFd Oxygen-based F-factor (dscf/MMBtu) 9,817 9,817 9,817Fc Carbon dioxide-based F-factor (dscf/MMBtu) 1,792 1,792 1,792
Cap Capacity factor (hours/year) 8,760 8,760 8,760
Gas ConditionsO2 Oxygen (dry volume %) 5.4 5.2 5.4 5.3CO2 Carbon dioxide (dry volume %) 13.7 13.9 13.6 13.7Ts Sample temperature (°F) 231 232 231 232Bw Actual water vapor in gas (% by volume) 14.16 14.36 14.15 14.22
Gas Flow RateQa Volumetric flow rate, actual (acfm) 959,107 1,010,648 996,438 988,731Qs Volumetric flow rate, standard (scfm) 734,258 772,458 762,561 756,426Qstd Volumetric flow rate, dry standard (dscfm) 630,266 661,565 654,694 648,841
Particulate ResultsCsd Particulate Concentration (gr/dscf) 0.0008 0.0010 0.0012 0.0010Elb/hr Particulate Rate (lb/hr) 4.0681 5.8250 7.0036 5.6322Ekg/hr Particulate Rate (kg/hr) 1.8449 2.6417 3.1762 2.5543ET/yr Particulate Rate (Ton/yr) 17.8181 25.5135 30.6758 24.6691EFd Particulate Rate - Fd-based (lb/MMBtu) 0.0014 0.0019 0.0024 0.0019EFc Particulate Rate - Fc-based (lb/MMBtu) 0.0014 0.0019 0.0023 0.0019

BLACK & VEATCH CORPORATION Client Reference No: 137064.96.1400 JEA - NORTHSIDE GENERATING STATION CleanAir Project No: 9475-3 RESULTS 2-7
Revision 0
Table 2-7: Unit 2 – Stack - Fluoride
Run No. 1 2 3 Average
Date (2004) Jun 9 Jun 9 Jun 9Start Time (approx.) 10:30 12:08 14:04Stop Time (approx.) 11:33 13:10 15:10
Process ConditionsFd Oxygen-based F-factor (dscf/MMBtu) 9,882 9,882 9,882Fc Carbon dioxide-based F-factor (dscf/MMBtu) 1,795 1,795 1,795
Cap Capacity factor (hours/year) 8,760 8,760 8,760
Gas ConditionsO2 Oxygen (dry volume %) 5.4 5.6 5.2 5.4CO2 Carbon dioxide (dry volume %) 14.2 14.0 14.5 14.2Ts Sample temperature (°F) 239 231 215 228Bw Actual water vapor in gas (% by volume) 14.80 14.99 15.30 15.03
Gas Flow RateQa Volumetric flow rate, actual (acfm) 974,643 974,975 926,246 958,621Qs Volumetric flow rate, standard (scfm) 738,273 746,631 725,948 736,951Qstd Volumetric flow rate, dry standard (dscfm) 629,007 634,737 614,851 626,198
Hydrogen Fluoride (HF) ResultsCsd HF Concentration (ppmdv) <0.1008 <0.0970 <0.0018 <0.0665Elb/hr HF Rate (lb/hr) <0.1974 <0.1918 <0.0034 <0.1309EFd HF Rate - Fd-based (lb/MMBtu) <6.969E-05 <6.797E-05 <1.221E-06 <4.630E-05EFc HF Rate - Fc-based (lb/MMBtu) <6.612E-05 <6.456E-05 <1.149E-06 <4.394E-05

BLACK & VEATCH CORPORATION Client Reference No: 137064.96.1400 JEA - NORTHSIDE GENERATING STATION CleanAir Project No: 9475-3 RESULTS 2-8
Revision 0
Table 2-8: Unit 2 – Stack – Lead
Run No. 1 2 3 Average
Date (2004) Jun 8 Jun 8 Jun 8Start Time (approx.) 09:00 11:59 14:52Stop Time (approx.) 11:14 14:12 17:02
Process ConditionsFd Oxygen-based F-factor (dscf/MMBtu) 9,817 9,817 9,817Fc Carbon dioxide-based F-factor (dscf/MMBtu) 1,792 1,792 1,792
Cap Capacity factor (hours/year) 8,760 8,760 8,760
Gas ConditionsO2 Oxygen (dry volume %) 5.4 5.2 5.4 5.3CO2 Carbon dioxide (dry volume %) 13.7 13.9 13.6 13.7Ts Sample temperature (°F) 231 232 231 232Bw Actual water vapor in gas (% by volume) 14.16 14.36 14.15 14.22
Gas Flow RateQa Volumetric flow rate, actual (acfm) 959,107 1,010,648 996,438 988,731Qs Volumetric flow rate, standard (scfm) 734,258 772,458 762,561 756,426Qstd Volumetric flow rate, dry standard (dscfm) 630,266 661,565 654,694 648,841
Lead Results - TotalCsd Concentration (lb/dscf) <6.186E-11 <2.375E-11 <1.369E-11 <3.310E-11Elb/hr Rate (lb/hr) <2.339E-03 <9.426E-04 <5.380E-04 <1.273E-03ET/yr Rate (Ton/yr) <1.025E-02 <4.129E-03 <2.356E-03 <5.577E-03EFd Rate - Fd-based (lb/MMBtu) <8.188E-07 <3.103E-07 <1.813E-07 <4.368E-07EFc Rate - Fc-based (lb/MMBtu) <8.091E-07 <3.061E-07 <1.805E-07 <4.319E-07
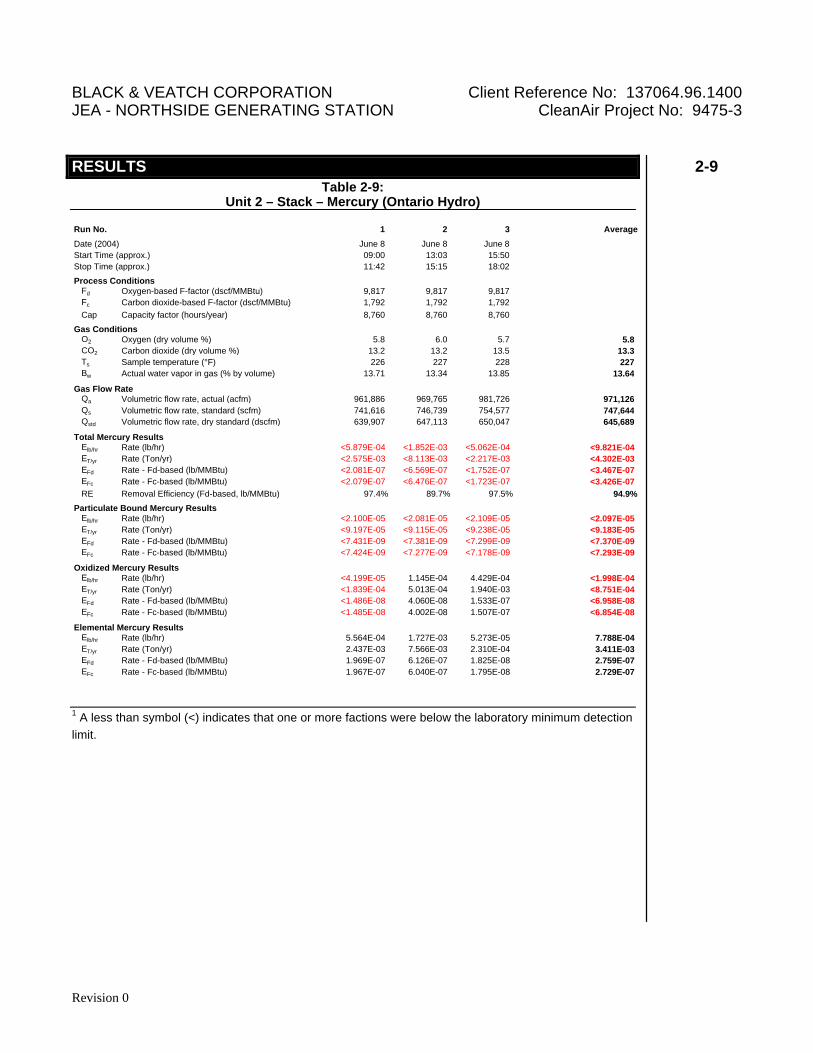
BLACK & VEATCH CORPORATION Client Reference No: 137064.96.1400 JEA - NORTHSIDE GENERATING STATION CleanAir Project No: 9475-3 RESULTS 2-9
Revision 0
Table 2-9: Unit 2 – Stack – Mercury (Ontario Hydro)
Run No. 1 2 3 Average
Date (2004) June 8 June 8 June 8Start Time (approx.) 09:00 13:03 15:50Stop Time (approx.) 11:42 15:15 18:02
Process ConditionsFd Oxygen-based F-factor (dscf/MMBtu) 9,817 9,817 9,817Fc Carbon dioxide-based F-factor (dscf/MMBtu) 1,792 1,792 1,792Cap Capacity factor (hours/year) 8,760 8,760 8,760
Gas ConditionsO2 Oxygen (dry volume %) 5.8 6.0 5.7 5.8CO2 Carbon dioxide (dry volume %) 13.2 13.2 13.5 13.3Ts Sample temperature (°F) 226 227 228 227Bw Actual water vapor in gas (% by volume) 13.71 13.34 13.85 13.64
Gas Flow RateQa Volumetric flow rate, actual (acfm) 961,886 969,765 981,726 971,126Qs Volumetric flow rate, standard (scfm) 741,616 746,739 754,577 747,644Qstd Volumetric flow rate, dry standard (dscfm) 639,907 647,113 650,047 645,689
Total Mercury ResultsElb/hr Rate (lb/hr) <5.879E-04 <1.852E-03 <5.062E-04 <9.821E-04ET/yr Rate (Ton/yr) <2.575E-03 <8.113E-03 <2.217E-03 <4.302E-03EFd Rate - Fd-based (lb/MMBtu) <2.081E-07 <6.569E-07 <1.752E-07 <3.467E-07EFc Rate - Fc-based (lb/MMBtu) <2.079E-07 <6.476E-07 <1.723E-07 <3.426E-07RE Removal Efficiency (Fd-based, lb/MMBtu) 97.4% 89.7% 97.5% 94.9%
Particulate Bound Mercury ResultsElb/hr Rate (lb/hr) <2.100E-05 <2.081E-05 <2.109E-05 <2.097E-05ET/yr Rate (Ton/yr) <9.197E-05 <9.115E-05 <9.238E-05 <9.183E-05EFd Rate - Fd-based (lb/MMBtu) <7.431E-09 <7.381E-09 <7.299E-09 <7.370E-09EFc Rate - Fc-based (lb/MMBtu) <7.424E-09 <7.277E-09 <7.178E-09 <7.293E-09
Oxidized Mercury ResultsElb/hr Rate (lb/hr) <4.199E-05 1.145E-04 4.429E-04 <1.998E-04ET/yr Rate (Ton/yr) <1.839E-04 5.013E-04 1.940E-03 <8.751E-04EFd Rate - Fd-based (lb/MMBtu) <1.486E-08 4.060E-08 1.533E-07 <6.958E-08EFc Rate - Fc-based (lb/MMBtu) <1.485E-08 4.002E-08 1.507E-07 <6.854E-08
Elemental Mercury ResultsElb/hr Rate (lb/hr) 5.564E-04 1.727E-03 5.273E-05 7.788E-04ET/yr Rate (Ton/yr) 2.437E-03 7.566E-03 2.310E-04 3.411E-03EFd Rate - Fd-based (lb/MMBtu) 1.969E-07 6.126E-07 1.825E-08 2.759E-07EFc Rate - Fc-based (lb/MMBtu) 1.967E-07 6.040E-07 1.795E-08 2.729E-07
1 A less than symbol (<) indicates that one or more factions were below the laboratory minimum detection limit.

BLACK & VEATCH CORPORATION Client Reference No: 137064.96.1400 JEA - NORTHSIDE GENERATING STATION CleanAir Project No: 9475-3 RESULTS 2-10
Revision 0
Table 2-10: Unit 2 – Stack - Ammonia
Run No. 1 2 3 Average
Date (2004) Jun 9 Jun 9 Jun 9Start Time (approx.) 12:25 13:41 15:14Stop Time (approx.) 13:27 14:54 16:21
Process ConditionsFd Oxygen-based F-factor (dscf/MMBtu) 9,882 9,882 9,882Fc Carbon dioxide-based F-factor (dscf/MMBtu) 1,795 1,795 1,795
Cap Capacity factor (hours/year) 8,760 8,760 8,760
Gas ConditionsO2 Oxygen (dry volume %) 5.6 5.4 5.2 5.4CO2 Carbon dioxide (dry volume %) 14.0 14.3 14.2 14.2Ts Sample temperature (°F) 224 214 212 217Bw Actual water vapor in gas (% by volume) 14.42 14.48 14.25 14.39
Gas Flow RateQa Volumetric flow rate, actual (acfm) 986,624 908,645 903,817 933,028Qs Volumetric flow rate, standard (scfm) 760,646 713,209 712,324 728,726Qstd Volumetric flow rate, dry standard (dscfm) 650,930 609,910 610,786 623,876
Ammonia (NH3) ResultsCsd Ammonia Concentration (ppmdv) 0.5292 0.4454 <0.5870 <0.5206Elb/hr Ammonia Rate (lb/hr) 0.9131 0.7201 <0.9504 <0.8612ET/yr Ammonia Rate (Ton/yr) 3.9993 3.1541 <4.1628 <3.7721EFd Ammonia Rate - Fd-based (lb/MMBtu) 0.0003 0.0003 <0.0003 <0.0003EFc Ammonia Rate - Fc-based (lb/MMBtu) 0.0003 0.0002 <0.0003 <0.0003
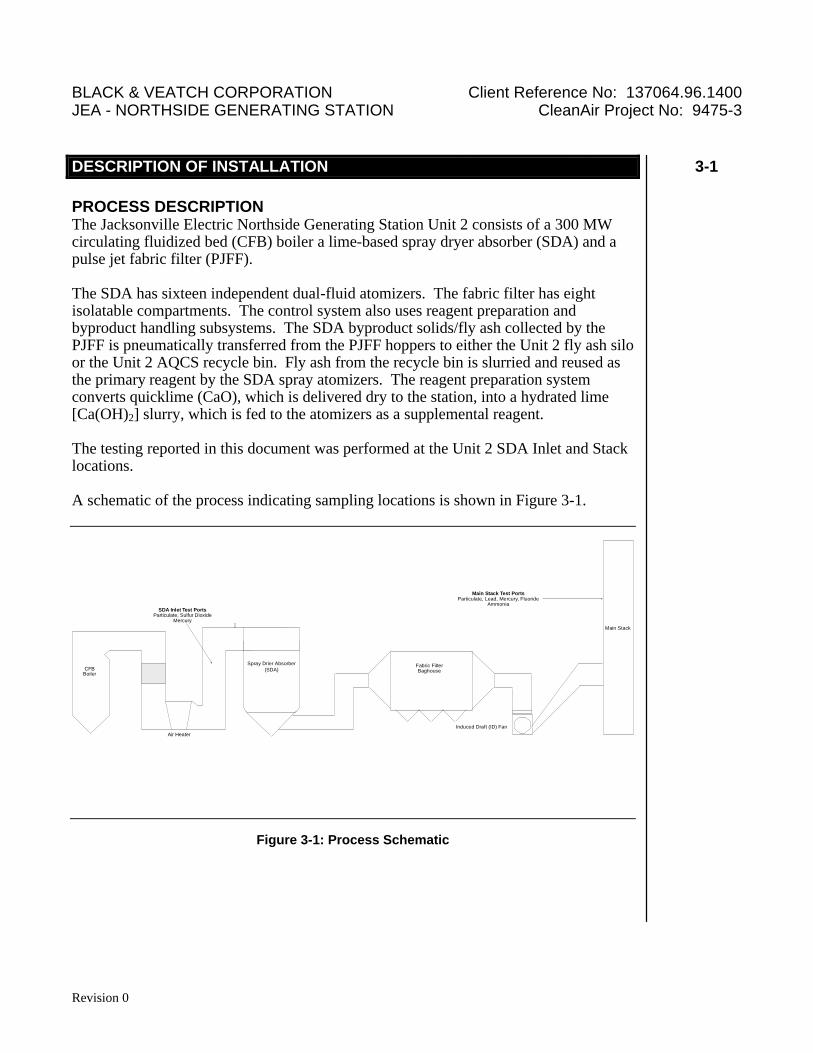
BLACK & VEATCH CORPORATION Client Reference No: 137064.96.1400 JEA - NORTHSIDE GENERATING STATION CleanAir Project No: 9475-3 DESCRIPTION OF INSTALLATION 3-1
Revision 0
PROCESS DESCRIPTION The Jacksonville Electric Northside Generating Station Unit 2 consists of a 300 MW circulating fluidized bed (CFB) boiler a lime-based spray dryer absorber (SDA) and a pulse jet fabric filter (PJFF). The SDA has sixteen independent dual-fluid atomizers. The fabric filter has eight isolatable compartments. The control system also uses reagent preparation and byproduct handling subsystems. The SDA byproduct solids/fly ash collected by the PJFF is pneumatically transferred from the PJFF hoppers to either the Unit 2 fly ash silo or the Unit 2 AQCS recycle bin. Fly ash from the recycle bin is slurried and reused as the primary reagent by the SDA spray atomizers. The reagent preparation system converts quicklime (CaO), which is delivered dry to the station, into a hydrated lime [Ca(OH)2] slurry, which is fed to the atomizers as a supplemental reagent. The testing reported in this document was performed at the Unit 2 SDA Inlet and Stack locations. A schematic of the process indicating sampling locations is shown in Figure 3-1.
CFBBoiler SNCR
Air Heater
Spray Drier Absorber(SDA)
SDA Inlet Test PortsParticulate, Sulfur Dioxide
Mercury
Fabric FilterBaghouse
Induced Draft (ID) Fan
Main Stack
Main Stack Test PortsParticulate, Lead, Mercury, Fluoride
Ammonia
Figure 3-1: Process Schematic
3 Description of Installation
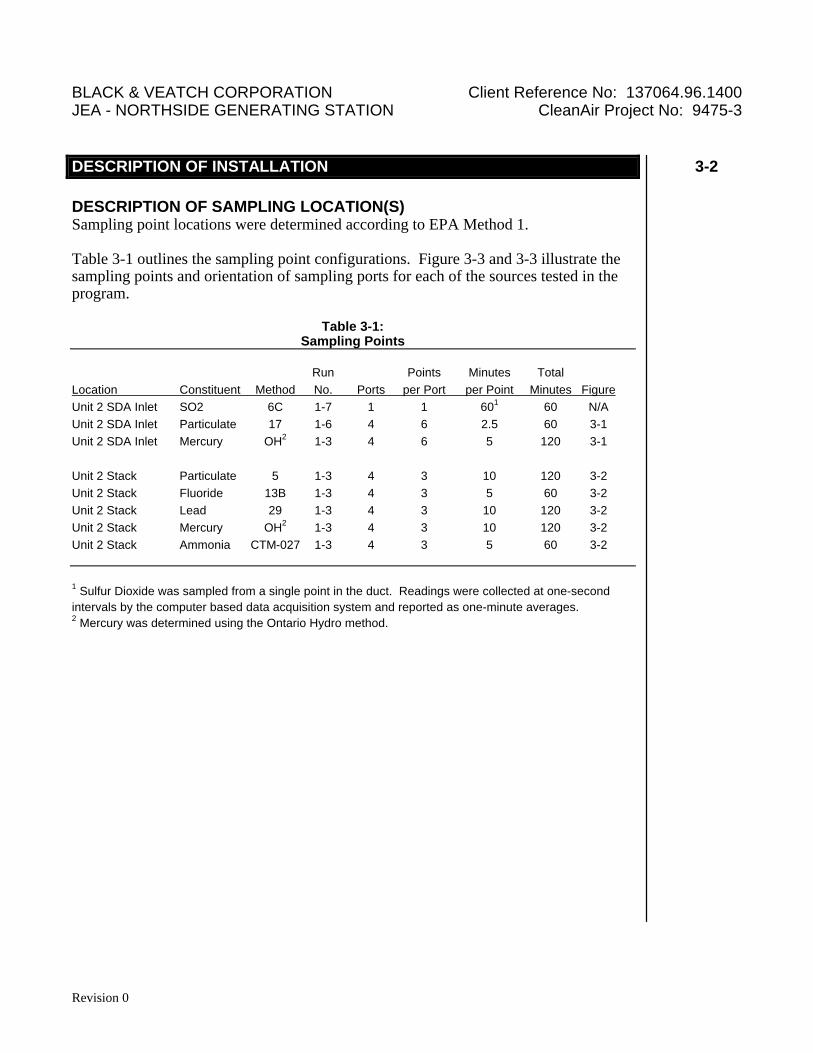
BLACK & VEATCH CORPORATION Client Reference No: 137064.96.1400 JEA - NORTHSIDE GENERATING STATION CleanAir Project No: 9475-3 DESCRIPTION OF INSTALLATION 3-2
Revision 0
DESCRIPTION OF SAMPLING LOCATION(S) Sampling point locations were determined according to EPA Method 1. Table 3-1 outlines the sampling point configurations. Figure 3-3 and 3-3 illustrate the sampling points and orientation of sampling ports for each of the sources tested in the program.
Table 3-1: Sampling Points
Run Points Minutes Total Location Constituent Method No. Ports per Port per Point Minutes Figure Unit 2 SDA Inlet SO2 6C 1-7 1 1 601 60 N/A Unit 2 SDA Inlet Particulate 17 1-6 4 6 2.5 60 3-1 Unit 2 SDA Inlet Mercury OH2 1-3 4 6 5 120 3-1 Unit 2 Stack Particulate 5 1-3 4 3 10 120 3-2 Unit 2 Stack Fluoride 13B 1-3 4 3 5 60 3-2 Unit 2 Stack Lead 29 1-3 4 3 10 120 3-2 Unit 2 Stack Mercury OH2 1-3 4 3 10 120 3-2 Unit 2 Stack Ammonia CTM-027 1-3 4 3 5 60 3-2 1 Sulfur Dioxide was sampled from a single point in the duct. Readings were collected at one-second intervals by the computer based data acquisition system and reported as one-minute averages. 2 Mercury was determined using the Ontario Hydro method.

BLACK & VEATCH CORPORATION Client Reference No: 137064.96.1400 JEA - NORTHSIDE GENERATING STATION CleanAir Project No: 9475-3 DESCRIPTION OF INSTALLATION 3-3
Revision 0
DESCRIPTION OF SAMPLING LOCATION (CONTINUED)
Sampling Point Port to Point Distance (in.) 1 76.9 2 54.0 3 38.2 4 25.5 5 14.5 6 4.5 Diameters to upstream disturbance: >2.0 Limit: 2.0 (minimum) Diameters to downstream disturbance: >0.5 Limit: 0.5 (minimum)
Figure 3-2: SDA Inlet Sampling Point Determination (EPA Method 1)

BLACK & VEATCH CORPORATION Client Reference No: 137064.96.1400 JEA - NORTHSIDE GENERATING STATION CleanAir Project No: 9475-3 DESCRIPTION OF INSTALLATION 3-4
Revision 0
DESCRIPTION OF SAMPLING LOCATION (CONTINUED)
Sampling Point Port to Point Distance (in.) 1 53.3 2 26.3 3 7.9 Diameters to upstream disturbance: >8.0 Limit: 2.0 (minimum) Diameters to downstream disturbance: >2.0 Limit: 0.5 (minimum)
Figure 3-3: Stack Sampling Point Determination (EPA Method 1)
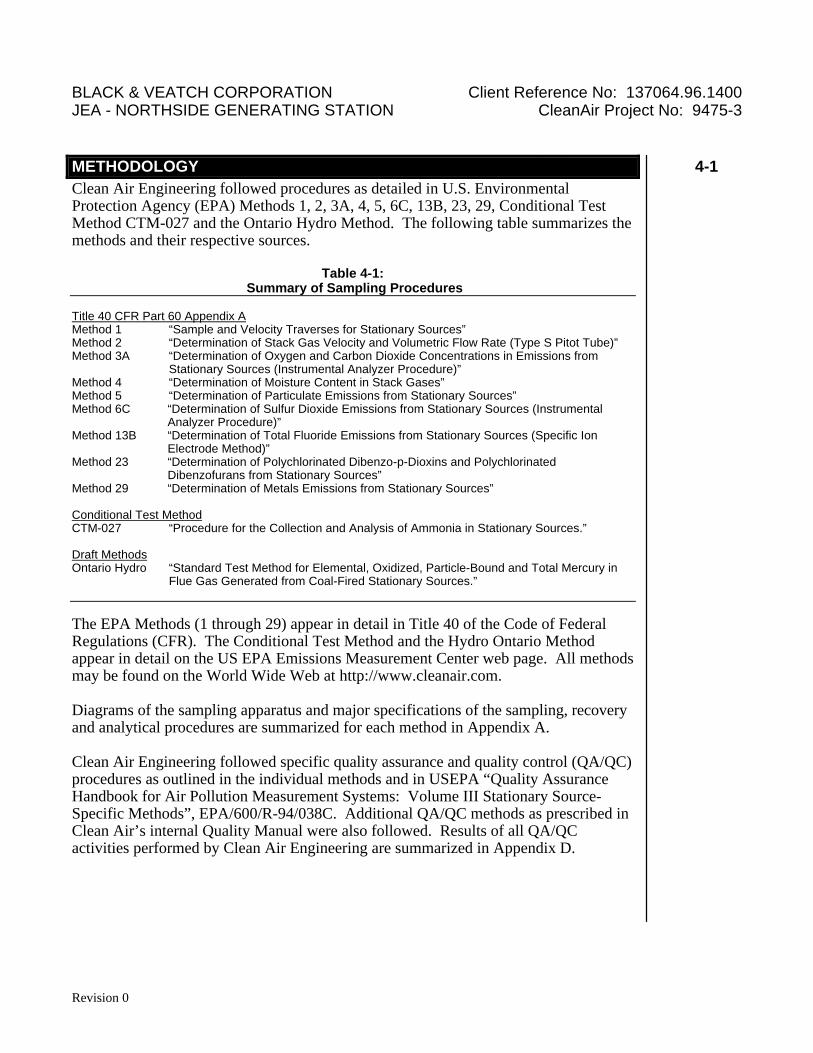
BLACK & VEATCH CORPORATION Client Reference No: 137064.96.1400 JEA - NORTHSIDE GENERATING STATION CleanAir Project No: 9475-3 METHODOLOGY 4-1
Revision 0
Clean Air Engineering followed procedures as detailed in U.S. Environmental Protection Agency (EPA) Methods 1, 2, 3A, 4, 5, 6C, 13B, 23, 29, Conditional Test Method CTM-027 and the Ontario Hydro Method. The following table summarizes the methods and their respective sources.
Table 4-1: Summary of Sampling Procedures
Title 40 CFR Part 60 Appendix A Method 1 “Sample and Velocity Traverses for Stationary Sources” Method 2 “Determination of Stack Gas Velocity and Volumetric Flow Rate (Type S Pitot Tube)” Method 3A “Determination of Oxygen and Carbon Dioxide Concentrations in Emissions from
Stationary Sources (Instrumental Analyzer Procedure)” Method 4 “Determination of Moisture Content in Stack Gases” Method 5 “Determination of Particulate Emissions from Stationary Sources” Method 6C “Determination of Sulfur Dioxide Emissions from Stationary Sources (Instrumental
Analyzer Procedure)” Method 13B “Determination of Total Fluoride Emissions from Stationary Sources (Specific Ion
Electrode Method)” Method 23 “Determination of Polychlorinated Dibenzo-p-Dioxins and Polychlorinated
Dibenzofurans from Stationary Sources” Method 29 “Determination of Metals Emissions from Stationary Sources” Conditional Test Method CTM-027 “Procedure for the Collection and Analysis of Ammonia in Stationary Sources.” Draft Methods Ontario Hydro “Standard Test Method for Elemental, Oxidized, Particle-Bound and Total Mercury in
Flue Gas Generated from Coal-Fired Stationary Sources.” The EPA Methods (1 through 29) appear in detail in Title 40 of the Code of Federal Regulations (CFR). The Conditional Test Method and the Hydro Ontario Method appear in detail on the US EPA Emissions Measurement Center web page. All methods may be found on the World Wide Web at http://www.cleanair.com. Diagrams of the sampling apparatus and major specifications of the sampling, recovery and analytical procedures are summarized for each method in Appendix A. Clean Air Engineering followed specific quality assurance and quality control (QA/QC) procedures as outlined in the individual methods and in USEPA “Quality Assurance Handbook for Air Pollution Measurement Systems: Volume III Stationary Source-Specific Methods”, EPA/600/R-94/038C. Additional QA/QC methods as prescribed in Clean Air’s internal Quality Manual were also followed. Results of all QA/QC activities performed by Clean Air Engineering are summarized in Appendix D.
4 Methodology
BLACK & VEATCH CORPORATION Client Reference No: 137064.96.1400 JEA - NORTHSIDE GENERATING STATION CleanAir Project No: 9475-3 APPENDIX
Revision 0
TEST METHOD SPECIFICATIONS.................................................................................... A SAMPLE CALCULATIONS.................................................................................................. B PARAMETERS .................................................................................................................... C QA/QC DATA....................................................................................................................... D FIELD DATA........................................................................................................................ E FIELD DATA PRINTOUTS.................................................................................................. F LABORATORY DATA..........................................................................................................G FACILITY OPERATING DATA ............................................................................................ H
5 Appendix
JEA Large-Scale CFB Combustion Demonstration Project
Fuel Capability Demonstration Test Report #3 - ATTACHMENTS Illinois 6 Coal Fuel
B&V Project 137064
ATTACHMENT D
PI Data Summary
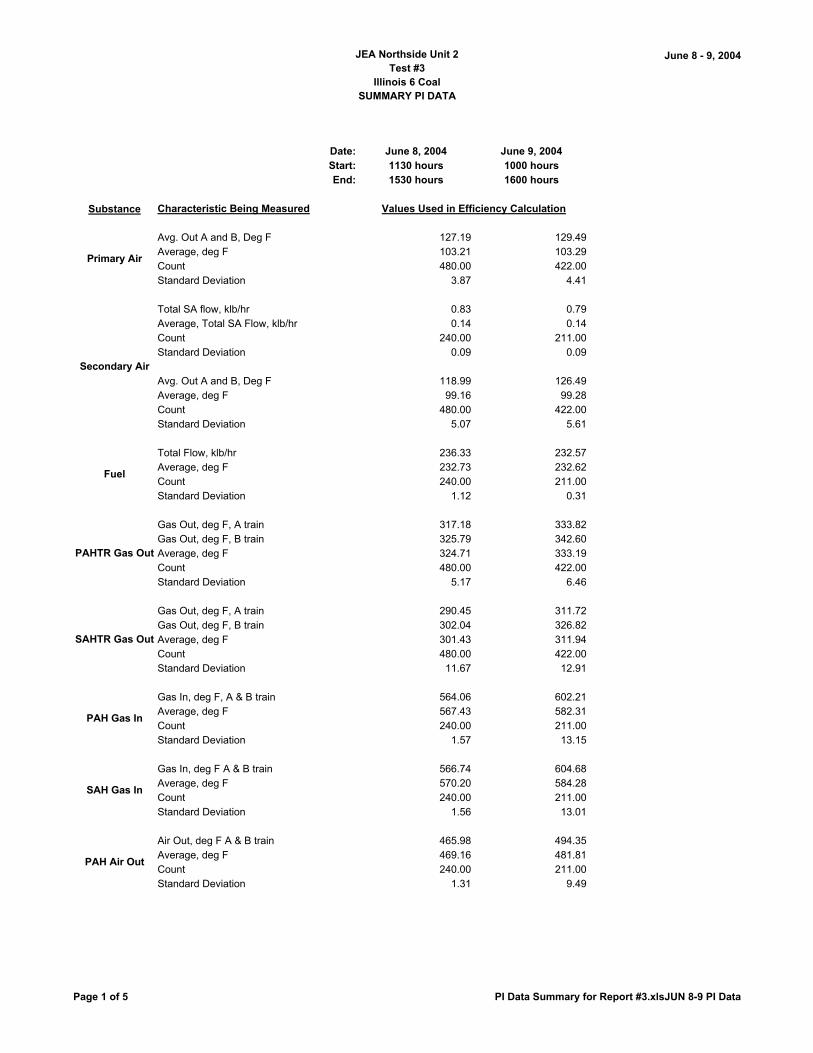
JEA Northside Unit 2Test #3
Illinois 6 CoalSUMMARY PI DATA
June 8 - 9, 2004
Date: June 8, 2004 June 9, 2004Start: 1130 hours 1000 hoursEnd: 1530 hours 1600 hours
Substance Characteristic Being Measured
Avg. Out A and B, Deg F 127.19 129.49Average, deg F 103.21 103.29Count 480.00 422.00Standard Deviation 3.87 4.41
Total SA flow, klb/hr 0.83 0.79Average, Total SA Flow, klb/hr 0.14 0.14Count 240.00 211.00Standard Deviation 0.09 0.09
Avg. Out A and B, Deg F 118.99 126.49Average, deg F 99.16 99.28Count 480.00 422.00Standard Deviation 5.07 5.61
Total Flow, klb/hr 236.33 232.57Average, deg F 232.73 232.62Count 240.00 211.00Standard Deviation 1.12 0.31
Gas Out, deg F, A train 317.18 333.82Gas Out, deg F, B train 325.79 342.60Average, deg F 324.71 333.19Count 480.00 422.00Standard Deviation 5.17 6.46
Gas Out, deg F, A train 290.45 311.72Gas Out, deg F, B train 302.04 326.82Average, deg F 301.43 311.94Count 480.00 422.00Standard Deviation 11.67 12.91
Gas In, deg F, A & B train 564.06 602.21Average, deg F 567.43 582.31Count 240.00 211.00Standard Deviation 1.57 13.15
Gas In, deg F A & B train 566.74 604.68Average, deg F 570.20 584.28Count 240.00 211.00Standard Deviation 1.56 13.01
Air Out, deg F A & B train 465.98 494.35Average, deg F 469.16 481.81Count 240.00 211.00Standard Deviation 1.31 9.49
PAH Gas In
SAH Gas In
PAH Air Out
Values Used in Efficiency Calculation
Primary Air
Secondary Air
Fuel
PAHTR Gas Out
SAHTR Gas Out
Page 1 of 5 PI Data Summary for Report #3.xlsJUN 8-9 PI Data

JEA Northside Unit 2Test #3
Illinois 6 CoalSUMMARY PI DATA
June 8 - 9, 2004
Substance Characteristic Being Measured Values Used in Efficiency Calculation
Air Out, deg F A & B train 423.62 457.91Average, deg F 428.61 446.98Count 240.00 211.00Standard Deviation 3.73 8.47
Ash leaving temperature, deg F, A 270.70 318.54Ash leaving temperature, deg F, B 115.46 116.68Ash leaving temperature, deg F, C 129.20 463.75Ash leaving temperature, deg F, D 281.80 436.20Average, deg F 305.42 368.08Count 480.00 422.00Standard Deviation 12.82 88.02
Temperature, deg FAverage, deg F 158.46 181.67Count 240.00 211.00Standard Deviation 6.80 6.40
Feedrate, feeders 1, 2, 3, lb/hr 56,622.52 57,116.93Average, lb/hr 64,005.39 59,301.70Count 240.00 211.00Standard Deviation 7.45 5.76
AH inlet, ppmAverage, ppm mv 41.09 30.65Count 240.00 211.00Standard Deviation 24.86 19.49
Flow to A, B, C, lb/hr 44,334.18 44,204.36Average, lb/hr 43,360.97 44,624.64Count 1,440.00 1,266.00Standard Deviation 373.51 193.54
PA Flow to Intrex A, B, C, lb/hr 36,792.76 36,972.43Average, lb/hr 36,539.68 37,620.46Count 240.00 211.00Standard Deviation 280.55 336.88
Average, deg F 181.91 182.58Count 240.00 211.00Standard Deviation 4.15 1.81
Average, deg F 200.11 201.76Count 240.00 211.00Standard Deviation 2.87 1.95
Average, deg F 484.13 484.77Count 240.00 211.00Standard Deviation 0.65 0.97
Average, psig 1,950.46 1,950.48Count 240.00 211.00Standard Deviation 9.29 7.66
Feedwater Temperature to
Econ
Feedwater Pressure to
Econ
Intrex Blower Air Flow
Intrex Seal Pot Blower
Intrex Blower Exit Air Temp
Seal Pot Blower Exit Air Temp
Stripper/ Coolers - A, B,
C, D
SDA Hopper
Limestone Feed Rate 1
SO2, in flue Gas
SA Airheater Air Out
Page 2 of 5 PI Data Summary for Report #3.xlsJUN 8-9 PI Data
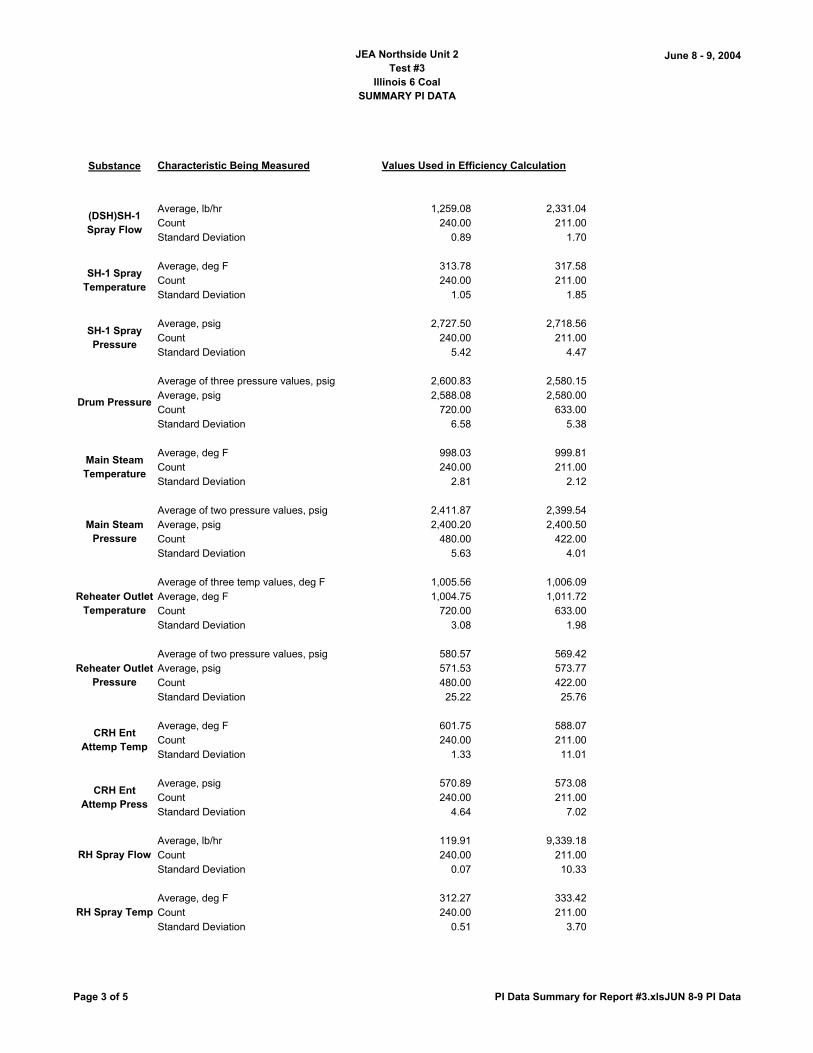
JEA Northside Unit 2Test #3
Illinois 6 CoalSUMMARY PI DATA
June 8 - 9, 2004
Substance Characteristic Being Measured Values Used in Efficiency Calculation
Average, lb/hr 1,259.08 2,331.04Count 240.00 211.00Standard Deviation 0.89 1.70
Average, deg F 313.78 317.58Count 240.00 211.00Standard Deviation 1.05 1.85
Average, psig 2,727.50 2,718.56Count 240.00 211.00Standard Deviation 5.42 4.47
Average of three pressure values, psig 2,600.83 2,580.15Average, psig 2,588.08 2,580.00Count 720.00 633.00Standard Deviation 6.58 5.38
Average, deg F 998.03 999.81Count 240.00 211.00Standard Deviation 2.81 2.12
Average of two pressure values, psig 2,411.87 2,399.54Average, psig 2,400.20 2,400.50Count 480.00 422.00Standard Deviation 5.63 4.01
Average of three temp values, deg F 1,005.56 1,006.09Average, deg F 1,004.75 1,011.72Count 720.00 633.00Standard Deviation 3.08 1.98
Average of two pressure values, psig 580.57 569.42Average, psig 571.53 573.77Count 480.00 422.00Standard Deviation 25.22 25.76
Average, deg F 601.75 588.07Count 240.00 211.00Standard Deviation 1.33 11.01
Average, psig 570.89 573.08Count 240.00 211.00Standard Deviation 4.64 7.02
Average, lb/hr 119.91 9,339.18Count 240.00 211.00Standard Deviation 0.07 10.33
Average, deg F 312.27 333.42Count 240.00 211.00Standard Deviation 0.51 3.70
RH Spray Flow
RH Spray Temp
Reheater Outlet Temperature
Reheater Outlet Pressure
CRH Ent Attemp Temp
CRH Ent Attemp Press
SH-1 Spray Pressure
Drum Pressure
Main Steam Temperature
Main Steam Pressure
(DSH)SH-1 Spray Flow
SH-1 Spray Temperature
Page 3 of 5 PI Data Summary for Report #3.xlsJUN 8-9 PI Data
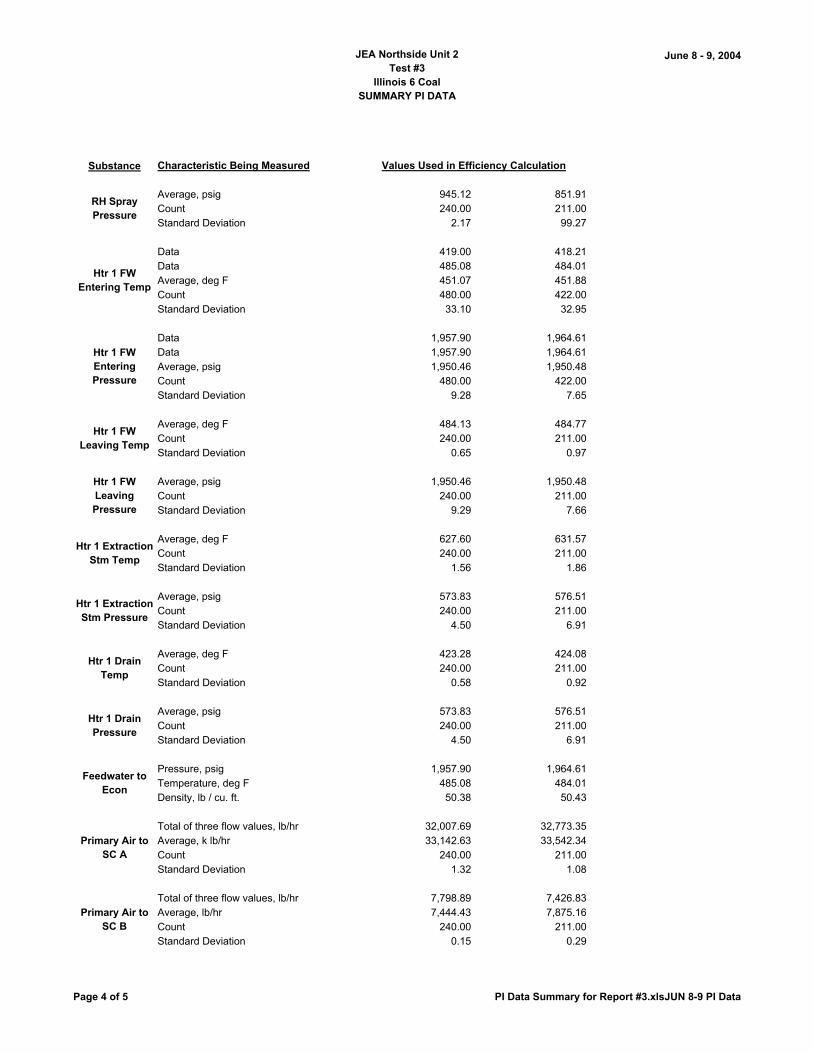
JEA Northside Unit 2Test #3
Illinois 6 CoalSUMMARY PI DATA
June 8 - 9, 2004
Substance Characteristic Being Measured Values Used in Efficiency Calculation
Average, psig 945.12 851.91Count 240.00 211.00Standard Deviation 2.17 99.27
Data 419.00 418.21Data 485.08 484.01Average, deg F 451.07 451.88Count 480.00 422.00Standard Deviation 33.10 32.95
Data 1,957.90 1,964.61Data 1,957.90 1,964.61Average, psig 1,950.46 1,950.48Count 480.00 422.00Standard Deviation 9.28 7.65
Average, deg F 484.13 484.77Count 240.00 211.00Standard Deviation 0.65 0.97
Average, psig 1,950.46 1,950.48Count 240.00 211.00Standard Deviation 9.29 7.66
Average, deg F 627.60 631.57Count 240.00 211.00Standard Deviation 1.56 1.86
Average, psig 573.83 576.51Count 240.00 211.00Standard Deviation 4.50 6.91
Average, deg F 423.28 424.08Count 240.00 211.00Standard Deviation 0.58 0.92
Average, psig 573.83 576.51Count 240.00 211.00Standard Deviation 4.50 6.91
Pressure, psig 1,957.90 1,964.61Temperature, deg F 485.08 484.01Density, lb / cu. ft. 50.38 50.43
Total of three flow values, lb/hr 32,007.69 32,773.35Average, k lb/hr 33,142.63 33,542.34Count 240.00 211.00Standard Deviation 1.32 1.08
Total of three flow values, lb/hr 7,798.89 7,426.83Average, lb/hr 7,444.43 7,875.16Count 240.00 211.00Standard Deviation 0.15 0.29
Htr 1 Extraction Stm Pressure
Htr 1 Drain Temp
Htr 1 Drain Pressure
Feedwater to Econ
Primary Air to SC A
Primary Air to SC B
Htr 1 FW Entering Pressure
Htr 1 FW Leaving Temp
Htr 1 FW Leaving Pressure
Htr 1 Extraction Stm Temp
RH Spray Pressure
Htr 1 FW Entering Temp
Page 4 of 5 PI Data Summary for Report #3.xlsJUN 8-9 PI Data
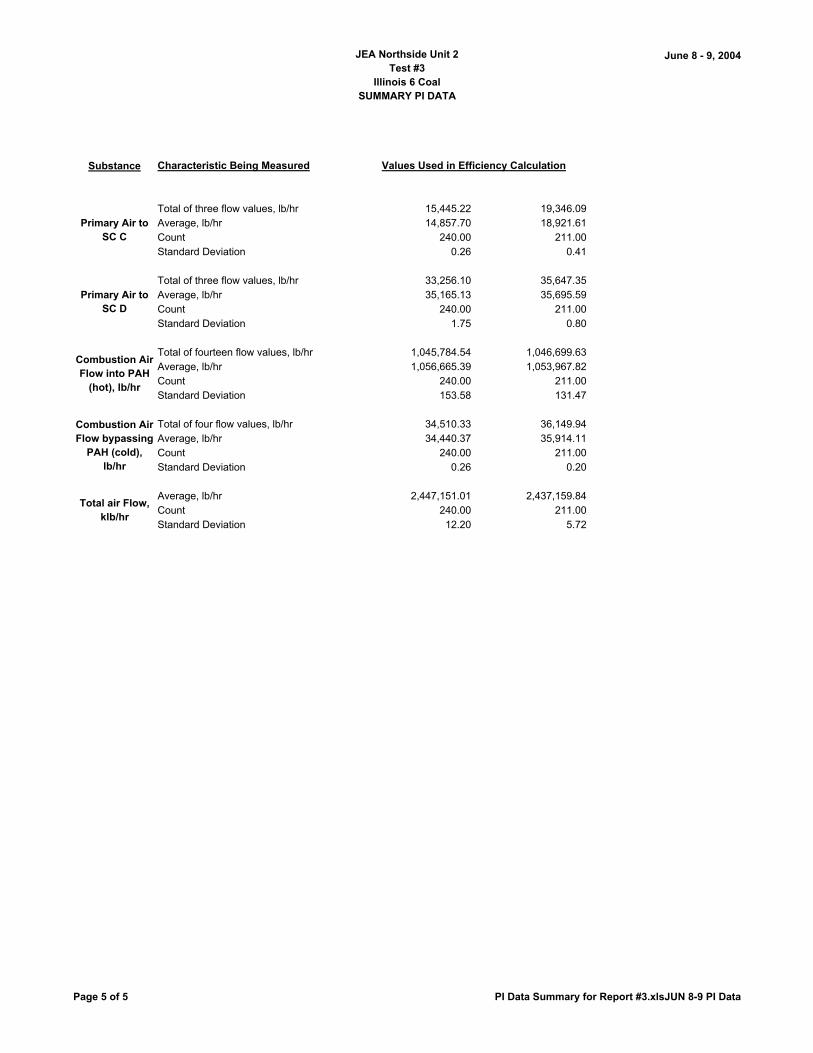
JEA Northside Unit 2Test #3
Illinois 6 CoalSUMMARY PI DATA
June 8 - 9, 2004
Substance Characteristic Being Measured Values Used in Efficiency Calculation
Total of three flow values, lb/hr 15,445.22 19,346.09Average, lb/hr 14,857.70 18,921.61Count 240.00 211.00Standard Deviation 0.26 0.41
Total of three flow values, lb/hr 33,256.10 35,647.35Average, lb/hr 35,165.13 35,695.59Count 240.00 211.00Standard Deviation 1.75 0.80
Total of fourteen flow values, lb/hr 1,045,784.54 1,046,699.63Average, lb/hr 1,056,665.39 1,053,967.82Count 240.00 211.00Standard Deviation 153.58 131.47
Total of four flow values, lb/hr 34,510.33 36,149.94Average, lb/hr 34,440.37 35,914.11Count 240.00 211.00Standard Deviation 0.26 0.20
Average, lb/hr 2,447,151.01 2,437,159.84Count 240.00 211.00Standard Deviation 12.20 5.72
Primary Air to SC C
Combustion Air Flow bypassing
PAH (cold), lb/hr
Total air Flow, klb/hr
Combustion Air Flow into PAH
(hot), lb/hr
Primary Air to SC D
Page 5 of 5 PI Data Summary for Report #3.xlsJUN 8-9 PI Data

JEA Large-Scale CFB Combustion Demonstration Project
Fuel Capability Demonstration Test Report #3 - ATTACHMENTS Illinois 6 Coal Fuel
B&V Project 137064
ATTACHMENT E
Abbreviation List - Refer to Section 1.2

JEA Large-Scale CFB Combustion Demonstration Project
Fuel Capability Demonstration Test Report #3 - ATTACHMENTS Illinois 6 Coal Fuel
B&V Project 137064
ATTACHMENT F
Isolation Valve List


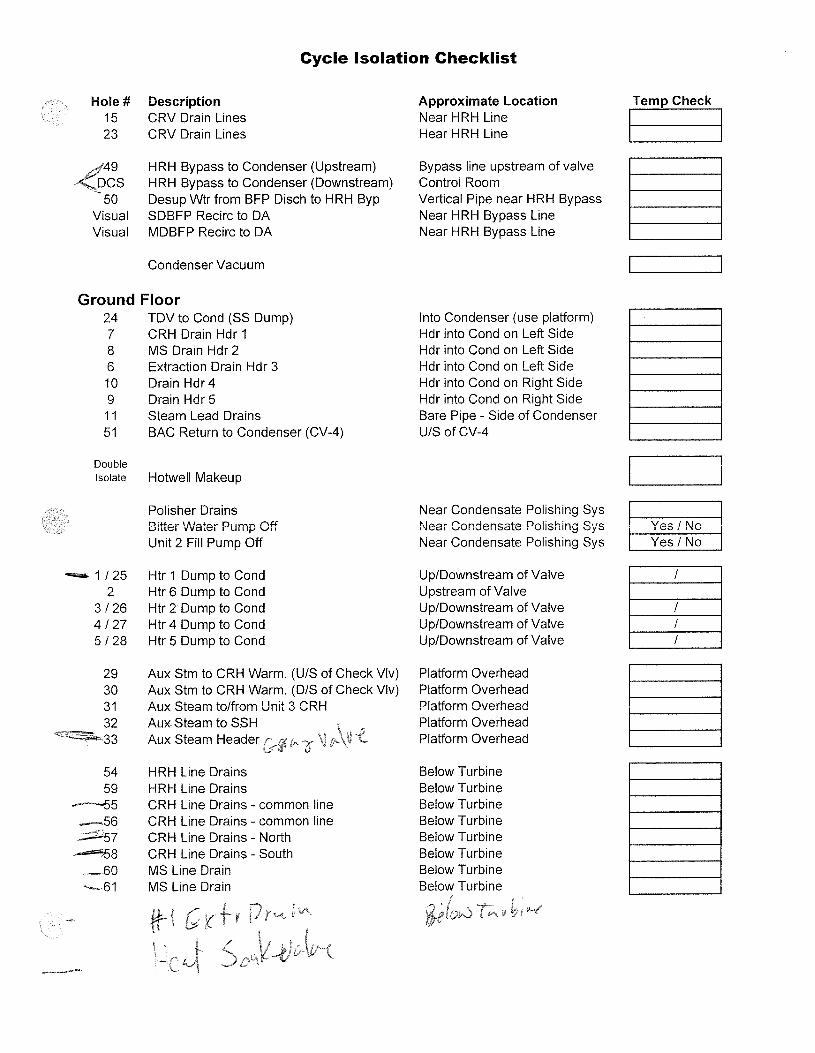
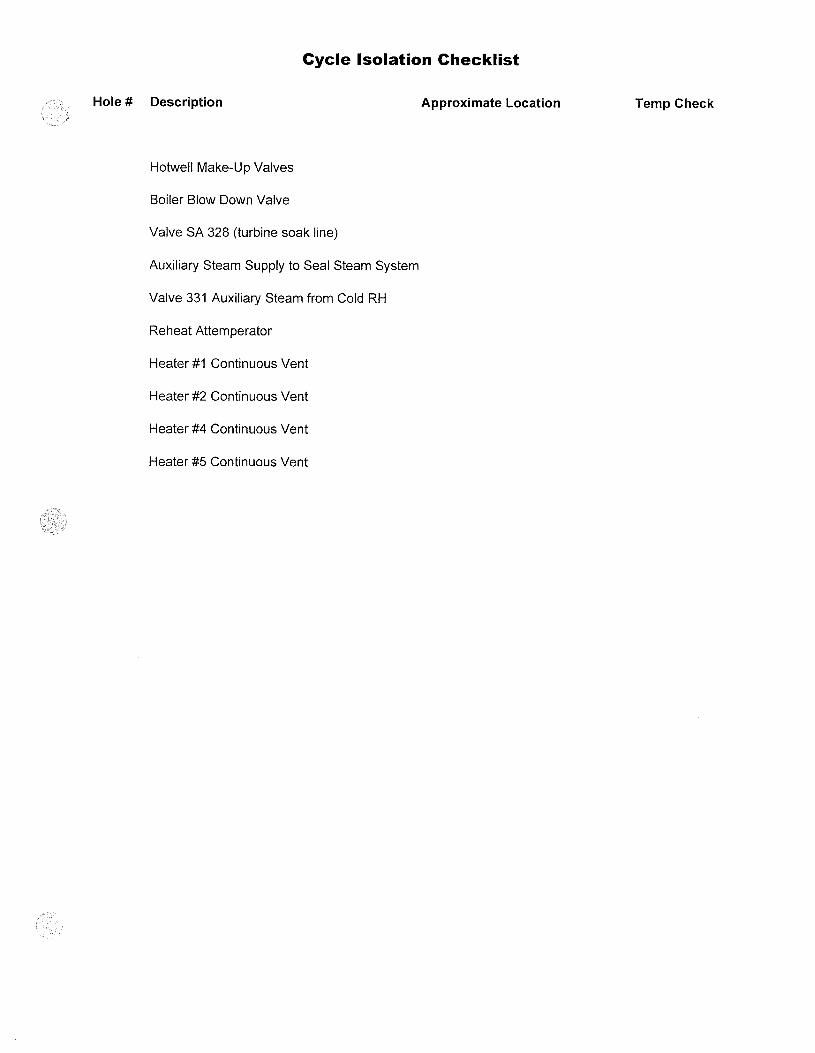
JEA Large-Scale CFB Combustion Demonstration Project
Fuel Capability Demonstration Test Report #3 - ATTACHMENTS Illinois 6 Coal Fuel
B&V Project 137064
ATTACHMENT G
Fuel Analyses - Illinois 6 Coal

JEA Northside Unit 2Test #3
Illinois 6 CoalSUMMARY - FUEL ANALYSES
June 8 - 9, 2004
Lab Number 71-237672 71-237673Date 8-Jun-04 9-Jun-04 Average CountTime 4 hours 4 hours
Proximate AnalysisMoisture, wt% 12.10 12.19 12.15 2 0.06Ash, wt% 7.08 6.59 6.84 2 0.35Volatile, wt% 34.77 34.61 34.69 2 0.11Fixed Carbon, wt% 46.05 46.61 46.33 2 0.40
Ultimate AnalysisCarbon, wt% 64.93 64.70 64.82 2 0.16Hydrogen, wt% 4.31 4.57 4.44 2 0.18Nitrogen, wt% 1.27 1.26 1.27 2 0.01Sulfur, wt% 3.17 3.32 3.25 2 0.11Moisture, wt% 12.10 12.19 12.15 2 0.06Ash, wt% 7.08 6.59 6.84 2 0.35Oxygen, wt% 7.14 7.37 7.26 2 0.16
Higher Heating, Btu/lb 11,649 11,664 11656.50 2 10.61
Total Chlorine, wt% 0.15 0.15 0.15 2 0.00Total Fluorine, wt% 67.00 62.00 64.50 2 3.54
Total Mercury, ug/g 0.050 0.040 0.05 2 0.01Total Lead, ug/g 12.000 12.000 12.00 2 0.00
Moisture (oven), wt% 12.10 12.19 12.15 2 0.06
Mineral analysisSiO2, wt% 46.61 46.12 46.37 2 0.35Al2O3, wt% 19.47 19.03 19.25 2 0.31Ti2O, wt% 1.10 1.06 1.08 2 0.03Fe2O3, wt% 23.22 23.05 23.14 2 0.12CaO, wt% 2.63 2.84 2.74 2 0.15MgO, wt% 0.79 0.74 0.77 2 0.04K2O, wt% 2.31 2.16 2.24 2 0.11Na2O, wt% 0.70 0.68 0.69 2 0.01SO3, wt% 2.23 3.10 2.67 2 0.62P2O5, wt% 0.16 0.16 0.16 2 0.00SrO, wt% 0.03 0.03 0.03 2 0.00BaO, wt% 0.03 0.04 0.04 2 0.01Mn3O4, wt% 0.04 0.04 0.04 2 0.00Undetermined, wt% 0.68 0.95 0.82 2 0.19
Particulate size distributionParticulate Left Mesh, 1/2", wt% 14.97 14.53 14.75 2 0.31Particulate Left Mesh, 1/4", wt% 33.41 33.29 33.35 2 0.08Particulate Left Mesh, #4, wt% 37.48 37.29 37.39 2 0.13Particulate Left Mesh, #8, wt% 55.21 55.49 55.35 2 0.20Particulate Left Mesh, #14, wt% 71.47 71.85 71.66 2 0.27Particulate Left Mesh, #28, wt% 82.16 83.87 83.02 2 1.21Particulate Left Mesh, #50, wt% 87.37 88.13 87.75 2 0.54Particulate Left Mesh, #100, wt% 92.51 93.06 92.79 2 0.39Bottom, wt% 7.49 6.94 7.22 2 0.39
Std Deviation
Test #3Fuel June 8 - 9, 2004
Page 1 of 1 JUN 8-9 Fuel Analysis.xlsJUNE 8-9 Fuel

JEA Large-Scale CFB Combustion Demonstration Project
Fuel Capability Demonstration Test Report #3 - ATTACHMENTS Illinois 6 Coal Fuel
B&V Project 137064
ATTACHMENT H
Limestone Analyses
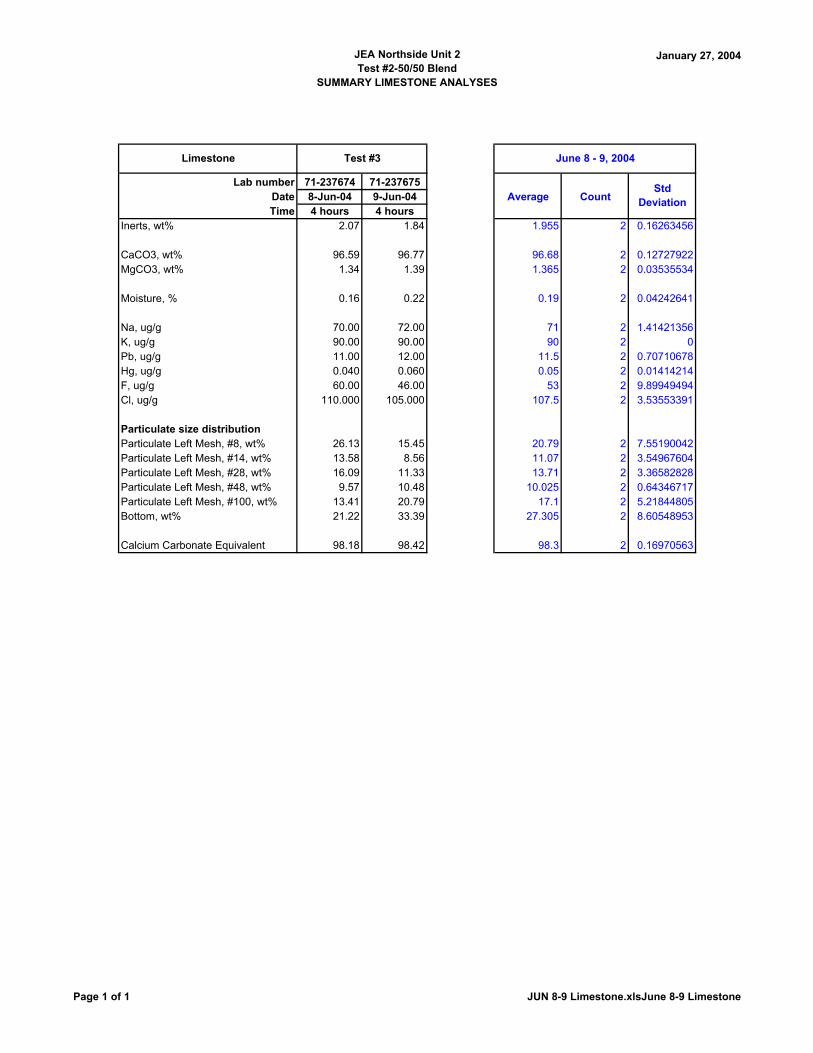
JEA Northside Unit 2Test #2-50/50 Blend
SUMMARY LIMESTONE ANALYSES
January 27, 2004
Lab number 71-237674 71-237675Date 8-Jun-04 9-Jun-04 Average CountTime 4 hours 4 hours
Inerts, wt% 2.07 1.84 1.955 2 0.16263456
CaCO3, wt% 96.59 96.77 96.68 2 0.12727922MgCO3, wt% 1.34 1.39 1.365 2 0.03535534
Moisture, % 0.16 0.22 0.19 2 0.04242641
Na, ug/g 70.00 72.00 71 2 1.41421356K, ug/g 90.00 90.00 90 2 0Pb, ug/g 11.00 12.00 11.5 2 0.70710678Hg, ug/g 0.040 0.060 0.05 2 0.01414214F, ug/g 60.00 46.00 53 2 9.89949494Cl, ug/g 110.000 105.000 107.5 2 3.53553391
Particulate size distributionParticulate Left Mesh, #8, wt% 26.13 15.45 20.79 2 7.55190042Particulate Left Mesh, #14, wt% 13.58 8.56 11.07 2 3.54967604Particulate Left Mesh, #28, wt% 16.09 11.33 13.71 2 3.36582828Particulate Left Mesh, #48, wt% 9.57 10.48 10.025 2 0.64346717Particulate Left Mesh, #100, wt% 13.41 20.79 17.1 2 5.21844805Bottom, wt% 21.22 33.39 27.305 2 8.60548953
Calcium Carbonate Equivalent 98.18 98.42 98.3 2 0.16970563
Limestone
Std Deviation
June 8 - 9, 2004Test #3
Page 1 of 1 JUN 8-9 Limestone.xlsJune 8-9 Limestone

JEA Large-Scale CFB Combustion Demonstration Project
Fuel Capability Demonstration Test Report #3 - ATTACHMENTS Illinois 6 Coal Fuel
B&V Project 137064
ATTACHMENT I
Bed Ash Analyses

JEA Northside Unit 2Test #3
Illinois 6 CoalSUMMARY - BED ASH ANALYSES
June 8 - 9, 2004
Lab Number 71-237680 71-237681
Date 8-Jun-04 9-Jun-04 Average Count
Time 4 hours 4 hours
Unburned carbon, wt% 1.26 1.42 1.34 2 0.1131
Organic carbon, wt% 0.65 1.05 0.85 2 0.2828
Loss on Ignition @ 950 deg F 5.11 3.66 4.39 2 1.0253
CaSO4, %wt 43.69 47.58 45.64 2 2.7506
Sulfur, wt% 10.40 11.32 10.86 2 0.6505
Mineral analysis
SiO2, wt% 3.14 3.89 3.52 2 0.5303
SO3, wt% 25.98 28.28 27.13 2 1.6263
Fe2O3, wt% 0.97 1.40 1.19 2 0.3041
CaO, wt% 59.43 58.92 59.18 2 0.3606
MgO, wt% 0.86 0.81 0.84 2 0.0354
Na2O, wt% 0.01 0.02 0.02 2 0.0071
K2O, wt% 0.05 0.04 0.05 2 0.0071
Al2O3, %wt 1.83 1.90 1.87 2 0.0495
TiO2, %wt 0.13 0.16 0.15 2 0.0212
P2O5, %wt 0.05 0.02 0.04 2 0.0212
SrO, %wt 0.10 0.09 0.10 2 0.0071
BaO, %wt 0.01 0.01 0.01 2 0.0000
Mn3O2, %wt 0.01 0.01 0.01 2 0.0000
Undetermined, %wt 7.43 4.45 5.94 2 2.1072
Particulate size distribution
Particulate Left Mesh, 1/2", wt% 0.00 0.00 0.00 2 0.0000
Particulate Left Mesh, 1/4", wt% 0.42 0.00 0.21 2 0.2970
Particulate Left Mesh, #4, wt% 0.26 0.98 0.62 2 0.5091
Particulate Left Mesh, #8, wt% 4.34 4.53 4.44 2 0.1344
Particulate Left Mesh, #14, wt% 8.54 9.41 8.98 2 0.6152
Particulate Left Mesh, #28, wt% 20.85 15.61 18.23 2 3.7052
Particulate Left Mesh, #48, wt% 20.37 25.88 23.13 2 3.8962
Particulate Left Mesh, #100, wt% 25.02 24.04 24.53 2 0.6930
Bottom, wt% 20.20 19.55 19.88 2 0.4596
Bed Ash June 8 - 9, 2004
Std Deviation
Test #3
Page 1 of 1 JUN 8-9 Bed Ash.xlsJune 8-9 Bed Ash

JEA Large-Scale CFB Combustion Demonstration Project
Fuel Capability Demonstration Test Report #3 - ATTACHMENTS Illinois 6 Coal Fuel
B&V Project 137064
ATTACHMENT J
Fly Ash (Air Heater and PJFF) Analyses

JEA Northside Unit 2Test #3
Illinois 6 CoalSUMMARY - FLY ASH ANALYSES
June 8 - 9, 2004
Average Count Std Deviation Average Count Std Deviation
Unburned carbon, wt% 3.88 2 1.9940 6.79 2 0.6788Organic carbon, wt% 2.94 2 1.3435 5.46 2 1.1031
LOI @ 1742 °F (950 °C) 6.81 2 4.6386 11.92 2 0.5445
CaSO4, wt% 43.20 2 5.4377 25.53 2 1.2233
Sulfur, wt% 10.28 2 1.3081 6.08 2 0.3677
Ash analysisSiO2, wt% 8.40 2 0.7354 14.37 2 0.0636Al2O3, wt% 3.46 2 0.3111 6.02 2 0.0778TiO2, wt% 0.18 2 0.0000 0.29 2 0.0071Fe2O3, wt% 6.25 2 0.5303 5.68 2 0.7142CaO, wt% 47.63 2 2.5244 43.55 2 0.2758MgO, wt% 0.70 2 0.0354 0.67 2 0.0000K2O, wt% 0.24 2 0.0424 0.76 2 0.0212Na2O, wt% 0.02 2 0.0000 0.19 2 0.0071SO2, wt% 25.69 2 3.2668 15.19 2 0.9192P2O5, wt% 0.03 2 0.0000 0.03 2 0.0000SrO, wt% 0.07 2 0.0000 0.07 2 0.0071BaO, wt% 0.03 2 0.0212 0.01 2 0.0000Mn3O4, wt% 0.02 2 0.0000 0.01 2 0.0000Undetermined 7.30 2 4.2285 13.20 2 0.0990
Particulate size distributionParticulate Left Mesh, #4, wt% 0.00 2 0.0000 0.00 2 0.0000Particulate Left Mesh, #14, wt% 0.03 2 0.0354 0.00 2 0.0000Particulate Left Mesh, #28, wt% 0.07 2 0.0990 0.00 2 0.0000Particulate Left Mesh, #48, wt% 0.12 2 0.0283 0.00 2 0.0000Particulate Left Mesh, #100, wt% 0.17 2 0.0990 0.36 2 0.0707Bottom, wt% 99.62 2 0.2616 99.64 2 0.0707
Fly Ash
June 8 - 9, 2004Air Heater
June 8 - 9, 2004Air Heater (Iso Kinetic)
Page 1 of 2 JUN 8-9 Fly Ash.xlsSummary
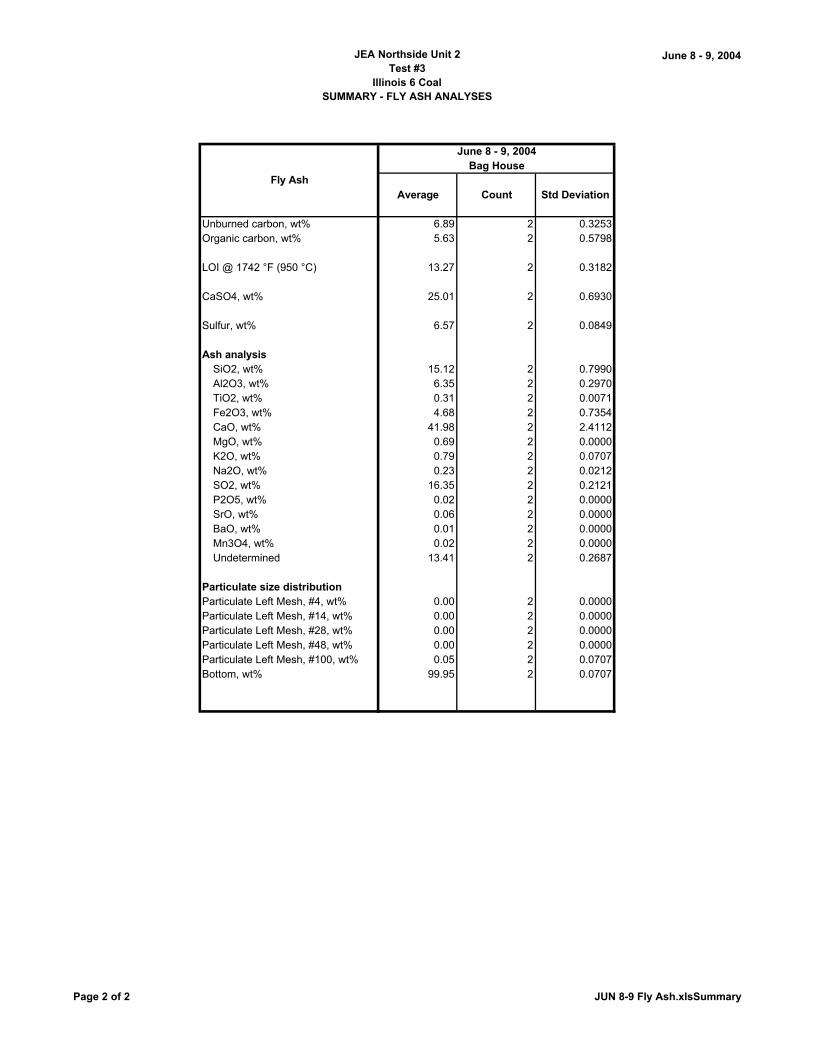
JEA Northside Unit 2Test #3
Illinois 6 CoalSUMMARY - FLY ASH ANALYSES
June 8 - 9, 2004
Unburned carbon, wt%Organic carbon, wt%
LOI @ 1742 °F (950 °C)
CaSO4, wt%
Sulfur, wt%
Ash analysisSiO2, wt%Al2O3, wt%TiO2, wt%Fe2O3, wt%CaO, wt%MgO, wt%K2O, wt%Na2O, wt%SO2, wt%P2O5, wt%SrO, wt%BaO, wt%Mn3O4, wt%Undetermined
Particulate size distributionParticulate Left Mesh, #4, wt%Particulate Left Mesh, #14, wt%Particulate Left Mesh, #28, wt%Particulate Left Mesh, #48, wt%Particulate Left Mesh, #100, wt%Bottom, wt%
Fly AshAverage Count Std Deviation
6.89 2 0.32535.63 2 0.5798
13.27 2 0.3182
25.01 2 0.6930
6.57 2 0.0849
15.12 2 0.79906.35 2 0.29700.31 2 0.00714.68 2 0.7354
41.98 2 2.41120.69 2 0.00000.79 2 0.07070.23 2 0.0212
16.35 2 0.21210.02 2 0.00000.06 2 0.00000.01 2 0.00000.02 2 0.0000
13.41 2 0.2687
0.00 2 0.00000.00 2 0.00000.00 2 0.00000.00 2 0.00000.05 2 0.0707
99.95 2 0.0707
June 8 - 9, 2004Bag House
Page 2 of 2 JUN 8-9 Fly Ash.xlsSummary

JEA Large-Scale CFB Combustion Demonstration Project
Fuel Capability Demonstration Test Report #3 - ATTACHMENTS Illinois 6 Coal Fuel
B&V Project 137064
ATTACHMENT K
Ambient Data, June 8, 2004 & June 9, 2004
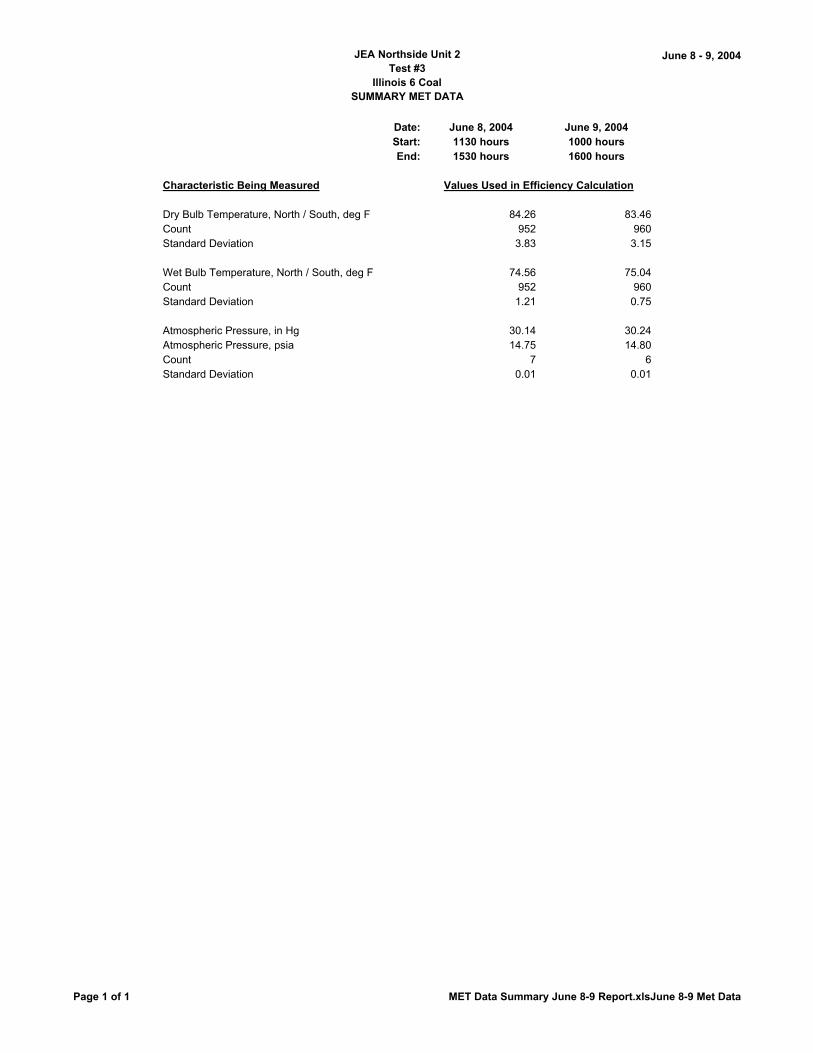
JEA Northside Unit 2Test #3
Illinois 6 CoalSUMMARY MET DATA
June 8 - 9, 2004
Date: June 8, 2004 June 9, 2004Start: 1130 hours 1000 hoursEnd: 1530 hours 1600 hours
Characteristic Being Measured
Dry Bulb Temperature, North / South, deg F 84.26 83.46Count 952 960Standard Deviation 3.83 3.15
Wet Bulb Temperature, North / South, deg F 74.56 75.04Count 952 960Standard Deviation 1.21 0.75
Atmospheric Pressure, in Hg 30.14 30.24Atmospheric Pressure, psia 14.75 14.80Count 7 6Standard Deviation 0.01 0.01
Values Used in Efficiency Calculation
Page 1 of 1 MET Data Summary June 8-9 Report.xlsJune 8-9 Met Data
JEA Large-Scale CFB Combustion Demonstration Project
Fuel Capability Demonstration Test Report #3 - ATTACHMENTS Illinois 6 Coal Fuel
B&V Project 137064
ATTACHMENT L
Partial Loads Ambient Data, June 8, 2004, & June 9, 2004

JEA Northside Unit 2Test #3
Illinois 6 CoalSUMMARY - MET DATA, JUNE 8, 9, 2004
June 8 - 9, 2004
Date Time (hrs)Temperature, deg
F (dry bulb)
Temperature, deg F (wet bulb) Calculated
Dew Point, deg F
Relative Humidity, %
Pressure, in Hg
Pressure, psiA
RH calc to determine wet
bulb
9-Jun-04 1956 78.1 76.80 75.9 93 30.06 14.71 93
9-Jun-04 2056 77.0 76.00 75.0 94 30.08 14.72 94
9-Jun-04 2156 77 76.00 75.0 94 30.10 14.73 94
9-Jun-04 2256 75.0 74.30 73.9 96 30.11 14.74 96
9-Jun-04 2356 75.9 74.80 73.9 94 30.10 14.73 94
8-Jun-04 0056 72.0 71.50 71.1 97 30.14 14.75 97
8-Jun-04 0156 72.0 72.00 72.0 100 30.12 14.74 100
8-Jun-04 0256 71.1 71.10 71.1 100 30.11 14.74 100
8-Jun-04 0356 70.0 69.50 69.1 97 30.11 14.74 97
8-Jun-04 0456 70.0 69.50 69.1 97 30.12 14.74 97
9-Jun-04 0056 75.9 74.30 73.0 91 30.17 14.76 91
9-Jun-04 0156 75.0 74.00 73.0 94 30.16 14.76 94
9-Jun-04 0256 75.9 74.40 73.0 91 30.13 14.74 91
9-Jun-04 0356 73.9 73.40 73.0 97 30.11 14.74 97
9-Jun-04 0456 75.0 74.00 73.0 94 30.11 14.74 94
JUNE 9, 2004 (80% LOAD TEST)
JUNE 8, 2004 (60% LOAD TEST)
JUNE 9, 2004 (40% LOAD TEST)
Page 1 of 1 Test #3 Partial Loads MET Data.xlsJune 8, 9, 2004 Summary

JEA Large-Scale CFB Combustion Demonstration Project
Fuel Capability Demonstration Test Report #3 - FIGURES Illinois 6 Coal Fuel
B&V Project 137064
FIGURES
FIGURE 1 - GENERAL ARRANGEMENT PLAN, DRAWING NO. 3847-1-100, REV. 3
FIGURE 2 - GENERAL ARRANGEMENT ELEVATION, DRAWING NO. 3847-1-101, REV. 3
FIGURE 3 - FABRIC FILTER EAST END ELEVATION, DRAWING NO. 3847-9-268, REV. 2
FIGURE 4 - GENERAL ARRANGEMENT UNIT 2 ISO VIEW (RIGHT SIDE), DRAWING NO. 43-7587-5-53
FIGURE 5 - GENERAL ARRANGEMENT UNIT 2 FRONT ELEVATION VIEW A-A, DRAWING NO. 43-7587-5-50, REV. C
FIGURE 6 - GENERAL ARRANGEMENT UNIT 2 SIDE ELEVATION, DRAWING NO. 43-7587-5-51, REV. C
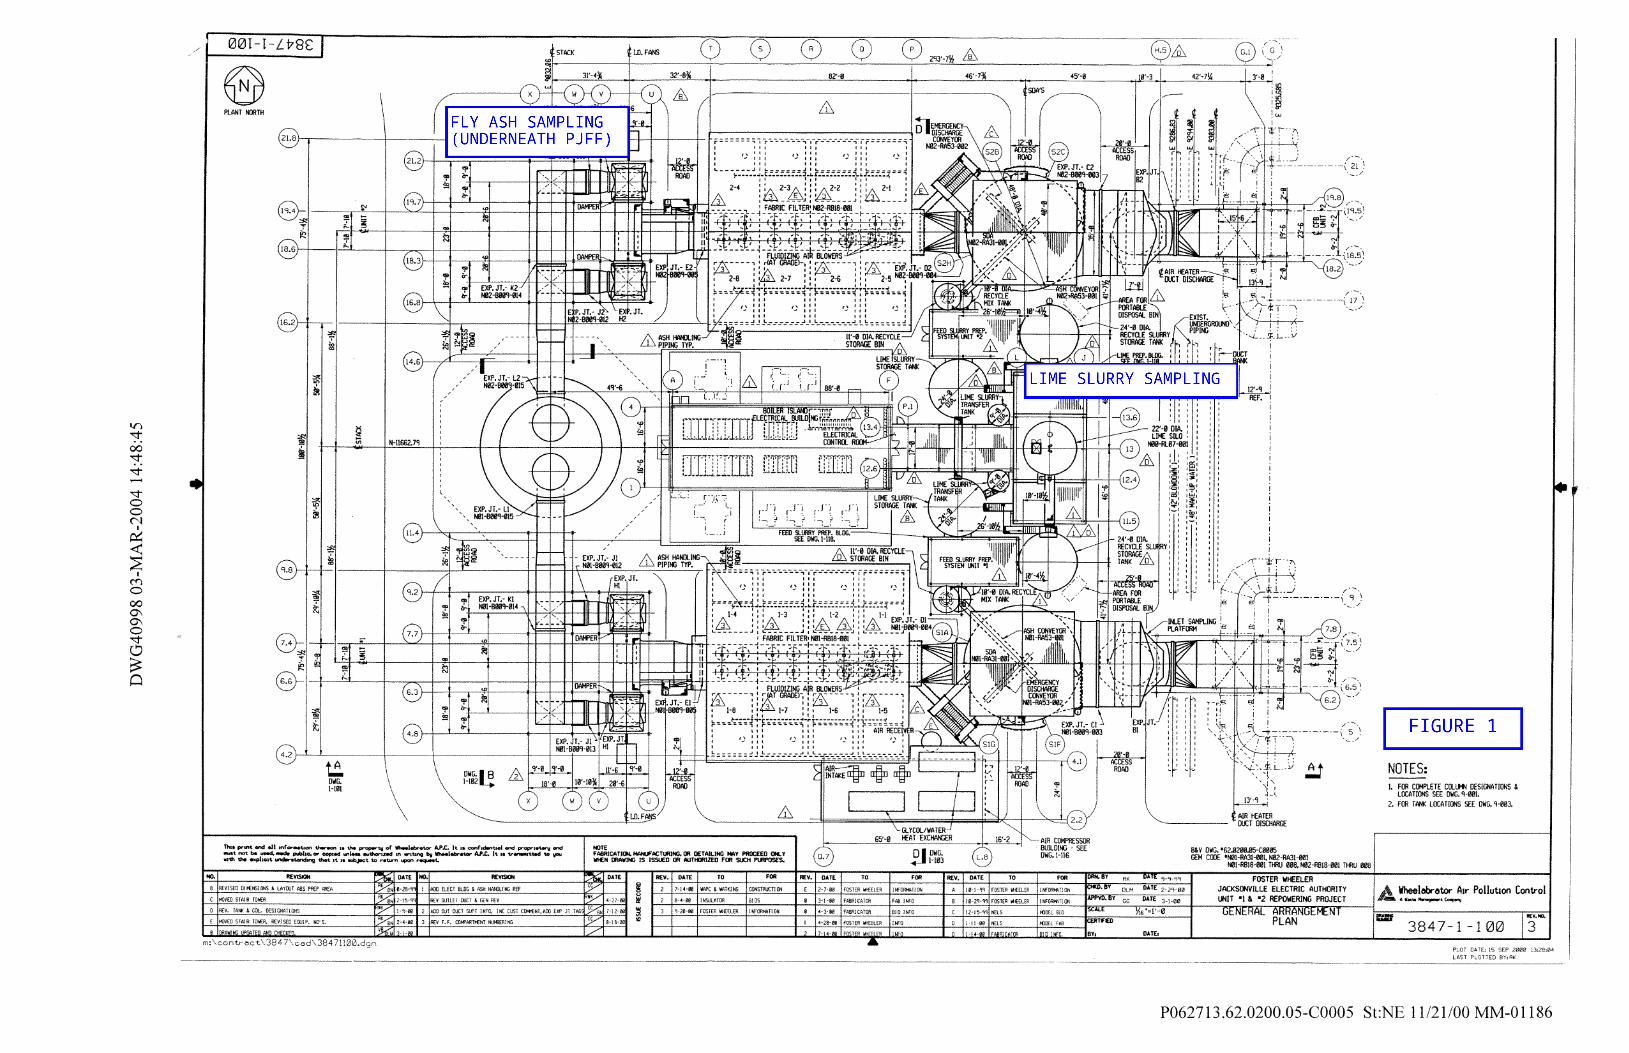
tri29423
LIME SLURRY SAMPLING
tri29423
tri29423
FIGURE 1
tri29423
FLY ASH SAMPLING (UNDERNEATH PJFF)
tri29423
tri29423

tri29423
ISOKINETIC FLY ASH SAMPLING - SDA INLET
tri29423
FIGURE 2
tri29423
FLY ASH SAMPLING (PJFF)
tri29423
tri29423
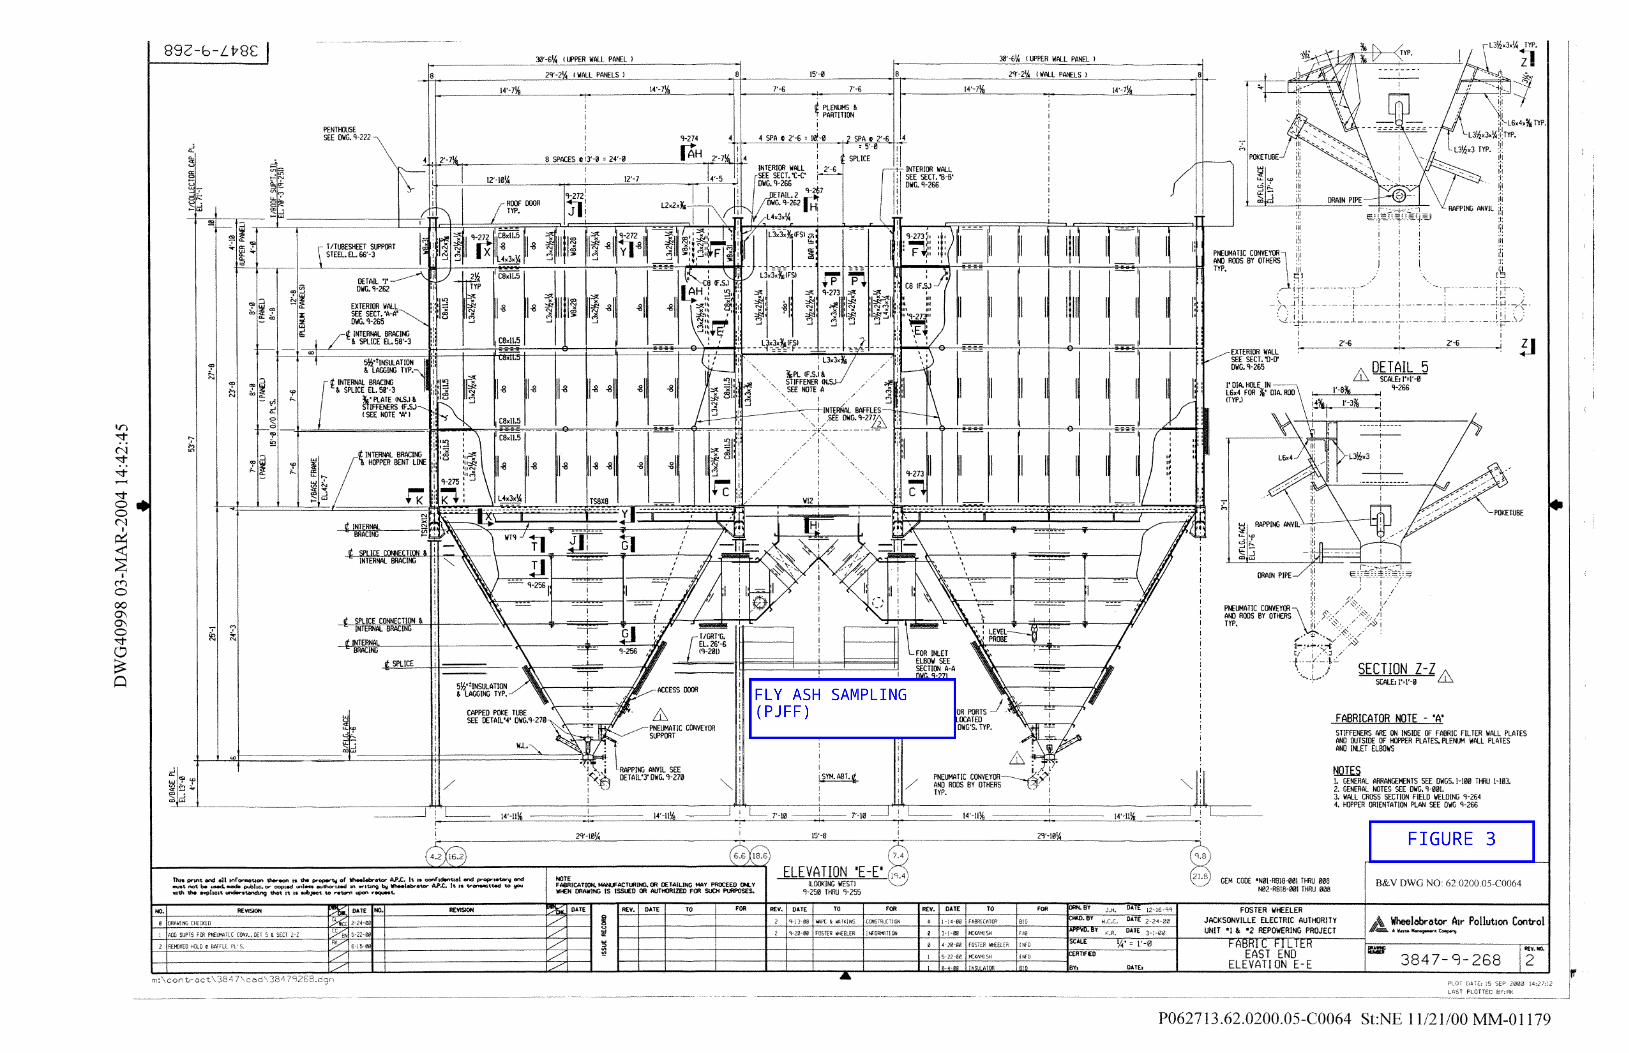
tri29423
FLY ASH SAMPLING (PJFF)
tri29423
tri29423
tri29423
FIGURE 3
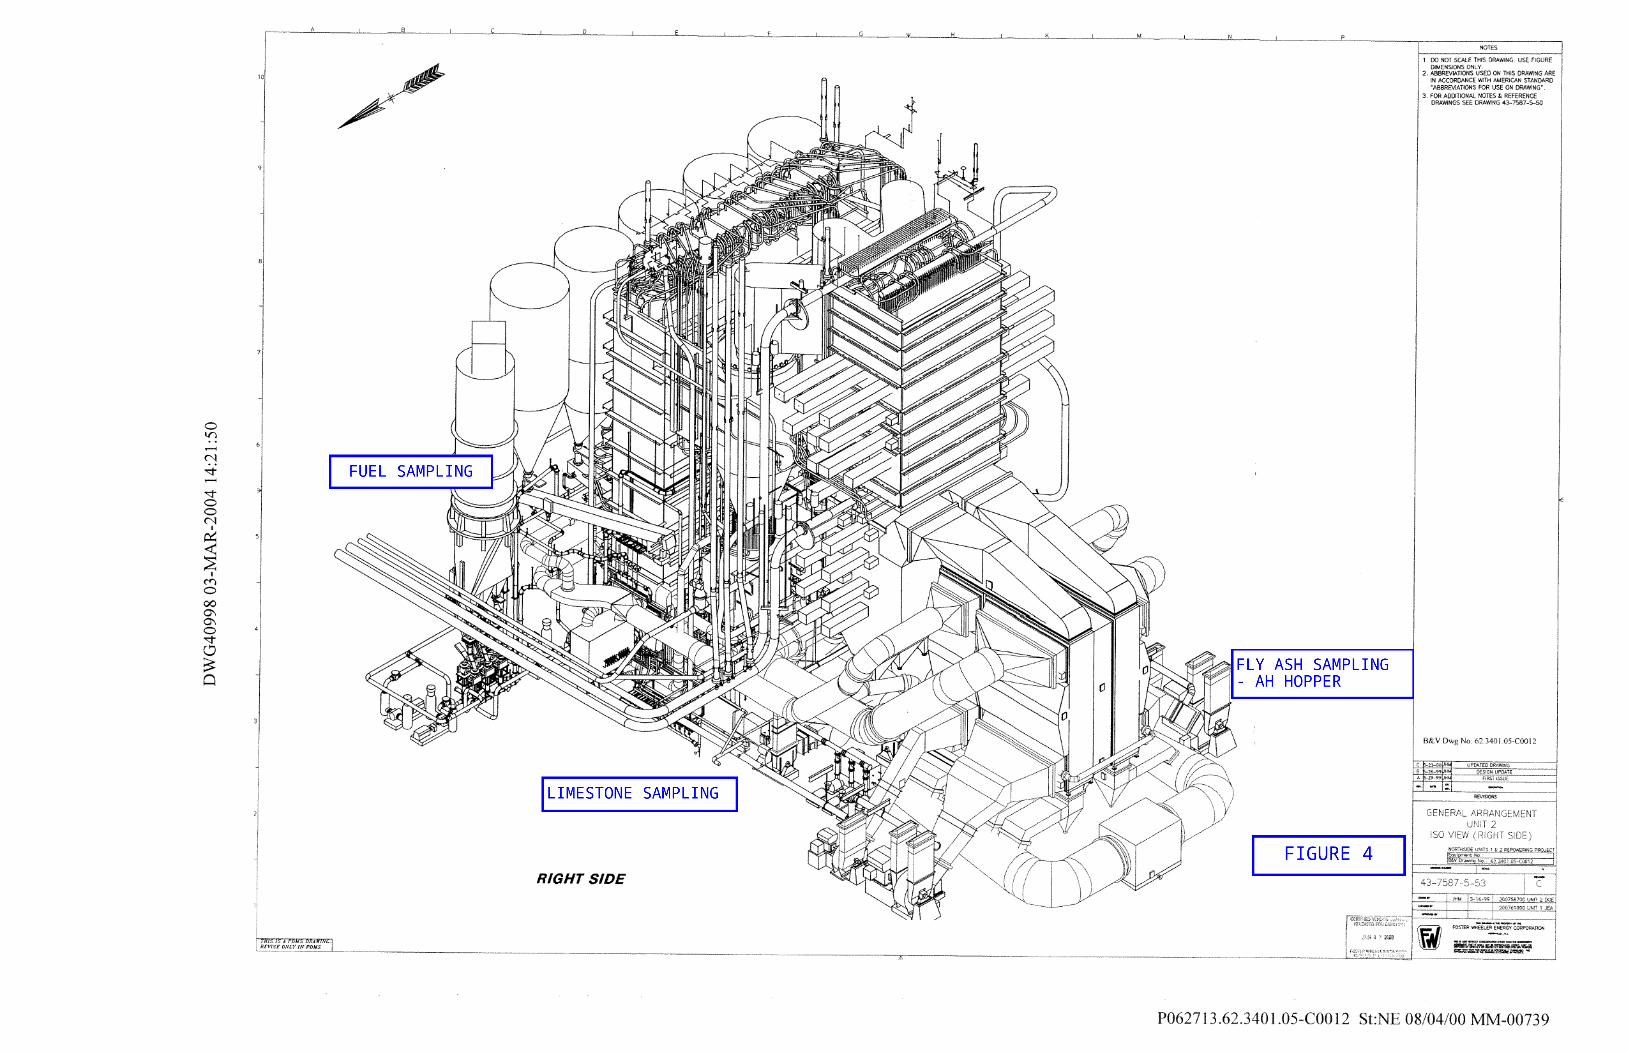
tri29423
LIMESTONE SAMPLING
tri29423
tri29423
FIGURE 4
tri29423
FUEL SAMPLING
tri29423
tri29423
tri29423
FLY ASH SAMPLING - AH HOPPER
tri29423
tri29423

tri29423
FUEL SAMPLING (8 FEEDERS)
tri29423
tri29423
tri29423
tri29423
tri29423
tri29423
tri29423
tri29423
tri29423
FIGURE 5
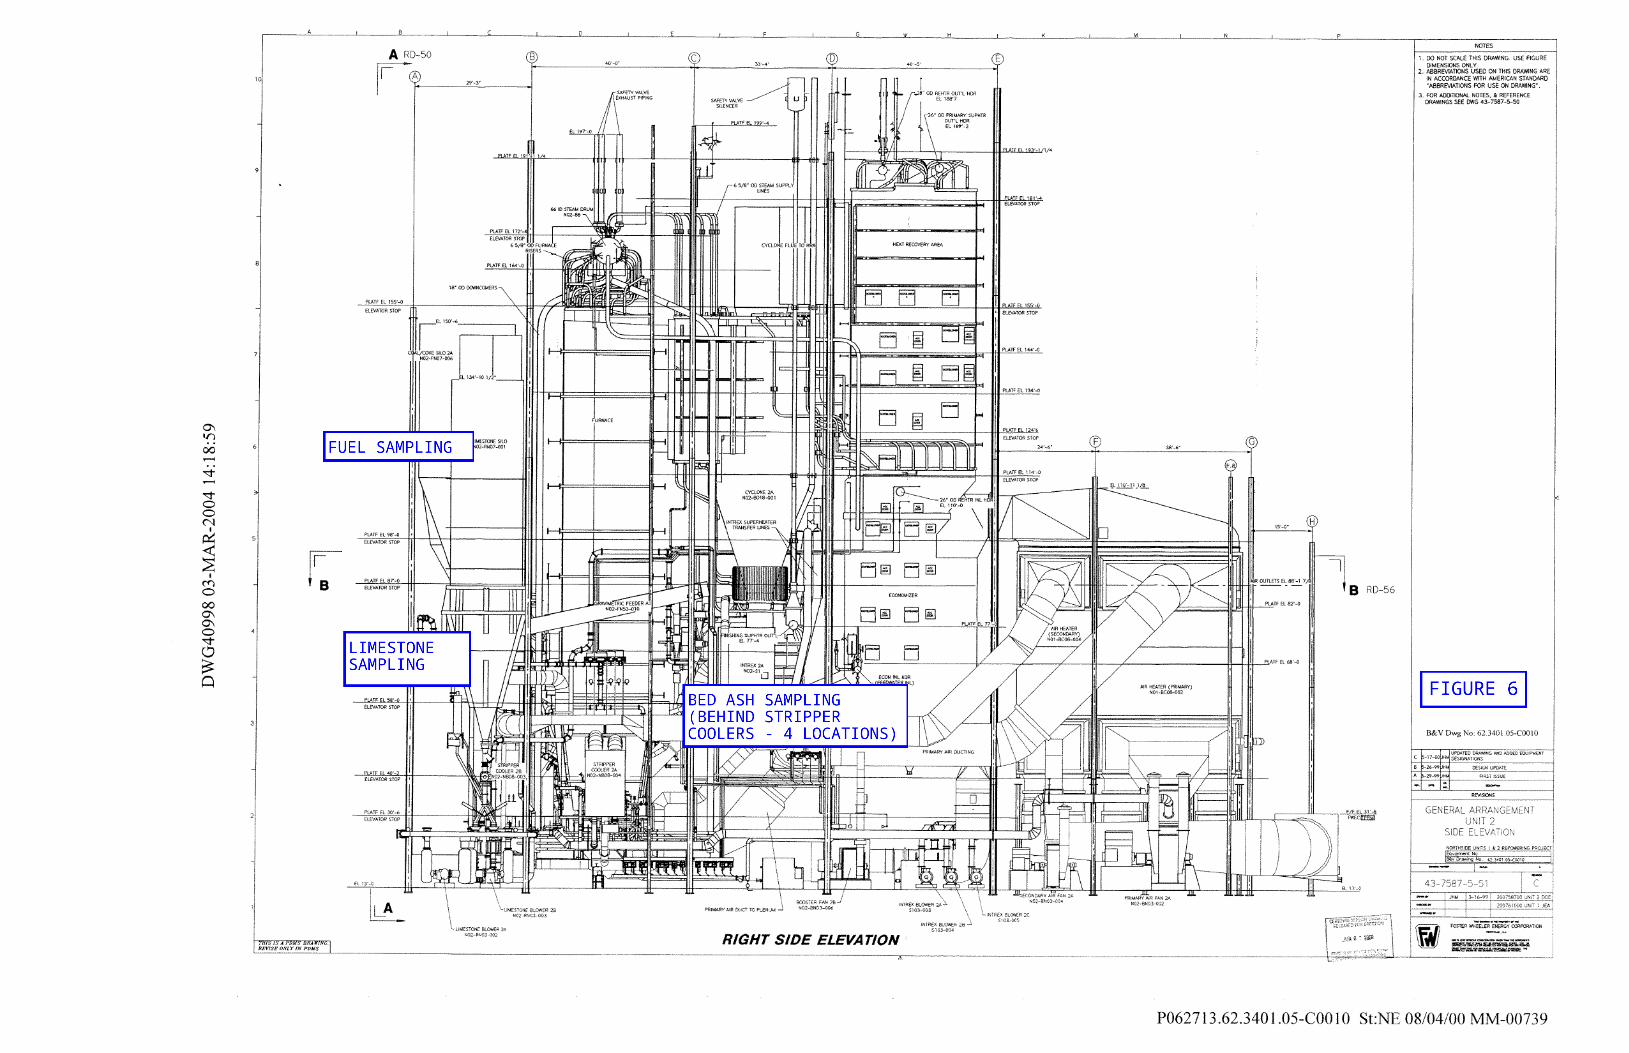
tri29423
FUEL SAMPLING
tri29423
LIMESTONE SAMPLING
tri29423
tri29423
tri29423
FIGURE 6
tri29423
BED ASH SAMPLING (BEHIND STRIPPER COOLERS - 4 LOCATIONS)
tri29423
tri29423
Related Documents