INDEX PAGE 1. GENERAL INFORMATION 1 2. REPORT FROM THE AUDITOR-GENERAL 2 3. REPORT OF THE EXECUTIVE DIRECTOR FINANCE 3 4. ACCOUNTING POLICIES 8 5. BALANCE SHEET 12 6. INCOME STATEMENT 13 7. CASH FLOW STATEMENT 14 8. NOTES TO THE FINANCIAL STATEMENTS 15 9. APPENDICES A STATUTORY FUNDS, TRUST FUNDS AND RESERVES B EXTERNAL LOANS AND INTERNAL ADVANCES C ANALYSIS OF FIXED ASSETS D ANALYSIS OF OPERATING INCOME AND EXPENDITURE FOR THE YEAR ENDED 30 JUNE 2005 E DETAILED INCOME STATEMENT FOR THE YEAR ENDED 30 JUNE 2005 F STATISTICAL INFORMATION G MEMORANDUM STATEMENTS 25 26 27 29 30 34 35

Welcome message from author
This document is posted to help you gain knowledge. Please leave a comment to let me know what you think about it! Share it to your friends and learn new things together.
Transcript

INDEX PAGE
1.
GENERAL INFORMATION
1
2.
REPORT FROM THE AUDITOR-GENERAL
2
3.
REPORT OF THE EXECUTIVE DIRECTOR FINANCE
3
4.
ACCOUNTING POLICIES
8
5.
BALANCE SHEET
12
6.
INCOME STATEMENT
13
7.
CASH FLOW STATEMENT
14
8.
NOTES TO THE FINANCIAL STATEMENTS
15
9.
APPENDICES
A STATUTORY FUNDS, TRUST FUNDS AND RESERVES B EXTERNAL LOANS AND INTERNAL ADVANCES C ANALYSIS OF FIXED ASSETS D ANALYSIS OF OPERATING INCOME AND EXPENDITURE FOR THE YEAR ENDED 30 JUNE 2005 E DETAILED INCOME STATEMENT FOR THE YEAR ENDED 30 JUNE 2005 F STATISTICAL INFORMATION G MEMORANDUM STATEMENTS
25
26
27
29
30
34
35

GENERAL INFORMATION MEMBERS OF THE MAYORAL COMMITTEE
Councillor Councillor Councillor Councillor Councillor Councillor Councillor Councillor Councillor Councillor
J I Mokoena F S Chaine J C Erasmus M M Fikizolo M E Moilwa N G Mokotjo T A Montsi M A Scheepers M Selaledi A T Stander
Executive Mayor - Chairperson
GRADING OF LOCAL AUTHORITY Grade 13 (Grade 5 in terms of Remuneration of Public Office Bearers Act 20/1998) AUDITORS Auditor-General Represented by PricewaterhouseCoopers Inc. BANKERS ABSA Bank REGISTERED OFFICE
Bram Fischer Building De Villiers Street Bloemfontein
P O Box 288 Bloemfontein 9300
Telephone : (051) 4058911 Fax: (051) 4476673
ACTING CITY MANAGER T D J Matutle EXECUTIVE DIRECTOR FINANCE J F Britz: Registered Municipal Accountant (Associate) APPROVAL OF THE FINANCIAL STATEMENTS The annual financial statements as set out on pages 3 to 38 were approved by the City Manager on 29 August 2005 and will be presented to Council for approval. __________________________ ___________________________ T D J MATUTLE J F BRITZ ACTING CITY MANAGER EXECUTIVE DIRECTOR FINANCE (Registered Municipal Accountant)
29 August 2005 29 August 2005

2

3
REPORT OF THE EXECUTIVE DIRECTOR FINANCE
FOR THE FINANCIAL YEAR 1 JULY 2004 TO 30 JUNE 2005 1. OPERATING RESULTS Details of the operating results per department, classification and object of expenditure are included in appendices D and E. The applicable statistics are shown in appendix F. The overall operating results for the year ended 30 June 2005 are as follows :
ACTUAL 2004
R
ACTUAL 2005
R
VARIANCE 2004/2005
%
BUDGET 2005
R
VARIANCE ACTUAL/ BUDGET
%
INCOME Opening surplus Operating income for the year
34 413 804 1 213 475 945
36 381 643 1 415 978 470
5.7 16.7
11 292 630 1 402 979 090
222.2 0.9
1 247 889 749 1 452 360 113 16.4 1 414 271 720 2.7
EXPENDITURE Operating expenditure for the year Sundry transfer Closing surplus
1 153 556 564 57 951 542 36 381 643
1 334 125 281 79 380 161 38 854 671
15.7 37.0 6.8
1 413 643 210
628 510
(5.6)
6 082.0
1 247 889 749 1 452 360 113 16.4 1 414 271 720 2.7
1.1 Rate and General Services
ACTUAL 2004
R
ACTUAL 2005
R
VARIANCE 2004/2005
%
BUDGET 2005
R
VARIANCE ACTUAL/ BUDGET
%
Income Expenditure
545 649 040 615 109 850
671 062 004 732 773 645
23.0 19.1
677 484 070 766 961 810
(0.9) (4.5)
Surplus/(deficit) (69 460 810) (61 711 641) 11.2 (89 477 740) 31.0
Surplus/(deficit) as % of total income (12.7) (9.2) (13.2)
The actual deficit is R27.8 million less than the budgeted deficit of R89.5 million. This was mainly due to savings on salaries as a result of vacancies which existed during the financial year.

4
1.2 Housing Service
ACTUAL 2004
R
ACTUAL 2005
R
VARIANCE 2004/2005
%
BUDGET 2005
R
VARIANCE ACTUAL/ BUDGET
%
Income Expenditure
6 405 842 6 846 430
6 772 319 11 249 636
5.7 64.3
7 909 240 13 127 230
(14.4) (14.3)
Surplus/(deficit) (440 588) (4 477 317) (916.2) (5 217 990) 14.2
Surplus/(deficit) as % of total income (6.9) (66.1) (66.0)
In accordance with the stipulation of the Housing Act (Act 107 of 1997), the net proceeds of the housing schemes must be transferred to the operating account of the Housing Fund. The deficit represents the administration cost to be allocated to the Rate and General Services. 1.3 Trading Services The purchase prices of water and electricity are subject to administered adjustments by Bloem Water Board and Eskom respectively. The purchase price of purified water increased by approximately 7.10%, and the purchase price of electricity by 4.2% during the 2004/2005 financial year. Electricity Service
ACTUAL 2004
R
ACTUAL 2005
R
VARIANCE 2004/2005
%
BUDGET 2005
R
VARIANCE ACTUAL/ BUDGET
%
Income Expenditure
433 197 199 350 293 906
489 227 515 384 539 598
12.9 9.8
486 956 460 423 957 610
0.5 (9.3)
Surplus/(deficit) 82 903 293 104 687 917 26.3 62 998 850 66.2
Surplus/(deficit) as % of total income 19.1 21.4 12.9
An amount of R73.4 million will be transferred to the Rate and General Services as a contribution in relief of rates. The utilization of the power station for the own generation of electricity and load control resulted in a saving of R24,3 million on the purchase of electricity from Eskom. Refer also to note 28.

5
Fresh Produce Market ACTUAL
2004
R
ACTUAL 2005
R
VARIANCE 2004/2005
%
BUDGET 2005
R
VARIANCE ACTUAL/ BUDGET
%
Income Expenditure
9 512 390 8 080 208
9 631 042 9 025 891
1.2 11.7
10 267 320 8 339 220
(6.2) 8.2
Surplus/(deficit) 1 432 182 605 151 (57.7) 1 928 100 (68.6)
Surplus/(deficit) as % of total income 15.1 6.3 18.8
Increases in overtime, bank charges, electricity and water consumption resulted in an excess of 8.2% over the budgeted expenditure. This was mainly due to adjustments in work hours in the Conditions of Service and extensions to the coldroom facilities.The income from commission from market agents was R608 120 less than the budgeted amount. The surplus will be transferred to the Rate and General Services. Water Service
ACTUAL 2004
R
ACTUAL 2005
R
VARIANCE 2004/2005
%
BUDGET 2005
R
VARIANCE ACTUAL/ BUDGET
%
Income Expenditure
218 711 474 173 226 170
239 285 590 196 536 511
9.4 13.5
220 362 000 201 257 340
8.6 (2.3)
Surplus/(deficit) 45 485 304 42 749 079 (6.0) 19 104 660 123.8
Surplus/(deficit) as % of total income 20.8 17.9 8.7
An amount of R27 million will be transferred to the Rate and General Services account as a contribution in relief of rates. The income from the sale of water was R16.3 million more than the budgeted amount, whilst the purchase of water was R6.1 million less than the amount budgeted for.

6
2. CAPITAL EXPENDITURE AND FINANCING The expenditure on fixed assets during the year amounted to R253 022 644. The actual expenditure is 4.4% more than the amount budgeted for. Additional funds received from government for infrastructural development and the new financial system resulted in an over expenditure on the approved budget.
2005 ACTUAL
2005 BUDGET
2004 ACTUAL
R R R
RATE AND GENERAL SERVICES EXECUTIVE OFFICE COMMUNITY AND SOCIAL DEVELOPMENT - Emergency Services - Traffic and Security Services - Parks and Cemeteries - Social Development - Health Services CORPORATE SERVICES - Corporate Management Support - Info Management and Technology - Human Resource Management INFRASTRUCTURAL SERVICES - Administrative Support Services - Roads and Stormwater - Sanitation - Mechanical Services - Solid Waste FINANCE ECONOMIC DEVELOPMENT AND PLANNING - Planning - Economic Development
543 935
3 209 866 6 868 211 4 813 241 1 936 573
840 353
1 763 621 1 525 413
142 870
45 307 70 017 849 58 614 499
91 855 4 820 982
9 338 190
3 469 951 964 105
0
3 208 830 686 800
5 460 205 2 374 230 1 042 500
1 820 000 2 131 000
0
0 60 012 340 48 711 320
100 000 4 598 000
3 843 500
4 168 000 2 210 000
1 415 592
1 247 548 2 041 605 6 318 808 3 696 825 4 767 288
9 659 487 2 293 301
933 484 57 639 252 51 670 130
504 364 2 409 220
1 242 643
6 305 077 546 412
SUBTOTAL 169 006 821 140 366 725 152 691 036
HOUSING SERVICE 4 396 410 12 299 680 4 908 627
TRADING SERVICES Electricity Fresh Produce Market Water
40 786 377
733 694
38 099 342
55 912 530
100 000
33 597 470
58 032 976
1 822 864
28 750 491
SUBTOTAL 79 619 413 89 610 000 88 606 331
GRAND TOTAL 253 022 644 242 276 405 246 205 994

7

8
Resources used to finance the fixed assets were as follows :
2005 ACTUAL
R
2005 BUDGET
R
2004 ACTUAL
R
Capital Development Fund Contributions from operating income Provisions and reserves Erven Trust Fund Grants and subsidies Public contributions
137 015 111 932 197
8 311 799 2 036 501
95 056 849 9 670 187
134 493 825 1 222 920
10 252 600 2 450 000
77 893 220 15 963 840
144 748 883 2 841 548 2 956 391 5 097 710
81 945 297 8 616 165
TOTAL 253 022 644 242 276 405 246 205 994
A complete analysis of capital expenditure (budgeted and actual) per classification or service is included in appendix C. More details regarding external loans and internal advances used
to finance fixed assets are shown in appendix B.
3. EXTERNAL LOANS, INVESTMENTS AND CASH
External loans outstanding on 30 June 2005 amounted to R20 438 828 as set out in appendix B.
Investments, cash and bank on 30 June 2005 amounted to R400 941 408.
More information regarding loans and investments is disclosed in the notes (4 and 7) and
appendix B to the financial statements.
4. FUNDS AND RESERVES
More information regarding funds and reserves is disclosed in the notes (1 to 3) and appendix A to the financial statements.
EXPRESSION OF APPRECIATION
I am grateful to the Mayor, Chairperson and members of the Mayoral Executive Committee, Councillors, the City Manager and Heads of Directorates for the support they have given me
and to the staff of my own department, and in particular to the local representatives of the Auditor-General and the firm PricewaterhouseCoopers Inc. appointed by the Auditor-General
for their assistance.
J F BRITZ B Com., FIMFO
Registered Municipal Accountant (Associate) Executive Director Finance
Mangaung Local Municipality Date : 29 August 2005

9
ACCOUNTING POLICIES 1. Basis of presentation
1.1 The financial statements have been prepared so as to conform to the standards laid down by the Institute of Municipal Finance Officers in its Code of Accounting Practice (1996) and Report on Published Annual Financial Statements (Second edition - January 1996).
1.2 The financial statements are prepared on the historical cost basis, adjusted for
capital expenditure as more fully detailed in paragraph three. The accounting policies are consistent with those applied in the previous year, except as otherwise indicated.
1.3 The financial statements are prepared on the accrual basis whereas certain
direct income is accrued when received, such as traffic fines, pre-paid electricity and certain licences.
2. Consolidation
The balance sheet includes the Rate and General Services, Housing Service, Trading Services and the different funds and reserves. All interdepartmental charges are set off against each other, with the exception of assessment rates, refuse removal, electricity and water, which are treated as income and expenditure in the respective departments.
3. Fixed Assets
3.1 Fixed Assets are stated : - at historical cost, or - at valuation (based on the market price at date of acquisition), where
assets have been acquired by grant or donation, or at valuation on date of transfer/acquisition. while the assets are in existence and fit for use, except in the case of assets which are written off at the end of their estimated life as determined by the Executive Director Finance. Erven are stated at valuation as recorded in the valuation roll.
3.2 Capital outlay is financed from various sources including operating income,
Government loans, external loans, contributions by the public and internal advances. The period of internal advances is equated to the lives of the assets that are being financed and the services concerned is being charged interest at the internal interest rate.
3.3 Depreciation
The balance shown against the heading "Loans Redeemed and Other Capital Receipts" in the notes to the balance sheet is tantamount to a provision for depreciation, however, certain structural differences do exist. By way of this "provision" assets are written down over their estimated useful life. Apart from advances from the various council funds, assets may also be acquired through :
- Appropriations from income, where the full cost of the asset forms an
immediate and direct charge against the operating income.
- Grant or donation, where the amount representing the value of such grant or donation is immediately credited to the "Loans Redeemed and Other Capital Receipts" account, and therefore it is unnecessary to make any further provision for depreciation.

10
3.4 The net proceeds on the sale of immovable property are credited to the Erven Trust Fund.
The net proceeds on the sale of movable property are :
- credited to the Capital Development Fund if it amounts to R1 000 or
more.
- credited to income if it amounts to less than R1 000. 4. Inventory
Inventory is valued at the lower of cost, determined on the weighted average basis, and net realisable value.
5. Funds, Reserves and Provisions
5.1 Reserves and provisions have been established where considered necessary. The basis used in determining contributions to these funds is as follows :
(a) Replacement Funds
Water Service - 1% of the capitalised value of the assets in the undertaking concerned at the end of the previous financial year. Electricity Service - ½ % of the capitalised value of the assets in the undertaking concerned at the end of the previous financial year.
(b) Capital Development Funds
Not less than 1% of the defined annual income.
(c) Insurance Fund
An insurance reserve has been established to cater for losses not covered in the external policy. The contributions are provided as estimated by the Council's Insurance Brokers and are charged against the various services.
The following risks are insured under the reserve fund: Business all risk Glass Business interruption, and Motor fleet
(d) The policies for funds and reserves as compiled and approved by Council, are available at the department of the Executive Director Finance.
(e) Leave-pay Provision
An estimated amount is transferred annually to the leave-pay provision. It is the policy of the Council to carry a provision of not less than 25% of the outstanding amount.
6. Surpluses and Deficits
The policy with regard to trading surpluses and deficits is :
Electricity Services - A maximum of 15% of the gross income derived from the electricity service is appropriated as a contribution towards the relief of rates. The balance is carried forward to the next financial year.

11
Produce Market - The surplus is transferred to Rate and General
Services as a contribution towards the relief of rates.
Water Service - A maximum of 15% of the gross income derived
from the sale of water is appropriated as a contribution towards the relief of rates. The balance is carried forward to the next financial year.
7. Treatment of administration and other overhead expenses Administration expenses are charged to the various services on a sliding scale based on
the expenditure of the relevant department. 8. Leased Assets
Fixed assets held under finance leases are capitalised. Such assets are effectively amortised over the term of the lease agreement.
Lease finance charges are allocated to accounting periods over the duration of the leases, which reflects the extent and cost of lease finance utilised in each accounting period.
9. Investments
Investments are shown in the statements at original cost or market value if a permanent decline in the value occurred and are invested in the securities prescribed in Section 6 of the Municipal Investment Regulations, as determined by Section 13 of the Local Government: Municipal Finance Management Act, 2003 (Act number 56 of 2003).
10. Income Recognition
10.1 Electricity and Water billings
Meters on properties are read and billed monthly. 10.2 Pre-paid electricity Income is accrued when the cash is received
10.3 Assessment Rates
Mangaung Local Municipality applies a differential partial site rating system. In terms of this system the assessment rates are levied partly on the municipal valuation of the ratable property without any improvements and partly on the municipal valuation of the improvements forming part of the ratable property.
11. Retirement Benefits
Mangaung Local Municipality, its employees and councillors contribute to the following pension- or provident funds :
Free State Municipal Pension Fund SALA Pension Fund Municipal Councillor’s Pension Fund Free State Municipal Provident Fund SAMWU National Provident Fund Mangaung Multi Provident Fund
Government Employees Pension Fund Old Mutual Orion
These funds provide retirement benefits to employees and councillors and are subject to the Pension Funds Act, 1956. Benefits are being calculated according to the different funds’ rules. Current contributions are charged against operating income.

12
Actuarial valuations are performed by the relevant pension funds at least every three years.
12. Medical Aid Funds
Mangaung Local Municipality, its employees, Councillors and pensioners contribute to the following medical aid funds.
Employees and pensioners:
Munimed Bonitas Medical Fund Global Health Hosmed
Samwumed LA Health Councillors: Bonitas Discovery Oxygen Medicover Fedhealth Munimed Hosmed
Benefits are being calculated according to the rules of the different funds. Current contributions are charged against operating income.

13
BALANCE SHEET AT 30 JUNE 2005 Note 2005
R
2004
R
CAPITAL EMPLOYED FUNDS AND RESERVES
Statutory Funds Reserves
1 2
1 132 427 471 136 303 858
1 029 810 531 174 567 623
RETAINED SURPLUS 17 37 901 703 36 381 643
1 306 633 032 1 240 759 797
ACCUMULATED HOUSING FUND Operating account
26
63 965 885
71 389 731
TRUST FUNDS LONG TERM LIABILITIES CONSUMER DEPOSITS - SERVICES
3 4 5
6 618 876 19 031 651 39 388 461
6 182 020 20 440 486 36 342 080
1 435 637 905 1 375 114 114
EMPLOYMENT OF CAPITAL
FIXED ASSETS INVESTMENTS LONG TERM DEBTORS
6 7 8
822 231 912 8 293
49 962 151
728 568 075 8 293
55 825 096
872 202 356 784 401 464
NET CURRENT ASSETS
563 435 549
590 712 650
CURRENT ASSETS 839 141 000 830 682 072
Stock Debtors Short-term investments Short-term portion of long-term debtors Cash and Bank
9 10 7 8
17 349 884 398 237 346 277 758 992 22 620 655
123 174 123
28 713 324 399 060 289 317 024 927 22 240 678 63 642 854
CURRENT LIABILITIES
275 705 451
239 969 422
Provisions Creditors Short-term portion of long-term liabilities
11 12 4
21 514 138 252 784 136
1 407 177
14 967 457 223 685 824
1 316 141
1 435 637 905 1 375 114 114

14
INCOME STATEMENT FOR THE YEAR ENDED 30 JUNE 2005
2004 2004 2004 2005 2005 2005 2005
ACTUAL INCOME ACTUAL
EXPEN- DITURE
SURPLUS/ (DEFICIT) ACTUAL
INCOME ACTUAL EXPEN- DITURE
SURPLUS/ (DEFICIT)
BUDGET SURPLUS/ (DEFICIT)
R R R R R R R
545 649 040 615 109 850 (69 460 810) RATE AND GENERAL SERVICES
671 062 004 732 773 645 (61 711 641) (89 477 740)
407 977 174
12 964 735
124 707 131
401 139 066
97 740 605
116 230 179
6 838 108
(84 775 870)
8 476 952
Community Services Subsidised Services Economic Services
529 842 558
12 062 101
129 157 345
506 116 736
101 683 465
124 973 444
23 725 822
(89 621 364)
4 183 901
(174 680)
(89 963 230)
660 170
6 405 842
661 421 063
6 846 430
531 600 284
(440 588)
129 820 779
HOUSING SERVICES TRADING SERVICES
6 772 319
738 144 147
11 249 636
590 102 000
(4 477 317)
148 042 147
(5 217 990)
84 031 610
1 213 475 945 1 153 556 564 59 919 381 TOTAL 1 415 978 470 1 334 125 281 81 853 189 (10 664 120)
68 691 098 58 308 967
10 382 131 Distribution, Suspense and Quarry Accounts
18 272 160
19 225 128 (952 968)
-
(58 037 455)
Appropriations for the year (Refer to note 17)
(79 380 161)
12 264 057
24 117 586
Net surplus/(deficit) for the year Accumulated surplus/ (deficit) beginning of the year
1 520 060
36 381 643
36 381 643 ACCUMULATED SURPLUS/(DEFICIT) END OF THE YEAR 37 901 703
Refer to appendix D, E and E(i) for more detail

15
CASH FLOW STATEMENT
FOR THE YEAR ENDED 30 JUNE 2005
Note
2005
R
2004
R
CASH RETAINED FROM OPERATING ACTIVITIES 274 605 777 239 016 159
Cash generated by operations Investment income (Increase)/decrease in working capital
18 16 19
47 989 847 32 858 914 91 228 367
185 941 863 43 645 475
(61 080 017)
Less: External interest paid
16
172 077 128
(2 198 387)
168 507 321
(2 354 107)
Cash available from operations Cash contributions from the public and State
169 878 741
104 727 036
166 153 214
72 862 945
CASH UTILISED IN INVESTING ACTIVITIES Investment in fixed assets
6
(253 022 644)
(246 205 994)
NET CASH FLOW 21 583 133 (7 189 835)
CASH EFFECTS OF FINANCING ACTIVITIES : Increase/(decrease) in long-term loans (Increase)/decrease in cash investments (Increase)/decrease in cash
20 21 22
(1 317 799) 39 265 935
(59 531 269)
(2 082 757) (1 747 015) 11 019 607
NET CASH (GENERATED)/UTILIZED (21 583 133) 7 189 835

16
NOTES TO THE FINANCIAL STATEMENTS AT 30 JUNE 2005
2005 R
2004 R
1. STATUTORY FUNDS Capital Development Fund Insurance Fund Erven Trust Fund
1 031 457 319 75 901 832 25 068 320
937 743 786 69 965 924 22 100 821
(Refer to note 25 and appendix A for more detail) 1 132 427 471 1 029 810 531
2. RESERVES PROTECTION SERVICES Disaster Management Parking Fund PARKS AND RECREATION Tennis Court Surface Renewal Fund INFRASTRUCTURAL SERVICES Vehicles and Plant - Maintenance GRAVEL QUARRIES General Reserve SPECIAL AND SUNDRY RESERVES Market Deficit Workmen's Compensation Act Student Bursaries Capital Reserve Stores Contingencies Account General Reserve - Petra Quarry General Reserve - Business Entity
3 467 134 4 037 048
2 415 865
405 350
936 954
2 030 539 15 613 642
767 490 2 738 515
10 508 378 7 348 928
68 200 718
3 339 836 3 728 353
2 257 374
378 757
875 486
1 897 327 15 078 401
738 991 2 558 856
15 858 838 6 866 806
102 741 548
WATER SERVICE Tariff Stabilisation Fund Replacement Fund - General Mains, etcetera
4 211 970 13 621 327
3 935 646 14 311 404
(Refer to appendix A for more detail) 136 303 858 174 567 623

17
NOTES TO THE FINANCIAL STATEMENTS AT 30 JUNE 2005(Continued)
2005
R 2004
R 3. TRUST FUNDS Cultural Fund The Tomory Bequest Alfred Leith Non-European Endowment Fund R T B de Villiers Trust A E Fichardt Trust Coloured Old Age Home (OVV) Relief fund : Home for Coloureds Johan Ströhfeldt Trust
139 964 12 665
2 199 324 277
5 930 782 46 494
136 780 25 715
130 782 9 035 2 224
303 003 5 541 697
43 444 127 807 24 028
(Refer to appendix A for more detail) 6 618 876 6 182 020
4. LONG TERM LIABILITIES Government Loans Development Bank of Southern Africa
230 669 20 208 159
330 181 21 426 446
20 438 828 21 756 627
(Refer to appendix B for more detail on long term liabilities) Less : Current portion transferred to Current Liabilities 1 407 177 1 316 141
Government Loans Development Bank of Southern Africa
109 712 1 297 465
99 512 1 216 629
19 031 651 20 440 486
The above loans were advanced for infrastructural projects. They bear interest at rates from 8.50 % to 14.00% per annum and were originally repayable over periods of between twenty and thirty years. The final dates of repayment vary from 31 December 2005 to 31 December 2015. None of the loans are secured by any assets of the Council.
5. CONSUMER DEPOSITS - SERVICES Electricity and water
39 388 461
36 342 080
Guarantees held in lieu of electricity and water deposits
10 352 633
10 855 765
6. FIXED ASSETS Fixed assets at the beginning of the year Capital expenditure during the year Assets written off, transferred or disposed of during the year
2 855 626 855 253 022 644
5 835 838
2 414 798 192 246 205 994 194 622 669
Total fixed assets Less : Loans redeemed and other capital receipts
3 114 485 337 (2 292 253 425)
2 855 626 855 (2 127 058 780)
Net fixed assets 822 231 912 728 568 075
(Refer to appendix C and section 2 of the Report of the Executive Director Finance for more detail on fixed assets)

18
NOTES TO THE FINANCIAL STATEMENTS AT 30 JUNE 2005(Continued)
2005
R 2004
R 7. INVESTMENTS Unlisted Centlec (Pty) Ltd Senwes Ltd Shares OVK Holdings Ltd
100 5 658 2 535
100 5 658 2 535
Short term
8 293 277 758 992
8 293 317 024 927
277 767 285 317 033 220
Management valuation of unlisted investments 277 767 285 317 033 220
Average rate of return on investments 7.02% 8.86%
The Local Government: Municipal Finance Management Act, 2003 requires local authorities to invest funds not immediately required in investments types as prescribed in the Municipal Investment Regulations. Included in investments, is an amount of R358 992, being the balance of an investment at an institution currently under receivership. An investment of R6 000 000 is pledged as security to the Commissioner of the Workmen's Compensation Fund to guarantee the payment of claims in respect of accidental injuries while on duty. No investments have been written off during the year.
8. LONG TERM DEBTORS Loans to Local Authorities Housing Loans to Individuals and Public Organisations Mortgage Bonds to Employees Car loans Study loans Erven Trust
8 337 502 28 331 120
4 905 579 16 412 239
358 757 14 237 609
6 368 244 26 941 171
6 603 245 24 188 117
921 535 13 043 462
Less: Short-term portion of long-term debtors transferred to current assets
72 582 806 (22 620 655)
78 065 774 (22 240 678)
49 962 151 55 825 096
9. STOCK
17 349 884
28 713 324
Stock represents consumable stores, raw materials, work in progress and finished goods. Where necessary specific provision is made for obsolete stock.
10. DEBTORS Current debtors (consumer and other) Provision for bad debts
526 665 003 (128 427 657)
568 902 269 (169 841 980)
398 237 346 399 060 289
Amounts totaling R106 548 143 (2004 : R5 521 053) were written off as bad debts. This represents 7.52% (2004: 0.45%) of the total operating income for the year. Days outstanding in debtors amount to 202 days (2004: 238 days)
11.PROVISIONS 12.
13.Leave Pay
21 514 138
14 967 457

19

20NOTES TO THE FINANCIAL STATEMENTS AT 30 JUNE 2005(Continued)
2005
R 2004
R 12. CREDITORS Trade Creditors and other Deposits
252 303 255 480 881
223 050 465 635 359
252 784 136 223 685 824
13. ASSESSMENT RATES
SITE VALUATIONS
AS AT 1 JULY 2004
ACTUAL INCOME
2005
ACTUAL INCOME
2004
Free Services Residential and Commercial State Municipal
12 968 444 294 2 069 156 200 1 548 500 300
33 876 970 179 652 714
16 720 325 1 244 579
30 505 400 161 697 959
15 282 406 2 306 790
231 494 588 209 792 555
Valuations are performed at least every three years. The last general valuation in Mangaung came into effect on 1 July 2003. The basic rates were as follows : General assessment rates (a) 6,92c per rand on the value of rateable property without any improvements. (b) 0,629c per rand on the value of improvements. The following rebates apply on rateable properties: (i)40% rebate on properties which are used solely for dwelling purposes, including properties which are zoned for the purpose of town houses and flats and including small holdings and farms used solely for residential and agricultural purposes. (ii)100% rebate on properties in the Bloemdustria industrial area. (iii)20% rebate on properties which are used mainly for dwelling purposes but on which informal business is also performed.
(iv)
14. COUNCILLORS' REMUNERATION Mayor's allowances Speaker’s allowances Councillors’ allowances Mayoral Committee allowances Councillors' pension contributions Councillors’ medical aid contribution
428 405 352 391
5 410 159 3 333 870
929 852 155 851
404 845 333 135
5 497 606 3 152 060
944 112 107 750
10 610 528 10 439 508
15. AUDITORS' REMUNERATION Audit fees - Current year - Under provision prior year
2 070 770 336 303
1 722 190 475 233
2 407 073 2 197 423

21
NOTES TO THE FINANCIAL STATEMENTS AT 30 JUNE 2005(Continued)
2005
R 2004
R 16. FINANCE TRANSACTIONS Total external interest earned or paid : Interest earned Interest paid
32 858 914 2 198 387
43 645 475 2 354 107
Capital charges debited to operating and distribution accounts : Interest : External Internal Redemption : External Internal
2 198 387 73 209 930
1 317 800 44 504 259
2 354 107 63 749 629
1 182 757 50 435 706
121 230 376 117 722 199
17. APPROPRIATIONS Appropriation Account Accumulated surplus/(deficit) at the beginning of the year :
36 381 643
24 117 586
- Operating account - Distribution, Suspense and Quarry accounts
36 381 643 -
34 413 804 (10 296 218)
Operating surplus/(deficit) for the year 80 900 221 70 301 512
- Operating account - Distribution, Suspense and Quarry accounts
81 853 189 (952 968)
59 919 381 10 382 131
Appropriations for the year : (79 380 161) (58 037 455)
- Contributions to : Workmen’s Compensation Fund Leave-pay Reserve Provision for Bad Debts - Prior year adjustments: Accrued VAT Creditors Other - Distribution, Suspense and Quarry accounts
(1 000 000) (13 000 000) (58 000 000)
(8 605 596) 2 250 552
(1 025 117) -
- (3 000 000)
(54 947 883) - -
(3 659) (85 913)
Accumulated surplus/(deficit) at the end of the year 37 901 703 36 381 643
- Operating account - Distribution, suspense and Quarry accounts
38 854 671 (952 968)
36 381 643 -
The above results have been achieved after the following transfer and contributions have been made : Operating Account Transfer from General Reserve - Business Entity
45 000 000
-

22Capital expenditure Contribution to : Replacement provision - Electricity - Water Capital Development Fund Leave - Pay Reserve Parking Fund Bad debts provision
932 197
3 179 740 2 729 699
27 977 866 1 086 350
6 005 7 133 820
2 841 548
2 892 375 2 443 577
24 216 581 1 003 620
129 042 2 722 285
43 045 677 36 249 028

23
NOTES TO THE FINANCIAL STATEMENTS AT 30 JUNE 2005 (Continued)
2005
R 2004
R 18.CASH GENERATED BY OPERATIONS 19. 20.Surplus/(deficit) for year 21. 22.Adjustments in respect of : 23.Previous years' operating transactions and contributions 24.
25.Appropriations charged against income :
80 900 221
(79 380 161)
115 045 677
70 301 512
(58 037 455)
111 895 427
- Capital development fund - Provisions and reserves - Fixed Assets
27 977 866 86 135 614
932 197
24 216 581 67 138 781 20 540 065
Capital Charges :
121 230 376
117 722 199
Interest paid : - to internal funds - on external funds Redemption : - of internal advances - of external borrowings
73 209 930
2 198 387
44 504 259 1 317 800
63 749 629
2 354 107
50 435 706 1 182 757
Investment income (operating account) Non-operating income : Net income from Provisions, Reserves and Trust Funds Non-operating expenditure : Expenditure charged against Provisions, Reserves and Trust Funds
(22 010 602)
8 399 056
(176 194 720)
(21 005 122)
16 169 095
(51 103 793)
47 989 847 185 941 863
18.(INCREASE)/DECREASE IN WORKING CAPITAL 19. 20.(Increase)/decrease in stock 21.(Increase)/decrease in debtors
22.Increase/(decrease) in creditors
11 363 440 47 720 234 32 144 693
(4 831 835) (59 693 325)
3 445 143
91 228 367 (61 080 017)
20. INCREASE/(DECREASE) IN LONG-TERM LOANS (EXTERNAL) Loans raised Loans repaid
- (1 317 799)
- (2 082 757)
(1 317 799) (2 082 757 )
21. (INCREASE)/DECREASE IN EXTERNAL CASH INVESTMENT Investment realised Investment made
152 265 935 (113 000 000)
156 000 000 (157 747 015)
39 265 935 (1 747 015)
22. (INCREASE)/DECREASE IN CASH ON HAND Cash balance at the beginning of the year Less: Cash balance at the end of the year
63 642 854 123 174 123
74 662 461 63 642 854
(59 531 269) 11 019 607

24
NOTES TO THE FINANCIAL STATEMENTS AT 30 JUNE 2005 (Continued)
2005
R 2004
R 23. CONTINGENT LIABILITIES AND CONTRACTUAL OBLIGATIONS Guarantees by Council in respect of housing loans at financial institutions for officials
5 518 665
6 124 181
Leave pay outstanding as at 30 June 2005 amounts to R25 808 745, whereas the provision amounts to R21 514 138. It is the policy of the Council to carry a provision of not less than 25% of the outstanding amount. The following pending claims exist against the council: R150 000 for a claim in respect of the utilization of funds from the Local Economic Development Fund (LEDF). R1.1 million for claims regarding labour disputes.
R90 000 for animals which have died
24. CAPITAL COMMITMENTS Commitments in respect of capital expenditure approved and contracted for
95 833 830
68 848 647
This expenditure will be financed from : - Internal Sources - External Sources Subsidies Government
58 048 860
37 784 970
38 122 403
30 726 244
95 833 830 68 848 647
25. CAPITAL DEVELOPMENT FUND Accumulated Fund Less :
1 031 457 319
954 643 922
937 743 786
823 560 116 External investments Debtors Internal advances (See appendix B for more detail)
117 660 061 35 190 777
801 793 084
71 517 607 45 231 061
706 811 448
Applied as operating capital 76 813 397 114 183 670
26.HOUSING OPERATING ACCOUNT 27. 28.The operating account of the Housing Fund was established in terms of the Housing Act, (Act 107 of 1997), which came into operation on 1 April 1998.
29.Refer to Annexure E (ii) for more detail.
30.RETIREMENT BENEFITS 31.
32.The actuarial valuations of the funds, as mentioned in the accounting policies, could not be obtained.
27.POST BALANCE SHEET EVENT 28. 29.28.1 A new company, Centlec (Pty) Ltd of which Mangaung Local Municipality is the sole shareholder, was formed to take over all activities in respect of the supply of electricity. The income derived from this activity will revert to the newly established business. All assets, including certain of the debtors of the electricity service will be taken over by the newly formed company. The income formerly derived from this activity will be replaced by interest to be received on a loan account. The company will commence with business from 1 July 2005. 30.
31.28.2 The annual financial statements of Centlec (Pty) Ltd are as a result of details in 28.1 therefore not yet consolidated.
NOTES TO THE FINANCIAL STATEMENTS AT 30 JUNE 2005 (Continued)
29. ADDITIONAL DISCLOSURES IN TERMS OF MUNICIPAL FINANCE MANAGEMENT ACT, 2003 (ACT NO. 56 OF 2003) 29.1 COUNCILLOR’S ARREAR CONSUMER ACCOUNTS - SECTION 124(1)(b)

25 The following Councillors had arrear accounts outstanding for more than 90 days as at 30 June 2005:
Councillor Total Outstanding less than 90 Days
Outstanding More than 90 Days
Goliath E K Liphoko M A Makhanya K N L Mbange M B Melamu M G Minnie H Mokoena J I Moletsane M J Siyonzana M A Wittes V A
4 348-38 2 408-86 9 482-10 2 513-87 2 186-21 3 691-94
11 698-55 854-46
8 247-21 5 266-91
1 545-011 325-68
639-391 453-53
907-05714-82
5 623-24187-47563-19190-84
2 803-371 083-188 842-711 060-341 279-162 977-126 075-31
666-997 684-025 076-07
50 698-49 13 150-22 37 548-27
During the year the following additional Councillors had arrear accounts outstanding for more than 90 days
30 June 2005 Councillor
Highest Amount
Outstanding
Ageing
Dlamini M L Jacobs L P Kosana M S Kotsoane M S Lala T S Mathae B L Mokotjo N G Motlalane J J Motsi K J Mzuzwana Z Z Nakedi S S Nompondo P M Nthejane T B Saohatse G K Scheepers M A Soebehle S N Tlhobelo T E Zumane Z A
141-17 754-61 766-91
3 175-92 1 711-98 2 835-96
292-50 214-19 353-77
8 028-91 304-51 614-68
1 036-69 358-44
5 595-08 617-83
1 037-08 4 073-79
> 150 days > 150 days > 150 days > 150 days > 150 days > 150 days > 150 days > 150 days > 150 days > 150 days > 150 days > 150 days > 150 days > 150 days > 150 days > 150 days > 150 days > 150 days
NOTES TO THE FINANCIAL STATEMENTS AT 30 JUNE 2005 (Continued)
29.2 EMPLOYEE RELATED COSTS - SECTION 124(1)(c)
Remuneration of the Municipal Manager
Annual remuneration Performance bonuses Car allowance Contributions to UIF, medical and pension funds
692 885 147 312 199 704 19 680
Total 1 059 581
Remuneration of the Chief Financial Officer
Annual remuneration Performance bonuses Car allowance Contributions to UIF, medical and pension funds
527 722 119 572 98 152
125 451
Total 870 897
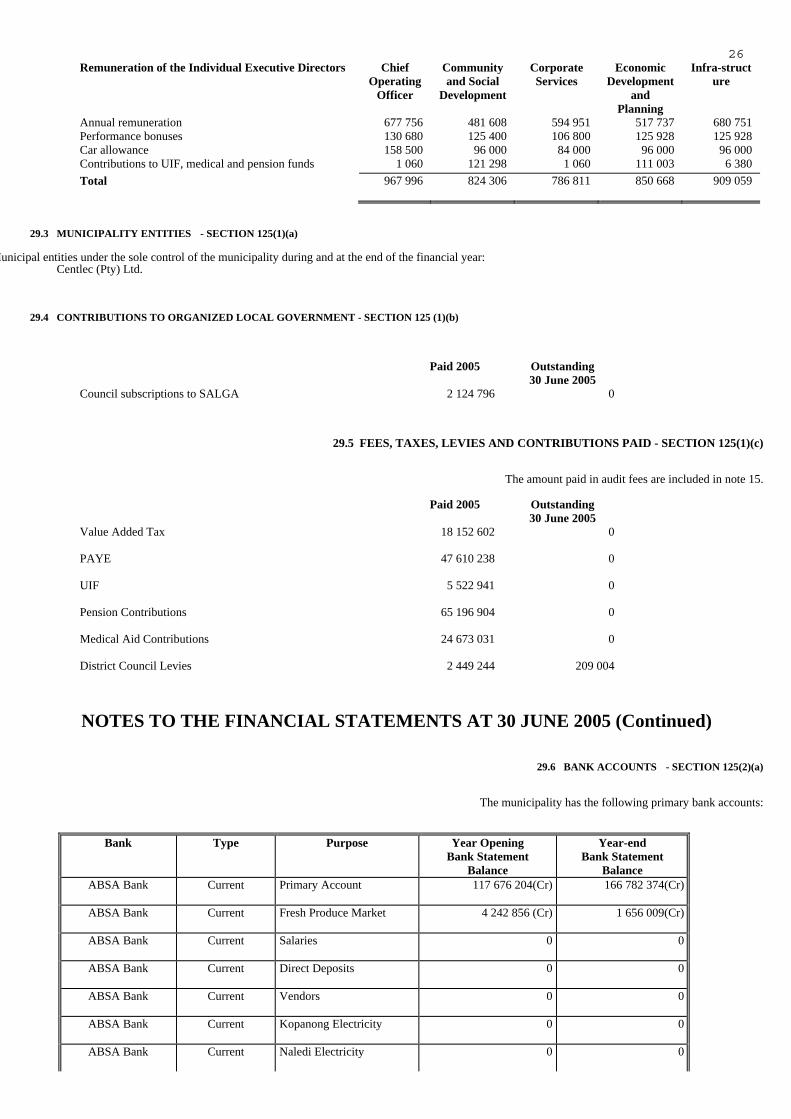
26Remuneration of the Individual Executive Directors Chief
Operating Officer
Community and Social
Development
Corporate Services
Economic Development
and Planning
Infra-structure
Annual remuneration Performance bonuses Car allowance Contributions to UIF, medical and pension funds
677 756 130 680 158 500
1 060
481 608 125 400 96 000
121 298
594 951 106 800 84 000 1 060
517 737 125 928 96 000
111 003
680 751 125 928 96 000 6 380
Total 967 996 824 306 786 811 850 668 909 059
29.3 MUNICIPALITY ENTITIES - SECTION 125(1)(a)
Municipal entities under the sole control of the municipality during and at the end of the financial year: Centlec (Pty) Ltd. 29.4 CONTRIBUTIONS TO ORGANIZED LOCAL GOVERNMENT - SECTION 125 (1)(b)
Paid 2005 Outstanding 30 June 2005
Council subscriptions to SALGA 2 124 796 0
29.5 FEES, TAXES, LEVIES AND CONTRIBUTIONS PAID - SECTION 125(1)(c)
The amount paid in audit fees are included in note 15.
Paid 2005 Outstanding 30 June 2005
Value Added Tax 18 152 602 0
PAYE 47 610 238 0
UIF 5 522 941 0
Pension Contributions 65 196 904 0
Medical Aid Contributions 24 673 031 0
District Council Levies 2 449 244 209 004
NOTES TO THE FINANCIAL STATEMENTS AT 30 JUNE 2005 (Continued)
29.6 BANK ACCOUNTS - SECTION 125(2)(a)
The municipality has the following primary bank accounts:
Bank Type Purpose Year Opening Bank Statement
Balance
Year-end Bank Statement
Balance ABSA Bank Current Primary Account 117 676 204(Cr) 166 782 374(Cr)
ABSA Bank Current Fresh Produce Market 4 242 856 (Cr) 1 656 009(Cr)
ABSA Bank Current Salaries 0 0
ABSA Bank Current Direct Deposits 0 0
ABSA Bank Current Vendors 0 0
ABSA Bank Current Kopanong Electricity 0 0
ABSA Bank Current Naledi Electricity 0 0

27ABSA Bank Current Mohokare Electricity 0 0
29.7 INVESTMENTS - SECTION 125(2)(b)
Refer to note 7.
29.8 CONTINGENT LIABILITIES - SECTION 125(2)(c)
Refer to note 23.
29.9 STATEMENT BY ACCOUNTING OFFICER - SECTION 124(1)(a)
I certify that the salaries, allowances and benefits of councillors, as disclosed in note 14, are within the upper limits of the framework envisaged in Section 219 of the Constitution, read with the Remuneration of Public Office Bearers Act and the Minister of Provincial and Local Government’s determination
in accordance with this Act.
__________________________________ 29 Augustus 2005
ACTING CITY MANAGER DATE

28
APPENDIX A
STATUTORY FUNDS, TRUST FUNDS AND RESERVES
BALANCE AT
30/6/2004
R
CONTRI-BUTIONS
DURING THE YEAR
R
INTEREST ON
INVEST- MENTS
R
OTHER INCOME
R
OPERA-TING
EXPENDI-TURE
DURING THE YEAR
R
CAPITAL EXPENDI-T
URE DURING
THE YEAR
R
BALANCE AT
30/6/2005
RSTATUTORY FUNDS Capital Development Fund Insurance Fund Erven Trust Fund
937 743 786 69 965 924 22 100 821
27 977 866
86 631 780 4 912 344
705 315
761 832 2 525 097 4 705 567
21 657 945 1 501 533
406 881
2 036 502
1 031 457 319 75 901 832 25 068 320
1 029 810 531 27 977 866 92 249 439 7 992 496 23 566 359 2 036 502 1 132 427 471
RESERVES PROTECTION SERVICES Disaster Management Parking Fund PARKS AND RECREATION Tennis Court Surface Renewal Fund INFRASTRUCTURAL SERVICES Vehicles and Plant - Maintenance QUARRIES GRAVEL General Reserve SPECIAL AND SUNDRY RESERVES Market Deficit Workmen's Compensation Fund Student Bursaries Capital Reserve General Reserve - Petra Quarry Stores Contingencies Account General Reserve - Business Entity WATER SERVICE Tariff Stabilisation Fund Replacement Fund - General Mains etc.
3 339 836 3 728 353
2 257 374
378 757
875 486
1 897 327
15 078 401 738 991
2 558 856 6 866 806
15 858 838 102 741 548
3 935 646
14 311 404
1 327 780
3 179 741
2 729 699
234 492 261 770
158 491
26 593
61 468
133 212
1 058 662 51 885
179 659 482 122
1 113 457 7 213 538
276 324
1 004 811
46 925
3 625 65 891
107 194
1 851 201 23 386
194 989 45 000 000
2 385 342
6 272 553
2 039 245
3 467 134 4 037 048
2 415 865
405 350
936 954
2 030 539
15 613 642 767 490
2 738 515 7 348 928
10 508 378 68 200 718
4 211 970
13 621 327
174 567 623 7 237 220 12 256 484 116 441 49 562 112 8 311 798 136 303 858
TRUST FUNDS Cultural Fund The Tomory Bequest Alfred Leith Non-European Endowment Fund R T B De Villiers Trust A E Fichardt Trust Coloured Old Age Home (OVV) Relief Fund : Home for Coloureds Johan Ströhfeldt Trust
130 782 9 035 2 224
303 003 5 541 697
43 444 127 807
24 028
9 182 634 156
21 274 389 085
3 050 8 973 1 687
2 996
181
139 964 12 665 2 199
324 277 5 930 782
46 494 136 780 25 715
6 182 020 434 041 2 996 181 6 618 876
1 210 560 174 35 215 086 104 939 964 8 111 933 73 128 652 10 348 300 1 275 350 205
29
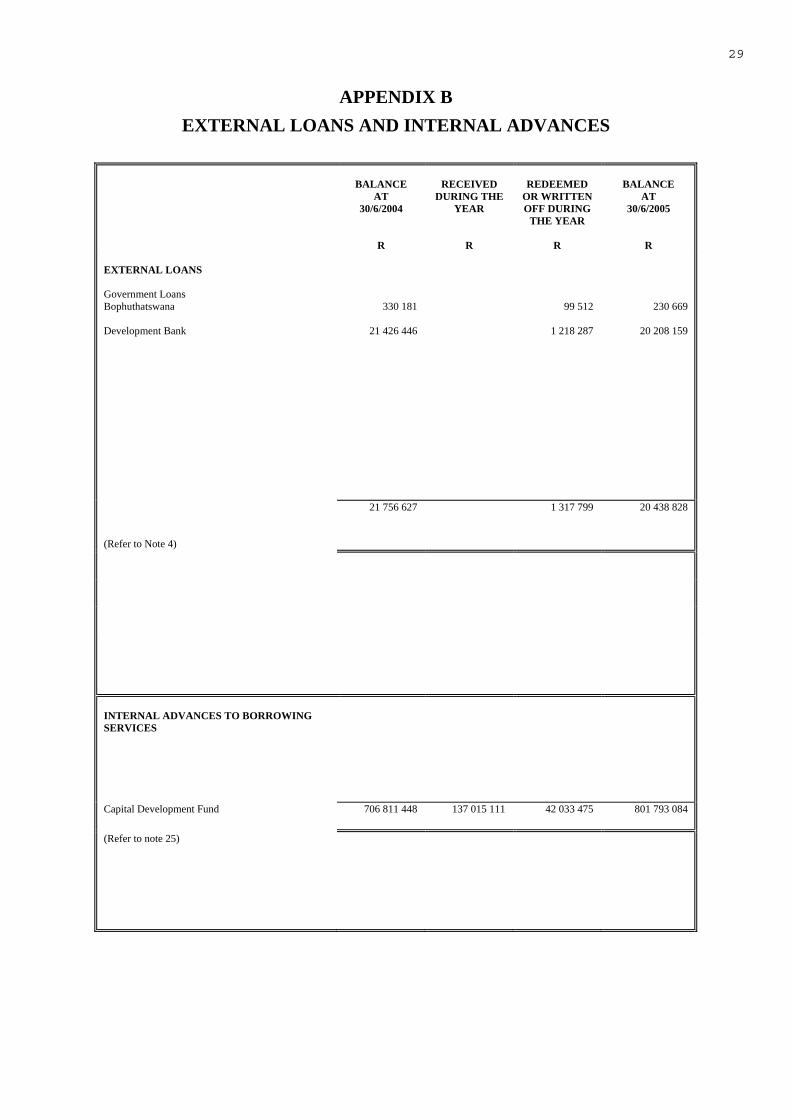
APPENDIX B
EXTERNAL LOANS AND INTERNAL ADVANCES
BALANCE AT
30/6/2004
R
RECEIVED
DURING THE YEAR
R
REDEEMED
OR WRITTEN OFF DURING
THE YEAR
R
BALANCE
AT 30/6/2005
R EXTERNAL LOANS Government Loans Bophuthatswana Development Bank
330 181
21 426 446
99 512
1 218 287
230 669
20 208 159
(Refer to Note 4)
21 756 627 1 317 799 20 438 828
INTERNAL ADVANCES TO BORROWING SERVICES
Capital Development Fund 706 811 448 137 015 111 42 033 475 801 793 084
(Refer to note 25)

30
APPENDIX C
ANALYSIS OF FIXED ASSETS
EXPEN- DITURE 2003/2004
R
SERVICE
BUDGET 2004/2005
R
BALANCE
AT 30/6/2004
R
EXPEN- DITURE 2004/2005
R
WRITTEN OFF, TRANS-
FERRED, REDEEMED
OR DISPOSED
OF DURING THE YEAR
R
BALANCE
AT 30/6/2005
R
152 691 036
RATE AND GENERAL SERVICES
140 366
725
1 885 793 973
169 006 821
(7 874 807)
2 062 675 601
77 274 643 Community Services 72 125 470 539 069 737 93 029 097 19 876 622 612 222 212
54 129 192 466
1 849 139 77 907
1 415 592 4 767 288 2 293 301
933 484
57 388 383 250 870
1 242 643 504 364
6 305 077
Protection Services : Administration Civil Defence Security Traffic Control Parks Administration Secretariate : Administration Council's General Expenses Health Services Personnel Infrastructural Services : Administration Roads and Stormwater Railway Sidings Finance Mechanical Services Urban Planning
141 330 190 000 496 800
1 042 500 2 131 000
59 744 840 267 500
3 843 500 100 000
4 168 000
265 097
2 474 752 8 210 375
13 652 494 836 159
3 003 824 3 815 951
11 345 988 10 953 629
5 156 997
427 548 182 1 561 935
11 954 863 11 755 950 26 533 541
145 163 154 690
6 713 521
543 935 840 353
1 668 282
45 308 69 937 077
80 772 9 338 190
91 855 3 469 951
(60 473)
6 609 52 854
1 380 552 43 157
220 056 67 547
417 336 (427 642)
(531 088)
16 746 016
153 213 498 651
1 309 834
325 570
2 613 306 8 312 211
18 985 463 793 002
2 783 768 4 292 339
11 769 005 13 049 553
5 733 393
480 739 243 1 642 707
21 139 840 11 349 154 28 693 658
21 336 840 Subsidised Services 14 931 935 1 003 451 616 12 542 242 (26 965 082) 1 042 958 940
1 193 419
2 104 430 1 442 777
2 702 525 1 873 811
338 021
6 360 368 1 476 159 3 845 330
Ambulance and Fire Brigade Parks and Recreation : Cemeteries Zoo and Nature Conservation Airport Parks and Public Grounds Recreational Facilities Stadiums Swimming Baths Secretariate : Miscellaneous Properties Library Services Civil Buildings Civic Theatre Rural Areas
3 067 500
2 268 000 742 925
2 449 280 2 035 000
339 230 4 030 000
16 631 548
10 452 841 8 997 477 2 357 032
29 066 476 42 157 810 49 075 060 11 992 067
707 349 213
7 371 330 106 657 294
1 054 520 10 288 948
3 064 703
1 850 841 705 017
2 257 383 1 440 065
496 507 2 727 726
63 914
(221 011)
796 712 26 831 949
(41 822 101) (270 220)
(9 675 270)
531 980 (3 201 035)
19 632 337
12 524 693 9 702 494 2 357 032
30 527 147 16 765 926 90 897 161 12 262 287
717 024 483
7 335 857 112 586 055
1 054 520 10 288 948
54 079 553 Economic Services 53 309 320 343 272 620 63 435 482 (786 347) 407 494 449
203 2 409 220
51 670 130 Procurement: Stores
Sanitary and Night Soil Sewerage Petra Quarry
4 778 000
48 531 320
3 007 740 61 422 836
275 711 894 3 130 150
4 942 479
58 493 003
1 995 1 106 336
(1 894 678)
3 005 745 65 258 979
336 099 575 3 130 150

31
APPENDIX C (Continued)
ANALYSIS OF FIXED ASSETS
EXPEN-DITURE
2003/2004
R
SERVICE
BUDGET 2004/2005
R
BALANCE
AT 30/6/2004
R
EXPEN- DITURE 2004/2005
R
WRITTEN OFF, TRANS-
FERRED, REDEEMED
OR DISPOSED
OF DURING THE YEAR
R
BALANCE
AT 30/6/2005
R
4 908 627
HOUSING SERVICES 12 299 680
38 440 645
4 396 410
(3 091 238)
45 928 293
4 908 627 Housings Schemes
12 299 680 38 440 645 4 396 410 (3091 238) 45 928 293
88 606 331 TRADING SERVICES
89 610 000
931 392 237
79 619 413
5 130 207
1 005 881 443
58 032 976 1 822 864
28 750 491 Electricity
Produce Market Water
55 912 530 100 000
33 597 470
635 948 094 22 474 205
272 969 938
40 786 377 733 694
38 099 342
335 432
4 794 775
676 399 039 23 207 899
306 274 505
246 205 994 TOTAL FIXED ASSETS 242 276
4052 855 626 855 253 022 644 (5 835 838) 3 114 485 337
101 457 111
LESS: LOANS REDEEMED AND OTHER CAPITAL RECEIPTS
2 127 058 780
116 007 533
(49 187 112)
2 292 253 425
2 841 548 8 054 101
81 945 297 8 616 165
Loans redeemed and advances repaid Contributions from operating income Contributions from reserves Grants and subsidies Public contributions
872 784 068 67 646 485
914 515 122 187 492 070 84 621 035
932 197
10 348 300 95 056 849 9 670 187
(57 398 296) 2 269 028 5 872 164
69 992
930 182 364 66 309 654
918 991 258 282 478 927 94 291 222
144 748 883 NET FIXED ASSETS 728 568 075 137 015 111 43 351 274 822 231 912

32
APPENDIX D
ANALYSIS OF OPERATING INCOME AND EXPENDITURE
FOR THE YEAR ENDED 30 JUNE 2005
ACTUAL
2004
R
ACTUAL
2005
R
BUDGET
2005
R
189 014 322
12 688 806
209 792 555
407 523 843
189 528 462
204 927 957
INCOME Grants and Subsidies - Central Government - Regional Government Operating Income - Assessment rates - Sale of electricity - Sale of water - Other - Transfer from reserve
213 527 493
13 523 082
231 494 588
451 563 138
203 437 885
257 432 284
45 000 000
217 849 690
11 371 790
230 542 540
436 722 060
187 134 830
274 358 180
45 000 000
1 213 475 945 1 415 978 470 1 402 979 090
350 404 799
220 866 426
114 869 967
291 902 130
78 866 336
116 539 522
2 816 115
33 407 480
EXPENDITURE Salaries, wages and allowances General expenses - Purchase of electricity - Purchase of water - Other expenses Repairs and maintenance Capital charges Contribution to fixed assets: Income Contribution to fixed assets: Grants Contributions
423 116 790
243 141 169
128 391 388
354 180 847
93 663 914
124 083 873
932 197 12 913 128
42 113 480
477 817 040
267 487 390
134 454 160
363 645 372
112 504 170
130 038 540
1 242 020 12 913 128
27 941 690
1 209 672 775
56 116 211
Gross expenditure Less : Amounts charged out
1 422 536 786
88 411 505
1 528 043 510
114 400 300
1 153 556 564 Net expenditure 1 334 125 281 1 413 643 210

33
APPENDIX E
DETAILED INCOME STATEMENT FOR THE YEAR ENDED 30 JUNE 2005
2004
ACTUAL INCOME
R
2004
ACTUAL
EXPEN-DITUR
E
R
2004
SURPLUS/
(DEFICIT)
R
2005 ACTUA
L INCOM
E
R
2005
ACTUAL EXPEN-DITURE
R
2005
SURPLUS/
(DEFICIT)
R
2005
BUDGET
SURPLUS/
(DEFICIT)
R
545 649 040
615 109
850
(69 460
810)
RATE AND GENERAL SERVICES
671 062 004
732 773 645
(61 711 641)
(89 477 740)
407 977 174 401 139 066 6 838
108 Community Services 529 842 558
506 116 736 23 725
822(174 680)

34
209 792 555
50 1 105 287 1 579 225 3 997 827
2 905
1 737 032 10 750
78 795
159 002 11 934 477
438 30 208
5 108 180 396 957
2 087
17 653 770 366 938
153 375 772
116 030 149 825
5 337 19 739
337 860
16 128
417 906 3 742
426 19 260
796 15 094
300
2 054 822
2 190 104
4 189 592
2 624 678
6 745 832
997 586 1 105
383 1 715
988 1 059
278
16 503 364
18 960 105
16 982
393
1 460 431
25 940 186
423 852
1 338 949
606 933 55 929
023 396 957
3 606 001
1 396 387
17 726 406
8 009 257
145 946 797
4 955 340
1 078 570
1 372 555
4 111 648
1 973 445
871 049 1 912
688 358 079
5 131 235
2 948
725
209 792 555
(417 856) (2 637
139) (17 681
571) (11 096
473)
(2 051 917)
(2 190 104)
(4 189 592)
(2 624 678)
(6 745 832)
(997 586) (1 105
383) (1 715
988) (1 059
278)
(14 766 332)
(18 949 355)
(16 903
598)
(1 301 429)
(14 005 709)
(423 852)
(1 338 511)
(576 725) (50 820
843)
(3 603 914)
(1 396 387)
(72 636) (7 642
319) 7 428
975 (4 955
340) (1 078
570)
(1 372 555)
(3 995 618)
(1 823 620)
(865 712) (1 892
949) (358 079)
(4 793 375)
(2 932
597
Assessment Rates Protection Services - Administration - Civil Defence - Security - Traffic Control Parks and Recreation - Administration Executive Office - City Manager - Office of the Mayor - Office of the Speaker Executive Directors - Administration - Chief Operations Officer - Corporate Services - Infrastructural Services - Community and Social Development - Economic Development and Planning Secretariate - Administration - Council's General Expenses Corporate Services Medical Officer of Health - Administration - Health Services - Community Development Infrastructural Services - Administration - Design - Roads and Stormwater - Railway Sidings - Mechanical Service - Rural Area Development Finance - Administration - Miscellaneous Services - Governmental Transfers - Grants-in-Aid - Internal Audit Economic Development and Planning - Administration - Town Planning - Metropolitan Planning - Drafting Service - Property Administration - Environmental management - Building Maintenance - Industrial Marketing & Public Relations
231 494 588
1 816 1 214 855 1 578 285 5 258 060
5 994
360 6 605 000
17 750 329
2 600
201 864 1 500
917 679
6 886 13 139
445
821 036 22 267
4 794 204 310 934
1 305 231
30 867 598
49 633 908
163 614 772
100
937 29 073
476 13 321 18 483
230 957
2 288 297 3 180 462
19 724 791
15 618 392
3 229 530
2 422 290 23 742
980 3 159 654
20 254 746
1 548 019
1 672 878 1 135 992
7 441 369 16 228
715
34 434 670
1 427 002 27 874
965 975 166
2 782 687 131 257 83 045
922 310 934
7 143 742 1 293 253
31 082 838
10 615 016
158 649 508
5 413 797 2 004 169
949 352 4 489 032 1 921 537
961 824 2 864 913 1 279 204
4 817 833
231 494 588
(2 286 481)
(1 965 607)
(18 146 506)
(10 360 332)
(3 223 536)
(2 421 930)
(17 137 980)
(3 159 654)
(2 504 417)
(1 548 019)
(1 670
278) (1 135
992)
(7 239 505)
(16 227 215)
(33 516
991)
(1 420 116)
(14 735 520)
(975 166)
(1 961 651)
(108 990) (78 251
718)
(5 838 511)
(1 293 253)
(215 240) 39 018
892 4 965
264 (5 413
797) (2 004
069)
(948 415) (4 459
959) (1 921
061) (948 503)
(2 846 430)
(1 279 204)
(4 586 876)
230 542 540
(2 342 480)
(2 442 050)
(19 224 020)
(10 701 790)
(2 863 140)
(2 216 800)
(15 265 050)
(2 713 320)
(2 301 020)
(1 088 850)
(1 657
830) (1 166
460)
(8 190 150)
(17 967 990)
(32 932
540)
(1 323 970)
(18 039 520)
(977 270)
(1 997 800)
175 790 (77 896
620) (97 510)
(2 320 420)
(1 441 190)
457 690 20 367
900 0
(5 450 930)
(2 417 080)
(1 034 930)
(5 265 450)
(1 969 190)
(942 670) (2 631
540) (1 652
070)
(3 186 950)
12 964 735
97 740 605
(84 775 870)
Subsidised Services 12 062
101
101 683
465 (89 621
364)
(89 963
230)
2 129 614 4 011 474
932 404 189 099 108 146
2 405 126 333 046
1 706 634 577 422 571 770
22 552 424
6 658 786
3 843 911
251 701 22 820
633 11 582
285 3 997
224 2 746
525 10 165
410 12 840
300 281 406
(20 422 810)
(2 647 312)
(2 911 507)
(62 602) (22 712
487) (9 177
159) (3 664
178) (1 039
891) (9 587
988) (12 268
530) (281 406)
Fire Protection Cemeteries Zoo and Nature Conservation Airport Parks Sport and Recreation Swimming Baths Sundry Properties City Library Services Civic Buildings Civic Theatre
1 484 007 3 190 352 1 004 038
201 809 97 679
1 475 228 453 388
2 155 240 303 102
1 697 258
21 572 395
6 114 517 3 841 634
253 467 26 310
766 10 962
074 4 856 257 2 426 664
10 254 675
14 994 328
96 688
(20 088 388)
(2 924 165)
(2 837 596)
(51 658) (26 213
087) (9 486
846) (4 402
869) (271 424)
(9 951 573)
(13 297 070)
(96 688)
(19 812 030)
(3 011 580)
(3 328 420)
(89 190) (25 593
800) (9 291
700) (3 750
240) (362 020)
(10 485 180)
(13 976 300)
(262 770)

35
APPENDIX E (Continued)
DETAILED INCOME STATEMENT FOR THE YEAR ENDED 30 JUNE 2005
2004
ACTUAL INCOME
R
2004
ACTUAL
EXPEN-DITUR
E
R
2004
SURPLUS/
(DEFICIT)
R
2005 ACTUA
L INCOM
E
R
2005
ACTUAL EXPEN-DITURE
R
2005
SURPLUS/
(DEFICIT)
R
2005
BUDGET
SURPLUS/
(DEFICIT)
R
124 707 131
116 230 179
8 476 952
Economic Services 129 157
345
124 973
444 4 183
901
660 170
657 896 108 025
2 465 784 18 249 607
2 046 016 1 620 045
99 559 758
770 527 120 648
5 768 323
56 474 416
19 305 375
33 790 890
(112 631) (12 623)
(3 302 539)
(38 224 809)
(17 259 359)
(32 170 845)
99 559 758
Parking Garage Taxi Terminus Building Management and Control Cleansing Service Sanitary and Nightsoil Sewerage Sanitary Fees
596 996 112 596
3 169 244 7 474 641 6 903 014
896 545 110 004
309
854 277 302 111
5 959 676 58 892
966 19 061
272 39 903
142
(257 281) (189 515)
(2 790 432)
(51 418 325)
(12 158 258)
(39 006 597)
110 004 309
(397 980) (88 060)
(5 254 280)
(51 766 920)
(15 344 630)
(35 932 370)
109 444 410
6 405 842 6 846 430 (440 588) HOUSING SERVICES 6 772 319 11 249
636 (4 477 317)
(5 217 990)
1 670 506
3 660 206 219 887
33 957 58 780
198 192
178 873 385 441
2 111 094
3 660
206 219 887
33 957 58 780
198 192
178 873 385 441
(440 588)
Administration Rental Housing Economic Schemes Sub-economic Schemes Compound Mangnaung Mangaung Hostel Heidedal - Economic Schemes - Sub-economic Schemes
949 844 950 181
3 778 007 219 299
31 959 58 780
213 408
181 198 389 643
956 900 5 420 442 3 778 007
219 299 31 959 58 780
213 408
181 198 389 643
(7 056) (4 470
261)
(645 520) (4 572
470)
661 421 063
531 600 284
129 820
779
TRADING SERVICES 738 144
147
590 102
000
148 042 147
84 031
610
433 197 199 9 512 390
218 711 474 350 293 906
8 080 208
173 226 170
82 903 293
1 432 182
45 485 304
Electricity Produce Market Water
489 227 515
9 631 042 239 285
590
384 539 598
9 025 891 196 536
511
104 687 917
605 151 42 749
079
62 998 850
1 928 100
19 104 660
1 213 475
945 1 153
556 564 59 919
381 TOTAL
1 415 978 470
1 334 125
281
81 853
189
(10 664
120)
10 382
131
(58 037 455)
Distribution, Suspense and Quarry Accounts (Refer to Appendix E(i)) Appropriations for the year
(952 968)
(79 380 161)
(57 951 542)
(85 913)
- Operating Account - Distribution, Suspense and Quarry Accounts (Refer to note 17)
(79 380 161)
-
12 264 057
24 117 586
Net surplus/ (deficit) for the year Accumulated surplus/ (deficit) beginning of the year
1 520
060
36 381 643
34 413 804
(10 296
218)
- Operating Account - Distribution, Suspense and Quarry Accounts
36 381 643
-
36 381 643 ACCUMULATED
SURPLUS/(DEFICIT) END OF THE YEAR
37 901
703
36 381 643
0 Operating Account
Distribution, Suspense and Quarry Accounts (Refer to Appendix E(i))
38 854 671
(952 968)

36
Note: As a result of the restructuring of the budget format, the allocation of accounts were changed. A comparison of actual income and expenditure for 2004 and 2005 is therefore only possible for some of the sections.

37
APPENDIX E (i)
DISTRIBUTION, SUSPENSE AND QUARRY ACCOUNTS DETAILED INCOME STATEMENT FOR THE YEAR ENDED 30 JUNE 2005
2004 ACTUAL INCOME
R
2004 ACTUAL EXPEN- DITURE
R
2004 SURPLUS/ (DEFICIT)
R
DISTRIBUTION, SUSPENSE AND QUARRY ACCOUNTS
2005 ACTUAL INCOME
R
2005 ACTUAL EXPEN- DITURE
R
2005 SURPLUS/ (DEFICIT)
R
2005 BUDGET
SURPLUS/ (DEFICIT)
R
5 511 328
8 936 220
28 283 186
1 331 966
5 499 841
58 969
13 754 839
4 836 015
478 734
1 674 102
5 915 607
29 350 475
1 155 305
5 499 841
(1 094 293)
10 493 181
4 836 015
478 734
3 837 226
3 020 613
(1 067 289)
176 661
1 153 262
3 261 658
DISTRIBUTION ACCOUNTS City Engineer Mechanical Services Electricity Service - Network Services Electricity Service - Training TARIFF VEHICLES Electricity Service Mechanical Services City Engineer STORES QUARRY ACCOUNTS Petra Dolerite Quarry Gravel Quarry
4 384 855
385 739
13 501 566
5 337 823
385 739
13 501 566
(952 968)
68 691 098 58 308 967 10 382 131 18 272 160 19 225 128 (952 968)
(85 913)
(10 296 218)
Appropriations for the year Accumulated surplus (deficit) beginning of the year
-
-
-
Accumulated surplus (deficit) end of year - Transferred to appendix E
(952 968)

38
APPENDIX E (ii)
HOUSING FUND (HOUSING ACT NO. 107 OF 1997) DETAILED INCOME STATEMENT FOR THE YEAR ENDED 30 JUNE 2005
2004 ACTUAL INCOME
R
2004 ACTUAL
EXPEN-DITURE
R
2004 SURPLUS/ (DEFICIT)
R
2005 ACTUAL INCOME
R
2005 ACTUAL
EXPEN-DITURE
R
2005 SURPLUS/ (DEFICIT)
R
2005 BUDGET
SURPLUS/ (DEFICIT)
R
1 261 346
6 575 945
(5 314 599)
Operating Account
1 195 784
8 619 630
(7 423 846)
-
76 704 330 Accumulated Fund beginning of the year 71 389 731 -
71 389 731 Accumulated Fund end of the year 63 965 885 -
39
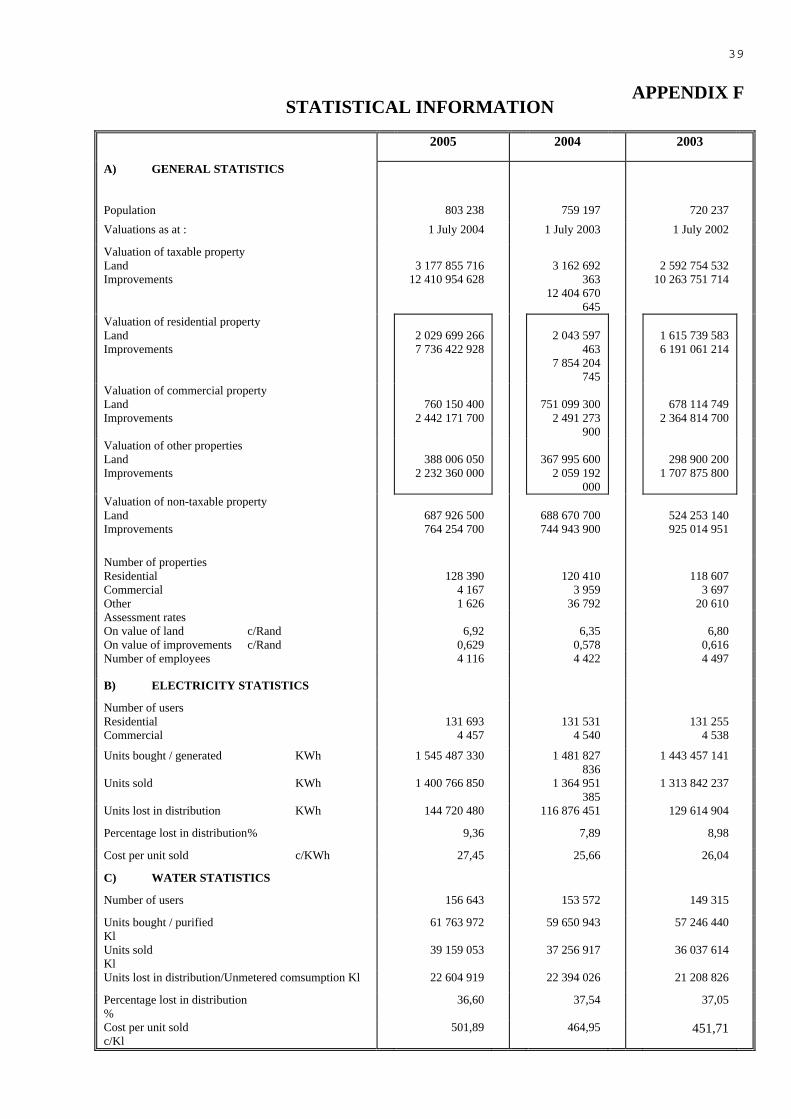
APPENDIX F STATISTICAL INFORMATION
2005 2004 2003
A) GENERAL STATISTICS Population
803 238
759 197
720 237
Valuations as at : 1 July 2004 1 July 2003 1 July 2002
Valuation of taxable property Land Improvements
3 177 855 716
12 410 954 628
3 162 692
363 12 404 670
645
2 592 754 532
10 263 751 714
Valuation of residential property Land Improvements
2 029 699 266 7 736 422 928
2 043 597
463 7 854 204
745
1 615 739 583 6 191 061 214
Valuation of commercial property Land Improvements
760 150 400
2 442 171 700
751 099 300
2 491 273 900
678 114 749
2 364 814 700
Valuation of other properties Land Improvements
388 006 050
2 232 360 000
367 995 600
2 059 192 000
298 900 200
1 707 875 800
Valuation of non-taxable property Land Improvements
687 926 500 764 254 700
688 670 700 744 943 900
524 253 140 925 014 951
Number of properties Residential Commercial Other
128 390
4 167 1 626
120 410
3 959 36 792
118 607
3 697 20 610
Assessment rates On value of land c/Rand On value of improvements c/Rand
6,92
0,629
6,35
0,578
6,80
0,616Number of employees 4 116 4 422 4 497
B) ELECTRICITY STATISTICS Number of users Residential Commercial
131 693
4 457
131 531
4 540
131 255
4 538
Units bought / generated KWh 1 545 487 330 1 481 827 836
1 443 457 141
Units sold KWh 1 400 766 850 1 364 951 385
1 313 842 237
Units lost in distribution KWh 144 720 480 116 876 451 129 614 904
Percentage lost in distribution % 9,36 7,89 8,98
Cost per unit sold c/KWh 27,45 25,66 26,04
C) WATER STATISTICS Number of users 156 643 153 572 149 315
Units bought / purified Kl
61 763 972 59 650 943 57 246 440
Units sold Kl
39 159 053 37 256 917 36 037 614
Units lost in distribution/Unmetered comsumption Kl 22 604 919 22 394 026 21 208 826
Percentage lost in distribution %
36,60 37,54 37,05
Cost per unit sold c/Kl
501,89 464,95 451,71

40NOTE: The populations as disclosed in Section A for 2004 and 2003 were restated.
BLOEMET CONSOLIDATED METROPOLITAN TRANSPORT FUND ACCOUNTING POLICIES The financial statements incorporate the following principal accounting policies which are consistent with those applied in the previous year. 1. The financial statements are prepared on the historical cost basis. 2. Grants received are recognised as income in the same year that the income is expended. 3. Equipment acquired are written off against contributions.

41 BLOEMET CONSOLIDATED METROPOLITAN TRANSPORT FUND
BALANCE SHEET AT 30 JUNE 2005 2003/2004
R
EMPLOYMENT OF CAPITAL 2004/2005
R
NETT CURRENT ASSETS
2 279 164 Current Assets 2 272 813
2 264 045
15 119
Due by Mangaung Local Municipality Debtors Interstate Bus Service
2 272 813
-
15 119 Planning
-
(2 279 164) Current Liabilities (2 272 813)
(2 279 164)
Contributions Prepaid Planning
(2 272 813)
(161 648) (1 832 921)
(284 595)
Department of Transport Free State Provincial Administration Mangaung Local Municipality
(161 648) (1 832 921)
(278 244)
0 0

42BLOEMET CONSOLIDATED METROPOLITAN TRANSPORT FUND INCOME AND EXPENDITURE FOR THE YEAR ENDED 30 JUNE 2005
2003/2004
R
2004/2005
R
1 49 825 12 013
292 400
4 651
EXPENDITURE CLAIMS SUBMITTED Planning Salaries - Urban Planning - Traffic Division Insurance Conferences Travelling and Subsistence
- 6 232
- - -
167 181 6 232
167 181
INCOME CONTRIBUTIONS RECEIVED Planning Mangaung Local Municipality
6 232
167 181 6 232

43
38
BLOEMET CONSOLIDATED METROPOLITAN TRANSPORT FUND
CASH FLOW STATEMENT FOR THE YEAR ENDED 30 JUNE 2005
NOTE 2005
R
2004
R CASH RETAINED FROM OPERATING ACTIVITIES
15 119
-
Decrease/(Increase) in working capital Cash contribution
2
15 119
-
NET CASH FLOW 15 119 -
CASH EFFECTS OF FINANCING ACTIVITIES (Decrease)/Increase in amount due to Mangaung Local Municipal
(15 119)
-
NET CASH UTILISED/(GENERATED) (15 119) -
NOTES TO THE FINANCIAL STATEMENTS 27. Equipment : 28. 29. Equipment at cost at beginning of year 30. 31. Written off against subsidies and contributions in previous years
-
-
288 167
(288 167)
Balance 30 June - -
Acquired during year at cost Written off against subsidies and contributions
-
-
-
-Balance 30 June - -
2. Cash utilised to increase working capital : Decrease/(Increase) in debtors (Decrease)/Increase in creditors
15 119
-
-
-
15 119 -
Related Documents


