FRUIT FLY ALGORITHM FOR ESTIMATION OF QUALITY RIPENINGOF FRUITS 1a V. Srividhya, 1b Dr. K.Sujatha and Dr. N. Jayachitra 1a,b Research Scholar/Prof., EEE/Chemical EngineeringDept, Center for Electronics, Automation and Industrial Research (CEAIR), Dr.M.G.R. Educational & Research Institute, Maduravoyal, Chennai, Tamil Nadu, India. 1a Asst. Prof., EEE Dept, Meenakshi College of Engineering, West K.k.Nagar, Chennai, Tamil Nadu, India. 1 [email protected] ABSTRACT Ripening is the progression by which fruits and vegetables attain their smart taste, brilliance, colour, edible nature and other textural properties. Ripening is related with variation in worki.e. varyfrom starch to sugar. A scheme for estimating ethylene (C 2 H 4 in ppm) stage employing soft sensor is the purpose of this work. The projected method relies on the color of the fruit or the vegetable which denotes the various stages of ripening which in turn indicates the amount of ethylene gas necessary for the ripening method. Apples, pears, bananas, and mangoes are some of the fruits that release ethylene while ripening. Ethylene is responsible for varying in texture, softening, color, and other processes anxious with ripening. The evaluation of ethylene concentration released from the fruits indicates the stage of fruit ripening and measurement of ethylene is predictable during the post gather of the fruits and also throughout the haulage of the fruits in order to avoid over ripening. The capability of ethylene required for fruit ripening is carried out using a Feed Forward Neural Network (FFNN) trained with Back Propagation Algorithm (BPA) also required to sort out the type of ripening. Fruits are also ripened by artificial ripening methods which are not supportable for consumption. The intensity values in color images of the fruits are used for characteristic mining which is then used as inputs to train the FFNN. In order to attain high exactitude and sensitivity, various provisions have to be taken in order to eradicate hindrance effects. These comprise, for instance, the compensation of temperature or pressure variations in the gas, which may have a control on the ripening process. The accessible techniques for measurement of ethylene gas are chromatographs, Fourier Transform, infrared spectroscopy and electrochemical sensors which are laboratory based logical methods and are pricey. To overcome the limitations of the accessiblelogical techniques a simple and cost valuable soft sensor desires to be developed. Keywords: Artificial Intelligence, Back Propagation Algorithm, Ethylene gas emission and Characteristic extraction. 1. INTRODUCTION Ripening is a progression which adds colour, taste, flavor, aroma and appearance for the fruits and vegetables becomefeasible. They are alienated as climacteric and non-climactericfor ripening of the fruits. Climacteric fruits are defined as fruits that enter ‘climacteric phase’ after yield i.e. they prolong to ripen. During the ripening process the fruits release ethylene along with increased rate of respiration [1]. Ripe fruits are malleable and feeble and usually cannot bear rigors of transport and frequent handling. These fruits are harvested solid and green, but fully grown-up and are ripened near consumption areas. Small quantify of ethylene is used to persuade ripening process under prescribed conditions of temperature and moisture. They include mango, guava, fig, apricot, banana, kiwi, apple, plum, pear and passion fruit [2]. The other category is the non-climacteric fruits once harvested do not grown-up further. Non climacteric fruits produce very small quantity of ethylene and do not respond to ethylene treatment. There is no characteristic increased rate of respiration or production of carbon dioxide. They consist of orange, grapes, litchi, watermelon, blackberry etc [3]. International Journal of Pure and Applied Mathematics Volume 118 No. 18 2018, 3191-3207 ISSN: 1311-8080 (printed version); ISSN: 1314-3395 (on-line version) url: http://www.ijpam.eu Special Issue ijpam.eu 3191

Welcome message from author
This document is posted to help you gain knowledge. Please leave a comment to let me know what you think about it! Share it to your friends and learn new things together.
Transcript
FRUIT FLY ALGORITHM FOR ESTIMATION OF QUALITY
RIPENINGOF FRUITS
1aV. Srividhya,
1bDr. K.Sujatha and Dr. N. Jayachitra
1a,bResearch Scholar/Prof., EEE/Chemical EngineeringDept, Center for Electronics, Automation and
Industrial Research (CEAIR), Dr.M.G.R. Educational & Research Institute, Maduravoyal, Chennai, Tamil
Nadu, India. 1a
Asst. Prof., EEE Dept, Meenakshi College of Engineering, West K.k.Nagar, Chennai, Tamil Nadu, India. [email protected]
ABSTRACT
Ripening is the progression by which fruits and vegetables attain their smart taste, brilliance,
colour, edible nature and other textural properties. Ripening is related with variation in worki.e. varyfrom
starch to sugar. A scheme for estimating ethylene (C2H4 in ppm) stage employing soft sensor is the purpose
of this work. The projected method relies on the color of the fruit or the vegetable which denotes the
various stages of ripening which in turn indicates the amount of ethylene gas necessary for the ripening
method. Apples, pears, bananas, and mangoes are some of the fruits that release ethylene while ripening.
Ethylene is responsible for varying in texture, softening, color, and other processes anxious with ripening.
The evaluation of ethylene concentration released from the fruits indicates the stage of fruit ripening and
measurement of ethylene is predictable during the post gather of the fruits and also throughout the haulage
of the fruits in order to avoid over ripening. The capability of ethylene required for fruit ripening is carried
out using a Feed Forward Neural Network (FFNN) trained with Back Propagation Algorithm (BPA) also
required to sort out the type of ripening. Fruits are also ripened by artificial ripening methods which are not
supportable for consumption. The intensity values in color images of the fruits are used for characteristic
mining which is then used as inputs to train the FFNN. In order to attain high exactitude and sensitivity,
various provisions have to be taken in order to eradicate hindrance effects. These comprise, for instance,
the compensation of temperature or pressure variations in the gas, which may have a control on the
ripening process. The accessible techniques for measurement of ethylene gas are chromatographs, Fourier
Transform, infrared spectroscopy and electrochemical sensors which are laboratory based logical methods
and are pricey. To overcome the limitations of the accessiblelogical techniques a simple and cost valuable
soft sensor desires to be developed.
Keywords: Artificial Intelligence, Back Propagation Algorithm, Ethylene gas emission and
Characteristic extraction.
1. INTRODUCTION
Ripening is a progression which adds colour, taste, flavor, aroma and appearance for the fruits
and vegetables becomefeasible. They are alienated as climacteric and non-climactericfor
ripening of the fruits. Climacteric fruits are defined as fruits that enter ‘climacteric phase’ after
yield i.e. they prolong to ripen. During the ripening process the fruits release ethylene along with
increased rate of respiration [1]. Ripe fruits are malleable and feeble and usually cannot bear
rigors of transport and frequent handling. These fruits are harvested solid and green, but fully
grown-up and are ripened near consumption areas. Small quantify of ethylene is used to persuade
ripening process under prescribed conditions of temperature and moisture. They include mango,
guava, fig, apricot, banana, kiwi, apple, plum, pear and passion fruit [2]. The other category is the
non-climacteric fruits once harvested do not grown-up further. Non climacteric fruits produce
very small quantity of ethylene and do not respond to ethylene treatment. There is no
characteristic increased rate of respiration or production of carbon dioxide. They consist of
orange, grapes, litchi, watermelon, blackberry etc [3].
International Journal of Pure and Applied MathematicsVolume 118 No. 18 2018, 3191-3207ISSN: 1311-8080 (printed version); ISSN: 1314-3395 (on-line version)url: http://www.ijpam.euSpecial Issue ijpam.eu
3191

2. EXISTING METHODS FOR RIPENING OF FRUITS BY SURVEY IN
PRACTICE
Lack of easier and rapid methods for constant ripening pose a key difficulty in the fruit industry.
Approximately all methods of ripening, either predictable or the modern chemical methods, come
with their own behavior. There are quite a few easy technologies and methods existing today for
farmers for good ripening. In general, the number of days taken for edible ripening varies for
different fruits and prevailing climatic conditions. They consist of
1. Mango ripening in an air stiff rice container. This is a usual process of ripening but not valid on
large scale.
2. Smoking inside smoke chambers using acetylene gas.
3. Layers of paddy shell or wheat straw as a naturalripening medium.
4. Immerse immature fruits in 0.1 per cent ethrel solution, clean dry and extend them over a
newspaper or clean cloth without touching each other.
5.10 ml of ethrel and 2 gm of sodium hydroxide pellets are added in five litres of water in a broad
mouthed container placed within the ripening chamber near the fruits and the room is preserved
air tight.
6. Fruit ripening by means of calcium carbideas aartifical ripening agent.
Prevention of Food Adulteration (PoFA) has forced stringent rules to discard the usage of
calcium carbide as it is dissolved in water, produces acetylene which acts as an artificial ripening
cause. Acetylene is found to affect the nervous system by reducing oxygen supply to brain.
Arsenic and phosphorus are noxious and exposure may cause severe health hazards. Hence from
this survey it is recognizedthat ,The only safe and worldwide conventional method is using
ethylene, which is a natural hormone for ripening when done under controlled temperature and
relative humidity conditions and pressure can be used for ripening process which is considered as
a secure process.
3. RIPENING PROCESS USING ETHYLENE GAS
Ethylene is aninnate hormone and does not stimulate any side effects to the human community
when consumed in large quantities over long periods [4]. This de-greening agent is capable of
converting the chlorophyll responsible for the green colour of the fruits to yellow colour which
indicates the carotenoids when applied under optimal ripening conditions [5]. The optimal
conditions are listed in Table 1
Table 1. Finest Ripening Conditions S.No Substantial Parameters Finest Range
1. Temperature 18 oCto 25
oC
2. Dampness 90 to 95%
3. Ethylene concentration 10 to 100 ppm
4. Extent of Exposure 24 to 74 hours depending on fruit type and stage of maturity
5. Air flow Sufficient to ensure distribution of ethylene
6. Aeration Require adequate air exchange in order to prevent accumulation
of O2’ which reduces effectiveness of C2H4.
Structure chosen for applying ethylene depends on cost, viability and security factors. Diluted
ethylene gas mix is securer than using pure ethylene, which is volatile and also combustible at 3%
or higher concentration [6]. Fruits to be fully grown are placed in a hermetically preserved
ripening room maintained at a constant temperature (18-21oC for most fruits, but 29-31
oC in
mango). The most favorable storage and ripening temperatures for various fruits are given in
Table 2.
International Journal of Pure and Applied Mathematics Special Issue
3192
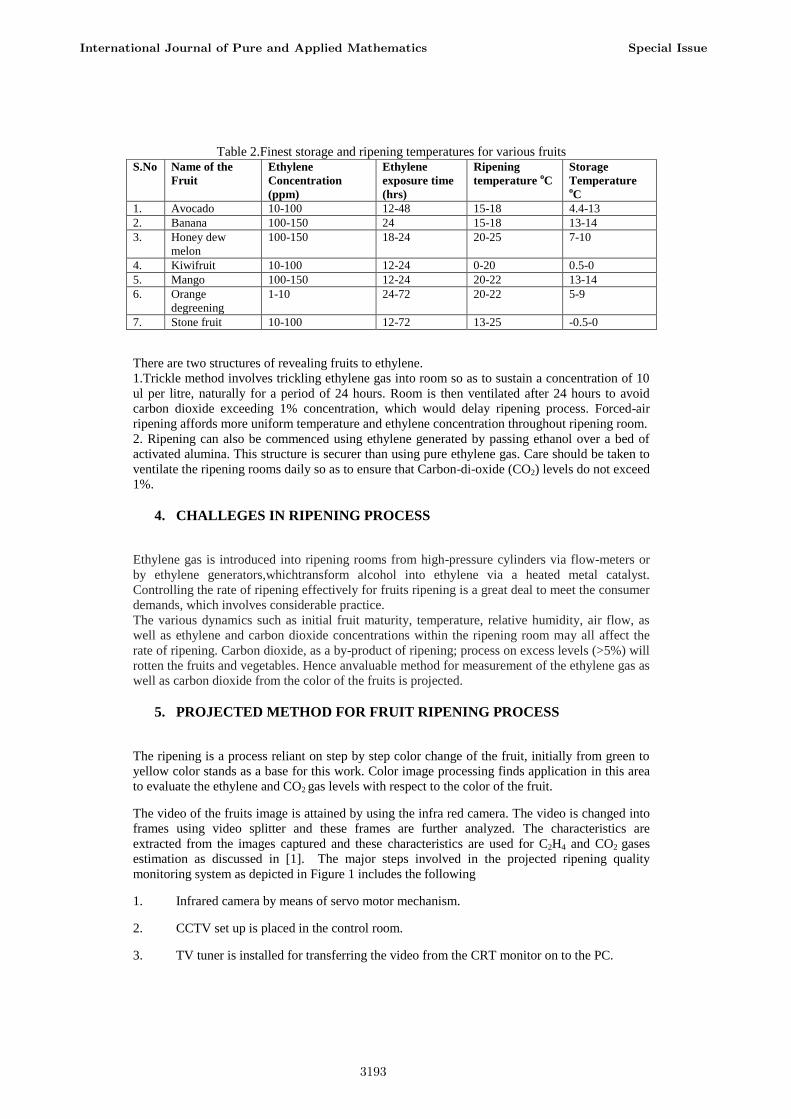
Table 2.Finest storage and ripening temperatures for various fruits S.No Name of the
Fruit
Ethylene
Concentration
(ppm)
Ethylene
exposure time
(hrs)
Ripening
temperature oC
Storage
Temperature oC
1. Avocado 10-100 12-48 15-18 4.4-13
2. Banana 100-150 24 15-18 13-14
3. Honey dew
melon
100-150 18-24 20-25 7-10
4. Kiwifruit 10-100 12-24 0-20 0.5-0
5. Mango 100-150 12-24 20-22 13-14
6. Orange
degreening
1-10 24-72 20-22 5-9
7. Stone fruit 10-100 12-72 13-25 -0.5-0
There are two structures of revealing fruits to ethylene.
1.Trickle method involves trickling ethylene gas into room so as to sustain a concentration of 10
ul per litre, naturally for a period of 24 hours. Room is then ventilated after 24 hours to avoid
carbon dioxide exceeding 1% concentration, which would delay ripening process. Forced-air
ripening affords more uniform temperature and ethylene concentration throughout ripening room.
2. Ripening can also be commenced using ethylene generated by passing ethanol over a bed of
activated alumina. This structure is securer than using pure ethylene gas. Care should be taken to
ventilate the ripening rooms daily so as to ensure that Carbon-di-oxide (CO2) levels do not exceed
1%.
4. CHALLEGES IN RIPENING PROCESS
Ethylene gas is introduced into ripening rooms from high-pressure cylinders via flow-meters or
by ethylene generators,whichtransform alcohol into ethylene via a heated metal catalyst.
Controlling the rate of ripening effectively for fruits ripening is a great deal to meet the consumer
demands, which involves considerable practice.
The various dynamics such as initial fruit maturity, temperature, relative humidity, air flow, as
well as ethylene and carbon dioxide concentrations within the ripening room may all affect the
rate of ripening. Carbon dioxide, as a by-product of ripening; process on excess levels (>5%) will
rotten the fruits and vegetables. Hence anvaluable method for measurement of the ethylene gas as
well as carbon dioxide from the color of the fruits is projected.
5. PROJECTED METHOD FOR FRUIT RIPENING PROCESS
The ripening is a process reliant on step by step color change of the fruit, initially from green to
yellow color stands as a base for this work. Color image processing finds application in this area
to evaluate the ethylene and CO2 gas levels with respect to the color of the fruit.
The video of the fruits image is attained by using the infra red camera. The video is changed into
frames using video splitter and these frames are further analyzed. The characteristics are
extracted from the images captured and these characteristics are used for C2H4 and CO2 gases
estimation as discussed in [1]. The major steps involved in the projected ripening quality
monitoring system as depicted in Figure 1 includes the following
1. Infrared camera by means of servo motor mechanism.
2. CCTV set up is placed in the control room.
3. TV tuner is installed for transferring the video from the CRT monitor on to the PC.
International Journal of Pure and Applied Mathematics Special Issue
3193

4. Image processing packages are stacked in the laptop connected to the TV tuner.
5. The video file which is split up into frames for further scrutiny.
6. Image processing algorithms for analyzing the constituents of the images.
7. Intelligent control scheme to monitor and estimate the ripening process.
8. The validation of the developed algorithms.
Figure 1. Schematic diagram of the projected fruit ripening monitoring system
6. OBJECTIVE OF THE PROJECTED METHOD
The primary objective of this workis todevelop a fruit ripening quality monitoring system using
fruit image scrutiny by colour image processing in the container.According to the brightness
value of the image pixels, the ripening characteristic parameters are picked up from the images.
The online monitoring of ripening quality, C2H4 and CO2 gas estimation using intelligent image
processing technique thereby offers dynamic adjustment of C2H4 flow rate so as to ensure
effective ripening process.
7. RESULTS AND DISCUSSION
The results for various conventional and intelligent schemes for monitoring fruit ripening process
are discussed elaborately in this chapter. The images are preprocessed to ensure that it should be
noise free and the desired images are used for scrutiny and monitoring purposes alone. The
schematic for the projected concept is shown in Figure 2.
International Journal of Pure and Applied Mathematics Special Issue
3194

Figure 2.Methodology for Fruit ripening process using Image processing
The fruit images are captured by the infra red camera asa sensor placed at the top corner of the
room with a servomotor mechanism for changing the direction of the camera. The infra red
camera is of Sony make. The video acquired is converted to frames using video splitter software.
The images acquired are preprocessed, analyzed before feature extraction and classification. The
collected data is recorded in Table 3.
The preprocessing includes dithering,filtering and edge detection. The filtering removes noise so
that the noise free images can be used for additional analysis and the edge detection is carried out
to extract the region of interest which in turn determines the characteristics to be extracted.
Table 3. Ripening parameters corresponding to various fruits
Ripening parameters Stage 1 Stage 2 Stage 3 Stage 4 Stage 5 Stage 6 Stage 7
Images of Banana fruit
Images of Mango fruit
NA NA
Ethylene conc.(ppm) for
Banana fruit 140-150 130-140 120-130 115-120 110-115 110-100 100 -10
Ethylene conc.(ppm) for
Mango fruit 140-150 130-140 120-130 110-120 110-100 NA NA
Ethylene
exposure time
(hrs) for Banana fruit
24 24 24 12 12 6 6
Ethylene
exposure time
(hrs) for Mango fruit
24 24 24 12 12 NA NA
Ripening temp. oC for Banana fruit
15-
15.25
15.25-
15.5
15.5-
16.25
16.25-
16.5 16.5-17.25
17.25-
17.5 17.5-18
Ripening temp. oC for Mango fruit
22 22 22 21 20 NA NA
International Journal of Pure and Applied Mathematics Special Issue
3195

Image approximation is done to decrease the number of colors in an image; the ensuing image
might look mediocre to the original, because some of the colors are vanished. Dithering is
performed to amplify the visible number of colors in the output image and also changes the colors
of the pixels in thevicinity so that the normal color in each neighborhood approximates the unique
RGB color.The output for dithering and filtering for Banana is shown in figure 3.
Figure 3.Output for Dithering and Filtering
The output for dithering and filtering for Mango is shown in figure 3
International Journal of Pure and Applied Mathematics Special Issue
3196
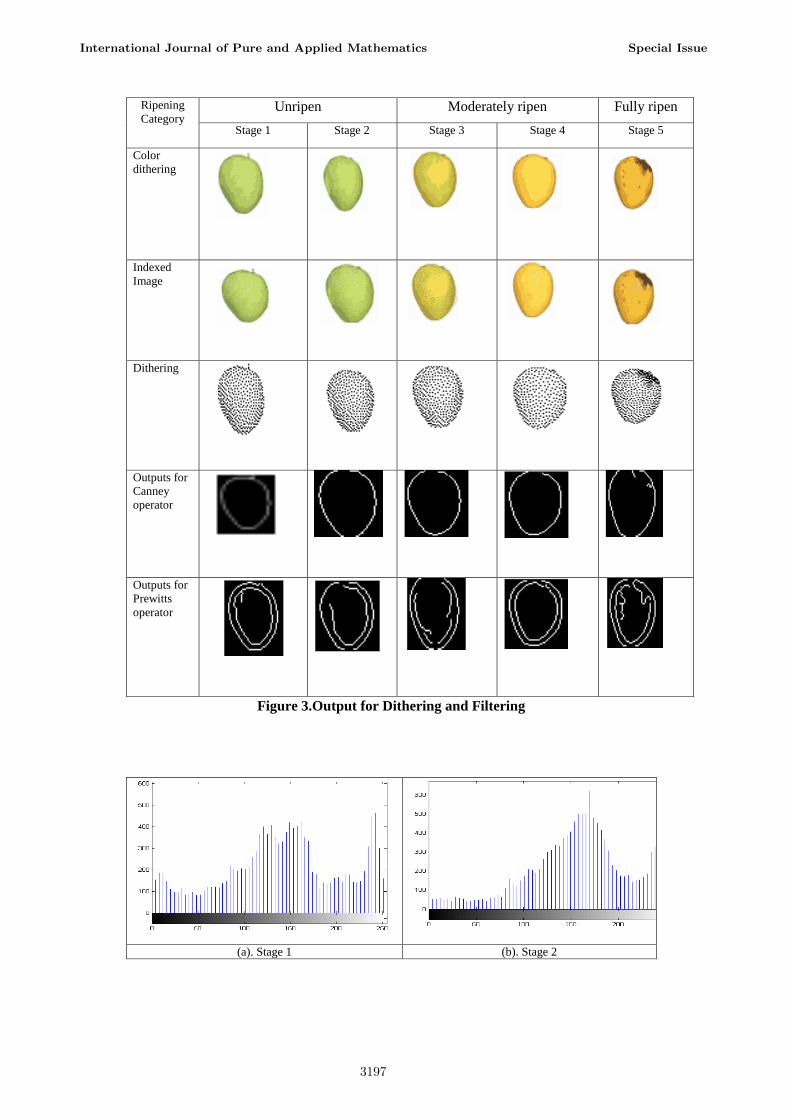
Figure 3.Output for Dithering and Filtering
(a). Stage 1 (b). Stage 2
Ripening
Category Unripen Moderately ripen Fully ripen
Stage 1 Stage 2 Stage 3 Stage 4 Stage 5
Color
dithering
Indexed
Image
Dithering
Outputs for
Canney
operator
Outputs for
Prewitts
operator
International Journal of Pure and Applied Mathematics Special Issue
3197

(c). Stage 3 (d). Stage 4
(e). Stage 5 (f). Stage 6
(g). Stage 7
Figure 4. Histogram for Ripening process of Banana
(a). Stage 1 (b). Stage 2
0 50 100 150 200 250
0
50
100
150
200
0 50 100 150 200 250
0
20
40
60
80
100
120
140
160
International Journal of Pure and Applied Mathematics Special Issue
3198

(c). Stage 3 (d). Stage 4
(e). Stage 5
Figure 4. Histogram for Ripening process of Mango
Figure 4 denotes the histogram which is the plot between the pixel strength and their frequency of
occurrence. During the initial stages (from 1 to 3 stages denoted as Unripen) of ripening, the
strength values lie between a minimum of 100 to a maximum of 175 which is totally green in
colour (see Figure 4(a) to (c)).For the stages 4 and 5 (denoted as Moderately ripen) the maximum
and minimum strength range is 175-225 (Figure 4(d) to (e)). These stages are partially green and
yellowish. For the remaining 2 stages(denoted as Fully ripen) which is entirely yellowish; the
strength values range from 175- 255 which is evident from Figure 4(f) to (h). This histogram
analysis is done to verify that the colour variation facilitates the measurement and control of the
ethylene gas supply which is used as the ripening agent.
The various features like mean, standard deviation, mode and variance are extracted from the
images. The features represent the basic pattern that gets repeated in various directions to form an
image. Hence by extracting the selective features the ripening state as well the amount of
ethylene gas inside the ripening chamber can be calculated.
Table 4. Feature Extraction for Mango
0 50 100 150 200 250
0
20
40
60
80
100
120
140
160
0 50 100 150 200 250
0
20
40
60
80
100
120
140
160
0 50 100 150 200 250
0
20
40
60
80
100
120
140
160
Table 4. Feature Extraction for Banana S.No Mean StdDev Mode Median
1. 110.541 68.044 255 91
2. 140.89 59.907 244 125
3. 174.705 56.475 246 170
4. 187.24 55.931 255 206
5. 181.119 57.356 218 199
6. 231.265 35.707 246 245
7. 196.985 38.898 221 203
International Journal of Pure and Applied Mathematics Special Issue
3199

S.No Mean StdDev Mode Median
1. 201.948 48.483 255 182
2. 195.823 47.657 255 177
3. 197.311 46.854 255 181
4. 205.218 40.925 255 187
5. 188.681 54.928 255 169
The evaluationwasdoneusingFeedForward (FF) architecture of trainedwith Back Propagation
Algorithm (BPA). The FF Neural Network (NN) is constructed by highly interconnected
processing units (nodes or neurons) which perform simple mathematical operations. Neural
networks are characterized by their topologies, weight vectors and activation function which are
used in the hidden layers and output layer. The topology refers to the number of hidden layers
and connection between nodes in the hidden layers. The activation functions that can be used are
sigmoid, hyperbolic,tangent and sine.
The network models can be static or dynamic. Static networks include single layer perceptrons
and multilayer perceptrons. A perceptron or adaptive linear element (ADALINE) refers to a
computing unit. This forms the fundamental building block for neural networks. The input to a
perceptron is the summation of input pattern vectors by weight vectors. Information flows in a
feed-forward manner from input layer to the output layer through hidden layers. The number of
nodes in the input layer and output layer is fixed. It depends upon the number of input variables
and the number of output variables in a pattern. In this work, there are seven input variables and
one output variable. The number of nodes in a hidden layer is fixed by trial and error. In this
application, the network parameters suchas the number of nodes in the hidden layers and the
number of hidden layers are found by trial and error method. In most of the applications one
hidden layer is adequate. As the name implies BPA the weight updation takes place in the reverse
order i.e. from the output layer to input layer [7].
FFNN structure trainedwith BPA isused to identify the estimation of ethylenegas for
ripeningprocessso as to prevent the fruits fromrotteningduring the process of de-greening.
Emission of CO2islikely to rotten the ripened fruits ratio and flametemperature. The
featuresobtainedfrom the images are given as the inputs to the FFNN.Table 5 contains the values
for various features extracted. The target is the value of the C2H4 gas concentration. The
normalized values of the features are used for obtaining results from the various intelligent
classifiers. For normalization each value of the feature divided by the maximum value of that
feature is used as the formula so as reduce the computational complexity.
The inputs for FFNN trained with BPA require4 features as given in Table 5. A set of final
weights are obtained by training with desired target value (C2H4gas concentration). Testing the
projected algorithm to infer the ripening state and C2H4 gas concentration from the fruit image is
done with final weights obtained after training to achieve feed forward control C2H4 gas
concentration. The outputs of the FFNN trained with BPA are shown in Figure 5. Similarly the
FFNN was trained and tested as discussed above. The Table 5 shows the network parameters with
values prescribed for the objective function.
Validation of FFNN withfour features as input and one output is done. Table 5 given
below shows the data relating to the fruit images collected at some other stage of time. The results
in Table 6 support that intelligent estimation isvaluable for fruit ripening quality monitoring. The
training and testing results are very close to the validation results. The precision and recall for all
the three classes are shown in Table 7 below.
International Journal of Pure and Applied Mathematics Special Issue
3200
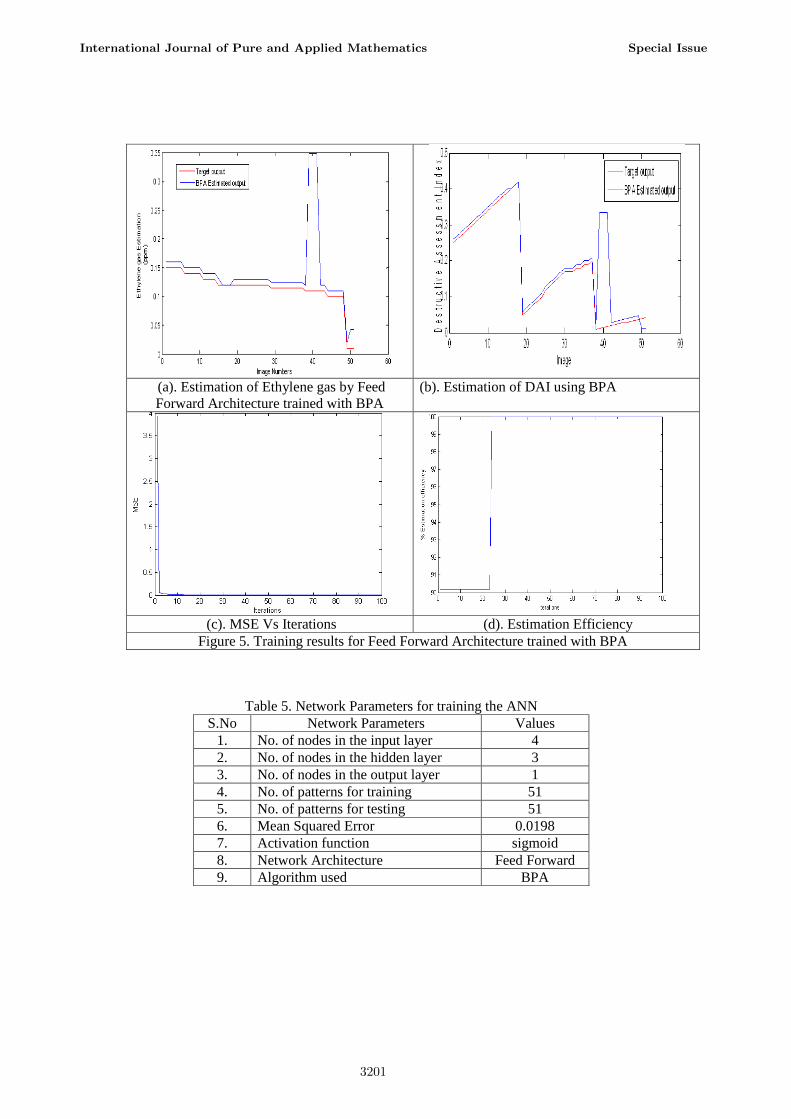
(a). Estimation of Ethylene gas by Feed
Forward Architecture trained with BPA
(b). Estimation of DAI using BPA
(c). MSE Vs Iterations (d). Estimation Efficiency
Figure 5. Training results for Feed Forward Architecture trained with BPA
Table 5. Network Parameters for training the ANN
S.No Network Parameters Values
1. No. of nodes in the input layer 4
2. No. of nodes in the hidden layer 3
3. No. of nodes in the output layer 1
4. No. of patterns for training 51
5. No. of patterns for testing 51
6. Mean Squared Error 0.0198
7. Activation function sigmoid
8. Network Architecture Feed Forward
9. Algorithm used BPA
International Journal of Pure and Applied Mathematics Special Issue
3201

8. GENETIC ALGORTHIM
Genetic algorithms are based on biological progress. Genetic algorithms can be used to explain a
wide variety of problems. Given a problem a genetic algorithm generates a set of possible
solutions and evaluates each in order to choose which solutions are fit for reproduction. If a
particular solution is more fit then it will have more chances to generate new solutions. Finally
we can find a real solution.
The genetic algorithm uses three main types of rules at each step to produce the next generation
from the current population:
Selection rules select the individuals, called parents, that contribute to the population at the
next generation.
Crossover rules combine two parents to form children for the next generation.
Mutation rules apply random changes to individual parents to form children.
Artificial Intelligence (AI) is the study and creation of computer systems that can perceive reason
and act. The primary aim of AI is to produce intelligent machines. The intelligence should be
exhibited by thinking, making decisions, solving problems, more importantly by learning. AI is
an interdisciplinary field that requiresfacts in computer science, linguistics, psychology, biology,
philosophy and so on for serious research.Genetic algorithm is a kind of Artificial Intelligence
which is used to train the neural network.
Figure6. Flowchart for Genetic algorithm
The extracted features are used for estimation by Genetic Algorithm. The Genetic Algorithm
along with the extracted features is used for training the ANN. The close connection between the
training and testing patterns in identification of mango ripening with respect to intensity is shown
in Figure 7. Similarly the surface plot in Figure 8 shows the relation between the intensity and
International Journal of Pure and Applied Mathematics Special Issue
3202

ripening stage. The estimation of Quality ripening process and generations is depicted in Figure
9.The improvement made in application side denotes that earlier a circuit with capacitance is used
to generate ethylene gas for this purpose which is on other hand replaced by using a soft
sensor.The parameters of GAis shown in Table 6.
Figure7. Estimation of intensity values by GA in ripening stage identification
0 5 10 15 20 25 30 35 40-6
-4
-2
0
2
Générations
x
0 5 10 15 20 25 30 35 40-6
-4
-2
0
2
Générations
y
TABLE 6. Parameters of GA
S.No Parameters in GA Parameter value
1. No. of Generations 40
2. Population size 150
3. Fitness value 0.022
4. Probability of mutation 0.1
5. Type of cross over Single point cross over
6. No. of bits in cross over 8
International Journal of Pure and Applied Mathematics Special Issue
3203

Figure8. Surface plot for Ripening stage
Figure9. Estimation of Quality ripening process by GA
Figure 10. Results for fruit fly algorithm
-3-2
-10
12
3
-2
0
2
0.5
1
1.5
2
x
L a fonction à maximiser
y
0 5 10 15 20 25 30 35 400
0.5
1
1.5
2
2.5
Générations
Quality of R
ipenin
g
fully mature
partially mature
unripened
International Journal of Pure and Applied Mathematics Special Issue
3204

9. CONCLUSION
In this work, 102 images collected from the ripening room. The images are pre-processed and
features are extracted. Training of FFNN using BPA is done with 51 images taken for unripen,
moderately ripen and fully ripen so as to achieve the final output. Also other AI based methods
like GA and FFA are incorporated. Testing and validation results shown in Table 7 indicate that
maximum classification performance is obtained using FFA. Classification performance can be
improved by further pre-processing of the acquired images. Depending on the quality of ripening;
corresponding to the colour of the fruit images necessary action is taken to increase or decrease
the C2H4 gas supply so as to ensure complete efficient ripening process. The inferred parameters
can be displayed through the cloud service for anytime monitoring and control providing a cost
valuable solution. To conclude with there is a further scale to extend the work by considering the
spectrum of the images.
REFERENCES
[1] Nelson SO, Bartley JPG (2002) Frequency and temperature dependence of the dielectric
properties of food materials. Transactions of the ASAE 45(4): 1223–1227.
[2] Nelson SO, Wen-chuan G, Samir T, Stanley JK (2007) Dielectric spectroscopy of
watermelons for quality sensing. Meas. Sci. Technol 18: 1887–1892.
[3] Nelson SO, Wen-chuan G, Samir T, Stanley JK (2008) Investigation of dielectric sensing for
fruit quality determination. IEEE Sensors Applications Symposium Atlanta, GA, February 12-14.
[4] Ragni L, Gradari P, Berardinelli A, Giunchi A, Guarnieri A (2006) Predicting quality
parameters of shell eggs using a simple technique based on the dielectric properties.Biosystems
Engineering 94 (2): 255–262.
[5] Salvador A, Sanz T, Fiszman SM (2007) Changes in color and texture and their relationship
with eating quality during storage of two different dessert bananas. Postharvest Biology and
Technology 43: 319–325.
[6]. Sirikulrat k, Sirikulat N (2008) Dielectric properties of different maturity soybean. KMITL
Sci. J 8(2): 12-18.
[7] Sujatha, K. Pappa N. (2011) Combustion Quality Monitoring in PS Boilers Using Discriminant RBF, ISA Transactions, Elsevier, Vol.2(7), pp.2623-2631.
0 10 20 30 40 50 60 70 80 90 1002.995
2.9955
2.996
2.9965
2.997
2.9975
2.998
2.9985
2.999
2.9995
3Optimization process
Iteration Number
Sm
ell
0 10 20 30 40 50 60 70 80 90 1002.995
2.9955
2.996
2.9965
2.997
2.9975
2.998
2.9985
2.999
2.9995
3Optimization process
Iteration Number
Sm
ell
Table 7. Comparison of performance criteria for testing and validation
Comparison
Testing/Validation Class 1 Class 2 Class 3
Precision Recall Precision Recall Precision Recall
Testing results 1 1 0.894 1 0.85 1
Validation results 1 1 0.8358 1 0.8 1
International Journal of Pure and Applied Mathematics Special Issue
3205

International Journal of Pure and Applied Mathematics Special Issue
3206

3207

3208
Related Documents