Fruit and Vegetables in Cancer Prevention Harri Vainio and Elisabete Weiderpass Abstract: Our aim was to review the epidemiological litera- ture on possible cancer-preventive effects of the consumption of fruits and vegetables in humans, to quantify the effect of high versus low consumption of fruits and vegetables, and to give an overall assessment of the existing evidence. We based our work on an expert meeting conducted by the Interna- tional Agency for Research on Cancer in 2003. A qualitative reading and evaluation of relevant articles on the can- cer-preventive effect of the consumption of fruits and vegeta- bles was made followed by the calculation of the mean rela- tive risk and range for cohort and case-control studies separately. The possible population-preventable fraction for modifying diet in relation to fruit and vegetable consumption was calculated as well as an overall statement about the de- gree of evidence for the cancer-preventive effect of fruit and vegetable consumption for each cancer site. There is limited evidence for a cancer-preventive effect of the consumption of fruits and vegetables for cancer of the mouth and pharynx, esophagus, stomach, colon-rectum, larynx, lung, ovary (veg- etables only), bladder (fruit only), and kidney. There is inade- quate evidence for a cancer-preventive effect of the consump- tion of fruits and vegetables for all other sites. Applying this range of risk difference to the range of prevalence of low in- take, the preventable fraction for low fruit and vegetable in- take would fall into the range of 5–12%. It is important to recognize that this is only a crude range of estimates and that the proportion of cancers that might be preventable by in- creasing fruit and vegetable intake may vary beyond this range for specific cancer sites and across different regions of the world. Introduction In the early 1900s, the focus of diet research was on iden- tifying and preventing nutrient-deficiency diseases. Later, the focus changed to identifying nutrient requirements. More recently, research has focused on the role of diet in maintain- ing health and reducing the risk of noncommunicable dis- eases such as cancer. Potentially, all types of dietary components have potential to affect health status, causing or preventing diseases. In the past decades, abundant consumption of fruits and vegetables has been associated with a lower risk of several chronic dis- eases including cardiovascular diseases and overall mortality (1). Consumption of fruits and vegetables is low, particularly in developing nations. In 1998, only 6 of 14 World Health Or- ganization regions had an availability of fruits and vegetables to supply the recommended 400 g/day per inhabitant (1). In 1997, the World Cancer Research Fund and the American In- stitute for Cancer Research produced an extensive report stating that diets rich in fruits and vegetables “decrease the risk of many cancers” (2). Their evaluation was based mainly on the existing case-control studies, which have inherent problems associated with measurement error. Since then, more recent prospective cohort studies, where recall bias is less of a problem, indicated that such diets may not be pre- ventive against cancer. In 2003, the International Agency for Research on Cancer (IARC) organized an expert meeting to access the evidence based on published literature of the can- cer-preventive effects of the consumption of fruits and vege- tables (3). The purpose of this handbook was to provide an up-to-date review of the knowledge about fruits and vegeta- bles collectively. We summarize here the main results of this meeting in what concerns cancer prevention in humans as well as the most important articles published in the field since then. A more complete and detailed description of the results has been published elsewhere (3). Methods Definition of Fruits and Vegetables Although culinary definitions are less precise than botani- cal definitions, they are commonly used by researchers and subjects in epidemiological surveys. The culinary definition of fruits and vegetables refers to edible parts of plant foods with the exclusion of cereal grains, nuts, and seeds. The culinary term for fruit refers to the part of a plant that contains the seeds and pulpy surrounding tis- sue. Plant parts used as vegetables include stems and stalks, roots, tubers, bulbs, leaves, flowers, some fruits, and pulses. The definition and classification of fruits and vegetables are NUTRITION AND CANCER, 54(1), 111–142 Copyright © 2006, Lawrence Erlbaum Associates, Inc. H. Vainio is affiliated with the Finnish Institute of Occupational Health, Helsinki, Finland. E. Weiderpass is affiliated with The Cancer Registry of Norway, N-0310, Oslo, Norway and the Karolinska Institutet, Department of Medical Epidemiology and Biostatistics, Stockholm, Sweden.

Welcome message from author
This document is posted to help you gain knowledge. Please leave a comment to let me know what you think about it! Share it to your friends and learn new things together.
Transcript

Fruit and Vegetables in Cancer Prevention
Harri Vainio and Elisabete Weiderpass
Abstract: Our aim was to review the epidemiological litera-
ture on possible cancer-preventive effects of the consumption
of fruits and vegetables in humans, to quantify the effect of
high versus low consumption of fruits and vegetables, and to
give an overall assessment of the existing evidence. We based
our work on an expert meeting conducted by the Interna-
tional Agency for Research on Cancer in 2003. A qualitative
reading and evaluation of relevant articles on the can-
cer-preventive effect of the consumption of fruits and vegeta-
bles was made followed by the calculation of the mean rela-
tive risk and range for cohort and case-control studies
separately. The possible population-preventable fraction for
modifying diet in relation to fruit and vegetable consumption
was calculated as well as an overall statement about the de-
gree of evidence for the cancer-preventive effect of fruit and
vegetable consumption for each cancer site. There is limited
evidence for a cancer-preventive effect of the consumption of
fruits and vegetables for cancer of the mouth and pharynx,
esophagus, stomach, colon-rectum, larynx, lung, ovary (veg-
etables only), bladder (fruit only), and kidney. There is inade-
quate evidence for a cancer-preventive effect of the consump-
tion of fruits and vegetables for all other sites. Applying this
range of risk difference to the range of prevalence of low in-
take, the preventable fraction for low fruit and vegetable in-
take would fall into the range of 5–12%. It is important to
recognize that this is only a crude range of estimates and that
the proportion of cancers that might be preventable by in-
creasing fruit and vegetable intake may vary beyond this
range for specific cancer sites and across different regions of
the world.
Introduction
In the early 1900s, the focus of diet research was on iden-
tifying and preventing nutrient-deficiency diseases. Later,
the focus changed to identifying nutrient requirements. More
recently, research has focused on the role of diet in maintain-
ing health and reducing the risk of noncommunicable dis-
eases such as cancer.
Potentially, all types of dietary components have potential
to affect health status, causing or preventing diseases. In the
past decades, abundant consumption of fruits and vegetables
has been associated with a lower risk of several chronic dis-
eases including cardiovascular diseases and overall mortality
(1). Consumption of fruits and vegetables is low, particularly
in developing nations. In 1998, only 6 of 14 World Health Or-
ganization regions had an availability of fruits and vegetables
to supply the recommended 400 g/day per inhabitant (1). In
1997, the World Cancer Research Fund and the American In-
stitute for Cancer Research produced an extensive report
stating that diets rich in fruits and vegetables “decrease the
risk of many cancers” (2). Their evaluation was based mainly
on the existing case-control studies, which have inherent
problems associated with measurement error. Since then,
more recent prospective cohort studies, where recall bias is
less of a problem, indicated that such diets may not be pre-
ventive against cancer. In 2003, the International Agency for
Research on Cancer (IARC) organized an expert meeting to
access the evidence based on published literature of the can-
cer-preventive effects of the consumption of fruits and vege-
tables (3). The purpose of this handbook was to provide an
up-to-date review of the knowledge about fruits and vegeta-
bles collectively. We summarize here the main results of this
meeting in what concerns cancer prevention in humans as
well as the most important articles published in the field
since then. A more complete and detailed description of the
results has been published elsewhere (3).
Methods
Definition of Fruits and Vegetables
Although culinary definitions are less precise than botani-
cal definitions, they are commonly used by researchers and
subjects in epidemiological surveys.
The culinary definition of fruits and vegetables refers to
edible parts of plant foods with the exclusion of cereal grains,
nuts, and seeds. The culinary term for fruit refers to the part
of a plant that contains the seeds and pulpy surrounding tis-
sue. Plant parts used as vegetables include stems and stalks,
roots, tubers, bulbs, leaves, flowers, some fruits, and pulses.
The definition and classification of fruits and vegetables are
NUTRITION AND CANCER, 54(1), 111–142
Copyright © 2006, Lawrence Erlbaum Associates, Inc.
H. Vainio is affiliated with the Finnish Institute of Occupational Health, Helsinki, Finland. E. Weiderpass is affiliated with The Cancer Registry of Norway,
N-0310, Oslo, Norway and the Karolinska Institutet, Department of Medical Epidemiology and Biostatistics, Stockholm, Sweden.

not precise and differ between dietary assessment instru-
ments depending on the purposes of the study and dietary
patterns of the population being evaluated.
Measuring Intake of Fruits and Vegetables
Questionnaire methods such as food-frequency question-
naires (FFQs) and diet history (DH) have been the most com-
monly used methods to assess individuals’ diets in case-con-
trol and cohort studies. These methods are designed to
estimate usual intake, allowing classification of subjects in
epidemiological studies. Twenty-four-hour recalls were
mostly used to validate FFQ and DH. Given the large
intra-individual variation in food intake, measurement errors
are an important source of potential misclassification and
bias. The estimation of fruit and vegetable intake using FFQ
and DH largely differs in epidemiological studies, depending
on the way the questionnaire is structured, the amount of spe-
cific questions, the method of assessing portion size, and the
types of fruits and vegetables assessed. In the following, we
present information from studies on fruit and vegetable in-
take as a group; no subgroup classification was used.
Integration of the Evidence:
Cancer-Preventive Effects of Fruit
and Vegetable Consumption in Humans
In reviewing the evidence, inclusion criteria were used.
Case reports were not considered, and ecological studies were
not used in the evaluation. Cohort and case-control studies
were always considered unless they were inadequate in con-
ception, design, conduct, or analysis. There have been several
instances of sequential or multiple publications of analyses of
the same or overlapping datasets. When the reports clearly re-
lated to the same or overlapping datasets, only data from the
largest or most recent publication were included.
The data considered are presented in detail elsewhere (3).
The data used in the evaluations also appear as plots (Figs.
1–36). Only those studies on total fruit or vegetable con-
sumption reporting confidence intervals and adjusted for the
main confounders for the relevant sites are included in the
plots. An estimate of the overall effect across all the evalu-
ated studies, calculated as explained subsequently, is pre-
sented, taking the size of the study (as reflected in the confi-
dence interval) into account when weighing the individual
study findings. The result of applying a test for heterogeneity
is given as a footnote to each plot. The reader is cautioned
that these summary estimates do not constitute the result of a
formal meta-analysis, and they should not be interpreted as
such.
The summary estimates in the plots were calculated as fol-
lows. Using the log of the relative risks for the highest versus
lowest exposure categories in the individual studies, desig-
nated as βi, the pooled estimate (summary value, βp) was ob-
tained, separately for cohort and case-control studies, as
βp = [Σi βi/var(βi)]/[Σi 1/var(βi)]
with estimated standard error
SE(βp) = [Σi 1/var(βi)]–1/2
The χ2 for heterogeneity was calculated as
χ2 = Σi (βi – βp)2/var(βi)
with (N – 1) degrees of freedom, where N is the total number
of studies.
Analyses and generation of the plots were performed us-
ing A Language and Environment for Statistical Computing
(R Foundation for Statistical Computing, Vienna, Austria)
(4). Individual studies are presented in the plot in chronologi-
cal order, with the “box size” proportional to the inverse of
their variance.
For some studies, results are reported for subcategories of
the population under study, for example, males and females,
pre- and postmenopausal women, and colon and rectal can-
cer. In the calculation of the overall effect and in the final
plot, the subgroups counted as individual studies; however,
when counting the number of evaluable studies for different
cancer sites, subgroups were considered as coming from a
single study.
Overall Evaluation of the Evidence
The group of experts who met at IARC made judgments
concerning the evidence that fruits and vegetables prevent
cancer in humans. In making the judgment, several criteria
are considered. Findings that are replicated in several studies
of the same design or using different approaches are more
likely to provide evidence of a true protective effect than iso-
lated observations from single studies. The results of studies
judged to be of high quality are given more weight. In sum-
marizing the data, evaluations of the strength of the evidence
for cancer-preventive activity and carcinogenic effects from
studies in humans are made, using standard terms, knowing
that the evaluations may change as new information becomes
available. The categories in which the potential cancer-pre-
ventive agent is classified are
• Sufficient evidence of cancer-preventive activity: A
causal relationship has been established between the agent or
intervention and the prevention of human cancer in studies in
which chance, bias, and confounding could be ruled out with
reasonable confidence.
• Limited evidence of cancer-preventive activity: The
data suggest a reduced risk for cancer with use of the agent or
intervention but are limited for making a definitive evalua-
tion either because chance, bias, or confounding could not be
ruled out with reasonable confidence or because the data are
restricted to intermediary biomarkers or uncertain validity in
the putative pathway to cancer.
• Inadequate evidence of cancer-preventive activity: The
available studies are of insufficient quality, consistency, or
statistical power to permit a conclusion regarding a can-
112 Nutrition and Cancer 2006

cer-preventive effect of the agent or intervention, or no data
on the prevention of cancer in humans are available.
• Evidence suggesting lack of cancer-preventive activity:
Several adequate studies of use or exposure to the agent or in-
tervention are mutually consistent in not showing a preven-
tive effect.
The evaluations refer to fruits and vegetables as whole
classes, without consideration of separate subcategories.
Results
Oral Cavity and Pharynx
No cohort study on fruit consumption and risk of oral or
oropharyngeal cancer was identified. Most studies were hos-
pital-based case-control studies. For the 10 evaluated case-
control studies of fruit consumption (5–14) the mean relative
risk for high versus low consumption was 0.45 and the range
was 0.10–0.70 (Fig. 1).
In the large cohort study of Hirayama in Japan (15), the fre-
quency of intake of green-yellow vegetables was inversely as-
sociated with risk of oropharyngeal cancer nonsignificantly in
men and significantly in women. Seven case-control studies
were evaluated for vegetable intake (5–8,11–13), and the
mean relative risk for high versus low consumption was 0.49
and the range was 0.19–0.80 (Fig. 2). Concerns about residual
confounding by cigarette smoking, alcohol consumption, and
socioeconomic status as well as recall bias among cases and
selection bias among control subjects mayat least partiallyex-
plain these results. There are no consistent findings of an in-
verse association of salivary gland and nasopharynx cancer
with fruit and vegetable consumption.
Esophagus
An inverse association between fruit consumption and
mortality for esophagus cancer was found in one cohort
study (16). Among the 16 evaluated case-control studies
(7,9,17–30), the mean relative risk for high versus low fruit
consumption was 0.54 and the range was 0.14–1.50 (Fig. 3).
For vegetable consumption, no cohort studies were identi-
fied, and the results of 10 case-control studies that were eval-
uated (7,17–21,23,25,31,32) entailed a mean relative risk for
Vol. 54, No. 1 113
Figure 1. Case-control studies of oral and pharyngeal cancer and fruit consumption. (Reproduced with permission from the IARC Handbook of Cancer Preven-
tion, vol 8. Lyon, France: IARC Press, 2003.)

high versus low consumption of 0.64 and a range of
0.10–0.97 (Fig. 4). The studies evaluated did not indicate
gender-specific effects and were underpowered to detect ef-
fect modification by smoking and alcohol consumption. Se-
lection and recall bias or residual confounding cannot be
ruled out from the evaluated studies.
Stomach
For fruit consumption, 10 cohort (16,33–41) and 28
case-control studies (28,42–68) were evaluated. In the cohort
studies, the mean relative risk for high versus low consump-
tion was 0.85 and the range was 0.55–1.92 (Fig. 5). In the
case-control studies the mean was 0.63 and the range was
0.31–1.39 (Fig. 6).
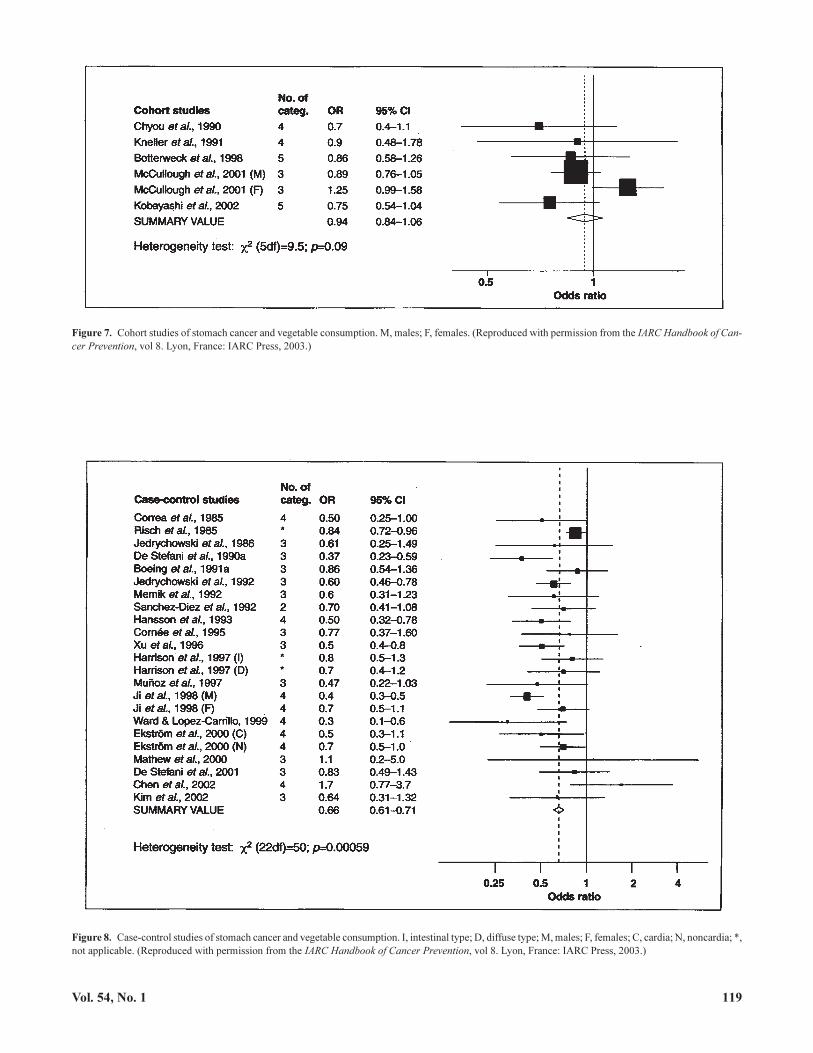
For vegetable consumption 5 cohort studies
(33,35,39,41,69) and 20 case-control studies (31,42,43,
45,48,51,52,55–58,60,61,63,64,66,70–73) were evaluated.
For the cohort studies, the mean relative risk for high versus
low consumption was 0.94 and the range was 0.70–1.25 (Fig.
7); for the case-control studies, the mean relative risk for high
versus low consumption was 0.66 and the range was
0.30–1.70 (Fig. 8).
The reason that case-control studies tended to show in-
verse associations and cohorts did not is unclear. Recall bias
as well as changes in dietary patterns at early stages of dis-
ease may at least partially explain the discrepancy between
case-control and cohort studies mean results.
Colon and Rectum
For fruit consumption, 11 cohort studies (16,74–83) were
evaluated, and the mean relative risk for high versus low con-
sumption was 1.0 and the range was 0.50–1.60 (Fig. 9). For
the nine evaluated case-control studies (84–92), the mean rel-
ative risk for high versus low fruit consumption was 0.87 and
the range was 0.30–1.74 (Fig. 10).
For vegetable consumption, there were 10 evaluated co-
hort studies (74–83), and the mean relative risk for high ver-
sus low consumption was 0.94 and the range was 0.72–1.78
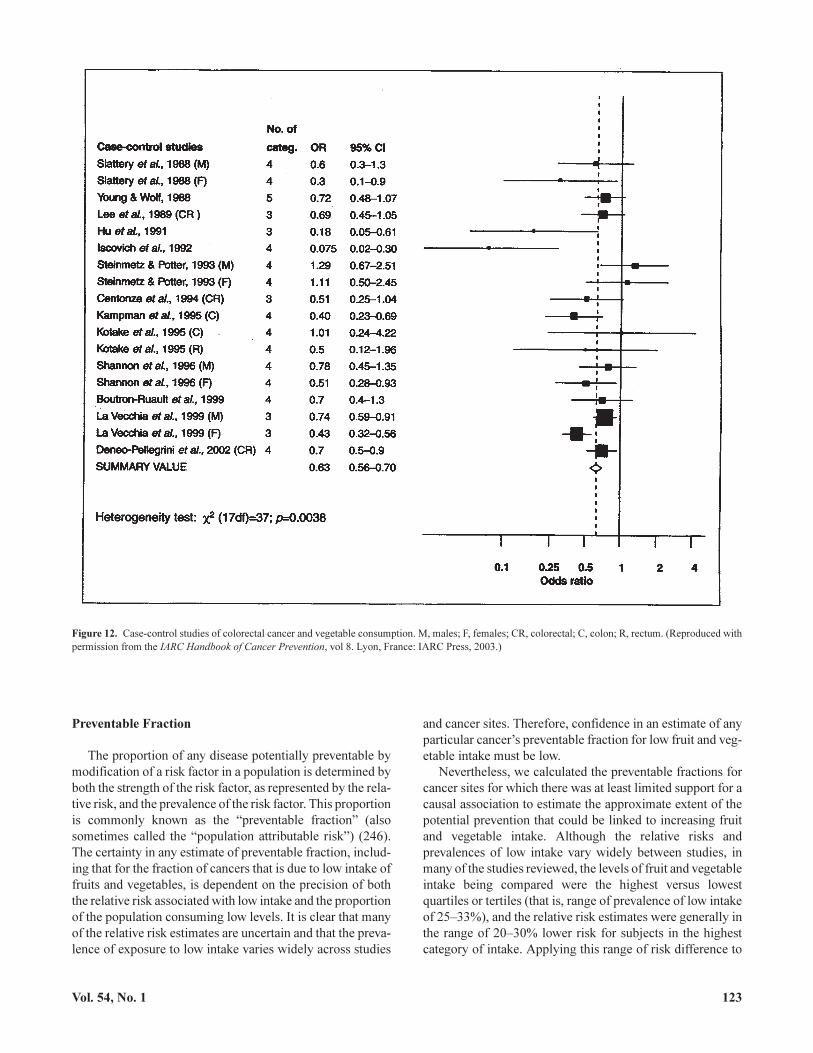
(Fig. 11). For the 13 evaluated case-control studies
(84–90,92–97), the mean relative risk for high versus low
consumption was 0.63 and the range was 0.18–1.29 (Fig. 12).
Recall and selection bias in case-control studies and con-
founding in both case-control and cohort studies may have
affected the results.
114 Nutrition and Cancer 2006
Figure 2. Case-control studies of oral and pharyngeal cancer and vegetable consumption. (Reproduced with permission from the IARC Handbook of Cancer
Prevention, vol 8. Lyon, France: IARC Press, 2003.)

Liver
Only one cohort study (16) and three case-control studies
(98–101) were evaluated, and none found evidence of an as-
sociation between fruit consumption and liver cancer risk.
For vegetable consumption, the cohort study of Sauvaget
et al. (16) found a significant inverse association with
green-yellow vegetables, whereas Hirayama et al. (15) did
not. The cohort study by Yu et al. (102) reported a significant
reduced risk. For the case-control studies, La Vecchia et al.
(100) found no effect of all vegetables but an effect for fruit
and vegetables combined (103). Hadziyannis et al. (98),
Fukuda et al. (104), and Kuper et al. (101) found no associa-
tion for vegetable consumption and risk of liver cancer.
Biliary Tract
One cohort study (16) found no association between fruit
consumption and risk of gallbladder cancer. One case-con-
trol study (105) showed a significant protective effect of con-
sumption of fruit and vegetables combined, whereas two
other case-control studies on green-yellow vegetables
(15,16) found no association.
Pancreas
In the four evaluated cohort studies that also considered
smoking as a confounding factor in the analysis
(16,106–108), all found inverse, nonsignificant associations
for pancreas cancer with increased fruit consumption. In six
case-control studies (109–114) the mean relative risk for
high versus low consumption was 0.72, and the range was
0.07–0.92 (Fig. 13).
Nonsignificant inverse associations were found in the two
evaluated cohort studies of vegetable consumption
(106,108). For the five evaluated case-control studies
(109,111–114), the mean relative risk for high versus low
consumption of vegetables was 0.80 and the range was
0.32–1.03 (Fig. 14).
Vol. 54, No. 1 115
Figure 3. Case-control studies of esophageal cancer and fruit consumption. S, squamous cell carcinoma; A, adenocarcinoma. (Reproduced with permission
from the IARC Handbook of Cancer Prevention, vol 8. Lyon, France: IARC Press, 2003.)
In studies where the proxies of patients were interviewed,
as well as those studies that excluded deceased cases, report-
ing bias is a serious concern. Many of the inverse associa-
tions were found in studies where the response rates among
controls were low.
Larynx
Four case-control studies (7,115–117) were evaluated for
fruit consumption, and the mean relative risk for high versus
low consumption was 0.63 and the range was 0.38–0.80 (Fig.
15).
For vegetable consumption, the four evaluated case-con-
trol studies (7,115–117) had a mean relative risk of 0.49 and a
range of 0.17–1.1 (Fig. 16).
The majority of the studies were hospital based, with the
exception of one large population-based study. Control for
smoking was rather crude in earlier studies. One study pre-
sented results for fruit and vegetable consumption according
to smoking and alcohol consumption history, and the effect
of fruit and vegetable consumption among smokers and
among drinkers was weaker than among nonsmokers and
among nondrinkers. This indicates that the possibility of re-
call and selection bias in earlier studies cannot be ruled out.
Lung
For the 13 evaluated cohort studies of fruit consumption
(16,74,118–128), the mean relative risk for high versus low
consumption was 0.77 and the range was 0.33–2.04 (Fig. 17).
For the 21 evaluated case-control studies (57,129–148),
the mean relative risk for high versus low consumption of
fruit was 0.70 and the range was 0.33–2.04 (Fig. 18).
For 11 cohort studies on vegetable consumption
(74,119–128), the mean relative risk was 0.80 and the range
was 0.47–1.37 (Fig. 19).
116 Nutrition and Cancer 2006
Figure 4. Case-control studies of esophageal cancer and vegetable consumption. S, squamous cell carcinoma; A, adenocarcinoma. (Reproduced with permis-
sion from the IARC Handbook of Cancer Prevention, vol 8. Lyon, France: IARC Press, 2003.)

For 18 evaluated case-control studies on vegetable con-
sumption, (129–133,135,137,139,140,143,145,147,149–154)
the mean relative risk was 0.69 and the range was 0.30–1.49
(Fig. 20). There were no clear differences in the results for
men and women, hospital- and population-based studies, nor
between morphological categories on lung cancer. The
strength of the inverse association was smaller in cohort than
in case-control studies, leaving the possibility of recall and
selection bias in the case-control studies.
Although the newer cohort studies have attempted to care-
fully control for confounding by smoking, residual con-
founding cannot be excluded, and cohort studies usually fail
to capture changes in smoking and diet after cohort enroll-
ment. Studies that did subanalysis among nonsmokers usu-
ally found a weaker effect, although the results are not en-
tirely consistent.
Breast
For fruit consumption, there were six evaluated cohort
studies (16,74,155–158), and the mean relative risk for high
versus low consumption was 0.94 and the range was
0.64–1.43 (Fig. 21). For the 12 evaluated case-control studies
(9,159–169), the mean relative risk for high versus low fruit
consumption was 0.66 and the range was 0.09–1.40 (Fig. 22).
For five evaluated cohort studies of vegetable consump-
tion (74,155–158), the mean relative risk for high versus low
consumption was 0.94 and the range was 0.64–1.43 (Fig. 23).
For 12 evaluated case-control studies (159–161,
163–167,170–173), the mean relative risk for high versus
low vegetable consumption was 0.66 and the range was
0.09–1.40 (Fig. 24).
After the meeting, a large cohort study on the association
between fruits and vegetables and breast cancer risk has been
published with null results (174).
Cervix
No cohort studies on fruit and vegetable consumption and
cervix cancer risk were identified. For the case-control stud-
ies, there was no consistent effect and very little evidence of
an effect of either fruit or vegetable consumption (175–180).
Given the very strong effect of human papillomavirus (HPV)
with the disease, there is concern about the appropriate con-
Vol. 54, No. 1 117
Figure 5. Cohort studies of stomach cancer and fruit consumption. (Reproduced with permission from the IARC Handbook of Cancer Prevention, vol 8. Lyon,
France: IARC Press, 2003.)

trol for possible confounding or modifying effect by the in-
fection. One study examined the risk restricted to HPV-posi-
tive women, and the results were similar when both
HPV-positive and -negative controls were included or when
controls were limited to women with HPV infection.
Endometrium
The association between fruit and vegetable consumption
has been studied only in case-control studies. For seven eval-
uated case-control studies (180–186), the mean relative risk
for high versus low fruit consumption was 1.03 and the range
was 0.67–1.97 (Fig. 25). For five evaluated case-control stud-
ies on vegetable consumption (181–185), the relative risk for
high versus low consumption was 0.75 and the range was
0.65–1.00 (Fig. 26). The combined effect of fruit and vegeta-
ble consumption was inversely associated with endometrial
cancer risk in one cohort and three case-control studies. Body
mass index, as a proxy of obesity, an established risk factor
for endometrial cancer, has been adjusted in several but not
all of the previous studies.
Ovary
For fruit consumption, the number of studies available
was limited: two cohort (187,188) and four case-control
118 Nutrition and Cancer 2006
Figure 6. Case-control studies of stomach cancer and fruit consumption. B, blacks; W, whites; H, hospital controls; P, population controls; M, males; F, females;
I, intestinal type; D, diffuse type; C, cardia; N, noncardia; FH+, gastric cancer family history positive; F–, gastric cancer family history negative; *, not applica-
ble. (Reproduced with permission from the IARC Handbook of Cancer Prevention, vol 8. Lyon, France: IARC Press, 2003.)
Vol. 54, No. 1 119
Figure 7. Cohort studies of stomach cancer and vegetable consumption. M, males; F, females. (Reproduced with permission from the IARC Handbook of Can-
cer Prevention, vol 8. Lyon, France: IARC Press, 2003.)
Figure 8. Case-control studies of stomach cancer and vegetable consumption. I, intestinal type; D, diffuse type; M, males; F, females; C, cardia; N, noncardia; *,
not applicable. (Reproduced with permission from the IARC Handbook of Cancer Prevention, vol 8. Lyon, France: IARC Press, 2003.)

studies (189–192), and the results were inconsistent but in
general indicating no association. For vegetable consump-
tion, an inverse association was found in two cohort (nonsig-
nificant results) (187,188) and five (189,190,192–194) of six
case-control (191) studies. In one case-control study there
was an inverse association for the combined consumption of
fruits and vegetables (190).
Prostate
For eight evaluated cohort studies of fruit consumption
(74,195–201), the mean relative risk for high versus low con-
sumption was 1.11 and the range was 0.84–1.57 (Fig. 27). For
nineevaluatedcase-control studies (9,202–209), themeanrel-
ative risk was 1.08 and the range was 0.40–1.70 (Fig. 28).
The results for fruit are consistent and suggest that high
fruit consumption does not reduce prostate cancer risk. The
increased risk found in some studies may be due to bias asso-
ciated with prostate cancer screening and detection in
health-conscious men.
For vegetable consumption, the mean relative risk for high
versus low consumption in six evaluated cohort studies
(74,197–201) was 0.95 and the range was 0.7–1.04 (Fig. 29).
For nine evaluated case-control studies (202–204,206–211),
the mean relative risk for high versus low consumption was
0.90 and the range was 0.6–1.39 (Fig. 30).
Thus, for vegetables, the majority of studies have reported
a slight, nonsignificant lower risk for higher consumption.
Testis
There were no cohort studies on testis cancer, and two
case-control studies are available (212,213).
Bladder
There were five cohort studies evaluated (214–218), and
the mean relative risk for high versus low consumption of
fruit was 0.87 and the range was 0.63–1.12 (Fig. 31).
120 Nutrition and Cancer 2006
Figure 9. Cohort studies of colorectal cancer and fruit consumption. M, males; F, females; CR, colorectal; C, colon; R, rectum. (Reproduced with permission
from the IARC Handbook of Cancer Prevention, vol 8. Lyon, France: IARC Press, 2003.)

For the four available case-control studies (219–222), the
mean relative risk for high versus low intake was 0.74 and the
range was 0.53–0.95 (Fig. 32).
Three cohort studies evaluated vegetable consumption
(215,217,218), and the mean relative risk for high versus
low consumption was 0.94 and the range was 0.72–1.16
(Fig. 33).
For the three case-control studies evaluated (219,220,
222), the mean relative risk for low vegetable consumption
was 0.89 and the range was 0.66–1.14 (Fig. 34).
Kidney
Two cohort studies were evaluated: one did not show an
association with total fruit consumption (223) and the other
one had too few cases to be informative (224). Seven
case-control studies were evaluated (9,225–230), and the
mean relative risk for high versus low fruit consumption was
0.76 and the range was 0.20–1.20 (Fig. 35).
Four case-control studies (and no cohort studies) were
evaluated for vegetable consumption (226,227,229,230).
The mean relative risk for high versus low intake was 0.86
and the range was 0.30–1.60 (Fig. 36).
All evaluated case-control studies presented results
adjusted for body mass index and smoking, and most stud-
ies used population-based controls. However, recall bias
cannot be completely excluded as an explanation for the
results.
Brain
Three case-control studies of adult (231–233) and five for
childhood brain cancers (234–238) considered fruit and veg-
etable consumption usually as one among many study hy-
potheses. All adult studies and three childhood studies
showed inverse associations with fruit and/or vegetable con-
sumption. Only one of the three childhood studies showed a
statistically significant inverse association (234); in the other
two the associations were nonsignificant (235,237).
Vol. 54, No. 1 121
Figure 10. Case-control studies of colorectal cancer and fruit consumption. M, males; F, females; CR, colorectal; C, colon; R, rectum. (Reproduced with per-
mission from the IARC Handbook of Cancer Prevention, vol 8. Lyon, France: IARC Press, 2003.)

Thyroid
No cohort studies were available, and none of the three
case-control studies evaluated found a significant association
with total fruit or vegetable consumption (239–241).
Non-Hodgkin Lymphoma
A nonsignificant inverse association was found in both of
the two cohort studies of fruit consumption (242,243). The
only case-control study evaluated showed no evidence of as-
sociation with fruit consumption (244).
For vegetable consumption, one (243) of three cohort
studies evaluated (15,242,243) showed an inverse associa-
tion. The only case-control study evaluated for vegetable
consumption showed no association (245).
Leukemia
The only cohort study available evaluated green-yellow
vegetables only (and no fruit) and found no association (15).
Overall Evaluation
After the evaluating the evidence presented previously, it
has been concluded that there is limited evidence for a can-
cer-preventive effect of the consumption of fruits and vegeta-
bles for cancer of the mouth and pharynx, esophagus, stom-
ach, colon-rectum, larynx, lung, ovary (vegetables only),
bladder (fruit only), and kidney in humans.
There is inadequate evidence for a cancer-preventive ef-
fect of the consumption of fruits and vegetables for all other
sites.
122 Nutrition and Cancer 2006
Figure 11. Cohort studies of colorectal cancer and vegetable consumption. M, males; F, females; CR, colorectal; C, colon; R, rectum. (Reproduced with permis-
sion from the IARC Handbook of Cancer Prevention, vol 8. Lyon, France: IARC Press, 2003.)
Preventable Fraction
The proportion of any disease potentially preventable by
modification of a risk factor in a population is determined by
both the strength of the risk factor, as represented by the rela-
tive risk, and the prevalence of the risk factor. This proportion
is commonly known as the “preventable fraction” (also
sometimes called the “population attributable risk”) (246).
The certainty in any estimate of preventable fraction, includ-
ing that for the fraction of cancers that is due to low intake of
fruits and vegetables, is dependent on the precision of both
the relative risk associated with low intake and the proportion
of the population consuming low levels. It is clear that many
of the relative risk estimates are uncertain and that the preva-
lence of exposure to low intake varies widely across studies
and cancer sites. Therefore, confidence in an estimate of any
particular cancer’s preventable fraction for low fruit and veg-
etable intake must be low.
Nevertheless, we calculated the preventable fractions for
cancer sites for which there was at least limited support for a
causal association to estimate the approximate extent of the
potential prevention that could be linked to increasing fruit
and vegetable intake. Although the relative risks and
prevalences of low intake vary widely between studies, in
many of the studies reviewed, the levels of fruit and vegetable
intake being compared were the highest versus lowest
quartiles or tertiles (that is, range of prevalence of low intake
of 25–33%), and the relative risk estimates were generally in
the range of 20–30% lower risk for subjects in the highest
category of intake. Applying this range of risk difference to
Vol. 54, No. 1 123
Figure 12. Case-control studies of colorectal cancer and vegetable consumption. M, males; F, females; CR, colorectal; C, colon; R, rectum. (Reproduced with
permission from the IARC Handbook of Cancer Prevention, vol 8. Lyon, France: IARC Press, 2003.)

124 Nutrition and Cancer 2006
Figure 13. Case-control studies of pancreas cancer and fruit consumption. M, males; F, females. (Reproduced with permission from the IARC Handbook of
Cancer Prevention, vol 8. Lyon, France: IARC Press, 2003.)
Figure 14. Case-control studies of pancreas cancer and vegetable consumption. M, males; F, females. (Reproduced with permission from the IARC Handbook
of Cancer Prevention, vol 8. Lyon, France: IARC Press, 2003.)

Vol. 54, No. 1 125
Figure 15. Case-control studies of larynx cancer and fruit consumption. (Reproduced with permission from the IARC Handbook of Cancer Prevention, vol 8.
Lyon, France: IARC Press, 2003.)
Figure 16. Case-control studies of larynx cancer and vegetable consumption. (Reproduced with permission from the IARC Handbook of Cancer Prevention, vol
8. Lyon, France: IARC Press, 2003.)

the range of prevalence of low intake, the preventable frac-
tion for low fruit and vegetable intake would fall into the
range of 5–12%. It is important to recognize that this is only a
crude range of estimates and that the proportion of cancers
that might be preventable by increasing fruit and vegetable
intake may vary beyond this range for specific cancer sites
and across different regions of the world.
There have been many estimates of the fraction of can-
cer preventable by increasing fruit and vegetable intake
based on individual case-control studies but only two based
on meta-analyses. van’t Veer et al. (247) reviewed pub-
lished studies and estimated the population attributable
risks for all cancer sites due to consumption of 250 g of
fruits and vegetables per day compared with the recom-
mended 400 g/day. They made three estimates based on dif-
ferent assumptions of the size of the relative risks: a “best
guess” estimate (19%), an “optimistic” estimate (28%), and
a “conservative” estimate (6%). Riboli and Norat (248) es-
timated the preventable fractions for esophageal, stomach,
and colorectal cancers in various populations around the
world using relative risks derived from a meta-analysis of
published studies (largely from developed countries) cou-
pled with regional prevalence estimates derived from
sources including FAO data. This approach led to estimates
of the proportion of cancers preventable by increasing fruit
and vegetable intake from current levels to 350 g/day in the
range of 8–16% for colorectal cancer and 20–30% for
esophageal and gastric cancers; these estimates varied sub-
stantially in different regions of the world.
The preventable fraction estimates of 5–12% for the
groups of cancers evaluated here as having limited evidence
for an inverse association with fruit and vegetable consump-
tion are similar to the estimates for all cancer sites made by
van’t Veer et al. (247) and to the estimates for colorectal can-
cer by Riboli and Norat (248), but they are lower than the
Riboli and Norat (248) estimates for esophageal and stomach
cancers. The range of estimates of the fraction of selected
cancers preventable by increasing intake of fruits and vegeta-
bles is only an approximation. The true relative risk for low
intake is quite uncertain given limitations in dietary assess-
ment and in study designs. In addition, the mix of various
cancers as well as the prevalence of low intake can vary sub-
stantially across different populations.
The present estimates for the fraction of selected cancers
preventable by increasing fruit and vegetable intake could
be either high or low. They would be too high if the relative
126 Nutrition and Cancer 2006
Figure 17. Cohort studies of lung cancer and fruit consumption. M, males; F, females; I, intervention arm; P, placebo arm. (Reproduced with permission from
the IARC Handbook of Cancer Prevention, vol 8. Lyon, France: IARC Press, 2003.)

risk estimates on which the measure is based are inflated by
biases in study design and/or uncontrolled confounding by
other factors. On the other hand, they would be too low if
the relative risks were underestimated because of
misclassification arising from random errors in estimating
dietary intake. In addition, benefits of increasing fruit and
vegetable intake may well extend beyond those at the low-
est levels of intake. Shifting the diets of entire populations
over long periods to lower levels of risk can have a greater
impact on population health than reducing risk only for a
subgroup at highest risk (249). Increasing fruit and vegeta-
ble intake in populations is likely also to be accompanied
by other beneficial changes in diet composition and in other
chronic diseases.
Acknowledgments and Notes
We thank the participants in the meeting in Lyon in 2003: G. Link, H.
Boeng, T. Byers, L.O. Dragsted, P.J. Elmer, A. Ferro-Luzzi, J.L.
Freudenheim, T. Key, J.W. Lampe, F. Levi, J. Little, A.J. Michael, A.B.
Miller, J. Pennington, B.S. Reddy, R. Saracci, A. Schatzkin, S.
Smith-Warner, G. Stoner, S. Tsugane, P.A. van den Brandt, P. Vineis, and A.
Wolk. We acknowledge the invaluable contribution of the IARC secretariat,
in particular: F. Bianchini, J. Cheney, S. Franceschi, R. Kaaks, T. Norat, E.
Riboli, and N. Slimani. Both authors worked previously at the International
Agency for Research on Cancer (Lyon, France) and participated in the ex-
pert meeting in which the body of this document was written. Harri Vainio
was the chief of the Unit of Cancer Chemoprevention and the main editor of
the IARC Handbooks of Cancer Prevention. Address correspondence to Dr.
E. Weiderpass, The Cancer Registry of Norway, Montebello, N-0310, Oslo,
Norway. Phone: + 358 40 845 3406. FAX: + 47 22 45 13 70. E-mail: ewv@
kreftregisteret.no.
Vol. 54, No. 1 127
Figure 18. Case-control studies of lung cancer and fruit consumption. B, blacks; W, whites; M, males; F, females; A, adenocarcinoma; S, squamous and small
cell carcinoma; Sm, smokers; NonSm, nonsmokers; *, not applicable. (Reproduced with permission from the IARC Handbook of Cancer Prevention, vol 8.
Lyon, France: IARC Press, 2003.)

128 Nutrition and Cancer 2006
Figure 19. Cohort studies of lung cancer and vegetable consumption. M, males; F, females; I, intervention arm; P, placebo arm. (Reproduced with permission
from the IARC Handbook of Cancer Prevention, vol 8. Lyon, France: IARC Press, 2003.)
Figure 20. Case-control studies of lung cancer and vegetable consumption. B, blacks; W, whites; M, males; F, females; Sm, smokers; NonSm, nonsmokers; *,
not applicable. (Reproduced with permission from the IARC Handbook of Cancer Prevention, vol 8. Lyon, France: IARC Press, 2003.)

Vol. 54, No. 1 129
Figure 21. Cohort studies of breast cancer and fruit consumption. pre, premenopausal; post, postmenopausal; I, incidence. (Reproduced with permission from
the IARC Handbook of Cancer Prevention, vol 8. Lyon, France: IARC Press, 2003.)
Figure 22. Case-control studies of breast cancer and fruit consumption. pre, premenopausal; post, postmenopausal; *, not applicable. (Reproduced with permis-
sion from the IARC Handbook of Cancer Prevention, vol 8. Lyon, France: IARC Press, 2003.)

130 Nutrition and Cancer 2006
Figure 23. Cohort studies of breast cancer and vegetable consumption. pre, premenopausal; post, postmenopausal; I, incidence. (Reproduced with permission
from the IARC Handbook of Cancer Prevention, vol 8. Lyon, France: IARC Press, 2003.)
Figure 24. Case-control studies of breast cancer and vegetable consumption. pre, premenopausal; post, postmenopausal; *, not applicable. (Reproduced with
permission from the IARC Handbook of Cancer Prevention, vol 8. Lyon, France: IARC Press, 2003.)

Vol. 54, No. 1 131
Figure 25. Case-control studies of endometrial cancer and fruit consumption. (Reproduced with permission from the IARC Handbook of Cancer Prevention,
vol 8. Lyon, France: IARC Press, 2003.)
Figure 26. Case-control studies of endometrial cancer and vegetable consumption. (Reproduced with permission from the IARC Handbook of Cancer Preven-
tion, vol 8. Lyon, France: IARC Press, 2003.)

132 Nutrition and Cancer 2006
Figure 27. Cohort studies of prostate cancer and fruit consumption. *, not applicable. (Reproduced with permission from the IARC Handbook of Cancer Pre-
vention, vol 8. Lyon, France: IARC Press, 2003.)
Figure 28. Case-control studies of prostate cancer and fruit consumption. (Reproduced with permission from the IARC Handbook of Cancer Prevention, vol 8.
Lyon, France: IARC Press, 2003.)

Vol. 54, No. 1 133
Figure 29. Cohort studies of prostate cancer and vegetable consumption. *, not applicable. (Reproduced with permission from the IARC Handbook of Cancer
Prevention, vol 8. Lyon, France: IARC Press, 2003.)
Figure 30. Case-control studies of prostate cancer and vegetable consumption. (Reproduced with permission from the IARC Handbook of Cancer Prevention,
vol 8. Lyon, France: IARC Press, 2003.)

134 Nutrition and Cancer 2006
Figure 31. Cohort studies of bladder cancer and fruit consumption. (Reproduced with permission from the IARC Handbook of Cancer Prevention, vol 8. Lyon,
France: IARC Press, 2003.)
Figure 32. Case-control studies of bladder cancer and fruit consumption. (Reproduced with permission from the IARC Handbook of Cancer Prevention, vol 8.
Lyon, France: IARC Press, 2003.)

Vol. 54, No. 1 135
Figure 33. Cohort studies of bladder cancer and vegetable consumption. (Reproduced with permission from the IARC Handbook of Cancer Prevention, vol 8.
Lyon, France: IARC Press, 2003.)
Figure 34. Case-control studies of bladder cancer and vegetable consumption. (Reproduced with permission from the IARC Handbook of Cancer Prevention,
vol 8. Lyon, France: IARC Press, 2003.)

136 Nutrition and Cancer 2006
Figure 35. Case-control studies of renal cell cancer and fruit consumption. M, males; F, females. (Reproduced with permission from the IARC Handbook of
Cancer Prevention, vol 8. Lyon, France: IARC Press, 2003.)
Figure 36. Case-control studies of renal cell cancer and vegetable consumption. M, males; F, females; NonSm, nonsmokers. (Reproduced with permission from
the IARC Handbook of Cancer Prevention, vol 8. Lyon, France: IARC Press, 2003.)

References
1. WHO: Diet, Nutrition and the Prevention of Chronic Diseases. Report
of a Joint FAO/WHO Expert Consultation. Geneva: World Health Or-
ganization, 2003. (WHO Technical Report, series 916)
2. WCRF/AICR: Food, Nutrition and the Prevention of Cancer: A
Global Perspective. Washington, DC: World Cancer Research Fund
and American Institute for Cancer Research, 1997.
3. IARC: Fruit and Vegetables, IARC Handbook of Cancer Prevention,
vol 8. Lyon, France: IARC Press, 2003.
4. Ihaka R and Gentleman R: A language for data analysis and graphics. J
Comput Graph Stat 5, 299–314, 1996.
5. Kune GA, Kune S, Field B, Watson LF, Cleland H, et al.: Oral and pha-
ryngeal cancer, diet, smoking, alcohol, and serum vitamin A and
beta-carotene levels: a case-control study in men. Nutr Cancer 20,
61–70, 1993.
6. Oreggia F, De Stefani E, Correa P, and Fierro L: Risk factors for cancer
of the tongue in Uruguay. Cancer 67, 180–183, 1991.
7. De Stefani E, Deneo-Pellegrini H, Mendilaharsu M, and Ronco A:
Diet and risk of cancer of the upper aerodigestive tract. I. Foods. Oral
Oncol 35, 17–21, 1999.
8. Garrote LF, Herrero R, Reyes RM, Vaccarella S, Anta JL, et al.: Risk
factors for cancer of the oral cavity and oro-pharynx in Cuba. Br J
Cancer 85, 46–54, 2001.
9. Negri E, La Vecchia C, Franceschi S, D’Avanzo B, and Parazzini F:
Vegetable and fruit consumption and cancer risk. Int J Cancer 48,
350–354, 1991.
10. Tavani A, Gallus S, La Vecchia C, Talamini R, Barbone F, et al.: Diet
and risk of oral and pharyngeal cancer. An Italian case-control study.
Eur J Cancer Prev 10, 191–195, 2001.
11. Lissowska J, Pilarska A, Pilarski P, Samolczyk-Wanyura D,
Piekarczyk J, et al.: Smoking, alcohol, diet, dentition and sexual prac-
tices in the epidemiology of oral cancer in Poland. Eur J Cancer Prev
12, 25–33, 2003.
12. Sánchez MJ, Martínez C, Nieto A, Castellsagué X, Quintana MJ, et al.:
Oral and oropharyngeal cancer in Spain: influence of dietary patterns.
Eur J Cancer Prev 12, 49–56, 2003.
13. Rajkumar T, Sridhar H, Balaram P, Vaccarella S, Gajalakshmi V, et
al.: Oral cancer in Southern India: the influence of body size, diet,
infections and sexual practices. Eur J Cancer Prev 12, 135–143,
2003.
14. Takezaki T, Hirose K, Inoue M, Hamajima N, Kuroishi T, et al.: To-
bacco, alcohol and dietary factors associated with the risk of oral can-
cer among Japanese. Jpn J Cancer Res 87, 555–562, 1996.
15. Hirayama T: Life-Style and Mortality. A Large-Scale Census-Based
Cohort Study in Japan, Epidemiology and Biostatistics, vol. 6. Basel,
Switzerland: Karger, 1990.
16. Sauvaget C, Nagano HJ, Hayashi M, Spencer E, Shimizu Y, et al.: Veg-
etables and fruit intake and cancer mortality in the Hiroshima/Naga-
saki Life Span Study. Br J Cancer 88, 689–694, 2003.
17. Brown LM, Blot WJ, Schuman SH, Smith VM, Ershow AG, et al.: En-
vironmental factors and high risk of esophageal cancer among men in
coastal South Carolina. JNCI 80, 1620–1625, 1988.
18. Castellsague X, Muñoz N, De Stefani E, Victora CG, Castelletto R, et
al.: Influence of mate drinking, hot beverages and diet on esophageal
cancer risk in South America. Int J Cancer 88, 658–664, 2000.
19. De Stefani E, Brennan P, Boffetta P, Ronco AL, Mendilaharsu M, et al.:
Vegetables, fruits, related dietary antioxidants, and risk of squamous
cell carcinoma of the esophagus: a case-control study in Uruguay. Nutr
Cancer 38, 23–29, 2000b.
20. Tzonou A, Lipworth L, Garidou A, Signorello LB, Lagiou P, et al.:
Diet and risk of esophageal cancer by histologic type in a low-risk pop-
ulation. Int J Cancer 68, 300–304, 1996a.
21. Cheng KK, Sharp L, McKinney PA, Logan RF, Chilvers CE, et al.: A
case-control study of oesophageal adenocarcinoma in women: a pre-
ventable disease. Br J Cancer 83, 127–132, 2000a.
22. Sharp L, Chilvers CE, Cheng KK, McKinney PA, Logan RF, et al.:
Risk factors for squamous cell carcinoma of the oesophagus in
women: a case-control study. Br J Cancer 85, 1667–1670, 2001.
23. Terry P, Lagergren J, Hansen H, Wolk A, and Nyren O: Fruit and vege-
table consumption in the prevention of oesophageal and cardia can-
cers. Eur J Cancer Prev 10, 365–369, 2001b.
24. Phukan RK, Chetia CK, Ali MS, and Mahanta J: Role of dietary habits
in the development of esophageal cancer in Assam, the north-eastern
region of India. Nutr Cancer 39, 204–209, 2001.
25. Onuk MD, Oztopuz A, and Memik F: Risk factors for esophageal
cancer in eastern Anatolia. Hepatogastroenterology 49, 1290–1292,
2002.
26. Hu J, Nyren O, Wolk A, Bergström R, Yuen J, et al.: Risk factors for
oesophageal cancer in northeast China. Int J Cancer 57, 38–46, 1994.
27. Hanaoka T, Tsugane S, Ando N, Ishida K, Kakegawa T, et al.: Alcohol
consumption and risk of esophageal cancer in Japan: a case-control
study in seven hospitals. Jpn J Clin Oncol 24, 241–246, 1994.
28. Gao CM, Takezaki T, Ding JH, Li MS, and Tajima K: Protective effect
of allium vegetables against both esophageal and stomach cancer: a si-
multaneous case-referent study of a high-epidemic area in Jiangsu
Province, China. Jpn J Cancer Res 90, 614–621, 1999.
29. Yokoyama A, Kato H, Yokoyama T, Tsujinaka T, Muto M, et al.: Ge-
netic polymorphisms of alcohol and aldehyde dehydrogenases and
glutathione S-transferase M1 and drinking, smoking, and diet in Japa-
nese men with esophageal squamous cell carcinoma. Carcinogenesis
23, 1851–1859, 2002.
30. Wolfgarten E, Rosendahl U, Nowroth T, Leers J, Metzger R, et al.: Co-
incidence of nutritional habits and esophageal cancer in Germany.
Onkologie 24, 546–551, 2001.
31. Chen H, Ward MH, Graubard BI, Heineman EF, Markin RM, et al.: Di-
etary patterns and adenocarcinoma of the esophagus and distal stom-
ach. Am J Clin Nutr 75, 137–144, 2002a.
32. Launoy G, Milan C, Day NE, Pienkowski MP, Gignoux M, et al.: Diet
and squamous-cell cancer of the oesophagus: a French multicentre
case-control study. Int J Cancer 76, 7–12, 1998.
33. Chyou PH, Nomura AM, Hankin JH, and Stemmermann GN: A
case-cohort study of diet and stomach cancer. Cancer Res 50,
7501–7504, 1990.
34. Nomura A, Grove JS, Stemmermann GN, and Severson RK: A pro-
spective study of stomach cancer and its relation to diet, cigarettes, and
alcohol consumption. Cancer Res 50, 627–631, 1990.
35. Kneller RW, McLaughlin JK, Bjelke E, Schuman LM, Blot WJ, et al.:
A cohort study of stomach cancer in a high-risk American population.
Cancer 68, 672–678, 1991.
36. Kato I, Tominaga S, and Matsumoto K: A prospective study of stom-
ach cancer among a rural Japanese population: a 6-year survey. Jpn J
Cancer Res 83, 568–575, 1992.
37. Guo W, Blot WJ, Li JY, Taylor PR, Liu BQ, et al.: A nested case-con-
trol study of oesophageal and stomach cancers in the Linxian nutrition
intervention trial. Int J Epidemiol 23, 444–450, 1994.
38. Inoue M, Tajima K, Kobayashi S, Suzuki T, Matsuura A, et al.: Protec-
tive factor against progression from atrophic gastritis to gastric
cancerdata from a cohort study in Japan. Int J Cancer 66, 309–314,
1996.
39. Botterweck AA, van den Brandt PA, and Goldbohm RA: A prospec-
tive cohort study on vegetable and fruit consumption and stomach can-
cer risk in The Netherlands. Am J Epidemiol 148, 842–853, 1998.
40. Galanis DJ, Kolonel LN, Lee J, and Nomura A: Intakes of selected
foods and beverages and the incidence of gastric cancer among the
Japanese residents of Hawaii: a prospective study. Int J Epidemiol 27,
173–180, 1998.
41. Kobayashi M, Tsubono Y, Sasazuki S, Sasaki S, and Tsugane S: Vege-
tables, fruit and risk of gastric cancer in Japan: a 10-year follow-up of
the JPHC Study Cohort I. Int J Cancer 102, 39–44, 2002.
42. Correa P, Fontham E, Pickle LW, Chen V, Lin YP, et al.: Dietary deter-
minants of gastric cancer in south Louisiana inhabitants. JNCI 75,
645–654, 1985.
Vol. 54, No. 1 137

43. Jedrychowski W, Wahrendorf J, Popiela T, and Rachtan J: A case-con-
trol study of dietary factors and stomach cancer risk in Poland. Int J
Cancer 37, 837–842, 1986b.
44. Kono S, Ikeda M, Tokudome S, and Kuratsune M: A case-control
study of gastric cancer and diet in northern Kyushu, Japan. Jpn J Can-
cer Res 79, 1067–1074, 1988.
45. De Stefani E, Correa P, Fierro L, Carzoglio J, Deneo-Pellegrini H, et
al.: Alcohol drinking and tobacco smoking in gastric cancer. A
case-control study. Rev Epidemiol Santé Publ 38, 297–307, 1990a.
46. Kato I, Tominaga S, Ito Y, Kobayashi S, Yoshii Y, et al.: A comparative
case-control analysis of stomach cancer and atrophic gastritis. Cancer
Res 50, 6559–6564, 1990.
47. Wu-Williams AH, Yu MC, and Mack TM: Life-style, workplace, and
stomach cancer by subsite in young men of Los Angeles County. Can-
cer Res 50, 2569–2576, 1990.
48. Boeing H, Frentzel-Beyme R, Berger M, Berndt V, Göres W, et al.:
Case-control study on stomach cancer in Germany. Int J Cancer 47,
858–864, 1991a.
49. Yu GP and Hsieh CC: Risk factors for stomach cancer: a popula-
tion-based case-control study in Shanghai. Cancer Causes Control 2,
169–174, 1991.
50. Hoshiyama Y and Sasaba T: A case-control study of single and multi-
ple stomach cancers in Saitama Prefecture, Japan. Jpn J Cancer Res
83, 937–943, 1992.
51. Jedrychowski W, Boeing H, Popiela T, Wahrendorf J,
Tobiasz-Adamczyk B, et al.: Dietary practices in households as risk
factors for stomach cancer: a familial study in Poland. Eur J Cancer
Prev 1, 297–304, 1992.
52. Sanchez-Diez A, Hernandez-Mejia R, and Cueto-Espinar A: Study of
the relation between diet and gastric cancer in a rural area of the Prov-
ince of Leon, Spain. Eur J Epidemiol 8, 233–237, 1992.
53. Ramon JM, Serra L, Cerdo C, and Oromi J: Dietary factors and gastric
cancer risk. A case-control study in Spain. Cancer 71, 1731–1735,
1993.
54. Inoue M, Tajima K, Hirose K, Kuroishi T, Gao CM, et al.: Life-style
and subsite of gastric cancer: joint effect of smoking and drinking hab-
its. Int J Cancer 56, 494–499, 1994.
55. Cornée J, Pobel D, Riboli E, Guyader M, and Hémon B: A case-con-
trol study of gastric cancer and nutritional factors in Marseille, France.
Eur J Epidemiol 11, 55–65, 1995.
56. Muñoz SE, Ferraroni M, La Vecchia C, and Decarli A: Gastric cancer
risk factors in subjects with family history. Cancer Epidemiol
Biomarkers Prev 6, 137–140, 1997.
57. Xu Z, Brown LM, Pan GW, Liu TF, Gao GS, et al.: Cancer risks among
iron and steel workers in Anshan, China. II. Case-control studies of
lung and stomach cancer. Am J Ind Med 30, 7–15, 1996.
58. Harrison LE, Zhang ZF, Karpeh MS, Sun M, and Kurtz RC: The role of
dietary factors in the intestinal and diffuse histologic subtypes of gas-
tric adenocarcinoma: a case-control study in the U.S. Cancer 80,
1021–1028, 1997.
59. La Vecchia C, Munoz SE, Braga C, Fernandez E, and Decarli A: Diet
diversity and gastric cancer. Int J Cancer 72, 255–257, 1997.
60. Ward MH and Lopez-Carrillo L: Dietary factors and the risk of gastric
cancer in Mexico City. Am J Epidemiol 149, 925–932, 1999.
61. Ekström AM, Serafini M, Nyrén O, Hansson LE, Ye W, et al.: Dietary
antioxidant intake and the risk of cardia cancer and noncardia cancer of
the intestinal and diffuse types: a population-based case-control study
in Sweden. Int J Cancer 87, 133–140, 2000.
62. Huang XE, Tajima K, Hamajima N, Xiang J, Inoue M, et al.: Compari-
son of lifestyle and risk factors among Japanese with and without gas-
tric cancer family history. Int J Cancer 86, 421–424, 2000.
63. Mathew A, Gangadharan P, Varghese C, and Nair MK: Diet and stom-
ach cancer: a case-control study in South India. Eur J Cancer Prev 9,
89–97, 2000.
64. De Stefani E, Correa P, Boffetta P, Ronco A, Brennan P, et al.: Plant
foods and risk of gastric cancer: a case-control study in Uruguay. Eur J
Cancer Prev 10, 357–364, 2001.
65. Hamada GS, Kowalski LP, Nishimoto IN, Rodrigues JJ, Iriya K, et al.:
Risk factors for stomach cancer in Brazil. II. A case-control study
among Japanese Brazilians in Sao Paulo. Jpn J Clin Oncol 32,
284–290, 2002.
66. Kim HJ, Chang WK, Kim MK, Lee SS, and Choi BY: Dietary factors
and gastric cancer in Korea: a case-control study. Int J Cancer 97,
531–535, 2002.
67. Nishimoto IN, Hamada GS, Kowalski LP, Rodriges JG, Iriya K, et al.:
Risk factors for stomach cancer in Brazil. I. A case-control study
among non-Japanese Brazilians in Sao Paulo. Jpn J Clin Oncol 32,
277–283, 2002.
68. Ito LS, Inoue M, Tajima K, Yamamura Y, Kodera Y, et al.: Dietary fac-
tors and the risk of gastric cancer among Japanese women: a compari-
son between the differentiated and non-differentiated subtypes. Ann
Epidemiol 13, 24–31, 2003.
69. McCullough ML, Robertson AS, Jacobs EJ, Chao A, Calle EE, et al.:
A prospective study of diet and stomach cancer mortality in United
States men and women. Cancer Epidemiol Biomarkers Prev 10,
1201–1205, 2001.
70. Risch HA, Jain M, Choi NW, Fodor JG, Pfeiffer CJ, et al.: Dietary fac-
tors and the incidence of cancer of the stomach. Am J Epidemiol 122,
947–959, 1985.
71. Memik F, Nak SG, Gulten M, and Ozturk M: Gastric carcinoma in
northwestern Turkey: epidemiologic characteristics. J Environ Pathol
Toxicol Oncol 11, 335–338, 1992b.
72. Hansson LE, Nyren O, Bergström R, Wolk A, Lindgren A, et al.: Diet
and risk of gastric cancer. A population-based case-control study in
Sweden. Int J Cancer 55, 181–189, 1993.
73. Ji BT, Chow WH, Yang G, McLaughlin JK, Zheng W, et al.: Dietary
habits and stomach cancer in Shanghai, China. Int J Cancer 76,
659–664, 1998.
74. Shibata A, Paganini-Hill A, Ross RK, and Henderson BE: Intake of
vegetables, fruits, beta-carotene, vitamin C and vitamin supplements
and cancer incidence among the elderly: a prospective study. Br J Can-
cer 66, 673–679, 1992.
75. Steinmetz KA, Kushi LH, Bostick RM, Folsom AR, and Potter JD:
Vegetables, fruit, and colon cancer in the Iowa Women’s Health Study.
Am J Epidemiol 139, 1–15, 1994.
76. Kato I, Akhmedkhanov A, Koenig K, Toniolo PG, Shore RE, et al.:
Prospective study of diet and female colorectal cancer: the New York
University Women’s Health Study. Nutr Cancer 28, 276–281, 1997.
77. Hsing AW, McLaughlin JK, Chow WH, Schuman LM, Co Chien HT,
et al.: Risk factors for colorectal cancer in a prospective study among
U.S. white men. Int J Cancer 77, 549–553, 1998a.
78. Pietinen P, Malila N, Virtanen M, Hartman TJ, Tangrea JA, et al.: Diet
and risk of colorectal cancer in a cohort of Finnish men. Cancer
Causes Control 10, 387–396, 1999.
79. Michels KB, Giovannucci E, Joshipura KJ, Rosner BA, Stampfer MJ,
et al.: Prospective study of fruit and vegetable consumption and inci-
dence of colon and rectal cancers. JNCI 92, 1740–1752, 2000.
80. Voorrips LE, Goldbohm RA, van Poppel G, Sturmans F, Hermus RJ, et
al.: Vegetable and fruit consumption and risks of colon and rectal can-
cer in a prospective cohort study: The Netherlands Cohort Study on
Diet and Cancer. Am J Epidemiol 152, 1081–1092, 2000a.
81. Terry P, Giovannucci E, Michels KB, Bergkvist L, Hansen H, et al.:
Fruit, vegetables, dietary fiber, and risk of colorectal cancer. JNCI 93,
525–533, 2001a.
82. Flood A, Velie EM, Chaterjee N, Subar AF, Thompson FE, et al.: Fruit
and vegetable intakes and the risk of colorectal cancer in the Breast
Cancer Detection Demonstration Project follow-up cohort. Am J Clin
Nutr 75, 936–943, 2002.
83. McCullough ML, Robertson AS, Chao A, Jacobs EJ, Stampfer MJ, et
al.: A prospective study of whole grains, fruits, vegetables and colon
cancer risk. Cancer Causes Control 14, 959–970, 2003.
84. Slattery ML, Sorenson AW, Mahoney AW, French TK, Kritchevsky D,
et al.: Diet and colon cancer: assessment of risk by fiber type and food
source. JNCI 80, 1474–1480, 1988.
138 Nutrition and Cancer 2006

85. Steinmetz KA and Potter JD: Food-group consumption and colon can-
cer in the Adelaide Case-Control Study. I. Vegetables and fruit. Int J
Cancer 53, 711–719, 1993.
86. Centonze S, Boeing H, Leoci C, Guerra V, and Misciagna G: Dietary
habits and colorectal cancer in a low-risk area. Results from a popula-
tion-based case-control study in southern Italy. Nutr Cancer 21,
233–246, 1994.
87. Kampman E, Verhoeven D, Sloots L, and van’t Veer P: Vegetable and
animal products as determinants of colon cancer risk in Dutch men and
women. Cancer Causes Control 6, 225–234, 1995.
88. Kotake K, Koyama Y, Nasu J, Fukutomi T, and Yamaguchi N: Relation
of family history of cancer and environmental factors to the risk of
colorectal cancer: a case-control study. Jpn J Clin Oncol 25, 195–202,
1995.
89. Shannon J, White E, Shattuck AL, and Potter JD: Relationship of food
groups and water intake to colon cancer risk. Cancer Epidemiol
Biomarkers Prev 5, 495–502, 1996.
90. Boutron-Ruault MC, Senesse P, Faivre J, Chatelain N, Belghiti C, et
al.: Foods as risk factors for colorectal cancer: a case-control study in
Burgundy (France). Eur J Cancer Prev 8, 229–235, 1999.
91. Murata M, Tagawa M, Watanabe S, Kimura H, Takeshita T, et al.: Ge-
notype difference of aldehyde dehydrogenase 2 gene in alcohol drink-
ers influences the incidence of Japanese colorectal cancer patients. Jpn
J Cancer Res 90, 711–719, 1999.
92. Deneo-Pellegrini H, Boffetta P, De Stefani E, Ronco A, Brennan P, et
al.: Plant foods and differences between colon and rectal cancers. Eur J
Cancer Prev 11, 369–375, 2002.
93. Young TB and Wolf DA: Case-control study of proximal and distal
colon cancer and diet in Wisconsin. Int J Cancer 42, 167–175,
1988.
94. Lee HP, Gourley L, Duffy SW, Estève J, Lee J, et al.: Colorectal cancer
and diet in an Asian populationa case-control study among Singapore
Chinese. Int J Cancer 43, 1007–1016, 1989.
95. Hu JF, Liu YY, Yu YK, Zhao TZ, Liu SD, et al.: Diet and cancer of the
colon and rectum: a case-control study in China. Int J Epidemiol 20,
362–367, 1991.
96. Iscovich JM, L’Abbé KA, Castelleto R, Calzona A, Bernedo A, et al.:
Colon cancer in Argentina. I. Risk from intake of dietary items. Int J
Cancer 51, 851–857, 1992.
97. La Vecchia C, Braga C, Franceschi S, Dal Maso L, and Negri E: Popu-
lation-attributable risk for colon cancer in Italy. Nutr Cancer 33,
196–200, 1999.
98. Hadziyannis S, Tabor E, Kaklamani E, Tzonou A, Stuver S, et al.: A
case-control study of hepatitis B and C virus infections in the etiology
of hepatocellular carcinoma. Int J Cancer 60, 627–631, 1995.
99. Parkin DM, Srivatanakul P, Khlat M, Chenvidhya D, Chotiwan P, et
al.: Liver cancer in Thailand. I. A case-control study of
cholangiocarcinoma. Int J Cancer 48, 323–328, 1991.
100. La Vecchia C, Negri E, Decarli A, D’Avanzo B, and Franceschi S: Risk
factors for hepatocellular carcinoma in northern Italy. Int J Cancer 42,
872–876, 1988b.
101. Kuper H, Tzonou A, Lagiou P, Mucci LA, Trichopoulos D, et al.: Diet
and hepatocellular carcinoma: a case-control study in Greece. Nutr
Cancer 38, 6–12, 2000.
102. Yu MW, Hsieh HH, Pan WH, Yang CS, and Chen CJ: Vegetable con-
sumption, serum retinol level, and risk of hepatocellular carcinoma.
Cancer Res 55, 1301–1305, 1995.
103. Braga C, La Vecchia C, Negri E, and Franceschi S: Attributable risks
for hepatocellular carcinoma in northern Italy. Eur J Cancer 33,
629–634, 1997a.
104. Fukuda K, Shibata A, Hirohata I, Tanikawa K, Yamaguchi G, et al.: A
hospital-based case-control study on hepatocellular carcinoma in
Fukuoka and Saga Prefectures, Northern Kyushu, Japan. Jpn J Cancer
Res 84, 708–714, 1993.
105. Kato K, Akai S, Tominaga S, and Kato I: A case-control study of
biliary tract cancer in Niigata Prefecture, Japan. Jpn J Cancer Res 80,
932–938, 1989.
106. Shibata A, Mack TM, Paganini-Hill A, Ross RK, and Henderson BE:
A prospective study of pancreatic cancer in the elderly. Int J Cancer
58, 46–49, 1994.
107. Appleby PN, Key TJ, Burr ML, and Thorogood M: Mortality and fresh
fruit consumption. In Nutrition and Lifestyle: Opportunities for Can-
cer Prevention, Riboli E and Lambert R (eds). Lyon, France: IARC
Press, 2002, pp 131–133. (IARC Scientific Publications No. 156)
108. Stolzenberg-Solomon RZ, Pietinen P, Taylor PR, Virtamo J, and
Albanes D: Prospective study of diet and pancreatic cancer in male
smokers. Am J Epidemiol 155, 783–792, 2002.
109. Falk RT, Pickle LW, Fontham ET, Correa P, and Fraumeni JF Jr:
Life-style risk factors for pancreatic cancer in Louisiana: a case-con-
trol study. Am J Epidemiol 128, 324–336, 1988.
110. Olsen GW, Mandel JS, Gibson RW, Wattenberg LW, and Schuman
LM: A case-control study of pancreatic cancer and cigarettes, alcohol,
coffee and diet. Am J Public Health 79, 1016–1019, 1989.
111. Howe GR, Jain M, and Miller AB: Dietary factors and risk of pancre-
atic cancer: results of a Canadian population-based case-control study.
Int J Cancer 45, 604–608, 1990.
112. Lyon JL, Slattery ML, Mahoney AW, and Robison L.M: Dietary intake
as a risk factor for cancer of the exocrine pancreas. Cancer Epidemiol
Biomarkers Prev 2, 513–518, 1993.
113. Ji BT, Chow WH, Gridley G, McLaughlin JK, Dai Q, et al.: Dietary
factors and the risk of pancreatic cancer: a case-control study in Shang-
hai China. Cancer Epidemiol Biomarkers Prev 4, 885–893, 1995.
114. Mori M, Hariharan M, Anandakumar M, Tsutsumi M, Ishikawa O, et
al.: A case-control study on risk factors for pancreatic diseases in
Kerala, India. Hepatogastroenterology 46, 25–30, 1999.
115. Estève J, Riboli E, Péquignot G, Terracini B, Merletti F, et al.: Diet and
cancers of the larynx and hypopharynx: the IARC multi-center study
in southwestern Europe. Cancer Causes Control 7, 240–252, 1996.
116. De Stefani E, Boffetta P, Oreggia F, Brennan P, Ronco A, et al.: Plant
foods and risk of laryngeal cancer: a case-control study in Uruguay. Int
J Cancer 87, 129–132, 2000a.
117. Bosetti C, La Vecchia C, Talamini R, Negri E, Levi F, et al.: Food
groups and laryngeal cancer risk: a case-control study from Italy and
Switzerland. Int J Cancer 100, 355–360, 2002a.
118. Fraser GE, Beeson WL, and Phillips RL: Diet and lung cancer in Cali-
fornia Seventh-day Adventists. Am J Epidemiol 133, 683–693, 1991.
119. Chow WH, Schuman LM, McLaughlin JK, Bjelke E, Gridley G, et al.:
A cohort study of tobacco use, diet, occupation, and lung cancer mor-
tality. Cancer Causes Control 3, 247–254, 1992.
120. Steinmetz KA, Potter JD, and Folsom AR: Vegetables, fruit, and lung
cancer in the Iowa Women’s Health Study. Cancer Res 53, 536–543,
1993.
121. Ocké MC, Bueno de Mesquita HB, Feskens EJ, van Staveren WA, and
Kromhout D: Repeated measurements of vegetables, fruits, beta-caro-
tene, and vitamins C and E in relation to lung cancer. The Zutphen
Study. Am J Epidemiol 145, 358–365, 1997a.
122. Breslow RA, Graubard BI, Sinha R, and Subar AF: Diet and lung can-
cer mortality: a 1987 National Health Interview Survey cohort study.
Cancer Causes Control 11, 419–431, 2000.
123. Feskanich D, Ziegler RG, Michaud DS, Giovannucci EL, Speizer FE,
et al.: Prospective study of fruit and vegetable consumption and risk of
lung cancer among men and women. JNCI 92, 1812–1823, 2000.
124. Voorrips LE, Goldbohm RA, Verhoeven DT, van Poppel GA,
Sturmans F, et al.: Vegetable and fruit consumption and lung cancer
risk in the Netherlands Cohort Study on diet and cancer. Cancer
Causes Control 11, 101–115, 2000b.
125. Jansen MC, Bueno de Mesquita HB, Rasanen L, Fidanza F, Nissinen
AM, et al.: Cohort analysis of fruit and vegetable consumption and
lung cancer mortality in European men. Int J Cancer 92, 913–918,
2001.
126. Holick CN, Michaud DS, Stolzenberg-Solomon R, Mayne ST,
Pietinen P, et al.: Dietary carotenoids, serum β-carotene, and retinol
and risk of lung cancer in the alpha-tocopherol, beta-carotene cohort
study. Am J Epidemiol 156, 536–547, 2002.
Vol. 54, No. 1 139

127. Miller AB, Altenburg HP, Bueno-de-Mesquita HB, Boshuizen H,
Agudo A, et al.: Fruits and vegetables and lung cancer: findings from
the European Prospective Investigation into Cancer and Nutrition. Int J
Cancer 108, 269–276, 2004.
128. Neuhouser ML, Patterson RE, Thornquist MD, Omenn GS, King IB,
et al.: Fruits and vegetables are associated with lower lung cancer risk
only in the placebo arm of the β-carotene and retinol efficacy trial
(CARET). Cancer Epidemiol Biomarkers Prev 12, 350–358, 2003.
129. Fontham ET, Pickle LW, Haenszel W, Correa P, Lin YP, et al.: Dietary
vitamins A and C and lung cancer risk in Louisiana. Cancer 62,
2267–2273, 1988.
130. Kalandidi A, Katsouyanni K, Voropoulou N, Bastas G, Saracci R, et
al.: Passive smoking and diet in the etiology of lung cancer among
non-smokers. Cancer Causes Control 1, 15–21, 1990.
131. Candelora EC, Stockwell HG, Armstrong AW, and Pinkham PA: Di-
etary intake and risk of lung cancer in women who never smoked. Nutr
Cancer 17, 263–270, 1992.
132. Forman MR, Yao SX, Graubard BI, Qiao YL, McAdams M, et al.: The
effect of dietary intake of fruits and vegetables on the odds ratio of lung
cancer among Yunnan tin miners. Int J Epidemiol 21, 437–441, 1992.
133. Dorgan JF, Ziegler RG, Schoenberg JB, Hartge P, McAdams MJ, et al.:
Race and sex differences in associations of vegetables, fruits, and ca-
rotenoids with lung cancer risk in New Jersey (United States). Cancer
Causes Control 4, 273–281, 1993.
134. Gao CM, Tajima K, Kuroishi T, Hirose K, and Inoue M: Protective ef-
fects of raw vegetables and fruit against lung cancer among smokers
and ex-smokers: a case-control study in the Tokai area of Japan. Jpn J
Cancer Res 84, 594–600, 1993.
135. Axelsson G, Liljeqvist T, Andersson L, Bergman B, and Rylander R:
Dietary factors and lung cancer among men in west Sweden. Int J
Epidemiol 25, 32–39, 1996.
136. Hu J, Johnson KC, Mao Y, Xu T, Lin Q, et al.: A case-control study of
diet and lung cancer in northeast China. Int J Cancer 71, 924–931,
1997.
137. Ko YC, Lee CH, Chen MJ, Huang CC, Chang WY, et al.: Risk factors
for primary lung cancer among non-smoking women in Taiwan. Int J
Epidemiol 26, 24–31, 1997.
138. Pawlega J, Rachtan J, and Dyba T: Evaluation of certain risk factors for
lung cancer in Cracow (Poland)a case-control study. Acta Oncol 36,
471–476, 1997.
139. Pillow PC, Hursting SD, Duphorne CM, Jiang H, Honn SE, et al.:
Case-control assessment of diet and lung cancer risk in African Ameri-
cans and Mexican Americans. Nutr Cancer 29, 169–173, 1997.
140. Nyberg F, Agrenius V, Svartengren K, Svensson C, and Pershagen G:
Dietary factors and risk of lung cancer in never-smokers. Int J Cancer
78, 430–436, 1998.
141. Brennan P, Fortes C, Butler J, Agudo A, Benhamou S, et al.: A
multicenter case-control study of diet and lung cancer among
non-smokers. Cancer Causes Control 11, 49–58, 2000.
142. Takezaki T, Hirose K, Inoue M, Hamajima N, Yatabe Y, et al.: Dietary
factors and lung cancer risk in Japanese: with special reference to fish
consumption and adenocarcinomas. Br J Cancer 84, 1199–1206,
2001.
143. De Stefani E, Brennan P, Ronco A, Fierro L, Correa P, et al.: Food
groups and risk of lung cancer in Uruguay. Lung Cancer 38, 1–7, 2002.
144. Kreuzer M, Heinrich J, Kreienbrock L, Rosario AS, Gerken M, et al.:
Risk factors for lung cancer among nonsmoking women. Int J Cancer
100, 706–713, 2002.
145. Marchand JL, Luce D, Goldberg P, Bugel I, Salomon C, et al.: Dietary
factors and the risk of lung cancer in New Caledonia (South Pacific).
Nutr Cancer 42, 18–24, 2002.
146. Rachtan J: A case-control study of lung cancer in Polish women.
Neoplasma 49, 75–80, 2002a.
147. Seow A, Poh WT, Teh M, Eng P, Wang YT, et al.: Diet, reproductive
factors and lung cancer risk among Chinese women in Singapore: evi-
dence for a protective effect of soy in nonsmokers. Int J Cancer 97,
365–371, 2002.
148. Suzuki I, Hamada GS, Zamboni MM, Cordeiro PB, Watanabe S, et al.:
Risk factors for lung cancer in Rio de Janeiro, Brazil: a case-control
study. Lung Cancer 11, 179–190, 1994.
149. MacLennan R, Da Costa J, Day NE, Law CH, Ng YK, et al.: Risk fac-
tors for lung cancer in Singapore Chinese, a population with high fe-
male incidence rates. Int J Cancer 20, 854–860, 1977.
150. Le Marchand L, Yoshizawa CN, Kolonel LN, Hankin JH, and Good-
man MT: Vegetable consumption and lung cancer risk: a popula-
tion-based case-control study in Hawaii. JNCI 81, 1158–1164, 1989.
151. Jain M, Burch JD, Howe GR, Risch HA, and Miller AB: Dietary fac-
tors and risk of lung cancer: results from a case-control study, Toronto,
1981–1985. Int J Cancer 45, 287–293, 1990.
152. Sankaranarayanan R, Varghese C, Duffy SW, Padmakumary G, Day
NE, et al.: A case-control study of diet and lung cancer in Kerala, south
India. Int J Cancer 58, 644–649, 1994.
153. Agudo A, Estève MG, Pallares C, Martinez-Ballarin I, Fabregat X, et
al.: Vegetable and fruit intake and the risk of lung cancer in women in
Barcelona, Spain. Eur J Cancer 33, 1256–1261, 1997.
154. Kubik A, Zatloukal P, Tomasek L, Kriz J, Petruzelka L, et al.: Diet and
the risk of lung cancer among women. A hospital-based case-control
study. Neoplasma 48, 262–266, 2001.
155. Rohan TE, Howe GR, Friedenreich CM, Jain M, and Miller AB: Di-
etary fiber, vitamins A, C, and E, and risk of breast cancer: a cohort
study. Cancer Causes Control 4, 29–37, 1993.
156. Verhoeven DT, Assen N, Goldbohm RA, Dorant E, van’t Veer P, et al.:
Vitamins C and E, retinol, beta-carotene and dietary fibre in relation to
breast cancer risk: a prospective cohort study. Br J Cancer 75,
149–155, 1997a.
157. Zhang S, Hunter DJ, Forman MR, Rosner BA, Speizer FE, et al.: Di-
etary carotenoids and vitamins A, C, and E and risk of breast cancer.
JNCI 91, 547–556, 1999.
158. Maynard M, Gunnell D, Emmett P, Frankel S, and Davey Smith G:
Fruits, vegetables, and antioxidants in childhood and risk of adult can-
cer: the Boyd Orr cohort. J Epidemiol Community Health 57, 218–225,
2002.
159. Ingram DM, Nottage E, and Roberts T: The role of diet in the develop-
ment of breast cancer: a case-control study of patients with breast can-
cer, benign epithelial hyperplasia and fibrocystic disease of the breast.
Br J Cancer 64, 187–191, 1991.
160. Zaridze D, Lifanova Y, Maximovitch D, Day NE, and Duffy SW: Diet,
alcohol consumption and reproductive factors in a case-control study
of breast cancer in Moscow. Int J Cancer 48, 493–501, 1991.
161. Holmberg L, Ohlander EM, Byers T, Zack M, Wolk A, et al.: Diet and
breast cancer risk. Results from a population-based, case-control study
in Sweden. Arch Intern Med 154, 1805–1811, 1994.
162. Hirose K, Tajima K, Hamajima N, Inoue M, Takezaki T, et al.: A
large-scale, hospital-based case-control study of risk factors of breast
cancer according to menopausal status. Jpn J Cancer Res 86, 146–154,
1995.
163. Trichopoulou A, Katsouyanni K, Stuver S, Tzala L, Gnardellis C, et
al.: Consumption of olive oil and specific food groups in relation to
breast cancer risk in Greece. JNCI 87, 110–116, 1995a.
164. Freudenheim JL, Marshall JR, Vena JE, Laughlin R, Brasure JR, et al.:
Premenopausal breast cancer risk and intake of vegetables, fruits, and
related nutrients. JNCI 88, 340–348, 1996.
165. Thorand B, Kohlmeier L, Simonsen N, Croghan C, and Thamm M: In-
take of fruits, vegetables, folic acid and related nutrients and risk of
breast cancer in postmenopausal women. Public Health Nutr 1,
147–156, 1998.
166. Potischman N, Swanson CA, Coates RJ, Gammon MD, Brogan DR, et
al.: Intake of food groups and associated micronutrients in relation to
risk of early-stage breast cancer. Int J Cancer 82, 315–321, 1999.
167. Ronco A, De Stefani E, Boffetta P, Deneo-Pellegrini H, Mendilaharsu
M, et al.: Vegetables, fruits, and related nutrients and risk of breast can-
cer: a case-control study in Uruguay. Nutr Cancer 35, 111–119, 1999.
168. Terry P, Wolk A, Persson I, and Magnusson C: Brassica vegetables and
breast cancer risk. JAMA 285, 2975–2977, 2001c.
140 Nutrition and Cancer 2006

169. Dos Santos Silva I, Mangtani P, McCormack V, Bhakta D, Sevak L, et
al.: Lifelong vegetarianism and risk of breast cancer: a popula-
tion-based case-control study among South Asian migrant women liv-
ing in England. Int J Cancer 99, 238–244, 2002.
170. Katsouyanni K, Trichopoulos D, Boyle P, Xirouchaki E, Trichopoulou
A, et al.: Diet and breast cancer: a case-control study in Greece. Int J
Cancer 38, 815–820, 1986.
171. Ewertz M and Gill C: Dietary factors and breast-cancer risk in Den-
mark. Int J Cancer 46, 779–784, 1990.
172. Pawlega J: Breast cancer and smoking, vodka drinking and dietary
habits. A case-control study. Acta Oncol 31, 387–392, 1992.
173. Qi XY, Zhang AY, Wu GL, and Pang WZ: The association between
breast cancer and diet and other factors. Asia Pac J Public Health 7,
98–104, 1994.
174. van Gils CH, Peeters PH, Bueno-de-Mesquita HB, Boshuizen HC,
Lahmann PH, et al.: Consumption of vegetables and fruits and risk of
breast cancer. JAMA 293, 183–193, 2005.
175. La Vecchia C, Decarli A, Fasoli M, Parazzini F, Franceschi S, et al.:
Dietary vitamin A and the risk of intraepithelial and invasive cervical
neoplasia. Gynecol Oncol 30, 187–195, 1988a.
176. Verreault R, Chu J, Mandelson M, and Shy K: A case-control study of
diet and invasive cervical cancer. Int J Cancer 43, 1050–1054, 1989.
177. Ziegler RG, Brinton LA, Hamman RF, Lehman HF, Levine RS, et al.:
Diet and the risk of invasive cervical cancer among white women in the
United States. Am J Epidemiol 132, 432–445, 1990.
178. Herrero R, Potischman N, Brinton LA, Reeves WC, Brenes MM, et al.:
A case-control study of nutrient status and invasive cervical cancer. I.
Dietary indicators. Am J Epidemiol 134, 1335–1346, 1991.
179. Cuzick J, Sasieni P, and Singer A: Risk factors for invasive cervix can-
cer in young women. Eur J Cancer 32A, 836–841, 1996.
180. Hirose K, Tajima K, Hamajima N, Takezaki T, Inoue M, et al.: Subsite
(cervix/endometrium)-specific risk and protective factors in uterus
cancer. Jpn J Cancer Res 87, 1001–1009, 1996.
181. Potischman N, Swanson CA, Brinton LA, McAdams M, Barrett RJ, et
al.: Dietary associations in a case-control study of endometrial cancer.
Cancer Causes Control 4, 239–250, 1993.
182. Tzonou A, Lipworth L, Kalandidi A, Trichopoulou A, Gamatsi I, et al.:
Dietary factors and the risk of endometrial cancer: a case-control study
in Greece. Br J Cancer 73, 1284–1290, 1996b.
183. Jain MG, Howe GR, and Rohan TE: Nutritional factors and
endometrial cancer in Ontario, Canada. Cancer Control 7, 288–296,
2000.
184. McCann SE, Freudenheim JL, Marshall JR, Brasure JR, Swanson MK,
et al.: Diet in the epidemiology of endometrial cancer in western New
York (United States). Cancer Causes Control 11, 965–974, 2000.
185. Littman AJ, Beresford SA, and White E: The association of dietary fat
and plant foods with endometrial cancer (United States). Cancer
Causes Control 12, 691–702, 2001.
186. Terry P, Vainio H, Wolk A, and Weiderpass E: Dietary factors in rela-
tion to endometrial cancer: a nationwide case-control study in Sweden.
Nutr Cancer 42, 25–32, 2002.
187. Kushi LH, Mink PJ, Folsom AR, Anderson KE, Zheng W, et al.: Pro-
spective study of diet and ovarian cancer. Am J Epidemiol 149, 21–31,
1999.
188. Fairfield KM, Hankinson SE, Rosner BA, Hunter DJ, Colditz GA, et
al.: Risk of ovarian carcinoma and consumption of vitamins A, C, and
E and specific carotenoids: a prospective analysis. Cancer 92,
2318–2326, 2001.
189. Shu XO, Gao YT, Yuan JM, Ziegler RG, and Brinton LA: Dietary fac-
tors and epithelial ovarian cancer. Br J Cancer 59, 92–96, 1989.
190. McCann SE, Moysich KB, and Mettlin C: Intakes of selected nutrients
and food groups and risk of ovarian cancer. Nutr Cancer 39, 19–28,
2001.
191. Salazar-Martinez E, Lazcano-Ponce EC, Gonzalez Lira-Lira G,
Escudero-De los RP, and Hernandez-Avila M: Nutritional determi-
nants of epithelial ovarian cancer risk: a case-control study in Mexico.
Oncology 63, 151–157, 2002.
192. Zhang M, Yang ZY, Binns CW, and Lee AH: Diet and ovarian cancer
risk: a case-control study in China. Br J Cancer 86, 712–717, 2002b.
193. La Vecchia C, Decarli A, Negri E, Parazzini, F, Gentile A, et al.: Di-
etary factors and the risk of epithelial ovarian cancer. JNCI 79,
663–669, 1987a.
194. Bosetti C, Negri E, Franceschi S, Pelucchi C, Talamini R, et al.: Diet
and ovarian cancer risk: a case-control study in Italy. Int J Cancer 93,
911–915, 2001.
195. Mills PK, Beeson WL, Phillips RL, and Fraser GE: Cohort study of
diet, lifestyle, and prostate cancer in Adventist men. Cancer 64,
598–604, 1989.
196. Severson RK, Nomura AM, Grove JS, and Stemmermann GN: A pro-
spective study of demographics, diet, and prostate cancer among men
of Japanese ancestry in Hawaii. Cancer Res 49, 1857–1860, 1989.
197. Hsing AW, McLaughlin JK, Schuman LM, Bjelke E, Gridley G, et al.:
Diet, tobacco use, and fatal prostate cancer: results from the Lutheran
Brotherhood Cohort Study. Cancer Res 50, 6836–6840, 1990.
198. Giovannucci E, Ascherio A, Rimm EB, Stampfer MJ, Colditz GA, et
al.: Intake of carotenoids and retinol in relation to risk of prostate can-
cer. JNCI 87, 1767–1776, 1995.
199. Schuurman AG, Goldbohm RA, Dorant E, and van den Brandt PA:
Vegetable and fruit consumption and prostate cancer risk: a cohort
study in The Netherlands. Cancer Epidemiol Biomarkers Prev 7,
673–680, 1998.
200. Chan JM, Pietinen P, Virtanen M, Malila N, Tangrea J, et al.: Diet and
prostate cancer risk in a cohort of smokers, with a specific focus on cal-
cium and phosphorus (Finland). Cancer Causes Control 11, 859–867,
2000.
201. Key T, Allen N, Appleby P, Overvad K, Tjønneland A, et al.: Fruit and
vegetables and prostate cancer: no association among 1,104 cases in a
prospective study of 130,544 men in the European Prospective Investi-
gation into Cancer and Nutrition (EPIC). Int J Cancer 109, 119–124,
2004.
202. De Stefani E, Fierro L, Barrios E, and Ronco A: Tobacco, alcohol, diet
and risk of prostate cancer. Tumori 81, 315–320, 1995.
203. Deneo-Pellegrini H, De Stefani E, Ronco A, and Mendilaharsu M:
Foods, nutrients and prostate cancer: a case-control study in Uruguay.
Br J Cancer 80, 591–597, 1999.
204. Jain MG, Hislop GT, Howe GR, and Ghadirian P: Plant foods, antioxi-
dants, and prostate cancer risk: findings from case-control studies in
Canada. Nutr Cancer 34, 173–184, 1999.
205. Sung JF, Lin RS, Pu YS, Chen YC, Chang HC, et al.: Risk factors for
prostate carcinoma in Taiwan: a case-control study in a Chinese popu-
lation. Cancer 86, 484–491, 1999.
206. Tzonou A, Signorello LB, Lagiou P, Wuu J, Trichopoulos D, et al.:
Diet and cancer of the prostate: a case-control study in Greece. Int J
Cancer 80, 704–708, 1999.
207. Villeneuve PJ, Johnson KC, Kreiger N, and Mao Y: Risk factors
for prostate cancer: results from the Canadian National Enhanced
Cancer Surveillance System. The Canadian Cancer Registries
Epidemiology Research Group. Cancer Causes Control 10, 355–367,
1999.
208. Cohen JH, Kristal AR, and Stanford JL: Fruit and vegetable intakes
and prostate cancer risk. JNCI 92, 61–68, 2000.
209. Kolonel LN, Hankin JH, Whittemore AS, Wu AH, Gallagher RP, et al.:
Vegetables, fruits, legumes and prostate cancer: a multiethnic
case-control study. Cancer Epidemiol Biomarkers Prev 9, 795–804,
2000.
210. Oishi K, Okada K, Yoshida O, Yamabe H, Ohno Y, et al.: A case-con-
trol study of prostatic cancer with reference to dietary habits. Prostate
12, 179–190, 1988.
211. Talamini R, Franceschi S, La Vecchia C, Serraino D, Barra S, et al.:
Diet and prostatic cancer: a case-control study in northern Italy. Nutr
Cancer 18, 277–286, 1992.
212. Sigurdson AJ, Chang S, Annegers JF, Duphorne CM, Pillow PC, et al.:
A case-control study of diet and testicular carcinoma. Nutr Cancer 34,
20–26, 1999.
Vol. 54, No. 1 141

213. Swerdlow AJ, De Stavola BL, Swanwick MA, Mangtani P, and
Maconochie NE: Risk factors for testicular cancer: a case-control
study in twins. Br J Cancer 80, 1098–1102, 1999.
214. Chyou PH, Nomura AM, and Stemmermann GN: A prospective study
of diet, smoking, and lower urinary tract cancer. Ann Epidemiol 3,
211–216, 1993.
215. Michaud DS, Spiegelman D, Clinton SK, Rimm EB, Willett WC, et
al.: Fruit and vegetable intake and incidence of bladder cancer in a
male prospective cohort. JNCI 91, 605–613, 1999.
216. Nagano J, Kono S, Preston DL, Moriwaki H, Sharp GB, et al.: Blad-
der-cancer incidence in relation to vegetable and fruit consumption: a
prospective study of atomic-bomb survivors. Int J Cancer 86,
132–138, 2000.
217. Zeegers MP, Goldbohm RA, and van den Brandt PA: Consumption of
vegetables and fruits and urothelial cancer incidence: a prospective
study. Cancer Epidemiol Biomarkers Prev 10, 1121–1128, 2001.
218. Michaud DS, Pietinen P, Taylor PR, Virtanen M, Virtamo J, et al.: In-
takes of fruits and vegetables, carotenoids and vitamins A, E, C in rela-
tion to the risk of bladder cancer in the ATBC cohort study. Br J Can-
cer 87, 960–965, 2002.
219. Riboli E, Gonzalez CA, Lopez-Abente G, Errezola M, Izarzugaza I, et
al.: Diet and bladder cancer in Spain: a multi-centre case-control study.
Int J Cancer 49, 214–219, 1991.
220. Bruemmer B, White E, Vaughan TL, and Cheney CL: Nutrient intake
in relation to bladder cancer among middle-aged men and women. Am
J Epidemiol 144, 485–495, 1996.
221. Wakai K, Takashi M, Okamura K, Yuba H, Suzuki K, et al.: Foods and
nutrients in relation to bladder cancer risk: a case-control study in
Aichi Prefecture, Central Japan. Nutr Cancer 38, 13–22, 2000.
222. Balbi JC, Larrinaga MT, De Stefani E, Mendilaharsu M, Ronco AL, et
al.: Foods and risk of bladder cancer: a case-control study in Uruguay.
Eur J Cancer Prev 10, 453–458, 2001.
223. Prineas RJ, Folsom AR, Zhang ZM, Sellers TA, and Potter J: Nutrition
and other risk factors for renal cell carcinoma in postmenopausal
women. Epidemiology 8, 31–36, 1997.
224. Fraser GE, Phillips RL, and Beeson WL: Hypertension,
antihypertensive medication and risk of renal carcinoma in California
Seventh-Day Adventists. Int J Epidemiol 19, 832–838, 1990.
225. Talamini R, Baron AE, Barra S, Bidoli E, La Vecchia C, et al.: A
case-control study of risk factor for renal cell cancer in northern Italy.
Cancer Causes Control 1, 125–131, 1990.
226. McLaughlin JK, Gao YT, Gao RN, Zheng W, Ji BT, et al.: Risk factors
for renal-cell cancer in Shanghai, China. Int J Cancer 52, 562–565,
1992.
227. Chow WH, Gridley G, McLaughlin JK, Mandel JS, Wacholder S, et
al.: Protein intake and risk of renal cell cancer. JNCI 86, 1131–1139,
1994.
228. Mellemgaard A, McLaughlin JK, Overvad K, and Olsen JH: Dietary
risk factors for renal cell carcinoma in Denmark. Eur J Cancer 32A,
673–682, 1996.
229. Boeing H, Schlehofer B, and Wahrendorf J: Diet, obesity and risk for
renal cell carcinoma: results from a case control-study in Germany. Z
Ernährungswiss 36, 3–11, 1997.
230. Lindblad P, Wolk A, Bergström R, and Adami HO: Diet and risk of re-
nal cell cancer: a population-based case-control study. Cancer
Epidemiol Biomarkers Prev 6, 215–223, 1997.
231. Chen H, Ward MH, Tucker KL, Graubard BI, McComb RD, et al.: Diet
and risk of adult glioma in eastern Nebraska, United States. Cancer
Causes Control 13, 647–655, 2002b.
232. Hu J, Johnson KC, Mao Y, Guo L, Zha X, et al.: Risk factors for glioma
in adults: a case-control study in northeast China. Cancer Detect Prev
22, 100–108, 1998.
233. Hu J, La Vecchia C, Negri E, Chatenoud L, Bosetti C, et al.: Diet and
brain cancer in adults: a case-control study in northeast China. Int J
Cancer 81, 20–23, 1999.
234. Bunin GR, Kuijten RR, Buckley JD, Rorke LB, and Meadows AT: Re-
lation between maternal diet and subsequent primitive
neuroectodermal brain tumors in young children. N Engl J Med 329,
536–541, 1993.
235. Cordier S, Iglesias M-J, Le Goaster C, Guyot M-M, Mandereau L, et
al.: Incidence and risk factors for childhood brain tumors in the Ile de
France. Int J Cancer 59, 776–782, 1994.
236. McCredie M, Maisonneuve P, and Boyle P: Antenatal risk factors for
malignant brain tumours in New South Wales children. Int J Cancer
56, 6–10, 1994a.
237. McCredie M, Maisonneuve P, and Boyle P: Perinatal and early
postnatal risk factors for malignant brain tumours in New South Wales
children. Int J Cancer 56, 11–15, 1994b.
238. Lubin F, Farbstein H, Chetrit A, Farbstein M, Freedman L, et al.: The
role of nutritional habits during gestation and child life in pediatric
brain tumour etiology. Int J Cancer 86, 139–143, 2000.
239. Franceschi S, Levi F, Negri E, Fassina A, and La Vecchia C: Diet and
thyroid cancer: a pooled analysis of four European case-control stud-
ies. Int J Cancer 48, 395–398, 1991b.
240. Galanti MR, Hansson L, Bergström R, Wolk A, Hjartaker A, et al.:
Diet and the risk of papillary and follicular thyroid carcinoma: a popu-
lation-based case-control study in Sweden and Norway. Cancer
Causes Control 8, 205–214, 1997.
241. Hallquist A, Hardell L, Degerman A, and Boquist L: Thyroid cancer:
reproductive factors, previous diseases, drug intake, family history and
diet. A case-control study. Eur J Cancer Prev 3, 481–488, 1994.
242. Chiu BC, Cerhan JR, Folsom AR, Sellers TA, Kushi LH, et al.: Diet
and risk of non-Hodgkin lymphoma in older women. JAMA 275,
1315–1321, 1996.
243. Zhang SM, Hunter DJ, Rosner BA, Giovannucci EL, Colditz GA, et
al.: Intakes of fruits, vegetables, and related nutrients and the risk of
non-Hodgkin’s lymphoma among women. Cancer Epidemiol
Biomarkers Prev 9, 477–485, 2000.
244. Tavani A, Pregnolato A, Negri E, Franceschi S, Serraino D, et al.: Diet
and risk of lymphoid neoplasms and soft tissue sarcomas. Nutr Cancer
27, 256–260, 1997.
245. Ward MH, Zahm SH, Weisenburger DD, Gridley G, Cantor KP, et al.:
Dietary factors and non-Hodgkin’s lymphoma in Nebraska (United
States). Cancer Causes Control 5, 422–432, 1994.
246. World Health Organization: National Cancer Control Programmes.
Policies and Managerial Guidelines (2nd ed). Geneva: World Health
Organization, 2002.
247. van’t Veer P, Kolb CM, Verhoef P, Kok FJ, Schouten EG, et al.: Dietary
fiber, beta-carotene and breast cancer: results from a case-control
study. Int J Cancer 45, 825–828, 1990.
248. Riboli E and Norat T: Epidemiologic evidence of the protective effect
of fruit and vegetables on cancer risk. Am J Clin Nutr 78 (Suppl 3),
S559–S569, 2003.
249. Rose DP, Boyar AP, and Wynder EL: International comparisons of
mortality rates for cancer of the breast, ovary, prostate, and colon, and
per capita food consumption. Cancer 58, 2363–2371, 1986.
142 Nutrition and Cancer 2006

Related Documents