1 FRP Strengthening of URM Walls Subject to Out-of-Plane Loads J. Gustavo Tumialan, Nestore Galati and Antonio Nanni Abstract: Unreinforced masonry (URM) walls are prone to failure when subjected to out-of- plane loads caused by earthquakes or high wind pressure. This paper presents the results of an experimental program on the flexural behavior of URM walls strengthened with externally bonded Fiber Reinforced Polymer (FRP) laminates as well as on the influence of the putty filler on the bond strength. Based on the experimental evidence, the paper provides a design approach for the strengthening with FRP laminates of URM walls that are analyzed as simply supported members. The database includes URM walls strengthened with different amounts and types of externally bonded FRP reinforcement. Keywords: FRP Laminates, Flexural Strengthening, Masonry Strengthening, Out-of-Plane Failure, Unreinforced Masonry (URM) J. Gustavo Tumialan is a Research Engineer at the Center for Infrastructure Engineering Studies (CIES) at the University of Missouri-Rolla (UMR), where he received his M.Sc. and Ph.D. degrees in Civil Engineering. He received his B.Sc. from the Pontificia Universidad Catolica del Peru (PUCP). His research interests include rehabilitation of masonry and reinforced concrete structures. Nestore Galati is a Graduate Research Assistant at CIES at UMR where he is pursuing a M.Sc. degree in Engineering Mechanics. He is also a doctoral student in Composite Materials for Civil Engineering at the University of Lecce, Italy, where he received his B.Sc. in Materials Engineering. His research interests include repair of masonry and reinforced concrete structures. Antonio Nanni, FACI, is the V&M Jones Professor of Civil Engineering and Director of CIES at UMR. He is interested in construction materials, their structural performance, and field application. He is an active member of several ACI technical committees.

Welcome message from author
This document is posted to help you gain knowledge. Please leave a comment to let me know what you think about it! Share it to your friends and learn new things together.
Transcript
1
FRP Strengthening of URM Walls Subject to Out-of-Plane Loads
J. Gustavo Tumialan, Nestore Galati and Antonio Nanni
Abstract: Unreinforced masonry (URM) walls are prone to failure when subjected to out-of-
plane loads caused by earthquakes or high wind pressure. This paper presents the results of an
experimental program on the flexural behavior of URM walls strengthened with externally
bonded Fiber Reinforced Polymer (FRP) laminates as well as on the influence of the putty filler
on the bond strength. Based on the experimental evidence, the paper provides a design approach
for the strengthening with FRP laminates of URM walls that are analyzed as simply supported
members. The database includes URM walls strengthened with different amounts and types of
externally bonded FRP reinforcement.
Keywords: FRP Laminates, Flexural Strengthening, Masonry Strengthening, Out-of-Plane
Failure, Unreinforced Masonry (URM)
J. Gustavo Tumialan is a Research Engineer at the Center for Infrastructure Engineering Studies (CIES) at the
University of Missouri-Rolla (UMR), where he received his M.Sc. and Ph.D. degrees in Civil Engineering. He
received his B.Sc. from the Pontificia Universidad Catolica del Peru (PUCP). His research interests include
rehabilitation of masonry and reinforced concrete structures.
Nestore Galati is a Graduate Research Assistant at CIES at UMR where he is pursuing a M.Sc. degree in
Engineering Mechanics. He is also a doctoral student in Composite Materials for Civil Engineering at the University
of Lecce, Italy, where he received his B.Sc. in Materials Engineering. His research interests include repair of
masonry and reinforced concrete structures.
Antonio Nanni, FACI, is the V&M Jones Professor of Civil Engineering and Director of CIES at UMR. He is
interested in construction materials, their structural performance, and field application. He is an active member of
several ACI technical committees.
2
INTRODUCTION
Structural weakness, overloading, dynamic vibrations, settlements, and in-plane and out-of-plane
deformations can cause failure of unreinforced masonry (URM) structures. URM buildings have
features that, in case of overstressing, can threaten human lives. Organizations such as The
Masonry Society (TMS) and the Federal Emergency Management Agency (FEMA) have
determined that failures of URM walls result in more material damage and loss of human life
during earthquakes than any other type of structural element. Fiber reinforced polymer (FRP)
composites may provide viable solutions for the strengthening of URM walls subjected to in-
plane and out-of-plane loads caused by high wind pressures or earthquakes. As a reflection of
retrofitting needs (e.g. approximately 96% of the URM buildings inventoried throughout
California needed to be retrofitted1) and important advantages (i.e. material characteristics and
ease of installation) interest in the use of FRP materials for the strengthening of masonry
elements has increased in recent years. To respond to the interest of the engineering community,
the American Concrete Institute (ACI) – Committee 440 along with the Existing Masonry
Committee of TMS have formed a joint task group to develop design recommendations for the
strengthening of masonry elements with FRP materials.
RESEARCH SIGNIFICANCE
To observe improved performance and modes of failure, URM panels were strengthened with
different amounts of externally bonded FRP laminates to be tested under out-of-plane loads. Two
types of FRP fabrics were used for the strengthening. In addition, the influence of the putty filler
on the bond strength was investigated. Based on experimental evidence, a design methodology
3
for the strengthening of URM walls when acting as simply supported members (i.e. arching
mechanism is not present) is proposed.
EXPERIMENTAL PROGRAM
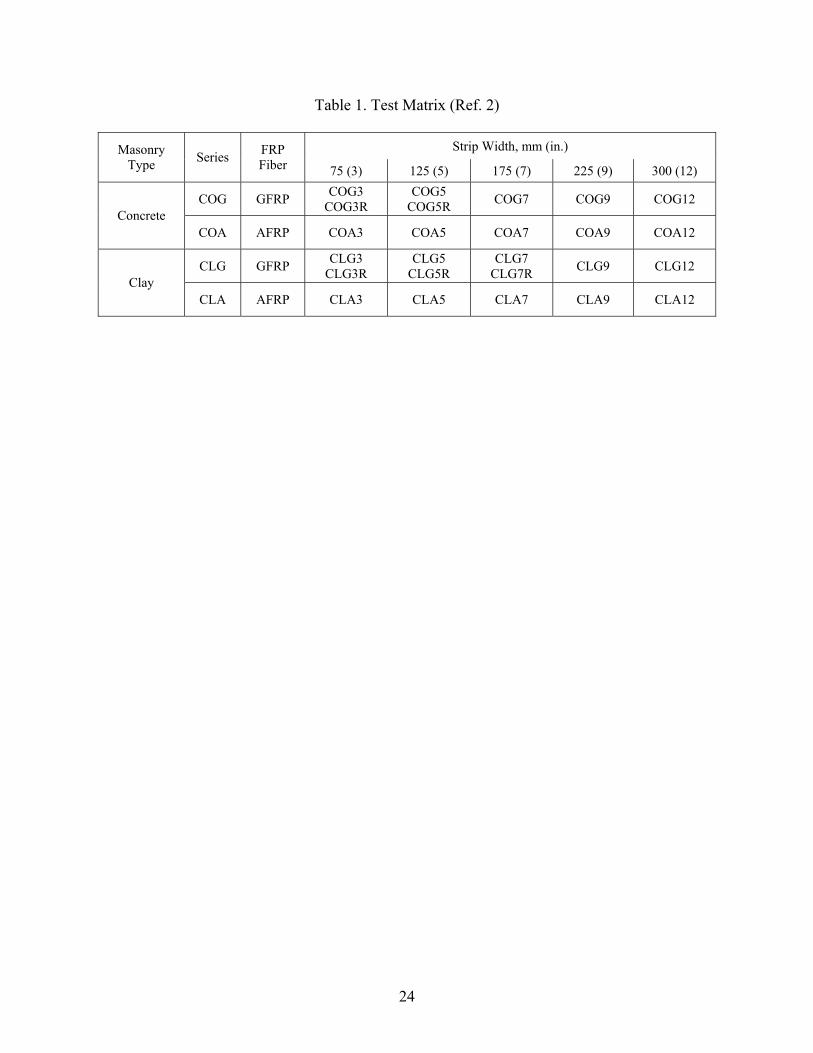
Test Matrix
Table 1 summarizes the characteristics of 25 masonry walls that were constructed for the
experimental program2. Twelve walls were built with concrete blocks and the remaining 13 with
clay bricks. Their nominal dimensions were 95×600×1200 mm (3.75×24×48 in.). The
specimens were strengthened with glass FRP (GFRP) and aramid FRP (AFRP) laminates.
Concrete and clay masonry units and two surface preparation methods (with or without putty
filler) were used to take into account different compressive strengths and surfaces. Since clay
brick wall surfaces exhibit more unevenness than those of concrete blocks, the surface
preparation of the clay specimens required the use of putty. Similarly to the case of
strengthening of reinforced concrete (RC) members, the putty is used to fill small surface voids
and to provide a leveled surface to which the FRP can be adhered. All the masonry panels were
strengthened with a single FRP strip placed along the longitudinal axis on the side in tension.
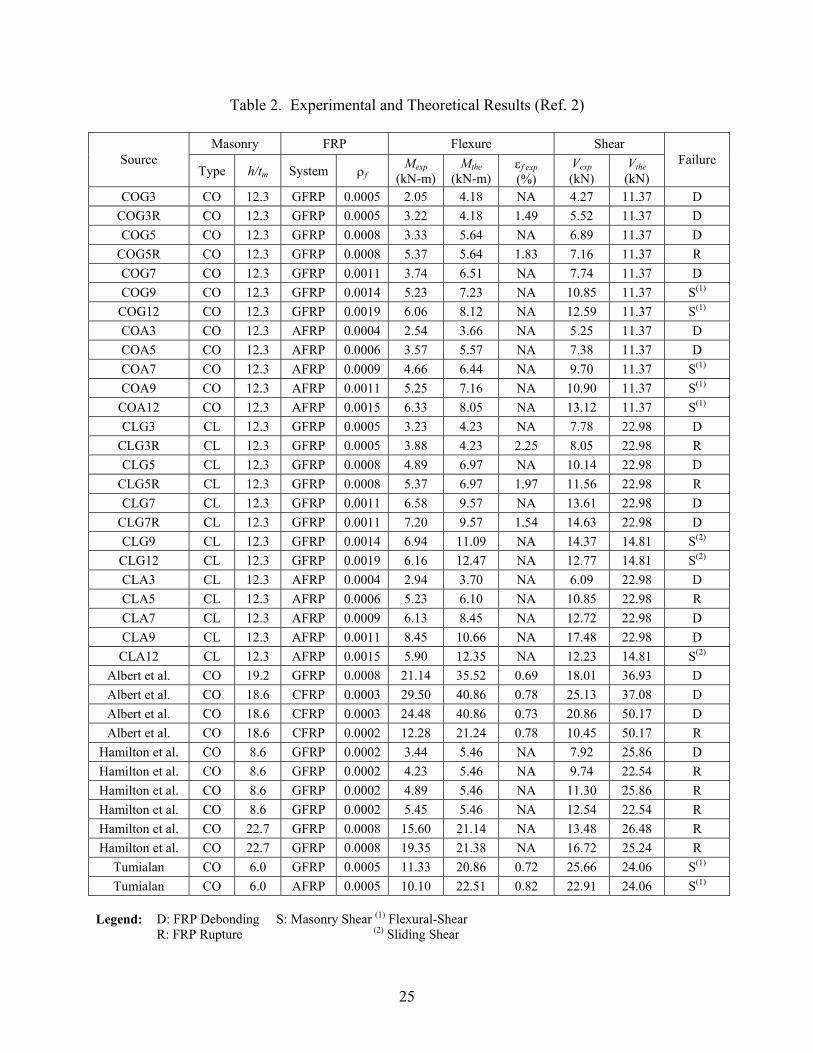
The strip width ranged from 75 mm (3 in.) to 300 mm (12 in.). Table 2 provides an indication of
the amount of FRP reinforcement (ρf = Af / bm tm), for specimens tested in this program and
others. Four series of walls were tested: COC, COA, CLG, and CLA. The first two characters in
the code represent the type of masonry used, “CO” for concrete masonry and “CL” for clay
masonry. The third character represents the type of fiber, “G” for GFRP and “A” for AFRP.
The last character indicates the width of the strip in inches. Thus, CLG5 represents a clay
masonry wall, strengthened with a GFRP laminate, having a width of 125 mm (5 in.) The
4
character “R” indicates a test repetition. In every case, the length of the FRP strips was 1170
mm (46 in.). In this manner the laminate did not touch the roller supports used for testing.
Unstrengthened specimens were not tested since their capacity in flexure when acting as simply
supported members is negligible. All the walls were tested under simply supported conditions.
Details of the test procedure are shown elsewhere2.
Materials
Tests were performed to characterize the engineering properties of the materials2. The average
compressive strengths of concrete and clay masonry were 10.5 MPa (1520 psi) and 17.1 MPa
(2480 psi), respectively. In the case of mortar an average value of 7.6 MPa (1100 psi) at 28 days
was found; therefore, the mortar was classified as Type N.
Tensile tests were performed on FRP laminates. The results showed that the tensile strength of
GFRP was equal to 1690 MPa (245 ksi) and the modulus of elasticity was 92.9 GPa (13460 ksi).
In the case of AFRP, the tensile strength was 1876 MPa (272 ksi) and the modulus of elasticity
was equal to 115.2 GPa (16700 ksi). These properties are related to the fiber content and not to
composite area.
TEST RESULTS
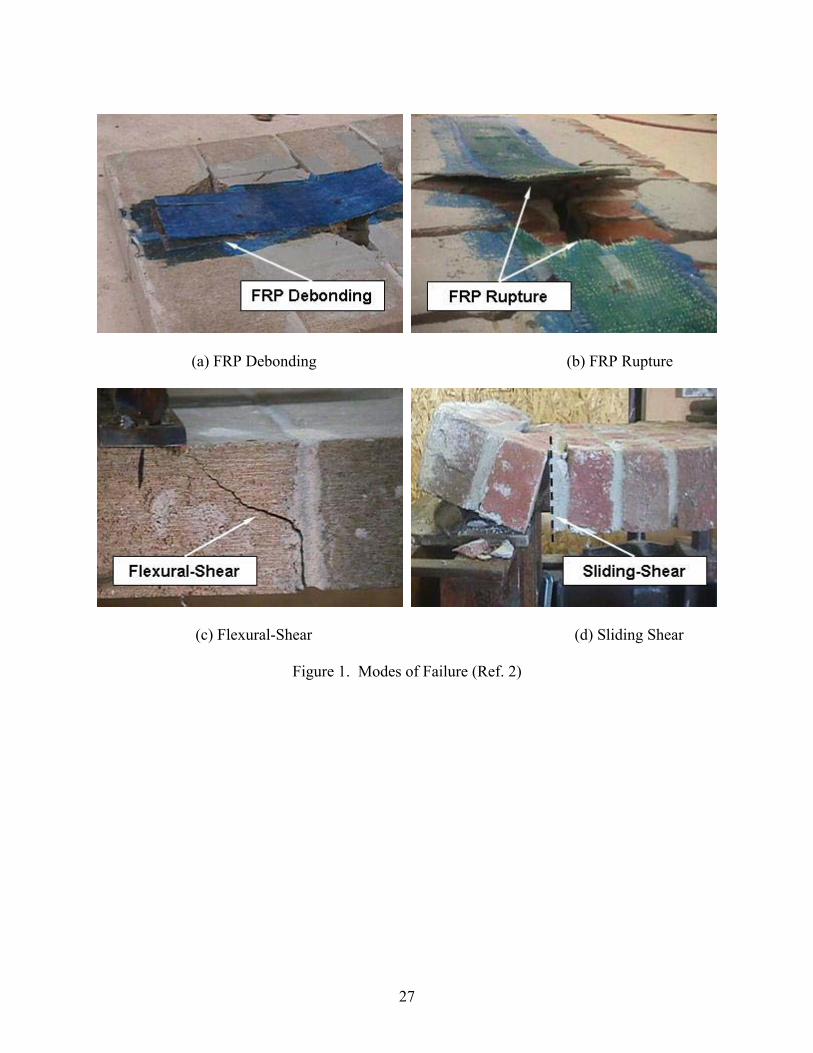
Modes of Failure
URM walls strengthened with FRP laminates subjected to out-of-plane loads exhibited the
following modes of failure: (1) debonding of the FRP laminate from the masonry substrate, (2)
flexural failure (i.e. rupture of the FRP laminate in tension or crushing of the masonry in
compression), and (3) shear failure in the masonry near the support.
5
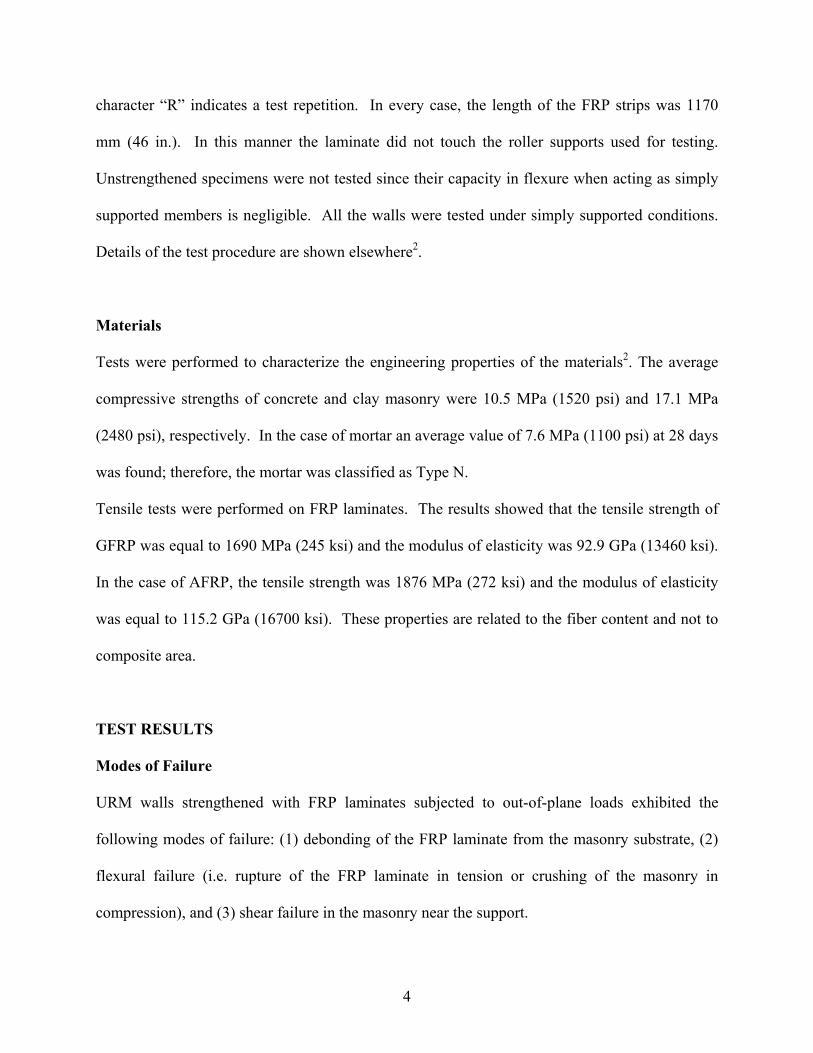
FRP Debonding: due to shear transfer mechanisms at the interface masonry/FRP laminate,
debonding of the laminate from the masonry substrate may occur before flexural failure (see
Figure 1a). Debonding started from flexural cracks at the maximum bending moment region and
developed towards the supports. Since the tensile strength of masonry is lower than that of the
epoxy resins, the failure line is in the masonry. In the case of concrete masonry walls, part of the
concrete block faceshell remained attached to the FRP laminate.
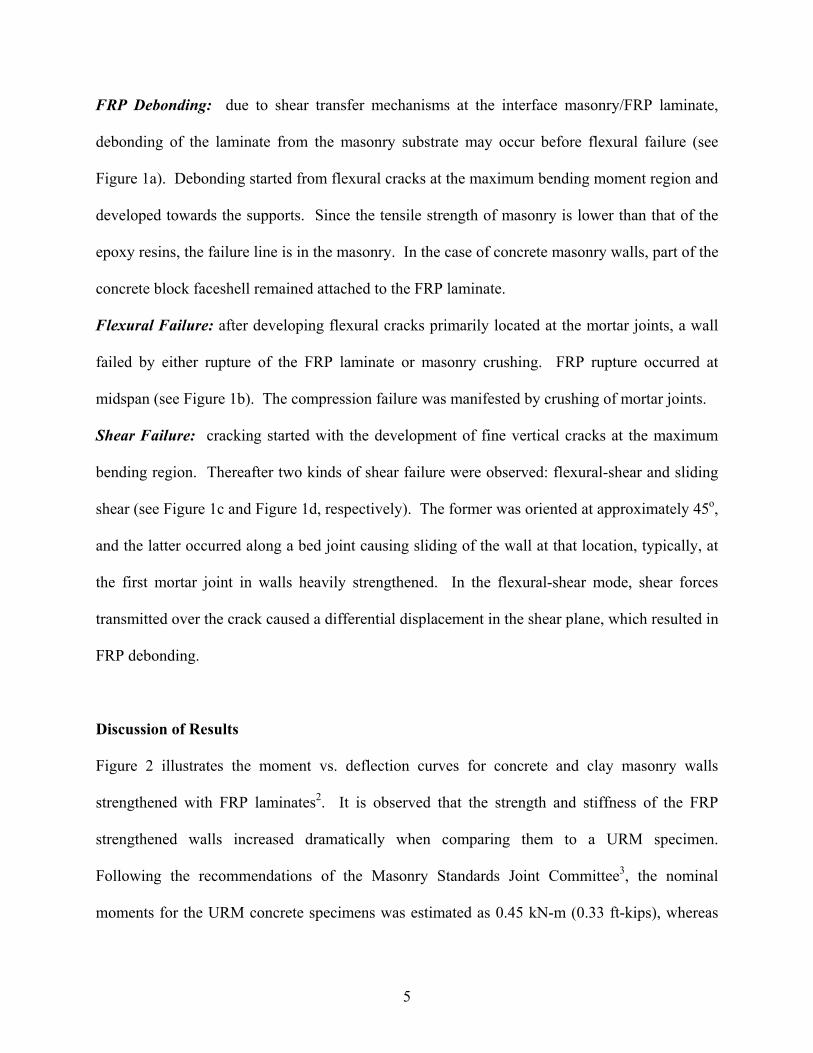
Flexural Failure: after developing flexural cracks primarily located at the mortar joints, a wall
failed by either rupture of the FRP laminate or masonry crushing. FRP rupture occurred at
midspan (see Figure 1b). The compression failure was manifested by crushing of mortar joints.
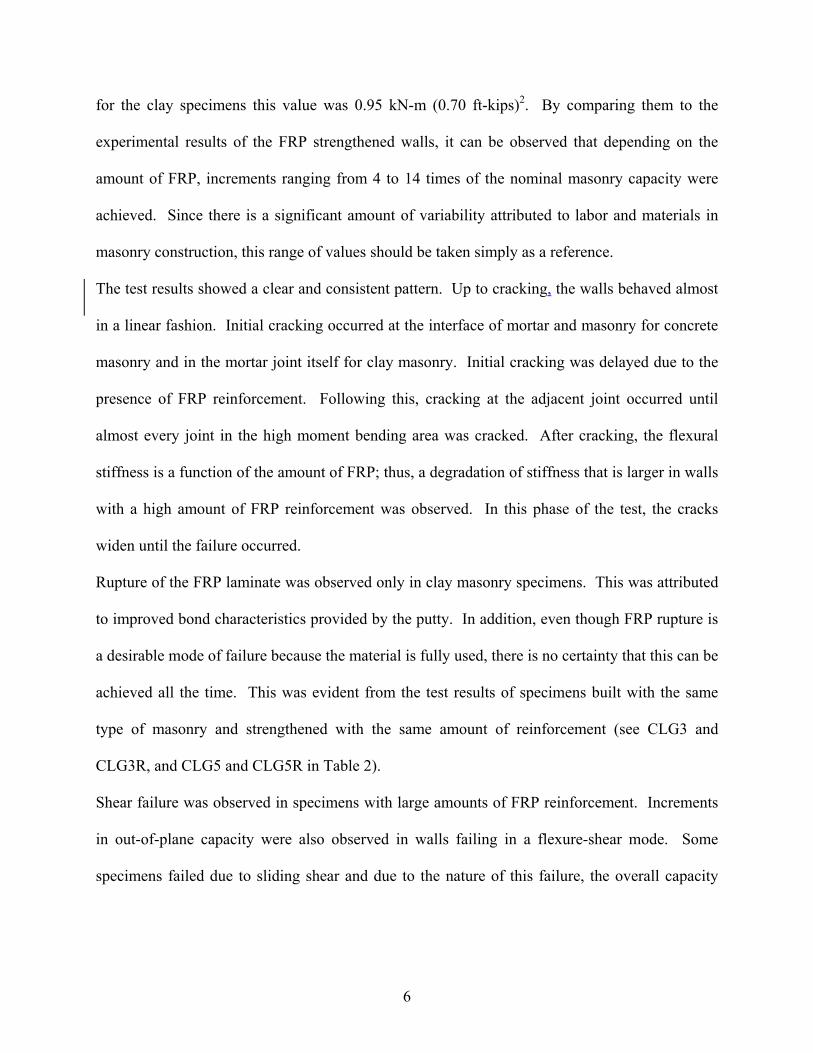
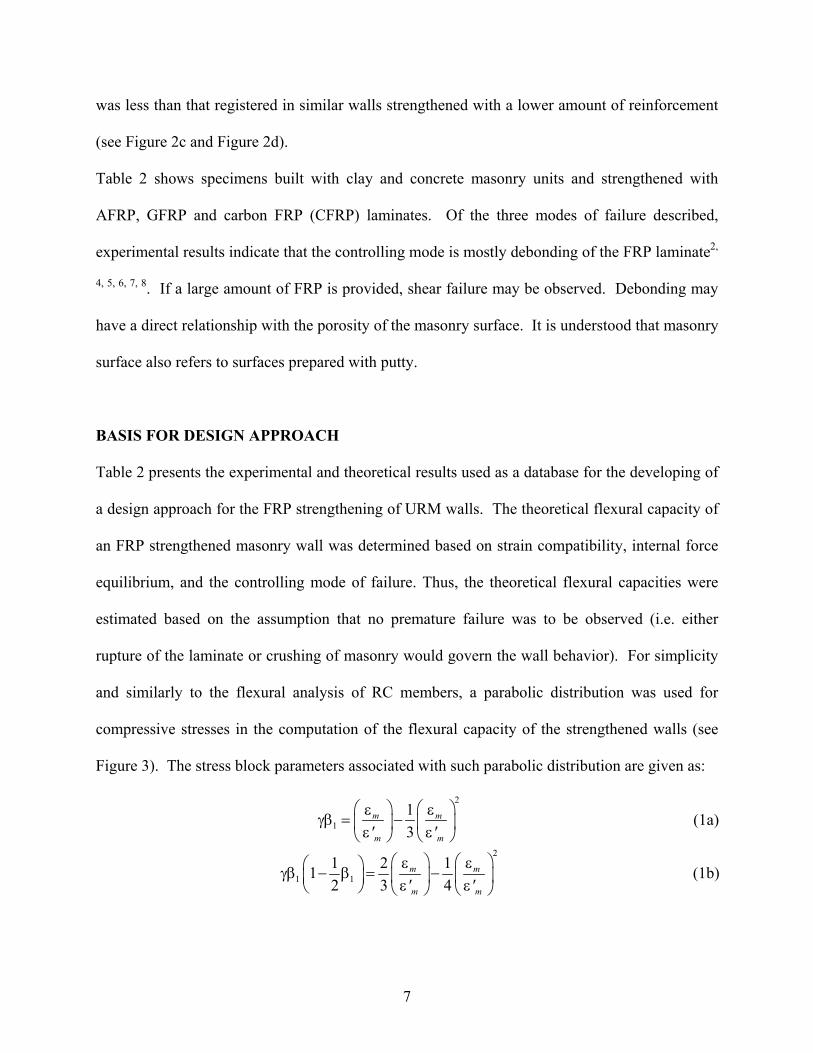
Shear Failure: cracking started with the development of fine vertical cracks at the maximum
bending region. Thereafter two kinds of shear failure were observed: flexural-shear and sliding
shear (see Figure 1c and Figure 1d, respectively). The former was oriented at approximately 45o,
and the latter occurred along a bed joint causing sliding of the wall at that location, typically, at
the first mortar joint in walls heavily strengthened. In the flexural-shear mode, shear forces
transmitted over the crack caused a differential displacement in the shear plane, which resulted in
FRP debonding.
Discussion of Results
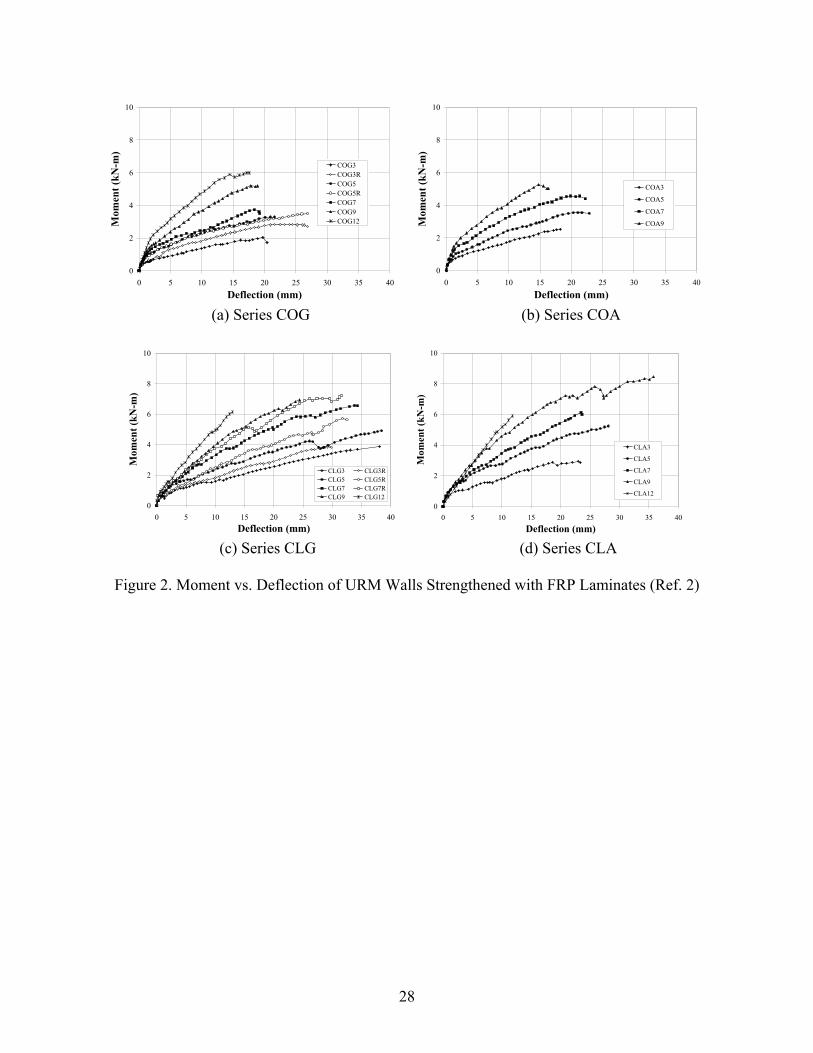
Figure 2 illustrates the moment vs. deflection curves for concrete and clay masonry walls
strengthened with FRP laminates2. It is observed that the strength and stiffness of the FRP
strengthened walls increased dramatically when comparing them to a URM specimen.
Following the recommendations of the Masonry Standards Joint Committee3, the nominal
moments for the URM concrete specimens was estimated as 0.45 kN-m (0.33 ft-kips), whereas
6
for the clay specimens this value was 0.95 kN-m (0.70 ft-kips)2. By comparing them to the
experimental results of the FRP strengthened walls, it can be observed that depending on the
amount of FRP, increments ranging from 4 to 14 times of the nominal masonry capacity were
achieved. Since there is a significant amount of variability attributed to labor and materials in
masonry construction, this range of values should be taken simply as a reference.
The test results showed a clear and consistent pattern. Up to cracking, the walls behaved almost
in a linear fashion. Initial cracking occurred at the interface of mortar and masonry for concrete
masonry and in the mortar joint itself for clay masonry. Initial cracking was delayed due to the
presence of FRP reinforcement. Following this, cracking at the adjacent joint occurred until
almost every joint in the high moment bending area was cracked. After cracking, the flexural
stiffness is a function of the amount of FRP; thus, a degradation of stiffness that is larger in walls
with a high amount of FRP reinforcement was observed. In this phase of the test, the cracks
widen until the failure occurred.
Rupture of the FRP laminate was observed only in clay masonry specimens. This was attributed
to improved bond characteristics provided by the putty. In addition, even though FRP rupture is
a desirable mode of failure because the material is fully used, there is no certainty that this can be
achieved all the time. This was evident from the test results of specimens built with the same
type of masonry and strengthened with the same amount of reinforcement (see CLG3 and
CLG3R, and CLG5 and CLG5R in Table 2).
Shear failure was observed in specimens with large amounts of FRP reinforcement. Increments
in out-of-plane capacity were also observed in walls failing in a flexure-shear mode. Some
specimens failed due to sliding shear and due to the nature of this failure, the overall capacity
7
was less than that registered in similar walls strengthened with a lower amount of reinforcement
(see Figure 2c and Figure 2d).
Table 2 shows specimens built with clay and concrete masonry units and strengthened with
AFRP, GFRP and carbon FRP (CFRP) laminates. Of the three modes of failure described,
experimental results indicate that the controlling mode is mostly debonding of the FRP laminate2,
4, 5, 6, 7, 8. If a large amount of FRP is provided, shear failure may be observed. Debonding may
have a direct relationship with the porosity of the masonry surface. It is understood that masonry
surface also refers to surfaces prepared with putty.
BASIS FOR DESIGN APPROACH
Table 2 presents the experimental and theoretical results used as a database for the developing of
a design approach for the FRP strengthening of URM walls. The theoretical flexural capacity of
an FRP strengthened masonry wall was determined based on strain compatibility, internal force
equilibrium, and the controlling mode of failure. Thus, the theoretical flexural capacities were
estimated based on the assumption that no premature failure was to be observed (i.e. either
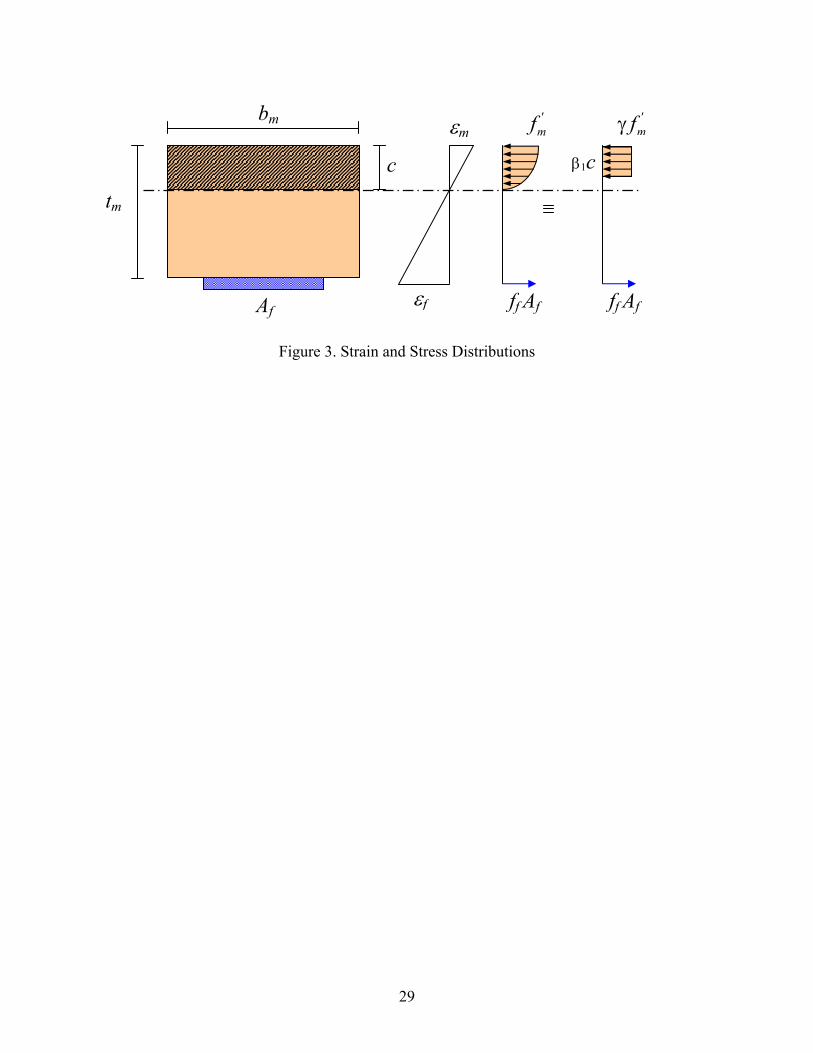
rupture of the laminate or crushing of masonry would govern the wall behavior). For simplicity
and similarly to the flexural analysis of RC members, a parabolic distribution was used for
compressive stresses in the computation of the flexural capacity of the strengthened walls (see
Figure 3). The stress block parameters associated with such parabolic distribution are given as:
2
113
ε εγβ = − ε ε
m m
m m' ' (1a)
2
1 11 2 112 3 4
ε ε γβ − β = − ε ε m m
m m' ' (1b)
8
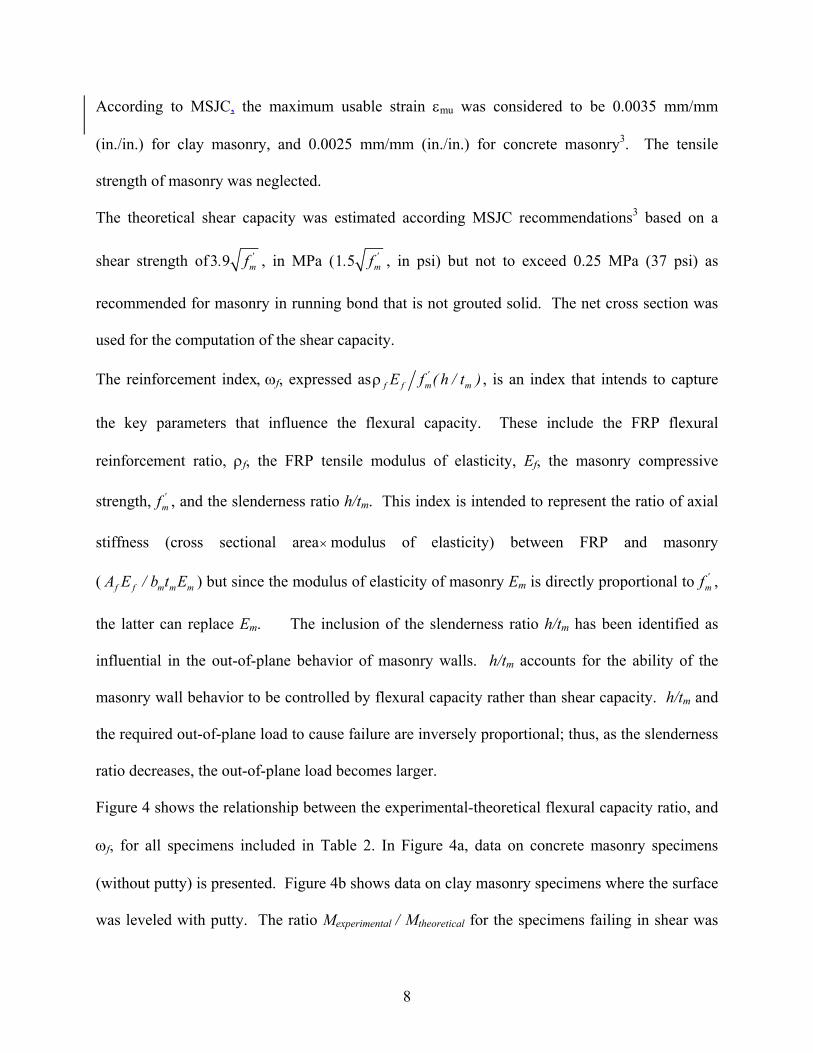
According to MSJC, the maximum usable strain εmu was considered to be 0.0035 mm/mm
(in./in.) for clay masonry, and 0.0025 mm/mm (in./in.) for concrete masonry3. The tensile
strength of masonry was neglected.
The theoretical shear capacity was estimated according MSJC recommendations3 based on a
shear strength of3 9 'm. f , in MPa (1 5 '
m. f , in psi) but not to exceed 0.25 MPa (37 psi) as
recommended for masonry in running bond that is not grouted solid. The net cross section was
used for the computation of the shear capacity.
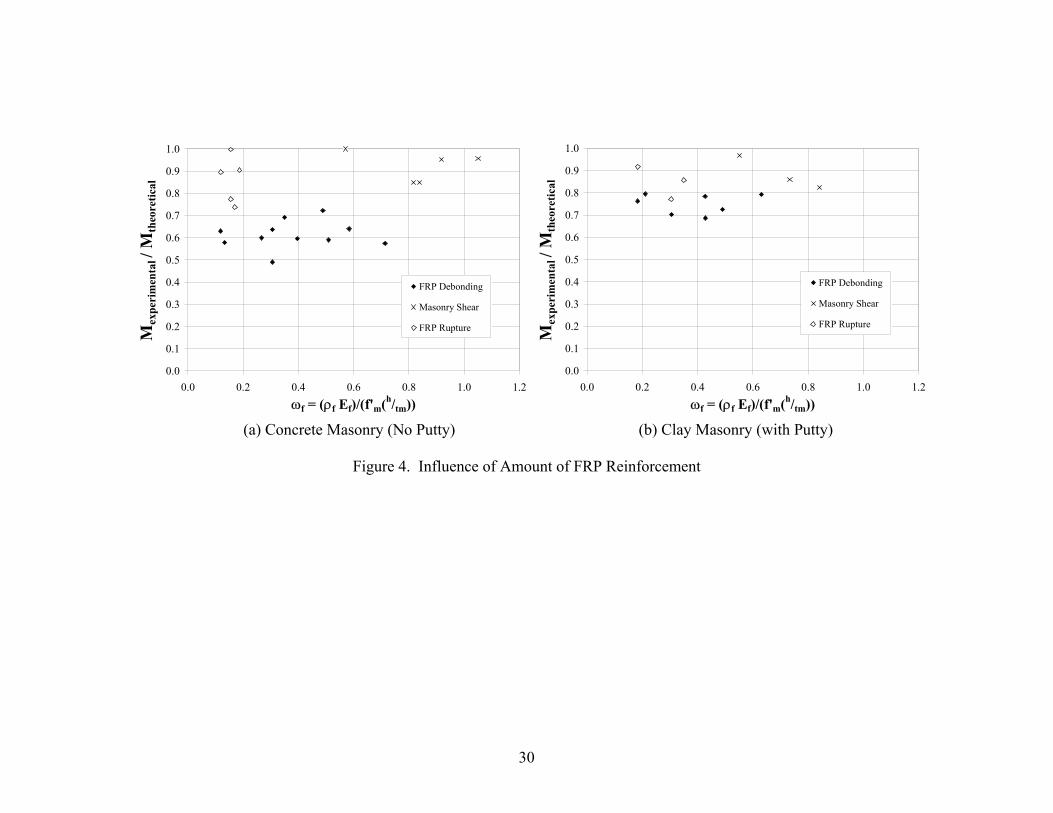
The reinforcement index, ωf, expressed asρ 'f f m mE f ( h / t ) , is an index that intends to capture
the key parameters that influence the flexural capacity. These include the FRP flexural
reinforcement ratio, ρf, the FRP tensile modulus of elasticity, Ef, the masonry compressive
strength, 'mf , and the slenderness ratio h/tm. This index is intended to represent the ratio of axial
stiffness (cross sectional area× modulus of elasticity) between FRP and masonry
( f f m m mA E / b t E ) but since the modulus of elasticity of masonry Em is directly proportional to 'mf ,
the latter can replace Em. The inclusion of the slenderness ratio h/tm has been identified as
influential in the out-of-plane behavior of masonry walls. h/tm accounts for the ability of the
masonry wall behavior to be controlled by flexural capacity rather than shear capacity. h/tm and
the required out-of-plane load to cause failure are inversely proportional; thus, as the slenderness
ratio decreases, the out-of-plane load becomes larger.
Figure 4 shows the relationship between the experimental-theoretical flexural capacity ratio, and
ωf, for all specimens included in Table 2. In Figure 4a, data on concrete masonry specimens
(without putty) is presented. Figure 4b shows data on clay masonry specimens where the surface
was leveled with putty. The ratio Mexperimental / Mtheoretical for the specimens failing in shear was
9
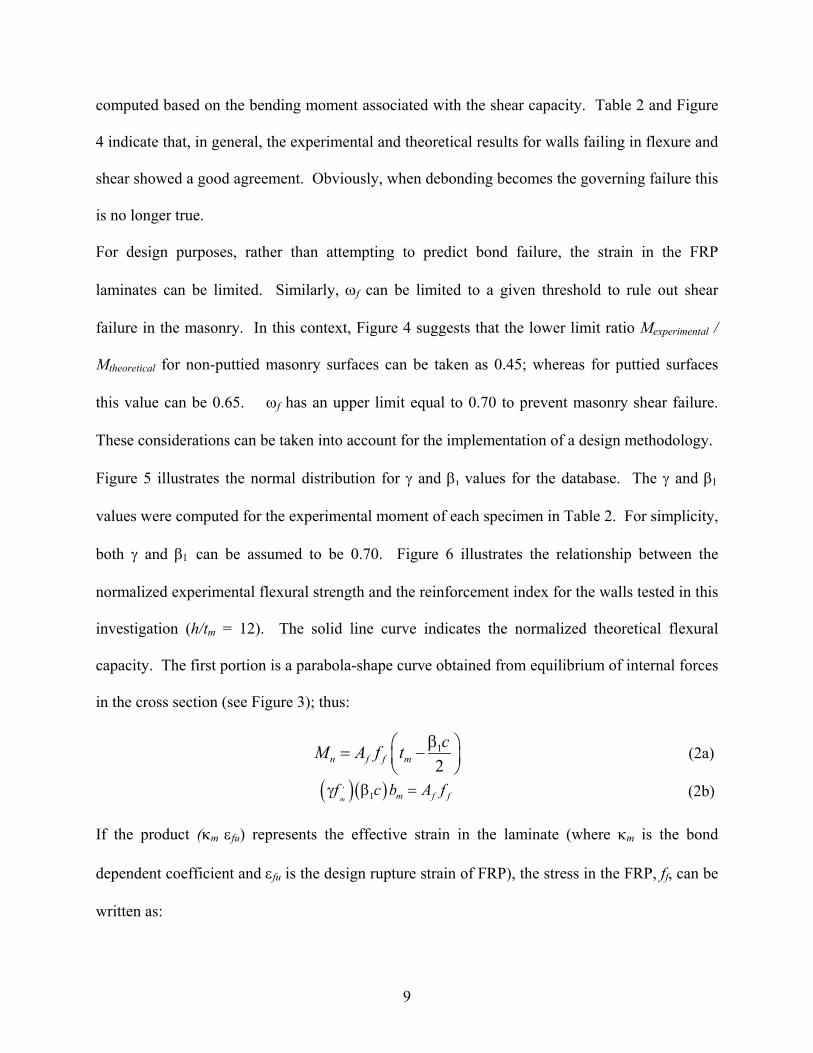
computed based on the bending moment associated with the shear capacity. Table 2 and Figure
4 indicate that, in general, the experimental and theoretical results for walls failing in flexure and
shear showed a good agreement. Obviously, when debonding becomes the governing failure this
is no longer true.
For design purposes, rather than attempting to predict bond failure, the strain in the FRP
laminates can be limited. Similarly, ωf can be limited to a given threshold to rule out shear
failure in the masonry. In this context, Figure 4 suggests that the lower limit ratio Mexperimental /
Mtheoretical for non-puttied masonry surfaces can be taken as 0.45; whereas for puttied surfaces
this value can be 0.65. ωf has an upper limit equal to 0.70 to prevent masonry shear failure.
These considerations can be taken into account for the implementation of a design methodology.
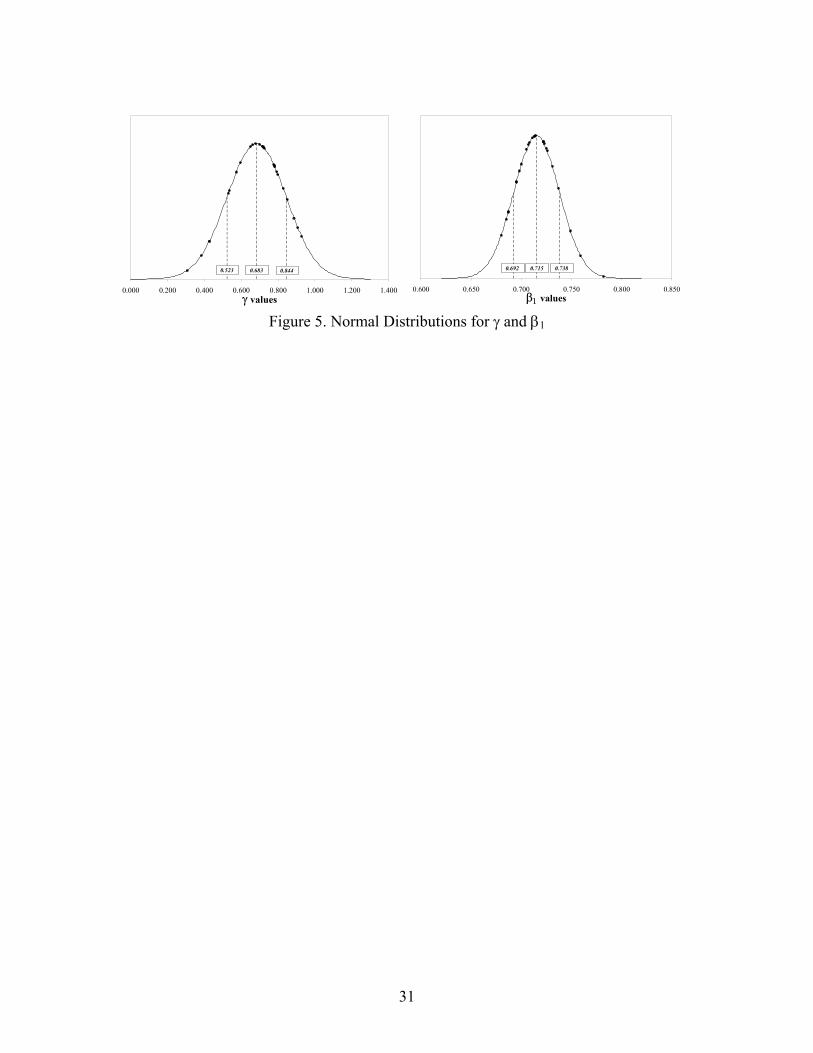
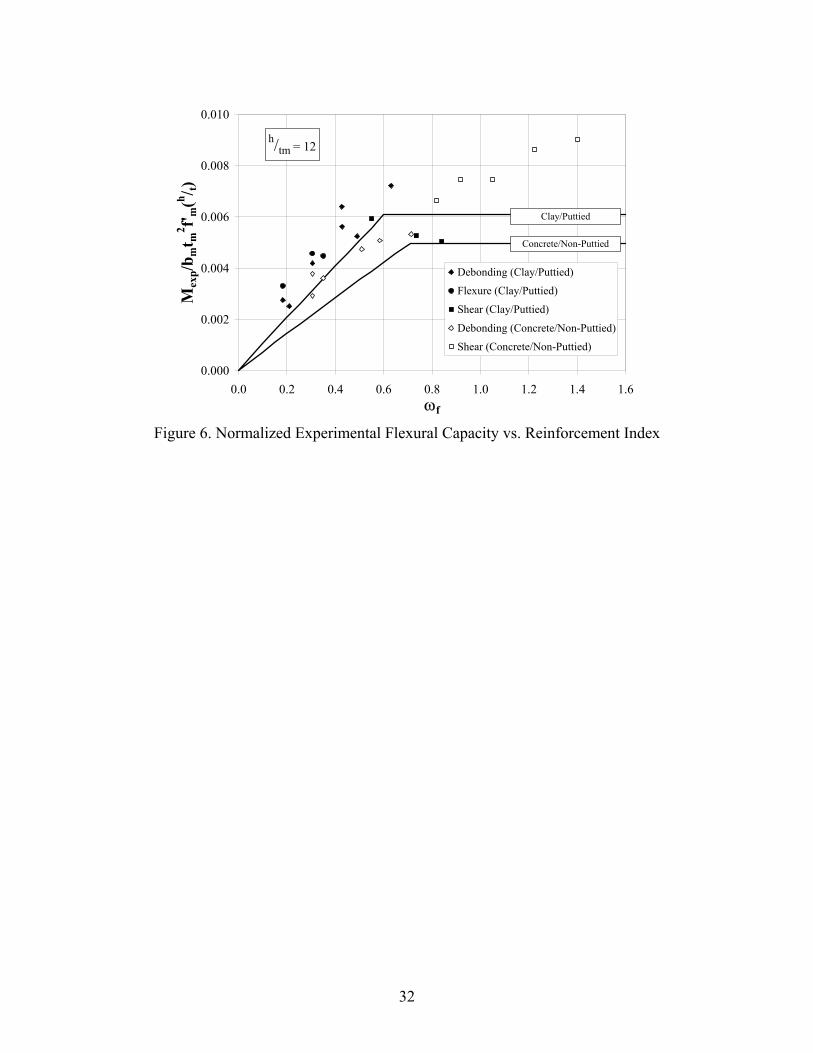
Figure 5 illustrates the normal distribution for γ and β values for the database. The γ and β1
values were computed for the experimental moment of each specimen in Table 2. For simplicity,
both γ and β1 can be assumed to be 0.70. Figure 6 illustrates the relationship between the
normalized experimental flexural strength and the reinforcement index for the walls tested in this
investigation (h/tm = 12). The solid line curve indicates the normalized theoretical flexural
capacity. The first portion is a parabola-shape curve obtained from equilibrium of internal forces
in the cross section (see Figure 3); thus:
1
2β = −
n f f m
cM A f t (2a)
( )( )1γ β =m
,m f ff c b A f (2b)
If the product (κm εfu) represents the effective strain in the laminate (where κm is the bond
dependent coefficient and εfu is the design rupture strain of FRP), the stress in the FRP, ff, can be
written as:
10
= κ εf m fu ff ( )E (2c)
Replacing Eqs. 2b and 2c in 2a, and multiplying both terms by the factors 'm m mb t f and mh / t , one
obtains:
( ) ( ) 12 1
2ρ β = κ ε −
f fn
m fu' 'm m m m m m
EM cb t f h / t f ( h / t )
(2d)
Finally, making ωf explicit on the right end side of Eq. 2d one obtains:
( ) ( ) ( ) ( )2 1
2
ω κ ε = ω κ ε − γ
f m fu mnf m fu'
m m m m
h / tMb t f h / t (2e)
To plot Eq. 2e in Figure 6, κm, the bond dependent coefficient, was taken as 0.45 for
concrete/non-puttied masonry and 0.65 for clay/puttied masonry. εfu of GFRP was used since it
represented the lowest bound. h/tm was equal to 12 and γ was assumed to be 0.70.
The second portion (horizontal line) is the normalized strength associated with the theoretical
shear capacity of the masonry. The shear capacity was estimated based on MSJC provisions3
and considering that shear sliding would occur. The horizontal portion represents the moment
associated with the shear strength of the masonry. Figure 6 shows that for concrete masonry
specimens this is conservative since flexural-shear failure is more common.
The intersection of the two lines represents the limit between flexural and shear controlled
failure. For clay masonry, ωf is about 0.60, while for concrete masonry, ωf is around 0.70. This
observation reaffirms the assumption that the index ωf may be limited to 0.70 to prevent the
occurrence of shear failure.
11
PROPOSED DESIGN PROTOCOL
Outline of Design Approach
The following design approach is applicable when the wall can be assumed to behave under
simply supported conditions (i.e. arching mechanism is not present). The ultimate strength
design criteria states that the design flexural capacity of a member must exceed the flexural
demand:
≤ φu nM M (3) The following assumptions and limitations should be adopted:
• The strains in the reinforcement and masonry are directly proportional to the distance
from the neutral axis.
• The maximum usable strain, εmu, at the extreme compressive fiber is assumed to be
0.0035 mm/mm (in./in.) for clay masonry and 0.0025 mm/mm (in./in) for concrete
masonry3.
• The maximum usable strain in the FRP reinforcement is considered to be κmεfu (for non-
puttied surfaces κm is 0.45, for puttied surfaces κm is 0.65).
• The tensile strength of masonry is neglected.
• The FRP reinforcement has a linear elastic stress-strain relationship up to failure.
• A masonry stress of 0.70 'mf is assumed uniformly distributed over an equivalent
compression zone bounded by edges of the wall cross section and a straight line parallel
to the neutral axis at a distance a = 0.70c from the fiber of maximum compressive strain
(i.e. γ = 0.70 and β1 = 0.70).
• The reinforcement index ωf is limited to 0.70 to avoid shear failure.
The design protocol can be outlined as follows:
12
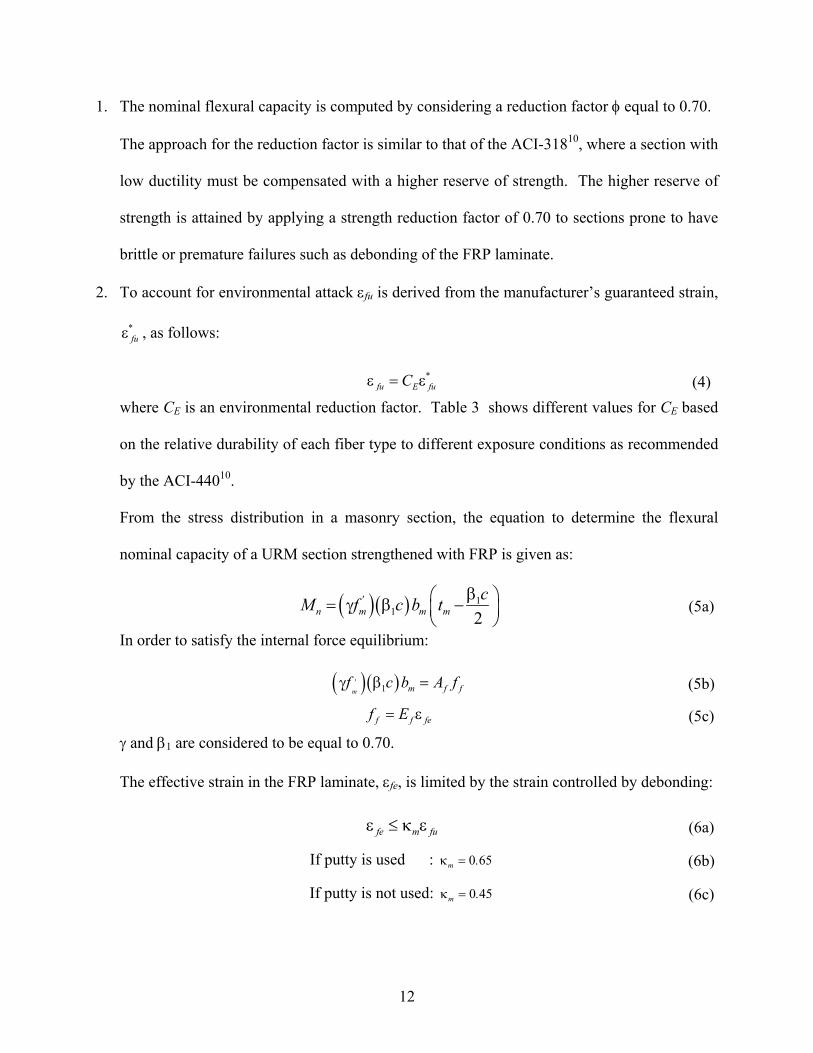
1. The nominal flexural capacity is computed by considering a reduction factor φ equal to 0.70.
The approach for the reduction factor is similar to that of the ACI-31810, where a section with
low ductility must be compensated with a higher reserve of strength. The higher reserve of
strength is attained by applying a strength reduction factor of 0.70 to sections prone to have
brittle or premature failures such as debonding of the FRP laminate.
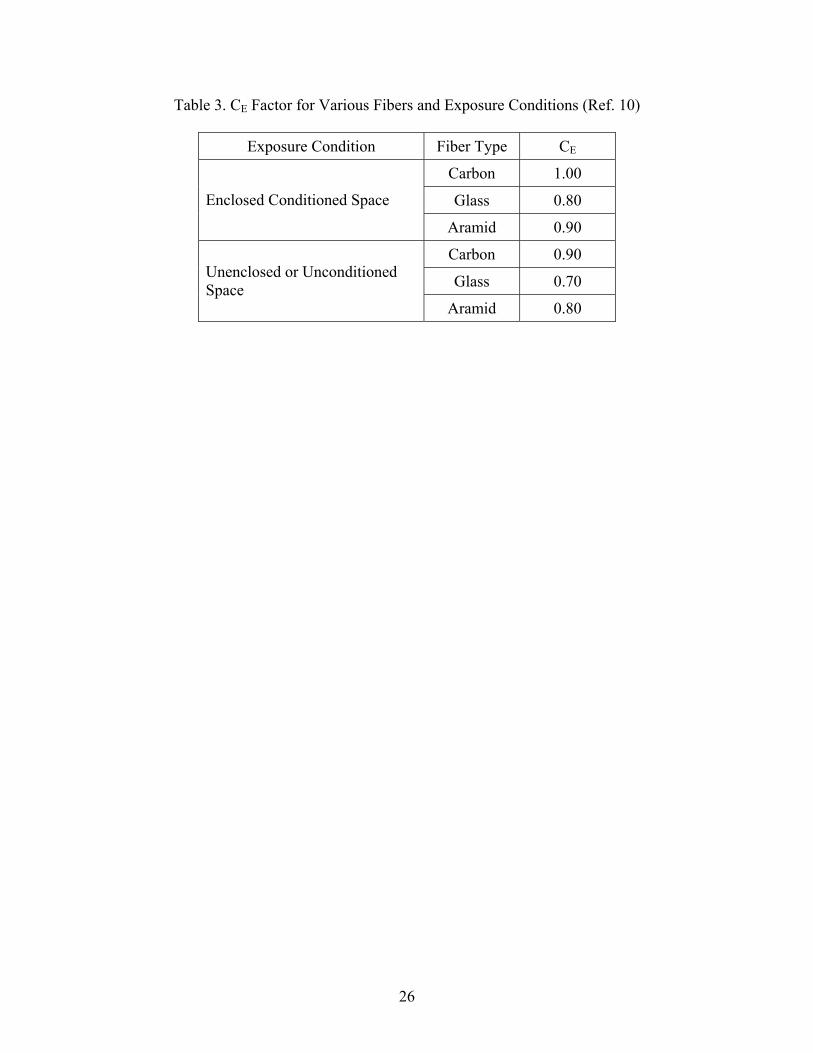
2. To account for environmental attack εfu is derived from the manufacturer’s guaranteed strain,
ε*fu , as follows:
ε = ε*fu E fuC (4)
where CE is an environmental reduction factor. Table 3 shows different values for CE based
on the relative durability of each fiber type to different exposure conditions as recommended
by the ACI-44010.
From the stress distribution in a masonry section, the equation to determine the flexural
nominal capacity of a URM section strengthened with FRP is given as:
( )( ) 11 2
β = γ β −
'n m m m
cM f c b t (5a)
In order to satisfy the internal force equilibrium:
( )( )1γ β =m
,m f ff c b A f (5b)
= εf f fef E (5c)
γ and β1 are considered to be equal to 0.70.
The effective strain in the FRP laminate, εfe, is limited by the strain controlled by debonding:
ε ≤ κ εfe m fu (6a)
If putty is used : 0 65κ =m . (6b)
If putty is not used: 0 45κ =m . (6c)
13
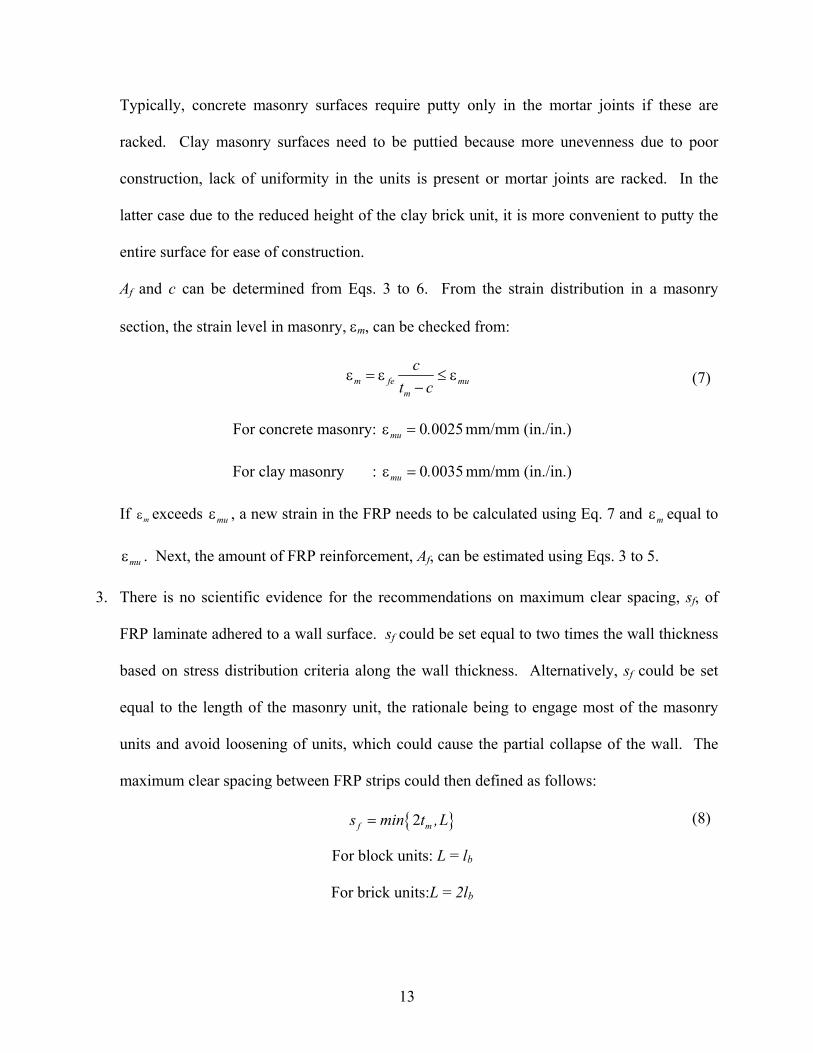
Typically, concrete masonry surfaces require putty only in the mortar joints if these are
racked. Clay masonry surfaces need to be puttied because more unevenness due to poor
construction, lack of uniformity in the units is present or mortar joints are racked. In the
latter case due to the reduced height of the clay brick unit, it is more convenient to putty the
entire surface for ease of construction.
Af and c can be determined from Eqs. 3 to 6. From the strain distribution in a masonry
section, the strain level in masonry, εm, can be checked from:
ε = ε ≤ ε−m fe mu
m
ct c
(7)
For concrete masonry: 0 0025ε =mu . mm/mm (in./in.)
For clay masonry : 0 0035ε =mu . mm/mm (in./in.)
If εm exceeds εmu , a new strain in the FRP needs to be calculated using Eq. 7 and εm equal to
εmu . Next, the amount of FRP reinforcement, Af, can be estimated using Eqs. 3 to 5.
3. There is no scientific evidence for the recommendations on maximum clear spacing, sf, of
FRP laminate adhered to a wall surface. sf could be set equal to two times the wall thickness
based on stress distribution criteria along the wall thickness. Alternatively, sf could be set
equal to the length of the masonry unit, the rationale being to engage most of the masonry
units and avoid loosening of units, which could cause the partial collapse of the wall. The
maximum clear spacing between FRP strips could then defined as follows:
{ }2=f ms min t ,L (8)
For block units: L = lb
For brick units:L = 2lb
14
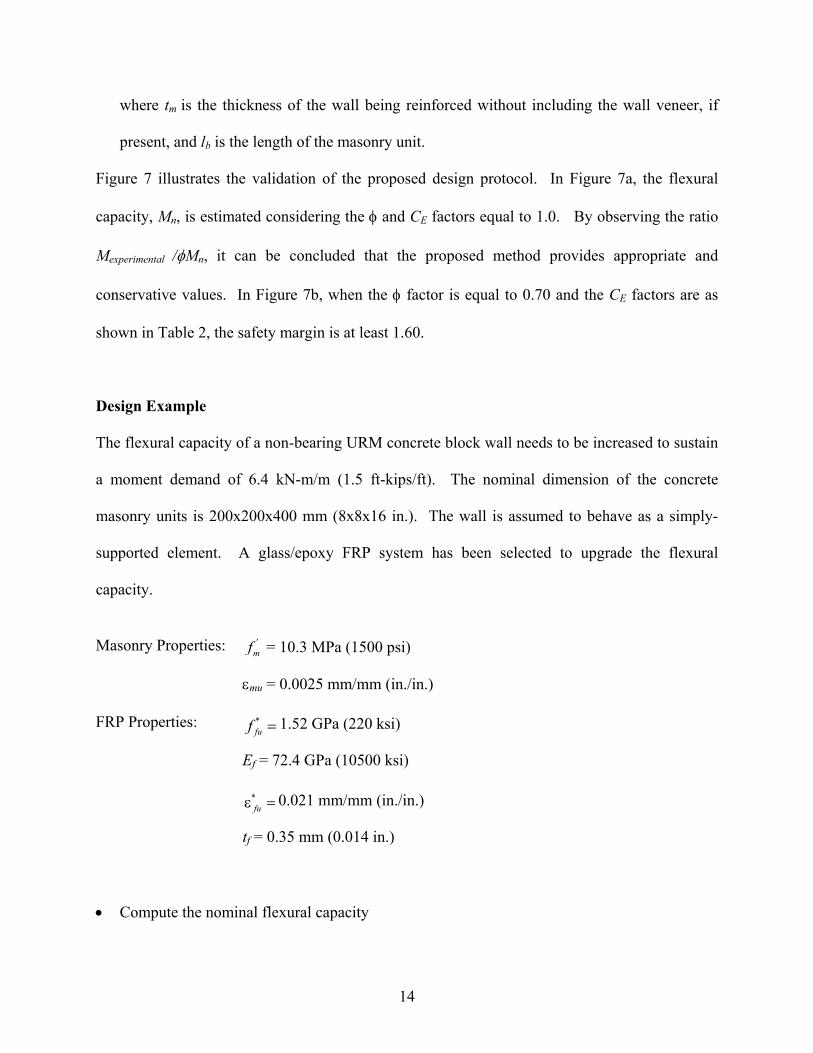
where tm is the thickness of the wall being reinforced without including the wall veneer, if
present, and lb is the length of the masonry unit.
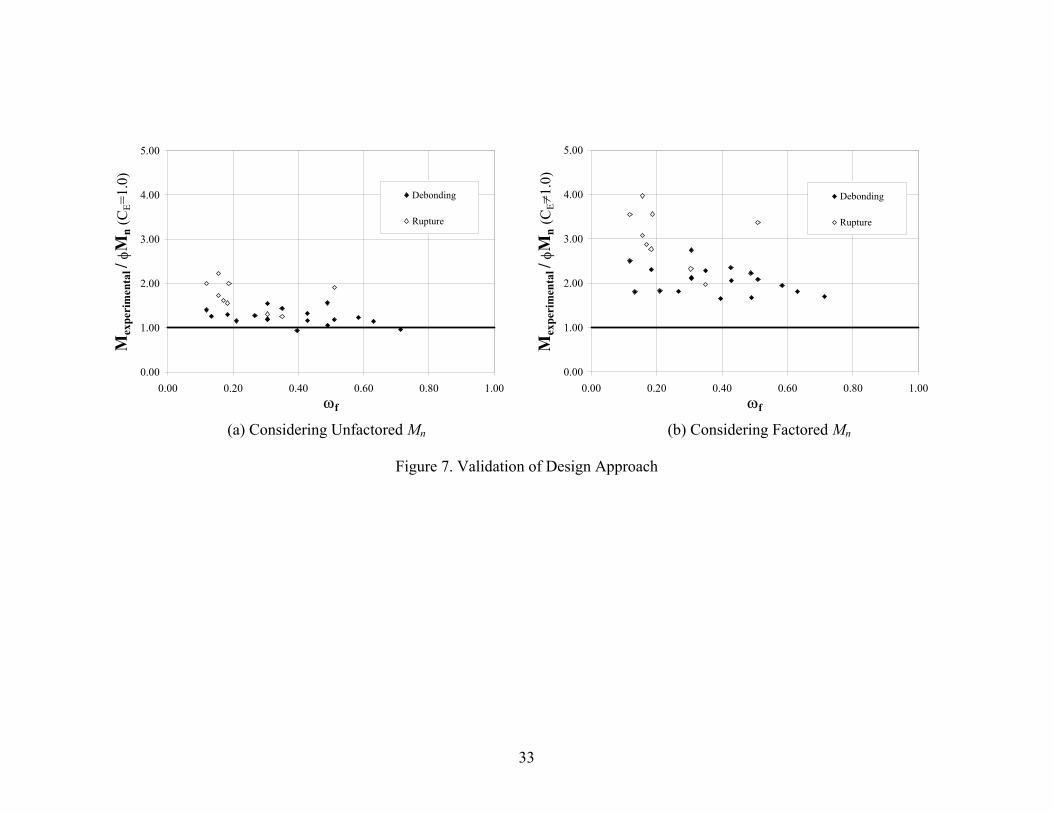
Figure 7 illustrates the validation of the proposed design protocol. In Figure 7a, the flexural
capacity, Mn, is estimated considering the φ and CE factors equal to 1.0. By observing the ratio
Mexperimental /φMn, it can be concluded that the proposed method provides appropriate and
conservative values. In Figure 7b, when the φ factor is equal to 0.70 and the CE factors are as
shown in Table 2, the safety margin is at least 1.60.
Design Example
The flexural capacity of a non-bearing URM concrete block wall needs to be increased to sustain
a moment demand of 6.4 kN-m/m (1.5 ft-kips/ft). The nominal dimension of the concrete
masonry units is 200x200x400 mm (8x8x16 in.). The wall is assumed to behave as a simply-
supported element. A glass/epoxy FRP system has been selected to upgrade the flexural
capacity.
Masonry Properties: '
mf = 10.3 MPa (1500 psi)
εmu = 0.0025 mm/mm (in./in.)
FRP Properties: =*fuf 1.52 GPa (220 ksi)
Ef = 72.4 GPa (10500 ksi)
ε =*fu 0.021 mm/mm (in./in.)
tf = 0.35 mm (0.014 in.)
• Compute the nominal flexural capacity
15
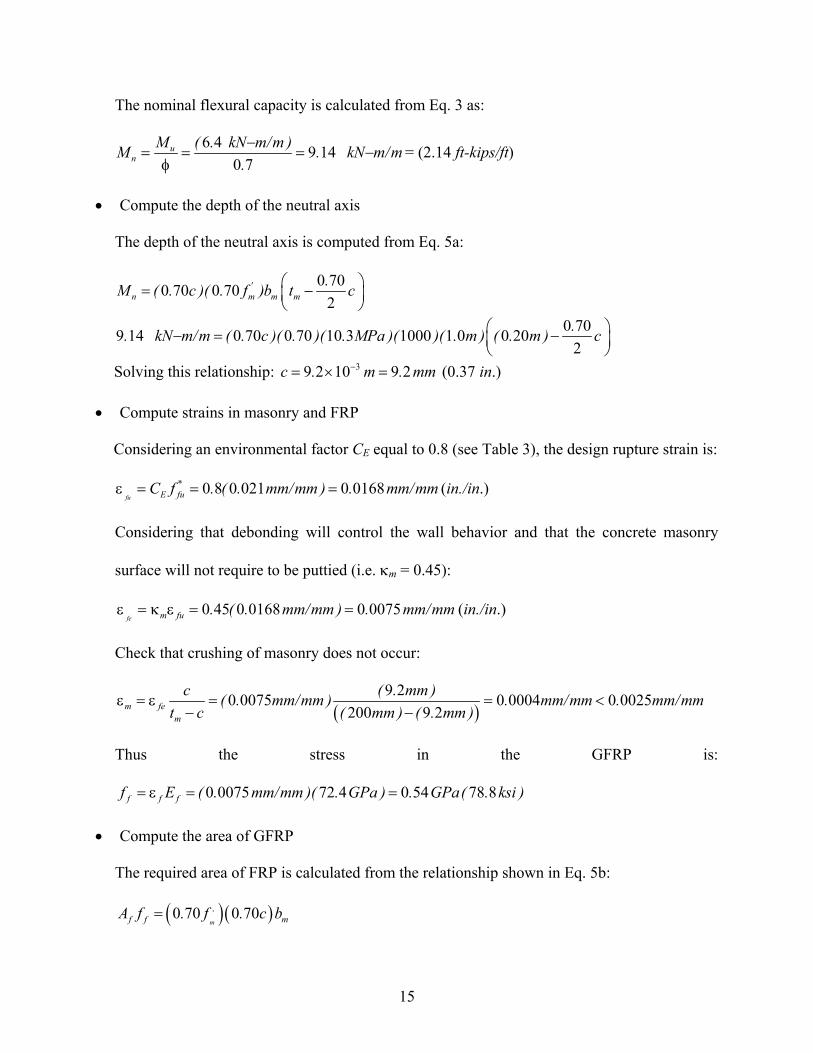
The nominal flexural capacity is calculated from Eq. 3 as:
6 4 9 140 7
−= = = −
φu
nM ( . kN m/m )M . kN m/m
.= (2.14 ft-kips/ft)
• Compute the depth of the neutral axis
The depth of the neutral axis is computed from Eq. 5a:
0 700 70 0 702
= −
'n m m m
.M ( . c )( . f )b t c
0 709 14 0 70 0 70 10 3 1000 1 0 0 202
− = −
.. kN m/m ( . c )( . )( . MPa )( )( . m ) ( . m ) c
Solving this relationship: 39 2 10 9 2−= × =c . m . mm (0.37 in.)
• Compute strains in masonry and FRP
Considering an environmental factor CE equal to 0.8 (see Table 3), the design rupture strain is:
0 8 0 021 0 0168ε = = =fu
*E fuC f . ( . mm/mm ) . mm/mm (in./in.)
Considering that debonding will control the wall behavior and that the concrete masonry
surface will not require to be puttied (i.e. κm = 0.45):
0 45 0 0168 0 0075ε = κ ε = =fe m fu . ( . mm/mm ) . mm/mm (in./in.)
Check that crushing of masonry does not occur:
( )9 20 0075 0 0004 0 0025
200 9 2ε = ε = = <
− −m fem
c ( . mm )( . mm/mm ) . mm/mm . mm/mmt c ( mm ) ( . mm )
Thus the stress in the GFRP is:
0 0075 72 4 0 54 78 8= ε = =f f ff E ( . mm/mm )( . GPa ) . GPa( . ksi )
• Compute the area of GFRP
The required area of FRP is calculated from the relationship shown in Eq. 5b:
( )( )0 70 0 70=m
,f f mA f . f . c b
16
( )( )3(0.54 )(1000) (0.70)(10.3 ) (0.70)(9.2 10 (1.0 )−= ×fA GPa MPa m m
286=fA mm / m (0.041 in2 / ft)
Then, the width of GFRP per wall unit is: 286 246
0 35= = =f
ff
A ( mm /m )w mm/mt ( . mm )
(2.90 in/ft)
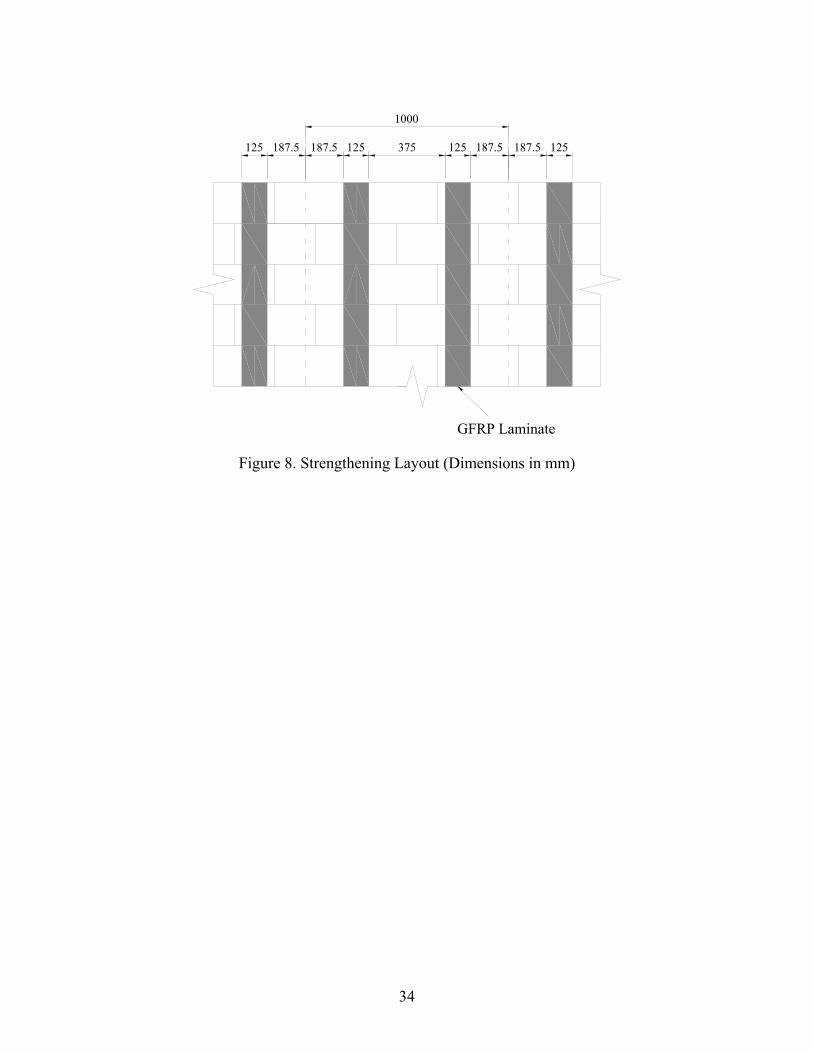
250∴Use mm/ m (3 in/ft) of GFRP laminates
• Determine the maximum clear spacing sf
tm and lb are equal to 200 mm and 400 mm, respectively.
Thus, in the Eq. 8 the clear spacing can be calculated as:
{ }2 200 400 400= =fs min ( mm ), mm mm (16 in.)
The strengthening layout is illustrated in Figure 8, which satisfies the maximum spacing
requirement.
SUGGESTED DETAILING CONSIDERATIONS
Proper FRP reinforcement detailing at wall boundaries is necessary to ensure proper
strengthening and improve the wall behavior by avoiding or delaying premature failures such as
debonding. This may be attained with anchorage systems that include the use of steel angles,
steel bolts, and Near-Surface-Mounted (NSM) bars. Different systems offer their own
advantages and disadvantages. Steel angles are easy to install but aesthetically problematic. As
they may locally fracture the wall due to displacement and rotation restraint, the angles should
not be in direct contact with the masonry surface. Steel bolts have shown high effectiveness but
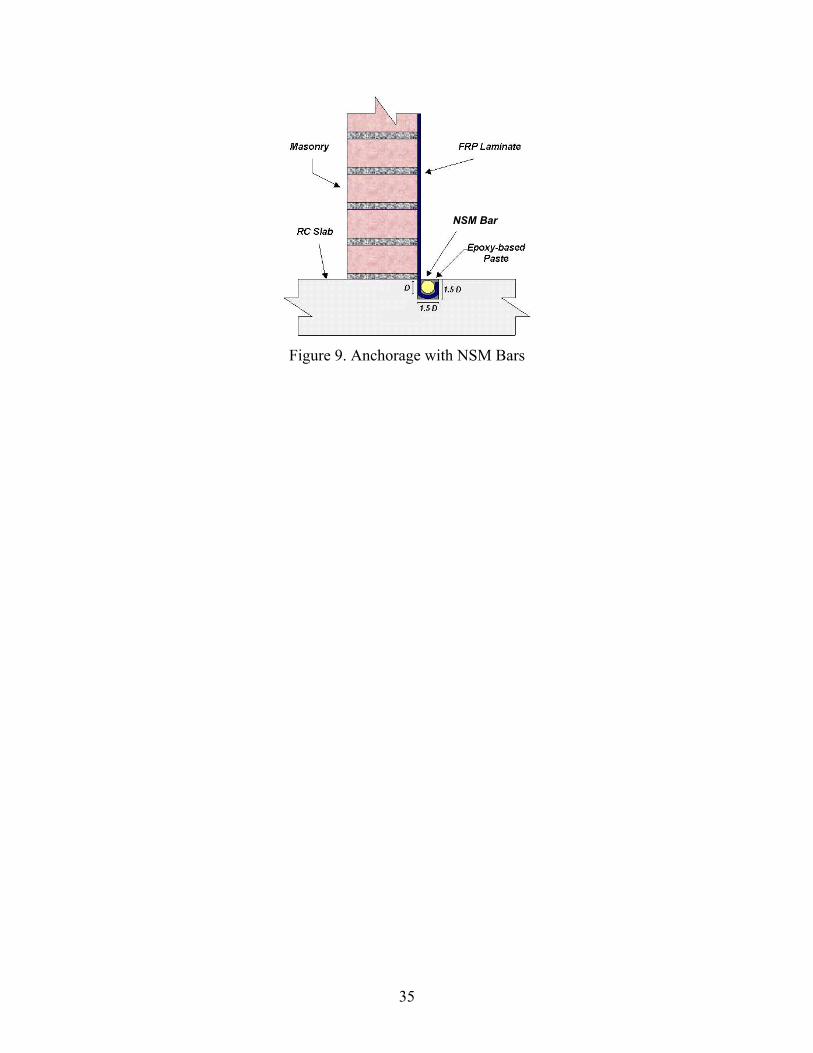
require a demanding installation effort11. NSM bars have been successfully used for anchoring
FRP laminates in both RC joists strengthened in shear12 and URM walls13. The installation
technique consists of grooving a slot in the upper and lower boundary members. The ply is
17
wrapped around an FRP bar and placed in the slot. The bar is then bonded with a suitable epoxy-
based paste (see Figure 9).
SUMMARY AND CONCLUSIONS
The following conclusions can be drawn from this experimental program:
• Strength and pseudo-ductility of URM walls can be significantly increased by strengthening
them with FRP laminates. This increase can be observed in walls that can behave as simply
supported members, such as walls with high h/tm ratios (i.e. larger than 20), or in any walls
where the supports do not restrain the outward movement (i.e. arching mechanism is not
observed).
• The test results made possible to identify three basic modes of failure. One, shear failure,
related to the parent material (i.e. masonry); and two, associated with the reinforcing
material, debonding and flexural failure (i.e. rupture of FRP or crushing of the masonry).
For large amounts of reinforcement (i.e. reinforcement index, ωf, larger than 0.70), shear
failure was observed to be the controlling mode. For other reinforcement ratios, either FRP
rupture or debonding was observed, being the latter the most common.
• Finally, a design methodology for flexural strengthening of walls that can be idealized as
simply supported is presented. Based on experimental data generated by the present
investigation and others, it is recommended to consider the maximum usable strain is the
FRP reinforcement as 0.45εfu for non-puttied surfaces and 0.65εfu for puttied surfaces. The
reinforcement index ωf should not exceed 0.70 to avoid shear failure in the masonry.
18
• The proposed design method described in this paper offers a first rational attempt for
consideration by engineers interested in out-of-plane upgrade of masonry walls with
externally bonded FRP laminates.
NOTATION
Af = area of FRP reinforcement
bm = width of the masonry wall considered in the flexural analysis
CE = environmental reduction factor
c = distance from extreme compression fiber to the neutral axis
Ef = tensile modulus of elasticity of FRP
Em = modulus of elasticity of masonry
ff = stress level in the FRP reinforcement *fuf = ultimate tensile strength of the FRP material as reported by the manufacturer '
mf = compressive strength of masonry
h/tm = slenderness ratio (wall height-to-wall thickness)
L = clear spacing based on length of masonry units
lb = length of masonry units
Mn = nominal flexural capacity
Mu = flexural demand based on factored loads
sf = maximum clear spacing between FRP strips
tf = nominal thickness of one ply of FRP reinforcement
tm = nominal thickness of masonry wall
wf = width of FRP reinforcing plies
β1 = ratio of the depth of the equivalent rectangular stress block to the depth to the neutral axis
εm = compressive strain in masonry
ε'm = compressive strain in masonry associated to peak '
mf in a parabolic distribution
εmu = ultimate compressive strain of masonry
εfu = design rupture strain of FRP reinforcement
19
εfe = effective strain in FRP reinforcement
ε*fu = ultimate rupture strain of FRP reinforcement
φ = strength reduction factor
γ = multiplier on 'mf to determine the intensity of an equivalent block stress for masonry
κm = bond dependent coefficient
ρf = ratio of FRP flexural reinforcement
ωf = FRP reinforcement index
ACKNOWLEDGEMENTS
The authors would like to acknowledge the support of the National Science Foundation
Industry/University Cooperative Research Center at the University of Missouri–Rolla.
REFERENCES
1. California Seismic Safety Commission, “Status of Unreinforced Masonry Building Law,”
SSC 2000-02, Sacramento California, 2000.
2. Tumialan J.G., Morbin A., Micelli F. and Nanni A., “Flexural Strengthening of URM
Walls with FRP Laminates,” Third International Conference on Composites in Infrastructure
(ICCI 2002), San Francisco, CA, June 10-12, 2002, 11 pp. (Accepted for Publication)
3. Masonry Standards Joint Committee, “Building Code Requirements for Masonry
Structures,” ACI-530-99/ASCE 5-99/TMS 402-99, American Concrete Institute, American
Society of Civil Engineers, and The Masonry Society, Detroit, New York, and Boulder, 1999.
20
4. Velazquez-Dimas J.I., “Out-of-Plane Cyclic Behavior of URM Walls Retrofitted with Fiber
Composites,” Doctoral Dissertation, Department of Civil Engineering and Engineering
Mechanics, The University of Arizona, Tucson, Arizona, 1998.
5. Roko K., Boothby T.E., and Bakis C.E., “Failure Modes of Sheet Bonded Fiber Reinforced
Polymer Applied to Brick Masonry,” Fourth International Symposium on Fiber Reinforced
Polymer (FRP) for Reinforced Concrete Structures, Baltimore, Maryland, November 1999, pp.
305-311.
6. Albert L.M., Elwi A.E., Cheng J.J., “Strengthening of Unreinforced Masonry Walls Using
FRPs,” ASCE Journal of Composites for Construction, Vol.5, No.2, May 2001, pp. 76-84.
7. Hamilton H.R. III, and Dolan C.W, “Flexural Capacity of Glass FRP Strengthened
Concrete Masonry Walls,” ASCE Journal of Composites for Construction, Vol.5, No.3, August
2001, pp. 170-178.
8. Tumialan J.G., “Strengthening of Masonry Structures with FRP Composites,” Doctoral
Dissertation, Department of Civil Engineering, University of Missouri-Rolla, Rolla, Missouri,
2001, 186 pp.
9. American Concrete Institute (ACI), Committee 318, “Building Code Requirements for
Reinforced Concrete and Commentary,” American Concrete Institute, Detroit, Michigan, 1999.
10. American Concrete Institute (ACI), Committee 440, “Guide for the Design and
Construction of Externally Bonded FRP Systems for Strengthening Concrete Structures,” July
2000 (document under review).
11. Schwegler G. and Kelterborn P., “Earthquake Resistance of Masonry Structures
strengthened with Fiber Composites,” Eleventh World Conference on Earthquake Engineering,
Acapulco, Mexico, 1996, 6 pp. CD-ROM.
21
12. Annaiah H.R., “Shear Performance of Reinforced Concrete Beams Strengthened in situ
with Composites,” Master’s Thesis, Department of Civil Engineering, University of Missouri-
Rolla, 2000, 136 pp.
13. Morbin A., “Strengthening of Masonry Elements with FRP Composites”, Tesi di Laurea,
Dipartimento di Ingegneria Edile, Università di Padova, Italy, December 2001, 190 pp.
22
LIST OF TABLES
Table 1. Test Matrix
Table 2. Experimental and Theoretical Results
Table 3. CE Factor for Various Fibers and Exposure Conditions
23
LIST OF FIGURES
Figure 1. Modes of Failure (Ref. 2)
Figure 2. Moment vs. Deflection of URM Walls Strengthened with FRP Laminates (Ref. 2)
Figure 3. Strain and Stress Distributions
Figure 4. Influence of Amount of FRP Reinforcement
Figure 5. Normal Distributions for γ and β1
Figure 6. Normalized Experimental Flexural Capacity vs. Reinforcement Index
Figure 7. Validation of Design Approach
Figure 8. Strengthening Layout (Dimensions in mm)
Figure 9. Anchorage with NSM Bars
24
Table 1. Test Matrix (Ref. 2)
Strip Width, mm (in.) Masonry Type Series FRP
Fiber 75 (3) 125 (5) 175 (7) 225 (9) 300 (12)
COG GFRP COG3 COG3R
COG5 COG5R COG7 COG9 COG12
Concrete COA AFRP COA3 COA5 COA7 COA9 COA12
CLG GFRP CLG3 CLG3R
CLG5 CLG5R
CLG7 CLG7R CLG9 CLG12
Clay CLA AFRP CLA3 CLA5 CLA7 CLA9 CLA12
25
Table 2. Experimental and Theoretical Results (Ref. 2)
Masonry FRP Flexure Shear Source
Type h/tm System ρf Mexp
(kN-m) Mthe
(kN-m) εf exp (%)
Vexp (kN)
Vthe (kN)
Failure
COG3 CO 12.3 GFRP 0.0005 2.05 4.18 NA 4.27 11.37 D COG3R CO 12.3 GFRP 0.0005 3.22 4.18 1.49 5.52 11.37 D COG5 CO 12.3 GFRP 0.0008 3.33 5.64 NA 6.89 11.37 D
COG5R CO 12.3 GFRP 0.0008 5.37 5.64 1.83 7.16 11.37 R COG7 CO 12.3 GFRP 0.0011 3.74 6.51 NA 7.74 11.37 D COG9 CO 12.3 GFRP 0.0014 5.23 7.23 NA 10.85 11.37 S(1)
COG12 CO 12.3 GFRP 0.0019 6.06 8.12 NA 12.59 11.37 S(1) COA3 CO 12.3 AFRP 0.0004 2.54 3.66 NA 5.25 11.37 D COA5 CO 12.3 AFRP 0.0006 3.57 5.57 NA 7.38 11.37 D COA7 CO 12.3 AFRP 0.0009 4.66 6.44 NA 9.70 11.37 S(1) COA9 CO 12.3 AFRP 0.0011 5.25 7.16 NA 10.90 11.37 S(1)
COA12 CO 12.3 AFRP 0.0015 6.33 8.05 NA 13.12 11.37 S(1) CLG3 CL 12.3 GFRP 0.0005 3.23 4.23 NA 7.78 22.98 D
CLG3R CL 12.3 GFRP 0.0005 3.88 4.23 2.25 8.05 22.98 R CLG5 CL 12.3 GFRP 0.0008 4.89 6.97 NA 10.14 22.98 D
CLG5R CL 12.3 GFRP 0.0008 5.37 6.97 1.97 11.56 22.98 R CLG7 CL 12.3 GFRP 0.0011 6.58 9.57 NA 13.61 22.98 D
CLG7R CL 12.3 GFRP 0.0011 7.20 9.57 1.54 14.63 22.98 D CLG9 CL 12.3 GFRP 0.0014 6.94 11.09 NA 14.37 14.81 S(2) CLG12 CL 12.3 GFRP 0.0019 6.16 12.47 NA 12.77 14.81 S(2) CLA3 CL 12.3 AFRP 0.0004 2.94 3.70 NA 6.09 22.98 D CLA5 CL 12.3 AFRP 0.0006 5.23 6.10 NA 10.85 22.98 R CLA7 CL 12.3 AFRP 0.0009 6.13 8.45 NA 12.72 22.98 D CLA9 CL 12.3 AFRP 0.0011 8.45 10.66 NA 17.48 22.98 D CLA12 CL 12.3 AFRP 0.0015 5.90 12.35 NA 12.23 14.81 S(2)
Albert et al. CO 19.2 GFRP 0.0008 21.14 35.52 0.69 18.01 36.93 D Albert et al. CO 18.6 CFRP 0.0003 29.50 40.86 0.78 25.13 37.08 D Albert et al. CO 18.6 CFRP 0.0003 24.48 40.86 0.73 20.86 50.17 D Albert et al. CO 18.6 CFRP 0.0002 12.28 21.24 0.78 10.45 50.17 R
Hamilton et al. CO 8.6 GFRP 0.0002 3.44 5.46 NA 7.92 25.86 D Hamilton et al. CO 8.6 GFRP 0.0002 4.23 5.46 NA 9.74 22.54 R Hamilton et al. CO 8.6 GFRP 0.0002 4.89 5.46 NA 11.30 25.86 R Hamilton et al. CO 8.6 GFRP 0.0002 5.45 5.46 NA 12.54 22.54 R Hamilton et al. CO 22.7 GFRP 0.0008 15.60 21.14 NA 13.48 26.48 R Hamilton et al. CO 22.7 GFRP 0.0008 19.35 21.38 NA 16.72 25.24 R
Tumialan CO 6.0 GFRP 0.0005 11.33 20.86 0.72 25.66 24.06 S(1) Tumialan CO 6.0 AFRP 0.0005 10.10 22.51 0.82 22.91 24.06 S(1)
Legend: D: FRP Debonding S: Masonry Shear (1) Flexural-Shear R: FRP Rupture (2) Sliding Shear
26
Table 3. CE Factor for Various Fibers and Exposure Conditions (Ref. 10)
Exposure Condition Fiber Type CE
Carbon 1.00
Glass 0.80 Enclosed Conditioned Space
Aramid 0.90
Carbon 0.90
Glass 0.70 Unenclosed or Unconditioned Space
Aramid 0.80
27
(a) FRP Debonding (b) FRP Rupture
(c) Flexural-Shear (d) Sliding Shear
Figure 1. Modes of Failure (Ref. 2)
28
0
2
4
6
8
10
0 5 10 15 20 25 30 35 40Deflection (mm)
Mom
ent (
kN-m
)
COG3COG3RCOG5COG5RCOG7COG9COG12
0
2
4
6
8
10
0 5 10 15 20 25 30 35 40Deflection (mm)
Mom
ent (
kN-m
)
COA3
COA5
COA7
COA9
(a) Series COG (b) Series COA
0
2
4
6
8
10
0 5 10 15 20 25 30 35 40Deflection (mm)
Mom
ent (
kN-m
)
CLG3 CLG3RCLG5 CLG5RCLG7 CLG7RCLG9 CLG12
0
2
4
6
8
10
0 5 10 15 20 25 30 35 40Deflection (mm)
Mom
ent (
kN-m
)
CLA3
CLA5
CLA7
CLA9
CLA12
(c) Series CLG (d) Series CLA
Figure 2. Moment vs. Deflection of URM Walls Strengthened with FRP Laminates (Ref. 2)
29
Figure 3. Strain and Stress Distributions
Af
bm
tm
c
εm
εf ff Af ff Af
'mf γ '
mf
β1c
30
0.0
0.1
0.2
0.3
0.4
0.5
0.6
0.7
0.8
0.9
1.0
0.0 0.2 0.4 0.6 0.8 1.0 1.2ωf = (ρf Ef)/(f'm(h/tm))
Mex
peri
men
tal /
Mth
eore
tical
FRP Debonding
Masonry Shear
FRP Rupture
0.0
0.1
0.2
0.3
0.4
0.5
0.6
0.7
0.8
0.9
1.0
0.0 0.2 0.4 0.6 0.8 1.0 1.2
ωf = (ρf Ef)/(f'm(h/tm))
Mex
peri
men
tal /
Mth
eore
tical
FRP Debonding
Masonry Shear
FRP Rupture
(a) Concrete Masonry (No Putty) (b) Clay Masonry (with Putty)
Figure 4. Influence of Amount of FRP Reinforcement
31
0.000 0.200 0.400 0.600 0.800 1.000 1.200 1.400γ values
0.6830.523 0.844
0.600 0.650 0.700 0.750 0.800 0.850β1 values
0.692 0.715 0.738
Figure 5. Normal Distributions for γ and β1
32
0.000
0.002
0.004
0.006
0.008
0.010
0.0 0.2 0.4 0.6 0.8 1.0 1.2 1.4 1.6ωf
Mex
p/bm
t m2 f' m
(h / t)
Debonding (Clay/Puttied)
Flexure (Clay/Puttied)
Shear (Clay/Puttied)
Debonding (Concrete/Non-Puttied)
Shear (Concrete/Non-Puttied)
Clay/Puttied
Concrete/Non-Puttied
h/tm = 12
Figure 6. Normalized Experimental Flexural Capacity vs. Reinforcement Index
33
0.00
1.00
2.00
3.00
4.00
5.00
0.00 0.20 0.40 0.60 0.80 1.00ωf
Mex
peri
men
tal /
φMn
(CE=
1.0)
Debonding
Rupture
0.00
1.00
2.00
3.00
4.00
5.00
0.00 0.20 0.40 0.60 0.80 1.00ωf
Mex
peri
men
tal /
φMn (
CE=
1.0)
Debonding
Rupture
(a) Considering Unfactored Mn (b) Considering Factored Mn
Figure 7. Validation of Design Approach
34
125 187.5 187.5 125 375 125 187.5 187.5 125
1000
GFRP Laminate
Figure 8. Strengthening Layout (Dimensions in mm)
35
NSM Bar
Figure 9. Anchorage with NSM Bars
Related Documents