FROZEN YOGURT MANUFACTURING Item Type text; Electronic Thesis Authors COOK, KATHRYN LOUISE KRAMER; Moline, Dena; Morehead, Yirla; Ormsby, Stefka Publisher The University of Arizona. Rights Copyright © is held by the author. Digital access to this material is made possible by the University Libraries, University of Arizona. Further transmission, reproduction or presentation (such as public display or performance) of protected items is prohibited except with permission of the author. Download date 10/05/2018 08:31:26 Link to Item http://hdl.handle.net/10150/190435

Welcome message from author
This document is posted to help you gain knowledge. Please leave a comment to let me know what you think about it! Share it to your friends and learn new things together.
Transcript

FROZEN YOGURT MANUFACTURING
Item Type text; Electronic Thesis
Authors COOK, KATHRYN LOUISE KRAMER; Moline, Dena; Morehead,Yirla; Ormsby, Stefka
Publisher The University of Arizona.
Rights Copyright © is held by the author. Digital access to this materialis made possible by the University Libraries, University of Arizona.Further transmission, reproduction or presentation (such aspublic display or performance) of protected items is prohibitedexcept with permission of the author.
Download date 10/05/2018 08:31:26
Link to Item http://hdl.handle.net/10150/190435

Frozen Yogurt Manufacturing
Course: ChEE 443: Plant Design Submitted: May 2, 2008
_______________________________ _______________________________ Kathryn Cook, Senior Design Engineer Dena Moline, Senior Design Engineer
_______________________________ _______________________________ Yirla Morehead, Senior Design Engineer Stefka Ormsby, Senior Design Engineer

Executive Summary
The goal of this project was to design a manufacturing facility to produce 7.4 million
containers of vanilla frozen yogurt annually with each container holding 1.75 quarts.
Pennsylvania was chosen as the building site because of the demand for frozen yogurt in the
region. In today’s market there are many reasons to market more low-fat and more healthful
foods based on recent diet and health trends. In 2006, the market for frozen yogurt in the United
States was $200 million, and 30% of this market is concentrated in the northeastern US alone
(Parker, 2005). While Yogurina will supply a small percentage of that, 5%, we feel that the
region has a strong demand for the low-fat frozen yogurt product we are offering.
Frozen yogurt has several key ingredients, starting with ultrafiltered skim milk. A sweet
mix is made by adding cream, sugar, and stabilizers to a third of the milk, and yogurt is made by
fermenting the other two thirds of the milk. Next, the sweet mix and yogurt are combined, aged,
and then flavored. In the most important step, the frozen yogurt mix is sent through an
ammonia-cooled scraped surface heat exchanger, where initial freezing takes place and air is
injected to give the frozen yogurt a light, creamy texture. Finally, the frozen yogurt is packaged,
hardened, and finally sent to a storage freezer to await shipping.
In order to be environmentally friendly and economical, the design was optimized at
various stages of the process. The primary optimization involves the refrigeration cycle needed
to freeze the frozen yogurt. Wherever possible, energy was recycled to reduce the amount of
utilities needed. Also, ambient air was used as a coolant to reduce cooling water needs. A
cooling tower was also used, not only to prevent disposal of hot water into the environment, but
also to recycle cooling water. Because ultrafiltering the milk leaves 78% of the milk as waste

filtrate, some filtrate was reused as the growth medium for the yogurt culture. In addition,
insulated pipes are used in order to reduce energy losses.
While designing the process, safety was also considered. Within the refrigeration cycle,
temperatures and pressures were kept as ambient as possible while still freezing the frozen
yogurt. Excepting ammonia, the coolants water, brine, and air were used because they are both
economical and safe to handle. The main safety hazard in the plant is an ammonia leak. Though
the process has relatively few hazards, proper protective equipment requirements and safety
training are necessary to maintain a safe working environment. Finally, to ensure food safety, a
quality control lab is necessary to prevent microbiological or other product contamination.
A 30 year cost analysis for this project was performed. The overall bare module cost for
the equipment is $7.9 million. Estimated annual sales total $29.7 million at a selling price of $4
per container based on current market values. The net present value of the investment after 30
years is $9.9 million. An initial total capital investment of $22.99 million is required with an
annual operating cost of $22.6 million. At a 20% interest rate, the payback period is 2.8 years.
The investor’s rate of return or discounted cash flow rate of return is calculated to be 34.4%.
Yogurina is producing a product that is similar to other frozen yogurt products on the
market. However, Yogurina produces frozen yogurt with added health benefits, such as lower
fat, higher calcium, live probiotics, higher protein, lower lactose, and added prebiotics.
Although Yogurina is a premium frozen yogurt, it will still be offered at a midrange price so that
when the market price of raw materials, such as milk, fluctuates, Yogurina would be able to
adjust the selling price accordingly to maintain profits. After producing and evaluating this
design, Yogurina concludes that this process to produce hard-packed frozen yogurt is
economically feasible and recommends that further work to build this plant go forward.

4
Table of Contents
Section Page
1.0 Introduction
1.1 Overall Goal 5
1.2 Current Market Information 5 – 7
1.3 Project Premises and Assumptions 8 – 11
2.0 Process Description, Rationale, and Optimization
2.1 Written Description of Process 11 – 16
2.2 Block Flow Diagram 17 – 18
2.3 Process Flow Diagram 19 – 23
2.4 Stream Tables 24 – 27
2.5 Equipment Tables 28 – 37
2.6 Production and Raw Material Requirements 38
2.7 Utility Requirements 38 – 39
2.8 Rationale for Process Choice 40 – 47
2.9 Equipment Description, Rationale, and Optimization 47 – 56
3.0 Safety
3.1 Safety Statement 56 – 63
3.2 Process Hazard Analyses 64 – 75
4.0 Environmental Impact Statement 76 – 81
5.0 Economics
5.1 Economic Analysis 82 – 83
5.2 Economic Hazards 83 – 85
6.0 Conclusions and Recommendations 85 – 87
Appendices
A Overall Mass and Energy Balances A-1 – A-10
B Process Calculations B-1 – B-28
C Economic Calculations C-1 – C-67
D Assumptions D-1 – D-7
E References E-1 – E-11

5
1.0 Introduction
1.1 Overall Goal
The objective of the present study is to design a dairy facility in rural Pennsylvania with a
minimum manufacturing capacity of 7.43 million (1.75 quart) units of vanilla flavored frozen
yogurt annually. The annual production rate is intended to meet about 5% of the demand for
frozen yogurt in the northeastern United States. This region includes New York City, Phila-
delphia, Baltimore, and Washington DC (Parker, 2005). The process starts with the milk and
other raw ingredients and ends with hard-packed frozen yogurt ready for shipping. Given
current trends towards low-fat foods, techniques to keep a creamy product while lowering the fat
content are incorporated into this process (Stogo, 1998). Regular ice cream is 10-16% milk fat,
but the goal is to make this frozen yogurt 2% milk fat and still tasty (Arbuckle, 1977). Also,
probiotic bacteria are included along with the normal yogurt cultures to provide added digestive
benefits (Teitelbaum and Walker, 2002).
1.2 Current Market Information
With consumers becoming more concerned about their health, frozen yogurt is becoming
an increasingly popular alternative to ice cream (Stogo, 1998). While the whole market for
frozen desserts is growing, frozen yogurt is experiencing the strongest growth (Pszczola, 2008).
In 2006, consumption of frozen yogurt in the United States was $200 million with 30% of this
consumption concentrated in the northeast region alone. China had the second highest
consumption of frozen yogurt in 2006 with $92 million in latent demand. New York City
consumes the most frozen yogurt in the world: 5.3% of the world’s frozen yogurt and 22.8% of
the United States’ frozen yogurt is consumed by New Yorkers (Parker, 2005). In order to situate

6
the plant in close proximity to the east coast market, one of the leading states in dairy production,
Pennsylvania, was chosen for the plant’s location (Environmental Protection Agency, Dairy
Production, 2008).
Vanilla was chosen as the flavor to be produced because it is the most popular ice cream
and frozen yogurt flavor. Vanilla also forms the base for many other frozen yogurt flavors
(Stogo, 1998).
The main focus of Yogurina is to provide consumers with a product that will have
additional health benefits in comparison to current frozen yogurt and ice cream products. There
are many options in frozen yogurt for adding health benefits that will attract customers. The key,
however, is to add the health benefits while maintaining similar sensory attributes to the original
version. Sensory factors which are important to consumer perception include creaminess,
hardness, flavor, acidity and melting (El-Nagar, et al., 2002). With frozen yogurt, this often
means tasting more like ice cream and less like yogurt (Stogo, 1998).
The most attractive health promotion is lower fat. The challenge with low-fat frozen
yogurt, however, is achieving the same creamy texture that the full fat version has (Hartel, 1996).
Thus, the low-fat frozen yogurt this process will produce must retain the properties and texture of
traditional ice cream.
Another popular health claim is the inclusion of probiotic bacteria. According to recent
research, these bacteria likely support immune system function and gastrointestinal health
(Teitelbaum and Walker, 2002). It is also imperative that a sufficient percentage of probiotic
bacteria are present in the final product for optimum digestive benefits (Ordonez, et al., 2000).
One marketplace example of probiotics is Danone’s Activia yogurt, which is a conventional
yogurt with claims to help “naturally regulate your slow intestinal transit” (Danone Activia,

7
2008). Currently, sales of dairy foods with probiotics are increasing dramatically: about 20%
annually (Pszczola, 2008). Given the trend towards probiotics, incorporating some in Yogurina
would be an added selling point for customers.
Claims of higher calcium or lower lactose content may also attract customers concerned
about their bones or lactose intolerance. Using ultrafiltered milk can achieve both these ends
while improving the frozen yogurt’s texture at the same time (Ordonez, et al., 2000).
Fiber is also attractive to consumers, particularly when it is advertised as prebiotics,
which promote the growth of probiotic bacteria in the intestines (Teitelbaum and Walker, 2002).
A study by El-Nagar, et al. (2002) showed that the addition of inulin, a soluble dietary fiber, to
the low-fat frozen yogurt mix improved the texture comparable to a high fat content frozen
yogurt while adding the health benefit characteristic of dietary fibers.
Yogurina believes the incorporation of these findings into a new product will appeal to a
wide range of consumers. It is assumed that Yogurina will capture approximately 5% of the east
coast’s current market based on regional demand and annual production for the facility. Due to
all of the health benefits and the intended rich and creamy taste, Yogurina is intended to be a
premium frozen yogurt, which will command a higher selling price. In 2007, the monthly
average selling price of ice cream varied between $1.897 and $2.113 per quart (University of
Wisconsin, Madison, 2008). Currently grocery stores are selling Häagen Dazs frozen yogurt for
$7.00/qt ($3.74/lb) and Food Club frozen yogurt for $1.75/qt ($1.37/lb) (Safeway, 2008;
Coborn’s, 2008). Yogurina intends to sell its product to grocery stores for $2.29/qt ($1.46/lb or
$4 per 1.75 qt). This is the wholesale price to the grocery stores. To stay competitive with other
brands, Yogurina could be sold for $3.43/qt, $6 per container, in grocery stores.

8
Fig. 1.3.1: Schematic of a scraped surface heat exchanger for initial frozen yogurt
freezing (Univ. of Guelph, 2008)
1.3 Project Premises and Assumptions
The process to make frozen yogurt is nearly identical to the ice-cream-making process,
with the exception that yogurt is added to the mix. There is no federal standard of identity for
frozen yogurt, so composition can vary
between brands (Guinard, et al., 1994;
Univ. of Guelph, 2008). A typical frozen
yogurt mix contains milk, cream, sugar,
stabilizers, and emulsifiers. Once the mix
is prepared, it is initially frozen in a
scraped surface heat exchanger, where
about 50% of the water is frozen (Adapa,
et al., 2000). A drawing of a typical
scraped surface heat exchanger is shown
in Fig. 1.3.1. Air is also injected into the product in the freezer. The product is still soft at this
point, so it is packaged and then hardened. As the ice crystallizes, the remaining water contains
more and more sugar, which depresses the freezing point so that in the final, hardened product,
about 75% of the water is frozen (Hartel, 1996). The product is both an emulsion and a foam.
The emulsion consists primarily of milk fat dispersed in an aqueous phase containing sugar, acid,
and the dry matter contents (Adapa, et al., 2000; Güven and Karaca, 2002). The foam is formed
by pockets of air being dispersed throughout the emulsion and is stabilized by coalesced fat
globules (Univ. of Guelph, 2008).
One key quality issue in frozen yogurt and ice cream manufacture is the size of the ice
crystals in the final product (Drewett and Hartel, 2007). The best ice creams on the market have

9
a smooth and creamy texture, along with a delicious flavor. That creamy texture, often
associated with a high fat content, is determined, in large part, by the average size of the ice
crystals. Larger crystals (greater than 50 µm) impart a grainy texture on the ice cream, while
smaller crystals (around 10-20 µm) give ice cream the desired creaminess (Drewett and Hartel,
2007). This means that if the ice crystal size can be kept small, less fat can be added to the
product. The challenge with low fat ice cream, however, is achieving the same creamy texture
that the full fat ice cream has. The source of this challenge is that when ice cream contains more
fat, it, most commonly, contains less water, and thus the crystals that are formed are smaller
(Hartel, 1996).
Processing conditions and the mix formulation can both affect ice crystal size. A shorter
residence time in the scraped surface heat exchanger has been found to correlate with smaller
crystal size since heat is removed faster from the freezer (Drewett and Hartel, 2007). Higher
overrun, the percent increase in volume due to air injection, also correlates with slightly smaller
crystal size. It is believed that the air pockets act as barriers to crystal growth (Sofjan and Hartel,
2004). However, lower overrun is characteristic of a premium ice cream. A super-premium
brand may have between 25-50% overrun, while an economy brand can have up to 120%
overrun (Univ. of Guelph, 2008). Since Yogurina is intended to be a premium frozen yogurt, the
overrun will be 50%. Stabilizers are added to slow down undesirable recrystallization during
storage. Carrageenan was found to be one of the best stabilizers for slowing recrystallization
(Adapa, et al., 2000). The type of sweetener used can also affect crystallization and
recrystallization. The lowest rates of recrystallization were seen in ice creams made with 20
dextrose-equivalent corn syrup, and the highest with high fructose corn syrup (Adapa, et al.,
2000). In another study, the type of sweetener was found not to significantly affect ice

10
crystallization provided that an appropriate draw temperature was selected based on the freezing
point depression (Drewett and Hartel, 2007).
Lactose crystallization, which can cause a sandy texture, is another issue in ice cream
quality. Lactose is not highly soluble in milk’s serum phase, and thus it is known to precipitate
out (Arbuckle, 1977). Low storage temperatures and a viscous serum phase can help minimize
the possibility of lactose crystallization (Nickerson, 1962). Less lactose would also logically
lead to less lactose crystallization.
In yogurt manufacture, milk is fermented until the desired acidity is reached. The
thermophilic lactic acid bacteria used to ferment the product must include Lactobacillus
bulgaricus and Streptococcus thermophilus for the yogurt portion to be considered yogurt
(Chandan, 2006). In addition to these bacteria, probiotic bacteria, such as Bifidobacterium
bifidum and Lactobacillus acidophilus, can also be incorporated (Ordonez, et al., 2000; Saarela,
et al., 2000). Yogurt is formed when the acidity reaches such a level that the milk coagulates
(Spreer, 1998). For frozen yogurt, a lower titratable acidity, 0.23% to 0.29% lactic acid,
correlates with a higher degree of liking, irrespective of sugar content. For comparison, a plain,
unfrozen yogurt may have a titratable acidity of 0.95% (Guinard, et al., 1994).
Frozen yogurt manufacturing is a rigorous and complex process. Therefore, several
assumptions were made in order to develop an operational design. First of all, it is assumed that
Yogurina products have enough consumer demand in the east coast to capture about 5% of the
current market. Secondly, this preliminary design lacks research and development facilities and
pilot plants for flavor development and quality testing. As a result, Yogurina is assuming that
the developed formulations will yield a high quality product. Pilot plant trials could be carried

11
out to assess whether any modifications to the process or formulation are needed to make
Yogurina frozen yogurt taste as delicious as intended.
2.0 Process Description, Rationale, and Optimization
2.1 Written Description of Process
The process to make frozen yogurt is described in this section. A block flow diagram of
the process can be found in section 2.2, Figs. 2.2.1 and 2.2.2, and the process flow diagram can
be found in section 2.3, Figs. 2.3.1 through 2.3.5. The stream tables are given by Tables 2.4.1
and 2.4.4. The equipment tables, material requirements, and utility requirements are located in
sections 2.5, 2.6, and 2.7 respectively. A mass and energy balance for this process can be found
in Appendix A, and the detailed process calculations are located in Appendix B.
The frozen yogurt making process begins with milk and cream receiving. This step
involves metering the milk or cream from a truck into a silo. A quality control lab can also
determine at this point if the milk is acceptable with regards to temperature, taste, and bacteria.
Milk and cream enter the plant by truck and are delivered at 4 °C. The milk is skim milk and the
cream is 38% milk fat. When a milk tanker arrives at the plant, the quantity of milk delivered is
determined by sending the milk through volumetric flow meter ST-101 on its way to silo SL-101
in stream 2. The density of the milk is then used to calculate the mass delivered. The cream is
received in the same fashion and transferred to silo SL-102 via stream 22. The plant requires
175,136 lb/day of skim milk and 2,880 lb/day of cream when it operates for 16 hr/day.
To concentrate the milk, ultrafiltration is used. The reasons for ultrafiltration are
addressed in section 2.8. Stream 3 takes the skim milk from the silo, through pump P-101A/B to
increase the pressure, and then through membrane MB-101. The filtrate, which contains mostly

12
water and lactose along with some protein and other minerals, leaves the membrane in stream 5.
The retentate, ultrafiltered (UF) milk, leaves the membrane in stream 6. While most of the
filtrate is a waste product, 1,616 lb/day, about 1.2%, can be reused in preparing the bulk culture,
a batch process described later. The UF milk is split into two streams. Stream 8, containing
1,548 lb/hr UF milk, is used to make the yogurt portion of the frozen yogurt mix. Stream 7,
containing 860 lb/hr UF milk, is used to prepare the ice cream mix portion.
To prepare the ice cream mix portion of the frozen yogurt mix, several ingredients must
be mixed together, pasteurized, and homogenized. Stream 7 takes the UF milk to mixer M-101.
Also coming into M-101 are cream from SL-102 in stream 24, mono- and diglycerides in stream
25, carrageenan in stream 26, cane sugar in stream 27, water in stream 28, inulin fiber in stream
29, and corn syrup solids in stream 30. The raw ice cream mixture proceeds to the pasteurizer,
E-201 through 204, after leaving the mixer in stream 31 at 4 °C, a conservative temperature
estimate since colder product takes more energy to pasteurize. The pasteurizer has four sections,
the regenerator, the heater, the water cooler, and the brine cooler. Stream 31 first takes the ice
cream mix to the regenerator, E-201, which uses already hot mix to heat the incoming mix in
stream 44. Stream 44 is then sent through the homogenizer, HG-201, which breaks apart large
fat globules producing a better emulsion. Stream 45 takes the ice cream mix from the
homogenizer to E-202, the heater. The heater uses saturated steam to heat the ice cream mix to
90 °C in stream 46. This hot ice cream mix passes through the regenerator, heating up the
incoming ice cream mix and getting cooled down in stream 47. Water in E-203 further cools the
ice cream mix. The ice cream mix is finally cooled down to 3 °C in stream 54 after passing
through E-204, where brine is the coolant. The brine heats up through E-204 in stream 53 and
then goes to E-208 where it cools the water in stream 51 to its original temperature in stream 49.

13
Before the yogurt can be made, the culture which is used to ferment the UF milk into
yogurt must be prepared in batch. Table 2.4.4 presents the stream information for the batch
process streams, and area 500 of the process flow diagram visually describes the batch process.
The medium used to grow the yogurt culture is the filtrate from membrane MB-101. Once every
day, stream 113 diverts 1616 lb of filtrate from stream 80. Heat exchanger E-501 uses saturated
steam to heat the filtrate. Cooling water then cools the filtrate in stream 115 through E-502. The
culture can now be grown in three stages: the initial mother culture is used to make the
intermediate culture, which is used to make the bulk culture, which is finally used to ferment the
UF milk into yogurt. The mother culture is normally prepared on a laboratory scale. For each
run, 6.08 lb of pasteurized filtrate, stream 116, is combined with 6 grains (0.000857 lb) of
concentrated freeze-dried culture, stream 119. This mixture is grown at 40 °C in a flask, R-501,
for about 5.5 hr, or until the pH is 5.5. The finished mother culture, stream 120, is mixed with
the pasteurized filtrate, stream 117, in the intermediate culture tank, R-502. The intermediate
culture is incubated the same as the mother culture. Stream 121 takes the finished intermediate
culture to the bulk culture tank, R-503, where it is mixed with the last of the pasteurized filtrate,
stream 118. Again, the culture is incubated for 5.5 hours or until the pH reaches 5.5.
Preparing the yogurt portion of the frozen yogurt mix requires pasteurizing and
homogenizing the UF milk, fermenting the UF milk into yogurt, and cooling the yogurt to stop
fermentation. To pasteurize the UF milk in stream 8, the stream is sent to E-101, the regenerator
stage of the pasteurizer, where hot UF milk heats the incoming UF milk, stream 9. Stream 9 then
passes through homogenizer HG-101, which improves the stability of the emulsion (although the
UF milk is from skim milk, it is still about 0.5% fat) (Premaratne and Cousin, 1991). Stream 10
takes the UF milk from the homogenizer to the heater section of the pasteurizer, E-102, from

14
which the UF milk exits at 90 °C in stream 11. The hot fluid is superheated compressed
ammonia (this stream is part of the ammonia refrigeration loop, detailed later). Stream 11 takes
the hot UF milk through the regenerator, E-101, where it cools down in stream 13. Heat
exchanger E-103 then cools the UF milk down to the incubation temperature. The cold fluid is
cooling water. Brine returns the cooling water to its original temperature in E-104. The UF milk
in stream 14 is then sent to the continuous fermentation tank, R-101, where it is mixed with the
bulk culture from stream 33. The milk is incubated at 40 °C in R-101 with a 4 hour residence
time or until the total (titratable) acidity reaches 0.30%. Yogurt leaves the fermentation tank in
stream 20 and heads to E-205 and E-206 where refrigerated water and brine cool it respectively.
The brine then goes into E-207 where it cools the refrigerated water to its original temperature.
This brine stream and the brine from E-104 are mixed together into stream 57. Ammonia then
cools the brine back to its original temperature in stream 64 through E-302. This stream is then
split to send brine to E-204 and E-206 again.
Now that the ice cream mix and the yogurt are prepared, they can be mixed together,
aged, and flavored. Stream 54 carries ice cream mix to mixing tank M-201 where it is joined by
yogurt. Stream 55 takes the frozen yogurt mix to an insulated tank, JT-201, where the mix ages
for four hours as explained in section 2.8. Stream 56 then takes the frozen yogurt mix from the
jacketed tank to mixer M-301 where it is joined by vanilla extract from stream 81. If flavors
other than vanilla frozen yogurt were to be made, the appropriate ingredients would be added
into M-301 in place of the vanilla.
To turn the frozen yogurt mix into hard-packed frozen yogurt, the mix is sent through a
scraped surface heat exchanger, filled into the 1.75 qt cartons the product is to be sold in, sent
through a hardening tunnel to further chill the product, and finally put into a storage freezer.

15
Stream 82 takes the vanilla frozen yogurt mix at 3 °C and sends it through the scraped surface
freezers, ES-301-308 (there are 8 identical freezers in parallel due to the size of each freezer),
while injecting compressed air into the mix via stream 84 to give 50% overrun (a 50% increase
in volume). Soft frozen yogurt exits the scraped surface freezer at -7 °C in stream 70 and goes to
the filler, FL-301, to be packaged. The packaged frozen yogurt is taken in stream 71 to the
hardening tunnel, HT-301. Ammonia from stream 68 keeps the air in the hardening tunnel at -40
°C, and the frozen yogurt leaves the tunnel in stream 72 at -18 °C after a 1.75 hour residence
time. This final product is sent to the storage freezer, SF-301, at 3613 lb/hr to await shipping.
The refrigeration for the scraped surface heat exchangers, the hardening tunnel, the
storage freezer, and the brine in the pasteurizer is achieved using ammonia, with air as the final
heat sink. The ammonia loop begins with the refrigerant in stream 62 being isentropically
expanded through valve V-301 and to -16.7 °C in stream 63. Stream 63 then cools off the brine
in E-302. The ammonia is then passed through a second valve, V-302, and expanded to -33.7 °C
in stream 66. This stream is then split into streams 67, 68, and 69 which carry ammonia to the
ES-301-308, HT-301, and SF-301 respectively. The streams are divided so that each warm
stream (streams 74, 75, and 76) is at -33.7 °C and 99.1% vapor when the three streams reconnect
into stream 77. The ammonia is then compressed in C-401 and C-402 and aftercooled by
ambient air being blown across the heat exchanger in E-403 and E-402. The ammonia is
compressed one more time in C-403 in stream 110. The hot compressed ammonia then passes
through E-102 to heat the UF milk. Cooling water cools the ammonia in stream 59 through E-
401. Filtrate from MB-101 then cools the ammonia in E-303. Finally, E-301 uses ambient air to
cool the ammonia to its original state in stream 62.

16
The cooling water used to cool off the compressed ammonia, stream 88, and the
pasteurized filtrate, stream 87, is cooled back to its original temperature through a cooling tower,
CT-401. These two streams are combined into stream 89 and enter the cooling tower. Through
CT-401, water evaporates out with the air being blown through the tower. The air enters in
stream 97 at ambient conditions and exits with 100% relative humidity. Stream 85 replenishes
the cooling water and connects with stream 90. The water is then split into streams 93 and 94 to
be sent to cool the compressed ammonia in E-401 and the pasteurized filtrate in E-502.

17
2.2 Block Flow Diagram
Fig. 2.2.1: First half of block flow diagram for frozen yogurt manufacture

18
Fig. 2.2.2: Second half of block flow diagram for frozen yogurt manufacture

19
2.3 Process Flow Diagram
Fig. 2.3.1: Process flow diagram for area 100 of frozen yogurt manufacture

20
Fig. 2.3.2: Process flow diagram for area 200 of frozen yogurt manufacture

21
Fig. 2.3.3: Process flow diagram for area 300 of frozen yogurt manufacture

22
Fig. 2.3.4: Process flow diagram for area 400 of frozen yogurt manufacture

23
Drawn By
Checked by
Approved By
Drawing No.C
bar
Culture
Filtrate from 300
H20 from 400
Bulk Culture
for 100
80
121
119 120
118117116
32
40
1
39.9
1
20
1
R-501
Reactor/
Fermentation
R-501 R-503R-502
R-503
Reactor/
Fermentation
R-502
Reactor/
Fermentation
Key
Date
Revision No:
Date
Date
Yogurina - Frozen Yogurt Processing
Steam
Steam
111
40
1
40
1
40
140
1
40
1
H20 for 400
E-501 E-502
E-501
Plate Heat
Exchanger
E-502
Plate Heat
Exchanger
94
114 115
87
112
40
1
35
1
90
1
105
1.21
30
1.1
Waste Filtrate
39.9
1
123
105
1.21
39.9
1
40
1.1
122
P-501A/B
P-501A/B
External Gear
Pump
113
Fig. 2.3.5: Process flow diagram for area 500 of frozen yogurt manufacture

24
2.4 Stream Tables Table 2.4.1: Stream table for continuous processing of frozen yogurt, streams 1-37
Stream 1 2 3 4 5 6 7 8 9 10 Temperature (ºC) 4 4 4 4 4 4 4 4 42.7 42.7 Pressure (bar) 1 1 1 6.7 1 1 1 1 1 1 Total Mass Flow (lb/hr) 10,946 10,946 10,946 10,946 8,538 2,408 860 1,548 1,548 1,548 Volumetric Flow Rate (gpm) 21.21 21.21 21.21 21.21 17.04 4.45 1.59 2.86 2.86 2.86 Component Milk Milk Milk Milk Filtrate UF Milk UF Milk UF Mil k UF Milk UF Milk Vapor Fraction 0 0 0 0 0 0 0 0 0 0
Stream 11 12 13 14 15 16 17 18 19 Temperature (ºC) 90 103.8 51.3 40 35.2 30 30 5.7 9 Pressure (bar) 1 25 1 1 1 0.9 1 1 1 Total Mass Flow (lb/hr) 1,548 2,250 1,548 1,548 3,096 3,096 3,096 5,679 5,679 Volumetric Flow Rate (gpm) 2.86 291.90 2.86 2.86 6.18 6.18 6.18 10.28 10.28
Component UF Milk Ammonia UF Milk UF Milk Water Water Water Brine Brine Vapor Fraction 0 1 0 0 0 0 0 0 0
Stream 20 21 22 23 24 25 26 27 28 Temperature (ºC) 40 4 4 4 4 20 20 20 20 Pressure (bar) 1 1 1 1 1.1 1 1 1 1 Total Mass Flow (lb/hr) 1,649 180 180 180 180 7 10 413 234 Volumetric Flow Rate (gpm) 3.05 0.36 0.36 0.36 0.36 0.02 0.03 0.52 0.47
Component Yogurt Cream Cream Cream Cream Mono- and
Diglycerides Carrageenan Cane Sugar Water
Vapor Fraction 0 0 0 0 0 0 0 0 0
Stream 29 30 31 32 33 34 35 36 37 Temperature (ºC) 20 20 4 40 40 -4 2 1 9.3 16 Pressure (bar) 1 1 1 1 1.1 1 1 1 1 Total Mass Flow (lb/hr) 86 103 1,893 101 101 4,947 4,947 4,947 3,298 Volumetric Flow Rate (gpm) 0.13 0.34 3.44 0.20 0.20 8.95 8.95 8.95 6.58
Component Inulin Corn Syrup
Solids Ice Cream
Mix Bulk
Culture Bulk Culture Brine Brine Brine Water Vapor Fraction 0 0 0 0 0 0 0 0 0

25
Table 2.4.2: Stream table for continuous processing of frozen yogurt, streams 38-73
Stream 38 39 40 41 42 43 44 45 46 Temperature (ºC) 25.3 25.3 20 3 105 105 64.2 64.2 90 Pressure (bar) 0.9 1 1 1 1.21 1.21 1 1 1 Total Mass Flow (lb/hr) 3,298 3,298 1,649 1,649 84.4 84.4 1,893 1,893 1,893 Volumetric Flow Rate (gpm) 6.58 6.58 3.05 3.05 246.8 0.18 3.44 3.44 3.44
Component Water Water Yogurt Yogurt Saturated
Steam Saturated
Water Ice Cream
Mix Ice Cream
Mix Ice Cream
Mix Vapor Fraction 0 0 0 0 1 0 0 0 0
Stream 47 48 49 50 51 52 53 54 55 Temperature (ºC) 29.8 22 16 16 19.6 -4 2.9 3 3 Pressure (bar) 1 1 0.9 1 1 1 1 1 1 Total Mass Flow (lb/hr) 1,893 1,893 3,786 3,786 3,786 5,679 5,679 1,893 3,542 Volumetric Flow Rate (gpm) 3.44 3.44 7.56 7.56 7.56 10.28 10.28 3.44 6.26
Component Ice Cream
Mix Ice Cream
Mix Water Water Water Brine Brine Ice Cream
Mix Frozen
Yogurt Mix Vapor Fraction 0 0 0 0 0 0 0 0 0
Stream 56 57 58 59 60 61 62 63 64 Temperature (ºC) 3 9.1 9.1 58.3 35 30.9 28 -16.7 -4 Pressure (bar) 1 1 1.1 25 25 1.1 25 2.2 1 Total Mass Flow (lb/hr) 3,542 10,626 10,626 2,250 2,250 8,000 2,250 2,250 10,626 Volumetric Flow Rate (gpm) 6.26 19.23 19.23 96.37 7.67 12,221 7.53 446.44 19.23
Ammonia Component Frozen
Yogurt Mix Brine Brine Ammonia Ammonia Air Ammonia Ammonia Brine Vapor Fraction 0 0 0 0.369 0 1 0 0.177 0
Stream 65 66 67 68 69 70 71 72 73 Temperature (ºC) -16.7 -33.7 -33.7 -33.7 -33.7 -7 -7 -18 -18 Pressure (bar) 2.2 1 1 1 1 1 1 1 1 Total Mass Flow (lb/hr) 2,250 2,250 1,864 332.9 53.1 3,613 3,613 3,613 3,613 Volumetric Flow Rate (gpm) 866.9 2,038.7 1,688.9 301.63 48.11 9.62 9.62 9.62 9.62
Component Ammonia Ammonia Ammonia Ammonia Ammonia Soft Frozen
Yogurt Soft Frozen
Yogurt Frozen Yogurt
Frozen Yogurt
Vapor Fraction 0.346 0.392 0.392 0.392 0.392 0 0 0 0

26
Table 2.4.3: Stream table for continuous processing of frozen yogurt, streams 74-123
Stream 74 75 76 77 78 79 80 81 82 Temperature (ºC) -33.7 -33.7 -33.7 -33.7 20 20 39.9 20 3 Pressure (bar) 1 1 1 1 1 1.1 1 1 1 Total Mass Flow (lb/hr) 1,864 332.9 53.1 2,250 8,000 8,000 8,538 69 3,611 Volumetric Flow Rate (gpm) 4,259 761 121.3 5,141 12,221 12,221 17.04 0.15 6.38
Component Ammonia Ammonia Ammonia Ammonia Air Air Filtrate Vanilla Flavored
Frozen Yogurt Vapor Fraction 0.991 0.991 0.991 0.991 1 1 0 0 0
Stream 83 84 85 86 88 89 90 91 92 Temperature (ºC) 20 -163.4 30 30 62 60.1 30 30 30 Pressure (bar) 137.9 5 0.9 1 1 1 1 1 1.1 Total Mass Flow (lb/hr) 2.08 2.08 744 744 13,000 14,010 13,266 14,010 14,010 Volumetric Flow Rate (gpm) 0.03 0.27 1.49 1.49 25.95 27.96 26.48 27.96 27.96
Component Compressed
Air Compressed
Air Water Water Water Water Water Water Water Vapor Fraction 1 1 0 0 0 0 0 0 0
Stream 93 95 96 97 98 99 100 101 102 Temperature (ºC) 30 20 20 20 30 33.8 38.6 38.9 20 Pressure (bar) 1.1 1 1 1.1 1 1.1 1.1 1.1 1 Total Mass Flow (lb/hr) 13,000 81,202 44,202 44,202 44,946 81,946 20,000 17,000 20,000 Volumetric Flow Rate (gpm) 25.95 134,866 73,414 66,740 77,782 138,489 30,553 25,970 33,670
Component Water Air, 70%
R.H. Air, 70%
R.H. Air, 70%
R.H. Air, 100%
R.H. Air, 86%
R.H. Air Air Air Vapor Fraction 0 1 1 1 1 1 1 1 1
Stream 103 104 105 106 107 108 109 110 123 Temperature (ºC) 20 20 20 93.1 28 101.3 28 154.6 39.9 Pressure (bar) 1.1 1 1.1 4 4 8 8 25 1 Total Mass Flow (lb/hr) 20,000 17,000 17,000 2,250 2,250 2,250 2,250 2,250 8,437 Volumetric Flow Rate (gpm) 30,553 28,620 25,970 1,935 1,605 989 778 345 16.84
Component Air Air Air Ammonia Ammonia Ammonia Ammonia Ammonia Filtrate Vapor Fraction 1 1 1 1 1 1 1 1 0

27
Table 2.4.4: Stream table for batch processing of frozen yogurt, streams 87-122
Stream 87 94 111 112 113 114 115 Temperature (ºC) 35 30 105 105 39.9 90 40 Pressure (bar) 1 1.1 1.21 1.21 1 1 1 Total Mass Flow (lb/batch) 1,010 1,010 152 152 101 101 101 Volumetric Flow Rate (gal/batch) 121 121 444 0.32 11.74 11.74 11.74
Component Water Water Saturated
Steam Saturated
Water Filtrate Filtrate Filtrate Vapor Fraction 0 0 1 0 0 0 0
Stream 116 117 118 119 120 121 122 Temperature (ºC) 40 40 40 20 40 40 40 Pressure (bar) 1 1 1 1 1 1 1.1 Total Mass Flow (lb/batch) 6.08 92.5 1517 8.57×10-04
6.08 98.56 98.56 Volumetric Flow Rate (gal/batch) 0.71 10.75 176 1.56×10-04 0.71 11.46 11.46
Component Filtrate Filtrate Filtrate Dry Culture Mother Culture Intermediate
Culture Intermediate
Culture Vapor Fraction 0 0 0 0 0 0 0

28
2.5 Equipment Tables
Table 2.5.1: Equipment table for volumetric flowmeters Volumetric Flowmeter ST-101 ST-102 MOC* SS SS Type Magnetic inductive Magnetic inductive Component Milk Cream Inlet Temperature (°C) 4 4 Inlet Pressure (bar) 1 1 Mass Flow (lb/hr) 10,946 180 *Stainless steel is abbreviated SS
Table 2.5.2: Equipment table for silos
Silo SL-101 SL-102 MOC SS SS Type Cone Roof Cone Roof Component Milk Cream Inlet Temperature (°C) 4 4 Inlet Pressure (bar) 1 1 Volume (ft3) 2,804 46.62 Mass Flow (lb/hr) 10,946 180
Table 2.5.3: Equipment table for reactors (fermentors)
Reactor R-101 R-501 R-502 R-503 MOC SS SS SS SS Type Plug Flow Batch Batch Batch Component UF Milk and Bulk Culture Filtrate and Culture Filtrate and Culture Filtrate and Culture Incubation Temperature (°C) 40 40 40 40 Operating Pressure (bar) 1 1 1 1 Mass 1,649 lb/hr 6.08 lb/batch 98.56 lb/batch 1,616 lb/batch Volume (ft3) 133.28 negligible 1.99 32.66 Residence Time (hr) 4 5.5 5.5 5.5

29
Table 2.5.4: Equipment table for membrane Membrane MB-101 MOC SS Type Ultrafiltration, 5 kDa molecular weight cut-off Component Milk Target Retentate Composition 20% solids Inlet Temperature (°C) 4 Inlet Pressure (bar) 6.7 Outlet Pressure (bar) 1 Filtrate Flux (gal/ft 2/hr) 3.49 Mass Flow (lb/hr) 10,946 Area (ft2) 297.4 Transmembrane Pressure (bar) 5.7
Table 2.5.5: Equipment table for mixers Mixer M-101 M-201 M-301 MOC SS SS SS Type Closed vessel with agitator Closed vessel with agitator Closed vessel with agitator Inlet Temperature (°C) 4 3 3 Inlet Pressure (bar) 1 1 1 Mass Flow (lb/hr) 1,893 3,542 3,611 Mixing Time (hr) 0.5 0.5 0.5 Volume (ft3) 35.87 32.64 32.64

30
Table 2.5.6: Equipment table for homogenizers Homogenizer HG-101 HG-201 MOC SS SS Type Single Stage Two Stage Component UF Milk Ice Cream Mix Inlet Temperature (°C) 42.7 64.2 Inlet Pressure (bar) 1 1 Mass Flow (lb/hr) 1,548 1,893 Homogenized Pressure (bar), first stage 100 140 Homogenized Pressure (bar), second stage - 35
Table 2.5.7: Equipment table for filler Filler FL-301 MOC SS Type Rotary
Component Soft Frozen
Yogurt Inlet Temperature (°C) -7 Inlet Pressure (bar) 1 Mass Flow (lb/hr) 3,613 Carton size (qt) 1.75 Cartons per minute 22

31
Table 2.5.8: Equipment table for heat exchangers Heat Exchanger E-101 E-102 E-103 E-104 E-201 E-202
Type Plate & Frame
Plate & Frame
Plate & Frame Double pipe
Plate & Frame
Plate & Frame
Area (ft2) 5.8 4.7 4.5 3.9 19.4 5.7 Heat Duty (kW) 30.6 36.1 8.6 8.6 55.6 23.9 Cold Side Stream, inlet 8 10 17 18 31 45 Stream, outlet 9 11 15 19 44 46
Component UF Milk UF Milk Water Brine Ice Cream
Mix Ice Cream
Mix Mass Flow (lb/hr) 1,548 1,548 3,096 5,679 1,893 1,893 Temperature (°C), Inlet 4 42.7 30 5.7 4 64.2 Temperature (°C), Outlet 42.7 90 35.2 9 64.2 90 Pressure (bar) 1 1 1 1 1 1 Phase Liquid Liquid Liquid Liquid Liquid Liquid MOC SS SS SS Nickel alloy SS SS Hot Side Stream, inlet 11 110 13 15 46 42 Stream, outlet 13 12 14 16 47 43
Component UF Milk Ammonia UF Milk Water Ice Cream
Mix Steam Mass Flow (lb/hr) 1,548 2,250 1,548 3,096 1,893 84.4 Temperature (°C), Inlet 90 154.6 51.3 35.2 90 105 Temperature (°C), Outlet 51.3 103.8 40 30 29.8 105 Pressure (bar) 1 25 1 1 1 1.21 Phase Liquid Vapor Liquid Liquid Liquid Condensing MOC SS SS SS SS SS SS
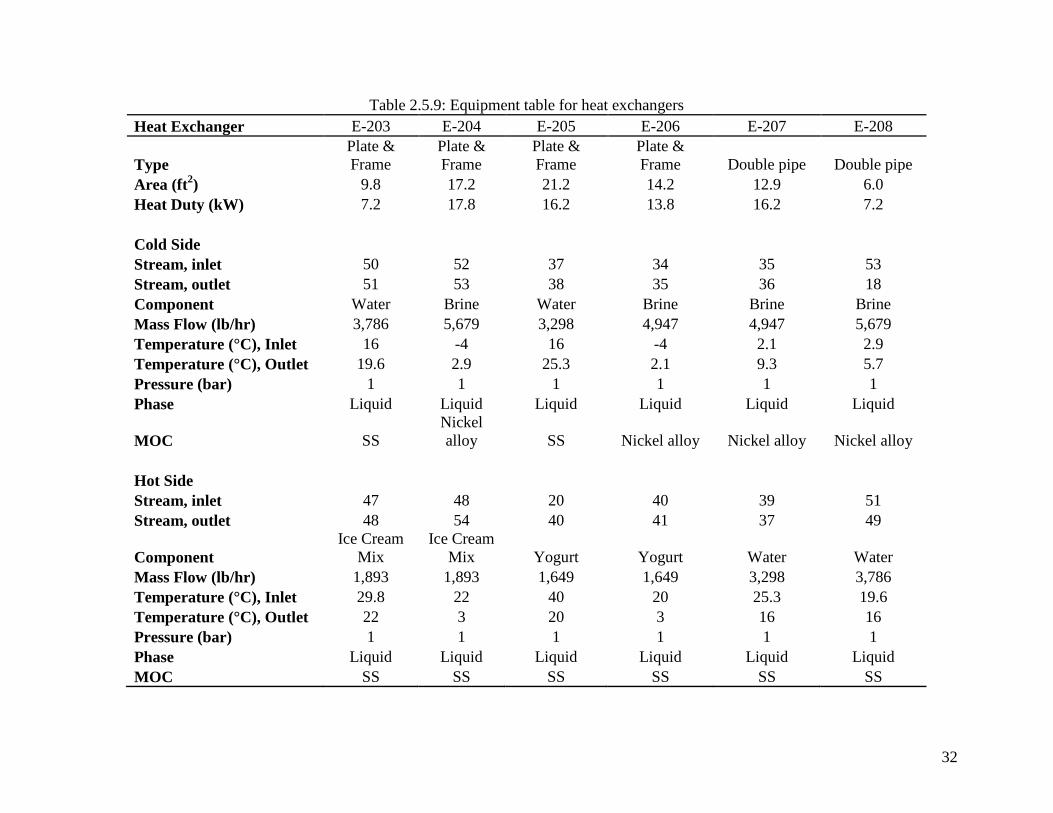
32
Table 2.5.9: Equipment table for heat exchangers Heat Exchanger E-203 E-204 E-205 E-206 E-207 E-208
Type Plate & Frame
Plate & Frame
Plate & Frame
Plate & Frame Double pipe Double pipe
Area (ft2) 9.8 17.2 21.2 14.2 12.9 6.0 Heat Duty (kW) 7.2 17.8 16.2 13.8 16.2 7.2 Cold Side Stream, inlet 50 52 37 34 35 53 Stream, outlet 51 53 38 35 36 18 Component Water Brine Water Brine Brine Brine Mass Flow (lb/hr) 3,786 5,679 3,298 4,947 4,947 5,679 Temperature (°C), Inlet 16 -4 16 -4 2.1 2.9 Temperature (°C), Outlet 19.6 2.9 25.3 2.1 9.3 5.7 Pressure (bar) 1 1 1 1 1 1 Phase Liquid Liquid Liquid Liquid Liquid Liquid
MOC SS Nickel alloy SS Nickel alloy Nickel alloy Nickel alloy
Hot Side Stream, inlet 47 48 20 40 39 51 Stream, outlet 48 54 40 41 37 49
Component Ice Cream
Mix Ice Cream
Mix Yogurt Yogurt Water Water Mass Flow (lb/hr) 1,893 1,893 1,649 1,649 3,298 3,786 Temperature (°C), Inlet 29.8 22 40 20 25.3 19.6 Temperature (°C), Outlet 22 3 20 3 16 16 Pressure (bar) 1 1 1 1 1 1 Phase Liquid Liquid Liquid Liquid Liquid Liquid MOC SS SS SS SS SS SS

33
Table 2.5.10: Equipment table for heat exchangers Heat Exchanger E-301 E-302 E-303 E-401 E-402 E-403 E-501 E-502
Type Fin-Fan Fixed Head
Shell & Tube Fixed Head
Shell & Tube Fixed Head
Shell & Tube Fin-Fan Fin-Fan Plate & Frame
Plate & Frame
Area (ft2) 355.2 216.4 271.7 1,848.1 669.5 637.2 23.1 31.2 Heat Duty (kW) 10.98 63.14 147.7 208.9 46.94 40.58 154.2 MJ 153.9 MJ Cold Side Stream, inlet 79 63 5 93 103 105 113 94 Stream, outlet 61 65 80 88 100 101 114 87 Component Air Ammonia Filtrate Water Air Air Filtrate Water
Mass Flow (lb/hr) 8,000 2,250 8,538 13,000 20,000 17,000 1,616
lb/batch 16,160 lb/batch
Temperature (°C), Inlet 20 -16.7 4 30 20 20 39.9 30 Temperature (°C), Outlet 30.9 -16.7 39.9 62 38.6 38.9 90 35 Pressure (bar) 1 2.2 1 1 1.1 1.1 1 1 Phase Gas Vaporizing Liquid Liquid Gas Gas Liquid Liquid MOC SS SS SS SS SS SS SS SS Hot Side Stream, inlet 60 58 59 12 108 106 111 114 Stream, outlet 62 64 60 59 109 107 112 115 Component Ammonia Brine Ammonia Ammonia Ammonia Ammonia Steam Filtrate
Mass Flow (lb/hr) 2,250 10,626 2,250 2,250 2,250 2,250 152
lb/batch 1616
lb/batch Temperature (°C), Inlet 35 9.1 58.3 103.8 101.3 93.1 105 90 Temperature (°C), Outlet 28 -4 35 58.3 28 28 105 40 Pressure (bar) 25 1 25 25 8 4 1.21 1 Phase Liquid Liquid Condensing Condensing Vapor Vapor Condensing Liquid MOC SS Nickel alloy SS SS SS SS SS SS

34
Table 2.5.11: Equipment table for pumps Pump P-101A/B P-102A/B P-103A/B P-104A/B P-201A/B MOC SS SS SS SS SS Type External Gear External Gear External Gear External Gear External Gear Temperature (°C) 4 30 4 40 16 Inlet Pressure (bar) 1 0.9 1 1 0.9 Outlet Pressure (bar) 6.7 1 1.1 1.1 1 Power (shaft) (hp) 1.8 0.0091 0.0005 0.0003 0.011 Power (kW) 1.32 0.0068 0.0004 0.0002 0.008 Efficiency 0.8 0.8 0.8 0.8 0.8 Mass Flow (lb/hr) 10,946 3,096 180 101 3,786 Component Milk Water Cream Bulk Culture Water
Table 2.5.12: Equipment table for pumps Pump P-202A/B P-301A/B P-401A/B P-402A/B P-501A/B MOC SS SS SS SS SS Type External Gear External Gear External Gear External Gear External Gear Temperature (°C) 25.3 9.1 30 30 40 Inlet Pressure (bar) 0.9 1 0.9 1 1 Outlet Pressure (bar) 0.9 1.1 1 1.1 1.1 Power (shaft) (hp) 0.0094 0.027 0.0023 0.044 0.00002 Power (kW) 0.007 0.02 0.0017 0.033 0.000013 Efficiency 0.8 0.8 0.8 0.8 0.8 Mass Flow (lb/hr) 3,298 10,626 744 14,010 6.16
Component Water Brine Water Water Intermediate
Culture

35
Table 2.5.13: Equipment table for scraped surface heat exchangers Heat Exchanger ES-301 to ES-308 MOC SS Type Scraped Surface Inlet Temperature (°C) 3 Outlet Temperature (°C) -7 Pressure (bar) 1 Mass Flow (lb/hr) 3,613 Heat Duty (kW) 126 Coolant Ammonia Volume (ft3) 0.67 Dasher Speed (rpm) 500 Residence Time (hr) 0.063
Table 2.5.14: Equipment table for hardening tunnel Hardening Tunnel HT-301 MOC SS Type Spiral
Component Soft Frozen
Yogurt Inlet Temperature (°C) -7 Outlet Temperature (°C) -18 Pressure (bar) 1 Mass Flow (lb/hr) 3,613 Heat Duty (kW) 34.43 Hardening Time (hr) 1.75
Table 2.5.15: Equipment table for storage freezer
Storage Freezer SF-301 MOC SS Component Frozen Yogurt Inlet Temperature (°C) -18 Outlet Temperature (°C) -18 Pressure (bar) 1 Mass Flow (lb/hr) 3,613 Heat Duty (kW) 5.49 Volume (ft3) 19,300

36
Table 2.5.16: Equipment table for jacketed tank used in aging Jacketed Tank JT-201 MOC SS
Component Frozen Yogurt
Mix Inlet Temperature (°C) 3 Inlet Pressure (bar) 1 Mass Flow (lb/hr) 3,542 Holding Time (hour) 4 Volume (ft3) 261.08
Table 2.5.17: Equipment table for cooling tower Cooling Tower CT-401 MOC Various Component Water Inlet Temperature (°C) 60.1 Outlet Temperature (°C) 30.0 Pressure (bar) 1 Inlet Air Relative Humidity 70% Inlet Air Temperature (°C) 20 Inlet Air Volumetric Flow Rate (ft3/min) 9,814 Inlet Mass Flow (lb/hr) 14,010 Mass Evaporated (lb/hr) 744 Heat Duty (kW) 211.6
Table 2.5.18: Equipment table for compressors Compressors C-401 C-402 C-403 MOC SS SS SS Type Centrifugal Centrifugal Centrifugal Component Ammonia Ammonia Ammonia Inlet Temperature (°C) -33.7 28 28 Inlet Pressure (bar) 1 4 8 Outlet Temperature (°C) 93 101.3 154.6 Outlet Pressure (bar) 4 8 25 Efficiency 72% 72% 72% Mass Flow (lb/hr) 2,250 2,250 2,250 Power (shaft) (hp) 104 58 99 Power (kW) 77.63 43.52 74.19

37
Table 2.5.19: Equipment table for expansion valves Expansion Valves V-301 V-302 V-303 MOC SS SS SS Type Isentropic Isentropic Isentropic Component Ammonia Ammonia Compressed Air Inlet Temperature (°C) 28 -16.7 20 Inlet Pressure (bar) 25 2.2 137.9 Outlet Temperature (°C) -16.7 -33.7 -163.4 Outlet Pressure (bar) 2.2 1 5 Mass Flow (lb/hr) 2,250 2,250 2.08
Table 2.5.20: Equipment table for blowers Blowers B-301 B-401 B-402 B-403 MOC SS SS SS SS Type Centrifugal Centrifugal Centrifugal Centrifugal Component Air Air Air Air Inlet Temperature (°C) 20 20 20 20 Inlet Pressure (bar) 1 1 1 1 Outlet Temperature (°C) 20 20 20 20 Outlet Pressure (bar) 1.1 1.1 1.1 1.1 Mass Flow (lb/hr) 8,000 17,000 20,000 46,520 Power (hp) 28.3 13.5 33.2 1.5 Power (kW) 21.08 10.04 24.79 1.12

38
2.6 Production and Raw Material Requirements
Raw material requirements for the manufacture of frozen yogurt include ingredients and
containers. Containers of 1.75 quart volume are needed, along with lids. The raw ingredients
include: inulin, culture, milk, cream, vanilla, mono- and diglycerides, cane sugar, carrageenan,
corn syrup solids, compressed air, and water. Table 2.6.1 outlines the assortment of raw
materials and relative amounts needed for the process. An overall material balance is given in
Appendix A.
Table 2.6.1: Raw material requirements Raw Material Unit Price Flow rate First Year Cost Annual Cost per lb lb/hr Inulin $0.45 86 $217,920 $217,920 Concentrated Freeze Dried Culture $40.82 5.4×10⁻⁵
$13 $13 Milk $0.11 10,946 $6,927,990 $6,927,990 Heavy Cream, 38% fat $0.57 180 $574,396 $574,396 Vanilla $5.73 69 $2,230,155 $2,230,155 Mono and Diglycerides $0.15 7 $5,913 $5,913 Cane Sugar $0.24 413 $558,145 $558,145 Carrageenan $5.50 10 $309,705 $309,705 Corn Syrup Solids $0.95 103 $550,993 $550,993 Compressed Air $0.25 480 $6,732 $6,732 Ice Cream Containers (a)$0.10 (b)7,428,571 $728,000 $728,000 Process Water $6.0×10⁻⁵
234 negligible negligible Total $12,109,962 $12,109,962 (a) price per container
(b) containers per year
2.7 Utility Requirements
There are many utility requirements for the production of frozen yogurt. Table 2.7.1
outlines the assortment of utilities and their annual costs. Ammonia, brine, cooling water, and
steam are all used in the refrigeration cycles for the various phases of heating and cooling. It is
assumed that the coolants will not leak, so no extra coolant is purchased to make up for leaks.
Due to the safety hazard an ammonia leak poses, it is assumed that suitable safety precautions

39
will prevent an ammonia leak during typical operation. The electricity needs come from the
following equipment used in the process: compressors, homogenizers, mixers, pumps, filler,
blowers, and scraped surface heat exchangers. The total electricity usage is 3 million kWh per
year for the entire process. A breakdown of the electricity use by piece of equipment is given in
Table 5.1.2. The sulfuric acid and sodium hydroxide are used in the cleaning in place procedures
along with the process water to rinse after each acid or base flush of the system. Liquid water
disposal is the cost to dispose of the cleaning in place materials after use. The compressed air
used to operate the filler is considered a utility; the compressed air in Table 2.6.1 is injected into
the scraped surface heat exchangers. An overall energy balance for the whole process in shown
in Appendix A.
Table 2.7.1: Utility requirements
Utilities Unit Price (per gal)
Flow rate (gal/hr)
First Year Cost
Annual Cost
Brine $0.05 (a)577 $29 None Ammonia (b)$0.09 (c)1,125 $135 $14 Cooling water $5.0×10⁻⁵ 528,349 $35 $35 Electricity (d)$0.04 (e)419 $159,331 $159,331 Sulfuric Acid $0.12 2.66 $2,380 $2,380 Sodium Hydroxide $0.30 2.66 $6,010 $6,010 Liquid Water Disposal $3.0×10⁻³ 13.28 $299 $299 Process Water $5.0×10⁻⁴ 36.00 $30 $30 Steam (f)$2.5×10⁻³
(g)236.4 $1,768 $1,768
Compressed Air (h)$0.25 (i)2.08 $300 $300 Total $170,317 $170,167 (b) price per pound (c) pounds in loop (d) cost per kilowatt-hr (e) power consumption in kW of equipment (f) cost per pound of steam (g) pounds of steam per hour (h) price per pound (i) flow in pounds per hour

40
2.8 Rationale for Process Choice
Since frozen yogurt is not a new product in the supermarket, there is already a well
established process for making it. However, as with every process, there is room for variations
and improvements. The basic process to make frozen yogurt involves making the yogurt; adding
in sugar, cream, other additives, and flavors; freezing the mixture while incorporating air; and
hardening the product (University of Guelph, 2008). Aside from the yogurt, this process is
identical to making ice cream, where milk replaces the yogurt (Stogo, 1998). The process
elements with room for variation were the ratio of yogurt to milk, the ingredients, culture
addition, the aging time, and the hardening stage. The elements of this process that make it
unique are the ultrafiltration membrane, the added inulin fiber, and the probiotic bacteria.
The process begins with fluid skim milk and cream arriving at the plant and weighed into
storage silos. By starting with minimally processed raw materials and making the yogurt on-site,
a greater degree of control can be maintained over the process. It is well accepted in frozen
yogurt processes to begin with milk and make the yogurt at the plant (Knight, 2008; Ordonez, et
al., 2000; El-Nagar, et al., 2002). Also, since yogurt is about 55 times more viscous than milk,
milk would be the easier component to transport (Prentice, 1992).
The next step for the skim milk is ultrafiltration, which increases the total solids in the
milk from 9% to 20%. This is not a normal unit operation for frozen yogurt production, but it
does provide several benefits. Ultrafiltered milk and the products produced from it are higher in
protein and calcium and lower in lactose than their conventional counterparts, which are made
from milk with added milk solids non fat (MSNF include milk proteins, lactose, and minerals)
(Ordonez, et al., 2000). Furthermore, lactose crystallization is a cause of the “sandy” texture of
some ice creams. The more lactose in the product, the more likely it will crystallize out the

41
water phase (Arbuckle, 1977). Most ice creams or frozen yogurts use milk (5% lactose) plus
nonfat dry milk (54% lactose) to increase the solids content. The UF milk, however, only
contains about 4% lactose and does not need added MSNF (Premaratne and Cousin, 1991).
Once a portion of the UF milk has been made into yogurt, the lactose content will be even lower
because the yogurt culture contains lactic acid bacteria, which consume lactose (Spreer, 1998).
Since the lactose content of this product will be 42% lower than that of skim milk, significant
lactose crystallization is not expected, which will contribute to a premium texture. Also, the
calcium content of the final product is expected to be 2.5 times higher than that of skim milk (pg.
A-7). UF milk also provides higher flavor and higher consistency scores in sensory tests than
products made with milk and nonfat dry milk. Since flavor and consistency are common
complaints in low fat ice cream and frozen yogurt, higher sensory scores makes UF milk a good
option for low fat frozen yogurt (Ordonez, et al., 2000).
Next, the ice cream mix is prepared. This consists of the UF milk, cream, mono- and
diglycerides, carrageenan, cane sugar, corn syrup solids, water, and inulin fiber. The cream is
added to increase the fat content of the finished product to 2% (Univ. of Guelph, 2008). The
mono- and diglycerides are added because they are emulsifiers, which keep the water and fat
phases together (Kessler, 1981). Carrageenan is the chosen stabilizer because it is one of the best
tested products for slowing recrystallization, the joining of ice crystals or the melting and
reformation of ice crystals (Adapa, et al., 2000). Cane sugar (sucrose) was chosen as the primary
sweetener because of its general acceptability to customers. Some corn syrup solids are used as
well because they aid in preventing recrystallization (Adapa, et al., 2000). High fructose corn
syrup is not used because ice creams made with it have the highest recrystallization rates and
because it lowers the freezing point of the ice cream mix relative to sucrose, making nucleation

42
more difficult (Adapa, et al., 2000; Drewett and Hartel, 2007). Also, ice cream made with
sucrose is softer, therefore easier to scoop, than ice cream made with corn syrup (Muse and
Hartel, 2004). Water is added based on the frozen yogurt formulation in Ordonez, et al. (2000).
Lastly, inulin is an ingredient not normally added to frozen yogurt. This ingredient was chosen
because, not only is it a fiber with metabolic benefits, but it can be a fat replacer. Inulin
increases the creaminess and viscosity of the
frozen yogurt while decreasing the meltdown
rate (El-Nagar, et al., 2002). The ice cream
mix is also pasteurized to kill potentially
dangerous microorganisms and homogenized,
as shown in Fig. 2.8.1, to distribute the fat
phase within the water phase more evenly and
to keep the two phases more stably emulsified
(Spreer, 1998). The method of pasteurization
used is higher-heat shorter time (HHST)
pasteurization, which requires that the milk be brought up to 90 °C and held there for at least 0.5
seconds and then cooled again (International Dairy Foods Association, 2008). HHST
pasteurization was chosen because the holding time is so short that no holding tank will be
needed to maintain 90 °C for the required time.
When making yogurt, the culture must contain the lactic acid bacteria Lactobacillus
bulgaricus and Streptococcus thermophilus (Chandan, 2006). Since it is desirable for the frozen
yogurt to have the benefits of probiotic bacteria (improved digestive health), Bifidobacterium
bifidum and Lactobacillus acidophilus are also included in the culture (Ordonez, et al., 2000;
Fig. 2.8.1: Diagram of the homogenization process (Univ. of Guelph, 2008)

43
Saarela, et al., 2000). The cultures used in this product, Yo-flex (yogurt culture) and Nu-trish
(probiotic culture) from Chr. Hansen, were chosen because Yo-flex requires fewer milk solids to
grow and because Nu-trish has good survival characteristics, the importance of which is
explained below (Chr. Hansen, Nu-trish, 2004; Chr. Hansen, Yo-flex, 2004). One technological
challenge in incorporating probiotics into food is keeping the probiotic bacteria alive. Some
techniques for the survival of probiotic bacteria are using oxygen-impermeable containers,
micro-encapsulating the bacteria, incorporating micro-nutrients (peptides or amino acids) into
the product, and selecting acid- or bile-resistant strains (Shah, 2000). The probiotic bacteria used
in this product are tolerant to gastric acids and bile (Chr. Hansen, Nu-trish, 2004). Incorporating
any of the other techniques would be areas for future improvement. Before the culture is added
to the UF milk, it is pre-grown as “bulk culture.” Normally, the growth medium is water with
10% nonfat dry milk, NFDM (Ordonez, et al., 2000). The Yo-flex culture, however, does not
require as high a milk solids content to grow (Chr. Hansen, Yo-flex, 2004). Therefore, since
lactic acid bacteria eat lactose, it was assumed that as long as the growth medium has as much
lactose as the 10% NFDM solution, 5.3% lactose, the culture will grow. Lactose concentrations
over 15% can begin to inhibit growth of the yogurt culture (Ozen and Ozilgen, 1992). The
filtrate from the membrane meets the lactose requirement, and is therefore used to grow the bulk
culture without added solids (pg. B-2).
There are three common choices regarding the form of culture used: liquid culture, deep-
frozen culture or concentrated culture, and concentrated freeze-dried culture. Liquid culture is
good for about eight days and must be kept refrigerated, and deep-frozen culture, though having
a shelf life of several years, must be kept at -25 °C. Concentrated freeze-dried culture (CFDC),
on the other hand, can be kept at room temperature and has a moderate shelf life of about 5

44
months (Spreer, 1998). The chosen cultures are CFDC, though the manufacturer recommends
storing them at -18 °C for up to 24 months (Chr. Hansen, Yo-flex, 2004). Since the process
requires a large storage freezer at -18 °C for the final product and since the CFDCs do not take
up much space, storing the cultures will not require special refrigeration.
Before making the yogurt portion, the yogurt culture must be prepared for inoculation.
The culture can be added to the milk either by direct inoculation (which would require much
more culture, and is more common in cheese manufacture) or through a bulk starter culture
(which requires little culture). Making the bulk culture involves adding the CFDC to a
pasteurized growth medium, the filtrate, and letting it incubate. After incubation, this becomes
the mother culture, which is used to inoculate more filtrate at a rate of 6.1% to make an
intermediate culture (Ordonez, et al., 2000). This inoculation rate means that intermediate
culture, before fermentation, is 6.1 wt% mother culture and 93.9% filtrate. The intermediate
culture is used to inoculate even more filtrate at the same rate to make the bulk culture, which is
used to inoculate the milk and make yogurt (Spreer, 1998; Food and Agriculture Organization,
2004). Since 2 grains of culture are added per liter of milk or filtrate, direct addition would use
2.973 lb of culture per run while making a bulk culture uses 6 grains (0.0009 lb) of culture per
run (Food and Agriculture Organization, 2004; pg. B-27).
The process to make the yogurt is quite standard: lactic acid bacteria ferment milk. First,
the UF milk is pasteurized and homogenized to stabilize the emulsion. The bulk culture is then
added to the milk at an inoculation rate of 6.1% and fermented at 40 °C until the total acidity
reaches 0.30%, about four hours, as suggested by Ordonez, et al. (Ordonez, et al., 2000; Food
and Agriculture Organization, 2004). This acidity level is low enough to be acceptable to

45
customers (Guinard, et al., 1994). Once the yogurt is fermented, it must be cooled as fast as
possible to prevent further acidification (Spreer, 1998).
Next, the ice cream and the yogurt portions are mixed together. The ratio of yogurt to ice
cream mix is nearly half and half (Ordonez, et al., 2000; Univ. of Guelph, 2008). Using only
half yogurt ensures a less yogurt-like and more ice-cream-like flavor. The mixture is then aged
for fours hours at 3 °C (How Products are Made, 2007). The aging process allows the
“hydrocolloids to swell, the casein to become hydrated, the viscosity to increase, the
whippability to improve, fats to crystallize out and aroma to develop uniformly throughout”
(Kessler, 1981). The vanilla flavor is mixed in after aging (How Products are Made, 2007;
Kessler, 1981).
The mix is now ready to be frozen. During the freezing process, the mix is rapidly
cooled, about 50% of the water is frozen, and air is incorporated into the product (Adapa, et al.,
2000). This results in a three-phase system that is both an emulsion and a foam: the milk fat and
the air are dispersed within a serum phase. The fat was previously dispersed by the
homogenizer, but the air is dispersed by the rotating blade inside an ice cream freezer and is
stabilized by the fat and emulsifiers (Univ. of Guelph, 2008). By far, the most common way to
freeze ice cream or frozen yogurt is with a scraped surface heat exchanger (Hartel, 1996).
Common refrigerants in an ice cream freezer are ammonia or Freon (Kessler, 1981). Ammonia
was chosen for this process because, while Freon refrigerants (hydrochlorofluorocarbons) are
nontoxic, ammonia is more environmentally friendly. Also, Freon products are currently being
phased out from industry (DuPont, 2007). The frozen yogurt’s draw temperature, the
temperature at which it comes out of the scraped surface freezer, was chosen to be -7 °C. A

46
lower draw temperature helps more ice crystals to nucleate in the freezer, which will help keep
the size of the ice crystals small in the final product (Drewett and Hartel, 2007).
The product that leaves the scraped surface heat exchanger is more like soft-serve ice
cream than hard-packed ice cream, so the next step is to freeze the frozen yogurt further. Before
hardening, however, the frozen yogurt is packaged while it is still soft and easy to flow (Knight,
2008; How Products are Made,
2007). The hardening step is carried
out in a hardening tunnel—akin to a
blast freezer—where the temperature
of the frozen yogurt is lowered to -18
°C over 1.75 hours. A schematic of
a spiral hardening tunnel is shown in
Fig. 2.8.2. During this step, the ice
crystals formed in the scraped surface heat exchanger grow to about 45-50 µm, at which point
75-80% of the water from the original serum phase has been frozen (Hartel, 1996). The hard
frozen yogurt can now be kept in a storage freezer at -18 °C until it is ready to ship out.
A classic refrigeration cycle (expansion valve, heat exchanger, compressor, and
condenser) is used to take heat out of the process (Koretsky, 2004; pg. B-19 – B-20). The main
refrigerant for the process is ammonia, as mentioned above, which cools the brine, the scraped
surface freezer, the hardening tunnel, and the storage freezer. The ammonia is expanded twice,
instead of once, so that the ammonia is at -16.7 °C and 2.2 bar when cooling the brine (whose
freezing point is -21 °C) and is then at -33.7 °C and 1 bar when cooling the freezers and the
tunnel (Lide, 2007; pg. B-20 – B-24). Cooling water and air are used to cool and condense the
Fig. 2.8.2: Drawing of a spiral hardening tunnel (Univ. of Guelph, 2008)

47
ammonia along with the filtrate and a stream of UF milk. These last two trade heat with
ammonia for energy recycling. The cooling water is cooled to its original temperature by a
cooling tower, which avoids sending hot water down the drain and reduces the mass flow of
incoming cooling water by 94.7% (Felder and Rousseau, 2000; pg. B-25). An intermediate
refrigerant between ammonia and the cooling water or the air was not used to avoid extra process
equipment and because ambient air is free and at a low enough temperature to cool the ammonia.
Brine and water are also used as coolants for the product; however, they always remain liquid
because of their high boiling points. The heat exchangers that use brine or water do so instead of
using ammonia, whose normal boiling point is -33.7 °C, in order to avoid freezing the product
prematurely (pg. B-20 – B-24).
2.9 Equipment Description, Rationale, and Optimization
The following section discusses and rationalizes the pieces of equipment used to make
frozen yogurt in this process. All of the equipment specifications can be found in the equipment
tables, Tables 2.5.1 through 2.5.20 in section 2.5, and the detailed calculations for equipment
size and cost can be found in Appendix C.
When the milk and cream are brought to the plant, they are paid for by weight. Since the
density of milk is known, a volumetric flowmeter is a cheap and accurate way to measure how
much milk is being received. Magnetic-inductive flowmeters were chosen because they are easy
to manipulate during cleaning (Spreer, 1998). Another option considered was to have a truck
scale, but given the size of such a scale and the accuracy needed, it was considered more
economical to use a flow meter (Warner, 1976). Once the milk and cream are received, they are
not used all at once, so two silos (storage tanks, SL-101 and SL-102) are needed to hold the milk

48
and cream until use. The silos are made of stainless steel and are equipped with a stirring system
for cleaning (Spreer, 1998). All the equipment that contacts the product is made of stainless steel
because it is resistant to corrosion and bacteriological contamination. In practice, stainless steel
is the material of choice for food processing equipment (Krishna Industries, 2008). Since milk
and cream are delivered daily, the silos were designed to hold 100% of the daily milk supply and
100% of the daily cream supply (Spreer, 1998; pg. C-30).
The idea to ultrafilter the skim milk was incorporated into the design based on a paper by
Ordonez, et al., which, as described in the previous section, will increase the creaminess of the
frozen yogurt, increase the amount of protein and calcium in the product, and decrease the
amount of lactose (2000). The membrane specifications, as listed in Table 2.5.4, indicated a
molecular weight cut-off of 5 kDa and a retentate that is 20% total solids (Ordonez, et al., 2000).
To achieve this percentage of total solids, a volume reduction factor of 4.55 is needed
(Premaratne and Cousin, 1991; pg. B-2). This means that 78% of the incoming skim milk is
filtrate, and only 22% of the skim milk becomes UF milk. The waste is recycled as much as
possible. Since the filtrate is cold, it can be recycled to cool the compressed ammonia, some
filtrate is used to grow the bulk culture, and the rest can be sold as pig feed (Knight, 2008). The
ultrafiltration membrane to be used will be provided by Koch Membrane Systems and it will be a
spiral membrane with a molecular weight cut-off of 5 kDa. A flux of 25 L/m2/hr/bar (0.614
gal/ft2/hr/bar) and a membrane area of 27.2 m2 (292.8 ft2) were selected (Koch, 2007). Using the
volumetric flow of the filtrate, a flux of 142.3 L/m2/hr was found, which made the
transmembrane pressure 5.7 bar (Sáez, 2007). The membrane chosen has a larger area than other
5 kDa cut-off membranes by Koch, which increases the flux while allowing the pressure to
remain relatively low (Koch, 2007). To increase the pressure of the skim milk before the

49
membrane a rotary (external gear) pump was selected because the liquid is at a low flow rate,
about 22 gpm, and is being pumped to a low pressure, 6.7 bar (Seider, et al., 2005; PDH
Engineer, 2008). All the other pumps in this process, except for the homogenizers, are also
rotary pumps for the same reasons. Pump details are found in Tables 2.5.11 and 2.5.12.
Preparing the ice cream mix is the next step. The ingredients for the ice cream mix come
together in a closed vessel with a propeller-type agitator, M-101. This vessel, along with all the
other vessels in the process (except for the silos), are oversized by 30%, in case any unit
operations take longer than expected. To get
the cream from its silo to the mixer, a rotary
pump is used just as for the skim milk. The
mono- and diglycerides, carrageenan, cane
sugar, water, inulin fiber, and corn syrup
solids are all added to the process by the
operators. During a tour of the Phoenix Ice
Cream Plant, it was noted that most of the
additives were manually added to the
process (Knight, 2008). To pasteurize the
ice cream mix, a plate-and-frame heat exchanger is used. This type of heat exchanger, as shown
in Fig. 2.9.1, was selected because it is the most common type of heat exchanger used for milk
pasteurization (Univ. of Guelph, 2008; Spreer, 1998). Also, the ice cream mix will be somewhat
viscous, and plate-and-frame heat exchangers are considered ideal for viscous flows (Seider, et
al., 2005). The pasteurizer consists of four sections: a regenerator, E-201; a heater, E-202; a
water cooler, E-203; and a brine cooler, E-204 (pgs. B-3–B-4). The specifications for these heat
Fig. 2.9.1: General schematic of a plate-and-frame milk pasteurizer (Univ. of Guelph, 2008)

50
exchanger sections can be found in Tables 2.5.8 and 2.5.9. Since the mix must be both heated
and cooled, the regenerator is an excellent way to save energy. In this section the hot,
pasteurized ice cream mix is cooled from 90 °C to 29.8 °C by heating the incoming ice cream
mix from 4 °C to 64.2 °C (Kessler, 1981). Between the regenerator and the heater, the ice cream
mix is at the right temperature for homogenization, so the mix is diverted to the homogenizer,
HG-201, Table 2.5.6, after the regenerator (Ordonez, et al., 2000; Kessler, 1981). The
homogenizer is a type of reciprocating pump that subjects the liquid to very high pressures while
passing between a valve and valve seat, which causes the fat globules to be torn apart and creates
a better emulsion (Warner, 1976; Univ. of Guelph, 2008). This homogenizer has two stages
since the ice cream mix will be thick due to the inulin and carrageenan. It operates at 140 bar in
the first stage and 35 bar in the second stage. These specifications are based on research into
making frozen yogurt with added inulin (El-Nagar, et al., 2002). In the heating section of the
pasteurizer, saturated steam is used to heat the mix to 90 °C, HHST pasteurization temperature
(Kessler, 1981; International Dairy Foods Association, 2008). The water cooler uses refrigerated
water, 16 °C, to bring the temperature of the ice cream mix down to 22 °C, and the brine cooler
brings the ice cream mix the rest of the way to target temperature of 3 °C (Kessler, 1981). Brine
is used to make sure that the coolant temperatures can be high enough to avoid freezing the
coolant in the pipes. Water is used in addition to brine because it usually leads to slightly higher
overall heat transfer coefficients than brine, it is less corrosive than brine, and it is cheaper than
brine (Kessler, 1981; Iowa Department of Transportation, 2008; Seider, et al., 2005). After the
brine cools the ice cream mix, it is used to bring the water back to its original temperature in a
double-pipe heat exchanger, E-208. This model was chosen because double-pipe heat
exchangers are more appropriate than shell-and-tube heat exchangers for heat transfer areas

51
between 2 ft2 and 200 ft2 (Seider, et al., 2005). This heat exchanger falls within that range at 6.0
ft2 (pg. B-10). Also, the brine side of E-208 is made of nickel alloy to avoid corrosion from the
brine (Turton, et al., 2003). For the other heat exchangers in the plant, all the surfaces contacting
brine use nickel alloy, too. A rotary pump, P-201A/B, keeps the refrigerated water moving
(Seider, et al., 2005).
To make the bulk culture, the culture’s growth medium, the filtrate from the milk
ultrafiltration process, is pasteurized and the culture is grown in the three stages described in
sections 2.1 and 2.8: mother culture, intermediate culture, and bulk culture. The pasteurizer used
on the filtrate only consists of a heater, E-501, and a water cooler, E-502; both are described in
Table 2.5.10. No brine is used because the filtrate is exiting the pasteurizer at the incubation
temperature, 40 °C. While a regenerator could have been added to the pasteurizer, the savings,
about $108 per year in steam and cooling water costs, would take about 15 years to outweigh the
cost of a larger heat exchanger (Seider, et al., 2005; Kessler, 1981; pg. B-28). Since this is a
pasteurization process, plate-and-frame heat exchangers are used as described earlier. The
mother culture can be grown in a lab because of the small quantities produced. A 4-L flask
incubated at 40 °C will be sufficient to grow the mother culture. To make the intermediate
culture, the mother culture is poured into a 14.9 gal tank, R-502, and incubated at 40 °C. The
tank must have a port so that periodic samples can be taken to check the pH of the culture. Also,
since the intermediate culture must be kept warm for several hours, insulation on the tank will
prevent heat loss. A rotary pump transfers the intermediate culture into the bulk culture tank.
The bulk culture tank, R-503, is the same as the R-502, but larger; it holds 32.66 ft3. R-503 also
requires a rotary pump to take the bulk culture to the fermentor, R-101.

52
To prepare the UF milk for fermentation, it is pasteurized in a three-stage plate-and-frame
pasteurizer (regenerator, heater, and water cooler; E-101 through 103) with a homogenizer again
between the regenerator and the heater. Since the UF milk only needs to be cooled to 40 °C, the
fermentation temperature, cooling water at 30 °C can be used alone instead of refrigerated water
and brine. The other three stages are used based on typical pasteurizer operation, as for the ice
cream mix pasteurizer (Kessler, 1981; pg. B-5). Since the UF milk is thinner than the ice cream
mix, it is homogenized in a single-stage homogenizer, HG-101, operated at 100 bar (Ordonez, et
al., 2000). To cool off the water from the water cooler, brine is used in E-104. The heat transfer
area is very small, 3.9 ft2, so a double-pipe heat exchanger is used (Seider, et al., 2005; pg. B-
10). A rotary pump keeps the cooling water circulating at 6.2 gal/min.
Fermentation is carried out in R-101. This reactor is intended to operate continuously, so
it must operate as a plug flow reactor. While a continuous stirred tank reactor is possible, to go
from a pH of 6.5 (the approximate pH of milk) to 5.5 would require a CSTR ten times larger than
a comparable PFR (Levenspiel, 2004). In order to ferment the yogurt continuously, the
unfermented UF milk and bulk culture must be added in such a way that there is no back mixing.
The residence time for the reactor is about four hours, which should allow the yogurt to reach a
total acidity of 0.30% (Ordonez, et al., 2000). After fermentation, the yogurt is taken directly to
be cooled by refrigerated water at 16 °C, E-205, then by brine at -4 °C, E-206, to stop
acidification and bring the yogurt to 3 °C (pg. B-6). Because yogurt is much more viscous than
milk, a plate-and-frame heat exchanger is best suited for cooling the yogurt (Prentice, 1992;
Seider, et al., 2005). The water for E-205 is cooled by the brine in E-207. Because of the small
area of this heat exchanger, 12.3 ft2 (pg. B-6), and the corrosive nature of brine, a nickel-alloy

53
double-pipe heat exchanger was selected (Seider, et al., 2005; Turton, et al., 2003). As with the
other water coolers, a rotary pump is used to keep the water moving.
The yogurt and the ice cream mix are mixed together in a closed vessel with an agitator,
M-201. The vessel is closed to prevent contamination, and the agitator is necessary to ensure
mixing. The mix is intended to remain in the mixer for a short amount of time, maximum 30
minutes. To age the frozen yogurt mix, it sits in a tank, JT-201, for fours hours while the flavors
develop as described earlier. The tank must be insulated since the mix is at 3 °C. As with the
fermentor, a plug flow through the tank will ensure that all the mix has been aged for four hours.
Since aging is not as critical a process as fermentation, limited back mixing is acceptable. To
add vanilla to the frozen yogurt mix, another closed vessel with an agitator is used, M-301. This
vessel was designed using the same rationale as M-201.
For the initial freezing process, the vanilla frozen yogurt mix is sent through a scraped
surface heat exchanger with compressed air at 5 bar being added directly into the mix (Warner,
1976; Adapa, et al., 2000). Table 2.5.13 details the freezer specifications. A scraped surface
heat exchanger is the most common type of freezer used to make ice cream, as mentioned in
section 2.8. During the freezing process, the majority of the ice crystals are nucleated on the
wall of the heat exchanger where a large temperature gradient drives nucleation. To maintain
efficient heat transfer and maximize ice crystal nucleation, the ice layer must be frequently
scraped off. Furthermore, to obtain a smooth frozen yogurt, the ice crystals must be kept as
small as possible. This makes it desirable to nucleate as many crystals as possible during initial
freezing. In general, no new crystals nucleate during the hardening stage. The more existing
crystals there are from initial freezing, the smaller these crystals can grow during the hardening
stage—there is less room to grow. Thus, having the scraper, called a dasher, in the heat

54
exchanger removes the growing ice crystals and allows more to nucleate. The dasher cannot
revolve too quickly, however, because heat liberated by viscous dissipation will cause small ice
crystals to melt, thus increasing the final size of the ice crystals (Hartel, 1996). A moderate
dasher speed, 500 rpm, was chosen based on a study on ice crystallization in ice cream in a
scraped surface heat exchanger. This study also found that a shorter residence time resulted in
smaller ice crystals because of necessarily faster heat removal (Drewett and Hartel, 2007). The
ice cream freezer chosen has a volume of five gallons, which results in a very short residence
time, about four minutes (Anco-Eaglin Inc, 2008). The heat transfer area of the freezer also
means that eight scraped surface freezers in parallel are needed (pg. B-13). To calculate the
amount of heat generated by viscous dissipation, several estimations had to be used, but the
viscous heat calculated was similar to values found by Russell, et al. (1999).
Between the initial freezing and hardening, the product is packaged while it can flow
readily. The piece of equipment used for packaging is an ice cream filler. The model chosen can
fill up to 60 1.75 qt containers per minute, though the process only requires 22 cartons per
minute. It fills each 1.75 qt container with the product and sends it off to the hardening tunnel.
To prevent tubs that are only partially full, the filling line can include a scale with a control to
automatically reject containers that are less than the target weight using compressed air. Also, in
the filling line, a metal detector can be installed to ensure that no metallic foreign objects have
wound up in the product.
To harden the frozen yogurt, the options were either a hardening room or a hardening
tunnel (Arbuckle, 1977). Since this process is continuous, a hardening tunnel was selected.
Also, a hardening tunnel will cool the frozen yogurt faster than a hardening room would. Faster
hardening is important to prevent warm spots in the soft frozen yogurt from melting the ice

55
crystals formed in the freezer (Warner, 1976). The containers of frozen yogurt are conveyed
from the filler to the hardening tunnel and then off to the storage freezer. Due to the presence of
the conveyor belt, a spiral hardening tunnel was chosen. The conveyor belt takes the frozen
yogurt to be hardened into a chamber with air at -40 °C. The belt then takes the frozen yogurt on
a spiral path in the chamber for about 2 hours and then conveys the hardened frozen yogurt on to
the storage freezer (Knight, 2008; pg. B-15).
The storage freezer keeps the frozen yogurt stored until it is shipped. The storage freezer
is kept at -18 °C, which is the target core temperature of the frozen yogurt when it leaves the
hardening tunnel. The freezer was designed to hold one week’s worth of product and to allow
space to move around in.
The ammonia refrigeration cycle is the key to providing temperatures low enough to
make frozen yogurt. As described in section 2.1, the refrigeration cycle consists of expansion
valves, compressors, and heat exchangers. While a turbine could have been used, it would not
have generated much work, and it would have cost more than a valve (Koretsky, 2004). The
three compressors used are centrifugal because that type delivers a smooth flow rate, has low
maintenance costs, and is small in size (Seider, et al., 2005). The highest compression ratio used
is 4, which is the maximum recommended compression ratio according to the heuristics in
Seider, et al. (2005). Based on the precedent set by the home refrigerator, blowing air will
provide some of the cooling for the hot, compressed ammonia (Marshall, et al., 2003). These
heat exchangers, E-402, E-403, and E-301, were selected to be air-cooled fin-fan heat
exchangers. The air is conservatively assumed to be at 20 °C, based on Pennsylvania climate
data (Pennsylvania State Climatologist, 2008). To keep a decent temperature approach, the air
cools the ammonia to 28 °C. The air is brought in with centrifugal blowers, B-301, 401, 402,

56
and 403, because chemical plants commonly use centrifugal blowers to supply air (Seider, et al.,
2005). The ammonia/brine heat exchanger, E-302, is a shell-and-tube heat exchanger because its
heat transfer area is over 200 ft2 (pg. B-11). The style of shell-and-tube chosen is a fixed head
because of the low price (Seider, et al., 2005). The brine loop is kept flowing with a rotary
pump, P-301A/B. The filtrate/ammonia and the cooling water/ammonia heat exchangers are also
fixed-head shell-and-tube heat exchangers because of their size (pg. B-19). Cooling water is
used in addition to filtrate, air, and UF milk to cool off the compressed ammonia because not
using cooling water would have required the air/ammonia heat exchanger to have a prohibitively
large area (aspenONE, 2005).
Hot cooling water is cooled back to its original temperature, 30 °C, using a cooling
tower. Because the cooling water that cools off the ammonia reaches 62 °C, it would not be
environmentally friendly to return hot water to the environment. Also, adding the cooling tower
saves nearly 8.95 million gallons of water each year (pg. B-25). Rotary pumps are used to bring
new cooling water into the process and to keep the cooling water circulating.
3.0 Safety
3.1 Safety Statement
There are three major safety hazards associated with frozen yogurt manufacturing:
microbiological, chemical, and physical. The greatest hazard is microbiological, which is a
serious concern to human health (van Schothorst and Kleiss, 1994). Potential risks for the
presence of pathogens can occur throughout the process from milk receiving to storage and
transportation if the design parameters are not strictly controlled. Chemical hazards are a
concern due to the presence of large quantities of toxic, highly corrosive compounds, on-site.

57
The last potential hazard is physical and can result in human injury or fatality. This hazard has a
direct impact on the personnel working at the facility during the operational phase. Process
hazard analyses were completed for the manufacturing of frozen yogurt and are given in Tables
3.2.1 to 3.2.12.
This assessment identifies specific hazards in the microbiological, chemical and physical
areas. At the same time, each hazard is analyzed to determine how it can be controlled or
eliminated. Lastly, a safety risk assessment was developed using a potential hazard analysis
(PHA) around different pieces of equipment throughout the process.
Microbiological Hazards
In order to minimize the hazard of food borne illnesses, the Food and Drug
Administration adopted a program known as Hazard Analysis and Critical Control Point
(HACCP) in different areas of the food industry. A critical control point is a step, such as
pasteurization, that eliminates or acceptably reduces food safety hazards. Currently, the FDA
does not require the use of HACCP as the food safety standard in the dairy industry (FDA,
2001). However, there is a dairy voluntary HACCP in place that was used as a model in this
safety assessment.
Since frozen yogurt is a milk-based product, it is a good medium for growth of
microbes at different stages of the process due to the high nutrient content, favorable pH range
(6-7) and long storage period (van Schothorst and Kleiss, 1994). The FDA has identified the
following hazardous pathogens in milk products (FDA, 2001):
� Salmonella
� Listeria monocytogenes
� Staphylococcus aureus
� Enterohemorrhagic Escherichia coli

58
� Campylobacter jejuni
� Clostridium botulinum
� Bacillus cereus
Most of these pathogens have the potential to grow in frozen yogurt, at any stage of the process,
unless the environmental conditions inhibit the growth. The three areas within manufacturing
that restrict the growth of pathogens are: pasteurization, fermentation and hardening. However,
the processing facility must have an automated system in place to assign lot numbers to each
product, in case of a recall, should any of the control points fail.
Pasteurization is the most commonly applied heat treatment in milk products (van
Schothorst and Kleiss, 1994). The parameters used to accomplish an effective pasteurization are
time and temperature. In this process, the raw ice cream mixture, the ultrafiltered milk for
making yogurt, and the filtrate for growing the bulk culture are heated to 90 °C for a period of
0.5 seconds. After reaching this temperature and maintaining it for the specified time, 99.9% of
pathogenic bacteria have been destroyed (International Dairy Foods Association, 2008; Spreer,
1998). This process is known as higher-heat shorter time (HHST) pasteurization, and it is one
of several types of pasteurization methods. This is a critical control point since it reduces
potential hazards in milk to acceptable levels by the International Dairy Foods Association.
The fermentation of yogurt is also used as a critical control point to eliminate the
presence of undesired bacteria. During fermentation, bulk culture made of lactic acid bacteria
(benign bacteria to humans) is added to pasteurized UF milk which drops the total acidity of the
mixture to 0.30%. This acidic environment makes it unlikely for pathogens to survive (Adams
and Nicolaides, 1997). In addition, the rapid growth of the lactic acid bacterial population
restricts the growth of other organisms by competing for available space and uptake of nutrients

59
(Adams and Nicolaides, 1997). Therefore, the fermentation serves as an additional control point
for any pathogens that may have survived pasteurization.
Frozen yogurt hardening is the last step within the process that reduces microbiological
hazards. The frozen yogurt is cooled down to -18°C in the hardening tunnel, and it is kept at this
temperature during storage and transportation. While some bacteria may survive the freezing
and hardening processes, the low temperatures are not conducive to bacterial growth, so no new
bacteria is expected to grow in the system. Any pathogens that happen to survive the
pasteurization, fermentation, and freezing steps, may become active again after consumption due
to the warm temperatures of the human body (Rahman, 2007).
Setting control points to avoid contamination from the process equipment is more
difficult because contaminants can arise from many sources (van Schothorst and Kleiss, 1994).
This includes buildup of microorganisms in cracks, void spaces, dead ends, etc. Good
manufacturing practice is a good measure of control. Therefore, frequent cleaning of conveyor
belts, product lines and flow pipes is required. This is performed by flushing with water, caustic,
acid and water once again into the systems. Another way to detect unforeseen sources of
contamination is to collect samples on the microbiology of the plant’s soil and its environment
(Kleiss, et al., 1994). This process allows identification of microorganisms that can be found in
drains, air handling units, insulation around tanks and pipes. In addition, the possibility of pests
entering production, or storage can be determined (Kleiss, et al., 1994).
In the case of control failure and/or suspicion of product contamination, the product must
be recalled. Yogurina must identify the lot number associated with the contaminated products,
and notify the nearest FDA office. This will assure that the product will be quickly removed
from the market to avoid consumer harm (FDA, 2002).

60
The final frozen yogurt product has the potential to become contaminated even after
leaving the manufacturing facility through transportation and shipping if good manufacturing
practice is not followed or proper temperatures are not maintained. Keeping the temperature in
shipping trucks below freezing will prevent microbial growth, though the temperature ought to
be kept near -18 °C to maintain product quality. In addition, the following actions can support
safety assurance:
� Use hygienic and sanitatary practices when loading, unloading, and inspecting the product
� Inspect transportation vehicles for cleanliness, odors, and dirt before loading
Table 3.1.1 below summarizes process hazards and describes each particular control point.
Table 3.1.1: Hazard identification and prevention in frozen yogurt manufacturing Process Hazard Action to Prevent Hazard
Milk receiving Presence of pathogens
-Purchase materials from certified sources -Conduct testing to assure milk temperature is no higher than 4°C -Conduct microbiological testing for presence of pathogens
Pasteurization Survival of pathogens
-Adjust residence time and temperature control -Equipment disinfection -Install valves to divert milk back to silos when temperature falls below the set point (90°C)
Fermentation Survival of pathogens
-Good hygienic practices -Monitor pH of culture mixture by taking samples from tank ports
Aging Contamination -Good manufacturing practices -Regular cleaning
Growth of microorganisms
-Maintain low temperatures (less than 4 °C) to inhibit growth
Packaging Contamination -Use of automated equipment -Regular cleaning
Additional ingredients: iInulin, vanilla flavoring, mono- and diglycerides, carrageenan, cane sugar and corn syrup
Contamination -Purchase materials from certified sources -Maintain storage areas regularly clean -Maximum storage temperature of 25 °C
Hardening Contamination -Cleaning and disinfection of equipment Storage and transportation Growth of
microbes -Maintain a freezing temperature -Discard product exposed to temperatures > 0°C

61
Chemical Hazards
There are three chemicals used in this process that are toxic to human health: ammonia,
sodium hydroxide and sulfuric acid. Exposure to these chemicals involves chemical handling
during cleaning operations, maintenance of cooling systems, and equipment failure. The primary
method to avoid exposure to chemicals is the use of personal protective equipment (OSHA,
2003).
Cleaning and washing the equipment/pipelines in preparation for maintenance can create
problems. Sulfuric acid, used as a cleaning agent in the plant, is a strong irritant causing severe
skin burns and respiratory tract irritation (Kegley, et al., 2007). Similarly, sodium hydroxide can
also cause severe skin burns, shortness of breath, and collapse (Kegley, et al., 2007).
Respirators, lab coats, appropriate gloves, and shoes should be required while handling this
agent. Employees with appropriate technical training should be considered for this stage of the
manufacturing process. Additional safety sessions should be presented to all employees every 6
to 8 months to enrich their knowledge and safety awareness about the plant (OSHA, 1992).
Maintenance of cooling systems is one area where many accidents have occurred. For
example, an ice cream plant manager was killed by an explosion while replacing a leaking drain
valve on an oil trap as a part of an ammonia refrigeration system (Sanders, 1999). In 1994, an
employee was killed when disconnecting a line from an ammonia valve. The line had not been
adequately isolated, causing the release of liquid ammonia which struck the worker's face and
body (OSHA, 1996). The OSHA Permissible Exposure Limit for ammonia in general industry is
50 ppm. Ammonia can be harmful and additional safety features must be implemented
throughout the refrigeration cycle to ensure a safe working environment. This highly hazardous
refrigerant can be protected by safety valves or pressure-relief devices discharging to a surge

62
tank, flare or other safer place for storage. Leak detectors are also recommended in order to
avoid further complications and ensure hazard prevention (OSHA, 1996).
Physical Hazards
Many safety considerations are related to physical hazards in the working environment
during manufacturing of frozen yogurt. In recent years, the total recordable cases of safety
incidents in the food industry are about 3 to 5 times higher than the chemical industry according
to the U.S. National Safety Council (Sanders, 1999). The potential for employee injury arises
from performing repetitive activities in the production lines, exposure to cold in refrigerated
areas, and performing maintenance on process equipment.
Dairy operations require employees to perform heavy lifting, carrying, and repetitive
work. The following guidelines can be used as a prevention method to avoid injuries
(International Finance Corporation, 2007):
� Use mechanical equipment when possible.
� Provide employees ergonomic awareness education to avoid work-related repetitive
motion injuries.
� Train employees within the first week of employment in effective lifting and stretching
techniques that place minimum stress on the lower back.
� Assign different job tasks to each employee on a weekly basis to reduce the outlined
hazards and improve overall labor efficiency.
The working environment in frozen yogurt manufacturing process can also pose a hazard
to employees. The main area of concern is exposure to noise and vibrations from heavy
machinery like the homogenizer, fillers, and packing lines (IFC, 2007). In order to minimize
exposure, ear plugs must be worn at all times in the operation floor. In addition, the hardening

63
tunnel and storage freezer can expose employees to extremely low temperatures over long
periods of time. Employee activities in these areas should be replaced by automated equipment,
if possible. Otherwise, the employees must wear a thermal suit to prevent frostbite and other
related damages. Lastly, a proper drainage system must be in place to minimize the volume of
liquids on the floors. Employees must wear slip-resistant footwear to prevent slips and falls.
Overall, frozen yogurt manufacturing is a safe process. This study indicated that the
major safety hazard, specific to the equipment, is the ammonia refrigeration. Ammonia is a
highly toxic compound, and any type of failure can lead to human fatalities. In addition, the
process hazard analysis (PHA) indicated that another major hazard is the compressed air lines
flowing into the scraped surface heat exchanger due to the extreme high pressures. This type of
incident can potentially lead to upsets in downstream units, which would magnify the effects of
the event. Appropriate installation of automatic control in combination with daily inspections
can reduce the potential hazards significantly. Microbiological hazards, on the other side, are
not specific to one piece of equipment, and can occur at any stage of the process. Good
manufacturing practices, regular equipment cleaning, equipment monitoring, and sample testing
are essential to reduce the presence of pathogens in the milk or frozen yogurt. By implementing
the recommendations stated in this safety study, the safety performance for this facility should
increase to a level that will protect human health and the working environment.

64
3.2 Process Hazard Analyses Table 3.2.1: Process hazard analysis on E-202
No.: 1 Description: E-202 Plate and Frame Pasteurizer (Heater)
Item What if...? Root Causes/Related Questions Responses Safeguards Action Items
1.1
What if the pasteurizer plates fail due to stress corrosion?
Use of cleaning in place (CIP) chemicals during equipment cleaning
Pressure drop across the plates and loss of heat transfer occurs
Monitor equipment with temperature and pressure gauges to and compare to normal operating conditions to detect any corrosion
Consider duplex stainless steel as MOC
Consider ultrasonic monitoring for wall thickness
Close outlet of mixer M-101 to prevent more ice cream mix from coming into pasteurizer
Shut off P-101 to prevent M-101 from overfilling
1.2
What if the pasteurizer plates become clogged with burned milk solids?
Equipment is not properly maintained or cleaned
Milk pathogens will contaminate the final product
Inefficient heat transfer across plates
Product loss and production delay
Divert unpasteurized milk back to E-202
Product recall in worst case scenario
Consider installation of valves to divert milk back to E-202
Clean pasteurizer (would need to stop process and run CIP)
1.3
What if the contents of the pasteurizer are overheated by steam causing the vapor pressure to rise?
Excess steam flow
Steam pressure is too high
Over-pressurization in E-202, HG-201
Fire or explosion
Fatalities
Pressure relief system
Use of flowmeters to monitor flow of steam
Install temperature and pressure alarms or interlocks to stop steam flow
Company: University of Arizona- Tucson
April 13, 2008
Plant: Yogurina Site: Rural Pennsylvania Unit: 200 System: Frozen Yogurt Manufacturing
Method: What-if Type: Heat Exchanger Design Intent: Pasteurize incoming raw milk
Number: Unit 200
Team Members: Yirla Morehead, Stefka Ormsby, Kathryn Cook, Dena Moline

65
Company: University of Arizona- Tucson
April 13, 2008
Plant: Yogurina Site: Rural Pennsylvania Unit: 300 System: Frozen Yogurt Manufacturing
Method: What-if Type: Heat Exchanger Design Intent: Remove growing ice crystals from the wall of the scraped surface heat exchanger
Number: Unit 300
Team Members: Yirla Morehead, Stefka Ormsby, Kathryn Cook, Dena Moline
No.: 2 Description: ES-301-308 Scraped Surface Heat Exchanger with Dasher
Item What if...? Root Causes/Related Questions
Responses Safeguards Action Items
2.1
What if the dasher blades become dull?
Equipment use
An error in vendor specifications
Lack of maintenance
Overgrowth and oversized ice formation used in frozen yogurt mix
Filler failure or clogging
Inefficient heat transfer
Icy frozen yogurt with poor consistency
Replace dasher blades based on supplier recommendation
Sharpen blades periodically
Perform maintenance and inspection
Sharpen or replace blades when needed
Sampling of product before sending to fillers
2.2
What if the compressed air flowing into the heat exchanger is over pressurized?
V-303 failure to control flow of compressed air
Product contains too much air; overrun specification is not met
Pressure drop across ES-301-308
Plant explosion due to over-pressurized heat exchanger plates in contact with ammonia refrigeration cycle
Casualties
Failure of downstream process units
Pressure relief system
Periodic valve testing
Consider installation of a safety valve after V-303
Close flow of frozen yogurt mix from M-301 and close flow of air from compressed air tank (before stream 83)
Replace or repair V-303
Table 3.2.2: Process hazard analysis on ES-301-308

66
Company: University of Arizona- Tucson
April 13, 2008
Plant: Yogurina Site: Rural Pennsylvania Unit: 500 System: Frozen Yogurt Manufacturing
Method: What-if Type: Reactor Design Intent: To ferment the ultrafiltered milk into yogurt
Number: Unit 500
Team Members: Yirla Morehead, Stefka Ormsby, Kathryn Cook, Dena Moline
No.: 3 Description: R-503 Bulk Culture Batch Reactor
Item What if...? Root Causes/Related Questions Responses Safeguards Action Items
3.1
What if the target pH (5.5) is not reached during fermentation?
Growth medium for bacteria is below 5.3% lactose (not enough lactose to feed culture)
Incubation temperature too high or too low
Lower percentage of live bacteria in culture
pH control loss
Viscosity of mixture will decrease
Product loss and production delay
High/low pH alarm
Test pH regularly during batch culture growth
Extend fermentation time until pH reaches set point
Grow culture ahead of time to keep a good production schedule
3.2
What if the starter culture is not active?
Supplier error
Inappropriate culture storage (i.e. at the wrong temperature)
Fermentation will not be achieved
Product loss and production delay
Perform fermentation ahead of time
Test pH regularly during batch culture growth
Grow culture ahead of time to keep a good production schedule
Start a new batch of culture
Table 3.2.3: Process hazard analysis on R-503

67
Company: University of Arizona- Tucson
April 13, 2008
Plant: Yogurina Site: Rural Pennsylvania Unit: 300 System: Frozen Yogurt Manufacturing
Method: What-if Type: Line/Pipe Design Intent: Carry compressed air to scraped surface heat exchanger
Number: Unit 300
Team Members: Yirla Morehead, Stefka Ormsby, Kathryn Cook, Dena Moline
No.: 4 Description: Compressed air lines before and after V-303
Item What if...? Root Causes/Related Questions Responses Safeguards Action Items
4.1
What if the line leaked or ruptured?
Supplier error
Corrosion
Air line accidentally punctured
Overpressurization
Plant explosion if near ignition sources or in proximity to ammonia
Casualties
Process delay and production loss
Final overrun too low (i.e. frozen yogurt is too dense; not enough air in product)
Daily inspection of pipelines and flowmeters
Close flow of frozen yogurt mix from M-301 and close flow of air from compressed air tank (before stream 83)
Repair or replace compressed air lines
4.3
What if the valve failed to control flow of compressed air?
Control failure
Maintenance error
Supplier error
Pressure drop in ES-301-308
Final product does not meet quality standard (overrun)
Daily valve testing
Product quality testing schedule to check overrun
Install automatic turn-off control for compressed air flow
Close flow of frozen yogurt mix from M-301 and close flow of air from compressed air tank (before stream 83)
Repair or replace V-303
Table 3.2.4: Process hazard analysis on compressed air lines

68
Company: University of Arizona- Tucson
April 13, 2008
Plant: Yogurina Site: Rural Pennsylvania Unit: 200 System: Frozen Yogurt Manufacturing
Method: What-if Type: Tank/Vessel Design Intent: Aging of frozen yogurt mix
Number: Unit 200
Team Members: Yirla Morehead, Stefka Ormsby, Kathryn Cook, Dena Moline
No.: 5 Description: JT-201 Jacketed Tank
Item What if...? Root Causes/Related Questions Responses Safeguards Action Items
5.1
What if microbes are present in cracks, void spaces inside the tank after cleaning?
Flow of chemicals was not maintained during cleaning
Void spaces and crack due to supplier error
Geometry of equipment may result in difficult to clean corners
Potential pathogens present in final product
If pathogens are not detected, it can lead to consumer harm
Quality control lab tests for pathogens
Eliminate corners in equipment
Have clean welds and rounded surfaces
Conduct periodic testing for pathogens in vessel
Product recall in worst case scenario
Perform extra CIP (stop process)
Replace tank
5.2
What if the tank deteriorates?
Internal corrosion and decomposition
Internal reactions between the stainless steel and cleaning chemicals
CIP chemicals
Tank rupture
Process delay and production loss
Contaminated product
Daily inspection of equipment
Appropriate material of construction
Product recall possible
Replace tank
Table 3.2.5: Process hazard analysis on JT-201

69
Company: University of Arizona- Tucson
April 13, 2008
Plant: Yogurina Site: Rural Pennsylvania Unit: 300 System: Frozen Yogurt Manufacturing
Method: What-if Type: Hardening Tunnel Design Intent: Hardening of soft frozen yogurt with anhydrous ammonia as refrigerant
Number: Unit 300
Team Members: Yirla Morehead, Stefka Ormsby, Kathryn Cook, Dena Moline
No.: 6 Description: HT-301 Spiral Hardening Tunnel
Item What if...? Root Causes/Related Questions
Responses Safeguards Action Items
6.1
What if there is ammonia leak during refrigeration in the hardening tunnel HT-301?
Pipe/ joint/ seal leak or eruption
Chemical and physical wear
Supplier error
Fire or explosion if ammonia comes into contact with lubricant oil or ignition source
Process upset and production loss
Air monitoring device
Leak detectors
Daily inspection
Excess flow valve to detect a sudden drop of pressure due to the release of ammonia Automatic shut-off control for ammonia flow
Fire protection
Emergency evacuation plan
Call Hazmat team and shut off ammonia flow in event of leak
Stop process and evacuate plant
Fix leak if reasonable to do so
6.2
What if employees are exposed to ammonia?
Caused by ammonia leak in the system
Frostbite from evaporating ammonia
20 ppm for five minutes is maximum exposure
Fatalities occur at 30,000 ppm for five minutes
Potential law suit
Leak detectors
Daily inspection
Install ammonia alarm detectors
Have safety shower and eye wash nearby
Fire protection
Emergency evacuation plan
Call Hazmat team and shut off ammonia flow in event of leak
Stop process and evacuate plant
Fix leak if reasonable to do so
6.3
What if the product containers are not properly sealed and the product gets contaminated with ammonia?
Caused by ammonia leak in the system
Process upset and production loss
Health threat (poisoning) to consumers
Potential law suit
Inspection of product before hardening
Quality testing
Inspect product seal
Contact Department of Health
Product recall possible
Table 3.2.6: Process hazard analysis on HT-301

70
Company: University of Arizona- Tucson
April 13, 2008
Plant: Yogurina Site: Rural Pennsylvania Unit: Pipes System: Frozen Yogurt Manufacturing
Method: What-if Type: Pipelines Design Intent: Transportation of reactants, products and refrigerants
Number:
Team Members: Yirla Morehead, Stefka Ormsby, Kathryn Cook, Dena Moline
No.: 7 Description: Pipelines
Item What if...? Root Causes/Related Questions Responses Safeguards Action Items
7.1
What if some of the stainless steel pipes are corroded?
Caused by overall breakdown of the passivation layer formed on the stainless steel due to CIP chemicals
Physical damage to the passivation layer of the pipe surface
Contamination of product
Pipe fracture/rupture
Loss of product and production delays
Daily inspection
Ultrasonic monitoring for wall thickness
Duplex stainless steel as MOC
Replace pipes when needed
7.2
What if some of the Ni-alloy pipes are corroded?
Chemical wear Contamination of product
Pipe fracture/rupture
Loss of product and production delays
Daily inspection Replace pipes when needed
7.3
What if the corroded pipe carries ammonia?
Caused by overall breakdown of the passivation layer formed on the stainless steel due to CIP chemicals
Physical damage to the passivation layer of the pipe surface
Reaction of ammonia with oxidizing or reducing agents in corroded material
Process upset and production loss
Microprocessor leak detectors
Daily inspection
Consider Emergency Evacuation Plan
Consider duplex stainless steel as MOC
Table 3.2.7: Process hazard analysis on pipelines

71
Company: University of Arizona- Tucson
April 13, 2008
Plant: Yogurina Site: Rural Pennsylvania Unit: 300 System: Frozen Yogurt Manufacturing
Method: What-if Type: Valve Design Intent: Expansion and decrease of ammonia temperature and pressure
Number: Unit 300
Team Members: Yirla Morehead, Stefka Ormsby, Kathryn Cook, Dena Moline
No. 8 Description: V-301 Isentropic Expansion valve
Item What if...? Root Causes/Related Questions Responses Safeguards Action Items
8.1
What if the valve V-301 is malfunctioning and fails to relieve pressure?
Supplier error
Maintenance error
Pipeline overpressure
Pressure drop across E-302
Insufficient refrigeration in the ammonia cycle
Production delay
Poor product quality
Pressure relief system
Periodic valve testing
Perform maintenance and inspection
Replace valve when needed
Stop ammonia flow and process flow until valve is fixed
8.2
What if the valve is leaking?
Supplier error
Pipe/ joint/ seal leak or eruption
Chemical and physical ware
Maintenance error
Fire or explosion if ammonia comes into contact with lubricant oil or ignition source
Process upset and production loss
Air monitoring with direct reading device
Leak detectors
Daily inspection
Excess flow valve to detect a sudden drop of pressure due to the release of ammonia
Automatic shut-off control for ammonia flow
Replace valve when needed
Shut off flow of ammonia in case of leak
Use emergency action plan
Table 3.2.8: Process hazard analysis on V-301

72
Company: University of Arizona- Tucson
April 13, 2008
Plant: Yogurina Site: Rural Pennsylvania Unit: 300 System: Frozen Yogurt Manufacturing
Method: What-if Type: Blower Design Intent: Air transportation to heat exchanger
Number: Unit 300
Team Members: Yirla Morehead, Stefka Ormsby, Kathryn Cook, Dena Moline
No. 9 Description: B-301 Centrifugal Blower
Item What if...? Root Causes/Related Questions Responses Safeguards Action Items
9.1
What if the blower B-301 failed and the air is not passing through E-301?
Electric short-circuit
Supplier error
Lack of air cooling supply for ammonia
Insufficient refrigeration to produce product
Potential for explosion due to rise in temperature of ammonia
Daily inspection
Temperature monitoring throughout process
Install temperature alarms or interlocks
Replace blower
Shut off compressors to stop ammonia flow, and stop process
9.2
What if during maintenance, the power supply is turned on?
Miscommunication
Supplier error
Severe injury/death
Process delay and production loss
Safety locks
Lock out tag out
Continue safety education for employees to avoid miscommunication
Turn power supply to blower off
Table 3.2.9: Process hazard analysis on B-301

73
Company: University of Arizona- Tucson
April 13, 2008
Plant: Yogurina Site: Rural Pennsylvania Unit: 200 System: Frozen Yogurt Manufacturing
Method: What-if Type: Pump Design Intent: Pumping additional water to cooling tower
Number: Unit 200
Team Members: Yirla Morehead, Stefka Ormsby, Kathryn Cook, Dena Moline
No. 10 Description: P-401A/B External Gear Pump
Item What if...? Root Causes/Related Questions Responses Safeguards Action Items
10.1
What if pump P-401A/B failed and water is not added back to stream 90 after the cooling tower?
Supplier error
Build up of minerals due to water hardness
Mechanical failure
Will result in decrease of water flow in cooling cycle
After 20 cycles, cooling tower will be dry, which will result in insufficient heat transfer in downstream units
Process delay and production loss
Will result in failure to cool the ammonia in E-401
Ammonia will overheat the filtrate in E-303 above 39.9 C
Filtrate used for fermentation will be above the required temperature leading to lack of bacteria growth
Measure flow rates in stream 86
Filter water if water hardness is high
Daily inspection
Regular readings of the flow meter on stream 86 to detect malfunctioning in early stage
Replace pump and switch to backup pump in even of pump failure
10.2
What if some of the pump’s parts have fretting corrosion (common on the pump shaft or sleeve)?
Supplier error (MOC of pump’s parts)
Chemical oxidation
External fire if lubricant oil from pump is mixed with released ammonia Resulting in seal leakage
Avoid pumps containing carbon steel parts
Regular maintenance and inspection
Assure pump is made of correct materials of construction
Replace pump if corrosion is found
Switch to P-401B
Table 3.2.10: Process hazard analysis on P-401A/B

74
Company: University of Arizona- Tucson
April 13, 2008
Plant: Yogurina Site: Rural Pennsylvania Unit: 400 System: Frozen Yogurt Manufacturing
Method: What-if Type: Compressor Design Intent: Ammonia compression during refrigeration
Number: Unit 400
Team Members: Yirla Morehead, Stefka Ormsby, Kathryn Cook, Dena Moline
No. 11 Description: C-401 Centrifugal Compressor
Item What if...? Root Causes/Related Questions
Responses Safeguards Action Items
11.1
What if the compressor C-401 failed to compress the ammonia going into E-403?
Supplier error
Maintenance error
Process upset
Insufficient heat removal during freezing and hardening
Temperature of storage freezer rises, product could melt
Unpasteurized ultrafiltered milk
Presence of pathogens in yogurt mix
Backup compressor in case of failure; install parallel compressors C-401 A/B
Fix or replace C-401
Stop process since refrigeration is required to produce product
11.2
What if there was ammonia release?
Supplier error
Pipe, seal leak, or eruption
Chemical and physical ware
Fire or explosion in proximity to ignition sources
Process upset and production loss
Air monitoring with direct reading device
Leak detectors
Daily inspection
Excess flow valve to detect a sudden drop of pressure due to the release of ammonia
Automatic shut-off control for ammonia flow
Fire protection
Use emergency evacuation plan
Call Hazmat team and shut off ammonia flow in event of leak
Stop process and evacuate plant
Fix leak if safe to do so
Table 3.2.11: Process hazard analysis on C-401

75
Company: University of Arizona- Tucson
April 13, 2008
Plant: Yogurina Site: Rural Pennsylvania Unit: 100 System: Frozen Yogurt Manufacturing
Method: What-if Type: Pump Design Intent: Milk pressurizing before ultrafiltration in membrane
Number: Unit 100
Team Members: Yirla Morehead, Stefka Ormsby, Kathryn Cook, Dena Moline
No. 12 Description: P-101A/B External Gear Pump
Item What if...? Root Causes/Related Questions Responses Safeguards Action Items
12.1
What if there is pump malfunctioning and the pressure is too low for MB-101?
Supplier error
Pump- internal corrosion
Pump malfunctioning
Poor separation of UF milk and filtrate
UF milk contains less than 20% milk solids nonfat, which would diminish product quality
UF milk with high content of lactose
Fermentation failure due to lack of lactose
Product loss and production delay
Daily inspection
Install pressure gauges
Flow meters to check ratio of filtrate to retentate
Switch to backup pump in case of malfunction and replace or repair broken pump
12.2
What if the milk pressure is too high?
Pump malfunctioning
Operator error
Pipe eruption
Membrane failure and milk spill
If pressure is too high, but not high enough to cause failures, the UF milk will have the wrong composition
Pressure regulator
Install pressure relief system
Automatic shut-off control to stop flow from SL-101
Shut off pump and switch to backup if malfunctioning
Reduce pump speed if operator is at fault
Table 3.2.12: Process hazard analysis on P-101A/B

76
4.0 Environmental Impact Statement
Yogurina frozen yogurt performed a gate to gate life cycle assessment (LCA) to identify
potential environmental impacts arising from production, material use, and disposal associated
with frozen yogurt manufacturing. The results of this study are based on the plant’s delivery of
20.4 million lb/yr of frozen yogurt to market. The overall study was broken down into different
sections to evaluate environmental performance: contributions by impact category, regulations,
impact from utilities, and process improvements to reduce environmental burdens.
Impact Categories
In the first part of the analysis, the following environmental impact categories were used
to estimate the percentage contribution from raw materials, cooling fluids, and on-site chemicals
(cleaning agents).
� Human toxicity
� Ecotoxicity
� Depletion of non-renewable resources
� Ozone layer depletion
� Global warming potential
In order to determine human toxicity from each material, material safety data sheets were
used (ScienceLab.com, 2005). Ecotoxicity data (terrestrial and aquatic) was not found for any of
the raw materials or steam using both the Environmental Protection Agency website and online
search engines. Ecotoxicity data on the impacts to aquatic life was found for ammonia, sulfuric
acid, and sodium hydroxide. The latter chemicals have highly toxic effects in aquatic organisms
(ScienceLab.com, 2005). The brine solution was considered to be benign to aquatic life (Nova
Chemicals, 2007).

77
The remaining categories were found to have a favorable outlook on the environment.
The global warming potentials were determined to be low or nonexistent for all the chemicals
based on the EPA inventory of U.S. Greenhouse Gas Emissions and Sinks: 1990-2006 (EPA,
2008). The processing materials were considered to be non-ozone depleting since no emissions
were recorded on the EPA Global Anthropogenic non-CO2 Greenhouse Emissions: 1990-2020
(EPA, 2006). Lastly, all materials are renewable because they are either produced from
livestock, or industrial chemical reactions. A summary of all environmental burdens by category
is shown in Table 4.0.1.
Table 4.0.1: Summary of environmental burdens by category from raw materials, cooling fluids and on-site chemicals during one year of operation.
Quantity used annually
(lb)
Human Toxicity
Ecotoxicity Depletion of non-
renewables
Ozone layer
depletion
Global warming potential
Raw Materials Inulin 484,266 Low No No No No Freeze dried culture 0.30 No No No No No Milk 61,636,926 No No No No No Heavy cream 1,013,580 Low No No No No Vanilla 388,539 Low No No No No Mono- & Diglycerides 39,417 Low No No No No Cane Sugar 2,325,603 Low No No No No Carrageenan 56,310 Low No No No No Corn Syrup Solids 528,751 Low No No No No Cooling Fluids Ammonia 2,250* High Slight No No No Brine 5,313* Low No No No No Steam 528,751 No No No No No **On-site chemicals Sulfuric acid 177,843 High High No No No Sodium hydroxide 150,022 High High No No No
* Close loop, one-time inputs ** Storage period for on-site chemicals is three weeks; raw materials is one week.
Regulations
The EPA’s consolidated list of chemicals subject to the Emergency Planning and
Community Right to Know Act (EPCRA) and section 112 (r) of the Clean Air Act was used to

78
determine the rules and regulations pertaining to frozen yogurt manufacturing (EPA, 2001). For
the most part, the raw materials consist of solid chemicals except for milk, heavy cream, and
vanilla. The threshold planning quantity (TPQ) for solids is 10,000 pounds. Most of the raw
materials are stored for one week. Milk and heavy cream arrive daily, so they are stored for one
day or less. The storage amount is under the TPQ, except for cane sugar which is not regulated
at all. Therefore, these substances are not subject to state or local reporting. The remaining
chemicals, with the exception of brine and steam, fall under the extremely hazardous category
and are thus regulated.
Ammonia, sodium hydroxide, and sulfuric acid are considered extremely hazardous
substances (EHS) under the EPCRA sections 302 and 304, and the Comprehensive
Environmental Response Compensation and Liability Act of 1980 (CERCLA) (EPA, 2001).
Since these substances will be present on-site in amounts above the TPQ, the following actions
must be taken:
1) Obtain an emergency response plan from the Local Emergency Planning Committee
(LEPC)
2) Notify the State Emergency Response Commission (SERC) of the presence of such
substances
3) Provide a list of material safety data sheets or a list of the chemicals to the SERC, LEPC
and the local fire department.
Table 4.0.2 shows a summary of the chemicals that are regulated with the corresponding TPQ
values and release reportable quantities (RQ) in pounds.

79
Table 4.0.2: Regulated chemicals under the EPCRA and CERCLA (EPA, 2001) Hazardous Substance
Registry Number
EPCRA Section 302
TPQ
EPCRA Section 304
RQ
CERCLA RQ
Yogurina storage amount,
3-week period Ammonia 1310-73-2 500 100 100 Sulfuric acid 7664-93-9 1000 1000 1000 6400 Sodium hydroxide 7664-41-7 1000 6400 Impact from utilities
The major environmental burden for this facility results from electricity usage during
manufacturing. The primary energy source in the state of Pennsylvania is coal (Energy
Information Administration, 2006). Based on statistics from the Energy Information
Administration, 2006, the following emissions to air in Table 4.0.3 were calculated for a facility
with similar electricity requirements of 3 million kWh:
Table 4.0.3: Greenhouse gas emissions from electricity requirements Emissions Unit Value Sulfur Dioxide lb 25,368 Carbon Dioxide lb 3,784,257 Nitrogen Oxide lb 5,372
Using the US average, per capita electricity use in 2001 (13,000 kWh), it is estimated that the
electricity use from this facility is equivalent to the electricity use of 230 citizens (California
Energy Commission, 2005). During process design, the required electricity was minimized by
recycling energy, reducing materials used, and making use of pre-insulated pipes.
The total average water consumption for the facility is 500,000 gal per year. This value
is equivalent to the average water consumption of 12 citizens living in Arizona in 2004 (Tucson
Water, 2008).

80
Process improvements to reduce environmental burdens
In recognizing the importance of protecting the environment, several actions were
implemented into the overall process to reduce material use, utilities (electricity), and waste
products. The modifications are listed below:
� Membrane filtrate (4°C) is used to cool down ammonia at 58.3 °C down to 35 °C in E-
303, reducing the amount of cooling water needed.
� The membrane concentration ratio was increased making the filtrate suitable for culture
growth in terms of lactose content and eliminating the use of non fat dry milk (NFDM).
� The pasteurization of ultrafiltered milk (for making yogurt) uses hot ammonia at 154.6
°C instead of steam, reducing utilities.
� Cooling water is also used to cool off ammonia and pasteurized filtrate (for culture
growth) before sending it to a cooling tower to save energy and materials used.
� A cooling tower was incorporated into the process to reduce water use and avoid sending
hot water back into the environment.
� Brine, ammonia, and cooling water are recycled throughout the heat exchanger network
� Frequency converters are incorporated to control the speed of pumps and thus reduce
consumption of electrical power.
� Tanks and pipes are designed to be insulated to reduce heat losses.
� Warm milk reused in pasteurizer to warm incoming milk
� Any filtrate waste sold (for minimal price) to a pig farm as pig feed, instead of going to
waste.
� Brine was used in place of another non-environmentally friendly refrigerant to minimize
environmental impact

81
Figure 4.1 summarizes the overall environmental impact statement.
Fig. 4.1: Frozen yogurt environmental impact for a delivery of 20,344,803 lb/yr to market * Solid waste amount typical of an average frozen yogurt/ice cream manufacturing facility (Knight, 2008)
Raw Materials � Inulin � Culture � Milk � Heavy cream � Vanilla � Mono- and
diglycerides � Cane sugar � Carrageenan � Corn syrup solids
Unit Process Frozen Yogurt Manufacturing
Final Product Frozen Yogurt
Emissions to Water Water polluted from cleaning sent to
water treatment plant
Emissions to Air (Utilities-electricity)
� 25,400 lb SO2 � 5,400 lb NO � 3,800,000 lb CO2
*Solid Waste � 3% of target production � 610,400 lb (plastic containers +
frozen yogurt) � Waste filtrate (sold as pig feed)
Recycle and Internal Recovery Energy and Heat Recovery
� Membrane filtrate � Ammonia � Cooling water
Material Recovery � Brine � Ammonia � Refrigerated water � Membrane filtrate
Delivered Electricity 2,984,993 kW-hr

82
5.0 Economics
5.1 Economic Analysis
The theoretical selling price of the frozen yogurt at $4.00 per container was determined
from market research, as described in the introduction. A profitability analysis of the selling
price of $4.00 per container of frozen yogurt was completed (Table C.5). Income from selling
the frozen yogurt at $4.00 per container amounts to $29.7 million per year, while operating costs
are $22.6 million per year as summarized in Table 5.1.1. At a 20% rate of return, the payback
period is 2.82 years. With a 15 year MACRS depreciation schedule, the net present value (NPV)
after thirty years is $9.91 million and the investor’s rate of return is 34.4%. A summary of this
information is shown in Table C.6.
The net present value was determined by utilizing the calculated bare equipment cost,
annual production costs, and total capital investment. The overall bare module cost for all
equipment is $7.87 million (Table C.1), and the total capital investment (TCI) comes to $22.99
million (Table C.2). The total feedstocks cost totals $12.28 million. For utilities including
electricity, cooling water, brine, sulfuric acid, sodium hydroxide, liquid water disposal, process
water, compressed air and steam, the costs sum to $170,317. The annual cost for milk, the main
raw material, is $6.9 million, as shown in Table 2.6.1. The total cost for raw materials totals
$12.11 million. Electricity usage (Table 5.1.2) is the electricity required by the pump,
compressor, filler, blowers, scraped surface heat exchanger, mixers, and homogenizers. The
total electricity usage is 3 million kWh per year for the entire process. In addition to utility and
material costs, the annual cost of production, which totaled $22.6 million (Table C.4), includes
the cost of maintenance, operations, employee wages, and benefits.

83
Table 5.1.1: Summary of annual sales Product Production Rate Selling Price Annual Sales
Frozen Yogurt 7,428,571
containers/year $4.00/container $29,714,286
Total Annual Sales $29,714,286
Table 5.1.2: Energy requirements breakdown by equipment
Equipment
Electricity Consumption
(kW) Equipment
Electricity Consumption
(kW) P-101 1.3 M-101 1.0×10⁻¹ P-102 6.8×10⁻³ M-201 9.0×10⁻² P-103 4.0×10⁻⁴ M-301 9.0×10⁻² P-104 2.0×10⁻³ R-502 5.6×10⁻³ P-201 8.0×10⁻³ R-503 9.0×10⁻² P-202 7.0×10⁻³ R-501 negligible P-301 2.0×10⁻² B-401 10.0 P-401 2.0×10⁻³ B-402 24.8 P-402 4.0×10⁻² B-403 1.5 P-501 1.3×10⁻⁴ B-301(b) 21.1
ES-301 to ES-308(a) 125.6 HG-101 74.6 *C-401 77.6 HG-201 74.6 *C-402 43.5 FL-301 1.2 *C-403 74.2
Total 530.10 * Compressors’ electricity needs were taken from Aspen simulations with process-specific inputs. All others determined by hand calculations shown in Appendix C. These values are used for annual plant operating costs. (a) From Anco-Eaglin Inc., 2008 (a) From American Cooling Tower, 2008
5.2 Economic Hazards
The profitability of this plant depends primarily on the economic hazards. In order to
compete with other large frozen yogurt manufacturers, it is imperative to provide a superior
product at a similar price to the consumer. Without high-quality advertising, consumers will not
be persuaded from the reputation of a recognized vendor such as Dreyer’s.
The demand for frozen yogurt will increase with time as the population grows and as the
importance of healthy food products increases. Since market prices fluctuate, it is important to
have enough financial backing to cover losses and maintain operation while consumption ebbs.

84
However, frozen yogurt is experiencing very strong growth and sales of dairy foods with
probiotics are increasing 20% annually (Pszcola, 2008). As is the case with many food sales,
frozen treats, such as frozen yogurt sales are influenced by the economy. Constant innovation in
the frozen desserts sector is very important, both with improving current products to developing
brand new products (PRWeb, 2008). Every company will experience weak economic periods,
but with appropriate risk management, companies are able to recover. When sales are strong, it
is important to put away money in preparation for the inevitable downfall. The market will grow
in the long run and business ventures will profit if they invest wisely.
The largest financial risk to this plant is the fact that operating costs are quite large, if
these costs rise 32% or more, the annual sales will only equal the annual operating costs. If the
plant were to produce more frozen yogurt, it is likely that sales would increase moderately faster
than the operating and capital costs. The raw materials are by far the largest part of the annual
operating cost. Future work to lower the cost of these materials would be beneficial to
Yogurina’s production.
A sensitivity analysis was performed on the process to determine which factors would
affect the process the most if they were to change. The results are shown in Table 5.2.1 and the
calculations can be found in Appendix C. The most important factors to Yogurina’s profitability
include the cost of milk and the annual sales. If the annual sales were to decrease by 25% the
NPV after 30 years would be reduced by 208%. If the cost of milk were to double the NPV
would decrease by 220% and the TCI would increase by 5%. Thus by Yogurina selling the
frozen yogurt at a relatively low price, this allows the selling price to increase as the price of
milk increases or if annual sales were to decrease.

85
Table 5.2.1: Sensitivity analysis summary
Changing Cost Change in
TCI Change in 30 Year
NPV Equipment costs increased by 25% 18.6% -53.7% Feedstocks cost increased by 25% 2.2% -97.1% Production costs increased by 25% 0.0% -179.0% Annual sales decreased by 25% -3.3% -208.0% Price of milk doubles 5.0% -220.0% Price of vanilla doubles 1.6% -70.5% Cost of electricity increases by 25% 2.9×10⁻⁴% -1.3%
In summary, it is possible for the plant to be profitable with a selling price of $4.00 per
container. Therefore, Yogurina recommends the construction of this plant to produce frozen
yogurt. From the sensitivity analysis, it is clear that decreasing sales and doubling the cost of
milk are the factors that most dramatically affect the NPV after thirty years. Another factor to
consider is the production costs for the process. If the costs were to increase significantly, it
would affect the NPV dramatically as well.
6.0 Conclusions and Recommendations
After creating and evaluating this design, Yogurina concludes that this process to produce
hard-packed frozen yogurt is economically feasible and recommends that further work to
produce this plant go forward. With a projected investor’s rate of return of 34.4% and a net
present value of $9.9 million after 30 years, the plant is expected to be profitable. The selling
price to achieve this profit is $4 per 1.75 qt container and is based on current commodity prices.
As with all commodities, however, the price of milk and the other ingredients fluctuates, and, if
needed, the selling price can be adjusted to maintain such profits.
Given the large number of unit operations involved in making Yogurina frozen yogurt,
there are several areas that room for future work and improvement. The most important
recommendation is to test making this product in a pilot plant. While Yogurina believes it has

86
developed a delicious frozen yogurt with a superior flavor and texture, pilot plant testing would
ensure that the frozen yogurt does, in fact, taste great and meet Yogurina’s quality standards.
Based on the results of these test runs, or even of bench-top tests, the recipe for the product can
be adjusted where needed. Pilot plant testing would also expose physical problems in making
the frozen yogurt. For example, as mentioned in the process rationale, section 2.8, the product is
intended to become viscous due to the inulin, carrageenan, and fermentation. For laminar flow,
viscosity is directly proportional to the power required to pump a fluid, so any sharp increases in
viscosity—such as can happen during fermentation—will result in a proportionally sharp
increase in pump power (McCabe and Smith, 2004). In this case the ingredients or fermentation
end points could be adjusted to lower viscosity or more powerful pumps could be required.
This design produces vanilla-flavored frozen yogurt specifically. However, consumers as
a whole buy many flavors, so others should be developed and produced, too. Yogurina suggests
flavors such as strawberry shortcake, chocolate chip cookie dough, and mint chocolate brownie.
The focus of this report is manufacturing the frozen yogurt and providing refrigeration
for the process. Sanitation, via cleaning in place, is an important process in ensuring a safe
product, however. Basic ideas for sanitation are mentioned in this report, but further research
into a CIP process should be done in order to better quantify the process. Also, steam for
pasteurization is currently obtained from an off-site source. The process would be less
dependent on others if a boiler were added to make the steam on-site.
As mentioned in the process rationale, there are a few areas for improvement related to
the culture. Further research can be done into keeping a maximal number of probiotic bacteria
alive by the time the frozen yogurt reaches the consumer’s intestines. Processing improvements,
such as micro-encapsulation of bacteria or two-step fermentation, have the potential to keep the

87
probiotics alive long enough to yield the intended health benefits. Also, obtaining stress-adapted
and acid-resistant culture strains from the supplier can help the bacteria survive processing and
passage through the consumer’s gut respectively (Shah, 2000). Also, if the culture strains do not
grow well when cultured together, they may need to be grown separately in the mother culture
through bulk culture stages or the equipment could be redesigned to optimize bacteria growth
based on experiment.
Other areas for improvement include reducing the amount of filtrate produced, finding a
more profitable use for the waste filtrate, increasing the efficiency of the pasteurizers, and further
optimizing the scraped-surface freezers. It may also be beneficial to do future research around
plant profitability and product quality with less or no ultrafiltration. Reducing the amount of
waste filtrate produced would then reduce the amount of milk needed as a raw material and
should therefore increase the plant’s profitability. Any improvement to reduce costs while
keeping a quality product would be beneficial.
The plant, with its many recycle streams, is already designed with the environment in
mind. An entirely self-sufficient plant in terms of energy would be ideal for environmental
friendliness. More practically, maximizing energy recycle and minimizing wasted energy would
not only benefit the environment, but would also save the plant money. In conclusion, Yogurina
has developed an economically feasible design for producing hard-packed frozen yogurt and
recommends that the plant be built.

A- 1
Appendix A – Overall Mass and Energy Balances
Tables A.1 and A.2 tabulate the inlet and outlet mass flow rates for the ingredient
streams.
Table A.1: Mass balance on ingredients entering plant
Component Flow rate
(lb/hr) Skim milk 10,946 Cream (38% fat) 180 Mono- and diglycerides 7 Carrageenan 10 Cane sugar 413 Water 234 Inulin 86 Corn syrup solids 103 Vanilla 69 Air 2 Dried culture 8.6×10⁻⁴ Total 12,050
Table A.2: Mass balance on ingredients leaving plant Component Flow rate (lb/hr)
Filtrate 8,437 Frozen yogurt 3,613 Total 12,050
The following pages detail the calculations for the flow rates in each stream and the
calculations for the density of the ingredient and product streams. Also included is a calculation
of how much lactose and calcium is expected to be in the finished product.

A- 2

A- 3

A- 4

A- 5

A- 6

A- 7

A- 8
Table A.3 presents the overall energy balance on the plant. It shows that the amount of
energy lost from the product and waste (the frozen yogurt and the waste filtrate) is equal to the
rate of energy gain in the utilities. Table A.4 through A.10 present the energy balances on the
various components. The components that circulate in a closed loop (ammonia, water, and
brine) balance out to a net energy consumption of 0 kW, or nearly 0 kW in the case of brine.
Table A.3: Overall energy balance
Product Heat duty
(kW) Energy source
Heat duty (kW)
Frozen yogurt and filtrate -88.7 Steam -26.6 Ammonia 0.0 Air 310.1 Electricity -195.34 Water 0.0 Brine 0.5 Total -88.7 Total 88.7
Table A.4: Energy input and output on frozen yogurt product and by-products
Equipment # Heat Duty
(kW) Description E-101 30.6 UF milk regenerator E-102 36.1 UF milk heater (with NH3) E-101 -30.6 UF milk regenerator E-103 -8.6 UF milk water cooler E-205 -16.2 yogurt water cooler E-206 -13.8 yogurt brine cooler E-201 55.6 ice cream mix regenerator E-202 23.9 ice cream mix heater (steam) E-201 -55.6 ice cream mix regenerator E-203 -7.2 ice cream mix water cooler E-204 -17.8 ice cream mix brine cooler ES-301-308 -192.8 initial freezing, with NH3 HT-301 -34.4 hardening, with NH3 SF-301 -5.5 storage, with NH3 E-303 147.7 filtrate cooling NH3 E-501 2.7 heating filtrate with steam, +154.2 MJ (batch) E-502 -2.7 cooling filtrate with water, -153.9 MJ (batch) -48.9 to NH3 -31.6 to brine -34.7 to water 26.6 from steam Total -88.7

A- 9
Table A.5: Energy balance on steam
Equipment # Heat Duty
(kW) Description E-202 -23.9 to ice cream mix E-501 -2.7 to filtrate, -154.2 MJ (batch) Total -26.6
Table A.6: Energy balance on ammonia
Equipment # Heat Duty
(kW) Description E-102 -36.1 UF milk heater E-303 -147.7 cooled by filtrate E-301 -11.0 cooled by air E-302 63.1 cools brine ES-301-308 192.8 freezes frozen yogurt HT-301 34.4 hardens product SF-301 5.5 storage for product E-401 -208.9 cooled by water E-402 -46.9 cooled by air E-403 -40.6 cooled by air C-401 77.6 compresses NH3 to 4 bar (using electricity) C-402 43.5 compresses NH3 to 8 bar (using electricity) C-403 74.2 compresses NH3 to 25 bar (using electricity) 48.9 from product -98.5 to air 195.3 from electricity -208.9 to water 63.1 to brine Total 0.0
Table A.7: Energy balance on air
Equipment # Heat Duty
(kW) Description E-301 11.0 cools NH3 at 25 bar E-402 46.9 cools NH3 at 8 bar E-403 40.6 cools NH3 at 4 bar CT-401 211.6 cools water via evaporation 98.5 from NH3 211.6 from water Total 310.1

A- 10
Table A.8: Energy balance on brine
Equipment # Heat Duty
(kW) Description E-104 8.6 cools water E-204 17.8 ice cream mix brine cooler E-206 13.8 yogurt brine cooler E-207 16.2 cools water E-208 7.2 cools water E-302 -63.1 cooled by NH3 32.0 from water 31.6 from product -63.1 to NH3 Total 0.5*
*The energy balance on brine does not sum to 0 kW due to rounding errors.
Table A.9: Energy balance on water
Equipment # Heat Duty
(kW) Description E-103 8.6 UF milk water cooler E-104 -8.6 cooled by brine E-203 7.2 ice cream mix water cooler E-208 -7.2 cooled by brine E-205 16.2 yogurt cooler E-207 -16.2 cooled by brine E-401 208.9 cools NH3 CT-401 -211.6 evaporation cools water E-502 2.7 cools filtrate, +153.9 MJ (batch) 34.7 from product -32 to brine 208.9 from NH3 -211.6 to air Total 0.0
Table A.10: Energy balance on electricity
Equipment # Heat Duty
(kW) Description C-401 -77.63 to NH3 C-402 -43.52 to NH3 C-403 -74.19 to NH3 Total -195.34

B- 1
Appendix B – Process Calculations
This appendix presents the detailed calculations used around each piece of equipment.
The unit operations are organized as follows:
- Ultrafiltration membrane, MB-101
- Ice cream mix pasteurization, E-201 – E-204
- Ultrafiltered milk pasteurization for making yogurt, E-101 – E-103
- Yogurt cooling, E-205 – E-206
- Summary of pasteurizers and yogurt cooling
- Brine cooling, E-104, E-207, E-208, and E-302
- Initial frozen yogurt freezing, ES-301 – ES-308
- Hardening tunnel, HT-301
- Storage freezer, SF-301
- Ammonia refrigeration loop with Aspen diagram and stream table, V-301, V-302, ES-
301-308, HT-301, SF-301, C-401 – C-403, E-102, E-301 – E-303, and E-401 – E-403
- Cooling tower, CT-401
- Bulk culture and fermentation, R-101 and R-501 – R-503
- Filtrate pasteurization for growing bulk culture, E-501 and E-502

B- 2

B- 3

B- 4

B- 5

B- 6

B- 7

B- 8

B- 9

B- 10

B- 11

B- 12

B- 13

B- 14

B- 15

B- 16

B- 17

B- 18

B- 19

B- 20
Fig. B.12: Aspen screen shot of ammonia refrigeration loop modeled in Aspen, the stream numbers do not match up to those on the stream table; the cold water pump on the left hand side is P-401
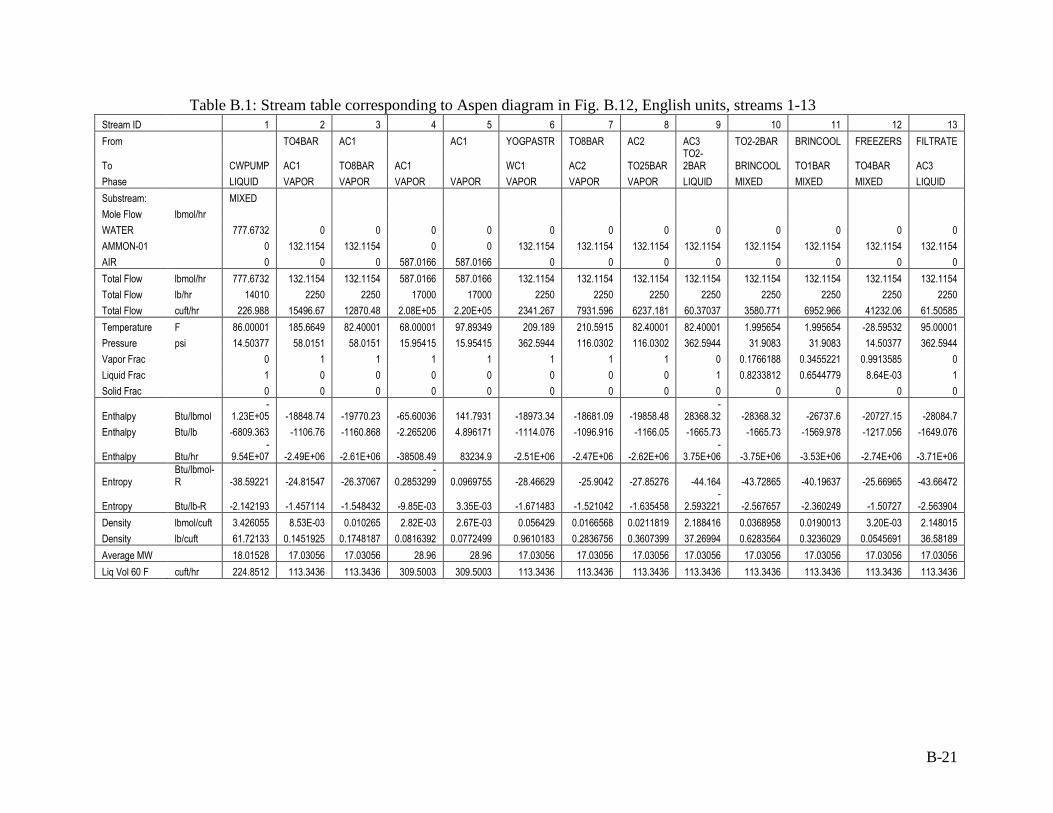
B- 21
Table B.1: Stream table corresponding to Aspen diagram in Fig. B.12, English units, streams 1-13 Stream ID 1 2 3 4 5 6 7 8 9 10 11 12 13
From TO4BAR AC1 AC1 YOGPASTR TO8BAR AC2 AC3 TO2-2BAR BRINCOOL FREEZERS FILTRATE
To CWPUMP AC1 TO8BAR AC1 WC1 AC2 TO25BAR TO2-2BAR BRINCOOL TO1BAR TO4BAR AC3
Phase LIQUID VAPOR VAPOR VAPOR VAPOR VAPOR VAPOR VAPOR LIQUID MIXED MIXED MIXED LIQUID
Substream: MIXED
Mole Flow lbmol/hr
WATER 777.6732 0 0 0 0 0 0 0 0 0 0 0 0
AMMON-01 0 132.1154 132.1154 0 0 132.1154 132.1154 132.1154 132.1154 132.1154 132.1154 132.1154 132.1154
AIR 0 0 0 587.0166 587.0166 0 0 0 0 0 0 0 0
Total Flow lbmol/hr 777.6732 132.1154 132.1154 587.0166 587.0166 132.1154 132.1154 132.1154 132.1154 132.1154 132.1154 132.1154 132.1154
Total Flow lb/hr 14010 2250 2250 17000 17000 2250 2250 2250 2250 2250 2250 2250 2250
Total Flow cuft/hr 226.988 15496.67 12870.48 2.08E+05 2.20E+05 2341.267 7931.596 6237.181 60.37037 3580.771 6952.966 41232.06 61.50585
Temperature F 86.00001 185.6649 82.40001 68.00001 97.89349 209.189 210.5915 82.40001 82.40001 1.995654 1.995654 -28.59532 95.00001
Pressure psi 14.50377 58.0151 58.0151 15.95415 15.95415 362.5944 116.0302 116.0302 362.5944 31.9083 31.9083 14.50377 362.5944
Vapor Frac 0 1 1 1 1 1 1 1 0 0.1766188 0.3455221 0.9913585 0
Liquid Frac 1 0 0 0 0 0 0 0 1 0.8233812 0.6544779 8.64E-03 1
Solid Frac 0 0 0 0 0 0 0 0 0 0 0 0 0
Enthalpy Btu/lbmol -
1.23E+05 -18848.74 -19770.23 -65.60036 141.7931 -18973.34 -18681.09 -19858.48 -
28368.32 -28368.32 -26737.6 -20727.15 -28084.7
Enthalpy Btu/lb -6809.363 -1106.76 -1160.868 -2.265206 4.896171 -1114.076 -1096.916 -1166.05 -1665.73 -1665.73 -1569.978 -1217.056 -1649.076
Enthalpy Btu/hr -
9.54E+07 -2.49E+06 -2.61E+06 -38508.49 83234.9 -2.51E+06 -2.47E+06 -2.62E+06 -
3.75E+06 -3.75E+06 -3.53E+06 -2.74E+06 -3.71E+06
Entropy Btu/lbmol-R -38.59221 -24.81547 -26.37067
-0.2853299 0.0969755 -28.46629 -25.9042 -27.85276 -44.164 -43.72865 -40.19637 -25.66965 -43.66472
Entropy Btu/lb-R -2.142193 -1.457114 -1.548432 -9.85E-03 3.35E-03 -1.671483 -1.521042 -1.635458 -
2.593221 -2.567657 -2.360249 -1.50727 -2.563904
Density lbmol/cuft 3.426055 8.53E-03 0.010265 2.82E-03 2.67E-03 0.056429 0.0166568 0.0211819 2.188416 0.0368958 0.0190013 3.20E-03 2.148015
Density lb/cuft 61.72133 0.1451925 0.1748187 0.0816392 0.0772499 0.9610183 0.2836756 0.3607399 37.26994 0.6283564 0.3236029 0.0545691 36.58189
Average MW 18.01528 17.03056 17.03056 28.96 28.96 17.03056 17.03056 17.03056 17.03056 17.03056 17.03056 17.03056 17.03056
Liq Vol 60 F cuft/hr 224.8512 113.3436 113.3436 309.5003 309.5003 113.3436 113.3436 113.3436 113.3436 113.3436 113.3436 113.3436 113.3436

B- 22
Table B.2: Stream table corresponding to Aspen diagram in Fig. B.12, English units, streams 14-28 Stream ID 14 15 16 17 18 19 20 21 22 23 27 28
From CWPUMP AC2 FILTRATE TO1BAR TO25BAR WC1 WC1 AC3
To AC2 FILTRATE FREEZERS YOGPASTR FILTRATE WC1 AC3
Phase LIQUID VAPOR VAPOR LIQUID LIQUID MIXED VAPOR MIXED LIQUID LIQUID VAPOR VAPOR
Mole Flow lbmol/hr
WATER 777.6732 0 0 473.931 473.931 0 0 0 721.6097 721.6097 0 0
AMMON-01 0 0 0 0 0 132.1154 132.1154 132.1154 0 0 0 0
AIR 0 690.6078 690.6078 0 0 0 0 0 0 0 276.2431 276.2431
Total Flow lbmol/hr 777.6732 690.6078 690.6078 473.931 473.931 132.1154 132.1154 132.1154 721.6097 721.6097 276.2431 276.2431
Total Flow lb/hr 14010 20000 20000 8538 8538 2250 2250 2250 13000 13000 8000 8000
Total Flow cuft/hr 226.9891 2.45E+05 2.60E+05 139.5607 134.9387 16351.19 2764.362 772.8939 210.6241 217.5766 97992.08 1.02E+05
Temperature F 86.00941 68.00001 100.4651 102.0906 39.20001 -28.59532 300.5836 136.9042 86.00001 143.6 68.00001 87.55287
Pressure psi 15.95415 15.95415 15.95415 15.95415 15.95415 14.50377 362.5944 362.5944 15.95415 15.95415 15.95415 15.95415
Vapor Frac 0 1 1 0 0 0.3923714 1 0.3695253 0 0 1 1
Liquid Frac 1 0 0 1 1 0.6076286 0 0.6304747 1 1 0 0
Solid Frac 0 0 0 0 0 0 0 0 0 0 0 0
Enthalpy Btu/lbmol -1.23E+05 -65.60036 159.6379 -1.22E+05 -1.23E+05 -26737.6 -18040.98 -24368.54 -1.23E+05 -1.22E+05 -65.60036 70.0442
Enthalpy Btu/lb -6809.351 -2.265206 5.512358 -6794.34 -6851.843 -1569.978 -1059.33 -1430.871 -6809.359 -6754.529 -2.265206 2.418653
Enthalpy Btu/hr -9.54E+07 -45304.11 1.10E+05 -5.80E+07 -5.85E+07 -3.53E+06 -2.38E+06 -3.22E+06 -8.85E+07 -8.78E+07 -18121.64 19349.23
Entropy Btu/lbmol-R -38.59194 -0.2853299 0.1289069 -38.10505 -40.04456 -39.61274 -27.16068 -37.44 -38.59223 -36.87471 -0.2853299 -0.0329155
Entropy Btu/lb-R -2.142178 -9.85E-03 4.45E-03 -2.115152 -2.222811 -2.32598 -1.59482 -2.198401 -2.142194 -2.046858 -9.85E-03 -1.14E-03
Density lbmol/cuft 3.426037 2.82E-03 2.66E-03 3.395878 3.512195 8.08E-03 0.0477923 0.1709361 3.426055 3.316577 2.82E-03 2.72E-03
Density lb/cuft 61.72102 0.0816392 0.0768943 61.17769 63.27318 0.1376047 0.813931 2.911137 61.72133 59.74906 0.0816392 0.0787137
Average MW 18.01528 28.96 28.96 18.01528 18.01528 17.03056 17.03056 17.03056 18.01528 18.01528 28.96 28.96
Liq Vol 60 F cuft/hr 224.8512 364.118 364.118 137.0292 137.0292 113.3436 113.3436 113.3436 208.6414 208.6414 145.6472 145.6472

B- 23
Table B.3: Stream table corresponding to Aspen diagram in Fig. B.12, metric units, streams 1-13 Stream ID 1 2 3 4 5 6 7 8 9 10 11 12 13
From TO4BAR AC1 AC1 YOGPASTR TO8BAR AC2 AC3 TO2-2BAR BRINCOOL FREEZERS FILTRATE
To CWPUMP AC1 TO8BAR AC1 WC1 AC2 TO25BAR TO2-2BAR BRINCOOL TO1BAR TO4BAR AC3
Phase LIQUID VAPOR VAPOR VAPOR VAPOR VAPOR VAPOR VAPOR LIQUID MIXED MIXED MIXED LIQUID
Substream: MIXED
Mole Flow kmol/hr
WATER 352.7466 0 0 0 0 0 0 0 0 0 0 0 0
AMMON-01 0 59.92656 59.92656 0 0 59.92656 59.92656 59.92656 59.92656 59.92656 59.92656 59.92656 59.92656
AIR 0 0 0 266.2662 266.2662 0 0 0 0 0 0 0 0
Total Flow kmol/hr 352.7466 59.92656 59.92656 266.2662 266.2662 59.92656 59.92656 59.92656 59.92656 59.92656 59.92656 59.92656 59.92656
Total Flow kg/hr 6354.829 1020.583 1020.583 7711.07 7711.07 1020.583 1020.583 1020.583 1020.583 1020.583 1020.583 1020.583 1020.583
Total Flow l/min 107.1264 7313.614 6074.188 98275.11 1.04E+05 1104.955 3743.296 2943.621 28.49164 1689.936 3281.435 19459.37 29.02753
Temperature K 303.15 358.5194 301.15 293.15 309.7575 371.5884 372.3675 301.15 301.15 256.4809 256.4809 239.4859 308.15
Pressure atm 0.9869233 3.947693 3.947693 1.085616 1.085616 24.67308 7.895387 7.895387 24.67308 2.171231 2.171231 0.9869233 24.67308
Vapor Frac 0 1 1 1 1 1 1 1 0 0.1766188 0.3455221 0.9913585 0
Liquid Frac 1 0 0 0 0 0 0 0 1 0.8233812 0.6544779 8.64E-03 1
Solid Frac 0 0 0 0 0 0 0 0 0 0 0 0 0
Enthalpy cal/mol -68151.44 -10471.52 -10983.46 -36.44464 78.77395 -10540.74 -10378.38 -11032.49 -15760.18 -15760.18 -14854.22 -11515.08 -15602.61
Enthalpy cal/gm -3782.98 -614.8666 -644.9267 -1.258448 2.720095 -618.9311 -609.3976 -647.8053 -925.4057 -925.4057 -872.21 -676.1424 -916.1536
Enthalpy cal/sec -6.68E+06 -1.74E+05 -1.83E+05 -2695.549 5826.345 -1.75E+05 -1.73E+05 -1.84E+05 -2.62E+05 -2.62E+05 -2.47E+05 -1.92E+05 -2.60E+05
Entropy cal/mol-K -38.59221 -24.81547 -26.37067 -
0.2853299 0.0969755 -28.46629 -25.9042 -27.85276 -44.164 -43.72865 -40.19637 -25.66965 -43.66472
Entropy cal/gm-K -2.142193 -1.457114 -1.548432 -9.85E-03 3.35E-03 -1.671483 -1.521042 -1.635458 -2.593221 -2.567657 -2.360249 -1.50727 -2.563904
Density mol/cc 0.0548801 1.37E-04 1.64E-04 4.52E-05 4.27E-05 9.04E-04 2.67E-04 3.39E-04 0.035055 5.91E-04 3.04E-04 5.13E-05 0.0344078
Density gm/cc 0.9886809 2.33E-03 2.80E-03 1.31E-03 1.24E-03 0.015394 4.54E-03 5.78E-03 0.5970072 0.0100653 5.18E-03 8.74E-04 0.5859857
Average MW 18.01528 17.03056 17.03056 28.96 28.96 17.03056 17.03056 17.03056 17.03056 17.03056 17.03056 17.03056 17.03056
Liq Vol 60F l/min 106.1179 53.49224 53.49224 146.0679 146.0679 53.49224 53.49224 53.49224 53.49224 53.49224 53.49224 53.49224 53.49224

B- 24
Table B.4: Stream table corresponding to Aspen diagram in Fig. B.12, metric units, streams 14-28 Stream ID 14 15 16 17 18 19 20 21 22 23 27 28
From CWPUMP AC2 FILTRATE TO1BAR TO25BAR WC1 WC1 AC3
To AC2 FILTRATE FREEZERS YOGPASTR FILTRATE WC1 AC3
Phase LIQUID VAPOR VAPOR LIQUID LIQUID MIXED VAPOR MIXED LIQUID LIQUID VAPOR VAPOR
Substream:
Mole Flow kmol/hr
WATER 352.7466 0 0 214.9715 214.9715 0 0 0 327.3166 327.3166 0 0
AMMON-01 0 0 0 0 0 59.92656 59.92656 59.92656 0 0 0 0
AIR 0 313.2544 313.2544 0 0 0 0 0 0 0 125.3018 125.3018
Total Flow kmol/hr 352.7466 313.2544 313.2544 214.9715 214.9715 59.92656 59.92656 59.92656 327.3166 327.3166 125.3018 125.3018
Total Flow kg/hr 6354.829 9071.848 9071.848 3872.772 3872.772 1020.583 1020.583 1020.583 5896.701 5896.701 3628.739 3628.739
Total Flow l/min 107.1269 1.16E+05 1.23E+05 65.86531 63.68397 7716.901 1304.634 364.7653 99.40351 102.6847 46247.11 47965.97
Temperature K 303.1552 293.15 311.1862 312.0892 277.15 239.4859 422.3631 331.4301 303.15 335.15 293.15 304.0127
Pressure atm 1.085616 1.085616 1.085616 1.085616 1.085616 0.9869233 24.67308 24.67308 1.085616 1.085616 1.085616 1.085616
Vapor Frac 0 1 1 0 0 0.3923714 1 0.3695253 0 0 1 1
Liquid Frac 1 0 0 1 1 0.6076286 0 0.6304747 1 1 0 0
Solid Frac 0 0 0 0 0 0 0 0 0 0 0 0
Enthalpy cal/mol -68151.32 -36.44464 88.68771 -68001.08 -68576.6 -14854.22 -10022.77 -13538.08 -68151.4 -67602.64 -36.44464 38.91345
Enthalpy cal/gm -3782.973 -1.258448 3.062421 -3774.633 -3806.58 -872.21 -588.5167 -794.9285 -3782.978 -3752.517 -1.258448 1.343696
Enthalpy cal/sec -6.68E+06 -3171.234 7717.171 -4.06E+06 -4.10E+06 -2.47E+05 -1.67E+05 -2.25E+05 -6.20E+06 -6.15E+06 -1268.494 1354.423
Entropy cal/mol-K -38.59194 -0.2853299 0.1289069 -38.10505 -40.04456 -39.61274 -27.16068 -37.44 -38.59223 -36.87471 -0.2853299 -0.0329155
Entropy cal/gm-K -2.142178 -9.85E-03 4.45E-03 -2.115152 -2.222811 -2.32598 -1.59482 -2.198401 -2.142194 -2.046858 -9.85E-03 -1.14E-03
Density mol/cc 0.0548798 4.52E-05 4.25E-05 0.0543967 0.0562599 1.29E-04 7.66E-04 2.74E-03 0.0548801 0.0531264 4.52E-05 4.35E-05
Density gm/cc 0.9886759 1.31E-03 1.23E-03 0.9799726 1.013539 2.20E-03 0.0130379 0.0466319 0.9886809 0.9570882 1.31E-03 1.26E-03
Average MW 18.01528 28.96 28.96 18.01528 18.01528 17.03056 17.03056 17.03056 18.01528 18.01528 28.96 28.96
Liq Vol 60F l/min 106.1179 171.8446 171.8446 64.67059 64.67059 53.49224 53.49224 53.49224 98.46775 98.46775 68.73783 68.73783

B- 25

B- 26

B- 27

B- 28

C- 1
Appendix C – Economic Calculations
The purchase costs for compressors (Table C.1) were calculated with equation 16.35
(Seider, et al., 2005)
BMDp CFFC =
and the base cost equation for centrifugal compressor equation 16.36 (Seider, et al., 2005).
( )[ ]{ }CB PC ln80.02223.7exp +=
where PC is power consumption in horsepower which was calculated in Aspen, FD is the driver
factor, and FM is the material factor. Since the compressors are driven by steam turbine motors
in this design the driver factor is 1.15. The material factor is determined from Table 16.21 in
Seider, et al. (2005). The material factor for stainless steel is 2.0.
For heat exchangers the f.o.b. purchase cost (Table C.1) and base costs depend on the
heater type used. In this design, five types of heat exchangers, shell and tube fixed head, double
pipe, scraped surface, plate and frame, and air cooled fin fan are used. The base cost equations
and purchase costs, respectively, for shell and tube fixed head and double pipe are 16.40, 16.43,
16.46, and 16.47 (Seider, et al., 2005).
}A]).09861(ln[0ln[A]9228.05exp{11.054C 2B +−=
BLMPP CFFFC =
0.16ln[A]}exp{7.1248CB +=
BMPP CFFC =
where A is the area of the heat exchanger in square feet, and the type of heat exchanger selected
is based on this area. FL is the tube length correction and was considered to be 1.00, where the
tube length is 20 feet. The pressure factor was also considered to be 1.0 as many of the pressures
in the process are atmospheric pressure. Material factors from equation 16.44 and Table 16.25

C- 2
for fixed head heat exchangers also from Seider, et al. (2005). Stainless steel was chosen for the
material to determine a and b.
b
M
AaF
+=100
Air cooled fin fan heat exchangers, plate and frame heat exchangers, and scraped surface
heat exchangers were all costed using Table 16.32 of Seider, et al. (2005)
0.4B [A]970,1C =
0.42B [A]000,7C =
0.67B [L]400,11C =
where L is assumed to be 10 feet for the scraped surface heat exchangers.
External gear pumps purchase cost (Table C.1) calculated from equations 16.15 and
16.20 for pump and its motor,
BM CFCP =
BTp CFC =
for the pump the size factor was calculated from 16.13,
( ) 5.0HQS =
cost base equation for the motor from 16.19,
})][ln(0035549.0)][ln(028628.0
)][ln(053255.0)][ln(13141.04866.5exp{43
2
CC
CCB
PP
PPC
−+
++=

C- 3
material factor from Table 16.15 and for motor the power consumption was calculated from
equation 16.16
MP
Cη33,000η
QHρP =
where:
2(ln[Q])01199.0[Q]ln24015.0316.0 −+−=Pη
2BB ])(ln[P00182.0][Pln0319.080.0 −+=Mη
where Q is the flow rate through the pump in gallons per minute, H is the pump head, ρ is the
density in pounds per gallon, ηp is the fractional efficiency, ηM is the fractional efficiency of the
electric motor. Pump head is the pressure rise over the liquid density
The motor-type factor was chosen to be FT=0.90 from Table 16.22 in Seider, et al., and
the power was assumed PB=1Hp (assumed as the minimum) (2005). The base cost for the actual
pump from equation 16.21.
}Q])0.0291(ln[ln[Q]19861.0exp{7.2744C 2B ++=
The jacketed tank was costed using Table 16.32 of Seider, et al., as well for an open
storage tank (2005). Its insulation was priced using a vendor quote.
0.72B [V]14C =
The purchase cost for mixers was determined using Table 16.32 of Seider, et al., for a
closed vessel agitator and a cone roof storage tank (2005).
0.17B [S]600,2C =
0.51B [V]210C =

C- 4
where S is the motor horsepower for the agitator, S=0.5 Hp per 1,000 gallons of liquid page 557
of Seider, et al. (2005).
The purchase cost of blowers was determined by using Eqn. 16.30 for the brake
horsepower, PB
1])P
P)[(
η
PQ)(
1k
k0.00436(P k
1k
1
0
B
11B −
−=
−
where Q1 is the inlet flow rate in cubic feet per minute, P1 is the inlet pressure in pounds per
square inch, P0 is the outlet pressure in pounds per square inch, k is the specific heat ratio which
is dimensionless and 1.4 for air.
The brake horsepower was then used to calculate the purchase cost of the blowers.
]}ln[P7900.0exp{6.6547C BB +=
The cost of the membrane included the cartridge for the membrane as well as the actual
membrane. The membrane cost was quoted by a vendor and the cartridge cost was determined
by using Table 16.32 of Seider, et al. (2005)
14ACB =
where A is area of membrane in square feet.
To cost the silos for the cream and milk, they were considered to be cone roof storage
tanks from Table 16.32 of Seider, et al. (2005).
0.51B 210[V]C =
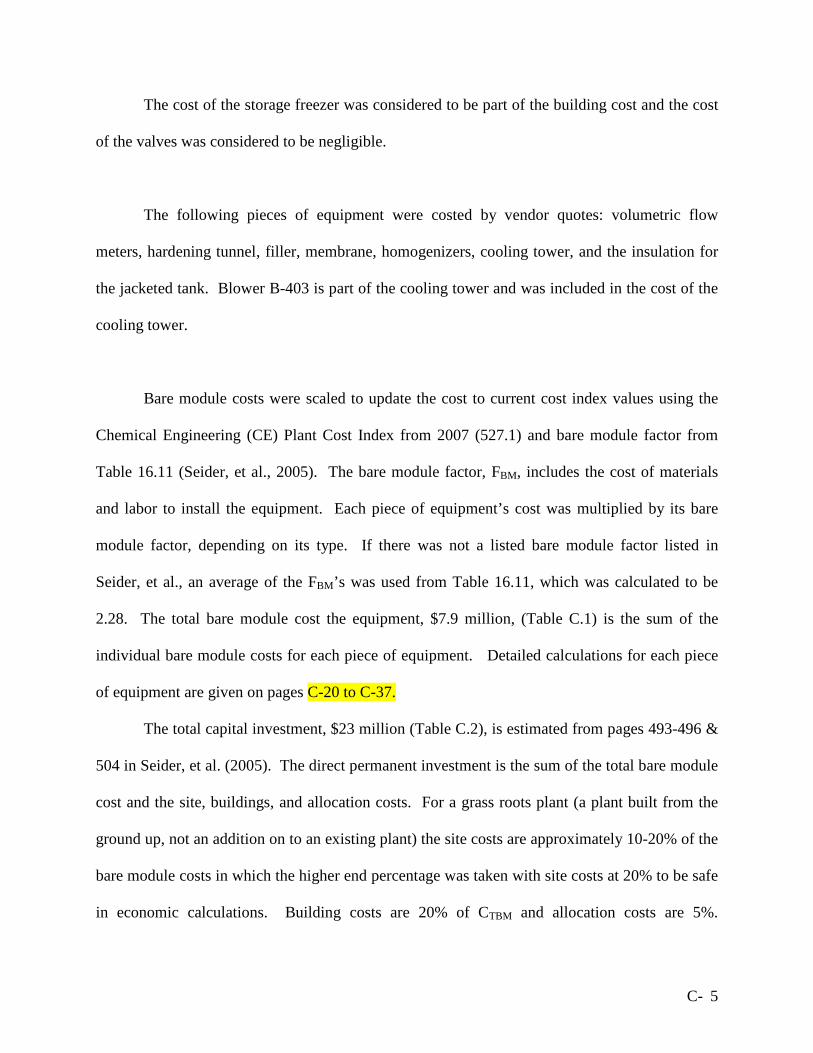
C- 5
The cost of the storage freezer was considered to be part of the building cost and the cost
of the valves was considered to be negligible.
The following pieces of equipment were costed by vendor quotes: volumetric flow
meters, hardening tunnel, filler, membrane, homogenizers, cooling tower, and the insulation for
the jacketed tank. Blower B-403 is part of the cooling tower and was included in the cost of the
cooling tower.
Bare module costs were scaled to update the cost to current cost index values using the
Chemical Engineering (CE) Plant Cost Index from 2007 (527.1) and bare module factor from
Table 16.11 (Seider, et al., 2005). The bare module factor, FBM, includes the cost of materials
and labor to install the equipment. Each piece of equipment’s cost was multiplied by its bare
module factor, depending on its type. If there was not a listed bare module factor listed in
Seider, et al., an average of the FBM’s was used from Table 16.11, which was calculated to be
2.28. The total bare module cost the equipment, $7.9 million, (Table C.1) is the sum of the
individual bare module costs for each piece of equipment. Detailed calculations for each piece
of equipment are given on pages C-20 to C-37.
The total capital investment, $23 million (Table C.2), is estimated from pages 493-496 &
504 in Seider, et al. (2005). The direct permanent investment is the sum of the total bare module
cost and the site, buildings, and allocation costs. For a grass roots plant (a plant built from the
ground up, not an addition on to an existing plant) the site costs are approximately 10-20% of the
bare module costs in which the higher end percentage was taken with site costs at 20% to be safe
in economic calculations. Building costs are 20% of CTBM and allocation costs are 5%.

C- 6
Contingencies need to be included as well, which can be between 10-40% of the direct
permanent investment depending on how well the process is known and contractors’ fees which
are approximately 3%. The contingencies will be estimated to be 15% plus 3% for contractor
fees, since frozen yogurt production is a relatively well-known process. The sum of the direct
permanent investment and the contingencies and contractor fees make up the total depreciable
investment (TDC). The other costs involved in the total permanent investment (TCI), include
land, royalties, and startup, and do not typically depreciate and thus are calculated separately
from the depreciable investment. Land, royalties, and startup costs were calculated as
percentages of the total depreciable investment, 2%, 2%, and 10% respectively. Total permanent
investment is also dependent upon the location of the plant. For Pennsylvania (the Northeast),
the proposed locale of the plant, the correction factor for investment site location is 1.10 from
Table 16.13 (Seider, et al., 2005). To attain the final total capital investment the working capital
is added to the corrected total permanent investment.
The total feedstocks cost for the process which includes the utilities and raw materials are
shown in Table C.3. Raw materials include any ingredient in the frozen yogurt making process.
Utilities are any materials used to operate or maintain the process. Process water and
compressed air are listed in both tables. Process water is used as a main ingredient as it is mixed
into M-101 as an ingredient and it is used during cleaning in place after acid and base rinses.
The compressed air is injected into the frozen yogurt as an ingredient and it is also used to
operate the filler pneumatically.
Table C.4 shows the total annual productions costs for the frozen yogurt making facility.
Table C.4 is put together using Seider, et al., pages 563-581 (2005). The total annual production

C- 7
costs take into account operations, maintenance, overhead, taxes and insurance, and other
miscellaneous costs.
The cash flow sheet for 30 years is shown in Table C.5. The investments in the cash flow
sheet are the working capital and total depreciable capital (both previously calculated in Table
C.2). These values coupled with annual sales, annual costs, and annual depreciation make up the
net cash flow. The tax rate used in the cash flow sheet is 37%. Sales in the cash flow sheet were
calculated in the following manner. Annually, 7.4 million containers of frozen yogurt are
produced and sold for $4.00 per container. Multiplying the annual production of the frozen
yogurt by its market prices yields the annual sales for this process.
A summary of the NPV and payback period for the thirty year outlook is presented in
Table C.6. Tables C.7 and C.8 show the thirty year outlook when the price of milk and vanilla,
respectively, are doubled for the manufacture of frozen yogurt. These two ingredients were part
of the economic analysis. Finally, C.9 shows how the IRR (DCFRR, discounted cash flow rate
of return) of 34.4% is calculated.

C- 8
Table C.1: Bare module equipment cost for Yogurina’s frozen yogurt making process Equipment # Cp Total Cp Fm Fbm Cbm Yearly Cost
Volumetric Flow meter ST-101 1 $1,544 $1,544 1 2.28 $3,520 N/A Volumetric Flow meter ST-102 1 $1,544 $1,544 1 2.28 $3,520 N/A
Milk Silo Storage SL-101 1 $33,595 $33,595 2.00 2.28 $204,945 N/A Cream Silo Storage SL-102 1 $4,119 $4,119 2.00 2.28 $25,128 N/A
Reactor R-501-flask 1 Negligible Negligible negligible N/A Reactor R-502-CSTR 1 $1,963 $1,963 2.00 4.3 $22,590 N/A Reactor R-503-CSTR 1 $5,286 $5,286 2.00 4.3 $60,820 N/A Membrane MB-101 1 $29,332 $29,332 2.00 3.2 $29,332 $2,685
Final Reactor/Mixer-R-101 1 $4,810 $4,810 2.00 4.3 $55,341 N/A Mixer M-101 1 $5,486 $5,486 2.00 2.28 $33,467 N/A Mixer M-201 1 $5,285 $5,285 2.00 2.28 $32,242 N/A Mixer M-301 1 $5,285 $5,285 2.00 2.28 $32,242 N/A
Homogenizer HG-101 1 $300,000 $300,000 1.00 2.28 $684,000 N/A Homogenizer HG-201 1 $300,000 $300,000 1.00 2.28 $684,000 N/A
Plate and Frame Heat Exchanger E-201 to E-204 4 $36,827 $36,827 1.00 3.3 $162,584 N/A
Plate and Frame Heat Exchanger E-101 to E-103 3 $23,008 $23,008 1.00 3.3 $101,577 N/A
Plate and Frame Heat Exchanger E-501 to E-502 2 $37,473 $37,473 1.00 3.3 $165,436 N/A
Plate and Frame Heat Exchanger E-205 1 $25,244 $25,244 1.00 3.17 $111,447 N/A Plate and Frame Heat Exchanger E-206 1 $21,333 $21,333 1.125 3.17 $94,182 N/A Shell and Tube Heat Exchanger E-401 1 $16,193 $16,193 2.721 3.17 $186,858 N/A Double Pipe Heat Exchanger E-208 1 $1,656 $1,656 2.500 3.17 $17,557 N/A Double Pipe Heat Exchanger E-104 1 $1,542 $1,542 2.500 3.17 $16,349 N/A Double Pipe Heat Exchanger E-207 1 $1,869 $1,869 2.500 3.17 $19,816 N/A
Shell and Tube Heat Exchanger E-302 1 $7,659 $7,659 2.721 3.17 $88,381 N/A Shell and Tube Heat Exchanger E-303 1 $7,942 $7,942 2.721 3.17 $91,646 N/A
Air Cooled Fin Fan Heat Exchanger E-402 1 $26,593 $26,593 2.000 2.17 $154,402 N/A Air Cooled Fin Fan Heat Exchanger E-403 1 $26,073 $26,073 2.000 2.17 $151,383 N/A Air Cooled Fin Fan Heat Exchanger E-301 1 $20,637 $20,637 2.000 2.17 $119,821 N/A
External Gear Pump P-101A/B 2 $3,739 $3,739 2.00 3.3 $32,229 N/A External Gear Pump P-102A/B 2 $2,285 $2,285 2.00 3.3 $20,765 N/A External Gear Pump P-103AB 2 $1,215 $1,215 2.00 3.3 $11,056 N/A

C- 9
External Gear Pump P-104A/B 2 $1,128 $1,128 2.00 3.3 $10,258 N/A External Gear Pump P-201A/B 2 $2,435 $2,435 2.00 3.3 $22,110 N/A External Gear Pump P-202A/B 2 $2,331 $2,331 2.00 3.3 $21,173 N/A External Gear Pump P-301A/B 2 $3,393 $3,393 2.00 3.3 $30,560 N/A External Gear Pump P-401A/B 2 $1,586 $1,586 2.00 3.3 $14,427 N/A External Gear Pump P-402A/B 2 $4,038 $4,038 2.00 3.3 $36,253 N/A External Gear Pump P-501A/B 2 $1,060 $1,060 2.00 3.3 $9,639 N/A
Filler FL-301 1 $42,000 $42,000 1.00 2.28 $95,760 N/A Scraped Surface Heat Exchanger ES-301 to
ES-308 8 $53,322 $426,576 1.00 2.06 $1,175,602 N/A Hardening Tunnel HT-301 1 $770,000 $770,000 1.00 2.28 $1,755,600 N/A
Storage Freezer SF-301 1
assumed to be included in cost of building
assumed to be included in
cost of building 2.00 1.00 $0 N/A
Jacketed Tank JT-201 1 $3,477 $3,477 2.00 2.28 $21,211 N/A Cooling Tower CT-401, B-403 (one unit) 1 $4,872 $4,872 1.00 2.28 $11,108 N/A
Blower B-401 1 $6,054 $6,054 2.50 2.28 $46,165 N/A Blower B-402 1 $12,368 $12,368 2.50 2.28 $94,313 N/A Blower B-301 1 $10,880 $10,880 2.50 2.28 $82,966 N/A
Compressor C-401 1 $56,307 $56,307 1.15 4.3 $372,499 N/A Compressor C-402 1 $35,445 $35,445 1.15 4.3 $234,488 N/A Compressor C-403 1 $54,308 $54,308 1.15 4.3 $359,275 N/A
Insulation for jacketed tank 1 $3,200 $3,200 1.00 1 $3,200 N/A
Blower, B-403 1
included in cost of cooling Tower
included in cost of cooling tower 1.00 2.28 $0 N/A
Total $7,866,224

C- 10
Table C.2: Total capital investment Total Bare Module Cost for onsite equipment $7,866,224 Total Bare Module Cost for Spare $209,610 Total bare module investment, TBM $8,075,834 Cost of site preparation $1,615,167 Cost of service facilities $1,615,167 Allocated cost for utility plants and related facilities $403,792 Total Direct Permanent Investment DPI $11,709,959 Contingencies and contractor's fee $2,107,793 Total Depreciable Capital, TDC $13,817,752 Cost of Land $276,355 Cost of Royalties $276,355 Cost of Plant Startup $1,381,775 Total Permanent Investment $15,752,237 Adjusted Total Permanent Investment $17,327,461 Working Capital $5,663,043 Total Capital Investment $22,990,504
Table C.3: Total feedstocks costs
Feedstocks Unit Cost Utilities Steam $/yr $1,768 Electricity $/yr $159,331 Cooling Water (CW) $/yr $35 Process Water $/yr $30 Ammonia $/yr $135 Brine $/yr $29 Liquid Water Disposal $/yr $299 Sodium Hydroxide $/yr $6,010 Sulfuric Acid $/yr $2,380 Compressed Air $/yr $300
Raw Materials Inulin $/yr $217,920 Concentrated Freeze Dried Culture $/yr $13 Milk $/yr $6,927,990 Heavy Cream $/yr $574,396 Vanilla $/yr $2,230,155 Mono- and Diglycerides $/yr $5,913 Cane Sugar $/yr $558,145 Carrageenan $/yr $309,705 Corn Syrup Solids $/yr $550,993 Compressed Air $/yr $6,732 Ice Cream Containers $/yr $728,000 Process Water $/yr negligible cost Total Feedstocks Cost $/yr $12,280,278

C- 11
Table C.4: Annual expenses Annual Cost Factor (excluding depreciation) Factor Unit
Annual Amount Unit Cost
Feedstocks (raw materials) $12,280,278 $/yr $12,280,278 Operations Direct Wages & Benefits (DW&B) $53.51 $/operator hr $40,000 operator hour/yr $2,140,508 Direct Salaries & Benefits 15% % of DW&B $2,140,508 $/yr $321,076 Operating Supplies and Services 6% %of DW&B $2,140,508 $/yr $128,430 Technical Assistance to Manufacturing $69,567 $/operator shift-yr $5 operators shift $347,832 Control Laboratory $76,256 $/operator shift-yr $5 operators shift $381,278 Maintenance Solid-Fluid Handling Process 4.50% % of Ctdc $13,817,752 $/yr $621,799 Salaries and Benefits 25% % of MW&B $621,799 $/yr $155,450 Materials and Services 100% % of MW&B $621,799 $/yr $621,799 Maintenance Overhead 5% % of MW&B $621,799 $/yr $31,090 Operating Overhead General Plant Overhead 7.10% % of M&O-SW&B $3,238,832 $/yr $229,957 Mechanical department Overhead 2.40% % of M&O-SW&B $3,238,832 $/yr $77,732 Employee relations department 5.90% % of M&O-SW&B $3,238,832 $/yr $191,091 Business Services 7.40% % of M&O-SW&B $3,238,832 $/yr $239,674 Property taxes and Insurance 2% % of Ctdc $13,817,752 $/yr $276,355 Depreciation Direct plant 8% % of (Ctdc-1.18Calloc) $/yr $1,067,302 Allocated plant 6% % of 1.18Calloc $403,792 $/yr $28,588 Annual COST OF MANUFACTURE (COM) $19,140,239 General Expenses Selling Expense 3% % of sales $29,714,286 $/yr $891,429 Direct Research 4.80% % of sales $29,714,286 $/yr $1,426,286 Allocated Research 0.50% % of sales $29,714,286 $/yr $148,571 Administrative expense 2% % of sales $29,714,286 $/yr $594,286 Management Incentive Compensation 1.25% % of sales $29,714,286 $/yr $371,429 Annual TOTAL GENERAL EXPENSES (GE) $3,432,000 Annual TOTAL PRODUCTION COST (excluding depreciation) $22,572,239
MW&B: Maintenance, wages, and benefits; M&O: Maintenance and overhead; SW&B: Salaries, wages, and benefits; Ctdc: Total depreciable capital; Calloc: Cost of allocation

C- 12
Table C.5: Thirty year cash flow analysis for frozen yogurt manufacturing at a selling price of $4.00/container Investment Cash Cum PV @ 20%
Year fCTDC CWC Depreciation(a) C excl Dep Sales Net Earnings Flow 0.2 1 -$13,817,752 -$5,663,043 -$19,480,795 -$13,817,752 2 $690,888 $22,572,239 $29,714,286 $3,672,497 $4,363,384 -$10,181,598 3 $1,312,686 $22,572,239 $29,714,286 $3,672,497 $4,985,183 -$6,719,685 4 $1,181,418 $22,572,239 $29,714,286 $3,755,196 $4,936,614 -$3,862,828 5 $1,063,967 $22,572,239 $29,714,286 $3,829,190 $4,893,157 -$1,503,088 6 $957,570 $22,572,239 $29,714,286 $3,896,220 $4,853,790 $447,541 7 $860,846 $22,572,239 $29,714,286 $3,957,156 $4,818,002 $2,061,081 8 $815,247 $22,572,239 $29,714,286 $3,985,884 $4,801,131 $3,400,988 9 $815,247 $22,572,239 $29,714,286 $3,985,884 $4,801,131 $4,517,578 10 $816,629 $22,572,239 $29,714,286 $3,985,013 $4,801,642 $5,448,168 11 $815,247 $22,572,239 $29,714,286 $3,985,884 $4,801,131 $6,223,577 12 $816,629 $22,572,239 $29,714,286 $3,985,013 $4,801,642 $6,869,821 13 $816,629 $22,572,239 $29,714,286 $3,985,013 $4,801,642 $7,408,357 14 $815,247 $22,572,239 $29,714,286 $3,985,884 $4,801,131 $7,857,089 15 $816,629 $22,572,239 $29,714,286 $3,985,013 $4,801,642 $8,231,073 16 $407,624 $22,572,239 $29,714,286 $4,242,686 $4,650,310 $8,532,903 17 $22,572,239 $29,714,286 $4,499,489 $4,499,489 $8,776,271 18 $22,572,239 $29,714,286 $4,499,489 $4,499,489 $8,979,078 19 $22,572,239 $29,714,286 $4,499,489 $4,499,489 $9,148,083 20 $22,572,239 $29,714,286 $4,499,489 $4,499,489 $9,288,921 21 $22,572,239 $29,714,286 $4,499,489 $4,499,489 $9,406,286 22 $22,572,239 $29,714,286 $4,499,489 $4,499,489 $9,504,090 23 $22,572,239 $29,714,286 $4,499,489 $4,499,489 $9,585,594 24 $22,572,239 $29,714,286 $4,499,489 $4,499,489 $9,653,513 25 $22,572,239 $29,714,286 $4,499,489 $4,499,489 $9,710,113 26 $22,572,239 $29,714,286 $4,499,489 $4,499,489 $9,757,279 27 $22,572,239 $29,714,286 $4,499,489 $4,499,489 $9,796,584 28 $22,572,239 $29,714,286 $4,499,489 $4,499,489 $9,829,339 29 $22,572,239 $29,714,286 $4,499,489 $4,499,489 $9,856,634 30 $5,664,125 $22,572,239 $29,714,286 $4,499,489 $10,162,533 $9,908,008
(a) Based on a fifteen year class-life MACRS Tax-Basis depreciation schedule Legend: fCTDC: fraction of total depreciable capital CWC: working capital Cexcluding Dep.: costs excluding depreciation Cum. PV at 20%: cumulative present value with an interest rate of 20%

C- 13
Table C.6: Payback period and NPV summary Payback Period 2.82 NPV after 30 years $9,908,008 IRR (DCFRR) 34.40%

C- 14
Table C.7: Thirty year cash flow analysis for frozen yogurt manufacturing at a selling price of $4.00/container doubling the milk price Investment Cash Cum PV @ 20%
Year fCTDC CWC Depreciation C excl Dep Sales Net Earnings Flow 0.20 1 -$13,817,752 -$6,817,246 -$20,634,998 -$13,817,752 2 $690,888 $29,500,229 $29,714,286 -$692,137 -$1,249 -$13,818,793 3 $1,312,686 $29,500,229 $29,714,286 -$692,137 $620,550 -$13,387,855 4 $1,181,418 $29,500,229 $29,714,286 -$609,438 $571,980 -$13,056,848 5 $1,063,967 $29,500,229 $29,714,286 -$535,443 $528,523 -$12,801,966 6 $957,570 $29,500,229 $29,714,286 -$468,414 $489,157 -$12,605,385 7 $860,846 $29,500,229 $29,714,286 -$407,477 $453,369 -$12,453,553 8 $815,247 $29,500,229 $29,714,286 -$378,750 $436,497 -$12,331,735 9 $815,247 $29,500,229 $29,714,286 -$378,750 $436,497 -$12,230,219
10 $816,629 $29,500,229 $29,714,286 -$379,621 $437,008 -$12,145,524 11 $815,247 $29,500,229 $29,714,286 -$378,750 $436,497 -$12,075,027 12 $816,629 $29,500,229 $29,714,286 -$379,621 $437,008 -$12,016,211 13 $816,629 $29,500,229 $29,714,286 -$379,621 $437,008 -$11,967,198 14 $815,247 $29,500,229 $29,714,286 -$378,750 $436,497 -$11,926,401 15 $816,629 $29,500,229 $29,714,286 -$379,621 $437,008 -$11,892,364 16 $407,624 $29,500,229 $29,714,286 -$121,947 $285,676 -$11,873,822 17 $29,500,229 $29,714,286 $134,856 $134,856 -$11,866,528 18 $29,500,229 $29,714,286 $134,856 $134,856 -$11,860,450 19 $29,500,229 $29,714,286 $134,856 $134,856 -$11,855,384 20 $29,500,229 $29,714,286 $134,856 $134,856 -$11,851,163 21 $29,500,229 $29,714,286 $134,856 $134,856 -$11,847,646 22 $29,500,229 $29,714,286 $134,856 $134,856 -$11,844,714 23 $29,500,229 $29,714,286 $134,856 $134,856 -$11,842,272 24 $29,500,229 $29,714,286 $134,856 $134,856 -$11,840,236 25 $29,500,229 $29,714,286 $134,856 $134,856 -$11,838,540 26 $29,500,229 $29,714,286 $134,856 $134,856 -$11,837,126 27 $29,500,229 $29,714,286 $134,856 $134,856 -$11,835,948 28 $29,500,229 $29,714,286 $134,856 $134,856 -$11,834,966 29 $29,500,229 $29,714,286 $134,856 $134,856 -$11,834,148 30 $6,817,246 $29,500,229 $29,714,286 $134,856 $6,952,102 -$11,799,004

C- 15
Table C.8: Thirty year cash flow analysis for frozen yogurt manufacturing selling at $4.00/container doubling the vanilla price Investment Cash Cum PV @ 20% Year fCTDC CWC Depreciation C excl Dep Sales Net Earnings Flow 0.20
1 -$13,817,752 -$6,034,587 -$19,852,339 -$13,817,752 2 $690,888 $24,802,394 $29,714,286 $2,267,499 $2,958,387 -$11,352,429 3 $1,312,686 $24,802,394 $29,714,286 $2,267,499 $3,580,186 -$8,866,189 4 $1,181,418 $24,802,394 $29,714,286 $2,350,199 $3,531,616 -$6,822,430 5 $1,063,967 $24,802,394 $29,714,286 $2,424,193 $3,488,159 -$5,140,254 6 $957,570 $24,802,394 $29,714,286 $2,491,222 $3,448,793 -$3,754,262 7 $860,846 $24,802,394 $29,714,286 $2,552,159 $3,413,005 -$2,611,253 8 $815,247 $24,802,394 $29,714,286 $2,580,886 $3,396,133 -$1,663,455 9 $815,247 $24,802,394 $29,714,286 $2,580,886 $3,396,133 -$873,623
10 $816,629 $24,802,394 $29,714,286 $2,580,015 $3,396,644 -$215,330 11 $815,247 $24,802,394 $29,714,286 $2,580,886 $3,396,133 $333,164 12 $816,629 $24,802,394 $29,714,286 $2,580,015 $3,396,644 $790,312 13 $816,629 $24,802,394 $29,714,286 $2,580,015 $3,396,644 $1,171,268 14 $815,247 $24,802,394 $29,714,286 $2,580,886 $3,396,133 $1,488,684 15 $816,629 $24,802,394 $29,714,286 $2,580,015 $3,396,644 $1,753,237 16 $407,624 $24,802,394 $29,714,286 $2,837,689 $3,245,312 $1,963,875 17 $24,802,394 $29,714,286 $3,094,492 $3,094,492 $2,131,250 18 $24,802,394 $29,714,286 $3,094,492 $3,094,492 $2,270,728 19 $24,802,394 $29,714,286 $3,094,492 $3,094,492 $2,386,961 20 $24,802,394 $29,714,286 $3,094,492 $3,094,492 $2,483,821 21 $24,802,394 $29,714,286 $3,094,492 $3,094,492 $2,564,538 22 $24,802,394 $29,714,286 $3,094,492 $3,094,492 $2,631,802 23 $24,802,394 $29,714,286 $3,094,492 $3,094,492 $2,687,855 24 $24,802,394 $29,714,286 $3,094,492 $3,094,492 $2,734,567 25 $24,802,394 $29,714,286 $3,094,492 $3,094,492 $2,773,493 26 $24,802,394 $29,714,286 $3,094,492 $3,094,492 $2,805,931 27 $24,802,394 $29,714,286 $3,094,492 $3,094,492 $2,832,963 28 $24,802,394 $29,714,286 $3,094,492 $3,094,492 $2,855,489 29 $24,802,394 $29,714,286 $3,094,492 $3,094,492 $2,874,262 30 $6,034,587 $24,802,394 $29,714,286 $3,094,492 $9,129,079 $2,920,411

C- 16
Table C.9: Investor’s rate of return thirty year outlook
Investment Cash Cum PV @ DCFRR%
Year fCTDC CWC Depreciation C excl Dep Sales Net Earnings Flow IRR: 0.344 1 -$13,817,752 -$5,663,043 -$19,480,795 -$13,817,752 2 $690,888 $22,572,239 $29,714,286 $3,672,497 $4,363,384 -$10,571,221 3 $1,312,686 $22,572,239 $29,714,286 $3,672,497 $4,985,183 -$7,811,448 4 $1,181,418 $22,572,239 $29,714,286 $3,755,196 $4,936,614 -$5,778,074 5 $1,063,967 $22,572,239 $29,714,286 $3,829,190 $4,893,157 -$4,278,481 6 $957,570 $22,572,239 $29,714,286 $3,896,220 $4,853,790 -$3,171,701 7 $860,846 $22,572,239 $29,714,286 $3,957,156 $4,818,002 -$2,354,284 8 $815,247 $22,572,239 $29,714,286 $3,985,884 $4,801,131 -$1,748,223 9 $815,247 $22,572,239 $29,714,286 $3,985,884 $4,801,131 -$1,297,290
10 $816,629 $22,572,239 $29,714,286 $3,985,013 $4,801,642 -$961,743 11 $815,247 $22,572,239 $29,714,286 $3,985,884 $4,801,131 -$712,108 12 $816,629 $22,572,239 $29,714,286 $3,985,013 $4,801,642 -$526,351 13 $816,629 $22,572,239 $29,714,286 $3,985,013 $4,801,642 -$388,140 14 $815,247 $22,572,239 $29,714,286 $3,985,884 $4,801,131 -$285,316 15 $816,629 $22,572,239 $29,714,286 $3,985,013 $4,801,642 -$208,803 16 $407,624 $22,572,239 $29,714,286 $4,242,686 $4,650,310 -$153,669 17 $22,572,239 $29,714,286 $4,499,489 $4,499,489 -$113,977 18 $22,572,239 $29,714,286 $4,499,489 $4,499,489 -$84,445 19 $22,572,239 $29,714,286 $4,499,489 $4,499,489 -$62,472 20 $22,572,239 $29,714,286 $4,499,489 $4,499,489 -$46,123 21 $22,572,239 $29,714,286 $4,499,489 $4,499,489 -$33,959 22 $22,572,239 $29,714,286 $4,499,489 $4,499,489 -$24,908 23 $22,572,239 $29,714,286 $4,499,489 $4,499,489 -$18,174 24 $22,572,239 $29,714,286 $4,499,489 $4,499,489 -$13,163 25 $22,572,239 $29,714,286 $4,499,489 $4,499,489 -$9,435 26 $22,572,239 $29,714,286 $4,499,489 $4,499,489 -$6,662 27 $22,572,239 $29,714,286 $4,499,489 $4,499,489 -$4,598 28 $22,572,239 $29,714,286 $4,499,489 $4,499,489 -$3,062 29 $22,572,239 $29,714,286 $4,499,489 $4,499,489 -$1,920 30 $5,663,043 $22,572,239 $29,714,286 $4,499,489 $10,162,533 $0
IRR: investor’s rate of return

C- 17

C- 18

C- 19

C- 20

C- 21

C- 22

C- 23

C- 24

C- 25

C- 26

C- 27

C- 28

C- 29

C- 30

C- 31

C- 32

C- 33

C- 34

C- 35

C- 36

C- 37

C- 38

C- 39

C- 40

C- 41

C- 42

C- 43

C- 44

C- 45

C- 46

C- 47

C- 48

C- 49

C- 50

C- 51

C- 52

C- 53

C- 54

C- 55

C- 56

C- 57

C- 58

C- 59

C- 60

C- 61

C- 62

C- 63

C- 64

C- 65

C- 66

C- 67

D- 1
Appendix D – Assumptions
Operation
- 5631 operating hours per year
- 16 hours per day of making product
- 3,250,000 million gallons of frozen yogurt produced per year
- Since no pilot plant tests have been conducted, it is assumed that the product will turn out
as intended in terms of texture, flavor, and viscosity by using the ingredients and process
detailed in this report.
Densities
- The density of the bulk culture and the filtrate is the same as for skim milk.
- Ultrafiltered milk and yogurt have the same density.
- Assume the concentrated freeze-dried culture has the same density as Grape Nuts Flakes,
but is packed 4 times more closely. This assumption was used because both are dried
items, but CFDC is in smaller granules than the cereal.
- The mono- and diglycerides have the same density as milk fat.
Environment
- External temperature is constant at 20 °C, which is about the average high in
Pennsylvania (Pennsylvania State Climatologist, 2008).
- Average atmospheric relative humidity is constant at 70%, which is around the average
annual relative humidity in Pennsylvania (Pennsylvania State Climatologist, 2008).
- Cooling water enters at 30 °C (Seider, et al., 2005).
Ultrafiltration Membrane
- The flux of milk through membrane is 25 L/m2/hr/bar (Koch, 2007).

D- 2
- Assume the ultrafiltered milk composition data from Premaratne and Cousin accurately
describes the UF milk that will be obtained in this process (1991).
- The culture is assumed to grow in filtrate only because it contains as much lactose (the
food of yogurt culture, lactic acid bacteria) as a 10% nonfat dry milk and water solution,
which is the normal way to grow culture (pg. B-2).

D- 3
Pasteurization
- Estimates for the overall heat transfer coefficients and heat capacities were taken from
Kessler (1981).
- Since E-102 uses ammonia instead of steam to heat the UF milk, it is assumed that the
heat exchanger has safety features preventing the ammonia from entering the milk.
- The overall heat transfer coefficient between UF milk and ammonia is taken to be the
same as the coefficient for milk and steam.
- The overall heat transfer coefficient between water and brine was estimated by averaging
the water-milk and the brine-milk coefficients in Kessler (1981).
Scraped Surface Freezers
- Assume that with a draw temperature of -7 °C and mostly sucrose as a sweetener, 55
vol% of the frozen yogurt is ice (Drewett and Hartel, 2007).
- The freezing point of the frozen yogurt mix is assumed to be -2.7 °C (Drewett and Hartel,
2007).
- The fraction of water that is frozen in the mix is taken to be a linear function of
temperature over the range of the freezer (3 °C to -7 °C) (Kessler, 1981).
- The viscosity of the frozen yogurt is assumed to be constant.
- The distance between the scraper blade and the freezer wall is assumed to be 1 mm.
- The overall heat transfer coefficient in the freezer is assumed to be 1000 W/m2/°C (Earle,
1983).
- The compressed air being injected into the freezer along with the mix was assumed to
provide negligible refrigeration (pg. B-14).
Hardening Tunnel

D- 4
- The hardening time was calculated using a model for transient heat transfer through an
infinite cylinder (pg. B-15). It was assumed that this model is applicable.
- The convective heat transfer coefficient in the tunnel was taken to be 35 W/m2/K
(Amarante and Lanoisellé, 2005).
- The thermal conductivity was estimated at 0.55 W/m/K (Cogné, et al., 2003).
- Heat transfer coefficients for heat loss through the walls, ceiling, and floor of the tunnel
were estimated from Warner (1976).

D- 5
Storage Freezer
- Assume the only heat losses are through the walls, ceiling, and floors. Doors are
neglected.
- Sized for one week’s capacity of frozen yogurt demand.
Refrigeration Loop with Ammonia
- Calculations were done in Aspen (aspenONE, 2005).
- Overall heat transfer coefficients estimated using heuristics in Turton, et al. (2003).
- Physical properties were estimated in Aspen using the “UNIFAC” property method.
- The filtrate was modeled as water.
Cooling Tower
- Assume that the water will leave the tower at 30 °C.
- The flow rate through the cooling tower is assumed to be constant for the calculation. In
practice, because some of the water is coming from a batch process, the amount of water
could fluctuate during a run.
Bulk Culture Fermentation
- The different bacteria strains are assumed to all be able to grow together when making
the bulk culture.
- It is assumed that 1 granule (grain) of concentrated freeze-dried culture weighs 1 grain.
- Use two grains of culture per liter of filtrate (Food and Agriculture Organization, 2004).
- It is assumed that the culture will grow as expected in the paper by Ordonez, et al. (2000).
This means that it is assumed that each stage of culture preparation will take 5.5 hours to
reach a pH of 5.5 and that yogurt fermentation will take 4 hours.

D- 6
- For pasteurizing the filtrate, it was assumed that the filtrate has the same thermodynamic
properties as water.
Environmental Impact
- Environmental impact study is based on the plant’s delivery of 20,344,803
lb/yr of frozen yogurt to market
- In the environmental impact, material quantities of raw materials and on-site
chemicals is an estimate for one year operation but the facility will not store
the indicated amount during normal operation.
- Storage period for on-site chemicals is three weeks; raw materials are stored for one
week. Milk and heavy cream are stored for one day or less.
Economic Assumptions:
- If cost equations from Seider, et al. were not in correct range, it was assumed that they
would still be applicable.
- The plant was taken to produce product 5631 hours per year.
- An average FBM of 2.28 was used, based on Table 16.11 of Seider, et al., for any
equipment not in the list.
- All materials of construction in contact with the product are stainless steel.
- It was assumed that Fp equals 1.0 for the double pipe heat exchangers.
- The storage freezer is assumed to be part of building cost.
- Valves costs are considered to be negligible.

D- 7
- For shell-and-tube fixed-head heat exchangers, the length was assumed to be 20 feet,
therefore FL=1.0.
- A minimum brake horsepower for fractional efficiency of electric motor was assumed,
therefore ηM=0.72, which is the standard efficiency in Aspen.
- The jacketed tank will be able to hold 4 hours worth of mix, plus 30% extra volume.
- Mixers will have 30% extra capacity, as well, and be able to hold enough mix for the
required holding time.
- The price of a two-stage homogenizer is assumed to be same price as for a one stage
homogenizer.
- The silos will be able to hold a whole day’s supply of milk and cream.
- Ammonia, brine, cooling water (except for the amount added to make up for evaporation)
will be a one time investment to fill each loop.
- The time for one component to complete a full loop is 30 minutes.
- The ammonia, brine, and cooling water are assumed not to leak. Due to the safety hazard
an ammonia leak poses, it is assumed that suitable safety precautions will prevent an
ammonia leak during typical operation. The cooling water and brine are assumed not to
leak because they are both cheap and very easy to replace.
- It was assumed that the electricity needs for a 175 rpm scraped surface heat exchanger
can be scaled up to a 500 rpm scraped surface heat exchanger.
- It was assumed that the cleaning in place chemicals were the same relative amounts as
those needed by Phoenix Ice Cream (Knight, 2008).
- Heat exchangers, where the majority of the materials of construction were stainless steel,
were costed with the stainless steel material factor.

E- 1
Appendix E – References
Adams, MR and L Nicolaides. “Review of the Sensitivity of Different Pathogens to
Fermentation.” Food Control 8 (1997): 227–239.
Adapa, S, et al. ”Mechanisms of Ice Crystallization and Recrystallization in Ice Cream: A
Review.” Food Revue International 16 (2000): 259-271.
Airgas, Compressed Air. 2008. <http://www.airgas.com/browse/product_list.aspx?catID=
186&WT.svl=186> (accessed Feb 2008).
Amarante, A and JL Lanoisellé. “Heat Transfer Coefficients Measurement in Industrial Freezing
Equipment by Using Heat Flux Sensors.” Journal of Food Engineering 66 (2005): 377-386.
American Cooling Tower Solutions, ACTS 50 Specifications Brochure.
<http://www.americancoolingtowersolutions.com/pdfs/ACTS-50%20Specs.pdf> (accessed
Mar 2008).
Anco-Eaglin Inc., Votator Scraped Surface Heat Exchanger Brochure.
<http://www.ancoeaglin.com/images/pdfs/ANCO%20Votator%20Brochure.pdf> (accessed
Feb 2008).
Ann. Personal Interview. Koch Membrane Systems, Wilmington, MA, 11 Mar 2008.
Apollo, Hygienic Flowmeter. 2008. <http://www.apolloflow.co.uk/flowmeters/hygienic.htm>
(accessed Mar 2008).
Arbuckle, WS. Ice Cream. AVI Publishing Co, Inc.: Westport, CT, 1977.
aspenONE, Aspen Plus Version 2004.1 (13.2.0.2925). Computer software. Aspen Technology,
Inc, April 2005.
BeeInternational, Production Homogenizers Brochure.
<http://www.beei.com/pdf/DeBEE_Production.pdf> (accessed Mar 2008).

E- 2
California Energy Commission, US per Capita Electricity Use by State in 2001. 2005.
<http://www.energy.ca.gov/electricity/us_percapita_electricity.html> (accessed April 2008).
Chandan, Ramesh C., ed. Manufacturing Yogurt and Fermented Milks. Blackwell Publishing:
Oxford, UK, 2006.
“Chemical Engineering Plant Cost Index.” Chemical Engineering 115 (2008): 60.
Chr. Hansen, Nu-trish Product Information. Jun 2004.
<http://www.pps.ir/Downloads/Dairy%20culture/NU-TRISH/Nu-trish%20(probiotic).pdf>
(accessed Mar 2008).
Chr. Hansen, Yo-flex Product Information. Jul 2004.
<http://www.pps.ir/Downloads/Dairy%20culture/Yo-Flex/YC-350.pdf> (accessed Mar
2008).
Chris. Personal Interview. Airgas, Tucson, AZ, 3 Mar 2008.
Coborn’s, Shop Online. 2008. <http://www.getyourgroceries.com/Coborns/Shop.asp> (accessed
Mar 2008).
Cogné, C, et al. “Experimental Data and Modelling of Thermal Properties of Ice Creams.”
Journal of Food Engineering 58 (2003): 331-341.
Comoros Vanilla Beans, Bourbon and Tahitian Vanilla Beans. 2008.
<http://www.comorosvanillabeans.com/extract.htm> (accessed Mar 2008).
CP Kelco, Genu Carrageenan. <http://www.cpkelco.com/carrageenan/commercial.html>
(accessed Mar 2008).
Danone Activia. 2008. <http://www.activia.com> (accessed Mar 2008).
De Cindio, B, G Iorio, and V Romano. “Thermal Analysis of the Freezing of Ice Cream
Brickettes by the Finite Element Method.” Journal of Food Science 50 (1985): 1463-1466.

E- 3
Drewett, EM and RW Hartel. “Ice Crystallization in a Scraped Surface Freezer.” Journal of
Food Engineering 78 (2007): 1060-1066.
DuPont, R-22 Outlook. Nov 2007.
<http://refrigerants.dupont.com/Suva/en_US/pdf/k16681.pdf> (accessed Mar 2008).
Earle, RL. Unit Operations in Food Processing, Heat Transfer Applications. NZIFST: 1983.
<http://www.nzifst.org.nz/unitoperations/httrapps.htm> (accessed Mar 2008).
eChina Chem, Inulin.
<http://www.echinachem.com/english/SupplyAndRequest/582/60178/ShowSupplier.aspx>
(accessed Feb 2008).
El-Nagar, G, G Clowes, CM. Tudorica, and V Kuri. "Rheological Quality and Stability of Yog-
Ice Cream with Added Inulin." International Journal of Dairy Technology 55 (2002): 89-93.
Energy Information Administration, Pennsylvania Electricity Profile. 2006.
<http://www.eia.doe.gov/cneaf/electricity/st_profiles/pennsylvania.html> (accessed Apr
2008).
Environmental Protection Agency, Dairy Production Study Questions.
<http://www.epa.gov/oecaagct/ag101/dairystudy.html> (accessed Mar 2008).
Environmental Protection Agency, Global Anthropogenic Non-CO2 Greenhouse Gas Emissions:
1990 – 2020. 2006. <http://www.epa.gov/climatechange/economics/
downloads/GlobalAnthroEmissionsReport.pdf> (accessed Apr 2008).
Environmental Protection Agency, Inventory of U.S. Greenhouse Gas Emissions and Sinks:
1990 – 2006. 2008. <http://www.epa.gov/climatechange/emissions/
usinventoryreport.html> (accessed Apr 2008).

E- 4
Environmental Protection Agency, Office of Solid Waste and Emergency Response,
Consolidated List of Chemicals Subject to the Emergency Planning and Community Right-
To-Know Act (EPCRA) and Section 112(r) of the Clean Air Act. 2001.
<http://www.epa.gov/ceppo/pubs/title3.pdf> (accessed Apr 2008).
Felder, RM and RW Rousseau. Elementary Principles of Chemical Engineering. Wiley: New
York, NY, 2000.
Food and Agriculture Organization of the United Nations, Production of Cultured Milk. 2004.
<http://www.fao.org/ag/Aga/publication/mpguide/mpguide4.htm> (accessed Jan 2008).
Food and Drug Administration, Evaluation and Definition of Potentially Hazardous Foods.
2001. <http://www.cfsan.fda.gov/~comm/ift4-toc.html> (accessed Apr 2008).
Food and Drug Administration, FDA Recall Policies. 2002.
<http://www.cfsan.fda.gov/~lrd/recall2.html> (accessed Apr 2008).
Food and Drug Administration, HACCP: A State-of-the-Art Approach to Food Safety. 2001.
<http://www.cfsan.fda.gov/~lrd/bghaccp.html> (accessed Apr 2008).
Guinard, JX, et al. “Effect of Sugar and Acid on the Acceptability of Frozen Yogurt to a Student
Population.” Journal of Dairy Science 77 (1994): 1232-1238.
Güven, M, and OB Karaca. "The Effects of Varying Sugar Content and Fruit Concentration on
the Physical Properties of Vanilla and Fruit Ice-Cream Type Frozen Yogurts." International
Journal of Dairy Technology 55 (2002): 27-31.
Haley, S and D Kelch. USDA, Sugar and Sweeteners Outlook Brochure. Jan 2008.
<http://usda.mannlib.cornell.edu/usda/current/SSS/SSS-01-29-2008.pdf> (accessed Feb
2008).

E- 5
Hartel, Richard W. “Ice Crystallization during the Manufacture of Ice Cream.” Trends in Food
Science and Technology 7 (1996): 315-321.
Hoskins, Rob. Personal interview. Hoyer TetraPak, Lake Geneva, WI, 13 Mar 2008.
How Products are Made, How Frozen Yogurt is Made. 2007.
<http://www.madehow.com/Volume-2/Frozen-Yogurt.html> (accessed Jan 2008).
International Dairy Foods Association (IDFA), Pasteurization, Definitions and Methods. 2008.
<http://www.idfa.org/facts/milk/pasteur.cfm> (accessed Apr 2008).
International Finance Corporation (IFC), Environmental, Health, and Safety Guidelines. 2007.
<www.ifc.org/ifcext/enviro.nsf/Content/EnvironmentalGuidelines> (accessed Apr 2008).
Iowa Department of Transporation, Brine.
<http://www.dot.state.ia.us/maintenance/internetpages/chemicals/brine.pdf> (accessed Mar
2008).
International Dairy Foods Association, Pasteurization: Definitions and Methods.
<http://www.idfa.org/facts/milk/pasteur.cfm> (accessed Mar 2008).
Jenny. Personal Interview. Schier Company, Kiefer, OK, 11 Mar 2008.
Kegley S, B Hill, and S Orme. PAN Pesticide Database, Pesticide Action Network, North
America. San Francisco, CA, 2007. <http:www.pesticideinfo.org> (accessed Apr 2008).
Kessler, HG. Food Engineering and Dairy Technology. Trans. M. Wotzilka. Verlag A. Kessler:
Freising, F.R. Germany, 1981.
Kitchen Universe, Rolmex Freeze-Dried Yogurt Starter.
<http://www.kitchenu.com/shop/product.aspx?ref=shopping&sku=2309> (accessed Mar
2008).

E- 6
Kleiss, T, van Schothorst, M, Cordier, JL and Untermann, F. “Staphylococci in a Whey Powder
Plant Environment: An Ecological Survey as a Contribution to HACCP Studies.” Food
Control 5 (1994): 196-199.
Knight, Joel. Personal interview. Phoenix Ice Cream Plant, Tempe, AZ, 7 Feb 2008.
Koch Membrane Systems, KMS HFK-328 Food & Dairy UF Elements. Aug 2007.
<www.kochmembrane.com/pdf/HFK328%20Food%20&%20Dairy.pdf> (accessed Mar
2008).
Koretsky, MD. Engineering and Chemical Thermodynamics. Wiley: New York, NY, 2004.
Krishna Industries, Better Material for Food Handling and Processing.
<http://www.dairyequipments.com/test.htm> (accessed Mar 2008).
Levenspiel, Octave. Chemical Reaction Engineering. 3rd ed. Wiley: New York, NY, 2004.
Lide, David R, ed. CRC Handbook of Chemistry and Physics. 88th ed. CRC Press: 2007.
Macaulay, Keith. Personal interview. Apollo, Charles Street, Walsall, 17 Mar 2008.
Marshall, RT, HD Goff, and RW Hartel. Ice Cream. 6th ed. Springer: New York, NY, 2003.
McCabe, WL, Smith, JC. Unit Operations of Chemical Engineering, 7th ed. McGraw-Hill: New
York, NY, 2004.
Muse, MR and RW Hartel. “Ice Cream Structural Elements that Affect Melting Rate and
Hardness.” Journal of Dairy Science 87 (2004): 1-10.
New Life Chemical & Equipment Inc., Mono and Diglycerides. <http://www.newlife-
chem.com/products2.html> (accessed Feb 2008).
Nickerson, TA. “Lactose Crystallization in Ice Cream. IV. Factors Responsible for Reduced
Incidence of Sandiness.” Journal of Dairy Science 45 (1962): 354-359.

E- 7
Nova Chemicals, Material Safety Data Sheet: Brine Solution. 2007.
<http://www.novachem.com/ProductServices/docs/BrineSolution_MSDS_EN.pdf>
(accessed Apr 2008).
Oanda, The Currency Converter. 2008. <http://www.oanda.com/convert/classic?free=1>
(accessed Mar 2008).
Occupational Safety and Health Administration (OSHA), Ammonia Refrigeration: Recognition
and Control. 1996. <http://www.osha.gov/SLTC/ammoniarefrigeration/recognition.html>
(accessed Apr 2008).
Occupational Safety and Health Administration (OSHA), Personal Protective Equipment. (2003).
<http://www.osha.gov/Publications/osha3151.pdf> (accessed Apr 2008).
Occupational Safety and Health Administration (OSHA), Process Safety Management of Highly
Hazardous Chemicals: Compliance Guidelines and Enforcement Procedures. 1992.
<http://www.osha.gov/pls/oshaweb/owadisp.show_document?p_table=DIRECTIVES&p_id=
1557> (accessed Apr 2008).
Ordonez, GA, et al. "Manufacture of Frozen Yogurt with Ultrafiltered Milk and Probiotic Lactic
Acid Bacteria." Journal of Food Processing and Preservation 24 (2000): 163-176.
Oxford University, Safety Data for Inulin. <http://www.pcl.ox.ac.uk/MSDS/IN/inulin.html>
(accessed Mar 2008).
Ozen, S and M Ozilgen. “Effects of Substrate Concentration of Growth and Lactic-Acid
Production by Mixed Cultures of Lactobacillus-bulgaricus and Streptococcus-thermophilus.”
Journal of Chemical Technology and Biotechnology 54 (1992): 57-61.
Parker, Phillip. 2006-2011 World Outlook for Frozen Yogurt & Sorbet. Fontainebleau, France,
2005.

E- 8
<http://ezproxy.library.arizona.edu/login?url=http://search.ebscohost.com/login.aspx?direct=
true&db=bth&AN=20759424&site=ehost-live> (accessed Jan 2008).
PDH Engineer, Pumps – Centrifugal vs. Positive Displacement.
<http://www.pdhengineer.com/Course%20Files/Completed%20Course%20PDF%20Files/Pu
mps%20Centrifugal%20vs%20Positive%20Displacement%20Word%20Document.htm>
(accessed Mar 2008).
Pennsylvania State Climatologist, Means and Extremes. 2008.
<http://pasc.met.psu.edu/PA_Climatologist/state/pameans.html> (accessed Feb 2008).
Perry, RH and DW Green. Perry’s Chemical Engineers’ Handbook. 7th ed. McGraw-Hill: New
York, NY, 1997.
Premaratne RJ and MA Cousin. “Changes in the Chemical Composition during Ultrafiltration of
Skim Milk.” Journal of Dairy Science (74) 1991: 788-795.
Prentice, James H. Dairy Rheology: a Concise Guide. VCH Publishers: New York, 1992.
PRWeb, “Global Frozen Desserts Market to Reach US$97.4 Billion by 2010, According to New
Report by Global Industry Analysts, Inc.” Mar 2008.
<http://prweb.com/releases/frozen_yogurt/ice_cream/prweb776114.htm> (accessed Mar
2008).
Pszczola, DE. “What’s Yonder for Yogurt.” Food Technology. 62 (2008): 45-58.
Rahman, M Shafiur. Handbook of Food Preservation. CRC Press: 2007.
Roquette America Inc., Corn Syrup Solids. 2008.
<http://www.foodservicedirect.com/index.cfm/S/7/CLID/1834/N/93469/Roquette_America_
Inc._Corn_Syrup_Solid.htm> (accessed Mar 2008).

E- 9
Russell, AB, et al. “Influence of Freezing Conditions on Ice Crystallisation in Ice Cream.”
Journal of Food Engineering 39 (1999): 179-191.
Saarela, Maria, et al. "Probiotic Bacteria: Safety, Functional and Technological Properties."
Jounal of Biotechnology 84 (2000): 197-215.
Sáez, A Eduardo. Personal interviews. Jan-Apr 2008.
Sáez, A Eduardo. ChEE 305 Transport Phenomena Class Notes. Tucson, AZ, Spring 2007.
Safeway, Shop Online. Mar 2008. <http://shop.safeway.com/superstore/> (accessed Mar 2008).
Sanders, Roy E. Chemical Process Safety: Learning from Case. Elsevier, 1999.
<http://books.google.com/books?id=XcPc5PmDXvwC&pg=PA75&lpg=PA75&dq=ice+crea
m+manufacturing+safety+report&source=web&ots=Ktrk2lAdA2&sig=WDzDglbMY-
0U3Nhf8PMajofJt10&hl=en#PPA75,M1> (accessed Apr 2008).
ScienceLab.com, Inc., ScienceLab.com Chemicals. 2005.
<http://www.sciencelab.com/page/S/CTGY/10403> (accessed Apr 2008).
Schier Company, Miscellaneous Fillers.
<http://www.schiercompany.com/MiscellaneousFillers.html> (accessed Mar 2008).
Schier, Gary. Personal interview. Schier Company, Kiefer, OK, 7 Mar 2008.
Seider WD, JD Seader, and DR Lewin. Product and Process Design Principles. 2nd ed. Wiley:
New York, NY, 2005.
Shah, NP. “Probiotic Bacteria: Selective Enumeration and Survival in Dairy Foods.” Journal of
Dairy Science 83 (2000): 894-907.
Sofjan, RP and Hartel RW. “Effects of Overrun on Structural and Physical Characteristics of Ice
Cream.” International Dairy Journal 14 (2004): 255-262.
Sokol, Peter. Personal Interview. BeeInternational, South Easton, MA, 7 Mar 2008.

E- 10
Spirax Sarco, Steam Tables. 2008. <http://www.spiraxsarco.com/resources/steam-tables.asp>
(accessed Mar 2008).
Spreer, Edgar. Milk and Dairy Product Technology. Trans. Axel Mixa. Marcel Dekker, Inc:
New York, NY, 1998.
Stogo, Malcolm. Ice Cream and Frozen Desserts: a Commerical Guide to Production and
Marketing. Wiley: New York, NY, 1998.
Tate and Lyle, Star-Dri Maltodextrins and Corn Syrup Solids Brochure.
<http://www.tateandlyle.com/NR/rdonlyres/eohrb5gjnjtxor752adyog2koimyz3w4uqgnqgbps
kkkdqwowlddxbzqufwjh3ymw5q2ofwnf56l2fvrxxx2wna7c4e/TALFIIASTARDRI2005.pdf>
(accessed Mar 2008).
Teitelbaum, JE and WA Walker. “Nutritional Impact of Pre- and Probiotics as Protective
Gastointestinal Organisms.” Annual Revue of Nutrition 22 (2002): 107-138.
TetraPak, Ice Cream Hardening Tunnels. 2008.
<http://www.tetrapak.com/index.asp?navid=219> (accessed Mar 2008).
Tic Gums, Carrageenan. <http://www.ticgums.com/product-overview.asp#carrageenan>
(accessed Feb 2008).
Tucson Water, Water Plan 2000-2050. 2008. <http://www.tucsonaz.gov/water/docs/wp-app-
b.pdf> (accessed April 2008).
Turton, et al. Analysis, Synthesis and Design of Chemical Processes. Prentice Hall: New Jersey,
2003.
UK Plumbing, Cylinder Jacket Insulation. 2007. <http://www.uk-plumbing.com/insulation-
cylinder-jacket-insulation-c-446_447.html> (accessed Mar 2008).
E- 11
University of Guelph, Dairy Science and Technology.
<http://www.foodsci.uoguelph.ca/dairyedu/home.html> (accessed Jan 2008).
University of Wisconsin, Madison, Dairy Markets Data & Graphs. Mar 2008.
<http://future.aae.wisc.edu/tab/prices.html> (accessed Mar 2008).
van Schothorst, M and T Kleiss. “HACCP in the Dairy Industry.” Food Control 5.3 (1994):162-
166.
Warner, James N. Principles of Dairy Processing. Wiley: New York, 1976.
Related Documents