FSG USAID FROM THE AMERI CAN PEOPLE IE1 CREATING VIABLE AND SUSTAINABLE SANITATION ENTERPRISES Case Study: A Retrospective Analysis of Rural Sanitation Enterprises in Bihar, India MARCH 2020 This publication was produced for review by the United States Agency for International Development. It was prepared by Tetra Tech.

Welcome message from author
This document is posted to help you gain knowledge. Please leave a comment to let me know what you think about it! Share it to your friends and learn new things together.
Transcript

FSG
USAID FROM THE AMERICAN PEOPLE IE1
CREATING VIABLE AND SUSTAINABLE SANITATION ENTERPRISES Case Study: A Retrospective Analysis of Rural Sanitation Enterprises in Bihar, India
MARCH 2020
This publication was produced for review by the United States Agency for International Development. It was prepared by Tetra Tech.

ACKNOWLEDGEMENTS This case study was prepared by FSG in partnership with PSI India. Rishi Agarwal led the analysis with essential participation from Subhash Chennuri, Abhishek Khanna, Urmi Uppal, and Apurva Shukla (FSG).
The authors would like to acknowledge the generous contribution and thought partnership of Sanjay Singh, Vivek Sharma, Bikas Sinha, Chandan Singh, Amit Kumar, Bharat Kumar, and Putul Thakur (PSI India), WASHPaLS Deputy Project Director Dr. Jeff Albert of Aquaya, and WASHPaLS Research Advisor Dr. Mimi Jenkins.
The following individuals reviewed this document and provided valuable input to ensure its comprehensiveness and accuracy: Sanjay Singh (PSI India), WASHPaLS Project Director Morris Israel (Tetra Tech), Elizabeth Jordan (USAID), and Jesse Shapiro (USAID).
The authors would like to thank Pritpal Marjara (PSI India) for making this partnership possible. Ishwar Gawande contributed to the case study and Kashmira Ranji (FSG) provided invaluable logistical and other support.
Authors: Rishi Agarwal, Subhash Chennuri, Abhishek Khanna, and Urmi Uppal, FSG
Preferred citation: USAID, 2020. Creating Viable and Sustainable Sanitation Enterprises. Case Study: Bihar, India. Washington, D.C., USAID Water, Sanitation, and Hygiene Partnerships and Learning for Sustainability (WASHPaLS) Project.
Prepared for the United States Agency for International Development by the Water, Sanitation, and Hygiene Partnerships and Learning for Sustainability (WASHPaLS) project under Task Order number AID-OAA-TO-16-00016 of the Water and Development Indefinite Delivery Indefinite Quantity Contract (WADI), contract number AID-OAA-I-14-00068.
Tetra Tech Contacts: Morris Israel, Project Director [email protected]
Jeff Albert, Deputy Project Director [email protected]
Lucia Henry, Project Manager [email protected]
Tetra Tech 1320 N. Courthouse Road, Suite 600, Arlington VA 22201 Tel: 703-387-2100 | Fax: 703-414-5593 www.tetratech.com/intdev

CREATING VIABLE AND SUSTAINABLE SANITATION ENTERPRISES
Case Study: A Retrospective Analysis of Rural Sanitation Enterprises in Bihar, India
March 2020
DISCLAIMER The authors’ views expressed in this publication do not necessarily reflect the views of the United States Agency for International Development or the United States Government.

TABLE OF CONTENTS ACRONYMS AND ABBREVIATIONS .................................................................................................... ii
GLOSSARY OF TERMS ........................................................................................................................... iii
PREFACE.................................................................................................................................................... v
EXECUTIVE SUMMARY ......................................................................................................................... vi
1. INTRODUCTION ............................................................................................................................... 1
1.1. CONTEXT FOR THE STUDY............................................................................................................................................... 1 1.2. BACKGROUND OF THE 3SI PROGRAM ............................................................................................................................ 2 1.3. SANITATION CONTEXT IN BIHAR.................................................................................................................................... 4 1.4. INTERVENTION PERFORMANCE SUMMARY...................................................................................................................... 4
2. METHODOLOGY ............................................................................................................................... 6
2.1. DIRECT INTERVIEWS........................................................................................................................................................... 6 2.2. ANALYTICAL APPROACH .................................................................................................................................................. 7
2.2.1. Analysis of Drivers to Improve Profit............................................................................................................7 2.2.2. Sustainability Analysis .......................................................................................................................................12
3. ENTERPRISE BACKGROUND........................................................................................................ 13
3.1. SURAJ .................................................................................................................................................................................13 3.2. NEERAJ...............................................................................................................................................................................13 3.3. RAM....................................................................................................................................................................................13 3.4. SHYAM ...............................................................................................................................................................................14
4. FINDINGS.......................................................................................................................................... 15
4.1. ANALYSIS OF DRIVERS TO IMPROVE PROFIT .................................................................................................................15 4.1.1. Number of Customers ....................................................................................................................................19 4.1.2. Prices ....................................................................................................................................................................21 4.1.3. Costs ....................................................................................................................................................................22 4.1.4. Common Products Mix ...................................................................................................................................24 4.1.5. Additional Sanitation-Related Products.......................................................................................................25 4.1.6. Summary of Viability Analysis ........................................................................................................................26
4.2. ASSESSING SUSTAINABILITY.............................................................................................................................................27 4.2.1. Financial Independence ....................................................................................................................................27 4.2.2. Operational Independence .............................................................................................................................28
5. RECOMMENDATIONS.................................................................................................................... 29
5.1. RECOMMENDATIONS TO IMPROVE VIABILITY...............................................................................................................29 5.1.1. Cost-reduction strategy ..................................................................................................................................29 5.1.2. Revenue-growth strategy................................................................................................................................30 5.1.3. Margin-expansion strategy ..............................................................................................................................31
5.2. RECOMMENDATIONS TO IMPROVE SUSTAINABILITY....................................................................................................31
6. APPENDIX ........................................................................................................................................ 32
6.1. INITIAL SAMPLING PLAN ..................................................................................................................................................32 6.1.1. Market Types .....................................................................................................................................................32 6.1.2. Enterprise Categories ......................................................................................................................................34
6.2. PROFIT & LOSS STATEMENTS ..........................................................................................................................................37 6.3. GROSS MARGIN VARIANCE ANALYSIS...........................................................................................................................38 6.4. ADDITIONAL GMVA BRIDGES .......................................................................................................................................41
CREATING VIABLE AND SUSTAINABLE SANITATION ENTERPRISES: BIHAR, INDIA CASE STUDY i

ACRONYMS AND ABBREVIATIONS
3SI Supporting Sustainable Sanitation Improvements
COGS Cost of Goods Sold
CRM Cement Ring Manufacturer
GMVA Gross Margin Variance Analysis
GPPC Gross Profit Per Customer
HP High Profit
LP Low Profit
MBS Market-Based Sanitation
MFI Microfinance Institution
P&L Profit and Loss
PSI Population Services International
SBA Swachh Bharat Abhiyan
USAID United States Agency for International Development
USD United States Dollar
WADI Water and Development Indefinite Delivery Indefinite Quantity Contract
WASHPaLS Water, Sanitation, and Hygiene Partnerships and Learning for Sustainability
CREATING VIABLE AND SUSTAINABLE SANITATION ENTERPRISES: BIHAR, INDIA CASE STUDY ii

GLOSSARY OF TERMS
Term Definition
Equipment (e.g., a truck or mold to cast concrete components) with a useful life spanning multiple years. Capital assets, unlike raw materials, are not “consumed” in
Capital asset the manufacturing and sale of each toilet; their useful life depends on their frequency of use, quality, and maintenance, and their value can depreciate (see definition below).
Cash net profit
The revenue earned from the sale of toilets in excess of all cash expenses incurred by an enterprise. Cash net profit is the amount available to the entrepreneur to take home as income and/or re-invest in the business. Cash net profit differs from the net profit as per conventional accounting norms, which include non-cash expenses such as depreciation (see definition below).
Cost of Goods Sold (COGS)
In the sanitation context, COGS consists of expenses incurred by an enterprise exclusively for the procurement of raw materials and manufacturing or assembly of a toilet or its constituent components. It includes the cost of raw materials (e.g., cement), components (e.g., pans), and labor costs for workers involved in manufacturing, assembly, and installation.
Customer Member(s) of a household that purchase(s), use(s), and oversee(s) the construction, operation, and maintenance of a toilet.
Demand activation
Direct sales and marketing activities carried out to persuade customers to convert product awareness and interest into a purchasing decision. Demand activation is distinct from “demand generation,” which drives increased awareness and interest in hygienic sanitation behaviors and improved sanitation products and services.
Depreciation
The decline in the value of the equipment (e.g., trucks and molds) due to routine wear and tear. A depreciating asset will eventually be replaced after its utility is exhausted. Depreciation is a non-cash expense; while the enterprise makes full payment to purchase the equipment, its cost is spread over its useful life of multiple years and recognized annually. Example: The total cost for a mold with a lifespan of four years is paid in full in Year 1; however, a portion of this cost will be recognized (as a non-cash expense) each year over the four-year period.
Expenses
The expenses incurred by sanitation enterprises comprise costs directly incurred on producing toilets and/ or related services, and other indirect costs not linked to the production of each toilet, but required to operate the business. These expenses include COGS, operational expenses, and other expenses.
Gross Margin Variance Analysis (GMVA)
An analytical method to compare gross profits of the same enterprise from two different periods or budget vs. actual gross profit and identify drivers of differences. In our context, the method has been adapted to compare the gross profits of two different sanitation enterprises and identify the significant drivers of differences in the gross profits. The five drivers analyzed in our context are: "number of customers", "price", "cost", "product mix", and "additional sanitation-related products". The graphical representation of a GMVA comparison is called a "GMVA bridge."
Gross profit
The difference between revenue from the sale of toilets and the Cost of Goods Sold (COGS). Gross profit is a metric of an enterprise’s efficiency in converting raw material and labor expended into revenue from the sale of toilets. High gross profit implies that the enterprise is generating significantly more revenue over its costs.
CREATING VIABLE AND SUSTAINABLE SANITATION ENTERPRISES: BIHAR, INDIA CASE STUDY iii

Term Definition
Market actor
In the sanitation context, an entity from the private, public, or non-profit sector that is not subsidized by donors or philanthropic entities, and participates directly or indirectly in the market by interacting or transacting with other market actors (e.g., sanitation enterprise, input supplier, financial service provider). Non-market actors include entities that are subsidized to play a specific role in the market (e.g., an NGO that implements programs to develop a sanitation market).
Net profit
The difference between an enterprise's total revenues and expenses (as defined above), including non-cash expenses (e.g., depreciation) expressed in absolute terms (e.g., USD). Net profit shows the amount that an enterprise has earned (or lost) over a definite period (typically a quarter or a year).
Non-market support
Financial or operational assistance provided to a sanitation enterprise by a non-market actor to help the enterprise function (e.g., providing a cash grant or supplying free molds to enterprises). Non-market support might impact the enterprise’s profitability, viability, and sustainability (see below).
Operating expenses Expenses on overheads that are required for the enterprise’s functioning. Examples of operating expenses include expenses towards rent, utilities, commissions paid to sales agents for selling toilets, maintenance of equipment, etc.
Other expenses Expenses on items that are unrelated to the core business of the sanitation enterprise. Example: interest payment on a loan taken for purposes not related to the products or services of a sanitation enterprise.
Profit The difference between revenue and expenses. Profit is expressed in absolute terms (e.g., USD). A negative profit is termed a loss.
Profit and loss statement (P&L statement)
Profitability
A statement providing a summary of the enterprise’s revenues and expenses, to arrive at a profit (or loss) for the enterprise. A P&L statement summarizes an enterprise’s financial performance over a definite period (typically a quarter or year). Profit relative to the revenue of an enterprise expressed as a percentage. Higher profitability indicates an enterprise is able to retain a higher share of revenue after accounting for expenses. Two enterprises with the same profits (e.g., USD 1,000 annually) may have different profitability relative to revenue. The one earning USD 1,000 as profit from sales of USD 10,000 is more profitable (generating a surplus of 1,000/10,000 = 10 percent) than the one earning USD 1,000 from sales of USD 50,000 (2 percent surplus)
Revenue
Revenue for sanitation enterprises is the money received by selling toilets and related services (e.g., installation) if offered and charged separately. Sanitation enterprises typically sell toilets as whole units (i.e., a package comprising the necessary components), individual toilet component(s) (e.g., cement rings, pit covers), or both. Enterprises typically provide two related services to customers— delivery and/or installation of toilets—and either charge separately or include them in the price of the toilet.
Subsidy program In the sanitation context, an initiative run by a government or non-government entity to provide financial assistance to a customer by paying a part of or the entire price of the toilet purchased by them.
Sustainability The likelihood that an enterprise remains viable over an extended period of time (i.e., multiple years) and continues operations without external, non-market support.
Viability A subjective measure of profit relative to a variety of explicit or implicit factors considered by an entrepreneur (e.g., minimum income expected; income from other non-sanitation specific enterprises; time and effort; or financial investment and risk).
Working capital The money required by a sanitation enterprise to finance its operational and other expenses. An enterprise needs working capital to meet immediate expenses such as raw materials, laborers, rent, and utilities.
CREATING VIABLE AND SUSTAINABLE SANITATION ENTERPRISES: BIHAR, INDIA CASE STUDY iv

PREFACE The Water, Sanitation and Hygiene Partnerships and Learning for Sustainability (WASHPaLS) project is a 5-year task order awarded to Tetra Tech on 16 September 2016 under USAID’s Water and Development Indefinite Delivery Indefinite Quantity Contract (WADI). Tetra Tech implements the project in collaboration with several non-governmental organizations and small-business partners— Aquaya Institute, Family Health International (FHI 360), FSG, and Iris Group—that contribute expertise in state-of-the-art WASH programming and research. Distinguished academics, practitioners, and policy makers from across the WASH sector regularly provide expert perspectives to the project through an internal research working group and an external WASHPaLS Advisory Board.
WASHPaLS supports the Agency’s goal of reducing morbidity and mortality in children under five by ensuring USAID programming employs high-impact, evidence-based environmental health, and WASH interventions. The project identifies and shares best practices for achieving sustainability, scale, and impact by generating evidence to support the reduction of open defecation and movement of communities up the sanitation ladder while also focusing on novel approaches for reducing feces exposure to infants and young children (IYC). Specifically, WASHPaLS:
1. offers USAID missions and technical bureaus ready access to thought leaders and analytical expertise across a wide range of WASH themes in response to their needs;
2. generates evidence through implementation research to increase the sector’s understanding of and approaches to sustainable WASH services, the effectiveness of behavioral and market-oriented approaches to sanitation, and measures to disrupt pathways of fecal exposure to infants and young children;
3. administers a small grants program on innovations in hygiene behavior change; and 4. engages and partners with national and global stakeholders to promote the use and application of
WASHPaLS-generated evidence and global best practices by practitioners and policy makers, tapping into broad coalitions and dynamic partnerships.
CREATING VIABLE AND SUSTAINABLE SANITATION ENTERPRISES: BIHAR, INDIA CASE STUDY v

r----------
r---
11
EXECUTIVE SUMMARY The USAID WASHPaLS Desk Review1 on scaling market-based sanitation (MBS) highlighted the need for an intervener to address barriers at all three levels of the market system―the core sanitation market; the business environment; and the broader context. The review identified multiple questions for further exploration based on areas with inadequate evidence (Figure A). This case study aims to contribute toward the evidence base that can provide an understanding of the factors, including entrepreneur profile, that impact enterprise viability. The specific question the USAID WASHPaLS project aims to answer is: “How can sanitation enterprises be made viable and sustainable?”
We define viability as a subjective measure of profit relative to a variety of explicit or implicit factors considered by an entrepreneur, such as minimum income expected; income from other non-sanitation specific enterprises; time and effort; and/or financial investment and risk. We define sustainability as the likelihood that an enterprise remains viable over an extended period of time (i.e., multiple years) and continues operations without external, non-market-based support.
Figure A: Barriers to scaling MBS interventions
BRO
ADER
CO
NTE
XT
SANITATION MARKET
BUSIN
ESS ENVIRO
NM
ENT
CUSTOMER
Affordability Availability
ENTREPRENEUR ENTERPRISE
TargetMarket
Delivery Model
Product System
Sales & Marketing
The changes in market rules that can create a positive environment for MBS
Factors that influence sanitation enterprises’ viability and sustainability across different business environments and contexts
Financial mechanisms that are best suited to support sanitation enterprises
Profiles of entrepreneurs who are best suited to manage sanitation enterprises and act as focal point (for sales to customers)
The amount and form of subsidies, which unlock household investment by the poorest but avoid distorting the market
The amount and types of promotional investmentsrequired to activate latent demand in a cost-effective manner
The appropriate range of productsthat balance customer choice and simplicity of the buying process while ensuring enterprise viability
Focus of this document
USAID, (2018). Scaling Market Based Sanitation: Desk review on market-based rural sanitation development programs, Washington, D.C.: USAID Water, Sanitation, and Hygiene Partnerships and Learning for Sustainability (WASHPaLS).
CREATING VIABLE AND SUSTAINABLE SANITATION ENTERPRISES: BIHAR, INDIA CASE STUDY
1
vi

This research addresses the enterprise viability and sustainability questions, for which we conducted retrospective studies in partnership with three mature MBS programs in Cambodia, India (state of Bihar), and Nigeria. As part of the retrospective studies, we realized that few – if any – MBS programs were tracking the financial performance of sanitation enterprises. Therefore, the project team interviewed enterprises that had received technical support from MBS programs to build detailed financial statements. We then undertook comparative analyses to identify the contextual and strategic choices (factors) that drove differences in performance among enterprises within the same program. We also assessed how enterprise-specific support provided by a particular MBS program influenced enterprise viability and sustainability.
This case study examines the experience of sanitation enterprises that were supported by Population Services International’s (PSI) Supporting Sustainable Sanitation Improvements (3Si) intervention in Bihar (India). We present research findings and make recommendations directed at MBS program implementers to help improve the viability and sustainability of the sanitation enterprises they support.
An entrepreneur’s strategic decisions made exclusively for the sanitation enterprise are reflected in its gross profit, a quantity dependent on the number of customers, the price of the various products offered, the costs of manufacturing various products, the relative quantities of products (each with different profits) sold by the enterprise, and the additional sanitation-related products that it sells.
We utilized Gross Margin Variance Analysis (GMVA) to compare the gross profits of pairs of different sanitation enterprises to identify the significant drivers of differences in their respective gross profits. Our analysis highlighted that enterprises employed different strategies to increase their gross profits in the 3Si context in Bihar (India), leveraging different combinations of the five drivers. Some high profit enterprises followed a revenue-growth strategy, acquiring more customers by investing in demand activation and customer service, and taking advantage of markets with a large base of unserved households. They increased prices by leveraging their strong reputation in the market and providing assurances on product quality. Finally, they captured a greater share of the customer’s wallet (the total amount spent by a customer on purchasing materials from one or more input suppliers required to build a toilet) by stocking and selling a greater share of sanitation-related products that carried higher profits. Other high profit enterprises followed a cost-reduction strategy to increase profits. They lowered manufacturing costs by using lower quantities of raw materials (without adversely impacting product quality) lowered labor costs by contributing their own labor. By contrast, less profitable enterprises did not follow a deliberate strategy to improve profits or were unable to implement one fully.
Additionally, we determined that sustainability is a challenge for enterprises that rely on sales agents but do not pay them. Enterprises were accustomed to PSI recruiting, managing, and paying sales agents and expected PSI to continue playing this role. Once PSI exited the market, most enterprises did not pay sales agents for their work. Paying sales agents cuts into profits, but the impact of this profit reduction is only significant among the worst-performing enterprises. Without commissions, those sales agents currently operating without any other income will exit the market. While all enterprises will be able to pay for other recurring business needs (such as investments in molds), the dependence on PSI for paying sales agents risks the longer-term continuity of enterprises.
CREATING VIABLE AND SUSTAINABLE SANITATION ENTERPRISES: BIHAR, INDIA CASE STUDY vii

1. INTRODUCTION
1.1. CONTEXT FOR THE STUDY
Inadequate access to sanitation remains a significant problem globally. According to the UNICEF-WHO Joint Monitoring Programme,2 2 billion people still do not have access to basic sanitation facilities, while 673 million people still practice open defecation. Inadequate sanitation is linked to the transmission of numerous communicable diseases—particularly cholera, dysentery, hepatitis A, typhoid, and polio—with a disproportionally large effect on children. The scale of investment required to deliver sanitation services to hundreds of millions of people around the world that currently lack access is likely beyond the capacity of public finance alone.
Market-based sanitation (MBS)—through which private sector actors supply toilets and related services to individual households—is a promising approach to deliver onsite sanitation products and services to low-income populations that are not connected to centralized wastewater collection and conveyance systems. Successful MBS interventions in Southeast Asia and Bangladesh demonstrate the promise of this approach, but the consistent achievement of scale of such interventions has been a challenge. A USAID desk review3 on MBS interventions identified a range of barriers to scaling sanitation market interventions, which included, among others, an inadequate supply base for toilets.
A central strategy of many MBS programs is to increase the participation by local entrepreneurs in the sanitation value chain, but fostering commercially viable and sustainable sanitation enterprises can be challenging. While the USAID desk review identified a range of tactics and factors that enabled enterprises to grow and thrive, more evidence on the key drivers of enterprise performance was needed. Furthermore, the review determined that implementers of MBS programs typically have a limited understanding of the viability and sustainability of the enterprises within their programs because most do not track the financial performance of enterprises. Monitoring enterprise performance is often limited to the number of toilets sold, which alone does not provide a complete picture; Table a. Acme and Best enterprise summary high sales volumes do not necessarily Metric correspond to large profits and vice versa. Consider two hypothetical sanitation enterprises: Acme and Best. Both sell toilets, albeit at different prices, and in different numbers (Table a). Despite Best selling only a third of the toilets as Acme, it generates a higher overall profit because of significantly higher profit (price less cost) per toilet. Meanwhile, while both enterprises are, strictly speaking, profitable, they are not necessarily viable or sustainable (see Box 1).
Acme Best Price per toilet (a) USD 50 USD 80
Cost per toilet (b) USD 40 USD 40
Profit per toilet (p=a-b) USD 10 USD 40
# of toilets sold (q) 30 10 Total Profit (p * q) USD 300 USD 400
2 United Nations Children’s Fund (UNICEF) and World Health Organization, (2019). Progress on household drinking water, sanitation and hygiene 2000-2017. Special focus on I\inequalities. New York: United Nations Children’s Fund (UNICEF) and World Health Organization.
3 USAID, Scaling Market Based Sanitation: Desk review on market-based rural sanitation development programs, Washington, D.C.: USAID Water, Sanitation, and Hygiene Partnerships and Learning for Sustainability (WASHPaLS) Project, USAID 2018.
CREATING VIABLE AND SUSTAINABLE SANITATION ENTERPRISES: BIHAR, INDIA CASE STUDY 1

Box 1: Profit, profitability, viability, and sustainability
Profit is the revenue generated by an enterprise in excess of its costs, expressed in absolute terms (USD).
Profitability refers to profit relative to the scale of an enterprise, such as profit margin—the ratio between profit and sales expressed as a percentage. Two enterprises may have equal profits (say, USD 1,000 annually), but one earning USD 1,000 in profit against USD 10,000 in sales is more profitable (10% margin) than another one earning USD 1,000 against USD 50,000 in sales (2% margin).
Viability refers to profit relative to one or more of explicit or implicit factors considered by an entrepreneur (e.g., minimum income expected; income from other non-sanitation specific enterprises; time and effort; or financial investment and risk). Unlike profit, or profit margin, which are specific numerical quantities, viability is a subjective measure which varies from entrepreneur to entrepreneur: an enterprise that makes a profit might be considered viable by one entrepreneur but not by another. Improving viability is in large part a function of increasing profits.
Sustainability refers to the likelihood that an enterprise remains viable over an extended period of time (i.e., multiple years) and continues operations without external, non-market-based support.
To aid MBS program implementers gain a better, more nuanced understanding of the factors influencing the viability and sustainability of enterprises so that they can better tailor the technical support provided, we analyzed the performance of sanitation enterprises supported by MBS interventions in Cambodia, India (state of Bihar), and Nigeria. This case study analyzes the enterprises supported by Population Services International’s (PSI) Supporting Sustainable Sanitation Improvements (3Si) in Bihar (India) and is organized as follows:
• Overview of the 3Si intervention and sanitation context in Bihar • Description of the methodology used to analyze the viability and sustainability of the enterprises • Background on the four enterprises selected for this comparative case study • Findings on the viability and sustainability of the four enterprises • Recommendations
1.2. BACKGROUND OF THE 3SI PROGRAM
The 3Si intervention was implemented from 2013 to 2017, aiming to create a functioning sanitation market in 19 rural districts in Bihar through coordinated demand and supply-side activities. 3Si featured four key components:
• Product Development: PSI worked with partners to develop a catalog of three products based on customer feedback. In practice, however, most customers ended up deferring their purchasing decision until they were in a position to buy the most expensive model. Observing this trend, PSI eventually offered the cheapest model as the standard product (Figure 1). A typical toilet retailed between USD 230–277, and the technical specifications qualified it for the government’s Swachh Bharat Abhiyan (SBA) subsidy of ~USD 185, improving affordability. The product also included experiential features about which consumers were enthusiastic (e.g., lighting, ventilation, and thick, sturdy roofing and walls).
• Cement Ring Manufacturer (CRM) + Model: PSI promoted a “network” model to aggregate different supply chain players. A network model has one player (known as the “focal point”) that provides one or multiple components required for a toilet and connects customers to other providers for procuring the remaining inputs and/or for constructing the toilet. PSI
CREATING VIABLE AND SUSTAINABLE SANITATION ENTERPRISES: BIHAR, INDIA CASE STUDY 2

Panel
Door
Superstructure
Soap Shelf
CubbyShelf
Pan
P-trap Interface
Y-Junction
PVC Pipe
{ P;<com Substructure
Cement ring
recruited CRMs to serve as the focal point enterprise. CRMs typically sold cement rings for the substructure and linked customers with other supply chain actors (e.g., pan suppliers, masons) for other components and services required to construct a toilet. PSI helped a few CRMs expand their product portfolio to stock additional components (e.g., plumbing components, pans, doors) and become a one-stop shop for purchasing a toilet. The CRMs also provided pit digging and installation services to customers. PSI facilitated the product expansion by persuading upstream hardware distributors to stock and supply enterprises with the additional components, especially items unavailable locally, at attractive terms. These measures helped address fragmentation in the supply chain while allowing customers to keep costs low (since it was often cheaper to negotiate and buy components from different suppliers instead of one supplier).
• Toilet Motivators: PSI recruited and paid “toilet motivators” (sales agents4) to sell toilets on behalf of sanitation enterprises. These agents were local individuals from a range of backgrounds who were paid commissions by PSI or the enterprises themselves (typically USD 2.31 per toilet). PSI assigned multiple villages to sales agents based on their home location. Sales agents organized group meetings in their assigned villages, conducted door-to-door visits, and followed up with prospective customers to persuade them to purchase toilets from local PSI-supported enterprises. PSI initially paid the commissions to sales agents out of the hope that enterprises would see the value of sales agents and follow suit. PSI discontinued direct commission payments and non-financial support to sales agents when it withdrew from the market in June 2017.
Figure 1: Typical toilet in 3Si intervention
• Access to Enterprise Loans: PSI helped develop a sanitation microfinance market for both customers and enterprises. PSI partnered with Friends of Women’s World Banking (FWWB), which received soft capital from funders and served as a fund manager. FWWB loaned the capital
Sales agent are a subset of the broader category of “Demand Activators” who sell toilets with or without commissions.
CREATING VIABLE AND SUSTAINABLE SANITATION ENTERPRISES: BIHAR, INDIA CASE STUDY
4
3

to microfinance institutions (MFIs) at a rate of 6–10% per annum, below the market rate of 12%, for onward lending. PSI educated MFIs on the economics and potential of the sanitation business. Incentivized by the seed capital, the MFIs developed loan products at market rates for both sanitation enterprises and customers. PSI also introduced enterprises seeking a loan to MFIs, which in turn independently conducted credit evaluations. MFIs issued 251 enterprise loans as of June 2017.5
1.3. SANITATION CONTEXT IN BIHAR
Before the start of the 3Si intervention (in 2013), 88% of Bihar’s population lived in rural areas, and 73% of the rural population defecated in the open6. Median toilet coverage stood at 23% in 2014 in 3Si’s target districts.7
Thirty-three percent of the rural population who did not have toilets had researched toilet options, according to a market study conducted by Monitor Deloitte in 2013, indicating considerable latent demand8 for toilets. Customers surveyed in the study cited safety, convenience, and privacy as the major reasons for wanting a toilet.9 The sanitation supply chain was highly penetrated but fragmented: customers typically bought different toilet materials from a range of suppliers, such as cement ring manufacturers (CRMs), hardware stores, or masons. There were few linkages among these different suppliers, and it could take months for a customer to buy and install a toilet.
From a policy perspective, sanitation was (and remains) a key focus of the national government through the SBA program. SBA started in 2014, focusing on eliminating open defecation (among other objectives), running campaigns to stimulate demand for toilets, and offering households a toilet purchase and installation subsidy of INR 12,000 (~USD10 185). A household received the subsidy after government representatives had verified that it had constructed a toilet.
1.4. INTERVENTION PERFORMANCE SUMMARY
PSI worked with 741 enterprises from 2013 to 2017. These enterprises sold 220,145 toilets (as of June 2017) (Figure 2), with toilet penetration increasing from 23% in 2014 to 28% in 2017 in 3Si’s target districts.11 Ninety-two percent (92%) of households that had purchased toilets were still using12 the
5 USAID. (2018). Scaling Market-Based Sanitation: Desk Review on Market-Based Rural Sanitation Development Programs. Washington, DC.: Water, Sanitation, and Hygiene Partnerships and Learning for Sustainability (WASHPaLS).
6 Sinha, Bikas, et al. (2016) Market Development: an Evolutionary Process for Rural Sanitation in Bihar, India. PSI. 7 Swacch Bharat Abhiyan. http://sbm.gov.in. (The website has been redesigned since the data was collected, so the specific page cannot be
sourced.) 8 Demand for a product or service that a consumer cannot satisfy because they do not have enough money, because the product or service
is not available, or because they do not know that it is available; source: Cambridge Dictionary. (August 15, 2019). Latent Demand. Retrieved from Cambridge Dictionary: https://dictionary.cambridge.org/dictionary/english/latent-demand.
9 Shah, Arpit, et al. (2013). A Market-Led, Evidence-Based Approach to Rural Sanitation. Monitor Deloitte. 10 USD 1 = INR 65; used throughout this case study. 11 Oxford Policy Management. (2018). Verification of Outcomes for the 3Si Project: Final Report. 12 Toilet usage defined as “in use” if at least 2 household members used the toilet consistently in the last 3 defecation occasions.
CREATING VIABLE AND SUSTAINABLE SANITATION ENTERPRISES: BIHAR, INDIA CASE STUDY 4

toilets in 2017.13 About 78%14 of enterprises that PSI had worked with were still active in 2017 (defined in this study as having reported sales of at least one toilet in 2017 to PSI) (Figure 3). The sales and number of enterprises trajectory in Figure 2 and Figure 3 demonstrate the scale-up phase of the 3Si intervention following the initial period of experimentation and iteration.15
Figure 2: Cumulative toilets sold (‘000) by year Figure 3: Active sanitation enterprises by year 700
579
0 6
220
0 20 40 60 80
100 120 140 160 180 200 220
Cum
ulat
ive T
oile
t So
ld (’
000)
23
89
600
468
179
48 3
Act
ive
Ente
rpri
ses 500
400
300
200
100
0 2013 2014 2015 2016 2017 2013 2014 2015 2016 2017
Source: PSI
13 PSI India. (2017). “Developing Markets for Sanitation: Where to Start?” SuSanA & BEAM Exchange. https://www.youtube.com/watch?v=ReZTD8XCOGU&feature=youtu.be.
14 78% of active enterprises is calculated using the data from PSI’s Management Information System but may not be completely accurate. During the field research, we discovered that a few enterprises identified as “active” had stopped selling toilets, while a few enterprises marked as “exited” were still active.
15 USAID, (2018). Scaling Market Based Sanitation: Desk review on market-based rural sanitation development programs, Washington, D.C.: USAID Water, Sanitation, and Hygiene Partnerships and Learning for Sustainability (WASHPaLS).
CREATING VIABLE AND SUSTAINABLE SANITATION ENTERPRISES: BIHAR, INDIA CASE STUDY 5

2. METHODOLOGY To help MBS programs improve the viability and sustainability of sanitation enterprises, we sought to understand the factors that differentiated enterprises at different levels of profit. We assume that viability and, by extension, sustainability, is largely a function of profit (see Box 1). We also recognized that contextual factors often favor or limit the ability of enterprises to implement business practices to improve their profits. Therefore, we studied enterprises in five districts where the 3Si program was implemented and aimed to select a sample of enterprises that operated in different market conditions.
We followed a three-step process:
• Direct interviews: We conducted detailed interviews with 28 active enterprises and six exited enterprises that were part of the 3Si program.
• Viability Analysis: We categorized enterprises based on their revenues and profit, and then undertook a comparative analysis of enterprises selected from each “revenue vs. profit” category to identify the business practices and contextual factors that drove differences in profits and thus impacted viability.
• Sustainability Analysis: Based on the viability analysis and our understanding of the 3Si program, we assessed enterprise sustainability.
We conclude with both general and specific recommendations for improving the viability and sustainability of sanitation enterprises, within the limitations posed by context.
2.1. DIRECT INTERVIEWS
This study is based primarily on in-person interviews with a sample of 28 active16 sanitation enterprises. We also interviewed six exited17 enterprises and 15 value chain players to understand the broader market system for sanitation. The interviews focused on understanding the economics (i.e., revenue, costs, and profit), strategic choices, and challenges faced by sanitation enterprises, and yielded the primary data on which this study is based. Interviews with exited enterprises sought to understand the reasons that led to their exit from the market and those with other value chain players focused on understanding the broader ecosystem for sanitation enterprises. Figure 4 presents a detailed interview schedule. The interviews were conducted in April 2018 with extensive field support from PSI.
It is important to note that our final sampling approach differed from our initial plan. In preparation for the field research, we had initially aimed to interview a sample of enterprises with diverse contextual and performance characteristics, using data from PSI’s Management Information System. To ensure diversity in enterprise context and performance in the sampling, we categorized both the markets where enterprises operated and the enterprises themselves based on such parameters as historical sales trends and the duration for which the enterprise had been operational. Our initial sample aimed to have a balanced mix of different enterprise categories across each market type (see Appendix 6.1). However, we had to modify our proposed approach to selecting enterprises because of several limitations to our sampling approach, which became apparent in our initial interviews. First, the data gathered from secondary sources, such as the sanitation coverage, did not reflect ground realities in the initial blocks18
16 Active sanitation enterprises are defined in this study as those that sold toilets when we conducted the research (April 2018). 17 Exited sanitation enterprises are defined in this study as enterprises that had sold toilets before we conducted the research (April 2018),
but had stopped selling toilets when we conducted interviews. 18 Block is an administrative district sub-division in India.
CREATING VIABLE AND SUSTAINABLE SANITATION ENTERPRISES: BIHAR, INDIA CASE STUDY 6

-
-
we visited. Second, even though we interviewed enterprises in different market types per our categorization, real-world conditions proved not significantly different across markets. Road connectivity had not posed a challenge in most places, and areas classified as “flood-prone” did not appear to warrant a different product design or pose a major challenge to the installation of toilets. In addition, while we had categorized sales performance by growth trends and duration, the distinction among such categories was not stark as we judged from the business acumen of entrepreneurs. Finally, the actual status of enterprises (active vs. exited) differed from PSI’s records in some cases. Therefore, instead of grouping enterprises by market type and sales trends, we decided that the focus of enterprise selection should primarily be on high and low sales enterprises while ensuring that we interviewed exited enterprises as well as reflected in the sampling plan in Figure 4.
Figure 4: Research locations and interviews conducted by actor
Interview Districts
Active enterprises
Exited enterprises
Demand activators
Input suppliers Masons
Begusarai 9 3 – – –
Muzaffarpur 7 2 1 1 –
Khagaria 6 – 3 – 1
Samastipur 3 1 4 1 1
Vaishali 3 – 3 – –
Total 28 6 11 2 2
3Si districts
2.2. ANALYTICAL APPROACH
To understand the factors that improve viability, we undertook a comparative analysis among enterprises with different levels of revenue and profit. We also identified factors likely to affect the sustainability of enterprises in the 3Si context and assessed the performance of different enterprises with respect to these factors. Our methodology for each of these analyses is presented below.
2.2.1. ANALYSIS OF DRIVERS TO IMPROVE PROFIT
To evaluate the performance of enterprises, we needed data not only on sales volumes (collected by PSI) but also on prices, costs, revenues, and profits. We collected these data in our interviews with the enterprises (as well as other value chain players) to prepare profit and loss (P&L) statements for the 28 enterprises (see Appendix 6.2 for definitions and additional details on P&L Statements). The primary
CREATING VIABLE AND SUSTAINABLE SANITATION ENTERPRISES: BIHAR, INDIA CASE STUDY 7

f------------+------------1◄
metric we computed to assess profit was cash net profits19, which can be understood as the “bottom line” of the businesses and which exclude non-cash expenses, such as asset depreciation. By contrast, the term net profit includes non-cash expenses. We opted to analyze the businesses based on cash net profits because these small rural sanitation enterprises typically understand profit in terms of cash and do not account for non-cash expense items. Henceforth, we refer to cash net profits as “profits” unless mentioned otherwise.
We then classified enterprises into four categories (see Figure 5) based on profit and revenue to study the differences between high-performance and low-performance enterprises.
• Profits: we classified enterprises as either “high profit” or “low profit,” using the threshold of USD20 2,700 (twice a typical mason’s annual income21 in Bihar) to separate the two classes.
• Revenues: we classified enterprises as “high revenue” and “low revenue” using the median sales revenue (USD 13,800) during 2017 as the threshold between the two classes. Revenue is an indicator of an enterprise’s scale, and we hypothesized that enterprises adopt different profit-maximizing strategies at different scales. We chose the median as it is a neutral metric (i.e., it is not impacted by the presence of a few abnormally high or low values in the sample), and offered a reasonable approach to separating “high” and “low” revenue enterprises.
Figure 5: Enterprise performance categories
Prof
it 2x Mason’s income = USD 2,700
Low Revenue,High Profit (“Small HP”)
High Revenue,High Profit (“Large HP”)
Low Revenue,Low Profit (“Small LP”)
High Revenue,Low Profit (“Large LP”)
High
Median revenue = USD 13,800
performance
Low performance
Revenue
We chose to employ these thresholds, but we note that we could have used other techniques to define the business categories. These thresholds met our objectives of 1) being computationally
19 AccountingTools, Inc. How to calculate cash profit. 7 August 2019. <https://www.accountingtools.com/articles/how-to-calculate-cash-profit.html>
20 1 USD = 65 Indian Rupees (INR); used throughout this case study. 21 We assume mason income to be INR 400 (USD 6.15) per day based on interviews with masons in our research. Conservative estimate of
mason income: USD 6.15 per day X 6 days per week X 4.3 weeks per month X 8.5 months of active labor (adjusting for 3.5 months of downtime during and around the monsoon season) = ~USD 1,350.
CREATING VIABLE AND SUSTAINABLE SANITATION ENTERPRISES: BIHAR, INDIA CASE STUDY 8

T
D D
··------
-------------------------t ◄
straightforward and 2) coming up with categories that differed significantly in terms of performance to enable an analysis of differences.
In Figure 6, we plot the position of the 28 active enterprise-sample from the 3Si program (covered in our research) relative to the four categories. Most are either in the low revenue, low profit (“Small LP”) or high revenue, high profit (“Large HP”) categories.
Figure 6: Profit (USD) vs. revenue (USD) for the sampled sanitation enterprises supported by the 3Si program (2017) (n=28)
Prof
it (U
SD)
Median revenue: USD 13,800 22,000
20,000
18,000
16,000
14,000
12,000
10,000
8,000
6,000
4,000
-2,000
-4,000 20,000 60,000 140,000 160,000 40,000 120,000 0 100,000 80,000
0
Revenue (USD)
Small HP (n=4)
Large HP (n=11)
Large LP (n=3)
Small LP
(n=10)
Shyam’s enterprise Ram’s enterprise Revenue: USD 32,331 Profit: USD 9,927
Neeraj’s enterprise Revenue: USD 25,234 Profit: USD 1,718
Profit: USD 3,969 Revenue: USD 8,660
Suraj’s enterprise Revenue: USD 8,565 Profit: USD 831
2X Mason’s income: 2,000 USD 2,700
To understand the strategic choices that drive enterprise performance, we selected one enterprise from each category for further analysis (circled in Figure 6). Our analyses sought to identify a range of lessons on improving viability, on the premise that enterprises in different categories employed distinct business practices and/or operated under different business conditions.
We compared the relatively low performing enterprises (“Small LP” and “Large LP”) with the high performing enterprises (“Small HP” and “Large HP”) using a methodology called Gross Margin Variance Analysis (GMVA—see Appendix 6.3 for a detailed explanation). GMVA examines a measure of financial performance called gross profits: the difference between revenue from the sale of toilets and costs incurred exclusively for manufacturing the toilets sold (see Box 2). As GMVA can only be conducted between two enterprises at a time, we conducted the following comparisons:
• “Small LP” vs. “Small HP” (Suraj’s enterprise vs. Ram’s enterprise) • “Small LP” vs. “Large HP” (Suraj’s enterprise vs. Shyam’s enterprise) • “Large LP” vs. “Large HP” (Neeraj’s enterprise vs. Shyam’s enterprise)
These comparisons reflect the three different paths that enterprises can take to improve viability (see Figure 7). Path 1 represents strategies to grow a “Small LP” enterprise into a “Small HP” one by increasing profits. Path 2 reflects strategies to grow a “Small LP” into “Large HP” enterprise, and Path 3 presents an approach to growing “Large LP” enterprises into “Large HP” enterprises.
CREATING VIABLE AND SUSTAINABLE SANITATION ENTERPRISES: BIHAR, INDIA CASE STUDY 9

Figure 7: Potential path(s) to improve the viability of sanitation enterprises
Prof
it
Low Revenue, Hig
h
High Revenue, High Profit High Profit (“Small HP”) (“Large HP”)
21 3
Low Revenue, High Revenue, Low Profit Low Profit
Low (“Small LP”) (“Large LP”)
Low Revenue High
We note that this analysis relies on cash net profits to categorize enterprises but on gross profits to compare the drivers of their performance; see Box 2 for an explanation of why this is so. GMVA decomposes the difference in gross profits between two enterprises into its constituent components, or drivers. The five drivers are the following:
• The number of customers that bought different products from the enterprises • The prices of the different products sold • The costs of manufacturing different products • The relative quantities of the common, sanitation-related products (i.e., substructure and
interface components) sold by enterprises (also known as common product mix) • The additional, sanitation-related products (such as superstructure components) sold by one
enterprise but not by the other
Our application of GMVA, in which we compare two different enterprises, is novel; the conventional application of GMVA is for a single business to compare budgeted profits to actual profits or to compare profits from different accounting periods, in order to identify the drivers that explain the differences. While we are enthusiastic about the utility of GMVA to understand profit drivers of different businesses, we offer the following limitations of the method.
First, GMVA does not account explicitly for the role of market conditions (e.g., customer preferences or availability of raw materials) in influencing viability, as they are not quantified or directly attributed to any of the five drivers. To overcome this limitation, we complemented GMVA with a qualitative analysis of the market conditions of each enterprise, and describe their role throughout the Findings and Recommendations sections.
Second, the results from the GMVA may vary depending on the enterprises selected for analysis. GMVA can only be conducted between two enterprises at a time, and different pairs of enterprises may reveal different differences in profit drivers. While our selection of enterprises for this case study was aimed at highlighting the impact of a range of drivers, we also conducted GMVA on a few other enterprise pairs to improve the external validity of our findings and arrive at broad-based recommendations in the 3Si context. Recommendations for a specific enterprise could, however, vary based on the GMVA results from comparison with another enterprise. Appendix 6.3 provides a detailed explanation of GMVA, and Appendix 6.4 illustrates additional GMVA analyses.
CREATING VIABLE AND SUSTAINABLE SANITATION ENTERPRISES: BIHAR, INDIA CASE STUDY 10

Box 2: Why use one financial measure (cash net profit) to categorize enterprises and a different one (gross profits) to compare them?
Sanitation enterprises are generally not stand-alone businesses; they function as one of multiple business lines operated by an entrepreneur. To understand how effectively a sanitation enterprise is contributing to an entrepreneur’s overall financial success, cash net profits are ideal because they represent the “bottom line”: profits realized after accounting for all cash expenses. The higher the cash net profit of a sanitation enterprise, the more likely an entrepreneur will deem it “viable”, that is worthy of the time, investment, and opportunity cost.
Gross profits, on the other hand, are better for understanding the differences in financial performance of sanitation enterprises (as one of multiple businesses) because the measure focuses on the two most basic financial line items: revenue, and the cost of goods sold (COGS)—the costs of manufacturing toilets (see Figure 8 for a list of line items of a Profit & Loss statement). An important difference between gross profits and cash net profits is that gross profits exclude expenses that are influenced primarily by the entrepreneurs’ other non-sanitation related business (or businesses), such as rent and utilities. Entrepreneurs are unlikely to make decisions on factors such as location of the workshop or investment in transport vehicles solely for the sanitation enterprise, as they will also consider the requirements of their other business (or businesses). Cash net profits also include other expenses such as interest payments and taxes, which are not comparable across enterprises since access to finance and compliance with tax codes vary widely considering the informal nature of most rural sanitation enterprises in developing countries.
It is also worth noting that COGS typically constitute the majority of total costs for sanitation enterprises (84% of total costs at the median level for the 28 sampled enterprises in the 3Si program). The potential to improve cash net profits, therefore, is primarily driven by the potential to improve gross profit.
Figure 8: Line items of a Profit & Loss Statement of a typical sanitation enterprise
TOTAL REVENUE
COST OF GOODS SOLD
Raw materials
Direct labor
Transport of raw materials
GROSS PROFIT (Total Revenue – Cost of Goods Sold)
OPERATING EXPENSES
Transport for delivery
Land rent
Utilities
Marketing (commissions)
Marketing (non-commission)
Repairs
Depreciation
Bad debt
OPERATING PROFIT(Gross Profit – Operating Expenses)
OTHER EXPENSES
Interest
Tax
NET PROFIT (Operating Profit – Other Expenses)
CASH NET PROFIT (Net Profit + Depreciation)
Line items influenced by decisions related to the sanitation enterprise
Line items influenced by decisions related to the non-sanitation business
Line items influenced by decisions related to the sanitation enterprise
Line items influenced by decisions related to the non-sanitation business Line item influenced by decisions related to the sanitation enterprise
Line items not applicable to all enterprises
CREATING VIABLE AND SUSTAINABLE SANITATION ENTERPRISES: BIHAR, INDIA CASE STUDY 11

2.2.2. SUSTAINABILITY ANALYSIS
The sustainability of sanitation enterprises depends on their ability to finance and operate their businesses without ongoing non-market support. We analyzed the enterprises’ financial and operational independence to develop a broad view of their sustainability:
• Financial independence: we estimated an enterprise’s ability to pay for all recurring expenses (i.e., day-to-day operations) and their ability to make reinvestments (i.e., long-term capital expenditure such as equipment) for running the sanitation business. We assessed the ability to pay for recurring expenses by identifying any recurring expenses for which enterprises were dependent on PSI; in the 3Si context, many enterprises relied on PSI for paying sales agents. 11 of the 28 surveyed enterprises were benefitting from sales agents but not paying them. We then calculated the decrease in profit of these enterprises if they–instead of PSI–paid sales agents the standard commission (USD 2.31 per toilet).
In the 3Si context, the main reinvestment cost was the mold to manufacture toilets. We considered the cost and shelf life of the four enterprises’ current molds, assumed that profits stay at their current levels for the next few years, and calculated the share of profit that enterprises would need to set aside each year to replace the molds after their shelf lives.
We note that in some instances, enterprises may receive one-time financial support from PSI, but we did not consider such support for assessing financial independence since it will not impact future financial performance.
• Operational independence: This was assessed based on the absence of any ongoing support (non-financial) that enterprises received from non-market actors. We identified the ongoing non-financial support provided by PSI; in the 3Si context, this consisted primarily of connections to sales agents and other value chain players. We evaluated if these connections would continue after PSI exits the market, based on interviews with entrepreneurs and value chain players.
We also note that in some instances, enterprises might have received one-time operational support from PSI, but we did not consider such support for assessing operational independence since enterprises are unlikely to need the support again in the future.
CREATING VIABLE AND SUSTAINABLE SANITATION ENTERPRISES: BIHAR, INDIA CASE STUDY 12

3. ENTERPRISE BACKGROUND Suraj, Neeraj, Ram, and Shyam are four entrepreneurs running sanitation enterprises in Bihar. On the surface, they share some common characteristics; they have been CRMs for many years and participated in PSI’s 3Si program. However, they have distinct backgrounds and achieved widely varying enterprise performance.
This section provides a brief background of the four entrepreneurs, while the next section analyzes the viability and sustainability of their enterprises.
3.1. SURAJ
Suraj’s enterprise is in the Sahdei Buzurg block of Vaishali. He spent many years making cycle seat covers and then worked as a pit digger for cement rings. He struggled to cover his household expenses, so he decided to open a business to sell cement rings.
PSI approached Suraj to join the 3Si program in 2016. He was happy to join the program, as he was already in the business, and PSI promised him access to loans and cheaper raw materials. He began stocking pit covers after joining the program but remained largely independent from PSI. His interactions with PSI were limited, and he did not use them to access their sales agents or business credit.
Suraj is disappointed with the profits generated by his sanitation enterprise as compared to his initial expectations because both competition and raw material costs have increased. His sales (140 toilets sold in 2017) are lower than many other enterprises in the program, but he believes that demand for cement rings will go up as awareness of toilets increases. He plans to continue operating the sanitation enterprise, as this is the only business that he knows.
3.2. NEERAJ
Neeraj’s enterprise is in the Dandari block of Begusarai. He performed a variety of jobs before establishing a sanitation enterprise. He was an employee at a grocery store and then became a petrol pump attendant. In 2010, he collaborated with a friend to start a CRM business, though this partner is no longer part of the enterprise.
When PSI approached him in 2014, he was skeptical, deciding to join the program only after inquiring about PSI, among other CRMs in Begusarai. PSI encouraged him to expand his product offerings with the help of MFI loans, which he did. He faced intense competition from other businesses, which forced him to reduce prices.
Despite achieving relatively high sales (580 toilets sold in 2017), he questions the viability of the sanitation enterprise. He often suffers from a shortage of labor and working capital. He will, however, continue operating the business but does not believe that it will ever provide income higher than that required to cover his basic livelihood needs.
3.3. RAM
Ram’s enterprise is in the Alauli block of Khagaria. He has been a mason for many years and still performs masonry for half the year. He started his own cement ring business in 2014 and perceived that local demand for toilets would increase over time.
CREATING VIABLE AND SUSTAINABLE SANITATION ENTERPRISES: BIHAR, INDIA CASE STUDY 13

When PSI approached him in 2015, he joined the program for the business support services, as well as possible access to enterprise credit. Ram’s income from his masonry work supported the operating expenses of his sanitation enterprise, so he did not apply for a loan. He attributes his toilet sales (141 toilets in 2017) to the government drive to achieve the “Open-Defecation Free” status in his block.
While his sales are relatively low, Ram is pleased with the profits generated by his sanitation enterprise, as well as the freedom it affords to run his own business for half the year. He is content to continue the business but is unwilling to shoulder the risk of expanding and stocking products other than cement rings and pit covers.
3.4. SHYAM
Shyam’s enterprise is in the Khanpur block of Samastipur. He has been in the sanitation business for over a decade, starting out as a part-time sub-contractor manufacturing cement rings with a local NGO. Concurrently, he ran a business selling life insurance policies and distributing food ration cards. PSI approached him to serve as a sales agent in 2014, but he decided to open his own business soon after to sell cement rings and pit covers.
His sanitation enterprise grew rapidly on the strength of his social network; he was part of the local panchayat22 leadership committee for five years. He actively marketed his sanitation enterprise, working with sales agents (recruited either by him or PSI) and convening village meetings to spread awareness about his business. As Shyam’s enterprise gained traction, he took out MFI loans in 2016 to stock additional, sanitation-related components, which grew his profits further.
He believes the sanitation enterprise has a promising future for at least 10 years but expects sales to decline as the market saturates with increasing coverage.
22 Panchayat is the lowest unit of local governance in villages in India. It is a local government elected by voters of their respective jurisdiction; Definition retrieved from Ministry of Panchayati Raj, Government of India
CREATING VIABLE AND SUSTAINABLE SANITATION ENTERPRISES: BIHAR, INDIA CASE STUDY 14

4. FINDINGS The four selected enterprises differed significantly in their performance and viability (achievement of profit adequate to motivate the entrepreneur to continue operating). Given that all four enterprises joined the 3Si program, we raise two key questions:
• What were the business practices and enabling conditions that differentiated the sales and profit performance of the four sanitation enterprises?
• Are the four sanitation enterprises sustainable without PSI in the market?23
4.1. ANALYSIS OF DRIVERS TO IMPROVE PROFIT
We conducted a GMVA between the following pairs of enterprises to understand the three potential viability paths introduced in Figure 7:
• Suraj’s “Small LP” enterprise to Ram’s “Small HP” enterprise • Suraj’s “Small LP” enterprise to Shyam’s “Large HP” enterprise • Neeraj’s “Large LP” enterprise to Shyam’s “Large HP” enterprise
Since the four enterprises sold different sets of products (see Table 1), the potential drivers of variation in their gross profits were differences in:
• the number of customers that bought these products from the enterprise; • the prices of these products; • the costs of manufacturing these products; • the proportion of the average number of units of common products (cement rings and pit
covers per Table 1), sold per customer, known as the common products mix; and • the additional sanitation-related products sold by one enterprise and not the other (products
others than cement rings and pit covers).
Table 1: Products sold by enterprise24 (2017)
COMPONENT SURAJ (“Small LP”)
NEERAJ (“Large LP”)
RAM (“Small HP”)
SHYAM (“Large HP”)
Cement rings (substructure)
Pit covers (substructure)
Interface components25
Superstructure components26
23 PSI ended the first phase of the 3Si program in June 2017 and withdrew from the market. Although PSI started a second phase in late 2018, the program did not provide support to enterprises when we conducted the research.
24 The enterprises that sold interface and superstructure components sold a subset of the components mentioned in footnotes 22 and 23. 25 Interface components include pans, P-traps, Y-junctions, and PVC pipes (see Figure 1 for a visual representation). 26 Superstructure components include roof panels, doors, soap shelves, cubby shelves and ventilators (see Figure 1 for a visual
representation).
CREATING VIABLE AND SUSTAINABLE SANITATION ENTERPRISES: BIHAR, INDIA CASE STUDY 15

The diagrams in Figure 9, Figure 10, and Figure 11 are known as GMVA “bridges.” The left-most bar indicates the annual gross profits generated by one enterprise, and the right-most bar indicates those generated by the comparison enterprise. Box 3 provides guidance on interpreting these GMVA bridges.
Box 3: Interpreting GMVA bridges
The GMVA “bridge” between two enterprises decomposes the overall difference in their gross profits (represented by the first and the last blue bars) into their constituent “drivers.” The drivers are represented by the “floating” bars between the blue gross profit bars of the two enterprise on each end of the diagram and consist of the following.
• the number of customers to whom they sold; • the prices charged by the two enterprises for the same product(s); • the costs incurred by the two enterprises to manufacture the same product(s); • the proportion of the average number of units of common products sold per customer (known as the
common products mix); and • the additional, sanitation-related products sold by one enterprise and not the other; in this case
study, the superstructure components satisfy the criterion.
The height of each bar signifies the impact of the corresponding driver on the gross profit difference between the two enterprises.
The green and red colors of each bar indicate whether the effect on gross profit difference is positive or negative with respect to the enterprise on the right. For example, if the enterprise on the right enjoys higher prices or lower costs than the enterprise on the left, the corresponding bars will appear green because they represent a gross profit advantage to the enterprise on the right. Conversely, if the enterprise on the right suffers lower prices or higher costs than the enterprise on the left, the corresponding bars will be red because they represent a gross profit disadvantage.
CREATING VIABLE AND SUSTAINABLE SANITATION ENTERPRISES: BIHAR, INDIA CASE STUDY 16

I I I
• I I I
I
I I I
•
Figure 9: GMVA bridge (USD) between Suraj’s enterprise (“Small LP”) and Ram’s enterprise (“Small HP”) (2017)
1,701
4,078
607
1,831
(111)
12
38
+2,377
Gross profit No.of Prices Costs Common Additional, Gross profit (Suraj’s customers products mix sanitation- (Ram’s
Enterprise) related Enterprise) products
In Figure 9, we see that Ram’s enterprise generated nearly USD 2,400 more in annual gross profits than Suraj’s enterprise, primarily due to its lower costs (by reducing raw material quantities for manufacturing products and the entrepreneur performing labor himself, instead of hiring labor). See section 4.1.3 for further details. The other source of advantage was Ram’s ability to charge marginally higher prices (USD
per5.40 ring, USD 0.20 higher than that charged by Suraj). Ram did incur a slight disadvantage stemming from its product mix, but it was negligible compared to its advantage from the other factors. There was no significant difference in their customer bases and average units of their common products sold per customer.
CREATING VIABLE AND SUSTAINABLE SANITATION ENTERPRISES: BIHAR, INDIA CASE STUDY 17

Figure 10: GMVA bridge (USD) between Suraj’s enterprise (“Small LP”) and Shyam’s enterprise (“Large HP”) (2017)
1,701
13,274
2,296
2,256
3,388
1,779
1,854
+11,573
Gross profit No.of Prices Costs Common Additional, Gross profit (Suraj’s customers products mix sanitation- (Shyam’s
Enterprise) related Enterprise) products
Shyam’s enterprise achieved vastly higher gross profits than Suraj’s enterprise (Figure 10), with major advantages across every driver. Shyam’s investment in demand activation and customer service and his location in a larger potential market for toilets led to higher toilet sales (see section 4.1.1), and the enterprise sold its toilets at higher prices, due to Shyam’s strong positioning in his market (see section 4.1.2). Moreover, lower labor costs contributed to Shyam’s enterprise having a cost advantage over Suraj’s enterprise (see section 4.1.3). Shyam also had a more favorable common product mix, selling relatively more pit covers compared to Suraj, as the former’s customers preferred purchasing all products from a single shop (see section 4.1.4). Finally, Shyam’s enterprise had higher sales of additional, sanitation-related products, as its customers preferred purchasing all products from a single shop, and Shyam was able to stock additional products through working capital loans (see section 4.1.5).
CREATING VIABLE AND SUSTAINABLE SANITATION ENTERPRISES: BIHAR, INDIA CASE STUDY 18

------
Figure 11: GMVA bridge (USD) between Neeraj’s enterprise (“Large LP”) and Shyam’s enterprise (“Large HP”) (2017)
2,577
13,274
10,112
3,770
(55)
(2,014)
(1,115)
+10,697
Gross profit No.of Prices Costs Common Additional, Gross profit (Neeraj’s customers products mix* sanitation- (Shyam’s
Enterprise) related Enterprise) products
Note: *We consider only cement rings and pit covers as common products when analyzing the four enterprises together, but the GMVA bridge between Neeraj’s enterprise and Shyam’s enterprise includes other select sanitation-related products (such as pans and p-traps) as part of the common products mix, and not the additional, sanitation-related products. Because both enterprises sell these products, they qualify as common products.
Shyam’s enterprise also outperformed Neeraj’s enterprise (Figure 11), but for reasons different from the drivers that explain its performance compared to Suraj’s enterprise. The bulk of its gross profit advantages are driven by its ability to charge higher prices due to Shyam’s high social standing, reputation, and high level of customers’ trust (see section 4.1.2). Shyam’s common product mix was also favorable, with greater sales of pit covers driven by his customers’ preference to purchase most, if not all, components from a single supplier (see section 4.1.4 for further details). These advantages far outweighed the disadvantages of a smaller customer base and higher costs relative to Neeraj’s enterprise. Neeraj’s enterprise lowered his enterprise’s costs by reducing raw material quantities and manufacturing some toilets himself, thus decreasing labor costs (see section 4.1.3). The difference in their sales of additional, sanitation-related products was marginal, with both enterprises selling interface and superstructure components (see section 4.1.5).
These three GMVA bridges make clear that each of the five gross profit drivers may play a role in driving performance difference, in varying proportions depending upon the enterprises being compared. The specific business practices and enabling conditions that led to these differences are described in subsequent sections with the aim of identifying strategies to increase profits.
4.1.1. NUMBER OF CUSTOMERS
Among the four enterprises, Shyam and Neeraj’s enterprises built larger customer bases. They sold to 329 and 580 customers, respectively, compared to just 140 for Suraj’s enterprise and 141 for Ram’s enterprise.
CREATING VIABLE AND SUSTAINABLE SANITATION ENTERPRISES: BIHAR, INDIA CASE STUDY 19

..
Both Neeraj and Shyam benefited from being located in much larger potential markets than Ram and Suraj (see Figure 12). We estimated the market size using government data on the change in sanitation coverage in the enterprise’s location.29
Figure 12: Number of customers (2017) vs. market size27 (households) by enterprise
Number of customers
600
550
500
450
400
350
300
250
200
150
100
50
0 Market size
In addition to benefiting from a large market size, Shyam grew his customer base by actively investing in demand activation and strengthening relationships with customers through a range of different activities. Shyam was the only entrepreneur out of the four who leveraged sales agents to market toilets. He worked with nine sales agents, some of whom were recruited by PSI and others whom he recruited himself. He selected sales agents who had significant social influence in their communities (such as village heads) and directly paid them their commissions (~USD 3.10 per toilet) instead of relying on PSI (which was the case with most enterprises part of the 3Si program). Furthermore, his commissions were higher than those paid by PSI (USD 2.31 per toilet). Shyam’s sales agents thus secured the vast majority (75%) of his customers. Shyam also employed other demand activation tactics, such as convening regular village meetings in different villages to promote his toilet products and services. He was able to do this at a negligible cost because, as an active civic participant, he fostered strong relationships with community leaders.
In addition to demand activation, Shyam was proactive in assisting his customers on a variety of matters beyond selling them toilets. He (like the other three entrepreneurs) provided toilets on credit (i.e., allowing customers to pay in installments), providing full credit to 20% of his customers, and partial credit to another 20%.28 He believed that offering credit improved sales, and was often necessary to maintain positive community relationships. In addition to credit sales, he assisted customers in availing the Swacch Bharat Abhiyan subsidy to facilitate toilet purchase by helping fill out forms or working with local leaders to expedite funds disbursement. The subsidy helped increase sales, and the broader activities helped Shyam further build trust with customers.
Ram Suraj
Neeraj
Shyam
0 500 1,000 1,500 2,000 2,500 3,000 3,500 4,000
27 Market size is estimated to be the number of households that adopted improved sanitation between 2014 and 2018 in the enterprise’s block; data is sourced from Swacch Bharat Abhiyan. http://sbm.gov.in. (The original webpage content is unavailable because the website and webpage have been redesigned since the time the data was collected.)
28 Full credit does not require the customer to pay any amount up front when purchasing the toilet. Partial credit requires the customer to pay a partial amount up front.
CREATING VIABLE AND SUSTAINABLE SANITATION ENTERPRISES: BIHAR, INDIA CASE STUDY 20

G) •
While Neeraj was essentially passive in his marketing efforts, he was able to acquire more customers by charging lower prices relative to other enterprises (not presented in this case study) operating in his district, Begusarai (see Figure 13). He was located in an area with several competitors and needed to lower his prices to differentiate his enterprise in the market.
Suraj and Ram did not use any marketing tactics to
“Where I started a few years back, there were very few competitors in this area. Now, there are 2-3 competitors on this road alone. I need to lower prices to attract more customers.” - Neeraj
acquire customers and relied predominantly on walk-ins and word-of-mouth to generate sales. They also did not lower their price to differentiate themselves in their markets and attract customers.
Figure 13: Price (USD) per cement ring29 for enterprises located in Begusarai (2017)
Price per cement ring
4.1.2. PRICES
Among the four enterprises, Shyam’s enterprise was able to charge the highest prices, while Neeraj’s enterprise had the lowest (see Figure 14).
Figure 14: Price (USD) per cement ring by enterprise (2017)
6.2
5.4 5.2
3.1
0
1
2
3
4
5
6
7
Neeraj
Other enterprises in Begusarai
Suraj Neeraj Ram Shyam
29 All analyses in this case study will focus on cement rings (instead of other products) as it is common to all enterprises (not just the four enterprises selected for this case study) and generates the major share of their revenues and profits (see Figure 21).
CREATING VIABLE AND SUSTAINABLE SANITATION ENTERPRISES: BIHAR, INDIA CASE STUDY 21

Shyam was able to charge higher prices due to a reputation for producing high-quality products. He “My customers buy from me because already enjoyed the trust of customers, as he had a they trust me. They know that I offer strong social standing due to his involvement in good quality products. I often give acommunity affairs and politics. He built on this trust by
guarantee of 100 years on my offering product guarantees and providing additional cement rings.” - Shyam services to help customers complete purchases. He
became the preferred seller for toilets in his market, enabling him to charge higher prices without significantly affecting sales.
Neeraj charged lower prices because he believed that discounting was the only way for him to attract customers in his market. He was located in an area with several competitors and did not have the same social networks or reputation as Shyam did in his community.
4.1.3. COSTS
Neeraj and Ram’s enterprises had lower costs for manufacturing toilets. They reduced both their raw material costs and labor costs (see Figure 15). Shyam’s enterprise was able to offer nominally lower labor rates because his particular market allowed for it.
Figure 15: Total manufacturing cost (USD), raw material cost (USD), and labor cost (USD) per cement ring by enterprise (2017)
USD 4.1 Labor cost Raw material cost
2.2 1.9 1.8 2.0
1.9
0.8 0.9
1.4 USD 2.7
Suraj Neeraj
USD 3.4
USD 2.8
Figure at the top of the bar represents total cost of manufacturing a cement ring
Ram Shyam
Neeraj and Ram reduced their raw material costs by lowering the quantities of materials used in manufacturing cement rings. Neeraj reduced the quantities of cement, while Ram reduced the quantities of both cement and sand (see Table 2). According to Neeraj and Ram’s own reporting, these cost-cutting measures did not appear to impact the structural integrity or durability of the products significantly, but we could not independently verify this claim.
CREATING VIABLE AND SUSTAINABLE SANITATION ENTERPRISES: BIHAR, INDIA CASE STUDY 22

Table 2: Quantities of key raw materials per cement ring by enterprise (2017)
MATERIAL SURAJ NEERAJ RAM SHYAM
Cement (kg) 8.10 5.57 7.14 8.33
Sand (tin30) 0.97 1.00 0.86 0.83
Stone (tin) 0.97 1.00 1.00 0.83
The procurement prices of raw materials were broadly similar for all enterprises (see Figure 16 and Figure 17), indicating that material quantity reduction was the primary lever used by Neeraj and Ram to reduce material costs.
Figure 16: Procurement cost (USD) of Figure 17: Procurement cost (USD) of cement bag31 by enterprise (2017) sand (tin) and stone (tin) by enterprise (2017)
5.4 5.4 0.9 Sand (tin) 4.9 4.9
Suraj Neeraj Ram Shyam
Stone (tin)
0.7 0.7
0.6 0.6 0.5 0.5 0.5
Suraj Neeraj Ram Shyam
Neeraj and Ram further lowered costs by manufacturing products themselves without hiring casual or permanent
“I cast rings and drag the cart myself. Ilabor. They undertook the work of casting cement rings and only need to hire laborers for digging and pit covers themselves, hiring casual labor only to assist with installation. Why should I pay others when the installation and digging of pits. Ram was able to do this for
all his toilets (given his lower sales volumes), while Neeraj did I can do the work myself?” - Ram this for about 20% of his toilets, which still lowered his average labor costs per cement ring.
The combined effect of both raw material and labor cost reduction helped Ram’s enterprise realize the highest unit profit32 (as a proportion of price) while enabling Neeraj’s enterprise to generate a positive unit profit despite the lowest prices (see Figure 18).
30 Local unit of measurement of volume equivalent to 1.5 cubic feet. 31 One cement bag contains 50kg of cement. 32 Unit profit is defined as the price of one unit of a product less the cost of manufacturing one unit of the product.
CREATING VIABLE AND SUSTAINABLE SANITATION ENTERPRISES: BIHAR, INDIA CASE STUDY 23

• • •
• •
Figure 18: Unit profit, labor cost and raw material cost as a proportion of unit price (USD) per cement ring by enterprise (2017)
USD 6.2
21%
Neeraj
37% 12%
42%
28%
60%
17%
50%
33%
45%
USD 5.2
23%
33%
USD 3.1
USD 5.4 Unit profit (as % of price) Labor cost (as % of price) Raw material cost (as % of price)
Total, i.e., 100% corresponds to price of a cement ring
Suraj Ram Shyam
4.1.4. COMMON PRODUCTS MIX
All four enterprises sold two common products: cement rings and pit covers. While all enterprises sold 10 cement rings per customer on average (the number of rings required for a standard substructure of two pits), Shyam’s enterprise sold a higher number of pit covers per customer on average (see Figure 19).
Figure 19: Number of units sold per customer by enterprise (2017)
10.0 10.0 10.0 10.0
Suraj Neeraj Ram Shyam
Cement rings Pit covers
2.0
0.5 0.4 0.1
While two pit covers are required for a standard substructure of two pits, only Shyam was able to actually sell two pit covers to each customer on average. Shyam’s customers also preferred buying all the components of the substructure from him, as they trusted his quality and did not want to invest additional time in looking for other suppliers, whereas the other enterprises’ customers sometimes purchased different components from another vendor, comparison shopping for price.
The higher sales of pit covers helped Shyam capture a greater share of wallet (i.e., the total spend by a customer to acquire a toilet from one or more input suppliers) and generated an additional USD 7.3 in unit profit per customer (see Figure 20).
CREATING VIABLE AND SUSTAINABLE SANITATION ENTERPRISES: BIHAR, INDIA CASE STUDY 24

Figure 20: Unit profit (USD) per customer (on average) through the sale of pit covers33 by enterprise (2017)
7.3
1.3 1.7
0.1
Suraj Neeraj Ram Shyam
4.1.5. ADDITIONAL SANITATION-RELATED PRODUCTS
Neeraj and Shyam’s enterprises sold additional sanitation-related products alongside cement rings and pit covers. Ram’s enterprise also did so, but his additional sales volumes were negligible.
Both enterprises sold all the components of an interface34 and a few superstructure35 components (see Figure 1). Shyam and Neeraj were able to sell additional products because they were in markets where customers preferred buying a majority, if not all, of the sanitation-related components, including those for the superstructure, from the same shop (i.e., a “one-stop shop” delivery model). Furthermore, both Shyam and Neeraj were able to take multiple loans from MFIs36 to finance working capital investments to stock additional products. Suraj and Ram, by contrast, were reluctant to stock additional components, since they were not sure if they would be able to sell them in the presence of other suppliers (e.g., hardware store). They also cited a lack of working capital as a key constraint to stocking additional products and did not take loans to address this gap.
The sale of additional sanitation-related products helped Neeraj and Shyam capture a greater share of wallet of their large customer bases and represented 12% and 14% of their total unit profit per customer, respectively (see Figure 21).
We are careful to note, however, that in this context, selling additional sanitation-related products to existing customers was less lucrative than acquiring new customers. A new customer typically purchased cement rings, which contributed to most of the unit profit per customer for all four enterprises (Figure 21).
33 Unit profit per customer of pit covers: Unit profit of pit cover X Average number of pit covers sold per customer. 34 Both enterprises sold all the different interface components−pans, P-traps, Y-junctions, and PVC pipes. 35 Shyam’s enterprise sold doors, whereas Neeraj’s enterprise sold doors, soap shelves, and cubby shelves. 36 Neeraj’s enterprise took three loans, for a combined loan amount of USD 3,231. Shyam’s enterprise took three loans, for a combined loan
amount of USD 2,308.
CREATING VIABLE AND SUSTAINABLE SANITATION ENTERPRISES: BIHAR, INDIA CASE STUDY 25

• • • •
Figure 21: Unit profit (USD) per customer of different components37 (as a share of total unit profit per customer) by enterprise (2017)
1%
10%
8%4%
68%USD 12
6%
USD 4
USD 29
USD 40
90%
6%
87% 2%
93%
8%
18%
Superstructure components Interface components Pit covers Cement rings
Total, i.e., 100% corresponds to total unit profit per customer on average (represented at the top of each bar)
Suraj Neeraj Ram Shyam
4.1.6. SUMMARY OF VIABILITY ANALYSIS
All the drivers of the GMVA bridge can be leveraged to improve profits. Different enterprises followed different strategies to leverage different drivers, and the impact of multiple drivers in conjunction determined the difference in their performance.
Shyam’s enterprise primarily focused on a revenue-growth strategy, relying on multiple drivers to increase profits: number of customers, prices, common products mix, and additional, sanitation-related products. He actively invested in motivating demand and building relationships with customers to increase his customer base. Shyam also leveraged his social standing in his community to charge higher prices and push sales of pit covers and other sanitation-related products to increase customer share of wallet. Beyond the revenue-growth levers, he also benefitted from lower costs due to lower labor wages in his market. Together, these practices and factors helped him increase revenues and profits.
Neeraj’s enterprise also attempted a revenue-growth strategy but struggled to implement it fully. He benefited from being situated in an area with a large market size for sanitation, which increased his customer base and enabled him to sell additional sanitation-related products. However, he faced intense competition, which forced him to reduce prices to attract customers. He attempted to mitigate this price pressure by implementing a cost-reduction strategy (via reducing his raw material costs and labor costs). Unfortunately, cutting his costs did not sufficiently compensate for the low pricing into which he was forced, squeezing his unit profits and limiting his enterprise’s viability.
Ram’s enterprise primarily employed a cost-reduction strategy, focusing on the costs driver to increase profits. Despite being located in an area with relatively small market size, he achieved HPs by lowering manufacturing costs by reducing raw material quantities (and reportedly without adversely impacting product quality) and by casting cement rings and pit covers himself (instead of hiring labor).
Suraj’s enterprise was unable to leverage any driver to improve its performance. He could not attract more customers, did not have the working capital to stock additional, sanitation-related components, and did not pursue a deliberate strategy to activate demand or to reduce costs. As such, his enterprise’s performance remained low.
37 Unit profit per customer of a component: Unit profit of component X Average number of components sold per customer.
CREATING VIABLE AND SUSTAINABLE SANITATION ENTERPRISES: BIHAR, INDIA CASE STUDY 26

4.2. ASSESSING SUSTAINABILITY
The previous section highlighted the different factors that can influence sanitation enterprise viability via a close analysis of four specific examples. These examples considered business performance for a given year. What can we conclude about enterprise sustainability (long-term viability)?
In the 3Si Bihar context, sustainability is driven by the enterprises’ ability to finance and operate their business without ongoing non-market support from PSI.
4.2.1. FINANCIAL INDEPENDENCE
Many enterprises we interviewed (16 out of 28) used sales agents, and most of these (11 out of the 16) relied on PSI for payment of sales agent commissions. This was not the case for the four enterprises selected for this case study. Indeed, only one of the four enterprises we feature, Shyam’s enterprise, utilized sales agents at all, and Shyam paid the commissions himself.
To understand the impact of paying commissions on enterprise financial independence, we analyzed the P&L statements of 11 sampled enterprises that made use of sales agents paid by PSI.38
We conclude that the comparatively HP (“Small HP” and “Large HP”) enterprises are likely to absorb the costs of these sales commissions comfortably, but the comparatively LP (“Small LP” and “Large LP”) enterprises will struggle to bear these costs. The HP enterprises (7 in total) would see a decline of 6% (on average) in their profits if they assumed the costs of paying out sales commissions. The lower profit businesses (4 in total), by contrast, would see massive profit reductions (range from 41% to 2,000%), some so high that profits would be eliminated altogether (two out of four low profit enterprises).
Sales commissions are important costs for some enterprises; meanwhile, all enterprises must make periodic reinvestments in molds. Molds are a critical capital expenditure for sanitation enterprises, as they are required to manufacture different components of toilets. They have a limited shelf life and need to be replaced every few years, depending on the specific molds (ranging from 1.5 to 6 years for the four enterprises we profile in section 4.1).
Each of the four enterprises is likely to be able to afford molds, given the cost and shelf life of their current molds. Suraj’s enterprise would need to set aside less than 10% of its current annual profits each year to do so, while the other enterprises would need to set aside less than 1% of their annual profits each year. This would leave a significant portion of their profits available for other investments or to put toward the entrepreneur’s personal income.
38 The impact of paying sales commissions for each enterprise was calculated as follows: • Profit after paying sales commission = Current profit – Cost of sales commissions • Cost of sales commissions: Number of toilets sold by sales agents (sourced from entrepreneur interviews) X standard sales
commission (USD 2.31 per toilet)
CREATING VIABLE AND SUSTAINABLE SANITATION ENTERPRISES: BIHAR, INDIA CASE STUDY 27

Figure 22: Share of annual profit needed to be set aside39 for investing in molds by enterprise
6.7% 0.9%
99.1%
0.3%
99.7%
• •
0.5%
99.5% 93.3%
Suraj Neeraj Ram Shyam
Share of profit set aside for mold investment
Share of profit retained for other investments or as personal income of entreprenuer
Total, i.e., 100% corresponds to profit of sanitation enterprise
Our analysis of the enterprises’ financial independence should be read with an important caveat. The enterprises’ toilet sales, and hence their profits, were most likely enhanced due to the sizeable government subsidy provided under the SBA. In the absence of such indirect state support, the enterprise’s profits could have been lower and result in setting aside a greater share of their profits to account for recurring expenses and for investment in assets such as molds.
4.2.2. OPERATIONAL INDEPENDENCE
Under 3Si, PSI facilitated market mechanisms to fill critical gaps in the value chain of sanitation enterprises. For example, they persuaded a local distributor to stock PVC doors, which were not available locally at the beginning of the intervention (delaying the installation of toilets). They also connected enterprises with MFIs to provide access to working capital loans. In each instance, however, enterprises and the value chain players conducted commercial transactions directly without PSI’s recurring involvement. Of course, enterprises were also free to establish independent relationships with value chain players, and all four enterprises did, buying goods from local suppliers instead of the distributor introduced by PSI. This independence from PSI is a positive sign of operational sustainability.
By contrast, sales agents provided by PSI yielded some dependency on the part of the enterprises and the agents themselves, as they grew accustomed to PSI’s role as a “I haven’t asked my partner enterprise recruiter and manager of sales agents as well as paying to pay me the sales commission. It did their commissions. While this was not an issue for the four not occur to me because I thought it enterprises selected for this case study, it would impact was PSI’s job. I wish PSI comes back the sustainability of other enterprises. Only 5 (including and starts paying us.” Shyam’s enterprise) of the surveyed enterprises that
- Sales agent in Muzzafarpur employed sales agents during the life of the 3Si program continued paying them after PSI exited. Several sales agents we interviewed mentioned that they were currently selling toilets without financial compensation out of the hope that PSI would resume paying their commissions.
39 Share of profit needed to be set aside for mold investment: (Cost of molds)/(Annual profit X Shelf life of molds). We considered the cost and shelf life for each enterprise’s current molds in the above equation.
CREATING VIABLE AND SUSTAINABLE SANITATION ENTERPRISES: BIHAR, INDIA CASE STUDY 28
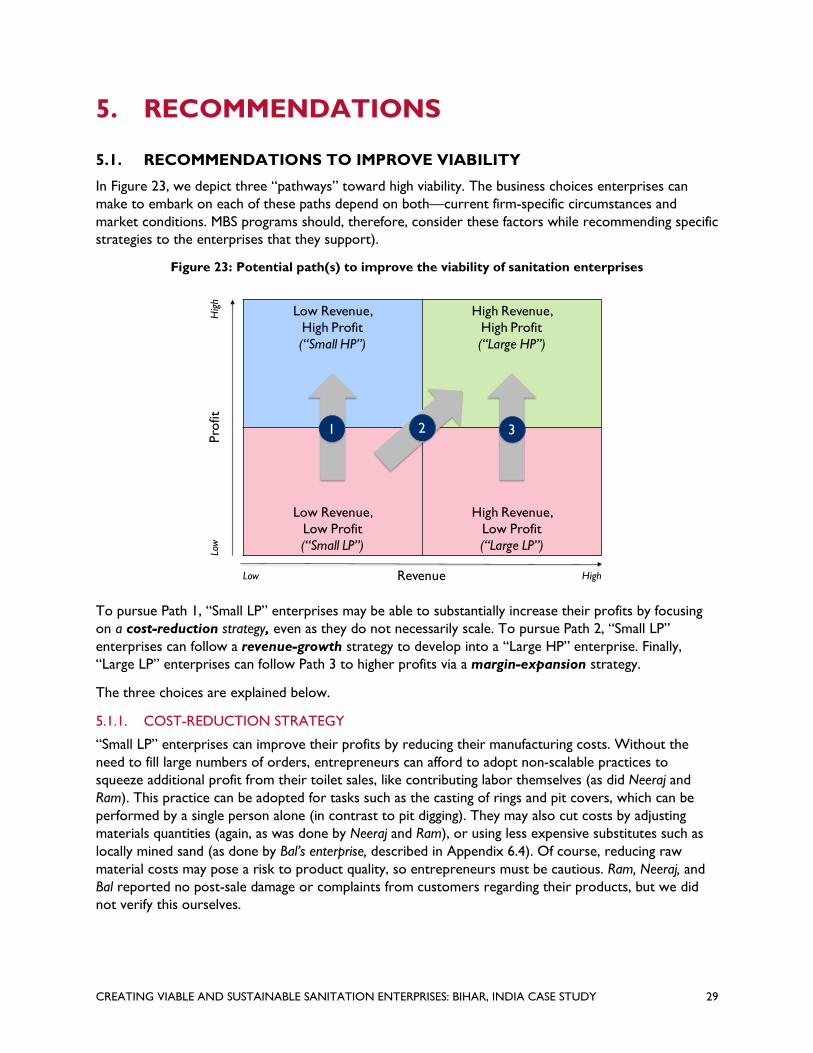
5. RECOMMENDATIONS
5.1. RECOMMENDATIONS TO IMPROVE VIABILITY
In Figure 23, we depict three “pathways” toward high viability. The business choices enterprises can make to embark on each of these paths depend on both—current firm-specific circumstances and market conditions. MBS programs should, therefore, consider these factors while recommending specific strategies to the enterprises that they support).
Figure 23: Potential path(s) to improve the viability of sanitation enterprises
Prof
it H
igh
Low Revenue, High Revenue, High Profit High Profit (“Small HP”) (“Large HP”)
21 3
Low Revenue, High Revenue, Low Profit Low Profit
Low (“Small LP”) (“Large LP”)
Low Revenue High
To pursue Path 1, “Small LP” enterprises may be able to substantially increase their profits by focusing on a cost-reduction strategy, even as they do not necessarily scale. To pursue Path 2, “Small LP” enterprises can follow a revenue-growth strategy to develop into a “Large HP” enterprise. Finally, “Large LP” enterprises can follow Path 3 to higher profits via a margin-expansion strategy.
The three choices are explained below.
5.1.1. COST-REDUCTION STRATEGY
“Small LP” enterprises can improve their profits by reducing their manufacturing costs. Without the need to fill large numbers of orders, entrepreneurs can afford to adopt non-scalable practices to squeeze additional profit from their toilet sales, like contributing labor themselves (as did Neeraj and Ram). This practice can be adopted for tasks such as the casting of rings and pit covers, which can be performed by a single person alone (in contrast to pit digging). They may also cut costs by adjusting materials quantities (again, as was done by Neeraj and Ram), or using less expensive substitutes such as locally mined sand (as done by Bal’s enterprise, described in Appendix 6.4). Of course, reducing raw material costs may pose a risk to product quality, so entrepreneurs must be cautious. Ram, Neeraj, and Bal reported no post-sale damage or complaints from customers regarding their products, but we did not verify this ourselves.
CREATING VIABLE AND SUSTAINABLE SANITATION ENTERPRISES: BIHAR, INDIA CASE STUDY 29
5.1.2. REVENUE-GROWTH STRATEGY
“Small LP” enterprises can also improve their viability by focusing on increasing their revenues, and hence, their profits. However, such a revenue-growth strategy requires enterprises to leverage multiple levers simultaneously and possibly incur higher costs. While Shyam’s enterprise notably maintained a cost advantage cost over Suraj’s enterprise (see Figure 10), we argue that this was a function of lower labor wages unique to Shyam’s market rather than a strategic business choice. We observed other enterprises that followed a revenue-growth strategy incurring higher costs (as illustrated in the GMVA bridge in Figure 32).
Enterprises can increase revenues by expanding their customer base through active investment in demand activation and customer service (like Shyam’s enterprise). This entails working with sales agents and compensating them (instead of relying on PSI to do so) for selling toilets on behalf of the enterprise. Enterprises can complement this with additional marketing efforts, such as holding village meetings to raise awareness about their products. Such demand activation mechanisms appear applicable only in markets with high latent demand40 for toilets. Nevertheless, MBS programs should still encourage enterprises to implement certain practices, such as building sales agent networks, because of the potential upside—additional sales— and the limited downside—an upfront financial investment is not required if the sales agents are paid on a commission-basis (e.g., when they bring purchase orders). Enterprises can also attract customers by providing credit or assisting them in benefitting from subsidies, leading to stronger customer relationships and higher conversion of sales.
Enterprises can increase revenues by increasing their prices. However, this requires enterprises to establish certain positioning in their markets (such as a reputation of high quality or trust with customers like Shyam’s enterprise). Without this, enterprises that increase prices will likely lose customers and possibly shrink their revenues. This is particularly problematic for “Small LP” enterprises, which already have relatively smaller customer bases and will struggle if they lose additional customers. Building a reputation of high quality may also require enterprises to incur higher costs by using higher material quantities to signal the high quality of their products (as was done by Jai’s enterprise, described in Appendix 6.4).
Finally, enterprises can increase revenues by increasing their sales of pit covers and additional, sanitation-related products (such as interface and superstructure components), capturing a greater share of the customer’s wallet. However, this practice is effective in markets where customers prefer to buy all sanitation products from one place, instead of shopping around for the lowest prices. Furthermore, it requires enterprises to have sufficient working capital to invest in stocking additional products, or the ability to take a loan for working capital investments.
Given that the revenue-growth strategy requires enterprises to implement multiple business practices and operate in specific and favorable market conditions, many will struggle to adopt this strategy. For example, Neeraj’s enterprise had difficulty increasing its profits despite leveraging multiple levers to increase revenues (number of customers, common products mix, and additional, sanitation-related products), as competition forced it to lower prices.
“Small LP” enterprises can take a more pragmatic, two-step approach to increase profits by first focusing on cost-reduction, to become a “Small HP”, and later test the potential to become a “Large HP” by implementing the revenue-growth strategy in their contexts (such as by experimenting with demand
40 Demand for a product or service that a consumer cannot satisfy because they do not have enough money, because the product or service is not available, or because they do not know that it is available; source: Cambridge Dictionary. (2019, August 15). Latent Demand. Retrieved from Cambridge Dictionary: https://dictionary.cambridge.org/dictionary/english/latent-demand.
CREATING VIABLE AND SUSTAINABLE SANITATION ENTERPRISES: BIHAR, INDIA CASE STUDY 30
activation through sales agents), but this could pose challenges. For instance, cost-reduction (e.g., lowering material quantities in products) can be inconsistent with positioning as a high-quality supplier and increase prices. Enterprises should consider the tradeoffs and decide on the most appropriate revenue-growth levers for their specific contexts.
5.1.3. MARGIN-EXPANSION STRATEGY
Increasing the profits of “Large LP” enterprises requires increasing margins (the degree to which the prices they charge exceed their manufacturing costs) while maintaining their large customer base. Manufacturing costs can be reduced through practices like those outlined under the cost-reduction strategy in this section. “Large LP” enterprises can also lower procurement costs by ordering raw materials in bulk and taking advantage of volume discounts (similar to Jai’s enterprise, as described in Appendix 6.4). This practice is particularly appropriate for enterprises that need to fill large numbers of orders. Reducing costs should be the first measure explored by “Large LP” enterprises as it can improve profits without significantly impacting sales volumes.
However, if costs cannot be reduced further (as was the case with Neeraj’s enterprise, which had already implemented cost-reduction measures), margins can be lifted by increasing prices. Unlike “Small LP” enterprises, larger enterprises can afford to lose a few sales (as is likely to occur in response to an increase in prices). Clearly, enterprises should only increase prices if they believe they will still be able to maintain a sufficiently large customer base at the new price, based on their understanding of customers and competitors. For example, if Neeraj’s enterprise increased prices from USD 3.07 to USD 4.62 (the median price in his district of Begusarai), his increased profits would satisfy our definition of a “Large HP” enterprise with just 40% of his existing customer base.41
“Large LP” enterprises can supplement their margin-expansion strategy through sales of pit covers and additional sanitation-related products (such as interface and superstructure components), capturing a greater share of wallet. However, as described in section 5.1.2, this practice is effective where customers prefer to buy all sanitation products from one-shop, and enterprises have the working capital to invest in stocking these products.
5.2. RECOMMENDATIONS TO IMPROVE SUSTAINABILITY
Sustainability would be a challenge for enterprises that are reliant on sales agents recruited by PSI but do not pay them. Many of these enterprises will face a significant reduction in profits if they pay sales agent commissions. However, without these commissions, sales agents who are currently operating without any income are likely to exit the market.
To avoid this challenge, programs might adopt a different sales agent model, whereby enterprises pay commissions and directly interact with sales agents once the implementing organization brokers the relationship (similar to the relationship established between enterprises and MFIs). This will enable an unambiguous and self-sustaining relationship between enterprises and sales agents. Enterprises could account for the cost of the commissions when deciding their product prices, and both stakeholders could negotiate mutually beneficial commissions.
41 To analyze the scenario where Neeraj’s enterprise raises prices to become a “Large HP” enterprise, we a) modified the Profit & Loss statement of Neeraj’s enterprise by changing the price of cement rings to USD 4.6 per unit (the median price in Begusarai), and b) estimated the number of customers required to generate a profit of at least USD 2,700 and a revenue of at least USD 13,800 (the two thresholds values for “Large HP” enterprises, defined in the Methodology section).
CREATING VIABLE AND SUSTAINABLE SANITATION ENTERPRISES: BIHAR, INDIA CASE STUDY 31

6. APPENDIX
6.1. INITIAL SAMPLING PLAN
Our initial sampling plan aimed to interview a sample of enterprises with diverse contextual and performance characteristics. We relied on data from PSI’s Management Information System (MIS) to prepare the sampling plan. Datasets on 741 enterprises included details such as location, duration in the 3Si program, delivery model, historical sales, and results of 3Si’s proprietary enterprise assessment (ECAT). We also received data on sales agents who sold toilets on behalf of sanitation enterprises affiliated with the program. We inspected the datasets for discrepancies, and after consultations with PSI program staff, we removed 101 enterprises, which had inconsistencies such as a mismatch between entrepreneur and enterprise names or their location. The resultant set of 640 enterprises formed the base for preparing the sampling plan.
To ensure diversity in enterprise context and performance, we categorized both the markets where enterprises operated and the enterprises, based on select parameters as described below.
6.1.1. MARKET TYPES
Market types were defined by ranking the blocks18 in which the enterprises operated as “high” or “low” on the following two metrics:
• Ease of market capture: “Ease of market capture” indicated the ease of running a sanitation business in a block. It was a composite measure of:
− Road connectivity: Road connectivity was measured using the percentage of villages within a block with all-weather roads. Good road connectivity was considered to improve “ease of market capture” as it made transportation (either for procurement of raw materials or delivery of toilets) easier.
− Tendency of the block to flood: Blocks were classified as “flood-prone” or “not flood-prone.” Flood-prone blocks were considered to make “ease of market capture” more difficult since it is challenging to run any retail business during the floods.
Each block was ranked on the two factors on a scale of 0–5, as per Table 3. The two factors were added to calculate an overall score of “ease of market capture” for each block. An overall score of more than 7.5 was considered high “ease of market capture.”
Table 3: Calculation of “ease of market capture”
FACTOR CALCULATION SOURCE
Road connectivity
% 𝑜𝑜𝑜𝑜 𝑣𝑣𝑣𝑣𝑣𝑣𝑣𝑣𝑣𝑣𝑣𝑣𝑣𝑣𝑣𝑣 𝑣𝑣𝑖𝑖 𝑏𝑏𝑣𝑣𝑜𝑜𝑏𝑏𝑏𝑏 𝑤𝑤𝑣𝑣𝑤𝑤ℎ 𝑣𝑣𝑣𝑣𝑣𝑣 − 𝑤𝑤𝑣𝑣𝑣𝑣𝑤𝑤ℎ𝑣𝑣𝑒𝑒 𝑒𝑒𝑜𝑜𝑣𝑣𝑟𝑟𝑣𝑣 � � x 5 𝐻𝐻𝑣𝑣𝑣𝑣ℎ𝑣𝑣𝑣𝑣𝑤𝑤 ′% 𝑜𝑜𝑜𝑜 𝑣𝑣𝑣𝑣𝑣𝑣𝑣𝑣𝑣𝑣𝑣𝑣𝑣𝑣𝑣𝑣 𝑤𝑤𝑣𝑣𝑤𝑤ℎ 𝑣𝑣𝑣𝑣𝑣𝑣 − 𝑤𝑤𝑣𝑣𝑣𝑣𝑤𝑤ℎ𝑣𝑣𝑒𝑒 𝑒𝑒𝑜𝑜𝑣𝑣𝑟𝑟𝑣𝑣′ 𝑣𝑣𝑖𝑖 𝑟𝑟𝑣𝑣𝑤𝑤𝑣𝑣𝑣𝑣𝑣𝑣𝑤𝑤
Census of India 2011. Office of the Registrar General & Census Commissioner, India, 2011.
Tendency “Flood-prone” blocks = 2.5 List of Flood-prone blocks in different of the block Other blocks = 5 districts of Eastern India. National to flood The source data categorized the flood-prone blocks in Bihar. Disaster Management Authority,
India
CREATING VIABLE AND SUSTAINABLE SANITATION ENTERPRISES: BIHAR, INDIA CASE STUDY 32

• Attractiveness of the market: “Attractiveness of the market” indicated the potential market opportunity for a sanitation business in a block. It was a composite measure of:
− Focus of demand generation campaigns: Measured using the percentage of “Open Defecation Free” villages in a block. High percentages indicated a strong historical presence of the Swacch Bharat Campaign. This was considered to improve the “attractiveness of the market” as it increased awareness and demand for toilets.
− Opportunity size: Measured using the number of households in a block without a toilet at the start of the 3Si program. A high number was considered attractive since a greater number of households could be targeted for selling toilets, thus indicating a higher market size.
Each block was ranked on the two factors on a scale of 0–5, as per Table 4. The two factors were added to calculate an overall score of “attractiveness of the market” for each block. An overall score of more than 7.5 was considered high “attractiveness of market.”
Table 4: Calculation of “attractiveness of market”
FACTOR CALCULATION SOURCE
Focus of % 𝑜𝑜𝑜𝑜 𝑂𝑂𝑂𝑂𝑣𝑣𝑖𝑖 𝐷𝐷𝑣𝑣𝑜𝑜𝑣𝑣𝑏𝑏𝑣𝑣𝑤𝑤𝑣𝑣𝑜𝑜𝑖𝑖 𝐹𝐹𝑒𝑒𝑣𝑣𝑣𝑣 𝑣𝑣𝑣𝑣𝑣𝑣𝑣𝑣𝑣𝑣𝑣𝑣𝑣𝑣𝑣𝑣 𝑣𝑣𝑖𝑖 𝑏𝑏𝑣𝑣𝑜𝑜𝑏𝑏𝑏𝑏 � � x 5 demand 𝐻𝐻𝑣𝑣𝑣𝑣ℎ𝑣𝑣𝑣𝑣𝑤𝑤 ′% 𝑜𝑜𝑜𝑜 𝑂𝑂𝑂𝑂𝑣𝑣𝑖𝑖 𝐷𝐷𝑣𝑣𝑜𝑜𝑣𝑣𝑏𝑏𝑣𝑣𝑤𝑤𝑣𝑣𝑜𝑜𝑖𝑖 𝐹𝐹𝑒𝑒𝑣𝑣𝑣𝑣 𝑣𝑣𝑣𝑣𝑣𝑣𝑣𝑣𝑣𝑣𝑣𝑣𝑣𝑣𝑣𝑣′ 𝑣𝑣𝑖𝑖 𝑟𝑟𝑣𝑣𝑤𝑤𝑣𝑣𝑣𝑣𝑣𝑣𝑤𝑤
generation Swacch Bharat Abhiyan. campaigns http://sbm.gov.in42
Opportunity 𝑁𝑁𝑜𝑜. 𝑜𝑜𝑜𝑜 ℎ𝑜𝑜𝑜𝑜𝑣𝑣𝑣𝑣ℎ𝑜𝑜𝑣𝑣𝑟𝑟𝑣𝑣 𝑣𝑣𝑖𝑖 𝑏𝑏𝑣𝑣𝑜𝑜𝑏𝑏𝑏𝑏 𝑤𝑤𝑣𝑣𝑤𝑤ℎ𝑜𝑜𝑜𝑜𝑤𝑤 𝑣𝑣 𝑤𝑤𝑜𝑜𝑣𝑣𝑣𝑣𝑣𝑣𝑤𝑤 � � x 5 size 𝐻𝐻𝑣𝑣𝑣𝑣ℎ𝑣𝑣𝑣𝑣𝑤𝑤 ′𝑖𝑖𝑜𝑜. 𝑜𝑜𝑜𝑜 ℎ𝑜𝑜𝑜𝑜𝑣𝑣𝑣𝑣ℎ𝑜𝑜𝑣𝑣𝑟𝑟𝑣𝑣 𝑤𝑤𝑣𝑣𝑤𝑤ℎ𝑜𝑜𝑜𝑜𝑤𝑤 𝑣𝑣 𝑤𝑤𝑜𝑜𝑣𝑣𝑣𝑣𝑣𝑣𝑤𝑤′ 𝑣𝑣𝑖𝑖 𝑟𝑟𝑣𝑣𝑤𝑤𝑣𝑣𝑣𝑣𝑣𝑣𝑤𝑤
Based on the above ranking methodology, the blocks of the enterprises were categorized into four market types (see Figure 24):
• Hard market: Challenging to operate a sanitation business and a low market opportunity for sanitation.
• “Opportunistic play” market: Low market opportunity for sanitation, but a potential opportunity to capture the market due to the ease of operating a sanitation business.
• “Attractive, yet difficult to serve” market: Large market opportunity for sanitation, but difficult to capture the market due to the challenges of operating a sanitation business.
• Easy market: Easy to operate a sanitation business and a large market opportunity for sanitation.
42 Swacch Bharat Abhiyan. http://sbm.gov.in. (The website has been redesigned since the data was collected, so the specific page cannot be sourced.)
CREATING VIABLE AND SUSTAINABLE SANITATION ENTERPRISES: BIHAR, INDIA CASE STUDY 33

l
Figure 24: Types of markets for sampling
Ease
of m
arke
t cap
ture
“Opportunistic play” market Easy market
Hard market “Attractive, yet difficult to serve” market
Attractiveness of the market High Low
Hig
hLo
w
6.1.2. ENTERPRISE CATEGORIES
Once the market types were defined, the 640 enterprises that PSI supported were categorized using a combination of the following two metrics:
• Sales volumes: Enterprises were grouped into three categories based on their average sales volumes43:
− High sales: More than 30 toilets sold per month on average. − Moderate sales: 10–30 toilets sold per month on average. − Low sales: Fewer than 10 toilets sold per month on average.
• Sales trends: Enterprises were grouped into four categories based on their sales trends:
− Always successful: Recorded increasing sales volumes for every year of operation. − Resilient: Recorded at least one year of decreasing sales volumes. − Late entrants: Entered the market in 2016. − Exited: Stopped selling toilets (per PSI’s database).
We mapped the 640 enterprises based on their sales performance categories to the four market types (Figure 25).
43 Average sales volumes were calculated by dividing the total sales volumes of an enterprise with the total months of operation. Month of operation is limited only to those when the enterprise sold at least one toilet.
CREATING VIABLE AND SUSTAINABLE SANITATION ENTERPRISES: BIHAR, INDIA CASE STUDY 34

1-----
j ------
Figure 25: 640 enterprises categorized by sales performance and market type
n=640 Easy market
4 1 50
7 3 53
9 4 43
Late Resilient Exited entrants
“Opportunistic play” market
Low
Ea
se o
f mar
ket c
aptu
re
Hig
h
High 1 1 - 21 High 19 5 2 72
Moderate 2 2 1 14 Moderate 7 19 6 63
Low Low 1 3 7 19 5 8 6 52
Always Late Always Resilient Exited Resilient
successful Exited Late
entrants
High 4
Moderate 9
Low 3
Always successful
Blocks=31
successful
Blocks=21
2
3
3
Resilient
n=103 n=201
n=264
Low High
We prioritized seven out of the 12 enterprise groups for sample selection. The remaining five enterprise groups were deprioritized either because they were not present in our sampled districts, or because it was unlikely that studying them would yield sufficient insights. We also shortlisted 25 blocks that contained a balanced mix of the seven enterprise categories across the four market types. We consulted PSI for inputs on location characteristics, logistics, and the availability of program field personnel for scheduling interviews and making introductions.
Figure 26 shows the resultant sampling plan of 33 enterprises—25 active and eight exited enterprises. This was our initial sampling plan, which was revised as described in the Methodology section.
Hard market
n=72
-
2
3
Exited
17
33
24
Late entrants
entrants
High
Moderate
Low
Blocks=45
Blocks=53
8
16
3
Always successful
“Attractive, yet difficult to serve” market
Attractiveness of the market
CREATING VIABLE AND SUSTAINABLE SANITATION ENTERPRISES: BIHAR, INDIA CASE STUDY 35

4 1
Figure 26: Sampling plan for 33 active and exited enterprises categorized by sales performance and market type
n=33
Low
Ea
se o
f mar
ket c
aptu
re
Hig
h “Opportunistic play” market Easy market
High 1 - 2 3 1
Moderate
Low
Always Late Always Resilient Exited Resilient Exited successful entrants successful
Late entrants
High
Moderate - 2
Low 3
Blocks=9 n=12 Blocks=5 n=7
Hard market “Attractive, yet difficult to serve” market
High
Moderate 1 2
Low 2
High 1 1 - 1 1 1 -
Moderate
Low
Always Always Late Resilient Exited Resilient Exited successful successful entrants Late
entrants
-
- 1
1
- 2
1
Blocks=7 n=8 Blocks=4 n=6
Low High Attractiveness of the market
Deprioritized Not present in sampled districts
CREATING VIABLE AND SUSTAINABLE SANITATION ENTERPRISES: BIHAR, INDIA CASE STUDY
1
36

=
- -
=
=
6.2. PROFIT & LOSS STATEMENTS
A P&L Statement is a financial statement that illustrates a business’s revenues and expenses in detail during a particular period (e.g., quarter, year). It quantifies the profits earned or value lost during the period and enables a comparison of performance across time periods and by component. The elements of a typical P&L statement for a sanitation enterprise are described in Table 5. Our computation of the P&L statement for enterprises in the 3Si program was for the year 2017.
Table 5: Line items for a P&L statement of a typical sanitation enterprise
REVENUE Revenue generated by selling toilets, toilet components, delivery, or installation services
(-) COST OF GOODS SOLD Costs incurred that are directly attributed to the production of toilets
Raw Material Costs Costs of procuring raw materials such as cement, sand, pans, pipes, etc. In most cases, this includes delivery cost from input supplier to the enterprise
Direct Labor Costs Cost of labor for casting, delivery, pit digging, installation
Transport (raw material Cost of transporting raw material from input supplier to the enterprise, if not procurement costs) included in raw material cost
( ) GROSS PROFIT
(-) OPERATING EXPENSES Non-production costs incurred in the day-to-day operations of the business
Transport (transport costs to customer/ channel)
Delivery cost incurred in delivering toilets to customers. This could be transport, rent in the case of rented transport, or cost of fuel in the case of owned transport
Land Rent Rent paid for operating the business from a location, apportioned by share of sanitation in overall business revenue
Utilities Costs of electricity, water, apportioned by share of sanitation in overall business revenue
Marketing (commissions) Commissions paid to demand activators for sale of toilets
Marketing (non-commissions) Non-commissions expenses such as marketing collateral or meeting expenses incurred
Repairs Repairs of assets, such as molds, etc.
Depreciation Depreciation is the annual decline in the value of assets (such as trucks and machinery) owned by a business. Assets have a limited useful life, i.e., the number of years they are expected to contribute to the business. At the end of the expected useful life, assets have scrap or salvage value. Depreciation is an accounting method to spread the asset’s value spread over its useful life. It is a non-cash expense, i.e., it is recorded as an expense despite not resulting in a cash outflow.
Bad Debt Credit offered to a customer of the toilet business that cannot be recovered
(=) OPERATING PROFIT Other costs incurred in the day to day running of a business
(-) INTEREST EXPENSE Interest on loans taken by the business, apportioned by share of sanitation in overall business revenue
(-) TAX Tax paid on profit generated in the business
( ) NET PROFIT
(+) DEPRECIATION
( ) CASH NET PROFIT Cash income earned (or lost) by the enterprise in the period
CREATING VIABLE AND SUSTAINABLE SANITATION ENTERPRISES: BIHAR, INDIA CASE STUDY 37

6.3. GROSS MARGIN VARIANCE ANALYSIS
GMVA is a business analytical tool used to identify drivers of the difference between gross profits. The tool is typically used by a single business or business division to analyze the differences in performance between two time periods, or else between planned/budgeted and actual performance. GMVA can help prioritize factors that drive differences in gross profits and guide subsequent responses. For instance, if the size of the customer base is the most important driver, then a business can analyze activities that influence and bolster customer acquisition.
To illustrate the process and interpretation of the GMVA, we present the following illustrative example:
Consider two widget manufacturers, Company 1 and 2. Assume that Company 1 sells widget A and widget B and that Company 2 sells widget A, widget B, and a third widget, widget C. Now consider the following set of assumptions:
Table 6: GMVA inputs example
COMPANY 1 COMPANY 2
CUSTOMERS
100 200
VOLUMES SOLD PER CUSTOMER
Widget A 5 10
Widget B 1 2
Widget C - 2
PRICE PER PIECE
Widget A 5 6
Widget B 4 4
Widget C - 4
GROSS MARGIN (%)
Widget A 24% 20%
Widget B 25% 20%
Widget C - 30%
COST PER PIECE (USD)
Widget A 3.8 4.8
Widget B 3.0 3.2
Widget C - 2.8
Total gross profit (USD)44 700 3,200
Company 1 generates an annual gross profit of USD 700, while Company 2 generates a gross profit of USD 3,200. GMVA allows us to decompose the gross profit difference between the two companies (see Table 7 for the list of variables used for the subsequent equations).
44 Calculated as the sum of (Price per piece – Cost per piece) x (Units sold per customer) x (Number of customers) for each widget.
CREATING VIABLE AND SUSTAINABLE SANITATION ENTERPRISES: BIHAR, INDIA CASE STUDY 38

First, we consider the effect caused by the difference in the customer base. This calculation entails increasing the number of customers only; if Company 1 sold widget A and B to 200 customers instead of 100, at its current prices, costs, and volumes sold to each customer, the company would make an additional USD 700 in gross profit.
Mathematically,
(1) 𝑉𝑉𝑣𝑣𝑒𝑒𝑣𝑣𝑣𝑣𝑖𝑖𝑏𝑏𝑣𝑣 (𝑏𝑏𝑜𝑜𝑣𝑣𝑤𝑤𝑜𝑜𝑐𝑐𝑣𝑣𝑒𝑒𝑣𝑣) = (𝒄𝒄𝒄𝒄𝒄𝒄𝒄𝒄𝒄𝒄𝒄𝒄𝒄𝒄𝒄𝒄𝒄𝒄𝟐𝟐 − 𝒄𝒄𝒄𝒄𝒄𝒄𝒄𝒄𝒄𝒄𝒄𝒄𝒄𝒄𝒄𝒄𝒄𝒄𝟏𝟏)x 𝐺𝐺𝐺𝐺𝐺𝐺𝐶𝐶1
where gross profit per customer1 (GPPC1) is gross profit per customer of Company 1.
With the adjusted number of customers for Company 1, the next source of gross profit difference is the difference in prices charged by Company 2 for the two products; if Company 1 sold widget A for USD 6 (instead of 5) and widget B for USD 4 (same price as currently charged, so no impact for widget B) to 200 customers (the customer base of company B), at its current volumes sold per customer, it would results in a USD 1,000 increase in gross profits.
Mathematically,
(2) 𝑉𝑉𝑣𝑣𝑒𝑒𝑣𝑣𝑣𝑣𝑖𝑖𝑏𝑏𝑣𝑣 (𝑂𝑂𝑒𝑒𝑣𝑣𝑏𝑏𝑣𝑣) = [(𝒑𝒑𝒄𝒄𝒑𝒑𝒄𝒄𝒄𝒄𝟐𝟐𝟐𝟐 − 𝒑𝒑𝒄𝒄𝒑𝒑𝒄𝒄𝒄𝒄𝟏𝟏𝟐𝟐) x 𝑏𝑏𝑜𝑜𝑣𝑣𝑤𝑤𝑜𝑜𝑐𝑐𝑣𝑣𝑒𝑒𝑣𝑣2 x 𝑣𝑣𝑜𝑜𝑣𝑣𝑜𝑜𝑐𝑐𝑣𝑣1A] + [(𝒑𝒑𝒄𝒄𝒑𝒑𝒄𝒄𝒄𝒄𝟐𝟐𝟐𝟐 −
𝒑𝒑𝒄𝒄𝒑𝒑𝒄𝒄𝒄𝒄𝟏𝟏𝟐𝟐) x 𝑏𝑏𝑜𝑜𝑣𝑣𝑤𝑤𝑜𝑜𝑐𝑐𝑣𝑣𝑒𝑒𝑣𝑣2 x 𝑣𝑣𝑜𝑜𝑣𝑣𝑜𝑜𝑐𝑐𝑣𝑣1B]
Similarly, the differences in the cost of production lead to a difference in gross profits as well. The signs are reversed (compared to the price equation) as higher costs reduce gross profit, whereas higher prices increase gross profit. The impact is computed by multiplying the difference in COGS for each product with Company 1’s volumes sold per customer to the adjusted customer base, i.e., the same number of customers as Company 2. In this example, Company 2 has higher costs than Company 1; hence the impact (USD 1,040) will be negative, i.e., the higher costs reduce Company 2’s gross profits relative to Company 1.
Mathematically,
(3) 𝑉𝑉𝑣𝑣𝑒𝑒𝑣𝑣𝑣𝑣𝑖𝑖𝑏𝑏𝑣𝑣 (𝑏𝑏𝑜𝑜𝑣𝑣𝑤𝑤) = [(𝒄𝒄𝒄𝒄𝒄𝒄𝒄𝒄𝟏𝟏𝑨𝑨 − 𝒄𝒄𝒄𝒄𝒄𝒄𝒄𝒄𝟐𝟐𝟐𝟐) x 𝑏𝑏𝑜𝑜𝑣𝑣𝑤𝑤𝑜𝑜𝑐𝑐𝑣𝑣𝑒𝑒𝑣𝑣2 x 𝑣𝑣𝑜𝑜𝑣𝑣𝑜𝑜𝑐𝑐𝑣𝑣1A] + [(𝒄𝒄𝒄𝒄𝒄𝒄𝒄𝒄𝟏𝟏𝟐𝟐 −
𝒄𝒄𝒄𝒄𝒄𝒄𝒄𝒄𝟐𝟐𝟐𝟐) x 𝑏𝑏𝑜𝑜𝑣𝑣𝑤𝑤𝑜𝑜𝑐𝑐𝑣𝑣𝑒𝑒𝑣𝑣2 x 𝑣𝑣𝑜𝑜𝑣𝑣𝑜𝑜𝑐𝑐𝑣𝑣1B]
The three equations above consider Company 1’s sales volumes sold per customer. We also have to consider the difference in volumes sold per customer of widget A and B (the common products sold by both enterprises), referred to as the “common product mix” effect. This effect would assume that Company 1 sells 10 and two units of widget A and B respectively, instead of 5 units and one unit, respectively, to the adjusted customer base of Company 2, at Company 2’s prices and costs. This results in a USD 1,360 increase in gross profit.
Mathematically,
(4) 𝑉𝑉𝑣𝑣𝑒𝑒𝑣𝑣𝑣𝑣𝑖𝑖𝑏𝑏𝑣𝑣 (𝑏𝑏𝑜𝑜𝑐𝑐𝑐𝑐𝑜𝑜𝑖𝑖 𝑂𝑂𝑒𝑒𝑜𝑜𝑟𝑟𝑜𝑜𝑏𝑏𝑤𝑤𝑣𝑣 𝑐𝑐𝑣𝑣𝑚𝑚) = [(𝒗𝒗𝒄𝒄𝒗𝒗𝒄𝒄𝒄𝒄𝒄𝒄𝟐𝟐𝟐𝟐 − 𝒗𝒗𝒄𝒄𝒗𝒗𝒄𝒄𝒄𝒄𝒄𝒄𝟏𝟏𝟐𝟐) x (𝑏𝑏𝑜𝑜𝑣𝑣𝑤𝑤𝑜𝑜𝑐𝑐𝑣𝑣𝑒𝑒𝑣𝑣2) x (𝑂𝑂𝑒𝑒𝑣𝑣𝑏𝑏𝑣𝑣2A − 𝑏𝑏𝑜𝑜𝑣𝑣𝑤𝑤2𝐴𝐴)] + [(𝒗𝒗𝒄𝒄𝒗𝒗𝒄𝒄𝒄𝒄𝒄𝒄𝟐𝟐𝟐𝟐 − 𝒗𝒗𝒄𝒄𝒗𝒗𝒄𝒄𝒄𝒄𝒄𝒄𝟏𝟏𝟐𝟐) x (𝑏𝑏𝑜𝑜𝑣𝑣𝑤𝑤𝑜𝑜𝑐𝑐𝑣𝑣𝑒𝑒𝑣𝑣2) x (𝑂𝑂𝑒𝑒𝑣𝑣𝑏𝑏𝑣𝑣2B − 𝑏𝑏𝑜𝑜𝑣𝑣𝑤𝑤2B)]
Finally, there is also a difference in gross profit attributed to the sale of widget C, an additional product sold only by Company 2. This results in a USD 480 gross profit increase.
CREATING VIABLE AND SUSTAINABLE SANITATION ENTERPRISES: BIHAR, INDIA CASE STUDY 39

Table 7: Definition of variables used in the GMVA example
VARIABLE DEFINITION
700
3,200
700
1,000 1,040 1,360
480
Gross profit (Company 2)
Additional, sanitation-
related products
Costs No. of customers
Gross profit (Company 1)
Prices Common products mix
+2,500
Mathematically,
(5) 𝑉𝑉𝑣𝑣𝑒𝑒𝑣𝑣𝑣𝑣𝑖𝑖𝑏𝑏𝑣𝑣 (𝑣𝑣𝑟𝑟𝑟𝑟𝑣𝑣𝑤𝑤𝑣𝑣𝑜𝑜𝑖𝑖𝑣𝑣𝑣𝑣 𝑂𝑂𝑒𝑒𝑜𝑜𝑟𝑟𝑜𝑜𝑏𝑏𝑤𝑤𝑣𝑣) = 𝑏𝑏𝑜𝑜𝑣𝑣𝑤𝑤𝑜𝑜𝑐𝑐𝑣𝑣𝑒𝑒𝑣𝑣2 𝑚𝑚 𝑣𝑣𝑜𝑜𝑣𝑣𝑜𝑜𝑐𝑐𝑣𝑣2C 𝑚𝑚 (𝑂𝑂𝑒𝑒𝑣𝑣𝑏𝑏𝑣𝑣2𝐶𝐶 − 𝑏𝑏𝑜𝑜𝑣𝑣𝑤𝑤2𝐶𝐶 )
The GMVA “bridge” for this example is offered in Figure 27.
Figure 27: GMVA bridge of Company 1 and Company 2
customers1 Number of customers of Company 1 customers2 Number of customers of Company 2 GPPC1 Gross profit per customer of Company 1 GPPC2 Gross profit per customer of Company 2 volume1A Product (widget A) volumes sold per customer of Company 1 volume2A Product (widget A) volumes sold per customer of Company 2 volume1B Product (widget B) volumes sold per customer of Company 1 volume2B Product (widget B) volumes sold per customer of Company 2 volume2C Product (widget C) volumes sold per customer of Company 2 price1A Unit price for widget A product of Company 1 price2A Unit price for widget A product of Company 2 price1B Unit price for widget B product of Company 1 price2B Unit price for widget B product of Company 2 price2C Unit price for widget C product of Company 2 cost1A Unit cost of goods sold for widget A for Company 1 cost2A Unit cost of goods sold for widget A for Company 2 cost1B Unit cost of goods sold for widget B for Company 1 cost2B Unit cost of goods sold for widget B for Company 2 cost2C Unit cost of goods sold for widget C for Company 2
CREATING VIABLE AND SUSTAINABLE SANITATION ENTERPRISES: BIHAR, INDIA CASE STUDY 40

D D
.. ) >----------------< ◄
0
6.4. ADDITIONAL GMVA BRIDGES
In addition to the four enterprises presented in this case study, we also prepared the GMVA bridges of three other enterprises (all seven are circled in red in Figure 28). We included a “Small LP” enterprise (Gaurav’s enterprise) that was making losses (negative profits) to understand the reasons that led to these losses. We also included another “Small HP” enterprise (Bal’s enterprise) and “Large HP” enterprise (Jai’s enterprise) to identify any other factors that influenced viability.
We compared Gaurav’s enterprise to our lowest profit enterprise (Suraj’s enterprise) and our highest profit enterprise (Shyam’s enterprise) to understand the range of factors that led to Gaurav’s enterprise generating losses.
We compared our selected “Small LP” enterprise (Suraj’s enterprise) to both Bal’s enterprise and Jai’s enterprise and compared our selected “Large LP” enterprise (Neeraj’s enterprise) to Jai’s enterprise. These comparisons represented the three potential paths to improve viability, as described in the Methodology section).
Figure 28: Additional enterprises selected for GMVA
Prof
it (U
SD)
Median revenue: USD 13,800 22,000
20,000
18,000
16,000
14,000
12,000
10,000
8,000
6,000
4,000
0
-2,000
-4,000 0 20,000 40,000 60,000 80,000 100,000 120,000 140,000 160,000
Small HP (n=4)
Large HP (n=11)
Revenue: USD 8,982 Large LP (n=3)
Small LP
(n=10)
Neeraj’s enterprise Revenue: USD 25,234 Profit: USD 1,718
Ram’s enterprise Revenue: USD 8,660 Profit: USD 3,969
Suraj’s enterprise Gaurav’s enterprise Revenue: USD 8,565 Profit: USD 831
Jai’s enterprise Revenue: USD 153,312 Profit: USD 13,964
Bal’s enterprise Revenue: USD 12,603 Profit: USD 3,897
Profit: USD -2,263
Shyam’s enterprise Revenue: USD 32,331 Profit: USD 9,927
2X Mason’s income: 2,000 USD 2,700
Revenue (USD) Focus of case study
CREATING VIABLE AND SUSTAINABLE SANITATION ENTERPRISES: BIHAR, INDIA CASE STUDY 41

-
-
•
----- ------
Figure 29: GMVA bridge (USD) between Gaurav’s enterprise and Suraj’s enterprise
1,701 177
3,920
32
(1,292)
0
(1,135)
+2,836
Gross profit No.of Prices Costs Common Additional, Gross profit (Gaurav’s customers products mix sanitation- (Suraj’s
Enterprise) related Enterprise) products
Figure 30: GMVA bridge (USD) between Gaurav’s enterprise and Shyam’s enterprise
13,274
2,410
1,854
(1,459) 0
11,604
(1,135)
+14,409
Gross profit No.of Prices Costs Common Additional, Gross profit (Gaurav’s customers products mix sanitation- (Shyam’s
Enterprise) related Enterprise) products
Figure 29 and Figure 30 show that Gaurav’s enterprise primarily suffered from high manufacturing costs, which made the margins (price less cost) on sales of cement rings negative. Over the years, his raw material costs increased, but he was unable to increase prices due to intense competition. As such, Gaurav’s primary focus should be on reducing his costs to improve his margins, since acquiring more
CREATING VIABLE AND SUSTAINABLE SANITATION ENTERPRISES: BIHAR, INDIA CASE STUDY 42

I
customers at current margins will only lead to greater losses. He can do this by reducing raw material quantities to manufacture cement rings, as per the cost-reduction strategy outlined in Section 5.1.1.
Figure 31: GMVA bridge (USD) between Suraj’s enterprise and Bal’s enterprise
1,701
5,888
1,049
3,334
(340) 0
144
+4,188
Gross profit No.of Prices Costs Common Additional, Gross (Suraj’s customers products mix sanitation- profit (Bal’s
Enterprise) related Enterprise) products
The GMVA bridge in Figure 31 between Suraj’s enterprise and Bal’s enterprise highlights the costs driver as the primary differentiator in gross profits between the enterprises. Bal’s enterprise followed a cost-reduction strategy, similar to Ram’s enterprise (as explained in the Findings section), by reducing raw material quantities. It reduced costs further by using locally mined sand, which was significantly cheaper than sand procured from a supplier. These practices reduced his raw materials costs of cement rings to USD 1.49 per unit, compared to USD 2.21 per unit for Suraj’s enterprise.
CREATING VIABLE AND SUSTAINABLE SANITATION ENTERPRISES: BIHAR, INDIA CASE STUDY 43

----------
Figure 32: GMVA bridge (USD) between Suraj’s enterprise and Jai’s enterprise
1,701
17,772
8,504
5,269 (7,741)
3,520
6,519
+16,071
Gross profit No.of Prices Costs Common Additional, Gross profit (Suraj’s customers products mix sanitation- (Jai’s Enterprise)
Enterprise) related products
Figure 33: GMVA bridge (USD) between Neeraj’s enterprise and Jai’s enterprise
2,577
17,772 26,043
(20,336)
2,250
6,082
1,155
+15,195
Gross profit No.of Prices Costs Common Additional, Gross profit (Neeraj’s customers products mix sanitation- (Jai’s Enterprise)
Enterprise) related products
The GMVA bridges between Jai’s enterprise, and Suraj and Neeraj’s enterprises (see Figure 32 and Figure 33, respectively) highlight that Jai’s enterprise followed a revenue-growth strategy to increase profits, similar to Shyam’s enterprise. However, in contrast to Shyam’s enterprise, Jai’s enterprise incurred higher costs to implement parts of its revenue-growth strategy.
CREATING VIABLE AND SUSTAINABLE SANITATION ENTERPRISES: BIHAR, INDIA CASE STUDY 44

Jai actively invested in demand activation and customer service to acquire 840 customers in 2017. He worked with PSI’s sales agents, who generated 92% of his total toilet sales, and he helped customers with availing subsidies to purchase toilets.
Jai also benefited from significantly higher prices, selling cement rings at USD 6.20 per unit, compared to USD 5.23 and USD 3.08 for Suraj and Neeraj, respectively. Jai was able to do this as he positioned himself as a provider of high-quality products. He signaled high quality by increasing raw material quantities in his cement rings, using 10 kg of cement and 1.6 tins each of stone and sand per cement ring. These quantities were significantly higher than those used by Suraj and Neeraj to manufacture cement rings (see Table 2). This practice increased Jai’s manufacturing costs, but he was able to partially contain the cost escalation by lowering procurement costs. He ordered raw materials in bulk and availed volumes discounts of ~5% on raw materials. Overall, the higher prices and lower procurement costs more than compensated for higher material usage and helped Jai’s enterprise increase its profits.
Finally, Jai benefitted from higher sales of pit covers, and other additional, sanitation-related products, helped him capture a greater share of wallet (i.e., the total spend by a customer to acquire a toilet from one or more input suppliers). His additional sanitation-related products included not only interface and superstructure components, but also raw materials (such as cement, sand, and stone) required to build the superstructure.
CREATING VIABLE AND SUSTAINABLE SANITATION ENTERPRISES: BIHAR, INDIA CASE STUDY 45

--
U.S. Agency for International Development 1300 Pennsylvania Avenue, NW
Washington, DC 20523 Tel: (202) 712 0000 Fax: (202) 216 3524
www.usaid.gov
Related Documents