From point to area: Upscaling approaches for Late Quaternary archaeological and environmental data Manuela Schlummer a, ⁎, Thomas Hoffmann a , Richard Dikau a , Michael Eickmeier b , Peter Fischer c , Renate Gerlach d , Jörg Holzkämper e , Arie J. Kalis f , Inga Kretschmer e , Franziska Lauer g , Andreas Maier e , Janina Meesenburg e , Jutta Meurers-Balke e , Ulla Münch h , Stefan Pätzold g , Florian Steininger b , Astrid Stobbe f , Andreas Zimmermann e a Department of Geography, University of Bonn, Meckenheimer Allee 166, 53115 Bonn, Germany b Institute of Geography, University of Cologne, Albertus-Magnus-Platz, 50923 Cologne, Germany c Natural Hazard Research and Geoarchaeology, Institute for Geography, Johannes Gutenberg-Universität Mainz, Johann-Joachim-Becher-Weg 21, 55099 Mainz, Germany d Rhineland Regional Council (LVR), LVR — State Service for Archaeological Heritage, Endenicher Str. 133, 53115 Bonn, Germany e Institute of Prehistoric Archaeology, University of Cologne, Bernhard-Feilchenfeld-Str. 11 50969 Cologne, Germany f Institute of Archaeological Sciences, Dept. III, Pre- and Early History, Johann Wolfgang Goethe-University, Grüneburgplatz 1, 60323 Frankfurt am Main, Germany g Institute of Crop Science and Resource Conservation (INRES), Soil Science and Soil Ecology, Nussallee 13, 53115 Bonn, Germany h Rhineland Regional Council (LVR), LVR — State Service for Archaeological Heritage, Unit Titz, Ehrenstr. 14-16, 52334 Titz, Germany abstract article info Article history: Received 3 December 2012 Accepted 15 January 2014 Available online 23 January 2014 Keywords: Upscaling Socio-environmental interaction Central Europe Geomorphology Soil science Palaeobotany The study of past socio-environmental systems integrates a variety of terrestrial archives. To understand regional or continental socio-environmental interactions proxy data from local archives need to be transferred to larger spatial scales. System properties like spatial heterogeneity, historical and spatial contingency, nonlinearity, scale dependency or emergence make generalizations from local observations to larger scales difficult. As these are common properties of natural and social systems, the development of an interdisciplinary upscaling framework for socio-environmental systems remains a challenge. For example, the integration of social and environmental data is often hindered by divergent methodological, i.e. qualitative and quantitative, approaches and discipline-specific perceptions of spatial scales. Additionally, joint approaches can be hampered by differences in the predictability of natural systems, which are subject to physical laws, and social systems, which depend on humans' decisions and communication. Here we present results from an interdisciplinary discussion of upscaling approaches in socio-environmental research with a special focus on the migration of modern humans in Central Europe during the last 30,000 years. Based on case studies from different disciplines, we develop a classification system for upscaling approaches used in past socio-environmental research. Finally, we present an initial upscaling framework that fosters the development of an interdisciplinary concept of scales and allows for a consideration of system properties like scale dependency, nonlinearity and contingency. The upscaling framework includes the following steps: i) the identification of relevant spatial and temporal scales at which socio-environmental interactions operate; ii) the definition of appropriate parameters to describe scale-specific interactions; iii) a comparison of process and observation scales to evaluate the potential of local archive data for larger scale generalization and for reconstructing scale-specific past socio-environmental interactions; iv) the identification and adaption of appropriate upscaling ap- proaches for the relevant scales; v) the development of scale-specific models of socio-environmental interactions, and vi) the connection of models in a nested hierarchy. Our intention is not to present final results, but rather to stimulate future discussions and to provide a basic reference on scale issues in the emerging field of integrated socio-environmental research. © 2014 Elsevier B.V. All rights reserved. Contents 1. Introduction . . . . . . . . . . . . . . . . . . . . . . . . . . . . . . . . . . . . . . . . . . . . . . . . . . . . . . . . . . . . . . . 23 2. Scales and terminology . . . . . . . . . . . . . . . . . . . . . . . . . . . . . . . . . . . . . . . . . . . . . . . . . . . . . . . . . . 24 3. Upscaling methods for different terrestrial archives . . . . . . . . . . . . . . . . . . . . . . . . . . . . . . . . . . . . . . . . . . . . . 25 Earth-Science Reviews 131 (2014) 22–48 ⁎ Corresponding author. Tel.: +49 228 734021; fax: +49 228 739099. E-mail address: [email protected] (M. Schlummer). 0012-8252/$ – see front matter © 2014 Elsevier B.V. All rights reserved. http://dx.doi.org/10.1016/j.earscirev.2014.01.004 Contents lists available at ScienceDirect Earth-Science Reviews journal homepage: www.elsevier.com/locate/earscirev

Welcome message from author
This document is posted to help you gain knowledge. Please leave a comment to let me know what you think about it! Share it to your friends and learn new things together.
Transcript
Earth-Science Reviews 131 (2014) 22–48
Contents lists available at ScienceDirect
Earth-Science Reviews
j ourna l homepage: www.e lsev ie r .com/ locate /earsc i rev
From point to area: Upscaling approaches for Late Quaternaryarchaeological and environmental data
Manuela Schlummer a,⁎, Thomas Hoffmann a, Richard Dikau a, Michael Eickmeier b, Peter Fischer c,Renate Gerlach d, Jörg Holzkämper e, Arie J. Kalis f, Inga Kretschmer e, Franziska Lauer g, Andreas Maier e,Janina Meesenburg e, Jutta Meurers-Balke e, Ulla Münch h, Stefan Pätzold g, Florian Steininger b,Astrid Stobbe f, Andreas Zimmermann e
a Department of Geography, University of Bonn, Meckenheimer Allee 166, 53115 Bonn, Germanyb Institute of Geography, University of Cologne, Albertus-Magnus-Platz, 50923 Cologne, Germanyc Natural Hazard Research and Geoarchaeology, Institute for Geography, Johannes Gutenberg-Universität Mainz, Johann-Joachim-Becher-Weg 21, 55099 Mainz, Germanyd Rhineland Regional Council (LVR), LVR — State Service for Archaeological Heritage, Endenicher Str. 133, 53115 Bonn, Germanye Institute of Prehistoric Archaeology, University of Cologne, Bernhard-Feilchenfeld-Str. 11 50969 Cologne, Germanyf Institute of Archaeological Sciences, Dept. III, Pre- and Early History, Johann Wolfgang Goethe-University, Grüneburgplatz 1, 60323 Frankfurt am Main, Germanyg Institute of Crop Science and Resource Conservation (INRES), Soil Science and Soil Ecology, Nussallee 13, 53115 Bonn, Germanyh Rhineland Regional Council (LVR), LVR — State Service for Archaeological Heritage, Unit Titz, Ehrenstr. 14-16, 52334 Titz, Germany
⁎ Corresponding author. Tel.: +49 228 734021; fax: +E-mail address: [email protected]
0012-8252/$ – see front matter © 2014 Elsevier B.V. All rihttp://dx.doi.org/10.1016/j.earscirev.2014.01.004
a b s t r a c t
a r t i c l e i n f oArticle history:Received 3 December 2012Accepted 15 January 2014Available online 23 January 2014
Keywords:UpscalingSocio-environmental interactionCentral EuropeGeomorphologySoil sciencePalaeobotany
The study of past socio-environmental systems integrates a variety of terrestrial archives. To understand regionalor continental socio-environmental interactions proxy data from local archives need to be transferred to largerspatial scales. System properties like spatial heterogeneity, historical and spatial contingency, nonlinearity,scale dependency or emergence make generalizations from local observations to larger scales difficult. As theseare common properties of natural and social systems, the development of an interdisciplinary upscaling frameworkfor socio-environmental systems remains a challenge. For example, the integration of social and environmental datais often hindered by divergent methodological, i.e. qualitative and quantitative, approaches and discipline-specificperceptions of spatial scales. Additionally, joint approaches can be hampered by differences in the predictabilityof natural systems, which are subject to physical laws, and social systems, which depend on humans' decisionsand communication.Here we present results from an interdisciplinary discussion of upscaling approaches in socio-environmentalresearch with a special focus on the migration of modern humans in Central Europe during the last30,000 years. Based on case studies from different disciplines, we develop a classification system for upscalingapproaches used in past socio-environmental research. Finally, we present an initial upscaling framework thatfosters the development of an interdisciplinary concept of scales and allows for a consideration of systempropertieslike scale dependency, nonlinearity and contingency. The upscaling framework includes the following steps: i) theidentification of relevant spatial and temporal scales at which socio-environmental interactions operate; ii) thedefinition of appropriate parameters to describe scale-specific interactions; iii) a comparison of process andobservation scales to evaluate the potential of local archive data for larger scale generalization and for reconstructingscale-specific past socio-environmental interactions; iv) the identification and adaptionof appropriate upscaling ap-proaches for the relevant scales; v) the development of scale-specific models of socio-environmental interactions,and vi) the connection of models in a nested hierarchy. Our intention is not to present final results, but rather tostimulate future discussions and to provide a basic reference on scale issues in the emerging field of integratedsocio-environmental research.
© 2014 Elsevier B.V. All rights reserved.
Contents
1. Introduction . . . . . . . . . . . . . . . . . . . . . . . . . . . . . . . . . . . . . . . . . . . . . . . . . . . . . . . . . . . . . . . 232. Scales and terminology . . . . . . . . . . . . . . . . . . . . . . . . . . . . . . . . . . . . . . . . . . . . . . . . . . . . . . . . . . 243. Upscaling methods for different terrestrial archives . . . . . . . . . . . . . . . . . . . . . . . . . . . . . . . . . . . . . . . . . . . . . 25
49 228 739099.(M. Schlummer).
ghts reserved.
23M. Schlummer et al. / Earth-Science Reviews 131 (2014) 22–48
3.1. Loess data and Pleistocene landform evolution . . . . . . . . . . . . . . . . . . . . . . . . . . . . . . . . . . . . . . . . . . . . 253.1.1. Upscaling methods . . . . . . . . . . . . . . . . . . . . . . . . . . . . . . . . . . . . . . . . . . . . . . . . . . . . 263.1.2. Concluding remarks . . . . . . . . . . . . . . . . . . . . . . . . . . . . . . . . . . . . . . . . . . . . . . . . . . . . 28
3.2. Reconstruction of Neolithic soil nutrient status in archaeological topsoil relicts . . . . . . . . . . . . . . . . . . . . . . . . . . . . . 283.2.1. Study area . . . . . . . . . . . . . . . . . . . . . . . . . . . . . . . . . . . . . . . . . . . . . . . . . . . . . . . . 293.2.2. Observation scale . . . . . . . . . . . . . . . . . . . . . . . . . . . . . . . . . . . . . . . . . . . . . . . . . . . . . 293.2.3. Target scale . . . . . . . . . . . . . . . . . . . . . . . . . . . . . . . . . . . . . . . . . . . . . . . . . . . . . . . 303.2.4. Upscaling methods . . . . . . . . . . . . . . . . . . . . . . . . . . . . . . . . . . . . . . . . . . . . . . . . . . . . 313.2.5. Critical remarks . . . . . . . . . . . . . . . . . . . . . . . . . . . . . . . . . . . . . . . . . . . . . . . . . . . . . . 313.2.6. Concluding remarks . . . . . . . . . . . . . . . . . . . . . . . . . . . . . . . . . . . . . . . . . . . . . . . . . . . . 31
3.3. Local soil erosion, sediment storage and upscaling . . . . . . . . . . . . . . . . . . . . . . . . . . . . . . . . . . . . . . . . . . 323.3.1. Local- and large-scale data . . . . . . . . . . . . . . . . . . . . . . . . . . . . . . . . . . . . . . . . . . . . . . . . . 323.3.2. Applied upscaling methods . . . . . . . . . . . . . . . . . . . . . . . . . . . . . . . . . . . . . . . . . . . . . . . . 323.3.3. Upscaling colluvial storage in the Rhine basin . . . . . . . . . . . . . . . . . . . . . . . . . . . . . . . . . . . . . . . . 333.3.4. Concluding remarks . . . . . . . . . . . . . . . . . . . . . . . . . . . . . . . . . . . . . . . . . . . . . . . . . . . . 34
3.4. A palaeobotanical point of view: upscaling of pollen data . . . . . . . . . . . . . . . . . . . . . . . . . . . . . . . . . . . . . . . 343.4.1. Process scale of pollen deposition and target scales . . . . . . . . . . . . . . . . . . . . . . . . . . . . . . . . . . . . . . 343.4.2. Stages of upscaling . . . . . . . . . . . . . . . . . . . . . . . . . . . . . . . . . . . . . . . . . . . . . . . . . . . . 34
3.5. Upscaling of Palaeolithic data . . . . . . . . . . . . . . . . . . . . . . . . . . . . . . . . . . . . . . . . . . . . . . . . . . . . 363.5.1. Sites, catchments and contextual areas — local and large-scale data in hunter–gatherer research . . . . . . . . . . . . . . . . . 363.5.2. Upscaling methods . . . . . . . . . . . . . . . . . . . . . . . . . . . . . . . . . . . . . . . . . . . . . . . . . . . . 373.5.3. Concluding remarks . . . . . . . . . . . . . . . . . . . . . . . . . . . . . . . . . . . . . . . . . . . . . . . . . . . . 38
3.6. Connecting Neolithic settlement areas and environmental data (soils, climate) . . . . . . . . . . . . . . . . . . . . . . . . . . . . 383.6.1. Large-scale data . . . . . . . . . . . . . . . . . . . . . . . . . . . . . . . . . . . . . . . . . . . . . . . . . . . . . 383.6.2. From excavation sites to settlement areas . . . . . . . . . . . . . . . . . . . . . . . . . . . . . . . . . . . . . . . . . . 393.6.3. Methods for analysing the relationship between land use and precipitation . . . . . . . . . . . . . . . . . . . . . . . . . . . 393.6.4. Concluding remarks . . . . . . . . . . . . . . . . . . . . . . . . . . . . . . . . . . . . . . . . . . . . . . . . . . . . 39
4. Discussion and synthesis . . . . . . . . . . . . . . . . . . . . . . . . . . . . . . . . . . . . . . . . . . . . . . . . . . . . . . . . . 394.1. Scales of terrestrial archives . . . . . . . . . . . . . . . . . . . . . . . . . . . . . . . . . . . . . . . . . . . . . . . . . . . . 394.2. Similarities and differences of upscaling methods in geosciences and archaeology . . . . . . . . . . . . . . . . . . . . . . . . . . . . 414.3. Towards an interdisciplinary upscaling framework of socio-environmental research . . . . . . . . . . . . . . . . . . . . . . . . 43
5. Summary and concluding remarks . . . . . . . . . . . . . . . . . . . . . . . . . . . . . . . . . . . . . . . . . . . . . . . . . . . . . 46Acknowledgements . . . . . . . . . . . . . . . . . . . . . . . . . . . . . . . . . . . . . . . . . . . . . . . . . . . . . . . . . . . . . . 46References . . . . . . . . . . . . . . . . . . . . . . . . . . . . . . . . . . . . . . . . . . . . . . . . . . . . . . . . . . . . . . . . . . 46
1. Introduction
The study of past socio-environmental systems bases on amultitudeof proxies and terrestrial archives. These include amongst others loessdeposits, colluvial sediments, pollen or archaeological finds and features,which are typiccaly sampled at local sites.While for example the analysisof geochemical elements in a 6 cmdrill core from a loess deposit providesinformation on past climatic conditions, the size of an excavated archae-ological settlement is used as a proxy for corresponding farmland or spe-cific raw material requirements. These site-specific data are generallyused to address issues that operate at regional or even continental scales,such as the impact of climatic deterioration on humanmigration or of an-thropogenic land use on regional environments.
A major problem impeding the transfer of knowledge from specificsites to larger, e.g. regional or continental, scales, here referred to as“upscaling”, arises from scale specific processes and properties ofsocio-environmental systems. Zhang et al. (2004) have identified fivemain causes of uncertainties associated with the transfer of knowledge,information or data from one spatial scale to another: i) the spatialheterogeneity of objects and process nonlinearities; ii) the scale depen-dency of the characteristics of objects or processes (e.g. size, magnitudeand/or frequency); iii) feedbacks associatedwith process interactions atsmall and large scales; iv) emergent properties that arise at larger scalesthrough the interaction of small-scale processes; and v) the time lags ofsystem response to external perturbation.
In addition, contingency is a system property that is strongly relatedto spatial heterogeneity, nonlinearity and scale dependency, andimpedes generalizations from small to larger scales (Phillips, 2001).Phillips (2001) distinguishes three types of contingency. Firstly histori-cal contingency that occurs where the unique local history or a specificpast event determines the local state of a system or system variable. This
includes cases where small perturbations in initial conditions cause a di-vergent system evolution. The second type is spatial contingency that ex-istswhere the local state of a systemor variable strongly depends on localconditions that “are unlikely to be duplicated in another location” (Phillips,2001, p. 349). The third type is scale contingency that occurs when “thecontrols over process-response relationships vary with spatial extent or reso-lution.” (Phillips, 2001, p. 349). These issues are not relevant everywhere,but are often inherent to socio-environmental systems and need to beaccounted for explicitly in upscaling approaches.
Different solutions for solving upscaling issues have been suggestedby Harvey (2000). Depending on the underlying causes, these solutionsinclude the adjustment of critical thresholds, the use of lumped (e.g. spa-tially averaged) models or the creation of new models to integrate theeffects of smaller scales (see Table 3 in Harvey (2000, p. 254) for a com-plete list). Each solution is appropriate for certain disciplinary upscalingissues or mathematical models, but of limited suitability in integratedapproaches that deal with socio-environmental interactions across abroad range of disciplines.
While some disciplines such as meteorology, hydrology or soilscience (Anderson and Rogers, 1987; Blöschl, 2001; Lagacherie et al.,2007) have a long tradition dealing with upscaling issues, other disci-plines such as archaeology or palaeobotany have only recently begun toconsider explicitly scale transfers and large-scale phenomena(e.g. Gaillard et al., 2008; Zimmermann et al., 2009). Mainly dueto their various states of upscaling-approaches, interdisciplinarycommunication about upscaling issues and related uncertainties insocio-environmental research is very limited. Rather, scale-specific gen-eralizations about external forcing variables are adopted fromother dis-ciplines to understand a system whose processes operate at its ownspecific scales. For instance, climate reconstructions derived from distantlake records are used to understand climate-driven changes of societies.
24 M. Schlummer et al. / Earth-Science Reviews 131 (2014) 22–48
This is often done without a nuanced assessment of the interpretation ofthe palaeoclimatic proxies and without considering possible scale-dependencies and complexities of the behaviour of ancient societies inrelation to palaeoclimatic conditions (Hodell, 2011).
The analysis of multiscale socio-environmental interactions requiresan integration of scale-specific proxies and upscaling approaches fromsocial and environmental disciplines that provide compatible data ofhuman and natural systems at various spatial scales. A major challengefor this integration is the lack of interdisciplinary communication and aunifying conceptual and methodological framework on upscaling andscale-dependencies which considers the different characteristics of ter-restrial archives, i.e. their processes of formation and modification aswell as relevant boundary conditions.
Terrestrial archives can be divided into three main types: thoseformed by (i) environmental processes, e. g. wind driven loess or pollentransport; (ii) by human actions like the transport of willfully selectedmollusk shells and lithic rawmaterial or the production of tools and art-work; and (iii) archives associated with natural processes conditionedby (un-) intended implications of human activities, e. g. the formationof a colluvial deposits induced by human land use. Most archives usedto analyse socio-environmental systems contain combined signals ofsocial and natural processes. As the former are driven by humans' deci-sions and communication, which can be independent of environmentalsettings, and the latter by physical laws, both are characterized by avarying degree of predictability, which has to be considered in jointupscaling approaches.
The high level of variability in archive forming processes culminates invariable spatial distributions and discontinuities. Thus sampling must beundertaken using archive specific sampling designs and largely variablesampling sizes. Colluvial deposits, for instance, are widespread in agricul-tural regions as they result from human-induced soil erosion on all in-clined arable land. As they are well preserved in lower slope positionsor slope hollows sampling often follows a catena-based approach. Pollenare ubiquitously deposited, but are preserved almost exclusively underspecial conditions that prevail, for instance, in peat, alluvial or lake sedi-ments. Hence, long-term pollen records are scarce and most often pre-served outside of areas of human activity. While both archives providevaluable records of socio-environmental interactions, upscaling ap-proaches are fundamentally different given their relative location topast areas of human activity and their widespread/sporadic spatialdistribution.
Here, we consider upscaling issues and critically review upscaling ap-proaches that are applied in disciplines of socio-environmental research.As a contribution to the interdisciplinary discussion on upscaling, we de-velop for the first time a classification system for upscaling approachesthat considers characteristic archive properties relevant for both socialand environmental disciplines.We discuss the suitability of each categoryfor coping with the systemic causes of scaling issues in combined socio-environmental systems. Even though the disciplinary focus of this studylies on archaeology, palaeobotany, soil science and geomorphology, thenew classification can easily be applied to other archives and extendedby further disciplines. By this review, we hope to ease the identificationof scaling issues and to provide a contribution towards the developmentof an upscaling concept for interdisciplinary research. Although the factor“time” is an important aspect of upscaling in socio-environmentalresearch, we reduce the complexity of the issue by focusing on spatialupscaling.
We start by defining the terms “scale” and “upscaling” as they pertainto social and environmental science. We then review upscaling ap-proaches and prediction frameworks for different terrestrial archivesused in socio-environmental research by introducing case studies fromdifferent disciplines. These archives include loess, soils, colluvial deposits,plant remains, and Palaeolithic andNeolithic finds and features. Althoughpollen are almost exclusively preserved under wet conditions and arethus strictly speaking not terrestrial, but semi-terrestrial archives, we in-clude them in our discussion due to their great value in reconstructing
land cover, their importance as parameters of socio-environmental inter-actions, and the similarity of the issues involved in upscaling local pollendata to larger spatial scales. Finally, basic types of upscaling approachesare categorized and their suitability for coping with the systemic causesof scaling issues is evaluated. Although our case studies focus on theCentral European loess belt, the discussed issues associated with theupscaling of terrestrial archive data can be transferred to areas of verydifferent environmental settings and land use histories.
2. Scales and terminology
Terminology and progress concerning upscaling issues differ consid-erably among disciplines. While single case studies on upscaling ap-proaches exist in archaeology (e.g. Finke et al., 2008; Zimmermannet al., 2009), in other disciplines reviews on scaling issues and upscalingapproaches are more widely available, for example in hydrology(Blöschl and Sivapalan, 1995), geomorphology (de Boer, 1992), environ-mental research (Bierkens et al., 2000; Harvey, 2000; Zhang et al., 2004),soil science (Lagacherie et al., 2007), socio-environmental relationships(Young, 1994) and human geography (Sayre and Di Vittorio, 2009).
These reviews reveal differences in terminology, concepts andupscaling methods, albeit that they also indicate similarities that canbe used as a basis for interdisciplinary communication (Harvey, 2000).Therefore, we summarize the aspects and definitions of “scale” and“upscaling”. According to Zhang et al. (2004) and Blöschl and Sivapalan(1995) a total of five different meanings for “scale” can be distinguished:
1) The “cartographic map scale” defines the proportional relationshipbetween the distances on a map to the actual distances on theground. The level of detail (i.e. resolution) increases linearly withthe scale of the topographic map. Typically map scales vary from1:5000 to 1:100,000,000.
2) The “geographic scale” describes the size or extent of the area underconsideration. In contrast to the cartographic map scale, the geo-graphical scale increases and the spatial data resolution decreaseswith the extent of the study area. In this paper, unless otherwisespecified, the term “spatial scale” is used synonymously with theterm “geographic scale”.
3) The “process-” or “operational scale” is associated with the charac-teristic spatial extent and the spatial variability of the processunder consideration. For instance, soil erosion and sheet wash dom-inate sediment transport on slopes, while bank erosion andsuspended sediment transport within river channels dominatesediment fluxes in larger drainage basins.
4) The “observation” or “measurement scale” is specified either by thespatial resolution that is used to determine an object, the spatial ortemporal extent of a dataset, the space between samples (data resolu-tion), or the size and integration (average) time of a sample. Typically,geoscientists and archaeologists often use single drill locations,outcrops, or archaeological finds and features (e.g. observation scaleb 1 m2) to understand processes that operate on much larger scales.
5) The “modelling scale” represents the spatial and/or temporal scale atwhich processes and objects are modelled or reproduced. Sincemodels should represent certain processes, the scale of the modelhas to be similar to the scale at which the associated processesoperate.
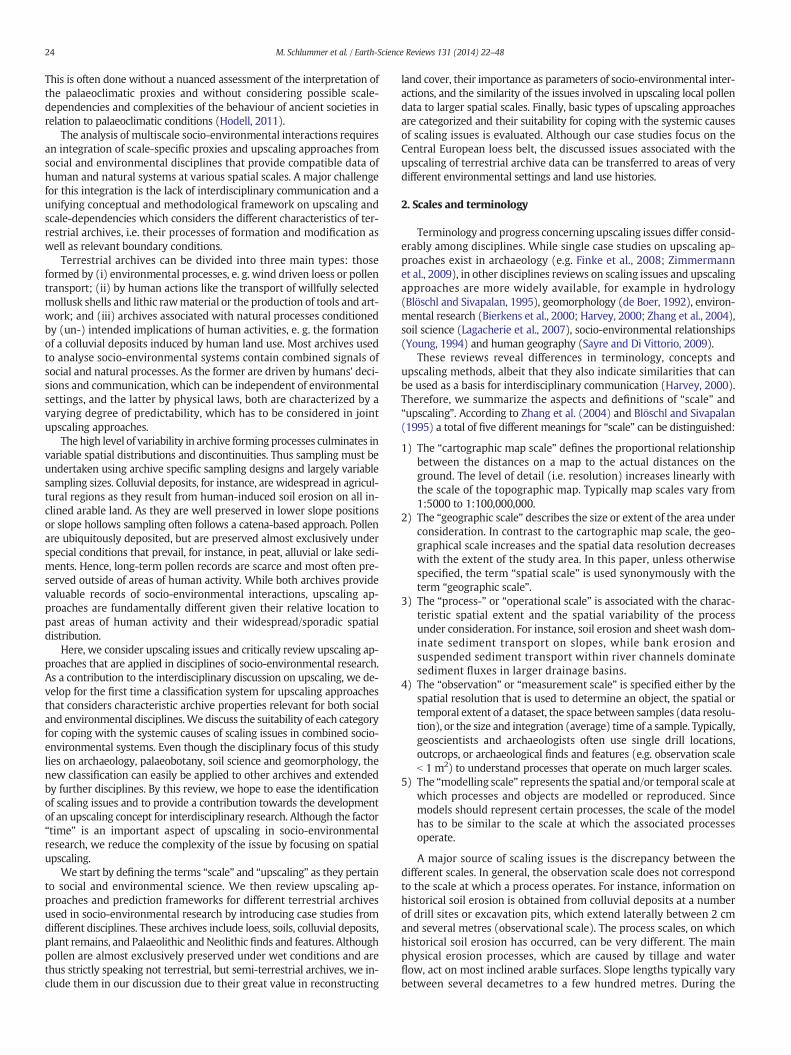
A major source of scaling issues is the discrepancy between thedifferent scales. In general, the observation scale does not correspondto the scale at which a process operates. For instance, information onhistorical soil erosion is obtained from colluvial deposits at a numberof drill sites or excavation pits, which extend laterally between 2 cmand several metres (observational scale). The process scales, on whichhistorical soil erosion has occurred, can be very different. The mainphysical erosion processes, which are caused by tillage and waterflow, act on most inclined arable surfaces. Slope lengths typically varybetween several decametres to a few hundred metres. During the
25M. Schlummer et al. / Earth-Science Reviews 131 (2014) 22–48
Neolithic, the size of individual agricultural fields, on which soil erosionoccurred, presumably extended over several hundreds of squaremetresand the total arable land in Central Europe during this period extendedover several hundred thousand square kilometres. Thus, an understand-ing of the impact of human-induced soil erosion during the Neolithicrequires bridging these scales by upscaling local information to largerregions, using appropriate sampling designs and regional datasets thatare correlated with local evidences.
Upscaling can be defined as “increasing the support of the researcharea”, while “the support is the largest subarea or time interval for whichthe property of interest is considered homogenous” (Bierkens et al., 2000,p. 8–9). In this paper we define “upscaling” more generally as creatinglarger-scale information from point data (observational scale). Thisincludes the application of already aggregated data like soil maps, pre-cipitation maps, land use maps or digital elevation models (DEMs) inthe modelling of phenomena at large scales.
3. Upscaling methods for different terrestrial archives
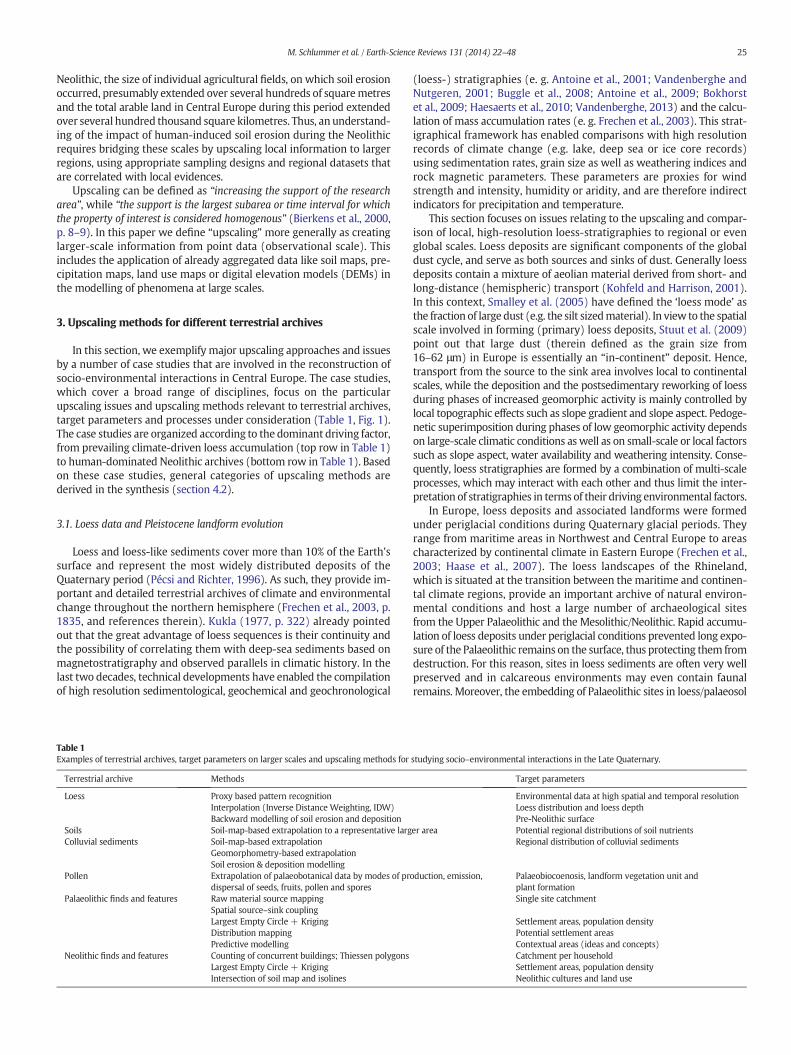
In this section, we exemplify major upscaling approaches and issuesby a number of case studies that are involved in the reconstruction ofsocio-environmental interactions in Central Europe. The case studies,which cover a broad range of disciplines, focus on the particularupscaling issues and upscaling methods relevant to terrestrial archives,target parameters and processes under consideration (Table 1, Fig. 1).The case studies are organized according to the dominant driving factor,from prevailing climate-driven loess accumulation (top row in Table 1)to human-dominated Neolithic archives (bottom row in Table 1). Basedon these case studies, general categories of upscaling methods arederived in the synthesis (section 4.2).
3.1. Loess data and Pleistocene landform evolution
Loess and loess-like sediments cover more than 10% of the Earth'ssurface and represent the most widely distributed deposits of theQuaternary period (Pécsi and Richter, 1996). As such, they provide im-portant and detailed terrestrial archives of climate and environmentalchange throughout the northern hemisphere (Frechen et al., 2003, p.1835, and references therein). Kukla (1977, p. 322) already pointedout that the great advantage of loess sequences is their continuity andthe possibility of correlating them with deep-sea sediments based onmagnetostratigraphy and observed parallels in climatic history. In thelast two decades, technical developments have enabled the compilationof high resolution sedimentological, geochemical and geochronological
Table 1Examples of terrestrial archives, target parameters on larger scales and upscaling methods for
Terrestrial archive Methods
Loess Proxy based pattern recognitionInterpolation (Inverse Distance Weighting, IDW)Backward modelling of soil erosion and deposition
Soils Soil-map-based extrapolation to a representative largColluvial sediments Soil-map-based extrapolation
Geomorphometry-based extrapolationSoil erosion & deposition modelling
Pollen Extrapolation of palaeobotanical data by modes of prdispersal of seeds, fruits, pollen and spores
Palaeolithic finds and features Raw material source mappingSpatial source–sink couplingLargest Empty Circle + KrigingDistribution mappingPredictive modelling
Neolithic finds and features Counting of concurrent buildings; Thiessen polygonsLargest Empty Circle + KrigingIntersection of soil map and isolines
(loess-) stratigraphies (e. g. Antoine et al., 2001; Vandenberghe andNutgeren, 2001; Buggle et al., 2008; Antoine et al., 2009; Bokhorstet al., 2009; Haesaerts et al., 2010; Vandenberghe, 2013) and the calcu-lation of mass accumulation rates (e. g. Frechen et al., 2003). This strat-igraphical framework has enabled comparisons with high resolutionrecords of climate change (e.g. lake, deep sea or ice core records)using sedimentation rates, grain size as well as weathering indices androck magnetic parameters. These parameters are proxies for windstrength and intensity, humidity or aridity, and are therefore indirectindicators for precipitation and temperature.
This section focuses on issues relating to the upscaling and compar-ison of local, high-resolution loess-stratigraphies to regional or evenglobal scales. Loess deposits are significant components of the globaldust cycle, and serve as both sources and sinks of dust. Generally loessdeposits contain a mixture of aeolian material derived from short- andlong-distance (hemispheric) transport (Kohfeld and Harrison, 2001).In this context, Smalley et al. (2005) have defined the ‘loess mode’ asthe fraction of large dust (e.g. the silt sizedmaterial). In view to the spatialscale involved in forming (primary) loess deposits, Stuut et al. (2009)point out that large dust (therein defined as the grain size from16–62 μm) in Europe is essentially an “in-continent” deposit. Hence,transport from the source to the sink area involves local to continentalscales, while the deposition and the postsedimentary reworking of loessduring phases of increased geomorphic activity is mainly controlled bylocal topographic effects such as slope gradient and slope aspect. Pedoge-netic superimposition during phases of low geomorphic activity dependson large-scale climatic conditions aswell as on small-scale or local factorssuch as slope aspect, water availability and weathering intensity. Conse-quently, loess stratigraphies are formed by a combination of multi-scaleprocesses, which may interact with each other and thus limit the inter-pretation of stratigraphies in terms of their driving environmental factors.
In Europe, loess deposits and associated landforms were formedunder periglacial conditions during Quaternary glacial periods. Theyrange from maritime areas in Northwest and Central Europe to areascharacterized by continental climate in Eastern Europe (Frechen et al.,2003; Haase et al., 2007). The loess landscapes of the Rhineland,which is situated at the transition between the maritime and continen-tal climate regions, provide an important archive of natural environ-mental conditions and host a large number of archaeological sitesfrom the Upper Palaeolithic and the Mesolithic/Neolithic. Rapid accumu-lation of loess deposits under periglacial conditions prevented long expo-sure of the Palaeolithic remains on the surface, thus protecting them fromdestruction. For this reason, sites in loess sediments are often very wellpreserved and in calcareous environments may even contain faunalremains. Moreover, the embedding of Palaeolithic sites in loess/palaeosol
studying socio–environmental interactions in the Late Quaternary.
Target parameters
Environmental data at high spatial and temporal resolutionLoess distribution and loess depthPre-Neolithic surface
er area Potential regional distributions of soil nutrientsRegional distribution of colluvial sediments
oduction, emission, Palaeobiocoenosis, landform vegetation unit andplant formationSingle site catchment
Settlement areas, population densityPotential settlement areasContextual areas (ideas and concepts)Catchment per householdSettlement areas, population densityNeolithic cultures and land use
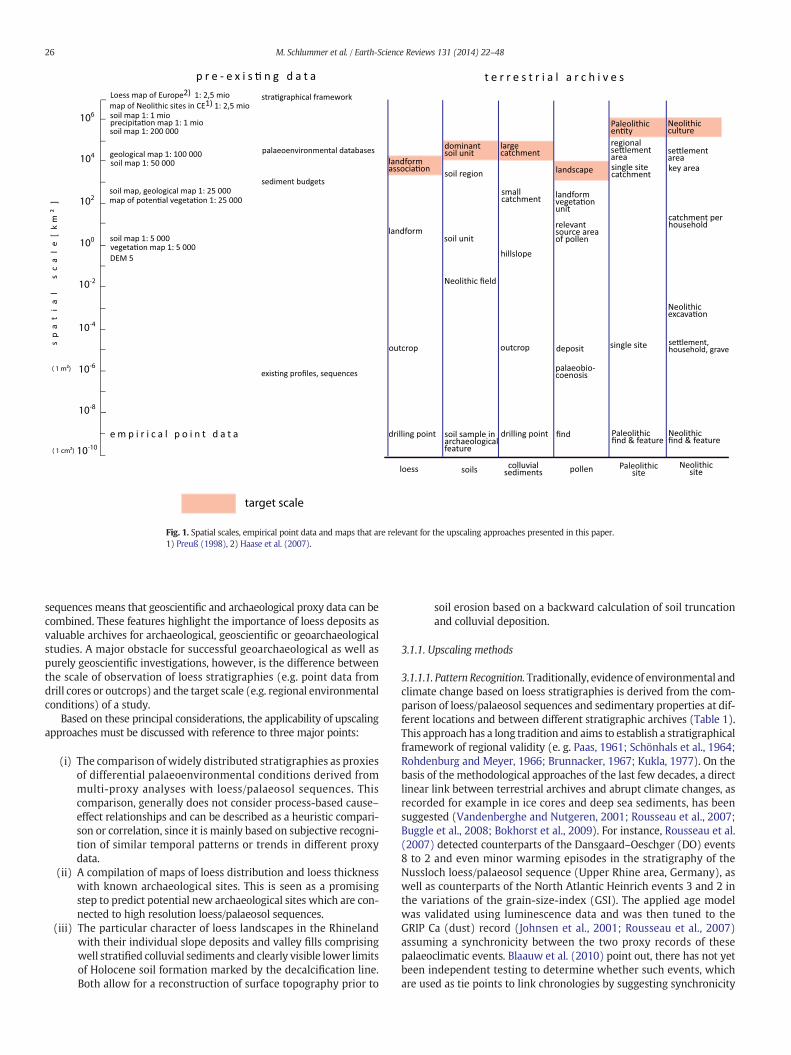
Fig. 1. Spatial scales, empirical point data and maps that are relevant for the upscaling approaches presented in this paper.1) Preuß (1998), 2) Haase et al. (2007).
26 M. Schlummer et al. / Earth-Science Reviews 131 (2014) 22–48
sequences means that geoscientific and archaeological proxy data can becombined. These features highlight the importance of loess deposits asvaluable archives for archaeological, geoscientific or geoarchaeologicalstudies. A major obstacle for successful geoarchaeological as well aspurely geoscientific investigations, however, is the difference betweenthe scale of observation of loess stratigraphies (e.g. point data fromdrill cores or outcrops) and the target scale (e.g. regional environmentalconditions) of a study.
Based on these principal considerations, the applicability of upscalingapproaches must be discussed with reference to three major points:
(i) The comparison of widely distributed stratigraphies as proxiesof differential palaeoenvironmental conditions derived frommulti-proxy analyses with loess/palaeosol sequences. Thiscomparison, generally does not consider process-based cause–effect relationships and can be described as a heuristic compari-son or correlation, since it is mainly based on subjective recogni-tion of similar temporal patterns or trends in different proxydata.
(ii) A compilation of maps of loess distribution and loess thicknesswith known archaeological sites. This is seen as a promisingstep to predict potential new archaeological sites which are con-nected to high resolution loess/palaeosol sequences.
(iii) The particular character of loess landscapes in the Rhinelandwith their individual slope deposits and valley fills comprisingwell stratified colluvial sediments and clearly visible lower limitsof Holocene soil formation marked by the decalcification line.Both allow for a reconstruction of surface topography prior to
soil erosion based on a backward calculation of soil truncationand colluvial deposition.
3.1.1. Upscaling methods
3.1.1.1. Pattern Recognition. Traditionally, evidence of environmental andclimate change based on loess stratigraphies is derived from the com-parison of loess/palaeosol sequences and sedimentary properties at dif-ferent locations and between different stratigraphic archives (Table 1).This approach has a long tradition and aims to establish a stratigraphicalframework of regional validity (e. g. Paas, 1961; Schönhals et al., 1964;Rohdenburg and Meyer, 1966; Brunnacker, 1967; Kukla, 1977). On thebasis of the methodological approaches of the last few decades, a directlinear link between terrestrial archives and abrupt climate changes, asrecorded for example in ice cores and deep sea sediments, has beensuggested (Vandenberghe and Nutgeren, 2001; Rousseau et al., 2007;Buggle et al., 2008; Bokhorst et al., 2009). For instance, Rousseau et al.(2007) detected counterparts of the Dansgaard–Oeschger (DO) events8 to 2 and even minor warming episodes in the stratigraphy of theNussloch loess/palaeosol sequence (Upper Rhine area, Germany), aswell as counterparts of the North Atlantic Heinrich events 3 and 2 inthe variations of the grain-size-index (GSI). The applied age modelwas validated using luminescence data and was then tuned to theGRIP Ca (dust) record (Johnsen et al., 2001; Rousseau et al., 2007)assuming a synchronicity between the two proxy records of thesepalaeoclimatic events. Blaauw et al. (2010) point out, there has not yetbeen independent testing to determine whether such events, whichare used as tie points to link chronologies by suggesting synchronicity
27M. Schlummer et al. / Earth-Science Reviews 131 (2014) 22–48
over large spatial scales, were indeed synchronous. It has been shownthat “even with the highest-resolution dated age models (67 radiocarbonand IRSL dates for Les Échets, multi-proxy annual layer counting forGreenland; Andersen et al., 2006), chronological uncertainties are currentlytoo high to resolve, through independent chronologies, [the question]whether last glacial D-O climate events were simultaneous, or even related,between Greenland and Western Europe. These problems are even moreserious with proxy archives dated and analysed at lower resolution.”(Blaauw et al., 2010, p. 391–392).
Beside the uncertainties associated with the applied age models, adelayed response of the depositional and erosional processes to climatechanges has to be assumed. Climate-driven periods of high rates of dustaccumulation alternate with phases of predominant erosion and reloca-tion of sediments and phases of low accumulation, which lead to soilformation and the conservation of the pre-existing land surface. How-ever, neither geomorphological nor soil formation processes react in-stantaneously to climate changes and may be delayed by several 102
to 103 years, due to internal feedback within the system (e.g. slowmigration of surface stabilizing vegetation). Additionally, these processesvary in space, due to local factors. Thus, prior to drawing a correlation be-tween local data and high resolution deep sea or ice core records, interimsteps are required. A good practice example is presented by Haesaertset al. (2010) and Bokhorst et al. (2011), who compare multiple proxiesderived from loess archives along a transect covering themain accumula-tion areas fromWestern over Central and Eastern Europe to Asia. Despitethe changing climatic conditions along this transect, ranging frompredominantly western and northwestern wind regimes to monsoonalregimes, the loess stratigraphy of the Chinese loess plateau is acceptedas standard stratigraphy of the continental Quaternary (Zöller, 2010).Additionally, Biscaye et al. (1997) note that an Eastern Asian sourcearea of dust accumulated in the Greenland ice sheet during the LastGlacial Maximum (LGM) is very likely.
In conclusion, detailed multi-proxy-based investigations would allowfor the detection and quantification of the geomorphic system's responseto climate events. In this context the underlying sampling theory is ofgreat importance. Almost all publications concerned with loess stratigra-phies and their relevance for climate and palaeo-environmental recon-struction are based on available outcrops. Thus, sampled sequencesare usually predetermined independent of their hillslope position. Incontrast, recent loess research of our group has focused on geophysicalexploration of the near-surface underground and subsequent drilling.The great advantage of this particular approach is that study sequencescan be selected systematically, i.e. considering such aspects as hillslopeposition and sediment thickness. In addition, the implementation ofdrill transects means that different hillslope positions can be engaged ina single catchment. Comparing single cores as well as different transects(from different catchments) can lead to the differentiation of local andoverlying thresholds and driving forces. A next step could be based onthe potential linkage of the loess archives of the Middle Rhine to highresolution laminated lake sediments (e. g. Seelos et al., 2009); in thisway, thresholds and associated system responses could be detectedand quantified on a regional scale, culminating in a chronological andbio-stratigraphical correlation of embedded archaeological finds. Assuch, pattern recognition seems to be an appropriate upscaling ap-proach if the above-mentioned problems and restrictions are takeninto consideration.
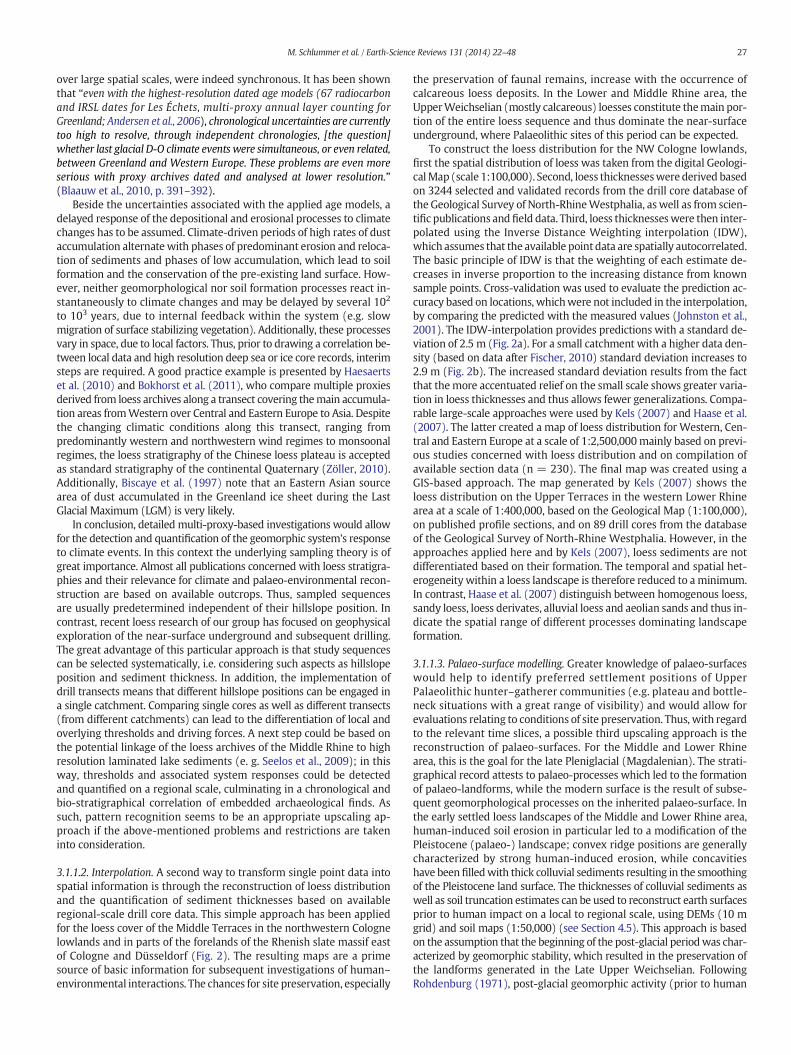
3.1.1.2. Interpolation. A second way to transform single point data intospatial information is through the reconstruction of loess distributionand the quantification of sediment thicknesses based on availableregional-scale drill core data. This simple approach has been appliedfor the loess cover of the Middle Terraces in the northwestern Colognelowlands and in parts of the forelands of the Rhenish slate massif eastof Cologne and Düsseldorf (Fig. 2). The resulting maps are a primesource of basic information for subsequent investigations of human–environmental interactions. The chances for site preservation, especially
the preservation of faunal remains, increase with the occurrence ofcalcareous loess deposits. In the Lower and Middle Rhine area, theUpperWeichselian (mostly calcareous) loesses constitute themain por-tion of the entire loess sequence and thus dominate the near-surfaceunderground, where Palaeolithic sites of this period can be expected.
To construct the loess distribution for the NW Cologne lowlands,first the spatial distribution of loess was taken from the digital Geologi-calMap (scale 1:100,000). Second, loess thicknesseswere derived basedon 3244 selected and validated records from the drill core database ofthe Geological Survey of North-RhineWestphalia, aswell as from scien-tific publications andfield data. Third, loess thicknesseswere then inter-polated using the Inverse Distance Weighting interpolation (IDW),which assumes that the available point data are spatially autocorrelated.The basic principle of IDW is that the weighting of each estimate de-creases in inverse proportion to the increasing distance from knownsample points. Cross-validation was used to evaluate the prediction ac-curacy based on locations, whichwere not included in the interpolation,by comparing the predicted with the measured values (Johnston et al.,2001). The IDW-interpolation provides predictions with a standard de-viation of 2.5 m (Fig. 2a). For a small catchment with a higher data den-sity (based on data after Fischer, 2010) standard deviation increases to2.9 m (Fig. 2b). The increased standard deviation results from the factthat themore accentuated relief on the small scale shows greater varia-tion in loess thicknesses and thus allows fewer generalizations. Compa-rable large-scale approaches were used by Kels (2007) and Haase et al.(2007). The latter created a map of loess distribution for Western, Cen-tral and Eastern Europe at a scale of 1:2,500,000mainly based on previ-ous studies concerned with loess distribution and on compilation ofavailable section data (n = 230). The final map was created using aGIS-based approach. The map generated by Kels (2007) shows theloess distribution on the Upper Terraces in the western Lower Rhinearea at a scale of 1:400,000, based on the Geological Map (1:100,000),on published profile sections, and on 89 drill cores from the databaseof the Geological Survey of North-Rhine Westphalia. However, in theapproaches applied here and by Kels (2007), loess sediments are notdifferentiated based on their formation. The temporal and spatial het-erogeneity within a loess landscape is therefore reduced to a minimum.In contrast, Haase et al. (2007) distinguish between homogenous loess,sandy loess, loess derivates, alluvial loess and aeolian sands and thus in-dicate the spatial range of different processes dominating landscapeformation.
3.1.1.3. Palaeo-surface modelling. Greater knowledge of palaeo-surfaceswould help to identify preferred settlement positions of UpperPalaeolithic hunter–gatherer communities (e.g. plateau and bottle-neck situations with a great range of visibility) and would allow forevaluations relating to conditions of site preservation. Thus, with regardto the relevant time slices, a possible third upscaling approach is thereconstruction of palaeo-surfaces. For the Middle and Lower Rhinearea, this is the goal for the late Pleniglacial (Magdalenian). The strati-graphical record attests to palaeo-processes which led to the formationof palaeo-landforms, while the modern surface is the result of subse-quent geomorphological processes on the inherited palaeo-surface. Inthe early settled loess landscapes of the Middle and Lower Rhine area,human-induced soil erosion in particular led to a modification of thePleistocene (palaeo-) landscape; convex ridge positions are generallycharacterized by strong human-induced erosion, while concavitieshave beenfilledwith thick colluvial sediments resulting in the smoothingof the Pleistocene land surface. The thicknesses of colluvial sediments aswell as soil truncation estimates can be used to reconstruct earth surfacesprior to human impact on a local to regional scale, using DEMs (10 mgrid) and soil maps (1:50,000) (see Section 4.5). This approach is basedon the assumption that the beginning of the post-glacial periodwas char-acterized by geomorphic stability, which resulted in the preservation ofthe landforms generated in the Late Upper Weichselian. FollowingRohdenburg (1971), post-glacial geomorphic activity (prior to human
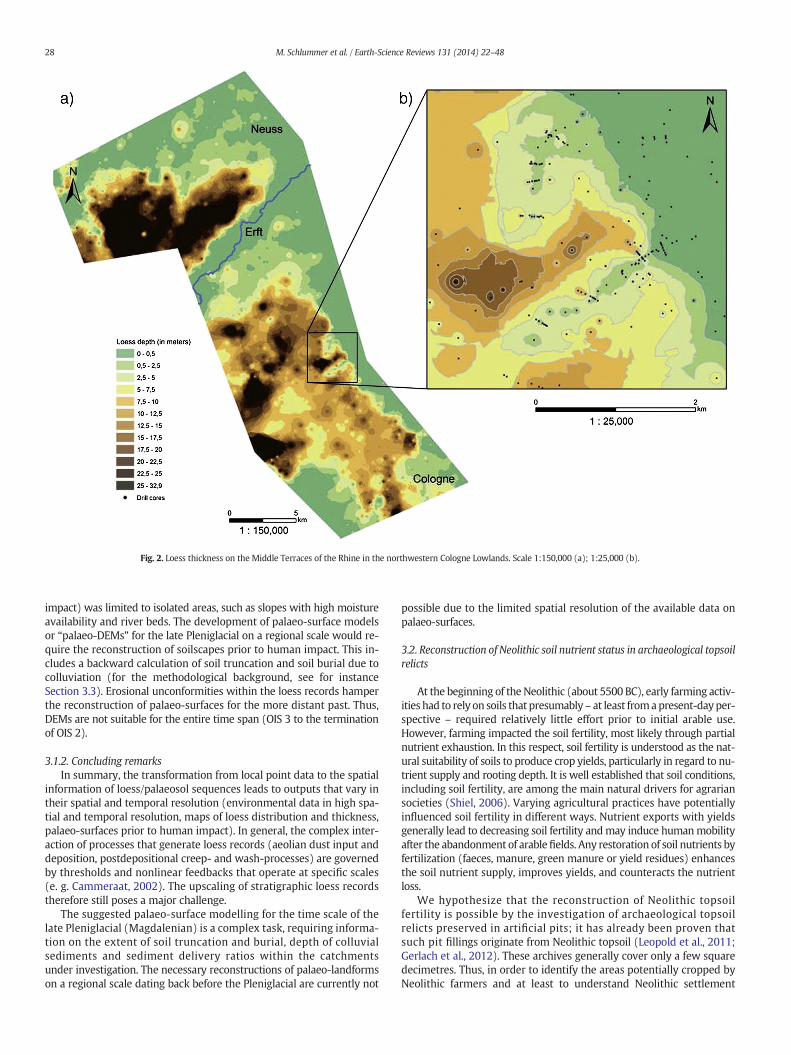
Fig. 2. Loess thickness on the Middle Terraces of the Rhine in the northwestern Cologne Lowlands. Scale 1:150,000 (a); 1:25,000 (b).
28 M. Schlummer et al. / Earth-Science Reviews 131 (2014) 22–48
impact) was limited to isolated areas, such as slopes with high moistureavailability and river beds. The development of palaeo-surface modelsor “palaeo-DEMs” for the late Pleniglacial on a regional scale would re-quire the reconstruction of soilscapes prior to human impact. This in-cludes a backward calculation of soil truncation and soil burial due tocolluviation (for the methodological background, see for instanceSection 3.3). Erosional unconformities within the loess records hamperthe reconstruction of palaeo-surfaces for the more distant past. Thus,DEMs are not suitable for the entire time span (OIS 3 to the terminationof OIS 2).
3.1.2. Concluding remarksIn summary, the transformation from local point data to the spatial
information of loess/palaeosol sequences leads to outputs that vary intheir spatial and temporal resolution (environmental data in high spa-tial and temporal resolution, maps of loess distribution and thickness,palaeo-surfaces prior to human impact). In general, the complex inter-action of processes that generate loess records (aeolian dust input anddeposition, postdepositional creep- and wash-processes) are governedby thresholds and nonlinear feedbacks that operate at specific scales(e. g. Cammeraat, 2002). The upscaling of stratigraphic loess recordstherefore still poses a major challenge.
The suggested palaeo-surface modelling for the time scale of thelate Pleniglacial (Magdalenian) is a complex task, requiring informa-tion on the extent of soil truncation and burial, depth of colluvialsediments and sediment delivery ratios within the catchmentsunder investigation. The necessary reconstructions of palaeo-landformson a regional scale dating back before the Pleniglacial are currently not
possible due to the limited spatial resolution of the available data onpalaeo-surfaces.
3.2. Reconstruction of Neolithic soil nutrient status in archaeological topsoilrelicts
At the beginning of the Neolithic (about 5500 BC), early farming activ-ities had to rely on soils that presumably– at least fromapresent-dayper-spective – required relatively little effort prior to initial arable use.However, farming impacted the soil fertility, most likely through partialnutrient exhaustion. In this respect, soil fertility is understood as the nat-ural suitability of soils to produce crop yields, particularly in regard to nu-trient supply and rooting depth. It is well established that soil conditions,including soil fertility, are among the main natural drivers for agrariansocieties (Shiel, 2006). Varying agricultural practices have potentiallyinfluenced soil fertility in different ways. Nutrient exports with yieldsgenerally lead to decreasing soil fertility andmay induce humanmobilityafter the abandonment of arablefields. Any restoration of soil nutrients byfertilization (faeces, manure, green manure or yield residues) enhancesthe soil nutrient supply, improves yields, and counteracts the nutrientloss.
We hypothesize that the reconstruction of Neolithic topsoilfertility is possible by the investigation of archaeological topsoilrelicts preserved in artificial pits; it has already been proven thatsuch pit fillings originate from Neolithic topsoil (Leopold et al., 2011;Gerlach et al., 2012). These archives generally cover only a few squaredecimetres. Thus, in order to identify the areas potentially cropped byNeolithic farmers and at least to understand Neolithic settlement
29M. Schlummer et al. / Earth-Science Reviews 131 (2014) 22–48
patterns, it is essential to upscale point information at which the soilfertility is measured to regions in which Neolithic mobility took place(see Section 3.6).
3.2.1. Study areaTwo regions (Lower Rhine Basin and Central German dry region)
with different predominant soil conditions were investigated. Bothareas are located in loess landscapes in Germany, and both regions areancient settlement areas (compare section 3.1). The occurrence ofloess as soil parentmaterial results in potentially high agricultural yieldsin both regions, since it provides the substrate for soils that likely hadnear-optimal cropping conditions during the Neolithic (Lüning, 2000;Zimmermann et al., 2005). In the Atlantic climate of the Lower RhineBasin (mean annual precipitation 650–700mm;mean annual tempera-ture 10–11 °C; (NRW State Agency for Nature Environment andConsumer Protection, 2010) soils on loess have mainly developed intoLuvisols (c.2000 km2; Federal Institute for Geosciences and NaturalResources, 2007). On the other hand, the drier andmore continental cli-matic conditions in the Central German dry region (mean annualprecipitation b500 mm; mean annual temperature 8.5–9 °C; seeHendl and Endlicher, 2003) have resulted in the dominant formationof Chernozem soils (c.3540 km2; Federal Institute for Geosciences andNatural Resources, 2007).
In general, soil units presented in modern soil maps are the result ofthe different physical, chemical, biological and anthropogenic soil forma-tion (i.e. pedogenic) processes that have impacted the soil parentmaterial(Jenny, 1941; Brady andWeil, 2001; Scheffer and Schachtschabel, 2010).To understand soil formation and inherent fertility alterations, pedogenicprocesses can be conceptually divided into natural and quasi-natural soilformation processes. We use the term quasi-natural (after Mortensen,1955) for soil-forming processes that have been triggered and influenced,thoughnot significantly altered, by human activities since the onset of theNeolithic. One example for a quasi-natural process is podzolization(Table 2) which can be triggered by anthropogenic land clearing (Saueret al., 2007). Natural soil-forming processes are restricted to theHolocene
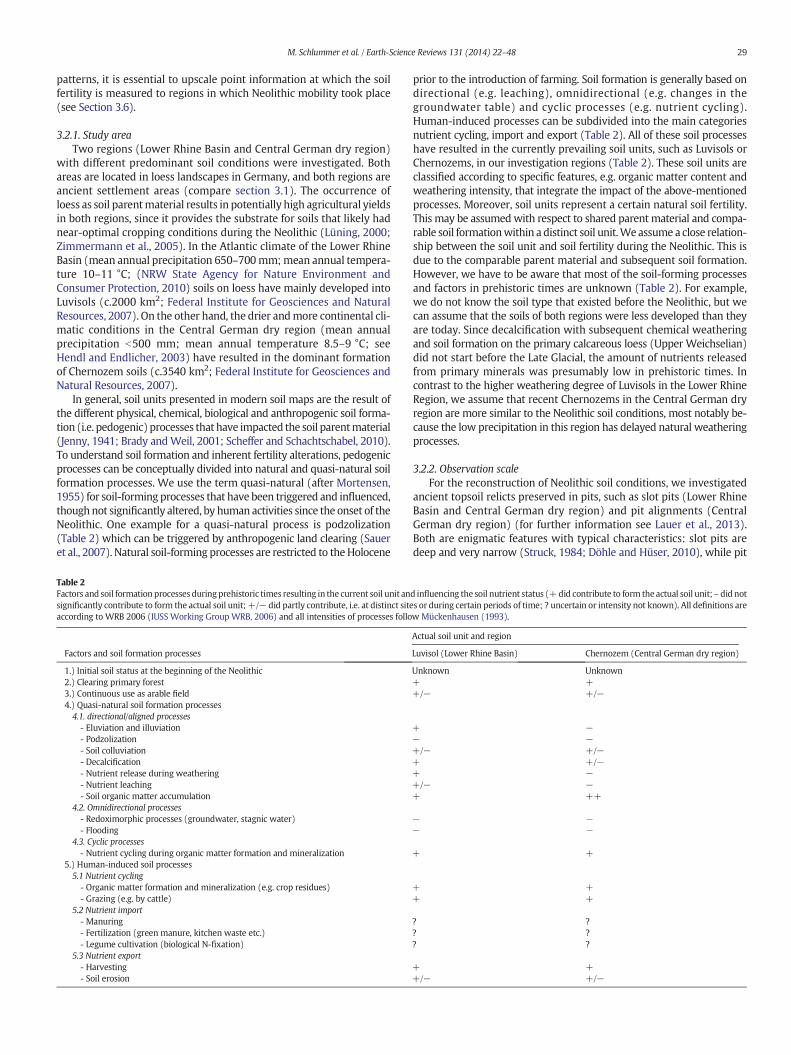
Table 2Factors and soil formation processes duringprehistoric times resulting in the current soil unit ansignificantly contribute to form the actual soil unit; +/− did partly contribute, i.e. at distinct siteaccording to WRB 2006 (IUSS Working Group WRB, 2006) and all intensities of processes follo
Factors and soil formation processes
1.) Initial soil status at the beginning of the Neolithic2.) Clearing primary forest3.) Continuous use as arable field4.) Quasi-natural soil formation processes4.1. directional/aligned processes- Eluviation and illuviation- Podzolization- Soil colluviation- Decalcification- Nutrient release during weathering- Nutrient leaching- Soil organic matter accumulation
4.2. Omnidirectional processes- Redoximorphic processes (groundwater, stagnic water)- Flooding
4.3. Cyclic processes- Nutrient cycling during organic matter formation and mineralization
5.) Human-induced soil processes5.1 Nutrient cycling- Organic matter formation and mineralization (e.g. crop residues)- Grazing (e.g. by cattle)
5.2 Nutrient import- Manuring- Fertilization (green manure, kitchen waste etc.)- Legume cultivation (biological N-fixation)
5.3 Nutrient export- Harvesting- Soil erosion
prior to the introduction of farming. Soil formation is generally based ondirectional (e.g. leaching), omnidirectional (e.g. changes in thegroundwater table) and cyclic processes (e.g. nutrient cycling).Human-induced processes can be subdivided into the main categoriesnutrient cycling, import and export (Table 2). All of these soil processeshave resulted in the currently prevailing soil units, such as Luvisols orChernozems, in our investigation regions (Table 2). These soil units areclassified according to specific features, e.g. organic matter content andweathering intensity, that integrate the impact of the above-mentionedprocesses. Moreover, soil units represent a certain natural soil fertility.This may be assumedwith respect to shared parent material and compa-rable soil formationwithin a distinct soil unit.We assume a close relation-ship between the soil unit and soil fertility during the Neolithic. This isdue to the comparable parent material and subsequent soil formation.However, we have to be aware that most of the soil-forming processesand factors in prehistoric times are unknown (Table 2). For example,we do not know the soil type that existed before the Neolithic, but wecan assume that the soils of both regions were less developed than theyare today. Since decalcification with subsequent chemical weatheringand soil formation on the primary calcareous loess (Upper Weichselian)did not start before the Late Glacial, the amount of nutrients releasedfrom primary minerals was presumably low in prehistoric times. Incontrast to the higher weathering degree of Luvisols in the Lower RhineRegion, we assume that recent Chernozems in the Central German dryregion are more similar to the Neolithic soil conditions, most notably be-cause the low precipitation in this region has delayed natural weatheringprocesses.
3.2.2. Observation scaleFor the reconstruction of Neolithic soil conditions, we investigated
ancient topsoil relicts preserved in pits, such as slot pits (Lower RhineBasin and Central German dry region) and pit alignments (CentralGerman dry region) (for further information see Lauer et al., 2013).Both are enigmatic features with typical characteristics: slot pits aredeep and very narrow (Struck, 1984; Döhle and Hüser, 2010), while pit
d influencing the soil nutrient status (+did contribute to form theactual soil unit; – did nots or during certain periods of time; ? uncertain or intensity not known). All definitions arew Mückenhausen (1993).
Actual soil unit and region
Luvisol (Lower Rhine Basin) Chernozem (Central German dry region)
Unknown Unknown+ ++/− +/−
+ −− −+/− +/−+ +/−+ −+/− −+ ++
− −− −
+ +
+ ++ +
? ?? ?? ?
+ ++/− +/−
30 M. Schlummer et al. / Earth-Science Reviews 131 (2014) 22–48
alignments consist of a series of pits arranged in long lines (Stäuble,2002). Both feature types are mainly filled with humic topsoil material,lacking artefacts such as ceramics, and occurr in the vicinity of settle-ments, though outside the actual residential areas. They can thereforebe seen as archaeological off-site features and as an element connectedwith prehistoric arable land use. Ancient soil properties have likely beenpreserved in these relocated and buried topsoil relicts, especially sincethey were subsequently covered by several decimetres of soil and weretherefore located below the main root zone and the influence ofweathering (Leopold et al., 2011). We analysed three types of samples:buried prehistoric topsoil material at different depths in the pit filling;the adjacent subsoil (B- and/or C-horizons developed from loess); and
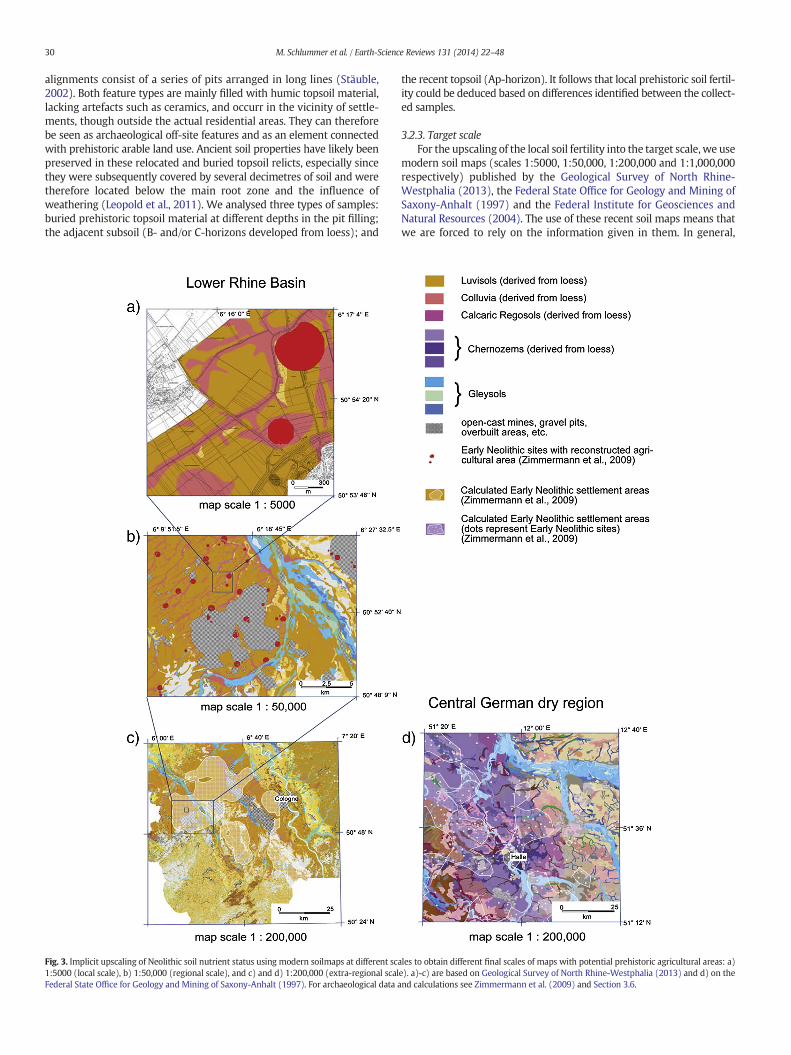
Fig. 3. Implicit upscaling of Neolithic soil nutrient status using modern soilmaps at different sca1:5000 (local scale), b) 1:50,000 (regional scale), and c) and d) 1:200,000 (extra-regional scalFederal State Office for Geology and Mining of Saxony-Anhalt (1997). For archaeological data a
the recent topsoil (Ap-horizon). It follows that local prehistoric soil fertil-ity could be deduced based on differences identified between the collect-ed samples.
3.2.3. Target scaleFor the upscaling of the local soil fertility into the target scale, we use
modern soil maps (scales 1:5000, 1:50,000, 1:200,000 and 1:1,000,000respectively) published by the Geological Survey of North Rhine-Westphalia (2013), the Federal State Office for Geology and Mining ofSaxony-Anhalt (1997) and the Federal Institute for Geosciences andNatural Resources (2004). The use of these recent soil maps means thatwe are forced to rely on the information given in them. In general,
les to obtain different final scales of maps with potential prehistoric agricultural areas: a)e). a)-c) are based on Geological Survey of North Rhine-Westphalia (2013) and d) on thend calculations see Zimmermann et al. (2009) and Section 3.6.
31M. Schlummer et al. / Earth-Science Reviews 131 (2014) 22–48
traditional soilmaps show the predominant soil unit and related subunitsincluding the parent material (Hennings, 2002; McBratney et al., 2003;Scheffer and Schachtschabel, 2010).
3.2.4. Upscaling methodsA detailed understanding of potential links between soil fertility and
Neolithic mobility requires us to link the observational scale (e.g. soilpits) to the target scale (e.g. Neolithic land use areas). Unfortunately,the Neolithic pits which serve as sampling locations cannot be mappedsystematically, as they are only discovered by chance, e.g. at large con-struction sites. For this reason, we use implicit upscaling to transferpoint data information to large-scale information by using the soilunits given in the modern soil maps (Fig. 3) which are defined as thesum of today's soil properties such as parent material, relief, conductiv-ity, groundwater influence and others. The implicit upscaling is dividedinto three steps which use soil maps of different scales to producemapsof the potential arable land and to reveal soil fertility status adequate forNeolithic farming (Fig. 3).
(i) The first scale of the implicit upscaling of point data is theNeolithic field scale, which is assumed to comprise an averagesize of ~2 to 4 ha of arable land per settlement (Ebersbach andSchade, 2005). We use a map of Early Neolithic settlement loca-tions and their surroundings (Zimmermann et al., 2004, 2005)which is based on the soil map (1:5000) and on landscape topog-raphy (Fig. 3a). Following Zimmermann et al. (2004, 2005, 2009)the potential agricultural area is reconstructed by drawing circleswith an areaof 2 to 4ha around the settlements in the loess region,excluding the valleys with their Gleysols. Today, the potentialagricultural land of all Early Neolithic sites in the Lower RhineBasin is characterized by Luvisols from loess. At this scale we cantransfer the soil fertility that was analysed in the soil material ofthe pit fillings to the reconstructed areas which were potentiallyused as arable land.
(ii) At the soilscape scale, we use the modern soil map (scale1:50,000) and relate the fertility of the pit fillings to the corre-sponding soil unit in which the prehistoric settlement areas arelocated (Fig. 3b). Small areas of less than approximately 0.2 hain size with aberrant soil units are omitted due to the map scale.
(iii) At the regional scale we use the soil maps with a scale of1:200,000 (and 1:1,000,000; Section 3.6) which display soilregions with a distinct dominant soil unit (Fig. 3c and d). Thesesoil maps describe the dominant soil unit distribution inGermanywith respect to the parentmaterial. Thus the complexityof the described soil patterns is strongly reduced, but theupscalingon the basis of this small scale soil map assumes the same precon-ditions as in the previous steps. Finally, we transfer the fertility ofthe pit fillings to the corresponding dominant soil unit in whichthe settlement areas are located. At the scale 1:1,000,000 we areable to obtain reasonably valid results only for the potential areaused for agriculture, but not for the specific soil properties, suchas the soil fertility.
3.2.5. Critical remarksIn this context, implicit upscaling is understood as a technique by
which the spatial extent of the study area is increased. It attempts topredict regional information by relying on local investigated data.Implicit upscaling is possible where the present circumstances do notindicate any interruption of long-established past trends. Therefore,the precondition for this upscaling of soil properties, e.g. the soil fertility,is the reliance on several assumptions which are mainly factors of sim-ilarity concerning the soil formation processes and the parent material.
In this view, the modern reference soils, not the ancient soil relicts,provide the information concerning the potential representativenessof the excavated site for the recent Luvisol and Chernozem soilscapes,respectively. Other inherent assumptions are the homogeneity of
human impacts on soil development, land use patterns and comparablelandscape formation processes in the region under consideration.
The entire concept of reconstructing prehistoric soilscapes relies onprocesses that operate at different spatial scales. Much like the scalesused by palaeobotany (local, regional, extra regional, see Section 3.4),we can differentiate between local and extra-local influences such ascropping and micro-relief, regional factors such as meso-relief and thedistribution of parent material, and extra-regional components such asclimate. Local processes and factors are more or less unaccounted foron small-scale soil maps (e.g. 1:50,000 and 1:200,000), but they are ofprimary interest in reconstructing human influence on pedogenesis.
Given the potential for error, the ability tomodel and reconstruct thestructure and functionof recent soils and ecosystems is limited (Wagenet,1998). During the past 7500 years, a variety of physical, chemical and an-thropogenic processes have influenced soil properties such as fertility(Table 2). As we know neither the exact starting conditions of soil forma-tion nor its course over time,wewill need to reconstruct different scenar-ios for the potential soil fertility of Neolithic fields based on differentinitial values and varying influences of soil-forming processes. However,reconstructing pedogenesis over time was not the aim of this project.Instead, we focus on the soil status during the Neolithic, which is a rathershort time interval with respect to soil genesis.
Furthermore, the use of recent soil maps in this upscaling approachmeans that we have to rely on and critically question the informationgiven in these maps as well. Soil properties displayed in soil mapsvary due to differences in sampling density, concepts of soil distributionand aggregation procedures. Moreover, traditional soil science tends tounderestimate anthropogenic influence on pedogenic processes. Recentgeoarchaeological investigations of buried topsoil material in off-sitefeatures shed light on the powerful human influence on Holocene soilgenesis from the beginning of the Neolithic onward (Leopold et al.,2011; Gerlach et al., 2012). However, recent soil maps are an appropri-ate and available tool for the upscaling of point data to the large-scaledistribution. Hence, the implicit upscaling approach presented here ap-parently reduces the complexity of the problem to the soil unit alone. Inturn, this reduction can be regarded as an advantage, because these soilmaps aggregate areaswith homogeneous soil formation,which itself in-tegrates the complex interactions of parent material, climatic influence,relief position and anthropogenic impact. In other soilscapes, with dif-ferent parentmaterial or groundwater levels, the soil-formingprocesseswill vary and lead to aberrant soil units. However, at the soilscape scale,areas will be classified as potential arable land which were likely notcropped during the Neolithic, for example due to high groundwaterlevels in the immediate vicinity of small watercourses that are notdisplayed at the 1:50,000 scale. Thus, at the field scale (1:5000), the po-tential arable landwill cover a smaller percentage of the landscape thanit does at smaller geographic scales. It has to be noted that our approachcannot follow the recently developed soil mapping and upscaling proce-dures (i.e. digital soil mapping and modelling; see Grunwald, 2009), be-cause our point information is restricted to scarce and serendipitousarchaeological off-site features (e.g. slot pits or pit alignments). Addition-ally, some unanswered questions remain concerning scale-dependentprocesses that may influence the soil fertility, e.g. variations in the prop-erties of the parent material and differences in precipitation or ground-water levels in the target regions. Validation of this approach dependson increasing the data set by using topsoil material from off-site featuresor fromburied soil horizons. The latter are rare in contrast to the relocatedtopsoil relicts in pits. Off-site pits in particular occurmore or less regularlyat most archaeological excavations. They are a unique – but mostlyneglected – archive for reconstructing the prehistoric properties ofarable land.
3.2.6. Concluding remarksComprehension of prehistoric interaction between soil fertility and
agricultural land use requires a method for upscaling point data fromthe sample point to regionally distributed soils. One possible upscaling
32 M. Schlummer et al. / Earth-Science Reviews 131 (2014) 22–48
approach for large-scale soil nutrient distribution is summarized inFig. 3. For the sample regions, the soil unit as displayed in soil mapscan be regarded as a proxy for soil fertility. The resulting “palaeo-soilfertility maps” are valid for a region with the same soil unit as indicatedon modern soil maps. However, these maps of potential arable landwith a focus on soil fertility are a first approach to providing a tool fora better knowledge of past human–soil interactions in terms of humanmobility.
3.3. Local soil erosion, sediment storage and upscaling
The change of subsistence strategies from hunting and gatheringto farming and sedentary communities marks the starting point ofhuman-induced soil erosion in Central Europe around 7500 years ago(Lang et al., 2003; Hoffmann et al., 2009). During the Holocene, increas-ing population densities, deforestation and changing land use practicescaused an intensification of soil erosion rates. Accordingly, soil erosionand corresponding sediment storage became major components ofHolocene sediment fluxes in river catchments, especially after theBronze Age (Rommens et al., 2005; Houben, 2008; Notebaert et al.,2009; Fuchs et al., 2011). Thus, soil erosion and deposition have to beconsidered important elements of socio-environmental interactions inCentral Europe during the period of agriculture. However, the evidenceis not unambiguous as to whether shifts in settlements and populationsoccurred in response to the high vulnerability of farming societies withrespect to the degradation of soils.
To better understand sediment fluxes as a response to land use andclimate changes, sediment budgets are used toquantify temporal changesin sediment storage and flux at various spatial scales (e.g. Macaire et al.,2002; Notebaert et al., 2009; Ward et al., 2009; Stolz, 2011). The quanti-fication of sediment budget components mostly requires an upscalingof small scale data, for example on soil truncation or sediment deposition,in order to estimate the area affected by soil erosion or burial and togeneralize the process intensity to larger scales. While it is possible to es-timate sediment storage for small catchments within a low error-margin,the precision and accuracy of estimates decrease with spatial scale due tothe decreasing data density in large areas (Brown et al., 2009). Under-standing the interaction among human migration, agricultural land useand its impact on the hillslope system requires data on soil erosion andcolluvial storage that covers spatial scales of human migration. Thus,it is necessary to develop upscaling approaches that produce reliableinformation on soil erosion and sediment storage in areas covering104–105 km2 and on temporal scales of several thousand years.
Information on long-term human impacts on hillslope systems inCentral Europe is generally obtained from the local stratigraphiesand chronologies of colluvial deposits or local soil truncationdepth (e. g. Niller, 1998; Lang and Hönscheidt, 1999; Kadereitet al., 2010). Numerous case studies have focused on soil erosionand colluvial deposits on small spatial scales, e.g. on erosion-plots, hillslopes and in small catchments (generally b 102 km2).However, only a few studies have produced estimates of soil ero-sion rates for regions larger than 103 km2 (Auerswald et al., 2009;Cerdan et al., 2010). Thus, large-scale quantifications of Holocenesoil erosion and colluvial sediment storage remain limited.
In this section,we discuss upscaling approaches with regard to long-term soil erosion and colluvial sediment storage and aim to identifyapproaches that are appropriate to quantifying the long-term andlarge-scale human impact on hillslope systems in the Rhinelandand the Rhine catchment. For this time scale, we hypothesize that colluvi-al sediment storages are a significant sedimentary sink in socio–environmental systems that has been insufficiently considered on largescales (Hoffmann et al., 2013).
With respect to the terminology defined in Section 2, the processscale of soil erosion and colluvial sediment storage is limited by themaximum slope length. At larger scales erosion, transport and deposi-tion of sediment take place in the fluvial system, which will not be
considered here. Typical slope lengths in low land Central Europe arein the order of 10–1000 m. Thus, the challenge in calculating colluvialstorage for large drainage basins is not to present the emergence ofnew phenomena and processes, such as fluvial erosion, transport anddeposition. Instead the challenge is to consider the small-scale variabilityof colluvial sediment storage and its impact on the uncertainty regardingsediment budgets in large drainage basins. While it is generally assumedthat the decreasing average slope angle results in lower average erosionrates and increased storage potential (de Vente et al., 2007), our knowl-edge of the scaling behaviour of sediment storage remains limited. More-over, the question of whether hillslope geomorphometry significantlychanges with increasing catchment size and causes a relatively higherstorage potential in larger catchments still remains unanswered.
3.3.1. Local- and large-scale dataResearch on long-term soil erosion in Central Europe has focused on
different spatial scales (Fig. 1). On the plot and outcrop scale, sedimentthickness and detailed colluvial chronologies are available (Lang andWagner, 1996; Lang et al., 2003; Scheibe, 2003; Reiß et al., 2009;Fuchs et al., 2010; Kadereit et al., 2010). For hillslope and catchmentscales, estimates of sediment storage masses have been provided forexample by Preston (2001), Rommens et al. (2006), Houben (2008),Notebaert et al. (2009), and Fuchs et al. (2011). These studies already in-cludedifferent upscaling procedures such as interpolation techniques orprocess-based modelling approaches, and quantify colluvial sedimentstorage volumes for basins ranging from 10−2 km2 up to 103 km2. Esti-mates for basins larger than 103 km2 are not available so far, but areneeded to understand the interaction between farming societies andhillslope systems on large spatial and long temporal scales.
3.3.2. Applied upscaling methodsIn general, four categories of upscaling approaches have been ap-
plied in sediment budget studies to quantify soil erosion and/or colluvialsediments on the catchment scale (Table 3): i) implicit methods; ii) in-terpolation methods; iii) averaging and extrapolation based on slopegradient; and (iv) modelling approaches.
3.3.2.1. Implicit upscaling. Traditionally, case studies on colluvial sedimentstorage derive information on the spatial distribution and thicknessof colluvial soils using soil maps or geological maps (van Hooff andJungerius, 1984; Seidel and Mäckel, 2007; Förster and Wunderlich,2009). These maps are typically generated using local augerings and out-crops, which are upscaled to the scale of the map. Therefore, upscalingprocedures for colluvial sediment storage that apply larger-scale mapsimplicitly accept the upscaling procedures that underlie the generationof these maps and often disregard the uncertainties associated with thatapproach. Implicit upscaling is also used in other disciplines in environ-mental research (e. g. see Section 3.2) and is more fully discussed inSection 4. Implicit upscaling approaches that rely on low resolution soilmaps (e.g. map scale 1:200,000) result in minimal storage estimatesdue to the low accuracy of large-scale soil maps with regard to colluvialdeposits. The limited accuracy mainly arises due to the genetical focusof soil maps and the limited representation of the effects of local scalehillslope sediment transport on soil formation.
3.3.2.2. Interpolation methods. Interpolation algorithms in sedimentbudget studies are generally used to estimate soil and/or sediment thick-nesses on a regular grid, derived from local drillings that are unevenlyspaced. Applied interpolation methods generally rely on GIS-integratedinterpolation methods such as the “Inverse Distance Weighting (IDW)”and Kriging and require a rather high spatial data density in order to de-rive reliable spatial patterns of the desired parameter. While these inter-polation techniques may be successfully applied in small-scale studies(Rommens et al., 2005; Houben, 2008), the data density in large-scalestudies is generally not sufficient.
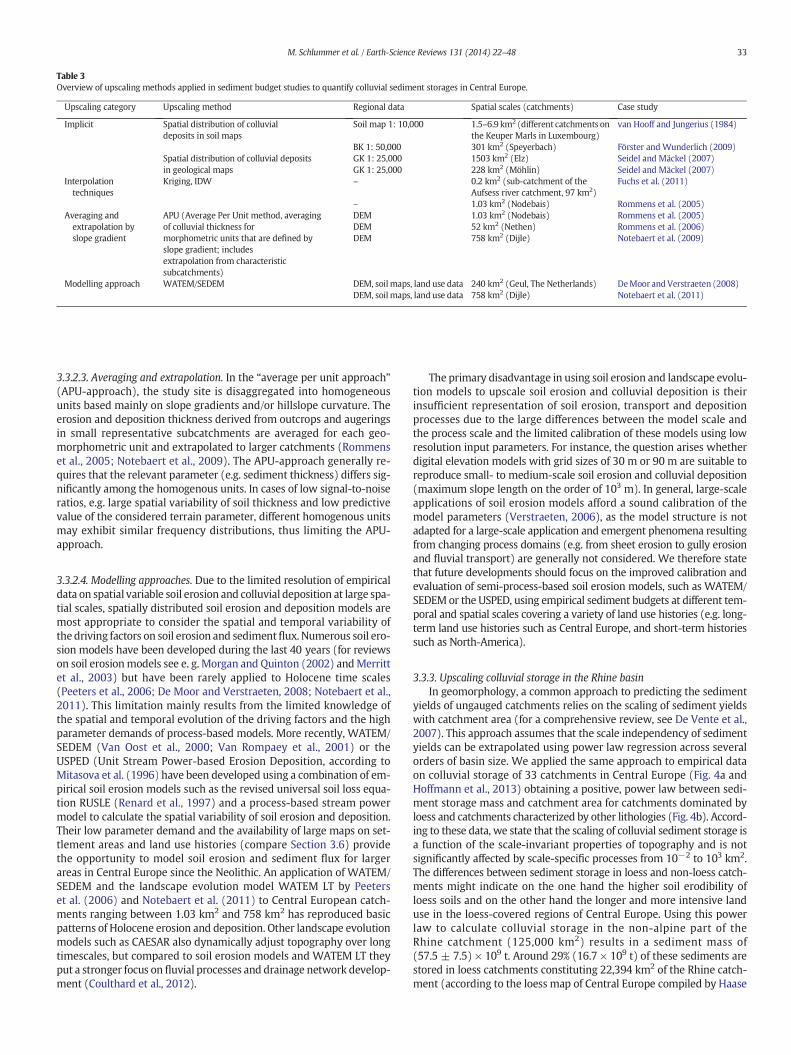
Table 3Overview of upscaling methods applied in sediment budget studies to quantify colluvial sediment storages in Central Europe.
Upscaling category Upscaling method Regional data Spatial scales (catchments) Case study
Implicit Spatial distribution of colluvialdeposits in soil maps
Soil map 1: 10,000 1.5–6.9 km2 (different catchments onthe Keuper Marls in Luxembourg)
van Hooff and Jungerius (1984)
BK 1: 50,000 301 km2 (Speyerbach) Förster and Wunderlich (2009)Spatial distribution of colluvial depositsin geological maps
GK 1: 25,000 1503 km2 (Elz) Seidel and Mäckel (2007)GK 1: 25,000 228 km2 (Möhlin) Seidel and Mäckel (2007)
Interpolationtechniques
Kriging, IDW – 0.2 km2 (sub-catchment of theAufsess river catchment, 97 km2)
Fuchs et al. (2011)
– 1.03 km2 (Nodebais) Rommens et al. (2005)Averaging andextrapolation byslope gradient
APU (Average Per Unit method, averagingof colluvial thickness formorphometric units that are defined byslope gradient; includesextrapolation from characteristicsubcatchments)
DEM 1.03 km2 (Nodebais) Rommens et al. (2005)DEM 52 km2 (Nethen) Rommens et al. (2006)DEM 758 km2 (Dijle) Notebaert et al. (2009)
Modelling approach WATEM/SEDEM DEM, soil maps, land use data 240 km2 (Geul, The Netherlands) DeMoor and Verstraeten (2008)DEM, soil maps, land use data 758 km2 (Dijle) Notebaert et al. (2011)
33M. Schlummer et al. / Earth-Science Reviews 131 (2014) 22–48
3.3.2.3. Averaging and extrapolation. In the “average per unit approach”(APU-approach), the study site is disaggregated into homogeneousunits based mainly on slope gradients and/or hillslope curvature. Theerosion and deposition thickness derived from outcrops and augeringsin small representative subcatchments are averaged for each geo-morphometric unit and extrapolated to larger catchments (Rommenset al., 2005; Notebaert et al., 2009). The APU-approach generally re-quires that the relevant parameter (e.g. sediment thickness) differs sig-nificantly among the homogenous units. In cases of low signal-to-noiseratios, e.g. large spatial variability of soil thickness and low predictivevalue of the considered terrain parameter, different homogenous unitsmay exhibit similar frequency distributions, thus limiting the APU-approach.
3.3.2.4. Modelling approaches. Due to the limited resolution of empiricaldata on spatial variable soil erosion and colluvial deposition at large spa-tial scales, spatially distributed soil erosion and deposition models aremost appropriate to consider the spatial and temporal variability ofthe driving factors on soil erosion and sedimentflux. Numerous soil ero-sion models have been developed during the last 40 years (for reviewson soil erosionmodels see e. g. Morgan and Quinton (2002) andMerrittet al., 2003) but have been rarely applied to Holocene time scales(Peeters et al., 2006; De Moor and Verstraeten, 2008; Notebaert et al.,2011). This limitation mainly results from the limited knowledge ofthe spatial and temporal evolution of the driving factors and the highparameter demands of process-based models. More recently, WATEM/SEDEM (Van Oost et al., 2000; Van Rompaey et al., 2001) or theUSPED (Unit Stream Power-based Erosion Deposition, according toMitasova et al. (1996) have been developed using a combination of em-pirical soil erosion models such as the revised universal soil loss equa-tion RUSLE (Renard et al., 1997) and a process-based stream powermodel to calculate the spatial variability of soil erosion and deposition.Their low parameter demand and the availability of large maps on set-tlement areas and land use histories (compare Section 3.6) providethe opportunity to model soil erosion and sediment flux for largerareas in Central Europe since the Neolithic. An application of WATEM/SEDEM and the landscape evolution model WATEM LT by Peeterset al. (2006) and Notebaert et al. (2011) to Central European catch-ments ranging between 1.03 km2 and 758 km2 has reproduced basicpatterns of Holocene erosion and deposition. Other landscape evolutionmodels such as CAESAR also dynamically adjust topography over longtimescales, but compared to soil erosion models and WATEM LT theyput a stronger focus on fluvial processes and drainage network develop-ment (Coulthard et al., 2012).
The primary disadvantage in using soil erosion and landscape evolu-tion models to upscale soil erosion and colluvial deposition is theirinsufficient representation of soil erosion, transport and depositionprocesses due to the large differences between the model scale andthe process scale and the limited calibration of these models using lowresolution input parameters. For instance, the question arises whetherdigital elevation models with grid sizes of 30 m or 90 m are suitable toreproduce small- to medium-scale soil erosion and colluvial deposition(maximum slope length on the order of 103 m). In general, large-scaleapplications of soil erosion models afford a sound calibration of themodel parameters (Verstraeten, 2006), as the model structure is notadapted for a large-scale application and emergent phenomena resultingfrom changing process domains (e.g. from sheet erosion to gully erosionand fluvial transport) are generally not considered. We therefore statethat future developments should focus on the improved calibration andevaluation of semi-process-based soil erosion models, such as WATEM/SEDEMor the USPED, using empirical sediment budgets at different tem-poral and spatial scales covering a variety of land use histories (e.g. long-term land use histories such as Central Europe, and short-term historiessuch as North-America).
3.3.3. Upscaling colluvial storage in the Rhine basinIn geomorphology, a common approach to predicting the sediment
yields of ungauged catchments relies on the scaling of sediment yieldswith catchment area (for a comprehensive review, see De Vente et al.,2007). This approach assumes that the scale independency of sedimentyields can be extrapolated using power law regression across severalorders of basin size. We applied the same approach to empirical dataon colluvial storage of 33 catchments in Central Europe (Fig. 4a andHoffmann et al., 2013) obtaining a positive, power law between sedi-ment storage mass and catchment area for catchments dominated byloess and catchments characterized by other lithologies (Fig. 4b). Accord-ing to these data, we state that the scaling of colluvial sediment storage isa function of the scale-invariant properties of topography and is notsignificantly affected by scale-specific processes from 10−2 to 103 km2.The differences between sediment storage in loess and non-loess catch-ments might indicate on the one hand the higher soil erodibility ofloess soils and on the other hand the longer and more intensive landuse in the loess-covered regions of Central Europe. Using this powerlaw to calculate colluvial storage in the non-alpine part of theRhine catchment (125,000 km2) results in a sediment mass of(57.5 ± 7.5) × 109 t. Around 29% (16.7 × 10⁹ t) of these sediments arestored in loess catchments constituting 22,394 km2 of the Rhine catch-ment (according to the loess map of Central Europe compiled by Haase
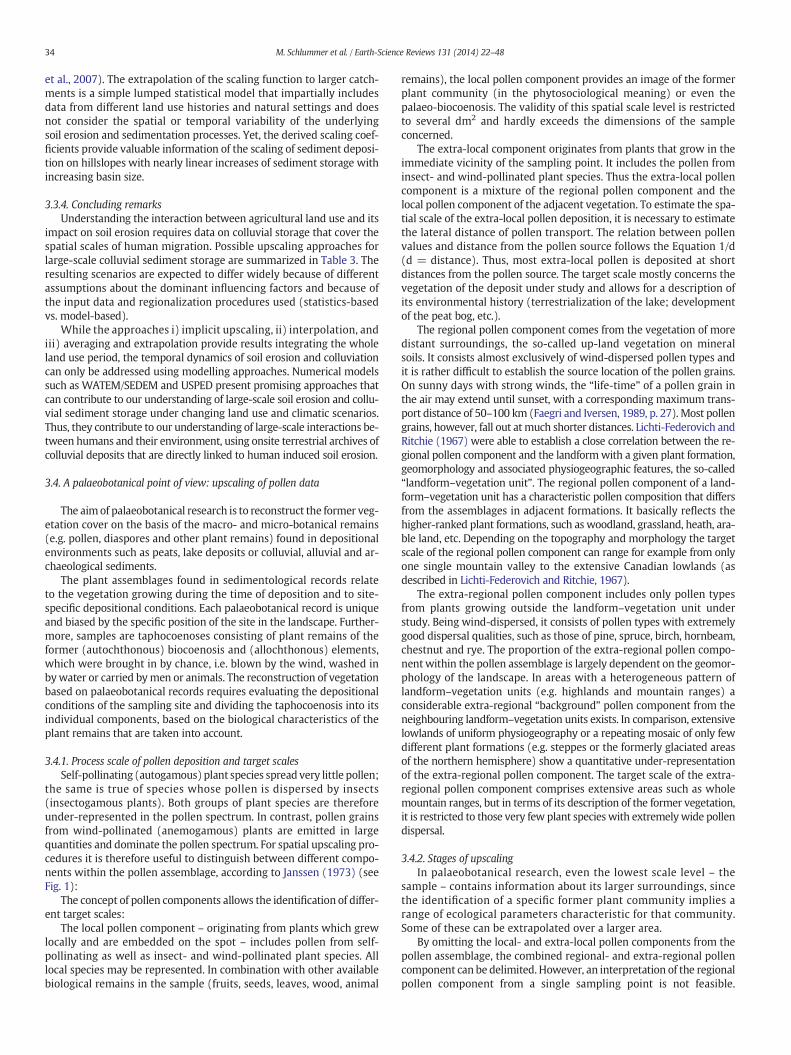
34 M. Schlummer et al. / Earth-Science Reviews 131 (2014) 22–48
et al., 2007). The extrapolation of the scaling function to larger catch-ments is a simple lumped statistical model that impartially includesdata from different land use histories and natural settings and doesnot consider the spatial or temporal variability of the underlyingsoil erosion and sedimentation processes. Yet, the derived scaling coef-ficients provide valuable information of the scaling of sediment deposi-tion on hillslopes with nearly linear increases of sediment storage withincreasing basin size.
3.3.4. Concluding remarksUnderstanding the interaction between agricultural land use and its
impact on soil erosion requires data on colluvial storage that cover thespatial scales of human migration. Possible upscaling approaches forlarge-scale colluvial sediment storage are summarized in Table 3. Theresulting scenarios are expected to differ widely because of differentassumptions about the dominant influencing factors and because ofthe input data and regionalization procedures used (statistics-basedvs. model-based).
While the approaches i) implicit upscaling, ii) interpolation, andiii) averaging and extrapolation provide results integrating the wholeland use period, the temporal dynamics of soil erosion and colluviationcan only be addressed using modelling approaches. Numerical modelssuch as WATEM/SEDEM and USPED present promising approaches thatcan contribute to our understanding of large-scale soil erosion and collu-vial sediment storage under changing land use and climatic scenarios.Thus, they contribute to our understanding of large-scale interactions be-tween humans and their environment, using onsite terrestrial archives ofcolluvial deposits that are directly linked to human induced soil erosion.
3.4. A palaeobotanical point of view: upscaling of pollen data
The aimof palaeobotanical research is to reconstruct the former veg-etation cover on the basis of the macro- and micro-botanical remains(e.g. pollen, diaspores and other plant remains) found in depositionalenvironments such as peats, lake deposits or colluvial, alluvial and ar-chaeological sediments.
The plant assemblages found in sedimentological records relateto the vegetation growing during the time of deposition and to site-specific depositional conditions. Each palaeobotanical record is uniqueand biased by the specific position of the site in the landscape. Further-more, samples are taphocoenoses consisting of plant remains of theformer (autochthonous) biocoenosis and (allochthonous) elements,which were brought in by chance, i.e. blown by the wind, washed inbywater or carried bymen or animals. The reconstruction of vegetationbased on palaeobotanical records requires evaluating the depositionalconditions of the sampling site and dividing the taphocoenosis into itsindividual components, based on the biological characteristics of theplant remains that are taken into account.
3.4.1. Process scale of pollen deposition and target scalesSelf-pollinating (autogamous) plant species spread very little pollen;
the same is true of species whose pollen is dispersed by insects(insectogamous plants). Both groups of plant species are thereforeunder-represented in the pollen spectrum. In contrast, pollen grainsfrom wind-pollinated (anemogamous) plants are emitted in largequantities and dominate the pollen spectrum. For spatial upscaling pro-cedures it is therefore useful to distinguish between different compo-nents within the pollen assemblage, according to Janssen (1973) (seeFig. 1):
The concept of pollen components allows the identification of differ-ent target scales:
The local pollen component – originating from plants which grewlocally and are embedded on the spot – includes pollen from self-pollinating as well as insect- and wind-pollinated plant species. Alllocal species may be represented. In combination with other availablebiological remains in the sample (fruits, seeds, leaves, wood, animal
remains), the local pollen component provides an image of the formerplant community (in the phytosociological meaning) or even thepalaeo-biocoenosis. The validity of this spatial scale level is restrictedto several dm2 and hardly exceeds the dimensions of the sampleconcerned.
The extra-local component originates from plants that grow in theimmediate vicinity of the sampling point. It includes the pollen frominsect- and wind-pollinated plant species. Thus the extra-local pollencomponent is a mixture of the regional pollen component and thelocal pollen component of the adjacent vegetation. To estimate the spa-tial scale of the extra-local pollen deposition, it is necessary to estimatethe lateral distance of pollen transport. The relation between pollenvalues and distance from the pollen source follows the Equation 1/d(d = distance). Thus, most extra-local pollen is deposited at shortdistances from the pollen source. The target scale mostly concerns thevegetation of the deposit under study and allows for a description ofits environmental history (terrestrialization of the lake; developmentof the peat bog, etc.).
The regional pollen component comes from the vegetation of moredistant surroundings, the so-called up-land vegetation on mineralsoils. It consists almost exclusively of wind-dispersed pollen types andit is rather difficult to establish the source location of the pollen grains.On sunny days with strong winds, the “life-time” of a pollen grain inthe air may extend until sunset, with a corresponding maximum trans-port distance of 50–100 km (Faegri and Iversen, 1989, p. 27). Most pollengrains, however, fall out atmuch shorter distances. Lichti-Federovich andRitchie (1967) were able to establish a close correlation between the re-gional pollen component and the landformwith a given plant formation,geomorphology and associated physiogeographic features, the so-called“landform–vegetation unit”. The regional pollen component of a land-form–vegetation unit has a characteristic pollen composition that differsfrom the assemblages in adjacent formations. It basically reflects thehigher-ranked plant formations, such as woodland, grassland, heath, ara-ble land, etc. Depending on the topography and morphology the targetscale of the regional pollen component can range for example from onlyone single mountain valley to the extensive Canadian lowlands (asdescribed in Lichti-Federovich and Ritchie, 1967).
The extra-regional pollen component includes only pollen typesfrom plants growing outside the landform–vegetation unit understudy. Being wind-dispersed, it consists of pollen types with extremelygood dispersal qualities, such as those of pine, spruce, birch, hornbeam,chestnut and rye. The proportion of the extra-regional pollen compo-nent within the pollen assemblage is largely dependent on the geomor-phology of the landscape. In areas with a heterogeneous pattern oflandform–vegetation units (e.g. highlands and mountain ranges) aconsiderable extra-regional “background” pollen component from theneighbouring landform–vegetation units exists. In comparison, extensivelowlands of uniform physiogeography or a repeating mosaic of only fewdifferent plant formations (e.g. steppes or the formerly glaciated areasof the northern hemisphere) show a quantitative under-representationof the extra-regional pollen component. The target scale of the extra-regional pollen component comprises extensive areas such as wholemountain ranges, but in terms of its description of the former vegetation,it is restricted to those very few plant species with extremelywide pollendispersal.
3.4.2. Stages of upscalingIn palaeobotanical research, even the lowest scale level – the
sample – contains information about its larger surroundings, sincethe identification of a specific former plant community implies arange of ecological parameters characteristic for that community.Some of these can be extrapolated over a larger area.
By omitting the local- and extra-local pollen components from thepollen assemblage, the combined regional- and extra-regional pollencomponent can be delimited. However, an interpretation of the regionalpollen component from a single sampling point is not feasible.
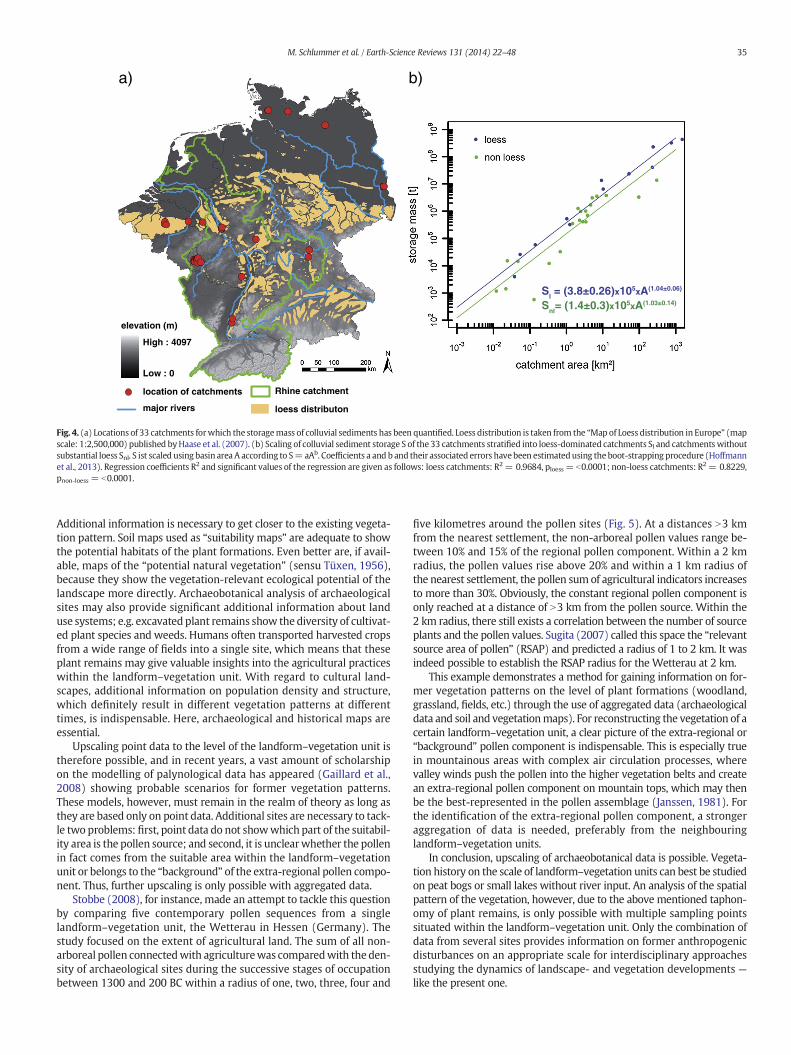
Sl = (3.8±0.26)x105xA(1.04±0.06)
Snl= (1.4±0.3)x105xA(1.03±0.14)
location of catchments
major rivers
Rhine catchment
loess distributon
a) b)
elevation (m)
High : 4097
Low : 0
Fig. 4. (a) Locations of 33 catchments forwhich the storagemass of colluvial sediments has been quantified. Loess distribution is taken from the “Mapof Loess distribution in Europe” (mapscale: 1:2,500,000) published byHaase et al. (2007). (b) Scaling of colluvial sediment storage S of the 33 catchments stratified into loess-dominated catchments Sl and catchmentswithoutsubstantial loess Snl. S ist scaled using basin area A according to S=aAb. Coefficients a and b and their associated errors havebeen estimatedusing the boot-strapping procedure (Hoffmannet al., 2013). Regression coefficients R2 and significant values of the regression are given as follows: loess catchments: R2= 0.9684, ploess = b0.0001; non-loess catchments: R2= 0.8229,pnon-loess = b0.0001.
35M. Schlummer et al. / Earth-Science Reviews 131 (2014) 22–48
Additional information is necessary to get closer to the existing vegeta-tion pattern. Soil maps used as “suitability maps” are adequate to showthe potential habitats of the plant formations. Even better are, if avail-able, maps of the “potential natural vegetation” (sensu Tüxen, 1956),because they show the vegetation-relevant ecological potential of thelandscape more directly. Archaeobotanical analysis of archaeologicalsites may also provide significant additional information about landuse systems; e.g. excavated plant remains show the diversity of cultivat-ed plant species and weeds. Humans often transported harvested cropsfrom a wide range of fields into a single site, which means that theseplant remains may give valuable insights into the agricultural practiceswithin the landform–vegetation unit. With regard to cultural land-scapes, additional information on population density and structure,which definitely result in different vegetation patterns at differenttimes, is indispensable. Here, archaeological and historical maps areessential.
Upscaling point data to the level of the landform–vegetation unit istherefore possible, and in recent years, a vast amount of scholarshipon the modelling of palynological data has appeared (Gaillard et al.,2008) showing probable scenarios for former vegetation patterns.These models, however, must remain in the realm of theory as long asthey are based only on point data. Additional sites are necessary to tack-le two problems: first, point data do not showwhich part of the suitabil-ity area is the pollen source; and second, it is unclearwhether the pollenin fact comes from the suitable area within the landform–vegetationunit or belongs to the “background” of the extra-regional pollen compo-nent. Thus, further upscaling is only possible with aggregated data.
Stobbe (2008), for instance, made an attempt to tackle this questionby comparing five contemporary pollen sequences from a singlelandform–vegetation unit, the Wetterau in Hessen (Germany). Thestudy focused on the extent of agricultural land. The sum of all non-arboreal pollen connectedwith agriculturewas comparedwith the den-sity of archaeological sites during the successive stages of occupationbetween 1300 and 200 BC within a radius of one, two, three, four and
five kilometres around the pollen sites (Fig. 5). At a distances N3 kmfrom the nearest settlement, the non-arboreal pollen values range be-tween 10% and 15% of the regional pollen component. Within a 2 kmradius, the pollen values rise above 20% and within a 1 km radius ofthe nearest settlement, the pollen sum of agricultural indicators increasesto more than 30%. Obviously, the constant regional pollen component isonly reached at a distance of N3 km from the pollen source. Within the2 km radius, there still exists a correlation between the number of sourceplants and the pollen values. Sugita (2007) called this space the “relevantsource area of pollen” (RSAP) and predicted a radius of 1 to 2 km. It wasindeed possible to establish the RSAP radius for the Wetterau at 2 km.
This example demonstrates a method for gaining information on for-mer vegetation patterns on the level of plant formations (woodland,grassland, fields, etc.) through the use of aggregated data (archaeologicaldata and soil and vegetationmaps). For reconstructing the vegetation of acertain landform–vegetation unit, a clear picture of the extra-regional or“background” pollen component is indispensable. This is especially truein mountainous areas with complex air circulation processes, wherevalley winds push the pollen into the higher vegetation belts and createan extra-regional pollen component on mountain tops, which may thenbe the best-represented in the pollen assemblage (Janssen, 1981). Forthe identification of the extra-regional pollen component, a strongeraggregation of data is needed, preferably from the neighbouringlandform–vegetation units.
In conclusion, upscaling of archaeobotanical data is possible. Vegeta-tion history on the scale of landform–vegetation units can best be studiedon peat bogs or small lakes without river input. An analysis of the spatialpattern of the vegetation, however, due to the above mentioned taphon-omy of plant remains, is only possible with multiple sampling pointssituated within the landform–vegetation unit. Only the combination ofdata from several sites provides information on former anthropogenicdisturbances on an appropriate scale for interdisciplinary approachesstudying the dynamics of landscape- and vegetation developments —like the present one.
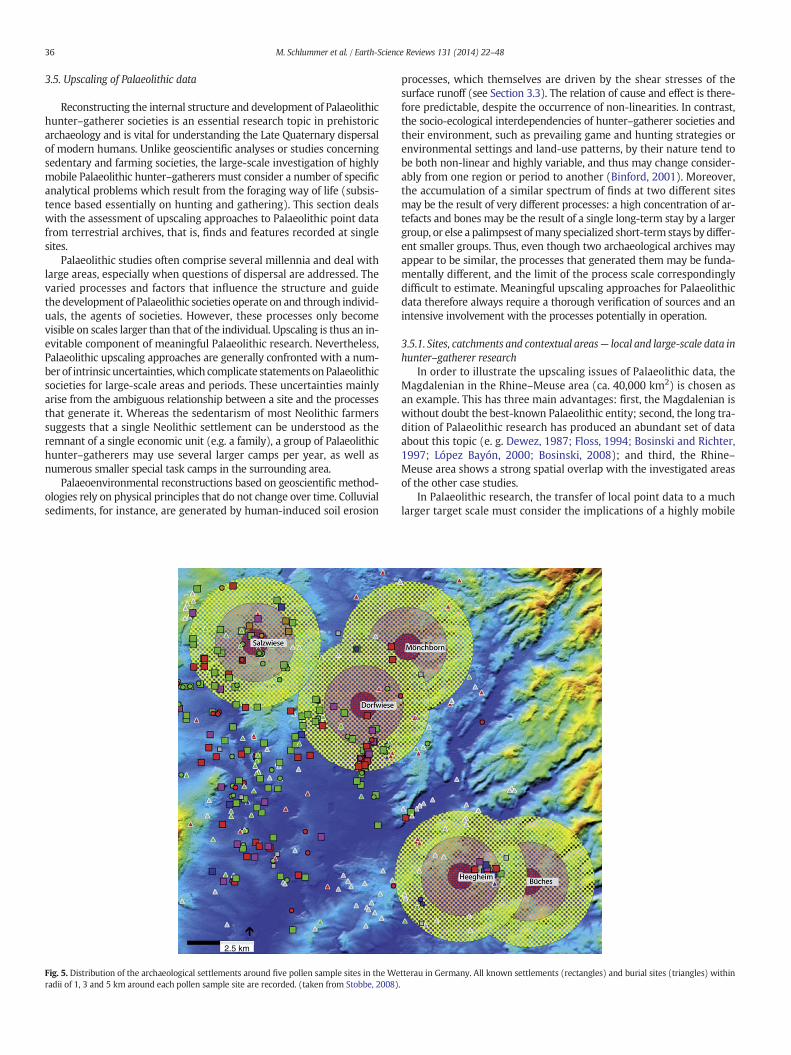
36 M. Schlummer et al. / Earth-Science Reviews 131 (2014) 22–48
3.5. Upscaling of Palaeolithic data
Reconstructing the internal structure and development of Palaeolithichunter–gatherer societies is an essential research topic in prehistoricarchaeology and is vital for understanding the Late Quaternary dispersalof modern humans. Unlike geoscientific analyses or studies concerningsedentary and farming societies, the large-scale investigation of highlymobile Palaeolithic hunter–gatherers must consider a number of specificanalytical problems which result from the foraging way of life (subsis-tence based essentially on hunting and gathering). This section dealswith the assessment of upscaling approaches to Palaeolithic point datafrom terrestrial archives, that is, finds and features recorded at singlesites.
Palaeolithic studies often comprise several millennia and deal withlarge areas, especially when questions of dispersal are addressed. Thevaried processes and factors that influence the structure and guidethe development of Palaeolithic societies operate on and through individ-uals, the agents of societies. However, these processes only becomevisible on scales larger than that of the individual. Upscaling is thus an in-evitable component of meaningful Palaeolithic research. Nevertheless,Palaeolithic upscaling approaches are generally confronted with a num-ber of intrinsic uncertainties,which complicate statements onPalaeolithicsocieties for large-scale areas and periods. These uncertainties mainlyarise from the ambiguous relationship between a site and the processesthat generate it. Whereas the sedentarism of most Neolithic farmerssuggests that a single Neolithic settlement can be understood as theremnant of a single economic unit (e.g. a family), a group of Palaeolithichunter–gatherers may use several larger camps per year, as well asnumerous smaller special task camps in the surrounding area.
Palaeoenvironmental reconstructions based on geoscientific method-ologies rely on physical principles that do not change over time. Colluvialsediments, for instance, are generated by human-induced soil erosion
2.5 km
Fig. 5. Distribution of the archaeological settlements around five pollen sample sites in the Weradii of 1, 3 and 5 km around each pollen sample site are recorded. (taken from Stobbe, 2008)
processes, which themselves are driven by the shear stresses of thesurface runoff (see Section 3.3). The relation of cause and effect is there-fore predictable, despite the occurrence of non-linearities. In contrast,the socio-ecological interdependencies of hunter–gatherer societies andtheir environment, such as prevailing game and hunting strategies orenvironmental settings and land-use patterns, by their nature tend tobe both non-linear and highly variable, and thus may change consider-ably from one region or period to another (Binford, 2001). Moreover,the accumulation of a similar spectrum of finds at two different sitesmay be the result of very different processes: a high concentration of ar-tefacts and bones may be the result of a single long-term stay by a largergroup, or else a palimpsest ofmany specialized short-term stays by differ-ent smaller groups. Thus, even though two archaeological archives mayappear to be similar, the processes that generated them may be funda-mentally different, and the limit of the process scale correspondinglydifficult to estimate. Meaningful upscaling approaches for Palaeolithicdata therefore always require a thorough verification of sources and anintensive involvement with the processes potentially in operation.
3.5.1. Sites, catchments and contextual areas— local and large-scale data inhunter–gatherer research
In order to illustrate the upscaling issues of Palaeolithic data, theMagdalenian in the Rhine–Meuse area (ca. 40,000 km2) is chosen asan example. This has three main advantages: first, the Magdalenian iswithout doubt the best-known Palaeolithic entity; second, the long tra-dition of Palaeolithic research has produced an abundant set of dataabout this topic (e. g. Dewez, 1987; Floss, 1994; Bosinski and Richter,1997; López Bayón, 2000; Bosinski, 2008); and third, the Rhine–Meuse area shows a strong spatial overlap with the investigated areasof the other case studies.
In Palaeolithic research, the transfer of local point data to a muchlarger target scale must consider the implications of a highly mobile
tterau in Germany. All known settlements (rectangles) and burial sites (triangles) within.
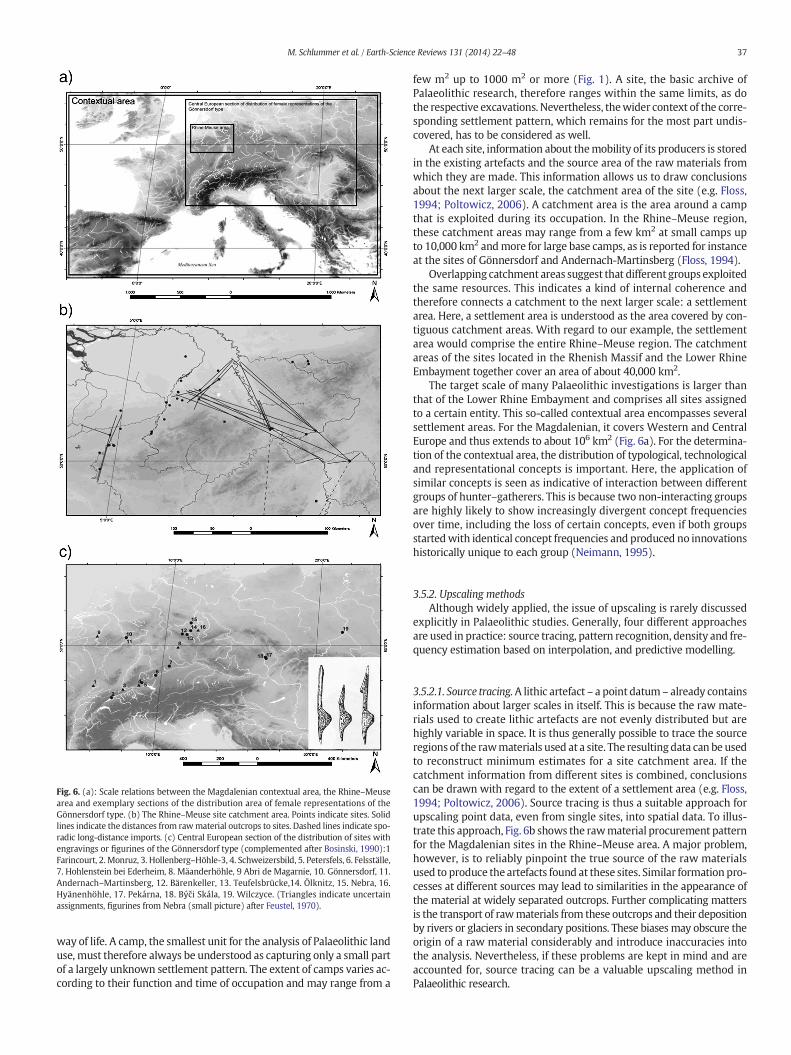
Fig. 6. (a): Scale relations between the Magdalenian contextual area, the Rhine–Meusearea and exemplary sections of the distribution area of female representations of theGönnersdorf type. (b) The Rhine–Meuse site catchment area. Points indicate sites. Solidlines indicate the distances from rawmaterial outcrops to sites. Dashed lines indicate spo-radic long-distance imports. (c) Central European section of the distribution of sites withengravings or figurines of the Gönnersdorf type (complemented after Bosinski, 1990):1Farincourt, 2. Monruz, 3. Hollenberg–Höhle-3, 4. Schweizersbild, 5. Petersfels, 6. Felsställe,7. Hohlenstein bei Ederheim, 8. Mäanderhöhle, 9 Abri de Magarnie, 10. Gönnersdorf, 11.Andernach–Martinsberg, 12. Bärenkeller, 13. Teufelsbrücke,14. Ölknitz, 15. Nebra, 16.Hyänenhöhle, 17. Pekárna, 18. Býči Skála, 19. Wilczyce. (Triangles indicate uncertainassignments, figurines from Nebra (small picture) after Feustel, 1970).
37M. Schlummer et al. / Earth-Science Reviews 131 (2014) 22–48
way of life. A camp, the smallest unit for the analysis of Palaeolithic landuse, must therefore always be understood as capturing only a small partof a largely unknown settlement pattern. The extent of camps varies ac-cording to their function and time of occupation and may range from a
few m2 up to 1000 m2 or more (Fig. 1). A site, the basic archive ofPalaeolithic research, therefore ranges within the same limits, as dothe respective excavations. Nevertheless, thewider context of the corre-sponding settlement pattern, which remains for the most part undis-covered, has to be considered as well.
At each site, information about themobility of its producers is storedin the existing artefacts and the source area of the raw materials fromwhich they are made. This information allows us to draw conclusionsabout the next larger scale, the catchment area of the site (e.g. Floss,1994; Poltowicz, 2006). A catchment area is the area around a campthat is exploited during its occupation. In the Rhine–Meuse region,these catchment areas may range from a few km2 at small camps upto 10,000 km2 andmore for large base camps, as is reported for instanceat the sites of Gönnersdorf and Andernach-Martinsberg (Floss, 1994).
Overlapping catchment areas suggest that different groups exploitedthe same resources. This indicates a kind of internal coherence andtherefore connects a catchment to the next larger scale: a settlementarea. Here, a settlement area is understood as the area covered by con-tiguous catchment areas. With regard to our example, the settlementarea would comprise the entire Rhine–Meuse region. The catchmentareas of the sites located in the Rhenish Massif and the Lower RhineEmbayment together cover an area of about 40,000 km2.
The target scale of many Palaeolithic investigations is larger thanthat of the Lower Rhine Embayment and comprises all sites assignedto a certain entity. This so-called contextual area encompasses severalsettlement areas. For the Magdalenian, it covers Western and CentralEurope and thus extends to about 106 km2 (Fig. 6a). For the determina-tion of the contextual area, the distribution of typological, technologicaland representational concepts is important. Here, the application ofsimilar concepts is seen as indicative of interaction between differentgroups of hunter–gatherers. This is because two non-interacting groupsare highly likely to show increasingly divergent concept frequenciesover time, including the loss of certain concepts, even if both groupsstartedwith identical concept frequencies and produced no innovationshistorically unique to each group (Neimann, 1995).
3.5.2. Upscaling methodsAlthough widely applied, the issue of upscaling is rarely discussed
explicitly in Palaeolithic studies. Generally, four different approachesare used in practice: source tracing, pattern recognition, density and fre-quency estimation based on interpolation, and predictive modelling.
3.5.2.1. Source tracing.A lithic artefact – a point datum – already containsinformation about larger scales in itself. This is because the raw mate-rials used to create lithic artefacts are not evenly distributed but arehighly variable in space. It is thus generally possible to trace the sourceregions of the rawmaterials used at a site. The resultingdata can be usedto reconstruct minimum estimates for a site catchment area. If thecatchment information from different sites is combined, conclusionscan be drawn with regard to the extent of a settlement area (e.g. Floss,1994; Poltowicz, 2006). Source tracing is thus a suitable approach forupscaling point data, even from single sites, into spatial data. To illus-trate this approach, Fig. 6b shows the rawmaterial procurement patternfor the Magdalenian sites in the Rhine–Meuse area. A major problem,however, is to reliably pinpoint the true source of the raw materialsused to produce the artefacts found at these sites. Similar formation pro-cesses at different sources may lead to similarities in the appearance ofthe material at widely separated outcrops. Further complicating mattersis the transport of rawmaterials from these outcrops and their depositionby rivers or glaciers in secondary positions. These biases may obscure theorigin of a raw material considerably and introduce inaccuracies intothe analysis. Nevertheless, if these problems are kept in mind and areaccounted for, source tracing can be a valuable upscaling method inPalaeolithic research.
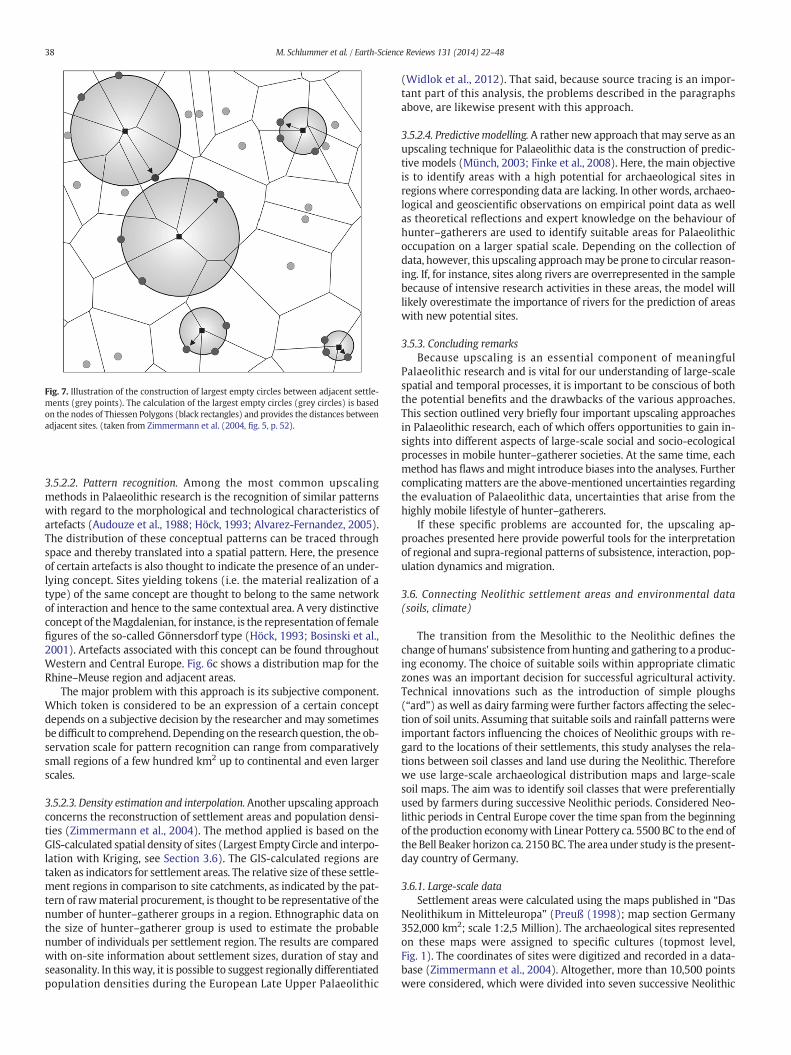
Fig. 7. Illustration of the construction of largest empty circles between adjacent settle-ments (grey points). The calculation of the largest empty circles (grey circles) is basedon the nodes of Thiessen Polygons (black rectangles) and provides the distances betweenadjacent sites. (taken from Zimmermann et al. (2004, fig. 5, p. 52).
38 M. Schlummer et al. / Earth-Science Reviews 131 (2014) 22–48
3.5.2.2. Pattern recognition. Among the most common upscalingmethods in Palaeolithic research is the recognition of similar patternswith regard to the morphological and technological characteristics ofartefacts (Audouze et al., 1988; Höck, 1993; Alvarez-Fernandez, 2005).The distribution of these conceptual patterns can be traced throughspace and thereby translated into a spatial pattern. Here, the presenceof certain artefacts is also thought to indicate the presence of an under-lying concept. Sites yielding tokens (i.e. the material realization of atype) of the same concept are thought to belong to the same networkof interaction and hence to the same contextual area. A very distinctiveconcept of theMagdalenian, for instance, is the representation of femalefigures of the so-called Gönnersdorf type (Höck, 1993; Bosinski et al.,2001). Artefacts associated with this concept can be found throughoutWestern and Central Europe. Fig. 6c shows a distribution map for theRhine–Meuse region and adjacent areas.
The major problem with this approach is its subjective component.Which token is considered to be an expression of a certain conceptdepends on a subjective decision by the researcher andmay sometimesbe difficult to comprehend. Depending on the research question, the ob-servation scale for pattern recognition can range from comparativelysmall regions of a few hundred km2 up to continental and even largerscales.
3.5.2.3. Density estimation and interpolation. Another upscaling approachconcerns the reconstruction of settlement areas and population densi-ties (Zimmermann et al., 2004). The method applied is based on theGIS-calculated spatial density of sites (Largest Empty Circle and interpo-lation with Kriging, see Section 3.6). The GIS-calculated regions aretaken as indicators for settlement areas. The relative size of these settle-ment regions in comparison to site catchments, as indicated by the pat-tern of rawmaterial procurement, is thought to be representative of thenumber of hunter–gatherer groups in a region. Ethnographic data onthe size of hunter–gatherer group is used to estimate the probablenumber of individuals per settlement region. The results are comparedwith on-site information about settlement sizes, duration of stay andseasonality. In this way, it is possible to suggest regionally differentiatedpopulation densities during the European Late Upper Palaeolithic
(Widlok et al., 2012). That said, because source tracing is an impor-tant part of this analysis, the problems described in the paragraphsabove, are likewise present with this approach.
3.5.2.4. Predictivemodelling. A rather new approach that may serve as anupscaling technique for Palaeolithic data is the construction of predic-tive models (Münch, 2003; Finke et al., 2008). Here, the main objectiveis to identify areas with a high potential for archaeological sites inregions where corresponding data are lacking. In other words, archaeo-logical and geoscientific observations on empirical point data as wellas theoretical reflections and expert knowledge on the behaviour ofhunter–gatherers are used to identify suitable areas for Palaeolithicoccupation on a larger spatial scale. Depending on the collection ofdata, however, this upscaling approachmay be prone to circular reason-ing. If, for instance, sites along rivers are overrepresented in the samplebecause of intensive research activities in these areas, the model willlikely overestimate the importance of rivers for the prediction of areaswith new potential sites.
3.5.3. Concluding remarksBecause upscaling is an essential component of meaningful
Palaeolithic research and is vital for our understanding of large-scalespatial and temporal processes, it is important to be conscious of boththe potential benefits and the drawbacks of the various approaches.This section outlined very briefly four important upscaling approachesin Palaeolithic research, each of which offers opportunities to gain in-sights into different aspects of large-scale social and socio-ecologicalprocesses in mobile hunter–gatherer societies. At the same time, eachmethod has flaws andmight introduce biases into the analyses. Furthercomplicatingmatters are the above-mentioned uncertainties regardingthe evaluation of Palaeolithic data, uncertainties that arise from thehighly mobile lifestyle of hunter–gatherers.
If these specific problems are accounted for, the upscaling ap-proaches presented here provide powerful tools for the interpretationof regional and supra-regional patterns of subsistence, interaction, pop-ulation dynamics and migration.
3.6. Connecting Neolithic settlement areas and environmental data(soils, climate)
The transition from the Mesolithic to the Neolithic defines thechange of humans' subsistence fromhunting and gathering to a produc-ing economy. The choice of suitable soils within appropriate climaticzones was an important decision for successful agricultural activity.Technical innovations such as the introduction of simple ploughs(“ard”) as well as dairy farming were further factors affecting the selec-tion of soil units. Assuming that suitable soils and rainfall patterns wereimportant factors influencing the choices of Neolithic groups with re-gard to the locations of their settlements, this study analyses the rela-tions between soil classes and land use during the Neolithic. Thereforewe use large-scale archaeological distribution maps and large-scalesoil maps. The aim was to identify soil classes that were preferentiallyused by farmers during successive Neolithic periods. Considered Neo-lithic periods in Central Europe cover the time span from the beginningof the production economywith Linear Pottery ca. 5500 BC to the end ofthe Bell Beaker horizon ca. 2150 BC. The area under study is the present-day country of Germany.
3.6.1. Large-scale dataSettlement areas were calculated using the maps published in “Das
Neolithikum in Mitteleuropa” (Preuß (1998); map section Germany352,000 km2; scale 1:2,5 Million). The archaeological sites representedon these maps were assigned to specific cultures (topmost level,Fig. 1). The coordinates of sites were digitized and recorded in a data-base (Zimmermann et al., 2004). Altogether, more than 10,500 pointswere considered, which were divided into seven successive Neolithic
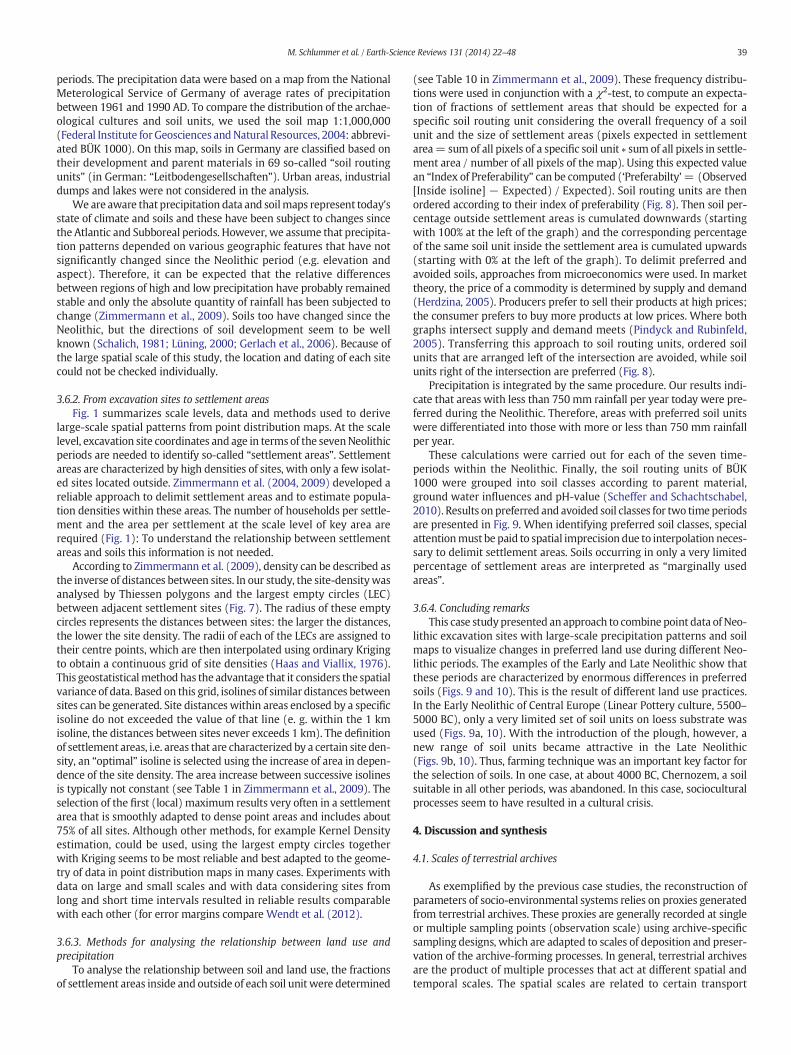
39M. Schlummer et al. / Earth-Science Reviews 131 (2014) 22–48
periods. The precipitation data were based on a map from the NationalMeterological Service of Germany of average rates of precipitationbetween 1961 and 1990 AD. To compare the distribution of the archae-ological cultures and soil units, we used the soil map 1:1,000,000(Federal Institute forGeosciences andNatural Resources, 2004: abbrevi-ated BÜK 1000). On this map, soils in Germany are classified based ontheir development and parent materials in 69 so-called “soil routingunits” (in German: “Leitbodengesellschaften”). Urban areas, industrialdumps and lakes were not considered in the analysis.
We are aware that precipitation data and soilmaps represent today'sstate of climate and soils and these have been subject to changes sincethe Atlantic and Subboreal periods. However, we assume that precipita-tion patterns depended on various geographic features that have notsignificantly changed since the Neolithic period (e.g. elevation andaspect). Therefore, it can be expected that the relative differencesbetween regions of high and low precipitation have probably remainedstable and only the absolute quantity of rainfall has been subjected tochange (Zimmermann et al., 2009). Soils too have changed since theNeolithic, but the directions of soil development seem to be wellknown (Schalich, 1981; Lüning, 2000; Gerlach et al., 2006). Because ofthe large spatial scale of this study, the location and dating of each sitecould not be checked individually.
3.6.2. From excavation sites to settlement areasFig. 1 summarizes scale levels, data and methods used to derive
large-scale spatial patterns from point distribution maps. At the scalelevel, excavation site coordinates and age in terms of the sevenNeolithicperiods are needed to identify so-called “settlement areas”. Settlementareas are characterized by high densities of sites, with only a few isolat-ed sites located outside. Zimmermann et al. (2004, 2009) developed areliable approach to delimit settlement areas and to estimate popula-tion densities within these areas. The number of households per settle-ment and the area per settlement at the scale level of key area arerequired (Fig. 1): To understand the relationship between settlementareas and soils this information is not needed.
According to Zimmermann et al. (2009), density can be described asthe inverse of distances between sites. In our study, the site-densitywasanalysed by Thiessen polygons and the largest empty circles (LEC)between adjacent settlement sites (Fig. 7). The radius of these emptycircles represents the distances between sites: the larger the distances,the lower the site density. The radii of each of the LECs are assigned totheir centre points, which are then interpolated using ordinary Krigingto obtain a continuous grid of site densities (Haas and Viallix, 1976).This geostatisticalmethod has the advantage that it considers the spatialvariance of data. Based on this grid, isolines of similar distances betweensites can be generated. Site distances within areas enclosed by a specificisoline do not exceeded the value of that line (e. g. within the 1 kmisoline, the distances between sites never exceeds 1 km). The definitionof settlement areas, i.e. areas that are characterized by a certain site den-sity, an “optimal” isoline is selected using the increase of area in depen-dence of the site density. The area increase between successive isolinesis typically not constant (see Table 1 in Zimmermann et al., 2009). Theselection of the first (local) maximum results very often in a settlementarea that is smoothly adapted to dense point areas and includes about75% of all sites. Although other methods, for example Kernel Densityestimation, could be used, using the largest empty circles togetherwith Kriging seems to be most reliable and best adapted to the geome-try of data in point distribution maps in many cases. Experiments withdata on large and small scales and with data considering sites fromlong and short time intervals resulted in reliable results comparablewith each other (for error margins compare Wendt et al. (2012).
3.6.3. Methods for analysing the relationship between land use andprecipitation
To analyse the relationship between soil and land use, the fractionsof settlement areas inside and outside of each soil unit were determined
(see Table 10 in Zimmermann et al., 2009). These frequency distribu-tions were used in conjunction with a χ2-test, to compute an expecta-tion of fractions of settlement areas that should be expected for aspecific soil routing unit considering the overall frequency of a soilunit and the size of settlement areas (pixels expected in settlementarea= sum of all pixels of a specific soil unit ∗ sum of all pixels in settle-ment area / number of all pixels of the map). Using this expected valuean “Index of Preferability” can be computed (‘Preferabilty’= (Observed[Inside isoline] − Expected) / Expected). Soil routing units are thenordered according to their index of preferability (Fig. 8). Then soil per-centage outside settlement areas is cumulated downwards (startingwith 100% at the left of the graph) and the corresponding percentageof the same soil unit inside the settlement area is cumulated upwards(starting with 0% at the left of the graph). To delimit preferred andavoided soils, approaches from microeconomics were used. In markettheory, the price of a commodity is determined by supply and demand(Herdzina, 2005). Producers prefer to sell their products at high prices;the consumer prefers to buy more products at low prices. Where bothgraphs intersect supply and demand meets (Pindyck and Rubinfeld,2005). Transferring this approach to soil routing units, ordered soilunits that are arranged left of the intersection are avoided, while soilunits right of the intersection are preferred (Fig. 8).
Precipitation is integrated by the same procedure. Our results indi-cate that areas with less than 750mm rainfall per year today were pre-ferred during the Neolithic. Therefore, areas with preferred soil unitswere differentiated into those with more or less than 750 mm rainfallper year.
These calculations were carried out for each of the seven time-periods within the Neolithic. Finally, the soil routing units of BÜK1000 were grouped into soil classes according to parent material,ground water influences and pH-value (Scheffer and Schachtschabel,2010). Results on preferred and avoided soil classes for two time periodsare presented in Fig. 9. When identifying preferred soil classes, specialattentionmust be paid to spatial imprecision due to interpolation neces-sary to delimit settlement areas. Soils occurring in only a very limitedpercentage of settlement areas are interpreted as “marginally usedareas”.
3.6.4. Concluding remarksThis case studypresented an approach to combine point data of Neo-
lithic excavation sites with large-scale precipitation patterns and soilmaps to visualize changes in preferred land use during different Neo-lithic periods. The examples of the Early and Late Neolithic show thatthese periods are characterized by enormous differences in preferredsoils (Figs. 9 and 10). This is the result of different land use practices.In the Early Neolithic of Central Europe (Linear Pottery culture, 5500–5000 BC), only a very limited set of soil units on loess substrate wasused (Figs. 9a, 10). With the introduction of the plough, however, anew range of soil units became attractive in the Late Neolithic(Figs. 9b, 10). Thus, farming technique was an important key factor forthe selection of soils. In one case, at about 4000 BC, Chernozem, a soilsuitable in all other periods, was abandoned. In this case, socioculturalprocesses seem to have resulted in a cultural crisis.
4. Discussion and synthesis
4.1. Scales of terrestrial archives
As exemplified by the previous case studies, the reconstruction ofparameters of socio-environmental systems relies on proxies generatedfrom terrestrial archives. These proxies are generally recorded at singleor multiple sampling points (observation scale) using archive-specificsampling designs, which are adapted to scales of deposition and preser-vation of the archive-forming processes. In general, terrestrial archivesare the product of multiple processes that act at different spatial andtemporal scales. The spatial scales are related to certain transport
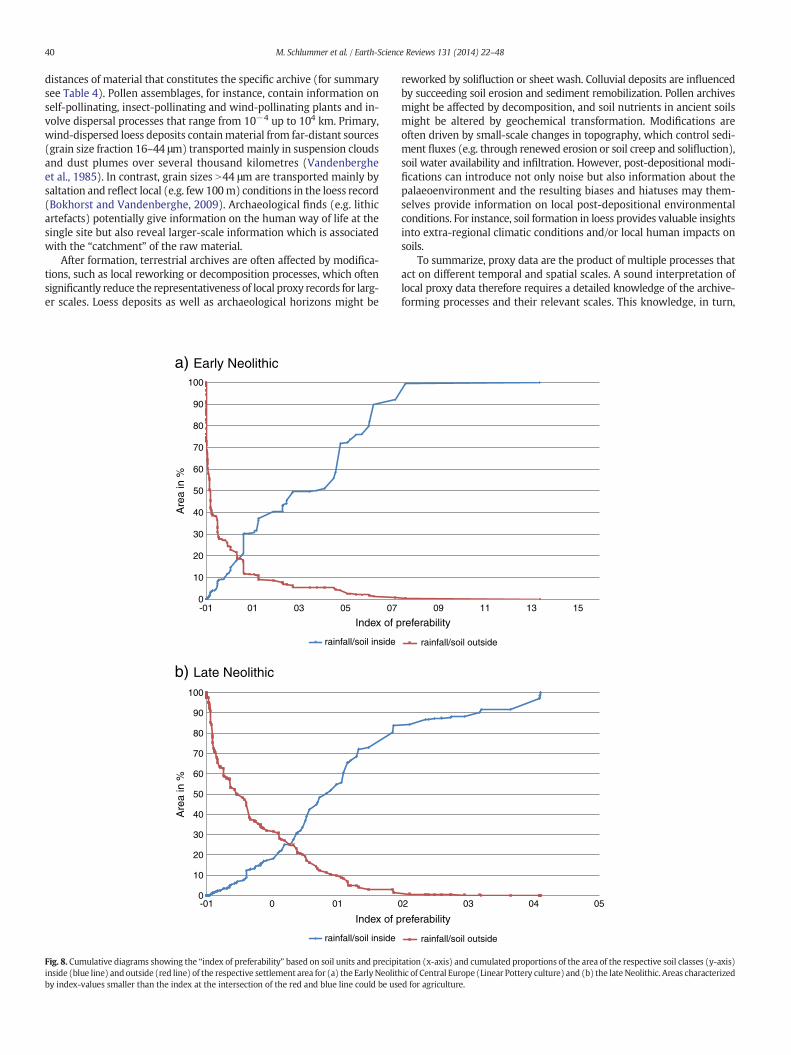
40 M. Schlummer et al. / Earth-Science Reviews 131 (2014) 22–48
distances of material that constitutes the specific archive (for summarysee Table 4). Pollen assemblages, for instance, contain information onself-pollinating, insect-pollinating and wind-pollinating plants and in-volve dispersal processes that range from 10−4 up to 104 km. Primary,wind-dispersed loess deposits containmaterial from far-distant sources(grain size fraction 16–44 μm) transported mainly in suspension cloudsand dust plumes over several thousand kilometres (Vandenbergheet al., 1985). In contrast, grain sizes N44 μm are transported mainly bysaltation and reflect local (e.g. few 100m) conditions in the loess record(Bokhorst and Vandenberghe, 2009). Archaeological finds (e.g. lithicartefacts) potentially give information on the human way of life at thesingle site but also reveal larger-scale information which is associatedwith the “catchment” of the raw material.
After formation, terrestrial archives are often affected by modifica-tions, such as local reworking or decomposition processes, which oftensignificantly reduce the representativeness of local proxy records for larg-er scales. Loess deposits as well as archaeological horizons might be
0
10
20
30
40
50
60
70
80
90
100
0
10
20
30
40
50
60
70
80
90
100
0 01
Index of p
Are
a in
%A
rea
in %
rainfall/soil inside
Index of p
rainfall/soil inside
a) Early Neolithic
b) Late Neolithic
-01
-01 01 03 05 07
Fig. 8. Cumulative diagrams showing the “index of preferability” based on soil units and precipiinside (blue line) and outside (red line) of the respective settlement area for (a) the EarlyNeolithby index-values smaller than the index at the intersection of the red and blue line could be us
reworked by solifluction or sheet wash. Colluvial deposits are influencedby succeeding soil erosion and sediment remobilization. Pollen archivesmight be affected by decomposition, and soil nutrients in ancient soilsmight be altered by geochemical transformation. Modifications areoften driven by small-scale changes in topography, which control sedi-ment fluxes (e.g. through renewed erosion or soil creep and solifluction),soil water availability and infiltration. However, post-depositional modi-fications can introduce not only noise but also information about thepalaeoenvironment and the resulting biases and hiatuses may them-selves provide information on local post-depositional environmentalconditions. For instance, soil formation in loess provides valuable insightsinto extra-regional climatic conditions and/or local human impacts onsoils.
To summarize, proxy data are the product of multiple processes thatact on different temporal and spatial scales. A sound interpretation oflocal proxy data therefore requires a detailed knowledge of the archive-forming processes and their relevant scales. This knowledge, in turn,
15
referability
rainfall/soil outside
referability
rainfall/soil outside
02 03 04 05
09 11 13
tation (x-axis) and cumulated proportions of the area of the respective soil classes (y-axis)ic of Central Europe (Linear Pottery culture) and (b) the late Neolithic. Areas characterized
ed for agriculture.
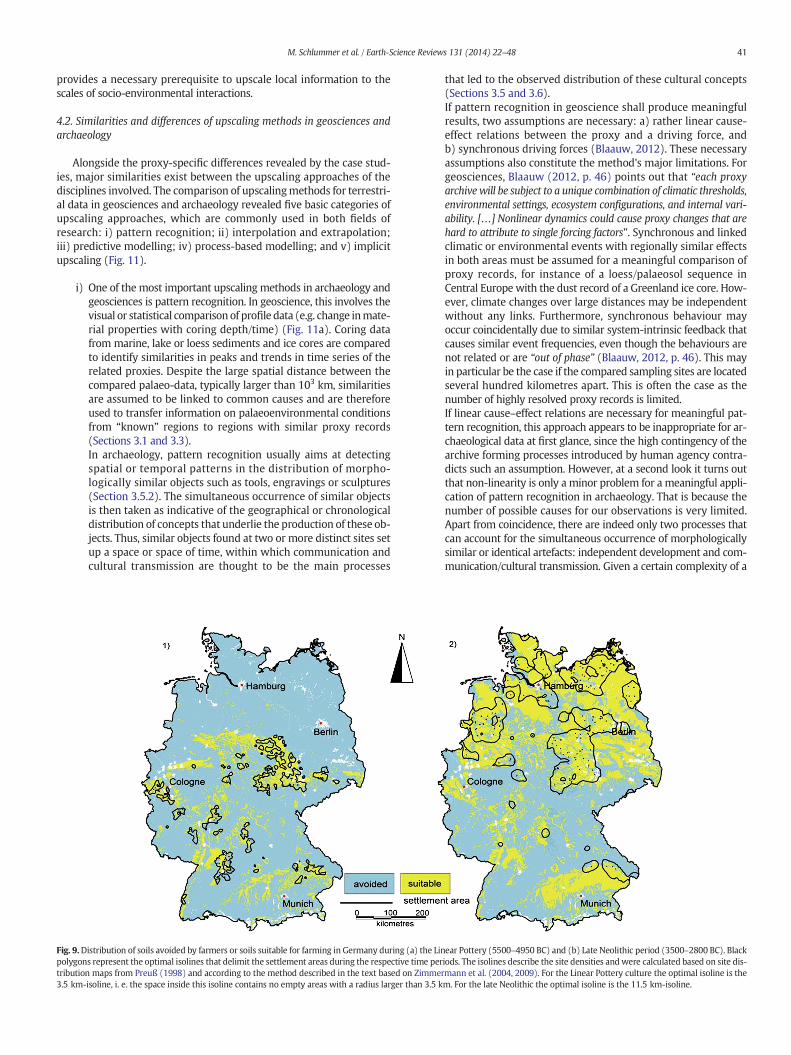
41M. Schlummer et al. / Earth-Science Reviews 131 (2014) 22–48
provides a necessary prerequisite to upscale local information to thescales of socio-environmental interactions.
4.2. Similarities and differences of upscaling methods in geosciences andarchaeology
Alongside the proxy-specific differences revealed by the case stud-ies, major similarities exist between the upscaling approaches of thedisciplines involved. The comparison of upscalingmethods for terrestri-al data in geosciences and archaeology revealed five basic categories ofupscaling approaches, which are commonly used in both fields ofresearch: i) pattern recognition; ii) interpolation and extrapolation;iii) predictive modelling; iv) process-based modelling; and v) implicitupscaling (Fig. 11).
i) One of the most important upscaling methods in archaeology andgeosciences is pattern recognition. In geoscience, this involves thevisual or statistical comparison of profile data (e.g. change inmate-rial properties with coring depth/time) (Fig. 11a). Coring datafrom marine, lake or loess sediments and ice cores are comparedto identify similarities in peaks and trends in time series of therelated proxies. Despite the large spatial distance between thecompared palaeo-data, typically larger than 103 km, similaritiesare assumed to be linked to common causes and are thereforeused to transfer information on palaeoenvironmental conditionsfrom “known” regions to regions with similar proxy records(Sections 3.1 and 3.3).In archaeology, pattern recognition usually aims at detectingspatial or temporal patterns in the distribution of morpho-logically similar objects such as tools, engravings or sculptures(Section 3.5.2). The simultaneous occurrence of similar objectsis then taken as indicative of the geographical or chronologicaldistribution of concepts that underlie the production of these ob-jects. Thus, similar objects found at two or more distinct sites setup a space or space of time, within which communication andcultural transmission are thought to be the main processes
Fig. 9.Distribution of soils avoided by farmers or soils suitable for farming in Germany during (polygons represent the optimal isolines that delimit the settlement areas during the respectivetribution maps from Preuß (1998) and according to the method described in the text based on3.5 km-isoline, i. e. the space inside this isoline contains no empty areas with a radius larger th
that led to the observed distribution of these cultural concepts(Sections 3.5 and 3.6).If pattern recognition in geoscience shall produce meaningfulresults, two assumptions are necessary: a) rather linear cause-effect relations between the proxy and a driving force, andb) synchronous driving forces (Blaauw, 2012). These necessaryassumptions also constitute the method's major limitations. Forgeosciences, Blaauw (2012, p. 46) points out that “each proxyarchive will be subject to a unique combination of climatic thresholds,environmental settings, ecosystem configurations, and internal vari-ability. […] Nonlinear dynamics could cause proxy changes that arehard to attribute to single forcing factors”. Synchronous and linkedclimatic or environmental events with regionally similar effectsin both areas must be assumed for a meaningful comparison ofproxy records, for instance of a loess/palaeosol sequence inCentral Europe with the dust record of a Greenland ice core. How-ever, climate changes over large distances may be independentwithout any links. Furthermore, synchronous behaviour mayoccur coincidentally due to similar system-intrinsic feedback thatcauses similar event frequencies, even though the behaviours arenot related or are “out of phase” (Blaauw, 2012, p. 46). This mayin particular be the case if the compared sampling sites are locatedseveral hundred kilometres apart. This is often the case as thenumber of highly resolved proxy records is limited.If linear cause–effect relations are necessary for meaningful pat-tern recognition, this approach appears to be inappropriate for ar-chaeological data at first glance, since the high contingency of thearchive forming processes introduced by human agency contra-dicts such an assumption. However, at a second look it turns outthat non-linearity is only a minor problem for a meaningful appli-cation of pattern recognition in archaeology. That is because thenumber of possible causes for our observations is very limited.Apart from coincidence, there are indeed only two processes thatcan account for the simultaneous occurrence of morphologicallysimilar or identical artefacts: independent development and com-munication/cultural transmission. Given a certain complexity of a
a) the Linear Pottery (5500–4950 BC) and (b) Late Neolithic period (3500–2800 BC). Blacktime periods. The isolines describe the site densities and were calculated based on site dis-Zimmermann et al. (2004, 2009). For the Linear Pottery culture the optimal isoline is thean 3.5 km. For the late Neolithic the optimal isoline is the 11.5 km-isoline.
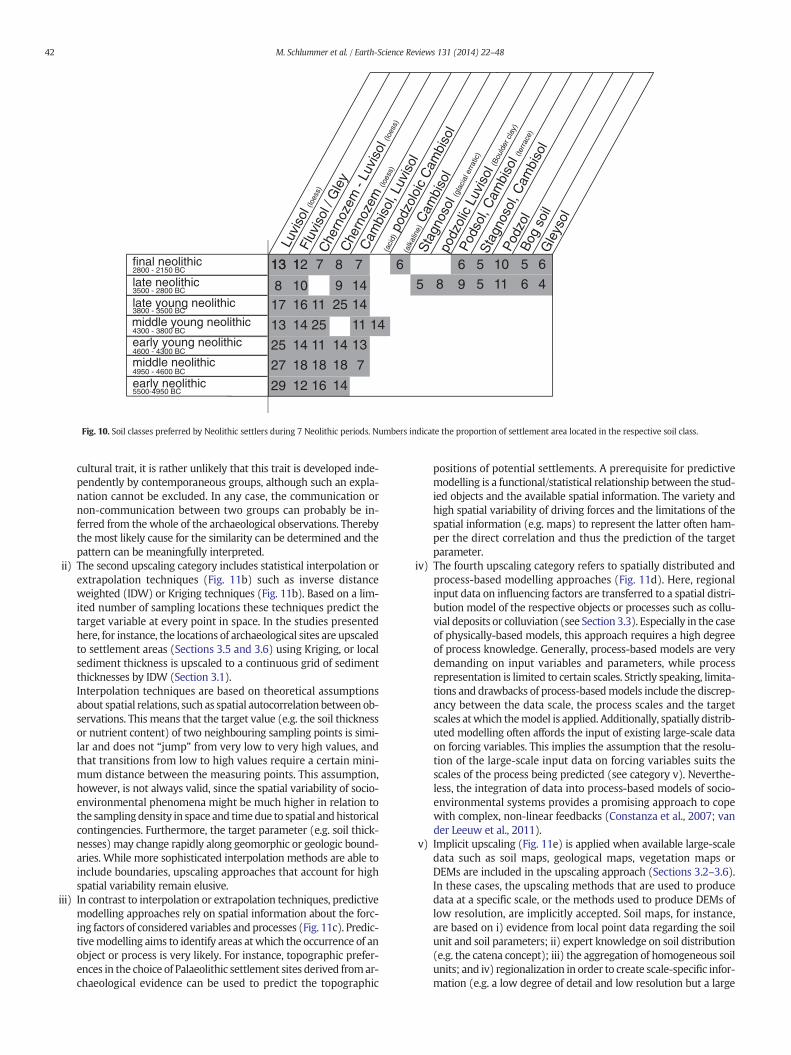
final neolithic
late neolithic
late young neolithic
middle young neolithic
early young neolithic
middle neolithic
early neolithic
13
817
13
25
27
29
12
1016
14
14
18
12
11
25
11
18
16
8
925
14
18
14
7
1414
11
13
7
14
5 8 9 5 11
13 1 67 5 106 56
6 4Lu
viso
l (lo
ess)
Fluv
isol
/ G
ley
Che
rnoz
em -
Luvi
sol (
loes
s)
Che
rnoz
em(lo
ess)
Cam
biso
l, Lu
viso
l
(aci
d) p
odzo
loic
Cam
biso
l
(alk
alin
e) C
ambi
sol
Sta
gnos
ol(g
laci
al e
rrat
ic)
podz
olic
Luv
isol
(Bou
lder
cla
y)
Sta
gnos
ol, C
ambi
sol
Pod
zol
Bog
soi
l
Pod
sol,
Cam
biso
l (te
rrac
e)
Gle
ysol
5500-4950 BC
4950 - 4600 BC
4600 - 4300 BC
4300 - 3800 BC
3800 - 3500 BC
3500 - 2800 BC
2800 - 2150 BC
Fig. 10. Soil classes preferred by Neolithic settlers during 7 Neolithic periods. Numbers indicate the proportion of settlement area located in the respective soil class.
42 M. Schlummer et al. / Earth-Science Reviews 131 (2014) 22–48
cultural trait, it is rather unlikely that this trait is developed inde-pendently by contemporaneous groups, although such an expla-nation cannot be excluded. In any case, the communication ornon-communication between two groups can probably be in-ferred from the whole of the archaeological observations. Therebythe most likely cause for the similarity can be determined and thepattern can be meaningfully interpreted.
ii) The second upscaling category includes statistical interpolation orextrapolation techniques (Fig. 11b) such as inverse distanceweighted (IDW) or Kriging techniques (Fig. 11b). Based on a lim-ited number of sampling locations these techniques predict thetarget variable at every point in space. In the studies presentedhere, for instance, the locations of archaeological sites are upscaledto settlement areas (Sections 3.5 and 3.6) using Kriging, or localsediment thickness is upscaled to a continuous grid of sedimentthicknesses by IDW (Section 3.1).Interpolation techniques are based on theoretical assumptionsabout spatial relations, such as spatial autocorrelation between ob-servations. This means that the target value (e.g. the soil thicknessor nutrient content) of two neighbouring sampling points is simi-lar and does not “jump” from very low to very high values, andthat transitions from low to high values require a certain mini-mum distance between the measuring points. This assumption,however, is not always valid, since the spatial variability of socio-environmental phenomena might be much higher in relation tothe samplingdensity in space and timedue to spatial andhistoricalcontingencies. Furthermore, the target parameter (e.g. soil thick-nesses) may change rapidly along geomorphic or geologic bound-aries. While more sophisticated interpolation methods are able toinclude boundaries, upscaling approaches that account for highspatial variability remain elusive.
iii) In contrast to interpolation or extrapolation techniques, predictivemodelling approaches rely on spatial information about the forc-ing factors of considered variables and processes (Fig. 11c). Predic-tivemodelling aims to identify areas atwhich the occurrence of anobject or process is very likely. For instance, topographic prefer-ences in the choice of Palaeolithic settlement sites derived fromar-chaeological evidence can be used to predict the topographic
positions of potential settlements. A prerequisite for predictivemodelling is a functional/statistical relationship between the stud-ied objects and the available spatial information. The variety andhigh spatial variability of driving forces and the limitations of thespatial information (e.g. maps) to represent the latter often ham-per the direct correlation and thus the prediction of the targetparameter.
iv) The fourth upscaling category refers to spatially distributed andprocess-based modelling approaches (Fig. 11d). Here, regionalinput data on influencing factors are transferred to a spatial distri-bution model of the respective objects or processes such as collu-vial deposits or colluviation (see Section 3.3). Especially in the caseof physically-based models, this approach requires a high degreeof process knowledge. Generally, process-based models are verydemanding on input variables and parameters, while processrepresentation is limited to certain scales. Strictly speaking, limita-tions and drawbacks of process-basedmodels include the discrep-ancy between the data scale, the process scales and the targetscales atwhich themodel is applied. Additionally, spatially distrib-uted modelling often affords the input of existing large-scale dataon forcing variables. This implies the assumption that the resolu-tion of the large-scale input data on forcing variables suits thescales of the process being predicted (see category v). Neverthe-less, the integration of data into process-based models of socio-environmental systems provides a promising approach to copewith complex, non-linear feedbacks (Constanza et al., 2007; vander Leeuw et al., 2011).
v) Implicit upscaling (Fig. 11e) is applied when available large-scaledata such as soil maps, geological maps, vegetation maps orDEMs are included in the upscaling approach (Sections 3.2–3.6).In these cases, the upscaling methods that are used to producedata at a specific scale, or the methods used to produce DEMs oflow resolution, are implicitly accepted. Soil maps, for instance,are based on i) evidence from local point data regarding the soilunit and soil parameters; ii) expert knowledge on soil distribution(e.g. the catena concept); iii) the aggregation of homogeneous soilunits; and iv) regionalization in order to create scale-specific infor-mation (e.g. a low degree of detail and low resolution but a large
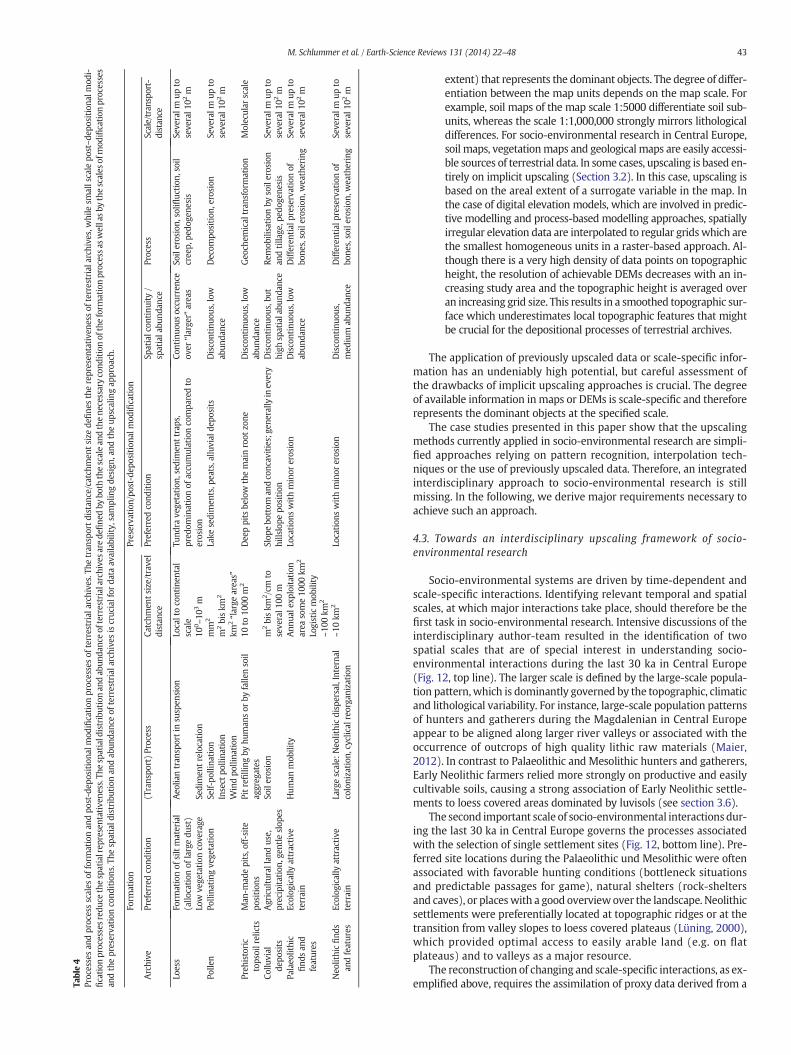
Table4
Processesan
dprocessscales
ofform
ationan
dpo
st-dep
ositiona
lmod
ification
proc
essesof
terrestriala
rchive
s.Th
etran
sportd
istanc
e/catchm
ents
izede
fine
stherepresen
tative
ness
ofterrestriala
rchive
s,while
smallscale
post–de
position
almod
i-fication
proc
essesr
educ
ethesp
atialrep
resentativen
ess.Th
esp
atiald
istributionan
dab
unda
nceof
terrestrialarchive
sare
define
dby
both
thescalean
dthene
cessaryco
nditionof
theform
ationprocessa
swellasby
thescales
ofmod
ification
processes
andthepreserva
tion
cond
itions
.The
spatiald
istributionan
dab
unda
nceof
terrestriala
rchive
siscruc
ialfor
data
availability,
samplingde
sign
,and
theup
scalingap
proa
ch.
Form
ation
Preserva
tion
/post-de
position
almod
ification
Archive
Preferredco
ndition
(Trans
port)Process
Catchm
ents
ize/trav
eldistan
cePreferredcond
ition
Spatialcon
tinu
ity/
spatiala
bund
ance
Process
Scale/tran
sport-
distan
ce
Loess
Form
ationof
siltmaterial
(allo
cation
oflargedu
st)
Aeo
liantran
sportin
susp
ension
Localtoco
ntinen
tal
scale
Tund
rave
getation
,sed
imen
ttrap
s,pred
ominationof
accu
mulationcompa
redto
erosion
Continuo
usoccu
rren
ceov
er“large
r”area
sSo
ilerosion,
solifl
uction
,soil
cree
p,pe
doge
nesis
Seve
ralm
upto
seve
ral1
02m
Low
vege
tation
cove
rage
Sedimen
trelocation
100–10
3m
Polle
nPo
llina
ting
vege
tation
Self-po
llina
tion
mm
2Lake
sedimen
ts,p
eats,allu
vial
depo
sits
Discontinuo
us,low
abun
danc
eDecom
position
,erosion
Seve
ralm
upto
seve
ral1
02m
Insect
pollina
tion
m2biskm
2
Windpo
llina
tion
km2“large
areas”
Preh
istoric
tops
oilrelicts
Man
-mad
epits,o
ff-site
position
sPitr
efilling
byhu
man
sor
byfalle
nsoil
aggreg
ates
10to
1000
m2
Dee
ppits
below
themainroot
zone
Discontinuo
us,low
abun
danc
eGeo
chem
ical
tran
sformation
Molecular
scale
Collu
vial
depo
sits
Agriculturallan
dus
e,precipitation,
gentle
slop
esSo
ilerosion
m2biskm
2 /cm
toseve
ral1
00m
Slop
ebo
ttom
andco
ncav
ities;ge
nerally
inev
ery
hillslope
position
Discontinuo
us,b
uthigh
spatialabu
ndan
ceRe
mob
ilisation
bysoilerosion
andtilla
ge,p
edog
enesis
Seve
ralm
upto
seve
ral1
02m
Palaeo
lithic
find
san
dfeatures
Ecolog
ically
attractive
terrain
Hum
anmob
ility
Ann
uale
xploitation
area
some10
00km
2
Logisticmob
ility
~100
km2
Location
swithminor
erosion
Discontinuo
us,low
abun
danc
eDifferen
tial
preserva
tion
ofbo
nes,soilerosion,
wea
thering
Seve
ralm
upto
seve
ral1
02m
Neo
lithicfind
san
dfeatures
Ecolog
ically
attractive
terrain
Largescale:
Neo
lithicdispersal,Internal
colonization
,cyclic
alreorga
nization
~10km
2Lo
cation
swithminor
erosion
Discontinuo
us,
med
ium
abun
danc
eDifferen
tial
preserva
tion
ofbo
nes,soilerosion,
wea
thering
Seve
ralm
upto
seve
ral1
02m
43M. Schlummer et al. / Earth-Science Reviews 131 (2014) 22–48
extent) that represents the dominant objects. The degree of differ-entiation between the map units depends on the map scale. Forexample, soil maps of the map scale 1:5000 differentiate soil sub-units, whereas the scale 1:1,000,000 strongly mirrors lithologicaldifferences. For socio-environmental research in Central Europe,soil maps, vegetationmaps and geological maps are easily accessi-ble sources of terrestrial data. In some cases, upscaling is based en-tirely on implicit upscaling (Section 3.2). In this case, upscaling isbased on the areal extent of a surrogate variable in the map. Inthe case of digital elevation models, which are involved in predic-tive modelling and process-based modelling approaches, spatiallyirregular elevation data are interpolated to regular gridswhich arethe smallest homogeneous units in a raster-based approach. Al-though there is a very high density of data points on topographicheight, the resolution of achievable DEMs decreases with an in-creasing study area and the topographic height is averaged overan increasing grid size. This results in a smoothed topographic sur-face which underestimates local topographic features that mightbe crucial for the depositional processes of terrestrial archives.
The application of previously upscaled data or scale-specific infor-mation has an undeniably high potential, but careful assessment ofthe drawbacks of implicit upscaling approaches is crucial. The degreeof available information in maps or DEMs is scale-specific and thereforerepresents the dominant objects at the specified scale.
The case studies presented in this paper show that the upscalingmethods currently applied in socio-environmental research are simpli-fied approaches relying on pattern recognition, interpolation tech-niques or the use of previously upscaled data. Therefore, an integratedinterdisciplinary approach to socio-environmental research is stillmissing. In the following, we derive major requirements necessary toachieve such an approach.
4.3. Towards an interdisciplinary upscaling framework of socio-environmental research
Socio-environmental systems are driven by time-dependent andscale-specific interactions. Identifying relevant temporal and spatialscales, at which major interactions take place, should therefore be thefirst task in socio-environmental research. Intensive discussions of theinterdisciplinary author-team resulted in the identification of twospatial scales that are of special interest in understanding socio-environmental interactions during the last 30 ka in Central Europe(Fig. 12, top line). The larger scale is defined by the large-scale popula-tion pattern,which is dominantly governed by the topographic, climaticand lithological variability. For instance, large-scale population patternsof hunters and gatherers during the Magdalenian in Central Europeappear to be aligned along larger river valleys or associated with theoccurrence of outcrops of high quality lithic raw materials (Maier,2012). In contrast to Palaeolithic and Mesolithic hunters and gatherers,Early Neolithic farmers relied more strongly on productive and easilycultivable soils, causing a strong association of Early Neolithic settle-ments to loess covered areas dominated by luvisols (see section 3.6).
The second important scale of socio-environmental interactionsdur-ing the last 30 ka in Central Europe governs the processes associatedwith the selection of single settlement sites (Fig. 12, bottom line). Pre-ferred site locations during the Palaeolithic und Mesolithic were oftenassociated with favorable hunting conditions (bottleneck situationsand predictable passages for game), natural shelters (rock-sheltersand caves), or placeswith a good overviewover the landscape. Neolithicsettlements were preferentially located at topographic ridges or at thetransition from valley slopes to loess covered plateaus (Lüning, 2000),which provided optimal access to easily arable land (e.g. on flatplateaus) and to valleys as a major resource.
The reconstruction of changing and scale-specific interactions, as ex-emplified above, requires the assimilation of proxy data derived from a
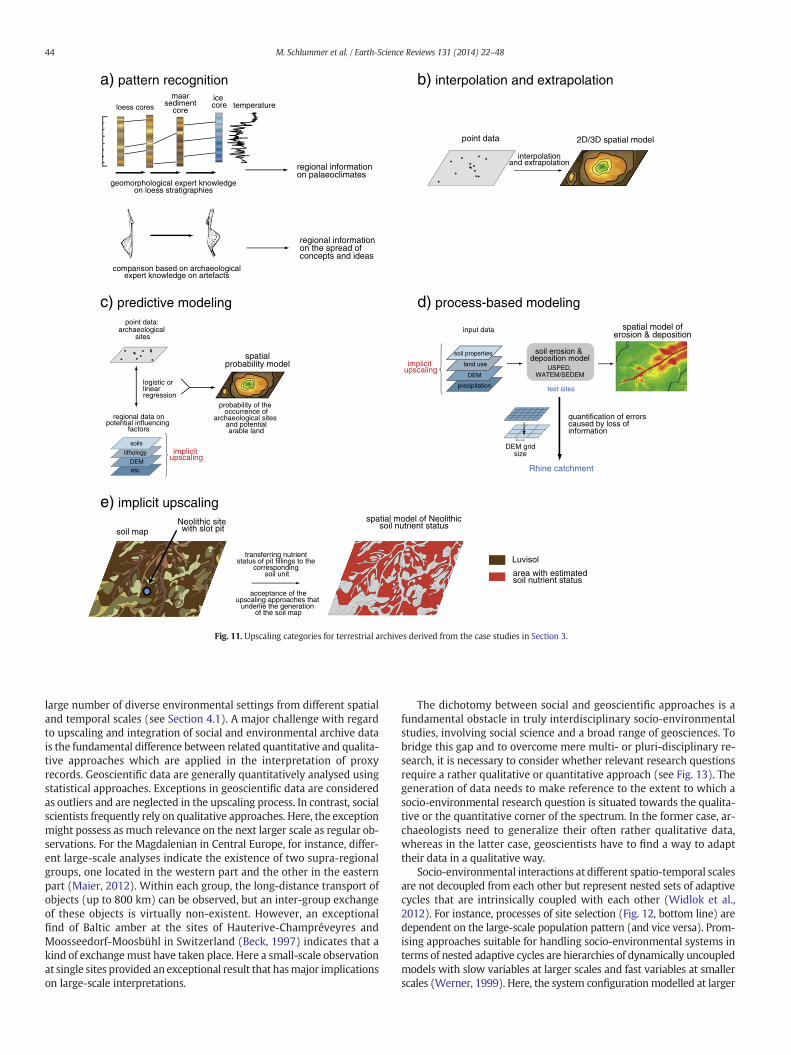
d) process-based modeling
input data
test sites
Rhine catchment
soil erosion & deposition model
spatial model oferosion & deposition
quantification of errorscaused by loss of information
soil properties
USPED,WATEM/SEDEM
precipitation
DEM
land useimplicitupscaling
c) predictive modelingpoint data:
soils
etc.DEM
lithology
regional data onpotential influencing
factors
spatialprobability model
probability of the occurrence of
archaeological sites and potentialarable land
archaeologicalsites
logistic orlinearregression
implicitupscaling
DEM grid size
b) interpolation and extrapolation
interpolationand extrapolation
point data 2D/3D spatial model
e) implicit upscaling
transferring nutrient status of pit fillings to the
correspondingsoil unit
soil map
spatial model of Neolithicsoil nutrient statusNeolithic site
with slot pit
acceptance of theupscaling approaches that
underlie the generation of the soil map
Luvisol
area with estimated soil nutrient status
a) pattern recognitionicecore
maarsediment
coreloess cores
regional information on the spread ofconcepts and ideas
regional information on palaeoclimates
geomorphological expert knowledgeon loess stratigraphies
comparison based on archaeologicalexpert knowledge on artefacts
temperature
Fig. 11. Upscaling categories for terrestrial archives derived from the case studies in Section 3.
44 M. Schlummer et al. / Earth-Science Reviews 131 (2014) 22–48
large number of diverse environmental settings from different spatialand temporal scales (see Section 4.1). A major challenge with regardto upscaling and integration of social and environmental archive datais the fundamental difference between related quantitative and qualita-tive approaches which are applied in the interpretation of proxyrecords. Geoscientific data are generally quantitatively analysed usingstatistical approaches. Exceptions in geoscientific data are consideredas outliers and are neglected in the upscaling process. In contrast, socialscientists frequently rely on qualitative approaches. Here, the exceptionmight possess as much relevance on the next larger scale as regular ob-servations. For the Magdalenian in Central Europe, for instance, differ-ent large-scale analyses indicate the existence of two supra-regionalgroups, one located in the western part and the other in the easternpart (Maier, 2012). Within each group, the long-distance transport ofobjects (up to 800 km) can be observed, but an inter-group exchangeof these objects is virtually non-existent. However, an exceptionalfind of Baltic amber at the sites of Hauterive-Champréveyres andMoosseedorf-Moosbühl in Switzerland (Beck, 1997) indicates that akind of exchangemust have taken place. Here a small-scale observationat single sites provided an exceptional result that hasmajor implicationson large-scale interpretations.
The dichotomy between social and geoscientific approaches is afundamental obstacle in truly interdisciplinary socio-environmentalstudies, involving social science and a broad range of geosciences. Tobridge this gap and to overcome mere multi- or pluri-disciplinary re-search, it is necessary to consider whether relevant research questionsrequire a rather qualitative or quantitative approach (see Fig. 13). Thegeneration of data needs to make reference to the extent to which asocio-environmental research question is situated towards the qualita-tive or the quantitative corner of the spectrum. In the former case, ar-chaeologists need to generalize their often rather qualitative data,whereas in the latter case, geoscientists have to find a way to adapttheir data in a qualitative way.
Socio-environmental interactions at different spatio-temporal scalesare not decoupled from each other but represent nested sets of adaptivecycles that are intrinsically coupled with each other (Widlok et al.,2012). For instance, processes of site selection (Fig. 12, bottom line) aredependent on the large-scale population pattern (and vice versa). Prom-ising approaches suitable for handling socio-environmental systems interms of nested adaptive cycles are hierarchies of dynamically uncoupledmodels with slow variables at larger scales and fast variables at smallerscales (Werner, 1999). Here, the system configurationmodelled at larger
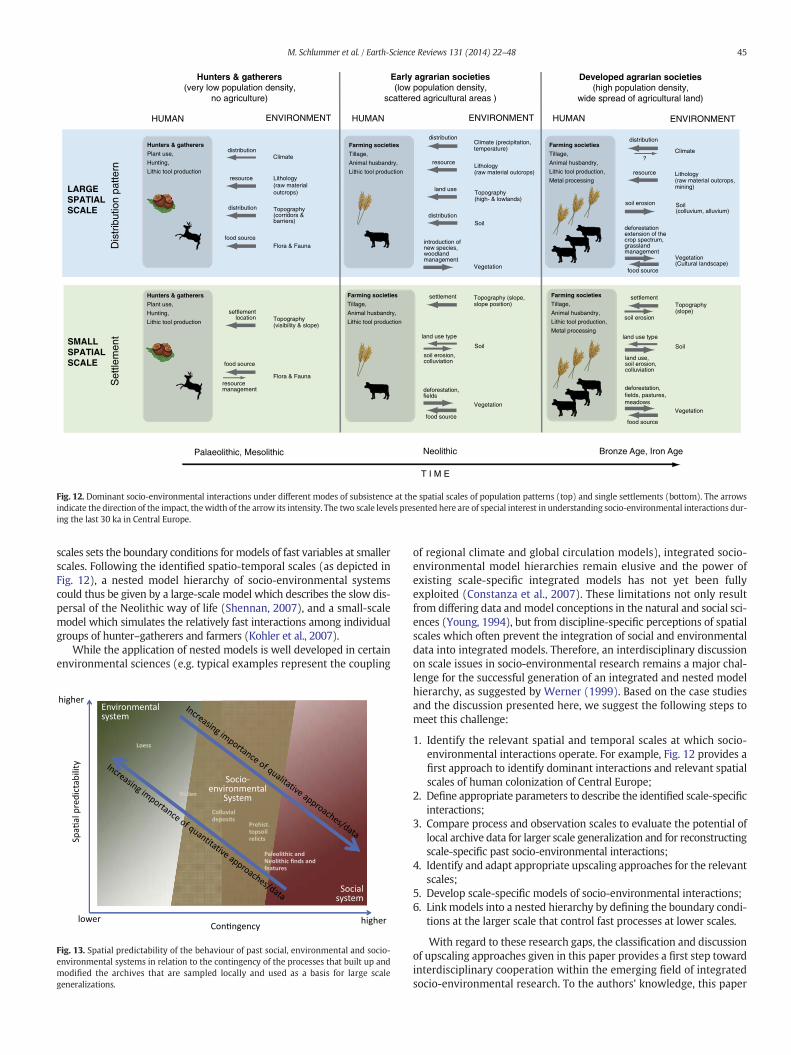
HUMAN ENVIRONMENT
Hunters & gatherers(very low population density,
no agriculture)
Early agrarian societies (low population density,
scattered agricultural areas )
Developed agrarian societies (high population density,
wide spread of agricultural land)
Topography(visibility & slope)
Set
tlem
ent
Dis
trib
utio
n pa
ttern
T I M E
SMALL SPATIAL SCALE
LARGESPATIAL SCALE
ENVIRONMENT ENVIRONMENTHUMAN HUMAN
Palaeolithic, Mesolithic egAnorI,egAeznorBcihtiloeN
Farming societies
Tillage,
Animal husbandry,
Lithic tool production
Hunters & gatherers
Plant use,
Hunting,
Lithic tool production
Farming societies
Tillage,
Animal husbandry,
Lithic tool production,
Metal processing
Farming societies
Tillage,
Animal husbandry,
Lithic tool production,
Metal processing
Farming societies
Tillage,
Animal husbandry,
Lithic tool production
Hunters & gatherers
Plant use,
Hunting,
Lithic tool production
Climatedistribution
Soildistribution
Flora & Faunafood source
Lithology(raw material outcrops)
resource
Topography (high- & lowlands)
land use
Lithology(raw material outcrops)
resource
Climate (precipitation, temperature)
distribution
Topography (corridors & barriers)
distribution
Topography (slope, slope position)
settlement
settlementlocation
Soil(colluvium, alluvium)
soil erosion
resource Lithology(raw material outcrops, mining)
Soil
land use type
land use, soil erosion, colluviation
Vegetation
deforestation,fields, pastures, meadows
Soil
land use type
soil erosion, colluviation
Vegetation
food source
deforestation,fields
introduction of new species, woodlandmanagement
Vegetation
Flora & Fauna
food source
resourcemanagement
Topography(slope)
settlement
soil erosion
Climate?
distribution
deforestationextension of thecrop spectrum, grasslandmanagement
Vegetation(Cultural landscape)
food source
food source
Fig. 12. Dominant socio-environmental interactions under different modes of subsistence at the spatial scales of population patterns (top) and single settlements (bottom). The arrowsindicate the direction of the impact, thewidth of the arrow its intensity. The two scale levels presented here are of special interest in understanding socio-environmental interactions dur-ing the last 30 ka in Central Europe.
45M. Schlummer et al. / Earth-Science Reviews 131 (2014) 22–48
scales sets the boundary conditions for models of fast variables at smallerscales. Following the identified spatio-temporal scales (as depicted inFig. 12), a nested model hierarchy of socio-environmental systemscould thus be given by a large-scale model which describes the slow dis-persal of the Neolithic way of life (Shennan, 2007), and a small-scalemodel which simulates the relatively fast interactions among individualgroups of hunter–gatherers and farmers (Kohler et al., 2007).
While the application of nested models is well developed in certainenvironmental sciences (e.g. typical examples represent the coupling
Fig. 13. Spatial predictability of the behaviour of past social, environmental and socio-environmental systems in relation to the contingency of the processes that built up andmodified the archives that are sampled locally and used as a basis for large scalegeneralizations.
of regional climate and global circulation models), integrated socio-environmental model hierarchies remain elusive and the power ofexisting scale-specific integrated models has not yet been fullyexploited (Constanza et al., 2007). These limitations not only resultfrom differing data and model conceptions in the natural and social sci-ences (Young, 1994), but from discipline-specific perceptions of spatialscales which often prevent the integration of social and environmentaldata into integrated models. Therefore, an interdisciplinary discussionon scale issues in socio-environmental research remains a major chal-lenge for the successful generation of an integrated and nested modelhierarchy, as suggested by Werner (1999). Based on the case studiesand the discussion presented here, we suggest the following steps tomeet this challenge:
1. Identify the relevant spatial and temporal scales at which socio-environmental interactions operate. For example, Fig. 12 provides afirst approach to identify dominant interactions and relevant spatialscales of human colonization of Central Europe;
2. Define appropriate parameters to describe the identified scale-specificinteractions;
3. Compare process and observation scales to evaluate the potential oflocal archive data for larger scale generalization and for reconstructingscale-specific past socio-environmental interactions;
4. Identify and adapt appropriate upscaling approaches for the relevantscales;
5. Develop scale-specific models of socio-environmental interactions;6. Linkmodels into a nested hierarchy by defining the boundary condi-
tions at the larger scale that control fast processes at lower scales.
With regard to these research gaps, the classification and discussionof upscaling approaches given in this paper provides a first step towardinterdisciplinary cooperation within the emerging field of integratedsocio-environmental research. To the authors' knowledge, this paper
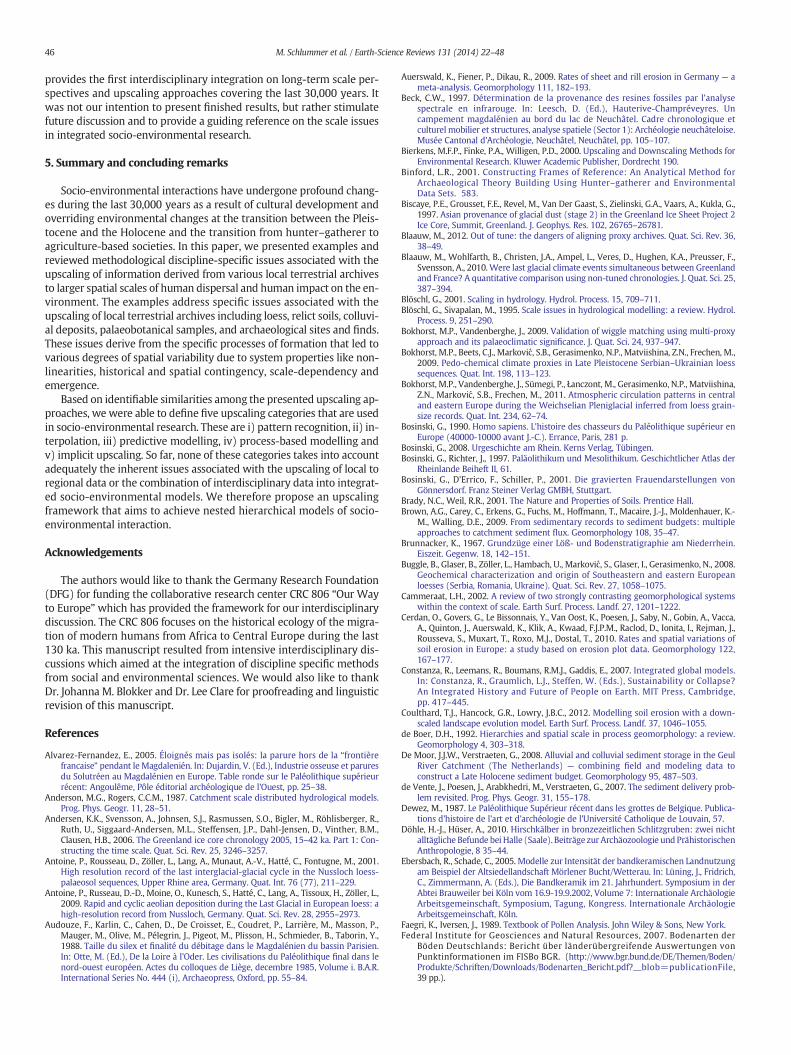
46 M. Schlummer et al. / Earth-Science Reviews 131 (2014) 22–48
provides the first interdisciplinary integration on long-term scale per-spectives and upscaling approaches covering the last 30,000 years. Itwas not our intention to present finished results, but rather stimulatefuture discussion and to provide a guiding reference on the scale issuesin integrated socio-environmental research.
5. Summary and concluding remarks
Socio-environmental interactions have undergone profound chang-es during the last 30,000 years as a result of cultural development andoverriding environmental changes at the transition between the Pleis-tocene and the Holocene and the transition from hunter–gatherer toagriculture-based societies. In this paper, we presented examples andreviewed methodological discipline-specific issues associated with theupscaling of information derived from various local terrestrial archivesto larger spatial scales of human dispersal and human impact on the en-vironment. The examples address specific issues associated with theupscaling of local terrestrial archives including loess, relict soils, colluvi-al deposits, palaeobotanical samples, and archaeological sites and finds.These issues derive from the specific processes of formation that led tovarious degrees of spatial variability due to system properties like non-linearities, historical and spatial contingency, scale-dependency andemergence.
Based on identifiable similarities among the presented upscaling ap-proaches, we were able to define five upscaling categories that are usedin socio-environmental research. These are i) pattern recognition, ii) in-terpolation, iii) predictive modelling, iv) process-based modelling andv) implicit upscaling. So far, none of these categories takes into accountadequately the inherent issues associated with the upscaling of local toregional data or the combination of interdisciplinary data into integrat-ed socio-environmental models. We therefore propose an upscalingframework that aims to achieve nested hierarchical models of socio-environmental interaction.
Acknowledgements
The authors would like to thank the Germany Research Foundation(DFG) for funding the collaborative research center CRC 806 “Our Wayto Europe”which has provided the framework for our interdisciplinarydiscussion. The CRC 806 focuses on the historical ecology of the migra-tion of modern humans from Africa to Central Europe during the last130 ka. This manuscript resulted from intensive interdisciplinary dis-cussions which aimed at the integration of discipline specific methodsfrom social and environmental sciences. We would also like to thankDr. Johanna M. Blokker and Dr. Lee Clare for proofreading and linguisticrevision of this manuscript.
References
Alvarez-Fernandez, E., 2005. Éloignés mais pas isolés: la parure hors de la “frontièrefrancaise” pendant leMagdalenién. In: Dujardin, V. (Ed.), Industrie osseuse et paruresdu Solutréen au Magdalénien en Europe. Table ronde sur le Paléolithique supérieurrécent: Angoulême, Pôle éditorial archéologique de l'Ouest, pp. 25–38.
Anderson, M.G., Rogers, C.C.M., 1987. Catchment scale distributed hydrological models.Prog. Phys. Geogr. 11, 28–51.
Andersen, K.K., Svensson, A., Johnsen, S.J., Rasmussen, S.O., Bigler, M., Röhlisberger, R.,Ruth, U., Siggaard-Andersen, M.L., Steffensen, J.P., Dahl-Jensen, D., Vinther, B.M.,Clausen, H.B., 2006. The Greenland ice core chronology 2005, 15–42 ka. Part 1: Con-structing the time scale. Quat. Sci. Rev. 25, 3246–3257.
Antoine, P., Rousseau, D., Zöller, L., Lang, A., Munaut, A.-V., Hatté, C., Fontugne, M., 2001.High resolution record of the last interglacial-glacial cycle in the Nussloch loess-palaeosol sequences, Upper Rhine area, Germany. Quat. Int. 76 (77), 211–229.
Antoine, P., Russeau, D.-D., Moine, O., Kunesch, S., Hatté, C., Lang, A., Tissoux, H., Zöller, L.,2009. Rapid and cyclic aeolian deposition during the Last Glacial in European loess: ahigh-resolution record from Nussloch, Germany. Quat. Sci. Rev. 28, 2955–2973.
Audouze, F., Karlin, C., Cahen, D., De Croisset, E., Coudret, P., Larrière, M., Masson, P.,Mauger, M., Olive, M., Pélegrin, J., Pigeot, M., Plisson, H., Schmieder, B., Taborin, Y.,1988. Taille du silex et finalité du débitage dans le Magdalénien du bassin Parisien.In: Otte, M. (Ed.), De la Loire à l'Oder. Les civilisations du Paléolithique final dans lenord-ouest européen. Actes du colloques de Liège, decembre 1985, Volume i. B.A.R.International Series No. 444 (i), Archaeopress, Oxford, pp. 55–84.
Auerswald, K., Fiener, P., Dikau, R., 2009. Rates of sheet and rill erosion in Germany — ameta-analysis. Geomorphology 111, 182–193.
Beck, C.W., 1997. Détermination de la provenance des resines fossiles par l'analysespectrale en infrarouge. In: Leesch, D. (Ed.), Hauterive-Champréveyres. Uncampement magdalénien au bord du lac de Neuchâtel. Cadre chronologique etculturel mobilier et structures, analyse spatiele (Sector 1): Archéologie neuchâteloise.Musée Cantonal d'Archéologie, Neuchâtel, Neuchâtel, pp. 105–107.
Bierkens, M.F.P., Finke, P.A., Willigen, P.D., 2000. Upscaling and Downscaling Methods forEnvironmental Research. Kluwer Academic Publisher, Dordrecht 190.
Binford, L.R., 2001. Constructing Frames of Reference: An Analytical Method forArchaeological Theory Building Using Hunter–gatherer and EnvironmentalData Sets. 583.
Biscaye, P.E., Grousset, F.E., Revel, M., Van Der Gaast, S., Zielinski, G.A., Vaars, A., Kukla, G.,1997. Asian provenance of glacial dust (stage 2) in the Greenland Ice Sheet Project 2Ice Core, Summit, Greenland. J. Geophys. Res. 102, 26765–26781.
Blaauw, M., 2012. Out of tune: the dangers of aligning proxy archives. Quat. Sci. Rev. 36,38–49.
Blaauw, M., Wohlfarth, B., Christen, J.A., Ampel, L., Veres, D., Hughen, K.A., Preusser, F.,Svensson, A., 2010. Were last glacial climate events simultaneous between Greenlandand France? A quantitative comparison using non-tuned chronologies. J. Quat. Sci. 25,387–394.
Blöschl, G., 2001. Scaling in hydrology. Hydrol. Process. 15, 709–711.Blöschl, G., Sivapalan, M., 1995. Scale issues in hydrological modelling: a review. Hydrol.
Process. 9, 251–290.Bokhorst, M.P., Vandenberghe, J., 2009. Validation of wiggle matching using multi-proxy
approach and its palaeoclimatic significance. J. Quat. Sci. 24, 937–947.Bokhorst, M.P., Beets, C.J., Marković, S.B., Gerasimenko, N.P., Matviishina, Z.N., Frechen, M.,
2009. Pedo-chemical climate proxies in Late Pleistocene Serbian–Ukrainian loesssequences. Quat. Int. 198, 113–123.
Bokhorst, M.P., Vandenberghe, J., Sümegi, P., Łanczont, M., Gerasimenko, N.P., Matviishina,Z.N., Marković, S.B., Frechen, M., 2011. Atmospheric circulation patterns in centraland eastern Europe during the Weichselian Pleniglacial inferred from loess grain-size records. Quat. Int. 234, 62–74.
Bosinski, G., 1990. Homo sapiens. L'histoire des chasseurs du Paléolithique supérieur enEurope (40000-10000 avant J.-C.). Errance, Paris, 281 p.
Bosinski, G., 2008. Urgeschichte am Rhein. Kerns Verlag, Tübingen.Bosinski, G., Richter, J., 1997. Paläolithikum und Mesolithikum. Geschichtlicher Atlas der
Rheinlande Beiheft II, 61.Bosinski, G., D'Errico, F., Schiller, P., 2001. Die gravierten Frauendarstellungen von
Gönnersdorf. Franz Steiner Verlag GMBH, Stuttgart.Brady, N.C., Weil, R.R., 2001. The Nature and Properties of Soils. Prentice Hall.Brown, A.G., Carey, C., Erkens, G., Fuchs, M., Hoffmann, T., Macaire, J.-J., Moldenhauer, K.-
M., Walling, D.E., 2009. From sedimentary records to sediment budgets: multipleapproaches to catchment sediment flux. Geomorphology 108, 35–47.
Brunnacker, K., 1967. Grundzüge einer Löß- und Bodenstratigraphie am Niederrhein.Eiszeit. Gegenw. 18, 142–151.
Buggle, B., Glaser, B., Zöller, L., Hambach, U., Marković, S., Glaser, I., Gerasimenko, N., 2008.Geochemical characterization and origin of Southeastern and eastern Europeanloesses (Serbia, Romania, Ukraine). Quat. Sci. Rev. 27, 1058–1075.
Cammeraat, L.H., 2002. A review of two strongly contrasting geomorphological systemswithin the context of scale. Earth Surf. Process. Landf. 27, 1201–1222.
Cerdan, O., Govers, G., Le Bissonnais, Y., Van Oost, K., Poesen, J., Saby, N., Gobin, A., Vacca,A., Quinton, J., Auerswald, K., Klik, A., Kwaad, F.J.P.M., Raclod, D., Ionita, I., Rejman, J.,Rousseva, S., Muxart, T., Roxo, M.J., Dostal, T., 2010. Rates and spatial variations ofsoil erosion in Europe: a study based on erosion plot data. Geomorphology 122,167–177.
Constanza, R., Leemans, R., Boumans, R.M.J., Gaddis, E., 2007. Integrated global models.In: Constanza, R., Graumlich, L.J., Steffen, W. (Eds.), Sustainability or Collapse?An Integrated History and Future of People on Earth. MIT Press, Cambridge,pp. 417–445.
Coulthard, T.J., Hancock, G.R., Lowry, J.B.C., 2012. Modelling soil erosion with a down-scaled landscape evolution model. Earth Surf. Process. Landf. 37, 1046–1055.
de Boer, D.H., 1992. Hierarchies and spatial scale in process geomorphology: a review.Geomorphology 4, 303–318.
De Moor, J.J.W., Verstraeten, G., 2008. Alluvial and colluvial sediment storage in the GeulRiver Catchment (The Netherlands) — combining field and modeling data toconstruct a Late Holocene sediment budget. Geomorphology 95, 487–503.
de Vente, J., Poesen, J., Arabkhedri, M., Verstraeten, G., 2007. The sediment delivery prob-lem revisited. Prog. Phys. Geogr. 31, 155–178.
Dewez, M., 1987. Le Paléolithique Supérieur récent dans les grottes de Belgique. Publica-tions d'histoire de l'art et d'archéologie de l'Université Catholique de Louvain, 57.
Döhle, H.-J., Hüser, A., 2010. Hirschkälber in bronzezeitlichen Schlitzgruben: zwei nichtalltägliche Befunde bei Halle (Saale). Beiträge zur Archäozoologie und PrähistorischenAnthropologie, 8 35–44.
Ebersbach, R., Schade, C., 2005. Modelle zur Intensität der bandkeramischen Landnutzungam Beispiel der Altsiedellandschaft Mörlener Bucht/Wetterau. In: Lüning, J., Fridrich,C., Zimmermann, A. (Eds.), Die Bandkeramik im 21. Jahrhundert. Symposium in derAbtei Brauweiler bei Köln vom 16.9-19.9.2002, Volume 7: Internationale ArchäologieArbeitsgemeinschaft, Symposium, Tagung, Kongress. Internationale ArchäologieArbeitsgemeinschaft, Köln.
Faegri, K., Iversen, J., 1989. Textbook of Pollen Analysis. John Wiley & Sons, New York.Federal Institute for Geosciences and Natural Resources, 2007. Bodenarten der
Böden Deutschlands: Bericht über länderübergreifende Auswertungen vonPunktinformationen im FISBo BGR. (http://www.bgr.bund.de/DE/Themen/Boden/Produkte/Schriften/Downloads/Bodenarten_Bericht.pdf?__blob=publicationFile,39 pp.).
47M. Schlummer et al. / Earth-Science Reviews 131 (2014) 22–48
Federal Institute for Geosciences and Natural Resources, 2004. Bodenübersichtskarte derBundesrepublik Deutschland 1:1,000,000 (BÜK 1000).
Federal State Office for Geology and Mining of Saxony-Anhalt, 1997. Bodenübersichtskarte1:200,000 Blatt Halle/Leipzig (CC4734).
Feustel, R., 1970. Statuettes féminines palélithiques de la République DémocratiqueAllemande. Bulletin de la Société Préhistorique Francaise, 67 12–16.
Finke, P.A., Meylemans, E., Van de Wauw, J., 2008. Mapping the possible occurrence ofarchaeological sites by Bayesian inference. J. Archaeol. Sci. 35, 2786–2796.
Fischer, P., 2010. Zur mittel- und jungquartären Relief- und Bodenentwicklung dernordwestlichen Kölner Bucht - Detailuntersuchungen der lössbedecktenMittelterrassenlandschaft. (PhD thesis) University of Cologne, Cologne.
Floss, H., 1994. Rohmaterialversorgung im Paläolithikum des Mittelrheingebietes.Monogr. RGZM 21, 407.
Förster, H., Wunderlich, J., 2009. Holocene sediment budgets for upland catchments: theproblem of soilscape model and data availability. Catena 77, 143–149.
Frechen, M., Oches, E.A., Kohfeld, K.E., 2003. Loess in Europe — mass accumulation ratesduring the Last Glacial Period. Quat. Sci. Rev. 22, 1835–1857.
Fuchs, M., Fischer, M., Reverman, R., 2010. Colluvial and alluvial sediment archives tempo-rally resolved by OSL dating: implications for reconstructing soil erosion. Quat.Geochronol. 5, 269–273.
Fuchs, M., Will, M., Kunert, E., Kreutzer, S., Fischer, M., Reverman, R., 2011. The temporaland spatial quantification of Holocene sediment dynamics in a meso-scale catchmentin northern Bavaria, Germany. The Holocene 21, 1093–1104.
Gaillard, M.-J., Sugita, S., Bunting, J., Daring, J., Bittmann, F., 2008. Human impact on terres-trial ecosystems, pollen calibration and quantitative reconstruction of past land cover.Veg. Hist. Archaeobot. 17.
Geological Survey of North Rhine-Westphalia, 2013. Bodenkarte 1:5,000 Blatt Pattern beiAldenhoven (5103/06), Bodenkarte 1:50,000 Blatt Köln digital (L5106),Bodenübersichtskarte 1:200,000 Blatt Köln digital (CC5502).
Gerlach, R., Baumewerd-Schmidt, H., van den Borg, K., Eckmeier, E., Schmidt, M.W.I., 2006.Prehistoric alteration of soil in the Lower Rhine Basin, Northwest Germany—archaeological, 14C and geochemical evidence. Geoderma 136, 38–50.
Gerlach, R., Fischer, P., Eckmeier, E., Hilgers, A., 2012. Buried dark soil horizons andarchaeological features in the Neolithic settlement region of the Lower Rhine area, NWGermany: formation, geochemistry and chronostratigraphy. Quat. Int. 265, 191–204.
Grunwald, S., 2009. Multi-criteria characterization of recent digital soil mapping andmodeling approaches. Geoderma 152, 195–207.
Haas, A.G., Viallix, J.R., 1976. Krigeage applied to geophysics. The answer to the problem ofestimates and contouring. Geophys. Prospect. 24, 49–69.
Haase, D., Fink, J., Haase, G., Ruske, R., Pécsi, M., Richter, H., Altermann, M., and Jäger, K.-D.,2007. Loess in Europe — its spatial distribution based on a European loess map, scale1:2,500,000. Quaternary Science Reviews 26, 1301–1312.
Haesaerts, P., Borziac, I., Chekha, V.P., Chirica, V., Drozdov, N.I., Koulakovska, L., Orlova,L.A., van der Plicht, J., Damblon, F., 2010. Charcoal and wood remains for radiocarbondating Upper Pleistocene loess sequences in Eastern Europe and Central Siberia.Palaeogeogr. Palaeoclimatol. Palaeoecol. 291, 106–127.
Harvey, L.D.D., 2000. Upscaling in global change research. Clim. Chang. 44, 225–263.Hendl, M., Endlicher,W., 2003. Klimaspektrum zwischen Zugspitze und Rügen. Spektrum,
Heidelberg.Hennings, V., 2002. Accuracy of coarse-scale land quality maps as a function of the
upscaling procedure used for soil data. Geoderma 107, 177–196.Herdzina, K., 2005. Einführung in die Mikroökonomik, 236.Höck, C., 1993. Die Frauenstatuetten des Magdalénien von Gönnersdorf und Andernach.
Jahrb. Römisch-Germanischen Zentralmuseums 40, 253–316.Hodell, D.A., 2011. Maya megadrought? Nature 479, 45.Hoffmann, T., Erkens, G., Gerlach, R., Klostermann, J., Lang, A., 2009. Trends and controls of
Holocene floodplain sedimentation in the Rhine catchment. Catena 77, 96–106.Hoffmann, T., Schlummer, M., Notebaert, B., Verstraeten, G., Korup, O., 2013. Carbon burial
in soil sediments from Holocene agricultural erosion, Central Europe. Glob.Biogeochem. Cycles 27, 828–835.
Houben, P., 2008. Scale linkage and contingency effects of field-scale and hillslope-scalecontrols of long-term soil erosion: anthropogeomorphic sediment flux in agriculturalloess watersheds of Southern Germany. Geomorphology 101, 172–191.
IUSS Working Group WRB, 2006. World Reference Base for Soil Resources 2006. WorldSoil Resources Reports, 103. FAO, Rome.
Janssen, C.R., 1973. Local and regional pollen deposition. In: Birks, H.J.B., West, R.G. (Eds.),Quaternary Plant Ecology, The 14th Symposium of the British Ecological Society.28–30 March 1972. University of Cambridge, Oxford, pp. 31–42.
Janssen, C.R., 1981. Contemporary pollen assemblages from the Vosges (France). Rev.Palaeobot. Palynol. 33, 183–313.
Jenny, H., 1941. Factors of soil formation. A system of quantitative pedology, 281.Johnsen, S.J., Dahl-Jensen, D., Gundestrup, N., Steffensen, J.P., Clausen, H.B., Miller, H.,
Masson-Delmotte, V., Sveinbjörnsdottir, A.E., White, J., 2001. Oxygen isotope andpalaeotemperature records from six Greenland ice-core stations: Camp Century,Dye-3, GRIP, GISP2, Renland and NorthGRIP. J. Quat. Sci. 16, 299–307.
Johnston, K., Ver Hoef, J.M., Krivoruchko, K., Lucas, N., 2001. Using ArcGIStm GeostatisticalAnalyst, 300.
Kadereit, A., Kühn, P., Wagner, G.A., 2010. Holocene relief and soil changes in loess-covered areas of south-western Germany: the pedosedimentary archives ofBretten-Bauerbach (Kraichgau). Quat. Int. 222, 96–119.
Kels, H., 2007. Bau und Bilanzierung der Lössdecke am westlichen Niederrhein. Heinrich-Heine-Universität Düsseldorf, Düsseldorf.
Kohfeld, K.E., Harrison, S.P., 2001. DIRTMAP: the geological record of dust. Earth Sci. Rev.54, 81–114.
Kohler, T.A., Johnson, C.D., Varien, M., Ortman, S., Reynolds, R.L., Kobti, Z., Cowan, J., Kolm,K., Smith, S., Yap, L., 2007. Settlement ecodynamics in the prehispanic Central Mesa
Verde region. In: Kohler, T.A., van der Leeuw, S.E. (Eds.), The Model-based Archaeol-ogy of Socionatural Systems. School for Advanced Research Press, Santa Fe,pp. 61–104.
Kukla, G.J., 1977. Pleistocene Land— Sea Correlations I. Europe. Earth Sci. Rev. 13, 307–374.Lagacherie, P., McBratney, A., Voltz, M., 2007. Digital soil mapping — an introductory
perspective. Elsevier, Amsterdam (658 pp.).Lang, A., Hönscheidt, S., 1999. Age and source of colluvial sediments in Vaihingen/Enz,
Germany. Catena 38, 89–107.Lang, A., Wagner, G.A., 1996. Infrared stimulated luminescence dating of archaeosediments.
Archaeometry 38, 129–141.Lang, A., Bork, H.-R., Mäckel, R., Preston, N.J., Wunderlich, J., Dikau, R., 2003. Changes in
sediment flux and storage within a fluvial system: some examples from the Rhinecatchment. Hydrol. Process. 17, 3321–3334.
Lauer, F., Pätzold, S., Protze, J., Willbold, S., Gerlach, R., Amelung, W., 2013. Phosphorusstatus in archaeological arable topsoil relicts—is it possible to reconstruct conditionsfor prehistoric agriculture in Germany? Geoderma 207–208, 111–120.
Leopold, M., Hürkamp, K., Völkl, J., Schmotz, K., 2011. Black soils, sediments and browncalcic luvisols: a pedological description of a newly discovered neolithic ring ditchsystem at Stephansposching, Eastern Bavaria, Germany. Quat. Int. 243, 293–304.
Lichti-Federovich, S., Ritchie, J.C., 1967. Recent pollen assemblages from the westerninterior of Canada. Rev. Palaeobot. Palynol. 7, 297–344.
López Bayón, I., 2000. La recolonisation tardiglaciaire de la Belgique, L'Europe centrale etseptentrionale au Tardiglaciaire. Confrontation des modèles régionaux de peuplement.Association pour la promotion de la recherche archéologique en Ile-de-France, Nemours139–149.
Lüning, J., 2000. Steinzeitliche Bauern in Deutschland: die Landwirtschaft imNeolithikum.Habelt, Bonn.
Macaire, J.-J., Bellemlih, S., Di-Giovanni, C., De Luca, P., Visset, L., Bernard, J., 2002. Sedimentyield and storage variations in the Négron River catchment (south western ParisianBasin, France) during the Holocene period. Earth Surf. Process. Landf. 27, 991–1009.
Maier, A., 2012. The Central European Magdalenian. Spatial diversity and regionalvariability. (PhD thesis) University of Cologne, Cologne.
McBratney, A.B., Mendonça Santos, M.L., Minasny, B., 2003. On digital soil mapping.Geoderma 117, 3–52.
Merritt, W.S., Letcher, R.A., Jakeman, A.J., 2003. A review of erosion and sediment trans-port models. Environ. Model. Softw. 18, 761–799.
Mitasova, H., Hofierka, J., Zlocha, M., Iverson, L.R., 1996. Modelling topographic potentialfor erosion and deposition using GIS. Int. J. Geogr. Inf. Syst. 10, 629–641.
Morgan, R.P.C., Quinton, J.N., 2002. Erosion modeling. In: Harmon, R.S., Doe, W.W. (Eds.),Landscape Erosion and Evolution Modeling. Luwer Academic/Plenum Publishers,New York, pp. 117–144.
Mortensen, H., 1955. Die “quasinatürliche” Oberflächenformung als Forschungsproblem.Wiss. Z. Ernst Moritz Arndt Univ. Greifswald Math. Naturwiss 4, 625–628.
Mückenhausen, E., 1993. Die Bodenkunde und ihre geologischen, mineralogischen,geomorphologischen und petrologischen Grundlagen, 3rd edition. DLG-Verlag,Frankfurt am Main.
Münch, U., 2003. Überlegungen zur Quellenkritik als eingrenzender Faktor derArchäoprognose. Die Entwicklung und Bewertung von Prognosemodellen fürverschiedene Testgebiete im Land Brandenburg und ihre Anwendbarkeit in derBodendenkmalpflege. (PhD thesis) University of Bamberg, Bamberg.
Neimann, F., 1995. Stylistic variation in evolutionary perspective: inferences from decora-tive diversity and interassemblage distance in Illinois woodland ceramic assem-blages. Am. Antiq. 60, 7–36.
Niller, H., 1998. Prähistorische Landschaften im Lössgebiet bei Regensburg. Kolluvien,Auenlehme und Böden als Archive der Paläoumwelt, Regensburg.
Notebaert, B., Verstraeten, G., Rommens, T., Vanmontfort, B., Govers, G., Poesen, J., 2009.Establishing a Holocene sediment budget for the river Dijle. Catena 77, 150–163.
Notebaert, B., Verstraeten, G., Ward, P., Renssen, H., Van Rompaey, A., 2011. Modeling thesensitivity of sediment and water runoff dynamics to Holocene climate and land usechanges at the catchment scale. Geomorphology 126, 18–31.
NRW State Agency for Nature Environment and Consumer Protection, 2010. Klima undKlimawandel in Nordrhein-Westfalen - Daten und Hintergründe.
Paas, W., 1961. Rezente und fossile Böden auf niederrheinischen Terrassen und derenDeckschichten. Eiszeit. Gegenw. 12, 165–230.
Pécsi, M., Richter, G., 1996. Löss: Herkunft - Gliederung - Landschaften. Stuttgart, Berlin.Peeters, I., Rommens, T., Verstraeten, G., Govers, G., Van Rompaey, A., Poesen, J., Van Oost,
K., 2006. Reconstructing ancient topography through erosion modelling. Geomor-phology 78, 250–264.
Phillips, J.D., 2001. Contingency and generalization in pedology, as exemplified bytexture-contrast soils. Geoderma 102, 347–370.
Pindyck, R.S., Rubinfeld, D.L., 2005. Mikroökonomie. Pearson Studium. Addison Wesley,München.
Poltowicz, M., 2006. The Magdalenian in Poland and neighbouring areas. ArchaeologiaBaltica 7, 21–28.
Preston, N., 2001. Geomorphic response to environmental change: the imprint ofdeforestation and agricultural land use on the contemporary landscape of the PleiserHügelland, Bonn, Germany. Rheinische Friedrich-Wilhelms Universität Bonn, Bonn.
Preuß, J., 1998. Das Neolithikum in Mitteleuropa. Kulturen –Wirtschaft – Umwelt vom 6.Bis 3. Jahrtausend v. u. Z. – Übersichten zum Stand der Forschung. Beier & Beran,Weissbach (700 pp.).
Reiß, S., Dreibrodt, S., Lubos, C.C.M., Bork, H.-R., 2009. Land use history and historical soilerosion at Albersdorf (northern Germany) — ceased agricultural land use after thepre-historical period. Catena 77, 107–118.
Renard, K.G., Foster, G.R., Weesies, G.A., McCool, D.K., Yoder, D.C., 1997. Predicting soilerosion by water: a guide to conservation planning with the Revised Universal SoilLoss Equation (RUSLE). Agric. Handbook, 703. U.S. Dept. of Agriculture.
48 M. Schlummer et al. / Earth-Science Reviews 131 (2014) 22–48
Rohdenburg, H., 1971. Einführung in die klimagenetische Geomorphologie. Lenz, Giessen(350 pp.).
Rohdenburg, H., Meyer, B., 1966. Zur Feinstratigraphie und Paläopedologie desJungpleistozäns nach Untersuchungen an südniedersächsischen und nordhessischenLössprofilen. Mitt. Dtsch. Bodenkundlichen Ges. 5, 1–137.
Rommens, T., Verstraeten, G., Poesen, J., Govers, G., Van Rompaey, A.J.J., Peeters, I., Lang, A.,2005. Soil erosion and sediment deposition in the Belgian oess belt during theHolocene: establishing a sediment budget for a small agricultural catchment. TheHolocene 15, 1032–1043.
Rommens, T., Verstraeten, G., Bogman, P., Peeters, I., Poesen, J., Govers, G., Van Rompaey,A., Lang, A., 2006. Holocene alluvial sediment storage in a small river catchment inthe loess area of central Belgium. Geomorphology 77, 187–201.
Rousseau, D.-D., Sima, A., Antoine, P., Hatté, C., Lang, A., Zöller, L., 2007. Link betweenEuropean and North Atlantic abrupt climate changes over the last glaciation. Atlantic34, 1–6.
Sauer, D., Sponagel, H., Sommer, M., Giani, L., Jahn, R., Stahr, K., 2007. Podzol: a review onits genesis, occurrence, and functions. J. Plant Nutr. Soil Sci. 170, 581–597.
Sayre, N.F., Di Vittorio, A.V., 2009. General: scale. In: Kitchen, R., Thrift, N. (Eds.), The Inter-national Encyclopedia of Human Geography. Elsevier, St. Louis, pp. 19–28.
Schalich, J., 1981. Boden- und Landschaftsgeschichte in der westlichen NiederrheinischenBucht. Fortschr. Geol. Rheinl. Westfalen 29, 505–518.
Scheffer, F., Schachtschabel, P., 2010. Lehrbuch der Bodenkunde. Spektrum, Heidelberg.Scheibe, R., 2003. Landschaftsentwicklung und Besiedlung in der Donauebene und im
Falkensteiner Vorwald - eine Analyse von Geoarchiven und historischenÜberlieferungen, Regensburger Beiträge zur prähistorischen Archäologie, Volume10. Universitätsverlag, Regensburg.
Schönhals, E., Rohdenburg, H., Semmel, A., 1964. Ergebnisse neuerer Untersuchungen zurWürmlöß-Gliederung in Hessen. Eiszeit. Gegenw. 15, 199–206.
Seelos, K., Sirocko, F., Dietrich, S., 2009. A continuous high-resolution dust record for thereconstruction of wind systems in central Europe (Eifel, Western Germany) overthe past 133 ka. Geophys. Res. Lett. 36.
Seidel, J., Mäckel, R., 2007. Holocene sediment budgets in two river catchments in theSouthern Upper Rhine Valley, Germany. Geomorphology 92, 198–207.
Shennan, S., 2007. The spread of farming into Central Europe and its consequences. In:Kohler, T.A., van der Leeuw, S.E. (Eds.), The Model-based Archaeology of SocionaturalSystems. School for Advanced Research Press, Santa Fe, pp. 141–155.
Shiel, R.S., 2006. Nutrient flows in pre-modern agriculture in Europe. In: McNeill, J.R.,Winiwarter, V. (Eds.), Soils and Societies: Perspectives From Environmental History.White Horse Press, Isle of Harris, pp. 217–242.
Smalley, I.J., Kumar, R., O'Hara Dhand, K., Jefferson, I.F., Evans, R.D., 2005. The formation ofsilt material for terrestrial sediments: particularly loess and dust. Sediment. Geol.179, 321–328.
Stäuble, H., 2002. Lineare Gräben und Grubenreihen in Nordwestsachsen: Eine Übersicht.Arbeits Forschungsberichte Sächsischen Bodendenkmalpflege 44, 9–49.
Stobbe, A., 2008. Palynological and archaeological data — a comparative approach. In:Posluschny, A., Lambers, K., Herzog, I. (Eds.), Layers of perception. Proceedings ofthe 35th International Conference on Computer Applications and QuantitativeMethods in Archaeology (CAA). Berlin, Germany, April 2-6, 2007. Kolloquien zurVor- und Frühgeschichte, Vol. 10. Dr. Rudolf Habelt GmbH, Bonn.
Stolz, C., 2011. Budgeting soil erosion from floodplain sediments of the central RhenishSlate Mountains (Westerwald), Germany. The Holocene 21, 499–510.
Struck, W., 1984. Schlitzgräbchen im Kaiserstuhlgebiet. Archäologische Inf. 7, 13–17.Stuut, J.B., Smalley, I.J., O'Hara-Dhand, K., 2009. Aeolian dust in Europe: African sources
and European deposits. Quat. Int. 198, 234–245.Sugita, S., 2007. Theory of quantitative reconstruction of vegetation. II. All you need is
LOVE. The Holocene 17, 243–257.
Tüxen, R., 1956. Die heutige potentielle natürliche Vegetation als Gegenstand derVegetationskartierung. Angew. Pflanzensoz. 13, 5–42.
van der Leeuw, S.E., Costanza, R., Aulenbach, S., Brewer, S., Burek,M., Cornell, S., Crumbley, C.,Dearing, J.A., Downy, C., Graumlich, L.J., Heckbert, S., Hegmon, M., Hibbard, K., Jackson,S.T., Kubiszewski, I., Sinclair, P., Sorlin, S., Steffen, W., 2011. Toward an integratedhistory to guide the future. Ecol. Soc. 16 (2). http://dx.doi.org/10.5751/ES-04341-160402.
van Hooff, P.P.M., Jungerius, P.D., 1984. Sediment source and storage in small watershedson the Keuper Marls in Luxembourg, as indicated by soil profile truncation and thedeposition of colluvium. Catena 11, 133–144.
Van Oost, K., Govers, G., Desmet, P.J.J., 2000. Evaluating the effects of changes in landscapestructure on soil erosion by water and tillage. Landsc. Ecol. 15, 579–591.
Van Rompaey, A., Verstraeten, G., Van Oost, K., Govers, G., Poesen, J., 2001. Modellingmean annual sediment yield using a distributed approach. Earth Surf. Process.Landf. 26, 1221–1236.
Vandenberghe, J., 2013. Grain size of fine-grainedwindblown sediment: a powerful proxyfor process identification. Earth Sci. Rev. 121, 18–30.
Vandenberghe, J., Nutgeren, G., 2001. Rapid climatic changes recorded in loess succes-sions. Glob. Planet. Chang. 28, 1–9.
Vandenberghe, J., Mücher, H.J., Roebroeks, W., Gemke, D., 1985. Lithostratigraphy andpalaeoenvironment of the Pleistocene deposits at Maastricht-Belvédère, southernLimburg, The Netherlands. Med. Rijks Geol. Dienst. 39, 7–29.
Verstraeten, G., 2006. Regional scale modelling of hillslope sediment delivery with SRTMelevation data. Geomorphology 81, 128–140.
Wagenet, R.J., 1998. Scale issues in agroecological research chains. Nutr. Cycl. Agroecosyst.50, 23–34.
Ward, P., van Balen, R.T., Verstraeten, G., Renssen, H., Vandenberghe, J., 2009. The impactof land use and climate change on late Holocene and future suspended sedimentyield of the Meuse catchment. Geomorphology 103, 389–400.
Wendt, K.P., Hilpert, J., Zimmermann, A., 2012. Landschaftsarchäologie III. Untersuchungenzur Bevölkerungsdichte der vorrömischen Eisenzeit, derMerowingerzeit undder spätenvorindustriellen Neuzeit an Mittel- und Niederrhein. Ber. Römisch-GermanischenKomission 91, 217–338.
Werner, B.T., 1999. Complexity in natural landform patterns. Science 284, 102–104.Widlok, T., Aufgebauer, A., Bradtmöller, M., Dikau, R., Hoffmann, T., Kretschmer, I.,
Panagiotopoulos, K., Pastoors, A., Peters, R., Schäbitz, F., Schlummer, M., Solich, M.,Wagner, B., Weniger, G.-C., Zimmermann, A., 2012. Towards a theoretical frameworkfor analyzing integrated socio-environmental systems. Quat. Int. 274, 259–272.
Young, O.R., 1994. The problem of scale in human/environmental relationships. Journal ofTheoretical Politics 6 (4), 429–447.
Zhang, X.Y., Drake, N.A., Wainwright, J., 2004. Scaling Issues in Environmental Modelling,Environmental Modelling. Finding Simplicity in Complexity. John Wiley & Sons, Ltd.319–334.
Zimmermann, A., Richter, J., Frank, T., Wendt, K.P., 2004. Landschaftsarchäologie II.Überlegungen zu Prinzipien einer Landschaftsarchäologie. Ber. Römisch-GermanischenKommission 85, 37–95.
Zimmermann, A., Meurers-Balke, J., Kalis, A.J., 2005. Das Neolithikum im Rheinland. Bonn.Jahrb. 205, 1–63.
Zimmermann, A., Wendt, K.P., Frank, T., Hilpert, J., 2009. Landscape archaeology in CentralEurope. Proc. Prehist. Soc. 75, 1–53.
Zöller, L., 2010. New approaches to European loess: a stratigraphic andmethodical reviewof the past decade. Cent. Eur. J. Geosci. 2, 19–31.
Related Documents