Energy Research and Development Division FINAL PROJECT REPORT From Past to Future of Home Energy Applying History and a “What-If” Sandbox to Inform Energy Systems Transitions Gavin Newsom, Governor September 2020 | CEC-500-2020-067

Welcome message from author
This document is posted to help you gain knowledge. Please leave a comment to let me know what you think about it! Share it to your friends and learn new things together.
Transcript
Energy Research and Development Division
FINAL PROJECT REPORT
From Past to Future of Home Energy Applying History and a “What-If” Sandbox to Inform Energy Systems Transitions
Gavin Newsom, Governor
September 2020 | CEC-500-2020-067

PREPARED BY:
Primary Authors:
Mithra Moezzi, Ph.D.
Aaron Ingle
Loren Lutzenhiser, Ph.D.
QQForward
San Rafael, California
www.qqforward.com
Contract Number: EPC-15-081
PREPARED FOR:
California Energy Commission
Susan Wilhelm, Ph.D.
Project Manager
Jonah Steinbuck, Ph.D.
Office Manager
ENERGY GENERATION RESEARCH OFFICE
Laurie ten Hope
Deputy Director
ENERGY RESEARCH AND DEVELOPMENT DIVISION
Drew Bohan
Executive Director
DISCLAIMER
This report was prepared as the result of work sponsored by the California Energy Commission. It does not necessarily
represent the views of the Energy Commission, its employees, or the State of California. The Energy Commission, the
State of California, its employees, contractors, and subcontractors make no warranty, express or implied, and assume
no legal liability for the information in this report; nor does any party represent that the uses of this information
will not infringe upon privately owned rights. This report has not been approved or disapproved by the California
Energy Commission, nor has the California Energy Commission passed upon the accuracy or adequacy of the infor-
mation in this report.

i
ACKNOWLEDGEMENTS
The authors thank and acknowledge everyone who helped with this project, including:
Kathleen Ave, Sylvia Bender, Joshua Binus, Carl Blumstein, Martha Brook, Christina Brunsvole,
Miguel Cerrutti, Kathryn Checkley, Troy Dorai, Pamela Doughman, Jae Edmonds, Nick Fugate,
Cary Garcia, Peng Gong, Tom Gorin, Andrea Gough, Arnulf Grübler, Siva Gunda, Jeff Harris
(NEEA), Jason Harville, You Hu, David Hungerford, Mike Jaske, Dan Kammen, Chris Kavalec,
Michael Kenny, Alan Lee, Erik Lyon, John Mathias, Brian McCullough, Rachel McDonald, James
McMahon, Shuba Raghavan, Alan Sanstad, Jordan Scavo, Margaret Sheridan, Abaratname
Thamilseran, Mitch Tian, Edward Vine, Max Wei, Malachi Weng-Gutierrez, and Sonya Ziaja.
The authors also thank contract manager Susan Wilhelm for her exceptional guidance
throughout this project. Mithra Moezzi would like to acknowledge Sy Goldstone, formerly of the
California Energy Commission, for the great wisdom, support, and encouragement he gave for
the research presented here and over many years leading up to it.
ii
PREFACE
The California Energy Commission’s (CEC) Energy Research and Development Division
supports energy research and development programs to spur innovation in energy efficiency,
renewable energy and advanced clean generation, energy-related environmental protection,
energy transmission and distribution and transportation.
In 2012, the Electric Program Investment Charge (EPIC) was established by the California
Public Utilities Commission to fund public investments in research to create and advance new
energy solutions, foster regional innovation and bring ideas from the lab to the marketplace.
The CEC and the state’s three largest investor-owned utilities—Pacific Gas and Electric
Company, San Diego Gas & Electric Company and Southern California Edison Company—were
selected to administer the EPIC funds and advance novel technologies, tools, and strategies
that provide benefits to their electric ratepayers.
The CEC is committed to ensuring public participation in its research and development
programs that promote greater reliability, lower costs, and increase safety for the California
electric ratepayer and include:
• Providing societal benefits.
• Reducing greenhouse gas emission in the electricity sector at the lowest possible cost.
• Supporting California’s loading order to meet energy needs first with energy efficiency
and demand response, next with renewable energy (distributed generation and utility
scale), and finally with clean, conventional electricity supply.
• Supporting low-emission vehicles and transportation.
• Providing economic development.
• Using ratepayer funds efficiently.
From Past to Future of Home Energy is the interim report for the Historical Insights for
Technology Adoption Scenarios in California and Flexible Energy Demand Modeling for
Residential Air Conditioning with Improved Behavioral Specificity project (Contract Number
EPC-15-081) conducted by QQForward/Ghoulem Research. The information from this project
contributes to the Energy Research and Development Division’s EPIC Program.
For more information about the Energy Research and Development Division, please visit the
CEC’s research website (www.energy.ca.gov/research/) or contact the CEC at 916-327-1551.
iii
ABSTRACT
California has ambitious goals for a rapid energy transition to help slow climate change, while
managing the effects of climate change itself. The goals call for an overhaul of energy supply
and major changes to energy demand technologies that would transform how society uses
energy, involving entire systems of people, technology, and practices. Planning for this scale
and scope of change requires tools, frameworks, and knowledge different from those
developed for energy efficiency.
This exploratory research project focuses on three contributions for planning this transition
developed for the realm of household energy use. The first is SIMSAND, a user-oriented
simulation tool (a “sandbox”) for exploring future energy scenarios for California households,
implemented for space cooling. SIMSAND uses agent-based modeling to represent energy use
diversity and dynamic technical-environmental-behavioral interactions within households.
Users can model various “What if” scenarios resolved by coordinating multiple data streams
intersecting at the household level. SIMSAND was developed at a proof-of-concept level.
Second, the project highlights a need for shifting transition scenarios to better capture how
technology and social changes unfold in the real world. Developing and exploring these
scenarios would help planning and research go beyond “Could we do this?” to consider crucial
“What if?,” “Should we?,” and “How to?” questions reflecting the scale of climate change
challenges and ambitions.
Third, the project analyzes histories of household energy demand technologies, considering
their implications for climate-focused technology policies. The analysis illustrates observed
patterns in real-world technology change that contrast from idealized projections. These
histories can help construct more realistic scenarios which in turn can be addressed by tools
such as SIMSAND.
This combination of history, scenario development, and modeling capabilities allows energy
transition planners to explore possible futures using a broader range of available evidence—a
breadth needed given the scale and scope of climate change.
Keywords: energy systems, agent-based modeling, energy technology history, climate
change planning, scenario development, energy forecasting, air conditioning
Please use the following citation for this report:
Moezzi, Mithra, Aaron Ingle, and Loren Lutzenhiser. 2020. From Past to Future of Home
Energy: Applying History and a What-If Sandbox to Inform Energy Systems
Transitions. California Energy Commission. Publication Number: CEC-500-2020-067.


v
TABLE OF CONTENTS
Page
ACKNOWLEDGEMENTS ......................................................................................................... i
PREFACE ............................................................................................................................ ii
ABSTRACT ......................................................................................................................... iii
TABLE OF CONTENTS ......................................................................................................... v
LIST OF FIGURES ............................................................................................................. vii
LIST OF TABLES .............................................................................................................. viii
EXECUTIVE SUMMARY ........................................................................................................1
Introduction .....................................................................................................................1
Project Purpose ................................................................................................................1
Project Approach ..............................................................................................................3
Project Results .................................................................................................................3
Technology/Knowledge Transfer .......................................................................................5
Benefits to California ........................................................................................................5
CHAPTER 1: Negotiating the Energy Systems Transitions Ahead ............................................7
Adapting Existing Perspectives and Tools ...........................................................................7
Scope and Boundaries .................................................................................................... 10
Chapter Summary .......................................................................................................... 10
Sections by Main Interest ............................................................................................... 10
CHAPTER 2: Home Energy Technology and Energy Efficiency Histories ................................ 11
From Past to Future Transitions ...................................................................................... 11
Piecing Together History of the Energy Efficiency Field ..................................................... 12
High Level Histories of Residential Energy Efficiency ......................................................... 13
Case Histories of Residential Energy Technologies ............................................................ 21
Lighting ...................................................................................................................... 21
Refrigerators ............................................................................................................... 24
Clothes Dryers ............................................................................................................. 28
Smart Homes .............................................................................................................. 30
Continuing Histories ....................................................................................................... 33
Chapter Summary .......................................................................................................... 33
CHAPTER 3: Applying Energy Technology History ............................................................... 35
Lessons from History of Technology and Energy Social Sciences Scholarship...................... 35
vi
1: Technologies in the Home Co-Evolve with Systems Outside the Home ........................ 35
2: New Technologies and Innovations Create Needs as Much as Serve Them .................. 37
3: The Best Technology Does Not Necessarily Win ........................................................ 40
4: Old Technologies Persist Alongside New Ones and Could Make Comebacks ................. 42
5: Growth in House Size Increases Energy Use .............................................................. 43
Lessons from Energy Efficiency Program and Policy History .............................................. 44
1: Energy Efficiency Does Not Necessarily Track Energy Consumption ............................ 44
2: Energy Models Can Create Important Blind Spots ...................................................... 46
3: Energy Efficiency Assumptions Can Be Too Optimistic ................................................ 47
4: Consumers Sometimes Dislike or Reject Energy Efficiency Offerings ........................... 48
5: Nonenergy Effects of Energy Efficiency Can Cause Problems ...................................... 48
6: Efficiency is not an Unlimited Resource for Absolute GHG Reductions ......................... 50
Making History Relevant and Accessible ........................................................................... 51
CHAPTER 4: Scenarios in Theory and Practice .................................................................... 53
Introduction to Energy Scenarios and Their Purposes ....................................................... 53
California Modeling Studies That Have Used Scenarios...................................................... 55
California Fourth Climate Change Assessment Impact Studies ........................................... 56
California Energy Demand Model and IEPR Forecast Analysis ............................................ 56
CPUC Energy Efficiency Potential and Goals Studies ......................................................... 57
CEC EPIC Long-Term Energy Scenarios Studies ................................................................ 58
California Modeling Results ............................................................................................. 59
Looking More Closely at Scenarios and Models ................................................................. 61
A Framework for Understanding the Uses of Scenarios ..................................................... 63
Scenarios and Histories ................................................................................................... 68
CHAPTER 5: SIMSAND, a What-If Sandbox Proof-of-Concept ............................................... 69
What-If Simulation Sandbox Concept............................................................................... 69
SIMSAND for Cooling ...................................................................................................... 70
Modeling Cooling Energy Use in SIMSAND ....................................................................... 71
Modeling Change Processes and Interventions in SIMSAND .............................................. 73
Exploring Uncertain Futures with SIMSAND ...................................................................... 74
How Well Do SIMSAND Outputs Represent Historical and Current Realities? ...................... 76
SIMSAND Application: Heat Pumps for Heating (and Cooling) ........................................... 76
SIMSAND Next Steps and Future Potentialities ................................................................. 80
Getting Users' Hands in the Sand .................................................................................... 80
vii
Data Nexus at the Household and House Level ................................................................ 83
Technical Improvements to the SIMSAND Platform .......................................................... 84
SIMSAND Platform Directions and Applications ................................................................. 85
Chapter Summary .......................................................................................................... 86
CHAPTER 6: Conclusions and Continuation ......................................................................... 87
Research Activities Completed ......................................................................................... 87
Research Conclusions for Energy Transition Planning........................................................ 88
Implications, New Questions, and Recommended Research Activities ................................ 89
Attracting SIMSAND/Sandbox Use ................................................................................... 89
Data Coordination .......................................................................................................... 89
Trend and History Curation ............................................................................................. 90
Scenario Development, Testing, and Deliberation ............................................................. 90
Strategic Options for Cooling........................................................................................... 91
Final Words ................................................................................................................... 93
LIST OF ACRONYMS .......................................................................................................... 94
REFERENCES .................................................................................................................... 95
APPENDIX: Policy and Environmental Context ................................................................... A-1
LIST OF FIGURES
Page
Figure 1: Positioning the Research in the Landscape of California Energy Futures ...................9
Figure 2: Trends in Estimated Presence of Second Refrigerators and Separate Freezers in
California Households ........................................................................................................ 25
Figure 3: Electricity Use in New United States Refrigerators, 1947–2001 .............................. 27
Figure 4: United States Refrigerator Shipment Weighted Average Energy Consumption, Price,
and Volume of New Shipments, 1990—2015 ....................................................................... 28
Figure 5: Key Elements of SIMSAND................................................................................... 72
Figure 6: Simulated Transitions in Annual HP Installations and Primary Electric Heating in
Homes ............................................................................................................................. 78
Figure 7: Simulated Trends for Four Different Metrics and House-Type Groups for Heat Pump
Transition Scenarios .......................................................................................................... 81
Figure A-1: History of Energy Consumption in the United States, 1775-2009 ..........................4

viii
Figure A-2: Trends in Residential Energy Use Per Capita for California ....................................5
Figure A-3: California Energy Sources for All Sectors, 2016 ....................................................6
Figure A-4: California Energy Consumption by End-Use Sector, 2016 .....................................6
Figure A-5: Trends in Heating Fuel Use in California Households ............................................7
Figure A-6: Average Retail Price of Electricity in California (annual), in cents/kWh ...................8
Figure A-7: Residential Sector Energy Consumption by End Use and Energy Source in California
Households (2015) ............................................................................................................ 10
LIST OF TABLES
Page
Table 1: California Energy Efficiency Historical Trends and Themes ...................................... 15
Table 2: Lessons from History of Technology and Energy Social Sciences Perspectives .......... 36
Table 3: Historical Lessons from an Energy Efficiency Perspective ........................................ 45
Table 4: Scenario Questions, Purposes, and Models ............................................................ 64
Table 5: Other Possible Scenarios for Simulation Using SIMSAND......................................... 66
Table 6: New Possibilities Enabled in a "What if" Simulation Sandbox ................................... 70
Table 7: Space Cooling Scenarios Preconfigured in SIMSAND ............................................... 75
Table 8: Five Heat Pump Replacement Scenarios Compared in the Test Case ....................... 78
Table 9: Some Possible User Types and Use Cases for the SIMSAND Platform .......................... 82

1
EXECUTIVE SUMMARY
Introduction California is faced with a changing climate. Weather patterns are more variable, bringing
hotter days and nights, noticeable shifts in the natural environment, and even major changes
to expectations about energy provision such as the extended planned power shutoffs for fire
safety experienced in 2019. These climate-related changes tax daily life for many Californians,
and strain energy systems at all levels, from individual homes to regional levels and beyond.
On the policy front, the state is pursuing an ambitious and rapid transition toward a
decarbonized energy system to reduce the rate of greenhouse gas emissions that contribute to
global climate change and the localized effects of that change. This decarbonized energy
system will involve extensive changes in energy sources and how energy is used. The
changing climate and the policies implemented to address it will have major effects on
California, including inside people’s homes.
Planning and executing an energy transition of this scale and scope is new territory for any
government. New types of information, processes, tools, and frameworks are required to
improve, complement, or replace those that were developed for different problems and under
earlier limits of experience and data. New data, new personnel, and advances in
communication, knowledge, and computational power are available to create innovative
approaches and solutions.
In response to these changes, California has been revising its energy planning arsenal. These
revisions respond to differences between climate change goals and those from when energy
efficiency was the primary focus. Absolute reductions in air pollution emissions are now the
policy goal, versus approaches optimized for improving end use efficiency. Renewable energy
sources have become more common and are slated to dominate electricity supply. Renewables
provide an essential component of decarbonization, but lack the stability and flexibility benefits
of fossil fuels. This change raises challenges for electricity reliability, as do risks to energy
infrastructure posed by wildfire, drought, and extreme weather. These problems and any
solutions reach deep into society. Energy transitions are social transitions at least as much as
technical ones. The work required to plan accordingly is still in its early stages.
Project Purpose This research project seeks paths for better representations, processes, and tools for
considering “the real world,” including the role of people, in the energy transition ahead. The
project was motivated by recognizing that current transition planning focuses on technology
innovation and deployment primarily within the narrow bounds of evaluating technology
penetration. This framework fails to systematically consider how technology becomes
integrated into society or the potential consequences of technology change beyond the direct
emissions and energy use impacts expected.
There are major scientific and policy challenges to incorporating this broader, more realistic
view. Energy use varies in amount and nature across users, time, and circumstances.
Aggregated and averaged approaches, common in the past, miss this variation. Interactions
and dependencies can be difficult to notice or quantify, so they may be treated as if they do
2
not exist. Strategies to take this socio-technical “system” nature of energy use into
consideration, along with the uncertainties it highlights, are not yet well developed. But
building blocks for progress are in place.
This project, funded through an exploratory grant, contributes to the groundwork for progress
on tools and knowledge for residential energy technology transitions. There are three main
components of this research. The first is a proof-of-concept simulation sandbox for residential
energy use that draws together multiple streams of quantitative empirical data, along with
diverse projections of climate, demographics, and other aspects of the future world. Called
SIMSAND (short for “simulation sandbox”), it is an agent-based simulation platform designed
to help detailed speculation on the future of residential energy demand in a quick and flexible
package that can be used by planners and researchers. SIMSAND’s ability to interact granular
data at the household level presents an advance over more static and averaged modeling
options, more closely reflecting the micro-dynamics that determine household energy use
profiles and how they change. It allows users to examine the distributions of these effects,
and to specify and test a broad range of scenarios, including those reflecting “What if?”
questions about the future.
Beyond its quantitative output, SIMSAND is a conceptual structure around which modeling
possibilities, demands, uncertainties, data use, and data coordination for transition planning
can be discussed. It can focus on local geographies or the entire state (and everything in
between). And it can examine results for groups such as disadvantaged communities, low-
income households, or rural areas. SIMSAND was implemented for air conditioning but can be
expanded to other energy uses. It can also be expanded to incorporate other energy system
dimensions or refinements, such as indoor temperature estimates or coordination with
electricity supply.
The second and third project components link with this modeling capability. One component
focuses on recent histories of energy demand technologies in California homes, along with
related energy efficiency history. These histories are hardly visible in contemporary energy
policy debates. But they are important because they provide a markedly different picture of
how technology change takes place than do smooth models of technology deployment.
Experience and insights drawn from these histories can be applied to planning for future
technologies, including for pursuing energy climate goals with a broader lens. For example,
starting with an understanding of how central air conditioning became normal over a few
decades, what range of possibilities are there for efficient, resilient cooling in a hotter future?
The final component addresses energy technology scenario development and interpretation.
This is an increasingly visible topic in climate change planning in international forums. After
outlining current activities in California energy demand technology planning, the analysis
considers how expanded scenario development could take fuller advantage of historical
experience (second component), and of detailed data on the structure and diversity of
household energy demand (first component) to support a more robust climate technology
planning process. The historical work provides a basis to imagine scenarios that more
realistically capture patterns and possibilities observed in past technology transitions.
SIMSAND or similar models, designed to represent these more realistic elements and patterns,
can be used to resolve these scenarios.

3
The primary audiences for these products are planners, researchers, technology developers,
and program implementers involved in energy transition planning, whether at state or local
scales. SIMSAND was implemented for residential air conditioning because of air conditioning’s
importance to energy technology planning. At present, air conditioning plays a modest role—8
percent—in California’s residential energy use. But it takes a critical role in demand and energy
system reliability, accounting for half of the residential peak demand in the state. The hotter
weather that comes with climate change will increase needs for cooling even in places that
have historically used little air conditioning, exacerbating peak demand. But doing without
cooling can harm health and well-being, especially for vulnerable populations. The modeling
approach provided by SIMSAND, which allows assessment of various technology and other
management options across the great variety of households in the state, can help weigh
approaches to cooling California homes in terms of energy use, GHG emissions, burden on
disadvantaged communities, and other factors.
Project Approach The QQForward research team includes a sociologist, a systems modeler, and a
statistician/social scientist, all with extensive experience in the field of buildings and energy. A
main impetus for this work has been producing findings and methods useful for policy that
carefully consider the real world, including the interactions between people, technology, and
environment at micro- and meso-scales—as distinguished from more idealized, smoothed, and
macro-scale worlds represented in most models and plans.
The research was conducted with the exploratory aspect of the funding in mind. This entailed
conversations with researchers, policy staff, and other professionals working at the California
Energy Commission, national laboratories, utilities, universities, and international research
centers, along with demonstrations of SIMSAND to Energy Commission staff. The work also
drew from review of current California planning projects and models in energy and climate
change, various sources on histories of energy technology and energy efficiency, on scenario
development, and on forecasting, and assessment of data sources for the exploratory
modeling achieved by SIMSAND.
Project Results The proof-of-concept implementation of SIMSAND for air conditioning, along with
conversations with prospective users, affirmed that a flexible “What if” model for testing
scenarios about residential energy technology futures is potentially useful in a variety of
contexts. As noted above, SIMSAND provides a platform for interacting multiple elements of
the energy system at granularity. The “What if” aspect allows consideration of how various
unknowns affect program and technology results, allowing questions such as, “What if only a
certain type of user adopts this technology?,” “What if the technology works only half as well
as expected?,” “What if the hottest climate predictions are correct?,” or “What if heat waves
and other factors drive a widespread rush to add and use central air conditioning?”
SIMSAND outputs include simulated household-level electricity consumption, cost, burden, and
access to air conditioning. Users can compare results across scenarios. In keeping with the
granularity of the input data, the tool also allows the user to examine how simulation output
values are distributed across households, such as how energy consumption and energy burden
may shift in disadvantaged communities (as defined by CalEnviroScreen) under specific
4
scenarios. Thus, SIMSAND can help in visualizing the mechanics and dynamics of transition,
including opportunities for localized solutions and consideration of equity across different
conditions.
SIMSAND is developed at a proof-of-concept level. Priority was given to developing a platform
that enabled qualitative exploration of relationships, trends, and impacts, given the limited
quality of data available for air conditioning response and the dated information available on
the energy characteristics of homes and households. SIMSAND has an adaptable structure that
can be adapted according to user interests, new emphases on particular interactions (e.g.
such as supply and demand), and improved data as they emerge. The platform coordinates
multiple different data streams and assumptions intersecting at the household level, including
the technical characteristics of homes, demographics, weather, and usage patterns. It can
thus serve as a data hub itself or be integrated with a larger hub coordinating and interacting
these data. This aligns it with the Energy Commission’s “energy data vision” for developing
strategic application of high-resolution data on energy use and usage patterns as this data
emerges.
SIMSAND implements several standard scenarios. The primary intent, however, is to accept
scenarios specified by users responding to topical questions as they emerge. SIMSAND was
tested with a series of “What if” scenario exploring an expanded use of electric heat pumps in
California homes for heating, and the implications of these additional heat pumps for air
conditioning energy use considering a variety of different metrics (such as cost burden to
households and energy use effects) and for various household sub-groups (such as
disadvantaged communities).
Along with a more empirically grounded understanding of the local and diverse expression of
technology change, and new data that permit modeling it, a refreshed level of scenario
development for energy transition is possible and valuable. New levels of scenario
development can help move modeling from an orientation to prediction toward “What if?”
questions that consider alternatives unfolding in different desirable or undesirable futures. This
expansion dovetails with recent calls for a more comprehensive national framework for climate
assessment. These adaptations have been ongoing. They are challenging, involving
negotiating a legacy of energy efficiency tools and procedures, and revising these to reflect
major differences in purposes, scopes, and scale of energy efficiency versus climate change
policy problems.
These changes in scenario construction and modeling, which can better represent
contingencies and variability, facilitate a new depth of intervention design, including comparing
outcomes and surprises in a simulation environment before implementing in the field. Some of
this is already done in existing efficiency processes and tools, but a lack of customized tools
hampers this process, including the ability to explore “How to?” alternatives — applicable in
statewide regulations and local program design, community initiatives, and climate change
adaptation plans. Besides these "How to?" questions, this modeling and the discussions that
surround it inform the “Should we?” questions about unintended consequences, distribution of
benefits and harms, and micro-impacts of policies.
5
Technology/Knowledge Transfer During this exploratory project, the research team held discussions with California Energy
Commission staff and with other researchers and planners, guiding the research presented
here. With the “What if” simulation sandbox SIMSAND demonstrated and other results
published, the intent is that such conversations will continue. The overall utility of SIMSAND
rests on how it and the concepts it incorporates are used and found useful. Similar models are
being solicited by the European Commission in its Horizon 2020 funding initiative, signaling
potential for broader engagement with these conceptual directions within the international
climate change planning community.
The energy technology histories covered in this project provide insights that market-driven
research has not addressed. Most generally these histories highlight the potential value of
turning planning questions around from “How can lifestyles accommodate given technology
goals?” and trying to get society to match, to instead asking “What sort of lifestyles can fit
climate change policy goals and climate risks, and what technologies might fit these lifestyles?”
To be useful, these histories must be visible, accessible, and interesting enough to spark
insights that help correct for overly optimistic or overly narrow frameworks on technology
change. This EPIC report goes part of the way in disseminating these histories.
Some stand-alone products are planned, including two journal papers, one on energy
technology histories and their implications, and one on scenario development and the
SIMSAND model. In addition, the authors’ completed contribution to California’s Fourth Climate
Change Assessment also drew from the research conducted in this EPIC project. The final
project briefing, held in November 2019, engaged CEC staff from three different divisions in
discussions about opportunities for further developing the use and usability of the simulation
sandbox concept and implementation. This would require the research team to remain in
contact with potential CEC users through established forums (for example, Integrated Energy
Policy Report proceedings and Energy Research & Development Ideas Exchange) toward
identifying cases where SIMSAND could efficiently help address existing needs. SIMSAND
could be used, for example, to facilitate data-driven analyses of the impact of various policies,
or of other factors such as climate change or differential technology adoption rates, on
residential demand. These results could also be used to examine how effects vary across
households in terms of demographic, energy, and environmental characteristics. As a flexible
modeling platform, SIMSAND would do this by enabling assimilation and use of several data
streams that can be easily updated as new questions and information emerge.
Benefits to California The project develops foundations to allow energy transition planners to improve their
understanding of how energy technologies are integrated into society, with what results, and
to recognize key contingencies. SIMSAND, now functioning at a proof-of-concept stage, can be
adapted to the priorities of a variety of users and use cases. It can provide a quick, light, and
flexible way to pursue “What if” questions about the future of residential energy technologies
as these questions arise, and without waiting to commission new models. This modeling
capability could be combined with advances in envisioning futures through new levels of
scenario development. SIMSAND also coordinates and interacts diverse data streams used in

6
state climate change and energy planning, extendable to upcoming data streams related to
household energy use.
This simulation tool, together with the results of historical analyses and the scenario development assessment, bring empirical data and the multiple disciplinary perspectives
together to better speak to questions that planners and researchers ask, or could ask, about the future of household energy use. The attention to heterogeneity in residential energy use
helps California assess equity, environmental justice, and the effects of policies or events on people as well as to aggregate emissions and energy use. Together these directions support
developing creative, effective pathways for a resilient and environmentally better energy future.
7
CHAPTER 1: Negotiating the Energy Systems Transitions Ahead
California has ambitious goals for transforming the state’s entire energy system to a
configuration that better contributes to slowing climate change and coping with climate
change impacts. This overall transition involves transitions in many components of the energy
system, including decarbonizing the electricity supply by shifting to renewable and other zero-
carbon energy sources, doubling energy efficiency savings through modifications to homes and
buildings, and electrifying transportation. Alongside these planned changes, climate change
itself changes the environment, including unprecedented patterns of hot weather, devastating
wildfires, and rapid loss of previous habitats and species. These planned and unplanned
changes will continue to have enormous effects on the people of California.
Focusing on the residential sector, this project explores three related approaches by which
people, and the variable and diverse world they create and inhabit, can be better considered in
planning future energy systems. These approaches contribute to moving beyond the narrower,
less data-rich analytic processes developed in the energy efficiency policy era. Those analyses
were keyed to the problems encountered in pursuing energy efficiency per se amidst the
constraints of that era. In contrast, in climate change policy:
1. Reducing absolute levels of greenhouse gas (GHG) emissions and energy use are at
issue, versus relative savings goals under energy efficiency;
2. Ambitions for the scale and pace of energy system changes are much bigger, so
evolving interactions, nonenergy effects, and distributional implications of these
changes must be explicitly considered;
3. Energy reliability challenges are greater, because of the planned substitution of
renewables for fossil fuels, and the new level of environmental risks posed by climate
change, such as extreme heat, wildfire, and threats to energy infrastructure.
These three pillars must be considered in conjunction with each other.
Adapting Existing Perspectives and Tools Technology is usually considered the key to achieving climate policy goals and resolving
associated energy problems. Technological policy solutions are designed and tested with
models, and depend on what these models assume, see, and omit. Facing climate change, the
analytical tools and processes used to develop technology-centered strategies must be
adapted to the new scale of ambitions, the wider scope of changes involved, the uncertainties
and types of surprises that may be encountered, changes in policy emphasis, and the wider
range of empirical data now available. This requires attention to how technology change
happens in the real world, including how society and technology interrelate.
Energy use does not occur as averages. That non-average nature is crucial to understanding
how change occurs, and with what effects. Energy planning tools and frameworks usually are
expressed in aggregate terms. This aggregation contrasts with the diversity of energy use

8
across the 13 million households in the state, and with the dynamics that this diversity creates.
Aggregation is appropriate for some purposes and is sometimes the best option given the
available data, uncertainties, and questions at hand. But it is poorly suited for thinking about
the “what if” and “how to” questions raised within the multidimensional, distributional, and
supply-demand coordination challenges of the scale, depth, and time horizon faced in climate
change planning.
Contrary to the expectation that deploying technologies in the real world yields the results
predicted in planning phases, history shows that technologies are often adopted more
unevenly and slowly than expected, and are sometimes rejected despite their assumed
benefits. Their trajectories can unfold in unpredicted ways, with consequences and spillover
effects that can counteract policy intent, exacerbate inequities, and create other problems. In
the meantime, the technological landscape of homes and society change independently of
energy policy for any number of reasons, with major effects on energy use. Insights and
lessons from history of residential energy technologies can help unpack these forces to better
illuminate risks, uncertainties, and the multiple layers of change. But these histories have
scarcely been visible.
The authors have argued that aggregated, averaged, and modeled characterizations of
household energy use have limited ability to resolve or anticipate changes in real energy use
systems, or to speculate on what might happen, where, and to whom (Lutzenhiser et al.,
2017). Now, with denser data, more information about covariance, relationships and
distributions, faster processing speeds, longer experience, wider professional expertise
available in the modern energy and climate policy domain, and increasing motivation to look at
multiple dimensions of a problem (such as GHG emissions and demand and energy poverty;
people and technology; health and energy), and at finer scales, more is possible. These
changes in data possibilities make the diversity, risk, and uncertainties inherent in energy
planning more explicit, while also providing a basis to create a more systems-oriented
approach to planning.
This project aims to contribute to the processes, tools, and analytical frameworks used for
planning residential energy transitions under climate change in California. The study is
exploratory, intended to prove out and adapt concepts and provide recommendations for
further action. Figure 1 sketches the overall vision. Because air conditioning is one of the most
important challenges in creating a resilient decarbonized energy system, the research pays
special attention to the air conditioning end use.
Three overlapping activities were completed. Starting from the most concrete, these are:
1. SIMSAND: The project developed an agent-based "What If" simulation sandbox concept
designed for exploring they dynamics of residential electricity consumption and its
change across California households (Chapter 5). It then produced a flexible and
expandable proof-of-concept implementation of this concept, limited to the air
conditioning end use. SIMSAND incorporates more of the diversity of residential energy
use than averages-based energy use models can. It can be used to explore “What if”
questions for policy, technology, environmental, and societal scenarios based on a
variety of potential storylines. The format allows users to coordinate a varied set of
interactions (among weather, equipment, and variation in household cooling behaviors),

9
and coordinates multiple streams of data, including climate and demographic
projections, and household-level technology and social data.
Figure 1: Positioning the Research in the Landscape of California Energy Futures
Source: QQForward, 2019 (created by Aaron Ingle).
2. Histories: The project analyzed recent histories of selected residential energy
technologies and their incorporation into society, including how they related to energy
efficiency policies. This work was based on published histories, limited primary source
material, and available quantitative data. The analysis illustrates the co-evolution of
technology and society, and the spillover effects of some planned technology changes.
These real-world effects often differ from what was anticipated in planning stages.
Chapter 2 provides a historical overview of recent residential energy technology change,
along with case studies for several specific technologies. Chapter 3 summarizes lessons
and implications from these histories.
3. Scenarios: The project examined current processes of energy scenario development
(Chapter 4), differentiating various types and purposes of scenarios, and analyzing
options for developing scenarios that better reflect how technology change has
occurred in the past than has been possible with existing forecasting and planning tools
that were developed for other purposes. Analysis was based on review of public
documents on state energy planning, interviews of energy planning staff and
researchers, and review of developing energy and climate change scenario and
modeling processes outside of California. SIMSAND or a similar model could help assess
these more complex scenarios.
Chapter 6 provides conclusions and recommendations for moving this work forward. The
Appendix presents overall policy background and some aggregate energy patterns.

10
Scope and Boundaries This research focuses on residential demand technologies, rather than on supply. It recognizes
that energy supply and demand are entwined, and that residential demand depends on
structures and processes outside of homes. It does not cover these processes in detail, nor the
details of policymaking, which are out of scope for this exploratory study.
Chapter Summary
• The energy-related problems and goals associated with climate change differ from
those that motivated energy efficiency policy, so tools, methods, and frameworks
reflecting those differences are needed to provide effective strategies for addressing
climate-related challenges.
• This exploratory research develops three foundations for energy transition planning
under climate change, focusing on the residential sector: a "What if" simulation
sandbox proof-of-concept designed to project energy futures taking the diversity of
household energy use and users into account; histories of residential energy technology
and energy efficiency; and new processes for developing scenarios tuned to the
problems faced by climate change policy.
Sections by Main Interest Please use the following guide to jump to the topics of most interest:
• Energy Technology History: Chapter 2, Chapter 3
• Scenario Development for New Policy Questions: Chapter 4, Chapter 6
• SIMSAND “What if” Simulation Sandbox: Chapter 5, Chapter 6
• Background and Recommendations: Chapter 1, Chapter 3, Chapter 6, Appendix
11
CHAPTER 2: Home Energy Technology and Energy Efficiency Histories
Knowledge of the past can help planners, researchers, and implementers understand how
future energy system change could occur. This chapter summarizes research on residential
energy use and efficiency program history (From Past to Future Transitions) and then covers
the history of selected home energy technologies and related efficiency efforts (Case Histories
of Residential Energy Technologies), focusing on California over the past four decades.
Chapter 3 summarizes insights from these histories that can be applied to planning the energy
system transition targeted in the state’s climate policy. Readers with specific interests can
jump to the topics of most interest as linked above.
Most energy efficiency professionals know something about energy technology history as
casual knowledge of their professional cultures. This familiarity is likely to be quite different
from an understanding drawn from a social scientific analysis of the energy past. In fact, little
detailed historical work on residential energy efficiency technologies or programs has even
been published. But for climate change planning, longer-term technology changes and
nonenergy effects of energy technologies are more relevant than they were in the efficiency
policy era. And there are over 40 years of efficiency efforts to learn from. Some of these
efforts are well-recorded in historical resources available through digital archives, making it
possible to construct histories, and to examine how they differ from energy efficiency’s
normative models of energy demand technology change. The histories provided in this chapter
are a beginning.
Some discussions below raise questions about how well energy efficiency has worked judged
with respect to how past efficiency approaches apply to climate change policy goals. These are
not an attack on efficiency, but a step to orienting existing efficiency and energy planning
practices to better align with climate goals.
From Past to Future Transitions Plans for an energy system transition of the scale that California is pursuing rest on
assumptions of technological progress, dissemination, and performance that may not be
achieved when expected, at the level projected, or even at all. There are major uncertainties
as to in which cases any new technology will be installed (versus assumed “average”
installations), how well it will work in place, and the effects of simultaneous and reactive
changes in energy and social systems. There are also tensions related to how the performance
of such technology might be judged. The implications of these sources of variability and
uncertainty may not be strategically acknowledged, in part because the issues at play are not
resolvable by dominant models. So models create particular blind spots when evaluating
technology strategies. The historical examples below highlight example patterns and
eventualities that are usually not reflected in technology planning models. Changes in how
long-term energy scenarios are developed and modeled could help better account for these
outcomes (Chapters 4 and 5).

12
Often, technology deployment scenarios start with imagining a technology that meets certain
criteria along with conditions under which this target technology will be installed. A
shortcoming to this mental model is that technology change almost always goes further than
substituting one device for another (Bijker, Hughes, and Pinch 1987; Kranzberg, 1986). The
energy system is a social system as much as a technical one. Users and technologies develop
together in ways that were not expected. Attributes overlooked in planning stages become
highly consequential. New technologies generate needs. Benefits originally anticipated may not
transpire or they may be counteracted. And potentially effective technologies can be rejected
due to cultural factors, competing technologies, or infrastructural incompatibilities. These
cannot be perfectly predicted. But a narrow focus on deploying technology as if into an inert
scene makes it difficult to anticipate, manage, and even acknowledge these effects. The
historical view taken in this chapter offers a recasting of energy transition, away from a focus
on achieving committed technology penetrations and toward imagining technology and society
as intimately and dynamically linked, opening a much wider range of opportunity for change.
Piecing Together History of the Energy Efficiency Field The energy efficiency field’s approach to assessing technology change has been dominated by
a focus on short-term changes seen under the specialized “looking glass” of energy programs
(Lutzenhiser, 2014; Shove, 2017). This has suited the immediate demands of program
planning and evaluation. But it ignores what happens outside these boundaries. For example,
because programs often run only a few years, program evaluation has not provided a long-
term perspective on the effects of technology change. Energy savings have usually been
calculated based on simple assumptions of what would have happened otherwise. Even the
focus on the calculability of energy efficiency benefits limits what can be achieved and seen,
as examples below illustrate.
Historical reviews are uncommon in the energy efficiency field (Hazas, Friday, and Scott,
2011), making it difficult to recognize recurring patterns or to argue their validity. So, energy
and climate change professionals have had limited choice for consulting critical histories of
residential energy demand technologies. Energy historians (Hirsh, 2011; Hirsh and Jones,
2014) and other energy researchers (Gismondi, 2018; Hazas, Friday, and Scott, 2011)1 argue
that more deliberate attention to history could help energy policy professionals think more
broadly about the future. This attention seems to be growing.
Some aspects of the history of energy have been well-explored outside of the efficiency field.
Most attention has been to supply, for example by historians (Hughes, 1983; Nye, 1999;
Scavo, 2015), anthropologists (Bakke, 2016), interdisciplinary scholars (Smil, 2016, 2018) and
even comparative literature scholars (Pinkus, 2016). There has been less attention to the
history of energy demand technologies, especially home energy technologies, including to how
people react, adapt, accept, and reject the technologies offered, and to how policy and
economy shape what technologies exist. There are important exceptions, where sociologists,
geographers, and anthropologists have studied the micro-dynamics of residential energy
technologies over history and how these matter for policy, for example, with respect to the
1 See also the open-access Journal of Energy History (http://www.energyhistory.eu/en) launched in 2018.
13
mechanisms by which energy demand escalates (Hitchings and Lee, 2008; Kuijer and Watson,
2017; Shove and Southerton, 2000; Wilhite, 2012).
Currently, the most visible energy history topic in the energy policy field focuses on the structure
of energy transitions, as a subtopic of general work on technology transitions. Arguing that
current energy systems are “unsustainable on all accounts of social, economic, and
environmental criteria” (Grübler, 2012; see also Kemp, 1994) and with respect to climate
change (Fouquet and Pearson, 2012; Shackley and Green, 2007), these scholars have taken
on the question of how energy systems have changed in the past. Again most of this work has
focused on energy supply (rather than demand), often taking a quantitative orientation
(Loorbach, Frantzeskaki, and Avelino, 2017; Geels, 2002; Fouquet and Pearson, 2012; Grübler,
2012; Sovacool, 2016). Particularly visible is the “Multi-Level Perspective” (MLP) for framing
how technology transitions take place in concert with changes in markets, users, and culture
(Geels, 2010). The MLP framework emphasizes the path-dependency of socio-technical
regimes, with investments and societal infrastructures co-evolving with technology, also
making transitions slow (Fuenfschilling and Truffer, 2014; Geels, 2010; Kemp, 1994) relative
to climate policy goals.
The transitions work has investigated more precisely how long technology change takes. The
answers are necessarily muddy, since they depend on what, where, and how a transition is
defined (Grübler et al. 2016). While transitions often take place over many decades or even
centuries, some happen in a decade or two (Sovacool, 2016; Sovacool and Geels, 2016). For
example, the presence of air conditioning in U.S. homes increased from 1 percent to 25
percent of homes in just 16 years, while in Brazil, flex-fuel vehicles represented 25 percent of
vehicle sales after just one year (Sovacool, 2016). Rapid transition may be more likely in
authoritarian countries or those willing to pursue strong intervention, and in small regions with
consensual policy styles such as in Northern Europe (Sovacool and Geels, 2016).
Research on narratives of the energy future, including on sociotechnical imaginaries (Ballo,
2015; Smith and Tidwell, 2016) and on using science fiction as a tool for energy and climate
change planning (Raven, 2017), offers concrete methods that help see energy transition as a
multidimensional set of societal changes versus as substituting in a set of smart or efficient
technologies. This approach could be applied to constructing scenarios in government-led
technology planning (see Chapter 4).
High Level Histories of Residential Energy Efficiency
Industry and Program Histories
California has played a central role in developing an energy efficiency industry. Rather than
energy efficiency being a static concept, over 45 years, the industry has adapted its
approaches to changing scientific, social, technical, and political conditions. Table 1
summarizes changing conditions by decade, from 1960 to 2019, focusing on the residential
sector. The motivating purpose argued for energy efficiency has shifted several times, from
managing energy shortages in the 1970s to market mechanisms for efficient energy use in the
1990s to GHG emissions reductions since the early 2000s. Various energy-related legislation
and events punctuate this history (second column from left in Table 1). Over this period, there
have also been shifts in how people are viewed in energy policies and programs (fourth
column, Table 1). The predominant view even today sees people as consumers who purchase

14
technologies that use energy to satisfy needs, making straightforward decisions regarding
costs and benefits, and who can be influenced by behavioral interventions.
In assessing its own history, the dominant players in the energy efficiency field have
highlighted successes (Alliance to Save Energy, 2013; EIA, 2015; Nadel, Elliott, and Langer,
2015; Rosenfeld and Poskanzer, 2009). These successes are expressed in conventions based
on the engineering foundation of efficiency and the decades of energy efficiency programs
that evolved from this foundation. The examples in the next section illustrate how much
success depends on measurement details.
Different Metrics Give Different Results
The United States Energy Information Administration (EIA) reports that energy efficiency
offset 70 percent of the growth in residential sector energy consumption that would have
occurred between 1980 and 2009 due to increases in home size and number of homes (EIA,
2015).2 In Big Love for Big Energy Efficient Homes, RESNET3 interprets this as meaning that
bigger homes are not worse for the environment or GHG emissions than smaller, older ones
(RESNET, 2015). That is, the increase in services has been greater than the increase in energy
use, so the energy use results are interpreted as a success. This argument is not aligned with
climate change goals since the calculations are indifferent to total energy use and emissions,
let alone other energy and environmental costs of bigger homes.4 With respect to goals for
reductions in energy use, smaller efficient homes will use less energy than bigger efficient
homes. And even smaller inefficient homes can use less energy than bigger efficient homes.
2 This EIA analysis tracks delivered energy, rather than source or primary energy. This means that losses from
production, transmission, and delivery of electricity are not included in these calculations. In recent decades,
delivered electricity in the United States amounts to only about one-third of primary (total) energy use, such as the ratio of source to site energy for grid-purchased electricity is estimated as 2.80 (35.7 percent of source energy is delivered as useful energy on site) in the ENERGY STAR® portfolio manager (ENERGY STAR. 2019. Portfolio Manager technical Reference. August. https://portfoliomanager.energystar.gov/pdf/reference/
Source%20Energy.pdf). As supply resources and grid structure change, this proportion will also change. Since
homes use natural gas and other fuels directly, in addition to electricity, and the contributions of these other fuels have varied over the years, the trend analysis that combines site electricity with natural gas (which has a source-
site ratio of only 1.05, according to the aforementioned ENERGY STAR estimates) cannot be interpreted as changes in total residential energy use. In fact, while residential-delivered energy increased only 9.7 percent between 1980 and 2009 (EIA, 2015), total (primary) residential energy use, including losses, increased 34
percent over the same period (Residential Sector Energy Consumption Table 2.2). These two EIA sources use different accounting, so the examples are not completely comparable (for example, the table shows 14 percent increase between 1980 and 2009 versus 9.7 percent). Still the pattern of much higher increases in total energy
use, versus delivered energy use, are maintained.
3 RESNET®, which stands for Residential Energy Services Network, is a nonprofit organization that develops
comparative home energy efficiency ratings in the U.S. The cited article (RESNET, 2015) may conflate energy intensity (energy use per square foot) with total energy consumption.
4 Beyond arguments of the physical comparison of resource use between small and large homes, the RESNET
argument reinforces an assumption that more is better, including that more services or space per household is better. The assumption, so engrained that it may be difficult to notice, can conflict with goals of lower resource
use.

15
Table 1: California Energy Efficiency Historical Trends and Themes
Decade Energy Events General Themes and
Residential Technologies Dominant View of
the Role of the Social
1960s • Dramatic growth in electricity demand, load-building
• Brownouts in late 60s due to supply shortages
• OPEC formed 1960
• Atomic Energy Commission envisions 1,000 nuclear reactors in the United States by 2000
• Residential load building
• Continuous growth in demand indicates success of modern societies.
1970s • Energy Commission formed 1974, focusing on reducing the demand for new power plants and anti-nuclear backlash
• California appliance efficiency standards (Title 20) 1976; building code (Title 24, Part 6) 1978
• Energy Crises and Jimmy Carter speech
• Three Mile Island radiation leak 1979
• Focus on resource limitations
• “Energy conservation” including both behavioral and technological measures.
• Attention to standards and codes aimed at increasing efficiency of major residential energy technology—refrigerators, HVAC
equipment, and building envelopes
• Individuals should conserve energy through changed
behavior.
1980s • Chernobyl disaster 1986
• NAECA for minimum efficiency standards 1987
• Increasing rejection of conservation in lieu of efficiency
• Waning funding for efficiency/conservation along with declining oil & gas prices
• Consumers of energy seen as rational economic actors; financial incentives
put in place

16
Decade Energy Events General Themes and
Residential Technologies Dominant View of
the Role of the Social
1990s • ENERGY STAR program formed 1992
• EPAct adds standards 1992
• Idea of deregulating retail energy gains traction
• Intermittent power shortages in California 1999
• Increasing attention to environmental damages (acid rain)
• Rejection of energy conservation, reassertion of market via Market Transformation
• Super Efficient Refrigerator Program: Golden Carrot refrigerator efficiency competition
• Recognition of miscellaneous electricity use such as small appliance plug loads
• Emphasis on energy efficiency gap, overcoming market and nonmarket barriers and failures.
2000s • California deregulation; electricity crisis (2000-2001); PG&E files
Chapter 11
• First long-term energy efficiency strategy plan 2008 specifying Big Bold goals
• San Bruno gas pipeline explosion 2008
• American Recovery and Reinvestment Act (ARRA) provides extensive funding of home efficiency retrofits, initiated 2009
• Rise of climate change mitigation as a centerpiece of policy
• Increasing attention to renewable electricity.
• Zero Net Energy buildings; rooftop PV; first Behavior, Energy, and Climate Change
Conference (BECC) held in Sacramento
• Behavior change
• Behavioral economics and nudges
• Demand response

17
Decade Energy Events General Themes and
Residential Technologies Dominant View of
the Role of the Social
2010s • Extreme weather events become more common
• Major planned power
shutoffs throughout the state
• GHG emissions reduction goals
• San Onofre Nuclear Generating Station shut down 2013; 2018 decision to shut down Diablo Canyon
• Aliso Canyon underground storage gas leak 2015
• Fukushima Daichi 2011.
• PG&E files Chapter 11, 2019
• Focus strongly on climate change mitigation and energy system
decarbonization
• Logos feature green leaves, LEDs, and smart interconnections
• Average residential retail price of electricity in California reaches 0.2USD/kWh (Feb.2019), 7th highest in the United States, and 25 percent higher than the 2010 price*
• Electric vehicles become more common
• People should understand climate change and why it
is important to act
• Households become prosumers providing PV-based power and EV
battery storage
• Increase attention to civil society, the importance of local efforts and effects, and equity with respect to disadvantaged communities
*Electric Power Monthly Tables 5.6.A for March 2019 and December 2010.
kWh=kilowatt-hours; HVAC=heating, ventilation, and air conditioning; LED=light-emitting diode
Source: QQForward, 2019.
18
This distinction is important enough to warrant looking at the EIA and RESNET arguments in
more detail. Turning to data for California only, the change in primary residential energy use
on a per capita basis (versus delivered energy, and versus the per-home metric used in the
EIA and RESNET examples) shows a more modest decrease of 16 percent per capita over the
same period, 1980 to 2009 (Appendix, Figure A-2). This decrease is still impressive, but it is
much lower than the 70 percent offset used in the EIA example and tells a different story
about how much emissions reductions are likely.
Another consideration is that of what year is used as baseline. Continuing with the example
above, starting at an earlier baseline of 1960, there has been only a 5 percent reduction in per
capita residential energy use between 1960 and 2009 (Appendix, Figure A-2).5 This is more
modest than the 16 percent seen between 1980 and 2009. Despite the reputed inefficiency of
homes in 1960, the amount of energy used per person in homes then was only marginally
more than it is today. Homes do more now than they did in 1960, and households have fewer
people on average (so 1960 versus the present is not “apples to apples”), but they do not use
much less energy.
These comparisons illustrate how different metrics and different starting points affect
impressions about how energy use has changed. Efficiency has offset a great deal of energy
use, as evaluated in conventional energy efficiency terms, but this has not been echoed in the
level of absolute reductions in energy use. This leads to the question of how the perspective of
absolute energy use could be better incorporated and metricized in planning energy
transitions, versus energy efficiency’s emphasis on relative savings. Without dismissing the
value of energy efficiency in its own terms, that favorable assessments of energy efficiency’s
past are not as promising for meeting the ambitions of climate change goals and they might at
first seem—if efficiency is pursued in the same ways that it has been in the past.
Meta-Evaluations of Efficiency in the Long Term
Energy efficiency policy uses a broad array of strategies to shape technology development and
adoption. These include research and development investments, utility programs, building
codes and standards, voluntary labels, economic incentives, tax credits, “nudges” and other
behavioral economics tools, technical facts and other informational strategies, and marketing.
This ensemble of planned energy efficiency efforts takes its place among the other forces of
technology change, governance, and social evolution.
Given these multiple changes, assessing the results of energy efficiency programs has required
defining strict boundaries and making major assumptions, including about counterfactuals
(“What would have happened in the absence of the program?”) to provide quantitative
descriptions of program impact. The American energy efficiency field thus has a well-
developed and specific way of assessing efficiency impacts, involving metrics, models, and
concepts that can be internally validated. Performance assessment and program design
proceed so results are reasonably evaluable within these requirements and traditions. This
5 The 2009 endpoint is used for comparison to the U.S. cited earlier. California’s downward trend, however, has
continued; per capita residential energy consumption in California in 2016 was 5 percent lower than it was in 1960. The comparisons do not imply that declines in California have been less than in the U.S., but rather
concerns a comparison of metrics used in the EIA analysis versus the one presented here.

19
creates tractability, but limits the types of questions that can be pursued, especially for
interactions between technology and society.6 This has left doubts as to how well energy
efficiency, as currently defined, is appropriate for producing aggregate GHG emissions
reductions (Herring, 2006; Moezzi and Diamond, 2005; Lutzenhiser, 2014; Moezzi et al.,
2018), even setting aside other challenges, such as energy systems fragility.
There are few academic long-term meta-evaluations on energy efficiency results in the United
States. Conducting meta-evaluations of efficiency is difficult because the process involves
fundamental incommensurability as well as challenges in coordinating results across studies
with different levels of quality (Gillingham, Keys, and Palmer, 2018; Brown, 2014; also
Mallburn and Eyre, 2014 for the U.K.). Still, the available studies highlight issues not addressed
in normal efficiency program assessments. One national meta-evaluation concludes that in
aggregate, energy efficiency programs are cost-effective, but that actual program savings are
often lower than deemed savings (ex-ante estimates of savings), and that there are potential
biases because evaluators want to keep clients (Gillingham, Keys, and Palmer, 2018). An
evaluation of the national Weatherization Assistance Program finds that model-projected
savings were about 2.5 times higher than actual savings (Fowlie, Greenstone, and Wolfram,
2015). These studies give pause as to “how we know what we think we know” about energy
efficiency. Similarly, outside the United States, a study on house efficiency labelling across four
European countries found that modeled energy consumption was far higher than actual energy
consumption, leading to overestimates in savings from efficiency (Laurent et al., 2013).
The message of these historical examples is not that energy efficiency is inapplicable to
climate change. Rather the specificity of efficiency calculations has to be weighed in planning
for climate change, as do arguments by social scientists concerning how efficiency might
sometimes work against energy use or GHG emissions reductions (argued below). Some argue
that energy efficiency programs in California are under-evaluated, in the sense that more
evaluation could improve outcomes for the ambitious goals that have been formulated in
California (Campbell, 2016).
Energy History as Seen by Social Sciences
Social scientists view the home as a social, cultural, transactional, and even political space
(Day Biehler and Simon 2011; Madsen 2018; Ellsworth-Krebs et al. 2015; Hirsch and
Silverstone, 2003). This contrasts with energy efficiency’s spartan model of the home as a
physical and economic system that provides for fixed needs of occupants. This clash of
perspectives accounts for some long-running difficulties in merging social science contributions
with those of the more hardware-centered energy efficiency community.
Homes are also physical entities that reflect the construction practices, resources, traditions,
and energy systems current when they were built along with local traditions of home upgrades
and repairs. This embedded history makes any individual home far more suitable for some
upgrades than others, which—besides localized traditions of upgrade and repair—can be at
odds with standardized notions of efficient homes. In short, a legacy is locked into homes as
6 For example, in the case of residential building standards, home sizes, locations, and services change
substantially over decades, and there is no simple way to standardize or control for these changes (Lutzenhiser et
al., 2017).

20
physical objects and into local energy supply, part of an energy geography that effects what
kind of residential energy futures can be had (Calvert, 2015; Darby, 2017).
Given the millions of homes in the state, one might at first imagine that there is lots of data
about what goes on in them. But energy use in the home is mundane, private, and varied over
time and across homes. This makes it difficult to study historically and difficult to express in
the quantitative terms that dominate energy efficiency work. How does one know what people
are doing and what difference it makes for energy use, especially given the limited data
available to characterize this use? How can changes be seen given this uncertainty and
diversity? Some sociologists have responded to this difficulty by focusing on social practices to
see and understand changes in energy use (Gram-Hanssen, 2011; Shove, Pantzar, and
Watson, 2012). Social practices are combinations of (a) material elements such as energy-
using devices and homes; (b) competences in using these material elements; and (c)
meanings enacted by people (Shove, 2014a)—for example, cooking and eating, educating
children, and so on.7 These practices happen in larger social networks and forms, institutions,
and matrices of larger socio-technical arrangements. From here, questions such as “How do
people stay cool, and why do they do it in those ways?” versus the more usual set of
questions asked in energy efficiency: “How can we get people to buy a more efficient central
air conditioner, and how can we get it to be operated efficiently”? can be pursued. The latter
questions accommodate only a limited range of answers—chiefly information, regulation,
incentives, and automation. The practices reframing is a clear pivot from the usual view of
separate worlds of consumers and technologies.
The precise activities that are taken for granted as normal energy use in American homes are
not many generations old. The first electric utility in the United States, Edison’s Pearl Street
Station in New York, began to serve customers in 1880. By 1920, 35 percent of American
homes used electricity, with far higher penetrations in urban than in rural areas. In California,
electrification rates were faster, at 87 percent by 1920. Only after World War II did natural gas
became popular in American homes for heating and cooking (Morrison, 1992).
In the early decades of electrification, proponents emphasized electricity’s potential to lighten
the burden of women’s labor in the home. The new electric technologies surely lightened
physical effort. This did not liberate women from domestic chores, but changed the nature of
this labor, including meeting (and helping create) higher expectations for what was to be
provided (Cowan, 1983). The historic course of the last several decades has still been toward
higher levels of energy services, including bigger homes, bigger appliances, more lighting, and
more bathing per person (Shove, 2003; Harris et al., 2008; Roberts, 2008). Shove (2003)
describes this as a matter of increasing standards of “comfort, cleanliness, and convenience.”
That is not a bad thing. But as illustrated below, standards of living can be set by the
availability of technologies to fulfill them creating new “needs” that have energy implications
(Cooper, 1998; Hackett and Lutzenhiser, 1985; Walker, Shove, and Brown, 2014).
The creation of these needs is outside the bounds of usual assessments of energy efficiency,
which has focused on efficient fulfillment of needs that are taken as given (without having to
7 Readers interested in learning more about how social practice theory how applies to residential energy use may
be interested in Comfort, Cleanliness and Convenience: The Social Organization of Normality (Shove, 2003), and
The Dynamics of Social Practice: Everyday Life and How it Changes (Shove, Pantzar, and Watson, 2012).
21
engage with the fact that there are active interests in creating them). While tractable and
pragmatic, it creates a complication for reducing absolute levels of energy use or GHG
emissions as targeted in climate change goals. Computationally, “the more you use, the more
you can save.”
Though the array of energy services in U.S. households has increased on average, there is
important diversity in these details from household to household (Lutzenhiser et al. 2017). For
example, while compressor-based central air conditioning is often taken as normal in American
homes, only slightly over half of California households have it; some use it 24/7 with low
temperature settings, and some don’t use it at all. How energy is used varies spatially for
reasons beyond climate (Bridge, 2018): different histories, actors, resources, politics,
infrastructure, urban morphologies, markets, practices, industries, home characteristics,
technologies, and culture. Een neighboring homes of similar size, construction characteristics,
and equipment can have energy use that differs by a factor of two or more (Morley and Hazas,
2011; Sonderegger, 1978). This means that averages-based assessments of energy use in
homes can easily misunderstand the ways that energy is used and can be saved across the
residential sector The SIMSAND model (Chapter 5) is designed to take this variety, and a
distributional perspective overall, into account.
Case Histories of Residential Energy Technologies This section summarizes histories of selected residential energy technologies, with an
emphasis on the efficiency programs that promoted these technologies.
Lighting
Lighting has been a favorite target for residential energy programs in the United States.
Lighting accounts for only about 6 percent of residential energy use nationwide (EIA RECS,
2009), but applies to all households and is cheap and easy to upgrade. Due to the many light
fixtures per household, upgrades have been nearly constantly applicable to most residential
customers (in contrast to the long lifetimes of major equipment and appliances). Lighting has
long provided the highest share of residential efficiency savings in California and nationwide,
achieved by swapping in CFLs for the incandescent bulbs that had been standard for
generations (Barclay et al., 2018).
The first CFLs were demonstrated to the public in the late 1930s. At that time, electric utilities
relied heavily on lighting to generate electricity sales, sometimes giving customers free high-
wattage lamps to profit from the load these lights could provide (Bijker, 1997). Because of
their low energy consumption, CFLs were a threat to these lighting electricity sales. Utilities
downplayed the applicability of CFLs and directed attention to lighting technology that
provided higher illumination without reducing power draw (Bijker, 1997). That is, part of the
reason that CFLs were not pushed into the market earlier was because their energy efficiency
contrasted with utility business models (see Bakke, 2016). Not until the energy crisis and
environmental concerns of the 1970s did lighting manufacturers earnestly develop CFLs for
household use, stimulated by government investments in lighting technology development
(NRC, 2013).
CFLs were back on the consumer market by the mid-1980s (Matulka and Wood, 2013). At that
time, CFLs were expected to be suitable only for certain applications rather than as a full

22
replacement for incandescent lamps (Verderber and Rubinstein, 1984). They were sometimes
described as a temporary technology that could serve until something better could be
produced (Brodrick, 2007). Plus, they were expensive, costing $25–$35 per bulb in the 1980s
(Brodrick, 2007). Eventually CFLs became common in the United States, and especially in
California, but there were many adjustments along the way, and lingering doubts. Less than
two decades after their relative heyday, the era of CFLs seems over. How did this happen, and
what are the consequences for efficiency?
Initial conditions for CFL adoption were tough. In the 1980s and 1990s, most people were
familiar with fluorescent lighting from its use in schools, office buildings, and retail stores,
more as something institutional to be endured than to be liked. The standard incandescent
light used in homes for decades worked well, apparently with hardly a concern. So it is not
surprising that households that installed CFLs early on found much to dislike about them:
initial expense, color rendition, low light output, flickering, delayed start, unfamiliar or “ugly”
lamp shape, incompatibility with existing fixtures, inability to dim, non-suitability for use
outdoors, occasional immediate failures, lifetimes that could be much shorter than promised,
and mercury content that meant that special handling was required if the lamp accidentally
broke and for proper disposal (Sandahl et al., 2006). A variety of health concerns including
noise, triggering of migraines, and ultraviolet radiation (Welch, 2018) were reported; these did
not find widespread scientific support, but remained a vocal consumer issue. There was also
confusion about whether switching CFLs on and off substantially reduced lamp performance,
creating an additional worry for those who had a habit of turning lights off when not in use.
While some of these concerns may have seemed trivial from an energy efficiency program
standpoint, they certainly annoyed people. Actions that symbolized “easy”, screwing in a light
bulb or flipping a switch, became more complicated and annoying. Lighting, the most basic
energy use in the home, had changed.
Nomenclature added to the confusion about CFLs. In 1995, 42 percent of Americans could not
distinguish an incandescent lamp from a CFL, let alone navigate different manufacturer names
for CFLs (Brodrick, 2007). Retailers were reluctant to sell CFLs at first, too (Brodrick 2007;
Sandahl et al., 2006). Of course, many CFL users did recognize benefits: saving energy,
reducing pollution, longer lamp lifetimes with less frequent need to change a lamp, and energy
bill savings. Statistically, however, actual savings from any single bulb would be hard to detect
in most households.
In short, though CFLs were promoted as a great choice for consumers, American society was
not keen. The lighting industry and energy efficiency programs eventually responded to user
concerns about CFLs by developing improvements to technical performance, aesthetics, quality
and market control, retailing, and consumer information. But also notable was the sense that
industry proponents seemed to interpret consumer complaints about CFLs as ignorance or
fussiness.
23
Plus, performance and savings estimates may have often been exaggerated (Brodrick, 2007)
through optimistic accounting.8 The energy efficiency industry, prioritizing aggregate estimated
savings, and assuming that energy savings and promised environmental benefits were what
consumers should want, seemed slow to acknowledge user experience and reaction as a
reasonable and legitimate assessment of product experience.
The most effective way to get consumers to own CFLs turned out to be to give them away. By
1990, Southern California Edison, for example, had given 800,000 CFLs to its customers
(Lovins, 1990). Many programs did something similar, such as buy-downs in the early 2000s
that offered CFLs at highly discounted prices (Moran et al., 2008). Attention to getting CFLs
into homes continued through early 2000s as a centerpiece of investor-owned utility
residential energy efficiency programs (Barclay et al., 2018). But as higher California and
federal standards for lighting came into place in the 2010s, and LED technology advanced, the
program-based energy savings potential of CFLs diminished by comparison. Though lighting
(driven by LEDs) even recently remained a dominant category of residential electricity savings
in California utility programs (Navigant, 2017), the program world met these changes with
trepidation: “It’s almost the end of the world and we know it” some authors wrote (Barclay et
al., 2018).A new phase of lighting standards is expected to truncate savings beginning in 2021
or 2022 (Barclay et al., 2016).
In summary, within the energy efficiency industry, CFLs have long been considered a success
story. They were once the symbol of green energy and even environmentalism, appearing on
logos for energy and environmental organizations everywhere in the 1990s and early 2000s.
But there were many adaptations along the way, some of which likely seemed slow from a
consumer point of view. CFLs were, according to one journalist, “the harsh, energy-saving
bulbs that divided a nation” (Spector, 2016). While households in some countries, such as
Japan and Poland (Sandahl et al., 2006) embraced CFLs, households in the United States did
not. Despite all the program attention, CFLs did not become the American norm, probably not
even when legislation made incandescent lamps difficult to purchase. In 2015, 19 percent of
American homes had no CFLs, and only 31 percent said that most or all their lamps were CFLs
(EIA RECS, 2015). In 2019, CFLs were no longer so easy to find. LEDs are more efficient than
CFLs, and apparently much better liked by households, so this transition seems to be a good
one. But households today have not necessarily forgotten these CFL difficulties, and lighting
regulation remains a political flash point.
In retrospect, early assumptions about how consumers would view and accept CFLs now seem
naïve. Lighting is the most basic energy use in most homes, and managing lighting is a social
and cultural practice (Crosbie and Guy, 2008). Energy savings were promoted as the chief
value of CFLs, but these savings may be invisible for most households. Overall, energy
efficiency policy seemed to fail to appreciate the fundamental human importance of light in the
home (Bladh, 2011). While CFL offerings improved over the few decades as noted above, no
8 For example, there is usually a very wide distribution of use among the 20-plus lamps in a typical home. One
study analyzing metered lighting data for a sample of homes found that the lamps in the highest-consuming 10
percent of all lamps in the entire sample accounted for 50 percent of total lighting use (Jennings et al., 1996). A CFL installed in a seldom-used closet—as one might do if they disliked CFLs—would have much less savings than one installed in a high-use fixture. Using “average” number of hours to calculate savings would lead to
overestimated savings.

24
cohesive strategy tracking user satisfaction or managing user discontent seems evident. In
addition, the substantial problem of mercury was handled only through admonishments to
users and regulations that CFLs should be properly recycled, but with poor infrastructure for
doing so, and little reckoning of the chore that following these recommendations would be.9
Refrigerators
Refrigerators are the highest electricity use category in the California residential sector (17
percent) after the “miscellaneous and lighting” category (41 percent), according to the state’s demand assessment.10 Thirty percent of households have at least two (EIA RECS, 2015). This
percentage has doubled since 1990, though freezers became somewhat less common over the
same period (Figure 2).11 As to their contributions to GHG emissions, besides energy
consumption, refrigerators have used hydrofluorocarbons (HFCs) as refrigerants since the
1930s. These refrigerants have high global warming potential, and are subject to bans being phased in for new equipment in California (SB 1103).12
Like CFLs, refrigerators are often considered a major success story for energy efficiency
(Levine et al., 1995; Rosenfeld, 1999). But there is broader way to see refrigeration’s
trajectory. The history sketched below focuses on aspects of refrigerators that are less familiar
than program and market success, drawing from Deumling’s 2004 investigation of refrigerator
energy efficiency programs (Deumling, 2004).
Cold is the absence of heat, and producing it is technically more complicated than producing
heat (Rees, 2013). People have been keeping food cool for preservation since at least 1700
B.C.E. using ice storage areas, water cooling, and ice production through radiation and
evaporation (Jackson, 2016; Rees, 2013). There are other ways to preserve food, but none
does as much as easily as refrigeration.
9 The rate of CFL recycling has been tiny, at roughly 2 percent nationwide in 2011 (Consumer Reports News,
2011). This is an example of where technology problems—such as related to environmental impacts or consumer efforts—can be made exogenous to policy reckoning through treating them as out of bounds, or through
specifying idealized solutions that may be difficult to implement.
10 On a national basis, refrigerator’s relative contribution to electricity use is much lower at 6 percent in 2018
(Annual Energy Outlook EIA 2019a), since many other states use more electricity for space and water heating
than does California.
11 However, trends need to be interpreted with caution, since some of the estimates in the figure are for the
Western Census Region or the Pacific Census Division, as explained in the note for the figure below.
12 See https://ww2.arb.ca.gov/resources/fact-sheets/hydrofluorocarbon-hfc-prohibitions-california for the details
of the regulation; effective dates for residential refrigeration begin in 2021.

25
Figure 2: Trends in Estimated Presence of Second Refrigerators and Separate Freezers in California Households
Due to differences in available geographic refinement, some data points were estimated from the Western
Census Region (1990 and 1993) and Census Division (2015) levels, versus the California-specific data for
1997, 2001, 2005, and 2009; trends are only approximate.
Source: QQForward, 2019, using EIA RECS data for 1990, 1993, 1997, 2001, 2005, 2009, and 2015.
But home refrigeration is less an independently-derived energy service need than a node in a
much larger food system. This system includes a massive cold chain for preserving food
through production, transportation, warehousing, and final consumption. The cold chain
brought major changes in diet and in food preparation activities in the home starting in the
1920s (Rees, 2013), only a century ago. Even before mechanical refrigeration was common,
the cold chain enabled a poor family in early 1900s Chicago to afford bananas, for example,
which otherwise would be available only to wealthier households (Rees, 2013). The cold chain
did not arrive on the scene without conflict. It was initially controversial, challenging notions of
goodness, fairness, and justice in the economy, as part of a growing system of mechanisms
displacing existing trade in perishables, threatening what these perishables represented
culturally and socially, including their role within local economies and the power dynamics
associated with food (Freidberg, 2015).
In the 1800s, homes used ice boxes or ice closets to keep food cold (Rees, 2013). Ice box
technology was stable for decades. Gas absorption refrigerators entered the market in the
mid-1910s (Cowan, 1985). Though electric refrigerators were mass produced in the 1920s,
they were expensive, at $450 in 1923 (in 1923 dollars). They required servicing every few
months, were prone to failure, and, unlike gas models, required a bulky compressor and a
motor. They were thus big and heavy. Early electric refrigerators used refrigerants such as
ammonia, sulfur dioxide, and other harsh or toxic elements. The synthesis of Freon in the

26
1920s led the way for smaller, cheaper, lighter, and safer refrigerators to enter the market in
the 1930s.
This refrigerant innovation and related electric refrigerator improvements were the result of
very well-funded development teams working at a variety of competing engineering companies
in and outside the United States. The stakes were huge, given the enormous potential
customer base for domestic refrigerators (Cowan, 1985). While gas refrigerators were quiet,
less likely to break down, and cheaper to run, the high investment in developing electric
refrigerator helped knock gas refrigerators out of the market (Cowan, 1985). Though gas
refrigerators were almost entirely abandoned, they were not inherently an inferior technology.
The electric refrigerators in the 1940s had low energy consumption and small capacity.13 As
Deumling (2004) explains, after World War II, utilities directed attention to selling refrigerators
that had higher energy use than the pre-war models. This benefitted refrigerator manufacturers
by helping them sell bigger, fancier, and more expensive refrigerators, while utilities could sell
more electricity as needed to power these bigger units. Refrigerators are especially good for
load building because they have high load factors (average load divided by peak load in a time
period) which help utilities optimize power plant optimization. Sales of these bigger
refrigerators were accompanied by a rhetoric that associated higher energy use with higher
well-being (Deumling, 2004).
The California Energy Commission (CEC) noticed, and addressed these increases in energy
consumption. The CEC, created in 1975, issued minimum efficiency standards for refrigerators
in 1976, effective in November 1977 (Rosenfeld, 1999).14 Other states followed California’s
lead. The first national refrigerator efficiency standards were issued by U.S. Department of
Energy in 1987 (Risser, 2011), and have been since updated four times; there were, of course,
many other refrigerator efficiency programs. These programs and standards led to a steady
decline in yearly average expected energy use of new refrigerators.
A widely reproduced graphic (Figure 3) illustrates the impact of the California and national
standards, showing a sharp decline in the Unit Energy Consumption (UEC) of new refrigerators
between 1974 and 1978. The decline continued past 2001 (Figure 4). Part of what made this
radical decline possible is suggested by the pattern shown in Figure 3: refrigerator UEC rapidly
increased between the late 1940s and the mid-1970s. In the 1960s, average refrigerator UEC
increased from 800 kWh/year to 1,600 kWh/year, with volume increasing from 13.5 cubic feet
to 18 cubic feet. This increase in refrigerator energy use parallels an increase in household
13 Energy consumption for this model is estimated at 350 kWh/year based on modern refrigerator test
procedures, with an average interior volume of 6.3 cubic feet (Deumling, 2004). The estimated energy use of an example 5.5-cubic-foot refrigerator qualifying for the ENERGY STAR label in 2019 is 221 kWh/year, at a price of about $1,800 (as per the Product Finder at energystar.gov). Most refrigerators sold now are much bigger. As of
September 15, 2014, the federal minimum standard for a side-by-side refrigerator-freezer with automatic defrost and through-the-door ice service was set at 8.54*adjusted volume in ft3 + 432.8 kWh (Electronic Code of Federal Regulations, Title 10, Part 430, Subpart C, section 430.32; type 7; ecfr.gov, accessed 19 September 2019). For a
refrigerator with 20 cubic foot volume (the most common size for a primary refrigerator as per EIA RECS, 2015), the federal minimum standard is thus 603.6 kWh per year.
14 The text of the regulation is available at https://ww2.energy.ca.gov/appliances/appl_regs_1976-
1992/1976_11_03_Appl_Regs.pdf. Air conditioner standards were also enacted.
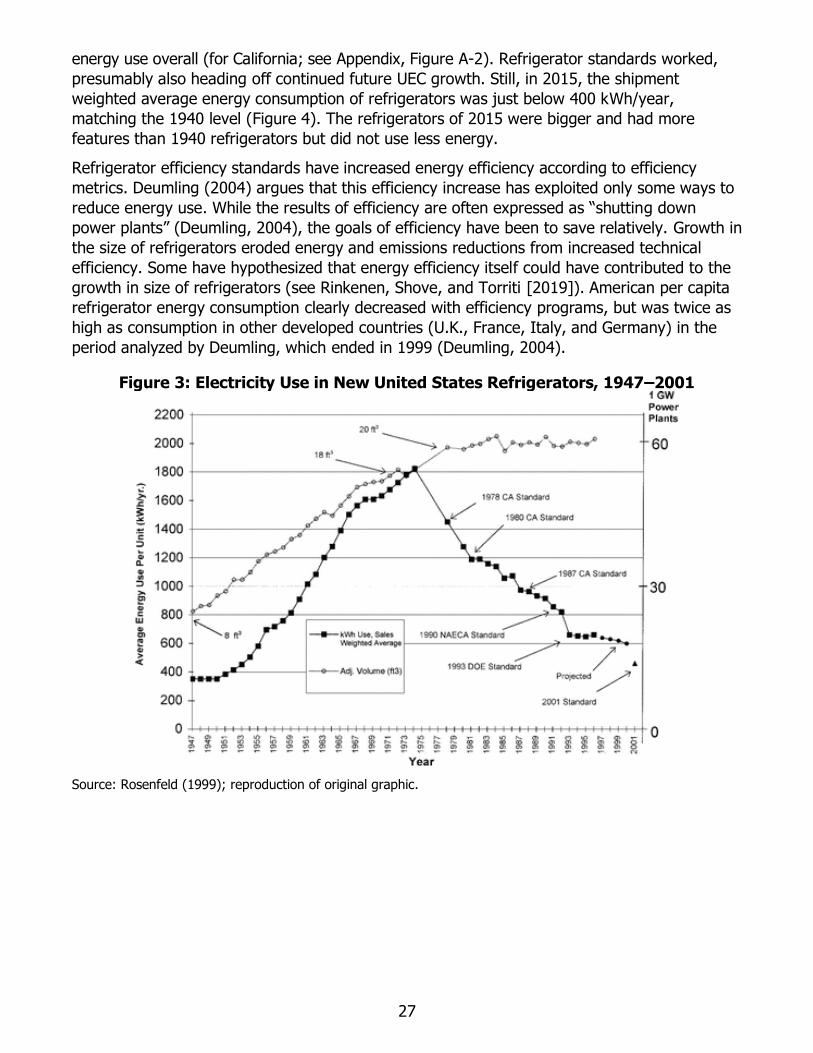
27
energy use overall (for California; see Appendix, Figure A-2). Refrigerator standards worked,
presumably also heading off continued future UEC growth. Still, in 2015, the shipment
weighted average energy consumption of refrigerators was just below 400 kWh/year,
matching the 1940 level (Figure 4). The refrigerators of 2015 were bigger and had more
features than 1940 refrigerators but did not use less energy.
Refrigerator efficiency standards have increased energy efficiency according to efficiency
metrics. Deumling (2004) argues that this efficiency increase has exploited only some ways to
reduce energy use. While the results of efficiency are often expressed as “shutting down
power plants” (Deumling, 2004), the goals of efficiency have been to save relatively. Growth in
the size of refrigerators eroded energy and emissions reductions from increased technical
efficiency. Some have hypothesized that energy efficiency itself could have contributed to the
growth in size of refrigerators (see Rinkenen, Shove, and Torriti [2019]). American per capita
refrigerator energy consumption clearly decreased with efficiency programs, but was twice as
high as consumption in other developed countries (U.K., France, Italy, and Germany) in the
period analyzed by Deumling, which ended in 1999 (Deumling, 2004).
Figure 3: Electricity Use in New United States Refrigerators, 1947–2001
Source: Rosenfeld (1999); reproduction of original graphic.
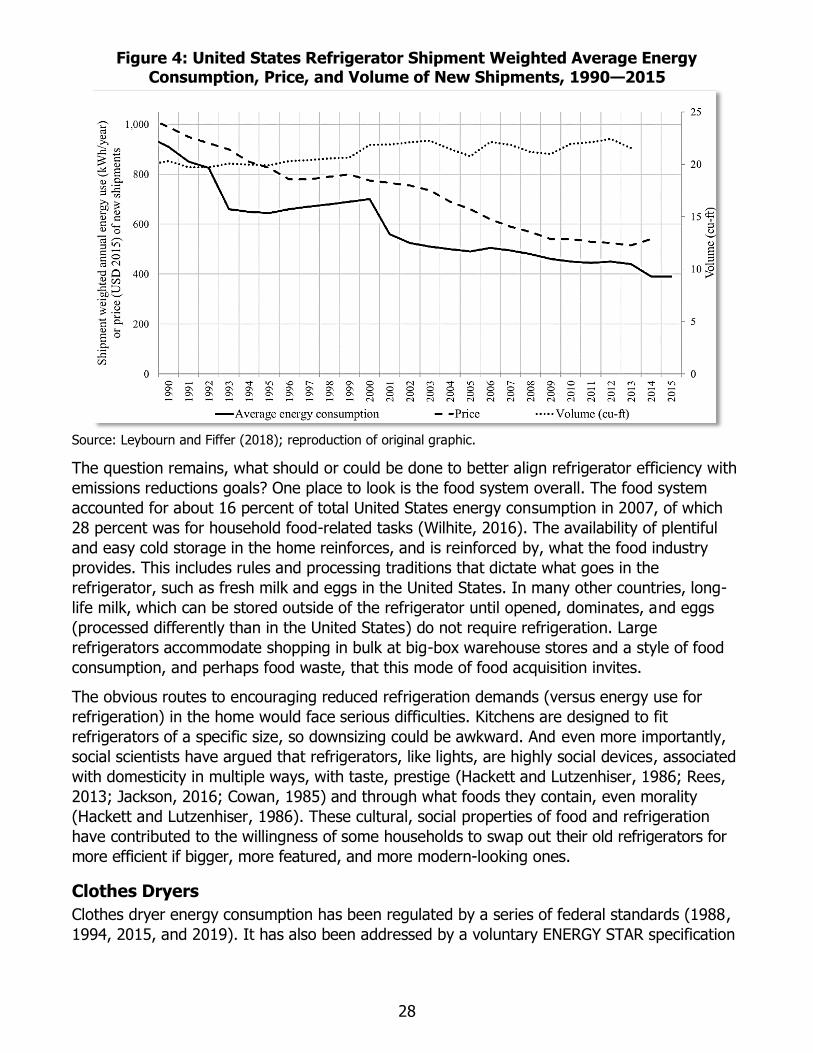
28
Figure 4: United States Refrigerator Shipment Weighted Average Energy Consumption, Price, and Volume of New Shipments, 1990—2015
Source: Leybourn and Fiffer (2018); reproduction of original graphic.
The question remains, what should or could be done to better align refrigerator efficiency with
emissions reductions goals? One place to look is the food system overall. The food system
accounted for about 16 percent of total United States energy consumption in 2007, of which
28 percent was for household food-related tasks (Wilhite, 2016). The availability of plentiful
and easy cold storage in the home reinforces, and is reinforced by, what the food industry
provides. This includes rules and processing traditions that dictate what goes in the
refrigerator, such as fresh milk and eggs in the United States. In many other countries, long-
life milk, which can be stored outside of the refrigerator until opened, dominates, and eggs
(processed differently than in the United States) do not require refrigeration. Large
refrigerators accommodate shopping in bulk at big-box warehouse stores and a style of food
consumption, and perhaps food waste, that this mode of food acquisition invites.
The obvious routes to encouraging reduced refrigeration demands (versus energy use for
refrigeration) in the home would face serious difficulties. Kitchens are designed to fit
refrigerators of a specific size, so downsizing could be awkward. And even more importantly,
social scientists have argued that refrigerators, like lights, are highly social devices, associated
with domesticity in multiple ways, with taste, prestige (Hackett and Lutzenhiser, 1986; Rees,
2013; Jackson, 2016; Cowan, 1985) and through what foods they contain, even morality
(Hackett and Lutzenhiser, 1986). These cultural, social properties of food and refrigeration
have contributed to the willingness of some households to swap out their old refrigerators for
more efficient if bigger, more featured, and more modern-looking ones.
Clothes Dryers
Clothes dryer energy consumption has been regulated by a series of federal standards (1988,
1994, 2015, and 2019). It has also been addressed by a voluntary ENERGY STAR specification

29
since 2015.15 In California, clothes dryers account for about 5 percent of total residential
electricity consumption and 3.1 percent of residential gas consumption (CEC, 2015)—about 4
percent of residential energy use overall (see Appendix, Figure A-7).16 The average clothes
dryer UEC in California is 640 kWh/year for electric models and 24 therms/year for gas models
(KEMA RASS, 2009). Gas dryers account for 60 percent of residential dryers in the state (KEMA
RASS, 2009).
Dryers became popular in the United States later than other major home appliances, reaching
10 percent saturation only in 1955 (Morris, n.d.). Most (85 percent) California single-family
homes had a clothes dryer in 2009. Individually owned clothes dryers are much less common
in multifamily dwellings, where communal laundry facilities are often available. In many
European countries and in some areas of Australia, in contrast, clothes dryers are not the
norm. Rather, clothes are often air-dried or dried using heated drying racks or in drying rooms
(Schmitz and Stamminger, 2014; de Vet, 2017; Cabeza, 2018). Schmitz and Stamminger’s
(2014) study on laundry practices in ten European countries found that between 3 percent
(Czech Republic) and 52 percent (Sweden and U.K.) of households had a tumble clothes dryer.
Even when a clothes dryer was available, it was not necessarily used throughout the year, or
even at all (Schmitz and Stamminger, 2014). In California, in contrast, among homes with
dryers, most (93 percent) say they use the dryer at least twice per week, and 10 percent say
that they average at least one load per day (KEMA RASS, 2009).
During energy crises, the conservation option of air-drying clothes versus using a mechanical
clothes dryer has been publicly debated (e.g., Hackett, 1990). This is an example of an old
method of doing household chores vying for traction relative to a newer, more energy-
intensive, one. The distinction is morally loaded. It also presents a complication with respect to
energy savings measurement practices. In the United States energy efficiency framework, air-
drying clothes is considered conservation rather than energy efficiency.17 This makes it hard to
propose as an energy savings method, except in supply crises when immediate demand
savings are needed and actions considered exceptional can be proposed. Similarly, in
electricity time-of-use rate pilots in the UK and Sweden, consumers were advised to change
when they use their clothes dryer (Anderson 2016; Carlsson-Kanyama and Linden, 2007),
versus to not use their clothes dryer at all. A skirting of conservation aligns with the
15 https://appliance-standards.org/product/clothes-dryers. Clothes dryers are a latecomer in the ENERGY STAR
product labelling portfolio, having been omitted for many years, since there was little difference in energy consumption across several models (Golden et al., 2010).
16 This comparison is based on the EIA’s national end use calculations for residential energy consumption in 2015,
which estimate that clothes dryers consume 5 percent of residential energy use versus 7 percent for refrigerators (https://www.eia.gov/consumption/residential/). Nationally, clothes dryer energy use approaches that of refrigerators, though they have received less attention in utility energy programs.
17 Definitions of efficiency versus conservation vary over time and context. Most formally, energy efficiency
reduces the energy required per unit of energy services, while conservation reduces energy use without reference to the level of energy services achieved. In this way, efficiency overlaps conservation. In the United States energy
efficiency context, particularly in the 1990s—2000s, efficiency refers primarily to the technical quality of devices or systems, whereas conservation refers to behavioral measures that reduce energy use, usually by foregoing some quality or quantity of energy services. Especially in that period, efficiency advocates often dismissed
conservation as carrying a negative image that confused consumer understanding of efficiency (Moezzi, 1998).

30
technologically-progressive image that the energy efficiency industry has worked to maintain
since the 1990s.18
Not using a clothes dryer is a way of life (Hackett, 1990), while using the clothes dryer is
normal in United States households (Gossard, 2004). Supply chain, know-how, and
administrative issues reinforce the machine-drying norm, as do the debates on when line-
drying is an appropriate way to save energy described just above. For example, a good setup
for line drying outdoors includes many clothes pins and a pulley system, all of which can be
found, but are not everyday items in many locales. Homeowner associations often ban outdoor
clotheslines (Hughes, 2007; Howland, 2012), despite conservation-minded energy analysts
challenging these restrictions even in the 1970s (Bainbridge, 1976). Savings from encouraging
air-drying would be difficult to prove, while programs can easily count savings from deploying
more efficient clothes dryers.
This sets up an historically- informed thought experiment that starts with the fact that how
chores are accomplished are cultural, social, and part of one’s identity (Hackett, 1990). Could
air-drying clothes, for example, become a normal activity? Given California’s ambitious plan for
energy transition, might the non-device, practices-centered, version of efficiency that air-
drying clothing represents help forge a different route to energy savings? Air-drying has a
different aesthetic than machine drying, one that is more artful (Hackett, 1990) and more
weather-connected (de Vet, 2016), though lacking some pleasures of a dryer (such as laundry
done quickly, being less wrinkled, freshly warm). Still air-drying clothes represents a large
potential for energy savings with little upfront investment. It could even develop as a natural,
normal thing to do if synthetic fabrics become more popular.19 But promoting it through energy
programs would require major reorientation in how energy savings are sought, to overcome
the politics of recommending conservation and the difficulties of accounting for savings, as
well as to find ways to make shifting to air-drying attractive and practical.
Smart Homes
The energy efficiency field has often envisioned the residential energy future in terms of the
type of home that will dominate that future, whether Smart, Zero Net Energy, or all-electric,
for example. These have been hardware-based visions of homes that are conceived to fulfill
specific policy goals. There has been little serious reflection of how people fit into these
visions, even as debates on the technical definitions of these home types can continue for
years.
The section below analyzes the Smart Home concept in its role for evolving thinking about
future homes. It is not about the history of any coherent execution of Smart Homes
18 There are exceptions. In 2019, Energy Upgrade California prominently lists conservation and maintenance
measures as ways to save energy (such as replacing HVAC filters, turning off the lights, and using fans and open windows to keep your home comfortable) in addition to efficiency recommendations; available at https://www.energyupgradeca.org/the-movement/. One of their 2019 spots, “It all adds up” features a dark
home interior (also symbolizing a darkened viewing screen) and air-drying laundry inside the home (https://www.youtube.com/watch?v=nNWxRq0jQ8U).
19 See https://www.theexpresswire.com/pressrelease/Synthetic-Fabrics-Market-2019-Analysis-Growth-by-Top-
Companies-Trends-by-Types-and-Application-Forecast-Analysis-to-2024_10301286

31
themselves, which, even in the early 2000s, were described as nonexistent (Aldrich, 2003).
What is “smart” is a moving target that is highly relevant to plans for the grid of the future,
one consisting of distributed energy resources, new systems of supply, and higher
engagement of people in the timing of energy use, even if many of these decisions are
automated (Alstone et al., 2017).
History of the Smart Home Concept
The smart home concept dates at least to 1972 (Brush et al., 2018; Darby, 2018), and Smart
Home as terminology dates at least to 1984 (Harper, 2003).20 Harper (2003) describes a Smart
Home as one with interactive technologies, while Brush et al. (2018) defines a Smart Home as
one with “connected devices and software that can automate and control those devices.”
These are ambiguous definitions, befitting a concept and set of technologies that have
changed over the decades.
The 1980s attention to Smart Homes was not about energy per se. Rather, the energy
efficiency industry started engaging with the Smart Home concept in the 1990s, at first via
early versions of smart appliances, arguing that smartness reduces waste relative to manual
operation, and provides users with convenience as a bonus. The Smart Home concept evolved
as the Smart Grid took shape, especially beginning in 2009 in California with the support of the
American Recovery and Reinvestment Act.21 Current energy policy interest in Smart Homes has
much to do with their potential to provide automated demand response (King, 2018) such as
through smart thermostats and direct load control (Alstone et al., 2017), as is presumed to be
needed to help manage the grid variability instilled by high levels of renewable energy supply.
Smartness provides cachet that has been bundled with image of efficiency as high-quality,
advanced, and elite. For example, the “world’s first Internet refrigerator” was launched in
2010. It had a TV-enabled LCD screen with LAN port, scanner with inventory system to keep
track of what was in the refrigerator, MP3 player, and temperature monitoring (Floarea and
Sgâriciu, 2006). But it was expensive and a commercial failure. Its features, however, are
similar to top-range smart refrigerators offered now, which are upgraded to more current
connectivity such as music streaming, built-in cameras, and control of other smart devices.22
This is an example of what social scientists have called “funwashing” (Darby, 2018) and
“pleasance”—a mixture of pleasure and (potentially) convenience (Strengers and Nicholls,
2017). From an energy transition perspective, the most notable feature of recent smart
refrigerators is their use of sensors and controls to reduce energy use through optimization,
and to respond to signals to reduce demand for limited periods of time(Elliot, Molina, and
20 The concept of home automation is millennia old. The stable of new devices and appliances powered by
electricity that entered even normal homes in the early 20th century was a major step in making home automation normal.
21 See the CPUC’s Smart Grid hub for details (https://www.cpuc.ca.gov/General.aspx?id=4693). Bakke (2016)
also describes this shift in historical perspective.
22 For example, Samsung’s Family Hub refrigerators. Nor was it necessarily intended to be a commercial success
or highly useful, versus a showpiece and experimental step toward an unknown future set of consumer desires. One product reviewer writes, for example, “the Internet-enabled fridge has been the butt of tradeshow bylines
for years” (Kanellos, 2016).
32
Trombley, 2012). The refrigerator thus becomes part of the Smart Grid, with an emphasis on
two-way communication between energy users and utilities.
These visions, which appear to be about technology, implicitly hinge on industry expectations
about people. Yet in most Smart Home discussions, people have appeared primarily as
idealized generic consumers, essentially instruments (and purchasers) of the technology.
Energy efficiency advocacy assumes that households will or should want what Smart Homes
provide, for example that smartness will give consumers “the opportunity to take part in
demand response programs” (King and Perry, 2018), with the hopes that these consumers will
cede control to an intelligent network bridging the home with the outside world. 23 But others
are skeptical about the appeal and benefits of this smartness (Darby, 2018; Gram-Hanssen
and Darby, 2018; Hazas and Strengers, 2019). The interoperability of home smart devices also
poses challenges (Noura et al., 2018).
In the efficiency advocacy narrative of Smart Homes, people are assumed to benefit from the
convenience and energy savings that smartness provides, technology providers benefit from
access to user data and the ability to operate with higher systems efficiency, everybody
benefits from assumed energy and emissions savings, grid stability, and perhaps certain
populations benefit from other smart features (e.g., monitoring the welfare of less-abled
people). The overall efficiency advocacy vision runs even deeper than this, for example, in
using intelligent efficiency to densely link activities in the home to Information and
Communication Technologies networks, and to find a higher level of efficiency by moving from
device-level to a systems-level scale in managing electricity (Elliott, Molina, and Trombley,
2012).
Implications of Smart Home History for Future Planning
The efficiency industry has described smartness in homes in highly win-win language: “Smart
homes use technologies like smart thermostats, appliances, and lighting to enhance residents’
comfort and convenience in their homes… Not only do smart technologies offer comfort and
convenience, but they also can save energy by automatically controlling the equipment in the
home and using energy only where and when it is necessary. They can also collect real-time
data on energy use and communicate with the electric grid, which can lead to more savings”
(King, 2018: iv).
Home energy technology will continue to be developed to provide the envisioned automation,
and with improvements over time (learning thermostats such as Ecobee or Nest). What is less
clear is how much and in which cases these claimed benefits will ensue, how widespread the
acceptance of these systems will be, how they contribute to or distract from energy transition
goals, and what knock-on consequences they may have.
As to how Smart Homes have performed to date, this is a difficult question. Aside from what is
implied in a handful of demonstration projects, the threshold for defining a Smart Home is
unclear. Darby (2018, p. 143) concludes that “[t]here is a striking dearth of evidence on home
energy consumption pre- and post-smarting.” Also, for the purposes of managing the Smart
Grid and distributed energy resources, overall changes in energy use are not necessarily a
23 Darby (2018) categorizes smart home discourses by the level of engagement with human users, with one
narrative strand technology-only, and the other focused on users.
33
critical metric, even if the rationale for these systems is partly based on their promises for
integrating renewables.
While Smart Homes have the potential to be effective in meeting energy transition goals, the
high expectations for how they will perform in the real world are necessarily unproven. The
discussion above illustrates some of the questions about interactions between technology and
society that will help determine the level of success. For successful technology planning, this
suggests the need for a multi-disciplinary step back to critically review assumptions about
what smartness will do considering the history of automation, and the history of smart
initiatives and experiments to date. For example, one of the shortcomings of early
programmable thermostat initiatives was that estimates of savings potential assumed that
people did not set back their thermostats at all. That assumption was wrong in many cases
(Nevius and Pigg, 2000; Malinick et al., 2012; Lutzenhiser et al., 2017) and led to savings
overestimates.
In short, rather than focusing exclusively on constructing ideal technologies imagined from an
engineering point of view, the historical view adopted above underscores the need to look
deeply and empirically at the “what, why, who, and what else” aspects of shaping and
deploying these smart technologies. As a companion to the Smart and other technology-led
visions of the future of homes, it is useful to ask what a future home should look like more
generally. What are the consequences of investing strongly in a paradigm where the home is a
densely connected node in the Internet of Things? How does this paradigm balance with goals
for resilient systems and society? What alternative visions of modern homes might be
pursued? The “Smart” vision imagines homes as precisely designed through detailed models
and automated for energy efficiency, serving as an active node in a network of distributed
energy resources. Another vision could be less about efficiency optimization and network
connections, and instead foreground a more manually adaptive paradigm for inhabiting a
home.
Continuing Histories Current patterns and practices of energy use are not inevitable outcomes of technological
progress, but results of a historical unfolding of technology and the society that accompanies
it. The histories of residential energy technologies and energy efficiency included above are a
taste of what could easily be a bigger investigation. One benefit of these histories is that they
illustrate the effects, surprises, and problems of technology change in a broader framework
(total energy consumption, dynamic system interactions, and longer time periods) than has
been the norm in energy efficiency. They show, for example, how technologies themselves
change both “needs” and energy use in ways that are invisible within the normal boundaries of
efficiency evaluation. They also point to alternative approaches to reducing energy use GHG
emissions through influencing systems of energy use (keeping cool, acquiring food, or even
defining comfort) versus swapping in what are assumed to be more efficient technologies.
Examples are explored in the next chapter.
Chapter Summary
• There are many decades of experience with past energy technology change and with
energy efficiency’s role in these changes, but analytical histories detailing the critical

34
lessons learned from this experience are largely unavailable within the energy efficiency
industry. A critical examination of residential energy technology history thus offers a
currently missing perspective by highlighting practical experience that can be applied to
energy transition planning.
• The insights from this analysis can be used to reorient energy efficiency practices to
forms more aligned with the challenges of climate change and that take fuller
advantage of the contemporary data, communication, and professional environment of
climate change work, including the multi-disciplinarity these networks invite.

35
CHAPTER 3: Applying Energy Technology History
Histories of residential energy technologies and the energy efficiency approaches related to
them create a resource for planning the ongoing transition to a decarbonized energy system.
They illustrate how home technology change takes place in society and reveal blind spots in
past efficiency work. This chapter extracts lessons and themes from those histories, presented
with examples and discussion of policy implications. These are grouped into two disciplinary
categories: (1) history and social sciences of technology and of energy, and (2) energy
efficiency history.
Lessons from History of Technology and Energy Social Sciences Scholarship Table 2 (next page) summarizes lessons about energy technology change drawn from
research in energy history, social sciences of technology, and energy social sciences. Details
on each lesson are provided below the table.
1: Technologies in the Home Co-Evolve with Systems Outside the Home
Energy technologies in the home evolve with technical and cultural systems outside the
home—refrigeration and cooking with food supply, distribution, and cultures; laundry with the
garment industry and fashion; heating and cooling with cultures of comfort and urban
infrastructure, for example. This is a reason that energy use in homes differs so much across
countries and even within regions and across social groups: local systems of appreciating and
doing, such as eating or relaxing, vary a great deal (Wilhite et al. 1996). Focusing on
technology inside the home in isolation makes sense for programs targeting modest efficiency
increases in near-term time scales. But that view is restrictive relative to achieving the big
changes needed for California’s energy transition.
Energy sociologists have argued that “tools and technologies ought properly to be analyzed
historically, as in effect ‘social movements’” (Hackett and Lutzenhiser, 1985). Seeing
technologies as interlinked with social movements can lead to much different technology
planning possibilities than seeing technologies just as hardware. The former allows a deeper
understanding of how technologies and practices change from novel to normal, and thus
better foresight and wider scope for forging desired pathways for the future.

36
Table 2: Lessons from History of Technology and Energy Social Sciences Perspectives
No. Observation Implications
1 Home energy technologies are
parts of larger systems inside and outside the home.
Addressing energy systems at a larger socio-
technical scale can provide new leverage points for decarbonization and illuminate
roadblocks to change.
2 Technologies and innovations
create needs rather than just serve them
Focusing only on efficiently fulfilling assumed
needs is misaligned with GHG emissions reductions goals. Instead, energy transition
planning must recognize how needs are created, evolve, and dissolve, and use this
knowledge to help shape socio-technical evolution with policy goals in mind.
3 It is difficult to pick a technological winner beforehand.
The commercial success of technologies depends on factors beyond technical qualities,
and can hardly be predicted. Closer, broader monitoring of the performance and reception
of energy technologies promoted by policy can help correct problems.
4 Older technologies have a viable place alongside more modern
versions
Encouraging older technologies to remain in the mix, and improving them where relevant,
could provide energy savings, demand reduction, and resilience in some situations.
5 New homes have become
substantially larger over the past 40 years, leading to an under-the-radar source of increased energy
service demand per capita.
Energy use associated with increased home
size is poorly captured by efficiency metrics. Encouraging reduced house size (such as a 1,700 square foot house that is as satisfactory
as a 2,300 square foot one) could reduce energy use, but alternative forms of
measurement would be needed to credit this type of savings.
Source: QQForward, 2019.
Examples
The amount of refrigeration needed in homes depends on food production and distribution
systems. The cold chain described in Chapter 2, along with household practices of stocking
frozen and refrigerated foods purchased in bulk from a warehouse store, affects how
households gauge their refrigeration needs. Refrigerator energy efficiency efforts succeeded in
efficiency’s own terms (Chapter 2). But refrigerators are now bigger and more homes have
two refrigerators than ever before.24 This greater refrigeration capacity accompanies higher
24 According to EIA RECS data, 30 percent of households had at least two refrigerators in their homes in 2015,
compared to 15 percent in 1993. In 2015, 43 percent of refrigerators had storage of 23 cubic feet or more, while
in 1993 only 4 percent did (EIA RECS, 2015; EIA RECS, 1993).

37
levels of stocking food in the home. A bulk-buy system of food procurement is not necessarily
less energy-efficient than others,25 but large stocks of food can contribute to household-level
food waste (Davenport, Qi, and Roe, 2019). The USDA estimates that 30–40 percent of food in
the United States is wasted (USDA, 2019), along with the energy, pesticides, fertilizer, and
other resources used in producing and transporting that food.
For a second example, while there are multiple reasons central air conditioning in homes has
become the norm (see just below), one is that people become conditioned to value it through
exposure outside the home (e.g., Ackermann 2002)—so there is a system of learning to
appreciate air conditioning.
Implications
The normal starting point for influencing residential energy use has been the home or
consumer in isolation. Looking to larger systems presents a richer set of possibilities, following
Donella Meadows’ question about where to intervene in a complex system to create a desired
effect (Meadows, 1997). One proposed alternative framework to see in a systems view is to
make social practices the object of energy planning (Shove et al., 2012; Rinkinen, Shove, and
Torriti, 2019; Strengers and Maller, 2011). Japan’s Cool Biz movement, for example, aimed to
lower air conditioning use by encouraging less use of air conditioning in the workplace, not
just by ordering higher indoor temperatures, but by making these warmer temperatures a
topic of conversation and physically more tolerable—for example by promoting changes in
dress codes and even clothing material more suitable for warmer temperatures (Shove, 2016).
Cool Biz coordinated shifts in intersecting lines of cultural practices (air conditioning levels,
dress code expectations, comfort expectations) toward lower levels of air conditioning.
This approach contrasts with seeking to increase technical efficiency piece by piece. The
familiar energy efficiency analysis structure is organized by sector, using sector-specific or
end-use specific metrics to gauge the energy effects of technical change. For example, the
residential sector is considered in isolation from the transportation sector (with current efforts
to integrate electric vehicle charging overcoming some of this separation), improving heating
can be pursued without thinking about heating efficiency’s effects on cooling, and embodied
energy in materials may be overlooked (Cabeza et al. 2014). Siloing makes problems tractable
but at the same time overlooks interactions that can lead to higher or lower energy use
overall. Climate-scale planning is faced with finding ways to help better think through and
influence these contingencies, even including possibilities (such as influencing the food
system) that might have seem fantastical in the energy efficiency policy era.
2: New Technologies and Innovations Create Needs as Much as Serve Them
The concept of “needs” is a fundamental building block of residential energy efficiency
planning. Energy efficiency has been defined in terms of the energy required to fulfil the set
and level of services that consumers want. History makes it obvious that needs are not fixed,
25 Researchers have examined food externalities and life cycle cost estimation (Weber and Matthews, 2008; Pretty
et al., 2005), the food-energy-water nexus, and how households manage refrigeration (Davenport, Qi, and Roe, 2019). A survey-based study also found that households that did shorter shopping trips (30 minutes or less) had higher utilization rates of the food they purchased (Davenport, Qi, and Roe, 2019) versus the less frequent
bigger-order trips expected in warehouse-style food shopping.

38
and that changes in “needs” change energy use. New needs can be fostered by new
technologies, and even by efficiency efforts (such as possible in the ENERGY STAR air
conditioning example above). In other words: “What [a tool] is good for is a consequence, not
a determinant, of its use” (Hackett and Lutzenhiser, 1985); “Invention is the mother of
necessity” (Kranzberg, 1986); and as practice theorists see it, “‘practices recruit users” (Shove
et al., 2012).
Historically, energy efficiency programs have been justified by demonstrating countable
savings relative to a counterfactual. For example, an efficient central air conditioner is
compared to an inefficient one of the same size. The baseline technology is thus defined as
fulfilling a fixed need. The more services that are defined as needed, the greater the potential
for finding savings through efficiency. This means that new needs and new energy use can
even be created in the name of efficiency. And conversely, it is possible to foster lower-energy
needs without leaning on traditional efficiency improvements or even notions of conservation.
Examples
Various stakeholders coordinate to make specific technologies “needed.” One interesting
example from energy history is load building, where industry actors have promoted a specific
technology at low cost with an eye toward selling the energy needed to power them especially
in ways that contribute to profitable demand profiles. Examples include power industry
pioneers efforts to get electricity-using equipment into American homes in the late nineteenth
and early twentieth centuries (Bakke, 2016; Munson, 2005); discounted gas water tank water
heaters in California that turned interest away from solar water heating to build a customer
base for natural gas (Butti and Perlin, 1980); and increasing size of refrigerators in the 1960s
(Deumling, 2004). Such deliberate needs creation are normal business strategies that can
work against the goals of lower energy use, even when the products sold are efficient. While
the profit structure of the power industry has shifted, some version of these interests will
remain (e.g., for electric vehicle charging).
As a second example, the availability of affordable central air conditioners shifted residential
architecture and construction. Passive cooling elements such as eaves, porches, and operable
windows were replaced by the cheaper-to-produce option of central air conditioners (Cooper,
1998).26 In turn, households had fewer options for passive cooling, leading to reliance on
central air conditioning. That is, architecture that supported passive cooling became outmoded
due to the promotion of competitively priced central air conditioning, which reinforced a
demand for using central air conditioning. This is not the only reason that central air
conditioning became so popular (Hitchings and Lee, 2008;Walker, Shove, and Brown, 2014),
but together these shifts feed new definitions and expectations of comfort (Brager and de
Dear, 2003) corresponding to new ways of achieving it. Air conditioning is sometimes difficult
to talk about because it is viewed (like conservation) as a moral issue (Cashman, 2017);
seeing it instead as a matter of the influence of larger technological systems (see the section
26 Air conditioning system advertisements to home builders sometimes even made this tradeoff explicit. For
example, an advertisement for Mueller Climatrol noted that “…at least part of the cost of cooling equipment may be offset by good planning. As an example, with cooling it would not be necessary to provide screens for those rooms that are cooled, or to provide a screened-in porch” (National Museum of American History, Archives Center
(NMAH-AC0060-0003327; estimated date 1953).
39
just above) provides some less-loaded leeway for finding lower-energy alternatives where
suitable.
Even efforts to increase energy efficiency can reinforce energy needs. In Australia, rewarding
efficient air conditioning has been found to devalue home designs without air conditioning
(Kordjamshidi and King, 2009; Williamson, 2000). There are similar examples in California. The
ENERGY STAR residential program scored having Seasonal Energy Efficiency Ratio (SEER) 16
air conditioning highly toward achieving ENERGY STAR status. High-SEER air conditioning thus
becomes a default, regardless of climate zone. For example, coastal areas of California
historically have had relatively low saturations of central air conditioning.27 The pursuit of an
ENERGY STAR home rating can encourage adding central air conditioning, even in areas where
lower-energy alternatives might work well (Energy Institute, 2011; Chong, 2012).28 This
influence can inadvertently increase energy consumption relative to what would have
happened in the absence of ENERGY STAR program. If weather remains mild in these
marginal areas, central air conditioners may not add much energy consumption, but they add
expense that could be invested more effectively in other efficiency (Davis, 2019) or resilience
measures.29
This example illustrates some downsides of standardization across the tremendous diversity in
how energy is used across households. Builders and sellers gain advantages by adding air
conditioning, thus normalizing air conditioning instead of other options, even as codes and
policies formally admit designs that use other methods for cooling.30 Normalization and
standardization provide administrative clarity and systems coordination, but can run at odds
with integrating efficient modes of cooling given the natural variation of households and
geography (Shove and Moezzi, 2004; Davis, 2019).
For another example of how efficient technologies can create needs, autonomous vehicles, still
rare, are sometimes considered to be a route to reduce GHG emissions from transportation
along with convenience and safety benefits. But some test cases suggest that their use could
lead to increases in vehicle miles travelled (EIA, 2018; Greenwald and Kornhauser, 2019;
Zhang et al., 2018). Autonomous vehicles do not simply substitute for vehicles with drivers,
they change vehicle roles. The convenience and possible lower operating costs they offer
could encourage more vehicle use overall. The popularity of free shipping at retail shopping
sites is similar: free shipping reduces the apparent cost barriers to acquisition which may
27 For example, according to the 2009 RASS survey, only 11 percent of homes in CEC Forecast Zone 5 had central
air conditioning, and 22 percent in Zone 11 (KEMA RASS, 2009).
28 This example was identified by Reuben Deumling, who notes that while alternative designs are possible to
achieve an ENERGY STAR Home rating, doing so requires extra effort and risk on the part of the builder.
29 The economist Lucas Davis argues that standards requiring central air conditioners to be high SEER no matter
what the location can add considerable expense for air conditioning in areas with infrequent need for cooling, but have little payoff in terms of reduced bills or GHG emissions (Davis, 2019).
30 Behavioral economics has become a popular perspective through which to think about and influence consumer
decisions for energy and environmental goals, for example by framing the most environmentally desired decision as the default choice (Sunstein and Reisch, 2014). These principles can also be applied to analyzing energy-
related decisions elsewhere in the energy system at large, such as builder decisions.

40
encourage more purchases, with an array of shifted costs and benefits to various parties. The
outcomes in the case of autonomous vehicles are as yet unknown, but taking a more systems
view of driving could provide useful foresight for imagining scenarios of how automobile
innovations might change use and in influencing use cost structure.
Implications
Energy efficiency endorsement and regulation typically adopt the stance that energy service
needs are best taken as given, and pursue an objective of promoting technologies that fulfill
these needs efficiently..31 This creates a twofold complication for energy efficiency in pursuing
the goal of absolute reduction of energy use. First, efficient technologies can create additional
needs and possibly additional energy use. Second, independently of efficiency, needs and the
means to fulfill them will continually evolve, creating a moving target for efficiency (Wilhite,
2016).
Proactive consideration of these possibilities leads to new guiding questions: How can climate
change policy help steer the creation of needs toward those with lower impact, versus
focusing on efficiently providing any services demanded at they evolve? When might
promoting efficiency or renewable energy (e.g., individually-owned solar) standardize higher
needs, and how should this possibility be addressed, if at all? These questions see reducing
energy use less as swapping in neutral technology, but as helping transform how activities are
accomplished and how needs are defined.
Social progress is often implicitly assumed to mean increasing standards of living and
increasing energy service needs for entire populations (Wilhite, 2016). Some civil movements
have pushed back against this pattern of escalation. For example, voluntary simplicity (an
ancient idea) has had fluctuating popularity over the past century (Leonard-Barton, 1981).
Another is enthusiasm for reducing the amount of stuff that fills homes (Pannett and Hoyle,
2019). Both examples represent a nongovernmental embrace of backing off consumption.
There are more organic examples, such as households deciding that they do not need
something that is often considered the norm, such as air conditioning (Deumling, Poskanzer,
and Meier, 2019). These examples are about alternative definitions of needs, versus
conservation per se. Rather than making dialed-back definitions of needs an effortful choice,
there may be ways to naturalize them.
Seeing the patterns illustrated above as legitimate concerns for transition planning faces the
complication that it is difficult to assess their presence or importance due to statistical and
data limitations, and because technology assessment practices rarely even scan for this kind of
effect. But exploring these micro-scale effects, even if largely qualitatively, and estimating
their macro implications schematically, can be accomplished scientifically and can help guide
technology policy.
3: The Best Technology Does Not Necessarily Win
Different versions of technologies compete, with industry and other stakeholders highly
engaged in this competition. Technologies do get better. But one technology may virtually
31 Energy service here refers to the way of using energy, such as a need for a central air conditioner to keep the
home at 72°F (22°C), for example.
41
eliminate others, less through innate technical superiority than through strategy and
happenstance. Promising technologies may fail if they insufficiently distribute value throughout
the supply chain. This unpredictability is at odds with the fact that government technology
policies often pre-select which technologies are best, before sufficient information about real
performance or impacts are available. Marchant (2009) notes, “The historical record is that
governments (along with everyone else) have a relatively poor record in picking which future
technologies will best succeed in achieving a particular objective.” Technology planners are
faced with the need to find creative ways of monitoring technology performance, in tension
with focusing on prospective performance.
Examples
Condensing natural gas refrigerators were common in the United States during the 1920s.
Soon after, electric compressor-based refrigerators completely dominated the market, and
have ever since (Cowan, 1985; Rees, 2013). Big companies that had already established a
solid manufacturing business in realms such as car radiators or farm implements had a major
advantage over small companies trying to enter the domestic market, thus shaping the
technical characteristics of refrigerators through the industrial competition at hand (Cowan,
1985). Other abandoned appliances include central vacuum cleaners and horizontal axis
washing machines (Cowan, 1985); solar water heaters (Moezzi et al., 2019);32 CFLs, which
have been outsold by LEDs since 2017 (NEMA, 2018); and electric versus combustion cars in
the early twentieth century (Kirsch, 2000). But electric cars have made a comeback a century
after they faded away in the market, and horizontal axis washing machines have been
repopularized in the United States.
Currently, electricity and natural gas are now competing for space heating, water heating,
cooking, and clothes dryers in California homes, with natural gas dominating (KEMA RASS,
2009). A gas transition strategy is needed (Aas et al., 2019) to manage this competition
toward achieving the state’s decarbonization goals. The recent pattern of Public Safety Power
Shutoffs creating blackouts lasting several days even in urban areas could, however, lead to
renewed interest in (or reluctance to abandon) gas appliances, since they can allow cooking,
water heating, and other home energy services during power outages—potentially important
forms of socio-technical resilience for homes without generators or home energy storage.
Implications
Climate change policy goals create a common vision around which multiple parties can rally
and coordinate. These often specify a technological route to a committed end goal far in the
future. Some types of uncertainties are acknowledged (e.g., more or less technology
penetration depending on economic assumptions), but these usually do not address the
dynamics that create these uncertainties. Marchant (2009) suggests that the means of
achieving policy goals are left relatively open rather than picking a winner too early, and that
safety valves are in place to provide flexibility (Marchant, 2009). Otherwise inflexible
commitments can lock in technological pathways through infrastructural, market, regulatory,
standardization, habitual, socially normative, scale, or other factors (Unruh, 2000; Grübler,
32 As also noted above, natural gas water heaters were promoted and subsidized by natural gas companies in
California in the 1930s and 1940s, to the detriment of solar and electric water heating (Butti and Perlin, 1980).
42
Liebowitz and Margolis, 1995), even when these pathways no longer seem desirable or
reasonable. Doing so could help come to terms with disappointments or commitments to
misplaced assumptions that proponents may otherwise be reluctant to formally admit.33
Whether a technology succeeds as envisioned is not just a matter of consumer acceptance.
Cowan (p. 215) summarizes: “In an economy such as ours in the United States, the first
question that gets asked about a device is not, Will it be good for the household—or even, Will
householders buy it? but rather, Can we manufacture and sell it at a profit?” That is not just a
matter of manufacturer ingenuity, but depends on a host of other system issues (such as
related to supply chains, regulations, tariffs). Profitability will shape how sustainability gets
defined, but profitable sustainability may be inconsistent with more grounded definitions of
sustainability.
4: Old Technologies Persist Alongside New Ones and Could Make Comebacks
New technologies and practices often largely replace older ones, but these older ways of doing
may remain layered with contemporary technologies (Kelly, 2011) for decades or even
centuries. Some older technologies can be lower impact environmentally than their modern
counterparts or otherwise have a different set of advantages that can suit certain situations
very well. This recognition contrasts with a widespread perception that technology evolves to
becoming singularly better than alternatives.
Examples
There are many examples over the past century. To name a few: older technologies and
practices that are still used but are less energy-intensive than dominant technologies include
air drying clothes versus using a clothes dryer, evaporative coolers versus central air
conditioning, solar water heating versus fossil-fuel based methods, and bicycling short
distances versus driving.
Some old technologies that were once the target of energy efficiency programs became much
less prominent over a decade or two: DVR devices (replaced by streaming), desktop and
laptop computers (partly replaced by tablets and smart phones), landline telephones and
answering machines (partly replaced by mobile phones), ironing (still practiced, but less so
due to changes in social standards and fabrics), and waterbeds.34 In other cases, how much
something is used declines. Cooking is a prime example, with much less time spent cooking
33 For example, one common assumption is that “homeowners are going to recognize the value of energy
efficiency like the energy efficiency itself does, and then voluntarily upgrade their existing equipment and homes,” which, left unchecked, takes on an “if only” character of planning that can mistake ideals for
achievements (Moezzi and Janda, 2014).
34 Waterbeds had very high energy consumption (1,103 kWh/year according to Nore and Roberts, 1994) and for
years were tracked separately in EIA’s residential energy end use accounting. In 1987, the height of waterbed
popularity, they represented 22 percent of mattress sales (Wells, 2016). But they eventually lost their countercultural vibe, and at last available estimate were present in only 0.5 percent of households (Greenfield, 2010). This change could be interpreted as having saved a great deal of energy, even if the changes were not
primarily because of energy efficiency concerns.

43
and increasing amounts of food preparation occurring outside the home comparing the mid-
1960s to the mid-2000s (Smith, Ng, and Popkin, 2013).
Implications
Some older home energy technologies could be redeveloped and revived to serve along with
their modern counterparts, providing advantages in certain locales or situations. These could
be modernized with engineering improvements—such as a better evaporative cooler or more
bullet-proof solar water heater. Any technology needs a support system, including availability
of parts and know-how, social familiarity, compatibility with regulatory requirements, and
complementary infrastructure, which would be needed to be retained.
Some of these older technologies also provide resilience when electricity supply is limited. For
example, passive cooling or lower-energy forms of active cooling such as evaporative units
could take the edge off demand from central air conditioners on hot days when grid capacity is
stretched. Evaporative coolers could be add-ons to homes that already have central air
conditioners (Watt, 1986).35 This would have grid flexibility benefits and possible health
benefits, such as cooling for people who do not want, rarely need, or cannot install central air
conditioning.
Unless intentionally pursued, these possibilities may be missed in technology planning for
several reasons. Promoting older ways of doing can seem retrograde rather than progressive.
And again, programs cannot easily account for savings from “not using” or “hot having.” Thus
savings from line-drying clothes, using smaller refrigerators, building smaller homes,
developing free-running versus active heating and cooling in the home, or using evaporative or
room air conditioners versus central systems, for example, may be difficult to see, contra
savings afforded through purchases of efficient products. But there may be a promising middle
ground, at least in terms of contributions to resilience (Alexander and Yacoumis, 2018).
5: Growth in House Size Increases Energy Use
The amount of space to be heated, cooled, lit, and filled per home and per person is greater
now than it was in the 1970s. The median size of a single-family home built for sale in the US
was 2480 square feet in 2017, 61% bigger than the 1545 square foot median in 1973 (U.S.
Department of Commerce 2018), and U.S. homes in general are among the biggest in the
world (Pinsker, 2019). Increasing home size combined with decreasing household size (Fry
2019) leads to more “home” per person, eroding energy saved by technical efficiency in the
meantime (Lutzenhiser et al., 2017). Efficiency promoters sometimes describe this as “win-
win” for efficiency and the public (EIA, 2015; RESNET, 2015; see Chapter 2). The double win
follows from how efficiency savings are defined: factoring out size or level of services, with
bigger savings calculated relative to bigger less-efficient alternatives.
Implications
Encouraging more space-efficient home design and making communal living more attractive
could help reduce energy use per capita. This need not be about mandating high-density
35 It may even be possible to combine low-energy technologies with higher-intensity technologies as a single
system, somewhat akin to the Variable Speed Drives sometimes applied in commercial HVAC for energy
conservation.
44
housing. Rather it could start from recognizing the many influences that encourage bigger
houses, including land planning practices and deep cultural identifications of house size
(Pinkus 2019). Construction practices and social norms could possibly be reset toward smaller
houses, for example by encouraging more space-efficient home design or showing smaller
spaces in a positive light. And it may be possible to instill more attention to energy and
resource use in “nonenergy” policies including those of land planning (Cox, Royston, and Selby
2019).
Lessons from Energy Efficiency Program and Policy History Table 3 summarizes observations from the history of energy efficiency that can be applied to
improve energy transition planning. These ideas will be familiar to those in the energy
efficiency field who have long heard about energy efficiency gaps, building-performance gaps, and rebounds. In fact, these issues may seem so familiar that they no longer seem
problematic. But they are major inflection points for adapting efficiency practices to climate
change problems, as explained below.
1: Energy Efficiency Does Not Necessarily Track Energy Consumption
Energy efficiency orients to how things are done rather than what or how much is done. The
“how” has long been developed into a tractable energy problem, but perversely for reducing
absolute energy use, higher nominal energy efficiency in homes can be associated with higher
levels of services, such as a bigger fridge or bigger house (Harris et al., 2008; Moezzi and
Diamond, 2005).36 This Trojan horse effect means that extra energy consumption and GHG
emissions can be encouraged in the name of efficiency. The extent of this effect is
controversial (Goldstein, 2010), and efficiency cannot be ruled as causative, but the situation
again speaks to a mismatch between traditional energy efficiency goals and those of climate
change policy (Moezzi et al., 2018).
Examples
Efficiency metrics of energy use per unit floor area favor larger homes over smaller, less-
efficient homes (Lutzenhiser et al., 2017), and homes with air conditioning are sometimes
easier to define as efficient as those without, as noted above.
Beyond efficiency definitions, voluntary efficiency programs may be initially oriented to the
premium market, leading bigger, more feature-laden, more expensive, and sometimes more
energy-consumptive devices associated energy efficiency—as for ENERGY STAR refrigerators
(Deumling, 2004). Marketing images of energy efficiency often feature higher-consuming
products, such as big houses or refrigerators, rather than more modest ones. Also, since
efficiency is defined in terms of devices or materials, rather than practices or larger systems,
the use or nonuse of devices cannot be reflected in efficiency ratings. An electric dryer can be
efficient, but line-drying clothes cannot be; rather line-drying is defined as “conservation”
36 The pattern occurs through different mechanisms and properties, including: physics, marketing energy
efficiency as a premium feature, higher levels of energy efficiency adoption among wealthier households, metrics that favor larger sizes in energy efficiency or energy savings determinations, cost-effectiveness criteria in relationship to pricing, energy-using devices being eligible to be considered as energy-efficient whereas
passive/manual alternatives are usually not, and, from economics, the direct rebound effect.
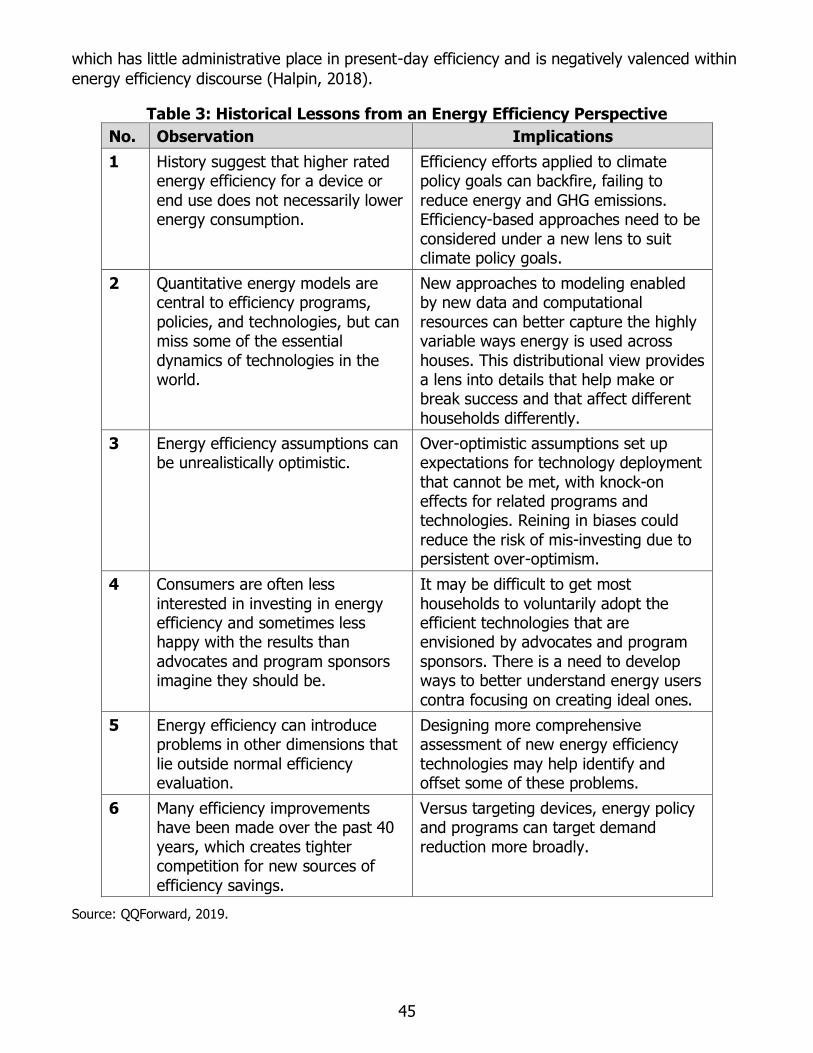
45
which has little administrative place in present-day efficiency and is negatively valenced within
energy efficiency discourse (Halpin, 2018).
Table 3: Historical Lessons from an Energy Efficiency Perspective
No. Observation Implications
1 History suggest that higher rated energy efficiency for a device or
end use does not necessarily lower energy consumption.
Efficiency efforts applied to climate policy goals can backfire, failing to
reduce energy and GHG emissions. Efficiency-based approaches need to be
considered under a new lens to suit climate policy goals.
2 Quantitative energy models are central to efficiency programs,
policies, and technologies, but can miss some of the essential
dynamics of technologies in the world.
New approaches to modeling enabled by new data and computational
resources can better capture the highly variable ways energy is used across
houses. This distributional view provides a lens into details that help make or break success and that affect different
households differently.
3 Energy efficiency assumptions can be unrealistically optimistic.
Over-optimistic assumptions set up expectations for technology deployment
that cannot be met, with knock-on effects for related programs and technologies. Reining in biases could
reduce the risk of mis-investing due to persistent over-optimism.
4 Consumers are often less
interested in investing in energy efficiency and sometimes less happy with the results than
advocates and program sponsors imagine they should be.
It may be difficult to get most
households to voluntarily adopt the efficient technologies that are envisioned by advocates and program
sponsors. There is a need to develop ways to better understand energy users
contra focusing on creating ideal ones.
5 Energy efficiency can introduce problems in other dimensions that
lie outside normal efficiency evaluation.
Designing more comprehensive assessment of new energy efficiency
technologies may help identify and offset some of these problems.
6 Many efficiency improvements have been made over the past 40
years, which creates tighter competition for new sources of
efficiency savings.
Versus targeting devices, energy policy and programs can target demand
reduction more broadly.
Source: QQForward, 2019.

46
Implications
Associating higher levels of energy services with higher levels of energy efficiency has been
expressed positively by the energy efficiency industry, as a benefit of efficiency, rather than as
detracting from its success (EIA, 2015; RESNET, 2015). For climate change goals37 that older
energy efficiency logic is less relevant. So how can energy policy prioritize lower energy
consumption versus more efficient consumption? How can this be accomplished without
making people worse off? This could be pursued, for example, by re-orienting how efficiency is
defined technically (Moezzi and Diamond, 2005), by focusing on more efficient practices (how
can people stay cool in their homes?), and by helping envision and support lifestyles that do
not rely on high levels of energy consumption. These pathways contrast with the more
conventional pursuit of more efficient technology (what is the most efficient central air
conditioner?). The argument here does not assume that top-down moral pressure to conserve
will have wide appeal. Rather, definitions and connotations of efficiency and conservation are
cultural (including professional cultures). They could be retooled to capture savings that
efficiency proper cannot or has not. This would require a perspective and a cadre of support
that goes beyond the traditional boundaries of efficiency field.
2: Energy Models Can Create Important Blind Spots
Quantitative energy models are central to efficiency programs, policy design, and technology
plans; and serve as a basic framework through which researchers and policy makers see
problems and solutions. They are necessary, will always simplify, and will always have inherent
uncertainties and biases. But models also have to be examined as to what crucial factors they
miss about the real world (dynamic interactions, diversity, long-term and knock-on effects,
systematic biases) and what difference these omissions make to policy outcomes. Historically it
has been difficult to pursue these questions, but the possibilities for (and necessity to) do this
kind of assessment are growing.
Examples
Models often use averaged assumptions to estimate savings from efficiency, but these
assumptions are not necessarily based on observation of actual use nor can they reflect
distributions or correlations across interacting distributions. For example, early programmable
thermostat program planning used assumptions that led to overestimates of actual savings
(Peffer et al., 2011). Laboratory and modeled definitions of efficiency may not reflect real-
world performance of, for example, heat pumps (CEC, 2019).
Implications
Wider dedication to empirical analysis of use and usability for specific technologies could lead
to improvements in the degree to which these technologies provide the results that models
and plans assume they deliver (Laurent et al., 2013). In short, studies that attend to how
households use, experience, and adapt to technologies can lead to better technologies and
37 Climate change goals here refers to the ensemble of goals targeted in California climate change policy,
encompassing not only GHG emissions reductions, but also energy systems resilience as well as various conditions on how these goals are accomplished, such as social equity and economic constraints. Energy efficiency policy also balanced multiple goals and conditions, but to a lesser extent and at a smaller scale than the
energy systems transition envisioned in climate change policy.
47
better estimates. This attention would dovetail with a shift of focus from technologies in
isolation to energy use practices (as suggested above). Along with this shift, developing
models constructed to reflect the distributional, multi-dimensional character of energy use
would permit better ways to see the structure of energy use and the various conditions and
events that interact with it—overcoming blind spots that simpler models (while certainly useful
for some applications) and overly-narrow requirements for evaluation reinforce.
3: Energy Efficiency Assumptions Can Be Too Optimistic
This is a corollary of the role of models noted above. If similar levels of optimism are reflected
in assumptions of future performance of transition technologies, they may deliver markedly
less than expected.
Examples
Three general examples that have repeatedly been observed in efficiency history. First,
engineering estimates of savings from efficiency may often overestimate achieved savings,
according to a limited set of meta-evaluations (see Chapter 2). In house efficiency labeling
schemes in the European Union, modeled energy consumption tends to be considerably higher
than actual energy consumption (Laurent et al., 2013). This has been called the pre-bound
effect (Sunikka-Blank and Galvin, 2012) and can lead to the overestimation of savings from
efficiency measures applied to these homes. The building performance gap (Fedoruk et al.,
2015) reflects a finding that buildings in use often perform less well than designed. For
example, commercial buildings may use twice as much energy as estimated by models (Imam
et al., 2017).38
Second, the rebound effect encompasses the theory that increased technical efficiency of an
end use can lead people to ask for more of that energy service or any services than they did
previously, thus eroding expected savings (Herring and Roy, 2007). The size of this effect is
controversial, partly because it is difficult to measure. Third, the energy efficiency gap asserts
that people under-adopt energy efficiency relative to levels considered rational in conventional
economic terms (see Lutzenhiser, 1993; Shove, 1998). Two of these effects (the building
performance gap and the energy efficiency gap) are often assumed to be essentially problems
about the behavior of people, but the reality is more complicated (Hong et al. 2017).
Implications
Exaggerated estimates of energy savings can mislead technology choices to configurations
that may not actually produced anticipated benefits. Historically, empirical performance data
have been difficult to produce, while designing technologies and buildings with given expected
performance has been tractable. Now, with new data and new problems, better ways to
anticipate, notice, and overcome performance estimation issues are possible and compelling.
This could involve a combination of better modeling (such as better incorporating variation),
technology designs that reduce the risk of poor performance, and more targeted evaluations
of technologies in use. The emphasis here is not a criticism of the underperformance of
modeling, but instead on recognizing systematic biases when and where they exist.
38 Most of the attention to the building performance gap has been for commercial rather than domestic buildings.
Performance gap research may be less common in the United States than in Europe.

48
4: Consumers Sometimes Dislike or Reject Energy Efficiency Offerings
Efficient technologies are not identical to the less efficient technologies that they are intended
to replace. Efficiency accounting has historically focused on energy comparisons alone, at best
with other differences generalized as nonenergy benefits. This calculation-centric view of
technology change ignores how end users and others in the market chain perceive, use, and
experience innovation. Product developers and marketers regularly improve their offerings in
response to consumer feedback or for market advantage. But this process can be slow and
incomplete, and can be impeded when incentives and other policies create impetus to widely
roll out qualifying products.
Examples
Aggressively promoted efficiency technologies that were met with high levels of dissatisfaction
include CFLs (Chapter 2), programmable thermostats (Peffer et al., 2013), solar hot water
heaters in the 1980s (Moezzi et al., 2019), and early generations of horizontal axis washing
machines (Hustvedt, Ahn, and Emmel, 2013).
Implications
Bad experiences with energy efficiency can poison public attitudes to efficiency in general,
reducing trust in energy efficiency or government energy recommendations. These consumer
experiences may be difficult to see from policy making and technology planning levels, in part
because they are not widely studied or called out.
More attention to avoiding overpromising, to anticipating and detecting problems with
technologies in the field, and to communicating with users about problems could help improve
efficiency design and consumer trust. A participatory approach to refining new technologies
could be useful. There are research traditions that can help at the design stage, including
human factors design (Sanquist, Schneider, and Meier, 2010), human-computer interaction
research, and social studies of technology. In some cases, satisfaction warranties may
overcome purchase hurdles.
This design/observe/monitor tactic contrasts with marketing approaches that focuse on
convincing consumers to accept a given technology, even as these marketing and frame-
making approaches can also be useful (Ahn et al., 2015). Put another way, the technology
assessments made by ordinary buyers, users, and sellers of technology are legitimate and
potentially useful data points for building better energy technologies, rather than simply
consumer mistakes.
5: Nonenergy Effects of Energy Efficiency Can Cause Problems
As noted above, technology designed to meet efficiency aims can introduce changes in
dimensions that lie outside the bounds of efficiency evaluation. Beyond the matters of
consumer acceptance and usability noted above, the nonenergy effects of technologies can
cause problems. On one hand, unintended consequences of government interventions are
inevitable (Merton, 1936), and technologies and policies cannot be optimized in all dimensions
even if problems are recognized beforehand. It is obvious that there are tradeoffs. On the
other, the systems to deal with these tradeoffs can be opaque. Tradeoffs span policy areas
and are usually incommensurate—such as all pollution versus greenhouse gas emissions
49
reductions, equity versus economic efficiency, coincident peak demand versus energy use.39
Some of these tradeoffs are recognized in the energy trilemma dialog that addresses balancing
politics, environment, and economics (Heffron et al., 2015).
Examples
There are many examples of tradeoffs from energy efficiency history. CFLs contain mercury.
Because of this mercury content, regulations require special handling for CFL disposal. The
actual rate of proper CFL recycling has historically been low, roughly 2 percent nationwide in
2011 (Janeway, 2011), if likely higher in California. Safeguards for mercury release from CFLs
are theoretically in place, but execution is far from guaranteed. So CFLs saved energy but
probably increased mercury pollution.
The case of the gasoline additive MTBE is similar (Marchant, 2009; McGarity, 2004). MTBE
helps gasoline burn more completely, boosting automobile fuel efficiency, but it contaminates
groundwater, resulting in effects on taste and possibly human toxicity. MTBE was banned in
California in 2002.
Ensuring a home’s airtightness for efficiency’s sake can lead to inadequate air circulation if the
mechanical ventilation systems do not work adequately or are used differently than modeled.
These differences are common and consequential (Less et al., 2014; Park and Kim, 2012); the
mechanical ventilation systems intended to provide controlled air circulation and sometimes
particle filtration (in lieu of the natural ventilation that occurs in homes that are not tightly
sealed) provide good indoor air quality in theory, but not necessarily in fact.
Even for behavioral conservation, too much conservation can harm health, for example, during
the 1970s energy crises, winter heat conservation left some elderly people dangerously cold
(Macey, 1989). Parallel examples likely exist for conserving energy during periods of excessive
heat (Lane et al., 2013; Maller and Strengers, 2011). Avoiding energy use is not uniformly a
good thing (Bushnell, 2017).
In energy efficiency history, there has been little categorical discussion of nonenergy costs,
contra attention to potential nonenergy benefits. Corrections to account for these nonenergy
costs can take more than a decade, as they did in the case of MTBE (McGarity, 2004). And if
the corrections rely on idealistic or untested assumptions about what people do, they may not
be effective.
Implications
With climate goals and the corresponding wider professional participation in climate versus
energy efficiency policy, there is both a need and a stronger possibility to directly negotiate
tradeoffs between GHG emissions reductions and other major environmental, health, energy,
and social effects. The quantitative models used in energy efficiency were not designed to
grapple with this scale of problem. At first, the topic of tradeoffs may seem too big to address.
With sufficient development, exploratory models like SIMSAND developed in this project
39 Some assessments use monetization to create comparisons, for example, estimating the external costs of
different types of electricity generation as a basis for policies that internalize these costs via pricing (Krewitt,
2002).

50
(Chapter 5), along with an expansion of scenario construction approaches (Chapter 4), could
help support tradeoff analyses.40
6: Efficiency is not an Unlimited Resource for Absolute GHG Reductions
Over the past 40 years, much device-level and structure-level efficiency has been applied in
California homes. State building codes and appliance standards have often been updated.41
Utility efficiency programs and market-led efficiency are well-developed in the state.
Consumers have become much more aware of efficiency. Federal appliance standards have
been periodically updated, as have efficiency specifications and product range for the Energy
Star voluntary labelling program.
These efficiency increases have been found to save a great deal of energy. So, how much
more potential for absolute reductions in household energy use are available using current
approaches? There are physics-based limits to efficiency as technically defined, and in the past
these limits have been overlooked (Bakke, 2016). State-mandated energy efficiency potential
studies provide estimates of remaining efficiency, including savings from applying efficiency to
new homes and products (Navigant 2019); much of this is relative savings rather than
absolute reductions. Many existing homes and appliances are not up to current efficiency
standards, so there is leeway. But getting efficiency upgrades into existing homes has been a
persistent difficulty over decades, and squeezing out extra efficiency at these margins may be
expensive.
Some engineering studies refute that the society is close to efficiency limits in general terms,
arguing, for example, that the overall efficiency of energy conversion globally is only 11
percent (Cullen and Allwood, 2016). It is not clear how this type of abstract assessment be
translated to the task of functionally ramping up efficiency for existing homes. Heating
systems can last decades, and homes can last a century or more, creating inertia relative to
goals for rapid transitions. The research team was unable to find much data that clarified
detailed engineering aspects of the questions about remaining efficiency issue for existing
homes and the end uses within them.42 However, there are other ways to approach absolute
energy use and peak demand reductions, as explained below.
Examples
The Model Energy Code (MEC) shows declining incremental savings estimates attributable to
the code over each successive code iteration: 10 percent decline between the 1985/1986 MEC
40 There are methods available to assess these diverse dimensions of policies and technologies, such as Multiple
Criteria Decision Analysis (Diakoulaki, Antunes, and Gomes, 2005), though these are not widely tested in real
policy applications. In any case, this method requires assessing the quantity or degree of effect for each dimension.
41 For a history of regulations in California, see California building codes (Title 24 Part 6 beginning in 1978
https://www.energy.ca.gov/title24/) and appliance efficiency regulation history (Title 20, https://www.
energy.ca.gov/appliances/previous_regulations.html)
42 The Energy Commission’s Senate Bill 350 Doubling Energy Efficiency Savings by 2030 report recommended that
“sufficient[ly] disaggregated … data, including hourly and seasonal, is available on historical energy consumption and efficiency savings estimates” (Jones et al., 2017; emphasis added).

51
and the 1992/1993 MEC, 2 percent decline between the 1992/1993 MEC and the 1995 MEC;
and again 2 percent decline between the 1995 MEC and the 1998 International Energy
Efficiency Code that succeeded MEC (EERE, 2008). This trajectory shows gradual improvement
in expected efficiency, but it is slow relative to California’s goal of doubling energy efficiency
savings. For another example, CFL replacement programs generated the bulk of IOU savings
in California, so that lighting regulations making high-efficiency lamps standard virtually
eliminated program savings available from CFLs (Barclay et al., 2018).
Implications
Energy efficiency is usually defined as an incremental property of devices or materials, though
sometimes for larger technical systems such as a house based on comparisons of modeled
expected energy use. New instances and new types of devices, material, and technical
systems are always being added, and existing instances degrade. These create incremental
opportunities for efficiency to generate energy savings. But big, climate-scale improvements in
efficiency and reductions in emissions likely require new approaches to efficiency, targeting
systems of energy demand rather than devices and material (Sahakian and Wilhite, 2014;
Rinkinen, Shove, and Torriti, 2019). Existing efficiency protocols provide limited assistance for
integrating such options. For example, how should passive architecture, an evaporative cooler,
and a compressor-based central air conditioner be compared in terms of efficiency? Drawing
on the example of Cool Biz Japan (Shove, 2014b), how would the possibility of more climate-
resistant clothing (including fabric innovations for example) fit in? Without deliberately
examining such questions, then central air conditioners may become the winning efficiency
choice no matter the location of the home (as noted above), even if other technologies or
portfolios work as well and with less energy. This raises a need to avoid over-rewarding
theoretical energy savings if the baseline is not well-defined, since it could push efficiency to
focus on bigger, more consumptive goods.43 Another potential non-efficiency resource for
emissions reductions is better coordination of electricity demand with supply—a mission that
the electricity industry has pursued for over a century (Bakke, 2016).
Making History Relevant and Accessible People working in the energy efficiency and climate change fields are already faced with a
tremendous amount of information, of things to read, listen to, absorb, and reflect. So how
could histories and historical insights be practically brought to bear, with what effects, given all
the normal types of information on offer? That is a research question that cannot be answered
without evidence on how existing histories and summaries (such as the ones in this report) are
received and applied. For now, there are two general conclusions on the potential value of
histories from this exploratory work.
Fostering adaptive management, such as by capturing technology-related patterns, trends,
and events as they emerge, could provide a rapid feedback aspect of evaluation in support of
desired energy transitions. The scope and intended pace of the energy transitions that
43 One example is the Golden Carrot (or Super Efficient Refrigerator Program) competition, where the award
metric was kWh saved rather than efficiency per cubic foot. This allegedly led to intentionally creating a big efficient refrigerator (Gillingham, Newell, and Palmer, 2006; Moezzi, 1998). While this competition likely spurred innovations that were used in other refrigerators (Gillingham, Newell, and Palmer, 2006), it is an example of the
“gold plating” that can occur as part of making efficiency attractive to consumers.

52
California policy has already legislated or is considering are more ambitious than in energy
policy’s past. For example, California’s Big Bold Energy Efficiency strategies initiated in 2008
targeted that by 2016–2020, 100 percent of new homes exceed 2005 Title 24 efficiency
standards by at least 35 percent, and that 75 percent of existing homes have a 30 percent
decrease in purchased energy relative to 2008 levels (CPUC, 2008). If natural gas heating is to
be replaced by electric heating, a similar pace would be required. Even if technology
installation goals are achieved, do they achieve the desired benefits? What trickle-down effects
or unintended consequences might be seen? How are technologies and programs in the real
world deviating from ideals? What adjustments or recasts are called for? Accelerated cycles of
feedback can help ensure that technology developers and strategists are continually informed
about interactions, difficulties, and adjustments observed as technologies try to take their
place in the real world. Developed well, with strategies to manage around inherent
uncertainties (small sample sizes and related statistical limitations), this could support a
system of adaptive management44 for efficiently rolling out climate change-friendly
technologies.
An extended set of energy technologies and energy efficiency histories could be valuable. A
library of historical summaries would provide planners and researchers missing information on
past experience, possibly shaking up current assumptions of “what must be” and providing
actionable balance to overly-idealistic models of change.45 If good quantitative trend
information accompanied these histories, this could also be quite helpful for thinking through
future projects. Possible historical topics include common energy efficiency concepts (such as
home energy audits, Zero Net Energy homes, passive architecture, and standby power) and
specific end uses (such as water heating, space cooling, and lighting). Such reviews would
have to be deliberately fostered and legitimized as a normal part of energy efficiency study.
For example, when considering the future of a particular technology, it would be useful to
understand the socio-technical landscape of its past (Moezzi et al., 2019).
Historical analyses can also be applied to inspire the creation of future imaginaries. This
includes the development of testable scenarios that capture more of the dynamic interactions
and distribution of effects of possible residential energy futures, along with “What if?”
questions probing alternatives and uncertainties. Prospects for developing these scenarios are
explored in the next chapter.
44 Williams, Szaro, and Shapiro (2009) give an example of adaptive management planning in the United States
government.
45 These ideals derive from engineering and economic constructs (Lutzenhiser, 1993; Shove, 1998; Moezzi et al.,
2009), models based on these constructs, and what has been called the folklore or “fables” (Rinkinen, Shove, and Torriti, 2019) that constitute energy efficiency culture; the terms “fable” or “folklore” as the authors use here are
not derogatory, and apply to any field.

53
CHAPTER 4: Scenarios in Theory and Practice
This chapter reviews the phase of the study that focused on the use of scenarios in energy
planning—what one expert interviewed called future histories. The research method combined
examination of relevant academic literature and published reports on scenario development
and use in international, national, regional, and California energy and environmental policy
contexts. This work informed a series of interviews with experts in energy planning and
modeling in California and elsewhere. Insights from those interviews led to additional data
sources and further interviews in targeted areas. A complex picture that emerged was
reported in a project memo, which is summarized in this chapter.
In some senses, the meaning of scenario seems obvious enough—for example, “a sequence of
events especially when imagined” (Merriam-Webster, 2019). People commonly talk about a
scenario playing out, such as making an investment and receiving returns over time. Or “In
that earthquake scenario, the house will fall down.” The ability to plan for the mid- and long-
term future, whether in business, government, or households, involves imagining actions and
future outcomes. This use of scenarios can be simple and short-term, such as planning a
birthday party or vacation, or complex and long-term. In formal modeling, for example,
scenarios are sometimes used to compare alternative possibilities decades in the future. An
early example is the Shell Oil Company’s pioneering work in long-term geopolitical scenarios
and energy supply alternative futures initiated in the late 1960s, and used to inform strategic
corporate planning and management decision-making (Wilkinson and Kupers, 2013; Shell,
2019).
In energy analysis, forecasting, and planning in California, the use of scenarios has historically
focused on informing specific policy options. However, even in the case of formal policy-
support modeling, precisely what different modelers mean when they talk about scenarios,
and what they do with scenarios in their work, can vary widely. Recent climate change policy
mandates (reviewed in Appendix) have set new long-term goals that increasingly call for the
use of scenarios to consider alternative California futures and pathways to those futures. This
opens a landscape of new possibilities, such as the flexible modeling of alternative scenarios
(future histories) in the simulation sandbox approach explored in this research.
Introduction to Energy Scenarios and Their Purposes
In California energy forecasting, scenarios have been used for some time to envision how
changes in technologies, population, employment, and energy efficiency might affect future
energy demand. Rather than large scale explorations of possibilities and uncertainties, the
purposes have been straightforward and predictive of future energy demand to inform
regulatory decisions about power plant and transmission permitting and siting. California utility
regulators have also used scenarios to compare different energy efficiency program designs
and their aggregate energy savings. The differences in purposes of the two primary state
energy agencies (the California Energy Commission and the California Public Utilities
Commission) have dictated different approaches, time horizons, modeling features, and so on.

54
Recently completed long-term energy scenario studies funded by the Energy Commission have
used scenarios in still other ways, for example, to test whether particular sequences of
technology change could achieve mandated emissions reduction targets (Wei et al., 2018;
Mahone et al., 2019). This use is sometimes known as backcasting, where the mission is to
find plausible or at least possible ways that a goal (usually an ambitious one) could be
achieved (Manning, Lindenmayer, and Fischer, 2006). And a suite of climate vulnerability and
adaptation studies for California’s Fourth Climate Change Assessment (Fourth Assessment,
2018) used downscaled projections of global climate change scenarios to assess potential
environmental impacts, such as wildfire risks and hydrology changes.
In short, different purposes have led to different conceptions and uses of scenarios. These
often do not incorporate a detailed sequence of events suggested by the generic definition of
scenarios. Sometimes the term scenario has been used to refer to an outcome or state of
affairs at a future point in time. In other cases, scenario means that different technology
configurations appear over time; or perhaps that different costs of fuels over time might
enable different energy supply configurations. And in still other cases, different global social
and economic change patterns (developmental scenarios) could be imagined to lead to
different energy intensity, fuel, technology, and global carbon emissions futures.
For the latter, the United Nations’ Intergovernmental Panel on Climate Change (IPCC) climate
modeling process integrates consideration of five macro storylines, called shared socio-
economic pathways (SSPs). The SSPs are each very different narratives about international
regions’ possible economic, social, and policy futures—with different associated levels of GHG
emissions (GHGs) and degrees of global warming and changing earth/atmosphere/ocean and
climate dynamics. The SSPs are titled: SSP1 Sustainability, SSP2 Middle-of-the-Road, SSP3
Regional Rivalry, SSP4 Inequality, and SSP5 Fossil Fuel Development (Bauer et al., 2017;
O’Neill et al., 2014). Detailed stories about “this happens and then that happens” for each SSP
are not elaborated, as this would be an impossible task on a global scale. But the SSPs are a
starting point and a heuristic for considering possible differences in outcomes across
economies, cultures, political and institutional structures, technology configurations, and
environment effects (e.g., Schweizer and O’Neill, 2014). The SSPs in IPCC global climate
modeling are translated to inputs to integrated assessment models that simulate macro
environment-economy interactions and used to conduct impact, adaptation and vulnerability
modeling, often at subglobal scales, including international regions, countries and even
national subdivisions (Wilbanks and Ebi, 2014; Samir and Lutz, 2017).
In the United States, independently of the IPCC, the U.S. Department of Energy’s (DOE) EIA
maintains a National Energy Modeling System (NEMS), which is used to support the EIA’s
Energy Outlook reports (EIA, 2019). NEMS scenarios include a reference case forecast
(projections based on current conditions and known facts) along with six side cases that vary
from the reference case in oil and natural gas prices and availability, as well as high and low
economic growth, in future years. It is a conservative assessment in the sense that “The
potential effects of proposed federal and state legislation, regulations, or standards—or of
sections of legislation that have been enacted but require funds and implementing regulations
that have not been provided or specified—not reflected in NEMS” (EIA, 2019a).
The next section focuses on the use of scenarios in current California energy and climate
modeling. But it is first useful to consider some context and critiques of the overall modeling

55
landscape in which scenarios have been used elsewhere. The global systems of energy,
emissions, atmosphere, and climate are so large, intricate, and dynamic that until the
advances in affordable computing power in just the past few decades, it was unimaginable to
model them in any detail, and at any distant future timescale. The atmosphere ocean system
is likely the best understood, but even here projections of ocean temperature cycles, hurricane
seasons, and the like are uncertain at greater than short time steps. When human activity,
populations, technologies, markets and trade, migration, resource extraction, politics, and/or
lifestyles are added to the picture, not only does complexity increase, but also uncertainty.
Given the current state of knowledge, socio-technical systems turn out to be much less
predictable than oceans and atmosphere—an important reason that climate change
researchers have been working on a wide range of global social, political, and economic
change scenarios besides environmental and technical layers of change (Moss et al., 2010).
Rather than being gradual or even linear, technological change can be rapid, disruptive and
even transformational or dominated by inertial forces with long lags from innovation to market
penetration.
This has led some to criticize complex integrated (economy/environment) modeling as too
uncertain to be useful for policy or planning (Pezzey, 2019). However, the use of large
numbers of simulations to represent a wide range of imaginable outcomes has been suggested
as a way to test for the effects of extremes (of weather, economic instability, technology
stagnation, population growth, and so on) on the state of the overall system (Pindyck, 2017).
Comparison of the results of multiple models has also been shown to provide a better sense of
differences and how model assumptions and architectures affect estimation (EMF, 2019). Also,
more exploratory and backcasting approaches to scenarios and modeling have been suggested
as ways in which admittedly imperfect tools can yield useful policy information (Manning et al.,
2006; van Vliet and Kok, 2015). Finally, in the academic literature, attention is also being
turned to how models are used (Volkery and Ribeiro, 2009; Wilson and Grübler, 2011), how
they may inform discussion in some cases and be misleading in others (Braunreiter and
Blumer, 2018), and issues in translating qualitative stories into quantitative computation (Kok
et al., 2015; Miller et al., 2015; Tyszczuk and Smith, 2018).
The lack of a common meaning of scenario in energy analyses, and the wide range of
conceptual and modeling processes that are said to be using scenarios, demonstrate that this
is an evolving area of analysis. The key finding for the current project is that thinking about
energy futures, energy supply and demand transitions, changing climate conditions and
human response, “storylines” and “future histories” will be necessary (Bushell et al., 2017).
But the business of constructing and using scenarios in this sense and at the scale of California
is an early work in progress.
California Modeling Studies That Have Used Scenarios The following discussion narrows the focus to California and details some of the activities
mentioned above. As noted there, formal energy modeling in California has pursued specific
policy interests and has posed questions in relatively focused ways. Examples include concerns
about matching supplies to demands, crediting energy efficiency gains appropriately, and
exploring the potential effects of specific legislation and regulation. With increased concerns
about climate change and impacts to the state’s coastline, water supplies, infrastructure, and
wildland fires, as well as proactive policies to reduce GHG emissions through cap-and-trade,
56
solar subsidies, and other instruments beyond efficiency, the modeling brief has been
expanded.46 New studies have used energy modeling at various scales to explore a range of
technological and environmental futures and to test the potential for policies to affect those
futures. Some of those efforts are reviewed below, with an eye toward how scenarios have
been used in varied ways in the California context.47
California Fourth Climate Change Assessment Impact Studies To support California’s Fourth Climate Change Assessment, coarse resolution projections from
an ensemble of global climate models were downscaled to provide high-resolution portrayal of
California’s climate in terms of temperatures, precipitation, and other climate-related factors
(e.g., sea level rise) and processes (wildfire, hydrology) for the 1950—2099 period. Two
emissions trajectories (e.g., peaking ca. 2040 and then declining vs. business as usual) were
used to portray California’s future temperatures, weather patterns, extreme weather events,
sea levels, fresh water supplies, drought, flooding, wildland fires, and so on at state and
substate scales.48 In these studies, scenario refers to two things: (1) different modeled global
emissions concentrations, and (2) for state-level impacts, different possible outcomes in
environmental conditions. The downscaled climate scenarios were also used in a number of
vulnerability and resilience studies including research on the natural gas, electricity, and transportation fuel sectors.49
California Energy Demand Model and IEPR Forecast Analysis State law has mandated the CEC to produce a biennial forecast of energy demand for the
subsequent 10-year period to inform the Commission’s Integrated Energy Policy Report
(IEPR), which provides a basis for joint energy planning by California state agencies with
energy and related environmental responsibilities. The California Energy Demand (CED) model
has been developed over the past three decades as primarily a bottom-up model with
additional inputs from various economic and demographic information and modeling sources.
This model for the residential sector is built up from populations of energy end-use
46 While climate change was already a topic of discussion in energy efficiency forums in the 1990s (such as seen
in the Proceedings of the ACEEE Summer Study on Energy Efficiency in Buildings), it was not until the mid-2000s that it became a strong focus in energy efficiency work.
47 This is not a definitive listing. The cases were selected because they are central elements of energy policy
support or are recent applications of scenario modeling applied to climate change in California. Notable related work over the past 15 years by Lawrence Berkeley National Laboratory (Ghanadan and Koomey, 2005; Greenblatt, 2015), Itron (Rufo and North, 2006), and Berkeley Economic Advising and Research (Roland-Holst et
al., 2018) is not reviewed here.
48 The technical details of model selection can be found in the Pierce et al. (2018) report Climate, Drought, and Sea Level Rise Scenarios for California’s Fourth Climate Change Assessment. Data downloads can be obtained from Cal-Adapt (2019). A thorough discussion of the two climate scenarios used—the “moderate policy” Representative
Concentration Pathway (RCP4.5) in which emissions peak around 2040 and then decline, and the RCP8.5 in which emissions rise throughout the twenty-first century—can be found in Wayne (2013).
49 California’s Fourth Climate Change Assessment overview and supporting technical papers can be found at:
http://www.climateassessment.ca.gov.

57
technologies (appliances, lighting, heating, cooling, water heating equipment) distributed
across the state in housing stocks, with associated energy requirements and efficiencies. In
CED modeling, future aggregate consumption levels are estimated as outcomes of changes in
end-use demands, which are derived from changes in technology efficiencies and population
growth, which in turn partially depend on economic growth and personal incomes. In recent
years, the CED model has also incorporated assumptions about changes in sources of
renewable generation (residential PV) and electric vehicle charging.
Several different scenario approaches are used in the CED modeling, including periodic
adjustment of the equipment saturations and efficiencies to better align with changing
technical innovation in the base case scenario. The most explicit use of scenarios is in
comparing how different combinations of technology, efficiency and renewable energy might,
over the next 10 years, result in different levels of energy demand.
“The California Energy Demand 2018—2030 Forecast (CED, 2017) includes three
scenarios: a high-energy demand case, a low-energy demand case, and a mid-energy
demand case. The high-energy demand case is characterized by relatively high
economic/demographic growth and climate change impacts, and relatively low
electricity rates and self-generation impacts. Lower economic/demographic growth,
higher assumed rates, and higher self-generation impacts are included in the low-
energy demand case. The mid case input assumptions are between the high and low
cases.” (CEC, 2019)
In this context, scenarios are technology trajectories that add up to different energy demand
totals. Embedded in the three cases are rates of efficiency improvement resulting from both
utility programs and market trends. However, no assumptions are generally made about the
policies, behaviors, or market dynamics that might lead to one scenario or another—or to
scenarios other than these.
California Public Utilities Commission Energy Efficiency Potential
and Goals Studies The California Public Utilities Commission (CPUC) is charged with regulation of the state’s
investor-owned utilities (IOUs). An important part of that work over the past several decades
has been requiring and regulating IOU funding of cost-effective energy efficiency acquisition
(Lutzenhiser, 2014). In support of that work, the CPUC conducts a regular analysis of energy
efficiency potentials and goals, which involves a modeling exercise focused on the respective
costs and benefits across the state of a large portfolio of possible energy efficiency technology
investments. The most recent study uses five scenarios to differentiate efficiencies that might
be achieved with different levels of subsidy, marketing, and stringency of estimates of
achieved savings (Navigant, 2017).
In this context, scenarios are internal regulatory cost-benefit accounting alternatives. While
larger policy contexts and recent state climate-related legislation are discussed as rationales
for looking at much more aggressive efficiency goals, the regulatory authority of the CPUC
Energy Division is for a narrow focus on IOU programs, cost effectiveness, and allowable rates
of return to utility shareholders. So future policy possibilities are not considered, and while
technological innovation is at the heart of the analysis, the details are not required for goals
and potentials assessment. Finally, although the most aggressive efficiency scenario with the

58
highest savings was predicted to result in about twice the savings as the business-as-usual
reference case, the total additional savings add up to only a little more than 1 percent of total
statewide electricity sales.
California Energy Commission EPIC Long-Term Energy Scenarios Studies Three large CEC-sponsored long-term energy scenarios (LTES) studies were recently
completed. In the first, University of California Irvine (UCI) examined possible impacts of
climate change on the electricity generating system. As with the Fourth Assessment studies,
using the same downscaled global climate scenario results discussed above as inputs for the
analysis, the UCI team investigated “…1) changes in hydropower generation due to altered
precipitation, stream flow, and runoff patterns; 2) changes in the availability of solar thermal
and geothermal power plant capacity due to shifting water availability; and 3) changes in the
residential and commercial electric building loads from increased temperatures” (UCI, 2019).
The results were used as inputs to the other two LTES studies.
One of those studies was conducted by Lawrence Berkeley National Laboratory (LBNL) and
used a capacity expansion model (SWITCH) for the Western States electricity grid to compare
outcomes (electricity use, costs, air quality, policy goals) of six scenarios that tested different
rates of adoption of energy efficiency and electrification of building energy use, industry, and
transportation. These were the “frozen demand,” SB 350, SB 350+electrification, aggressive
energy efficiency (EE) without electrification, and aggressive EE with electrification scenarios
(Wei et al., 2018). All are configurations of energy flows (as in the CED model), but with policy
differences defining scenario differences (such as electrification or efficiency) and how rapidly
technology change might occur in each. The study showed that these combinations would lead
to substantial reductions in GHGs and that hoped-for policy goals are, in principle,
achievable—if social choices (not modeled) were made. These sorts of models incorporate
technical and sometimes economic variables, and do not explicitly consider policy options that
might lead to technological change or evolving economic choices.
The consulting firm Energy and Environmental Economics (E3) also conducted an LTES study
of “deep decarbonization” potentials (Mahone et al., 2019) This analysis used a different
modeling platform and proposed 12 long-term scenarios, including a business-as-usual case
that brought in SB 350 goals as targets (“a 50 percent renewable portfolio standard by 2030
and a doubling of energy efficiency savings relative to historical goals”), along with 10 variants
of a “high electrification” case using different levels of technology adoption, efficiency and
renewable energy considered to be “plausible low-cost, low-risk combination[s] of GHG
mitigation technologies.” Across the range of scenarios beyond business as usual, noteworthy
GHG reduction potentials were estimated. As in the LBNL study, the social actions required to
initiate and sustain the scenarios were not considered in the modeling.
Both the LBNL and E3 studies are end-state exercises that show what some future could be if
a sequence of technology changes were to take place at a particular pace. But the action
scenarios (the social choices and changes that would be required for the technology changes
to occur) are general statements of social good and not storylines that have been elaborated
in any way. For example, improved “consumer choice” and “market transformation” would be

59
useful in stimulating modeled technological change (electrification of heating, “deployment” of
more efficient technologies, aggressive adoption of Zero Emission Vehicles).
California Modeling Results Without attempting to summarize the results of the various recent California energy, climate,
and environment modeling exercises, some key findings can be called out. First, the Fourth
Assessment Climate Change modeling studies found that impacts varied in extent, severity,
and across substate regions, and often with quite significant impacts to be experienced by
coastal ecologies and communities, watersheds, forests, agriculture, and urban communities
due to flooding, drought, wildfires, wildlife impacts, air quality and human health impacts
(Fourth Assessment, 2018).
Second, the CED modeling studies forecast (1) continued growth of overall energy demand
and emissions, but with differences between sectors (buildings, residential appliances,
industry, transportation, agriculture); and (2) that ongoing replacement of less efficient end-
use technologies with more efficient versions will result in increased overall efficiency of
energy use. The modeling also projects continued growth in distributed renewable energy
sources (primarily residential solar PV). Simple technology adoption scenarios were tested that
assumed higher levels of efficiency improvement and more rapid expansion of “self
generation,” and these showed large electricity demand savings at the final forecast year
2030. But the total electricity demand in that year would still not likely be less than the
baseline year 2017 consumption. True, California has experienced substantial economic
growth in recent years along with declines in GHG emissions (CEC, 2017, p. 23). But those
emission levels would have to be reduced by more than 40 percent to meet the 2030
reduction goals of SB 32. So large new reductions are also necessary, and as research
discussed below finds, potent new strategies to achieve these additional reductions—and
quickly—are required, including prospective technologies not yet demonstrated or on the
market, particularly in difficult-to-electrify sectors.
Third, the CPUC energy efficiency studies of potentials and goals found that as much as a
doubling of currently projected energy efficiency savings could be obtained by relaxing
regulatory criteria related to cost-effectiveness and the cost accounting for carbon reduction in
IOU efficiency programs over a relatively short period. However, even marginal gains on that
scale are quite small (1.5 percent of current electricity demand) compared to the reductions in
demand from efficiency required to meet statewide goals such as the doubling of efficiency in
buildings envisioned by SB 350.
Finally, a suite of laws and policies have been adopted in recent years to improve efficiency,
move away from fossil fuels, reduce emissions, and consider equity and economics in so doing
(see Appendix). The question addressed by the LTES studies by UCI (Tarroja et al., 2019),
LBNL (Wei et al., 2019) and E3 (Mahone et al., 2019) was whether known and plausibly
predicted changes in technologies, energy use, renewable supplies, and reductions in
nonenergy emissions could reach ambitious goals such as those proposed by SB 32. Using
somewhat different modeling approaches and assumptions, the LBNL and E3 modeling both
found possible technological change trajectories that could economically meet those goals.
However, “deep decarbonization” would require rapid and accelerating technology transitions
in such key areas as electrification of building heating and high rates of adoption of electric

60
vehicles (along with complementary system changes). Both modeling teams were agnostic on
whether and how supporting policies might be put in place to foster those transitions, but they
found that the economics of the new technologies would not be implausible.
However, LBNL pointed out that while these transitions are possible, to hit the targets at the
pace modeled, rapid electrification of space heating and water heating would have to begin very soon. And E3 (Mahone et al., 2018) identified a range of barriers to rapid change, the
most important of which involve consumer choice and pace of large-scale market change (in
supply chains and other technology deployment channels).
“This research highlights the pivotal role of the consumer in meeting the state’s climate
goals. To achieve high levels of adoption of electric vehicles, energy efficiency and
electrification in buildings, near-term action is necessary to avoid costly replacement of
long-lived equipment in 10—15 years. Furthermore, market transformation is essential
to reduce the capital cost of electric vehicles and heat pumps.” (Mahone et al., 2018)
And as others have stated regarding the role of consumers in energy transitions, “the potential
agency of diverse publics moves far beyond the accept/reject dichotomy [of ‘public
acceptance’]” (Ryghaug, Skjølsvold, and Heidenrich, 2018). Again, the E3 and LBNL studies
were technology-focused modeling exercises, with market resistance or political opposition not
modeled (technology deployment, adoption, transfer, and so on, modeled as “frictionless”). At
the current stage of knowledge, these studies are the state of the art and have made
important contributions to set the stage for public discussions. They bring California to the
threshold of questions about what changes are imaginable that could usher in large-scale
decarbonization of energy use—as well as how those changes might be best pursued.
However, the efforts of both policy makers and communities to consider these things will
clearly require more than even the most sophisticated current modeling systems can provide—
at least without considerable cost in time and resources. In addition, it is widely recognized
that energy use behavior, consumer choices, and supply chain dynamics all strongly influence
technology adoption and determine the effectiveness of policy strategies. So far, these are
external to conventional modeling and energy policy analysis.
Limitations of Current Modeling Platforms for Scenario Analysis and Energy Planning
Almost without exception, questions of policy implementation are external to the dominant
planning models. Following on norms set by EIA for NEMS years ago, speculations about
policies (new carbon taxes, aggressive regulations, accelerated expenditures, and so on) are
not considered inside of the models. In a much broader way than NEMS, the California
scenario modeling used by the CEC, CPUC and recent LTES research has brought the
ambitious emissions reduction goals of current policies and possible changes to current policies
(including the CPUC energy efficiency valuation) into the modeling context.
But as valuable as this broadening has been, current modeling platforms are mostly posing
questions such as “Could this be accomplished?”—rather than going further to ask “How might
policy A stack up against policy options B, C and D in meeting goals?” Partial exceptions are
the E3 LTES studies that analyzed in detail a high-electrification scenario and 10 different
mitigation scenarios, with comparison of cost and benefit potentials. These scenarios are
61
defined as technology outcomes (by 2030 “100 percent new sales of water heaters and HVAC
are electric heat pumps; 91 percent of building energy is electric;” or “6 million ZEVs (20
percent of total) and more than 60 percent of new sales are ZEVs”). The actual policies to get
there, such as cap-and-trade, subsidies, taxes, codes and standards mandates, and so on, are
explicitly excluded.50 Even breaking new ground as it does, this research was not intended to
examine the policies, programs, or other instruments that would help reach these goals.
That, in fact, is not imagined in any current policy modeling that the authors could find. Nor is
going even further to ask questions such as “If federal efforts to overturn California vehicle
emissions regulations were successful, or if an influx of climate migrants dramatically
increased energy demand, or a future legislature outlawed new natural gas heating systems,
what might be the effects?” Until recently, these possible future history deviations from the
current business-as-usual case would have been considered very speculative. But that sort of
outside-of-the-box speculation in the context of growing climate impacts, emerging policy
discussions, and extremely ambitious legislative goals now seems warranted. Given the
limitations of modeling mentioned above, and discussed in greater detail below, a more
exploratory approach to modeling that incorporates new dimensions, questions and
approaches may be a good first step to considering those sorts of questions (Bankes et al.,
2002; Weaver et al., 2013).
Looking More Closely at Scenarios and Models All models are limited—by intention, design, and execution. And, of necessity, current models
used in California for energy system and climate change planning are limited in their
usefulness in policy debates and public deliberations about achieving ambitious climate goals
in flexible and responsive ways. The importance of this observation is that the current
modeling tools are not readily able to produce the kind of practical understandings necessary
to develop effective public policies and market/citizen responses that can accelerate the
energy transitions required to meet legislative goals. Drilling down, at least four things
contribute to this.
1. Models focus on some parts of systems and ignore others. Models cannot consider
everything, and those things they are able to consider are treated in different degrees
of detail. They may also include gross effects from outside of the system being analyzed
(population projections or economic growth rates in the CED model imported from other
state agency databases and models), which are not intended to be as detailed as the
parts of the system being considered inside of the model (such as appliance stocks or
equipment efficiencies, decay rates for buildings). In other cases, some parts of the
system are held constant, such as the carbon mix of electricity supply, for example.
Some variables may be allowed to take on different states (such as heating demand
differences across regions or housing types) within the model. However, others may be
50 “Finally, this study aggregates statewide costs and benefits, explicitly excluding the effect of state incentives
and in-state transfers, such as Cap-and-Trade, the Low Carbon Fuel Standard, and utility energy efficiency programs. Costs borne by individual households will differ from the average and will depend on policy implementation. Further research could investigate the cost implications of specific state policies on individuals
and businesses.” (Mahone et al., 2018, p. 5)

62
averages (thermostat settings or equipment efficiencies), which may be rolled into a
gross average heating demand per square foot.
A problem with using averages is that it buries the variability of behavior, choice, and
even technology performance that can be useful in spotting problems and proposing
solutions, thus blinding interpreters to so much possibility. Variation, among other
things, provides clues to where the biggest problems may lie as well as helping to
uncover situations that can serve as exemplars or leverage points for positive change.
They also can be highly important in estimating effects of changes elsewhere in the
system—for a simple example, a $40 average increase in monthly utility bills over a
year across households due to a tariff change (to time-of-use tariffs, or changed tiers)
could plausibly mean a $300 increase in a summer monthly bill for many households.
Averages also turn attention away from distributional effects and equity considerations,
as well as opportunities for substantial emissions reductions in groups that are not
average.
2. Models designed for legacy purposes are not readily adapted to reflect scenarios.
Instead, models designed for specific purposes when they were developed are now
being asked to take on new questions. Tools that were designed to incorporate and
forecast outcomes for incremental improvements in efficiency are not readily suited to
address energy system/supply-demand transformation of the scale and speed required
to meet SB 100 goals. The aims and the scales are different. Some of these questions
may require slight modification and reruns of existing models (changes in coefficients or
even equations). But they are time consuming and often beyond the current brief of the
modeling group. For example, emissions outputs can be grafted onto energy demand
forecasting models or grid operations models, or even local/regional transportation and
land-use models. But new questions (such as the dynamics of hourly emissions) may
involve asking more complex inquiries that require adding new variables, rewriting
algorithms, introducing nonlinearities, and more complex relationships among variables
are all extremely difficult on large legacy platforms. In addition—because of basic
architectures and assumptions—asking those models to run and rerun quickly as inputs
and relationships are changed, or to compare the results of large numbers of runs, is
completely beyond their capacities.
3. There is a fundamental lack of important data to support target analysis. While efforts
are now underway at the Energy Commission to assemble data on energy, technology,
policy, markets, and so on to support analysis and inform policy-making (see McAllister,
2019), demand-side data in particular are extremely limited, and, when they exist, are
often proprietary (e.g., controlled by utilities or technology firms) with restrictions on
the degree to which households can be identified, limiting the degree to which demand
data can be merged with details about the house, household, or location. Limited data
lead to uncertainty in assumptions and uncertainty about model results. Again, the
large and legacy nature of models often limits modelers’ abilities to compare results
across different input data sources. The Energy Commission’s new data initiatives will
likely support expanded analysis and address some of these uncertainties.
4. Analysis is highly technical, requires expertise and time and entails communication
challenges. The size and complexity of energy forecasting and energy planning/analytic
modeling systems mean that it is difficult to use them for detailed, nuanced, and
63
dynamic scenario planning. When scenarios are used on those platforms, they tend to
involve repatterning of technology configurations and rates of change at highly
aggregated scales. Even this is no easy task, requiring programming expertise,
considerable staff time, and software modifications not imagined when the models were
originally designed. And when modifications are added over time, the models become
more complex and more opaque, with technical knowledge and historical knowledge
required to understand the growing model. So, if large-scale scenario analysis can be
attempted at all, it will be time-consuming and costly. More important, while the
contributions that this modeling work make to support energy policy and the public
interest are crucial, those results are not readily accessible or usable by the public, or
even by technically sophisticated energy and climate system stakeholders. Climate
scientists have recently called out the urgency for climate research to better connect
with civil society, including by providing more scientific support for practitioners whose
work intersects climate change adaptation and mitigation (Moss et al., 2019).
A Framework for Understanding the Uses of Scenarios As demonstrated above, scenarios are used in a wide variety of ways in formal energy system
modeling in California and beyond. All are legitimate as storylines and guidelines for selection
of quantitative depictions used in modeling at various scales. However, there are distinct
differences that need to be called out and better understood.
Taking scenario analysis first as a broad strategy for exploring questions about possible
futures, how those questions are posed define purposes and shape the answers that can be
obtained. As discussed above, policy requirements (laws, regulations, organizational goals)
often drive the questions, and the answers obtained are primarily useful in supporting those
requirements. But other purposes and questions are also possible and increasingly necessary
in the evolution of climate change policy.
Table 4 presents a typology of scenario questions and purposes. California modeling scenarios
are identified with the “What might happen?” and “What could happen?” and “Could this
happen?” questions. This leaves a large number of imaginable “What if?” and “Should we?”
and “How to?” scenario questions to be considered.
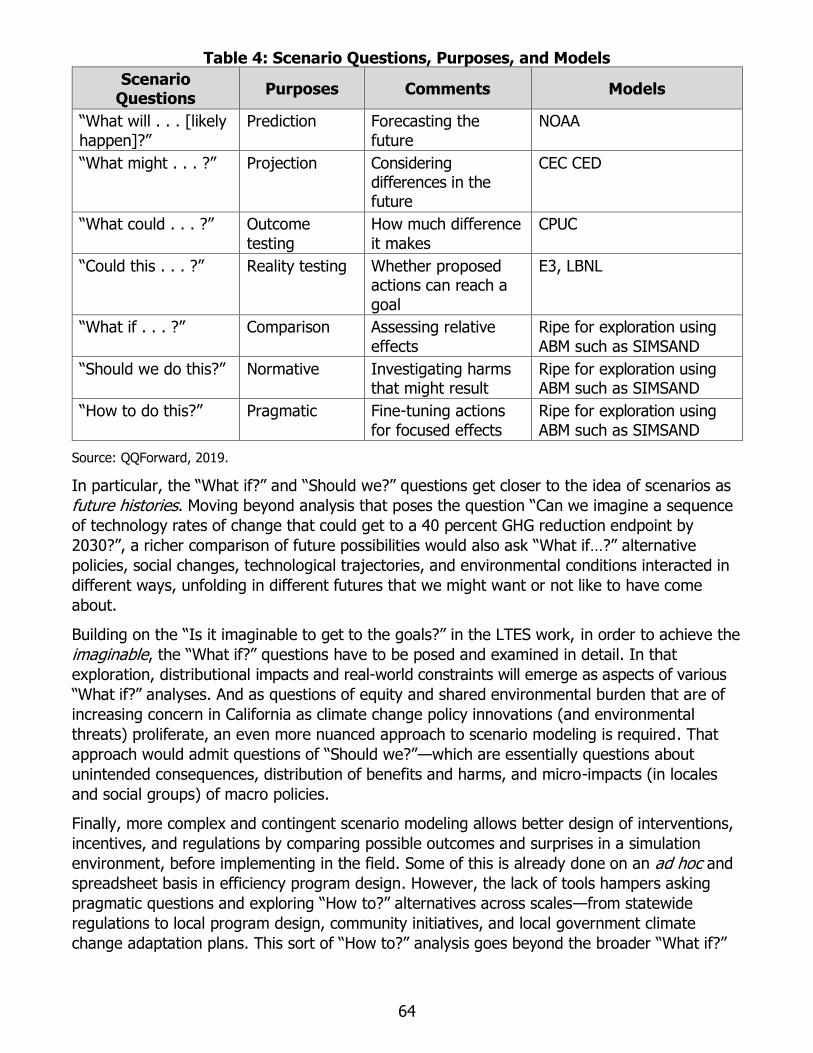
64
Table 4: Scenario Questions, Purposes, and Models
Scenario Questions
Purposes Comments Models
“What will . . . [likely
happen]?”
Prediction Forecasting the
future
NOAA
“What might . . . ?” Projection Considering differences in the future
CEC CED
“What could . . . ?” Outcome
testing
How much difference
it makes
CPUC
“Could this . . . ?” Reality testing Whether proposed actions can reach a
goal
E3, LBNL
“What if . . . ?” Comparison Assessing relative
effects
Ripe for exploration using
ABM such as SIMSAND
“Should we do this?” Normative Investigating harms that might result
Ripe for exploration using ABM such as SIMSAND
“How to do this?” Pragmatic Fine-tuning actions
for focused effects
Ripe for exploration using
ABM such as SIMSAND
Source: QQForward, 2019.
In particular, the “What if?” and “Should we?” questions get closer to the idea of scenarios as
future histories. Moving beyond analysis that poses the question “Can we imagine a sequence
of technology rates of change that could get to a 40 percent GHG reduction endpoint by
2030?”, a richer comparison of future possibilities would also ask “What if…?” alternative
policies, social changes, technological trajectories, and environmental conditions interacted in
different ways, unfolding in different futures that we might want or not like to have come
about.
Building on the “Is it imaginable to get to the goals?” in the LTES work, in order to achieve the
imaginable, the “What if?” questions have to be posed and examined in detail. In that
exploration, distributional impacts and real-world constraints will emerge as aspects of various
“What if?” analyses. And as questions of equity and shared environmental burden that are of
increasing concern in California as climate change policy innovations (and environmental
threats) proliferate, an even more nuanced approach to scenario modeling is required. That
approach would admit questions of “Should we?”—which are essentially questions about
unintended consequences, distribution of benefits and harms, and micro-impacts (in locales
and social groups) of macro policies.
Finally, more complex and contingent scenario modeling allows better design of interventions,
incentives, and regulations by comparing possible outcomes and surprises in a simulation
environment, before implementing in the field. Some of this is already done on an ad hoc and
spreadsheet basis in efficiency program design. However, the lack of tools hampers asking
pragmatic questions and exploring “How to?” alternatives across scales—from statewide
regulations to local program design, community initiatives, and local government climate
change adaptation plans. This sort of “How to?” analysis goes beyond the broader “What if?”

65
considerations to investigate questions about setting reasonable specific outcome goals and
expectations for pace of change resulting from policies and interventions. After
implementation, both goals and expectations can then be revisited as events unfold and
understanding and actions refined to support another round of “How to?” planning and
implementation (similar to the cycle proposed for market transformation initiatives by
Blumstein, Goldstone, and Lutzenhiser [2000]). This also allows policy choices to be framed in
systems terms as “adaptive challenges” rather than “technical problems” (Heifetz, 1994).
Scenarios and Modeling Related to Residential Air Conditioning
Focusing in on the problem of residential air conditioning, a reasonable question would be
“What are the models predicting about air conditioning energy use in the future in California,
under what conditions?” The answer is not clear in most cases. There is agreement that rising
temperatures will increase demand for residential cooling, and will increase peak demands as
well as overall electricity use a during hot months, days, and hours of the day. Increasing
occurrence of wildfires, and the air quality concerns that smoke from these fires pose, may
lead to even more demand for air conditioning and indoor air filtering. But in much modeling,
cooling is often wrapped up in larger categories, such as regional or sectoral space
conditioning. And breaking those aggregates down, residential air conditioning as a specific
technology/human activity demand domain is often itself buried and concealed in metrics such
as kWh per square foot that mixes heating, cooling, lighting, plug loads, and so on in a single
value.
While we know from limited available data on cooling at the household level that air
conditioning demand can differ considerably between buildings depending on energy use
patterns and system type, age, efficiency, maintenance, and other factors. But in most
modeling, averages must be used to try to summarize over that variability. This is problematic
for two reasons. First, as signaled above, it is easy to mistake the average for an accurate
representation of reality, though it is well known that very different distributions of values can
produce identical averages. Second, it is in the variation that the most powerful understanding
lies about where changes might be made (in technologies and use), and where those changes
are less likely or completely unrealistic.
However, what has been available to date to inform policy on residential cooling has largely
been low resolution and technology-focused frameworks that rely on rough estimates from
very limited data on how people use technologies, and how these technologies perform. Also,
the geographic scales available are broad and low resolution, while actual conditions can vary
importantly at much more refined scales. In sum, effective policy in this area requires a more
detailed understanding of the world than is—or can be—captured in current modeling practice.
The following chapter presents the results of developmental research on the use of agent-
based modeling to pose and explore “What if” questions related to California and residential
cooling. The proof-of-concept simulation sandbox developed in this project is called SIMSAND,
as mentioned earlier in this report. To set the stage for that discussion, Table 5 (next page)
illustrates a variety of possible “What if” scenarios that could potentially be investigated in
exploratory simulation modeling related to climate and cooling, such as that operationalized in
SIMSAND.

66
This is clearly a wide range of questions and possibilities to explore. Some may seem outside
of the conventional framework of policy discussions. But, as noted above, the seriousness of
the problems, the ambition of the policy goals, and the magnitude (in scale and speed) of
implied transitions require beyond-business-as-usual thinking as well as public consideration.
Planners and policy makers at the state level have been starting to shift viewpoints from an “Is
it possible to do this from a techno-economic perspective” to a “How do we manage transition
safely, equitably, affordably, and effectively?” A good place to conclude this discussion is to
summarize a research agenda that uses a flexible simulation modeling approach.
California is faced with an obvious problem: climate change involves hotter summers and more
frequent extreme heat events. This will increase the demand for air conditioners in regions
and among households that currently do not have it. It will also mean that air conditioning
units will operate longer, consume more energy than in the past, and will contribute to higher
peak loads on the grid. There will be differential effects in different parts of California and
there could be growing negative impacts of weather and related environmental conditions on
lower income, elderly, rural/agricultural, and health challenged households, exacerbating
current environmental equity problems.
Table 5: Other Possible Scenarios for Simulation Using SIMSAND
“What if” Scenario Description
Narrative
Baseline projection of
changes in California demand
California proceeds under "best available" status quo trends and
projections, as consistent with IEPR, California’s climate change assessments, demand forecasting models (CEC, 2020), etc.
Incorporates economic, demographic, population, climate, construction, and retrofit/EE trends.
Doubling of EE in building envelopes,
AC systems
California proceeds with goal to double efficiency in buildings by 2030, as it ends up being defined.
Emerging technologies, emerging challenges
New technologies of various sorts (PV, storage, smart controls, solid state AC, solar thermal absorption AC, etc.) proliferate. Do certain combinations of these technologies result in unanticipated
consequences for demand?
AC in the middle: AC control is shared, and
more contested
Smart thermostats, networked thermostat control, and energy management tools, interfacing with more dynamic rate
structures, further complicate already contested household control of thermostats and AC. Meanwhile, other households
retain control or cede it to algorithms. What unanticipated changes in demand might result?
A brave warm world? Resisting or embracing a
culture of AC and climate control
Will Californians exhibit a capacity to resist increased reliance on climate control in their homes? Or, will rising temperatures, more
severe weather events, concerns over the security of the outdoors, and an ever-strengthening (online) connected culture
together drive folks indoors more and more, with increasing reliance on AC?

67
“What if” Scenario Description
Narrative
Targeted or untargeted electrification: reducing
vulnerability while reducing emissions
Replacing gas heating systems with electric heat pumps becomes a policy objective; can a targeted implementation (preferentially
incentivizing the switch to electric heat pumps for homes with greater vulnerability to extreme heat events) yield increased
social benefits without compromising environmental benefits?
Uneven upgrades,
uneven benefits
Wealthier, more educated homeowners overwhelmingly
retrofit/adopt the newest high-efficiency ACs and controls and receive the benefits. How are costs and benefits distributed, and
how effective is carbon reduction in aggregate?
Rehabbing outdoors: cool roofs, pavement, and outdoor spaces
Communities create outdoor spaces more habitable in high heat events, including efforts to reduce local "heat island" effects—allowing people to rely on AC less, while also reducing AC loads.
What is the potential for energy savings and carbon reductions?
Stubborn demand: strong policies and
strong policy resistance
California aggressively pursues policy targets related to GHG reduction and EE, but AC demand proves difficult to reduce (e.g.,
due to take-back, physiological acclimation to space conditioning, industry not buying in, unintended consequences, etc.). How
much might these mechanisms interfere with energy savings and carbon reductions?
AC peak flattened, blurred
As a successful result of a portfolio of EE, tech adoption, behavior, and rate strategies, the AC peak issue is "solved,” and AC loads
become sufficiently responsive to TOU rates. What behavior and other changes might be necessary? Are there unanticipated
impacts?
Changing refrigerants
post-Kigali: social acceptance dynamics
slow carbon reductions
The transition of AC refrigerants to replacements with
substantially different properties, e.g., flammability or toxicity, result in substantial social and/or industry resistance. What effect
might this have on achieving environmental benefits?
The perfect (demographic) storm
Demographic and population shifts in California drive a transition in AC demand due to aging populations, increased ethnic
diversity, changing economic conditions, and movement of populations within California. Could incremental changes cause a large transition in AC demand? What combination of factors
might cause this?
Unsupportive external contexts create cross-
winds
Fossil fuel prices, population migrations, federal policy shifts, resumed drought, etc., alter trajectories in California relevant to
AC demand. How sensitive is future AC demand to these factors, individually or in combination?
Source: QQForward, 2019.
It is essential, then, to better understand how cooling technologies and populations of
California households may interact with the weather and changing climate conditions. And
against the backdrop of this knowledge, questions should be posed about the potential
impacts of policies and programs, individually and jointly. Comparisons can be made about the
68
benefits and shortfalls of different technologies and markets, and the influences of cultures
and communities. Here is a concrete case where moving from “Could we?” to “What if?,” as
well as “Should we?” and “How to?” questions and scenarios would be of considerable benefit.
The next chapter presents a modeling framework to explore these questions.
Scenarios and Histories
• Energy use scenarios play an important role in envisioning and shaping energy
transitions, policy strategies, and the future overall. How futures are imagined will help
determine what futures will be. This project reviewed residential energy scenario and
scenario-related activities in use in California energy and climate policy planning with an
eye toward what changes may be needed to support these “imagining” processes.
• This review suggested a need for expanded energy transition scenario development and
planning processes for envisioning the future of both demand and supply, e.g.,
household energy use in a highly renewables-dominated energy system. These
scenarios should go beyond traditional technological projections by addressing a
broader range of possibilities, some of which can be suggested from the history of
energy transitions.
• Such scenarios could reflect the “What if?,” “Should we?,” and “How to?” questions
important in applying energy futuring to the real world. These What-Ifs could involve,
for example, unexpected changes in weather patterns, major changes in how
households cool, or in technological performance. Appropriate models (such as a fully-
implemented version of SIMSAND for the residential sector) would be required to
explore and resolve such questions.

69
CHAPTER 5: SIMSAND, a What-If Sandbox Proof-of-Concept
The research team developed the concept for a "What if" simulation sandbox for exploring
residential sector energy futures that would: (1) reflect the diversity of household energy use
by drawing from household-level interactions; (2) be capable of reflecting a wide variety of
scenarios; (3) coordinate necessary data streams with high ability to select and update data
options; and (4) be easy and flexible to tailor to specific questions and emerging issues. This
concept was demonstrated with a limited proof-of-concept implementation, SIMSAND, which
focuses on the case of air conditioning for California households. SIMSAND in current form is
not intended to be enterprise-ready.51 Instead it provides a platform that that can be
broadened and further developed to meet the needs of particular use cases identified through
discussions with the climate change and energy efficiency research and planning community,
and to use new or otherwise improved data as available and relevant.
This chapter outlines the “What if” simulation sandbox concept and describes its
implementation in SIMSAND. It summarizes the results of demonstration scenarios modeled in
SIMSAND, sketches possibilities for future development, and discusses the potential role of this
type of simulation in energy transition planning.
What-If Simulation Sandbox Concept The broad vision of a simulation sandbox is of a platform that makes it easier for researchers,
analysts, planning experts, and interested members of the general public to think about and
explore “What if” questions about the mid-term energy future, playing out specific detailed
scenarios using defensible data on current and historical residential energy use. Such a
platform could provide a way to help break into, map, and discuss aspects of energy use and
energy change that currently are hardly accessible or manageable. In particular, it models
interactions between the various types of factors that affect energy use and users, and it
allows high levels of flexibility in specifying scenario assumptions, in light of observations made
above on actual technology history. This more realistic expression of change could be used to
develop insights about how energy transitions might unfold, and how they can be directed to
provide not only GHG emissions reductions but also equitability and cost-effectiveness.52
51 For example, SIMSAND as currently implemented focuses on energy outputs, without translating these outputs
to GHG emissions. Depending on the specific questions and scenarios explored, GHG emissions estimates might best be accomplished by incorporating the dynamics of hourly emissions from a transitioning supply system in addition to assumptions about the global warming potential of involved refrigerants. That could be added in a
module that integrates into the existing modeling structure. It also used limited information on air conditioning response, which could be updated with more detailed and more recent information that is potentially available. These and other possible expansions are discussed below.
52 The approach is not inherently limited to the residential sector, to demand (versus supply, distributed energy
resources, etc.), or to energy-related outputs (versus resilience or socio-economic impacts). Rather it allows assimilation of diverse data streams, analytic methods, and models, works across a range of scales, and enables
flexible exploration of user-defined output metrics and interventions.

70
There are already a variety of mid- and long-term energy futures models for California
(Kavalec et al., 2018; Mahone et al., 2018; Wei et al., 2018; Wei et al., 2013, Roland-Hurst et
al., 2018; Tarroja et al., 2019). These have been developed for distinct purposes and specific
questions, rather than for use in detailed exploratory "What if" and "How to" analysis of
potential socio-technical transitions. Such modeling requires specific capabilities (Köhler et al.,
2018), including representing the heterogeneous people at the center of these transitions
(Moezzi et al., 2018).
As a platform specifically designed and tailored for "What if" exploration of plausible futures
and transitions, while taking people and real-world variability into account, a simulation
sandbox can generate new possibilities for exploring future scenarios (Table 6). Recent
analysis of strategies to rapidly transition California's energy system has highlighted the
importance of human-dependent dynamics in these transitions, pointing to the "the pivotal
role of the consumer in meeting the state’s climate goals" (Mahone et al., 2018). This
assessment echoes the conclusion of many social scientific studies on energy use and how it
changes (Lutzenhiser et al., 2017; Malone et al., 2018; Rinkenen, Shove, and Torriti, 2019).
Table 6: New Possibilities Enabled in a "What if" Simulation Sandbox
General characteristics of existing tools
Simulation sandbox opens different possibilities
People, though central actors in energy
demand, tend to be marginally represented
Data may be highly distilled and averaged within broad categories
Row & column architecture not well-
suited for high levels of interactivity and potential non-linear effects (e.g., weather
+ household habits + feedback + technical characteristics)
Difficult to assess uncertainties and how
they relate across dimensions
Often analyses are one-off
Oriented to flexible incorporation of diverse and
evolving data streams that incorporate human element—especially by focusing on household-
level agents
Individual household/segment basis helps avoid over-averaging Californians
More attentive to interaction, covariance, nonlinearity, dynamics, relationships, and
distributions
Designed for detailed multidimensional scenarios
Ability to explore more dimensions of possibility
and of the space of uncertainty
Potentially cumulative or general platform, vs.
one-off
Potentially suitable for use for quick turn-around
analyses without requiring specialized training
Source: QQForward, 2019.
SIMSAND for Cooling
SIMSAND, the proof-of-concept implementation developed for this project, fulfills this initial
vision, specifically for the space cooling residential end use.53 An agent-based modeling (ABM)
53 Specifically, space cooling here refers to central, room/window, and evaporative air conditioning across
housing types (single family attached and detached, multi-family, and mobile homes).
71
approach was chosen for implementation of SIMSAND, due to the inherent flexibility of the
models and natural fit for doing household-level bottom-up geographically distributed
modeling, as well as suitability for transitions modeling (Köhler et al., 2018, Mercure et al.,
2016). ABM is a bottom-up technique involving computational simulation of a system
composed of any number (and types) of "agents" acting autonomously, interacting with each
other, and interacting with their environments.
ABMs have been less commonly used in energy demand modeling than in some other domains.54 There has been a recent surge in applications especially of the closely related
building stock modeling approach applied in California, at national scales, or at county or
urban scales (Dirks et al., 2015; Wilson et al., 2017; Reyna and Chester, 2017; Hong et al.
2017; Reinhart and Cerezo Davila, 2016; Burillo et al., 2019; Raghavan et al., forthcoming).
These models tend to use a set of building prototypes to project demand and to analyze
building retrofit and technology potentials, but can be weaker in representing the people who
do or could occupy the houses represented by these prototypes. ABM applications in this
domain also include the device-and-grid centric "Gridlab-D" (Chessin et al., 2014) as well as
simulations closer in structure to the SIMSAND, but focusing on other locales and other
applications (Subbiah et al., 2017; Thorve et al., 2018). As far as the authors are aware, the
SIMSAND approach (as a household-centered energy transition exploration tool), and
California focus is a distinct and new contribution.
As described below, the prototype SIMSAND has been completed, and demonstrates the
flexible, data-based, and generalizable approach, as proposed. The key elements of SIMSAND
are: the household and house agents and how they represent the population and are
scaled up; space cooling use and energy simulation; and representations of change from
history into the future in terms of behaviors and change processes directly altering cooling use
or AC energy demand, as well as the context factors affecting these (Figure 5).
Modeling Cooling Energy Use in SIMSAND The agents at the heart of SIMSAND reflect individual households, together with the houses55
they occupy, including house and equipment/technology characteristics, household
characteristics, energy use profiles, and equipment and energy use behaviors.56 In SIMSAND,
agents are dispersed across California’s utility service areas, climates, and counties at a ZIP
Code resolution.
54 ABMs are more commonly used in social simulation and environmental/ecological simulation, for example.
55 "Houses" is used throughout to refer to a range of housing unit types, including single-family detached and
attached houses, multifamily units, and mobile homes.
56 More specifically, agents are households and houses, specified distinctly but colocated and linked to represent
household agents occupying a particular house agent, while allowing (though not currently modeled) households
to move, houses to be unoccupied or acquire new households, etc.

72
Figure 5: Key Elements of SIMSAND
Source: QQForward, 2019.
Simulation Representation of Context-Level History and Future
Agent / Population Microdata
and Weights
Select Sample of
Agents
Household / House Agents
Simulated at each
time step:
AC energy use, GHGs,
energy cost, burden, AC access, etc.
Scale-up / Aggregate
(California, utilities, counties, housing
types, DACs, income level, other
household / house / equipment
characteristics
Trends
Source data
(RASS 2009 microdata,
supplemental datasets)
Model(s) of AC
energy use
Time range
selection (2009–2100)
Time step selection
(day, week, month, year)
Other sources
Wildcard Events
Interventions
Change processes and direct effects
BaselineSuccessful
AC Efficiency
Heat Pumps for Heating
(and Cooling)
Stagnant AC
Efficiency
Rush for AC / AC
Embraced
Scenarios / What-IfsStrategies for
Exploring Uncertain
Plausible Futures
Sensitivity Analysis
Deep Uncertainty Approaches
Monte Carlo
Robustness Analysis
Custom / Manual
Exploration
Other Strategies
Historical Trend Data
Trend Projections
Internal Trend Models
Environment (Weather)
Buildings (Houses)
Technology (Controls)
Technology (HVAC
Systems)
Household Activities,
Actions
InteractionsConstraints
Dynamic or feedback effects
73
Agents are data-driven; their characteristics are sampled from a subset of 6,612 cases drawn
from the microdata and billing data gathered in California’s most recent Residential Appliance
Saturation Survey (RASS), which was for 2009 (KEMA, 2010). Energy end uses are simulated
for each agent at every time step, that are adjustable between daily, weekly, monthly, and
yearly increments, and simulations can be run from 2009 through 2100. The air conditioning
energy end use, the focus of the SIMSAND prototype, is calculated from a weather-driven
statistical model individually fit to each agent household/home’s historical electricity billing data,57 with alterations to represent any simulation-based changes in house, equipment, or
household affecting AC energy use, such as replacement of the agent's air conditioning
equipment with a new model. Daily weather data, currently sourced from Cal-Adapt
(https://cal-adapt.org), gridded observed data (Livneh et al., 2015) or climate projections
(Pierce et al., 2018, Pierce et al., 2014), are fed into SIMSAND via a synthetic, flexible set of
weather stations, each pulling in single-location weather data, aggregated in time if necessary,
and mapped to nearby individual agents. The weather/climate data mechanism is flexible, and
can readily incorporate data streams at other spatial and chronological resolutions.
Simulated household-level time-resolved energy end uses can then be processed to estimate
other outputs/outcomes, including air conditioning energy costs and burden, and CO2
emissions.58 Other outputs, such as refrigerant GHG impacts or other equipment lifecycle
impacts, are not currently modeled in the SIMSAND prototype, but can be added in at final
implementation. Available outputs can be aggregated or grouped to the desired level (climate
zone, utility, county, income level, disadvantaged communities as per DAC definitions,
equipment type, or any defined house or household characteristic or combination thereof).
Aggregation from individual agents to groups and populations is achieved using population
weights assigned to the agents, analogous to and, in this implementation, partly derived from
RASS survey sample weights.
Modeling Change Processes and Interventions in SIMSAND Each household’s simulated energy use changes in time as a result of changes in agents'
characteristics and how they interact (such as equipment changes and behavioral changes).
Several change processes (and related dynamics) are currently modeled in SIMSAND that
affect agent characteristics and space cooling; these include AC equipment replacement, AC
system adoption, installation quality, and increased levels of use due to efficiency (takeback).
Other behaviors are also modeled that may affect space cooling use independent of equipment
57 This AC demand modeling approach loosely follows the well-established "PRISM" (Fels, 1986) or two-change
point linear modeling procedure. This is only one of many possible approaches to modeling demand, each with strengths and weaknesses. SIMSAND is intentionally agnostic in terms of analytical methods. Alternate and multiple models can be supported and compared within the framework.
58 Electricity rates usually vary by time, and the degree of variation will intensify if more dynamic rate
mechanisms are implemented. CO2 emissions from electricity use are already complexly dependent on dynamic and evolving supply-demand system conditions. As such, translating AC electricity use into resulting electricity
costs and CO2 emissions requires simulations of energy system scales not currently represented in SIMSAND. These systems could in the future be simulated in SIMSAND, or could instead be run interactively with stand-alone electricity rate and CO2 emission simulations (as a co-simulation). Or projections from such simulations could be
used noninteractively for SIMSAND.

74
changes, including thermostat-setting shifts, changes in when households are home, and
income and electricity price elasticities of AC demand.
These processes shape simulated AC energy use. In turn, many of these processes and
behaviors are shaped by context-level trends, and changes to climate, macroeconomic
conditions (per capita income, unemployment, and inflation), electricity price, population, and
shipped AC equipment efficiency levels. In SIMSAND, each context-level trend is specified
based on historical observations (where reputable published data are available), and from
future projections derived from one or more of: publicly available projections, extrapolation of
published historical and/or projected trends, and internally defined models (specified within
SIMSAND, such as using a fixed growth rate model). Trends are mapped into SIMSAND based
on the geographic resolution of available data (statewide, utility-scale, county-scale, and so
on). As context-level changes are a key source of uncertainty in future energy use, SIMSAND
allows the user to select among multiple alternative projections, or adjust and tailor these,
including unpredictable wildcard events or discontinuous context changes, such as an abrupt
economic recession (or boom) or an electricity price spike (or drop). an example, future rates
of air conditioning adoption might be simulated based on a simple fixed-rate model, based on
projections derived from the California Energy Commission's Demand Forecast Model, which
were established from observed relationships between climate and air conditioning saturations
(Sailor and Pavlova, 2003), or by modeling a household's propensity to install air conditioning
at least partly dependent on that household's recent experiences (such as exposure to
extreme heat events potentially enhanced by climate change).
Several stylized policy interventions targeted to air conditioning are also included as optional
selections in SIMSAND, among them:
• Improving installation quality: assumes an intervention that improves levels of
compliance with new/replacement HVAC permitting rules, resulting in increased
distribution system efficiencies
• Targeting heat pump as an electrification measure: assumes an intervention that
increases uptake of heat pumps by low income and/or disadvantaged community
households
• Targeting air conditioner replacement: assumes an intervention that increases AC
replacement rates for low income and/or disadvantaged community households
• Cash for AC clunkers: assumes an intervention that increases early replacement of
old/inefficient AC units with new AC units
• Replacing HVAC clunkers with heat pumps: assumes an intervention that increases early
replacement of old/inefficient HVAC systems with new heat pumps
The onset date and intensity of each of these interventions can be altered by the user,
allowing comparison across various combinations of policy designs and future conditions.
Exploring Uncertain Futures with SIMSAND SIMSAND simulations play time forward, starting from initial historical or recent conditions,
toward simulated futures defined by some combination of change trends, wildcard events, and
stylized interventions. These change knobs can be adjusted to simulate various future
conditions—and combined to model distinct scenarios. Five such scenarios are preconfigured in
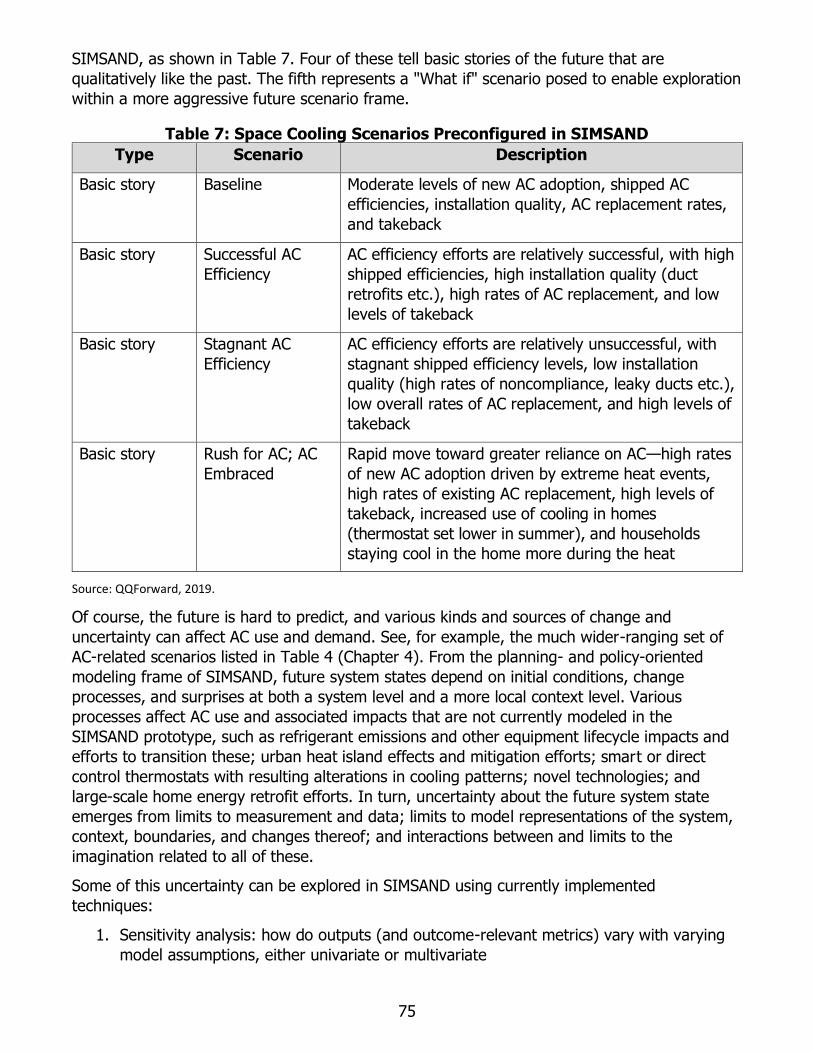
75
SIMSAND, as shown in Table 7. Four of these tell basic stories of the future that are
qualitatively like the past. The fifth represents a "What if" scenario posed to enable exploration
within a more aggressive future scenario frame.
Table 7: Space Cooling Scenarios Preconfigured in SIMSAND
Type Scenario Description
Basic story Baseline Moderate levels of new AC adoption, shipped AC
efficiencies, installation quality, AC replacement rates,
and takeback
Basic story Successful AC
Efficiency
AC efficiency efforts are relatively successful, with high
shipped efficiencies, high installation quality (duct
retrofits etc.), high rates of AC replacement, and low
levels of takeback
Basic story Stagnant AC
Efficiency
AC efficiency efforts are relatively unsuccessful, with
stagnant shipped efficiency levels, low installation
quality (high rates of noncompliance, leaky ducts etc.),
low overall rates of AC replacement, and high levels of
takeback
Basic story Rush for AC; AC
Embraced
Rapid move toward greater reliance on AC—high rates
of new AC adoption driven by extreme heat events,
high rates of existing AC replacement, high levels of
takeback, increased use of cooling in homes
(thermostat set lower in summer), and households
staying cool in the home more during the heat
Source: QQForward, 2019.
Of course, the future is hard to predict, and various kinds and sources of change and
uncertainty can affect AC use and demand. See, for example, the much wider-ranging set of
AC-related scenarios listed in Table 4 (Chapter 4). From the planning- and policy-oriented
modeling frame of SIMSAND, future system states depend on initial conditions, change
processes, and surprises at both a system level and a more local context level. Various
processes affect AC use and associated impacts that are not currently modeled in the
SIMSAND prototype, such as refrigerant emissions and other equipment lifecycle impacts and
efforts to transition these; urban heat island effects and mitigation efforts; smart or direct
control thermostats with resulting alterations in cooling patterns; novel technologies; and
large-scale home energy retrofit efforts. In turn, uncertainty about the future system state
emerges from limits to measurement and data; limits to model representations of the system,
context, boundaries, and changes thereof; and interactions between and limits to the
imagination related to all of these.
Some of this uncertainty can be explored in SIMSAND using currently implemented
techniques:
1. Sensitivity analysis: how do outputs (and outcome-relevant metrics) vary with varying
model assumptions, either univariate or multivariate
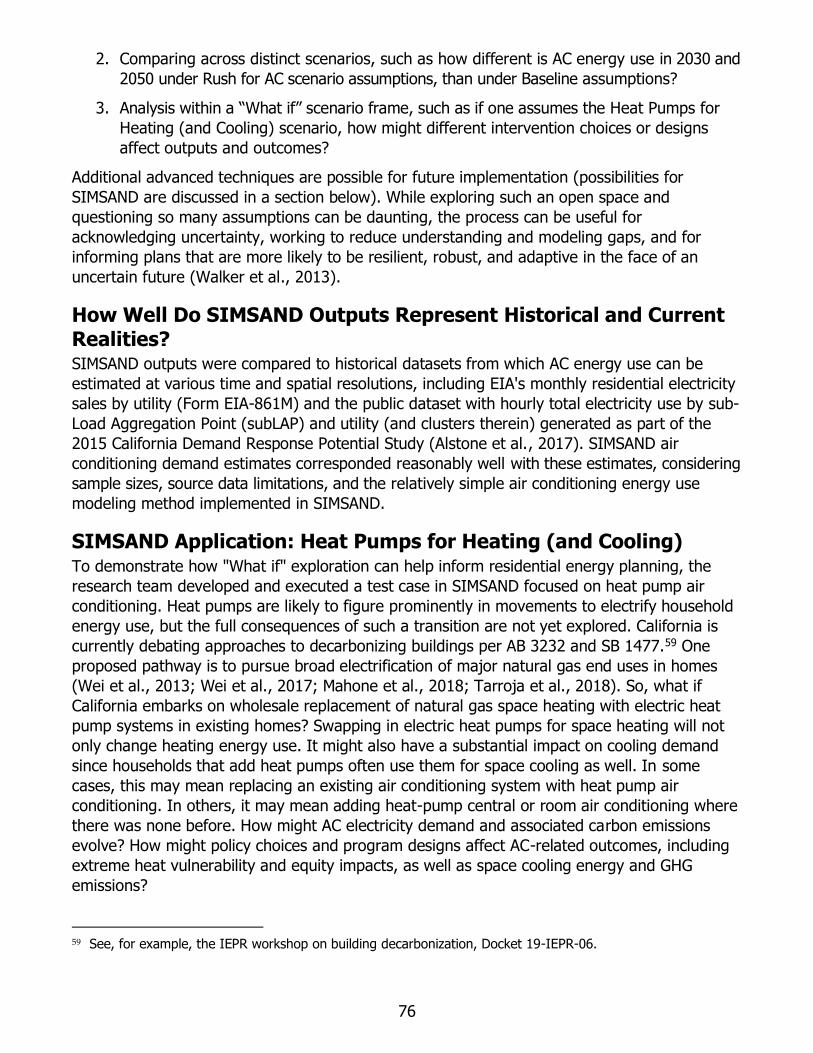
76
2. Comparing across distinct scenarios, such as how different is AC energy use in 2030 and
2050 under Rush for AC scenario assumptions, than under Baseline assumptions?
3. Analysis within a “What if” scenario frame, such as if one assumes the Heat Pumps for
Heating (and Cooling) scenario, how might different intervention choices or designs
affect outputs and outcomes?
Additional advanced techniques are possible for future implementation (possibilities for
SIMSAND are discussed in a section below). While exploring such an open space and
questioning so many assumptions can be daunting, the process can be useful for
acknowledging uncertainty, working to reduce understanding and modeling gaps, and for
informing plans that are more likely to be resilient, robust, and adaptive in the face of an
uncertain future (Walker et al., 2013).
How Well Do SIMSAND Outputs Represent Historical and Current Realities? SIMSAND outputs were compared to historical datasets from which AC energy use can be
estimated at various time and spatial resolutions, including EIA's monthly residential electricity
sales by utility (Form EIA-861M) and the public dataset with hourly total electricity use by sub-
Load Aggregation Point (subLAP) and utility (and clusters therein) generated as part of the
2015 California Demand Response Potential Study (Alstone et al., 2017). SIMSAND air
conditioning demand estimates corresponded reasonably well with these estimates, considering
sample sizes, source data limitations, and the relatively simple air conditioning energy use
modeling method implemented in SIMSAND.
SIMSAND Application: Heat Pumps for Heating (and Cooling) To demonstrate how "What if" exploration can help inform residential energy planning, the
research team developed and executed a test case in SIMSAND focused on heat pump air
conditioning. Heat pumps are likely to figure prominently in movements to electrify household
energy use, but the full consequences of such a transition are not yet explored. California is
currently debating approaches to decarbonizing buildings per AB 3232 and SB 1477.59 One
proposed pathway is to pursue broad electrification of major natural gas end uses in homes
(Wei et al., 2013; Wei et al., 2017; Mahone et al., 2018; Tarroja et al., 2018). So, what if
California embarks on wholesale replacement of natural gas space heating with electric heat
pump systems in existing homes? Swapping in electric heat pumps for space heating will not
only change heating energy use. It might also have a substantial impact on cooling demand
since households that add heat pumps often use them for space cooling as well. In some
cases, this may mean replacing an existing air conditioning system with heat pump air
conditioning. In others, it may mean adding heat-pump central or room air conditioning where
there was none before. How might AC electricity demand and associated carbon emissions
evolve? How might policy choices and program designs affect AC-related outcomes, including
extreme heat vulnerability and equity impacts, as well as space cooling energy and GHG
emissions?
59 See, for example, the IEPR workshop on building decarbonization, Docket 19-IEPR-06.

77
The “What if” scenario posits a transition of natural gas space heating in California homes to
electric heat pumps (HP) based on transformation in heating and AC replacement and
additions. Three transition patterns are compared here:
1. No HP pattern, assuming status quo conditions with minimal rates of electrification by
heat pump installation.
2. Mid HP pattern, assuming an S-shaped transformation of AC adoption and
replacements, starting in 2020 and gaining 50 percent of market share by 2030—2031,
and more than 95 percent by 2040. This pattern is similar to that supposed by Mahone
et al. (2018),60 and assumes essentially no early retirements of existing systems; that is
the transformation is limited to the existing or natural replacement rates of heating and
AC equipment and natural rates of additions.
3. Rapid HP pattern, assuming an additional impetus on top of the Mid HP transformation,
starting in 2025 and continuing through the simulation period. This rate of
transformation necessarily assumes some early HVAC replacement.
These transition patterns are applied in this simulation as top-down constraints, perhaps
plausible, but not necessarily likely without very concerted efforts. The impetus likely
necessary to drive such a market transformation61 was not modeled beyond mapping the
aggregate transition patterns onto household-level HP uptake processes, notably as end-of-life
replacements of existing space heating and cooling systems, and as HVAC installations with
home construction. Compared to Mid HP, the Rapid HP trajectory involves an acceleration in
HVAC replacements, due to earlier replacement of some systems, though overall replacement
propensity patterns are retained. For the base Mid HP and Rapid HP patterns (without
targeting interventions), HP uptake mimics the pattern of the nonHP change process, for
example, replacements are skewed toward older existing systems and higher income
households.
The transformation of the installed stock of HVAC equipment substantially lags the
transformation in the installation markets. Even assuming an aggressive market
transformation, it still takes 30 years before electric heating is the primary heating source for
90 percent of California homes (Figure 6, blue solid line). With the less-aggressive Mid HP
scenario uptake assumptions similar to the assumptions used in Mahone et al. (2018), electric
heating saturation only reaches approximately 70 percent after 30 years (red solid line).
60 Mahone et al. (2018) assume HP market share of new HVAC sales are 50 percent in 2030 and 100 percent by
2050. The SIMSAND "Mid HP" scenario assumes 50 percent HP share of new AC sales in 2030-2031 and 100 percent by 2050. The SIMSAND "Rapid HP" scenario assumes 50 percent share of new AC sales in 2027 and 100 percent by 2050.
61 Many difficulties would be faced in achieving such a transition, including potentially considerable technical
incompatibilities with existing equipment spaces, ducting, electrical systems, and other conditions in homes. A more developed SIMSAND implementation, given sufficient data, has the potential to reflect market dynamics,
market actors, and the technical and other difficulties faced in inducing such transitions.
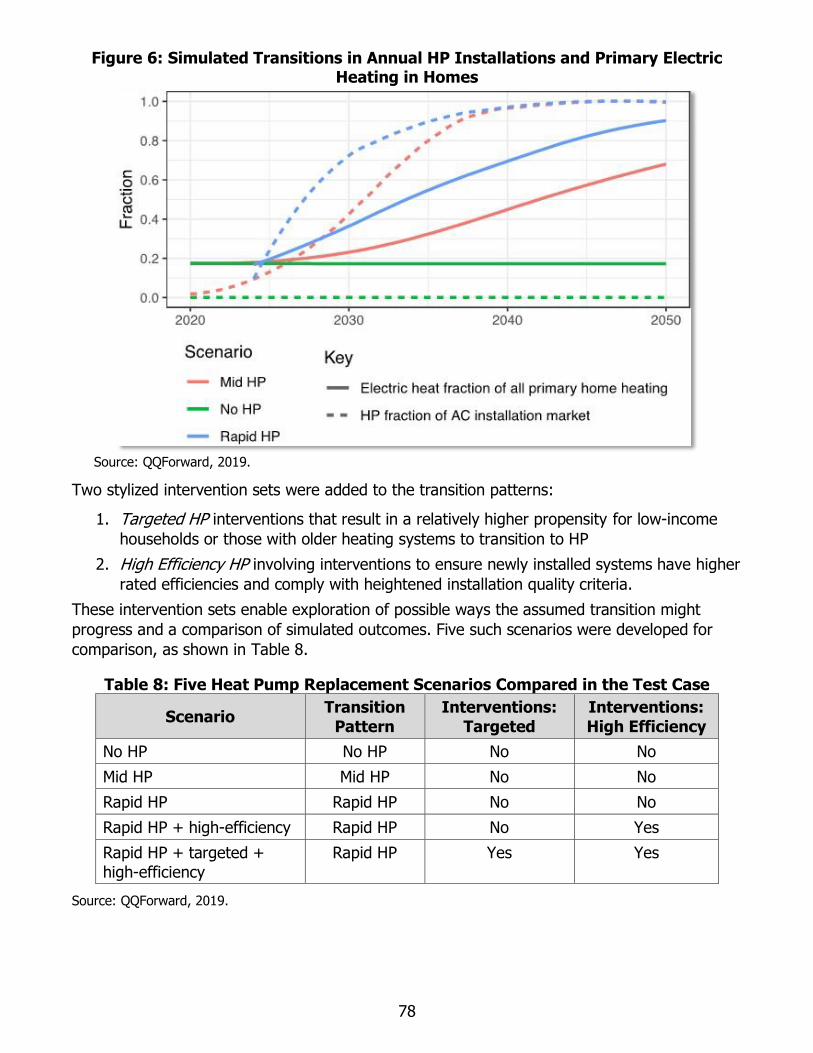
78
Figure 6: Simulated Transitions in Annual HP Installations and Primary Electric Heating in Homes
Source: QQForward, 2019.
Two stylized intervention sets were added to the transition patterns:
1. Targeted HP interventions that result in a relatively higher propensity for low-income
households or those with older heating systems to transition to HP
2. High Efficiency HP involving interventions to ensure newly installed systems have higher
rated efficiencies and comply with heightened installation quality criteria.
These intervention sets enable exploration of possible ways the assumed transition might
progress and a comparison of simulated outcomes. Five such scenarios were developed for
comparison, as shown in Table 8.
Table 8: Five Heat Pump Replacement Scenarios Compared in the Test Case
Scenario Transition
Pattern
Interventions:
Targeted
Interventions:
High Efficiency
No HP No HP No No
Mid HP Mid HP No No
Rapid HP Rapid HP No No
Rapid HP + high-efficiency Rapid HP No Yes
Rapid HP + targeted +
high-efficiency
Rapid HP Yes Yes
Source: QQForward, 2019.

79
For each scenario, four outcome metrics were simulated for the five scenarios over the period
2020–2050. The results are shown in Figure 7).62 As seen in Figure 6, under the Mid HP market
transformation (without early replacement), the transition from natural gas to electricity for
home heating lags behind the systemwide 2030 and 2050 state targets for transition to
electricity overall. Rather, a quite aggressive market transformation (the Rapid HP scenarios)
could be necessary. These Rapid HP scenarios could involve many early replacements. But a
transition of this pace can substantially increase air conditioning electricity use partly because
of quick adoption of additional heat pump air conditioning units (rows A and C in Figure 7 for
the Rapid HP scenario). By implication, this would result in increased peak demand and
possibly GHG emissions, depending on energy supply, and could exacerbate air conditioning
electricity costs and burden experienced by California households (row B of Figure 7, Rapid HP
scenario). But the simulations suggest that certain interventions can effectively mitigate such
increases in AC energy use (rows A and D of Figure 7, Rapid HP+high-efficiency scenario) and
reduce the level of the added electricity cost burden, particularly for vulnerable populations
(row B, rightmost column of Figure 7, Rapid HP+targeted+high-efficiency scenario), even
while providing increased air conditioning access overall and for subpopulations (row C, Figure
7). However, besides any early replacement issues, rapid replacement strategies also run a
higher risk of encountering unanticipated problems (of the sort discussed in Chapters 2 and 3)
for a larger number of households, since—at least without special attention to ongoing field
evaluation—problems may be noticed too slowly for sufficiently responsive corrections.
SIMSAND outputs include not just energy impacts, but also other dimensions that are not
easily addressed by existing tools. These include equity impacts; multiple possible scenarios
progressing along a variety of dimensions; consideration of how people’s behaviors may
facilitate, inhibit, or be differentially impacted by the transition; and possible direct and side
effects of the set of stylized policy interventions applied. This array of possible outputs and
specifications provides (1) a structure that helps users think about more dimensions of
residential energy use than are usually visible in transition planning, and (2) an estimation of
impacts from variations along these dimensions. For the question of heat pumps considered
here, these capabilities also help draw attention to noncentral, but potentially important,
consequences of a rapid transition from natural gas to electric space heating. These include,
for example, potential increases in air conditioning electricity use and cost burden, as well as
the potential for big increases in access to air conditioning for disadvantaged communities and
low-income households. These latter increases can potentially improve societal resilience to
extreme heat events, but with a tradeoff in increased levels of air conditioning use relative to
what might be expected in a linear trajectory.
Others have used building stock models to assess important dimensions of a transition to heat
pumps (Mahone et al., 2019, Raghavan et al., forthcoming), not all of which have been
implemented in the current SIMSAND prototype (such as space heating impacts, economic
cost-effectiveness, and GHG emissions impacts from alterations in energy use and refrigerant
62 The 2040 peaks evident in the graphs are related to the RCP 4.5 trajectory used in the simulation. High CDD
Homes are the subset of homes experiencing greater than a threshold number of cooling degree days per year. This population varies depending on the year's weather, generally increasing in the later years based on the
climate projection used.
80
emissions). In contrast, SIMSAND can offer greater resolution into other considerations that
can also be critical to transitions, for example:
• Diversity of household-to-household responses and impacts based on differences in
household circumstances and conditions, and empirical energy use patterns—not just
on building and equipment characteristics
• Targeting of interventions to particular populations, low income households or those in
communities defined as disadvantaged (DACs) —not just based on broad categories of
housing type or vintage, existing equipment characteristics, climate zone, and so on.
• Empirically-based modeling of energy use more reflective of the idiosyncratic
interactions of people with their homes and appliances and reactions to change in these
(e.g. takeback), which can complement building simulation and engineering-driven
expectations of typical energy use and how energy use changes with respect to
changed technologies.
The results shown for this example set of scenarios demonstrate the types of analyses and
insights possible with a SIMSAND-centered approach. In short, the approach can be used to
explore aggregate and home-level (disaggregate) energy transitions under uncertain future
conditions, high levels of heterogeneity, and various possible policy strategies for pursuing a
transition toward heat pumps. The space cooling focus of the current proof-of-concept
captures a critical end use looking forward in California and highlights potentially important
knock-on effects from a possible space heating transition.
SIMSAND Next Steps and Future Potentialities
Getting Users' Hands in the Sand A major next step for advancing a "What if" simulation sandbox is to develop more refined
ideas about users and use cases. To what degree should future SIMSAND development focus
on institutional users (such as at the Energy Commission), research users (at universities,
nonprofits, and consultant organizations), stakeholder users (advocacy organizations, utilities),
or the general public? It is reasonable to imagine that each type of user is likely to have
unique interests and needs that might require some customization or might use be
generalizable? Table 9 shows some possible user types and use cases. For example, an
institutional user might face an obligation to produce estimates to inform a certain policy
question quickly, where something more detailed and vetted than a back-of-envelope
calculation, but faster than a commissioned study is required. Or a community advocacy
organization may want to look at potential effects of a policy decision on the community, using
the approach to imagine local scenarios and readily see how elements of variability play out.
To move from proof-of-concept to broad use, design and development will have to tailor the
implementation to specific users and their use cases. Next steps for moving SIMSAND
development forward will also have to address more general issues, for example:
• Fitting the “What if” simulation sandbox approach into, or complementing, existing
processes and roles within California institutions
• Ensuring that the use of SIMSAND and its outputs are appropriate to the data,
capabilities, and overall approach, including conveying critical uncertainties

81
• Making the SIMSAND platform sufficiently accessible (for example, possibly via a web-
based interface), easy to use, and foolproof.
Figure 7: Simulated Trends for Four Different Metrics and House-Type Groups for Heat Pump Transition Scenarios
Source: QQForward, 2019.
Home cooling is a critically important energy use that simultaneously affects achieving the
state’s decarbonization goals, grid stability, and social resilience to climate change itself.
Depending on the strategies used, these goals can conflict. The advances made in this project
offer analysts the possibility of combining deep consideration of possible cooling strategies and
technologies with a simulation platform capturing the microlevel patterning and structure of air
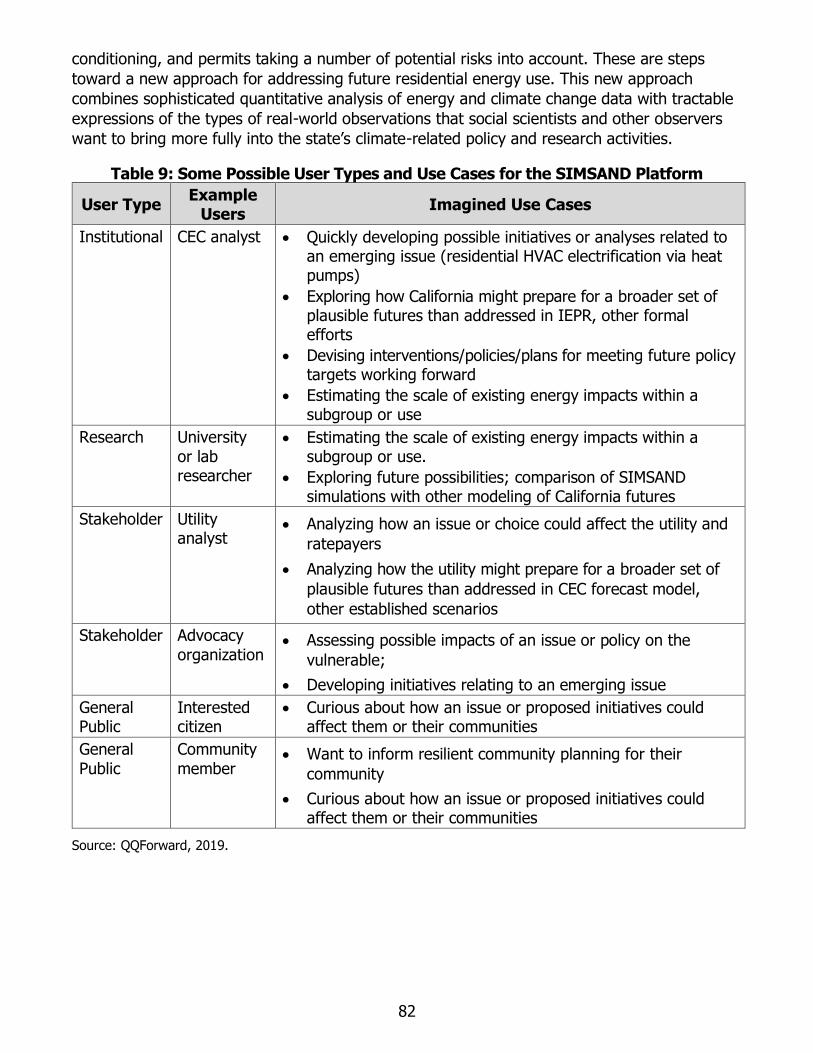
82
conditioning, and permits taking a number of potential risks into account. These are steps
toward a new approach for addressing future residential energy use. This new approach
combines sophisticated quantitative analysis of energy and climate change data with tractable
expressions of the types of real-world observations that social scientists and other observers
want to bring more fully into the state’s climate-related policy and research activities.
Table 9: Some Possible User Types and Use Cases for the SIMSAND Platform
User Type Example
Users Imagined Use Cases
Institutional CEC analyst • Quickly developing possible initiatives or analyses related to an emerging issue (residential HVAC electrification via heat pumps)
• Exploring how California might prepare for a broader set of plausible futures than addressed in IEPR, other formal efforts
• Devising interventions/policies/plans for meeting future policy targets working forward
• Estimating the scale of existing energy impacts within a subgroup or use
Research University
or lab researcher
• Estimating the scale of existing energy impacts within a subgroup or use.
• Exploring future possibilities; comparison of SIMSAND simulations with other modeling of California futures
Stakeholder Utility analyst
• Analyzing how an issue or choice could affect the utility and
ratepayers
• Analyzing how the utility might prepare for a broader set of
plausible futures than addressed in CEC forecast model,
other established scenarios
Stakeholder Advocacy
organization • Assessing possible impacts of an issue or policy on the
vulnerable;
• Developing initiatives relating to an emerging issue
General Public
Interested citizen
• Curious about how an issue or proposed initiatives could affect them or their communities
General
Public
Community
member • Want to inform resilient community planning for their
community
• Curious about how an issue or proposed initiatives could affect them or their communities
Source: QQForward, 2019.
83
Data Nexus at the Household and House Level A wide variety of existing data streams originate at or are resolved to the house and
household level, and new and more detailed data streams are becoming available. The current
data environment, and especially the possibility of coordinating new streams, is quite exciting
in terms of the insights it may bring. Individual, house, and/or household-level data streams
include microdata from the Public Use Microdata Series (PUMS, U.S. Bureau of the Census),
RASS (California), Residential Energy Consumption Survey (RECS national sample, from the
Energy Information Administration), the American Housing Survey (AHS, Department of
Housing and Urban Development), and bordering issues such as time use (American Time Use
Survey) and health data (the CDC’s Behavioral Risk Factor Surveillance System); billing and interval electricity, gas, and water meter data;63 tax assessor and various aggregator datasets
for houses, households and individuals; potentially household-level consumer segmentation
data offered by private companies (such as Experian’s MOSAIC dataset), and GIS data of
various sorts. There are also recent and still emerging data streams such as smart thermostat data, LiDAR building footprint and height data,64 street view data, PV generation data,
increasingly accessible weather and microclimate data (such as high-resolution urban heat island assessment), and more sophisticated data on the human actions and human effects.65
Given "big data", Internet of Things, Smart Cities, Smart Grids, Smart Homes, and Smart-
Everything, the flexibility to merge and incorporate new, diverse, and evolving data streams
potentially enabled by the household + house-level modeling approach could have major
benefits for planning.
Household and house-centered modeling depends on data sufficient to characterize the issue
(in this case residential AC use and energy) for individual households and houses (and to
capture covariation to the extent possible) with a sampling adequate for population-scale
aggregates, whether California or subsets thereof. This can be different from other forecasting
and futures approaches, which tend to characterize energy use (e.g. Unit Energy Consumption
for equipment along with saturations) in relatively coarse groupings (such as by housing type,
climate zone, end use type, and fuel).66 One particular value of the SIMSAND approach is its
ability to capture and use empirical patterns and relationships inherent in the source data
63 This includes much of what is currently collected and managed by California utilities, some of which is now
also housed by the California Energy Commission, or will be (see, for example, https://calenergycommission.blogspot.com/2019/05/commissioner-mcallister-talks-about.html; see also the GIS data hub
by the Energy Commission, at https://cecgis-caenergy.opendata.arcgis.com/).
64 For example: data releases from Microsoft in 2017 and 2018, https://www.gislounge.com/almost-125-million-
building-footprints-us-now-available-open-data/
65 Future directions for this category of data are nebulous and likely to be highly contentious. Examples of the
type of application include, for example, using cell phone location data from which home occupancy timing might be inferred, not a large stretch from the emerging use of such data in transportation planning (e.g., https://www.smartcitiesdive.com/news/portland-or-launches-pilot-with-sidewalk-labs-location-data-
software/555681/).
66 Exceptions exist, such as urban building energy modeling based on building simulation. Still, these mainly
focus centrally on building and technology, and look at a relatively constrained set of technological futures, rather
than the potentially broader set of plausible futures available using a more socio-technical approach.

84
without decomposing them (into factors and statistical formulae), since such decomposition is
often difficult, if not impossible to do well.
SIMSAND demonstrates the household and house centered data concept using RASS 2009
microdata with monthly billing data, along with several supporting datasets. The RASS 2009
data are obviously outmoded, which is an important limiting factor for the prototype. But there
are opportunities for improvement even short of the next edition of the RASS. Improved
household + house + energy use data (for all factors at a time, to help characterize the
structure of variability) would provide a new level of vision into present residential energy use
in addition to the use as a basis for speculating on the future. The data nexus presents a
major opportunity for the SIMSAND platform, but it also presents perhaps the most pressing
next steps: assessing and incorporating emerging data streams and finding the appropriate
statistical and data analytic methods to combine imperfectly meshed data, and maintaining
disclosure/privacy control, for example utilizing synthetic population or synthetic data vault
approaches (Patki et al., 2016; Temple et al., 2017; Subbiah et al., 2017; Thorve et al., 2018).
Technical Improvements to the SIMSAND Platform The household/house-level agent approach, which distinguishes the SIMSAND approach from
most other efforts in the residential energy space, also brings potential tradeoffs. It is well-
suited for some problems and situations, and not others. Based on the experience constructing
the SIMSAND proof-of-concept, household/house-level agent-based modeling at scale may
require:
• Higher quality source data. As noted just above, particularly useful are up-to-date data
that are simultaneously descriptive of individual households, homes, energy use,
equipment, and behaviors.
• Computational streamlining and scaling. Covering California with reasonable resolution
may require at least several thousand agents, depending on what subgroupings might be desired.67 Approaches relying on a predefined, fixed categorization scheme
(categories by climate zone, housing type, and so on) can be much less computationally
intensive, as each category might be represented by the SIMSAND-equivalent of a
single "representative" agent. For certain classes of problems, such a representation
may be sufficient, and the additional detail in SIMSAND would in turn be
computationally wasteful. On the other hand, for problems that reside down in the
details, the increased resolution can be useful. This type of problem may be particularly
native to the residential energy and climate transition spaces (Mercure et al., 2016). In
these cases, an approach like that used in SIMSAND is well-suited. Its data- and
computation-intensiveness is inherent to the problem itself, rather than to the modeling
approach.
• Stochasticity management. The current sandbox method applies random sampling to
sample agents from the RASS-derived agent database. Combined with the quite uneven
sampling weights generated for RASS 2009, this results in substantial stochasticity in
simulation results when smaller size samples of household/house agents are used in
67 See, e.g., Wilson et al., 2017, who estimated that 200,000 to 350,000 simulation runs were needed for
accurately representing the entire single-family U.S. housing stock using their archetype approach.
85
simulation runs. However, useful features of SIMSAND (the scaling methodology, the
potential to merge disparate datasets, and the potential to correct or recalculate
weights) depend on the process of randomly sampling households from the source
population database, and as such are tied to this stochasticity, so the current strategy has been to manage rather than eliminate this stochasticity.68 Larger applications may
necessitate improved sampling strategies, a migration to a high-performance or cloud-
computing environment, or use of an emulator of the SIMSAND simulation in place of
SIMSAND itself.
Additional next-step technical improvements to the SIMSAND platform also include
improvements to submodels, such as replacing the building stock change modeling, which in
the current prototype is limited.
SIMSAND Platform Directions and Applications The “What if” simulation sandbox concept is quite general and flexible, with the consequence
that the SIMSAND platform can be made substantially more sophisticated within: the current
residential energy use application, for example with higher-resolution modeling of air
conditioning energy use, expansion to other end uses and to nonenergy or life cycle impacts—
such as refrigerant-related emissions; integration with hourly or subhourly building simulation,
and hourly observed historical and projected future weather/climate data;69 more detailed and
dynamic modeling of people, behavior, and technologies; adding the ability to model “smart”
and direct control technologies; increased resolution in time and geographic scales; guidance
on uncertainties; and more.
Similarly, the concept can conceivably be focused on or expanded to a variety of bordering
domains and issues, including other energy sectors, cosimulation with supply-side or grid-
centered models, and applications at other scales or crossing into bordering domains.
Finally, analytical improvements are possible to enable the SIMSAND platform to be used to
more systematically explore the space of possible futures and assess intervention options.
Approaches include Monte Carlo-based analysis (a stochastic multivariate analysis approach to
exploring the trend, wildcard, and intervention possibility space), and deep uncertainty and
robustness analyses (Lempert, 2013; Walker et al., 2013; Climate Action Team, 2015;
Sanstad, 2017).
In modeling, there is a well-known tension between parsimony and comprehensiveness.
SIMSAND in current form already qualifies as reasonably complicated but not particularly
complex (Sun et al., 2016). The current level of complication is partly a result of the data-
driven household and house level bottom-up modeling approach, together with the
permutations necessary to achieve flexible exploration of a highly uncertain and
multidimensional future possibility space.
68 The other main source of stochasticity in SIMSAND is the use of probabilistic representations of AC adoption,
AC replacement, and other household-level processes or actions.
69 For example, the observed historical and projected future hourly weather station data for various points across
California that are undergoing development under EPC-15-036 and EPC-16-063.
86
Distinct use cases tend to be best served by tailored models.70 This tension supports the
"SIMSAND as a platform" approach—hosting a family of applications each tailored to a
particular use and with limited scope. Each application would have particular populations and
types of agents at the appropriate granularity, a rigorously defined model representing key
system and agent rules and relations, and would be informed and driven by up-to-date high-
quality data streams and scenarios, shared and standardized where possible.
Chapter Summary
• The agent-based energy simulation sandbox constructed in this project, SIMSAND, is
designed for bottom-up "What if" and scenario-based exploration of residential energy
transitions. Its major strength lies in its ability represent the diversity of energy use,
conditions, and interactions at the household level, and to play these out under
scenarios that specify varying assumptions about changes in weather and climate,
demographics, buildings, technology improvements, social practices, and policies over
30-50 years.
• While the approach has broad applicability across household energy end uses and
beyond, implementation of SIMSAND at this proof-of-concept stage for residential
cooling. Cooling is a crucial end use for achieving climate change policy goals, because
of warming weather, the time-dependent and peaky nature of air conditioning, the
challenges this poses for the grid especially one powered primarily by renewables, and
cooling’s role in supporting human health and well-being.
• SIMSAND is intended to facilitate rapid assessment of various residential energy futures
scenarios and to coordinate a variety of key data sets, including standard projections
related to climate and demographic change. It is designed to be useful for planning and
research staff.
• The SIMSAND approach can take advantage of emerging data streams with a nexus at
the household level and could be coordinated with the Energy Commission’s recent data
repository initiative and activities. The new data from such a repository could be a
major opportunity for developing a better empirical understanding of household energy
use and how it changes, particularly if coordinated with flexible, powerful analytical and
exploratory tools.
• The project’s analysis of histories, scenarios and modeling are complementary and
synergistic: historic transition perspectives inform scenarios; data advances inform
scenarios and nimble exploratory simulation in SIMSAND; and SIMSAND formalizes
transition perspectives and scenarios, profiting from new data streams and enabling
scenario innovation.
70 An over-complicated or over-complex model raises the bar for development, verification, validation,
performance, and usability, and therefore decreases flexibility and adaptability.

87
CHAPTER 6: Conclusions and Continuation
Approaching the large-scale energy system transition envisioned in climate change planning as
primarily a matter of perfecting hardware efficiency misunderstands how society uses energy
and integrates technology. The new data, knowledge, and collaboration routes available bring
opportunities to expand beyond this approach. This project investigated three coordinated
elements that can contribute to a new science of energy transition planning.
Research Activities Completed
The three elements investigated are: a modeling tool that takes advantage of new data and
explored the distributional perspectives they allow; scenario development process
improvements that more deliberately imagine socio-technical futures and how they can be
achieved; and mining the history of past technology transitions to more realistically develop
future ones. In more detail:
1. The project developed and tested the agent-based household energy use "What if"
simulation sandbox SIMSAND at a proof-of-concept level for California. SIMSAND starts
with households as agents. It assembles and coordinates a variety of data sources
interacting at the household level, defines energy use and related responses from these
interactions, incorporates the ability for users to specify scenarios using a variety of
parameterization options and assumptions, and generates and displays outputs for a
variety of metrics and segments of households. The results provide a basis for
assessing residential energy-related futures under a variety of user-specified scenario
assumptions, starting from a micro-scale household level versus the more averaged,
aggregated level often used in residential energy use planning. This also allows users to
better examine distributions of effects and to pinpoint results for different localities or
types of households. Such distributional views can be used to help assess equity and
other group differences in policy effects, for example, and help open the door to more
nuanced approaches to imagining social and technical change.
SIMSAND was developed for residential cooling. It is expandable to other end uses, and
updatable with novel data and assumptions regarding agent characteristics, response
functions, future conditions, and metrics of interest.
2. The project explored scenario development processes applied to residential energy
futures under climate change. Different types of residential energy scenarios
corresponding to different categories of policy questions were identified, leading to
recommendations on how scenario development in California could be expanded to
consider a wider scope of realistic possibilities for the energy future. This expansion
would help transition planning better move beyond narrow techno-economic
frameworks for energy transition. Those scenarios could draw from historical experience
on the dynamic nature, real-world breadth, and distributional aspects of past
technology change.

88
3. The project analyzed the recent histories of selected household energy technologies
and related energy efficiency efforts. The results illustrate how past technological
change has been much more uneven, less predictable, and less clear-cut than
technology dissemination models imagine. It is layered and multivalent, often with far-
reaching social effects. The complexities of real-world change have essential effects on
what technology dissemination “does” versus simple renditions of planned effects. For
the same reasons, history highlights opportunities for positive change that are missed in
current planning processes.
Research Conclusions for Energy Transition Planning
The value of this research depends on how the results will be used. Potential users, including
policy analysts, researchers, technology developers, and members of civil society, might start
with questions such as “What should resilient, efficient, and low-energy cooling look like in
future households?,” rather than “What are the benefits of getting as many efficient air
conditioners into homes as possible?” The work presented above resulted in three main
conclusions with respect to this broader type of questions.
1. An agent-based simulation model for exploring “What if” scenarios on energy use across
households is feasible, and the resulting analyses are potentially valuable for a variety of
uses and users. This was demonstrated through the SIMSAND tool and confirmed by
conversations with potential users. SIMSAND (or a similar tool) could be used to test
candidate EPIC technologies under varied scenarios, with quick turnaround for initial
reconnaissance. SIMSAND’s ability to represent and interact social, technical, and
environmental dimensions of energy use at the household level allows users to explore how
variations in key factors could affect future residential sector energy use, and how effects
are distributed across households and situations. That distributed, more multi-dimensional
view would allow users to more coherently analyze benefits and costs of candidate
technologies under a variety of assumptions, versus more static or averages-based
assessments.
SIMSAND or a similar modeling/data platform could eventually become a component of a
suite of agent-based models constructed to navigate the effects of real-world variabilities
and specific uncertainties. These tools could coordinate and help make sense of a variety
of types data sets (on energy, technology, environment, and demography, for example) for
a variety of current and emergent transition questions. In capturing household-level
interaction, SIMSAND provides capabilities that are missing in existing residential sector
planning models, and serves as a proof-of-concept and testing ground for this approach,
applied in this case to air conditioning.
2. Energy transition planning brings a need for a coordinated, broad approach to constructing,
testing, and interpreting scenarios related to residential energy technology. Historically,
California energy modeling has pursued a set of specific policy interests, posing questions
in technically focused ways—matching supplies to demands, crediting energy efficiency
gains, assessing cost-effectiveness, and exploring potential effects of specific legislation
and regulation. These scenarios focus on “What might happen?” and “What could happen”?
More recently, work on long-term energy scenarios has addressed “Could this happen?”
questions. But there are also many imaginable “What if?” and “Should we?” and “How to?”

89
questions that will need to be considered too. New processes and tools are needed to help
resolve these new types of questions.
3. History shows persistent difficulties with respect to dramatically reducing absolute levels of
household energy use by adding more efficient technologies. So focusing on disseminating
efficient devices and buildings may not lead to adequate outcomes relative to the climate
policy goals that California has adopted. On the other hand, a historical perspective also
points to strategies that expand beyond the current device-level efficiency framework,
including targeting systems of energy use and more refined technology development.
Combining historical analysis, scenario development, and more socio-technically oriented
modeling can contribute to the policy planning system by helping it move beyond a focus on
improving individual devices, average households, and normative conditions. To do this,
however, requires recognizing potential value in it.
Implications, New Questions, and Recommended Research Activities These research conclusions lead to a series of possible next steps for applying these findings.
These are summarized below. The project scope of work also calls for recommendations on
development beyond the work completed for the project. These recommendations are
included below.
Attracting SIMSAND/Sandbox Use SIMSAND does not replace existing models or modeling activities. Rather it complements them
by providing an efficient way of modeling household energy use as a dynamic system,
providing outputs that help compare results across different assumptions, eventualities, and
household population segments.
It is challenging to introduce a new tool into the already established set of tools and practices
used in energy planning. For SIMSAND or a similar tool to be used, the tool needs to be
accessible and potential users need to have some familiarity with its functionality. To be
useful, the legitimacy of the tool’s output must be established. The research above has taken
the first steps. Putting SIMSAND or a similar tool to use would be gradual process requiring
further conversations with potential users, assessing precise applications (e.g., about actual
questions already being asked), and probably modifying tool capabilities or data as
necessary.71 Users could be staff in the Energy Commission, or people outside the Commission
(such as other state agencies, local governments, utilities, community groups, and private
companies) engaged in energy transition planning and implementation (Chapter 5,Table 9).
Data Coordination SIMSAND coordinates multiple streams of data intersecting the household. These data streams
include projected weather data, household characteristics, demographic projections, and
assumptions and processes to determine air conditioning load. As SIMSAND was being
71 Possible additions range from relatively easy (such as adding the space heating end use) to medium (such as
integrating building simulation) to hard (such as providing strong integration with energy supply system
modeling).
90
developed, the Energy Commission had been pursuing (and continues to pursue) an energy
data vision to support strategic use of high-resolution data on energy use and usage patterns.
This step itself raises many statistical and philosophical questions about data science that were
less pronounced in the past, ranging from how to combine information across disparate data
sets, how to characterize and manage uncertainty, how to protect privacy (such as in linking
demographic data to energy use data at the household level), and how to express spatial
diversity and dynamic relationships in a comprehensible and statistically defensible way. Both
the state’s energy data vision and SIMSAND aim to make big data more useful and applicable
to understanding current patterns and diverse circumstances and applying them to energy and
technology planning.
Trend and History Curation If history and historical trend analysis is potentially useful, as argued above, then how can it
best be made accessible to the relevant researchers and planners? A well-designed data
platform for energy demand technology histories and related efficiency experience,
quantitative and qualitative, could help bring important evidence-based insights—of types that
can illuminate current “blind spots”—into consideration. This could include active trend
curation related to residential energy technologies and homes, interpretation and
standardization of trend data, and downscaling geographic resolution. Users could monitor
signs of emerging trends or new patterns. Various current California tools and activities, such
as the IEPR, CED, Cal-Adapt, and the Energy Commission’s public-facing Energy Almanac
already provide some of this functionality, as does the Energy Information Administration
(https://www.eia.gov/tools/). But there is little data systematically compiled on the details of
residential energy technology evolution and distribution, versus just penetrations and energy
use estimates. Therefore, such a platform should go beyond quantitative data, and including
histories of specific technologies. While useful to understanding on their own, qualitative
histories can illustrate structures and characteristics of change that can be reflected in
scenario construction and quantitative modeling thereof.
As energy research and policy becomes more inter- and multi-disciplinary, and as staff with
long experience with energy technology and related program experience retire, such histories
could be valuable in retaining some of this experience, as well as for introducing new
possibilities and reconsidering entrenched assumptions in light of changing goals,
circumstances, and data availability.
Scenario Development, Testing, and Deliberation The architectures of legacy models and processes limit what questions can be posed for
energy transition planning, as well as what answers can be seen. New tools are needed to
grasp the new problems at hand and to take advantage of the expanded data available. This is
already happening, for example, in changes to the CED model and through contracted
research projects on the climate future (such as the E3, LBNL, and UCI studies discussed in
Chapter 4).
The research presented above argues the need for exploring a wider range of questions about
energy use in homes versus earlier energy efficiency concerns. This wider range includes the
possibilities of unexpected responses to policies, important social shifts, the effects of
environmental instability, locally optimized technology choices, and close attention to the

91
distribution of costs and impacts. Transition-scale energy choices can have tremendous effects
on health, infrastructure, local and national economics, resiliency, and national security. These
go beyond the older emphasis on quantities and costs of energy use for efficiency mandates,
and require consideration of a wider scope of assessment especially for certain technologies or
approaches (e.g., smartness in homes, distributed energy resource development, and cooling
strategies).
If climate change scenario development in California were to become more highly coordinated
across different specialties, departments, and interests, how might this happen? Various
options can be imagined beyond what has already happened, with different levels of
inclusiveness (who is consulted?) and integration (how many dimensions must be considered?,
how extensive a system is captured in the scenarios?). One possibility to coordinate these
possibilities is a formal “futuring” group, such as a Scenario Analysis Working Group akin to
the active, long-running Demand Analysis Working Group.72 This group could be tasked with
dialog, exploration, and documentation to make sense of the changing space of socio-technical
energy futures. Whatever the results of modeling, there remains a need for deliberation,
especially as the number of potential tradeoffs relevant grows relative to the simpler criteria
and metrics that were appropriate in the past.
Research can move slowly relative to the pace of climate policy development. Commissioning a
study and waiting for results might often take three years or more. SIMSAND and similar
flexible tools could be used to explore future options at a climate policy pace. Work outside of
California has been pursuing this direction. In particular, the European Commission’s Horizon
2020 Work Programme calls for developing agent-based modeling and related scenario-
building processes for the European energy system (European Commission, 2018).73
Strategic Options for Cooling Modeling studies present the future of air conditioning impacts on the grid as large ranges
(Burillo et al., 2019) befitting the many uncertainties of projecting into the future, and
underscoring the different ways that air conditioning response to changing weather and
related conditions could unfold. The future of air conditioning, and its effects on the grid, are
among the biggest and most fraught topics for climate change planning in much of the world.
Hotter temperatures bring more air conditioning, more energy use, and more challenges to a
renewables-centered grid. But hot weather also has major health effects, including increased
mortality during heat waves, which can be reduced by air conditioning (Aufhammer, 2018; Yu et
al., 2010; Barreca et al., 2016). Hot weather can also have negative behavioral and
psychological effects, including increased violence and emergency psychiatric admissions
72 The Demand Analysis Working Group (DAWG) maintains a website at http://dawg.energy.ca.gov.
73 The European Commission Work Programme notes that “energy models that are currently used to plan, support,
and verify the energy policies at national and European level do not fully encompass and integrate all the new challenges posed by [the transition to a low-carbon future].” It calls for proposals that develop a suite of
modeling tools, including those that can represent the behavior of individuals and communities of actors. See “LC-SC3-CC-2-2018: Modelling in support to the transition to a Low-Carbon Energy System in Europe” (European Commission, 2018, pp. 202-203; https://ec.europa.eu/research/participants/data/ref/h2020/wp/2018-
2020/main/h2020-wp1820-energy_en.pdf).
92
(Brandl et al., 2018; Carleton and Hsiang, 2016). Certain households are especially vulnerable
to heat, due to housing quality, energy costs (Maller and Strengers, 2011), indoor air quality,
and health overall. All of this makes balancing the need for cooling against the challenges it
places on the grid (along with supply implications) a fragile affair.
Thinking about air conditioning “on average” or in terms of energy only can thus miss such
essential social considerations, including equity, limits to demand response under specific
conditions, and the need for cooling redundancy that could be used during power outages.
Energy efficiency policy’s first impulse on future residential cooling has been to ensure that
mechanical whole-house air conditioning systems are as efficient as possible, with homes
sufficiently insulated and sealed. This leads to an interesting situation. Rather than leading
with an efficient technology, one could ask what more effective strategies, that may include
efficient technology but placed in a broader context, should be considered? Central air
conditioning has been popular in California for only a few decades. Only slightly more than half
of homes have a central air conditioner.74 Even in hot areas, some households get along well
without it (Deumling, Poskanzer, and Meier, 2019), at least on most days. Given the expected
effects of air conditioning on peak demand over the coming decades (CEC 2020) there are
important questions about the strategy of broadly promoting efficient central air conditioning.
First, doing so could inadvertently dissuade lower-energy forms of cooling, paralleling the
historical finding that promoting central air conditioning in the past encouraged changes in
house architecture that reinforced the need for air conditioning (Cooper, 1998). And besides
the time-dependence and peaky nature noted above, air conditioning system performance also
degrades—typically 5% per year, sometimes much more, according to one study (Fenaughty
and Parker, 2018), so actual efficiency may be considerably lower than designed.75
These risks and imperfections point to the need for lower-energy cooling strategies that
complement individually-managed central air conditioning, including those that reduce the levels
of central air conditioning needed and those ready to replace it when necessary —for example
when there are threats of capacity shortages, or during Public Safety Power Shutoffs, rolling
blackouts, or other de-energizations. These strategies include land use planning, heat wave
management plans, lower-energy if less-efficient cooling methods, and other socio-technical
74 The latest survey data is 10 years old. The two main survey data sources for California residential air
conditioning equipment and use (the EIA’s RECS 2009 and California’s RASS 2009) have roughly consistent results. Based on 2009 RECS data, 41 percent of California households used central air conditioning, compared to
61 percent in the U.S. overall. An additional 4 percent of households in California and 2 percent nationwide report having but not using central air conditioning (EIA 2013; Table HC7.11 of the RECS survey). The 2009 RECS survey is cited because it allows a comparison between California and the U.S. based on the same method. The
2015 RECS survey showed an increase to 64 percent of homes nationwide using central air conditioning; unfortunately, there are no California-specific RECS 2015 data. RASS shows slightly more than half (53.4 percent) of California homes had central air conditioning in 2009 (KEMA RASS Data Explorer based on the survey question
regarding the number of central air conditioners installed). The RASS data are for the electric IOUs (PG&E, SCE, SDG&E) and the Los Angeles Department of Water & Power, the largest publicly owned utility in the state.
75 While HVAC maintenance is recognized as having substantial potential for energy savings for California,
achieving these savings is challenging (Heinemeier et al. 2012).

93
strategies.76 This kind of planning requires thinking through complex scenarios, and the results
from this perspective would likely be different than making central air conditioning as a
technology as efficient as possible. A “What if” simulation sandbox such as SIMSAND,
accompanied by broadly imagined scenario development, could help explore the strategic set
of questions.
Final Words The contours of the energy future are a matter of deep uncertainty transcending those of
climate, population, and energy resources. Governmental and nongovernmental actors will
need to collaborate to create, manage, and encourage energy transitions that recognize the
pivotal role of people, and not just as technology “adopters” but as ubiquitous elements of a
new energy and environmental landscape. Embracing this realization is challenging and
different from how energy demand policy has been pursued in the past. It requires innovations
in analysis, planning, understanding, and implementation, some of which are already in
motion. Additional ideas that emerged from this research project would also move innovation
toward a refreshed policy frame, including:
• Applying lessons from historical energy transitions and of related energy efficiency
efforts to contemporary climate policy discussions.
• Finding processes to accelerate learning loops as transitions move forward.
• Revisiting technology goals to reflect field experience, and to sync with the realities of a
diverse set of households/people/situations/infrastructures distributed across the state.
• Stepping up the processes by which scenarios for the energy future are developed and
assessed, to better capture energy use as one feature of an entire socio-technical
system.
• Expanding the remit of these scenarios to reflect a fuller scope of energy- and climate
change-related effects.
• Developing and applying agent-based models and other tools to support such
broadened scenario development, and to address these questions with high resolution,
while speaking to the state’s ambitious energy targets (SB 100 and SB 350 targets).
• Continuing to pursue and analyze more granular data to reveal past and present
patterns that provide evidence-based support to better manage the future.
Together, these innovations can help highlight existing and potential trouble spots, uncover
clues to promising directions, and bring new kinds of knowledge, tools, processes, and data to
bear on the challenges of climate change.
76 This is not a rejection of central air conditioner cooling. In fact, past research and development sponsored by
the Energy Commission has explored the viability and benefits of non-compressor cooling strategies (Davis Energy Group, 2004), and ASHRAE and other HVAC engineering approaches have taken seriously “adaptive comfort” (ASHRAE, 2019; De Dear, 2004) and a broader range of cooling strategies that are possible (and
currently widely used in California [Lutzenhiser et al., 2017]) in households at various income levels.

94
LIST OF ACRONYMS
Term Definition
ABM Agent Based Model
AC Air conditioning (generally)
CAC Central Air Conditioner (compressor-based)
CAC-HP Central Air Conditioning via Heat Pump
CED California Energy Demand (forecasting model)
CFL Compact Fluorescent Lamp
DAC Disadvantaged Community (as defined by CalEnviroScreen)
HVAC Heating, Ventilation, and Air Conditioning
IEPR Integrated Energy Policy Report (California Energy
Commission)
IPCC Intergovernmental Panel on Climate Change
LED Light Emitting Diode
LiDAR Laser-based land surveying method
PSPS
Public Safety Power Shutoff. These are preventative power
shutoffs undertaken by utilities during anticipated extreme
weather conditions to avoid fires started by damage to
affected transmission systems.
PV Photovoltaic System
RASS Residential Appliance Saturation Survey
RCP Representative Concentration Pathway as defined in the IPCC’s
fifth Assessment Report
RD&D Research, Development, & Deployment
RECS Residential Energy Consumption Survey (Energy Information
Administration, U.S. DOE)
SIMSAND Agent-based household energy use model developed in this
project
SSP Shared Socio-economic Pathways (IPCC)
ZNE Zero Net Energy here, but increasingly Zero Net Emissions

95
REFERENCES
Aas, Dan, Amber Mahone, Snuller Price, Zack Subin, Mike Mac Kinnon, and Blake Lane 2019.
“Draft Results: Future of Natural Gas Distribution in California.” Presentation for CEC
Staff Workshop for CEC PIER-16-011. June 6. https://ww2.energy.ca.gov/research/
notices/2019-06-06_workshop/2019-06-06_Future_of_Gas_Distribution.pdf
Ackerman, Martha. 2002. Cool Comfort: America’s Romance with Air-Conditioning.
Smithsonian Institution Press.
Ahn, Mira, Jiyun Kang, and Gwendolyn Hustvedt. 2016. “A Model of Sustainable Household
Technology Acceptance.” International Journal of Consumer Studies 40(1):83–91.
https://doi.org/10.1111/ijcs.12217.
Alexander, Samuel, and Paul Yacoumis. 2018. “Degrowth, Energy Descent, and ‘Low-Tech’
Living: Potential Pathways for Increased Resilience in Times of Crisis.” Journal of
Cleaner Production 197(October):1840–1848. https://doi.org/10.1016/j.jclepro.2016.09.
100.
Allcott, Hunt, and Michael Greenstone. 2012. “Is There an Energy Efficiency Gap?” Journal of
Economic Perspectives 26 (1): 3–28. https://doi.org/10.1257/jep.26.1.3.
Alliance to Save Energy. 2013. The History of Energy Efficiency. Alliance Commission on
National Energy Policy. January. https://www.ase.org/sites/ase.org/files/resources/Media
browser/ee_commission_history_report_2-1-13.pdf
Alstone, P., Potter, J., Piette, M.A., Schwartz, P., Berger, M.A., Dunn, et al. 2017. 2025
California Demand Response Potential Study: Charting California’s Demand Response
Future. LBNL-2001113. Lawrence Berkeley National Laboratory. Berkeley, Calif.
Anderson, Ben. 2016. “Laundry, Energy and Time: Insights from 20 Years of Time-Use Diary
Data in the United Kingdom.” Energy Research & Social Science 22(December):125–
136. https://doi.org/10.1016/j.erss.2016.09.004.
ASHRAE. 2019. ASHRAE Standard 55-2017: Thermal Environmental Conditions for Human
Occupancy. American Society of Heating, Refrigeration and Air-Conditioning Engineers.
https://www.techstreet.com/ashrae/standards/ashrae-55-2017?product_id=1994974
Australian Government. 2015. Australia’s 2030 Climate Change Target. (Fact Sheet). https://
www.environment.gov.au/climate-change/publications/factsheet-australias-2030-
climate-change-target .
Bainbridge, David A. 1976. Planning for Energy Conservation. Draft Report. With Bruce Melzer
and Jonathon Hammond. Prepared for the City of Davis, Calif. 1 June. Living Systems.
BEPress. https://works.bepress.com/david_a_bainbridge/12/
Bakke, Gretchen. 2016. The Grid: The Fraying Wires Between Americans and Our Energy
Future. Bloomsbury Publishing USA.

96
Ballo, Ingrid Foss. 2015. “Imagining Energy Futures: Sociotechnical Imaginaries of the Future
Smart Grid in Norway.” Energy Research & Social Science 9(September):9–20. https://
doi.org/10.1016/j.erss.2015.08.015.
Bankes, Steven, Robert Lempert, and Steven Popper. 2002. “Making Computational Social
Science Effective: Epistemology, Methodology, and Technology.” Social Science
Computer Review 20 (4):377–388. https://doi.org/10.1177/089443902237317.
Barclay, David, Matt Nelson, Kiersten von Trapp, Scott Walker, Lisa Wilson-Wright, Lynn
Hoefgen. 2016. “Back to the Future: Why Lighting Programs May Have Never Been
More Important.” In Proceedings of the 2016 ACEEE Summer Study on Energy
Efficiency in Buildings. American Council for an Energy Efficient Economy.
Washington, DC.
Barclay, David, Kiersten von Trapp, Melissa Meek, Shirley Pon, Lisa Wilson-Wright, and Lynn
Hoefgen. 2018. “It’s Almost the End of the World and We Know It: An Examination of
the Future of Residential Lighting Programs.” In Proceedings of the 2018 ACEEE
Summer Study on Energy Efficiency in Buildings. American Council for an Energy
Efficient Economy. Washington, DC.
Barreca, Alan, Karen Clay, Olivier Deschenes, Michael Greenstone, and Joseph S. Shapiro.
2016. “Adapting to Climate Change: The Remarkable Decline in the US Temperature-
Mortality Relationship over the Twentieth Century.” Journal of Political Economy
124(1):105–59. https://doi.org/10.1086/684582.
Bauer, Nico, Katherine Calvin, Johannes Emmerling, Oliver Fricko, Shinichiro Fujimori, Jérôme
Hilaire, Jiyong Eom, et al. 2017. “Shared Socio-Economic Pathways of the Energy Sector
– Quantifying the Narratives.” Global Environmental Change 42:316–330. https://doi.
org/10.1016/j.gloenvcha.2016.07.006.
Bedsworth, Louise, Dan Cayan, Guido Franco, Leah Fisher, and Sonya Ziaja. 2018. Statewide
Summary Report: California’s Fourth Climate Change Assessment. SUMCCCA4-2018-
013.
Bijker, Wiebe E. 1997. Of Bicycles, Bakelites, and Bulbs: Toward a Theory of Sociotechnical
Change. Cambridge, Mass. The MIT Press.
Bijker, Wiebe E., Thomas Parke Hughes, and Trevor J. Pinch. 1987. The Social Construction of
Technological Systems: New Directions in the Sociology and History of Technology. MIT
Press.
Bladh, Mats. 2011. “Energy Efficient Lighting Meets Real Home Life.” Energy Efficiency 4:235-
245.
Blumstein, Carl, Seymour Goldstone, and Loren Lutzenhiser. 2000. “A Theory-based Approach
to Market Transformation.” Energy Policy 28(2):137-144.
97
Brager, Gail S. and Richard J. de Dear. 2003. “Historical and Cultural Influences on Comfort
Expectations,” in Raymond J. Cole and Richard Lorch, eds., Buildings, Culture, and
Environment: Informing Local and Global Practices. Blackwell Publishing.
Brandl, Eva Janina, Tristram A. Lett, George Bakanidze, Andreas Heinz, Felix Bermpohl, and
Meryam Schouler-Ocak. 2018. “Weather Conditions Influence the Number of Psychiatric
Emergency Room Patients.” International Journal of Biometeorology 62 (5): 843–50.
http://dx.doi.org.proxy.lib.pdx.edu/10.1007/s00484-017-1485-z.
Braunreiter, Lukas, and Yann Benedict Blumer. 2018. “Of Sailors and Divers: How Researchers
Use Energy Scenarios.” Energy Research & Social Science 40(June):118–126. https://
doi.org/10.1016/j.erss.2017.12.003.
Brick, Stephen, and Samuel Thernstrom. 2016. “Renewables and Decarbonization: Studies of
California, Wisconsin and Germany.” The Electricity Journal 29(3):6–12. https://doi.org/
10.1016/j.tej.2016.03.001.
Bridge, Gavin. 2018. “The Map Is Not the Territory: A Sympathetic Critique of Energy
Research’s Spatial Turn.” Energy Research & Social Science 36(February):11–20.
https://doi.org/10.1016/j.erss.2017.09.033.
Brodrik, James. 2007. “Fluorescent’s Rocky Road to Consumer Acceptance.” Illuminating
Engineering Society of North America (IESNA). https://www1.eere.energy.gov/
buildings/publications/pdfs/ssl/cfls_july_lessons.pdf.
Brown, Brandy. 2014. A Meta-Evaluation of Energy Efficiency Evaluations. Ph.D. Dissertation.
Western Michigan University.
Brush, A.J., M. Hazas, and J. Albrecht. 2018. “Smart Homes: Undeniable Reality or Always Just
around the Corner?” IEEE Pervasive Computing 17(1):82–86. https://doi.org/10.1109/
MPRV.2018.011591065.
Burillo, Daniel, Mikhail V. Chester, Stephanie Pincetl, Eric D. Fournier, and Janet Reyna. 2019.
“Forecasting Peak Electricity Demand for Los Angeles Considering Higher Air
Temperatures Due to Climate Change.” Applied Energy 236(February):1–9. https://doi.
org/10.1016/j.apenergy.2018.11.039.
Bushell, Simon, Géraldine Satre Buisson, Mark Workman, and Thomas Colley. 2017. “Strategic
Narratives in Climate Change: Towards a Unifying Narrative to Address the Action Gap
on Climate Change.” Energy Research & Social Science 28(June):39–49. https://doi.org/
10.1016/j.erss.2017.04.001.
Bushnell, James. 2019. “How Much Electricity Consumption Is Too Little?” Energy Institute
Blog (blog). June 3. https://energyathaas.wordpress.com/2019/06/03/how-much-
electricity-consumption-is-too-little/
Butti, Ken, and John Perlin. 1980. A Golden Thread: 2500 Years of Solar Architecture and
Technology. Palo Alto, California: Cheshire Books.

98
Cabeza, Luisa F., Diana Ürge-Vorsatz, Daniel Ürge, Anabel Palacios, and Camila Barreneche.
2018. “Household Appliances Penetration and Ownership Trends in Residential
Buildings.” Renewable and Sustainable Energy Reviews 98(December):1–8. https://doi.
org/10.1016/j.rser.2018.09.006.
Cal-Adapt. 2019. https://cal-adapt.org/data/
Calvert, Kirby. 2016. “From ‘Energy Geography’ to ‘Energy Geographies’: Perspectives on a
Fertile Academic Borderland.” Progress in Human Geography 40(1):105–125. https://
doi.org/10.1177/0309132514566343.
Campbell, Andrew 2016. “Evaluating Evaluations—Energy Efficiency in California.” Energy
Institute Blog (blog). August 1. https://energyathaas.wordpress.com/2016/08/01/
evaluating-evaluations-energy-efficiency-in-california/.
Carlsson-Kanyama, Annika, and Anna-Lisa Lindén. 2007. “Energy Efficiency in Residences—
Challenges for Women and Men in the North.” Energy Policy 35 (4): 2163–72. https://
doi.org/10.1016/j.enpol.2006.06.018.
Carleton, T.A., and S.M. Hsiang. 2016. “Social and Economic Impacts of Climate.” Science 353
(6304):1112 [aad9837-1:aad9837-15]. https://doi.org/10.1126/science.aad9837.
California Public Utilities Commission. 2008. California Energy Efficiency Strategic Plan.
Achieving Maximum Savings in California for 2009 and Beyond. CPUC.
[CEC] California Energy Commission. 2015. “Attachment 12. References for Energy End-Use,
Electricity Demand and GHG Emissions Reference and Calculations.” November.
Sacramento, Calif.
[CEC] California Energy Commission. 2017. Integrated Energy Policy Report. California Energy
Commission. CEC-100-2017-001-CMF. https://ww2.energy.ca.gov/2017_energypolicy/
[CEC] California Energy Commission. 2018a. Building Energy Efficiency Standards Title 24.
https://www.energy.ca.gov/programs-and-topics/programs/building-energy-efficiency-
standards
[CEC] California Energy Commission. 2018b. “Attachment 12: References for Energy End-Use,
Electricity Demand and GHG Emissions Reference and Calculations. GFO-18-301.”
December. http://www.energy.ca.gov/sites/default/files/2019-05/Att_12-References-
Calc_Energy_End-Use-GHG_Emissions.docx
[CEC] California Energy Commission. 2019. Toward A Clean Energy Future, 2018 Integrated
Energy Policy Report Update Volume II. IEPR Update. California Energy Commission.
Sacramento, Calif. https://ww2.energy.ca.gov/2018publications/CEC-100-2018-001/
CEC-100-2018-001-V2-CMF.pdf
[CEC] California Energy Commission. 2020. Final 2019 Integrated Energy Policy Report. Energy
Commission. CEC-100-2019-001-CMF. California Energy Commission. Sacramento, Calif.
99
https://www.energy.ca.gov/data-reports/reports/integrated-energy-policy-report/2019-
integrated-energy-policy-report
Chassin, D.P., Fuller, J.C., and Djilali, N. 2014. “GridLAB-D: An Agent-Based Simulation
Framework for Smart Grids.” Journal of Applied Mathematics 2014:1–12. https://doi.
org/10.1155/2014/492320
Chong, H. 2012. “Building Vintage and Electricity Use: Old Homes Use Less Electricity in Hot
Weather.” European Economic Review 56(5):906-930.
Climate Action Team. 2015. Climate Change Research Plan for California. February. http://
climatechange.ca.gov/climate_action_team/reports/CAT_research_plan_2015.pdf
Cooper, Gail. 1998. Air-Conditioning America: Engineers and the Controlled Environment, 1900-
1960. Baltimore: John Hopkins University Press.
Cowan, Ruth Schwartz. 1985, “How the Refrigerator Got Its Hum,” in MacKenzie, Donald A.
and Judy Wajcman, eds. The Social Shaping of Technology. Open University Press.
Cowan, Ruth Schwartz. 1983, More Work for Mother: The Ironies of Household Technology
from the Open Hearth to the Microwave. New York: Basic Books.
Cox, Emily, Sarah Royston, and Jan Selby. 2019. “From Exports to Exercise: How Non-Energy
Policies Affect Energy Systems.” Energy Research & Social Science 55 (September):
179–188. https://doi.org/10.1016/j.erss.2019.05.016.
[CPUC]. California Public Utilities Commission. 2008. California Energy Efficiency Strategic Plan.
Achieving Maximum Savings in California for 2009 and Beyond.
[CPUC]. California Public Utilities Commission. 2018. California Electricity and Gas Utility Cost
Report. Energy Division.
Crosbie, Tracey, and Simon Guy. 2008. “En’lightening’ Energy Use: The Co-Evolution of
Household Lighting Practices.” International Journal of Environmental Technology and
Management 9 (2/3): 220-235. https://doi.org/10.1504/IJETM.2008.019035.
Cullen, Jonathan M., and Julian M. Allwood. 2010. “Theoretical Efficiency Limits for Energy
Conversion Devices.” Energy 35 (5): 2059–2069. https://doi.org/10.1016/j.energy.2010.
01.024.
Darby, Sarah J. 2018. “Smart Technology in the Home: Time for More Clarity.” Building
Research & Information 46(1): 40–147. https://doi.org/10.1080/09613218.2017.
1301707.
Darby, Sarah J. 2017. “Coal Fires, Steel Houses and the Man in the Moon: Local Experiences of
Energy Transition.” Energy Research & Social Science 31(September):120–127. https://
doi.org/10.1016/j.erss.2017.05.025.
100
Davenport, Megan L., Danyi Qi, and Brian E. Roe. 2019. “Food-Related Routines, Product
Characteristics, and Household Food Waste in the United States: A Refrigerator-Based
Pilot Study.” Resources, Conservation and Recycling 150 (November).10440.
Davis Energy Group. 2004. Alternatives to Compressor Cooling, Phase V: Integrated
Ventilation Cooling. Consultant Report to the California Energy Commission. Public
Interest Energy Research Program. P500-04-009.
Davis, Lucas. 2019. “Limitations of Standards.” Energy Institute Blog. 16 September.
University of California Berkeley. https://energyathaas.wordpress.com/2019/09/16/
limitations-of-standards/
Day Biehler, Dawn, and Gregory L. Simon. 2011. “The Great Indoors: Research Frontiers on
Indoor Environments as Active Political-Ecological Spaces.” Progress in Human
Geography 35(2):172–192. https://doi.org/10.1177/0309132510376851.
de Dear, Richard J. 2004. “Thermal Comfort in Practice.” Indoor Air 14:32-39.
Denholm, Paul, and Robert Margolis. 2016. “Energy Storage Requirements for Achieving 50%
Solar Photovoltaic Energy Penetration in California.” National Renewable Energy
Laboratory. NREL/TP--6A20-66595, 1298934. https://doi.org/10.2172/1298934.
Deumling, Reuben, Deborah Poskanzer, and Alan Meier. 2018. “‘Everyone Has a Peer in the
Low User Tier’: The Diversity of Low Residential Energy Users.” Energy Efficiency
12(1):245-259. https://doi.org/10.1007/s12053-018-9703-z.
Deumling, Reuben. 2004. Thinking Outside the Refrigerator. PhD. Dissertation. University of
California Berkeley.
Diakoulaki, Danae, Carlos Henggeler Antunes, and António Gomes Martins. 2005. “MCDA and
Energy Planning.” In Multiple Criteria Decision Analysis: State of the Art Surveys, edited
by José Figueira, Salvatore Greco, and Matthias Ehrogott, 859–90. International Series
in Operations Research & Management Science. New York, NY: Springer New York.
https://doi.org/10.1007/0-387-23081-5_21.
Dirks, J.A., Gorrissen, W.J., Hathaway, J.H., Skorski, D.C., Scott, M.J., et al. 2015. Impacts of
climate change on energy consumption and peak demand in buildings: A detailed
regional approach. Energy 79(C), 20–32. https://doi.org/10.1016/j.energy.2014.08.081
EERE (Energy Efficiency and Renewable Energy). 2008. “Energy Efficiency Trends in
Residential and Commercial Buildings. https://www1.eere.energy.gov/buildings/
publications/pdfs/corporate/bt_stateindustry.pdf
EIA RECS (U.S. Energy Information Administration). Prepared tables and microdata for the
Residential Energy Consumption Survey, periodically, 1977 to 2015. https://www.eia.
gov/consumption/residential/Department of Energy. Washington DC.
101
EIA (U.S. Energy Information Administration). 2011. “History of Energy Consumption in the
United States, 1775–2009.”Today in Energy. U.S. Energy Information Administration
(EIA).” https://www.eia.gov/todayinenergy/detail.php?id=10.
EIA (U.S. Energy Information Administration). 2015. “Energy Efficiency Improvements Have
Largely Offset Effect of More, Larger Homes.” Feb 18. https://www.eia.gov/
todayinenergy/detail.php?id=20031
EIA (U.S. Energy Information Administration). 2018. “Adoption of Autonomous Vehicles Could
Increase U.S. Transportation Energy Consumption.” Today in Energy. June 18. https://
www.eia.gov/todayinenergy/detail.php?id=36492&src=email.
EIA (U.S. Energy Information Administration). 2019a. Annual Energy Outlook with Projections
to 2050. U.S. Department of Energy. #AEO2019. https://www.eia.gov/outlooks/aeo/
pdf/aeo2019.pdf
EIA (U.S. Energy Information Administration). 2019b. “What is U.S. Electricity Generation by
Energy Source?” https://www.eia.gov/tools/faqs/faq.php?id=427&t=3
EIA-861M (U.S. Energy Information Administration). 2018. Form EIA-861M (formerly EIA-826)
detailed data. https://www.eia.gov/electricity/data/eia861m/
Elliott, Neal, Maggie Molina, and Dan Trombley. 2012. “A Defining Framework for Intelligent
Efficiency,” Report Number E125. American Council for an Energy Efficient Economy.
Washington, DC.
Ellsworth-Krebs, Katherine, Louise Reid, and Colin J. Hunter. 2015. “Home -Ing in on Domestic
Energy Research: ‘House,’ ‘Home,’ and the Importance of Ontology.” Energy Research
& Social Science 6 (March): 100–108. https://doi.org/10.1016/j.erss.2014.12.003.
Energy Institute. 2011. “California’s Building Standards: New Homes Use More Electricity.”
EI@Haas Research Review. Fall. https://ei.haas.berkeley.edu/research/reviews/
2011Fall.pdf
Engeland, Kolbjørn, Marco Borga, Jean-Dominique Creutin, Baptiste François, Maria-Helena
Ramos, and Jean-Philippe Vidal. 2017. “Space-Time Variability of Climate Variables and
Intermittent Renewable Electricity Production — A Review.” Renewable and Sustainable
Energy Reviews 79(November):600–617. https://doi.org/10.1016/j.rser.2017.05.046.
Fedoruk, Laura E., Raymond J. Cole, John B. Robinson, and Alberto Cayuela. 2015. “Learning
from Failure: Understanding the Anticipated–Achieved Building Energy Performance
Gap.” Building Research & Information 43(6):750–763. https://doi.org/10.1080/
09613218.2015.1036227.
Fels, MF 1986. “PRISM: An Introduction.” Energy and Buildings 9:5–18.
Fenaughty, Karen, and Danny Parker. 2018. Evaluation of Air Conditioning Performance
Degradation: Opportunities from Diagnostic Methods. FSEC-PF-474-18. Florida Solar
Energy Center.
102
Floarea, A., and V. Sgârciu. 2016. “Smart Refrigerator: A Next Generation Refrigerator
Connected to the IoT.” In 2016 8th International Conference on Electronics, Computers
and Artificial Intelligence (ECAI), pp. 1–6. https://doi.org/10.1109/ECAI.2016.7861170.
Fouquet, Roger, and Peter J.G. Pearson. 2012. “Past and Prospective Energy Transitions:
Insights from History.” Energy Policy 50:1–7. https://doi.org/10.1016/j.enpol.2012.08.
014.
Fourth Assessment. 2018. California’s Fourth Climate Change Assessment. http://www.
climateassessment.ca.gov.
Fowlie, Meredith, Michael Greenstone, and Catherine Wolfram. 2015. “Do Energy Efficiency
Investments Deliver? Evidence from the Weatherization Assistance Program.” Working
Paper 21331. National Bureau of Economic Research. https://doi.org/10.3386/w21331.
Freidberg, Susanne. 2015. “Moral Economies and the Cold Chain: Moral Economies and the
Cold Chain.” Historical Research 88(239):125–137. https://doi.org/10.1111/1468-2281.
12076.
Fry, Richard. 2019. “The Number of People in the Average U.S. Household is Going Up for the
First Time in Over 160 Years.” Pew Research Center. October 1.
https://www.pewresearch.org/fact-tank/2019/10/01/the-number-of-people-in-the-
average-u-s-household-is-going-up-for-the-first-time-in-over-160-years/
Fuenfschilling, Lea, and Bernhard Truffer. 2014. “The Structuration of Socio-Technical
Regimes—Conceptual Foundations from Institutional Theory.” Research Policy
43(4):772–791. https://doi.org/10.1016/j.respol.2013.10.010.
Fujii, Haruyuki, and Loren Lutzenhiser. 1992. “Japanese Residential Air-Conditioning: Natural
Cooling and Intelligent Systems.” Energy and Buildings 18(3):21–33. https://doi.org/10.
1016/0378-7788(92)90015-9.
Geels, Frank W. 2002. “Technological Transitions as Evolutionary Reconfiguration Processes: A
Multi-Level Perspective and a Case-Study.” Research Policy 31(8–9):1257–1274.
https://doi.org/10.1016/S0048-7333(02)00062-8.
Geels, Frank W. 2010. “Ontologies, Socio-Technical Transitions (to Sustainability), and the
Multi-Level Perspective.” Research Policy, Special Section on Innovation and
Sustainability Transitions, 39(4):495–510. https://doi.org/10.1016/j.respol.2010.01.022.
Geels, Frank W. 2010. “Ontologies, Socio-Technical Transitions (to Sustainability), and the
Multi-Level Perspective.” Research Policy 39(4):495–510. https://doi.org/10.1016/j.
respol.2010.01.022.
Geels, Frank W. 2011. “The Multi-Level Perspective on Sustainability Transitions: Responses to
Seven Criticisms.” Environmental Innovation and Societal Transitions 1(1):24–40.
https://doi.org/10.1016/j.eist.2011.02.002.

103
Gershunov, Alexander, and Kristen Guirguis. 2012. “California Heat Waves in the Present and
Future.” Geophysical Research Letters 39(18):1-7. https://doi.org/10.1029/
2012GL052979.
Gershunov, Alexander, Daniel R. Cayan, and Sam F. Iacobellis. 2009. “The Great 2006 Heat
Wave over California and Nevada: Signal of an Increasing Trend.” Journal of Climate
22(23):6181–6203. https://doi.org/10.1175/2009JCLI2465.1.
Ghanadan, Rebecca, Jonathan G. Koomey. 2005. “Using Energy Scenarios to Explore
Alternative Energy Pathways in California.” Energy Policy 33:1117-1142. https://doi.org/
10.1016/j.enpol.2003.11.011
Gillingham, Kenneth, Amelia Keyes, and Karen Palmer. 2018. “Advances in Evaluating Energy
Efficiency Policies and Programs.” Annual Review of Resource Economics 10(1):11–32.
https://doi.org/10.1146/annurev-resource-100517-023028.
Gismondi, Michael. 2018. “Historicizing Transitions: The Value of Historical Theory to Energy
Transition Research.” Energy Research & Social Science 38(April):193–198. https://doi.
org/10.1016/j.erss.2018.02.008.
Giurco, Damien, Elsa Dominish, Nick Florin, Takuma Watari, and Benjamin McLellan. 2019.
“Requirements for Minerals and Metals for 100% Renewable Scenarios.” In Achieving
the Paris Climate Agreement Goals: Global and Regional 100% Renewable Energy
Scenarios with Non-Energy GHG Pathways for +1.5°C and +2°C, edited by Sven Teske,
437–57. Cham: Springer International Publishing. https://doi.org/10.1007/978-3-030-
05843-2_11.
Goetzler, W., M. Guernsey, J. Young, J. Furman, and O. Abdelaziz. 2016. The Future of Air
Conditioning for Buildings. July. Consultant report for the U.S. Department of Energy,
Energy Efficiency and Renewable Energy. Washington, DC. https://www.energy.gov/
sites/prod/files/2016/07/f33/The%20Future%20of%20AC%20Report%20-
%20Full%20Report_0.pdf
Golden, Jay S., Vairavan Subramanian, Gustavo Marco Antonio Ugarte Irizarri, Philip White,
and Frank Meier. 2010. “Energy and Carbon Impact from Residential Laundry in the
United States.” Journal of Integrative Environmental Sciences 7 (1):53–73. https://doi.
org/10.1080/19438150903541873.
Gossard, Marcia Hill. 2004. “California’s Crisis: An Exploratory Analysis of Lifestyle, Energy Use,
and Conservation.” Ph.D. Thesis. Washington State University. http://search.proquest.
com/docview/305109694/abstract/634758C7B4B94A35PQ/1.
Gram-Hanssen, Kirsten, and Sarah J. Darby. 2018. “‘Home Is Where the Smart Is’? Evaluating
Smart Home Research and Approaches against the Concept of Home.” Energy Research
& Social Science 37 (March): 94–101. https://doi.org/10.1016/j.erss.2017.09.037.
Gram-Hanssen, Kirsten. 2011. “Understanding Change and Continuity in Residential Energy
Consumption.” Journal of Consumer Culture 11(1):61–78.

104
Greenblatt, Jeffery B. 2015. “Modeling California Policy Impacts on Greenhouse Gas
Emissions.” Energy Policy 78:158-172. https://doi.org/10.1016/j.enpol.2014.12.024
Greenwald, Judith M., and Alain Kornhauser. 2019. “It’s Up to Us: Policies to Improve Climate
Outcomes from Automated Vehicles.” Energy Policy 127(April):445–451. https://doi.org/
10.1016/j.enpol.2018.12.017.
Grubler, Arnulf, Charlie Wilson, and Gregory Nemet. 2016. “Apples, Oranges, and Consistent
Comparisons of the Temporal Dynamics of Energy Transitions.” Energy Research &
Social Science 22(December):18–25. https://doi.org/10.1016/j.erss.2016.08.015.
Grubler, Arnulf. 2012. “Energy Transitions Research: Insights and Cautionary Tales.” Energy
Policy, Special Section: Past and Prospective Energy Transitions - Insights from History,
50 (November): 8–16. https://doi.org/10.1016/j.enpol.2012.02.070.
Guirguis, Kristen, Alexander Gershunov, Alexander Tardy, and Rupa Basu. 2013. “The Impact
of Recent Heat Waves on Human Health in California.” Journal of Applied Meteorology
and Climatology 53(1):3–19. https://doi.org/10.1175/JAMC-D-13-0130.1.
Hackett, Bruce and Loren Lutzenhiser. 1986. “Issues in the Study of Residential Energy Use:
Ethnographic Methods and Models of Behavior.” In Proceedings of the 1986 Summer
Study on Energy Efficiency in Buildings. American Council for an Energy Efficient
Economy. Washington, DC.
Hackett, Bruce, and Loren Lutzenhiser. 1985. “The Unity of Self and Object.” Western Folklore
44(4):317–324. https://doi.org/10.2307/1499377.
Hackett, Bruce. 1990. “Clotheslines.” Proceedings of the 1990 ACEEE Summer Study on
Energy Efficiency in Buildings. American Council for an Energy Efficient Economy.
Washington, DC.
Hackett, Bruce. 1995. “1 November 95. Notes on household energy use, with special ref to
cooling—from B. Hackett.” Unpublished ms (4 pp).
Halpin, Kathleen. 2018. “Promoting Energy Literacy Through Teaching Students About Energy
Use and Behavior.” Thesis, [Bloomington, Ind.]: Indiana University. http://scholarworks.
iu.edu/dspace/handle/2022/22611.
Hammer, Christine, Anna LaRue, Gregory Risko, Stephanie Martling, and Peter Turnbull. 2014.
“West Village Case Study: Designers and Occupants.” In the 2014 Proceedings of the
ACEEE Summer Study on Buildings. American Council for an Energy Efficient Economy.
Washington, DC.
Harper, Richard. 2003. “Inside the Smart Home: Ideas, Possibilities and Methods.” In Inside
the Smart Home, edited by Richard Harper, pp. 1–13. London: Springer London.
https://doi.org/10.1007/1-85233-854-7_1.
Harris, Jeffrey, Rick Diamond, Maithili Iyer, and Christopher Payne. 2006. “Don’t Supersize Me!
Toward a Policy of Consumption-Based Energy Efficiency.” In Proceedings of the 2008

105
ACEEE Summer Study on Energy Efficiency in Buildings. American Council for an
Energy-Efficient Economy. Washington, DC.
Hazas, Mike and Yolande Strengers. 2019. “Promoting Smart Homes,” in Energy Fables, Jenny
Riniken, Elizabeth Shove, and Jacopo Torriti, eds. Earthscan. Routledge.
Hazas, Mike, Adrian Friday, and James Scott. 2011. “Look Back before Leaping Forward: Four
Decades of Domestic Energy Inquiry.” IEEE Pervasive Computing 10(1):13–19. https://
doi.org/10.1109/MPRV.2010.89.
Heffron, Raphael J., Darren McCauley, and Benjamin K. Sovacool. 2015. “Resolving Society’s
Energy Trilemma through the Energy Justice Metric.” Energy Policy 87
(December):168–176. https://doi.org/10.1016/j.enpol.2015.08.033.
Heifetz, Ronald A. 1994. Leadership without Easy Answers. The Belknap Press of Harvard
University Press. Cambridge, Mass.
Heinemeier, Kristin, Marshall Hunt, Marc Hoeschele, Elizabeth Weitzel, and Brett Close. 2012.
“Uncertainties in Achieving Energy Savings from HVAC Maintenance Measures in the
Field.” ASHRAE Conference Paper. San Antonio, Texas.
Herring, Horace. 2006. “Energy Efficiency—a Critical View.” Energy 31(1):10-20. https://doi.
org/10.1016/j.energy.2004.04.055.
Herring, Horace, and Robin Roy. 2007. “Technological Innovation, Energy Efficient Design and
the Rebound Effect.” Technovation 27(4):194–203. https://doi.org/10.1016/j.
technovation.2006.11.004.
Hirsch, Eric, and Roger Silverstone. 2003. Consuming Technologies: Media and Information in
Domestic Spaces. Routledge.
Hirsh, Richard F. 2011. “Historians of Technology in the Real World: Reflections on the Pursuit
of Policy-Oriented History.” Technology and Culture 52(1):6–20.
Hirsh, Richard F., and Christopher F. Jones. 2014. “History’s Contributions to Energy Research
and Policy.” Energy Research & Social Science 1(March):106–111. https://doi.org/10.
1016/j.erss.2014.02.010.
Hitchings, Russell, and Shu Jun Lee. 2008. “Air Conditioning and the Material Culture of
Routine Human Encasement: The Case of Young People in Contemporary Singapore.”
Journal of Material Culture 13(3):251–65. https://doi.org/10.1177/1359183508095495.
Holtz, G., Alkemade, F., Haan, F. De, Köhler, J., Trutnevyte, E., et al. 2015. “Prospects of
Modelling Societal Transitions: Position Paper of an Emerging Community.”
Environmental Innovation and Societal Transitions 17(December): 41–58.
Hong, Tianzhen, Da Yan, Simona D’Oca, and Chien-fei Chen. 2017. “Ten Questions Concerning
Occupant Behavior in Buildings: The Big Picture.” Building and Environment 114
(March): 518–530. https://doi.org/10.1016/j.buildenv.2016.12.006.

106
Howland, Jon. 2012. “Clothesline Bans Void in 19 States.” Sightline Institute (blog).
February 21. https://www.sightline.org/2012/02/21/clothesline-bans-void-in-19-states/.
Hughes, Kathleen A. 2007. “To Fight Global Warming, Some Hang a Clothesline.” New York
Times. April 12. https://www.nytimes.com/2007/04/12/garden/12clothesline.html.
Hughes, Thomas P. 1983. Networks of Power: Electrification in Western Society, 1880-1930.
Baltimore: John Hopkins University Press.
Hustvedt, Gwendolyn, Mira Ahn, and JoAnn Emmel. 2013. “The Adoption of Sustainable
Laundry Technologies by US Consumers.” International Journal of Consumer Studies
37(3):291–298. https://doi.org/10.1111/ijcs.12007.
Ingle, Aaron, Mithra Moezzi, and Loren Lutzenhiser. 2012. “How Well Do Home Energy Audits
Serve the Homeowner?,” In Proceedings of the 2012 ACEEE Summer Study on Energy
Efficiency in Buildings. American Council for an Energy Efficient Economy.
Washington, DC.
Imam, Salah, David A. Coley, and Ian Walker. "The Building Performance Gap: Are Modellers
Literate?." Building Services Engineering Research and Technology 38(3):351-375.
Jackson, Tom. 2016. Chilled: How Refrigeration Changed the World and Might Do So Again.
Reprint edition. London: Bloomsbury Sigma.
Jaffe, Adam B., and Robert N. Stavins. 1994. “The Energy Efficiency Gap: What Does It
Mean?” Energy Policy 22(10):804–810.
Janeway, Kimberly. 2011. “Despite Mercury Concerns, Few People Recycle Their CFLs.”
Consumer Reports News. April 28. https://www.consumerreports.org/cro/news/2011/
04/despite-mercury-concerns-few-people-recycle-their-cfls/index.htm
Jones, Melissa, Michael Jaske, Michael Kenney, Brian Samuelson, Cynthia Rogers, Elena
Giyenko, and Manjit Ahuja. 2017. Senate Bill 350: Doubling Energy Efficiency Savings
by 2030. California Energy Commission. Publication Number: CEC-400-2017-010-CMF.
Kanellos, Michael. 2016. “Hold the Laughter: Why the Smart Fridge is a Great Idea.” Forbes.
13 January. https://www.forbes.com/sites/michaelkanellos/2016/01/13/hold-the-
laughter-why-the-smart-fridge-is-a-great-idea/.
Kavalec, Chris, Asish Gautum, Mike Jaske, Lynn Marshall, Nahid Movassagh, Ravinderpal Vaid.
2018. California Energy Demand 2018-2030 Revised Forecast. February. CEC-200-2018-
002-CMF. California Energy Commission. Sacramento, Calif.
Kelly, Kevin. 2011. What Technology Wants. Penguin. New York.
KEMA RASS. 2003. California Residential Appliance Saturation Survey. Access through data
explorer https://webtools.dnvgl.com/rass2003/
KEMA RASS. 2009. California Residential Appliance Saturation Survey. Access through data
explorer https://webtools.dnvgl.com/rass2009/
107
KEMA. 2010. 2009 California Residential Appliance Saturation Study. Prepared for the
California Energy Commission. CEC-200-2010-004. KEMA Inc.: Oakland, Calif.
Kemp, René. 1994. “Technology and the Transition to Environmental Sustainability: The
Problem of Technological Regime Shifts.” Futures 26(10):1023–1046. https://doi.org/
10.1016/0016-3287(94)90071-X.
Kim, Joyce, Stefano Schiavon, and Gail Brager. 2018. “Personal Comfort Models – A New
Paradigm in Thermal Comfort for Occupant-Centric Environmental Control.” Building
and Environment 132(March):114–124. https://doi.org/10.1016/j.buildenv.2018.01.023.
King, Jennifer and Christopher Perry. 2017. Smart Buildings: Using Smart Technology to Save
Energy in Existing Buildings. Report A1701. February. American Council for an Energy
Efficient Economy. Washington, DC.
King, Jennifer. 2018. Energy Impacts of Smart Home Technologies. Report A1801. April.
American Council for an Energy Efficient Economy. Washington, DC.
Kirsch, D.A. 2000. The Electric Vehicle and the Burden of History. http://trid.trb.org/view/
666857.
Köhler, J., de Haan, F., Holtz, G., Kubeczko, K., Moallemi, E., Papachristos, G., & Chappin, E.
2018. “Modelling Sustainability Transitions: An Assessment of Approaches and
Challenges. Journal of Artificial Societies and Social Simulation 21(1),8. https://doi.org/
10.18564/jasss.3629
Kok, Kasper, Ilona Bärlund, Martina Flörke, Ian Holman, Marc Gramberger, Jan Sendzimir,
Benjamin Stuch, and Katharina Zellmer. 2015. “European Participatory Scenario
Development: Strengthening the Link between Stories and Models.” Climatic Change
128 (3–4):187–200. https://doi.org/10.1007/s10584-014-1143-y.
Kordjamshidi, Maria, and Steve King. 2009. “Overcoming Problems in House Energy Ratings in
Temperate Climates: A Proposed New Rating Framework.” Energy and Buildings 41 (1):
125–132. https://doi.org/10.1016/j.enbuild.2008.08.011.
Kranzberg, Melvin. 1986. “Technology and History: ‘Kranzberg’s Laws.’” Technology and
Culture 27(3):544–560. https://doi.org/10.2307/3105385.
Krewitt, Wolfram. 2002. “External Costs of Energy—Do the Answers Match the Questions?:
Looking Back at 10 Years of ExternE.” Energy Policy 30(10):839–848. https://doi.org/
10.1016/S0301-4215(01)00140-9.
Kuijer, Lenneke, and Matt Watson. 2017. “‘That’s When We Started Using the Living Room’:
Lessons from a Local History of Domestic Heating in the United Kingdom.” Energy
Research & Social Science 28(June):77–85. https://doi.org/10.1016/j.erss.2017.04.010.
Lane, Kathryn, Katherine Wheeler, Kizzy Charles-Guzman, Munerah Ahmed, Micheline Blum,
Katherine Gregory, Nathan Graber, Nancy Clark, and Thomas Matte. 2014. “Extreme
108
Heat Awareness and Protective Behaviors in New York City.” Journal of Urban Health
91(3):403–414. https://doi.org/10.1007/s11524-013-9850-7.
Laurent, Marie-Hélène, Ray Galvin, Tadj Oreszczyn, Casper Tigchelaar, Benoit Allibe, and Ian
Hamilton. 2013. “Back to Reality: How Domestic Energy Efficiency Policies in Four
European Countries Can be Improved by Using Empirical Data Instead of Normative
Calculation,” in Proceedings of the 2013 ECEEE Summer Study on Energy Efficiency.
European Council for an Energy Efficient Economy.
Lazar, Jim. 2016. Teaching the ‘Duck’ to Fly. Second edition. The Regulatory Assistance
Project. February. Montpelier, Vermont.
Leech, Judith A., William C. Nelson, Richard T. Burnett, Shawn Aaron, and Mark E. Raizenne.
2002. “It’s about Time: A Comparison of Canadian and American Time–Activity
Patterns.” Journal of Exposure Science & Environmental Epidemiology 12(6):427–432.
https://doi.org/10.1038/sj.jea.7500244.
Lempert, Robert. 2013. “Scenarios that Illuminate Vulnerabilities and Robust Responses.”
Climatic Change 117(4):627–646. https://doi.org/10.1007/s10584-012-0574-6
Leonard-Barton, Dorothy. 1981. “Voluntary Simplicity Lifestyles and Energy Conservation.”
Journal of Consumer Research 8(3):243–252. https://doi.org/10.1086/208861.
Less, Brennan, Nasim Mullen, Brett Singer, and Iain Walker. 2015. “Indoor Air Quality in 24
California Residences Designed as High-Performance Homes.” Science and Technology
for the Built Environment 21(1):14–24. https://doi.org/10.1080/10789669.2014.961850.
Lester, Paul. 2015. “History of Air Conditioning.” July 20. U.S. Department of Energy. https://
www.energy.gov/articles/history-air-conditioning
Levine, M D, J G Koomey, J E McMahon, A H Sanstad, and E Hirst. 1995. “Energy Efficiency
Policy and Market Failures.” Annual Review of Energy and the Environment 20 (1): 535–
555. https://doi.org/10.1146/annurev.eg.20.110195.002535.
Leybourn, Steve and Melissa Fiffer. 2018. “Emerging Technologies in Residential
Refrigeration.” In Proceedings of the 2018 ACEEEE Summer Study on Energy Efficiency
in Buildings. American Council for an Energy Efficient Economy. Washington, DC.
Lin, Judy. “How Much Could PG&E’s Rates Rise? What You Need to Know.” 2019. CalMatters.
August 23. https://calmatters.org/economy/2019/08/pges-rate-increases-what-you-
need-to-know/.
Livneh, B., Bohn, T.J., Pierce, D.W., Munoz-Arriola, F., Nijssen, B., Vose, R., Cayan, D.R.,
Brekke, L. 2015. “A Spatially Comprehensive, Hydrometeorological Data Set for Mexico,
the U.S., and Southern Canada 1950–2013.” Scientific Data, 2, 150042. Retrieved from
https://doi.org/10.1038/sdata.2015.42
Loorbach, Derk, Niki Frantzeskaki, and Flor Avelino. 2017. “Sustainability Transitions Research:
Transforming Science and Practice for Societal Change.” Annual Review of Environment
109
and Resources 42(1): 599–626. https://doi.org/10.1146/annurev-environ-102014-
021340.
Lovins, Amory B. 1990. “The Negawatt Revolution.” Across the Board 27(9):18-23
Lutzenhiser, Loren, Huafen Hu, Mithra Moezzi, Mithra, Anthony Levenda, and James Woods.
2012. “Lifestyles, Buildings and Technologies: What Matters Most?” In Proceedings of
the 2012 ACEEE Summer Study on Energy Efficiency in Buildings. American Council for
an Energy Efficiency Economy. Washington, DC.
Lutzenhiser, Loren, Mithra Moezzi, Aaron Ingle, and James Woods. 2017. Final Report for the
Advanced Residential Energy and Behavior Analysis (AREBA) Project. California Energy
Commission. https://ww2.energy.ca.gov/2017publications/CEC-500-2017-029/CEC-500-
2017-029.pdf
Lutzenhiser, Loren. 1993. “Social and Behavioral Aspects of Energy Use.” Annual Review of
Energy and the Environment 18:247–289.
Lutzenhiser, Loren. 2014. “Through the Energy Efficiency Looking Glass.” Energy Research &
Social Science 1 (March):141–151. https://doi.org/10.1016/j.erss.2014.03.011.
Macey, Susan M. 1989. “Hypothermia and Energy Conservation: A Tradeoff for Elderly
Persons?” The International Journal of Aging and Human Development 29(2):151–161.
https://doi.org/10.2190/5QQU-U15H-PB8U-M8VP.
Madsen, Line Valdorff. 2018. “The Comfortable Home and Energy Consumption.” Housing,
Theory and Society 35 (3):329–352. https://doi.org/10.1080/14036096.2017.1348390.
Mahone, Amber, Charles Li, Zack Subin, Michael Sontag, Gabe Mantegna, Alexis Karolides,
Alea German, Peter Morris. 2019. Residential Building Electrification in California:
Consumer Economics, Greenhouse Gases, and Grid Impacts. https://www.ethree.com/
wp-content/uploads/2019/04/E3_Residential_Building_Electrification_in_California_
April_2019.pdf
Mahone, Amber, Zachary Subin, Jenya Kahn-Lang, Douglas Allen, Vivian Li, Gerrit De Moor,
Nancy Ryan, and Snuller Price. 2018. Deep Decarbonization in a High Renewables
Future: Updated Results from the California PATHWAYS Model. California Energy
Commission. CEC-500-2018-012. https://ww2.energy.ca.gov/2018publications/CEC-500-
2018-012/CEC-500-2018-012.pdf
Malinick, Todd, Nate Wilairat, Jennifer Homes, Lisa Perry, and William Ware. 2012. “Destined
to Disappoint: Programmable Thermostat Savings are Only as Good as the Assumptions
About Their Operating Characteristics.” In the Proceedings of the 2012 ACEEE Summer
Study on Energy Efficiency in Buildings. American Council for an Energy Efficient
Economy. Washington, DC.
Mallaburn, Peter S., and Nick Eyre. 2014. “Lessons from Energy Efficiency Policy and
Programmes in the UK from 1973 to 2013.” Energy Efficiency; Dordrecht 7(1):23–41.
http://dx.doi.org.proxy.lib.pdx.edu/10.1007/s12053-013-9197-7.
110
Maller, Cecily J., and Yolande Strengers. 2011. “Housing, Heat Stress and Health in a Changing
Climate: Promoting the Adaptive Capacity of Vulnerable Households, a Suggested Way
Forward.” Health Promotion International 26(4):492–498. https://doi.org/10.1093/
heapro/dar003.
Malone, E.L., M. Betsill, S. Hughes, R. Kemp, L. Lutzenhiser, M. Moezzi, B.L. Preston, and T.O.
West, 2018: “Chapter 6: Social Science Perspectives on Carbon.” In Second State of the
Carbon Cycle Report (SOCCR2): A Sustained Assessment Report [Cavallaro, N., G.
Shrestha, R. Birdsey, M.A. Mayes, R.G. Najjar, S.C. Reed, P. Romero-Lankao, and
Z. Zhu (eds.)]. U.S. Global Change Research Program, Washington, DC, USA, pp. 264-
302, https://doi.org/10.7930/SOCCR2.2018.Ch6.
Manning, Adrian D., David B. Lindenmayer, and Joern Fischer. 2006. “Stretch Goals and
Backcasting: Approaches for Overcoming Barriers to Large-Scale Ecological
Restoration.” Restoration Ecology 14(4):487–492. https://doi.org/10.1111/j.1526-100X.
2006.00159.x.
Marchant, Gary E. 2009. “Sustainable Energy Technologies: Ten Lessons from the History of
Technology Regulation.” Widener Law Journal 18(3):831–58.
Martinot, Eric. 2016. “Grid Integration of Renewable Energy: Flexibility, Innovation, and
Experience.” Annual Review of Environment and Resources 41(1):223–251. https://doi.
org/10.1146/annurev-environ-110615-085725.
Matulka, Rebecca and Daniel Wood. 2013. “History of the Light Bulb.” U.S. Department of
Energy. https://www.energy.gov/articles/history-light-bulb
McAllister, Andrew. 2019. Webinar. http://www.missiondata.io/news/2019/4/4/webinar-
recording-available-energy-data-repositories;
McGarity, Thomas O. 2004. “MTBE: A Precautionary Tale.” Harvard Environmental Law Review
29:281-306.
Meadows, Donella H. 1997. “Places to Intervene in a System.” Whole Earth Winter (reprint).
Meadows, Donella H. 2008. Thinking in Systems: A Primer. Chelsea Green Publishing.
Mercure, J.F., Pollitt, H., Bassi, A.M., Viñuales, J.E., & Edwards, N.R. (2016). Modelling
complex systems of heterogeneous agents to better design sustainability transitions
policy. Global Environmental Change 37:102–115. https://doi.org/10.1016/j.gloenvcha.
2016.02.003
Merriam-Webster. 2019. Definitions of “Scenario.” Merriam Webster Dictionary. https://www.
merriam-webster.com/dictionary/scenario
Merton, Robert K. 1936. “The Unanticipated Consequences of Purposive Social Action.”
American Sociological Review 1(6): 894–904. https://doi.org/10.2307/2084615.
111
Miller, Clark A., Alastair Iles, and Christopher F. Jones. 2013. “The Social Dimensions of Energy
Transitions.” Science as Culture 22(2):35–48. https://doi.org/10.1080/09505431.2013.
786989.
Miller, Clark A., Jason O’Leary, Elisabeth Graffy, Ellen B. Stechel, and Gary Dirks. 2015.
“Narrative Futures and the Governance of Energy Transitions.” Futures 70 (June):65–
74. https://doi.org/10.1016/j.futures.2014.12.001.
Miller, Norman L., Katharine Hayhoe, Jiming Jin, and Maximilian Auffhammer. 2008. “Climate,
Extreme Heat, and Electricity Demand in California.” Journal of Applied Meteorology and
Climatology 47(6):1834–1844. https://doi.org/10.1175/2007JAMC1480.1.
Moezzi, Mithra and Richard C. Diamond. 2005. Is Efficiency Enough? Towards a New
Framework for Carbon Savings in the California Residential Sector. October. California
Energy Commission. CEC-500-2005-162.
Moezzi, Mithra, Loren Lutzenhiser, Aaron Ingle, and Harold Wilhite. 2018. Sixteen Ways
Energy Efficiency Researchers See People + Why it Matters for Climate Change.
California’s Fourth Climate Change Assessment. EXT- CCC4A-2018-008.
Moezzi, Mithra, Aaron Ingle, Sarah Outcault, Angela Sanguinetti, Loren Lutzenhiser, Hal
Wilhite, James D. Lutz, Alan Meier and Jennifer Kutzleb. 2019. Solar Water Heating
Assessment Project: Understanding and Improving Effectiveness for California
Households. CEC-500-2019-061. Prepared for the California Energy Commission.
Contract PIR 15-002. Sacramento, Calif.
Moezzi, Mithra. 2015. “Numbers, Stories, Energy Efficiency,” In Proceedings of the 2015 ECEEE
Summer Study on Energy Efficiency. Presqu’île de Giens, France.
Moezzi, Mithra. 1998. ‘The Predicament of Efficiency.” In Proceedings of the 1998 ACEEE
Summer Study on Energy Efficiency in Buildings. American Council for an Energy
Efficient Economy. Washington, DC.
Moore, Steven A., Sam Gelfand, and Dason Whitsett. 2015. “Epistemological Conflict: Modern
and Non-Modern Frameworks for Sustainability.” Building Research & Information 43
(6): 659–674. https://doi.org/10.1080/09613218.2015.1016379.
Moran, Dulane, Jane S. Peters, Shahana Samiullah, Corina Jump, and James J. Hirsch. 2008.
“CFL Program Strategy Review: No Programmatic ‘Silver Bullet.’” In Proceedings of the
2008 ACEEE Summer Study on Energy Efficiency in Buildings. American Council for an
Energy Efficient Economy. Washington, DC.
Morley, Janine and Mike Hazas. 2011. “The Significance of Difference: Understanding Variation
in Household Energy Consumption.” In Proceedings of the 2011 ECEEE Summer Study
on Energy Efficiency. European Council for an Energy Efficient Economy.
Morris, Margaret. n.d. The History of the Clothes Dryer.” Hunker. https://www.hunker.com/
13410374/the-history-of-the-clothes-dryer
112
Morrison, Bonnie Maas. 1992. “Ninety Years of U.S. Household Energy History: A Quantitative
Update.” In the Proceedings of the 1992 ACEEE Summer Study on Energy Efficiency in
Buildings. American Council for an Energy Efficient Economy. Washington, DC.
Moss, R.H., S. Avery, K. Baja, M. Burkett, A.M. Chischilly, J. Dell, P.A. Fleming, K. Geil, K.
Jacobs, A. Jones, K. Knowlton, J. Koh, M.C. Lemos, J. Melillo, R. Pandya, T.C.
Richmond, L. Scarlett, J. Snyder, M. Stults, A.M. Waple, J. Whitehead, D. Zarrilli, B.M.
Ayyub, et al. 2019. “Evaluating Knowledge to Support Climate Action: A Framework for
Sustained Assessment. Report of an Independent Advisory Committee on Applied
Climate Assessment.” Weather, Climate, and Society 11 (3): 465–487. https://doi.org/
10.1175/WCAS-D-18-0134.1.
Moss, R.H., S. Avery, K. Baja, M. Burkett, A.M. Chischilly, J. Dell, P.A. Fleming, K. Geil, K.
Jacobs, A. Jones, K. Knowlton, J. Koh, M.C. Lemos, J. Melillo, R. Pandya, T.C.
Richmond, L. Scarlett, J. Snyder, M. Stults, A. Waple, J. Whitehead, D. Zarrilli, J. Fox,
et al. 2019. “A Framework for Sustained Climate Assessment in the United States.”
Bulletin of the American Meteorological Society 100 (5): 897–907. https://doi.org/10.
1175/BAMS-D-19-0130.1.
Moss, Richard H., Jae A. Edmonds, Kathy A. Hibbard, Martin R. Manning, Steven K. Rose,
Detlef P. van Vuuren, Timothy R. Carter, et al. 2010. “The Next Generation of Scenarios
for Climate Change Research and Assessment.” Nature 463(7282):747–756.
Nadel, Steven, Neal Elliott, and Therese Langer. 2015. Energy Efficiency in the United States:
35 Years and Counting. June. Report E1502. American Council for an Energy Efficient
Economy. Washington, DC.
Navigant. 2017. Energy Efficiency Potential and Goals Study for 2018 and Beyond. Final Public
Report. Prepared for the California Public Utilities Commission.
Navigant 2019. 2019 Energy Efficiency Potential and Goals Study. Final Public Report.
Prepared for the California Public Utilities Commission.
NEMA (National Electric Manufacturers Association). 2018. “LED A-Line and Halogen Lamp
Shipments Increase in Third Quarter 2018 - NEMA.” Accessed September 22, 2019.
https://www.nema.org/Intelligence/Indices/Pages/LED-A-line-and-Halogen-Lamp-
Shipments-Increase-in-Third-Quarter-2018.aspx.
Nevius, Monica J, and Scott Pigg. 2000. “Programmable Thermostats That Go Berserk? Taking
a Social Perspective on Space Heating in Wisconsin.” In Proceedings of the ACEEE
Summer Study on Energy Efficiency in Buildings. American Council for an Energy
Efficient Economy. Washington, DC.
Nilsson, Anders, David Lazarevic, Nils Brandt, and Olga Kordas. 2018. “Household
Responsiveness to Residential Demand Response Strategies: Results and Policy
Implications from a Swedish Field Study.” Energy Policy 122(C):273–286.

113
Noura, Mahda, Mohammed Atiquzzaman, and Martin Gaedke. 2019. “Interoperability in
Internet of Things: Taxonomies and Open Challenges.” Mobile Networks and
Applications 24(3):796–809. https://doi.org/10.1007/s11036-018-1089-9.
Nye, David E. 1999. Consuming Power: A Social History of American Energies. MIT Press.
O’Neill, Brian C., Elmar Kriegler, Keywan Riahi, Kristie L. Ebi, Stephane Hallegatte, Timothy R.
Carter, Ritu Mathur, Detlef P. van Vuuren. 2014. “A New Scenario Framework for
Climate Change Research: The Concept of Shared Socioeconomic Pathways.” Climatic
Change 122:387–400. DOI 10.1007/s10584-013-0905-2
Pannett, Rachel and Rhiannon Hoyle. 2019. “Marie Kondo Isn’t Sparking Joy for Thrift Stores.”
Wall Street Journal, March 6, 2019, sec. Page One. https://www.wsj.com/articles/
marie-kondo-persuaded-you-to-jettison-your-junk-thrift-stores-sayenough-
11551889124.
Park, J.S., and H.J. Kim. 2012. “A Field Study of Occupant Behavior and Energy Consumption
in Apartments with Mechanical Ventilation.” Energy and Buildings 50 (July):19–25.
https://doi.org/10.1016/j.enbuild.2012.03.015.
Pasut, Wilmer, Hui Zhang, Ed Arens, and Yongchao Zhai. 2015. “Energy-Efficient Comfort with
a Heated/Cooled Chair: Results from Human Subject Tests.” Building and Environment
84 (January):10–21. https://doi.org/10.1016/j.buildenv.2014.10.026.
Patki, Neha, Roy Wedge and Kalyan Veeramachaneni. 2016. “The Synthetic Data Vault.’ IEEE
International Conference on Data Science and Advance Analytics. Montreal, CA. 2016.
https://dai.lids.mit.edu/wp-content/uploads/2018/03/SDV.pdf
Peffer, Therese, Daniel Perry, Marco Pritoni, Cecilia Aragon, and Alan Meier. 2013. “Facilitating
Energy Savings with Programmable Thermostats: Evaluation and Guidelines for the
Thermostat User Interface.” Ergonomics 56(3):463–479. https://doi.org/10.1080/
00140139.2012.718370.
Peffer, Therese, Marco Pritoni, Alan Meier, Cecilia Aragon, and Daniel Perry. 2011. “How
People Use Thermostats in Homes: A Review.” Building and Environment 46(12):2529–
2541. https://doi.org/10.1016/j.buildenv.2011.06.002.
Penn, Ivan. 2019. “Blamed for Wildfires, PG&E Seeks Higher Electricity Rates.” The New York
Times. 23 April. https://www.nytimes.com/2019/04/23/business/blamed-for-wildfires-
pge-seeks-higher-electricity-rates.html.
Pezzey, John C.V. 2019. “Why the Social Cost of Carbon Will Always Be Disputed.” Wiley
Interdisciplinary Reviews: Climate Change 10 (1): e558. https://doi.org/10.1002/wcc.
558.
Pierce, D.W., Cayan, D.R., and Thrasher, B.L. 2014. “Statistical Downscaling Using Localized
Constructed Analogs (LOCA).” Journal of Hydrometeorology 15:2558–2585. https://doi.
org/10.1175/JHM-D-14-0082.1

114
Pierce, David, Julie Kalansky, and Daniel Cayan. 2018. Climate, Drought, and Sea Level Rise
Scenarios for California’s Fourth Climate Change Assessment, California Energy
Commission Report CCCA4-CEC-2018-006. https://www.energy.ca.gov/sites/default/
files/2019-07/Projections_CCCA4-CEC-2018-006.pdf
Pindyck, Robert S. 2017. “The Use and Misuse of Models for Climate Policy.” Review of
Environmental Economics and Policy 11(1):100–114. https://doi.org/10.1093/reep/
rew012.
Pinkus, Karen. 2016. Fuel: A Speculative Dictionary. U of Minnesota Press.
Pinsker, Joe. 2019. “Why are American Homes so Big?” The Atlantic. Sept. 12.
Pretty, J.N., A.S. Ball, T. Lang, and J.I.L. Morison. 2005. “Farm Costs and Food Miles: An
Assessment of the Full Cost of the UK Weekly Food Basket.” Food Policy 30(1):1–19.
https://doi.org/10.1016/j.foodpol.2005.02.001.
Prins, Gwyn. 1992. “On Condis and Coolth.” Energy and Buildings 18(3–4):251–58.
Raghavan, Shuba V., Max Wei, Dan Johnson, Florin-James Langer, and Daniel M. Kammen.
forthcoming. “Decarbonizing Residential Space Heating and Cooling in a Changing
Climate.” (unpublished draft obtained from authors).
Rao, K. Usha, and V.V.N. Kishore. 2010. “A Review of Technology Diffusion Models with
Special Reference to Renewable Energy Technologies.” Renewable and Sustainable
Energy Reviews 14(3):1070–1078. https://doi.org/10.1016/j.rser.2009.11.007.
Raven, Paul Graham. 2017. “Telling Tomorrows: Science Fiction as an Energy Futures
Research Tool.” Energy Research & Social Science 31(September):164–169. https://doi.
org/10.1016/j.erss.2017.05.034.
Rees, Jonathan. 2013. Refrigeration Nation: A History of Ice, Appliances, and Enterprise in
America. JHU Press.
Reinhart, Christoph F., and Carlos Cerezo Davila. 2016. “Urban Building Energy Modeling—A
Review of a Nascent Field.” Building and Environment 97(February):196–202. https://
doi.org/10.1016/j.buildenv.2015.12.001.
RESNET. 2015. “Big Love for Big Energy Efficient Homes.” November 23. RESNET HERS Index.
https://www.hersindex.com/articles/big-love-big-energy-efficient-homes/
Reyna, J.L., & Chester, M.V. 2017. “Energy Efficiency to Reduce Residential Electricity and
Natural Gas Use Under Climate Change.” Nature Communications 8:1–12. https://doi.
org/10.1038/ncomms14916
Rinkinen, Jenny, Elizabeth Shove, and Jacopo Torriti. 2019. Energy Fables: Challenging Ideas
in the Energy Sector. Routledge.

115
Risser, Roland 2011. “The Proof is in the Pudding.” Department of Energy. https://www.
energy.gov/articles/proof-pudding-how-refrigerator-standards-have-saved-consumers-
billions
Roberts, Simon. 2008. “Demographics, Energy and Our Homes.” Energy Policy 36(12):4630–
4632. https://doi.org/10.1016/j.enpol.2008.09.064.
Robins, Kevin, and Mark Hepworth. 1988. “Electronic Spaces: New Technologies and the
Future of Cities.” Futures 20 (2):155–76. https://doi.org/10.1016/0016-3287(88)90022-
5.
Roland-Holst, David, Samuel Evans, Samuel Heft-Neal, Drew Behnke, and Myung Lucy Shim.
2018. Exploring Economic Impacts in Long-Term California Energy Scenarios. California
Energy Commission. Publication Number: CEC-500-2018-013
Rosenfeld, Arthur H. 1999. “The Art of Energy Efficiency: Protecting the Environment with
Better Technology.” Annual Review of Energy and the Environment 24(1):33–82.
https://doi.org/10.1146/annurev.energy.24.1.33.
Rosenfeld, Arthur H., and Deborah Poskanzer. 2009. “A Graph Is Worth a Thousand Gigawatt-
Hours: How California Came to Lead the United States in Energy Efficiency (Innovations
Case Narrative: The California Effect).” Innovations: Technology, Governance,
Globalization 4(4):57–79. https://doi.org/10.1162/itgg.2009.4.4.57.
Royston, Sarah, Jan Selby, and Elizabeth Shove. 2018. “Invisible Energy Policies: A New
Agenda for Energy Demand Reduction.” Energy Policy 123(December):127–35. https://
doi.org/10.1016/j.enpol.2018.08.052.
Rufo, Michael, Alan North. 2007. Assessment of Long-Term Electric Energy Efficiency Potential
in California’s Residential Sector. Report by Itron, Inc. to the California Energy
Commission. CEC-500-2007-002.
Ryghaug, Marianne, Tomas Moe Skjølsvold, and Sara Heidenreich. 2018. “Creating Energy
Citizenship through Material Participation.” Social Studies of Science 48(2):283–303.
https://doi.org/10.1177/0306312718770286.
Sailor, D.J., and A.A. Pavlova. 2003. “Air Conditioning Market Saturation and Long-Term
Response of Residential Cooling Energy Demand to Climate Change.” Energy
28(9):941–951. https://doi.org/10.1016/S0360-5442(03)00033-1
Sahakian, Marlyne, and Harold Wilhite. 2014. “Making Practice Theory Practicable: Towards
More Sustainable Forms of Consumption.” Journal of Consumer Culture 14(1):25–44.
https://doi.org/10.1177/1469540513505607.
Samir KC and Wolfgang Lutz. 2017. “The Human Core of the Shared Socioeconomic Pathways:
Population Scenarios by Age, Sex and Level of Education for All Countries to 2100.”
Global Environmental Change 42:181-192. https://doi.org/10.1016/j.gloenvcha.2014.
06.004

116
Sanchez, Marla, Jonathan Koomey, Mithra Moezzi, Alan Meier, and Wolfgang Huber.1998.
Miscellaneous Electricity Use in the U.S. Residential Sector. Lawrence Berkeley National
Laboratory. Berkeley, Calif. https://escholarship-
org.proxy.lib.pdx.edu/content/qt9fg1165g/qt9fg1165g.pdf
Sandahl, Linda J., Marc R. Ledbetter, Heidi E. Steward, and Chris Calwell. 2006. Compact
Fluorescent Lighting in America: Lessons Learned on the Way to Market. PNNL-15730,
882979. https://doi.org/10.2172/882979.
Sanstad, Alan H. 2017. “Addressing Deep Uncertainty in Climate Change Impacts and
Adaptation Analysis for the Energy System.” August 29. Presentation to IEPR Joint
Agency Workshop on Climate Adaptation and Resilience for the Energy System,
California Energy Commission.
Sathaye, Jayant A., Larry L. Dale, Peter H. Larsen, Gary A. Fitts, Kevin Koy, Sarah M. Lewis,
and André Frossard Pereira de Lucena. 2013. “Estimating Impacts of Warming
Temperatures on California’s Electricity System.” Global Environmental Change 23
(2):499–511. https://doi.org/10.1016/j.gloenvcha.2012.12.005.
Scavo, Jordan Michael. 2015. “False Dawn of a Solar Age: A History of Solar Heating and
Power During the Energy Crisis, 1973-1986.” Ph.D Thesis. United States – California:
University of California, Davis. http://search.proquest.com/docview/1720766788/
abstract/EDBC25F50ABB4C4APQ/1.
Schmitz, Angelika, and Rainer Stamminger. 2014. “Usage Behaviour and Related Energy
Consumption of European Consumers for Washing and Drying.” Energy Efficiency;
Dordrecht 7 (6): 937–954. http://dx.doi.org.proxy.lib.pdx.edu/10.1007/s12053-014-
9268-4.
Schweizer, Vanessa J. and Brian C. O’Neill. 2014. “Systematic Construction of Global
Socioeconomic Pathways Using Internally Consistent Element Combinations.” Climatic
Change 122:431–445. DOI 10.1007/s10584-013-0908-z
Shackley, Simon, and Ken Green. 2007. “A Conceptual Framework for Exploring Transitions to
Decarbonised Energy Systems in the United Kingdom.” Energy 32(3):221–236. https://
doi.org/10.1016/j.energy.2006.04.010.
Shell. 2019. Shell Scenarios. https://www.shell.com/energy-and-innovation/the-energy-future/
scenarios.html
Shove, Elizabeth, and Dale Southerton. 2000. “Defrosting the Freezer: From Novelty to
Convenience: A Narrative of Normalization.” Journal of Material Culture 5(3):301–319.
https://doi.org/10.1177/135918350000500303.
Shove, Elizabeth, and Mithra Moezzi. 2004. “What do Standards Standardize?” In the
Proceedings of the ACEEE Summer Study on Energy Efficiency in Buildings. American
Council for an Energy Efficient Economy. Washington, DC.
117
Shove, Elizabeth, M Pantzar, and M Watson. 2012. The Dynamics of Social Practice: Everyday
Life and How It Changes. London: Sage.
Shove, Elizabeth, Matt Watson, and Nicola Spurling. 2015. “Conceptualizing Connections:
Energy Demand, Infrastructures and Social Practices.” European Journal of Social
Theory 18(3):274–287. https://doi.org/10.1177/1368431015579964.
Shove, Elizabeth. 1998. “Gaps, Barriers and Conceptual Chasms: Theories of Technology
Transfer and Energy in Buildings.” Energy Policy 26(15):1105–1112.
Shove, Elizabeth. 2003. Comfort, Cleanliness & Convenience. Oxford, New York: Berg.
Shove, Elizabeth. 2014a. “Putting Practice into Policy: Reconfiguring Questions of Consumption
and Climate Change.” Contemporary Social Science 9(4):415–429. https://doi.org/10.
1080/21582041.2012.692484.
Shove, Elizabeth. 2014b. “Demanding Ideas.” In Demanding Ideas: Where Theories of Practice
Might Go Next. Windermere, UK. http://www.demand.ac.uk/wp-content/uploads/2014/
07/wp-10-shove.pdf.
Shove, Elizabeth. 2017. “What Is Wrong with Energy Efficiency?” Building Research &
Information 46(7):1–11. https://doi.org/10.1080/09613218.2017.1361746.
Smil, Vaclav. 2016. “Examining Energy Transitions: A Dozen Insights Based on Performance.”
Energy Research & Social Science 22 (Supplement C):194–197. https://doi.org/10.
1016/j.erss.2016.08.017.
Smil, Vaclav. 2018. Energy and Civilization: A History. Reprint edition. Cambridge,
Massachusetts: MIT Press.
Smith, Jessica M, and Abraham SD Tidwell. 2016. “The Everyday Lives of Energy Transitions:
Contested Sociotechnical Imaginaries in the American West.” Social Studies of Science
46 (3):327–350. https://doi.org/10.1177/0306312716644534.
Smith, Lindsey P., Shu Wen Ng, and Barry M. Popkin. 2013. “Trends in U.S. Home Food
Preparation and Consumption: Analysis of National Nutrition Surveys and Time Use
Studies from 1965–1966 to 2007–2008.” Nutrition Journal 12(1):1–10. https://doi.org/
10.1186/1475-2891-12-45.
Sonderegger, Robert C. 1978. “Movers and Stayers: The Resident’s Contribution to Variation
across Houses in Energy Consumption for Space Heating.” Energy and Buildings
1(3):313–324. https://doi.org/10.1016/0378-7788(78)90011-7.
Sovacool, Benjamin K. 2016. “How Long Will It Take? Conceptualizing the Temporal Dynamics
of Energy Transitions.” Energy Research & Social Science 13:202–215. https://doi.org/
10.1016/j.erss.2015.12.020.
Sovacool, Benjamin K., and Frank W. Geels. 2016. “Further Reflections on the Temporality of
Energy Transitions: A Response to Critics.” Energy Research & Social Science 22
(December): 232–237. https://doi.org/10.1016/j.erss.2016.08.013.

118
Spector, Julian. 2016. “GE Is No Longer BFFLs With CFLs.” CityLab. Accessed May 24, 2019.
http://www.citylab.com/tech/2016/02/general-electric-cfl-led-light-bulb/459804/.
Stram, Bruce N. 2016. “Key Challenges to Expanding Renewable Energy.” Energy Policy 96
(September):728–734. https://doi.org/10.1016/j.enpol.2016.05.034.
Strengers, Yolande, and Larissa Nicholls. 2017. “Convenience and Energy Consumption in the
Smart Home of the Future: Industry Visions from Australia and Beyond.” Energy
Research & Social Science 32(October):86–93.
Strengers, Yolande, Larissa Nicholls, and Cecily Maller. 2016. “Curious Energy Consumers:
Humans and Nonhumans in Assemblages of Household Practice.” Journal of Consumer
Culture 16(3):761–780. https://doi.org/10.1177/1469540514536194.
Subbiah, R., Pal, A., Nordberg, E.K., Marathe, A., & Marathe, M.V. (2017). Energy Demand
Model for Residential Sector: A First Principles Approach. IEEE Transactions on
Sustainable Energy, 8(3):1215-1224.
Sun, Z., Lorscheid, I., Millington, J.D., Lauf, S., Magliocca, N.R., Groeneveld, J., … Buchmann,
C.M. 2016. “Simple or Complicated Agent-Based models? A Complicated Issue.”
Environmental Modelling and Software 86(3):56–67. https://doi.org/10.1016/j.envsoft.
2016.09.006
Sunstein, Cass R., and Lucia A. Reisch. 2014."Automatically Green: Behavioral Economics and
Environmental Protection." Harvard Environmental Law Review 38:127-158.
Sunikka-Blank, Minna, and Ray Galvin. 2012. “Introducing the Prebound Effect: The Gap
between Performance and Actual Energy Consumption.” Building Research &
Information 40(3):260–273. https://doi.org/10.1080/09613218.2012.690952.
Tarroja, B., Chiang, F., AghaKouchak, A., Samuelsen, S., Raghavan, S.V., Wei, M., Sun, Kaiyu,
Hong, T. 2018. “Translating Climate Change and Heating System Electrification Impacts
on Building Energy Use to Future Greenhouse Gas Emissions and Electric Grid Capacity
Requirements in California.” Applied Energy 225(April):522–534. https://doi.org/10.
1016/j.apenergy.2018.05.003
Tarroja, Brian, Scott Samuelson, Amir AghaKouchak, David Feldman, Kate Forrest, and Felicia
Chiang. 2019. Building a Climate Change-Resilient Electricity System for Meeting
California’s Energy and Environmental Goals. Report to the California Energy
Commission. CEC-500-2019-015
Templ, M., Meindl, B., Kowarik, A., and Dupriez, O. 2017. “Simulation of Synthetic Complex
Data: The R Package simPop.” Journal of Statistical Software 79(10). https://doi.org/10.
18637/jss.v079.i10
Throve, Swapna, Samarth Swarup, Achla Marathe, Youngyun Chungbaek, Eric K. Nordberg,
Madhav V. Marathe, 2018. "Simulating Residential Energy Demand in Urban and Rural
Areas.” Winter Simulation Conference (WSC), pp. 548-559.

119
Tyszczuk, Renata, and Joe Smith. 2018. “Culture and Climate Change Scenarios: The Role and
Potential of the Arts and Humanities in Responding to the ‘1.5 Degrees Target.’”
Current Opinion in Environmental Sustainability 31(April): 56–64. https://doi.org/10.
1016/j.cosust.2017.12.007.
Unruh, G.C. 2000. “Understanding Carbon Lock-In.” Energy Policy 28 (12): 817–30.
USDA. 2010. “USDA ERS - Fuel for Food: Energy Use in the U.S. Food System.” n.d. Accessed
May 28, 2019. https://www.ers.usda.gov/amber-waves/2010/september/fuel-for-food-
energy-use-in-the-us-food-system/.
US Department of Commerce. 2018. 2017 Characteristics of New Housing.
https://www.census.gov/construction/chars/pdf/c25ann2017.pdf
Van Vactor, Samuel A. 2018. “Historical Perspective on Energy Transitions.” SSRN Electronic
Journal. https://doi.org/10.2139/ssrn.3178176.
Van Vliet, Mathijs, and Kasper Kok. 2015. “Combining Backcasting and Exploratory Scenarios
to Develop Robust Water Strategies in Face of Uncertain Futures.” Mitigation and
Adaptation Strategies for Global Change 20(1):43-74.
Verderber, R.R., and F.M. Rubinstein. 1984. “Comparison of Technologies for New Energy-
Efficient Lamps.” IEEE Transactions on Industry Applications IA-20(5):1185–1188.
https://doi.org/10.1109/TIA.1984.4504581.
Vet, Eliza de. 2016. “Experiencing and Responding to Everyday Weather in Darwin, Australia:
The Important Role of Tolerance.” Weather, Climate, and Society 9 (2):141–154.
https://doi.org/10.1175/WCAS-D-15-0069.1.
Volkery, Axel, and Teresa Ribeiro. 2009. “Scenario Planning in Public Policy: Understanding
Use, Impacts and the Role of Institutional Context Factors.” Technological Forecasting
and Social Change 76 (9):1198–1207. https://doi.org/10.1016/j.techfore.2009.07.009.
Walker, Gordon, Elizabeth Shove, and Sam Brown. 2014. “How Does Air Conditioning Become
‘Needed’? A Case Study of Routes, Rationales and Dynamics.” Energy Research & Social
Science 4 (December):1–9. https://doi.org/10.1016/j.erss.2014.08.002.
Walker, Warren E., Marjolijn Haasnoot and Jan H. Kwakkel. 2013. “Adapt or Perish: A Review
of Planning Approaches for Adaptation under Deep Uncertainty.” Sustainability 5:955-
979. doi:10.3390/su5030955999
Watt, John R. 1986. “Combined Evaporative Cooling Systems.” In Evaporative Air Conditioning
Handbook, edited by John R. Watt, 163–173. Boston, MA: Springer US. https://doi.org/
10.1007/978-1-4613-2259-7_10.
Wayne, G.P. 2013. The Beginner’s Guide to Representative Concentration Pathways. Retrieved
from https://skepticalscience.com/docs/RCP_Guide.pdf
Weaver, Christopher P., Robert J. Lempert, Casey Brown, John A. Hall, David Revell, and
Daniel Sarewitz. 2013. “Improving the Contribution of Climate Model Information to

120
Decision Making: The Value and Demands of Robust Decision Frameworks.” Wiley
Interdisciplinary Reviews: Climate Change 4(1):39–60. https://doi.org/10.1002/wcc.
202.
Weber, Christopher L., and H. Scott Matthews. 2008. “Food-Miles and the Relative Climate
Impacts of Food Choices in the United States.” Environmental Science & Technology
42(10):3508–3513. https://doi.org/10.1021/es702969f.
Wei, M., J.H. Nelson, J.B. Greenblatt, A. Mileva, J. Johnston, M. Ting, C. Yang, C. Jones, J.E.
McMahon, D.M. Kammen, “Deep Carbon Reductions in California Require Electrification
and Integration Across Economic Sectors,” Environmental Research Letters.
8(1):014038. https://doi.org/10.1088/1748-9326/8/1/014038.
Wei, Max, Shuba Raghavan, Patricia Hidalgo-Gonzalez, Rodrigo Henriquez Auba, Dev Millstein,
Madison Hoffacker, Rebecca Hernandez, Eleonara Ruffini, Brian Tarroja, Amir Agha
Kouchak, Josiah Johnston, Daniel Kammen, Julia Szinai, Colin Shepard, Anand Gopal,
Kaiyu Sun, Tianzhen Hong, and Florin-Langer James. 2017. Building a Healthier and
More Robust Future: 2050 Low-Carbon Energy Scenarios for California. California
Energy Commission. Publication Number: CEC-500-2019-033.
Welch, Lena. 2018. “Negative Effects of Compact Fluorescent Light Bulbs (CFLs) on Light-
Sensitive People.” TurboFuture. 7 March. https://turbofuture.com/misc/Negative-Side-
Of-Compact-Flourescent-Bulbs-CFLs.
Wellock Thomas. 2016. “‘Too Cheap to Meter’: A History of the Phrase.” U.S. NRC Blog (blog).
3 June. https://public-blog.nrc-gateway.gov/2016/06/03/too-cheap-to-meter-a-history-
of-the-phrase/.
Wilbanks, Thomas J., and Kristie L. Ebi. 2014. “SSPs from an Impact and Adaptation
Perspective.” Climatic Change 122 (3):473–479. https://doi.org/10.1007/s10584-013-
0903-4.
Wilhite, Harold, Hidetoshi Nakagami, Takashi Masuda, Yukiko Yamaga, and Hiroshi Haneda.
1996. “A Cross-Cultural Analysis of Household Energy Use Behaviour in Japan and
Norway.” Energy Policy 24 (9): 795–803. https://doi.org/10.1016/0301-4215(96)00061-
4.
Wilhite, Harold. 2012. “A Socio-Cultural Analysis of Changing Household Electricity
Consumption in India.” In Tackling Long-Term Global Energy Problems: The
Contribution of Social Science, edited by Daniel Spreng, Thomas Flüeler, David L.
Goldblatt, and Jürg Minsch, pp. 97–113. Dordrecht: Springer Netherlands. https://doi.
org/10.1007/978-94-007-2333-7_6.
Wilhite, Harold. 2016. The Political Economy of Low Carbon Transformation: Breaking the
Habits of Capitalism. Routledge.
Wilkinson, Angela, and Roland Kupers. 2013. “Living in the Futures.” Harvard Business Review.
May 1. https://hbr.org/2013/05/living-in-the-futures.

121
Williams, B.K., R.C. Szaro, and C.D. Shapiro. 2009. “Adaptive Management”: The U.S.
Department of the Interior Technical Guide. Adaptive Management Working Group, U.S.
Department of the Interior, Washington, DC.
Williamson, T J. 2000. “A Critical Review of Home Energy Rating in Australia.” ANZAScA 2000:
Proceedings of the 34th Conference of the Australia and New Zealand Architectural
Science Association. December 1-3.
Wilson, Charlie, and Arnulf Grubler. 2011. “Lessons from the History of Technological Change
for Clean Energy Scenarios and Policies.” Natural Resources Forum 35 (3):165–184.
https://doi.org/10.1111/j.1477-8947.2011.01386.x.
Wilson, E., Christensen, C., Horowitz, S., Robertson, J., & Maguire, J. 2017. Energy Efficiency
Potential in the U.S. Single-Family Housing Stock. National Renewable Energy
Laboratory. NREL/TP-5500-68670.
Woerpel, Herb. 2018. “Mini splits continue to revolutionize the HVAC industry.” The NEWS
(ACHR). 17 December. https://www.achrnews.com/articles/140289-mini-splits-
continue-to-revolutionize-the-hvac-industry
Woersdorfer, Julia Sophie. 2017. The Evolution of Household Technology and Consumer
Behavior, 1800-2000. Routledge. https://doi.org/10.4324/9781315203799.
World Nuclear Association. 2019. “Nuclear Fusion Power.” Updated July 2019. https://www.
world-nuclear.org/information-library/current-and-future-generation/nuclear-fusion-
power.aspx
Wulfinghoff, Donald R. 2000. “The Modern History of Energy Conservation: An Overview for
Information Professionals.” Electronic Green Journal 1(13). https://escholarship.org/
content/qt22f883rr/qt22f883rr.pdf
Xu, Peng, Yu Joe Huang, Norman Miller, Nicole Schlegel, and Pengyuan Shen. 2012. “Impacts
of Climate Change on Building Heating and Cooling Energy Patterns in California.”
Energy 44 (1):792–804. https://doi.org/10.1016/j.energy.2012.05.013.
Yu, Weiwei, Pavla Vaneckova, Kerrie Mengersen, Xiaochuan Pan, and Shilu Tong. 2010. “Is the
Association between Temperature and Mortality Modified by Age, Gender and Socio-
Economic Status?” Science of The Total Environment 408(17):3513–18. https://doi.org/
10.1016/j.scitotenv.2010.04.058.
Zhang, Wenwen, Subhrajit Guhathakurta, and Elias B. Khalil. 2018. “The Impact of Private
Autonomous Vehicles on Vehicle Ownership and Unoccupied VMT Generation.”
Transportation Research Part C: Emerging Technologies 90(May):156–165. https://doi.
org/10.1016/j.trc.2018.03.005.
A-1
APPENDIX A: Policy and Environmental Context
This appendix gives an overview of state energy transition policies most relevant to
household energy use. It also provides a brief background on California energy long-term
trends, current use, prices, and policy and data systems referenced later in the report.
Major Energy System Policies Several major California policies outline energy transitions that directly affect residential
energy use. These include the following bills and bill updates:
• Clean Energy and Pollution Reduction Act (Senate Bill 350, Statutes of 2015) sets
targets for renewable generation and energy efficiency for 2030. This includes a
statewide, cumulative “doubling” of energy efficiency savings for electric and natural
gas end uses by 2030, with the details of definitions and targets determined by the
Energy Commission (CEC, 2017).
• California Global Warming Solutions Act of 2006 (Assembly Bill 32, Statutes of 2016)
requires GHG emissions reduction to 1990 emissions levels by 2020. This goal has
already been achieved, as per the Energy Commission (CEC, 2019).
• California Global Warming Solutions Act of 2006: Emissions Limit (Senate Bill 32,
Statutes of 2016) requires that the state ensure that statewide greenhouse gas
emissions are reduced to at least 40% below the 1990 level by 2030.
• California Renewables Portfolio Standard Program: Emissions of Greenhouse Gases
(Senate Bill 100, Statutes of 2018) increases California’s Renewable Portfolio Standard
target to 60% renewables by 2030. In addition, by 2045, renewables and zero-carbon
resources are to supply 100% of retail sales of electricity to California end-use
customers and 100% of electricity procured to serve all state agencies.
• Low-Emissions Buildings and Sources of Heat Energy (Senate Bill 1477, Statutes of
2018) requires gas corporations to advance the state’s market for low-emission water
and space heating technology for residential buildings. It also requires the Energy
Commission to identify and target low-emission space and water heating equipment in
early stages of technology development.
These have various companion bills. Other bills closely tied to home energy use relate to
infrastructure for Zero Emission Vehicles (see Energy Commission, 2019, p. 13). These bills set
ambitious targets. In the past, California has met and even exceeded some ambitious energy
goals. For example, GHG emissions from California’s electricity sector in 2016 were 37.6 lower
than 1990 levels, compared to the goal of achieving 1990 levels by 2020 (CEC, 2019, pp. 14-
A-2
15)77. On the other hand, ambitious goals may often not be met or may be met more in name
than in spirit.78
High-level targets are translated into existing and new technology goals and implementation
plans. For example, in 2008 — prior to the bills listed just above — the state’s 10-year
strategic energy plan set the “Big Bold” goal that all new homes would Zero Net Energy by
2020 (CPUC, 2008). California’s 2019 building code (Title 24 Part 6) moves closer to reaching
this goal by requiring that by 2020 new homes will have PV systems, and steps up the
efficiency of other home energy technologies (CEC, 2018a). The policy goal of Zero Net Energy buildings also has shifted to one of Zero Net Emissions buildings (CEC, 2019:17-18). The
Integrated Energy Policy Report (IEPR), issued every two years with an update in intervening
years, draws together assessment of emerging trends in energy supply, use, and conservation,
along with a forecast. Subsequent research studies take these policy goals as their motivation
or as basis for exploring whether and how the goals might be achieved, in turn informing
strategies and programs. The legislated goals put into motion a large array of interconnected
activities based on the expectations that these goals will be achieved and through what
means.
The Energy Commission also notes a “growing consensus that building electrification is the
most viable and predictable path to zero-emission buildings’ (CEC 2019, p. 28) and to
decarbonization overall with the implication that natural gas would be phased out for use in
buildings. For the residential sector, this attention has focused on space heating and water
heating which account for most of the sector’s direct natural gas use. These goals are being
translated to actionable policies and programs, such as pursuing strategies to get households
to replace natural gas heating with electric heat pumps for space heating, a plan that Chapter
5 addresses.
These goals and directions are bounded by conditions designed to serve other goals in the
state, such as program cost-effectiveness, equity, and resilience, as outlined in the Integrated
Energy Policy Report (CEC, 2019) and elsewhere. For example, 25% of EPIC technology
demonstration and deployment funding are earmarked to specifically serve disadvantaged
communities (SB 535).
But energy policies themselves are only part of the picture. There are, for example, many
“invisible” policies, not directly considered energy policies, that have major effects on energy
use (Royston et al., 2018; Cox et al., 2019). These include those on school transportation
policies (do the kids have to be driven to school?), safety and security measures (which risks
77 The new emphasis on electrification of transportation, space heating, water heating, and other end uses may
again challenge this achievement.
78 For example, one of the sub-goals of California’s 2008 “Big Bold Energy Strategies” was that energy
consumption in existing homes would be reduced 20% by 2015 and 40% by 2020. The most recent household
energy use microdata for California are from 2009, and data from the EIA do not indicate such a decline. Homes designed as Zero Net Energy have not necessarily achieved this status (e.g., Hammer et al., 2014). This is not intended as a criticism of the progress that has been made, but to acknowledge that achieving these goals is
difficult and remains a work in progress.

A-3
are guarded against and which are allowed?), and tax structures (what activities and
investments are favored and for whom)?
Implications for the Residential Sector These policies and goals each carry specific visions for the future shape of energy in the state.
They are usually expressed purely as technology goals, though sometimes in combination with
distributional plans (e.g., toward equity, as noted above) and usually with other criteria such
as defined by economic metrics. A study on long-term energy transitions in California noted
that meeting California’s climate goals would transform the state’s economy (Mahone et al.
2018; Energy Commission 2019, p. 29). What is less acknowledged is that these technology
changes can entail major changes in how people live, and that what people do with these
technologies, and others that may arise, determines what technologies accomplish.
For example, electricity use patterns in homes and elsewhere would need to be coordinated
with the reimagined highly renewables-centric grid (CEC, 2019, p. 22; Stram, 2015). This is
due to the seasonality (including climate- and weather-dependency) and intermittency of
many renewable sources compared to fossil fuels (Engeland et al., 2017; Stram, 2016).79
Improved storage and source-diversity can handle some of the intermittency (Denholm and
Margolis, 2016), but as the absolute level of non-renewables (fossil fuels and nuclear)
declines, the challenges become more serious (Engeland et al., 2017; Brick and Thernstrom,
2016). One of the expected responses to this challenge is demand response programs, which
in the residential sector would require shifting when and how households use energy whether
through direct load control or deliberate changes in household practices (CEC, 2019). These
demand response programs are not just an otherwise-neutral economic activity for households
but can also be pressures that affect daily life (e.g., Carlsson-Kanyama & Lindén, 2007).
Basic Energy History In 1885, fossil fuels, in the form of coal, surpassed renewable energy, in the form of wood, as
the main source of energy in the United States (EIA, 2011). This makes 135 years over which
fossil fuels have been the dominant source of energy in the United States, as shown in Figure
A-1), even as all three other forms of energy (hydroelectric, wood, and nuclear) included in
the figure are still used. This long view gives context for the challenge of a transition to
renewables dominance, now additionally complicated by a many-fold increase in consumption
compared to the level of two hundred years ago and by a heightened need for reliability. Fossil
fuels are energy dense, easy to store, and easy to dispatch, so they have provided a flexible
and mostly secure form of energy. They contribute to climate change, other harmful local and
regional pollution, environmental destruction through extraction and processing, and are not
inexhaustible. Renewables are more environmentally benign with respect to climate change
but are less flexible due to their characteristic intermittency and current energy storage
limitations. The infrastructure to continually collect renewable energy on a scale close to that
currently provided by fossil fuels is not yet in place. And recent studies have raised alarm
79 In discussing characteristics of a renewables-centered grid, “climate related energy” renewables such as wind,
solar, and small hydro can useful be distinguished from less-intermittent sources such as geothermal power, large
hydro with reservoir, and biomass (Engeland et al., 2017).

A-4
about the level of minerals needed to support renewables at the levels that governments
anticipate (e.g., Bazilian, 2018; Giurco et al., 2019).
Past transitions in dominant energy sources were much less the product of government goals
and implementation programs than of multifaceted efforts from a wide variety of players (Van
Vactor, 2018). Not all government plans worked—for example, despite the great promises for
nuclear fusion in the 1950s (Wellock, 2016), more than six decades later nuclear fission
provided 19% of U.S. electricity generation (EIA, 2019b), and power generation from nuclear
fusion is still in the experimental stages (World Nuclear Association, 2019).
Figure A-1: History of Energy Consumption in the United States, 1775-2009
Source: U.S. EIA, Annual Energy Review 2009
Trends in Residential Per Capita Energy Use Nationally, the residential sector accounts for 54% of building energy use (EIA, 2019a). Per
capita source (i.e., counting generation losses) residential energy consumption in California in
2016 was 35% lower than it was in 1974, the year that the California Energy Commission was
created. This is a dramatic decrease over 42 years. Figure A-2 shows per capita residential
energy consumption trends 1960 through 2016, for natural gas, source electricity, and total
sector energy use. Notice the steep increase in per capita energy use between 1960 and the
early 1970s; residential refrigerator electricity use shows a roughly parallel increase over these
years (Chapter 2). The level of residential per capita source energy consumption in 2016 is
slightly (7%) lower than the level in 1960. So most of the decrease in residential per capita
energy use between 1974 and 2016 could be seen as living down the increases in the 14 years
prior to 1974, whether due mostly to efficiency policy or to something else.80 And it can also
80 This increase is so dramatic that it warrants a detailed review of changes in methods and categories over these
years.
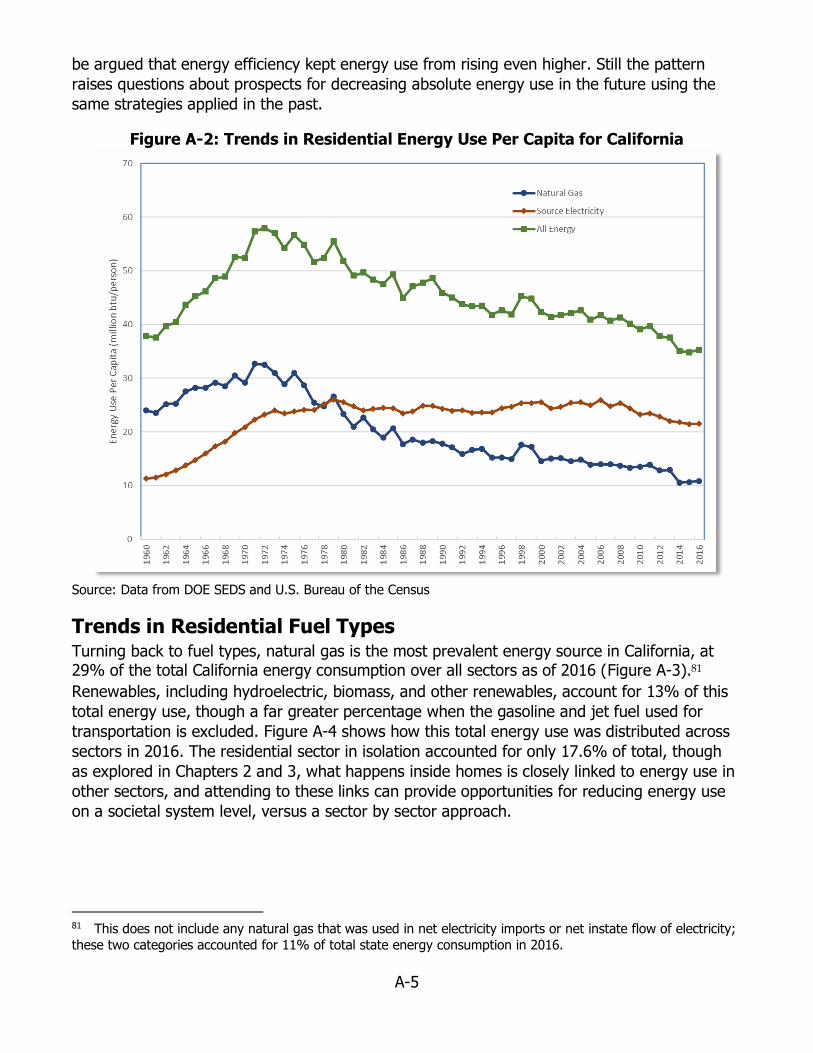
A-5
be argued that energy efficiency kept energy use from rising even higher. Still the pattern
raises questions about prospects for decreasing absolute energy use in the future using the
same strategies applied in the past.
Figure A-2: Trends in Residential Energy Use Per Capita for California
Source: Data from DOE SEDS and U.S. Bureau of the Census
Trends in Residential Fuel Types Turning back to fuel types, natural gas is the most prevalent energy source in California, at 29% of the total California energy consumption over all sectors as of 2016 (Figure A-3).81
Renewables, including hydroelectric, biomass, and other renewables, account for 13% of this
total energy use, though a far greater percentage when the gasoline and jet fuel used for
transportation is excluded. Figure A-4 shows how this total energy use was distributed across
sectors in 2016. The residential sector in isolation accounted for only 17.6% of total, though
as explored in Chapters 2 and 3, what happens inside homes is closely linked to energy use in
other sectors, and attending to these links can provide opportunities for reducing energy use
on a societal system level, versus a sector by sector approach.
81 This does not include any natural gas that was used in net electricity imports or net instate flow of electricity;
these two categories accounted for 11% of total state energy consumption in 2016.
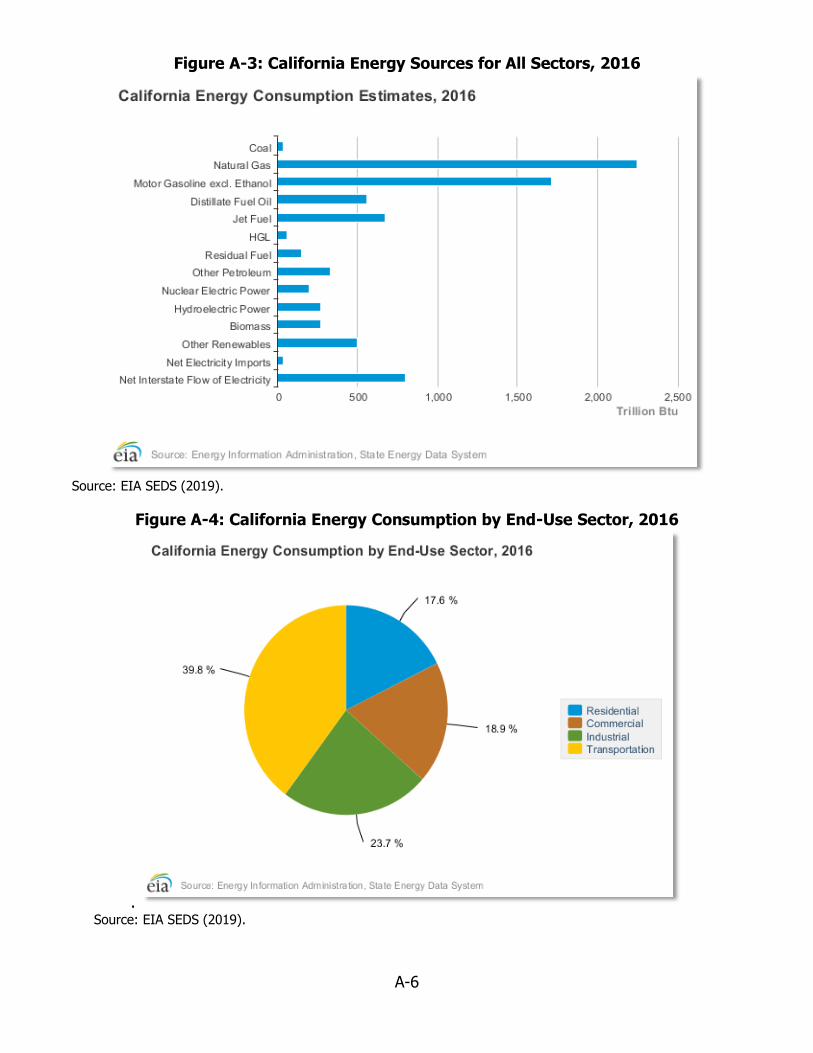
A-6
Figure A-3: California Energy Sources for All Sectors, 2016
Source: EIA SEDS (2019).
Figure A-4: California Energy Consumption by End-Use Sector, 2016
. Source: EIA SEDS (2019).

A-7
Since 1940, the U.S. Census has collected data on fuel type for household heating. This census
data is an indication of the prevalence of natural gas in California homes over decades, given
that household energy surveys did not start until the 1970s. In 2010, 66% of California homes
of all home types relied on natural gas as their main home heating fuel (Figure A-5). That is a
considerable drop from forty years prior (87% in 1970). Electricity as the main heating fuel in
California homes was nearly unknown in 1950 but increased gradually to 25% in 2010. These
historical patterns give a benchmark for imagining a pace of change toward an all-electric
household.
Figure A-5: Trends in Heating Fuel Use in California Households
Source: Lutzenhiser et al. 2017.
California Residential Electricity Prices Residential electricity tariffs in California have undergone major changes over the past decade,
including through the Residential Rate Reform enacted in 2013.82 Average electricity rates in
California across all sectors have increased 37% over the past decade (2018 vs. 2008) and
56% since 2001 (EIA, 2019a); see Figure A-6, and the structure of tariffs has changed as
well.83 These are steeper increases than in the United States overall, where the increase was
82 “Residential Rate Reform / R.12-06-013), https://www.cpuc.ca.gov/General.aspx?id=12154
83 These numbers are not inflation-adjusted. For 2013-2017 at least, system average rate increases have
generally been trending above inflation for PG&E and SDG&E (CPUC, 2018).
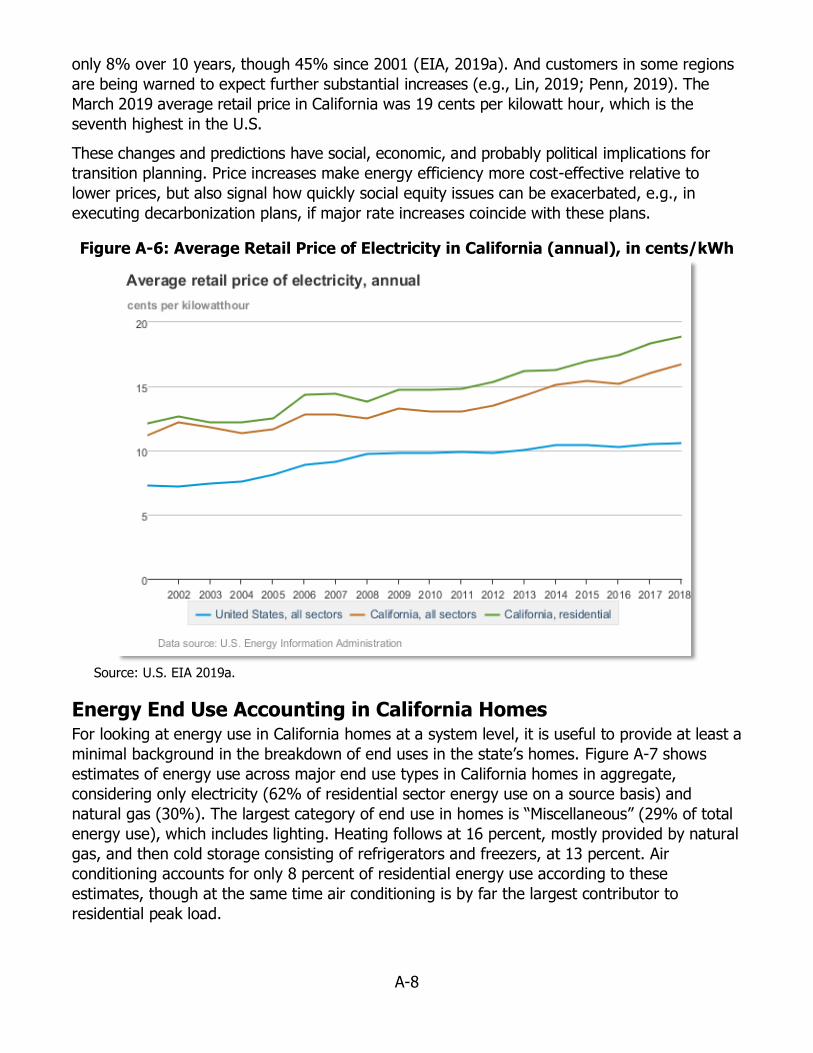
A-8
only 8% over 10 years, though 45% since 2001 (EIA, 2019a). And customers in some regions
are being warned to expect further substantial increases (e.g., Lin, 2019; Penn, 2019). The
March 2019 average retail price in California was 19 cents per kilowatt hour, which is the
seventh highest in the U.S.
These changes and predictions have social, economic, and probably political implications for
transition planning. Price increases make energy efficiency more cost-effective relative to
lower prices, but also signal how quickly social equity issues can be exacerbated, e.g., in
executing decarbonization plans, if major rate increases coincide with these plans.
Figure A-6: Average Retail Price of Electricity in California (annual), in cents/kWh
Source: U.S. EIA 2019a.
Energy End Use Accounting in California Homes For looking at energy use in California homes at a system level, it is useful to provide at least a
minimal background in the breakdown of end uses in the state’s homes. Figure A-7 shows
estimates of energy use across major end use types in California homes in aggregate,
considering only electricity (62% of residential sector energy use on a source basis) and
natural gas (30%). The largest category of end use in homes is “Miscellaneous” (29% of total
energy use), which includes lighting. Heating follows at 16 percent, mostly provided by natural
gas, and then cold storage consisting of refrigerators and freezers, at 13 percent. Air
conditioning accounts for only 8 percent of residential energy use according to these
estimates, though at the same time air conditioning is by far the largest contributor to
residential peak load.

A-9
Pools and spas amount to 6 percent of residential energy (CEC, 2015)—nearly as much as air
conditioning—even though in 2009 only 11 percent of California single-family homes had pools
and 10 percent had a spa or hot tub (KEMA RASS, 2009). These “low saturation, high impact”
end uses are a potentially interesting if vexing category: making these end uses more efficient
could make a big difference touching highly targeted populations, but there are no simple
ways of finding these households and encouraging them to change, and many of the unusual
end uses (e.g., pools, outdoor fountains) are found in higher-income households. Continuing
to move from averages to distributions across households, end use consumption levels vary
greatly from one home to another. This variation has to do with what people do in homes,
physical characteristics of the home and its devices, and the microenvironment, all of which
interact. For example, considering just house-level totals, the highest-consuming quartile of
California homes in terms of electricity use accounts for 46 percent of all residential sector
electricity use, while the lowest quartile uses 10 percent (Lutzenhiser et al., 2017). Within this
variation of house-level total energy use are similar variations in end use levels, such as the
energy used for cooling or heating. This also means that efficiency improvements of devices or
materials can have wildly different effects, and effectiveness, across households.
Energy Policies, Policy Tools, and Beyond
From Legacy Efficiency to Climate Change Policy System The coupling of analysis and policy making is a continuous work in progress. The transition
from a focus on energy efficiency to GHG emissions reductions has pressed legacy systems
and definitions to do more and more to support policy under a climate change framework,
expanding past original purposes and architectures (Lutzenhiser et al., 2017; Moezzi et al.,
2018). While these expansions may have worked quite well, the boundaries and scope of
potential analyses have grown. The nature of the past focus on energy efficiency may no
longer be adequate, given the goals of absolute emissions reductions and a decarbonized
renewables-centered energy supply. Thinking about, and modeling, efficiency as an absolute
quality of objects or devices can lead to blind spots in evaluating what efficiency does. In the
case of central air conditioning, for example, efficiency can be defined in terms of performance
at peak load, but this does not result in a system that is efficient at normal load (Moore et al.,
2015).
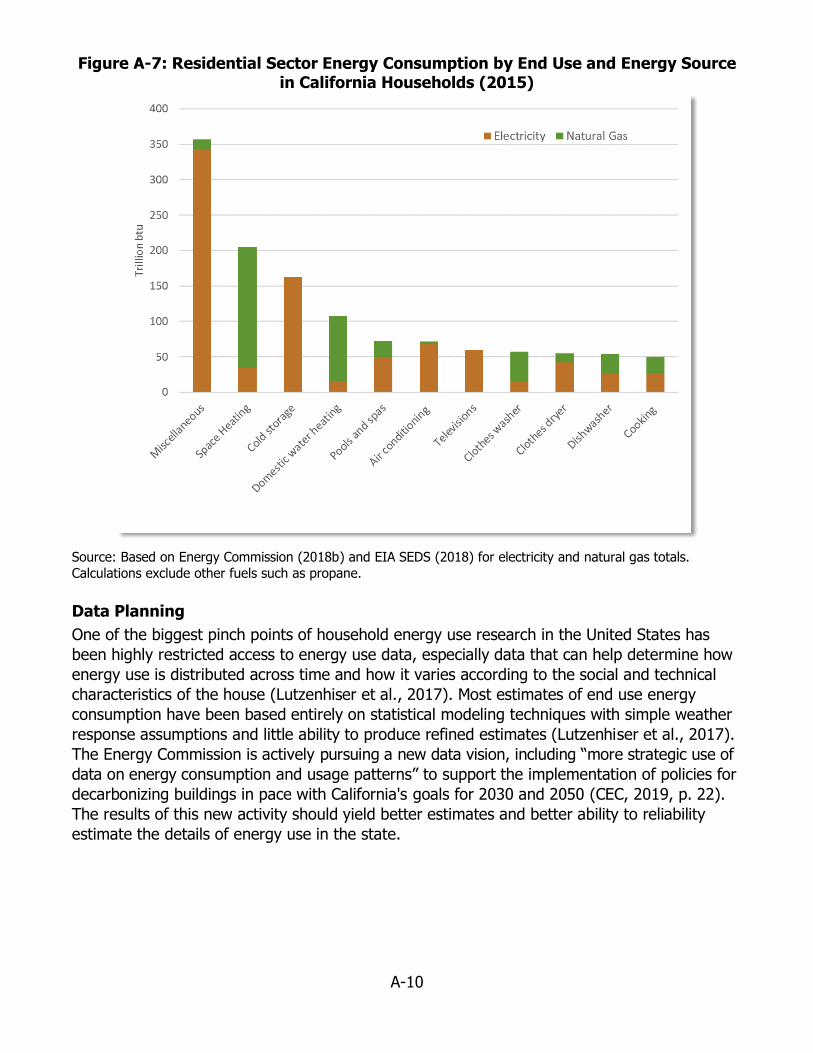
A-10
Figure A-7: Residential Sector Energy Consumption by End Use and Energy Source in California Households (2015)
Source: Based on Energy Commission (2018b) and EIA SEDS (2018) for electricity and natural gas totals.
Calculations exclude other fuels such as propane.
Data Planning
One of the biggest pinch points of household energy use research in the United States has
been highly restricted access to energy use data, especially data that can help determine how
energy use is distributed across time and how it varies according to the social and technical
characteristics of the house (Lutzenhiser et al., 2017). Most estimates of end use energy
consumption have been based entirely on statistical modeling techniques with simple weather
response assumptions and little ability to produce refined estimates (Lutzenhiser et al., 2017).
The Energy Commission is actively pursuing a new data vision, including “more strategic use of
data on energy consumption and usage patterns” to support the implementation of policies for
decarbonizing buildings in pace with California's goals for 2030 and 2050 (CEC, 2019, p. 22).
The results of this new activity should yield better estimates and better ability to reliability
estimate the details of energy use in the state.
Related Documents


