From Migmatites to Plutons: Power Law Relationships in the Evolution of Magmatic Bodies ALVAR SOESOO 1 and PAUL D. BONS 2 Abstract—Magma is generated by partial melting from mi- crometre-scale droplets at the source and may accumulate to form [ 100 km-scale plutons. Magma accumulation thus spans well over ten orders of magnitude in scale. Here we provide measure- ments of migmatitic leucosomes and granitic veins in drill cores from the Estonian Proterozoic basement and outcrops at Masku in SW Finland and Montemor-o-Novo, central Portugal. Despite the differences in size and number of measured leucosomes and magmatic veins, differences in host rock types and metamorphic grades, the cumulative width distribution of the studied magmatic leucosomes/veins follows a power law with exponents usually between 0.7 and 1.8. Published maps of the SE Australian Lachlan Fold Belt were used to investigate the distribution of granitoid pluton sizes. The granites occupy ca. 22 % of the 2.6 9 10 5 km 2 area. The cumulative pluton area distributions show good power law distributions with exponents between 0.6 and 0.8 depending on pluton area group. Using the self-affine nature of pluton shapes, it is possible to estimate the total volume of magma that was expelled from the source in the 2.6 9 10 5 km 2 map area, giving an esti- mated 0.8 km 3 of magma per km 2 . It has been suggested in the literature that magma batches in the source merge to form ever- bigger batches in a self-organized way. This leads to a power law for the cumulative distribution of magma volumes, with an expo- nent m V between 1 for inefficient melt extraction, and 2/3 for maximum accumulation efficiency as most of the volume resides in the largest batches that can escape from the source. If m V C 1, the mass of the magma is dominated by small batches; in case m = 2/ 3, about 50 % of all magma in the system is placed in a single largest batch. Our observations support the model that the crust develops a self-organized critical state during magma generation. In this state, magma batches accumulate in a non-continuous, step- wise manner to form ever-larger accumulations. There is no characteristic length or time scale in the partial melting process or its products. Smallest melt segregations and [ km-scale plotuns form the end members of a continuous chain of mergers of magma batches. Key words: Partial melting, migmatites, leucosome, pluton size distribution, power law, fractal, self-organized criticality. 1. Introduction The formation of felsic to intermediate magmatic intrusions is commonly viewed as a three-step pro- cess which involves (1) segregation and accumulation of melt in a partially molten source, (2) magma/melt 1 ascent, and (3) emplacement of magma (SAWYER 1994;BROWN 1994;CLEMENS 1997, 1998;PETFORD et al. 2000). Melt is generated in the crust or mantle by partial melting of rocks on the lm- to mm-scale and is followed by accumulation and ascent to form [ km-scale volumes in the form of plutons, batholiths, and volcanic formations. Thus, the whole range of magmatic process may involve more than 10 orders of magnitude in length scale and deals with a variety of physical–chemical processes on different scales and different levels within the crust and/or mantle. Time scales also vary over many orders of magnitude, from seconds to hours for the propagation of dykes (EMERMAN and MARRETT 1990;LISTER and KERR 1991;CLEMENS and MAWER 1992) to several millions of years for a thermal event that causes partial melting (BROWN et al. 1999;PETFORD et al. 2000). Partial melting experiments suggest that the initial melt resides at grain junctions in isolated microscopic melt pockets or forms a thin film of liquid along grain boundaries (JUREWICZ and WATSON 1984;WALTE et al. 2003, 2007;SAWYER 2014). The classical view is that melt segregation or drainage from the solid rock matrix starts when a large number of such grain-scale melt domains become connected to allow the melt to percolate through the rock (SAWYER 2001;BROWN and 1 Institute of Geology, Tallinn University of Technology, Ehitajate tee 5, Tallinn 19086, Estonia. E-mail: [email protected] 2 Department of Geosciences, Eberhard Karls University Tu ¨bingen, Wilhelmstr. 56, 72074 Tu ¨bingen, Germany. E-mail: [email protected] 1 ‘‘Melt’’ is pure molten (liquid) rock, while ‘‘magma’’ refers to liquid melt that may contain floating solid crystals or entrained pieces of solid rock. In this paper we use the term ‘‘magma’’ throughout. Pure Appl. Geophys. Ó 2014 Springer Basel DOI 10.1007/s00024-014-0995-4 Pure and Applied Geophysics

Welcome message from author
This document is posted to help you gain knowledge. Please leave a comment to let me know what you think about it! Share it to your friends and learn new things together.
Transcript

From Migmatites to Plutons: Power Law Relationships in the Evolution of Magmatic Bodies
ALVAR SOESOO1 and PAUL D. BONS
2
Abstract—Magma is generated by partial melting from mi-
crometre-scale droplets at the source and may accumulate to
form [100 km-scale plutons. Magma accumulation thus spans well
over ten orders of magnitude in scale. Here we provide measure-
ments of migmatitic leucosomes and granitic veins in drill cores
from the Estonian Proterozoic basement and outcrops at Masku in
SW Finland and Montemor-o-Novo, central Portugal. Despite the
differences in size and number of measured leucosomes and
magmatic veins, differences in host rock types and metamorphic
grades, the cumulative width distribution of the studied magmatic
leucosomes/veins follows a power law with exponents usually
between 0.7 and 1.8. Published maps of the SE Australian Lachlan
Fold Belt were used to investigate the distribution of granitoid
pluton sizes. The granites occupy ca. 22 % of the 2.6 9 105 km2
area. The cumulative pluton area distributions show good power
law distributions with exponents between 0.6 and 0.8 depending on
pluton area group. Using the self-affine nature of pluton shapes, it
is possible to estimate the total volume of magma that was expelled
from the source in the 2.6 9 105 km2 map area, giving an esti-
mated 0.8 km3 of magma per km2. It has been suggested in the
literature that magma batches in the source merge to form ever-
bigger batches in a self-organized way. This leads to a power law
for the cumulative distribution of magma volumes, with an expo-
nent mV between 1 for inefficient melt extraction, and 2/3 for
maximum accumulation efficiency as most of the volume resides in
the largest batches that can escape from the source. If mV C 1, the
mass of the magma is dominated by small batches; in case m = 2/
3, about 50 % of all magma in the system is placed in a single
largest batch. Our observations support the model that the crust
develops a self-organized critical state during magma generation.
In this state, magma batches accumulate in a non-continuous, step-
wise manner to form ever-larger accumulations. There is no
characteristic length or time scale in the partial melting process or
its products. Smallest melt segregations and [km-scale plotuns
form the end members of a continuous chain of mergers of magma
batches.
Key words: Partial melting, migmatites, leucosome, pluton
size distribution, power law, fractal, self-organized criticality.
1. Introduction
The formation of felsic to intermediate magmatic
intrusions is commonly viewed as a three-step pro-
cess which involves (1) segregation and accumulation
of melt in a partially molten source, (2) magma/melt1
ascent, and (3) emplacement of magma (SAWYER
1994; BROWN 1994; CLEMENS 1997, 1998; PETFORD
et al. 2000). Melt is generated in the crust or mantle
by partial melting of rocks on the lm- to mm-scale
and is followed by accumulation and ascent to
form [km-scale volumes in the form of plutons,
batholiths, and volcanic formations. Thus, the whole
range of magmatic process may involve more than 10
orders of magnitude in length scale and deals with a
variety of physical–chemical processes on different
scales and different levels within the crust and/or
mantle. Time scales also vary over many orders of
magnitude, from seconds to hours for the propagation
of dykes (EMERMAN and MARRETT 1990; LISTER and
KERR 1991; CLEMENS and MAWER 1992) to several
millions of years for a thermal event that causes
partial melting (BROWN et al. 1999; PETFORD et al.
2000).
Partial melting experiments suggest that the initial
melt resides at grain junctions in isolated microscopic
melt pockets or forms a thin film of liquid along grain
boundaries (JUREWICZ and WATSON 1984; WALTE et al.
2003, 2007; SAWYER 2014). The classical view is that
melt segregation or drainage from the solid rock
matrix starts when a large number of such grain-scale
melt domains become connected to allow the melt to
percolate through the rock (SAWYER 2001; BROWN and
1 Institute of Geology, Tallinn University of Technology,
Ehitajate tee 5, Tallinn 19086, Estonia. E-mail:
[email protected] Department of Geosciences, Eberhard Karls University
Tubingen, Wilhelmstr. 56, 72074 Tubingen, Germany. E-mail:
1 ‘‘Melt’’ is pure molten (liquid) rock, while ‘‘magma’’ refers
to liquid melt that may contain floating solid crystals or entrained
pieces of solid rock. In this paper we use the term ‘‘magma’’
throughout.
Pure Appl. Geophys.
� 2014 Springer Basel
DOI 10.1007/s00024-014-0995-4 Pure and Applied Geophysics
SOLAR 1999; WARK et al. 2003; JACKSON et al. 2003;
HASALOVA et al. 2008).
Migmatites are the link between initial melt
accumulation from microscopic melt films and
droplets, and bigger magma volumes. The term mi-
gmatite was introduced by the Finnish petrologist, J.
Sederholm, who derived this term from the Greek
word for mixture. Migmatites are composite rocks,
which display both metamorphic and magmatic
components. The magmatic component is usually
found as patches or veins, so called leucosomes, of
frozen magma. Several ideas have been proposed for
the formation of migmatites, such as partial melting
(e.g. WINKLER 1961), injection of foreign magmas
(SEDERHOLM 1907), metamorphic differentiation
(ASHWORTH and MCLELLAN 1985; LINDH and WAHL-
GREN 1985), and metasomatism (MISCH 1968; OLSEN
1984). In recent years, partial melting is considered to
be the only dominant migmatite forming process.
Thus, the migmatitic leucosomes represent the first
step of accumulation and segregation of magma from
its local source.
Two end-member models are currently consid-
ered for the segregation and accumulation of magma
from migmatites to its final emplacement in plutons:
(1) Melt flow is governed by the classical flow
through connected channels, such as pores, veins,
and dykes; and (2) step-wise merging of magma
batches.
The first model requires the existence of a con-
nected network of channels through which the
magma can flow; the melt connectivity threshold
must be overcome (VIGNERESSE et al. 1996). This
threshold fraction, which depends on the wetting
angle in porous aggregates, was originally estimated
to be a few tens of percent (VAN DER MOLEN and
PATERSON 1979), but is now generally regarded to be
only a few percent (RUSHMER 1995; LAPORTE and
WATSON 1995; VIGNERESSE et al. 1996).
At larger scales, the magma is mostly residing in
leucosomes and veins, which, when connected, are
envisaged to drain the magma from the source (e.g.
WEINBERG and SEARLE 1998; NICOLAS and JACKSON
1982; BROWN 1994; WEINBERG 1999; OLSON et al.
2004; HOBBS and ORD 2010). This idea is that of
‘‘rivulets that feed rivers’’ or a ‘‘rooted vein network’’
(BROWN and SOLAR 1998; PETFORD and KOENDERS
1998; WEINBERG 1999), where the smallest channels
feed into ever-bigger channels, finally into the largest
dykes that transect the crust and feed plutons
(CLEMENS and MAWER 1992).
BONS et al. (2004, 2010) argued that neither a
connected melt network, nor reaching any threshold
is required to accomplish magma segregation and
magma transport and extraction can take place at very
low magma fractions. One problem with the con-
nected channel network model is that flow only
occurs after a full (self-organized) network has
developed. Local connectivity, however, will in
reality already lead to a transfer of magma and
(partial) destruction of the network. It is thus ques-
tionable if large-scale connectivity is ever achieved.
According to the second model, flow is, therefore,
discontinuous and magma accumulates in steps in
increasingly larger veins or hydrofractures (MAALØE
1987; TAKADA 1990; BONS et al. 2001; BONS and VAN
MILLIGEN 2001; BONS et al. 2004). A ‘‘hydrofracture’’
is a brittle fracture that opens and propagates mainly
because of the internal pressure from the contained
liquid (magma or fluid) and not by applied tectonic
stresses (WEERTMAN 1971). The second model is
based on the observations that melt- or fluid-filled
hydrofractures become unstable when they exceed a
certain length (WEERTMAN 1971). The instability
arises from gradients in effective normal stress that
may act on a hydrofracture along its length. These
can result from the increase in lithostatic pressure
with depth, which differs from the increase in pres-
sure inside a steep hydrofracture if the density of the
melt is different from that of the host rock. This limits
the vertical length of a stable magma-filled hydro-
fracture to several tens to hundreds of metres (SECOR
and POLLARD 1975). Once instability is reached, hy-
drofractures may start to propagate at one end and
simultaneously close at the other end (BONS and VAN
MILLIGEN 2001). Batches of magma can thus move
together with their containing hydrofractures, which
is the crucial difference with the percolation flow
model, where magma moves through a stationary
network of fractures.
Experiments by BONS and VAN MILLIGEN (2001),
URTSON and SOESOO (2007) and numerical modelling
A. Soesoo, P. Bons Pure Appl. Geophys.
by BONS et al. (2004) indicated that the step-wise
merger of batches leads to power law distributions of
batch volumes:
N�V ¼ kVV�mV : ð1Þ
Here NCV is the number of batches larger than
volume (V), kV the number larger than unit volume
and mV the distribution coefficient. In this paper we
present measurements of size distributions of magma
batches, from thin leucosomes/veins to plutons, in the
geological record. Volumes of leucosomes, veins, or
plutons cannot usually be determined directly in the
geological record, where observation is normally
restricted to 2D outcrop or 1D scan lines or drill
cores. We will use the subscript A (area) for size
measurements in 2D and H (width or thickness) for
measurements in 1D. We will show that the observed
size distributions are indeed power law, which is
consistent with the second model of step-wise seg-
regation and accumulation of magma, from its source
in migmatites through to the final emplacement of
magma in [km-scale plutons.
2. Data
2.1. Self-Similarity and Scale-Invariance
in Migmatites
Both the spatial distribution and width distribution
of leucosomes, veins, and dykes were subjects of
several studies (e.g. TANNER 1999; BONS et al. 2004;
SOESOO et al. 2004a; BROWN 2007; URTSON and SOESOO
2009, BONS et al. 2010; BONAMICI and DUEBENDORFER
2010). The results are somewhat diverse—both power
law (fractal) (SOESOO et al. 2004a; BONS et al. 2004;
BONAMICI and DUEBENDORFER 2010) and non-fractal
(e.g. MARCHILDON and BROWN 2003) leucosome-width
statistics have been reported, as well as fractal
distributions of leucosome spacing (TANNER 1999;
SOESOO et al. 2004a; SOESOO and BONS 2013).
Here we provide measurements of migmatitic
leucosomes and granitic veins in drill cores and
outcrops. Their width and spacing distributions (SO-
ESOO et al. 2004a) were recorded in a number of drill
cores from the Estonian Proterozoic basement (SOES-
OO et al. 2004b), in outcrops at Masku, southwestern
Finland, and at Montemor-o-Novo, central Portugal
(URTSON and SOESOO 2009). Migmatites at these
localities represent rocks with a variety of chemical
compositions and metamorphic assemblages.
The Estonian drill cores F-265 and F-266 pene-
trate granulite facies rocks of the Johvi structural
zone, NE Estonia (SOESOO et al. 2004b, 2006), drill
core F-122 amphibolite facies metavolcanites and
metasediments of the Tallinn zone, northern Estonia,
and drill cores F-156 and F-268 amphibolite facies
metasediments of Alutaguse zone, eastern Estonia
(SOESOO et al. 2004b). The migmatites at Masku
(60832.520N; 22808.000E), southwestern Finland,
formed during Proterozoic granulite facies metamor-
phism (MENGEL et al. 2001). The migmatitic rocks at
the Montemor-o-Novo outcrop (38838.120N
8812.540E) in Portugal belong to the Evora massif
and are produced by high-grade metamorphism of the
Seria Negra Group metasediments, probably of
Variscan or Cadomian age (PEREIRA and SILVA 2002).
The thickness of leucosomes and their spacing
were measured along the axis of drill cores or along
line scans on outcrops using a measuring tape
(Table 1). Generally, the resolution of measurements
was limited to 2–3 mm. Leucosomes with thicknesses
below this value, close to the size of the individual
mineral grains, were not counted. When plotted on a
bi-logarithmic graph with measured thickness on the
x-axis and the number of leucosomes thicker than
that value on the y-axis, the data follow a power law
which is defined by a straight line with the distribu-
tion exponent being equal to its slope (Figs. 1, 2, 3).
Here we use nH for the observed exponent, to
emphasize that this exponent is affected by sectioning
effects of the 1D scan line through 3D space.
An alternative way to present data is the density
distribution, which represents the number of objects
belonging to an interval, divided by the interval
length. The density distribution is determined with
the box-counting method (similar to BONAMICI and
DUEBENDORFER 2010; TANNER 1999). In theory, the
exponent of the density distribution is increased by 1
compared to the exponent of cumulative distribution
ndensity = ncumulative ? 1 (e.g. BONNET et al. 2001).
The density distribution has the advantage of being
free of the unfavorable curvature (censoring) effect of
the cumulative distribution at the larger scale where
the number of objects approaches 1. Also, the
From Migmatites to Plutons
deviation of the data from the power law trend at the
small scale of the distribution due to insufficient
sampling of the smallest objects (truncation effect) is
exaggerated by the density distribution which helps to
define the range of the validity of the power law and
thus estimate the correct distribution exponents. The
size of the bins where objects are distributed
according to their size is critical as it determines
the smoothness of the data (BONNET et al. 2001). In
this study, logarithmic binning was used for plotting
the density distribution data.
In addition to leucosome width data, the amount
of melt during the late stage of melting can be
estimated by integration of leucosome thickness
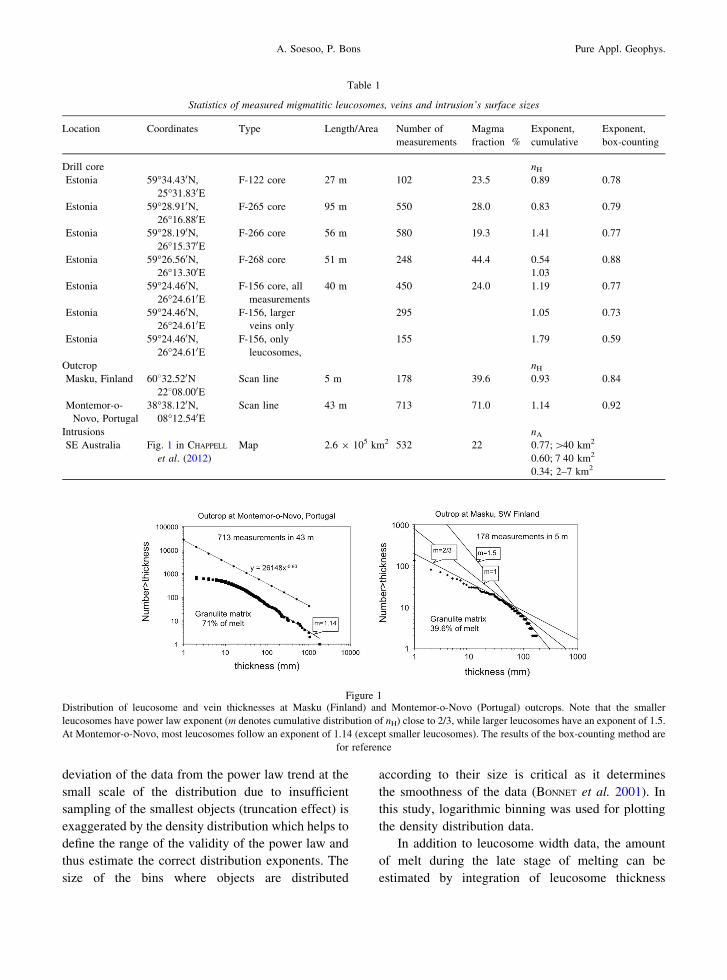
Table 1
Statistics of measured migmatitic leucosomes, veins and intrusion’s surface sizes
Location Coordinates Type Length/Area Number of
measurements
Magma
fraction %
Exponent,
cumulative
Exponent,
box-counting
Drill core nH
Estonia 59�34.430N,
25�31.830EF-122 core 27 m 102 23.5 0.89 0.78
Estonia 59�28.910N,
26�16.880EF-265 core 95 m 550 28.0 0.83 0.79
Estonia 59�28.190N,
26�15.370EF-266 core 56 m 580 19.3 1.41 0.77
Estonia 59�26.560N,
26�13.300EF-268 core 51 m 248 44.4 0.54
1.03
0.88
Estonia 59�24.460N,
26�24.610EF-156 core, all
measurements
40 m 450 24.0 1.19 0.77
Estonia 59�24.460N,
26�24.610EF-156, larger
veins only
295 1.05 0.73
Estonia 59�24.460N,
26�24.610EF-156, only
leucosomes,
155 1.79 0.59
Outcrop nH
Masku, Finland 60832.520N22808.000E
Scan line 5 m 178 39.6 0.93 0.84
Montemor-o-
Novo, Portugal
38�38.120N,
08�12.540EScan line 43 m 713 71.0 1.14 0.92
Intrusions nA
SE Australia Fig. 1 in CHAPPELL
et al. (2012)
Map 2.6 9 105 km2 532 22 0.77; [40 km2
0.60; 7 40 km2
0.34; 2–7 km2
Figure 1Distribution of leucosome and vein thicknesses at Masku (Finland) and Montemor-o-Novo (Portugal) outcrops. Note that the smaller
leucosomes have power law exponent (m denotes cumulative distribution of nH) close to 2/3, while larger leucosomes have an exponent of 1.5.
At Montemor-o-Novo, most leucosomes follow an exponent of 1.14 (except smaller leucosomes). The results of the box-counting method are
for reference
A. Soesoo, P. Bons Pure Appl. Geophys.
along the measurement line. However, the calculated
melt amount describes the minimal melt amount as
quite large melt fractions may reside in the smallest
leucosomes remaining below the resolution limit. The
observed migmatite outcrops and drill core samples
yielded minimal apparent melt fractions from 19 to
71 % (Figs. 1, 2, 3). The high grade rocks at Masku
(Finland) and Montemor-o-Novo (Portugal) outcrops
show relatively large percentages of melt varying
from 39.6 to 71 % (Fig. 1).
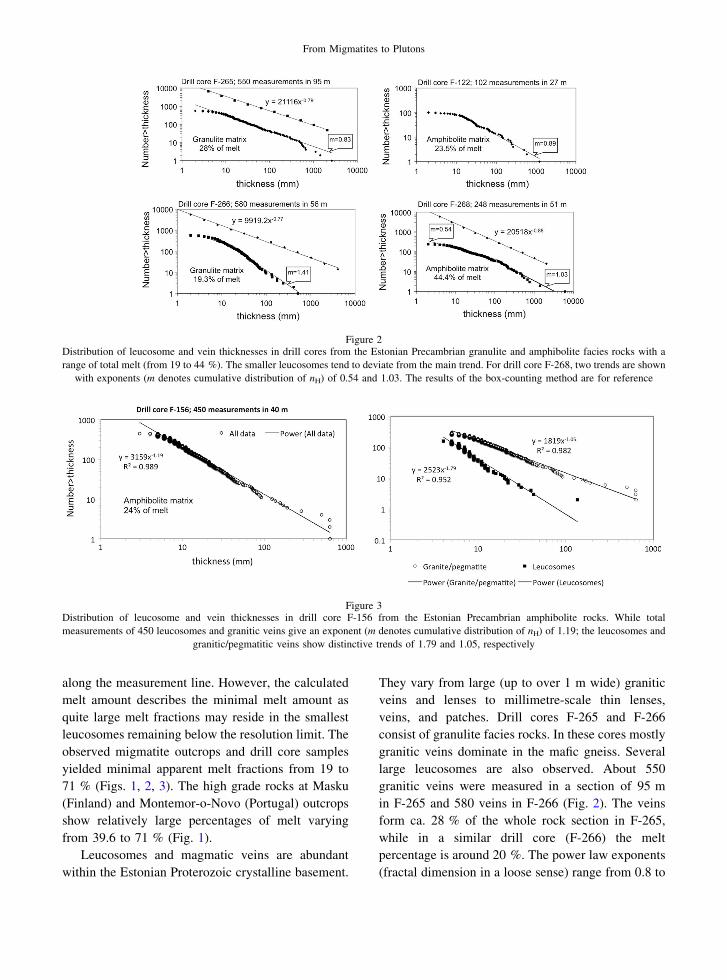
Leucosomes and magmatic veins are abundant
within the Estonian Proterozoic crystalline basement.
They vary from large (up to over 1 m wide) granitic
veins and lenses to millimetre-scale thin lenses,
veins, and patches. Drill cores F-265 and F-266
consist of granulite facies rocks. In these cores mostly
granitic veins dominate in the mafic gneiss. Several
large leucosomes are also observed. About 550
granitic veins were measured in a section of 95 m
in F-265 and 580 veins in F-266 (Fig. 2). The veins
form ca. 28 % of the whole rock section in F-265,
while in a similar drill core (F-266) the melt
percentage is around 20 %. The power law exponents
(fractal dimension in a loose sense) range from 0.8 to
Figure 2Distribution of leucosome and vein thicknesses in drill cores from the Estonian Precambrian granulite and amphibolite facies rocks with a
range of total melt (from 19 to 44 %). The smaller leucosomes tend to deviate from the main trend. For drill core F-268, two trends are shown
with exponents (m denotes cumulative distribution of nH) of 0.54 and 1.03. The results of the box-counting method are for reference
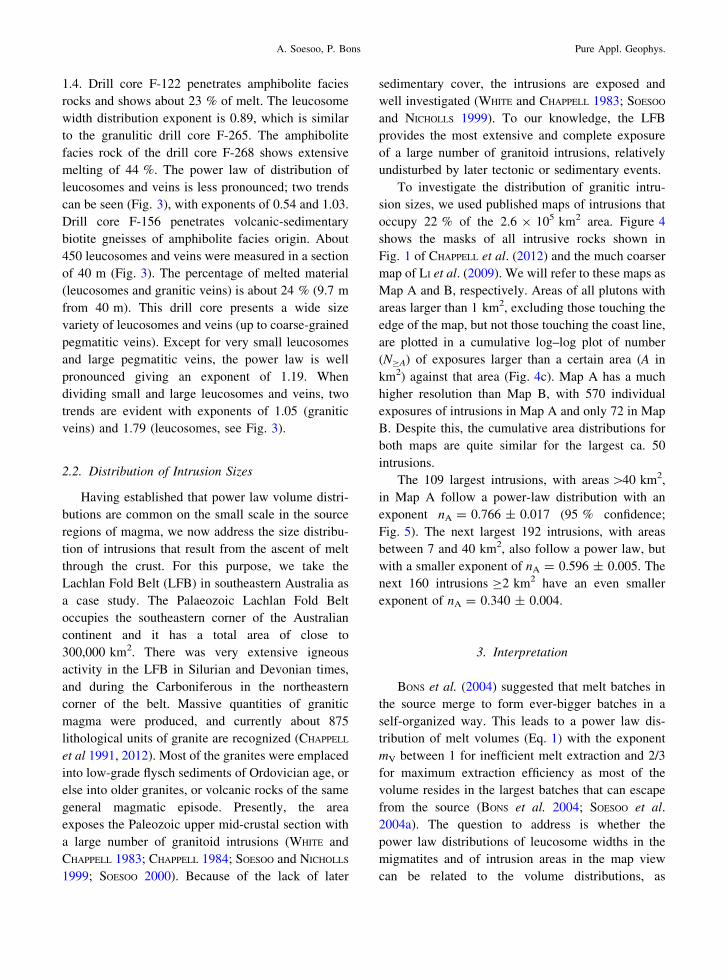
Figure 3Distribution of leucosome and vein thicknesses in drill core F-156 from the Estonian Precambrian amphibolite rocks. While total
measurements of 450 leucosomes and granitic veins give an exponent (m denotes cumulative distribution of nH) of 1.19; the leucosomes and
granitic/pegmatitic veins show distinctive trends of 1.79 and 1.05, respectively
From Migmatites to Plutons
1.4. Drill core F-122 penetrates amphibolite facies
rocks and shows about 23 % of melt. The leucosome
width distribution exponent is 0.89, which is similar
to the granulitic drill core F-265. The amphibolite
facies rock of the drill core F-268 shows extensive
melting of 44 %. The power law of distribution of
leucosomes and veins is less pronounced; two trends
can be seen (Fig. 3), with exponents of 0.54 and 1.03.
Drill core F-156 penetrates volcanic-sedimentary
biotite gneisses of amphibolite facies origin. About
450 leucosomes and veins were measured in a section
of 40 m (Fig. 3). The percentage of melted material
(leucosomes and granitic veins) is about 24 % (9.7 m
from 40 m). This drill core presents a wide size
variety of leucosomes and veins (up to coarse-grained
pegmatitic veins). Except for very small leucosomes
and large pegmatitic veins, the power law is well
pronounced giving an exponent of 1.19. When
dividing small and large leucosomes and veins, two
trends are evident with exponents of 1.05 (granitic
veins) and 1.79 (leucosomes, see Fig. 3).
2.2. Distribution of Intrusion Sizes
Having established that power law volume distri-
butions are common on the small scale in the source
regions of magma, we now address the size distribu-
tion of intrusions that result from the ascent of melt
through the crust. For this purpose, we take the
Lachlan Fold Belt (LFB) in southeastern Australia as
a case study. The Palaeozoic Lachlan Fold Belt
occupies the southeastern corner of the Australian
continent and it has a total area of close to
300,000 km2. There was very extensive igneous
activity in the LFB in Silurian and Devonian times,
and during the Carboniferous in the northeastern
corner of the belt. Massive quantities of granitic
magma were produced, and currently about 875
lithological units of granite are recognized (CHAPPELL
et al 1991, 2012). Most of the granites were emplaced
into low-grade flysch sediments of Ordovician age, or
else into older granites, or volcanic rocks of the same
general magmatic episode. Presently, the area
exposes the Paleozoic upper mid-crustal section with
a large number of granitoid intrusions (WHITE and
CHAPPELL 1983; CHAPPELL 1984; SOESOO and NICHOLLS
1999; SOESOO 2000). Because of the lack of later
sedimentary cover, the intrusions are exposed and
well investigated (WHITE and CHAPPELL 1983; SOESOO
and NICHOLLS 1999). To our knowledge, the LFB
provides the most extensive and complete exposure
of a large number of granitoid intrusions, relatively
undisturbed by later tectonic or sedimentary events.
To investigate the distribution of granitic intru-
sion sizes, we used published maps of intrusions that
occupy 22 % of the 2.6 9 105 km2 area. Figure 4
shows the masks of all intrusive rocks shown in
Fig. 1 of CHAPPELL et al. (2012) and the much coarser
map of LI et al. (2009). We will refer to these maps as
Map A and B, respectively. Areas of all plutons with
areas larger than 1 km2, excluding those touching the
edge of the map, but not those touching the coast line,
are plotted in a cumulative log–log plot of number
(NCA) of exposures larger than a certain area (A in
km2) against that area (Fig. 4c). Map A has a much
higher resolution than Map B, with 570 individual
exposures of intrusions in Map A and only 72 in Map
B. Despite this, the cumulative area distributions for
both maps are quite similar for the largest ca. 50
intrusions.
The 109 largest intrusions, with areas [40 km2,
in Map A follow a power-law distribution with an
exponent nA = 0.766 ± 0.017 (95 % confidence;
Fig. 5). The next largest 192 intrusions, with areas
between 7 and 40 km2, also follow a power law, but
with a smaller exponent of nA = 0.596 ± 0.005. The
next 160 intrusions C2 km2 have an even smaller
exponent of nA = 0.340 ± 0.004.
3. Interpretation
BONS et al. (2004) suggested that melt batches in
the source merge to form ever-bigger batches in a
self-organized way. This leads to a power law dis-
tribution of melt volumes (Eq. 1) with the exponent
mV between 1 for inefficient melt extraction and 2/3
for maximum extraction efficiency as most of the
volume resides in the largest batches that can escape
from the source (BONS et al. 2004; SOESOO et al.
2004a). The question to address is whether the
power law distributions of leucosome widths in the
migmatites and of intrusion areas in the map view
can be related to the volume distributions, as
A. Soesoo, P. Bons Pure Appl. Geophys.

predicted by BONS et al. (2004). To determine how
the observed exponents nH and nA relate to the
volume exponent mV, the shape of the magma
bodies (leucosomes, veins, plutons) needs to be
considered, as well as the chance that they are
observed in the map or scan line.
Large magma bodies are in general flatter than
small ones. Leucosomes tend to have width (H) and
length (L) ratios in the order of tens or more. It is
generally assumed that cracks are approximately
penny-shaped and can be described with the follow-
ing relationship between width (H) and length (L)
(OLSON 2003; PHILIPP 2012):
H ¼ bLa: ð2Þ
Although the exponent a is usually assumed to
be unity, for example, as observed by PHILIPP (2012)
for calcite-filled veins, OLSON (2003) argued that a
sub-linear relationship with a = 0.5 is also possible.
We are not aware of published H versus L mea-
surements for leucosomes and, therefore, assume
that a can vary from 0.5 to 1. On a much larger
scale, individual plutons are on average tabular
bodies that are self-affine in their shape (MCCAFFREY
and PETFORD 1997; CRUDEN 2005). For both a and b,
CRUDEN ( 2005) obtained values of about 0.6 when
the length unit is kilometer. Larger plutons are thus
on average flatter than small ones. It should be
noted that Eq. (2) holds for single plutons. Many of
the intrusions mapped and analyzed in Figs. 4 and 5
are composite bodies, consisting of numerous indi-
vidual intrusions. When two individual plutons
impinge on each other, they will be counted as a
single intrusion. Their H/L ratio will be smaller than
predicted by Eq. (2).
Figure 4Intrusions in the Lachlan Fold Belt in southeastern Australia based on a Fig. 1 in CHAPPELL et al. (2012) and b LI et al. (2009). Map B was
adjusted to match the scale and projection of Map A. c Logarithmic graph of number of exposed intrusion (NCA) larger than area (A in km2)
plotted against that area. Note that despite great differences in detail in the two maps, the cumulative area distributions for the largest tens of
intrusions are very similar
Figure 5Log-log plot of area of granitoid plutons in Map A of the Lachlan
Fold Belt. Three power law regimes can be defined
From Migmatites to Plutons
3.1. Volume Distribution of Leucosomes
in Migmatites
Thin leucosomes are shorter than thick ones, and
therefore, the chance (P) of them being intersected by
the drill core or scan line is smaller: P is proportional
to L. The frequency of observed (fobs) leucosomes is
thus their frequency in a volume of migmatite
multiplied by P:
fðVÞobs ¼ fðVÞPðVÞ ð3Þ
The (negative) exponent of the volume frequency
distribution (the derivative of Eq. 1) is mV ? 1 and
the volume of a leucosome is proportional to its width
and the square of its length, which gives:
fðVÞobs / V�mV�1L ¼ V�mV�1V1= 2það Þ
¼ V1= 2það Þ�mV�1 , Nð�VÞobs / V1= 2það Þ�mV
ð4Þ
This can be converted to the cumulative width
distribution that is observed in a scan line or drill core
to obtain:
Nð�HÞobs / H1þ2=a� �1= 2það Þ�mV
, nH
¼ 1þ 2=að Þ 1= 2þ að Þ � mVð Þ ð5Þ
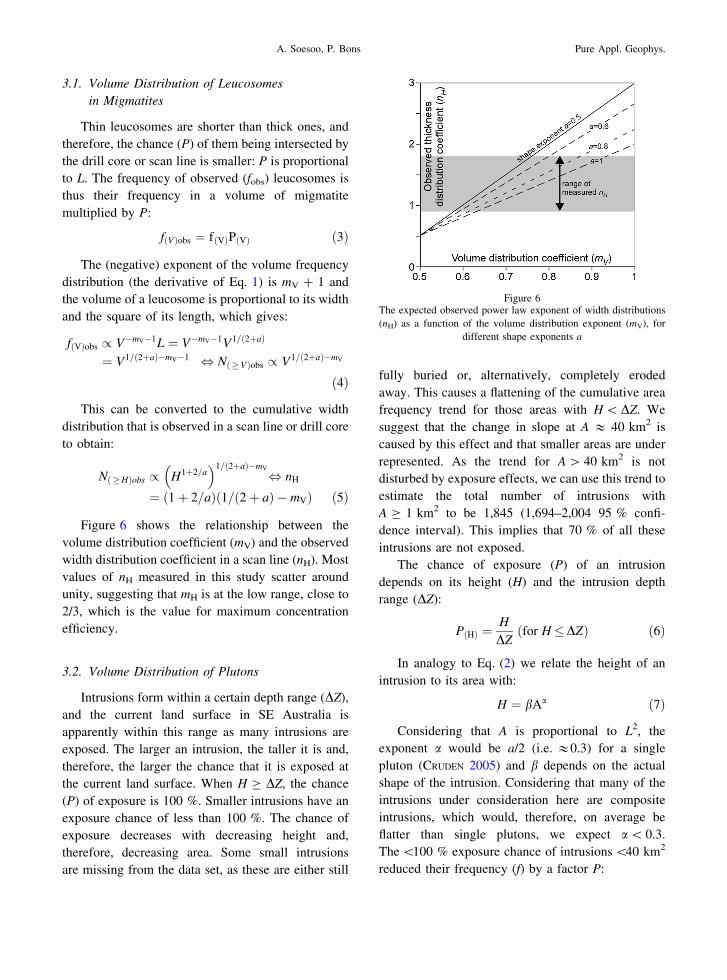
Figure 6 shows the relationship between the
volume distribution coefficient (mV) and the observed
width distribution coefficient in a scan line (nH). Most
values of nH measured in this study scatter around
unity, suggesting that mH is at the low range, close to
2/3, which is the value for maximum concentration
efficiency.
3.2. Volume Distribution of Plutons
Intrusions form within a certain depth range (DZ),
and the current land surface in SE Australia is
apparently within this range as many intrusions are
exposed. The larger an intrusion, the taller it is and,
therefore, the larger the chance that it is exposed at
the current land surface. When H C DZ, the chance
(P) of exposure is 100 %. Smaller intrusions have an
exposure chance of less than 100 %. The chance of
exposure decreases with decreasing height and,
therefore, decreasing area. Some small intrusions
are missing from the data set, as these are either still
fully buried or, alternatively, completely eroded
away. This causes a flattening of the cumulative area
frequency trend for those areas with H \ DZ. We
suggest that the change in slope at A & 40 km2 is
caused by this effect and that smaller areas are under
represented. As the trend for A [ 40 km2 is not
disturbed by exposure effects, we can use this trend to
estimate the total number of intrusions with
A C 1 km2 to be 1,845 (1,694–2,004 95 % confi-
dence interval). This implies that 70 % of all these
intrusions are not exposed.
The chance of exposure (P) of an intrusion
depends on its height (H) and the intrusion depth
range (DZ):
PðHÞ ¼H
DZðfor H�DZÞ ð6Þ
In analogy to Eq. (2) we relate the height of an
intrusion to its area with:
H ¼ bAa ð7Þ
Considering that A is proportional to L2, the
exponent a would be a/2 (i.e. &0.3) for a single
pluton (CRUDEN 2005) and b depends on the actual
shape of the intrusion. Considering that many of the
intrusions under consideration here are composite
intrusions, which would, therefore, on average be
flatter than single plutons, we expect a\ 0.3.
The \100 % exposure chance of intrusions \40 km2
reduced their frequency (f) by a factor P:
Figure 6The expected observed power law exponent of width distributions
(nH) as a function of the volume distribution exponent (mV), for
different shape exponents a
A. Soesoo, P. Bons Pure Appl. Geophys.
fexp
ðAÞ ¼ PðAÞfðAÞ ¼ �PðAÞdN�A
dA¼ bAa
DZnAkAA� nAþ1ð Þ
¼ bnAkA
DZAa� nAþ1ð Þ ðHðAÞ �DZÞ
ð8Þ
Here f stands for the true frequency of exposures
and fexp for the frequency of exposed intrusions of a
certain area. The slope of the cumulative frequency of
exposed intrusions is that of their frequency distri-
bution plus one:
Nexp�A / Aa�n ð9Þ
For the fit range between 7 and 40 km2 we find
a = 0.17 and for areas \7 km2, a = 0.43. a in the
intermediate area range (7–40 km2) is smaller than
0.3, which confirms that the composite plutons have a
smaller H/L ratio than single plutons, as was
expected. The smallest plutons have a high value of
a, which would imply a high H/L ratio, but factors
other than the shape may play a role in the
distribution of such small intrusions, such as mapping
resolution.
We have now derived an estimate of the total
number of intrusions larger than a certain area, and
we know their area frequency distribution and their
shape exponent. It would be of interest also to know
the volume distribution to estimate the total amount
of magma generated in the area. For this, the
intrusion depth range DZ needs to be known or
estimated. The frequency (fA) distribution is the slope
of the cumulative distribution (NCA). Although the
parameters kA and n were fitted to data in three
ranges, the transition from one distribution to another
needs to be calculated as the area where the
frequency of one distribution equals that of the other.
We then find:
f1 ¼ f2 , n1k1A�n1�1 ¼ n2k2A�n2�1 , A
¼ n2k2
n1k1
� � 1n2�n1
ð10Þ
We find that intrusions with A C 178 km2 have
100 % exposure chance (P = 1) and that the transi-
tion from the smallest to the medium range is at
67 km2 where P = 0.85. If we assume that the
smallest intrusions are vertical cylinders that follow
Eq. (3), we obtain using
A ¼ p 1
2L
� �2
P ¼ H
DZ¼ b
DZ
4A
p
� �a=2
, DZ
¼ b
P
4A
p
� �a=2ð11Þ
From this we obtain DZ = 2.7 km. With this we
can determine b using H(67 km2) = 0.85:
H ¼ bAa , b ¼ H
Aa; giving b ¼ 1:11: ð12Þ
Assuming a cylindrical shape, the largest intru-
sion would have L & 100 km and H & 10 km.
Using the values of a and b obtained here, this
intrusion would have a predicted thickness of
H & 5 km. Clearly, this is less than predicted by
CRUDEN (2005), but a smaller H is to be expected as
the largest intrusion is certainly a composite
intrusion.
We can now proceed to estimate the total volume
of intrusions in Map A, using:
V ¼ HA ¼ bA1þa ð13Þ
N�V ¼ kAbn
1þaV�n
1þa kV ¼ kAbn
1þa ¼ 1980 and
m ¼ n
1þ a¼ 0:65
ð14Þ
It is of interest to note that m = 0.65 is very close
to the expected minimum value of 2/3 for m, which
corresponds to maximum extraction efficiency (BONS
et al. 2004).
From the cumulative volume distribution, the total
volume of all intrusions can be derived by integrating
the product of frequency and volume:
Vtot ¼ZVmax
Vmin
VfV dV ¼ZVmax
Vmin
mkV V�mdV
¼ mkV
1� mVmaxð Þ1�m� Vminð Þ1�m�� ��
� mkV
1� mVmaxð Þ1�m; ð15Þ
where Vmin and Vmax are the smallest and largest
volume under consideration. Because (1 – m) \1,
only Vmax needs to be considered if Vmax [[ Vmin.
Remains to determine the value of Vmax, which fol-
lows from the fact that only one volume is equal or
larger than the maximum volume:
From Migmatites to Plutons
N�Vmax¼ 1 ¼ kV V�m
max , Vmax ¼ k1=mV
¼ 1:1 � 105km3: ð16Þ
Finally, the estimated total volume of intrusions,
including those currently not exposed or shown on
the map is 2.1 9 105 km3. As the total land area of
map A is 2.6 9 105 km2, 0.8 km3 of magma would
have been expelled from the source per km2. This
value is close to the 1 km3 estimated by ZEN (1992)
for the same area.
4. Discussion
Magma bodies from small ([2–3 mm thick) to
very large ([10,000 km2 in area) follow power law
distributions in their size measurements (width and
height, respectively). As the shape of magma vol-
umes, from small, magma-filled fractures to large
plutons, is generally assumed to be self-similar or
self-affine (Eq. 2), it can be assumed that volume
distributions also follow a power law. This suggests
that the process of segregation and accumulation of
magma from its source to its final emplacement as
plutons produces power law distributions over the full
range of scales under consideration here, from small
leucosomes to large plutons. There is, however, a
significant gap between the two length scales con-
sidered above. As can be seen in Figs. 1, 2, and 3, a
power law is observed in most migmatites over at
least two orders of magnitude of length scale (about
1 cm–1 m). This is a good indication that small leu-
cosomes, a few cm-wide granitic veins, and larger
([5 cm) granitic veins are related and represent a
common magma transport (pathway) system. The
range of widths is limited for several reasons.
At the small end the data are biased by the diffi-
culty to clearly recognize the thinnest veins when
their width approaches the grain size in the rock
(mm-scale). As long as the true volume distribution
(mV) is smaller than unity, this under sampling is not
a major issue, as these veins actually contain a small
proportion of the magma. Continuous scan lines and
drill cores are limited to a few tens of meters, where
the thickest vein is about 1 m thick in the migmatites
under consideration. To increase the range to ca.
10 m wide veins, about ten times longer scan lines or
drill cores would be needed, which are not available.
However, BROWN ( 2005) measured granitic veins
thicker than a few cm in outcrop and found a power
law relationship (with an exponent nH & 1.1) up to a
width of ca. 5 m. An upper limit of the power law
regime as observed in the migmatites is not known.
An estimate can be derived by taking nH & 1 and
using the observation that in a scan line of about
50 m the maximum vein width is about 1 m. Taking
10 km as the maximum height of the migmatite zone,
the maximum vein thickness would then be on the
order of 200 m. However, this estimate relies on the
unproven assumption that the same exponent extends
to this scale. Alternatively, the distribution may be
truncated at some scale, if there is a threshold melt
volume where melt batches can escape the source
region (BONS et al. 2004; BONAMICI and DUEBENDOR-
FER 2010).
Power law distributions of leucosomes and veins
have been attributed to some form of self-organiza-
tion of the melt distribution. Most authors favour melt
distribution to be in a self-organized network of
connected melt-bearing leucosomes and veins (e.g.
BROWN and SOLAR 1998; PETFORD and KOENDERS 1998;
WEINBERG and PODLADCHIKOV 1994; WEINBERG 1999;
HALL and KISTERS 2012). This model was criticized
by BONS et al. (2010), who argued that such a net-
work is not sustainable, as local and transient
transport of melt would cause the collapse of con-
nectivity. The alternative model is that step-wise
accumulation of batches of melt would lead to power
law distributions of melt volumes. This model is
supported by analogue experiments (BONS and VAN
MILLIGEN 2001; URTSON and SOESOO 2007) and
numerical modelling (BONS et al. 2004). Contrary to
classical models of magma percolating through a
network of ever-bigger veins (WEINBERG 1999), veins
are rarely connected, as their connection is only
transient. This is consistent with the observation in
outcrops that leucosomes tend to be parallel.
As long as the ambient temperature is high
enough, magma in the leucosomes and veins remains
liquid. However, plutons are formed by magma that
ascended through cooler crust. Only large magma
batches can ascend to the emplacement level, as
smaller ones would freeze along the way. These large
magma batches have a power law size distribution
A. Soesoo, P. Bons Pure Appl. Geophys.

and merge to form plutons at the emplacement level
at shallower crustal levels. Depending on the tem-
poral spacing of ascent events, the size of ascending
magma batches and size of the growing pluton, two
end members scenarios can be envisaged:
1. Previous magma batches are completely frozen
when a new one arrives. The previous magma
batches now form part of the host rock of the new
intrusion and the magmas cannot mix or mingle.
Detailed mapping of structures and geochemical
and petrological characteristics may reveal this
and the pluton is regarded as a ‘‘composite
pluton’’.
2. Previous magma batches are not yet (completely)
frozen when a new one arrives. The newly arrived
magma can mix and mingle with the previous
magma batches and a single pluton develops with
a potentially homogenized magma.
Indications for the growth of plutons by multiple
magma batches are found in several granitic plutons
and volcanic rocks (e.g. CAMBRAY et al. 1995; SLATER
et al. 2001; GLAZNER et al. 2004), although mixing in
a growing pluton may obscure the primary evidence.
The formation of plutons by amalgamation of
individual magma batches is effectively the same as the
formation of larger leucosomes from the merger of
smaller ones. We observe in the migmatites that this
leads to power law size distributions and plutons,
therefore, also show these distributions. The formation
of plutons is thus not a distinct process from magma
segregation and accumulation, but instead the end of a
single chain of transport and merger steps from the
smallest (\mm3) to the largest (�km3) scale.
The question arises whether the remaining melt in
leucosomes would actually represent the melt distri-
bution during melt generation and formation of
plutons. In case of melt percolation through a fracture
network, fractures would adapt their aperture
according to the melt pressure (HOBBS and ORD 2010).
As melt drains away, fractures would close. In that
case, a post-mortem analysis of the geological record
would not reveal the original melt-volume distribu-
tion during melt flow, and it is questionable whether
fractal distributions are to be expected. On the con-
trary, a power law or fractal spatial distribution of
remaining melt is predicted by the alternative model
of step-wise merging melt batches. The numerical
model of BONS et al. (2004) and analogue experi-
ments by Soesoo (URTSON and SOESOO 2007) indicate
that the removal of large melt batches does not affect
the distribution of remaining batches.
4.1. Self-Organization
The scale invariant nature of the distribution of
melt in former magmatic systems as observed in
migmatites indicates that magma segregation, trans-
port, and accumulation can be described as a
criticality system. Such a system exhibits rate-inde-
pendent dissipation in inhomogeneous environments;
in this case, melt transport in rocks. The scaling in a
partial melt–magma accumulation system emerges
from the interplay between order and disorder,
external dynamics and quasistatic driving forces
(PEREZ-RECHE et al. 2008). There are two end-
member models of the critical behaviour—the
random field Ising (RFIM) and pinning-depinning
(PD) approaches, which differ mainly by the amount
of disorder in the system, the latter having disorder as
an irrelevant parameter (CHAUVE et al. 2001). The two
approaches are fundamentally different. The first
model describes regimes that are dominated by
nucleation, while the second deals exclusively with
propagation. It has been shown that criticality in the
first class of models is classical, as in second order
phase transitions, while in the second class it is self-
tuning in the sense that infinitely slow driving brings
the system automatically to a critical state (DAHMEN
and BEN-ZION 2009). In the PD model, this self-
turning is interpreted as self-organised criticality
(SOC). The SOC state is achieved if the system is
driven through minor adjustments, which can be
modified by feedback mechanisms. In the SOC state
(e.g. BAK et al. 1988), a system (rock ? magmatic
liquid) adjusts itself to accommodate transport
through self-tuning and feedback adjustments.
A typical feature of an SOC system is that there is
a strong dynamic balance between input and output
and that any small perturbation can (but not neces-
sarily must) lead to a chain reaction or avalanche
(large-scale merging of melt batches and emplace-
ment of large melt volumes). From one point of view,
the partially molten rock system is comparable to the
From Migmatites to Plutons
sand-pile model of BAK et al. (1988). When sand is
sprinkled on a pile, it develops a semi-stable SOC
state (from time to time having a proper SOC state),
where sand leaves the pile in avalanches. The
continuous input is thus balanced by intermittent
bursts of output. The size distribution of the ava-
lanches follows a power law, with many small
avalanches and rare bigger ones. The latter distribu-
tion was also replicated numerically by BONS et al.
(2004) and experimentally by BONS and VAN MILLIGEN
(2001), and URTSON and SOESOO (2007).
As Perez-Reche et al. (2008) recognize, SOC is an
idealised state that is marginally accessible, but that
most systems jump from popping (POP) behaviour,
which is characterized by a large number of small
avalanches to snapping (SNAP) behaviour character-
ized by very large avalanches. In partial melting and
melt accumulation, the system behaviour is likely
dominated by POP-type avalanches, while SNAP
behaviour is an extreme case resulting in large
avalanches and local system collapse. Different
fractal dimensions (or ranges) are to be expected
for the POP and SNAP regimes. This may potentially
be the reason why some small and larger leucosomes/
magmatic veins show different fractal dimension (e.g.
Fig. 3, leucosomes vs. granite and pegmatite veins),
but altogether still follow power law distributions.
The analogy with the sand-pile model is far from
perfect. One difference is that the model does not
preserve any power law features inside the system.
Once sprinkling is stopped, the only indication of the
SOC state is the critical taper of the pile. This is
different in the partial-melt system under consideration
here, where the geological record does preserve frozen
melt batches, which represent the products of ‘‘ava-
lanches’’. Only the biggest of these escaped from the
system and are evidently difficult to observe, except for
some indicative collapse structures (BONS et al. 2008).
One similarity with the ideal sand-pile model,
which we suggest is of importance here, is that the
size distribution of avalanches is not controlled by the
sprinkling rate. The sprinkling rate only determines
the intervals between avalanches. The different
migmatites analyzed in this study may very well
have experienced different melt production rates, yet
the spatial distribution of remaining melt is remark-
ably similar. The age range ([100 million years) of
the plutons in the LFB by far exceeds the formation
time of individual plutons, which is up to *10 mil-
lion years (GLAZNER et al. 2004). Yet the size
distribution of the plutons spread over a large area
and of different ages appears to follow a single power
law. This indicates that the underlying process that
controls this distribution is independent of geograph-
ical position and age.
5. Conclusions
Magma is generated by partial melting from lm-
scale in its source rocks and may accumulate to
form �km-scale volumes. We measured thicknesses
of leucosomes and veins in migmatites along scan
lines at various localities, as well as pluton areas on
the map scale. In all cases we found power law
relationships between size and (cumulative) fre-
quency. These results show that during melt
segregation and transport the magma system is con-
trolled by self-organised criticality that governs the
topology of magmatic bodies from migmatitic leu-
cosomes to plutons and batholiths.
Theoretical and field observations indicate that
initial melts accumulate in a non-continuous, step-
wise manner to form larger accumulations. There is
no characteristic length or time scale in the partial
melting process or its products. There is no funda-
mental difference between smallest magma-filled
veins in migmatites and large plutons, which are
merely end members of a chain of mergers of magma
batches that create ever-larger volumes. The volume
distributions inferred from the measurements in line
scans and maps indicate that the cumulative volume
distribution coefficient, mV, is close to 2/3, which the
value of maximum concentration efficiency. The
distribution appears independent of local geological
or petrological factors as is probably mostly dictated
by the self-organized critical state.
Acknowledgments
This study was supported by the Estonian Ministry of
Education and Research target research project no.
SF0140016s09 and by grant no. 8963 (ESF) to AS.
A. Soesoo, P. Bons Pure Appl. Geophys.

REFERENCES
ASHWORTH, J., and MCLELLAN, E., Textures, In Migmatites (ed.
Ashworth. J.) (Blackie, Glasgow 1985) pp. 180–203.
BAK, P., TANG, C., and WIESENFELD, K. (1988), Self-organized
criticality, Phys. Rev. A. 38, 364–374.
BONAMICI, C.E., and DUEBENDORFER, E.M., (2010), Scale-invariance
and self-organized criticality in migmatites of the southern
Hualapai Mountains, Arizona, J. Struct. Geol. 32, 1114–1124.
BONNET, E., BOUR, O., ODLING, N. E., DAVY, P., MAIN, I., COWIE, P.,
and BERKOWITZ, B. (2001), Scaling of fracture systems in geo-
logical media, Rev. Geophys. 39, 347–383.
BONS, P.D., BECKER, J.K., ELBURG, M.A., URTSON, K. (2010),
Granite formation: stepwise accumulation or connected net-
works? Earth Environ. Sci. Trans. Roy. Soc. Edin. 100,
105–115.
BONS, P.D., DRUGUET, E., CASTANO, L.M., ELBURG, M.A. (2008),
Finding what is not there anymore: recognizing missing fluid and
magma volumes, Geology 36, 851–854.
BONS, P.D., ARNOLD, J., ELBURG, M.A., KALDA, J., SOESOO, A., VAN
MILLIGEN, B.P. (2004), Melt extraction and accumulation from
partially molten rocks, Lithos 78, 25–42.
BONS, P.D., DOUGHERTY-PAGE, J., and ELBURG, M.A. (2001), Step-
wise accumulation and ascent of magmas, J. Met. Geol. 19,
627–633.
BONS, P.D., and VAN MILLIGEN, B.P. (2001), A new experiment to
model self-organized critical transport and accumulation of melt
and hydrocarbons from their source rocks, Geology 29,
919–922.
BROWN, M. (2007), Crustal melting and melt extraction, ascent and
emplacement in orogens: mechanisms and consequences, J.
Geol. Soc. London 164, 709–730.
BROWN, M.A., Synergistic effects of melting and deformation: an
example from the Variscan belt, western France, In deformation
mechanisms, rheology and tectonics: from minerals to the lith-
osphere (eds. Gapais, D., Brun, J. P., and Cobbold, P. R.) (J.
Geol. Soc. London, Spec. Pub. 243, 2005a) pp. 205–26.
BROWN, M. A., BROWN, M., CARLSON, W. D., and DENISON, C.
(1999), Topology of syntectonic melt-flow networks in the deep
crust: inferences from three-dimensional images of leucosome
geometry in migmatites, Am. Miner. 84, 1793–1818.
BROWN, M., SOLAR, G.S. (1999), The mechanism of ascent and
emplacement of granite magma during transpression: a syntec-
tonic granite paradigm, Tectonophysics 312, 1–33.
BROWN, M., and SOLAR, G. S. (1998), Shear-zone systems and
melts: feedback and self-organization in orogenic belts. J. Struct.
Geol. 20, 211–27.
BROWN, M. (1994), The generation, segregation, ascent and
emplacement of granite magma: the migmatite-to-crustally-
derived granite connection in thickened orogens, Earth-Sci. Rev.
36, 83–130.
CAMBRAY, F.W., VOGEL, T.A., and MILLS, J.G. (1995), Origin of
compositional heterogeneities in tuffs of the Timber Mountain
Group: the relationship between magma batches and magma
transfer and emplacement in an extensional environment, Geo-
phys. Res. 100, 15793–15805.
CHAPPELL, B. W., BRYNT, C. J., WYBORN, D. (2012), Peraluminous
I-type granites, Lithos 153, 142–153.
CHAPPELL, B. W., ENGLISH, P. M., KING, P.L., WHITE, A. J., WYBORN,
D. (1991), Granites and related rocks of the Lachlan Fold Blet
(1:1 250 000 scale map), Bureau of Mineral Resources, Geology
and Geophysics, Australia.
CHAPPELL, B.W. (1984), Source rocks of I- and S-type granites in
the Lachlan Fold Belt, southeastern Australia, Philosoph.
Transac. Roy. Soc. London A. 310, 693–707.
CHAUVE, P., LE DOUSSAL, P., and WIESE. K. J. (2001), Renormal-
ization of pinned elastic systems: how does it work beyond one
loop ? Phys. Rev. Letts. 86, 1785.
CLEMENS, J. D. (1998), Observations on the origin and ascent
mechanism of granitic magma, J. Geol. Soc. London 155, 843–851.
CLEMENS, J.D., DROOP, G.T.R., and STEVENS, G. (1997), High-grade
metamorphism, dehydration and crustal melting: a reinvestiga-
tion based on new experiments in the silica-saturated portion of
the system KAlO3-MgO-SiO2-CO2 at P \ 1.GPa, Contrib.
Mineral. Petrol. 129, 308–325.
CLEMENS, J.D., and MAWER, C.K. (1992), Granitic magma transport
by fracture propagation, Tectonophysics 204, 339–360.
CRUDEN, A.R., Emplacement and growth of plutons: implications
for rates of melting and mass transfer in continental crust, In
Evolution and differentiation of the continental crust (eds.
Brown, M., and Rushmer, T.) (Cambridge University Press, New
York 2005) pp. 455–519.
DAHMEN, K.A., and BEN-ZION, Y., The physics of jerky motion in
slowly driven magnetic and earthquake fault systems, in ency-
clopedia of complexity and systems science Vol.5, (Springer,
New York 2009) pp. 5021–5037.
EMERMAN, S.H., and MARRETT, R. (1990), Why dikes? Geology 18,
231–233.
GLAZNER, A. F., BARTLEY, J. M., COLEMAN, D. S., GRAY, W., and
TAYLOR, R. Z. (2004), Are plutons assembled over millions of
years by amalgamation from small magma chambers? GSA
Today 14, 4–11.
HALL, D., and KISTERS, A. (2012), The stabilization of self-organ-
ised leucogranite networks—Implications for melt segregation
and far-field melt transfer in the continental crust, Earth Planet
Sci. Letts. 355–356, 1-12.
HASALOVA, P., SCHULMANN, K., LEXA, O., STIPSKA, P., HROUDA, F.,
ULRICH, S., HALODA, J., and TYCOVA, P. (2008), Origin of mi-
gmatites by deformation-enhanced melt infiltration of
orthogneiss: a new model based on quantitative microstructural
analysis, J. Met. Geol. 26, 29–53.
HOBBS, B.E., and ORD, A. (2010), The mechanics of granitoid
systems and maximum entropy production rates, Phil. Trans.
R. Soc. A. 368, 53–93.
JACKSON, M. D., CHEADLE, M. J., and ATHERTON, M. P. (2003),
Quantitative modeling of granitic melt generation and segrega-
tion in the continental crust, J. Geophys. Res. 108, 2332–2353.
JUREWICZ, S. R., and WATSON, E. B. (1984), Distribution of partial
melt in a felsic system: the importance of surface energy, Con-
trib. Mineral. Petrol. 85, 25–29.
LAPORTE, D., and WATSON, E. B. (1995), Experimental and theo-
retical constraints on melt distribution in crustal sources: the
effect of crystalline anisotropy on melt interconnectivity, Chem.
Geol. 124, 161–184.
LI, W., JACKSON, S.E., PEARSON, N.J., ALARD, O., and CHAPPELL,
B.W. (2009), The Cu isotopic signature of granites from the
Lachlan Fold Belt, SE Australia. Chem. Geol. 258, 38–49.
LINDH, A., and WAHLGREN, C. (1985), Migmatite formation at
subsolidus conditions—an alternative to anatexis, J. Met. Geol.
3, 1–12.
From Migmatites to Plutons
LISTER, J.R., and KERR, R.C. (1991), Fluid-mechanical models of
crack propagation and their application to magma transport in
dykes, J. Geophys. Res. 96, 10049–10077.
MAALØE, S. (1987), The generation and shape of feeder dykes from
mantle sources, Contrib. Mineral. Petrol. 96, 47–55.
MARCHILDON, N., and BROWN, M. (2003), Spatial distribution of
melt-bearing structures in anatectic rocks from Southern Brit-
tany, France: implications for melt transfer at grain- to orogen-
scale, Tectonophysics 364, 215–235.
MCCAFFREY, K.J.W., and PETFORD, N. (1997), Are granitic intru-
sions scale invariant? J. Geol. Soc. London 154, 1–4.
MISCH, P. (1968), Plagioclase compositions and non-anatectic
origin of migmatitic gneisses in N. Cascade Mountains of
Washington State, Contrib. Mineral. Petrol. 17, 1–70.
MENGEL, K., RICHTER, M., and JOHANNES, W. (2001), Leucosome-
forming small-scale geochemical processes in the metapelitic
migmatites of the Turku area, Finland, Lithos 56, 47–73.
NICOLAS, A., and JACKSON, M. (1982), High temperature dikes in
peridotites: origin by hydraulic fracturing. J. Petrol. 23, 568–82.
OLSEN, S. N. (1984), Mass-balance and mass-transfer in migmatites
from the Front Range, Colorado, Contrib. Mineral. Petrol. 85,
30–44.
OLSON, S. N., MARSH, B. D., and BAUMGARTNER, L. P. (2004),
Modelling mid-crustal migmatite terrains as feeder zones for
granite plutons: the competing dynamics of melt transfer by bulk
versus porous flow. Transac. Roy. Soc. Edin. Earth Sci. 95,
49–58.
OLSON, J.E. (2003), Sublinear scaling of fracture aperture versus
length: an exception or the rule? J. Geophys. Res. Solid Earth
108(B9), 2413.
PEREIRA, M. F., and SILVA, J. B. (2002), The geometry and kine-
matics of enclaves in sheared migmatites from the Evora Massif,
Ossa-Morena Zone (Portugal), Geogaceta 31, 199–202.
PEREZ-RECHE F-JOSE, TRUSKINOVSKY, L., and ZANZOTTO, G. (2008),
Driving-induced crossover: from classical criticality to self-
organized criticality, Phys. Rev. Letts. 101, 230601.
PETFORD, N., CRUDEN, A.R., MCCAFFREY, K.J.W., and VIGNERESSE,
J.-L. (2000), Granite magma formation, transport and
emplacement in the Earth’s crust, Nature 408, 669–673.
PETFORD, N., and KOENDERS, M. A. (1998), Self-organisation and
fracture connectivity in rapidly heated continental crust, J.
Struct. Geol. 20, 1425–34.
PHILIPP, S.L. (2012), Fluid overpressure estimates from the aspect
ratios of mineral veins, Tectonophysics 581, 35–47.
RUSHMER, T. (1995), An experimental deformation study of partially
molten amphibolite: application to low-melt fraction segrega-
tion, J. Geophys. Res. 100, 15681–15695.
SAWYER, E.W. (2014), The inception and growth of leucosomes:
microstructure at the start of melt segregation in migmatites, J.
Met. Geol. 32, 695–712.
SAWYER, E.W. (2001), Melt segregation in the continental crust:
distribution and movement of melt in anatectic rocks, J. Met.
Geol. 19, 291–309.
SAWYER, E. W. (1994), Melt segregation in the continental crust,
Geology 22, 1019–1022.
SECOR, D.T., and POLLARD, D.D. (1975), On the stability of open
hydraulic fractures in the Earth’s crust, Geophys. Res. Lett. 2,
510–513.
SEDERHOLM, J. (1907), On granite and gneiss, Bull. Comm. Geol.
Finl. 23, 1–110.
SLATER, L., MCKENZIE, D., GRONVOLD, K., and SHIMIZU, N. (2001),
Melt generation and movement beneath Theistareykir, NE Ice-
land, J. Petrol. 42, 321–354.
SOESOO, A., and BONS, P., Partial melting of Earth’ rocks: fractals
and analogue modelling approach, In (Ed. Perugini, D.) (VI
International Conference on fractals and dynamic systems in
geosciences, Perugia, Italy 2013) pp. 71–72.
SOESOO, A., KOSLER, J., and KULDKEPP, R. (2006), Age and geo-
chemical constraints for partial melting of granulites in Estonia,
Mineral. Petrol. 86, 277–300.
SOESOO, A., KALDA, J., BONS, P.D., URTSON, K., and KALM, V.
(2004a), Fractality in geology: a possible use of fractals in the
studies of partial melting processes, Proc. Eston. Acad. Sci.,
Geol. 53, 13–27.
SOESOO, A., PUURA, V., KIRS, J., PETERSELL, V., NIIN, M., and ALL, T.
(2004b), Outlines of the Precambrian basement of Estonia, Proc.
Eston. Acad. Sci., Geol. 53, 149–164.
SOESOO, A. (2000), Fractional crystallisation of mantle-derived
melts as a mechanism for some I-type granite petrogenesis: an
example from Lachlan Fold Belt, Australia, J. Geol. Soc. London
157, 135–150.
SOESOO, A., and NICHOLLS, I.A. (1999), Mafic rocks spatially
associated with Devonian felsic intrusions of the Lachlan Fold
Belt: a possible mantle contribution to crustal evolution pro-
cesses, Austr. J. Earth Sci. 46, 725–734.
TAKADA, A. (1990), Experimental study on propagation of liquid-
filled crack in gelatin: shape and velocity in hydrostatic stress
condition, J. Geophys. Res. 95, 8471–8481.
TANNER, D. C. (1999), The scale-invariant nature of migmatite from
the Oberpfalz, NE Bavaria and its significance for melt transport,
Tectonophysics 302, 297–305.
URTSON, K., and SOESOO, A. (2009), Stepwise magma migration and
accumulation processes and their effect on extracted melt
chemistry, Est. J. Earth Sci. 58, 246–258.
URTSON, K., and SOESOO, A. (2007), An analogue model of melt
segregation and accumulation processes in the Earth’s crust,
Est. J. Earth Sci. 56, 3–10.
VAN DER MOLEN, I., and PATERSON, M.S. (1979), Experimental
deformation of partially melted granite, Contrib. Mineral. Petrol.
70, 299–318.
VIGNERESSE, J.L., BARBEY, P., and CUNEY, M. (1996), Rheological
transitions during partial melting and crystallization with
application to felsic magma segregation and transfer, J. Petrol.
37, 1579–1600.
WALTE, N. P., BONS, P. D., PASSCHIER, C. W., and KOEHN, D. (2003),
Disequilibrium melt distribution during static recrystallization,
Geology 31, 1009–1012.
WALTE, N.P., BECKER, J.K., BONS, P.D., RUBIE, D.C., and FROST, D.J.
(2007), Liquid distribution and attainment of textural equilibrium
in a partially-molten crystalline system with a high-dihedral-
angle liquid phase, Earth Planet. Sci. Lett. 262, 517–53.
WARK,, D.A., WILLIAMS, C.A., WATSON, E.B., and PRICE, J.D.
(2003), Reassessment of pore shapes in microstructurally equil-
ibrated rocks, with implications for permeability of the upper
mantle, J. Geophys. Res. 108, 2050.
WEERTMAN, J. (1971), Theory of water-filled crevasses in glaciers
applied to vertical magma transport beneath ocean ridges, J.
Geophys. Res. 76, 1171–1183.
WEINBERG, R.F. (1999), Mesoscale pervasive felsic magma migra-
tion: alternatives to dyking, Lithos 46, 393–410.
A. Soesoo, P. Bons Pure Appl. Geophys.

WEINBERG, R.F., and PODLADCHIKOV, Y.Y. (1994), Diapiric ascent of
magmas through power law crust and mantle, J. Geophys. Res.
99, 9543–9559.
WEINBERG, R.F., and SEARLE, M.P. (1998), The Pangong injection
complex, Indian Karakoram: a case of pervasive granite
flow through hot viscous crust, J. Geol. Soc. London 155,
883–891.
WHITE, A.J.R., and CHAPPELL, B.W. (1983), Granitoid types and
their distribution in the Lachlan Fold Belt, southeastern Aus-
tralia, Geol. Soc. Am. Mem. 159, 21–34.
WINKLER, H. (1961), Die Genese von Graniten und Migmatiten auf
Grund neuer Experimente, Geol. Rundsch. 61, 347–364.
ZEN, E. (1992), Using granite to image the thermal state of the
source terrain, Trans. R. Soc. Edinb. Earth Sci. 83, 107–114.
(Received April 16, 2014, revised September 5, 2014, accepted November 19, 2014)
From Migmatites to Plutons
Related Documents