A Manual for Elimination Scenario Planning FROM MALARIA CONTROL TO MALARIA ELIMINATION

Welcome message from author
This document is posted to help you gain knowledge. Please leave a comment to let me know what you think about it! Share it to your friends and learn new things together.
Transcript

A Manual for Elimination Scenario Planning
FROM MALARIA
CONTROL TO MALARIA
ELIMINATION

A Manual for Elimination Scenario Planning
FROM MALARIA
CONTROL TO MALARIA
ELIMINATION
WHO Library Cataloguing-in-Publication Data
From malaria control to malaria elimination: a manual for elimination scenario planning.
1.Malaria - prevention and control. 2.Epidemiological Monitoring. 3.Communicable Disease Control. 4.Disease Vectors. 5.Disease Eradication. I.World Health Organization
ISBN 978 92 4 150702 8 (NLM classification: WC 765)
© World Health Organization 2014
All rights reserved. Publications of the World Health Organization are available on the WHO website (www.who.int) or can be purchased from WHO Press, World Health Organization, 20 Avenue Appia, 1211 Geneva 27, Switzerland (tel.: +41 22 791 3264; fax: +41 22 791 4857; e-mail: [email protected]).
Requests for permission to reproduce or translate WHO publications –whether for sale or for non-commercial distribution– should be addressed to WHO Press through the WHO website (www.who.int/about/licensing/copyright_form/en/index.html).
The designations employed and the presentation of the material in this publication do not imply the expression of any opinion whatsoever on the part of the World Health Organization concerning the legal status of any country, territory, city or area or of its authorities, or concerning the delimitation of its frontiers or boundaries. Dotted lines on maps represent approximate border lines for which there may not yet be full agreement.
The mention of specific companies or of certain manufacturers’ products does not imply that they are endorsed or recommended by the World Health Organization in preference to others of a similar nature that are not mentioned. Errors and omissions excepted, the names of proprietary products are distinguished by initial capital letters.
All reasonable precautions have been taken by the World Health Organization to verify the information contained in this publication. However, the published material is being distributed without warranty of any kind, either expressed or implied. The responsibility for the interpretation and use of the material lies with the reader. In no event shall the World Health Organization be liable for damages arising from its use.
Printed in France
Design and Layout: www.paprika-annecy.com

v
Contents
Foreword ................................................................................................................................... vii
Abbreviations .......................................................................................................................... viii
Acknowledgements.....................................................................................................................ix
Glossary of key terms ..................................................................................................................x
Part I. Introduction .....................................................................................................................1
Part II. Conceptual framework ..................................................................................................3
Part III. Estimating the malaria baseline ................................................................................10
Part IV. Making predictions about technical feasibility of malaria reduction .......................18
Part V. Operational feasibility of achieving reductions ...........................................................22
Part VI. Making predictions about the operational feasibility of malaria reduction ............27
Part VII. Achieving elimination ............................................................................................... 31
Part VIII. Maintaining elimination .........................................................................................36
Part IX. Assessing financial feasibility .....................................................................................44
Part X. Summation ...................................................................................................................50
References ..................................................................................................................................52

vi A MANUAL FOR ELIMINATION SCENARIO PLANNING
vii
Foreword
During the last decade, substantial progress has been made in controlling malaria worldwide through large scale implementation of effective malaria interventions. The magnitude of this progress has led some malaria endemic countries, even those with historically high burdens of malaria, to consider the possibility of malaria elimination. Existing WHO guidance for elimination has focused on activities to be conducted once a programme has entered the elimination phase and has included only limited discussion of the technical and operational feasibility of achieving this.
To fill this important gap, WHO has worked with partners from the Clinton Health Access Initiative, Imperial College London, the Global Health Group, University of California San Francisco, Johns Hopkins University, and the University of Southampton to develop an Elimination Scenario Planning tool, of which this manual is a key component. The manual reviews elimination concepts, considers the technical, operational, and financial feasibility of elimination, and helps users explore various scenarios through which elimination of malaria may be achieved. These scenarios consider the reduction in malaria that can be achieved using different combinations of interventions. The manual can be used in conjunction with malaria transmission model software, which allows users to explore the effect of a range of intervention packages on malaria burden in their country and to understand better what levels of intervention coverage might be needed to make elimination possible.
The Elimination Scenario Planning manual is focused on what is needed to achieve very low levels of malaria transmission, and was designed to integrate with the overall programme planning cycle and complement other programme management and planning tools. The concepts covered in the manual, on the technical, operational, and financial factors affecting malaria control, are applicable to programmes at any point on the path to malaria elimination. As the work to control and eliminate malaria goes forward, and new malaria interventions become available, the need for sound strategic planning by programmes will be increasingly important, so that resources can be directed as effectively, efficiently and equitably as possible.
John Reeder, PhDDirector a.i., Global Malaria Programme World Health Organization
viii A MANUAL FOR ELIMINATION SCENARIO PLANNING
Abbreviations
ACTs Artemisinin-based combination therapies
DHS Demographic and Health Surveys
ITN Insecticide-treated net
IRS Indoor residual spraying
LLIN Long-lasting insecticidal net
MIS Malaria Indicator Survey
WHO World Health Organization
ix
Acknowledgements
This manual was developed through the work of numerous WHO staff and international partners in malaria control, to whom we are most grateful. For their guidance, input, and comment on the Elimination Scenario Planning manual, we would like to thank: Justin Cohen, Deepika Kandula, Bruno Moonen and Oliver Sabot from the Clinton Health Access Initiative, USA; Azra Ghani, Jamie Griffin, Thomas Churcher and Lucy Okell from Imperial College, UK; David Smith from Johns Hopkins University, USA, and Andy Tatem from the University of Southampton, UK; Roly Gosling and Allison Phillips from the University of California San Francisco’s Global Health Group, USA; Richard Steketee from the Malaria Control and Evaluation Partnership in Africa (MACEPA) and Allan Schapira, independent consultant in malaria and tropical diseases; Michael Lynch, Robert Newman, Richard Cibulskis, and Aafje Rietveld from WHO-GMP.
We would also like to thank the following participants in a workshop on malaria elimination scenario planning held in Banjul, The Gambia, in May, 2012, for their valuable feedback on the ESP manual and accompanying malaria tools software: Adam Sonko, Balla Kandeh, Momadou Kalleh, Balla Gibba, Malick Gai, and Mamodou from the National Malaria Control Programme, The Gambia; Umberto D’Alessandro, Serign Ceesay, Joseph Okebe, Medical Research Council Unit, The Gambia; Cheikh Diop, Medoune Diop, Ousseynou Badiane, Jean-Louis Ndiaye from the Programme National de Lutte contre le Paludisme, Senegal; Boniface Mutombo, Yakou Dieye, MACEPA, Senegal.
Financial support for development and publication of this manual was provided by the WHO Global Malaria Programme (GMP) and the University of California San Francisco’s Global Health Group through a grant from the Bill and Melinda Gates Foundation (BMGF). The BMGF Vaccine Modeling Initiative and the Modeling Infectious Disease Agents Study (MIDAS) funded the development of the Malaria Tools Software.
x A MANUAL FOR ELIMINATION SCENARIO PLANNING
Glossary of key terms
Elimination
Reduction to zero of the incidence of infection caused by a specified malaria parasite in a defined geographical area as a result of deliberate efforts. Continued measures to prevent re-establishment of transmission are required.
Coverage
A general term referring to the fraction of the population of a specific area which receives a particular intervention. Individuals covered by an intervention may or may not use it appropriately.
Fraction fully protected
A specific term referring to the proportion of the population of a specific area which is both covered by a particular intervention and is fully and effectively protected or treated by it. This is also termed ‘effective coverage’.
Importation rate
The number of malaria infections per unit time that are brought into a particular area from another area.
Malaria baseline
The malaria burden that would be present in a specific area if no control activities existed. This is also termed ‘intrinsic malaria transmission level’.
Operational unit
An area of a country or region that serves as the unit of analysis for this framework, defined by its particular combination of a) baseline malaria burden, b) estimated malaria importation rate, and c) malaria interventions and related operational activities.
1INTROdUCTION
Part I. IntroductionObjectives, structure, and use of this document
Malaria elimination is defined as the reduction to zero of the incidence of infection caused by a specified malaria parasite in a defined geographical area as a result of deliberate efforts. Significant progress has been achieved in malaria control worldwide over the past decade. Increased financial support for malaria programmes has enabled impressive reductions in transmission in many endemic regions.1 These successes have stimulated renewed discussion of how, when and where malaria can be eliminated.2,3
Implementation of proven malaria control measures can reduce transmission within short to moderate timeframes nearly everywhere malaria occurs. Malaria levels in many endemic areas have been reduced to low levels, including the very low levels that could be the starting point for elimination programmes aimed at bringing those levels down to zero. Elimination of malaria could be within reach in many low burden areas, but in high burden regions it is an even more challenging goal than reduction of the malaria burden, and may not be possible in the short term.4
An elimination programme will require a short-term infusion of funding to intensify activities as well as a commitment to longer-term funding to ensure continued surveillance and control activities even after malaria has been eliminated, to prevent reintroduction and resurgence.5 While a country entirely free of malaria may be the ultimate goal, reduction of the burden of malaria by any magnitude and sustaining this reduction will have tremendous benefits in terms of deaths and illness averted, household socioeconomics, and industrial and agricultural growth.6 On the other hand, attempting and then abandoning malaria control or elimination programmes is likely to have negative consequences, including waste of resources, loss of faith in the public health system, and resurgence of malaria in a population that has lost its immunity.2,3,7
The main purpose of this manual is to raise awareness of the sorts of technical, operational, and financial resources that would be required to reduce and eventually eliminate malaria, the timelines over which such reductions are likely to be achieved, and how they can be sustained. This knowledge is essential in order to plan strategically for long-term success. More detailed, context-specific planning will be an important next step after working through the general approach set out here.
This document aims to assist malaria programmes in evaluating whether elimination, or other reductions in malaria, represents a feasible and appropriate goal in a defined area, based on careful consideration of what reductions in transmission are likely to occur given the intrinsic malaria burden, the levels of programme coverage that can be reached, and the financial investment available.8 It addresses three linked sets of considerations:
Technical feasibilityIs it technically feasible to eliminate malaria within a set timeframe given the intrinsic malaria transmission potential within the selected area? If so, what fraction of the population would theoretically need to be protected from transmission to achieve malaria elimination? What would be required technically to maintain the gains achieved in reducing malaria despite continued importation of infections from neighbouring areas or countries? And if elimination is not feasible, how much reduction in malaria is technically possible?
Operational feasibility Given the operational and administrative challenges involved, can the technical requirements for eliminating malaria and maintaining the gains be implemented?
1

2 A MANUAL FOR ELIMINATION SCENARIO PLANNING
What additional operational requirements, particularly in terms of surveillance, human resources, and legal and regulatory framework, will be required for elimination to be achieved and maintained?
Financial feasibilityWhat is the likely cost of meeting and sustaining the operational requirements for elimination? Are sufficient funds available to pay for these requirements, and can sustained financing be secured over time?
Even with the best prediction tools, accurate forecasting of what will happen to malaria in a specific place over time is difficult, in view of the complex web of social, environmental, epidemiological, programmatic, and health system factors that influence malaria. Within these limitations, this document considers how the malaria burden may evolve under different conditions. The history of malaria control and elimination around the world has provided a great deal of evidence on the impact control activities can have on malaria. By drawing lessons from these past experiences, insight and information can be gained on what might be expected to occur in future situations. Such extrapolations are guides to what is possible rather than precise predictions of what will occur, and actual results are quite likely to vary from the scenarios presented here. Nevertheless, the results should help set realistic expectations for what can be achieved, without indicating definite timelines for elimination.
This document does not provide guidance on the management of malaria elimination programme activities, which can be found in the WHO publication Malaria Elimination: A field manual for low and moderate endemic countries, available at http://www.who.int/malaria/publications/atoz/9789241596084/en/index.html.
The Elimination Scenario Planning (ESP) process involves the following steps:
1. Introducing the key concepts and framework
2. Dividing the area of interest into operational units (areas) for analysis
3. Estimating the malaria baseline in each operational unit (area), i.e. the malaria burden that would be present in the absence of intervention
4. Assessing technical requirements for reducing malaria to very low levels in each operational unit (area)
5. Evaluating current operational capacity against those technical requirements and whether operational strengthening would achieve the technical requirements in each area
6. Evaluating the technical and operational feasibility of maintaining elimination in each area despite importation of infections from neighbouring areas and abroad
7. Evaluating the financial feasibility of achieving and maintaining elimination
8. Consideration of the long-term goals for the malaria programme
Through this process, ESP can provide input into the broader strategic planning of a national programme by envisaging feasible long-term goals and the technical, operational and financial requirements for reaching them.
3CONCEPTUAL FRAMEwORk
2
Part II. Conceptual frameworkDefinition of the key terminology and explanation of a framework for analysis
Malaria baseline
Every place in the world has a certain potential for malaria transmission that is intrinsic to it at a given point in time, ranging from zero to some level above zero. This characteristic is often referred to as ’receptivity’, and indicates the extent to which conditions are favourable for malaria transmission in a specific location.9 The potential for malaria transmission is a function of many varied factors, including (but not limited to):
• The mosquito vector species, their abundance and behaviour
• The Plasmodium species
• Temperature and rainfall
• Geography and topography of the land
• Amount and type of agriculture or land-cover in that area
• Strength of the health system
• Quality of housing in which people live
• How people spend their time in the places and times when vectors are feeding
Together, these characteristics will lead to a specific malaria baseline: the level of malaria burden that would exist in a given place if no interventions are implemented to control it.
Because of the number and variability of factors that influence this baseline, it will vary both between and within countries; different areas within the same country may have different vectors, geographies, socioeconomics, and health system coverage. For analytical purposes, it is thus important to categorize a country (or whatever region is of interest) into operational units with fairly homogeneous baseline malaria. The smaller the units selected, the more homogeneous they can be made but the more challenging the analysis will become and, possibly, the less useful these units will be for operational purposes. It may be useful to relate the operational units to the scale and level at which operational decisions are made, for example, the regional, subregional, or district level.
Figure 1 depicts a country that has, on average, a medium baseline level of malaria. It is possible to analyse the entire country as a single operational unit, but analysis will be more precise if it is subdivided into smaller operational units, in this case one unit with high, one with medium, and one with low baseline. This categorization is important because, as described below, the effects of implementing the same malaria intervention in each of these three operational units will differ.

4 A MANUAL FOR ELIMINATION SCENARIO PLANNING
FIGURE 1. Division of a malarious area into smaller operational units may reveal important variations in malaria baseline.
Medium
Malaria baseline
Low High
High
High
Medium
High
Medium
Low
Medium
Low
Low
The malaria baseline of a particular area may change over time, and possibly through developments that are not modifiable by a malaria control programme. For example, improving housing conditions will likely reduce the baseline, while land-use changes that increase vector breeding habitats may increase it.
Even on shorter timescales, the existence of a malaria baseline does not mean that a constant prevalence or incidence of malaria will always occur. Prevalence or incidence at a given time can be quite variable: there will be regular seasonal variation as well as more unpredictable fluctuations that may be related to migration patterns or variation in weather patterns. In Figure 2, grey lines represent the oscillations that may be commonly observed in malaria prevalence due to many varying factors. The oscillations can be smoothed into a general seasonal pattern depicted in blue. To make general statements about malaria, the precise intricacies of either the grey or blue lines are not of interest; instead the irregular fluctuations in this “noisy” malaria picture can be generalized in terms of the average prevalence of malaria that exists in a specific place at a particular time if no control measures are implemented. In this hypothetical case, the baseline is slowly trending downwards over time due to factors extrinsic to the malaria control programme.
FIGURE 2. Regular and irregular variation is simplified by describing malaria metrics on average rather than at a precise moment in time.
Time
Mal
aria
pre
vale
nce
Seasonal variation
“Noise”
Malaria
baseline
5CONCEPTUAL FRAMEwORk
Reductions from the baseline
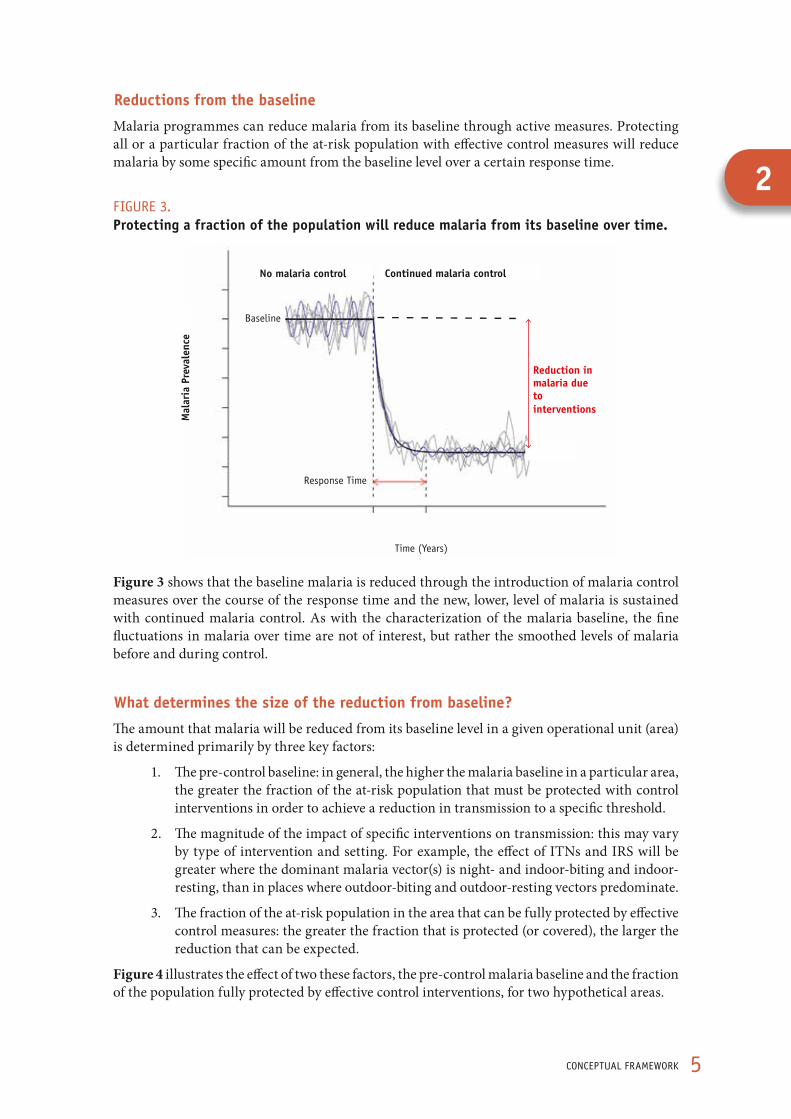
Malaria programmes can reduce malaria from its baseline through active measures. Protecting all or a particular fraction of the at-risk population with effective control measures will reduce malaria by some specific amount from the baseline level over a certain response time.
FIGURE 3. Protecting a fraction of the population will reduce malaria from its baseline over time.
Mal
aria
Pre
vale
nce
No malaria control Continued malaria control
Reduction in malaria due to interventions
Time (Years)
Baseline
Response Time
Figure 3 shows that the baseline malaria is reduced through the introduction of malaria control measures over the course of the response time and the new, lower, level of malaria is sustained with continued malaria control. As with the characterization of the malaria baseline, the fine fluctuations in malaria over time are not of interest, but rather the smoothed levels of malaria before and during control.
What determines the size of the reduction from baseline?
The amount that malaria will be reduced from its baseline level in a given operational unit (area) is determined primarily by three key factors:
1. The pre-control baseline: in general, the higher the malaria baseline in a particular area, the greater the fraction of the at-risk population that must be protected with control interventions in order to achieve a reduction in transmission to a specific threshold.
2. The magnitude of the impact of specific interventions on transmission: this may vary by type of intervention and setting. For example, the effect of ITNs and IRS will be greater where the dominant malaria vector(s) is night- and indoor-biting and indoor-resting, than in places where outdoor-biting and outdoor-resting vectors predominate.
3. The fraction of the at-risk population in the area that can be fully protected by effective control measures: the greater the fraction that is protected (or covered), the larger the reduction that can be expected.
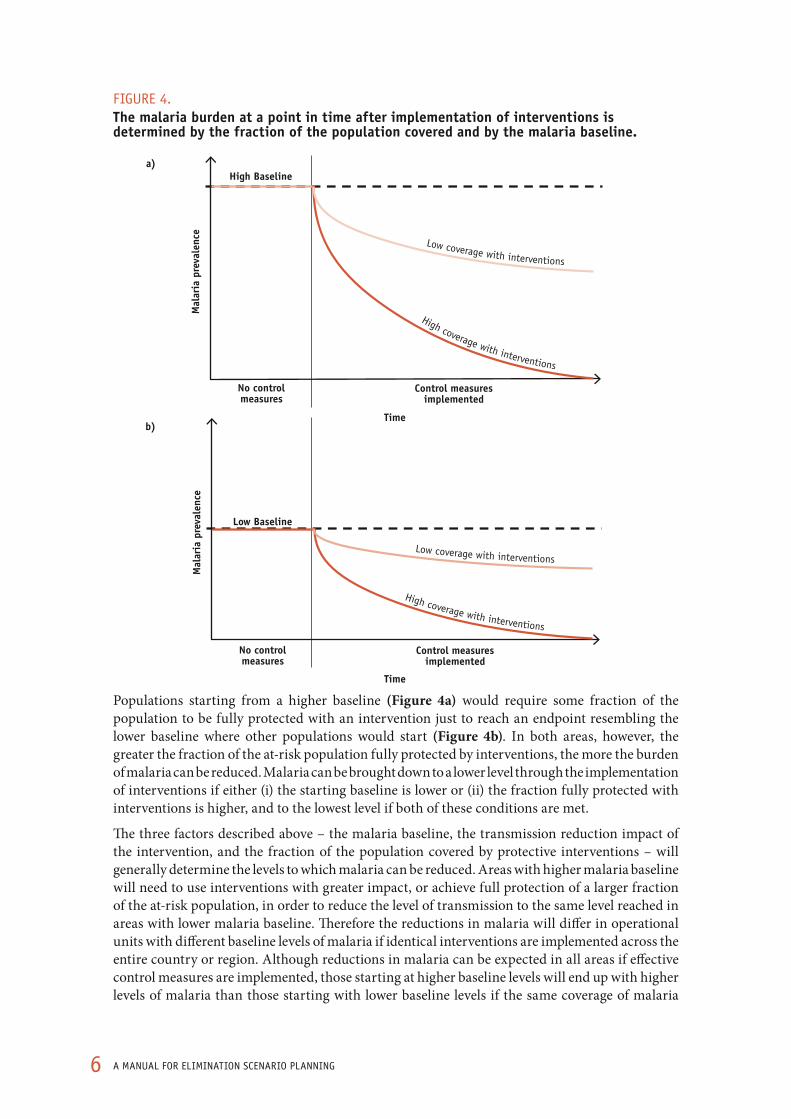
Figure 4 illustrates the effect of two these factors, the pre-control malaria baseline and the fraction of the population fully protected by effective control interventions, for two hypothetical areas.
2
6 A MANUAL FOR ELIMINATION SCENARIO PLANNING
FIGURE 4. The malaria burden at a point in time after implementation of interventions is determined by the fraction of the population covered and by the malaria baseline.
Time
High Baseline
Mal
aria
pre
vale
nce
Control measures implemented
No control measures
High coverage with interventions
Low coverage with interventions
a)
Time
Mal
aria
pre
vale
nce
Control measures implemented
No control measures
Low Baseline
High coverage with interventions
Low coverage with interventions
b)
Populations starting from a higher baseline (Figure 4a) would require some fraction of the population to be fully protected with an intervention just to reach an endpoint resembling the lower baseline where other populations would start (Figure 4b). In both areas, however, the greater the fraction of the at-risk population fully protected by interventions, the more the burden of malaria can be reduced. Malaria can be brought down to a lower level through the implementation of interventions if either (i) the starting baseline is lower or (ii) the fraction fully protected with interventions is higher, and to the lowest level if both of these conditions are met.
The three factors described above – the malaria baseline, the transmission reduction impact of the intervention, and the fraction of the population covered by protective interventions – will generally determine the levels to which malaria can be reduced. Areas with higher malaria baseline will need to use interventions with greater impact, or achieve full protection of a larger fraction of the at-risk population, in order to reduce the level of transmission to the same level reached in areas with lower malaria baseline. Therefore the reductions in malaria will differ in operational units with different baseline levels of malaria if identical interventions are implemented across the entire country or region. Although reductions in malaria can be expected in all areas if effective control measures are implemented, those starting at higher baseline levels will end up with higher levels of malaria than those starting with lower baseline levels if the same coverage of malaria

7CONCEPTUAL FRAMEwORk
control is implemented in both (Figure a). If control measures are implemented in proportion to the baseline level of malaria, one could expect all areas to achieve the same low levels under control (Figure 5b).
FIGURE 5. Protecting the same fraction of the population in operational units with different malaria baselines will result in different outcomes; achieving reductions to the same level in all units requires protecting a greater fraction of the at-risk population in units with higher malaria baseline.
Baseline levels of malaria
Medium
Medium
Low
Medium
Low
Very low
Low
Very low
Very low
High
High
Medium
High
Medium
Low
Medium
Low
Low
All areas receive equal amounts of control measures
Malaria levels under control
a)
Baseline levels of malaria
Very low
Very low
Very low
Very low
Very low
Very low
Very low
Very low
Very low
High
High
Medium
High
Medium
Low
Medium
Low
Low
Areas receive control in proportion to baseline malaria
Malaria levels under control
b)
It is important to note that this description is a simplification as it only considers two factors, the baseline transmission and the level of intervention coverage. In reality there are many complicating factors that may influence the actual reductions achieved, including the magnitude of the impact of different interventions. For example, an operational unit (area) with outdoor-biting vectors is not directly comparable to one with indoor-biting vectors, because interventions focused on reducing biting or killing mosquitoes inside the house will have limited impact in the former. The malaria burden in a particular area may vary from year to year due to varying weather patterns or unusual human movement. Such complicating factors are beyond the scope of this document, but it is important to take them into account through the process of making detailed, long-term strategic plans and for surveillance, monitoring, and evaluation of progress.
Without control, malaria prevalence will return to baseline
Reductions from the baseline achieved through implementation of malaria control in most situations do not represent permanent changes. The malaria baseline, or intrinsic malaria transmission level, is determined by environmental and socioeconomic factors that change only slowly and is usually not directly affected by malaria control measures. (Certain malaria control measures, such as elimination of all vector breeding sites through large-scale water management in a given transmission area, may have
2

8 A MANUAL FOR ELIMINATION SCENARIO PLANNING
permanent effects, but these are rarely employed.) Thus, without a change in malaria baseline through long-term changes in environmental or socioeconomic factors, or an intervention with permanent effects, these reductions must be maintained through sustained malaria control because the removal of control measures will result in a return to baseline levels (i.e. to the current baseline, which may differ from the original baseline).10
FIGURE 6. Implementing control measures will result in a reduction of malaria burden from its baseline, but removing those measures will result in a return to baseline.
Time
Low
M
alar
ia p
reva
lenc
e
Hig
h
Control measures implemented
Control measures removed
No control measures
Baseline
Figure 6 illustrates how the prevalence of malaria in an area exists at a certain baseline before, during and after control measures have been implemented. This baseline can decrease over time, for instance as a function of improving housing quality, urbanization and health systems. It can also increase due to factors such as changes in land-use, unusual weather events, or social disruption caused by war. Implementation of control activities decreases malaria from the baseline, but removing control results in a return to baseline.
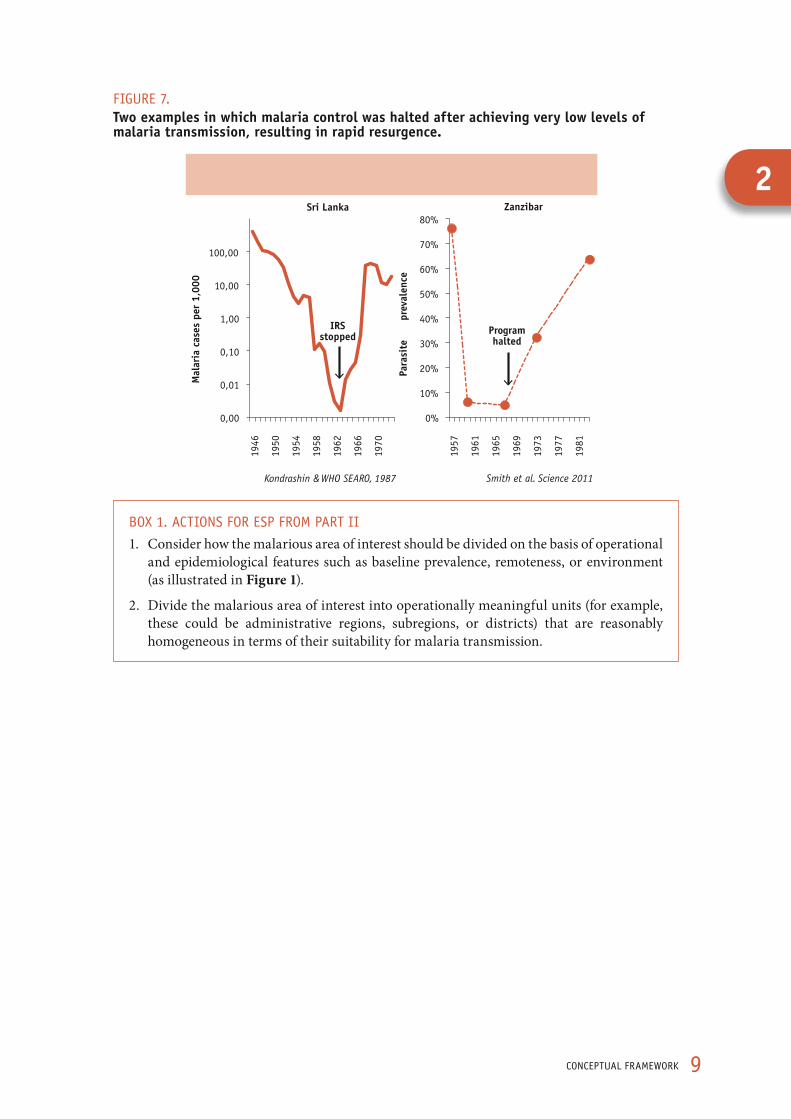
Such a pattern is not only theoretical, and has been observed in many locations where malaria control interventions have been successfully implemented and then halted. A review identified 75 different historical situations in which malaria resurged after it had been controlled.11 Many of these resurgence events occurred at least in part because the reduction of malaria to very low levels led to an impression that transmission was no longer a threat, whereas the potential for transmission still existed. Sri Lanka and Zanzibar both experienced this kind of resurgence (Figure 7).
9CONCEPTUAL FRAMEwORk
FIGURE 7.Two examples in which malaria control was halted after achieving very low levels of malaria transmission, resulting in rapid resurgence.
0,00
0,01
0,10
1,00
10,00
100,00 19
46
1950
1954
1958
1962
1966
1970
Mal
aria
cas
es p
er 1
,000
0%
10%
20%
30%
40%
50%
60%
70%
80%
1957
1961
1965
1969
1973
1977
1981
Para
site
pr
eval
ence
Kondrashin & WHO SEARO, 1987 Smith et al. Science 2011
Sri Lanka Zanzibar
Program halted
IRS stopped
BOX 1. ACTIONS FOR ESP FROM PART II
1. Consider how the malarious area of interest should be divided on the basis of operational and epidemiological features such as baseline prevalence, remoteness, or environment (as illustrated in Figure 1).
2. Divide the malarious area of interest into operationally meaningful units (for example, these could be administrative regions, subregions, or districts) that are reasonably homogeneous in terms of their suitability for malaria transmission.
2
10 A MANUAL FOR ELIMINATION SCENARIO PLANNING
Part III. Estimating the malaria baseline
Examining current and historical data on prevalence and interventions to understand the intrinsic potential for malaria transmission in each operational unit
The amount of malaria in an operational unit (area) at a given time can be measured in several ways – through a representative population-based survey of parasite prevalence, malaria deaths, or transmission measures like the entomological inoculation rate. For simplification, this discussion is largely limited to malaria parasite prevalence. Appropriate surveys include the Malaria Indicator Surveys (MIS) now routinely conducted by many countries. The observed prevalence in a survey reflects a snapshot of malaria at a given point in time.
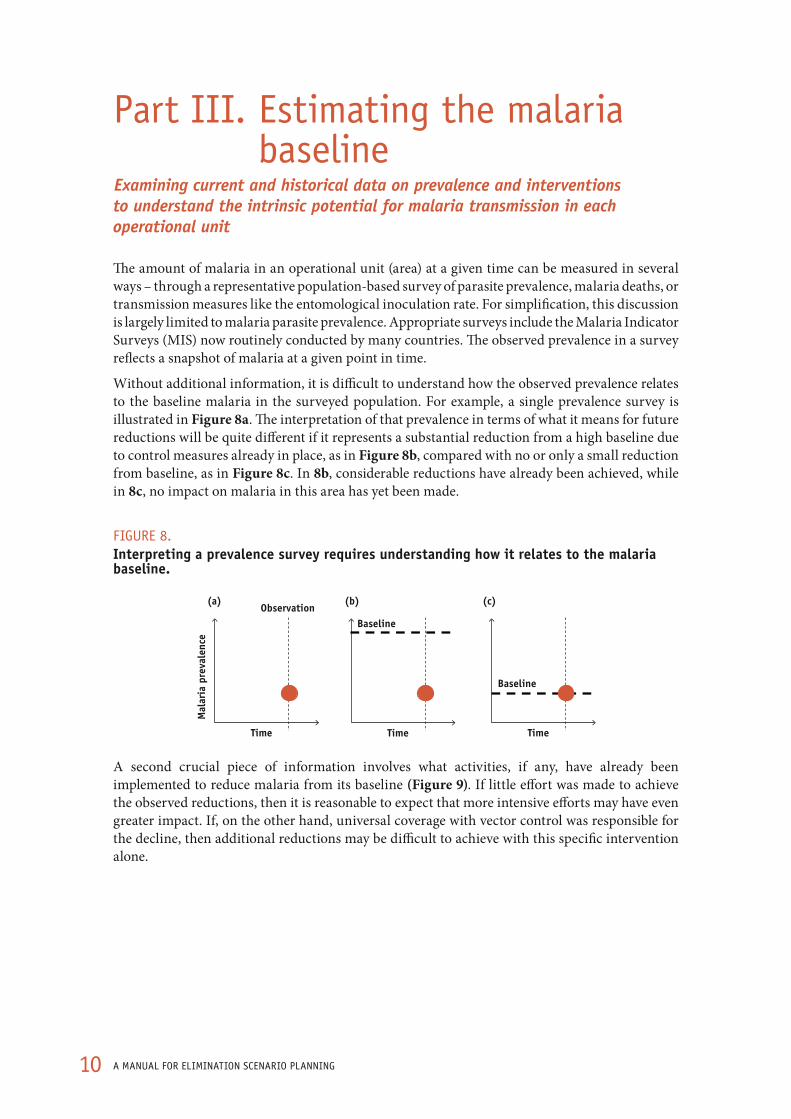
Without additional information, it is difficult to understand how the observed prevalence relates to the baseline malaria in the surveyed population. For example, a single prevalence survey is illustrated in Figure 8a. The interpretation of that prevalence in terms of what it means for future reductions will be quite different if it represents a substantial reduction from a high baseline due to control measures already in place, as in Figure 8b, compared with no or only a small reduction from baseline, as in Figure 8c. In 8b, considerable reductions have already been achieved, while in 8c, no impact on malaria in this area has yet been made.
FIGURE 8. Interpreting a prevalence survey requires understanding how it relates to the malaria baseline.
Time
Mal
aria
pre
vale
nce
Observation
Time Time
Baseline
Baseline
(a) (b) (c)
A second crucial piece of information involves what activities, if any, have already been implemented to reduce malaria from its baseline (Figure 9). If little effort was made to achieve the observed reductions, then it is reasonable to expect that more intensive efforts may have even greater impact. If, on the other hand, universal coverage with vector control was responsible for the decline, then additional reductions may be difficult to achieve with this specific intervention alone.

11ESTIMATING ThE MALARIA BASELINE
FIGURE 9. Knowledge of which interventions were implemented to reduce malaria prevalence from its baseline to current levels is important for estimating what future reductions can be achieved.
To understand what is possible, we should understand: the type and coverage levels of malaria interventions
Time
Mal
aria
pre
vale
nce
Interventions
Baseline
?
Two approaches are suggested here for calculating the malaria baseline from the observed survey data. The first method, which estimates the baseline from historical prevalence data (before any malaria control interventions were put in place), is simpler and will be most useful in areas where malaria has been extensively measured over time. The second method is more complex and relies upon outputs from mathematical models to estimate the baseline from currently observed prevalence and information on coverage achieved through vector control interventions.
Ideally, both methods should be attempted and their results compared. The results may differ in some cases, so comparing them provides a sense of the degree of uncertainty around conclusions from a single method. This uncertainty is due to the fact that it is usually not possible to measure the malaria baseline directly, as it represents a state that is no longer observable: the parasite prevalence that would exist if all malaria control measures were removed and malaria returned to a level determined by intrinsic factors related to the environment, vectors, and human behaviours in a region. These methods provide an estimate of what that baseline might be, but the accuracy of this estimate will depend greatly upon the available data and whether other background factors influencing the malaria baseline may have changed over time.
Estimating baseline from historical prevalence
If the malaria baseline were constant over time, the observed prevalence from any surveys carried out before the implementation of control measures should be representative of the prevalence to which it would return if those measures were removed. In reality, the baseline will rarely be constant and may change substantially over the course of decades, especially in areas where urbanization or land-use changes are occurring. A survey conducted immediately before the implementation of control measures is therefore the best estimate of malaria baseline (Figure 10).
3

12 A MANUAL FOR ELIMINATION SCENARIO PLANNING
FIGURE 10. Baseline can be estimated from the last prevalence survey conducted before interventions were introduced against malaria.
Time
Mal
aria
pre
vale
nce
Interventions No interventions
Prevalence surveys
Last survey before
intervention
Estimated baseline
If no such survey is available, historical prevalence surveys during earlier periods when no interventions were being implemented may be used instead, though consideration should be given as to whether the baseline may have increased or decreased over the intervening years.
This document focuses on using data on malaria parasite prevalence obtained in a cross-sectional survey of the population, rather than other routinely collected metrics like malaria case incidence or parasite prevalence in clinic attendees. Active examination of parasite prevalence in the population yields a measure of malaria which will not be affected by the complicating factors that influence reported clinical malaria incidence. These factors include whether an infected individual develops clinical symptoms, seeks treatment in a health facility, is properly diagnosed as having malaria, and that the case is properly reported from the health facility to the central authority that tracks malaria statistics.*
Ideally, a complete historical record of malaria prevalence over time would be available for each operational area. In reality, data on malaria prevalence is often scattered, available only at some times and in some places. Sources for recent measures of malaria prevalence across areas will likely include Demographic and Health Surveys (DHS), MIS, and similar nationally-representative household surveys. Peer-reviewed and/or unpublished reports may also provide useful results of prevalence surveys conducted in sub-populations, such as specific communities or schools. It is important to consider whether such surveys are indicative of prevalence throughout the population and throughout the year (as many settings have highly seasonal transmission), because baseline malaria may vary considerably as a function of the factors described earlier. Comparing surveys conducted during similar transmission seasons will minimize the effect of seasonal transmission. If no surveys can be identified for particular areas, an estimate of values can be made by comparing metrics from similar areas where surveys are available.
* In areas where the baseline parasite prevalence is very low, incidence of malaria cases identified at health facilities may be a useful measure, if the factors that affect its measurement can be taken into account.
13ESTIMATING ThE MALARIA BASELINE
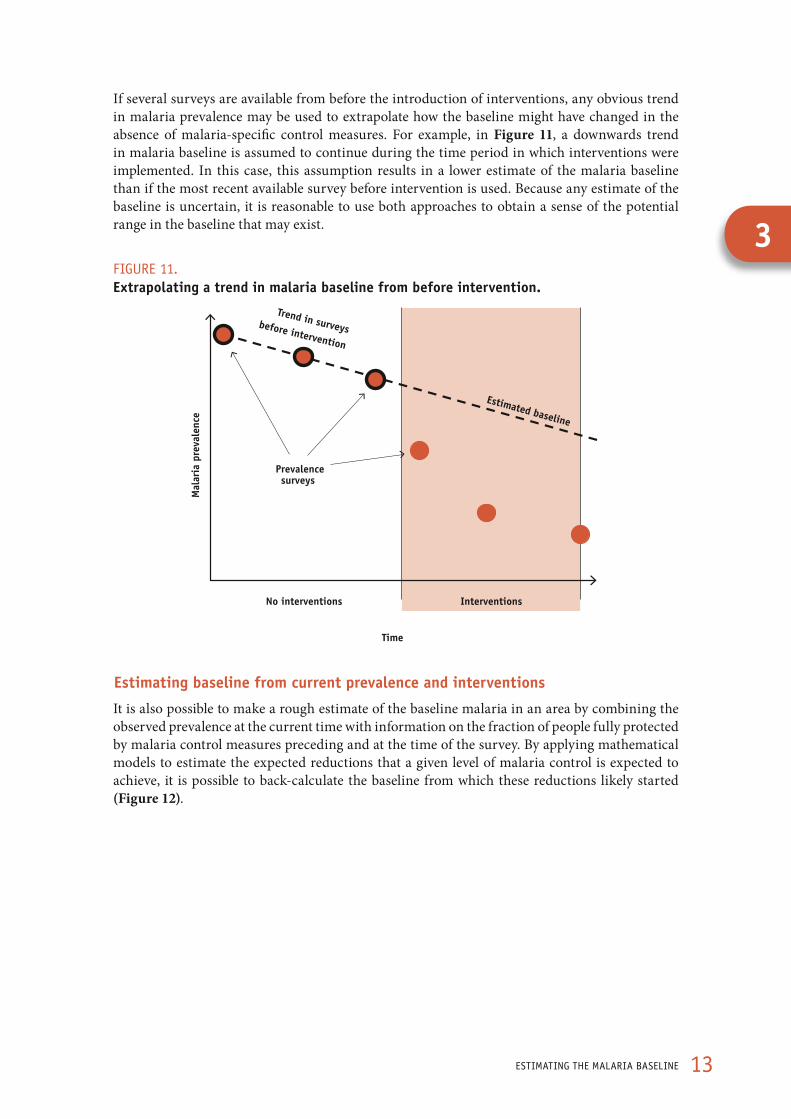
If several surveys are available from before the introduction of interventions, any obvious trend in malaria prevalence may be used to extrapolate how the baseline might have changed in the absence of malaria-specific control measures. For example, in Figure 11, a downwards trend in malaria baseline is assumed to continue during the time period in which interventions were implemented. In this case, this assumption results in a lower estimate of the malaria baseline than if the most recent available survey before intervention is used. Because any estimate of the baseline is uncertain, it is reasonable to use both approaches to obtain a sense of the potential range in the baseline that may exist.
FIGURE 11. Extrapolating a trend in malaria baseline from before intervention.
Time
Mal
aria
pre
vale
nce
Interventions No interventions
Trend in surveys before intervention
Estimated baseline
Prevalence surveys
Estimating baseline from current prevalence and interventions
It is also possible to make a rough estimate of the baseline malaria in an area by combining the observed prevalence at the current time with information on the fraction of people fully protected by malaria control measures preceding and at the time of the survey. By applying mathematical models to estimate the expected reductions that a given level of malaria control is expected to achieve, it is possible to back-calculate the baseline from which these reductions likely started (Figure 12).
3

14 A MANUAL FOR ELIMINATION SCENARIO PLANNING
FIGURE 12. Estimating the malaria baseline from a survey conducted while interventions were implemented, using the output of mathematical models.
Time
Mal
aria
pre
vale
nce
Interventions No interventions
Most recent survey
Estimated baseline
Intervention coverage
Prevalence surveys
This approach will be necessary if the only surveys available are those conducted while interventions were also being implemented. Estimating the baseline using current prevalence data can also be done even if historical survey data are also available, since trying several approaches and comparing the results may help ensure the best possible estimate.
Using this method requires two pieces of data:
1. The prevalence at a specific time (taking into account seasonal variation);
2. The fraction of the population protected from transmission by interventions up until time of survey.
This second measure is not exactly the same as the coverage measures commonly recorded during household surveys. Usually, coverage is used to describe the fraction of households or individuals who own a net, who have had their households sprayed, or who attend public health facilities when they are sick. When making predictions about malaria, it is important to recognize that these individuals may not be fully protected or cured; for example, they may not use the net they own, the insecticide may have lost potency, a person may not take a full curative dose of effective drugs, or the health facility may have a stock-out of effective drugs. In estimating the proportion of the population that is fully protected from transmission, these factors need to be taken into account. The fraction of the population fully protected from transmission is likely to be substantially lower than the fraction who own a net or whose house has been sprayed with IRS.
The fraction of an area’s at-risk population that is fully protected by malaria interventions (sometimes termed ’effective coverage’12) cannot be directly measured through surveys. It is estimated from data on typical coverage metrics, like the fraction of individuals sleeping under a net, taking into consideration all of the potential factors that may reduce the efficiency of an intervention, and making some estimate of how much the effective coverage will be reduced.
For nets, factors that reduce the effective coverage are those relating to distribution, use, and effectiveness of the nets, including missed households, nets not used correctly, damaged nets, loss of insecticide potency, and outdoor-biting mosquitoes. As illustrated in Figure 13, even small gaps in each of these areas can combine to result in a much lower fraction fully protected than would be estimated by consideration of any one factor alone.

15ESTIMATING ThE MALARIA BASELINE
FIGURE 13. Hypothetical illustration of some potential coverage gaps that determine the fraction of the population fully protected by nets.
Householdsmissed
0%
100%
Households receive nets
Net not used
Nets are used nightly
Net not protective
Insecticide maintained at effective potency and net in good condition
Vectors bite outdoors
Vectors bite indoors during
hours when nets are
used
Fraction not fully
protected by nets
Fraction fully
protected by nets
Gaps: Distribution Use Effectiveness Total
Similar calculations may be done to estimate the fraction of the at-risk population in a particular area that is fully protected by indoor residual spraying (IRS) with insecticides (Figure 14). For IRS, potential gaps may include missed communities, missed households, inadequate spraying of targeted structures, presence of mosquito resting surfaces that are unsuitable for IRS, re-plastering of houses, new construction, outdoor sleeping habits, the presence of vectors that do not bite and rest indoors, and even vector resistance to the products used for IRS.
FIGURE 14. Hypothetical illustration of some potential coverage gaps that determine the fraction of the population fully protected by IRS.
Fraction missed
0%
100%
Fraction of subregioncovered by
IRS
Refused or partially-sprayed
Households successfully
sprayed
Insecticide wears off
Insecticide is effective
Vectors bite outdoors
Vectors bite and rest indoors
Fraction not fully
protected by IRS
Fraction fully
protected by IRS
Community coverage
Household coverage Effectiveness Total Gaps:
3

16 A MANUAL FOR ELIMINATION SCENARIO PLANNING
This quantification is an estimate and not a precise measurement – for example, nets and IRS have been shown to have a community-wide protective effect when sufficient coverage is achieved; consequently, more people may be protected than those who sleep under nets or whose houses have been sprayed. However, the calculation can give an indication of the approximate proportion of the at-risk population that can be protected, and so permit estimation of the reductions in malaria that might be expected.
The panels in Figure 15 illustrate how to estimate the baseline given two pieces of data: (i) the observed malaria prevalence for a given area in the most recent malaria survey; and (ii) the estimated fraction of the population of the area that is fully protected from malaria transmission (the effective coverage). Each panel within the graphic corresponds to a different observed prevalence, such as that recorded during an MIS. Each bar within the panel indicates the estimated baseline that would exist in that place according to the fraction of the population fully protected from transmission. Values falling between those given here can be estimated according to the panel to which they fall closest. For example, if prevalence is measured as 5% when an estimated 50% of the population is protected, the baseline malaria prevalence can be estimated to fall between 27% (from the first panel corresponding to prevalence = 1%) and 36% (from the second panel corresponding to prevalence = 10%).
FIGURE 15. Estimation of the baseline prevalence for a given observed prevalence and proportion of the population fully protected from transmission. As shown in orange: if a prevalence of 40% is observed while 50% of the population is protected, the middle panel indicates that a baseline malaria prevalence of 60% is expected.
80%81%
83%84%
85%87%
88%90%
91%
70%72%74%76%78%
20%24%
29%34%
39%45%
51%57%
64%
50%53%56%60%63%67%70%74%78%
40%44%47%51%
55%60%
64%69%
74%
60%63%65%68%71%
76%
30%34%
38%43%
48%52%
58%63%
69%
10%14%
19%24%
30%36%
43%50%
58%
1%5%
10%15%
21%27%
35%43%
52%
Perc
ent
of t
he p
opul
atio
n fu
lly p
rote
cted
Observed PR = 1% Observed PR = 10% Observed PR = 20%
Observed PR = 30% Observed PR = 40% Observed PR = 50%
Observed PR = 60% Observed PR = 70% Observed PR = 80%
80%70%60%50%40%30%20%10%0%
80%70%60%50%40%30%20%10%0%
80%70%60%50%40%30%20%10%0%
83%79%
73% 80%82%85%87%
Estimated baseline prevalence
17ESTIMATING ThE MALARIA BASELINE
Where possible, it is preferable to use both of the methods described above to estimate baseline malaria in each operational unit. Where the methods reach a similar result, greater confidence can be placed in the estimated baseline. Where the methods reach different results, they may reflect a range in the estimated baseline, and the smaller or larger estimate can be used to make more demanding or more conservative estimates of what will be required to reduce malaria to very low levels. It is not necessary to know the exact prevalence in an area to make a useful analysis of the feasibility of elimination, and even a reasonable guess will permit consideration; the more precise the available data, however, the more accurate such an analysis can be.
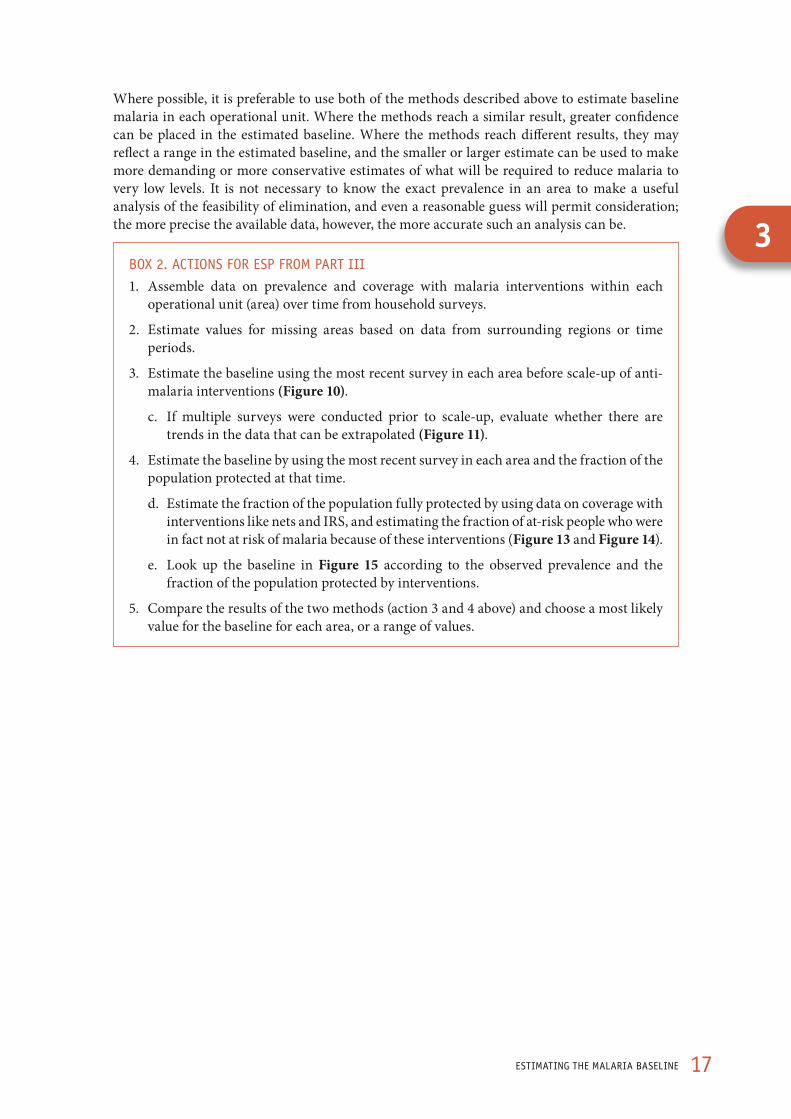
BOX 2. ACTIONS FOR ESP FROM PART III
1. Assemble data on prevalence and coverage with malaria interventions within each operational unit (area) over time from household surveys.
2. Estimate values for missing areas based on data from surrounding regions or time periods.
3. Estimate the baseline using the most recent survey in each area before scale-up of anti-malaria interventions (Figure 10).
c. If multiple surveys were conducted prior to scale-up, evaluate whether there are trends in the data that can be extrapolated (Figure 11).
4. Estimate the baseline by using the most recent survey in each area and the fraction of the population protected at that time.
d. Estimate the fraction of the population fully protected by using data on coverage with interventions like nets and IRS, and estimating the fraction of at-risk people who were in fact not at risk of malaria because of these interventions (Figure 13 and Figure 14).
e. Look up the baseline in Figure 15 according to the observed prevalence and the fraction of the population protected by interventions.
5. Compare the results of the two methods (action 3 and 4 above) and choose a most likely value for the baseline for each area, or a range of values.
3
18 A MANUAL FOR ELIMINATION SCENARIO PLANNING
Part IV. Making predictions about technical feasibility of malaria reduction
Estimating technical requirements to reduce malaria from its baseline
The prevalence of malaria is dependent on a complex dynamic web of factors including the behaviours of mosquitoes and people, land-cover and land-use, housing quality, and health system strength. This means that a certain outcome observed in one location following implementation of malaria control interventions may not be found in another setting where the same interventions are implemented.
Testing interventions through pilot studies could be done to show how malaria will respond in a particular location. However, a great deal is already known about the impact of antimalarial interventions in different contexts from previous field trial experience. It is therefore possible to extrapolate from past observations of the impact of control to estimate what will happen in a particular region under different conditions.
Extrapolating from these past results to the future in a specific area requires some kind of model. A model can be very simple: for example it might state that a certain level of vector control will always result in a 50% reduction in morbidity, or that malaria declines will always match those observed in a particular setting. But such a simple model is likely to be incorrect in many cases.
Alternatively a model can be more complex, describing the mechanics of malaria reductions in terms of the life-cycle of parasites and mosquitoes. Such models will tend to be more adaptable to different contexts because they explicitly detail how malaria transmission works. Dynamic models of this sort have long been used to guide malaria programmes, particularly for elimination. For example, during the Global Malaria Eradication Programme models were devised to predict the rate of decline in malaria that programmes should expect to see; this guidance enabled WHO and others to recognize when a programme was lagging significantly behind expectations.13
Several malaria transmission models have been developed by various researchers. To illustrate the technical feasibility of reductions in malaria from different baseline levels, a mathematical model developed at Johns Hopkins University (USA) and Imperial College (UK) is used here.18,19 The results from this model describe expected reductions in P. falciparum malaria* (see Box 3), improving upon the earlier model by incorporating a number of complexities that allow it to consistently fit empirically observed relationships. The complexities incorporated in this model include several assumptions: that people will develop immunity to malaria after exposure; that some people are bitten by mosquitoes more than others due to proximity to larval habitat, attractiveness to mosquitoes, or other reasons; and that people can be “superinfected”, or harbour multiple infections at the same time.14
Using this model to extrapolate from empirical observations provides a reasonable estimate of what can be expected to happen to P. falciparum malaria in a particular place in different scenarios. The extrapolation requires a simplification of the real world. As a result, the model output illustrated here provides a generalized sense of what will occur under different conditions. Actual programme results are likely to vary.15
* Reliable models of expected declines in P. vivax were not available when this document was written. Such models are in development and this document may be updated when they become available.
19MAkING PREdICTIONS ABOUT TEChNICAL FEASIBILITy OF MALARIA REdUCTION
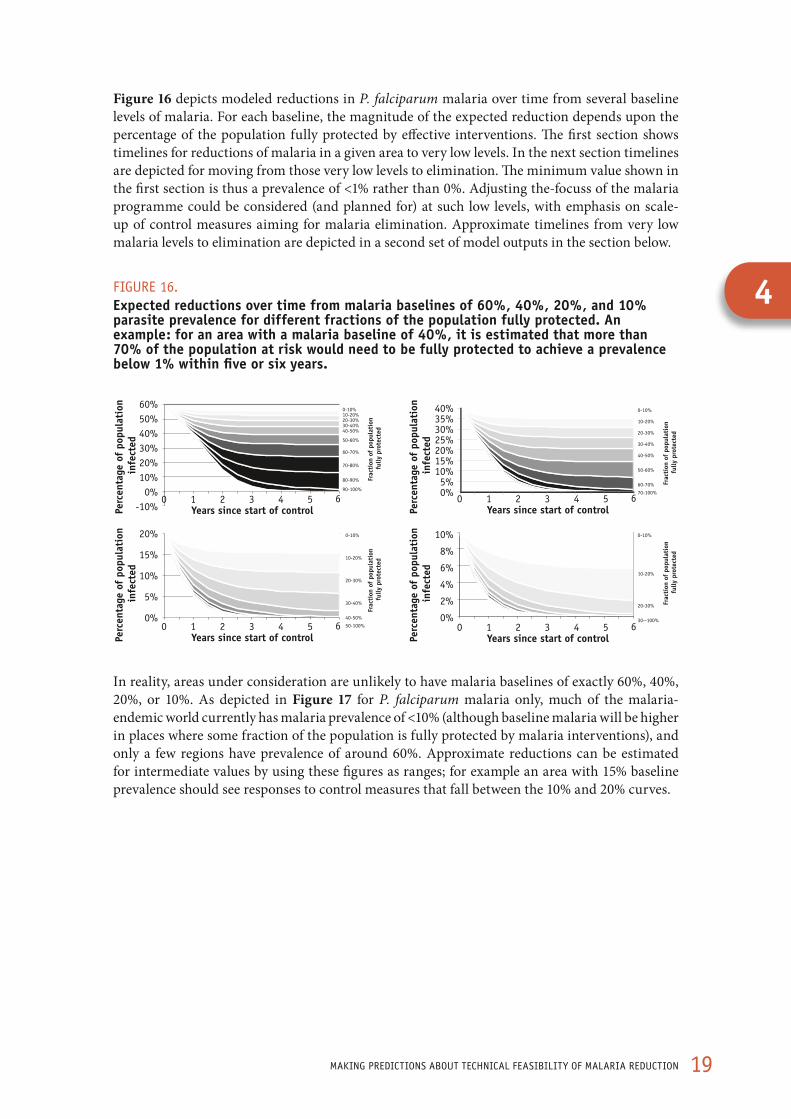
Figure 16 depicts modeled reductions in P. falciparum malaria over time from several baseline levels of malaria. For each baseline, the magnitude of the expected reduction depends upon the percentage of the population fully protected by effective interventions. The first section shows timelines for reductions of malaria in a given area to very low levels. In the next section timelines are depicted for moving from those very low levels to elimination. The minimum value shown in the first section is thus a prevalence of <1% rather than 0%. Adjusting the-focuss of the malaria programme could be considered (and planned for) at such low levels, with emphasis on scale-up of control measures aiming for malaria elimination. Approximate timelines from very low malaria levels to elimination are depicted in a second set of model outputs in the section below.
FIGURE 16. Expected reductions over time from malaria baselines of 60%, 40%, 20%, and 10% parasite prevalence for different fractions of the population fully protected. An example: for an area with a malaria baseline of 40%, it is estimated that more than 70% of the population at risk would need to be fully protected to achieve a prevalence below 1% within five or six years.
Years since start of control0
Perc
enta
ge o
f po
pula
tion
in
fect
ed
Frac
tion
of
popu
lati
on
fully
pro
tect
ed
1 62 3 4 5
60%50%40%30%20%10%0%
-10% Years since start of control0 1 62 3 4 5
40%35%30%25%20%15%10%5%0%
Years since start of control0 1 62 3 4 5
20%
15%
10%
5%
0%
Years since start of control0 1 62 3 4 5
10%
8%
6%
4%
2%
0%
Perc
enta
ge o
f po
pula
tion
in
fect
ed
Perc
enta
ge o
f po
pula
tion
in
fect
edPe
rcen
tage
of
popu
lati
on
infe
cted
0-10%10-20%20-30%30-40%40-50%
50-60%
60-70%
70-80%
80-90%
90-100%
0-10%
10-20%
20-30%
30-40%
40-50%
50-60%
60-70%
70-100%
0-10%
10-20%
20-30%
30-40%
40-50%
50-100%
0-10%
10-20%
20-30%
30--100%
Frac
tion
of
popu
lati
on
fully
pro
tect
ed
Frac
tion
of
popu
lati
on
fully
pro
tect
ed
Frac
tion
of
popu
lati
on
fully
pro
tect
ed
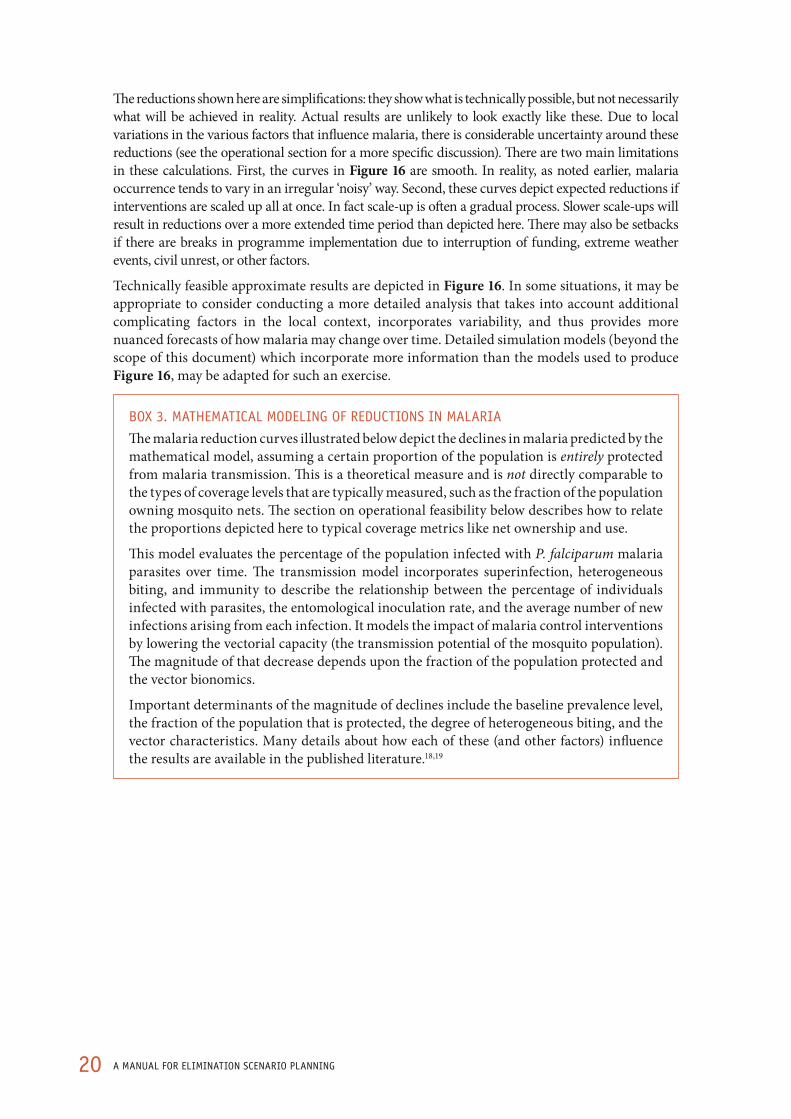
In reality, areas under consideration are unlikely to have malaria baselines of exactly 60%, 40%, 20%, or 10%. As depicted in Figure 17 for P. falciparum malaria only, much of the malaria-endemic world currently has malaria prevalence of <10% (although baseline malaria will be higher in places where some fraction of the population is fully protected by malaria interventions), and only a few regions have prevalence of around 60%. Approximate reductions can be estimated for intermediate values by using these figures as ranges; for example an area with 15% baseline prevalence should see responses to control measures that fall between the 10% and 20% curves.
4
20 A MANUAL FOR ELIMINATION SCENARIO PLANNING
The reductions shown here are simplifications: they show what is technically possible, but not necessarily what will be achieved in reality. Actual results are unlikely to look exactly like these. Due to local variations in the various factors that influence malaria, there is considerable uncertainty around these reductions (see the operational section for a more specific discussion). There are two main limitations in these calculations. First, the curves in Figure 16 are smooth. In reality, as noted earlier, malaria occurrence tends to vary in an irregular ‘noisy’ way. Second, these curves depict expected reductions if interventions are scaled up all at once. In fact scale-up is often a gradual process. Slower scale-ups will result in reductions over a more extended time period than depicted here. There may also be setbacks if there are breaks in programme implementation due to interruption of funding, extreme weather events, civil unrest, or other factors.
Technically feasible approximate results are depicted in Figure 16. In some situations, it may be appropriate to consider conducting a more detailed analysis that takes into account additional complicating factors in the local context, incorporates variability, and thus provides more nuanced forecasts of how malaria may change over time. Detailed simulation models (beyond the scope of this document) which incorporate more information than the models used to produce Figure 16, may be adapted for such an exercise.
BOX 3. MAThEMATICAL MOdELING OF REdUCTIONS IN MALARIA
The malaria reduction curves illustrated below depict the declines in malaria predicted by the mathematical model, assuming a certain proportion of the population is entirely protected from malaria transmission. This is a theoretical measure and is not directly comparable to the types of coverage levels that are typically measured, such as the fraction of the population owning mosquito nets. The section on operational feasibility below describes how to relate the proportions depicted here to typical coverage metrics like net ownership and use.
This model evaluates the percentage of the population infected with P. falciparum malaria parasites over time. The transmission model incorporates superinfection, heterogeneous biting, and immunity to describe the relationship between the percentage of individuals infected with parasites, the entomological inoculation rate, and the average number of new infections arising from each infection. It models the impact of malaria control interventions by lowering the vectorial capacity (the transmission potential of the mosquito population). The magnitude of that decrease depends upon the fraction of the population protected and the vector bionomics.
Important determinants of the magnitude of declines include the baseline prevalence level, the fraction of the population that is protected, the degree of heterogeneous biting, and the vector characteristics. Many details about how each of these (and other factors) influence the results are available in the published literature.18,19
21MAkING PREdICTIONS ABOUT TEChNICAL FEASIBILITy OF MALARIA REdUCTION
FIGURE 17. Prevalence of P. falciparum malaria in 2010.16
BOX 4. ACTIONS FOR ESP FROM PART IV
1. For each operational unit (area), choose the curve from Figure 16 that most closely matches the estimated baseline from Part III.
If an area’s baseline falls in the middle between two values, use the value on either side to give an approximate result.
2. In the figure, identify the minimum fraction of the at-risk population that must be fully protected from transmission to reduce malaria from the baseline to very low levels (<1%), and record that value for each area.
3. Identify the timeframe required to reduce malaria from baseline to very low levels in each area.
4. Does it appear to be technically possible to reduce malaria from its baseline to very low prevalence levels in all areas?
4
22 A MANUAL FOR ELIMINATION SCENARIO PLANNING
Part V. Operational feasibility of achieving reductions
Assessing whether it is operationally possible to strengthen the programme sufficiently to achieve reductions within the desired timeframe
The graphics in the previous section show that a reduction to very low levels is technically practicable if a sufficiently large fraction of the population can be protected. However, when the baseline prevalence is as high as 60% (Figure 16), the fraction of the population protected will need to be extremely high, with almost every individual protected. Operational factors may make it difficult or impossible to achieve the required levels, or in some cases to sustain them. For example, fully protecting 100% of a population with vector control may well be impossible from an operational perspective – there will always be some people who are missed by net distribution campaigns, who do not sleep under a net, whose walls are not completely sprayed with insecticide, or who come into contact with mosquitoes in ways not modifiable by a malaria control programme. These graphics are intended to demonstrate how challenging it will be to achieve desired reductions operationally and they should not be interpreted to mean that only the minimum level of protection is necessary. They provide rough estimates of achievable declines in malaria, and protecting as many people as possible from transmission will always have a higher probability of success than the minimal required coverage.
To assess the operational feasibility of achieving the technical requirements for elimination, the maximum fraction of the population that can realistically be fully protected in an area is considered. This level can then be compared with what the technical feasibility outputs indicate would be required to achieve elimination within a desired timeframe. Additionally, there may be operational constraints on maintaining interventions over time for the purpose of sustaining elimination where there is continued importation of malaria. This component of the assessment will also consider the likelihood of preventing resurgence given the importation levels estimated above.
The appropriate set of interventions that should be implemented must be tailored to the specific situation under consideration. This document uses a few commonly employed interventions involving vector control and health system strengthening as examples. Similar logic can be applied to any intervention to identify where coverage gaps exist and what fraction of the population can be fully protected if these gaps are addressed.
An assessment of operational feasibility examines whether it is possible, given the realities of infrastructure, communication, and geographical, social, political, and economic conditions, to protect or treat a sufficient proportion of the population to achieve and maintain technical goals. A comprehensive review of current usage of malaria control interventions and the capacity of both the national malaria programme and the health system will be important for detailed long-term strategic planning. In this document, some operational areas of vector control and malaria case identification and treatment are discussed to illustrate some of the key shifts that may be required for an elimination programme; more detailed guidance on the full range of operational considerations is available elsewhere.15
An increased fraction of the population fully protected by an intervention may be achieved by closing any of the estimated gaps. Careful record-keeping and repeated visits by a net distribution or insecticide spray campaign may close the gap in coverage of households reached by these interventions. Education campaigns may be successful in encouraging the correct hanging and use of nets and reducing refusals of spraying. Ensuring that redistribution or re-spraying takes

23OPERATIONAL FEASIBILITy OF AChIEVING REdUCTIONS
place on an appropriate schedule will narrow the gap in effectiveness. Finally, tailoring vector control measures to the local epidemiological context will also improve effectiveness, and the involvement of trained entomologists in the process is recommended.
Each programme needs to examine its coverage gaps to identify the set of activities that could improve the fraction of the population fully protected with control measures. It is necessary to be realistic about how much each gap can be reduced; the more accurately the fully protected fraction can be estimated, the more useful this measure will be for comparing against the technical requirements for achieving reduction. Because the combination of even small gaps in several categories will result in a significant overall gap, it is clear that achieving the high percentage of the population protected in accordance with the technical feasibility outputs may be extremely difficult, if not impossible, in many settings. For example, if reaching very low levels of malaria from a baseline of 60% would only be possible if >90% of the population were protected, this would be very difficult to achieve given that at least small imperfections exist in each of the individual components.
Coverage gaps for ITNS
Figure 13 illustrates potential coverage gaps for bednets. For each step, the current size of the coverage gap can be estimated, and how much that gap can be closed can be considered. Across all coverage gaps, the question ‘what is the highest percentage of the at-risk population that can be protected through this intervention?’ can be considered.
• Distribution may be estimated from household survey data (e.g. DHS, MIS) reporting net ownership. For a household to be fully protected, there must be sufficient nets available for all individuals to sleep under one.
• Use may be estimated from household survey data (e.g. DHS, MIS) reporting whether or not individuals sleep under nets.
• Net effectiveness is not easily measured at present from surveys, although methods for rapid evaluation are in development. The average age of nets in use may provide a reasonable proxy for net effectiveness; currently available nets have an estimated effective life of 3 years. If nets have just been distributed to a community, effectiveness can be expected to be quite high, while after three years, effectiveness will have declined as insecticide wears off or the physical integrity of the net deteriorates and holes develop.
• Vector behaviour may be assessed by entomological evaluations, though using the results to estimate the fraction of the population that may be protected by nets is not straightforward. This fraction may be estimated from existing entomological surveys, or simply varied to indicate the potential range in the fraction of the population fully protected by nets in different entomological scenarios. If this gap is ignored, it is likely that the fraction fully protected will be overestimated; on the other hand, community-wide effects of high net coverage may help to compensate for this error.
Exercise: Is the estimated maximum fraction of the population that can be protected with nets equal to or greater than the necessary fraction estimated in the previous section? If not, given the fraction of the population that it is operationally feasible to protect, to what level can prevalence be reduced?
Coverage gaps with IRS
In a similar exercise, the fraction of the population that can be protected with IRS can be estimated, considering the gaps illustrated in Figure 14.
5

24 A MANUAL FOR ELIMINATION SCENARIO PLANNING
• Community coverage can be estimated by comparing the proportion of the population living in areas sprayed in IRS campaigns with the total population living in all at-risk areas.
• Household coverage may be calculated from IRS campaign records (houses sprayed / houses in at-risk areas) or from household surveys that ask whether or not the house was sprayed.
• Insecticide effectiveness is not easily measured from surveys, although methods for rapid evaluation are in development. The average time since the house was sprayed may provide a reasonable proxy for effectiveness; if a house was very recently sprayed, effectiveness can be expected to be high, while after a year, effectiveness will have declined as insecticide wears off.
• Vector behaviour may be assessed by entomological evaluations, though using the results to estimate fraction of the population that may be protected by IRS is not straightforward. Existing entomological surveys may be used, or simply varied, to estimate the potential range in the fraction of the population fully protected by IRS in different entomological scenarios. If this gap is ignored, it is likely that the fraction fully protected will be overestimated; on the other hand, community-wide effects of high IRS coverage may help to compensate for this error.
Research on the combined effects of IRS and ITNs has begun only recently and no specific assumptions are made here about any synergistic effects between the two. However, using both control methods may be a useful means of increasing the overall fraction fully protected when individual coverage of one method cannot be increased to sufficiently high levels. ITNs and IRS are most effective against indoor-biting and indoor-resting vectors. The fraction of the population protected through vector control may be increased by adding additional interventions which target vectors in different ways (e.g. larval source management), and vectors with different behaviours.
Coverage gaps in case detection, diagnosis and treatment
Strong surveillance, case detection, diagnosis, and treatment have direct benefits in reducing mortality and severe malaria disease, but additionally can reduce transmission by diminishing the pool of infected individuals.
Estimates should be made of the fraction of all infections that are being rapidly identified and treated within each area. Symptomatic cases may receive diagnosis and treatment in a public or private health facility, or in many cases, self-treat by purchasing antimalarials in the informal sector. Regardless of the mechanism, the larger the fraction of cases that are rapidly treated effectively, the greater the potential impact on limiting onward transmission. Elimination will require vigilant oversight of all malaria case management activities nationwide by the national malaria control programme.
25OPERATIONAL FEASIBILITy OF AChIEVING REdUCTIONS
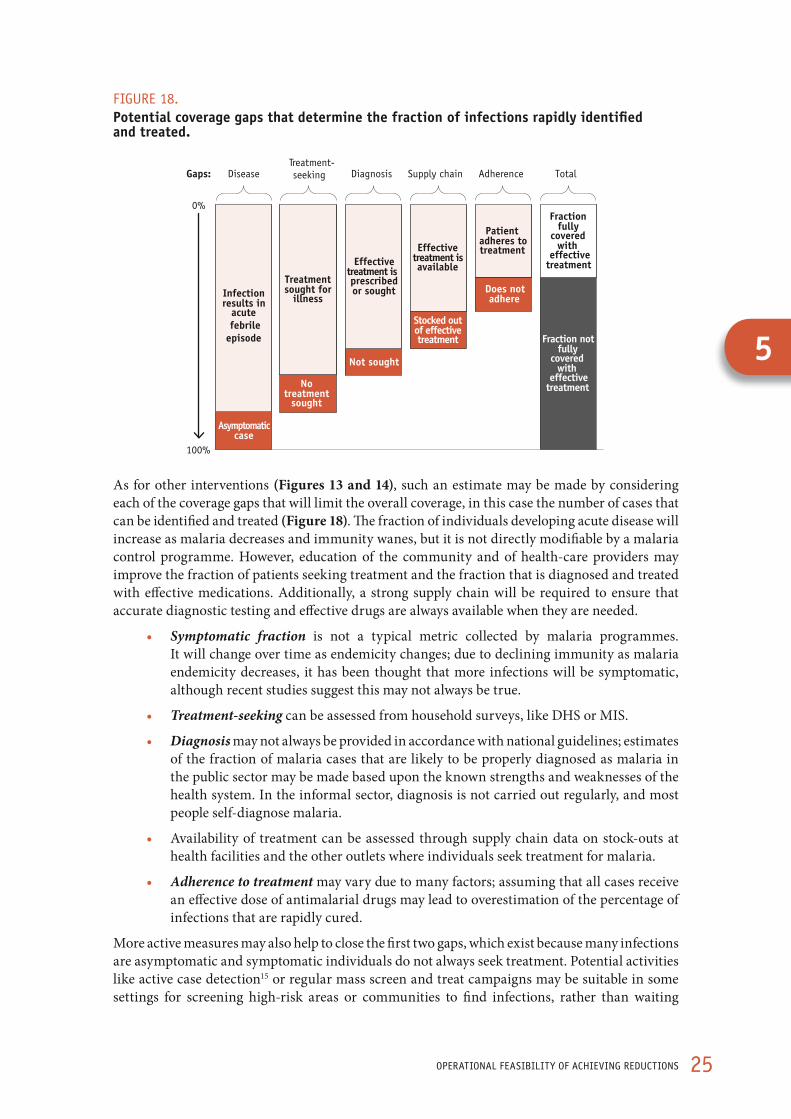
FIGURE 18. Potential coverage gaps that determine the fraction of infections rapidly identified and treated.
Asymptomatic case
0%
100%
Infection results in
acute febrile
episode
No treatment
sought
Treatment sought for
illness
Not sought
Effective treatment is prescribed or sought
Stocked out of effective treatment
Effective treatment is available
Does not adhere
Patient adheres to treatment
Fraction not fully
covered with
effective treatment
Fraction fully
covered with
effective treatment
Gaps: Disease Diagnosis Supply chain Adherence Total Treatment- seeking
As for other interventions (Figures 13 and 14), such an estimate may be made by considering each of the coverage gaps that will limit the overall coverage, in this case the number of cases that can be identified and treated (Figure 18). The fraction of individuals developing acute disease will increase as malaria decreases and immunity wanes, but it is not directly modifiable by a malaria control programme. However, education of the community and of health-care providers may improve the fraction of patients seeking treatment and the fraction that is diagnosed and treated with effective medications. Additionally, a strong supply chain will be required to ensure that accurate diagnostic testing and effective drugs are always available when they are needed.
• Symptomatic fraction is not a typical metric collected by malaria programmes. It will change over time as endemicity changes; due to declining immunity as malaria endemicity decreases, it has been thought that more infections will be symptomatic, although recent studies suggest this may not always be true.
• Treatment-seeking can be assessed from household surveys, like DHS or MIS.
• Diagnosis may not always be provided in accordance with national guidelines; estimates of the fraction of malaria cases that are likely to be properly diagnosed as malaria in the public sector may be made based upon the known strengths and weaknesses of the health system. In the informal sector, diagnosis is not carried out regularly, and most people self-diagnose malaria.
• Availability of treatment can be assessed through supply chain data on stock-outs at health facilities and the other outlets where individuals seek treatment for malaria.
• Adherence to treatment may vary due to many factors; assuming that all cases receive an effective dose of antimalarial drugs may lead to overestimation of the percentage of infections that are rapidly cured.
More active measures may also help to close the first two gaps, which exist because many infections are asymptomatic and symptomatic individuals do not always seek treatment. Potential activities like active case detection15 or regular mass screen and treat campaigns may be suitable in some settings for screening high-risk areas or communities to find infections, rather than waiting
5
26 A MANUAL FOR ELIMINATION SCENARIO PLANNING
for patients to seek treatment on their own. Such activities may be directed towards high-risk groups, such as migrant workers from endemic regions, or in areas where there is a high risk of transmission.
BOX 5. ACTIONS FOR ESP FROM PART V
1. For each operational unit (area), compare the current fraction of the at-risk population that is fully protected from transmission (as estimated in Part III) against the minimum fraction required to reduce malaria to very low levels (as estimated in Part IV). Is the currently protected fraction sufficiently high?
2. If the current fraction protected is less than what is required, evaluate the opportunities to increase it by closing operational coverage gaps. What is the maximum proportion of the at-risk population that can be protected?
3. Compare the maximum fraction that can be protected in each area against the minimum percentage required to reduce malaria to very low levels (as estimated in Part IV). Does reducing malaria to very low levels seem operationally feasible, given the effective coverage that can reasonably be achieved?

27MAkING PREdICTIONS ABOUT ThE OPERATIONAL FEASIBILITy OF MALARIA REdUCTION
6
Part VI. Making predictions about the operational feasibility of malaria reduction
Using operationally detailed models to predict potential reductions in malaria over
The mathematical model output presented in section IV illustrates what reductions in malaria are technically possible if certain percentages of the population can be completely protected. The model can be extended to incorporate assumptions about the sorts of imperfect operational realities, like actual rates of ITN use, insecticide decline, and vector biting habits, as described above. Some illustrative output is presented here to predict reductions that may be expected, applying a particular set of operational assumptions.
In Figures 19–21 several lines representing predicted changes in parasite prevalence under a variety of different operational assumptions are depicted. The assumptions are detailed in the table below.
In Figure 19, the most optimistic line (yellow) is what is depicted in the model output in the technical feasibility section for a scenario in which 100% of the population can be protected by vector control. In such a scenario, for example in which everyone sleeps under a net which works perfectly, prevalence can be reduced to very low levels in under five years from all three malaria baselines examined here. In reality, perfection is impossible: more likely, not everyone will own a net. The blue line represents a scenario in which only 80% of the people own a net, and not everyone who owns a net will use it. In such a case, reductions may appear more like the red line, which makes an additional assumption that net use falls over time. In areas starting from a lower malaria baseline of 20% or 10% prevalence, this incomplete coverage may still permit very low levels of malaria to be reached, but where the starting prevalence is high, such coverage gaps may allow significant reductions but not down to <1% prevalence.
Other operational factors will also limit the true protection that can be achieved. The green line depicts expected reductions in a scenario in which the effectiveness of insecticide on nets declines over time, and the blue line depicts one in which additionally not all mosquito bites occur inside the house during times when people are protected by nets. In each of these scenarios, significant reductions can be achieved from a high malaria baseline, but declines in insecticide effectiveness over time will result in rapid returns towards baseline unless nets are regularly renewed (LLINs) or re-treated (ITNs). In such a situation, very low levels of malaria may still be achieved from lower malaria baselines, but other interventions may also be required to do so in areas of high malaria baseline.

28 A MANUAL FOR ELIMINATION SCENARIO PLANNING
Legend, figures 19-21
Line name and colour
Loss of effectiveness due to
Hanging Use (adherence) Insecticide losing potency
Vector biting outdoors
Perfect intervention everyone covered by net everyone uses net net remains 100%
effectiveall bites taken when
people are in bed
Loss of coverage 20% not covered by net everyone uses net net remains 100%
effectiveall bites taken when
people are in bed
Loss of adherence 20% not covered by net
adherence falls with time since
distribution
net remains 100% effective
all bites taken when people are in bed
Loss of net effectiveness 20% not covered by net
adherence falls with time since
distribution
declining effectiveness as net
ages
all bites taken when people are in bed
Realistic vector and LLIN coverage
20% not covered by net
adherence falls with time since
distribution
declining effectiveness as net
ages
Some outdoor, non-bedtime biting
FIGURE 19. Estimated reductions in malaria from various baselines, incorporating a series of assumptions about how operational factors influence protection by bednets.
Perfect intervention Some people missedAdherence declines Nets lose effectivenessNot protective against all mosquitoes
time in years0
para
site
pre
vale
nce
1 62 3 4 5
60%
50%
40%
30%
20%
10%
0%
time in years0
para
site
pre
vale
nce
1 62 3 4 5
20%
15%
10%
5%
0%
5%
4%
3%
2%
1%
0%
10%
8%
6%
4%
2%
0%
time in years
para
site
pre
vale
nce
0 1 62 3 4 5time in years
0 1 62 3 4 5
para
site
pre
vale
nce
The predictions above apply to a situation in which the mosquito vector is primarily indoor-biting, like An. gambiae. In regions where an outdoor-biting vector predominates, nets will offer lesser protection. In Figure 20, the “realistic vector and LLIN coverage” blue line from the Figure 19 is presented for different vector species: An. gambiae s.s. (solid line), An. arabiensis (dotted line) and An. funestus (dashed line). According to this model output, achieving very low levels of prevalence through nets alone may prove impossible in the short term in settings where outdoor-biting vectors predominate.

29MAkING PREdICTIONS ABOUT ThE OPERATIONAL FEASIBILITy OF MALARIA REdUCTION
FIGURE 20. Estimated reductions in malaria from various baselines, comparing different vectors.
An. funestus An. Arabiensis AN. gambiae
para
site
pre
vale
nce
60%
50%
40%
30%
20%
10%
0%
time in years0 1 62 3 4 5
para
site
pre
vale
nce
20%
15%
10%
5%
0%
time in years0 1 62 3 4 5
para
site
pre
vale
nce
10%
8%
6%
4%
2%
0%
time in years0 1 62 3 4 5
para
site
pre
vale
nce
5%
4%
3%
2%
1%
0%
time in years0 1 62 3 4 5
Rapidly identifying and treating malaria infections (symptomatic and asymptomatic) may have a significant additional effect on suppressing transmission beyond that achieved through coverage with vector control alone. Such an impact can be included in the mathematical model. In Figure 21, the blue “realistic vector and LLIN coverage” line from the first graph is reproduced in the subsequent graphs for situations in which ACTs are introduced. Below, the purple line depicts reductions expected if the same net coverage as above is achieved, but with the addition of 30% of malaria cases receiving ACTs; the pink line increases the percent of cases receiving ACTs to 60%, and the orange line to 90%.
6

30 A MANUAL FOR ELIMINATION SCENARIO PLANNING
FIGURE 21. Estimated reductions in malaria from various baselines produced by achieving high coverage with nets and varying coverage of malaria cases with ACTs.
Vector control alone 30% of cases receive ACTs60% of cases receive ACTs
60% baseline 20% baseline
10% baseline 5% baseline
time in years time in years
para
site
pre
vale
nce
(%)
para
site
pre
vale
nce
(%)
para
site
pre
vale
nce
(%)
para
site
pre
vale
nce
(%)
In conclusion, the operational model outputs presented here indicate that implementing vector control measures together with improved identification and treatment of infections may prove more effective than scaling up either of these interventions alone. The outputs differ from those presented in the technical feasibility section in indicating that full coverage of very high fractions of the population may not be possible given typical coverage gaps, and with outdoor-biting vectors posing a particular problem. These outputs can give a general idea of the sorts of challenges and impacts a programme can expect. Mathematical models exist that can be tailored to specific contexts and applied to examine the impact of different combinations of interventions. Using such a dynamic model would be a good next step towards identifying which interventions would be successful in achieving elimination in specific settings.
BOX 6. ACTIONS FOR ESP FROM PART VI
1. Use Figure 19 and 20 to consider the key operational factors that influence whether malaria reductions to very low levels are truly feasible in each operational unit (area).
2. Use Figure 21 to consider how improving treatment of infections with ACTs may impact transmission in each area.
31AChIEVING ELIMINATION
Part VII. Achieving eliminationTechnical and operational requirements for moving from very low levels of malaria to elimination
The percentage of the population that is positive for malaria infection can fall rapidly in the first few years following introduction of effective preventive measures like IRS or ITNs.14, 17 As described above, full protection of a sufficiently high fraction of the at-risk population may achieve reductions in malaria from the baseline level to very low levels if the baseline is low enough or the fraction fully protected is high enough.
Achieving very low malaria prevalence and incidence is a significant accomplishment, and sustaining it over time with continued control measures will ensure a minimal burden of malaria for the population. In some areas, careful analysis may indicate that it is both feasible and strategically sensible to reduce malaria further to the point at which local endemic transmission is altogether eliminated.
Reductions in malaria from very low levels to elimination
If it is determined that it is technically feasible to reduce malaria in an area from its baseline to very low levels, the additional timelines required to achieve elimination in that area can be evaluated from a technical perspective (noting that actual operational timelines may be considerably longer). The unit of analysis for this evaluation is an operational unit (area) which is considered relatively homogeneous in terms of baseline malaria, population, and potential coverage with interventions.
The number of years required in a given area to move from very low levels of malaria to a point at which local transmission only occurs sporadically as a result of imported malaria cases can be estimated (Figure 22).18 Model outputs depict years from very low malaria (<1% prevalence) to elimination in areas with different baseline malaria prevalences, according to the population size and the fraction fully protected with interventions. For simplicity, results are presented here for a single malaria baseline of 20% parasite prevalence, but similar patterns can be expected for other baselines.
7
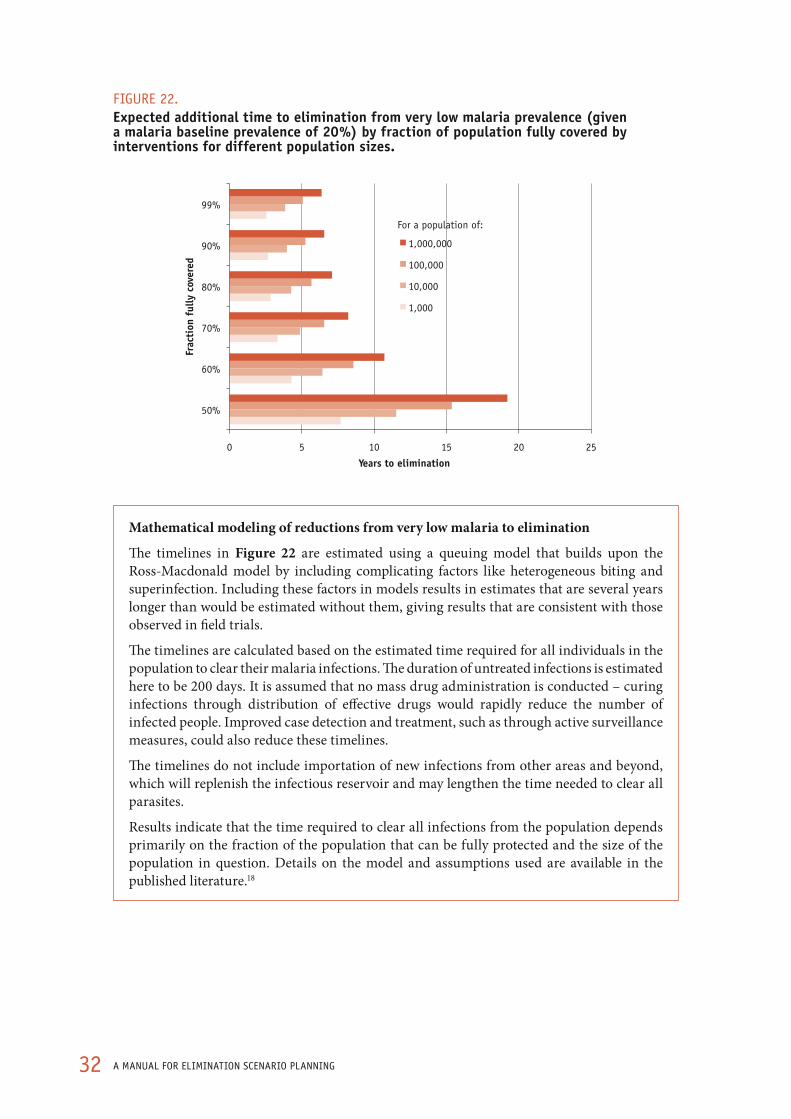
32 A MANUAL FOR ELIMINATION SCENARIO PLANNING
FIGURE 22. Expected additional time to elimination from very low malaria prevalence (given a malaria baseline prevalence of 20%) by fraction of population fully covered by interventions for different population sizes.
0 5 10 15 20 25
50%
60%
70%
80%
90%
99%
Years to elimination
Frac
tion
ful
ly c
over
ed
1,000,000
100,000
10,000
1,000
For a population of:
Mathematical modeling of reductions from very low malaria to elimination
The timelines in Figure 22 are estimated using a queuing model that builds upon the Ross-Macdonald model by including complicating factors like heterogeneous biting and superinfection. Including these factors in models results in estimates that are several years longer than would be estimated without them, giving results that are consistent with those observed in field trials.
The timelines are calculated based on the estimated time required for all individuals in the population to clear their malaria infections. The duration of untreated infections is estimated here to be 200 days. It is assumed that no mass drug administration is conducted – curing infections through distribution of effective drugs would rapidly reduce the number of infected people. Improved case detection and treatment, such as through active surveillance measures, could also reduce these timelines.
The timelines do not include importation of new infections from other areas and beyond, which will replenish the infectious reservoir and may lengthen the time needed to clear all parasites.
Results indicate that the time required to clear all infections from the population depends primarily on the fraction of the population that can be fully protected and the size of the population in question. Details on the model and assumptions used are available in the published literature.18

33AChIEVING ELIMINATION
The outputs depicted in the previous section in Figure 17 suggest that reaching very low malaria will be possible from a malaria baseline of 20% prevalence only if at least 50% of the population at risk is fully protected from transmission. Achieving malaria-free status from this baseline will thus require at least the same fraction of the population at risk to be fully protected, with elimination attained more rapidly if an even higher level of protection is reached.
Operational requirements for elimination
As with projected declines based on the percentage of the population protected, the timelines from very low malaria to elimination within an area are based on theoretical concepts of transmission and are likely to be modified by operational realities. Most malaria elimination programmes will need to build capacity or change focus in order to be successful and some will require substantial enhancement to achieve sustainable elimination – including the adoption of new and evolved strategies and new tools as they become available, and addressing service delivery issues to reach the required coverage.
Programmes have successfully completed the transition in settings where cases are limited to clearly defined foci and the following changes have been completed:15
• All malaria cases are microscopically confirmed and treated according to national policy, including cases diagnosed and treated in the private sector
• Microscopy quality-assurance systems are fully operational
• All malaria cases are notified, epidemiologically investigated and centrally registered
• Malarious areas are clearly delimited and an inventory of foci has been made
• The elimination database has been set up, including geographically-based data on foci, cases, vectors, parasite isolates and interventions
Identifying and treating greater proportions of infections will contribute to more rapid declines in transmission. Therefore, strengthening the health system to improve detection and treatment of infections (both symptomatic and asymptomatic) will make elimination easier and more sustainable. The health system clinical case management does not need to be perfect to achieve and maintain elimination, but the stronger it is, the more feasible this endeavor will be.
In an area that continues to have importation of malaria infections from its neighbours or further abroad, malaria cases will continue to occur even after the elimination of endemic transmission.20 Figure 23 illustrates the reductions that might be achieved with malaria control interventions in a hypothetical area with different levels of importation. An area with no importation would eventually see malaria disappear entirely, while in areas with continuing importation both imported malaria cases and also occasional local transmission from the imported cases (so-called “introduced” cases) should be expected. Methods for estimating importation rates are described in the next section.
7
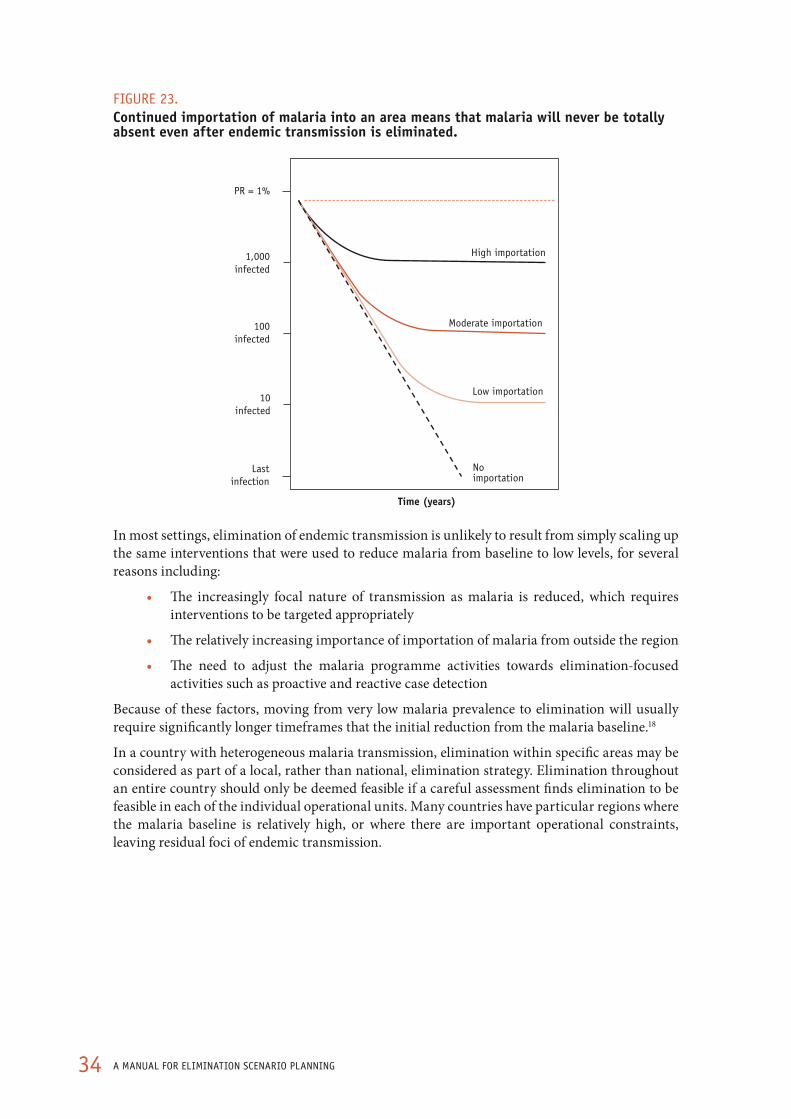
34 A MANUAL FOR ELIMINATION SCENARIO PLANNING
FIGURE 23. Continued importation of malaria into an area means that malaria will never be totally absent even after endemic transmission is eliminated.
Time (years)
No importation
Low importation
Moderate importation
High importation
PR = 1%
1,000infected
100infected
10infected
Lastinfection
In most settings, elimination of endemic transmission is unlikely to result from simply scaling up the same interventions that were used to reduce malaria from baseline to low levels, for several reasons including:
• The increasingly focal nature of transmission as malaria is reduced, which requires interventions to be targeted appropriately
• The relatively increasing importance of importation of malaria from outside the region
• The need to adjust the malaria programme activities towards elimination-focused activities such as proactive and reactive case detection
Because of these factors, moving from very low malaria prevalence to elimination will usually require significantly longer timeframes that the initial reduction from the malaria baseline.18
In a country with heterogeneous malaria transmission, elimination within specific areas may be considered as part of a local, rather than national, elimination strategy. Elimination throughout an entire country should only be deemed feasible if a careful assessment finds elimination to be feasible in each of the individual operational units. Many countries have particular regions where the malaria baseline is relatively high, or where there are important operational constraints, leaving residual foci of endemic transmission.
35AChIEVING ELIMINATION
BOX 7. ACTIONS FOR ESP FROM PART VII
1. Using Figure 23, estimate timelines to elimination from very low malaria prevalence in each operational unit (area), based on estimates of the fraction of the population that can be fully protected in practice (from Part V).
2. Consider operational factors that might extend these timelines. What operational strengthening will be required to achieve elimination in each area?
7
36 A MANUAL FOR ELIMINATION SCENARIO PLANNING
Part VIII. Maintaining eliminationTechnical and operational requirements for preventing re-emergence of malaria transmission after elimination has been achieved
After elimination has been achieved, measures and resources need to be in place and assured for the future so that it can be maintained. In assessing whether elimination is likely to be sustainable, the risks of resurgence must be taken into account. When malaria resurges, it may cause epidemics of disease and high mortality in populations which have lost immunity.11 It is therefore important to consider the sustainability of any gains against malaria before an elimination programme is implemented. A resurgence of malaria due to withdrawal of critical support can, and has proven to be, disastrous and costly – not only for the country, but also for the global community. Resurgence after achieving elimination in one country may discourage other countries from undertaking efforts to eliminate malaria, and erode the support of funding and advocacy agencies.
The sustainability of elimination in a particular area will depend on three main factors: (i) the malaria baseline, since this represents the potential for malaria transmission to recur and will lead to resurgence of malaria if control measures are removed; (ii) the sustainability of control measures; and (iii) the rate of importation of new infections into the area. If any of these factors is zero, a malaria-free status could theoretically be maintained without further interventions. Keeping the risk of malaria transmission suppressed through continued control measures will prevent resurgence, but operationally this will be challenging, not least because malaria may be not be perceived as a priority once it has been eliminated. Rapidly identifying and treating imported and introduced cases will be crucial to minimize any risk of resumption of transmission. Decisions about the proper set of interventions to be implemented post-elimination are highly context-specific; Figure 24 provides some general indications as to what may be required in different settings.
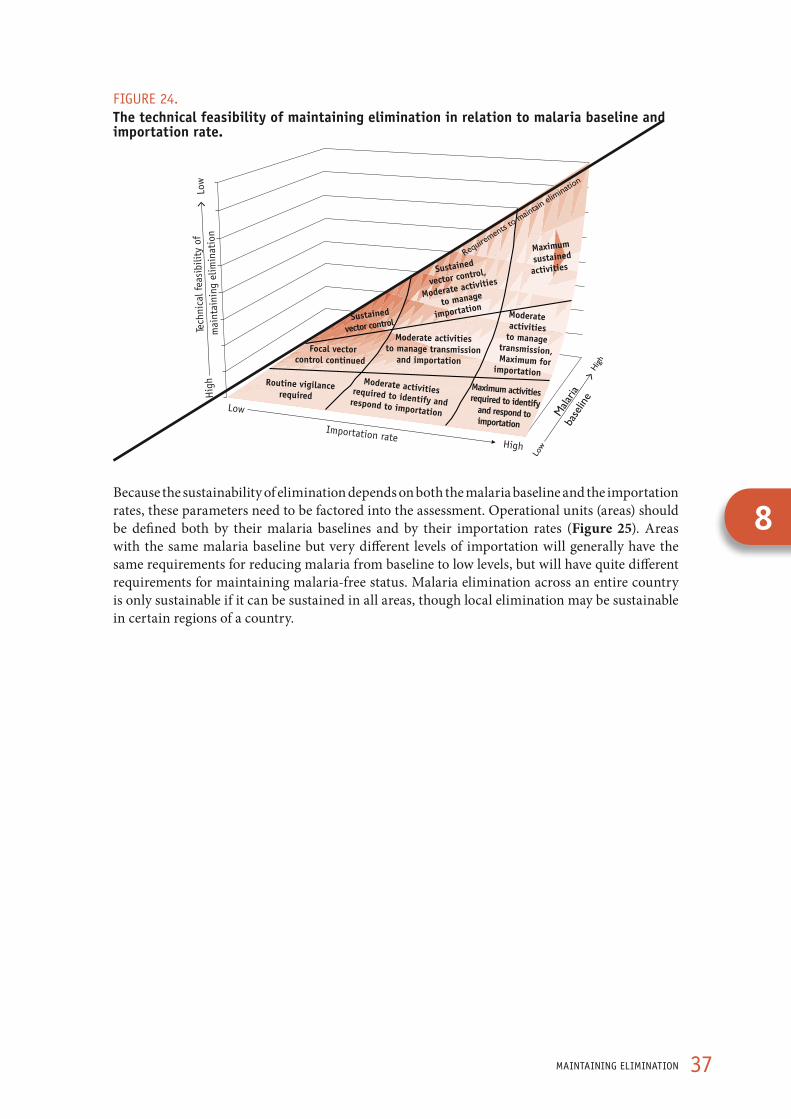
37MAINTAINING ELIMINATION
FIGURE 24. The technical feasibility of maintaining elimination in relation to malaria baseline and importation rate.
High
Low
Importation rate
Hig
h Lo
w
Tech
nica
l fea
sibi
lity
of
mai
ntai
ning
elim
inat
ion
Routine vigilancerequired
Moderate activitiesrequired to identify andrespond to importation
Maximum activitiesrequired to identifyand respond toimportation
Focal vectorcontrol continued
Moderate activitiesto manage transmission
and importation
Moderate activities
to managetransmission,Maximum for
importation
Sustained
vector control
Sustained
vector control,
Moderate activities
to manage
importation
Maximum
sustained
activities
Because the sustainability of elimination depends on both the malaria baseline and the importation rates, these parameters need to be factored into the assessment. Operational units (areas) should be defined both by their malaria baselines and by their importation rates (Figure 25). Areas with the same malaria baseline but very different levels of importation will generally have the same requirements for reducing malaria from baseline to low levels, but will have quite different requirements for maintaining malaria-free status. Malaria elimination across an entire country is only sustainable if it can be sustained in all areas, though local elimination may be sustainable in certain regions of a country.
8
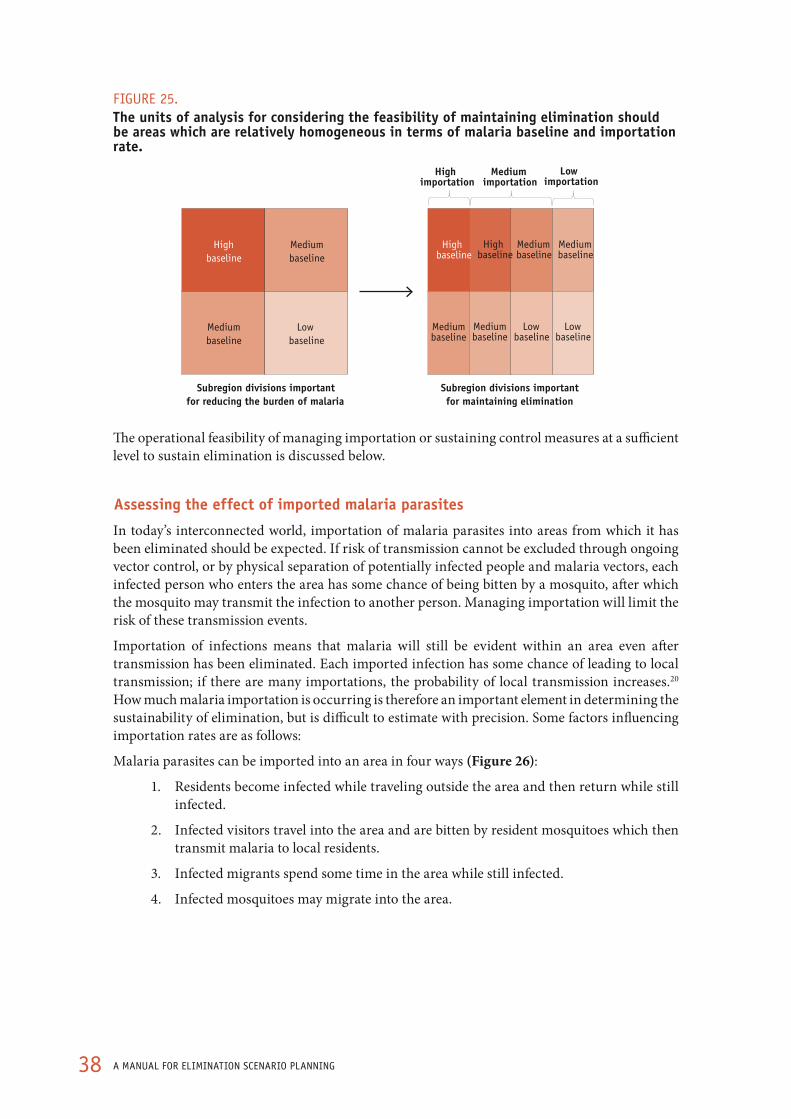
38 A MANUAL FOR ELIMINATION SCENARIO PLANNING
FIGURE 25. The units of analysis for considering the feasibility of maintaining elimination should be areas which are relatively homogeneous in terms of malaria baseline and importation rate.
High baseline
Medium baseline
Medium baseline
Low baseline
Subregion divisions importantfor reducing the burden of malaria
Subregion divisions important for maintaining elimination
High importation
Medium importation
Low importation
High baseline
Medium baseline
Medium baseline
Mediumbaseline
Low baseline
Mediumbaseline
Low baseline
High baseline
The operational feasibility of managing importation or sustaining control measures at a sufficient level to sustain elimination is discussed below.
Assessing the effect of imported malaria parasites
In today’s interconnected world, importation of malaria parasites into areas from which it has been eliminated should be expected. If risk of transmission cannot be excluded through ongoing vector control, or by physical separation of potentially infected people and malaria vectors, each infected person who enters the area has some chance of being bitten by a mosquito, after which the mosquito may transmit the infection to another person. Managing importation will limit the risk of these transmission events.
Importation of infections means that malaria will still be evident within an area even after transmission has been eliminated. Each imported infection has some chance of leading to local transmission; if there are many importations, the probability of local transmission increases.20 How much malaria importation is occurring is therefore an important element in determining the sustainability of elimination, but is difficult to estimate with precision. Some factors influencing importation rates are as follows:
Malaria parasites can be imported into an area in four ways (Figure 26):
1. Residents become infected while traveling outside the area and then return while still infected.
2. Infected visitors travel into the area and are bitten by resident mosquitoes which then transmit malaria to local residents.
3. Infected migrants spend some time in the area while still infected.
4. Infected mosquitoes may migrate into the area.

39MAINTAINING ELIMINATION
FIGURE 26. Four routes by which malaria infections may be imported into an area Reproduced from Le Menach et al.21
Of these potential entry routes, it is likely that the first and third will be of the greatest relevance to malaria programmes since in both cases, the infected person is likely to remain inside the area for the entire duration of infection. An individual, if not treated, may continue to be infectious to mosquitoes for many months to years after infection; an infected individual present in the area throughout that entire period will have many more opportunities to be bitten by mosquitoes than one who visits it for only a few days (or who makes a daytrip into the area for business). On the other hand, short-term transit visitors may have malaria infection without symptoms: they may infect local mosquitoes and move on without being noticed, giving rise to unexplained instances of local transmission for which the source of the original infection cannot be traced.
Quantification of future importation by each channel through which it occurs will be extremely valuable for detailed strategic planning of how best to eliminate malaria and maintain elimination over time. Knowing when and from where infected migrants travel into the region may highlight populations that should be proactively screened, or opportunities for reductions of infections at their source. However, quantification will require detailed data on human migration and movement patterns that may not be readily available. Nevertheless, a qualitative estimate of the importation rate can be made.
8
40 A MANUAL FOR ELIMINATION SCENARIO PLANNING
The importation rate into a particular area may be classified as:
• Very Low, if the annual estimated number of imported infections is ofn the order of a few infections per 100 000 residents
• Low, if the annual estimated number of imported infections is of the order of tens of infections (but <100) infections per 100 000 residents
• Moderate, if the annual estimated number of imported infections is of the order of hundreds of infections (but <1000) per 100 000 residents
• High, if the annual estimated number of imported infections is of the order of more than 1000 per 100 000 residents
An approximate classification for a given area may be roughly estimated on the basis of the endemicity of bordering areas or countries, assuming the free movement of people across borders. If the area shares a border with a highly endemic region, importation is likely to be frequent. Areas located on islands far from highly endemic regions, and without airports or ports, or with very tightly closed borders preventing the movement of people, are likely to have low rates of importation. As well as the rate, which is epidemiologically meaningful, it may also be important to consider the absolute number of imported infections as this value may be of significance for the total workload for the health services, and whether imported infections occur in high or low baseline level areas.
Future levels of importation are difficult to predict. For instance, achievement of malaria-free status may attract tourism, leading in turn to the construction of hotel resorts, arrival of foreign labour forces, creation of mosquito breeding sites, and renewed malaria transmission. Tourists and business travellers themselves may carry malaria parasites.
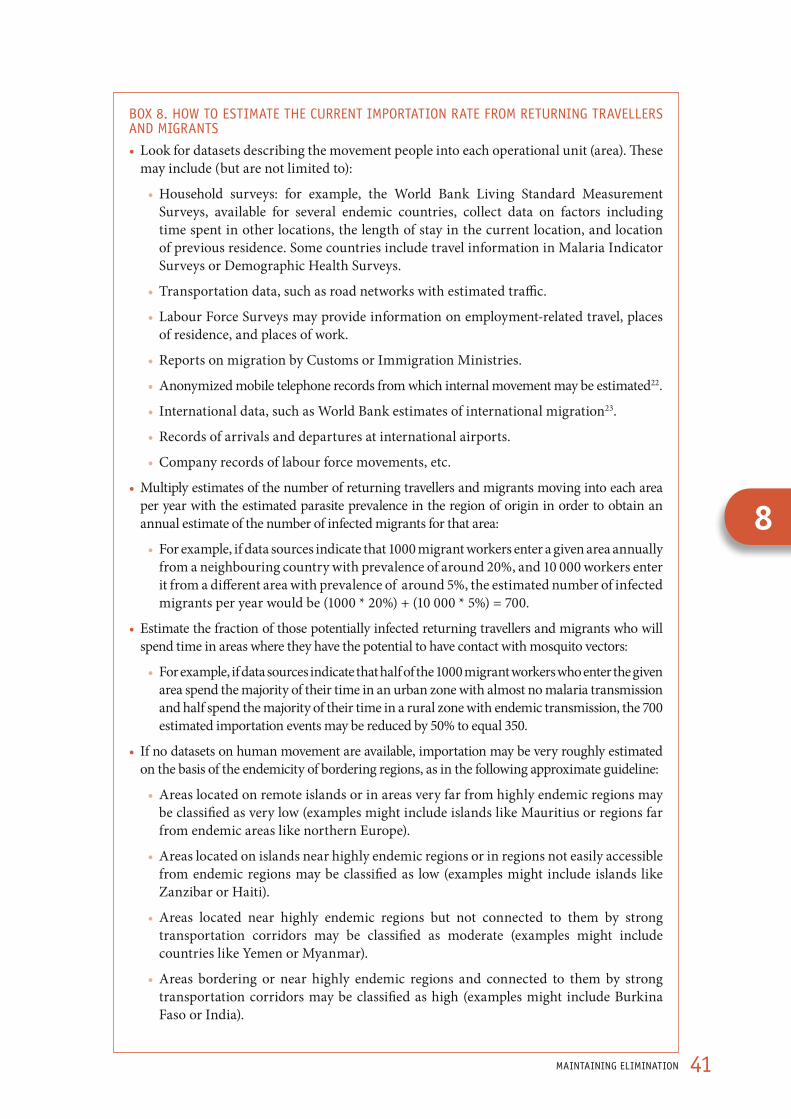
41MAINTAINING ELIMINATION
BOX 8. hOw TO ESTIMATE ThE CURRENT IMPORTATION RATE FROM RETURNING TRAVELLERS ANd MIGRANTS
• Look for datasets describing the movement people into each operational unit (area). These may include (but are not limited to):
• Household surveys: for example, the World Bank Living Standard Measurement Surveys, available for several endemic countries, collect data on factors including time spent in other locations, the length of stay in the current location, and location of previous residence. Some countries include travel information in Malaria Indicator Surveys or Demographic Health Surveys.
• Transportation data, such as road networks with estimated traffic.
• Labour Force Surveys may provide information on employment-related travel, places of residence, and places of work.
• Reports on migration by Customs or Immigration Ministries.
• Anonymized mobile telephone records from which internal movement may be estimated22.
• International data, such as World Bank estimates of international migration23.
• Records of arrivals and departures at international airports.
• Company records of labour force movements, etc.
• Multiply estimates of the number of returning travellers and migrants moving into each area per year with the estimated parasite prevalence in the region of origin in order to obtain an annual estimate of the number of infected migrants for that area:
• For example, if data sources indicate that 1000 migrant workers enter a given area annually from a neighbouring country with prevalence of around 20%, and 10 000 workers enter it from a different area with prevalence of around 5%, the estimated number of infected migrants per year would be (1000 * 20%) + (10 000 * 5%) = 700.
• Estimate the fraction of those potentially infected returning travellers and migrants who will spend time in areas where they have the potential to have contact with mosquito vectors:
• For example, if data sources indicate that half of the 1000 migrant workers who enter the given area spend the majority of their time in an urban zone with almost no malaria transmission and half spend the majority of their time in a rural zone with endemic transmission, the 700 estimated importation events may be reduced by 50% to equal 350.
• If no datasets on human movement are available, importation may be very roughly estimated on the basis of the endemicity of bordering regions, as in the following approximate guideline:
• Areas located on remote islands or in areas very far from highly endemic regions may be classified as very low (examples might include islands like Mauritius or regions far from endemic areas like northern Europe).
• Areas located on islands near highly endemic regions or in regions not easily accessible from endemic regions may be classified as low (examples might include islands like Zanzibar or Haiti).
• Areas located near highly endemic regions but not connected to them by strong transportation corridors may be classified as moderate (examples might include countries like Yemen or Myanmar).
• Areas bordering or near highly endemic regions and connected to them by strong transportation corridors may be classified as high (examples might include Burkina Faso or India).
8
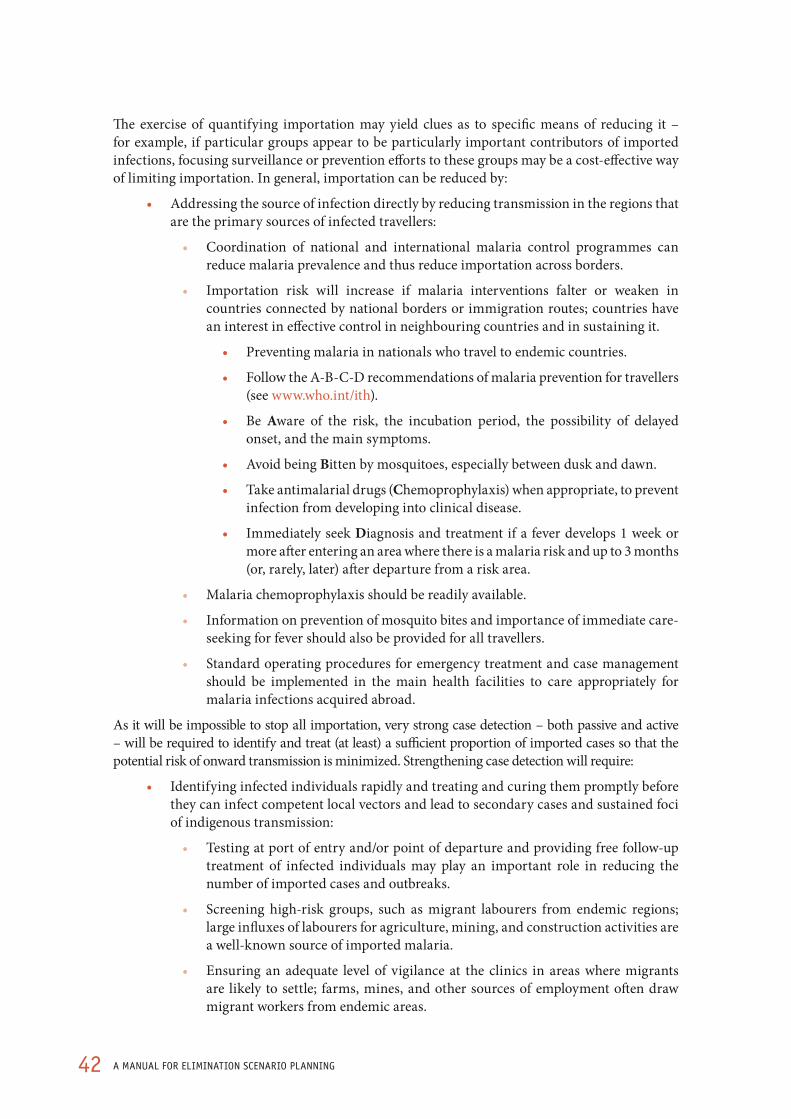
42 A MANUAL FOR ELIMINATION SCENARIO PLANNING
The exercise of quantifying importation may yield clues as to specific means of reducing it – for example, if particular groups appear to be particularly important contributors of imported infections, focusing surveillance or prevention efforts to these groups may be a cost-effective way of limiting importation. In general, importation can be reduced by:
• Addressing the source of infection directly by reducing transmission in the regions that are the primary sources of infected travellers:
• Coordination of national and international malaria control programmes can reduce malaria prevalence and thus reduce importation across borders.
• Importation risk will increase if malaria interventions falter or weaken in countries connected by national borders or immigration routes; countries have an interest in effective control in neighbouring countries and in sustaining it.
• Preventing malaria in nationals who travel to endemic countries.
• Follow the A-B-C-D recommendations of malaria prevention for travellers (see www.who.int/ith).
• Be Aware of the risk, the incubation period, the possibility of delayed onset, and the main symptoms.
• Avoid being Bitten by mosquitoes, especially between dusk and dawn.
• Take antimalarial drugs (Chemoprophylaxis) when appropriate, to prevent infection from developing into clinical disease.
• Immediately seek Diagnosis and treatment if a fever develops 1 week or more after entering an area where there is a malaria risk and up to 3 months (or, rarely, later) after departure from a risk area.
• Malaria chemoprophylaxis should be readily available.
• Information on prevention of mosquito bites and importance of immediate care-seeking for fever should also be provided for all travellers.
• Standard operating procedures for emergency treatment and case management should be implemented in the main health facilities to care appropriately for malaria infections acquired abroad.
As it will be impossible to stop all importation, very strong case detection – both passive and active – will be required to identify and treat (at least) a sufficient proportion of imported cases so that the potential risk of onward transmission is minimized. Strengthening case detection will require:
• Identifying infected individuals rapidly and treating and curing them promptly before they can infect competent local vectors and lead to secondary cases and sustained foci of indigenous transmission:
• Testing at port of entry and/or point of departure and providing free follow-up treatment of infected individuals may play an important role in reducing the number of imported cases and outbreaks.
• Screening high-risk groups, such as migrant labourers from endemic regions; large influxes of labourers for agriculture, mining, and construction activities are a well-known source of imported malaria.
• Ensuring an adequate level of vigilance at the clinics in areas where migrants are likely to settle; farms, mines, and other sources of employment often draw migrant workers from endemic areas.

43MAINTAINING ELIMINATION
• Ensuring rapid response to outbreaks in case surveillance fails to prevent transmission.
Sustaining vector control
In theory it would be possible to maintain a particular target state by indefinitely continuing the same level of protection that achieved it. For example, if a fraction fully protected of 60% was required to achieve elimination, maintaining coverage so that 60% of the population was fully protected indefinitely would theoretically ensure that malaria did not re-emerge. In practice, operational constraints are likely to intervene. Maintaining vector control with IRS or nets will require:
• Redistributing or retreating nets or continuing IRS campaigns at the required frequency
• Delaying the development of resistance to insecticides and monitoring the potential evolution of outdoor biting/other vector issues
• Sustaining funding for continued vector control despite the apparent absence of malaria
• Sustaining population support for chemical interventions
The three strategies – maintaining vector control and environmental management, reducing importation, and identifying and treating cases rapidly – all have their place in sustaining elimination. It is important to consider whether sufficient combinations of these three strategies can be sustained over time to minimize the risk of resurgence. Essentially, as long as the potential for malaria transmission and the rate of importation remain unchanged, maintaining elimination should be expected to require the same strength of surveillance activities as achieving it in the first place. Vigilance remains important, as temporary fluctuations in malaria transmission potential can occur locally and rapidly due to human interventions and weather fluctuations.
BOX 9. ACTIONS FOR ESP FROM PART VIII
1. As necessary, divide the area under consideration into smaller operational units (areas) that have roughly homogeneous rates of importation of new infections from abroad (Figure 25).
2. Make a rough estimate of the infection importation rates within each area.
3. Consider what operational strengthening is required to reduce or manage the threat of importation in each area.
4. Consider the operational feasibility of maintaining vector control measures even after elimination has been achieved.
8
44 A MANUAL FOR ELIMINATION SCENARIO PLANNING
Part IX. Assessing financial feasibility
Estimating whether sufficient funding can be secured for the measures needed to achieve elimination, and maintained over time to sustain it
Assessing costs required to achieve very low malaria from baseline levels
This section focuses on the question of whether it is feasible to secure the additional funds required to close coverage gaps and protect a sufficiently high fraction of the at-risk population in order to reduce malaria transmission from baseline to very low (or zero). It will be operationally possible to close many of the gaps at least partially, but doing so will usually entail additional costs for the malaria programme.
As an example, an assessment may determine that the fraction of the at-risk population fully protected with nets can be increased by expanding the reach of distribution programmes, encouraging net hanging and use through education campaigns, and conducting follow-up redistribution campaigns at regular (e.g. three-year) intervals. Each of these activities is operationally practicable, but each also has a cost requirement that must be met. Similarly, the fraction of malaria infections that are rapidly identified and treated may be increased by encouraging the population to seek treatment for fever in public health clinics through advertisements and posters, conducting trainings for health workers to encourage adherence to guidelines for treatment and diagnostic testing, and ensuring that sufficient diagnostic supplies are available in health facilities as well as consistent stocks of ACTs for treatment of positive cases.
Determining whether closing such operational gaps is financially feasible requires a full and realistic accounting of the costs that will be needed for each activity. Potential costs include:
• Commodities, including such necessary materials as nets, insecticides, diagnostic supplies, medical supplies, and antimalarial drugs
• Personnel, including additional health workers, spray technicians, net distributors, educators, IT staff, and university level specialists in public health, parasitology and entomology, etc.
• Equipment, including additional computer, health facility, diagnostic, or office requirements
• Travel, including the cost of vehicles and fuel
• Training, including the cost of meetings, conference space, and associated supplies
• Other expenses required to meet the operational needs of closing coverage gaps

45ASSESSING FINANCIAL FEASIBILITy
BOX 10. hOw TO ESTIMATE ThE COSTS OF CLOSING COVERAGE GAPS
Closing the coverage gaps exemplified in the operational feasibility section will involve additional financial costs. For LLINs, IRS and case management, these may include the following:
Nets
• Distribution improvements require increasing the magnitude or frequency of campaigns. Each will involve commodity costs for additional nets, personnel costs for additional workers, and travel costs for transporting the nets.
• Use may be improved through education campaigns or such strategies as directly hanging nets in houses; each strategy will necessitate personnel, travel, training, and equipment costs.
• Net effectiveness should be considered when planning what nets to purchase; cheap nets may ultimately prove to be more expensive if they must be replaced at more frequent intervals than costlier nets (for example, a US$ 1 net that must be replaced every second year would prove more expensive over time than a US$ 2 net that only needs replacement every five years). It is important to take into consideration local housing conditions when predicting net wear and tear.
IRS
• Community coverage improvements require increasing the magnitude, frequency, and/or quality of campaigns. Each will involve commodity costs for additional insecticide, personnel costs for additional workers, and transportation costs.
• Household coverage may be improved through education campaigns to inform home owners of the importance of having houses sprayed, or trainings to ensure spray technicians know to make return visits and cover all walls; each will entail personnel, training, and commodity costs.
Identifying and treating infections
• Treatment-seeking may be improved through education campaigns, which entail personnel and training costs.
• Diagnosis requires availability of reliable diagnostics, that health-care workers know how to interpret and follow up the laboratory test results, and that febrile individuals are aware of the importance of being tested; improving each of these areas may involve commodity costs and rolling out education and training campaigns.
• Availability of treatment may be improved by strengthening supply chain management; having personnel trained to monitor stocks, forecast demand, and order commodities appropriately will be crucial.
• Surveillance capacity may be strengthened by implementing active measures to complement passive surveillance, including weekly active case detection in high risk areas, seasons, or populations (costs will involve personnel, training, transportation, and commodities) and ensuring a strong information infrastructure including GIS capacity to analyse data and identify high risk locations over time.
9

46 A MANUAL FOR ELIMINATION SCENARIO PLANNING
Assessing costs involved in moving from very low malaria levels to elimination
As described in the operational section, moving from very low malaria prevalence to elimination involves an adjustment of the malaria programme activities, with greater emphasis on extremely comprehensive case detection and investigation to determine for each case the origin of infection. Surveillance activities must be intensive and, as depicted in the technical assessment section, vector control activities may need to reach nearly universal coverage in areas with moderately high baseline levels of malaria. Both of these activities are labour and commodity intensive, requiring significant resources. Achieving elimination is therefore likely to necessitate an enhanced level of funding through at least the short-to-medium term.
Little contemporary evidence is available to indicate how financial requirements will change for a programme working towards elimination. Shifts in costs under the Global Malaria Eradication Programme of the 1950s and 1960s were observed across 33 countries,24 with programmatic costs increasing by 87% on average during the elimination programme, although there was wide variation. A contemporary comparison of five regions, including two provinces of China, Mauritius, Swaziland, and the islands of Zanzibar, found that per capita costs had increased or would increase from control to elimination by a range from 30% in Zanzibar to 182% in Swaziland; most of this difference appeared to be related to the baseline costs of the control programme.5
The composition of these increases varied from region to region, depending upon the strengths and weaknesses of the baseline control programme. In Swaziland and the Chinese provinces, the greatest increase in costs was due to improvements in surveillance, including the introduction of active case detection or screening in identified risk areas. Other cost categories necessitating varying levels of increased financing included prevention, diagnosis, and case management.5
Clearly the expected change in cost structure required to move from very low malaria to elimination will vary considerably from place to place. Detailed assessment of the current and future operational requirements to achieve elimination will highlight the key coverage gaps that must be closed, each of which will have associated costs.
In general, for an elimination programme sufficient available funding must be ensured to maintain capability to do the following:15
• Detect and cure all malaria patients
• Interrupt local mosquito-borne malaria transmission
• Identify and clear up residual foci of malaria transmission
• Develop and implement vigilance systems for maintaining the malaria-free status
• Prevent re-establishment of transmission despite continuing importation of parasites
• Collaborate with neighbouring endemic countries to reduce malaria transmission in the region
Assessing costs of maintaining elimination
Financial feasibility depends on whether sufficient funds can be secured to implement the enhanced operational programme necessary to achieve elimination, and the ability to sustain sufficient funding to maintain a post-elimination programme (as part of the general health services) that is strong enough to prevent resurgence. While it is likely that some malaria activities can be scaled back once elimination has been achieved, many interventions (particularly surveillance, diagnosis, and treatment) will need to continue for decades to ensure that imported malaria does not lead to a resurgence of transmission. Estimating the ongoing costs of preventing reintroduction is therefore central to determining whether sustainable elimination will be financially feasible.

47ASSESSING FINANCIAL FEASIBILITy
In five regions for which the annual costs of maintaining elimination were considered,5 annual expenditure after eliminating malaria was generally expected to be lower than the cost of achieving elimination. However, regions with high rates of importation were found to require both measures to identify and treat imported cases and to continue to suppress the risk of malaria transmission from baseline. The need for continuing such activities indefinitely may mean that no direct cost savings will result from elimination, though indirect financial gains can be expected.
In general, costs of maintaining elimination may include:
• Strong surveillance systems, including both passive and active measures to rapidly identify and treat any imported and introduced cases
• Vector control in areas where risk of transmission is high to ensure that any imported infections that are missed by surveillance do not result in outbreaks
• Education campaigns to remind the population of the continued threat of malaria despite its absence as a cause of morbidity and mortality
• In some cases, suppression of importation either through screening of migrant populations or working with neighbouring regions to reduce importation at its source
Dependence on international donor funding in many countries means that the ability to continue investing in malaria will be highly contingent upon the ability to secure substantial foreign aid. Securing a sufficient level of funding is likely to become increasingly difficult as malaria recedes as an obvious public health problem, even though resurgence remains a threat. With tight budgets and a vanishing impact of malaria on the health and wellbeing of its population, it will inevitably become difficult to protect malaria funding from diversion to other needs. Even if a ministry of health is committed to continued support for malaria programmes, donors are likely to begin prioritizing funding for diseases and other issues that have a more direct and immediate impact on public welfare, unless the counterfactual case regarding lives that would be lost if funding were removed is clearly articulated. Donor aid can be extremely volatile, a serious challenge for sustaining the strong surveillance and treatment systems required to maintain elimination over time; malaria can easily resurge in areas with high baseline if funding for key control and surveillance activities slips for even a year or two, as occurred in Rwanda in 2010.25 This volatility highlights the need to encourage increases in spending by endemic countries on malaria specifically and on health and health systems more generally.
The long-term feasibility of elimination may therefore depend upon whether innovative solutions to the challenge of malaria programme financing can be found. If new financing methods can provide a reliable foundation for malaria programme funding, the pressure to secure traditional funding can be reduced and the impact of withdrawal of traditional funding sources can be mitigated. Also, a strong foundation of steady funding through innovative sources would help ensure the maintenance of essential malaria activities, such as surveillance and vector control in known “hot spots.” If innovative financing can be secured for those core interventions deemed necessary to prevent resurgence, then an annual drop in funding devoted to less essential activities will not impose a serious risk. Programmes should also seek to optimize operations to ensure that available funds have maximum impact.
Appropriate financing approaches are highly context dependent, but some options might include:
• Earmarked taxes: Taxation is the basis of the UNITAID model, an international facility operating since 2006 that uses revenues from an airline ticket tax to purchase drugs for HIV/AIDS, TB and Malaria. An airline tax is an attractive funding source because it is based on a steady, predictable form of revenue and because the tax is progressive — impacting higher income people the most. Another example of tax-based financing for health is the “black lung tax,” an excise tax on the purchase of coal that is used to
9
48 A MANUAL FOR ELIMINATION SCENARIO PLANNING
compensate miners suffering from black lung disease. A malaria tax would follow the same principle: just as coal companies contribute to the burden of black lung disease, travellers contribute to the risk of malaria resurgence and therefore would be required to contribute to the cost of mitigating that risk through a modest tax.
• Endowment or Trust Fund: A core level of endowment, established with funds from donors and governments, is not used for direct funding, but is instead invested to generate interest income that is used to fund recurring costs. Depending on the size of the endowment, the level of returns and the costs that need to be covered, the interest income may go partly to meet recurring costs and partly to reinvestment in the core endowment fund. Examples include an endowment funding infrastructure and economic development projects in Tuvalu, the Bhutan Trust Fund, which supports essential drugs and vaccines, and the USAID Profamilia endowment in Colombia which funds health facility upgrading.
• Emergency Debit Fund: Although some donors may be unwilling to fund recurring costs once malaria has been eliminated, they may be more likely to contribute to the costs of controlling a malaria outbreak. A financing option that could interest donors is an “emergency debit fund,” similar to a bank account, that can be drawn on to prevent or control outbreaks. The fund could be donor-managed and, as with a bank account, a certain portion of the fund could be lent out or used for other purposes by the donors. The funds in the account could be spent under defined conditions, such as demonstrated good management of other government funds and a clear, acute need for emergency funding to prevent or control malaria resurgence.
• Regional Funding Pool: The residents of an eliminating region are not the only beneficiaries of elimination. Neighbouring regions or those with a great deal of migration will also see importation reduced, and thus a lowered risk of malaria transmission. Neighbours that stand to benefit from sustained elimination may be willing to contribute to a regional funding pool. Funds from regional partners could either be donated annually to cover revolving costs, or used towards the endowment fund or emergency debit fund discussed above.
Novel financing schemes may be useful considerations even for those programmes where elimination is not deemed to be feasible; improving the continuity of funding is an important objective for all endemic countries.
Does elimination make financial sense?
If it is determined that elimination is financially feasible, a final consideration involves whether spending these funds on malaria elimination makes sense given the competing health priorities of the country. In most settings, malaria elimination should not be attempted for purposes of cost saving. Although there is a general conception that elimination will prove cheaper than continued malaria control in the long run, the fact that strong surveillance and response capacity must be implemented in any region where an intrinsic risk of malaria transmission remains will mean that considerable funding for an anti-malaria programme will be needed for years after elimination. The estimated costs of elimination should be weighed against other ways of using the funds, as well as the broader benefits (including financial) expected to result from elimination. Elimination will represent a landmark achievement, but where resources are very limited, it may not make sense financially as a short-term goal.

49ASSESSING FINANCIAL FEASIBILITy
BOX 10. ACTIONS FROM PART IX
1. For each operational unit (area), estimate the cost of strengthening the operational gaps as needed to achieve elimination (Box 9).
2. For each area, estimate the cost of maintaining sufficient programmatic measures to prevent the resurgence of transmission after elimination.
3. Assess whether it is feasible to secure the necessary financing and sustain it over time.
4. Explore whether there are innovative financing mechanisms that could allow decreased dependence on donor funding over time, or otherwise improve the sustainability of funding.
5. Consider whether the costs of elimination make sense given the expected benefits and the other ways in which the funds could be spent.
9
50 A MANUAL FOR ELIMINATION SCENARIO PLANNING
Part X. SummationSynthesizing outputs from the feasibility assessment and drawing conclusions
The assessment of whether elimination is a feasible goal for any malaria-endemic country or area will involve addressing the following questions:
Technically,
• What would technically be required to reduce malaria to very low levels?
• What would technically be required to reduce local malaria transmission from very low levels to zero?
• How long would it take to reduce transmission to zero?
• Is achieving and sustaining a malaria-free status technically feasible?
Operationally,
• Can the technical requirements for reducing malaria to very low levels be achieved operationally?
• What are the existing operational gaps that will need to be closed?
• What would be required operationally to reduce malaria from very low levels to zero?
• What would be the operational requirements for maintaining the gains over time?
• Is achieving and sustaining an absence of malaria transmission operationally feasible?
Financially,
• What would be the cost of the operational changes required to reduce malaria to very low levels?
• What would be the cost of the operational changes required to reduce malaria from very low levels to zero?
• What would be the costs of maintaining an absence of malaria transmission over time?
• Is achieving and sustaining an absence of malaria transmission financially possible?
• Given these costs, are the benefits of elimination great enough to justify the expense?
• How will funds be secured for the malaria programme over time, whether it attempts to eliminate or aims to control malaria?
Next steps
If, after careful assessment, elimination is considered to be technically, operationally, and financially feasible, and estimated timelines are deemed acceptable, the next step will be to conduct a more detailed strategic national planning exercise. In many situations, elimination may be practicable in some areas of a country but not others. In this case, stepwise progressive elimination by specific areas (operational units) in turn may be a useful strategy.
51SUMMATION
10
If the assessment indicates that elimination (in operational units or across the entire area under consideration) does not seem feasible for any of the reasons discussed, intermediate goals short of elimination could be set for the control programme. Circumstances may become more favourable for elimination later as the malaria baseline changes, importation from elsewhere is reduced, or as new tools (such as a highly effective malaria vaccine) are introduced. Reducing malaria from baseline is extremely beneficial for individuals and communities regardless of whether elimination is an ultimate goal.
Finally, regardless of whether elimination is deemed feasible, consideration should be given to possible strategies for assuring long-term funding for malaria control.

52 A MANUAL FOR ELIMINATION SCENARIO PLANNING
References1. Roll Back Malaria Partnership A decade of partnership and results. Geneva, World Health
Organization, 2011.
2. Roberts L, Enserink M. Did They Really Say... Eradication? Science, 2007, 318:1544.
3. Lines J, Schapira A, Smith T. Tackling malaria today. British Medical Journal, 2008, 337:435–437.
4. Tatem, AJ et al. Ranking of elimination feasibility between malaria-endemic countries. The Lancet, 2010.
5. Sabot O et al. Costs and financial feasibility of malaria elimination. The Lancet, 2010.
6. Sachs J, Malaney P. The economic and social burden of malaria. Nature, 2002, 415:680–685.
7. Snow R W, Marsh K. Malaria in Africa: progress and prospects in the decade since the Abuja Declaration. The Lancet,2010.doi:10.1016/S0140-6736(10)60577-6.
8. Moonen B. et al. A framework for assessing the feasibility of malaria elimination. Malaria Journal, 2010, 9:322.
9. WHO Expert Committee on Malaria: twelfth report. Geneva, World Health Organization, 1966.
10. Smith DL et al. Solving the Sisyphean problem of malaria in Zanzibar. Science, 2011, 332:1384.
11. Cohen JM et al. Malaria resurgence: a systematic review and assessment of its causes. Malaria Journal 2012, 11:122.
12. Shengelia B, Murray CJL, Adams OB. Beyond access and utilization: defining and measuring health system coverage. Health systems performance assessment: debates, methods and empiricism 2003, 221–234.
13. Macdonald G, Goeckel GW. The malaria parasite rate and interruption of transmission. Bulletin of the World Health Organization, 1964, 31:365.
14. Smith DL et al. Predicting changing malaria risk after expanded insecticide-treated net coverage in Africa. Trends in Parasitology, 2009, 25:511–516.
15. Malaria elimination: a field manual for low and moderate endemic countries. Geneva, World Health Organization, 2007.
16. Gething, P.W.*, Patil, A.P.*, Smith, D.L.*, Guerra, C.A., Elyazar, I.R.F., Johnston , G.L., Tatem, A.J. and Hay, S.I. (2011). A new world malaria map: Plasmodium falciparum endemicity in 2010. Malaria Journal, 10: 378.
17. Macdonald G, Cuellar CB, Foll CV. The dynamics of malaria. Bulletin of the World Health Organization 1968, 38:743.
18. Smith DL, Hay SI. Endemicity response timelines for Plasmodium falciparum elimination. Malaria Journal, 2009, 8:87.
19. Griffin JT, Hollingsworth TD, Okell LC, Churcher TS, White M, et al. (2010) Reducing Plasmodium falciparum Malaria Transmission in Africa: A Model-Based Evaluation of Intervention Strategies. PLoS Med 7(8): e1000324. doi:10.1371/journal.pmed.1000324.
20. Cohen JM et al. How absolute is zero? An evaluation of historical and current definitions of malaria elimination. Malaria Journal, 2010, 9:213.
21. Le Menach A. et al. Travel risk, malaria importation and malaria transmission in Zanzibar. Scientific Reports, Volume: 1, Article number: 93, DOI: doi:10.1038/srep00093, 2011.

53
22. Tatem AJ et al. The use of mobile phone data for the estimation of the travel patterns and imported Plasmodium falciparum rates among Zanzibar residents. Malaria Journal, 2009, 8:287.
23. Parsons CR et al. Quantifying international migration: a database of bilateral migrant stocks. (2007). at http://www-wds.worldbank.org/external/default/WDSContentServer/WDSP/IB/2007/03/06/000016406_20070306151900/Rendered/PDF/wps4165.pdf.
24. Kaser M. Observations on the likely economic efficiency of the malaria eradication program. The economic effects of malaria eradication,1968, 145–167.
25. World Malaria Report 2010. Geneva, World Health Organization, 2010.


From Malaria Control to Malaria Elimination, A Manual for Elimination Scenario Planning.
Global Malaria ProgrammeWorld Health Organization20 avenue Appia1211 Geneva 27Switzerland
This document was printed in April 2014. Please consult the web site for any content updates (www.who.int/malaria).
ISBN 978 92 4 150333 4ISBN 978 92 4 150702 8
Related Documents