Published Ahead of Print 16 December 2008. 10.1128/AEM.02245-08. 2009, 75(4):1173. DOI: Appl. Environ. Microbiol. Gagnevin and Olivier Pruvost Sylvain Brisse, Fabien Guérin, Sébastien Boutry, Lionel Lan Bui Thi Ngoc, Christian Vernière, Philippe Jarne, pv. citri Pathotypes Xanthomonas citri Methods for Epidemiological Monitoring of Three High-Throughput Genotyping From Local Surveys to Global Surveillance: http://aem.asm.org/content/75/4/1173 Updated information and services can be found at: These include: SUPPLEMENTAL MATERIAL Supplemental material REFERENCES http://aem.asm.org/content/75/4/1173#ref-list-1 at: This article cites 71 articles, 27 of which can be accessed free CONTENT ALERTS more» articles cite this article), Receive: RSS Feeds, eTOCs, free email alerts (when new http://journals.asm.org/site/misc/reprints.xhtml Information about commercial reprint orders: http://journals.asm.org/site/subscriptions/ To subscribe to to another ASM Journal go to: on November 18, 2014 by guest http://aem.asm.org/ Downloaded from on November 18, 2014 by guest http://aem.asm.org/ Downloaded from

Welcome message from author
This document is posted to help you gain knowledge. Please leave a comment to let me know what you think about it! Share it to your friends and learn new things together.
Transcript
Published Ahead of Print 16 December 2008. 10.1128/AEM.02245-08.
2009, 75(4):1173. DOI:Appl. Environ. Microbiol. Gagnevin and Olivier PruvostSylvain Brisse, Fabien Guérin, Sébastien Boutry, Lionel Lan Bui Thi Ngoc, Christian Vernière, Philippe Jarne,
pv. citri Pathotypes Xanthomonas citriMethods for Epidemiological Monitoring of Three High-Throughput Genotyping From Local Surveys to Global Surveillance:
http://aem.asm.org/content/75/4/1173Updated information and services can be found at:
These include:
SUPPLEMENTAL MATERIAL Supplemental material
REFERENCEShttp://aem.asm.org/content/75/4/1173#ref-list-1at:
This article cites 71 articles, 27 of which can be accessed free
CONTENT ALERTS more»articles cite this article),
Receive: RSS Feeds, eTOCs, free email alerts (when new
http://journals.asm.org/site/misc/reprints.xhtmlInformation about commercial reprint orders: http://journals.asm.org/site/subscriptions/To subscribe to to another ASM Journal go to:
on Novem
ber 18, 2014 by guesthttp://aem
.asm.org/
Dow
nloaded from
on Novem
ber 18, 2014 by guesthttp://aem
.asm.org/
Dow
nloaded from
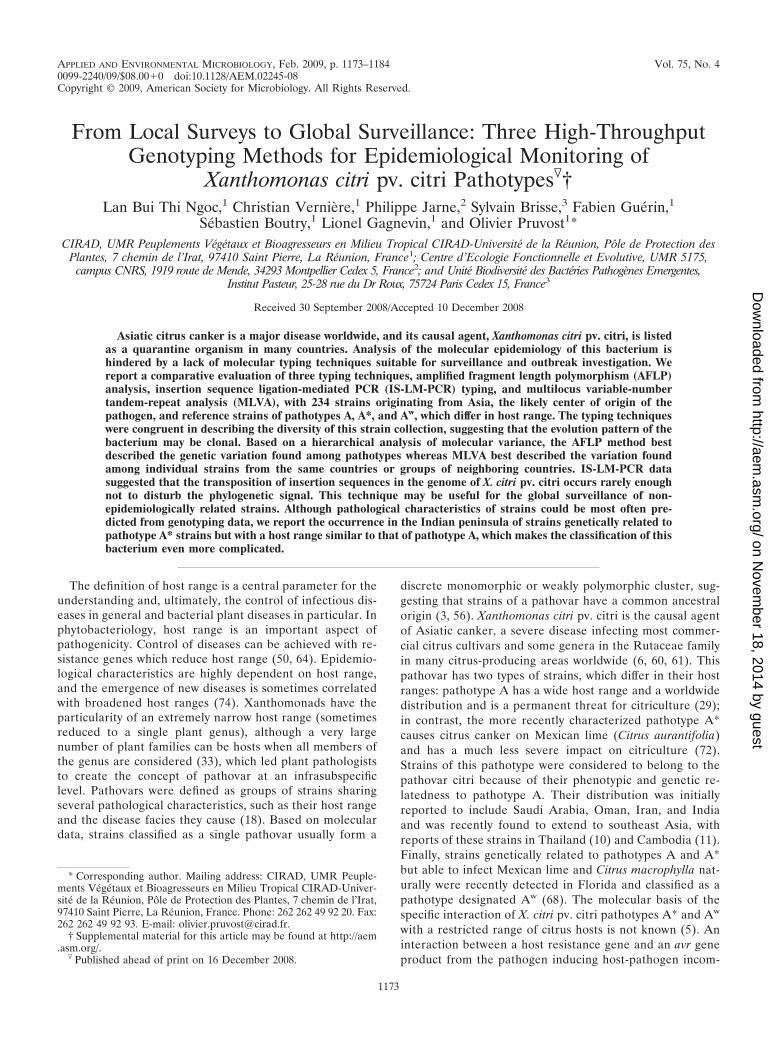
APPLIED AND ENVIRONMENTAL MICROBIOLOGY, Feb. 2009, p. 1173–1184 Vol. 75, No. 40099-2240/09/$08.00�0 doi:10.1128/AEM.02245-08Copyright © 2009, American Society for Microbiology. All Rights Reserved.
From Local Surveys to Global Surveillance: Three High-ThroughputGenotyping Methods for Epidemiological Monitoring of
Xanthomonas citri pv. citri Pathotypes�†Lan Bui Thi Ngoc,1 Christian Verniere,1 Philippe Jarne,2 Sylvain Brisse,3 Fabien Guerin,1
Sebastien Boutry,1 Lionel Gagnevin,1 and Olivier Pruvost1*CIRAD, UMR Peuplements Vegetaux et Bioagresseurs en Milieu Tropical CIRAD-Universite de la Reunion, Pole de Protection des
Plantes, 7 chemin de l’Irat, 97410 Saint Pierre, La Reunion, France1; Centre d’Ecologie Fonctionnelle et Evolutive, UMR 5175,campus CNRS, 1919 route de Mende, 34293 Montpellier Cedex 5, France2; and Unite Biodiversite des Bacteries Pathogenes Emergentes,
Institut Pasteur, 25-28 rue du Dr Roux, 75724 Paris Cedex 15, France3
Received 30 September 2008/Accepted 10 December 2008
Asiatic citrus canker is a major disease worldwide, and its causal agent, Xanthomonas citri pv. citri, is listedas a quarantine organism in many countries. Analysis of the molecular epidemiology of this bacterium ishindered by a lack of molecular typing techniques suitable for surveillance and outbreak investigation. Wereport a comparative evaluation of three typing techniques, amplified fragment length polymorphism (AFLP)analysis, insertion sequence ligation-mediated PCR (IS-LM-PCR) typing, and multilocus variable-numbertandem-repeat analysis (MLVA), with 234 strains originating from Asia, the likely center of origin of thepathogen, and reference strains of pathotypes A, A*, and Aw, which differ in host range. The typing techniqueswere congruent in describing the diversity of this strain collection, suggesting that the evolution pattern of thebacterium may be clonal. Based on a hierarchical analysis of molecular variance, the AFLP method bestdescribed the genetic variation found among pathotypes whereas MLVA best described the variation foundamong individual strains from the same countries or groups of neighboring countries. IS-LM-PCR datasuggested that the transposition of insertion sequences in the genome of X. citri pv. citri occurs rarely enoughnot to disturb the phylogenetic signal. This technique may be useful for the global surveillance of non-epidemiologically related strains. Although pathological characteristics of strains could be most often pre-dicted from genotyping data, we report the occurrence in the Indian peninsula of strains genetically related topathotype A* strains but with a host range similar to that of pathotype A, which makes the classification of thisbacterium even more complicated.
The definition of host range is a central parameter for theunderstanding and, ultimately, the control of infectious dis-eases in general and bacterial plant diseases in particular. Inphytobacteriology, host range is an important aspect ofpathogenicity. Control of diseases can be achieved with re-sistance genes which reduce host range (50, 64). Epidemio-logical characteristics are highly dependent on host range,and the emergence of new diseases is sometimes correlatedwith broadened host ranges (74). Xanthomonads have theparticularity of an extremely narrow host range (sometimesreduced to a single plant genus), although a very largenumber of plant families can be hosts when all members ofthe genus are considered (33), which led plant pathologiststo create the concept of pathovar at an infrasubspecificlevel. Pathovars were defined as groups of strains sharingseveral pathological characteristics, such as their host rangeand the disease facies they cause (18). Based on moleculardata, strains classified as a single pathovar usually form a
discrete monomorphic or weakly polymorphic cluster, sug-gesting that strains of a pathovar have a common ancestralorigin (3, 56). Xanthomonas citri pv. citri is the causal agentof Asiatic canker, a severe disease infecting most commer-cial citrus cultivars and some genera in the Rutaceae familyin many citrus-producing areas worldwide (6, 60, 61). Thispathovar has two types of strains, which differ in their hostranges: pathotype A has a wide host range and a worldwidedistribution and is a permanent threat for citriculture (29);in contrast, the more recently characterized pathotype A*causes citrus canker on Mexican lime (Citrus aurantifolia)and has a much less severe impact on citriculture (72).Strains of this pathotype were considered to belong to thepathovar citri because of their phenotypic and genetic re-latedness to pathotype A. Their distribution was initiallyreported to include Saudi Arabia, Oman, Iran, and Indiaand was recently found to extend to southeast Asia, withreports of these strains in Thailand (10) and Cambodia (11).Finally, strains genetically related to pathotypes A and A*but able to infect Mexican lime and Citrus macrophylla nat-urally were recently detected in Florida and classified as apathotype designated Aw (68). The molecular basis of thespecific interaction of X. citri pv. citri pathotypes A* and Aw
with a restricted range of citrus hosts is not known (5). Aninteraction between a host resistance gene and an avr geneproduct from the pathogen inducing host-pathogen incom-
* Corresponding author. Mailing address: CIRAD, UMR Peuple-ments Vegetaux et Bioagresseurs en Milieu Tropical CIRAD-Univer-site de la Reunion, Pole de Protection des Plantes, 7 chemin de l’Irat,97410 Saint Pierre, La Reunion, France. Phone: 262 262 49 92 20. Fax:262 262 49 92 93. E-mail: [email protected].
† Supplemental material for this article may be found at http://aem.asm.org/.
� Published ahead of print on 16 December 2008.
1173
on Novem
ber 18, 2014 by guesthttp://aem
.asm.org/
Dow
nloaded from
patibility has not yet been demonstrated for the X. citri pv.citri-citrus pathosystem, as it has been previously for otherplant pathogenic bacteria (43).
No assumption can be made about whether the apparentcontemporary emergence of pathotype A* strains is due to achange in virulence or to environmental or human factors.Host range shifts have sometimes been related to modifica-tions in the repertoire of virulence genes by horizontal genetransfer or intragenomic recombinations or mutations (20, 32,75). A clear understanding of the evolutionary relationshipsamong pathotypes A, A*, and Aw and of the diversity amongstrains of each pathotype would be helpful for assessing theseissues.
Due to the extreme difficulty and cost of the complete erad-ication of Asiatic citrus canker, several canker-threatened cit-rus-producing regions rely on integrated pest managementstrategies for control (30). Data derived from the huge effortput into the molecular typing of human bacterial pathogens(46, 63, 67, 69) suggest that an extensive knowledge of popu-lations of plant pathogenic bacteria may improve our under-standing of epidemic situations.
The tools most often used for the molecular epidemiology ofcitrus canker have been repetitive-element-based PCR (rep-PCR) and pulsed-field gel electrophoresis (PFGE) (13, 16, 19,28, 68). The lack of discriminatory power of rep-PCR and thehigh labor requirement for PFGE make it difficult to use thesetechniques extensively for outbreak investigations or regionalor global surveillance (67). Therefore, alternative high-resolu-tion and high-throughput molecular typing systems for X. citripv. citri should be developed. Amplified fragment length poly-morphism (AFLP) analysis of an Iranian collection of strainscausing Asiatic citrus canker suggested previously that thistechnique has better discriminatory power than the rep-PCRmethod (39). AFLP has the advantage of generating a largenumber of randomly located markers over the whole genome.The detected polymorphism may arise from point mutations atthe targeted restriction sites or from insertions and/or dele-tions in the amplified region (73). The determination of thecomplete sequence of X. citri pv. citri strain 306 (17) shouldfacilitate the development of molecular typing tools well-suitedfor deciphering taxonomy, evolution, and/or epidemiology. Forinstance, it gave access to specific primers associated withtransposable elements present in this bacterium (45), whichwere used for typing DNA from herbarium specimens showingcanker-like symptoms and originating from different geograph-ical origins. This technique revealed an unexpectedly high de-gree of genetic diversity. However, this typing scheme requiresmore than 50 PCRs for the full analysis of unknown DNA. Anew insertion sequence ligation-mediated PCR (IS-LM-PCR)scheme (9) also revealed considerable diversity and is lesslabor-intensive. This technique amplifies DNA fragments be-tween an insertion sequence element and a selected restrictionsite (9). We also recently developed a multilocus variable-number tandem-repeat analysis (MLVA) approach for thisbacterium, a promising technique targeting tandem repeats(minisatellite-like loci) for fine-scale epidemiology with dis-tinctive advantages, such as high discriminatory power, maxi-mal reproducibility of results, and portability of equipment(12). The characteristics of these newly developed techniquesneed to be subjected to a comparative evaluation in order to
determine which methods would be most useful for globalsurveillance and molecular epidemiology on small spatialscales. In this study, we compared the AFLP, MLVA, andIS-LM-PCR techniques to explore the genetic diversity of acollection of pathotype A, A*, and Aw strains originating fromAsia. Furthermore, we sought to determine the genetic diver-sity and structure of X. citri pv. citri strains, including a largecollection of pathotype A* strains for which no extensive char-acterization study is available at the moment, from the area oforigin of the pathogen.
MATERIALS AND METHODS
Bacterial strains and DNA extraction. A total of 234 bacterial strains isolatedfrom citrus canker lesions and collected from 26 countries in Asia were used inthis study, together with reference pathotype A, A*, and Aw strains. All strainswere assigned to a pathogenicity group on the basis of results from detached-leafinoculation assays performed on Mexican lime (C. aurantifolia), C. macrophylla,and grapefruit (C. paradisi) (72). Strains producing canker-like lesions on thethree host species were classified as pathotype A strains. Both pathotype A* (n �59) and Aw (n � 6) strains produced canker-like lesions on C. aurantifolia and C.macrophylla but not on C. paradisi. Thus, the two types were pathogenicallyindistinguishable (see Table S1 in the supplemental material for information oneach strain, including the geographical origin, host species, date of collection,and pathogenicity group). Single colonies were subcultured on plates containingYPGA (yeast extract, 7 g liter�1; peptone, 7 g liter�1; glucose, 7 g liter�1; agar,18 g liter�1; and propiconazole, 20 mg liter�1) for 24 h at 28°C. These subcul-tures were used to inoculate tubes containing 4 ml of YP broth (yeast extract, 7 gliter�1; peptone, 7 g liter�1; pH 7.2), and the tubes were incubated at 28°C on anorbital shaker for 16 to 18 h. These suspensions were used for DNA extractionwith the DNeasy tissue kit according to the instructions of the manufacturer(Qiagen, Courtaboeuf, France). DNA concentrations were estimated by flu-orometry with a TKO 100 fluorometer (Hoefer, San Francisco, CA).
AFLP analysis. AFLP fingerprinting was performed mainly according to theoriginal protocol by Vos et al. (73) as described previously (2). In brief, 25 ng ofDNA was digested with MspI and SacI restriction enzymes as recommended bythe manufacturer (New England Biolabs/Ozyme, Saint Quentin en Yvelines,France). Then 2.5-�l aliquots of the digested products were added to 22.5-�lligation mixes containing 2 �M MspI adaptor (see Table S2 in the supplementalmaterial), 0.2 �M SacI adaptor (Applied Biosystems, Courtaboeuf, France) (seeTable S2 in the supplemental material), and 2 U of T4 DNA ligase (New EnglandBiolabs/Ozyme, Saint Quentin en Yvelines, France) in 1� T4 DNA ligationbuffer. Ligations were performed for 3 h at 37°C before enzyme inactivation at65°C for 10 min. For preselective PCR, 10-fold-diluted ligation products wereused as a template in a mix containing 5 mM MgCl2, 0.23 �M (each) MspI andSacI primers (see Table S2 in the supplemental material), 0.45 mM (each)deoxynucleoside triphosphates (New England Biolabs/Ozyme, Saint Quentin enYvelines, France), and 0.5 U of Taq DNA polymerase (Goldstar red; Eurogen-tec, Seraing, Belgium) in 1� Goldstar buffer. The following PCR conditions wereused: initial extension to ligate the second strand of the adaptors at 72°C for 2min; a denaturation step at 94°C for 2 min; 25 cycles at 94°C for 30 s, 56°C for30 s, and 72°C for 2 min; and a final extension step at 72°C for 10 min. Tenfold-dilutions of PCR products were used as templates for selective amplifications.The selective amplifications using the unlabeled MspI�A, MspI�C, MspI�T, orMspI�G primer and the SacI�C primer labeled with one of four differentfluorochromes (Applied Biosystems, Courtaboeuf, France) (see Table S2 in thesupplemental material) were performed under the same conditions as the pre-selective PCR, except that the SacI�C primer concentration was 0.12 �M. Thefollowing PCR conditions were used: initial denaturation at 94°C for 2 min; 37cycles of 94°C for 30 s, annealing for 30 s at 65°C in the first cycle, at tempera-tures decreasing by 0.7°C per cycle for the next 12 cycles, and then at 56°C for thelast 24 cycles, and extension at 72°C for 2 min; and a final extension step at 72°Cfor 10 min. Samples were then prepared for capillary electrophoresis by adding1 �l of the final PCR product to a mixture of 18.7 �l of formamide and 0.3 �l ofa GeneScan 500 LIZ DNA ladder (Applied Biosystems, Courtaboeuf, France) asan internal standard. The samples were then denatured for 5 min at 95°C andplaced on ice for at least 5 min. Electrophoresis was performed in an ABIPRISM 3100 genetic analyzer (Applied Biosystems, Courtaboeuf, France) usinga performance-optimized polymer, POP-4, at 15,000 V for about 20 min at 60°C,with an initial injection of 66 s. The AFLP fingerprints were analyzed visuallyusing the software GeneScan 3.7 (Applied Biosystems, Courtaboeuf, France). To
1174 BUI THI NGOC ET AL. APPL. ENVIRON. MICROBIOL.
on Novem
ber 18, 2014 by guesthttp://aem
.asm.org/
Dow
nloaded from
test the reproducibility of the results from the AFLP technique, two independentDNA extractions were used for all strains and strain 306 of X. citri pv. citri (17)was used as a control in each AFLP experiment.
IS-LM-PCR analysis. IS-LM-PCR fingerprinting was performed as describedpreviously (9). In brief, aliquots of bacterial genomic DNA were subjected torestriction enzyme and ligated to the adaptor by incubation for 3 h at 37°C intotal volumes of 20 �l containing 2 ng of DNA, 9 U of MspI (New EnglandBiolabs/Ozyme, Saint Quentin en Yvelines, France), 50 U of T4 DNA ligase(New England Biolabs/Ozyme, Saint Quentin en Yvelines, France), 50 mMNaCl, 1 �M MspI adaptor (Applied Biosystems, Courtaboeuf, France) (seeTable S3 in the supplemental material), and 1� bovine serum albumin in 1� T4DNA ligation buffer, followed by enzyme inactivation at 65°C for 10 min. Tenfolddilutions were used as template DNA in 20 �l of a PCR mix which contained 1mM (each) deoxynucleoside triphosphates, 5 mM MgCl2, 0.25 �M unlabeledMspI primer (Applied Biosystems, Courtaboeuf, France) (see Table S3 in thesupplemental material), 0.25 �M 5�-end-labeled insertion sequence-specificprimer (Applied Biosystems, Courtaboeuf, France) (see Table S3 in the supple-mental material), and 0.5 U of Taq DNA polymerase (Goldstar red; Eurogentec,Seraing, Belgium) in 1� Taq Goldstar buffer. The following PCR conditionswere used: initial extension to ligate the second strand of the adaptors at 72°C for2 min; a denaturation step at 94°C for 2 min; 35 cycles at 94°C for 45 s, 60°C for60 s, and 72°C for 60 s; and a final extension step at 72°C for 10 min. Sampleswere prepared and subjected to capillary electrophoresis as explained above. Totest the reproducibility of results from the IS-LM-PCR technique, two indepen-dent DNA extractions were used for all strains and strain 306 of X. citri pv. citri(17) was used as a control in each experiment.
MLVA scheme. Fourteen primer pairs targeting single-locus alleles designedfrom the full sequence of X. citri pv. citri strain 306 (17) were used in a multiplexPCR format with a PCR kit from Qiagen (Courtaboeuf, France) (12). Briefly, 2to 5 ng of genomic DNA was used as a template in mixes containing 0.2 �M(each) primers (one of which was marked with one of the fluorescent dyes6-carboxyfluorescein, NED, PET, and VIC [Applied Biosystems]), 1� Qiagenmultiplex mastermix (containing a hot-start Taq DNA polymerase), 0.5� Q-solution (Qiagen, Courtaboeuf, France), and RNase-free water to yield a volumeof 15 �l. PCR amplifications were performed in a GeneAmp PCR system 9700thermocycler (Applied Biosystems) under the following conditions: 15 min at95°C for hot-start activation; 25 cycles of 94°C for 30 s, annealing at temperaturesranging from 64 to 70°C for 90 s, and 72°C for 90 s; and a final extension step at72°C for 30 min (12). Aliquots of 1 �l of amplified products diluted 1/50 to 1/200were mixed with 10.7 �l of Hi-Di formamide and 0.3 �l of a GeneScan 500 LIZinternal lane size standard (Applied Biosystems). Capillary electrophoresis wasperformed in an ABI PRISM 3130xl genetic analyzer (Applied Biosystems). Totest the reproducibility of results from the MLVA technique, two independentDNA extractions were used for all strains and strain 306 of X. citri pv. citri (17)was used as a control in each experiment.
Data scoring and exploration. For the AFLP and IS-LM-PCR techniques, thepresence and absence of fragments were scored as a binary matrix and analyzedwith the software R (version 2.6.1; R Development Core Team, Vienna, Aus-tria). The size of each fragment in the range of 50 to 500 bp was determined.Fragments with fluorescence above a threshold set to 500 relative fluorescenceunits were scored. This threshold was found to be suitable for minimizing scoringdiscrepancies among DNA replicates in earlier studies (2, 53). Only fragmentsdetected for both DNA replicates were scored as positive in the data matrix. Dicedissimilarities were used as distances to construct a weighted neighbor-joining(NJ) tree (26, 59) with the software R. The robustness of the tree was assessedby bootstrap analysis (1,000 resamplings). Metric multidimensional scaling(MDS) was used to represent distances between strains based on a Dice dissim-ilarity matrix. MDS transforms a distance matrix (which cannot be analyzed byeigendecomposition) into a cross-product matrix and then solves the eigenvectorproblem to find the coordinates of individuals so that distortions in the distancematrix are minimized. As in principal component analysis, individuals are pro-jected into n dimensions (1). MDS was performed using the cmd-scale functionin the R software.
For MLVA, integer numbers of tandem repeats were used as input data.Manhattan distances were calculated and used to build NJ trees with the Rsoftware (version 2.6.1; R Development Core Team, Vienna, Austria) using“cluster” and “ape” packages. The robustness of trees was assessed by bootstrapanalysis (1,000 resamplings). MDS was also performed as described above, basedon the Manhattan distance matrix. The identification of MLVA types (i.e.,groups of strains differing by one to three variable-number tandem-repeat[VNTR] loci) was performed with eBURST, version 3 (25), available at http://eburst.mlst.net/. Whether MLVA loci evolve following a stepwise mutationmodel (SMM), i.e., preferentially by the addition or loss of a single repeat, was
explored separately for each locus. For this purpose, the difference in the numberof repeats for each pair of haplotypes along the evolutionary path inferred byeBURST analysis was calculated. The occurrence of each value of repeat differ-ence was recorded for each group (defined as a collection of strains each with amaximum of three allelic mismatches with at least one other member of thecollection), and values from all eBURST groups were pooled. This analysis wasperformed using multilocus analyzer software (S. Brisse, unpublished data),which is an independent implementation (coded in Python) of the eBURSTalgorithm, to which the SMM test function was added.
Predictive in silico analyses of AFLP, IS-LM-PCR, and MLVA techniques. Apredictive analysis of the AFLP, IS-LM-PCR, and MLVA methods was per-formed with the genome sequence of X. citri pv. citri strain 306 (17) to determinethe accuracy and reproducibility of the results from each system (7). In the AFLPanalysis, the lengths of predicted fragments corresponded to the lengths of therestriction fragments produced by simulating digestion with SacI and MspI andthen selecting restriction fragments based on selective nucleotides present onselective AFLP primers, plus 24 bp corresponding to the length of adaptors. Inthe IS-LM-PCR analysis, the lengths of the predicted fragments were calculatedas the size of the fragment bordered by each primer pair from a selection of MspIrestriction fragments containing the targeted insertion sequences. The predictedfragment size for MLVA corresponded to the length of the PCR product foreach primer pair. A total of 31, 41, and 82 fingerprints using strain 306 wereanalyzed for the AFLP, IS-LM-PCR, and MLVA techniques, respectively.
Genetic diversity and population structure. The discriminatory power of eachtyping system was calculated using Hunter’s single numerical index of discrimi-nation (D) (34). This analysis was performed on our collection (n � 234) typedby the AFLP, IS-LM-PCR, and MLVA methods and on a subcollection (n � 34)including strains studied by Cubero and Graham (16). The correlations betweendistance matrices were tested pairwise using the Mantel test (48). All Manteltests were performed using GenAlEx, version 6.1, with 9,999 permutations (52).Nei’s unbiased estimates of genetic diversity (HE) for MLVA data were calcu-lated using FSTAT 2.9.3 (http://www2.unil.ch/popgen/softwares/fstat.htm). Forbiallelic data (AFLP and IS-LM-PCR results), AFLP-SURV software, version1.0 (71) (http://www.ulb.ac.be/sciences/lagev/aflp-surv.html), was used for com-puting (i) allelic frequencies from observed frequencies of fragments accordingto the method of Lynch and Milligan for haploid species (47) and (ii) HE.
The allelic richness of our two sample sets composed of strains of pathotypesA and A*/Aw was estimated by a rarefaction method (36) producing unbiasedestimates due to uneven sample sizes. The rarefaction method was performedwith HP-RARE, version 1.0 (37). The degree of linkage disequilibrium wasdetermined using the index of association (IA) (49) with the software GenAlEx,version 6.1 (52). IA is calculated by comparing the observed variance (VO) in thedistribution of allelic mismatches in all pairwise comparisons of the allelic pro-files with the expected variance (VE) in the freely recombining population, asfollows: IA � (VO/VE) � 1. Significant linkage disequilibrium is established if thevariance observed in the MLVA allele profiles is greater than the maximumvariance observed in 1,000 randomized allele profiles (P � 0.001) (49).
We described the structure of the strain collection by using different ap-proaches. Populations were defined at the geographical level when at least 10strains of pathotype A or A*/Aw originated from the same country. When fewerthan 10 strains per pathotype-country combination were present, we groupedstrains from neighboring countries with no natural geographical barriers and/orwith a common past history, e.g., those of the Indian peninsula; otherwise, suchcountries were not included in the analyses. A total of eight (10- to 27-strain) andthree (10- to 24-strain) populations of pathotype A and A* strains, respectively,were defined (see Table S1 in the supplemental material). Genetic differentiationamong populations was examined using different approaches. For MLVA data,pairwise population differentiation was assessed by Fisher exact tests (57) andtested for significance by the Markov chain Monte Carlo method using Arlequin,version 3.1 (22). For biallelic data, the results of exact tests were computed usingthe software TFPGA (Tools for Population Genetic Analyses), version 1.3 (42).
A hierarchical analysis of molecular variance (AMOVA) was conducted withArlequin software, version 3.1 (22). Significance was tested using a nonparamet-ric approach. Partitioning between data sets for pathotypes A and A* and amongdata sets for strains of each type from different countries and from the samecountry was conducted to evaluate the different contributions of these sources ofvariation for each genotyping technique. Estimates for Wright’s fixation index ofgenetic differentiation (FST) and Slatkin’s FST analogue RST, which takes intoaccount the size difference among alleles and is more appropriate than FST whenthe loci studied evolve under the basic SMM (66), were obtained from the threesets of data (AFLP, IS-LM-PCR, and MLVA results) and from MLVA data,respectively. Estimates of FST for MLVA data and their respective P values forpopulation pairs and all populations were calculated by using FSTAT 2.9.3. In
VOL. 75, 2009 GENETIC DIVERSITY OF X. CITRI PV. CITRI IN ASIA 1175
on Novem
ber 18, 2014 by guesthttp://aem
.asm.org/
Dow
nloaded from
the same way, RST estimates were calculated using the software RST CALC,version 2.2 (27). For AFLP and IS-LM-PCR data, FST was calculated using thesoftware AFLP-SURV, version 1.0.
Isolation by distance among the eight populations of pathotype A was tested(58). The correlation between the logarithm of the geographical distances, re-taining a central point for each population area, as defined above, and FST/(1 �FST) was evaluated with a Mantel test using the software GenAIEx 6.1 for eachdata set. Statistical testing was conducted using random permutation (n � 9,999).
The Bayesian clustering approach implemented in the software STRUCTURE,version 2.2.3, was used to infer population structure and assign individuals to groupscharacterized by distinct allele frequencies (54). The method estimates a probabilityof ancestry for each individual from each of the groups. Individuals are assigned toone of the groups or populations or jointly to two or more populations if theirgenotypes indicate that they are admixed. Twenty independent runs ofSTRUCTURE were performed by setting the number of subpopulations or groups(K) from 1 to 10, with 20,000 burn-in replicates and a run length of 105 replicates todecide which value of K best fit the data. The selection of K was done by examiningthe estimates of the posterior probability of the data for a given value of K, Pr(X K)(where X represents the number of genotypes in the sample), as a guide and byestimating the modal value of the distribution of �K [calculated from theSTRUCTURE output Pr(X K)], which is a good indicator of the real K (21). Weexamined the clustering of strains of X. citri pv. citri for the inferred number ofgroups. We used different ancestry models in STRUCTURE according to the datasets. The linkage model (24) was used for MLVA data. For the biallelic markers(AFLP and IS-LM-PCR data), we used the admixture model and performed clus-tering without using prior population information under the F model, which assumesthat the allele frequencies in the populations are correlated (23).
RESULTS
Predictive in silico AFLP, IS-LM-PCR, and MLVA typing.In the AFLP analysis, 111 of 147 predicted fragments (76%)for the sequenced X. citri pv. citri strain 306 were always re-corded and 8 predicted fragments were amplified in an irre-producible way. AFLP markers were scattered throughout theX. citri pv. citri genome. In the IS-LM-PCR analysis, 34 of 39predicted fragments (87%) were always recorded, 3 predictedfragments were occasionally amplified, and 4 unpredicted frag-ments were reproducibly recorded. In MLVA, all predictedfragments were observed.
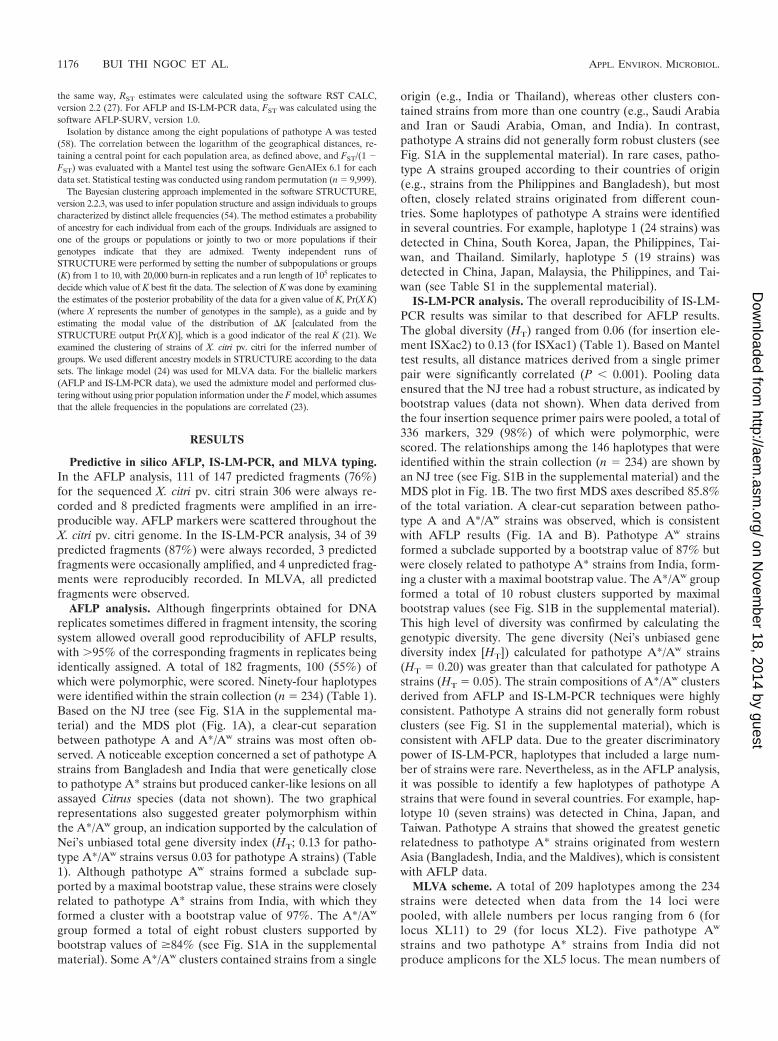
AFLP analysis. Although fingerprints obtained for DNAreplicates sometimes differed in fragment intensity, the scoringsystem allowed overall good reproducibility of AFLP results,with 95% of the corresponding fragments in replicates beingidentically assigned. A total of 182 fragments, 100 (55%) ofwhich were polymorphic, were scored. Ninety-four haplotypeswere identified within the strain collection (n � 234) (Table 1).Based on the NJ tree (see Fig. S1A in the supplemental ma-terial) and the MDS plot (Fig. 1A), a clear-cut separationbetween pathotype A and A*/Aw strains was most often ob-served. A noticeable exception concerned a set of pathotype Astrains from Bangladesh and India that were genetically closeto pathotype A* strains but produced canker-like lesions on allassayed Citrus species (data not shown). The two graphicalrepresentations also suggested greater polymorphism withinthe A*/Aw group, an indication supported by the calculation ofNei’s unbiased total gene diversity index (HT; 0.13 for patho-type A*/Aw strains versus 0.03 for pathotype A strains) (Table1). Although pathotype Aw strains formed a subclade sup-ported by a maximal bootstrap value, these strains were closelyrelated to pathotype A* strains from India, with which theyformed a cluster with a bootstrap value of 97%. The A*/Aw
group formed a total of eight robust clusters supported bybootstrap values of �84% (see Fig. S1A in the supplementalmaterial). Some A*/Aw clusters contained strains from a single
origin (e.g., India or Thailand), whereas other clusters con-tained strains from more than one country (e.g., Saudi Arabiaand Iran or Saudi Arabia, Oman, and India). In contrast,pathotype A strains did not generally form robust clusters (seeFig. S1A in the supplemental material). In rare cases, patho-type A strains grouped according to their countries of origin(e.g., strains from the Philippines and Bangladesh), but mostoften, closely related strains originated from different coun-tries. Some haplotypes of pathotype A strains were identifiedin several countries. For example, haplotype 1 (24 strains) wasdetected in China, South Korea, Japan, the Philippines, Tai-wan, and Thailand. Similarly, haplotype 5 (19 strains) wasdetected in China, Japan, Malaysia, the Philippines, and Tai-wan (see Table S1 in the supplemental material).
IS-LM-PCR analysis. The overall reproducibility of IS-LM-PCR results was similar to that described for AFLP results.The global diversity (HT) ranged from 0.06 (for insertion ele-ment ISXac2) to 0.13 (for ISXac1) (Table 1). Based on Manteltest results, all distance matrices derived from a single primerpair were significantly correlated (P � 0.001). Pooling dataensured that the NJ tree had a robust structure, as indicated bybootstrap values (data not shown). When data derived fromthe four insertion sequence primer pairs were pooled, a total of336 markers, 329 (98%) of which were polymorphic, werescored. The relationships among the 146 haplotypes that wereidentified within the strain collection (n � 234) are shown byan NJ tree (see Fig. S1B in the supplemental material) and theMDS plot in Fig. 1B. The two first MDS axes described 85.8%of the total variation. A clear-cut separation between patho-type A and A*/Aw strains was observed, which is consistentwith AFLP results (Fig. 1A and B). Pathotype Aw strainsformed a subclade supported by a bootstrap value of 87% butwere closely related to pathotype A* strains from India, form-ing a cluster with a maximal bootstrap value. The A*/Aw groupformed a total of 10 robust clusters supported by maximalbootstrap values (see Fig. S1B in the supplemental material).This high level of diversity was confirmed by calculating thegenotypic diversity. The gene diversity (Nei’s unbiased genediversity index [HT]) calculated for pathotype A*/Aw strains(HT � 0.20) was greater than that calculated for pathotype Astrains (HT � 0.05). The strain compositions of A*/Aw clustersderived from AFLP and IS-LM-PCR techniques were highlyconsistent. Pathotype A strains did not generally form robustclusters (see Fig. S1 in the supplemental material), which isconsistent with AFLP data. Due to the greater discriminatorypower of IS-LM-PCR, haplotypes that included a large num-ber of strains were rare. Nevertheless, as in the AFLP analysis,it was possible to identify a few haplotypes of pathotype Astrains that were found in several countries. For example, hap-lotype 10 (seven strains) was detected in China, Japan, andTaiwan. Pathotype A strains that showed the greatest geneticrelatedness to pathotype A* strains originated from westernAsia (Bangladesh, India, and the Maldives), which is consistentwith AFLP data.
MLVA scheme. A total of 209 haplotypes among the 234strains were detected when data from the 14 loci werepooled, with allele numbers per locus ranging from 6 (forlocus XL11) to 29 (for locus XL2). Five pathotype Aw
strains and two pathotype A* strains from India did notproduce amplicons for the XL5 locus. The mean numbers of
1176 BUI THI NGOC ET AL. APPL. ENVIRON. MICROBIOL.
on Novem
ber 18, 2014 by guesthttp://aem
.asm.org/
Dow
nloaded from
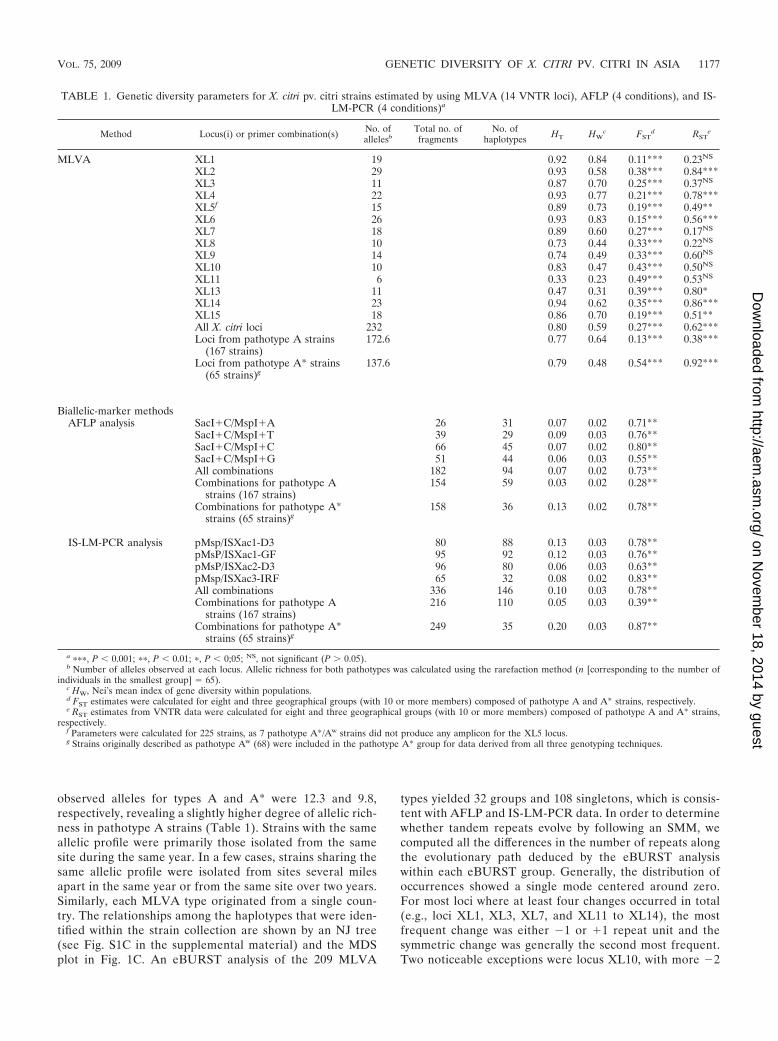
observed alleles for types A and A* were 12.3 and 9.8,respectively, revealing a slightly higher degree of allelic rich-ness in pathotype A strains (Table 1). Strains with the sameallelic profile were primarily those isolated from the samesite during the same year. In a few cases, strains sharing thesame allelic profile were isolated from sites several milesapart in the same year or from the same site over two years.Similarly, each MLVA type originated from a single coun-try. The relationships among the haplotypes that were iden-tified within the strain collection are shown by an NJ tree(see Fig. S1C in the supplemental material) and the MDSplot in Fig. 1C. An eBURST analysis of the 209 MLVA
types yielded 32 groups and 108 singletons, which is consis-tent with AFLP and IS-LM-PCR data. In order to determinewhether tandem repeats evolve by following an SMM, wecomputed all the differences in the number of repeats alongthe evolutionary path deduced by the eBURST analysiswithin each eBURST group. Generally, the distribution ofoccurrences showed a single mode centered around zero.For most loci where at least four changes occurred in total(e.g., loci XL1, XL3, XL7, and XL11 to XL14), the mostfrequent change was either �1 or �1 repeat unit and thesymmetric change was generally the second most frequent.Two noticeable exceptions were locus XL10, with more �2
TABLE 1. Genetic diversity parameters for X. citri pv. citri strains estimated by using MLVA (14 VNTR loci), AFLP (4 conditions), and IS-LM-PCR (4 conditions)a
Method Locus(i) or primer combination(s) No. ofallelesb
Total no. offragments
No. ofhaplotypes HT HW
c FSTd RST
e
MLVA XL1 19 0.92 0.84 0.11*** 0.23NS
XL2 29 0.93 0.58 0.38*** 0.84***XL3 11 0.87 0.70 0.25*** 0.37NS
XL4 22 0.93 0.77 0.21*** 0.78***XL5f 15 0.89 0.73 0.19*** 0.49**XL6 26 0.93 0.83 0.15*** 0.56***XL7 18 0.89 0.60 0.27*** 0.17NS
XL8 10 0.73 0.44 0.33*** 0.22NS
XL9 14 0.74 0.49 0.33*** 0.60NS
XL10 10 0.83 0.47 0.43*** 0.50NS
XL11 6 0.33 0.23 0.49*** 0.53NS
XL13 11 0.47 0.31 0.39*** 0.80*XL14 23 0.94 0.62 0.35*** 0.86***XL15 18 0.86 0.70 0.19*** 0.51**All X. citri loci 232 0.80 0.59 0.27*** 0.62***Loci from pathotype A strains
(167 strains)172.6 0.77 0.64 0.13*** 0.38***
Loci from pathotype A* strains(65 strains)g
137.6 0.79 0.48 0.54*** 0.92***
Biallelic-marker methodsAFLP analysis SacI�C/MspI�A 26 31 0.07 0.02 0.71**
SacI�C/MspI�T 39 29 0.09 0.03 0.76**SacI�C/MspI�C 66 45 0.07 0.02 0.80**SacI�C/MspI�G 51 44 0.06 0.03 0.55**All combinations 182 94 0.07 0.02 0.73**Combinations for pathotype A
strains (167 strains)154 59 0.03 0.02 0.28**
Combinations for pathotype A*strains (65 strains)g
158 36 0.13 0.02 0.78**
IS-LM-PCR analysis pMsp/ISXac1-D3 80 88 0.13 0.03 0.78**pMsP/ISXac1-GF 95 92 0.12 0.03 0.76**pMsP/ISXac2-D3 96 80 0.06 0.03 0.63**pMsp/ISXac3-IRF 65 32 0.08 0.02 0.83**All combinations 336 146 0.10 0.03 0.78**Combinations for pathotype A
strains (167 strains)216 110 0.05 0.03 0.39**
Combinations for pathotype A*strains (65 strains)g
249 35 0.20 0.03 0.87**
a ���, P � 0.001; ��, P � 0.01; �, P � 0;05; NS, not significant (P 0.05).b Number of alleles observed at each locus. Allelic richness for both pathotypes was calculated using the rarefaction method (n [corresponding to the number of
individuals in the smallest group] � 65).c HW, Nei’s mean index of gene diversity within populations.d FST estimates were calculated for eight and three geographical groups (with 10 or more members) composed of pathotype A and A* strains, respectively.e RST estimates from VNTR data were calculated for eight and three geographical groups (with 10 or more members) composed of pathotype A and A* strains,
respectively.f Parameters were calculated for 225 strains, as 7 pathotype A*/Aw strains did not produce any amplicon for the XL5 locus.g Strains originally described as pathotype Aw (68) were included in the pathotype A* group for data derived from all three genotyping techniques.
VOL. 75, 2009 GENETIC DIVERSITY OF X. CITRI PV. CITRI IN ASIA 1177
on Novem
ber 18, 2014 by guesthttp://aem
.asm.org/
Dow
nloaded from
changes (n � 6) than �1 (n � 3) and �1 (n � 3) changes,and locus XL9, with more �2 changes (n � 4) than �1 (n �3) or �1 (n � 1) changes. However, the numbers were smallin these two cases.
The IA calculated for the whole strain collection or for eachpathotype separately showed that there was significant linkagedisequilibrium (P � 0.001) between loci.
Genetic diversity and population structure. The discrimina-tory abilities of the AFLP, IS-LM-PCR, and MLVA tech-niques was determined and compared by calculating D for 234strains typed by all three methods. MLVA differentiated 209strains and showed the best level of discrimination, with a Dvalue of 0.998. IS-LM-PCR and AFLP markers distinguished146 strains (D � 0.991) and 94 strains (D � 0.970), respectively(Table 2). The combination of MLVA and IS-LM-PCR dataimproved the discrimination among the strains to a D value of0.999 (218 of 234 strains were discriminated). The three meth-ods were more discriminative than rep-PCR based on the datafrom a collection of 34 strains (Table 2).
Mantel test results suggested that data derived from thethree typing techniques were congruent (P � 0.001) (Table 3).The highest values of correlation between individual geneticdistances were observed for AFLP and IS-LM-PCR data (r �0.866; P � 0.001). Lower but highly significant values of cor-relation between MLVA and IS-LM-PCR data (r � 0.618, P �0.001) and MLVA and AFLP data (r � 0.599; P � 0.001) werefound. Correlations for individual pairs of genetic distanceswere also highly significant when determined by consideringpathotype A and A*/Aw strains separately (Table 3).
Hierarchical AMOVA revealed highly significant geneticvariation between pathotypes (P � 0.01), as well as betweenpopulations or within populations, whatever the molecularmarkers used (Table 4). The patterns of partitioning of the
FIG. 1. MDS representation of the distances among 234 strains of X. citripv. citri based on AFLP (A), IS-LM-PCR (B), and MLVA (C) data. X. citripv. citri pathotypes are represented by different symbols, including symbolsindicating the geographical origins of pathotype A strains, as follows: E,pathotype A from eastern and southern Asia; R, pathotype A from westernAsia; f, pathotype A*; and Œ, pathotype Aw. Numbers indicate the geo-graphical origins of pathotype A* strains, as follows: 1, Saudi Arabia; 2,Florida; 3, the Indian peninsula; 4, Iran; 5, Oman; and 6, Thailand or Cam-bodia. The two first MDS axes described 86.2% (A), 85.8% (B), and 83.4%(C) of the total variation.
TABLE 2. Discriminatory powers of AFLP, IS-LM-PCR, and MLVAmethods based on results for a collection of 234 strains of X. citri pv.
citri and a subset of 34 strains typed by rep-PCRa
Genotypingmethod
No. ofhaplotypesidentified(n � 234)
D
No. ofhaplotypesidentified(n � 34)
D
AFLP 94 0.970 19 0.932IS-LM-PCR 146 0.991 31 0.994MLVA 209 0.998 33 0.998Rep-PCR NDb ND 12 0.854
a Rep-PCR data are from Cubero and Graham (16).b ND, not determined.
TABLE 3. Mantel test results for pairwise correlations betweengenetic distances among individual strains for the different
typing methods and pairwise populationgenetic differentiationa
Population(s) rA rB rC
Pathotype A strains 0.472 0.430 0.673Pathotype A* strains 0.818 0.801 0.759
All populations 0.866 0.599 0.618
a rA, AFLP versus IS-LM-PCR data; rB, AFLP versus MLVA data; and rC,IS-LM-PCR versus MLVA data. P, �0.001 for all values.
1178 BUI THI NGOC ET AL. APPL. ENVIRON. MICROBIOL.
on Novem
ber 18, 2014 by guesthttp://aem
.asm.org/
Dow
nloaded from
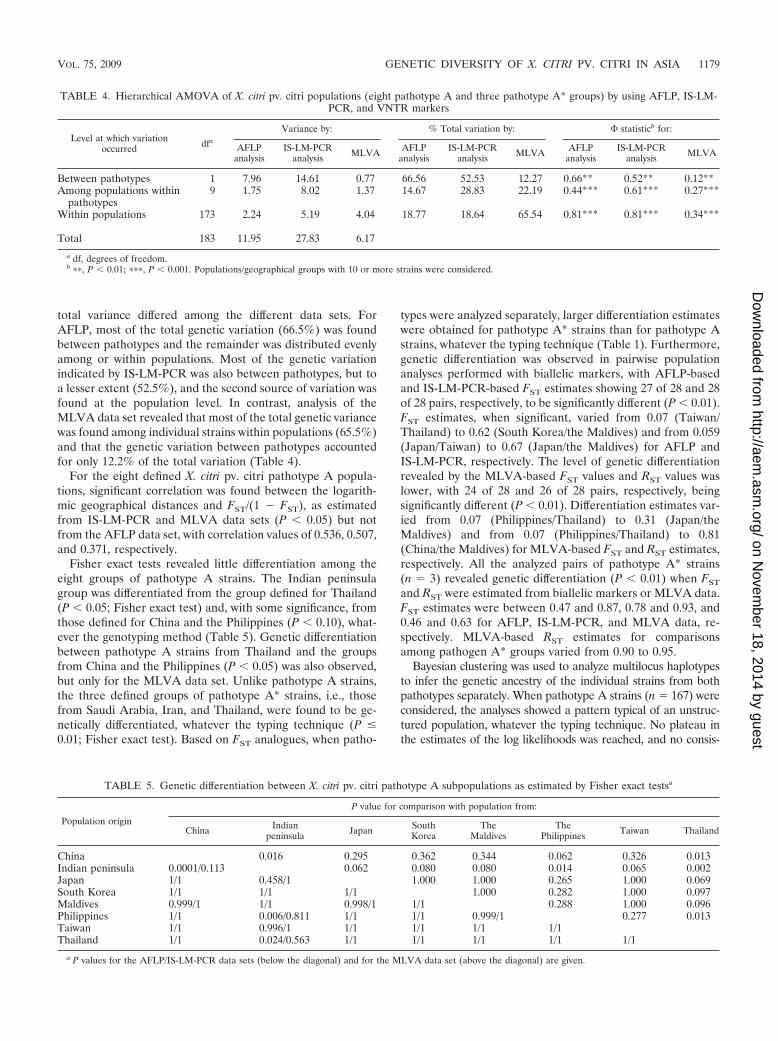
total variance differed among the different data sets. ForAFLP, most of the total genetic variation (66.5%) was foundbetween pathotypes and the remainder was distributed evenlyamong or within populations. Most of the genetic variationindicated by IS-LM-PCR was also between pathotypes, but toa lesser extent (52.5%), and the second source of variation wasfound at the population level. In contrast, analysis of theMLVA data set revealed that most of the total genetic variancewas found among individual strains within populations (65.5%)and that the genetic variation between pathotypes accountedfor only 12.2% of the total variation (Table 4).
For the eight defined X. citri pv. citri pathotype A popula-tions, significant correlation was found between the logarith-mic geographical distances and FST/(1 � FST), as estimatedfrom IS-LM-PCR and MLVA data sets (P � 0.05) but notfrom the AFLP data set, with correlation values of 0.536, 0.507,and 0.371, respectively.
Fisher exact tests revealed little differentiation among theeight groups of pathotype A strains. The Indian peninsulagroup was differentiated from the group defined for Thailand(P � 0.05; Fisher exact test) and, with some significance, fromthose defined for China and the Philippines (P � 0.10), what-ever the genotyping method (Table 5). Genetic differentiationbetween pathotype A strains from Thailand and the groupsfrom China and the Philippines (P � 0.05) was also observed,but only for the MLVA data set. Unlike pathotype A strains,the three defined groups of pathotype A* strains, i.e., thosefrom Saudi Arabia, Iran, and Thailand, were found to be ge-netically differentiated, whatever the typing technique (P �0.01; Fisher exact test). Based on FST analogues, when patho-
types were analyzed separately, larger differentiation estimateswere obtained for pathotype A* strains than for pathotype Astrains, whatever the typing technique (Table 1). Furthermore,genetic differentiation was observed in pairwise populationanalyses performed with biallelic markers, with AFLP-basedand IS-LM-PCR-based FST estimates showing 27 of 28 and 28of 28 pairs, respectively, to be significantly different (P � 0.01).FST estimates, when significant, varied from 0.07 (Taiwan/Thailand) to 0.62 (South Korea/the Maldives) and from 0.059(Japan/Taiwan) to 0.67 (Japan/the Maldives) for AFLP andIS-LM-PCR, respectively. The level of genetic differentiationrevealed by the MLVA-based FST values and RST values waslower, with 24 of 28 and 26 of 28 pairs, respectively, beingsignificantly different (P � 0.01). Differentiation estimates var-ied from 0.07 (Philippines/Thailand) to 0.31 (Japan/theMaldives) and from 0.07 (Philippines/Thailand) to 0.81(China/the Maldives) for MLVA-based FST and RST estimates,respectively. All the analyzed pairs of pathotype A* strains(n � 3) revealed genetic differentiation (P � 0.01) when FST
and RST were estimated from biallelic markers or MLVA data.FST estimates were between 0.47 and 0.87, 0.78 and 0.93, and0.46 and 0.63 for AFLP, IS-LM-PCR, and MLVA data, re-spectively. MLVA-based RST estimates for comparisonsamong pathogen A* groups varied from 0.90 to 0.95.
Bayesian clustering was used to analyze multilocus haplotypesto infer the genetic ancestry of the individual strains from bothpathotypes separately. When pathotype A strains (n � 167) wereconsidered, the analyses showed a pattern typical of an unstruc-tured population, whatever the typing technique. No plateau inthe estimates of the log likelihoods was reached, and no consis-
TABLE 4. Hierarchical AMOVA of X. citri pv. citri populations (eight pathotype A and three pathotype A* groups) by using AFLP, IS-LM-PCR, and VNTR markers
Level at which variationoccurred dfa
Variance by: % Total variation by: statisticb for:
AFLPanalysis
IS-LM-PCRanalysis MLVA AFLP
analysisIS-LM-PCR
analysis MLVA AFLPanalysis
IS-LM-PCRanalysis MLVA
Between pathotypes 1 7.96 14.61 0.77 66.56 52.53 12.27 0.66** 0.52** 0.12**Among populations within
pathotypes9 1.75 8.02 1.37 14.67 28.83 22.19 0.44*** 0.61*** 0.27***
Within populations 173 2.24 5.19 4.04 18.77 18.64 65.54 0.81*** 0.81*** 0.34***
Total 183 11.95 27.83 6.17
a df, degrees of freedom.b ��, P � 0.01; ���, P � 0.001. Populations/geographical groups with 10 or more strains were considered.
TABLE 5. Genetic differentiation between X. citri pv. citri pathotype A subpopulations as estimated by Fisher exact testsa
Population origin
P value for comparison with population from:
China Indianpeninsula Japan South
KoreaThe
MaldivesThe
Philippines Taiwan Thailand
China 0.016 0.295 0.362 0.344 0.062 0.326 0.013Indian peninsula 0.0001/0.113 0.062 0.080 0.080 0.014 0.065 0.002Japan 1/1 0.458/1 1.000 1.000 0.265 1.000 0.069South Korea 1/1 1/1 1/1 1.000 0.282 1.000 0.097Maldives 0.999/1 1/1 0.998/1 1/1 0.288 1.000 0.096Philippines 1/1 0.006/0.811 1/1 1/1 0.999/1 0.277 0.013Taiwan 1/1 0.996/1 1/1 1/1 1/1 1/1Thailand 1/1 0.024/0.563 1/1 1/1 1/1 1/1 1/1
a P values for the AFLP/IS-LM-PCR data sets (below the diagonal) and for the MLVA data set (above the diagonal) are given.
VOL. 75, 2009 GENETIC DIVERSITY OF X. CITRI PV. CITRI IN ASIA 1179
on Novem
ber 18, 2014 by guesthttp://aem
.asm.org/
Dow
nloaded from
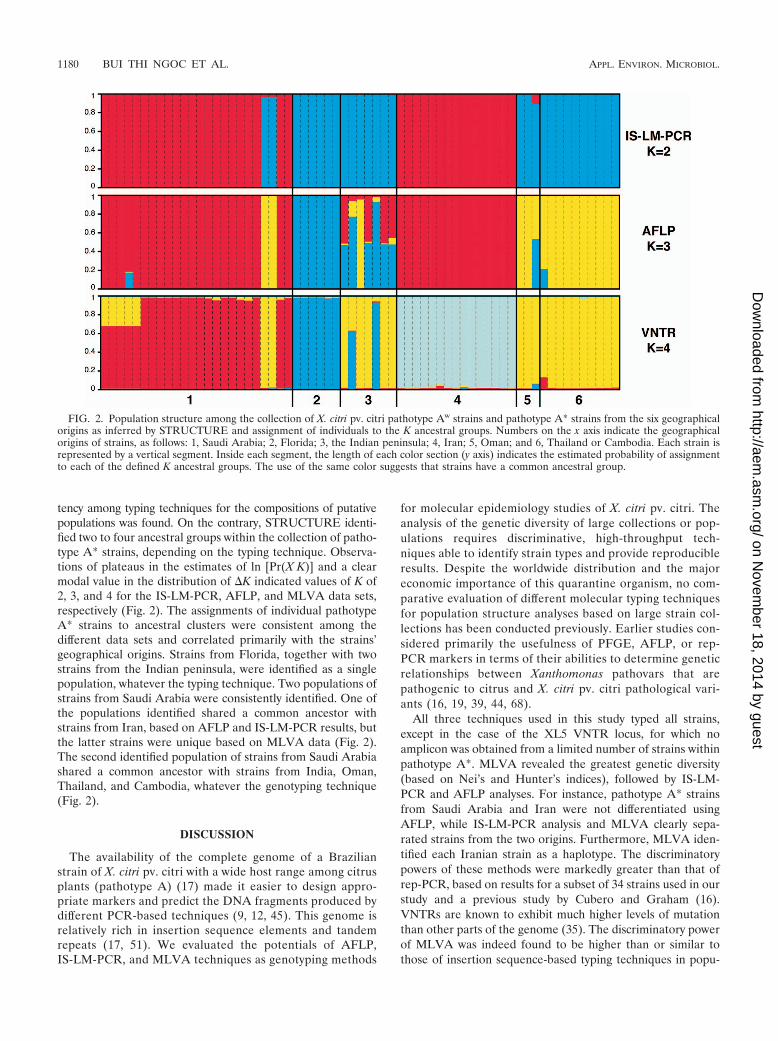
tency among typing techniques for the compositions of putativepopulations was found. On the contrary, STRUCTURE identi-fied two to four ancestral groups within the collection of patho-type A* strains, depending on the typing technique. Observa-tions of plateaus in the estimates of ln [Pr(X K)] and a clearmodal value in the distribution of �K indicated values of K of2, 3, and 4 for the IS-LM-PCR, AFLP, and MLVA data sets,respectively (Fig. 2). The assignments of individual pathotypeA* strains to ancestral clusters were consistent among thedifferent data sets and correlated primarily with the strains’geographical origins. Strains from Florida, together with twostrains from the Indian peninsula, were identified as a singlepopulation, whatever the typing technique. Two populations ofstrains from Saudi Arabia were consistently identified. One ofthe populations identified shared a common ancestor withstrains from Iran, based on AFLP and IS-LM-PCR results, butthe latter strains were unique based on MLVA data (Fig. 2).The second identified population of strains from Saudi Arabiashared a common ancestor with strains from India, Oman,Thailand, and Cambodia, whatever the genotyping technique(Fig. 2).
DISCUSSION
The availability of the complete genome of a Brazilianstrain of X. citri pv. citri with a wide host range among citrusplants (pathotype A) (17) made it easier to design appro-priate markers and predict the DNA fragments produced bydifferent PCR-based techniques (9, 12, 45). This genome isrelatively rich in insertion sequence elements and tandemrepeats (17, 51). We evaluated the potentials of AFLP,IS-LM-PCR, and MLVA techniques as genotyping methods
for molecular epidemiology studies of X. citri pv. citri. Theanalysis of the genetic diversity of large collections or pop-ulations requires discriminative, high-throughput tech-niques able to identify strain types and provide reproducibleresults. Despite the worldwide distribution and the majoreconomic importance of this quarantine organism, no com-parative evaluation of different molecular typing techniquesfor population structure analyses based on large strain col-lections has been conducted previously. Earlier studies con-sidered primarily the usefulness of PFGE, AFLP, or rep-PCR markers in terms of their abilities to determine geneticrelationships between Xanthomonas pathovars that arepathogenic to citrus and X. citri pv. citri pathological vari-ants (16, 19, 39, 44, 68).
All three techniques used in this study typed all strains,except in the case of the XL5 VNTR locus, for which noamplicon was obtained from a limited number of strains withinpathotype A*. MLVA revealed the greatest genetic diversity(based on Nei’s and Hunter’s indices), followed by IS-LM-PCR and AFLP analyses. For instance, pathotype A* strainsfrom Saudi Arabia and Iran were not differentiated usingAFLP, while IS-LM-PCR analysis and MLVA clearly sepa-rated strains from the two origins. Furthermore, MLVA iden-tified each Iranian strain as a haplotype. The discriminatorypowers of these methods were markedly greater than that ofrep-PCR, based on results for a subset of 34 strains used in ourstudy and a previous study by Cubero and Graham (16).VNTRs are known to exhibit much higher levels of mutationthan other parts of the genome (35). The discriminatory powerof MLVA was indeed found to be higher than or similar tothose of insertion sequence-based typing techniques in popu-
FIG. 2. Population structure among the collection of X. citri pv. citri pathotype Aw strains and pathotype A* strains from the six geographicalorigins as inferred by STRUCTURE and assignment of individuals to the K ancestral groups. Numbers on the x axis indicate the geographicalorigins of strains, as follows: 1, Saudi Arabia; 2, Florida; 3, the Indian peninsula; 4, Iran; 5, Oman; and 6, Thailand or Cambodia. Each strain isrepresented by a vertical segment. Inside each segment, the length of each color section (y axis) indicates the estimated probability of assignmentto each of the defined K ancestral groups. The use of the same color suggests that strains have a common ancestral group.
1180 BUI THI NGOC ET AL. APPL. ENVIRON. MICROBIOL.
on Novem
ber 18, 2014 by guesthttp://aem
.asm.org/
Dow
nloaded from
lation studies of Mycobacterium bovis and M. tuberculosis (4,40, 41).
The comparison of experimental data with in silico dataderived from the complete sequence of X. citri pv. citri strain306 (17) indicated that the MLVA scheme was 100% accurate,whereas not all predicted fragments were amplified in theIS-LM-PCR and AFLP analyses, leading to accuracy values of87 and 75%, respectively. This finding suggests that digestionand/or ligation may be deficient at some sites. The level ofaccuracy obtained by the AFLP method for X. citri pv. citristrain 306 was between those obtained previously for a strain ofEscherichia coli (92%) and two strains of M. tuberculosis (55and 66%) (7, 65). Although the overall intralaboratory repro-ducibility of AFLP and IS-LM-PCR data was good (95 to97%), it did not reach that obtained for MLVA results (100%).Consistent with our data, previous interlaboratory compari-sons of DNA typing methods for M. tuberculosis indicatedbetter reproducibility of MLVA results than IS-LM-PCR andAFLP results (40).
Based on results from Mantel tests of dissimilarities, AFLP,IS-LM-PCR, and MLVA data were significantly congruent.Congruency among the data from the different methods wasfurther observed for the parameters of genetic diversity. Patho-type A* strains were always clearly separated from the largemajority of pathotype A strains. However, a few pathotype Astrains were consistently shown to be related to pathotype A*strains. These strains originated from Bangladesh and India.Interestingly, they were all isolated from lime and displayedpathogenicity patterns typical of pathotype A. These observa-tions suggest that variations in host range may have occurred inpopulations of X. citri pv. citri that originated from the Indianpeninsula. Populations of the pathogen from this regiondisplay the greatest genetic diversity revealed to date, with thepresence of two groups of pathotype A* strains and withpathotype A strains that were genetically related either topathotype A strains present in southeast Asia or to pathotypeA* strains. It is likely that undescribed genetic and/or patho-logical variants of the pathogen are yet to be discovered.
Clusters identified in relation to the geographical origins ofthe strains were consistently reproduced among X. citri pv. citripathotype A* strains, whatever the typing technique. A patho-type A* strain was detected in Cambodia in 2007 (11), and thisstrain was closely related to pathotype A* strains from Thai-land (10). Similarly, pathotype Aw strains originating fromFlorida were closely related to some pathotype A* strainsisolated in India: these strains belonged to a single cluster withhigh bootstrap values, whatever the typing technique, and noneof them could be typed using the XL5 VNTR locus. In addi-tion, STRUCTURE suggested a common ancestry for patho-type Aw strains and the pathotype A* strains isolated in India.Thus, our molecular data fully support the results of investi-gations in Florida, which revealed that pathotype Aw strainshad been isolated from Mexican lime in the yard of a familythat had recently arrived from India and did not reveal thesource of the diseased plant (62). The distribution area ofpathotype A* strains in Asia is larger than previously reportedand confirms the epidemiological significance of this narrow-host-range pathotype.
Interestingly, the level of genetic diversity among pathotypeA* strains was higher than that among pathotype A strains,
whatever the typing technique. This finding suggests thatpathotype A* may have a longer evolutionary history. Li et al.(45) analyzed a few lime herbarium specimens collected inwestern Asia during the first half of the 20th century, and noconclusion could be drawn. Genetic differentiation analysesindicated that pathotype A* strain populations are well-struc-tured. The number of ancestral populations computed bySTRUCTURE was genotyping technique dependent, butpathotype A* strains could originate from at least two ances-tral populations. Pathotype A* strains from Saudi Arabia wereconsistently classified into two populations, whatever the typ-ing technique, which may suggest at least two different inci-dents involving the introduction of the pathogen into thiscountry.
Based on NJ trees and MDS, no clear geographically in-ferred structure among the pathotype A strains was revealed.This result is consistent with those of previous studies targetingdiversity by using rep-PCR or transposable elements (16, 45).Significant patterns of isolation by distance were observed atthe level of the Asian continent. The low degree of globalgenetic diversity and the significant isolation by distance sug-gest a spatially limited gene flow for pathotype A strains and/ora rather short evolutionary history.
The different levels of structuring were also reflected inthe different values of differentiation estimates for subpopu-lations of each pathotype. The elevated RST values com-pared to FST estimates calculated from the MLVA data setsuggested that the geographical subpopulations of X. citripv. citri or of each pathotype differed not only in allelefrequencies but also significantly in the evolutionary dis-tance between alleles. Different estimates of FST from eachmolecular marker data set revealed lower values for MLVAthan for the two biallelic marker systems. MLVA revealedthe highest discriminatory power, as shown in this study bythe identification of 209 different haplotypes among 234strains. Estimations of FST depend partly on the level ofwithin-population diversity, and estimates derived fromhighly mutable loci should be considered with caution (14).Gene flow between populations homogenizes allele frequen-cies and tends to decrease genetic differentiation. Further-more, the differentiation level is not affected strictly by themutation potential of the observed loci but also by the ratiobetween mutation and migration (8). This situation makesFST sensitive to the mutation rates for pathogens such as X.citri pv. citri with limited long-distance migration (31). TheRST analogue values from the MLVA data set are indepen-dent of the mutation rate and are more appropriate esti-mates than FST values, given that tandem repeats in ourscheme can be considered as evolving by the progressivegain or loss of single repeat units. RST values were in accor-dance with the estimates of genetic differentiation obtainedfrom the two biallelic data sets. It is likely that the signifi-cance of the long-distance movement of infected plant ma-terial, although globally limited, is pathotype dependent.Pathotype A strains can be transported by most of the citrusspecies, primarily through propagative material, providingmuch greater potential for the exchange of pathotype Astrains than for that of pathotype A* strains, which arehosted mainly by limes and, to a lesser extent, C. macro-phylla. In many Asiatic countries, lime trees are produced
VOL. 75, 2009 GENETIC DIVERSITY OF X. CITRI PV. CITRI IN ASIA 1181
on Novem
ber 18, 2014 by guesthttp://aem
.asm.org/
Dow
nloaded from
from seed and C. macrophylla is used mainly as rootstock,and the pathogen is not seed borne (15). These host char-acteristics drastically decrease the movement of budwood (amajor source of long-distance spread). The low level ofmigration of pathotype A* strains, together with their nar-row host range, minimizes gene flow, which can explain thegreater genetic differentiation observed within A* subpopu-lations. This observation may also be the result of thegreater genetic diversity observed within X. citri pv. citripathotype A*.
Significant levels of linkage disequilibrium among theVNTR loci were observed using a multilocus estimate, whichrevealed the absence of frequent genetic exchanges. Given ourstrain collection, however, this finding should be consideredwith caution because specific ecological niche and/or geo-graphical barriers may explain the limited DNA exchange ob-served (49). Nevertheless, these results, together with the sig-nificant congruence among data derived from the threeindependent genotyping techniques, suggested that bothpathotypes of X. citri pv. citri are clonal. Testing for nonran-dom association of loci on small scales should confirm the levelof clonality, which may vary among populations. Extensivesampling of pathotype A* strains in the Indian peninsula, forwhich admixtures within some individual strains suggest differ-ent origins, may reveal a population structure which differsfrom that in other geographical areas.
The various discriminative powers of the three genotypingtechniques made it possible to conduct molecular epidemiol-ogy analyses on different spatial scales and for different pur-poses. Highly variable markers, such as VNTRs, are notadapted for international long-term strain screening (70). Al-though the concomitant use of several typing techniquesstrengthens analyses, the increased discriminatory power of theIS-LM-PCR method compared to those of rep-PCR (16) andAFLP (this study) analyses makes this technique most appro-priate for the global surveillance of non-epidemiologically re-lated strains of X. citri pv. citri. IS-LM-PCR targets transpos-able elements, similar to the technique developed by Li et al.(45). IS-LM-PCR seems superior because of the smaller num-ber of PCR amplifications required. Furthermore, in contrastwith the method used by Li et al. (45), IS-LM-PCR was provedto provide results highly congruent with those of the AFLPmethod, a technique well-suited for analyzing phylogeneticrelationships among xanthomonads (55). These findings sug-gest that the transposition of insertion sequences in the ge-nome of X. citri pv. citri occurs so rarely that it does not disturbthe phylogenetic signal. In previous interlaboratory tests inwhich nine typing techniques were compared, two IS-LM-PCR-based techniques were the best alternative to MLVA forM. tuberculosis in terms of reproducibility (40). This observa-tion suggests that our IS-LM-PCR protocol may be amenableto an efficient interlaboratory typing system.
VNTR loci display a high degree of polymorphism and arewell-adapted for the typing of epidemiologically related iso-lates. Among the three typing techniques used in this study,MLVA best described the X. citri pv. citri intrapopulationgenetic variation. MLVA may be useful for tracing haplotypesduring epidemics on small spatial scales and for investigatinginoculum sources associated with outbreaks. MLVA wasproved previously to be very useful for the discrimination of
anthrax-causing bacterial populations with a low level of ge-netic diversity (38). We are currently evaluating MLVA for themolecular epidemiology of X. citri on different spatial scalesand in different epidemiological contexts (such as integratedmanagement and eradication).
ACKNOWLEDGMENTS
We thank E. L. Civerolo for helpful discussion and K. Vital, C.Boyer, and V. Ledoux for their technical expertise.
The European Union (FEOGA and FEDER), Conseil Regional deLa Reunion, and CIRAD provided financial support. The platform“Genotyping of Pathogens and Public Health” acknowledges financialsupport from the Institut Pasteur (Paris, France) and the Institut deVeille Sanitaire (Saint-Maurice, France).
REFERENCES
1. Abdi, H. 2007. Metric multidimensional scaling (MDS): analyzing distancematrices, p. 1–13. In N. Salkind (ed.), Encyclopedia of measurement andstatistics. Sage, Thousand Oaks, CA.
2. Ah-You, N., L. Gagnevin, F. Chiroleu, E. Jouen, J. R. Neto, and O. Pruvost.2007. Pathological variations within Xanthomonas campestris pv. mangif-eraeindicae support its separation into three distinct pathovars that can bedistinguished by amplified fragment length polymorphism. Phytopathology97:1568–1577.
3. Ah-You, N., L. Gagnevin, P. A. D. Grimont, S. Brisse, X. Nesme, F. Chiroleu,L. Bui Thi Ngoc, E. Jouen, P. Lefeuvre, C. Verniere, and O. Pruvost. 2009.Polyphasic characterization of xanthomonads pathogenic to Anacardiaceaeand their relatedness to different Xanthomonas species. Int. J. Syst. Evol.Microbiol. 59:306–318.
4. Allix, C., K. Walravens, C. Saegerman, J. Godfroid, P. Supply, and M.Fauville-Dufaux. 2006. Evaluation of the epidemiological relevance of vari-able-number tandem-repeat genotyping of Mycobacterium bovis and com-parison of the method with IS6110 restriction fragment length polymorphismanalysis and spoligotyping. J. Clin. Microbiol. 44:1951–1962.
5. Al-Saadi, A., J. D. Reddy, Y. P. Duan, A. M. Brunings, Q. Yuan, and D. W.Gabriel. 2007. All five host-range variants of Xanthomonas citri carry onepthA homolog with 17.5 repeats that determines pathogenicity on citrus, butnone determine host-range variation. Mol. Plant-Microbe Interact. 20:934–943.
6. Anonymous. 2007. List of new names and new combinations previouslyeffectively, but not validly, published. Int. J. Syst. Evol. Microbiol. 57:893–897.
7. Arnold, C., L. Metherell, J. P. Clewley, and J. Stanley. 1999. Predictivemodelling of fluorescent AFLP: a new approach to the molecular epidemi-ology of E. coli. Res. Microbiol. 150:33–44.
8. Balloux, F., and N. Lugon-Moulin. 2002. The estimation of population dif-ferentiation with microsatellite markers. Mol. Ecol. 11:155–165.
9. Bui Thi Ngoc, L., C. Verniere, J. Belasque, K. Vital, S. Boutry, L. Gagnevin,and O. Pruvost. 2008. Ligation-mediated PCR, a fast and reliable techniquefor insertion sequence-based typing of Xanthomonas citri pv. citri. FEMSMicrobiol. Lett. 288:33–39.
10. Bui Thi Ngoc, L., C. Verniere, O. Pruvost, N. Kositcharoenkul, and S.Phawichit. 2007. First report in Thailand of Xanthomonas axonopodis pv.citri-A* causing citrus canker on lime. Plant Dis. 91:771.
11. Bui Thi Ngoc, L., C. Verniere, O. Pruvost, S. Thavrith, and G. I. Johnson.2008. First report of Xanthomonas axonopodis pv. citri-A* causing citruscanker on lime in Cambodia. Plant Dis. 92:1588.
12. Bui Thi Ngoc, L., C. Verniere, K. Vital, F. Guerin, L. Gagnevin, S. Brisse, N.Ah-You, and O. Pruvost. 2009. Fourteen minisatellite markers for populationstudies of the citrus canker bacterium, Xanthomonas citri pv. citri. Mol. Ecol.Res. 9:125–127.
13. Carvalho, F. M. S., L. P. C. Caramori, and R. P. Leite. 2005. Geneticdiversity of Xanthomonas axonopodis pv. citri based on plasmid profile andpulsed field gel electrophoresis. Genet. Mol. Biol. 28:446–451.
14. Charlesworth, B. 1998. Measures of divergence between populations and theeffect of forces that reduce variability. Mol. Biol. Evol. 15:538–543.
15. Civerolo, E. L. 1984. Bacterial canker disease of citrus. J. Rio Grande ValleyHortic. Soc. 37:127–145.
16. Cubero, J., and J. H. Graham. 2002. Genetic relationship among worldwidestrains of Xanthomonas causing canker in citrus species and design of newprimers for their identification by PCR. Appl. Environ. Microbiol. 68:1257–1264.
17. Da Silva, A. C., J. A. Ferro, F. C. Reinach, C. S. Farah, L. R. Furlan, R. B.Quaggio, C. B. Monteiro-Vitorello, M. A. Van Sluys, N. F. Almeida, L. M.Alves, A. M. Do Amaral, M. C. Bertolini, L. E. Camargo, G. Camarotte, F.Cannavan, J. Cardozo, F. Chambergo, L. P. Ciapina, R. M. Cicarelli, L. L.Coutinho, J. R. Cursino-Santos, H. El-Dorry, J. B. Faria, A. J. Ferreira, R. C.Ferreira, M. I. Ferro, E. F. Formighieri, M. C. Franco, C. C. Greggio, A.
1182 BUI THI NGOC ET AL. APPL. ENVIRON. MICROBIOL.
on Novem
ber 18, 2014 by guesthttp://aem
.asm.org/
Dow
nloaded from
Gruber, A. M. Katsuyama, L. T. Kishi, R. P. Leite, E. G. Lemos, M. V.Lemos, E. C. Locali, M. A. Machado, A. M. Madeira, N. M. Martinez-Rossi,E. C. Martins, J. Meidanis, C. F. Menck, C. Y. Miyaki, D. H. Moon, L. M.Moreira, M. T. Novo, V. K. Okura, M. C. Oliveira, V. R. Oliveira, H. A.Pereira, A. Rossi, J. A. Sena, C. Silva, R. F. De Souza, L. A. Spinola, M. A.Takita, R. E. Tamura, E. C. Teixeira, R. I. Tezza, M. Trindade dos Santos,D. Truffi, S. M. Tsai, F. F. White, J. C. Setubal, and J. P. Kitajima. 2002.Comparison of the genomes of two Xanthomonas pathogens with differinghost specificities. Nature 417:459–463.
18. Dye, D. W., J. F. Bradbury, M. Goto, A. C. Hayward, R. A. Lelliott, and M. N.Schroth. 1980. International standards for naming pathovars of phytopatho-genic bacteria and a list of pathovar names and pathotype strains. Rev. PlantPathol. 59:153–168.
19. Egel, D. S., J. H. Graham, and R. E. Stall. 1991. Genomic relatedness ofXanthomonas campestris strains causing diseases of citrus. Appl. Environ.Microbiol. 57:2724–2730.
20. El Yacoubi, B., A. M. Brunings, Q. Yuan, S. Shankar, and D. W. Gabriel.2007. In planta horizontal transfer of a major pathogenicity effector gene.Appl. Environ. Microbiol. 73:1612–1621.
21. Evanno, G., S. Regnaut, and J. Goudet. 2005. Detecting the number ofclusters of individuals using the software STRUCTURE: a simulation study.Mol. Ecol. 14:2611–2620.
22. Excoffier, L., G. Laval, and S. Schneider. 2005. Arlequin (version 3.0): anintegrated software package for population genetics data analysis. Evol.Bioinform. 1:47–50.
23. Falush, D., M. Stephens, and J. K. Pritchard. 2007. Inference of populationstructure using multilocus genotype data: dominant markers and null alleles.Mol. Ecol. Notes 7:574–578.
24. Falush, D., M. Stephens, and J. K. Pritchard. 2003. Inference of populationstructure using multilocus genotype data: linked loci and correlated allelefrequencies. Genetics 164:1567–1587.
25. Feil, E. J., B. C. Li, D. M. Aanensen, W. P. Hanage, and B. G. Spratt. 2004.eBURST: inferring patterns of evolutionary descent among clusters of re-lated bacterial genotypes from multilocus sequence typing data. J. Bacteriol.186:1518–1530.
26. Gascuel, O. 1997. Concerning the NJ algorithm and its unweighted versionUNJ, p. 149–171. In B. Mirkin, F. R. McMorris, F. Roberts, and A. Rzhetsky(ed.), Mathematical hierarchies and biology, vol. 37. American Mathemati-cal Society, Providence, RI.
27. Goodman, S. J. 1997. RST Calc: a collection of computer programs forcalculating estimates of genetic differentiation from microsatellite data anddetermining their significance. Mol. Ecol. 6:881–885.
28. Gottwald, T. R., J. H. Graham, and D. S. Egel. 1992. Analysis of foci ofAsiatic citrus canker in a Florida citrus orchard. Plant Dis. 76:389–396.
29. Gottwald, T. R., J. H. Graham, and T. S. Schubert. 12 August 2002, postingdate. Citrus canker: the pathogen and its impact. Plant Health Prog. doi:10.1094/PHP-2002-0812-01-RV.
30. Gottwald, T. R., and M. Irey. 23 May 2007, posting date. Post-hurricaneanalysis of citrus canker. II. Predictive model estimation of disease spreadand area potentially impacted by various eradication protocols followingcatastrophic weather events. Plant Health Prog. doi:10.1094/PHP-2007-0405-01-RS.
31. Graham, J. H., T. R. Gottwald, J. Cubero, and D. S. Achor. 2004. Xanthomo-nas axonopodis pv. citri: factors affecting successful eradication of citruscanker. Mol. Plant Pathol. 5:1–15.
32. Hacker, J., and J. B. Kaper. 2000. Pathogenicity islands and the evolution ofmicrobes. Annu. Rev. Microbiol. 54:641–679.
33. Hayward, A. C. 1993. The hosts of Xanthomonas, p. 1–119. In J. G. Swingsand E. L. Civerolo (ed.), Xanthomonas. Chapman & Hall, London, UnitedKingdom.
34. Hunter, P. R., and M. A. Gaston. 1988. Numerical index of the discrimina-tory ability of typing systems: an application of Simpson’s index of diversity.J. Clin. Microbiol. 26:2465–2466.
35. Jarne, P., and P. J. L. Lagoda. 1996. Microsatellites, from molecules topopulations and back. Trends Ecol. Evol. 11:424–429.
36. Kalinowski, S. T. 2004. Counting alleles with rarefaction: private alleles andhierarchical sampling designs. Conserv. Genetics 5:539–543.
37. Kalinowski, S. T. 2005. HP-RARE 1.0: a computer program for performingrarefaction on measures of allelic richness. Mol. Ecol. Notes 5:187–189.
38. Keim, P., M. N. Van Ert, T. Pearson, A. J. Vogler, L. Y. Huynh, and D. M.Wagner. 2004. Anthrax molecular epidemiology and forensics: using theappropriate marker for different evolutionary scales. Infect. Genet. Evol.4:205–213.
39. Khodakaramian, G., and J. Swings. 2002. AFLP fingerprinting of the strainsof Xanthomonas axonopodis inducing citrus canker disease in southern Iran.J. Phytopathol. 150:227–231.
40. Kremer, K., C. Arnold, A. Cataldi, M. C. Gutierrez, W. H. Haas, S. Pan-aiotov, R. A. Skuce, P. Supply, A. G. M. Van der Zanden, and D. VanSoolingen. 2005. Discriminatory power and reproducibility of novel DNAtyping methods for Mycobacterium tuberculosis complex strains. J. Clin. Mi-crobiol. 43:5628–5638.
41. Kremer, K., B. K. Y. Au, P. C. W. Yip, R. Skuce, P. Supply, K. M. Kam, and
D. Van Soolingen. 2005. Use of variable-number tandem-repeat typing todifferentiate Mycobacterium tuberculosis Beijing family isolates from HongKong and comparison with IS6110 restriction fragment length polymorphismtyping and spoligotyping. J. Clin. Microbiol. 43:314–320.
42. Labate, J. A. 2000. Software for population genetic analyses of molecularmarker data. Crop Sci. 40:1521–1528.
43. Leach, J. E., and F. F. White. 1996. Bacterial avirulence genes. Annu. Rev.Phytopathol. 34:153–179.
44. Lee, Y. H., S. Lee, D. H. Lee, S. H. Ji, H. Y. Chang, S. Heu, J. W. Hyun, D. S.Ra, and E. W. Park. 2008. Differentiation of citrus bacterial canker strains inKorea by host range, rep-PCR fingerprinting and 16S rDNA analysis. Eur. J.Plant Pathol. 121:97–102.
45. Li, W., Q. Song, R. H. Brlansky, and J. S. Hartung. 2007. Genetic diversityof citrus bacterial canker pathogens preserved in herbarium specimens. Proc.Natl. Acad. Sci. USA 104:18427–18432.
46. Lindstedt, B. A. 2005. Multiple-locus variable number tandem repeats anal-ysis for genetic fingerprinting of pathogenic bacteria. Electrophoresis 26:2567–2582.
47. Lynch, M., and G. Milligan. 1994. Analysis of population genetic structurewith RAPD markers. Mol. Ecol. 3:91–99.
48. Mantel, N. 1967. The detection of disease clustering and a generalizedregression approach. Cancer Res. 27:209–220.
49. Maynard-Smith, J., N. H. Smith, M. O’Rourke, and B. G. Spratt. 1993. Howclonal are bacteria? Proc. Natl. Acad. Sci. USA 90:4384–4388.
50. Minsavage, G. V., D. Dahlbeck, M. C. Whalen, B. Kearney, U. Bonas, B. J.Staskawicz, and R. E. Stall. 1990. Gene-for-gene relationships specifyingdisease resistance in Xanthomonas campestris pv. vesicatoria-pepper interac-tions. Mol. Plant-Microbe Interact. 3:41–47.
51. Mrazek, J., X. Guo, and A. Shah. 2007. Simple sequence repeats in prokary-otic genomes. Proc. Natl. Acad. Sci. USA 104:8472–8477.
52. Peakall, R., and P. E. Smouse. 2006. GENALEX 6: genetic analysis in Excel.Population genetic software for teaching and research. Mol. Ecol. Notes6:288–295.
53. Picard, Y., P. Roumagnac, D. Legrand, L. Humeau, I. Robene-Soustrade, F.Chiroleu, L. Gagnevin, and O. Pruvost. 2008. Polyphasic characterization ofXanthomonas axonopodis pv. allii associated with outbreaks of bacterialblight on three Allium species in the Mascarene archipelago. Phytopathology98:919–925.
54. Pritchard, J. K., M. Stephens, and P. Donnelly. 2000. Inference of popula-tion structure using multilocus genotype data. Genetics 155:945–959.
55. Rademaker, J. L. W., B. Hoste, F. J. Louws, K. Kersters, J. Swings, L.Vauterin, P. Vauterin, and F. J. De Bruijn. 2000. Comparison of AFLP andrep-PCR genomic fingerprinting with DNA-DNA homology studies: Xan-thomonas as a model system. Int. J. Syst. Evol. Microbiol. 50:665–677.
56. Rademaker, J. L. W., F. J. Louws, M. H. Schultz, U. Rossbach, L. Vauterin,J. Swings, and F. J. De Bruijn. 2005. A comprehensive species to straintaxonomic framework for Xanthomonas. Phytopathology 95:1098–1111.
57. Raymond, M., and F. Rousset. 1995. An exact test for population differen-tiation. Evolution 49:1280–1283.
58. Rousset, F. 1997. Genetic differentiation and estimation of gene flow from Fstatistics under isolation by distance. Genetics 145:1219–1228.
59. Saitou, N., and M. Nei. 1987. The neighbor-joining method: a new methodfor reconstructing phylogenetic trees. Mol. Biol. Evol. 4:406–425.
60. Schaad, N. W., E. Postnikova, G. H. Lacy, A. Sechler, I. Agarkova, P. E.Stromberg, V. K. Stromberg, and A. K. Vidaver. 2006. Emended classifica-tion of xanthomonad pathogens on citrus. Syst. Appl. Microbiol. 29:690–695.
61. Schaad, N. W., E. Postnikova, G. H. Lacy, A. Sechler, I. Agarkova, P. E.Stromberg, V. K. Stromberg, and A. K. Vidaver. 2005. Reclassification ofXanthomonas campestris pv. citri (ex Hasse 1915) Dye 1978 forms A, B/C/D,and E as X. smithii subsp. citri (ex Hasse) sp. nov. nom. rev. comb. nov., X.fuscans subsp. aurantifolii (ex Gabriel 1989) sp. nov. nom. rev. comb. nov.,and X. alfalfae subsp. citrumelo (ex Riker and Jones) Gabriel et al., 1989 sp.nov. nom. rev. comb. nov.; X. campestris pv. malvacearum (ex Smith 1901)Dye 1978 as X. smithii subsp. smithii nov. comb. nov. nom. nov.; X. campestrispv. alfalfae (ex Riker and Jones, 1935) Dye 1978 as X. alfalfae subsp. alfalfae(ex Riker et al., 1935) sp. nov. nom. rev.; and “var. fuscans” of X. campestrispv. phaseoli (ex Smith, 1987) Dye 1978 as X. fuscans subsp. fuscans sp. nov.Syst. Appl. Microbiol. 28:494–518.
62. Schubert, T., S. Rizvi, X. Sun, T. Gottwald, J. Graham, and W. Dixon. 2001.Meeting the challenge of eradicating citrus canker in Florida—again. PlantDis. 85:341–356.
63. Scott, T. M., J. B. Rose, T. M. Jenkins, S. R. Farrah, and J. Lukasik. 2002.Microbial source tracking: current methodology and future directions. Appl.Environ. Microbiol. 68:5796–5803.
64. Shen, Y. W., and P. Ronald. 2002. Molecular determinants of disease andresistance in interactions of Xanthomonas oryzae pv. oryzae and rice. Mi-crobes Infect. 4:1361–1367.
65. Sims, E. J., M. Goyal, and C. Arnold. 2002. Experimental versus in silicofluorescent amplified fragment length polymorphism analysis of Mycobacte-rium tuberculosis: improved typing with an extended fragment range. J. Clin.Microbiol. 40:4072–4076.
VOL. 75, 2009 GENETIC DIVERSITY OF X. CITRI PV. CITRI IN ASIA 1183
on Novem
ber 18, 2014 by guesthttp://aem
.asm.org/
Dow
nloaded from
66. Slatkin, M. 1995. A measure of population subdivision based on micro-satellite allele frequencies. Genetics 139:457–462.
67. Struelens, M. J., Y. De Gheldre, and A. Deplano. 1998. Comparative andlibrary epidemiologic typing systems: outbreak investigations versus surveil-lance systems. Infect. Control Hosp. Epidemiol. 19:565–569.
68. Sun, X. A., R. E. Stall, J. B. Jones, J. Cubero, T. R. Gottwald, J. H. Graham,W. N. Dixon, T. S. Schubert, P. H. Chaloux, V. K. Stromberg, G. H. Lacy,and B. D. Sutton. 2004. Detection and characterization of a new strain ofcitrus canker bacteria from key Mexican lime and Alemow in South Florida.Plant Dis. 88:1179–1188.
69. Van Belkum, A. 2002. Molecular typing of micro-organisms: at the centre ofdiagnostics, genomics and pathogenesis of infectious diseases? J. Med. Mi-crobiol. 51:7–10.
70. Van Belkum, A., M. Struelens, A. De Visser, H. Verbrugh, and M. Tibayrenc.2001. Role of genomic typing in taxonomy, evolutionary genetics, and mi-crobial epidemiology. Clin. Microbiol. Rev. 14:547–560.
71. Vekemans, X., T. Beauwens, M. Lemaire, and I. Roldan-Ruiz. 2002. Data
from amplified fragment length polymorphism (AFLP) markers show indi-cation of size homoplasy and of a relationship between degree of homoplasyand fragment size. Mol. Ecol. 11:139–151.
72. Verniere, C., J. S. Hartung, O. P. Pruvost, E. L. Civerolo, A. M. Alvarez, P.Maestri, and J. Luisetti. 1998. Characterization of phenotypically distinctstrains of Xanthomonas axonopodis pv. citri from Southwest Asia. Eur. J.Plant Pathol. 104:477–487.
73. Vos, P., R. Hogers, M. Bleeker, M. Reijans, T. Vandelee, M. Hornes, A.Frijters, J. Pot, J. Peleman, M. Kuiper, and M. Zabeau. 1995. AFLP: a newtechnique for DNA fingerprinting. Nucleic Acids Res. 23:4407–4414.
74. Wicker, E., L. Grassart, R. Coranson-Beaudu, D. Mian, C. Guilbaud, M.Fegan, and P. Prior. 2007. Ralstonia solanacearum strains from Martinique(French West Indies) exhibiting a new pathogenic potential. Appl. Environ.Microbiol. 73:6790–6801.
75. Woolhouse, M. E. J., D. T. Haydon, and R. Antia. 2005. Emerging pathogens:the epidemiology and evolution of species jumps. Trends Ecol. Evol. 20:238–244.
1184 BUI THI NGOC ET AL. APPL. ENVIRON. MICROBIOL.
on Novem
ber 18, 2014 by guesthttp://aem
.asm.org/
Dow
nloaded from
Related Documents