From HP Lattice Models to Real Proteins: Coordination Number Prediction Using Learning Classifier Systems Michael Stout 1 , Jaume Bacardit 1 , Jonathan D. Hirst 2 , Natalio Krasnogor 1 , and Jacek Blazewicz 3 1 Automated Scheduling, Optimization and Planning research group, School of Computer Science and IT, University of Nottingham, Jubilee Campus, Wollaton Road, Nottingham NG8 1BB, UK {jqb, mqs, nxk}@cs.nott.ac.uk 2 School of Chemistry, University of Nottingham, University Park, Nottingham NG7 2RD, UK [email protected] 3 Poznan University of Technology, Institute of Computing Science, ul. Piotrowo 3a, Poznan 60-965, Poland [email protected] Abstract. Prediction of the coordination number (CN) of residues in proteins based solely on protein sequence has recently received renewed attention. At the same time, simplified protein models such as the HP model have been used to understand protein folding and protein structure prediction. These models represent the sequence of a protein using two residue types: hydrophobic and polar, and restrict the residue locations to those of a lattice. The aim of this paper is to compare CN prediction at three levels of abstraction a) 3D Cubic lattice HP model proteins, b) Real proteins represented by their HP sequence and c) Real proteins using residue sequence alone. For the 3D HP lattice model proteins the CN of each residue is simply the number of neighboring residues on the lattice. For the real proteins, we use a recent real-valued definition of CN proposed by Kinjo et al. To perform the predictions we use GAssist, a re- cent evolutionary computation based machine learning method belonging to the Learning Classifier System (LCS) family. Its performance was com- pared against some alternative learning techniques. Predictions using the HP sequence representation with only two residue types were only a little worse than those using a full 20 letter amino acid alphabet (64% vs 68% for two state prediction, 45% vs 50% for three state prediction and 30% vs 33% for five state prediction). That HP sequence information alone can result in predictions accuracies that are within 5% of those obtained using full residue type information indicates that hydrophobicity is a key determinant of CN and further justifies studies of simplified models. 1 Introduction The prediction of the 3D structures of proteins is both a fundamental and dif- ficult problem in computational biology. A popular approach to this problem is F. Rothlauf et al. (Eds.): EvoWorkshops 2006, LNCS 3907, pp. 208–220, 2006. c Springer-Verlag Berlin Heidelberg 2006

Welcome message from author
This document is posted to help you gain knowledge. Please leave a comment to let me know what you think about it! Share it to your friends and learn new things together.
Transcript
From HP Lattice Models to Real Proteins:
Coordination Number Prediction UsingLearning Classifier Systems
Michael Stout1, Jaume Bacardit1, Jonathan D. Hirst2,Natalio Krasnogor1, and Jacek Blazewicz3
1 Automated Scheduling, Optimization and Planning research group,School of Computer Science and IT, University of Nottingham,Jubilee Campus, Wollaton Road, Nottingham NG8 1BB, UK
{jqb, mqs, nxk}@cs.nott.ac.uk2 School of Chemistry, University of Nottingham, University Park,
Nottingham NG7 2RD, [email protected]
3 Poznan University of Technology, Institute of Computing Science,ul. Piotrowo 3a, Poznan 60-965, Poland
Abstract. Prediction of the coordination number (CN) of residues inproteins based solely on protein sequence has recently received renewedattention. At the same time, simplified protein models such as the HPmodel have been used to understand protein folding and protein structureprediction. These models represent the sequence of a protein using tworesidue types: hydrophobic and polar, and restrict the residue locationsto those of a lattice. The aim of this paper is to compare CN predictionat three levels of abstraction a) 3D Cubic lattice HP model proteins,b) Real proteins represented by their HP sequence and c) Real proteinsusing residue sequence alone. For the 3D HP lattice model proteins theCN of each residue is simply the number of neighboring residues on thelattice. For the real proteins, we use a recent real-valued definition of CNproposed by Kinjo et al. To perform the predictions we use GAssist, a re-cent evolutionary computation based machine learning method belongingto the Learning Classifier System (LCS) family. Its performance was com-pared against some alternative learning techniques. Predictions using theHP sequence representation with only two residue types were only a littleworse than those using a full 20 letter amino acid alphabet (64% vs 68%for two state prediction, 45% vs 50% for three state prediction and 30%vs 33% for five state prediction). That HP sequence information alonecan result in predictions accuracies that are within 5% of those obtainedusing full residue type information indicates that hydrophobicity is a keydeterminant of CN and further justifies studies of simplified models.
1 Introduction
The prediction of the 3D structures of proteins is both a fundamental and dif-ficult problem in computational biology. A popular approach to this problem is
F. Rothlauf et al. (Eds.): EvoWorkshops 2006, LNCS 3907, pp. 208–220, 2006.c© Springer-Verlag Berlin Heidelberg 2006

From HP Lattice Models to Real Proteins 209
to predict some specific attributes of a protein, such as the secondary structure,the solvent accessibility or the coordination number. The coordination number(CN) problem is defined as the prediction, for a given residue, of the number ofresidues from the same protein that are in contact with it. Two residues are saidto be in contact when the distance between the two is below a certain threshold.This problem is closely related to contact map (CM) prediction. It is generallybelieved that functional sites in proteins are formed from a pocket of residuestermed an active site. Active site residues consist of a number of buried (highCN) residues hence studies of CN are of relevance to understanding proteinfunction.
While protein structure prediction remains unsolved, researchers have re-sorted to simplified protein models to try to gain understanding of both the pro-cess of folding and the algorithms needed to predict it [1, 2, 3, 4, 5]. Approacheshave included fuzzy sets, cellular automata, L-systems and memetic algorithms[6, 7, 8, 9, 10, 11]. One common simplification is to focus only on the residues(C-alpha or C-beta atoms) rather than all the atoms in the protein. A furthersimplification is to reduce the number of residue types to less than twenty byusing residue sequence representations based, for instance, on physical proper-ties such as hydrophobicity, as in the so called hydrophobic/polar (HP) models.Another simplification is to reduce the number of spatial degrees of freedomby restricting the atom or residue locations to those of a lattice [3, 5]. Latticesof various geometries have been explored, e.g., two-dimensional triangular andsquare geometries or three-dimensional diamond and face centered cubic [9].
The aim of this paper is to compare CN prediction for simplified HP latticemodel proteins (Lattice-HP) with the prediction of the same feature for real pro-teins using either all twenty amino acid types (Real-AA) or using only the HPrepresentation (Real-HP). This was done for several levels of class assignment(two state, three state and five state) and for a range of machine learning algo-rithms (LCS, C4.5 and NaiveBayes). The CN definition we use for real proteinswas proposed recently by Kinjo et al.[12]. This is a continuous valued function,rather than the more frequently used discrete formulation [13].
The machine learning algorithm we focus on belongs to the family of LearningClassifier Systems (LCS) [14, 15], which are rule-based machine learning systemsusing evolutionary computation [16] as the search mechanism. Specifically, wehave used a recent system called GAssist, which generates accurate, compact andhighly interpretable solutions [17]. The performance of GAssist will be testedagainst some alternative learning mechanisms, and the performance of all thesemachine learning paradigms will be discussed.
2 Problem Definition
There is a large literature in CN/CM prediction, in which a variety of machinelearning paradigms have been used, such as linear regression [12], neural networks[13], a combination of self-organizing maps and genetic programming [18] orsupport vector machines [19]. Several kinds of input information have been used
210 M. Stout et al.
in CN prediction besides the residue type of the residues in the chain, suchas global information of the protein chain [12], data from multiple sequencesalignments [13, 19, 18, 12] (mainly from PSI-BLAST [20]), predicted secondarystructure [13, 19], predicted solvent accessibility [13] or sequence conservation[19].
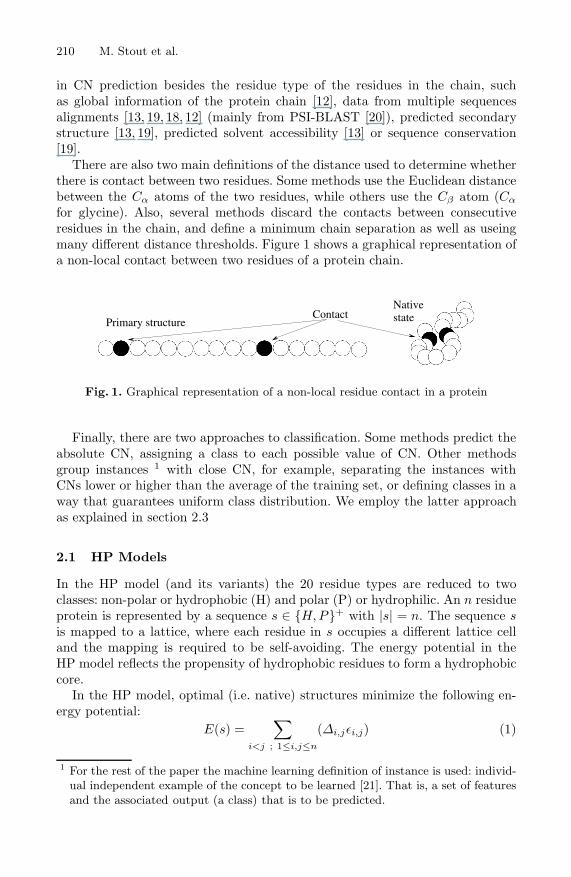
There are also two main definitions of the distance used to determine whetherthere is contact between two residues. Some methods use the Euclidean distancebetween the Cα atoms of the two residues, while others use the Cβ atom (Cα
for glycine). Also, several methods discard the contacts between consecutiveresidues in the chain, and define a minimum chain separation as well as useingmany different distance thresholds. Figure 1 shows a graphical representation ofa non-local contact between two residues of a protein chain.
NativestateContact
Primary structure
Fig. 1. Graphical representation of a non-local residue contact in a protein
Finally, there are two approaches to classification. Some methods predict theabsolute CN, assigning a class to each possible value of CN. Other methodsgroup instances 1 with close CN, for example, separating the instances withCNs lower or higher than the average of the training set, or defining classes in away that guarantees uniform class distribution. We employ the latter approachas explained in section 2.3
2.1 HP Models
In the HP model (and its variants) the 20 residue types are reduced to twoclasses: non-polar or hydrophobic (H) and polar (P) or hydrophilic. An n residueprotein is represented by a sequence s ∈ {H, P}+ with |s| = n. The sequence sis mapped to a lattice, where each residue in s occupies a different lattice celland the mapping is required to be self-avoiding. The energy potential in theHP model reflects the propensity of hydrophobic residues to form a hydrophobiccore.
In the HP model, optimal (i.e. native) structures minimize the following en-ergy potential:
E(s) =∑
i<j ; 1≤i,j≤n
(∆i,jεi,j) (1)
1 For the rest of the paper the machine learning definition of instance is used: individ-ual independent example of the concept to be learned [21]. That is, a set of featuresand the associated output (a class) that is to be predicted.
From HP Lattice Models to Real Proteins 211
where
∆i,j ={
1 if i, j are in contact and |i − j| > 10 otherwise (2)
In the standard HP model, contacts that are HP and PP are assigned anenergy of 0 and an HH contact is assigned an energy of -1.
2.2 Definition of CN
The distance used to determine contact by Kinjo et al. is defined using the Cβ
atom (Cα for glycine) of the residues. The boundary of the sphere defined bythe distance cutoff dc ∈ �+ is made smooth by using a sigmoid function. Also,a minimum chain separation of two residues is required. Formally, the CN (Op
i )of the residue i of protein chain p is computed as:
Opi =
∑
j:|j−i|>2
11 + exp(w(rij − dc))
(3)
where rij is the distance between the Cβ atoms of the ith and jth residues. Theconstant w determines the sharpness of the boundary of the sphere. A value ofthree for w was used for all the experiments.
2.3 Conversion of the Real-Valued CN Definition into aClassification Domain
In order to convert the real-valued CN definition into a set of discrete states,so that it can be used as a classification dataset, Kinjo et al. propose a methodto determine systematically some CN partitions resulting in an N class dataset.They choose the boundaries between classes in such a way as to generate classeswith a uniform number of instances. They test two versions of this method.Defining the class boundaries separately for each residue type or defining themglobally for all 20 residue types. In this study the later definition was adoptedfor simplicity and because it is more widely used.
3 The GAssist Learning Classifier System
GAssist [17] is a Pittsburgh Genetic–Based Machine Learning system descendantof GABIL [15]. The system applies a near-standard generational GA that evolvesindividuals that represent complete problem solutions. An individual consists ofan ordered, variable–length rule set. A special fitness function based on theMinimum Description Length (MDL) principle [22] is used. The MDL principleis a metric applied in general to a theory (being a rule set here) which balancesthe complexity and accuracy of the rule set. The details and rationale of thisfitness formula are explained in [17]. The system also uses a windowing schemecalled ILAS (incremental learning with alternating strata) [23] to reduce the
212 M. Stout et al.
run-time of the system, especially for dataset with hundreds of thousands ofinstances as in this paper. We have used the GABIL [15] rule-based knowledgerepresentation for nominal attributes and the adaptive discretization intervals(ADI) rule representation [17] for real-valued ones.
4 Experimental Framework
4.1 HP Lattice-Based Datasets
Two datasets were employed in this study, a 3D HP lattice model proteindataset and a data set of real proteins. Table 1 summarizes both datasets,which are available at http://www.cs.nott.ac.uk/~nxk/hppdb.html. For theLattice-HP study, a set of structures from Hart’s Tortilla Benchmark Col-lection (http://www.cs.sandia.gov/tech_reports/compbio/tortilla-hp-benchmarks.html) was used. This consisted of 15 structures on the simple cubiclattice (CN=6). Windows were generated for one, two and three residues at eachside of a central residue and the CN class of the central residue assigned as theclass of the instance. The instances was divided randomly into ten pairs of train-ing and test sets These sets act in a similar way to a ten-fold cross-validation.The process was repeated ten times to create ten pairs of training and test sets.Each reported accuracy will be, therefore, the average of one hundred values.
Table 1. Details of the data sets used in these experiments
Name Lattice-HP K1050Type 3D Cubic Lattice Real ProteinsNumber of Sequences 15 1050Minimum Sequence Length 27 80Maximum Sequence Length 48 2329Total Hydrophobic 316 170493Total Polar 309 84850Total Residues 625 255343
4.2 Real Proteins Dataset
We have used the same dataset and training/test partitions used by Kinjo et al.[12]. The real protein dataset (Real-AA) was selected from PDB-REPRDB [24]with the following conditions: less than 30% sequence identity, sequence lengthgreater than 50, no membrane proteins, no nonstandard residues, no chain breaks,resolution better than 2 A and having a crystallographicR factor better than 20%.Chains that had no entry in the HSSP [25] database were discarded. The finaldata set contains 1050 protein chains. CN was computed using a distance cutoffof 10 A. Windows were generated for one, two and three residues at each side of acentral residue and the CN class of the central residue assigned as the class of theinstance. The set was divided randomly into ten pairs of training and test set using950 proteins for training and 100 for testing in each set. These sets act in a similarway to a ten-fold cross-validation. The proteins included in each partition are re-ported in http://maccl01.genes.nig.ac.jp/~akinjo/sippre/suppl/list/.
From HP Lattice Models to Real Proteins 213
We have placed a copy of the dataset used in this paper at http://www.asap.cs.nott.ac.uk/~jqb/EvoBIO_dataset.tar.gz(approx.85MB). This samedataset was used to generate a real protein HP sequence dataset (Real-HP) byassigning each residue a value of Hydrophobic or Polar as shown in Table 2,following Broome and Hecht [26].
Table 2. Assignment of residues as Hydrophobic or Polar
Residue (one letter code) AssignmentACFGILMPSTVWY HydrophobicDEHKRQN Polar
4.3 Attribute Distributions
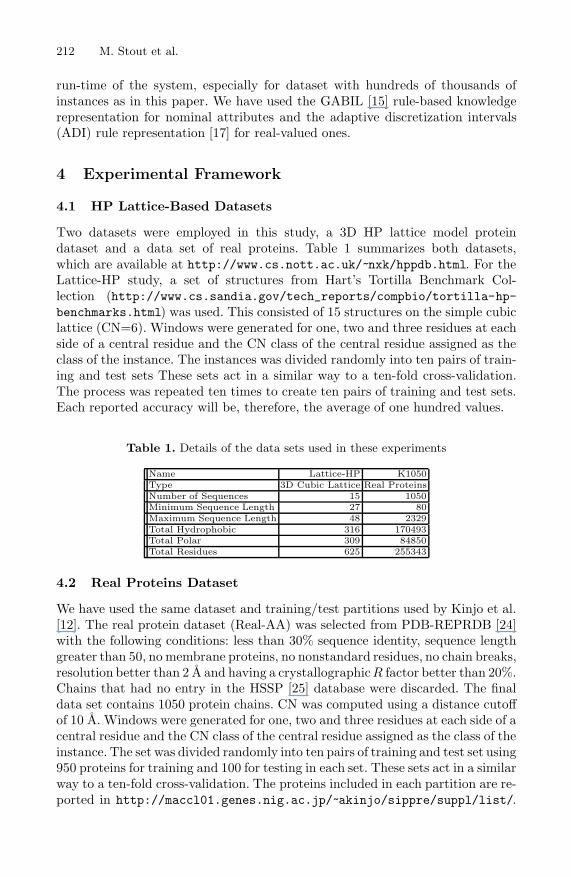
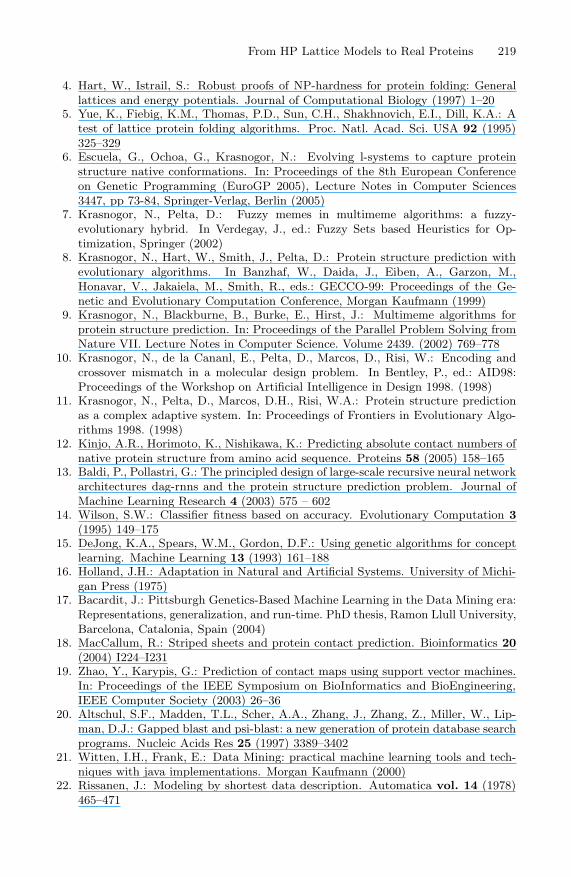
For the Lattice-HP dataset, Figure 2 shows the distribution of hydrophobic/polarresidues. Distributions are shown for a range of class assignments, two state,three state and five state. A higher proportion of hydrophobic residues are ob-served in the high CN classes, corresponding to a core of buried hydrophobicresidues. A higher proportion of polar residues are found in the low CN (ex-posed) classes. This is not surprising, since these model protein structures havebeen optimized on the basis of hydrophobicity to group the hydrophobic residuestogether.
0 1
Class Assignment
Pro
port
ion
of R
esid
ues
0.0
0.2
0.4
0.6
0.8
1.0
hp
Two state
0 1 2
Class Assignment
Pro
port
ion
of R
esid
ues
0.0
0.2
0.4
0.6
0.8
1.0
hp
Three state
0 1 2 3 4
Class Assignment
Pro
port
ion
of R
esid
ues
0.0
0.2
0.4
0.6
0.8
1.0
hp
Five state
Fig. 2. Distribution of hydrophobic/polar residues in the Lattice-HP dataset:h=hydrophobic, p=polar
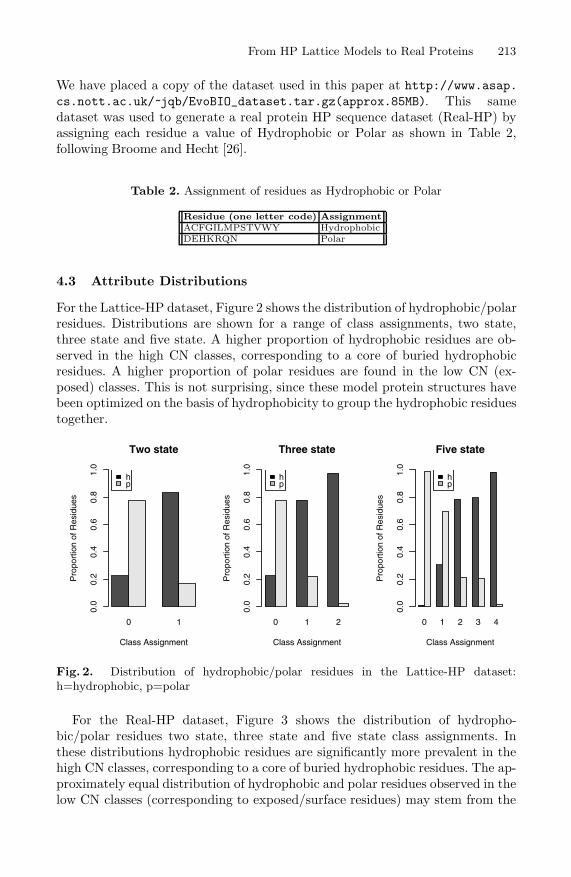
For the Real-HP dataset, Figure 3 shows the distribution of hydropho-bic/polar residues two state, three state and five state class assignments. Inthese distributions hydrophobic residues are significantly more prevalent in thehigh CN classes, corresponding to a core of buried hydrophobic residues. The ap-proximately equal distribution of hydrophobic and polar residues observed in thelow CN classes (corresponding to exposed/surface residues) may stem from the
214 M. Stout et al.
approximately two hydrophobic to one polar assignment ratio in Table 2. Thesedistributions provide a baseline against which the performance of the predictionalgorithms can be gauged.
0 1
Class Assignment
Pro
port
ion
of R
esid
ues
0.0
0.2
0.4
0.6
0.8
1.0
hp
Two state
0 1 2
Class Assignment
Pro
port
ion
of R
esid
ues
0.0
0.2
0.4
0.6
0.8
1.0
hp
Three state
0 1 2 3 4
Class Assignment
Pro
port
ion
of R
esid
ues
0.0
0.2
0.4
0.6
0.8
1.0
hp
Five state
Fig. 3. Distribution of hydrophobic/polar residues in the Real-HP dataset:h=hydrophobic, p=polar
5 Results
The performance of GAssist was compared to two other machine learning sys-tems: C4.5 [27], a rule induction system and Naive Bayes [28], a Bayesian learn-ing algorithm. The WEKA [21] implementation of these algorithms was used.Student t-tests were applied to the mean prediction accuracies (rather than indi-vidual experimental data points) to determine, for each dataset, those algorithmsthat significantly outperformed other methods using a confidence interval of 95%and Bonferroni correction [29] for multiple pair-wise comparisons was used.
5.1 Lattice-HP Datasets
Table 3 compares the results of two, three and five state CN predictions fora range of window sizes for the GAssist LCS, Naive Bayes and C4.5 using theLattice-HP dataset. A window size of three means three residues either side of thecentral residue, i.e. a seven residue peptide. As the number of states is increasedthe accuracy decreases from around 80% to around 51% for all algorithms. Foreach state as the window size is increased the accuracy increases by around0.1-0.2%. With the exception of the C4.5 algorithm which shows a decrease inaccuracy with increasing window size in two and three state predictions. Therewere no significant differences detected in these tests.
For two states, the best prediction was given by C4.5 with window size ofone (80%±4.9). For three states the best prediction was given by GAssist withwindow size of two (67%±4.1). For five states GAssist again gave the best pre-dictions for a window size of three (52.7%±5.3).
From HP Lattice Models to Real Proteins 215
Table 3. Lattice-HP Prediction Accuracies
Number of States AlgorithmWindow Size
1 2 3
2GAssist 79.8 ±4.9 80.2 ±5.0 80.0 ±5.3C4.5 80.2 ±4.9 79.9 ±5.0 79.7 ±5.1NaiveBayes 79.8 ±4.9 80.0 ±4.9 80.2 ±5.0
3GAssist 67.4 ±4.9 67.8 ±4.1 67.3 ±5.0C4.5 67.5 ±4.8 67.6 ±4.2 66.6 ±5.0NaiveBayes 67.2 ±4.6 67.3 ±4.4 67.5 ±4.8
5GAssist 51.4 ±4.6 51.3 ±4.2 52.7 ±5.3C4.5 51.7 ±4.5 51.0 ±4.1 52.2 ±5.1NaiveBayes 51.7 ±4.6 52.3 ±4.3 51.9 ±5.6
5.2 Real Proteins
Table 4 compares the results of two, three and five state CN predictions on realproteins for the GAssist LCS, Naive Bayes and C4.5 for the Real-HP dataset.When an HP sequence representation was used, an increase in the number ofstates is accompanied by a decrease in accuracy from around 63-64% to around29-30% for all algorithms. For each state, as the window size is increased theaccuracy increases by around 1%. For two states, the best predictions weregiven by GAssist and C4.5 with window size of three (64.4%±0.5). For threestates the best prediction was given by C4.5 with window size of two (45%±0.4).For five states C4.5 again gave the best predictions for a window size of three(30.4%±0.5).
Table 4. CN Prediction Accuracies for the Real-HP and Real-AA datasets. A • meansthat GAssist outperformed the Algorithm to the left (5% t-test significance). A ◦ labelmeans that the Algorithm on the left outperformed GAssist (5% t-test significance)
State AlgorithmHP Based Residue Based
Window Size Window Size1 2 3 1 2 3
2GAssist 63.6±0.6 63.9±0.6 64.4±0.5 67.5±0.4 67.9±0.4 68.2±0.4
C4.5 63.6±0.6 63.9±0.6 64.4±0.5 67.3±0.4 67.5±0.3 67.8±0.3NaiveBayes 63.6±0.6 63.9±0.6 64.3±0.5 67.6±0.4 68.0±0.4 68.8±0.3◦
3GAssist 44.9±0.5 45.1±0.5 45.6±0.4 48.8±0.4 49.0±0.4 49.3±0.4
C4.5 44.9±0.5 45.1±0.5 45.8±0.4 48.8±0.3 48.7±0.3 49.1±0.3NaiveBayes 44.7±0.5 45.2±0.5 45.7±0.4 49.0±0.4 49.6±0.5◦ 50.7±0.3◦
5GAssist 29.0±0.3 29.6±0.5 30.1±0.5 32.2±0.3 32.5±0.3 32.7±0.4
C4.5 29.0±0.3 29.7±0.4 30.4±0.5 31.9±0.4 31.4±0.4• 31.0±0.5•NaiveBayes 29.0±0.3 29.7±0.4 30.1±0.5 33.0±0.2◦ 33.9±0.3◦ 34.7±0.4◦
Using full residue information, an increase in the number of states is accom-panied by a decrease in accuracy from around 68% to around 34% for all algo-rithms. For each state, as the window size is increased, the accuracy increases byaround 0.5%, with the exception of the C4.5 algorithm which shows a decreasein accuracy with increasing window size in five state predictions. The LCS out-performed C4.5 two times and was outperformed by Naive Bayes six times. Fortwo, three and five state predictions the best results were given by Naive Bayes
.
216 M. Stout et al.
with window size of three (68.8%±0.3, 50.7%±0.3 and 34.7%±0.4 respectively).Most interestingly, moving from HP sequence representation to full residue typesequence information only results in a 4% increase for two and three state and1-2% increase for, the more informative, five state prediction.
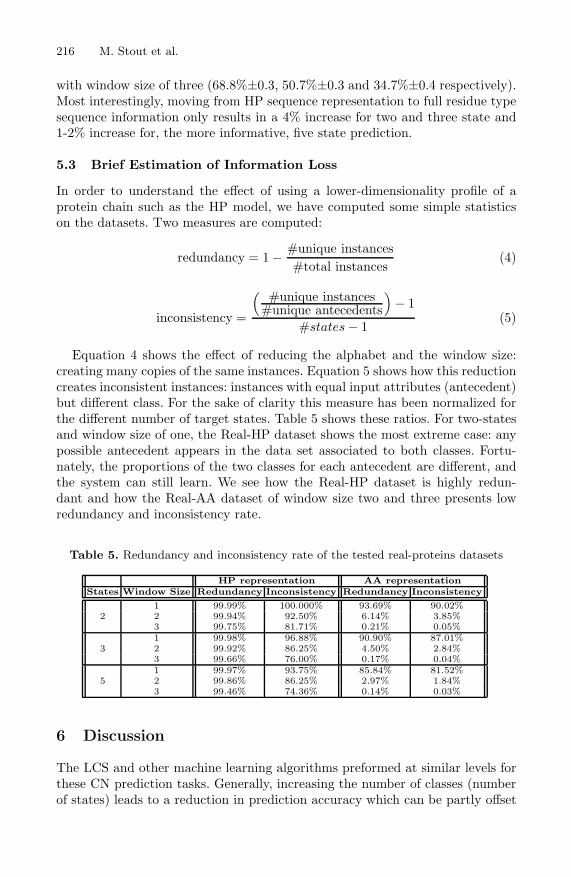
5.3 Brief Estimation of Information Loss
In order to understand the effect of using a lower-dimensionality profile of aprotein chain such as the HP model, we have computed some simple statisticson the datasets. Two measures are computed:
redundancy = 1 − #unique instances#total instances
(4)
inconsistency =
( #unique instances#unique antecedents
)− 1
#states − 1(5)
Equation 4 shows the effect of reducing the alphabet and the window size:creating many copies of the same instances. Equation 5 shows how this reductioncreates inconsistent instances: instances with equal input attributes (antecedent)but different class. For the sake of clarity this measure has been normalized forthe different number of target states. Table 5 shows these ratios. For two-statesand window size of one, the Real-HP dataset shows the most extreme case: anypossible antecedent appears in the data set associated to both classes. Fortu-nately, the proportions of the two classes for each antecedent are different, andthe system can still learn. We see how the Real-HP dataset is highly redun-dant and how the Real-AA dataset of window size two and three presents lowredundancy and inconsistency rate.
Table 5. Redundancy and inconsistency rate of the tested real-proteins datasets
HP representation AA representationStates Window Size Redundancy Inconsistency Redundancy Inconsistency
1 99.99% 100.000% 93.69% 90.02%2 2 99.94% 92.50% 6.14% 3.85%
3 99.75% 81.71% 0.21% 0.05%1 99.98% 96.88% 90.90% 87.01%
3 2 99.92% 86.25% 4.50% 2.84%3 99.66% 76.00% 0.17% 0.04%1 99.97% 93.75% 85.84% 81.52%
5 2 99.86% 86.25% 2.97% 1.84%3 99.46% 74.36% 0.14% 0.03%
6 Discussion
The LCS and other machine learning algorithms preformed at similar levels forthese CN prediction tasks. Generally, increasing the number of classes (numberof states) leads to a reduction in prediction accuracy which can be partly offset
From HP Lattice Models to Real Proteins 217
by using a larger window size. Reduction of input information from full residuetype to HP sequence reduces the accuracy of prediction. The algorithms were,however, all capable of predictions using HP sequence that were within 5% ofthe accuracies obtained using full residue type sequences.
For all of the algorithms studied, in the case of the most informative fivestate predictions, moving from HP lattice to real protein HP sequences leads toa reduction of CN prediction accuracy from levels of around 50% to levels ofaround 30%. The significant reduction in the spatial degrees of freedom in theLattice-HP models leads to an improvement in prediction accuracy of around20%.
In contrast, moving from the real protein HP sequences to real protein fullresidue type sequences (for the same five state CN predictions) only a 3-5%improvement in prediction accuracy results from inclusion of this additionalresidue type information. This seems to indicate that hydrophobicity informationis a key determinant of CN and that algorithmic studies of HP models arerelevant. The rules that result from a reduced two letter alphabet are simpler andeasier to understand than those from the full residue type studies. For example,for the HP representation a rule set giving 62.9% accuracy is shown below (anX symbol is used to represent positions at the end of the chains, that is beyondthe central residue being studied).
1. If AA−1 /∈ {x} and AA ∈ {h} and AA1 ∈ {p} then class is 12. If AA−1 ∈ {h} and AA ∈ {h} and AA1 /∈ {x} then class is 13. If AA−1 ∈ {p} and AA ∈ {h} and AA1 ∈ {h} then class is 14. Default class is 0
In these rules, a class assignment of high is represented by 1 and low by 0.For the full residue type representation a rule set giving 67.7% accuracy is:
1. If AA−1 /∈ {D, E, K, N, P, Q, R, S, X} and AA /∈ {D, E, K, N, P, Q, R, S, T}and AA1 /∈ {D, E, K, Q, X} then class is 1
2. If AA−1 /∈ {X} and AA ∈ {A, C, F, I, L, M, V, W, Y } and AA1 /∈{D, E, H, Q, S, X} then class is 1
3. If AA−1 /∈ {P, X, Y } and AA ∈ {A, C, F, I, L, M, V, W, Y } and AA1 /∈{K, M, T, W, X, Y } then class is 1
4. If AA−1 /∈ {H, I, K, M, X} and AA ∈ {C, F, I, L, M, V, W, Y } and AA1 /∈{M, X} then class is 1
5. Default class is 0
Recently, Kinjo et al [12] reported two, three and ten state CN predictionat accuracies of 72.1%, 53.7%, and 18.8% respectively, which is higher than ourresults. However, they use a non-standard accuracy measure that usually givesslightly higher results than the one used in this paper. Also, they use more inputinformation than was used in the experiments reported in this paper.
The aim of this paper was to compare the performance difference between theReal-AA and Real-HP representations, not to obtain the best CN results. Wehave undertaken more detailed studies on both the HP model dataset for CNand Residue Burial prediction and the real protein datasets for CN predictionin comparison to the Kinjo work (papers submitted).

218 M. Stout et al.
7 Conclusions and Further Work
This paper has shown that it is possible to predict residue CN for HP Latticemodel proteins at a level of around 52% for five state prediction using a windowof three residues either side of the prediced residue. For real proteins, five stateCN prediction using a window size of three can be performed at a level of 30%using HP residue profiles. This can be increased to 32% using full sequenceinformation. This is perhaps understandable since reducing the sequence to anHP sequence discards useful information. However, the representation with onlytwo residue types is only a little worse than that with a full twenty letter alphabet(64% vs 68% for two state prediction, 45% vs 50% for three state prediction and30% vs 33% for five state prediction). Thus, most of the information is containedin the HP representation, indicating that hydrophobicity is a key determinantof CN. This is consistent with earlier studies [30].
Initial estimates of information inconsistency (ambiguous antecedent to con-sequent assignments) in the reduced two letter alphabet dataset indicate thatconsiderable inconsistency is present even for five state assignments using largerwindow sizes. The algorithms presumably learn from the various distributionsof these inconsistencies during their learning stage. Li et al. [31] have investi-gated whether there is a minimal residue type alphabet by which proteins canbe folded. They conclude that a ten letter alphabet may be sufficient to charac-terize the complexity of proteins. We are performing studies to investigate suchreduced letter alphabets and to quantify the information loss in each. In future,we will extend these studies to prediction of other structural attributes, suchas secondary structure and relative solvent accessibility. These studies will helpdetermine the relative utility of CN for designing prediction heuristics for HPmodels and Real proteins.
Acknowledgments
We acknowledge the support provided by the UK Engineering and Physical Sci-ences Research Council (EPSRC) under grant GR/T07534/01 and the Biotech-nology and Biological Sciences Research Council (BBSRC) under grant BB/C511764/1.
References
1. Abe, H., Go, N.: Noninteracting local-structure model of folding and unfoldingtransition in globular proteins. ii. application to two-dimensional lattice proteins.Biopolymers 20 (1981) 1013–1031
2. Hart, W.E., Istrail, S.: Crystallographical universal approximability: A complexitytheory of protein folding algorithms on crystal lattices. Technical Report SAND95-1294, Sandia National Labs, Albuquerque, NM (1995)
3. Hinds, D., Levitt, M.: A lattice model for protein structure prediction at lowresolution. In: Proceedings National Academy of Science U.S.A. Volume 89. (1992)2536–2540
From HP Lattice Models to Real Proteins 219
4. Hart, W., Istrail, S.: Robust proofs of NP-hardness for protein folding: Generallattices and energy potentials. Journal of Computational Biology (1997) 1–20
5. Yue, K., Fiebig, K.M., Thomas, P.D., Sun, C.H., Shakhnovich, E.I., Dill, K.A.: Atest of lattice protein folding algorithms. Proc. Natl. Acad. Sci. USA 92 (1995)325–329
6. Escuela, G., Ochoa, G., Krasnogor, N.: Evolving l-systems to capture proteinstructure native conformations. In: Proceedings of the 8th European Conferenceon Genetic Programming (EuroGP 2005), Lecture Notes in Computer Sciences3447, pp 73-84, Springer-Verlag, Berlin (2005)
7. Krasnogor, N., Pelta, D.: Fuzzy memes in multimeme algorithms: a fuzzy-evolutionary hybrid. In Verdegay, J., ed.: Fuzzy Sets based Heuristics for Op-timization, Springer (2002)
8. Krasnogor, N., Hart, W., Smith, J., Pelta, D.: Protein structure prediction withevolutionary algorithms. In Banzhaf, W., Daida, J., Eiben, A., Garzon, M.,Honavar, V., Jakaiela, M., Smith, R., eds.: GECCO-99: Proceedings of the Ge-netic and Evolutionary Computation Conference, Morgan Kaufmann (1999)
9. Krasnogor, N., Blackburne, B., Burke, E., Hirst, J.: Multimeme algorithms forprotein structure prediction. In: Proceedings of the Parallel Problem Solving fromNature VII. Lecture Notes in Computer Science. Volume 2439. (2002) 769–778
10. Krasnogor, N., de la Cananl, E., Pelta, D., Marcos, D., Risi, W.: Encoding andcrossover mismatch in a molecular design problem. In Bentley, P., ed.: AID98:Proceedings of the Workshop on Artificial Intelligence in Design 1998. (1998)
11. Krasnogor, N., Pelta, D., Marcos, D.H., Risi, W.A.: Protein structure predictionas a complex adaptive system. In: Proceedings of Frontiers in Evolutionary Algo-rithms 1998. (1998)
12. Kinjo, A.R., Horimoto, K., Nishikawa, K.: Predicting absolute contact numbers ofnative protein structure from amino acid sequence. Proteins 58 (2005) 158–165
13. Baldi, P., Pollastri, G.: The principled design of large-scale recursive neural networkarchitectures dag-rnns and the protein structure prediction problem. Journal ofMachine Learning Research 4 (2003) 575 – 602
14. Wilson, S.W.: Classifier fitness based on accuracy. Evolutionary Computation 3(1995) 149–175
15. DeJong, K.A., Spears, W.M., Gordon, D.F.: Using genetic algorithms for conceptlearning. Machine Learning 13 (1993) 161–188
16. Holland, J.H.: Adaptation in Natural and Artificial Systems. University of Michi-gan Press (1975)
17. Bacardit, J.: Pittsburgh Genetics-Based Machine Learning in the Data Mining era:Representations, generalization, and run-time. PhD thesis, Ramon Llull University,Barcelona, Catalonia, Spain (2004)
18. MacCallum, R.: Striped sheets and protein contact prediction. Bioinformatics 20(2004) I224–I231
19. Zhao, Y., Karypis, G.: Prediction of contact maps using support vector machines.In: Proceedings of the IEEE Symposium on BioInformatics and BioEngineering,IEEE Computer Society (2003) 26–36
20. Altschul, S.F., Madden, T.L., Scher, A.A., Zhang, J., Zhang, Z., Miller, W., Lip-man, D.J.: Gapped blast and psi-blast: a new generation of protein database searchprograms. Nucleic Acids Res 25 (1997) 3389–3402
21. Witten, I.H., Frank, E.: Data Mining: practical machine learning tools and tech-niques with java implementations. Morgan Kaufmann (2000)
22. Rissanen, J.: Modeling by shortest data description. Automatica vol. 14 (1978)465–471
220 M. Stout et al.
23. Bacardit, J., Goldberg, D., Butz, M., Llora, X., Garrell, J.M.: Speeding-up pitts-burgh learning classifier systems: Modeling time and accuracy. In: Parallel ProblemSolving from Nature - PPSN 2004, Springer-Verlag, LNCS 3242 (2004) 1021–1031
24. Noguchi, T., Matsuda, H., Akiyama, Y.: Pdb-reprdb: a database of representativeprotein chains from the protein data bank (pdb). Nucleic Acids Res 29 (2001)219–220
25. Sander, C., Schneider, R.: Database of homology-derived protein structures. Pro-teins 9 (1991) 56–68
26. Broome, B., Hecht, M.: Nature disfavors sequences of alternating polar and non-polar amino acids: implications for amyloidogenesis. J Mol Biol 296 (2000) 961–968
27. Quinlan, J.R.: C4.5: Programs for Machine Learning. Morgan Kaufmann (1993)28. John, G.H., Langley, P.: Estimating continuous distributions in Bayesian classifiers.
In: Proceedings of the Eleventh Conference on Uncertainty in Artificial Intelligence,Morgan Kaufmann Publishers, San Mateo (1995) 338–345
29. Miller, R.G.: Simultaneous Statistical Inference. Springer Verlag, New York (1981)Heidelberger, Berlin.
30. Miller, S., Janin, J., Lesk, A., Chothia, C.: Interior and surface of monomericproteins. J Mol Biol 196 (1987) 641–656
31. Li, T., Fan, K., Wang, J., Wang, W.: Reduction of protein sequence complexityby residue grouping. Protein Eng 16 (2003) 323–330
Related Documents