From Gap to Opportunity: Business Models for Scaling Up Energy Access In partnership with Austria Public Disclosure Authorized Public Disclosure Authorized Public Disclosure Authorized Public Disclosure Authorized

Welcome message from author
This document is posted to help you gain knowledge. Please leave a comment to let me know what you think about it! Share it to your friends and learn new things together.
Transcript
From Gap to Opportunity: Business Models for
Scaling Up Energy AccessIn partnership with Austria
Pub
lic D
iscl
osur
e A
utho
rized
Pub
lic D
iscl
osur
e A
utho
rized
Pub
lic D
iscl
osur
e A
utho
rized
Pub
lic D
iscl
osur
e A
utho
rized
wb350881
Typewritten Text
72695
EXECUTIVE SUMMARY1
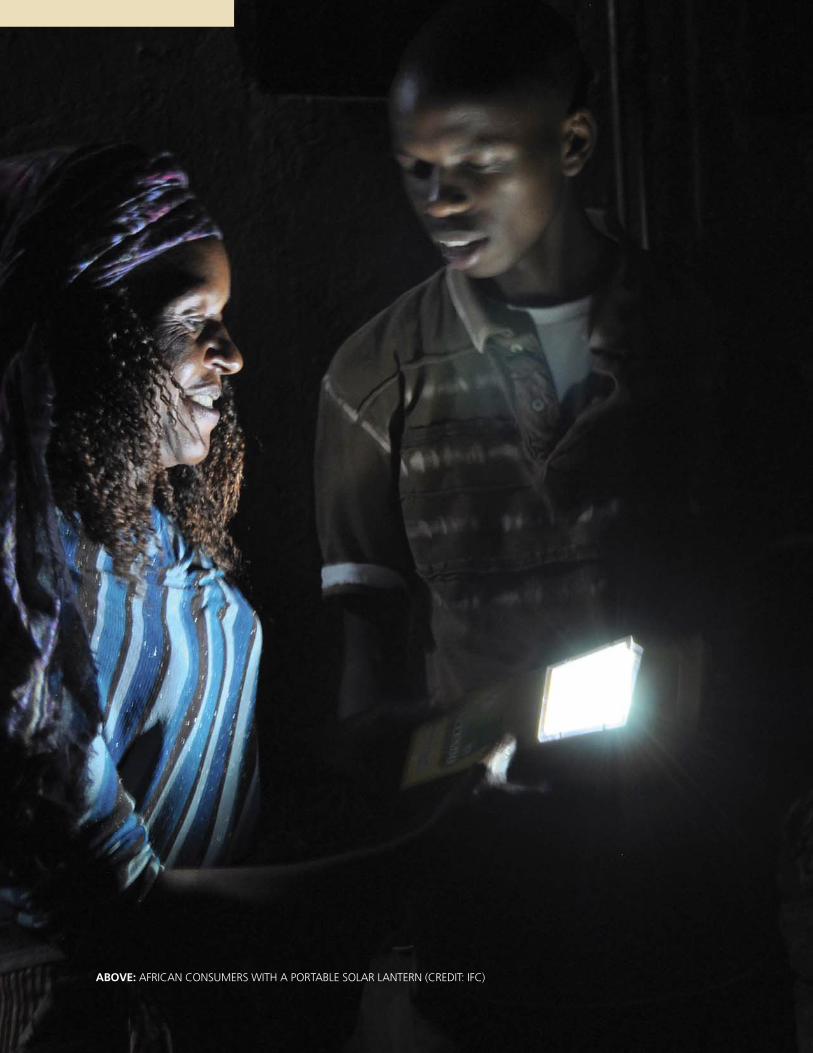
ABOVE: AFRICAN CONSUMERS WITH A PORTABLE SOLAR LANTERN (CREDIT: IFC)
2CONTENTS
ContentsFOREWORD ..............................................................................................................................................................7
ACKNOWLEDGMENTS ......................................................................................................................................8
ABBREVIATIONS .....................................................................................................................................................9
EXECUTIVE SUMMARY .................................................................................................................................... 11
CHAPTER 1: INTRODUCTION .................................................................................................................... 21
Reframing Energy Access as a Market .........................................................................................................................23
Defi ning Ways to further Catalyze Commercial Success Stories ................................................................................... 25
CHAPTER 2: SIZING THE ENERGY ACCESS MARKET .................................................................. 27
CHAPTER 3: HOW COMPANIES ARE SERVING THE MARKET .............................................. 37
Household-level Devices and Systems ..........................................................................................................................40
Devices: Business Models – How Companies are Serving the Market ...........................................................................44
Devices: Key Business Model Success Factors ..............................................................................................................60
Devices: Key Success Factors in the Ecosystem Environment ........................................................................................66
Community-level Electrifi cation through Mini-Utilities ................................................................................................. 75
Mini-utilities: Business Models – How Companies are Serving the Market ..................................................................79
Mini-utilities: Key Success Factors in the Business Model .............................................................................................88
Mini-utilities: Key Success Factors in the Ecosystem Environment ................................................................................ 93
Grid-based electrifi cation: Centralized Utility Approaches ......................................................................................... 101
Grid Extension: Business Models – How Companies are Serving the Market ............................................................. 101
Grid Extension: Key Success Factors in the Business Model ........................................................................................111
Grid Extension: Key Success Factors in the Ecosystem Environment ........................................................................... 114
CHAPTER 4: WHAT CAN BE DONE TO HELP SCALE-UP ENERGY ACCESS
SUCCESS STORIES? ............................................................................................................................................117
Refi ning Business Models: Challenges for Operating Companies ............................................................................... 120
Rethinking Policy: Roles for Governments and their Development Partners ............................................................... 126
Refocusing Financing: Opportunities for Impact and Commercial Investors ............................................................... 133
APPENDIXES
A: Market-sizing Methodology ................................................................................................................................. 145
B: Socioeconomic Impact of Serving the Energy-Poor ............................................................................................... 159
C: How Mini-Utilities Grow into Big Utilities .............................................................................................................. 160
D: Grid Extension – Recent Relaxation of Exclusive Arrangements ............................................................................. 161
E: Photo Credits ......................................................................................................................................................... 162
NOTES ....................................................................................................................................................................... 163
REFERENCES ........................................................................................................................................................ 168
3 CONTENTS
ContentsBOXES
3.1 Tizazu makes improved cookstoves in Ethiopia ...................................................................................................... 47
3.2 Unilever Tea Kenya Limited has tapped CSR funding to successfully purchase and disseminate solar PV devices ....52
3.3 Fenix’s ReadySet, deployed in partnership with MTN ............................................................................................ 53
3.4 Nuru Energy and its Rechargeable Solar Lamps ..................................................................................................... 55
3.5 Greenlight Planet: Building its own distribution network .......................................................................................62
3.6 Community-based systems have a role to play ......................................................................................................77
3.7 Vihearsur Electrify Enterprise, Cambodia ...............................................................................................................82
3.8 Bonny Utility Company, Nigeria .............................................................................................................................83
3.9 Government policy drives mini-utility outcomes: Encouraging private developers in Tanzania ................................90
3.10 Government policy drives mini-utility outcomes: Community power in Nepal ...................................................... 97
3.11 Case studies on reduction of nontechnical losses – JPSCo and RAMI .................................................................106
4.1 Commonwealth Development Corporation as a mini-utility developer and platform company ............................ 123
4.2 Understanding fi nancing constraints ................................................................................................................... 137
4.3 Risk-sharing facilities can encourage the provision of debt .................................................................................. 139
4.4 Examples of risk-sharing facilities ........................................................................................................................ 140
4.5 The Shell Foundation is taking a venture capital approach .................................................................................. 143
FIGURES
1.1 Share of people without access to modern energy in 2007 ...................................................................................22
1.2 Analytical framework used to study companies operating in the energy access market ........................................ 24
1.3 Scope and methodology of the report ................................................................................................................. 25
2.1 Distribution of household expenditures on traditional energy ............................................................................... 28
2.2 Energy access solutions discussed in this report ....................................................................................................29
2.3 Theoretically addressable market for “lighting plus” and improved cooking in 2010 .............................................30
2.4 Commercial price of modern energy alternatives .................................................................................................. 31
2.5 Theoretically addressable market by technology category ..................................................................................... 32
2.6 Sensitivity of the addressable market to up-front cost ........................................................................................... 33
2.7 Sensitivity of the addressable market to willingness to pay .................................................................................... 35
2.8 Penetration rates of energy and mobile phone services in developing markets .....................................................36
4CONTENTS
Contents 3.1 Overview of selected energy access ventures – subsector, model, and customer base ...........................................39
3.2 Solar and rechargeable technologies for lighting and providing electricity for the home ....................................... 41
3.3 Characteristics of selected companies covered in this section ...............................................................................43
3.4 Devices – how companies are serving the market ..................................................................................................44
3.5 Sample cost breakdown of a device made by an Indian solar lantern company .....................................................50
3.6 Sample cost breakdown of SHS installed by an Indian company ...........................................................................56
3.7 Key success factors in the devices business model .................................................................................................60
3.8 What is your preferred type of light, excluding electric light bulbs powered from the grid?, Ethiopia ....................63
3.9 Sample cost breakdown of a device made by an Indian cookstoves company .......................................................64
3.10 Key success factors in the devices ecosystem environment ..................................................................................66
3.11 Financing needs and obstacles early in the company life cycle ............................................................................. 70
3.12 Overview of mini-grid technologies ..................................................................................................................... 75
3.13 Electricity generation costs by mini-grid technology ............................................................................................78
3.14 Mini-utilities – how companies are serving the market ........................................................................................79
3.15 Generalized mini-utility operating model .............................................................................................................80
3.16 Shared Solar PV metering concept ......................................................................................................................87
3.17 Key success factors in the mini-utility business model ..........................................................................................88
3.18 Indicative cost structure of mini-utility, example from India ................................................................................. 93
3.19 Key success factors in the mini-utility ecosystem conditions ................................................................................94
3.20 Location of electrifi cation entities profi led in this section .................................................................................. 102
3.21 Grid extension – how companies are serving the market .................................................................................. 102
3.22 Key success factors in the grid extension business model ...................................................................................111
3.23 Key success factors in the grid extension ecosystem environment ......................................................................114
4.1 Regional electrifi cation rates and regional electricity access show the scale of the commercial opportunity in providing new energy access solutions ...................................................................................................................... 118
4.2 Summary of key success factors and recommendations ...................................................................................... 119
4.3 Growth in base stations in developing regions (2007–12) ................................................................................... 122
4.4 Financing is needed in three areas: To support companies in their early stages (start-up and growth capital), to support operations (working capital or trade fi nance), and to strengthen revenue streams .................................. 135
5 CONTENTS
Contents A.1 Addressable market for modern energy products and services ........................................................................... 147
A.2 Addressable market for improved cooking – charcoal ........................................................................................ 154
A.3 Addressable market for improved cooking – wood ............................................................................................ 154
TABLES
4.1 Where energy access companies look for fi nancing, off-grid lighting example .................................................... 141
A.1 Alternative modern lighting and electricity technologies ...................................................................................... 148
A.2 Sensitivity analysis of up-front payments on the addressable market .................................................................. 150
A.3 Sensitivity analysis of up-front payments “across the board” on the addressable market ................................... 151
A.4 Sensitivity analysis of price on the addressable market ....................................................................................... 151
A.5 Sensitivity analysis of price “across the board” on the addressable market ......................................................... 152
A.6 Sensitivity analysis of willingness to pay for electricity on the addressable market .............................................. 152
A.7 Sensitivity analysis of household incomes on the addressable market in 2030 .................................................... 153
A.8 Improved cooking devices .................................................................................................................................. 154
A.9 Sensitivity analysis of up-front payment on addressable market for improved cooking ....................................... 156
A.10 Sensitivity analysis of up-front payment on addressable market for improved cooking – across the board ........ 156
A.11 Sensitivity analysis of price on addressable market for improved cooking .......................................................... 158
A.12 Sensitivity analysis of price on addressable market for improved cooking – across the board ............................ 158
A.13 Sensitivity of willingness to pay and income levels on the addressable market .................................................. 158
A.14 Sensitivity analysis of household incomes on the addressable market in 2030 .................................................. 158
B.1 Health and environmental benefi ts of modern lighting solutions ........................................................................ 159
B.2 Health and environmental benefi ts of improved cooking solutions ..................................................................... 159
CONTENTS 8
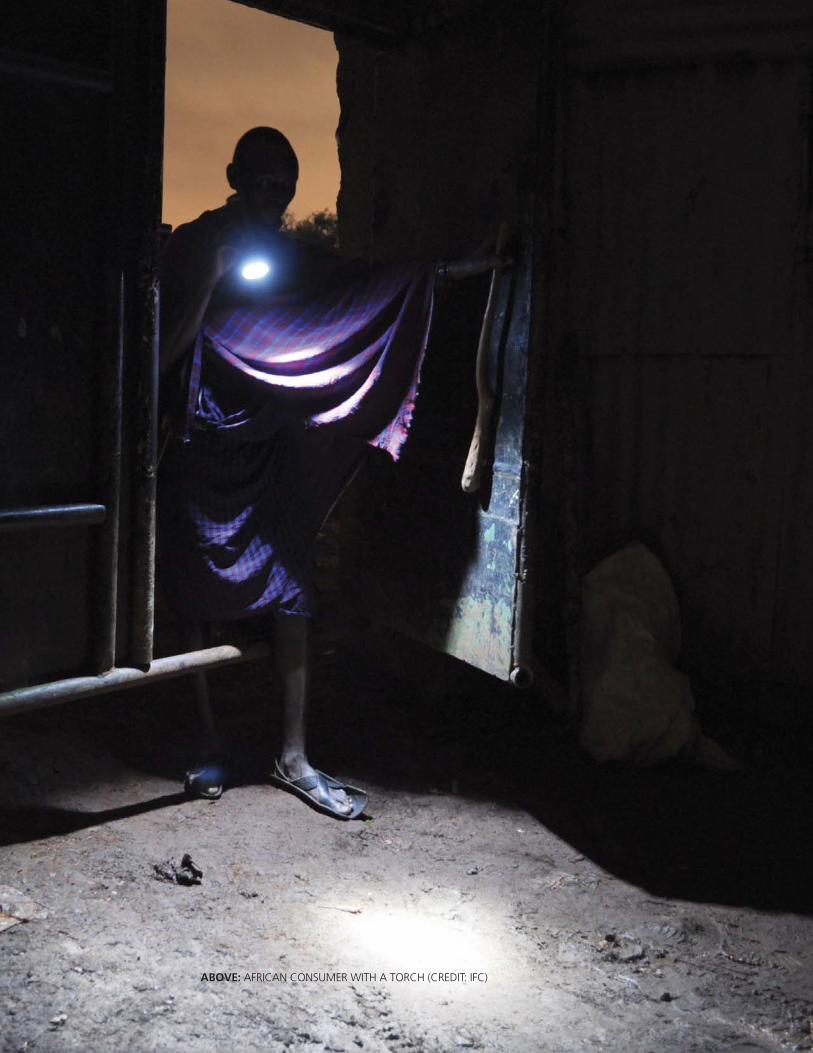
ABOVE: AFRICAN CONSUMER WITH A TORCH (CREDIT: IFC)
7 FOREWORD
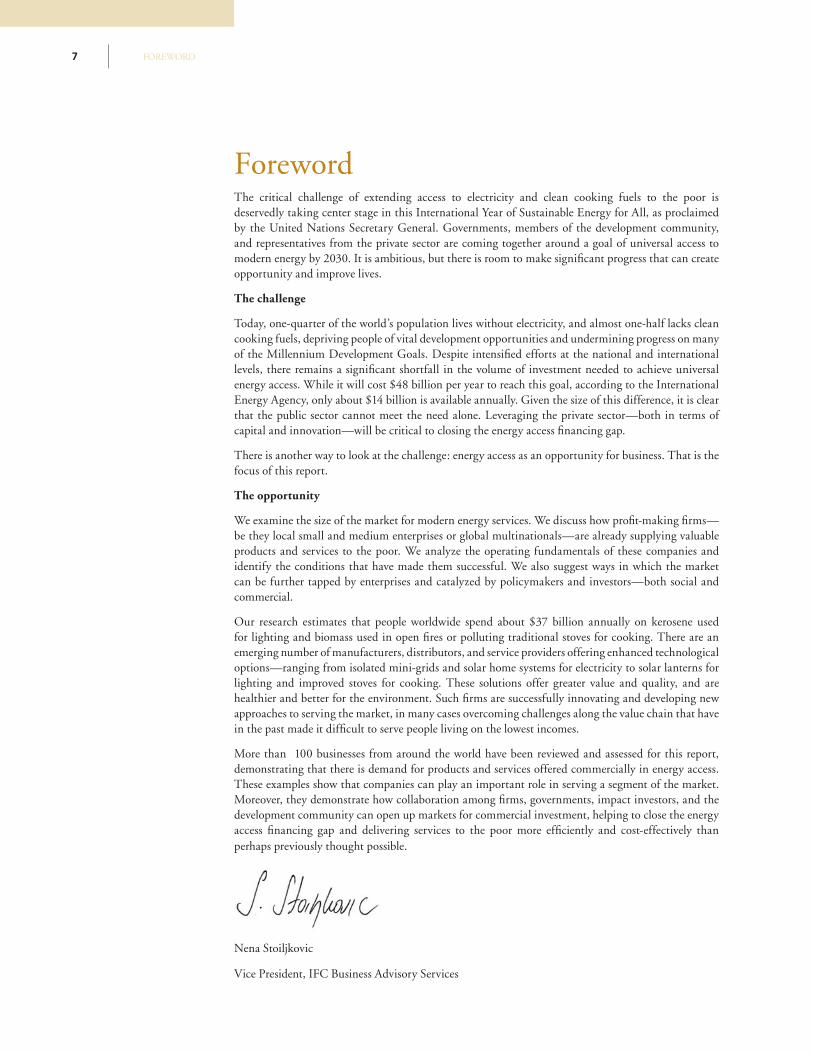
The critical challenge of extending access to electricity and clean cooking fuels to the poor is deservedly taking center stage in this International Year of Sustainable Energy for All, as proclaimed by the United Nations Secretary General. Governments, members of the development community, and representatives from the private sector are coming together around a goal of universal access to modern energy by 2030. It is ambitious, but there is room to make signifi cant progress that can create opportunity and improve lives.
The challenge
Today, one-quarter of the world’s population lives without electricity, and almost one-half lacks clean cooking fuels, depriving people of vital development opportunities and undermining progress on many of the Millennium Development Goals. Despite intensifi ed efforts at the national and international levels, there remains a signifi cant shortfall in the volume of investment needed to achieve universal energy access. While it will cost $48 billion per year to reach this goal, according to the International Energy Agency, only about $14 billion is available annually. Given the size of this difference, it is clear that the public sector cannot meet the need alone. Leveraging the private sector—both in terms of capital and innovation—will be critical to closing the energy access fi nancing gap.
There is another way to look at the challenge: energy access as an opportunity for business. That is the focus of this report.
The opportunity
We examine the size of the market for modern energy services. We discuss how profi t-making fi rms—be they local small and medium enterprises or global multinationals—are already supplying valuable products and services to the poor. We analyze the operating fundamentals of these companies and identify the conditions that have made them successful. We also suggest ways in which the market can be further tapped by enterprises and catalyzed by policymakers and investors—both social and commercial.
Our research estimates that people worldwide spend about $37 billion annually on kerosene used for lighting and biomass used in open fi res or polluting traditional stoves for cooking. There are an emerging number of manufacturers, distributors, and service providers offering enhanced technological options—ranging from isolated mini-grids and solar home systems for electricity to solar lanterns for lighting and improved stoves for cooking. These solutions offer greater value and quality, and are healthier and better for the environment. Such fi rms are successfully innovating and developing new approaches to serving the market, in many cases overcoming challenges along the value chain that have in the past made it diffi cult to serve people living on the lowest incomes.
More than 100 businesses from around the world have been reviewed and assessed for this report, demonstrating that there is demand for products and services offered commercially in energy access. These examples show that companies can play an important role in serving a segment of the market. Moreover, they demonstrate how collaboration among fi rms, governments, impact investors, and the development community can open up markets for commercial investment, helping to close the energy access fi nancing gap and delivering services to the poor more effi ciently and cost-effectively than perhaps previously thought possible.
Nena Stoiljkovic
Vice President, IFC Business Advisory Services
Foreword
8ACKNOWLEDGMENTS
This report, which explores the global market opportunity for expanding access to modern energy services at the household level, was funded by the Government of Austria and prepared by IFC’s Sustainable Business Advisory Department. The lead author was Pepukaye Bardouille, who also managed the project with guidance and thought-partnership from Patrick Avato, and input from Jeremy Levin, Alexios Pantelias, and Hendrik Engelmann-Pilger of IFC’s Global Clean Energy Advisory Team. We would like to acknowledge the support of Castalia Advisors and Hystra Consulting in undertaking background research, Terrestrial at the fi nalization and production stages of the report, and Diane Stamm for fi nal editing.
In addition, we are grateful for the input of external advisors, colleagues, and peer reviewers who have been involved at various stages of the project. They include Roberto Bocca, World Economic Forum; Anil Cabraal, Consultant; Raffaella Centurelli, International Energy Agency; Simon Desjardins, Shell Foundation; Rodd Eddy, Consultant; Rajan Kundra, Acumen Fund; Emmanuel Léger, Total; Kilian Reiche, iiDevelopment; Antonio Volpin, McKinsey & Company; and Adam Wolfensohn, Wolfenson & Company; within IFC: Nana Asamoah-Manu, Leo Blythe, Naomi Bruck, Vyjayanti Desai, Ricardo Gonzalez, Sabine Hertveldt, John Kellenberg, Geoffrey Lang, Toshiya Masuoka, Hemant Mandal, Euan Marshall, Itotia Njagi, Reinhard Reichel, Dirk Sommer, Russell Sturm, and Dana Younger; and at the World Bank: Adriana de Aguinaga de Vellutini, Sameer Akbar, Katherine Deaton-Steel, Dan Kammen, Yogita Mumssen, Venkata Ramana Putti, Dana Rysankova, and Bernie Tenenbaum.
We would also like to thank the many companies and organizations interviewed during the course of the research for their invaluable data and insight, including Andoya, Barefoot Power, d.light design, Dasra, Duron, E+Co, Electricité de France, Envirofi t, Fenix International, First Energy, Greenlight Planet, Grassroots Business Fund, GSM Association, Husk Power Systems, Infrastructure Development Company Limited, Intellecap, KwaZulu Energy Services, MoserBaer, Noble Energy Solar Technologies, Nigeria LNG, Nuru, Power Source, SELCO, Shared Solar, Simpa, Soluz, TataBPSolar, Tecnosol, Tizazu, Toyola, and Vihearsur Electrify Enterprise.
The collaboration and assistance of all the people, organizations, and companies mentioned here has enabled us to estimate the proportion of people currently relying on traditional energy to meet their lighting and cooking needs that could be served commercially by modern alternatives; to explore factors that have contributed to the success of some of the many businesses already serving the energy access market; and to offer recommendations to operating companies, social and commercial investors, and policymakers on how these promising but still nascent ventures can be further scaled. We hope these fi ndings will inform the debate on options for achieving universal energy access.
Acknowledgments
9 ABBREVIATIONS
AEC Ahmedabad Electricity Company LimitedAGECC Advisory Group on Energy and Climate Change (United Nations)ARPU average revenue per userATA Agricultural Transformation Agency (Ethiopia)BIDS Bangladesh Institute of Development StudiesBOP base of the pyramidBUC Bonny Utility CompanyCARD MRI a leading microfi nance institutionCDC Commonwealth Development Corporation (United Kingdom)CDM Clean Development MechanismCEMAR the private utility serving the Brazilian State of MaranhãoCEO chief executive offi cerCEPALCO Cagayan Electric Power and Light Company (the Philippines)CERs certifi ed emission reductionsCHUEE China’s Utility-based Energy Effi ciency FinanceCSR corporate social responsibilityDAC Development Assistance Committee (OECD)DESI Power Decentralized Energy Systems, India PowerDfID Department for International Development (United Kingdom)DOMLEC Dominica Electricity Services LimitedEBITDA earnings before interest, taxes, depreciation, and amortizationEU European UnionEU ETS European Union Emissions Trading SystemEWURA Energy and Water Utility Regulation Authority (Tanzania)FiTs feed-in tariffsFMO Netherlands international development bankGDP gross domestic productGIZ Deutsche Gesellschaft für Internationale Zusammenarbeit, German Agency for International CooperationGRENLEC Grenada Electricity ServicesGSMA the international association of mobile phone operatorsHPS Husk Power Systems (India)ICP International Comparison ProgramIDCOL Infrastructure Development Company Limited (Bangladesh)IEA International Energy AgencyIFC International Finance CorporationIREDA India Renewable Energy Development AgencyJPSCo Jamaica Public Service CompanyKfW Kreditanstalt für Wiederaufbau, Reconstruction Credit Institute (Germany’s development bank)kW kilowattkWh kilowatt hourLED light-emitting diode
Abbreviations
10ABBREVIATIONS
AbbreviationsLUCELEC St. Lucia Electricity ServicesMONLEC Montserrat Electricity ServicesMTN an African mobile operatorMW megawattNDPL North Delhi Power LimitedNEST Noble Energy Solar TechnologiesNGO nongovernmental organizationsNLNG Nigeria Liquefi ed Natural GasODA overseas development assistanceOECD Organisation for Economic Co-operation and DevelopmentOPIC Overseas Private Investment Corporation (United States)PEMANDU Performance Management and Delivery Unit (Malaysia)PERG Morocco’s Global Rural Electrifi cation ProgramPLN Indonesia’s state-owned power companyPPP public-private partnership PPP purchasing power parityPV photovoltaicR&D research and developmentRAMI Residential Advanced Meter InfrastructureREPRO Rwanda Renewable Energy PromotionsRESCO Rural Energy Services Company (France)RSFs risk-sharing facilitiesSacco savings and credit organization (Kenya)SHS solar home systemSMEs small and medium enterprisesSMS short message serviceSNV an international nonprofi t organization, started in the NetherlandsSPP small power producerTataBPSolar a joint venture between Tata Power Companies and BP Solar (India)TSch Tanzanian shillingsUN United NationsUNDP United Nations Development ProgrammeUNELCO a subsidiary of France’s GDF-SuezUSAID United States Agency for International DevelopmentUTKL Unilever Tea Kenya LimitedVAT value-added taxVEE Vihearsur Electrify Enterprise VINLEC St. Vincent Electricity Services LimitedVSPPs very small power producersWHO World Health OrganizationWp watt peakWRI World Resources Institute
EXECUTIVE SUMMARY11
ExecutiveSummary
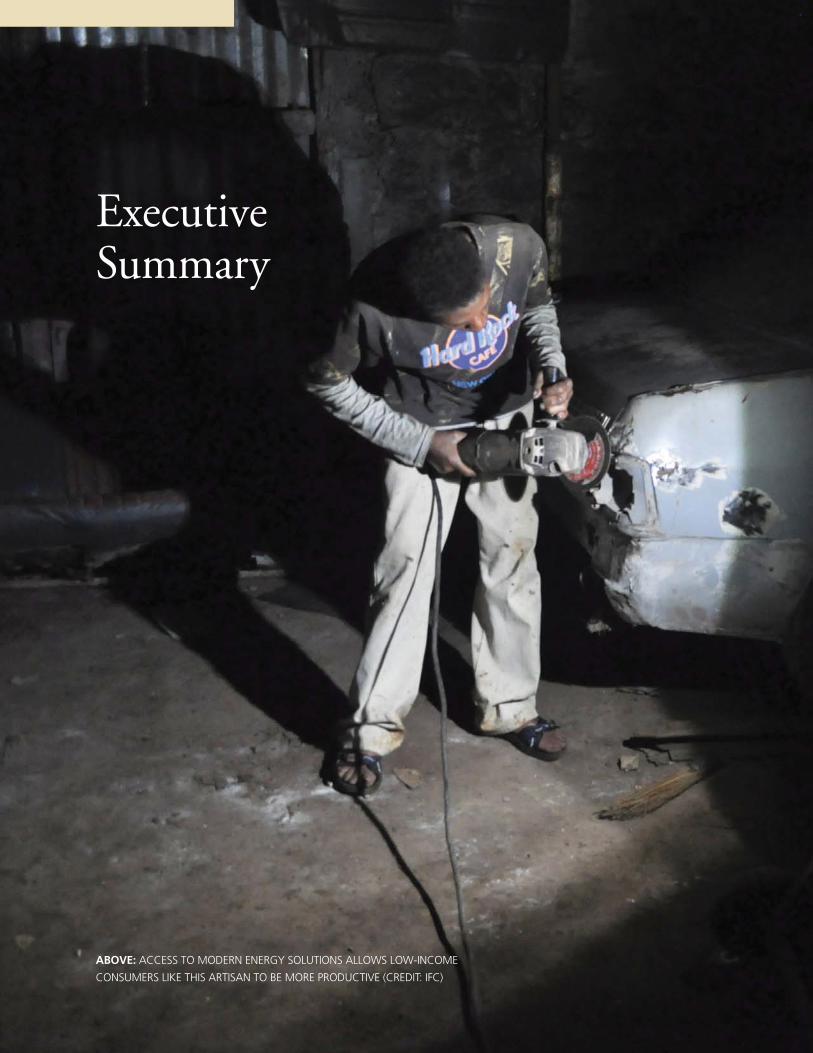
ABOVE: ACCESS TO MODERN ENERGY SOLUTIONS ALLOWS LOW-INCOME
CONSUMERS LIKE THIS ARTISAN TO BE MORE PRODUCTIVE (CREDIT: IFC)
EXECUTIVE SUMMARY 12
While there is broad recognition that lack of access to modern energy has major implications for development, the energy access gap is increasingly being seen as a market. Given the vital role it plays in socioeconomic development, providing improved access to energy has typically been the role of state-owned power utilities, rural energy agencies, international development and nongovernmental organizations, and other public entities. However, with growing recognition of the potential for “base of the pyramid” (BOP) customers to become fast-growing markets for goods and services on the one hand, and the emergence of novel models for serving them on the other, the energy access gap is increasingly being recognized as a commercial opportunity, too. The nature of that market, and the segments within it, is the focus of this report.
Sizing the energy access market opportunityEach year, the poor spend $37 billion on poor-quality energy solutions to meet their lighting and cooking needs. This represents a substantial and largely untapped market for the private sector to deliver better alternatives. It is estimated that over one-fi fth of humankind lacks modern energy services and that the cost of providing “universal access” to the electricity grid and decentralized electrifi cation systems would be in the tens of billions of dollars annually (if the institutional and structural issues in the utility sector could be addressed to enable such a setup).
This report posits, however, that an estimated 90 percent of (poor) people already spend so much on kerosene lamps, candles, and disposable batteries to meet their lighting needs that they could afford to purchase better options, such as solar lamps. Even more people could afford effi cient cookstoves because of the fuel cost savings they offer. Those who are skeptical about the prospect should consider the spectacular takeoff of mobile phone devices. In Africa, the number of subscribers using devices that cost as little as $20—which is at the low end of the cost of many modern energy access devices—has been increasing at a rate of 30 percent annually for the past 10 years. On a continent of 1 billion people, of which some 73 percent live on less than $2 a day, there are currently 620 million cell phone subscriptions, and the user base is expected to hit 735 million in 2012.
Exploring how companies are serving the marketThe good news is that pioneering companies are already making money from selling superior energy access options to households spending as little as $2 on lighting and $1.50 on fuels
for cooking each month. A number of these players—ranging from international social enterprises to local small and medium enterprises (SMEs), domestic conglomerates, and multinational corporations—have already established signifi cant customer bases, or hold promise for scaling up given the right conditions.While this is still a nascent sector, many businesses are rapidly moving beyond being cottage industries and are successfully serving tens of thousands to hundreds of thousands of customers. Some companies are seeing profi t margins of 10 percent to 30 percent, often with fairly small subsidies on capital costs (but not on operational costs) or no subsidies at all.
We explore three ways in which companies are providing improved energy access:
• Household-level devices and systems—including solar lanterns, solar home systems, and improved biomass cook-stoves—offer a basic fi rst step up the energy ladder and are often the most cost-effective option for the dispersed rural poor, and for those who live in urban slums.
• Community-level mini-utilities—often powered by hydro or diesel generators but increasingly using biomass, solar, and wind energy—provide households and small manu-facturing and commercial fi rms with electricity, often for much less than what they currently spend.
• Grid-based electrifi cation—is proving to be a viable option for new customers in many previously unserved urban ar-eas. “Informal consumers” are also being regularized into bill-paying clients.
This study of over 100 enterprises shows that with the right business models and enabling conditions, the private sector can play an important role in helping to close the energy access gap. Each of these market segments exhibits particular characteristics in terms of target consumers, technologies, delivery approaches, and economics. They also require specifi c business ecosystem conditions—that is, legal provisions and regulatory frameworks—for success. But this analysis of commercial ventures from around the globe shows that when innovative companies, frontier fi nanciers, and enlightened policymakers come together, business can successfully deliver valuable energy services to the poor.
“$37 billion spent each year on low-quality energy solutions represents a largely untapped market opportunity for the private sector.”
EXECUTIVE SUMMARY13
Household-level systems and devicesThe household-level systems and devices industry has attracted the greatest private sector innovation. With barriers to entry fairly low, dozens of companies are active across Africa, Asia, and Latin America. Local and international start-ups are growing quickly and some multinational corporations are exploring entry routes into the market. Solar lanterns priced between $20 and $50 are often the most affordable way for poor customers to purchase improved lighting services. Rooftop solar home systems (SHS) that cost $300 to $500 can provide suffi cient power for a household or small retail business and have a fairly long history among both entrepreneurs and development institutions. Companies are also selling effi cient biomass cookstoves for as little as $5 to $25. These stoves offer improved fuel consumption of 30 to 50 percent, meaning dramatically reduced operating expenditures, reduced indoor air-pollution levels, and a reduced burden on the environment.
The business models adopted by lighting and cooking device companies vary. Many of the smaller international solar lantern players, in particular, focus on design and marketing, and outsource their manufacturing. Cookstove companies are often indigenous SMEs that employ artisans to make no-frills devices tailored to local tastes and conditions. But a few international players are entering the stoves space, offering more sophisticated and generally more expensive products. They prioritize design appeal and product quality, and often work with public sector partners to help market stoves, and to spread the word about their benefi ts. SHS players are typically active across much of the value chain. Given that system sizes and add-ons are best designed to address local conditions and user requirements, many of them develop and assemble components, and provide comprehensive installation services and after-sales support.
Affordability is an obvious success factor for devices, and fi rms try to build this into as many aspects of the business as possible. Homegrown cookstove SMEs often leverage open-source designs (typically shared by nongovernmental organizations [NGOs] and development partners) while concentrating internal efforts on low-cost manufacturing using locally available materials, including cheap scrap metal. In the lighting market, economies of scale have led to solar lantern and panel prices dropping sharply, thus increasing their relevance to low-income consumers. But research and development (R&D), too, has played a role in the emergence of very low-cost products. “Solar kits” have surfaced as an alternative to traditional SHS—which can be too expensive for commercialization at scale in many markets without either direct subsidies or the availability of large amounts of concessional fi nance that the SHS provider can on-lend to customers, thus helping to spread payments over time. Solar kits are portable systems that allow households to run multiple lights and charge small devices. Priced at $100 to $200, these kits are more affordable than SHS and require no installation or regular maintenance. Smartly designed solar kits are also proving to be aspirational, helping to increase market penetration. On the payment side, rental and pay-as-you-go billing approaches are helping to reduce the up-front costs for consumers.
“When innovative companies, frontier fi nanciers, and enlightened policymakers come together, business can play an important role in helping to close the energy access gap.”
EXECUTIVE SUMMARY 14
For higher-priced items such as SHS, companies must typically offer consumer credit to make them affordable; this is often done in partnership with microfi nance institutions that have access to concessional fi nancing for on-lending to consumers. Despite the historical emphasis on the importance of microfi nance for helping BOP customers access products, many companies are seeing that this may not be needed for smaller-ticket items, such as solar lanterns and cookstoves, especially since technology costs have fallen. A handful of fi rms are tapping carbon fi nance, notably in the cookstove space. However, they are fi nding that signifi cant support is needed to get through the process of applying for credits.
Fundamentally strong distribution networks and supply chain fi nancing are “make-or-break” for devices businesses. In order to effectively penetrate BOP markets that are often in hard-to-reach rural areas, some companies sell devices through partners that have largely overcome last-mile distribution challenges to sell or distribute their own offerings, notably NGOs and microfi nance institutions. The results have been mixed since incentives are not always aligned. Most companies stick to traditional retail channels in urban areas while establishing their own sales force in rural communities; typically, these rural salespeople go door-to-door in their own and in neighboring villages, demonstrating how products work and building trust that the seller can be traced if the product needs repair. Still others incentivize dealers to stock their items by offering a disproportionately high percentage of profi ts, leaving them to manage marketing, working capital, and other downstream issues. However, fi nancing the length of the distribution chain, from the import of containers to wholesalers, through to distributors and then on to often many levels of retailers, can be costly.
Financing distribution is typically a natural comparative advantage of larger companies. Multinational corporations, in particular, are leveraging strong balance sheets, taking advantage of their brand names to get into the game and then quickly developing strong supply chains—from warehousing infrastructure to distributor credit facilities—to capture market share. There are, however, early signs of smaller players exploring innovative ways to deal with working capital by selling to large, nonconventional dealers—in some cases, local conglomerates or multinational corporations—that serve as aggregators and are well placed to provide the necessary trade fi nance to retailers downstream. In one instance, a major oil and gas company interested in the access market is establishing distribution channels (that tap its petroleum fi lling stations in selected countries) for solar lanterns, with the jury still out as to whether it will develop a proprietary lighting product.
But device manufacturers also have to work hard to create consumer confi dence in new technologies. As with any new equipment supplier, leading-edge device players are faced with cautious customers reluctant to risk their money on unfamiliar technology. Overcoming this can become a major marketing cost—exceeding conventional brand-building expenditure. Manufacturers have used a variety of highly effective low-cost tactics to overcome this barrier, such as word-of-mouth marketing, publicly funded radio campaigns, and roadshows. But, for many, awareness raising and market development is an important fi nancial sink; companies report that this typically adds 6 percent to 10 percent to device costs.
Device companies thrive in an ecosystem where the playing fi eld is level. That is, when there is suffi cient technology awareness, product standards exist, and tax and duty regimes do not discriminate against them. When these factors are combined with training and support of entrepreneurs, fi nance for growth, and in some instances carbon credits to help bring down the cost (of cookstoves in particular), successful device fi rms emerge and grow rapidly.
Community-level mini-utilitiesSmall, decentralized mini-grid businesses—we call them “mini-utilities”—are found in poor areas across the developing world and can offer suffi cient power for both household and productive use. These entities vary enormously in scale but are generally from 30 kilowatts (kW) to 500 kW and use a range of technologies, from simple diesel generators to hydropower, biomass, photovoltaic, or hybrid systems. Many mini-utilities deliver electricity at $0.20 to $0.50 per kilowatt hour (kWh), allowing most families to meet basic energy needs for less than $10 per month. This is a signifi cant expenditure, but the economics are attractive in many places because households already spend as much on kerosene and charging services for small appliances. Importantly, mini-utilities often provide suffi cient power for activities such as water pumping, milling, grinding, and other forms of processing, thus supporting local economic development.
Profi table mini-utilities have an adequate demand for power; a reliable, cheap fuel source; and good bill collection approaches. For mini-grids to size systems optimally and operate effi ciently, they require suffi cient baseload. This is often achieved by serving a mix of household and SME customers, with the latter providing a more predictable demand for electricity over time, and the ability to pay for it. While diesel is often a preferred fuel given its availability, many companies use renewable energy to keep costs down and more predictably stable. Where available,
EXECUTIVE SUMMARY15
biomass feedstock is a good option, but it also creates several challenges in controlling supply that mini-utilities must overcome. On the revenue management side, some companies are installing low-cost meters and switches that allow for easy disconnection in the case of nonpayment.
Others charge fi xed monthly fees for a limited service, such as suffi cient power for a couple of lights and charging of appliances, generally collected a month in advance. Beyond formal billing systems, developing close ties to the community is important, and successful mini-utilities work hard to be an integral part of the community. Interestingly, formal business skills are not an initial requirement for mini-utility success, but they do become critical for scaling up beyond a single site or a handful of sites. This is especially true for mini-utilities using renewable technologies, which are more sophisticated or have higher maintenance requirements than diesel generators.
Mini-utilities thrive in an ecosystem where they have the right legal and regulatory framework and good fi nancing options. Simply put, mini-utilities must be allowed to operate and to do so under a regime where tariffs allow an attractive return on investment. Perhaps surprisingly, this is not always the case—in some countries mini-utilities are not permitted and in others they are subject to onerous regulations or non-cost-refl ective tariffs. Where the right environment exists, profi table businesses operating one or a handful of plants can be found. But there are circumstances where some degree of subsidy is provided to make mini-utilities profi table. This is generally the case where governments are seeking to encourage private developers to enter the market but where tariffs alone are not commercially sustaining, where low population density increases the cost of building distribution networks, or where consumers are simply too poor to support the required revenues. In most instances, public fi nancing comes in the form of a capital subsidy, ranging from 30 percent in India to up to 80 percent in Mali. More broadly, these companies need sizable investment to scale, yet most struggle to raise suffi cient debt and equity for this. We believe that the ongoing success of mini-utilities will be linked to their ability to access these funds.
Grid-based electrifi cationFor almost all governments, universal grid-based electrifi cation is the endgame, yet levels remain very low in many parts of the world. Grid-based electrifi cation supports economic and social development imperatives by providing the quantity and quality of services required for large energy-intensive industrial activities. It also allows for economies of scale in generation and effi ciency in establishing peaking and back-up plants, reducing overall system costs. But only 30 percent of the population in Sub-Saharan Africa and 60 percent in Southeast Asia are connected to a network. Even when access to the grid is available, customers in many developing countries are plagued by unreliable power. Where system ineffi ciencies and theft create signifi cant losses, utilities are unable to cover their costs. The result is that companies struggle with solvency and are unable to provide high-quality service to existing customers, let alone deliver new connections. Hence, despite having “access,” it is not unusual for households and businesses to rely on expensive power from back-up generators to make up for poor utility service.
There is a market opportunity to connect previously unserved households profi tably. Beyond the prospect of providing improved service to existing grid-connected customers, some companies—most notably in urban and peri-urban areas in Brazil, India, and Colombia—have through choice or circumstance become smarter at serving the poor. In some cases, they have achieved this by turning households and businesses that were purchasing excessively expensive and often intermittent services from informal suppliers in their communities into utility customers. In other
EXECUTIVE SUMMARY 16
instances, they have taken money off the table by regularizing consumers who may not have formally been paying for the services they used. All have typically succeeded by installing prepayment meters, providing payment fl exibility, offering consumer fi nance to encourage the use of legal connections and, more broadly, operating their businesses effi ciently.
Grid extension can benefi t from policies that explicitly support private participation. This means removing limits on service areas where it makes sense, relaxing restrictions on serving informal settlements, allowing fl exibility in tariff regulation, and fi nancing the connection of the end customer.
But high costs and limited consumption by low-income consumers mean that purely commercial models for grid-electrifi cation are still rare; public funding has played an important role in the success of most truly large-scale extension programs. The capital investment required to generate power and extend lines means that grid extension is costly. Meanwhile many unconnected customers have low incomes and therefore have limited consumption, resulting in slim returns. In addition, a large portion of unelectrifi ed urban households live in slums, with the implication that they are unlikely to have legal tenure and may thus not qualify for—or are prohibited by municipalities from formally accessing—electricity services. Where providing widespread grid-based access for the energy poor has been successful, as in China, South Africa, and Vietnam, this has largely been a result of explicit policies mandating it and has been backed by signifi cant fi nancial commitments from the public purse. Commonly, governments choose to award concession contracts for new or privately owned distribution companies to serve currently unserved areas. This can also be combined with smart subsidies to extend access even further than would be viable on a purely commercial basis. Private companies often bring access to capital and new management approaches, which allow them to increase connections more quickly than public utilities, while improving the bottom line.
Acting on the fi ndings: what can be done to scale-up energy access success stories?There is a real market opportunity for closing the energy gap; however, scale-up and replication challenges will need to be addressed. This report asserts that energy access is not just a development gap, but also a real market opportunity for the private sector. Around the world, entrepreneurs are already
seizing the opportunity to profi tably supply appropriate, affordable goods and services to the poor. But despite the progress made in technology innovation and delivery approaches over the past decade or so, there remains much to be done before this becomes a more “mainstream” area on par with mobile telephony, for example. In particular, very fundamental scale-up and replication challenges will have to be addressed if the sector is to achieve its potential. There are a number of areas on which operating companies, policymakers, and impact investors (social venture capitalists and donors) can focus to further catalyze commercial activities in energy access.
Refi ning business models: challenges for operating companies to addressCompanies should continue to design for radical affordability in every area of operations. Businesses serving the BOP invariably require volume to make up for typically low margins. Affordability is critical for this and can continue to be achieved through innovation on product and service design, business model innovation, and provision of consumer fi nance, either directly or indirectly.
Perhaps the most important factor for all device companies is to secure robust distribution channels. Partnering strategically with companies that have already established strong distribution channels is one way of getting products to market more quickly. For example, tie-ups with mobile telephony network operators could be a good start, because the products are complementary (charged cell phones benefi t the mobile operator’s average revenue per customer) and they require similar supply chains for getting goods to customers and fi nancing them along the way. Equally, if a company has been able to develop strong networks of its own, it could leverage this asset to cross-sell other products. These might be other energy devices (such as cookstove manufacturers that also sell solar lanterns) or other products that would be desirable to end users such as radios, irrigation pumps, and water purifi ers. Device players, that is, companies in the device market, should also concentrate on ensuring suffi cient working capital to support retailers in stocking products; in many cases, this will require partnering with fi rms able to provide such fi nancing.
For mini-utilities, the operating basics are focused on innovative approaches to developing multisite systems. Once they have mastered the reliable supply of low-cost fuel and secured suffi cient demand, most companies struggle to fi nd a replicable business model that allows them to leverage the economies of scale that are critical for growth. While there are no easy remedies, one option to explore could be the “anchor client” model. Here, a mini-utility would partner with mobile network operators
EXECUTIVE SUMMARY17
(to manage the power needs of off-grid base stations) or other businesses, such as commercial farms or extractive industries, and in parallel, sell electricity to close-by communities. Another approach could be to supply rural government institutions such as agricultural extension facilities, clinics, schools, and possibly railway installations with power on a contract basis and then to build community mini-grid operations around such demand centers. Or they could provide power on an offtake agreement to existing mini-grids, for instance, remote systems operated by the central utility. This would allow the central utility to focus on increasing connections rather than adding off-grid capacity, and likely reduce overall costs of operations if it were based on renewable energy rather than diesel generation. Contracts with any of these entities would need appropriate advance payments or guarantees, and long-term agreements to serve multiple areas.
If growth were to take off, mini-utilities would need to develop the right span of control over dispersed systems to manage the operating complexity and resulting overheads that typically come with running several dispersed systems. One idea that could help businesses scale effi ciently is an “umbrella company” that plays, among other roles, a contract negotiation and governance function, assists in raising fi nancing, provides resource assessments and strategic planning advice, and procures equipment centrally.
For grid-based utilities, the basics fundamentally mean being fi t for purpose, which is achieved by enhancing system effi ciency. This begins with investing in reducing both technical and nontechnical losses. While the skills and access to capital that have led to large-scale grid extension in some countries will take time to replicate in others, many more straightforward tactics can be employed universally. These center on preventing theft, managing payment risk, and introducing fl exible payment options. Utilities in Brazil, Colombia, India, and Uganda provide evidence that such measures can lead to enhanced utility commercial viability and, in turn, (often aided by smart subsidies), increased connections for the poor.
To succeed over the long term, companies need to play to their strengths and build a compelling business case—and a strong development story—and should consider professionalizing their management teams in order to secure fi nancing and grow their businesses. Smaller companies, especially those that are locally run, have several advantages. They are often nimble and have low costs, good knowledge of the market’s product preferences and ability to pay, and have customer reach through innovative networks. Larger fi rms typically have deep pockets; broader management expertise; and some value chain advantages including procurement, convening power, and the ability to scale across geographies. But this alone is not enough to be a successful player in the long term. Given that many start-ups (especially
the device manufacturers) begin life as social enterprises, the social benefi ts of their endeavors are usually well communicated. Potential investors are looking for both a strong business case and a great story about potential development impact; rarely is the latter suffi cient for consistently attracting capital, even from impact investors. Hence, a well thought out commercial business plan is fundamental to securing fi nancing, and, fairly soon after they get going, smaller fi rms should also think about how best to professionalize their management teams to ensure that they take the business forward and help it grow.
Larger companies making tentative forays into the market should ensure that such ventures are given the required resources and internal visibility. While they may begin below the top-management radar screen, these ventures should quickly be showcased within the company—as a CEO-sponsored effort, for example. They would do well to use this platform to leverage core competencies, from distribution to procurement, across the business. And, here too, capital and strong management skills are needed for them to grow. So, an initiative may be incubated in the corporate social responsibility department, or another “soft start” area of the business, but cannot be allowed to remain there. Once suffi cient time has been given to nurturing an innovative model, it must be treated commercially and resourced accordingly.
Rethinking policy: Roles for governments and their development partnersFor policymakers—that is, governments and the development partners with which they work—leveraging business as far as possible to increase energy access should be a priority; this strategy would allow public funds to be directed toward reaching the “last mile.” As the examples in this report show, conducive policy can help to attract the private sector to all three energy access markets. This means that household-level systems and mini-utilities should be recognized in policies as good options, and be fostered accordingly. It also means that the private sector should be seen as part of the solution; development imperatives and profi ts need not be incompatible. If policymakers encourage business to address a sizable portion of the access gap, they can concentrate their own limited public funds on those segments of the population that can only be served through public means. Meanwhile, in order to ensure economic effi ciency, those public funds that the private sector accesses would be limited to closing the “viability gap”—that is, the shortfall between revenues that customers are able to contribute and those needed for enterprises to be fi nancially workable.
EXECUTIVE SUMMARY 18
While energy access can, in many instances, be a complex political issue, policymakers would do well to resist giveaway programs and unrealistic promises where markets exist. First, smart subsidies can be an invaluable tool for providing services to the poor. But, carelessly thought through “giveaways” can distort the market and limit the success of otherwise commercially viable offerings. Customers who are willing and able to pay the full price for a product or service will of course hesitate to do so if they know that others received a giveaway and that they may be next to enjoy this benefi t. Second, if they favor certain types of products, giveaway programs risk stunting innovation and encouraging companies to manufacture according to specifi cations that are not always optimal for the market. Finally, free products also deter businesses from investing by creating risk that they will have to compete with giveaways.
Policymakers should consider removing discriminatory import tariffs across energy access products. This report illustrates the ways in which many governments impose penalties on modern energy access products that are higher than the duties and taxes on conventional energy products. Often the effects are discriminatory and perverse, creating a bias in energy provision toward a better-off grid-connected population and away from poorer households, and toward conventional rather than renewable generation sources. Countries that have instituted successful renewable energy access programs have typically relied on removing such tariffs.
For mini-utilities, there are a number of supportive policies that can be implemented, including rethinking service areas, instituting appropriate “light-handed” regulation, and creating a solid revenue framework for fi rms. Rethinking service areas involves being clear on where potentially competing grid extension projects will head, and relaxing exclusivity on who can operate in other areas. Instituting appropriate “light-handed” regulation means streamlining requirements for SMEs operating mini-grids, instead of applying rules in this subsector that were originally designed for large utilities. Creating a solid revenue framework for companies means establishing market pricing for mini-utility tariffs, subsidizing connection costs where needed to close the viability gap and, if appropriate to the business model, helping to manage payment risks for service contracts with large offtakers, including incumbent utilities that buy excess power.
For grid-based access, public-private partnerships such as concessions hold the potential to extend reach when they are carefully structured with incentives to connect end users. For grid access to be successful, service areas need to be prioritized, subsidies structured to cover viability gaps, and delivery
mechanisms put into place to ensure that concessionaires are each implementing their part of the bargain as promised, or alternatively, allowing for regulatory counterparts to adjust contracts where this is below par.
Refocusing fi nancing: Opportunities for impact and commercial investorsInvestors can play a strategic role in helping to catalyze commercial approaches to improved energy access. Commercial lenders, social venture capitalists, local development banks, philanthropists and international development agencies would do well to keep investment mandates broad and beyond a single technology. This will attract a wider selection of promising companies to invest in and build a stronger portfolio. Investors should also establish deal marketplaces and local presence to discover hidden gems. Without these, it will be diffi cult to identify those lower-profi le companies that hold great promise—many of which may initially be community-level efforts.
First, fi nancing from both impact and commercial investors is needed at various stages of the business life cycle. In the energy access industry, there are roles for impact investors (particularly at the earlier stages) and commercial investors (especially for growth capital), but these should be directed at the needs of the investable companies. While innovators often start as social ventures, they have the potential to become sizable double bottom line companies.1
But to do so, they need help from impact investors to become bankable. Support could take the form of start-up grants, concessional fi nancing at attractive terms, or loan guarantees to allow fi rms to borrow from commercial banks, for example. Alternatively, support could be used to guarantee revenue streams, for instance from large but perhaps less creditworthy offtakers, such as entities that serve as anchor clients for mini-utilities. Given the diffi culty in identifying and assessing individual companies, it would make sense to channel programmatic monies via wholesaling mechanisms: this means that impact investors should work with intermediaries that are set up specifi cally to support a portfolio of energy access businesses rather than attempt to cherry-pick “winning companies” themselves. Commercial investors should then address deal size, especially the “missing middle,” typically between $50,000 to $100,000 and $3 million to $5 million, while providing both debt and equity at the start-up phase and throughout the company life cycle. In this market, there is also a particular need for trade fi nance and carbon prefi nance (to support the carbon credit registration process, and front-load payments for emissions reductions) for many companies.
EXECUTIVE SUMMARY19
Second, both investment and enterprise development support are fundamental to company success. Hence, at the individual company level, funds for business model refi nement and management capacity building should be coupled with fi nancial investments. The goal should be to help executive teams implement organizational structures and operating approaches and to develop robust growth strategies that allow the business to really scale. This is a model common in venture capital fi rms, which provide early-stage fi rms with active guidance designed to ensure that the investee delivers a suitable return. At the subsectoral level, donors can also help to support the design and testing of business models for companies operating at the frontier in energy access where there are diffi cult opportunities with high potential. This is the case, for instance, in the mini-utilities subsector, where profi table businesses have diffi culty growing beyond a few isolated systems. Impact investors could potentially help to demonstrate proof of concept of scalable models by partially funding an umbrella fi rm setup or franchising plan.
Third, donors can help reduce fi rst-mover costs by addressing public good issues, namely providing market intelligence and information on the availability of resources and helping to build consumer trust and awareness. As with all emerging sectors, there are high fi rst-mover costs in the nascent energy access space. Certain critical inputs to the development of a business venture may be prohibitively expensive to secure. Many such inputs can also be seen as public goods. These include collecting information on the availability of resources (such as biomass or hydropower potential) needed by mini-utilities, and gathering market intelligence on local customer spending patterns and preferences to help device players refi ne offerings. The same is true for building consumer awareness of and trust in new technologies, and putting into place appropriate standards to ensure that high-quality products enter the market as a whole.
Finally, it is important to have effective institutional capacity to deliver on energy access targets. Governments sould consider establishing “delivery” units specifi cally tasked with managing the rollout of targeted energy access efforts including, as applicable, market-orientated programs to stimulate device uptake, mini-utility development, and grid extension programs. Effective local standards agencies for device manufacturers and regulatory bodies to manage mini-utility power purchase agreements or large electrifi cation concessions are also needed. These areas can all benefi t from donor funds.
EXECUTIVE SUMMARY 20
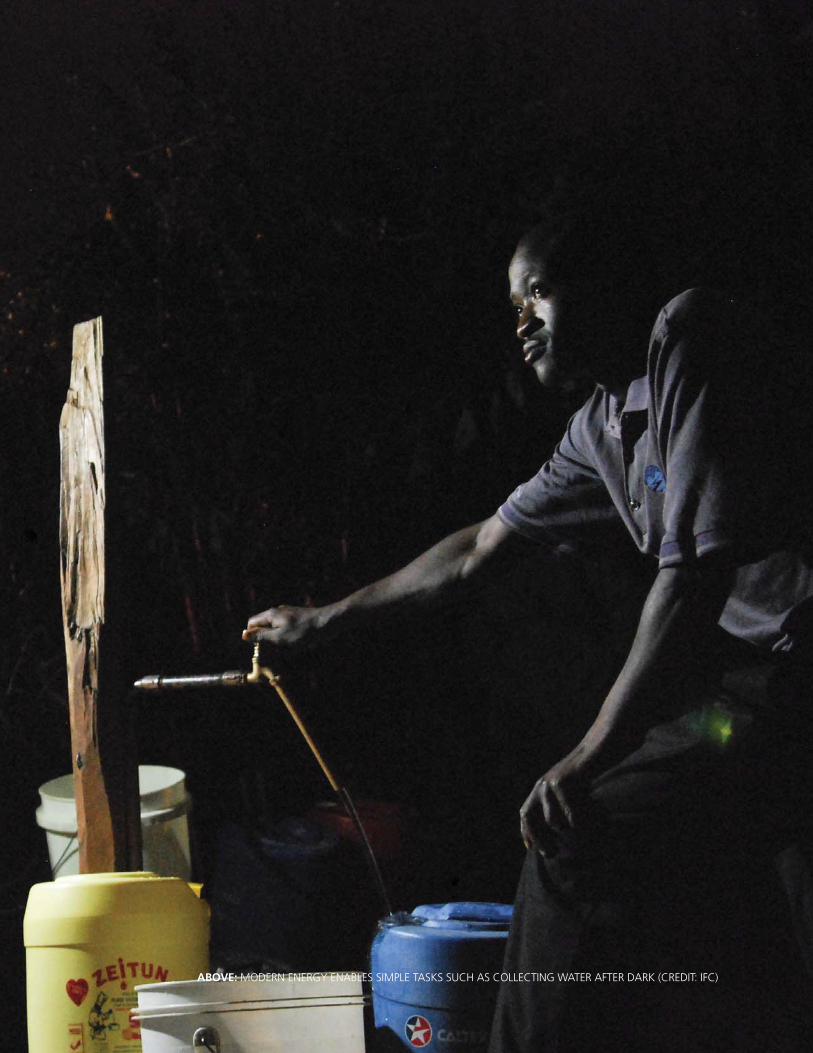
ABOVE: MODERN ENERGY ENABLES SIMPLE TASKS SUCH AS COLLECTING WATER AFTER DARK (CREDIT: IFC)
CHAPTER 121
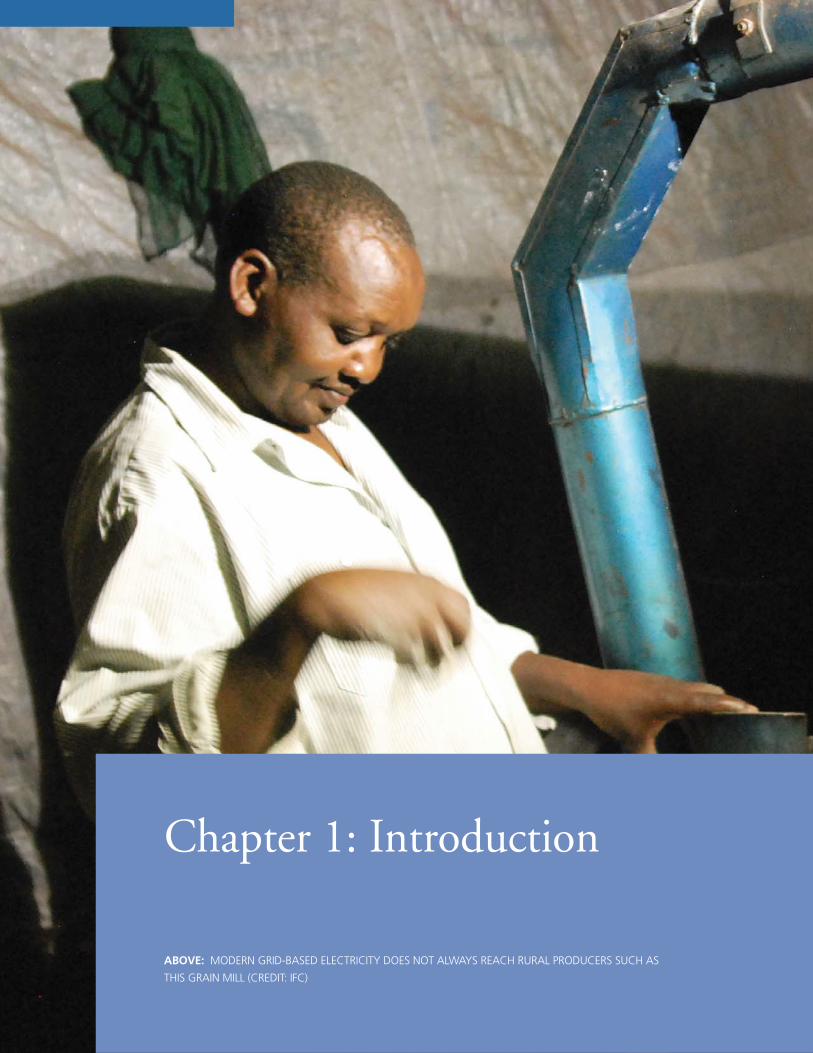
Chapter 1: Introduction
ABOVE: MODERN GRID-BASED ELECTRICITY DOES NOT ALWAYS REACH RURAL PRODUCERS SUCH AS
THIS GRAIN MILL (CREDIT: IFC)
INTRODUCTION 22
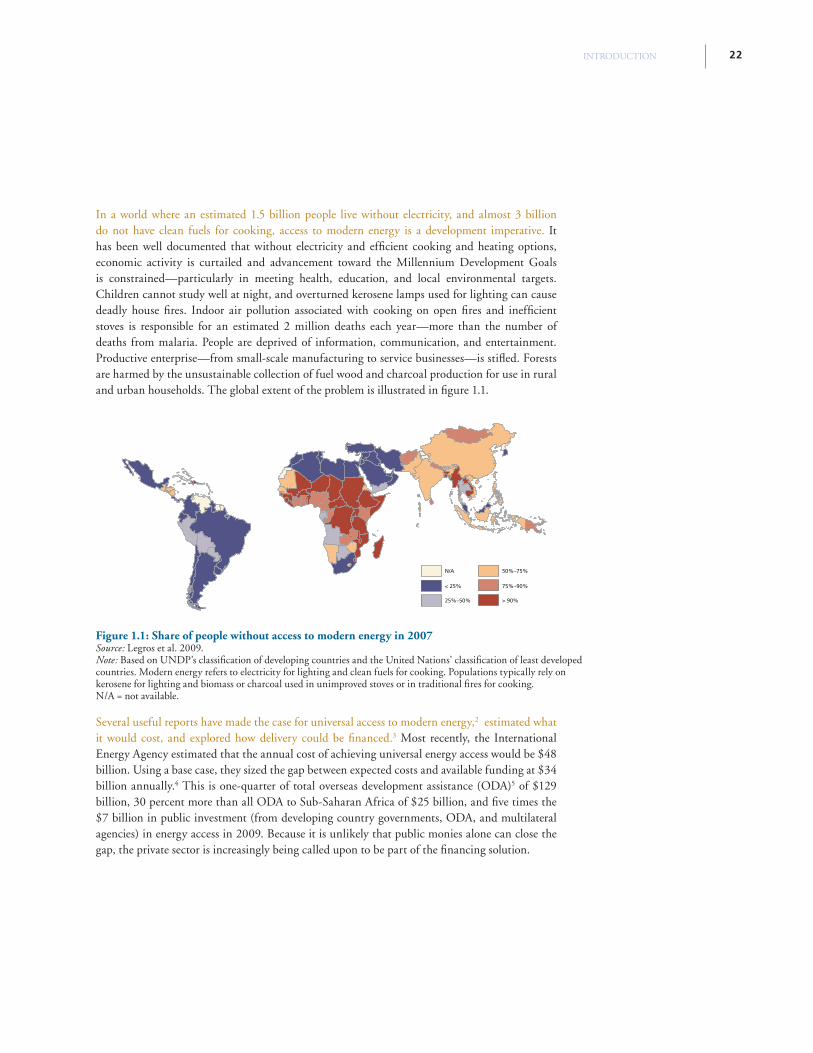
In a world where an estimated 1.5 billion people live without electricity, and almost 3 billion do not have clean fuels for cooking, access to modern energy is a development imperative. It has been well documented that without electricity and effi cient cooking and heating options, economic activity is curtailed and advancement toward the Millennium Development Goals is constrained—particularly in meeting health, education, and local environmental targets. Children cannot study well at night, and overturned kerosene lamps used for lighting can cause deadly house fi res. Indoor air pollution associated with cooking on open fi res and ineffi cient stoves is responsible for an estimated 2 million deaths each year—more than the number of deaths from malaria. People are deprived of information, communication, and entertainment. Productive enterprise—from small-scale manufacturing to service businesses—is stifl ed. Forests are harmed by the unsustainable collection of fuel wood and charcoal production for use in rural and urban households. The global extent of the problem is illustrated in fi gure 1.1.
Several useful reports have made the case for universal access to modern energy,2 estimated what it would cost, and explored how delivery could be fi nanced.3 Most recently, the International Energy Agency estimated that the annual cost of achieving universal energy access would be $48 billion. Using a base case, they sized the gap between expected costs and available funding at $34 billion annually.4 This is one-quarter of total overseas development assistance (ODA)5 of $129 billion, 30 percent more than all ODA to Sub-Saharan Africa of $25 billion, and fi ve times the $7 billion in public investment (from developing country governments, ODA, and multilateral agencies) in energy access in 2009. Because it is unlikely that public monies alone can close the gap, the private sector is increasingly being called upon to be part of the fi nancing solution.
N/A
< 25%
25%–50%
50%–75%
75%–90%
> 90%
Figure 1.1: Share of people without access to modern energy in 2007 Source: Legros et al. 2009.Note: Based on UNDP’s classifi cation of developing countries and the United Nations’ classifi cation of least developed countries. Modern energy refers to electricity for lighting and clean fuels for cooking. Populations typically rely on kerosene for lighting and biomass or charcoal used in unimproved stoves or in traditional fi res for cooking.N/A = not available.
CHAPTER 123
Reframing Energy Access as a MarketWhile the socioeconomic rationale is clear, the business case for private investment in energy access has not always been apparent. As with many other infrastructure services, a public sector mindset has often dominated the energy access debate. Pilot projects in remote areas have proliferated while commercial solutions have generally not been encouraged. Moreover, well-intentioned but sometimes badly designed or unnecessary donations from governments, philanthropists, and development agencies have often scared entrepreneurs away. And, where businesses have taken root, more often than not they have struggled. Information on consumer willingness to pay is scant. Technology costs have been high and distribution networks weak. In some cases, legal and regulatory frameworks have been inappropriate and requisite fi nancing for new ventures not readily available. In addition, motivated entrepreneurs have not always understood “base of the income pyramid” (BOP) markets or had the skills to succeed in or scale their business operations.
This report fi nds, however, that a convergence of exciting trends is set to reignite business interest in the energy access market. It is not surprising that, until very recently, there has only been scattered business activity in the energy access domain. But several parallel developments are reshaping the debate, including the emergence of new technologies and declining costs of existing ones such as PV (photovoltaic) panels, LEDs (light-emitting diodes), and batteries; increasing fossil and cooking fuel prices that are forcing innovation; recognition of the critical relevance of the access agenda to the Millennium Development Goals; and the rise of social entrepreneurship and impact investing.
A growing number of entrepreneurs are demonstrating—often at a relatively small but rapidly rising scale—that profi table ventures can indeed be built in low-income markets. Both local SMEs and conglomerates are succeeding in selling modern lighting and cooking devices, off-grid electrifi cation and, to some degree, grid extension services to the BOP. Ambitious international start-ups are also emerging, particularly in the household energy devices space. There has been an appetite among some large multinational companies to expand their markets to the poor, too—and not solely as part of their corporate social responsibility efforts. Some fi rms in the devices and mini-utilities markets are making 10 to 30 percent profi t margins. Promisingly, fi nanciers are starting to express interest, with both commercial venture capitalists and impact investors making some tentative but high-profi le and potentially instructive plays in the past two years. And there is mounting evidence that enabling ecosystems—the legal and regulatory frameworks within which the private sector operates—can be improved and donor interventions structured in such a way as to nurture businesses.
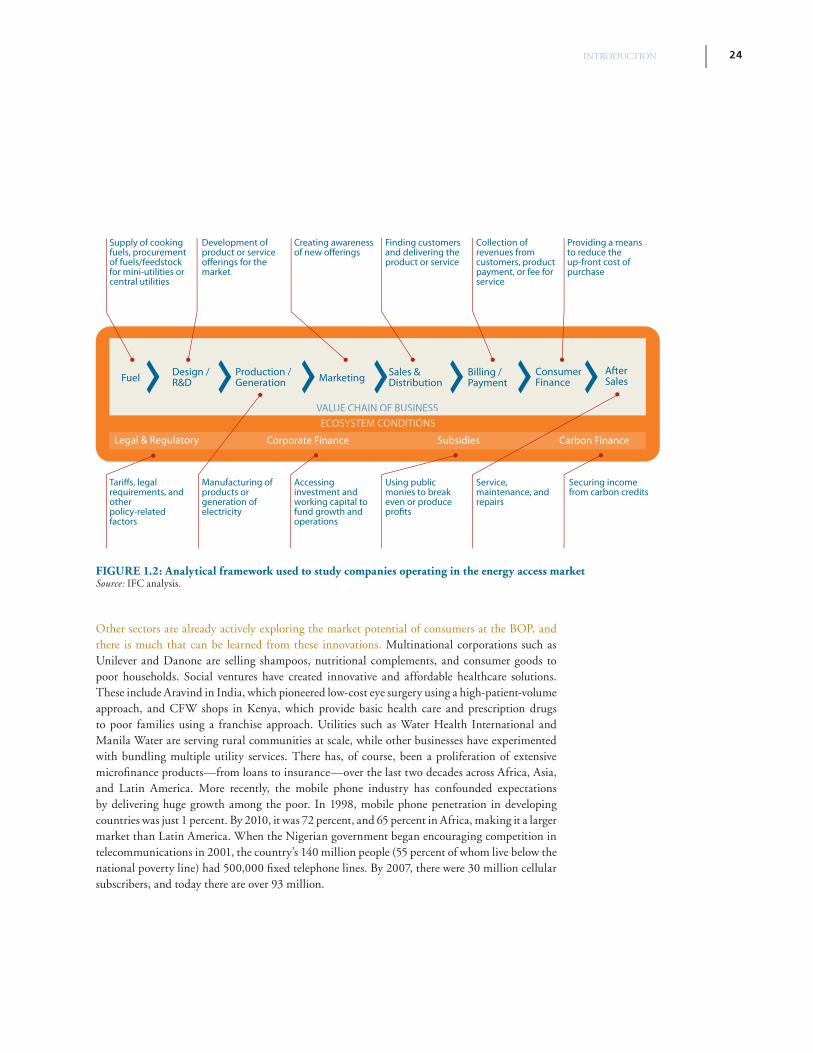
This report’s analytical framework covers both the business operating model and the wider ecosystem. Figure 1.2 illustrates how we examine each step of the value chain to identify the success factors and areas where the greatest challenges lie and assesses ecosystem conditions that hinder or support profi table business activities.
“In this report we examine each step of the value
chain to identify the success factors for businesses.
We also identify the ecosystem conditions that
hinder or enable profi table private enterprise.”
INTRODUCTION 24
Fuel Design /R&D
Production /Generation Marketing Sales &
DistributionBilling / Payment
After Sales
ECOSYSTEM CONDITIONS
Tariffs, legal requirements, and other policy-related factors
Manufacturing of products or generation of electricity
Accessing investment and working capital to fund growth and operations
Using public monies to break even or produce profits
Securing income from carbon credits
Service, maintenance, and repairs
Corporate Finance Carbon Finance
Consumer Finance
Subsidies
Supply of cooking fuels, procurement of fuels/feedstock for mini-utilities or central utilities
Development of product or service offerings for the market
Creating awareness of new offerings
Finding customers and delivering the product or service
Collection of revenues from customers, product payment, or fee for service
Providing a means to reduce the up-front cost of purchase
VALUE CHAIN OF BUSINESS
Legal & Regulatory
FIGURE 1.2: Analytical framework used to study companies operating in the energy access marketSource: IFC analysis.
Other sectors are already actively exploring the market potential of consumers at the BOP, and there is much that can be learned from these innovations. Multinational corporations such as Unilever and Danone are selling shampoos, nutritional complements, and consumer goods to poor households. Social ventures have created innovative and affordable healthcare solutions. These include Aravind in India, which pioneered low-cost eye surgery using a high-patient-volume approach, and CFW shops in Kenya, which provide basic health care and prescription drugs to poor families using a franchise approach. Utilities such as Water Health International and Manila Water are serving rural communities at scale, while other businesses have experimented with bundling multiple utility services. There has, of course, been a proliferation of extensive microfi nance products—from loans to insurance—over the last two decades across Africa, Asia, and Latin America. More recently, the mobile phone industry has confounded expectations by delivering huge growth among the poor. In 1998, mobile phone penetration in developing countries was just 1 percent. By 2010, it was 72 percent, and 65 percent in Africa, making it a larger market than Latin America. When the Nigerian government began encouraging competition in telecommunications in 2001, the country’s 140 million people (55 percent of whom live below the national poverty line) had 500,000 fi xed telephone lines. By 2007, there were 30 million cellular subscribers, and today there are over 93 million.
CHAPTER 125
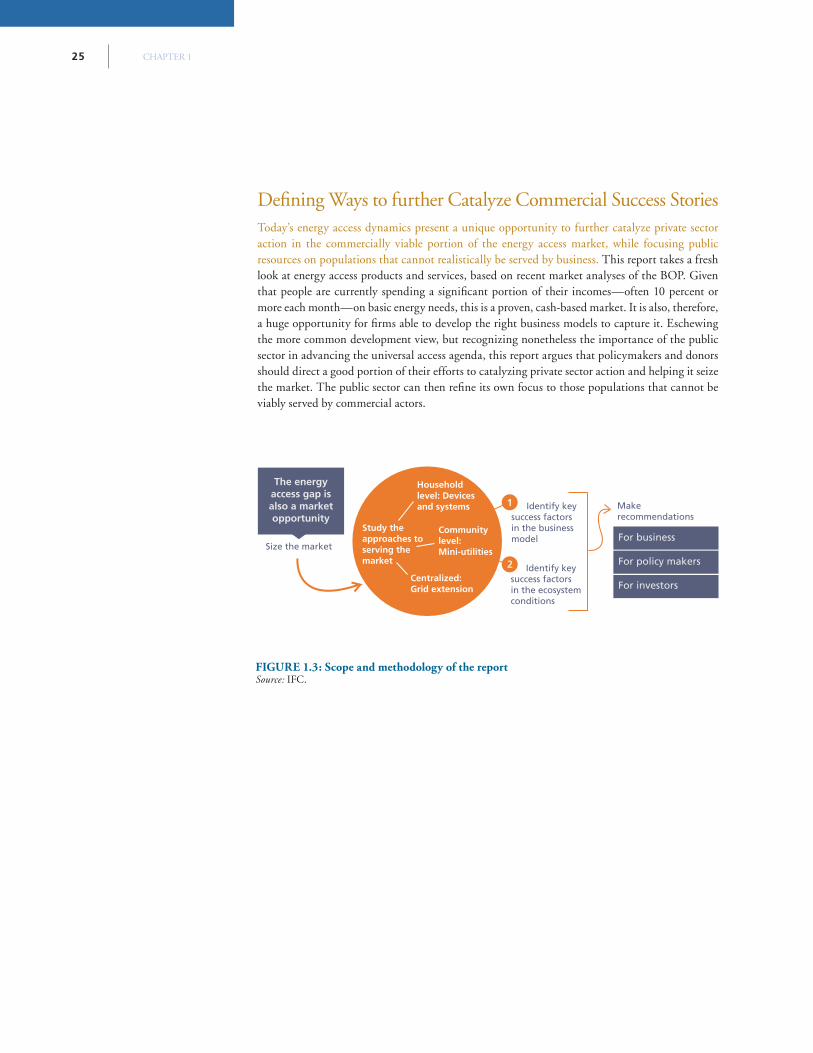
Defi ning Ways to further Catalyze Commercial Success StoriesToday’s energy access dynamics present a unique opportunity to further catalyze private sector action in the commercially viable portion of the energy access market, while focusing public resources on populations that cannot realistically be served by business. This report takes a fresh look at energy access products and services, based on recent market analyses of the BOP. Given that people are currently spending a signifi cant portion of their incomes—often 10 percent or more each month—on basic energy needs, this is a proven, cash-based market. It is also, therefore, a huge opportunity for fi rms able to develop the right business models to capture it. Eschewing the more common development view, but recognizing nonetheless the importance of the public sector in advancing the universal access agenda, this report argues that policymakers and donors should direct a good portion of their efforts to catalyzing private sector action and helping it seize the market. The public sector can then refi ne its own focus to those populations that cannot be viably served by commercial actors.
FIGURE 1.3: Scope and methodology of the reportSource: IFC.
Identify key success factors in the business model
Identify key success factors in the ecosystem conditions
Make recommendations
Size the market
Householdlevel: Devices and systems 1
2
Community-level:Mini-utilities
Study the approaches to serving the market
The energyaccess gap is also a market opportunity
For business
For policy makers
For investorsCentralized: Grid extension
INTRODUCTION 26
About this reportThis report is intended for business decision makers, policymakers, and impact and commercial investors. It covers the areas of the energy landscape that present an opportunity for making a profi table business out of extending energy access to the poor (that is, those who earn less than $2 a day).
The scope of the report (see fi gure 1.3) is global, covering developing countries in Africa, Asia, and Latin America, where many people do not have access to modern energy. While there is a range of energy services that people need—not least energy for productive uses—and various solutions available to meet these needs, this report focuses specifi cally on technologies and services that provide improved lighting, or “lighting plus” (primarily lighting but solutions that can generally also avail other electricity-related services) and cooking for the household market.
Three solutions are considered for lighting: (a) solar lanterns, solar kits, and rooftop solar home systems; (b) electricity supplied by mini-grids operated at the community level (which we term “mini-utilities”); and (c) electricity supplied through grid extension from a central utility. In the cooking space, we review improved biomass cookstoves. The rationale is that the greatest growth and innovation appears to be in these offerings, with fairly large numbers of businesses starting to operate at scale. In addition, based on current cash expenditures and from a levelized cost perspective, they are affordable to a sizable portion of those people currently relying on traditional energy.
The report is laid out as follows. Chapter 1, the introduction, discusses energy access as a market and defi nes ways to further catalyze commercial success stories. Chapter 2 explores how companies are serving the market, with an in-depth analysis of energy devices, mini-utilities, and grid extension. Chapter 3 discusses what can be done to help scale-up energy access success stories, with an emphasis on refi ning business models; rethinking policy and the roles of governments and development partners; and refocusing fi nancing, including a discussion of the opportunities for impact and commercial investors.
Our approach has been to fi rst estimate the “size of the prize,” or revenues that could potentially be generated; this provides the market size. Next, we study what the private sector is already doing and what can be learned from its successes. To do this, extensive interviews were undertaken with a range of companies active in this space and with the organizations that support them. Secondary research provided additional data on selected case studies. Having gained this insight, our analysis identifi ed the factors attributable to the businesses themselves and those attributable to the environment in which they operate. We then distilled the key success factors into a set of recommendations for business, policymakers, and social and fi nancial investors.
CHAPTER 227
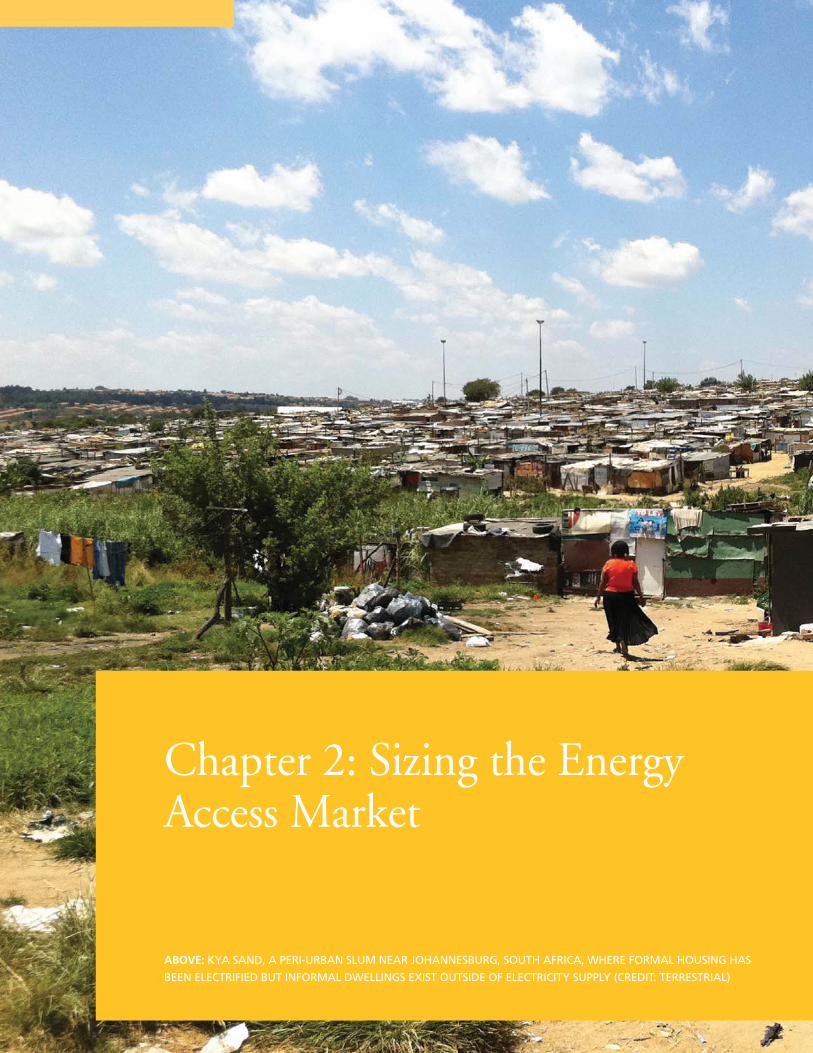
Chapter 2: Sizing the Energy Access Market
ABOVE: KYA SAND, A PERI-URBAN SLUM NEAR JOHANNESBURG, SOUTH AFRICA, WHERE FORMAL HOUSING HAS
BEEN ELECTRIFIED BUT INFORMAL DWELLINGS EXIST OUTSIDE OF ELECTRICITY SUPPLY (CREDIT: TERRESTRIAL)
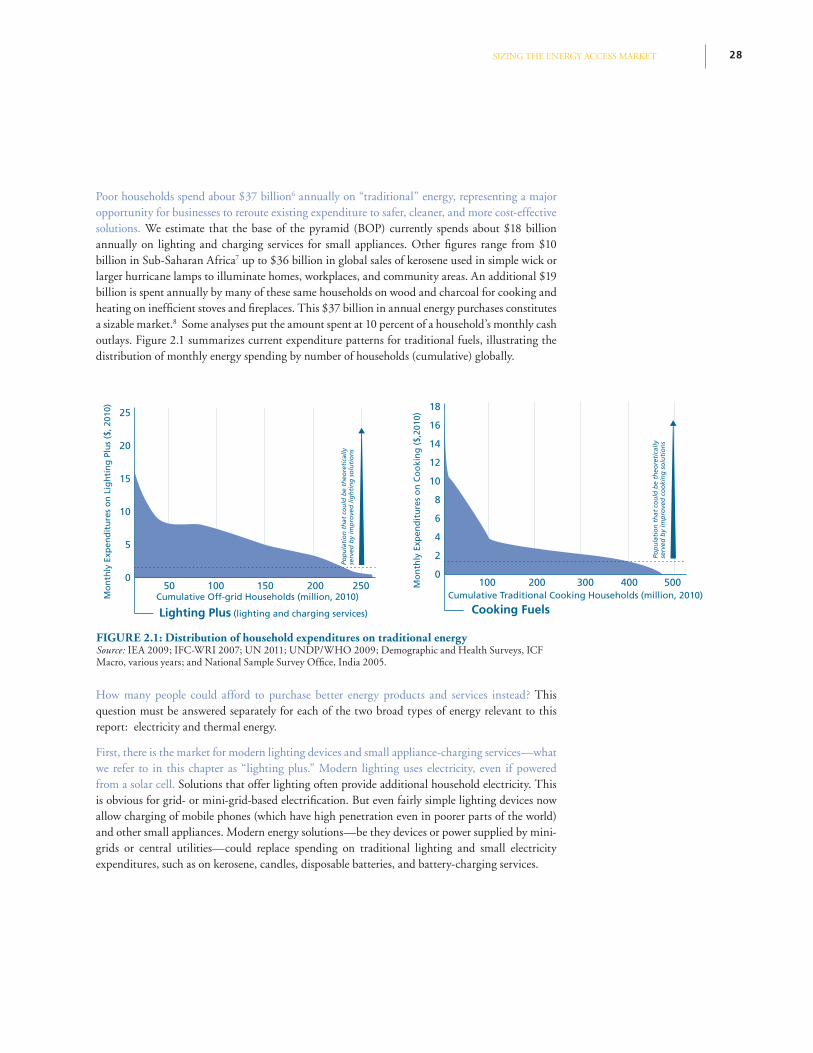
SIZING THE ENERGY ACCESS MARKET 28
Poor households spend about $37 billion6 annually on “traditional” energy, representing a major opportunity for businesses to reroute existing expenditure to safer, cleaner, and more cost-effective solutions. We estimate that the base of the pyramid (BOP) currently spends about $18 billion annually on lighting and charging services for small appliances. Other fi gures range from $10 billion in Sub-Saharan Africa7 up to $36 billion in global sales of kerosene used in simple wick or larger hurricane lamps to illuminate homes, workplaces, and community areas. An additional $19 billion is spent annually by many of these same households on wood and charcoal for cooking and heating on ineffi cient stoves and fi replaces. This $37 billion in annual energy purchases constitutes a sizable market.8 Some analyses put the amount spent at 10 percent of a household’s monthly cash outlays. Figure 2.1 summarizes current expenditure patterns for traditional fuels, illustrating the distribution of monthly energy spending by number of households (cumulative) globally.
How many people could afford to purchase better energy products and services instead? This question must be answered separately for each of the two broad types of energy relevant to this report: electricity and thermal energy.
First, there is the market for modern lighting devices and small appliance-charging services—what we refer to in this chapter as “lighting plus.” Modern lighting uses electricity, even if powered from a solar cell. Solutions that offer lighting often provide additional household electricity. This is obvious for grid- or mini-grid-based electrifi cation. But even fairly simple lighting devices now allow charging of mobile phones (which have high penetration even in poorer parts of the world) and other small appliances. Modern energy solutions—be they devices or power supplied by mini-grids or central utilities—could replace spending on traditional lighting and small electricity expenditures, such as on kerosene, candles, disposable batteries, and battery-charging services.
FIGURE 2.1: Distribution of household expenditures on traditional energySource: IEA 2009; IFC-WRI 2007; UN 2011; UNDP/WHO 2009; Demographic and Health Surveys, ICF Macro, various years; and National Sample Survey Offi ce, India 2005.
18
16
14
12
10
8
6
4
2
0100 200 300 400 500
Cumulative Traditional Cooking Households (million, 2010)
Cooking Fuels
Mo
nth
ly E
xpen
dit
ure
s o
n C
oo
kin
g (
$,20
10)
Pop
ula
tio
n t
hat
co
uld
be
theo
reti
cally
se
rved
by
imp
rove
d c
oo
kin
g s
olu
tio
ns
25
20
15
10
5
050 100 150 200 250
Cumulative Off-grid Households (million, 2010)
Lighting Plus (lighting and charging services)
Mo
nth
ly E
xpen
dit
ure
s o
n L
igh
tin
g P
lus
($, 2
010)
Pop
ula
tio
n t
hat
co
uld
be
theo
reti
cally
se
rved
by
imp
rove
d li
gh
tin
g s
olu
tio
ns
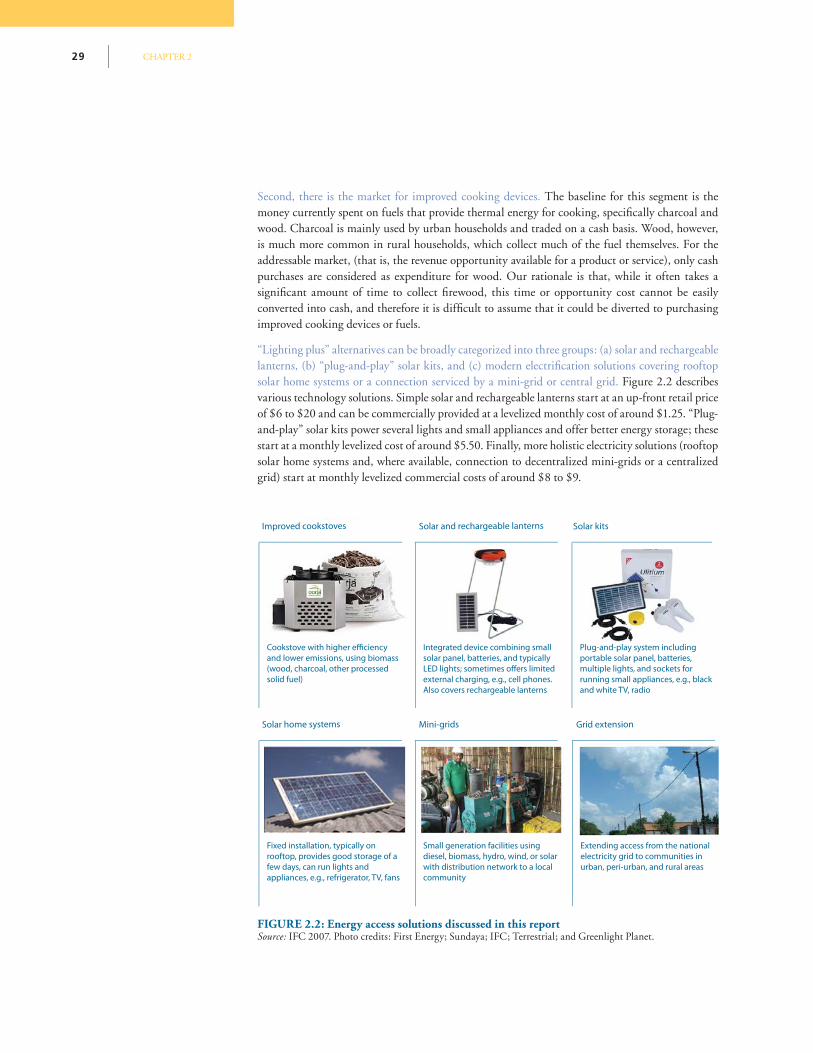
CHAPTER 229
FIGURE 2.2: Energy access solutions discussed in this reportSource: IFC 2007. Photo credits: First Energy; Sundaya; IFC; Terrestrial; and Greenlight Planet.
Second, there is the market for improved cooking devices. The baseline for this segment is the money currently spent on fuels that provide thermal energy for cooking, specifi cally charcoal and wood. Charcoal is mainly used by urban households and traded on a cash basis. Wood, however, is much more common in rural households, which collect much of the fuel themselves. For the addressable market, (that is, the revenue opportunity available for a product or service), only cash purchases are considered as expenditure for wood. Our rationale is that, while it often takes a signifi cant amount of time to collect fi rewood, this time or opportunity cost cannot be easily converted into cash, and therefore it is diffi cult to assume that it could be diverted to purchasing improved cooking devices or fuels.
“Lighting plus” alternatives can be broadly categorized into three groups: (a) solar and rechargeable lanterns, (b) “plug-and-play” solar kits, and (c) modern electrifi cation solutions covering rooftop solar home systems or a connection serviced by a mini-grid or central grid. Figure 2.2 describes various technology solutions. Simple solar and rechargeable lanterns start at an up-front retail price of $6 to $20 and can be commercially provided at a levelized monthly cost of around $1.25. “Plug-and-play” solar kits power several lights and small appliances and offer better energy storage; these start at a monthly levelized cost of around $5.50. Finally, more holistic electricity solutions (rooftop solar home systems and, where available, connection to decentralized mini-grids or a centralized grid) start at monthly levelized commercial costs of around $8 to $9.
Improved cookstoves Solar and rechargeable lanterns Solar kits
Cookstove with higher efficiency
and lower emissions, using biomass
(wood, charcoal, other processed
solid fuel)
Integrated device combining small
solar panel, batteries, and typically
LED lights; sometimes offers limited
external charging, e.g., cell phones.
Also covers rechargeable lanterns
Plug-and-play system including
portable solar panel, batteries,
multiple lights, and sockets for
running small appliances, e.g., black
and white TV, radio
Solar home systems Mini-grids
Fixed installation, typically on
rooftop, provides good storage of a
few days, can run lights and
appliances, e.g., refrigerator, TV, fans
Small generation facilities using
diesel, biomass, hydro, wind, or solar
with distribution network to a local
community
Grid extension
Extending access from the national
electricity grid to communities in
urban, peri-urban, and rural areas
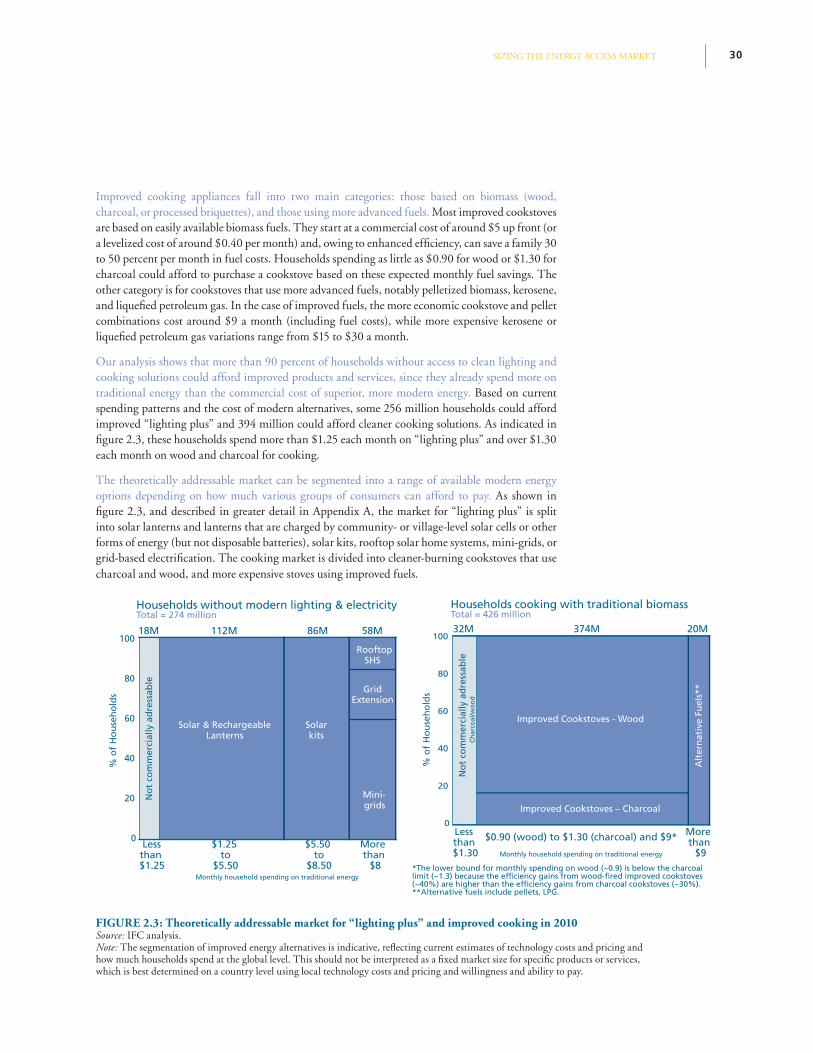
SIZING THE ENERGY ACCESS MARKET 30
Improved cooking appliances fall into two main categories: those based on biomass (wood, charcoal, or processed briquettes), and those using more advanced fuels. Most improved cookstoves are based on easily available biomass fuels. They start at a commercial cost of around $5 up front (or a levelized cost of around $0.40 per month) and, owing to enhanced effi ciency, can save a family 30 to 50 percent per month in fuel costs. Households spending as little as $0.90 for wood or $1.30 for charcoal could afford to purchase a cookstove based on these expected monthly fuel savings. The other category is for cookstoves that use more advanced fuels, notably pelletized biomass, kerosene, and liquefi ed petroleum gas. In the case of improved fuels, the more economic cookstove and pellet combinations cost around $9 a month (including fuel costs), while more expensive kerosene or liquefi ed petroleum gas variations range from $15 to $30 a month.
Our analysis shows that more than 90 percent of households without access to clean lighting and cooking solutions could afford improved products and services, since they already spend more on traditional energy than the commercial cost of superior, more modern energy. Based on current spending patterns and the cost of modern alternatives, some 256 million households could afford improved “lighting plus” and 394 million could afford cleaner cooking solutions. As indicated in fi gure 2.3, these households spend more than $1.25 each month on “lighting plus” and over $1.30 each month on wood and charcoal for cooking.
The theoretically addressable market can be segmented into a range of available modern energy options depending on how much various groups of consumers can afford to pay. As shown in fi gure 2.3, and described in greater detail in Appendix A, the market for “lighting plus” is split into solar lanterns and lanterns that are charged by community- or village-level solar cells or other forms of energy (but not disposable batteries), solar kits, rooftop solar home systems, mini-grids, or grid-based electrifi cation. The cooking market is divided into cleaner-burning cookstoves that use charcoal and wood, and more expensive stoves using improved fuels.
% o
f H
ou
seh
old
s
Monthly household spending on traditional energy
Households without modern lighting & electricityTotal = 274 million
No
t co
mm
erci
ally
ad
ress
able
RooftopSHS
GridExtension
Solarkits
Solar & RechargeableLanterns
Mini-grids
100
80
60
40
20
0More than $8
$5.50 to
$8.50
$1.25 to
$5.50
Lessthan
$1.25
18M 112M 86M 58M
Total = 426 million
% o
f H
ou
seh
old
s
Monthly household spending on traditional energy
Households cooking with traditional biomass
No
t co
mm
erci
ally
ad
ress
able
Alt
ern
ativ
e Fu
els*
*
Ch
arco
al/w
oo
d
Improved Cookstoves – Charcoal
Improved Cookstoves - Wood
100
80
60
40
20
0More than $9
$0.90 (wood) to $1.30 (charcoal) and $9*Lessthan
$1.30
32M 374M 20M
*The lower bound for monthly spending on wood (~0.9) is below the charcoal limit (~1.3) because the efficiency gains from wood-fired improved cookstoves (~40%) are higher than the efficiency gains from charcoal cookstoves (~30%).**Alternative fuels include pellets, LPG.
FIGURE 2.3: Theoretically addressable market for “lighting plus” and improved cooking in 2010Source: IFC analysis.Note: The segmentation of improved energy alternatives is indicative, refl ecting current estimates of technology costs and pricing and how much households spend at the global level. This should not be interpreted as a fi xed market size for specifi c products or services, which is best determined on a country level using local technology costs and pricing and willingness and ability to pay.
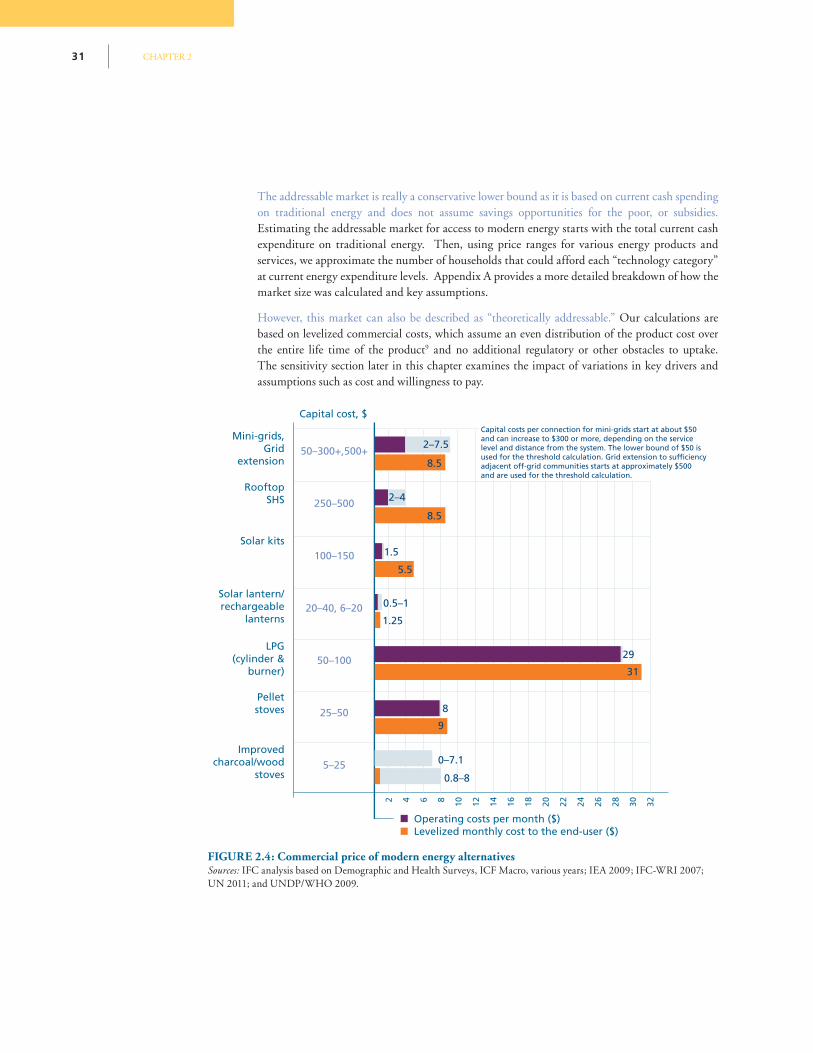
CHAPTER 231
FIGURE 2.4: Commercial price of modern energy alternativesSources: IFC analysis based on Demographic and Health Surveys, ICF Macro, various years; IEA 2009; IFC-WRI 2007; UN 2011; and UNDP/WHO 2009.
Mini-grids,Grid
extension50–300+,500+
250–500
100–150
20–40, 6–20
50–100
25–50
5–25
Capital cost, $
Operating costs per month ($)Levelized monthly cost to the end-user ($)
RooftopSHS
Solar kits
Solar lantern/rechargeable
lanterns
LPG(cylinder &
burner)
Pellet stoves
Improvedcharcoal/wood
stoves
2 4 6 8 10 12 14 16 18 20 22 24 26 28 30 32
2–7.5
8.5
8.5
5.5
1.25
31
9
0.8–8
2–4
1.5
29
8
0–7.1
0.5–1
Capital costs per connection for mini-grids start at about $50 and can increase to $300 or more, depending on the service level and distance from the system. The lower bound of $50 is used for the threshold calculation. Grid extension to sufficiencyadjacent off-grid communities starts at approximately $500 and are used for the threshold calculation.
The addressable market is really a conservative lower bound as it is based on current cash spending on traditional energy and does not assume savings opportunities for the poor, or subsidies. Estimating the addressable market for access to modern energy starts with the total current cash expenditure on traditional energy. Then, using price ranges for various energy products and services, we approximate the number of households that could afford each “technology category” at current energy expenditure levels. Appendix A provides a more detailed breakdown of how the market size was calculated and key assumptions.
However, this market can also be described as “theoretically addressable.” Our calculations are based on levelized commercial costs, which assume an even distribution of the product cost over the entire life time of the product9 and no additional regulatory or other obstacles to uptake. The sensitivity section later in this chapter examines the impact of variations in key drivers and assumptions such as cost and willingness to pay.
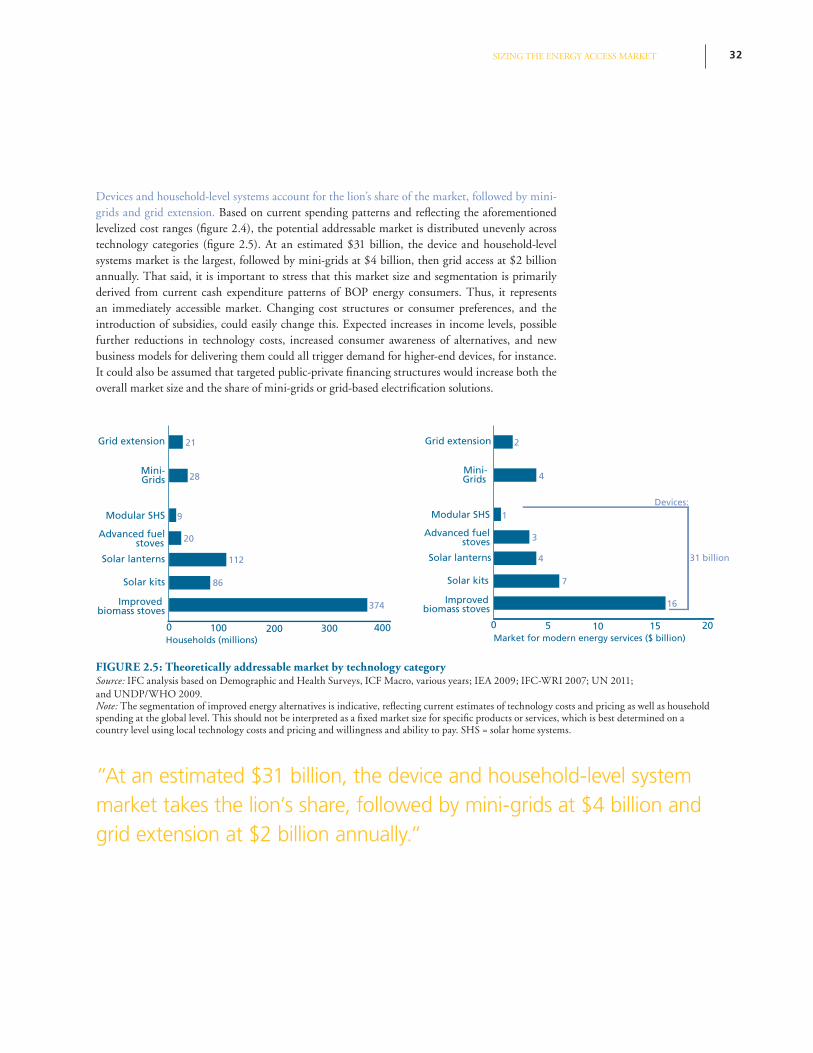
SIZING THE ENERGY ACCESS MARKET 32
FIGURE 2.5: Theoretically addressable market by technology categorySource: IFC analysis based on Demographic and Health Surveys, ICF Macro, various years; IEA 2009; IFC-WRI 2007; UN 2011; and UNDP/WHO 2009.Note: The segmentation of improved energy alternatives is indicative, refl ecting current estimates of technology costs and pricing as well as household spending at the global level. This should not be interpreted as a fi xed market size for specifi c products or services, which is best determined on a country level using local technology costs and pricing and willingness and ability to pay. SHS = solar home systems.
“At an estimated $31 billion, the device and household-level system market takes the lion’s share, followed by mini-grids at $4 billion and grid extension at $2 billion annually.”
0 100 200 300 400Households (millions)
Grid extension
Mini-Grids
Modular SHS
Advanced fuelstoves
Solar lanterns
Solar kits
Improved biomass stoves
112
86
9
28
21
374
20
Market for modern energy services ($ billion)0 5 10 15 20
Grid extension
Mini-Grids
Modular SHS
Advanced fuelstoves
Solar lanterns
Solar kits
Improved biomass stoves
4
7
1
4
2
16
31 billion
Devices:
3
Devices and household-level systems account for the lion’s share of the market, followed by mini-grids and grid extension. Based on current spending patterns and refl ecting the aforementioned levelized cost ranges (fi gure 2.4), the potential addressable market is distributed unevenly across technology categories (fi gure 2.5). At an estimated $31 billion, the device and household-level systems market is the largest, followed by mini-grids at $4 billion, then grid access at $2 billion annually. That said, it is important to stress that this market size and segmentation is primarily derived from current cash expenditure patterns of BOP energy consumers. Thus, it represents an immediately accessible market. Changing cost structures or consumer preferences, and the introduction of subsidies, could easily change this. Expected increases in income levels, possible further reductions in technology costs, increased consumer awareness of alternatives, and new business models for delivering them could all trigger demand for higher-end devices, for instance. It could also be assumed that targeted public-private fi nancing structures would increase both the overall market size and the share of mini-grids or grid-based electrifi cation solutions.
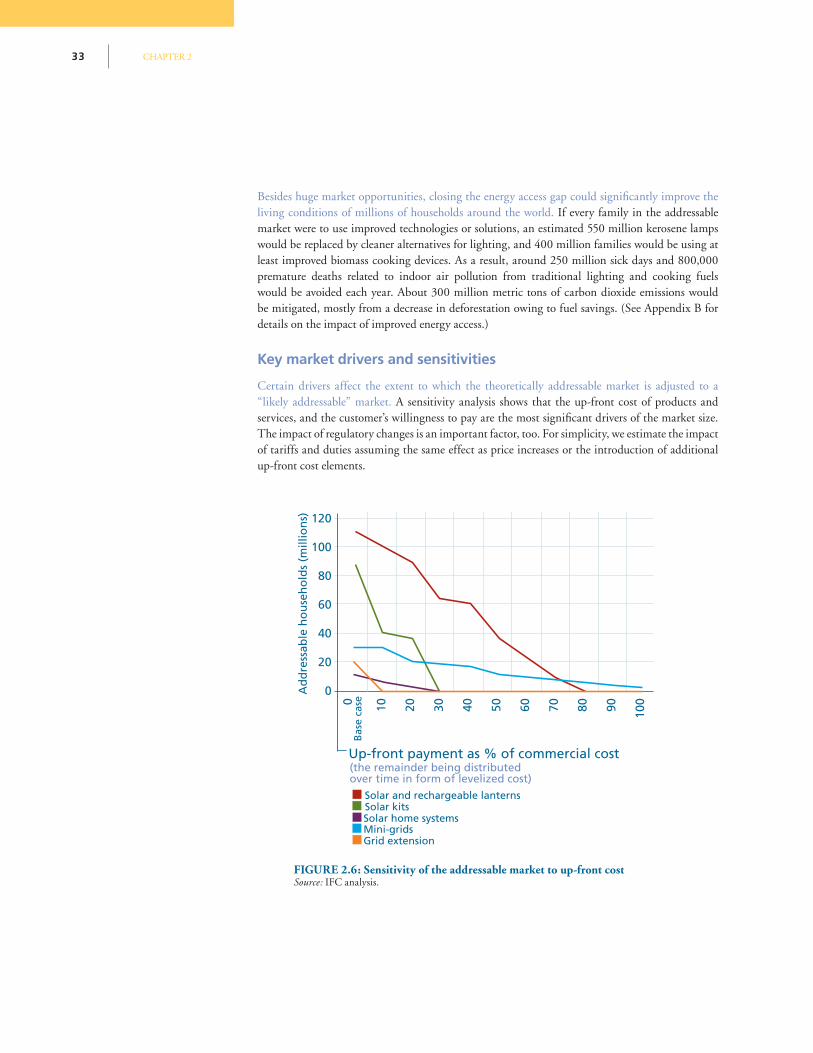
CHAPTER 233
FIGURE 2.6: Sensitivity of the addressable market to up-front costSource: IFC analysis.
Besides huge market opportunities, closing the energy access gap could signifi cantly improve the living conditions of millions of households around the world. If every family in the addressable market were to use improved technologies or solutions, an estimated 550 million kerosene lamps would be replaced by cleaner alternatives for lighting, and 400 million families would be using at least improved biomass cooking devices. As a result, around 250 million sick days and 800,000 premature deaths related to indoor air pollution from traditional lighting and cooking fuels would be avoided each year. About 300 million metric tons of carbon dioxide emissions would be mitigated, mostly from a decrease in deforestation owing to fuel savings. (See Appendix B for details on the impact of improved energy access.)
Key market drivers and sensitivities
Certain drivers affect the extent to which the theoretically addressable market is adjusted to a “likely addressable” market. A sensitivity analysis shows that the up-front cost of products and services, and the customer’s willingness to pay are the most signifi cant drivers of the market size. The impact of regulatory changes is an important factor, too. For simplicity, we estimate the impact of tariffs and duties assuming the same effect as price increases or the introduction of additional up-front cost elements.
Solar kitsSolar and rechargeable lanterns
Solar home systemsMini-gridsGrid extension
Ad
dre
ssab
le h
ou
seh
old
s (m
illio
ns)
0B
ase
case 10 20 30 40 50 60 70 80 90 100
120
100
80
60
40
20
0
Up-front payment as % of commercial cost(the remainder being distributedover time in form of levelized cost)
SIZING THE ENERGY ACCESS MARKET 34
Up-front costs
The addressable market estimate assumes that costs are broken down into monthly payments; the estimate would be much smaller if users were required to pay the total cost up front. The addressable market base case is a function of the levelized monthly costs of a product or service. If payment of a product or access to a service were required up front, the addressable market would be much smaller than if users were allowed to spread them over time. It is precisely to address this up-front payment sensitivity that companies around the world offer leasing options, consumer loans, and other means of paying off costs over time.
Figure 2.6 shows the impact of increasing up-front costs on the theoretical market size. In the case of solar lanterns costing $20 to $50, for example, a required down payment of 20 percent would reduce the addressable market by about the same amount, dropping this by 13 million households to 90 million households. For solar kits, a 20 percent down payment would more than halve the addressable market, reducing the number of households that could afford this technology from about 90 million to just under 40 million. A 10 percent down payment halves the market for solar home systems, reduces it by about one-third for mini-grid connections, and virtually eliminates it for grid-based electrifi cation.
In reality, however, it is diffi cult to know just how much people can afford. A very imperfect understanding of poverty and consumer spending has been demonstrated time and again in the design of social and economic development programs, product pricing, and company go-to-market strategies. Nonetheless, as discussed in Chapter 3, energy access product retailers and service providers are starting to recognize the importance of designing product and pricing strategies to spread up-front consumer costs, so the subject is explored here. Some utilities waive the initial connection charge and offer fi nancing options that allow customers to spread cost over time. Solar home system suppliers frequently bundle microcredit with their offerings, thus reducing the need for large up-front payments and amortizing a signifi cant portion of the costs over time. For cookstoves or solar lanterns, which are smaller-ticket items, hire purchase,10 recharging services, or pay-as-you-go models are sometimes offered to maximize market penetration.
Willingness to pay
A customer’s willingness to pay for a good or service is the second key driver for the addressable market estimate, and is based on customer awareness, expectations, and, critically, the perceived value of energy solutions. Customer education on the benefi ts of modern technologies, valued extra features (like phone charging), product performance guarantees, and social recognition can all increase willingness to pay. These are some factors that can be targeted by businesses, policymakers, and donors. But other factors such as hard-to-predict customer spending choices, affect willingness to pay and, therefore, the market penetration of a product. The growth of mobile telephone sales across the developing world has shown that the poor can often fi nd a way to pay for something with perceived value, or something that they simply desire. Less than a decade ago, the billions of people living on $2 a day barely appeared on the radar screens of mobile phone operators. Today, they are a critical market and a rapidly growing part of corporate revenues. Handsets costing $20 to $50—well within the range of low-cost clean energy devices—can now be found in very remote areas, and are overwhelmingly purchased without credit from the retailer or subsidies from donors.
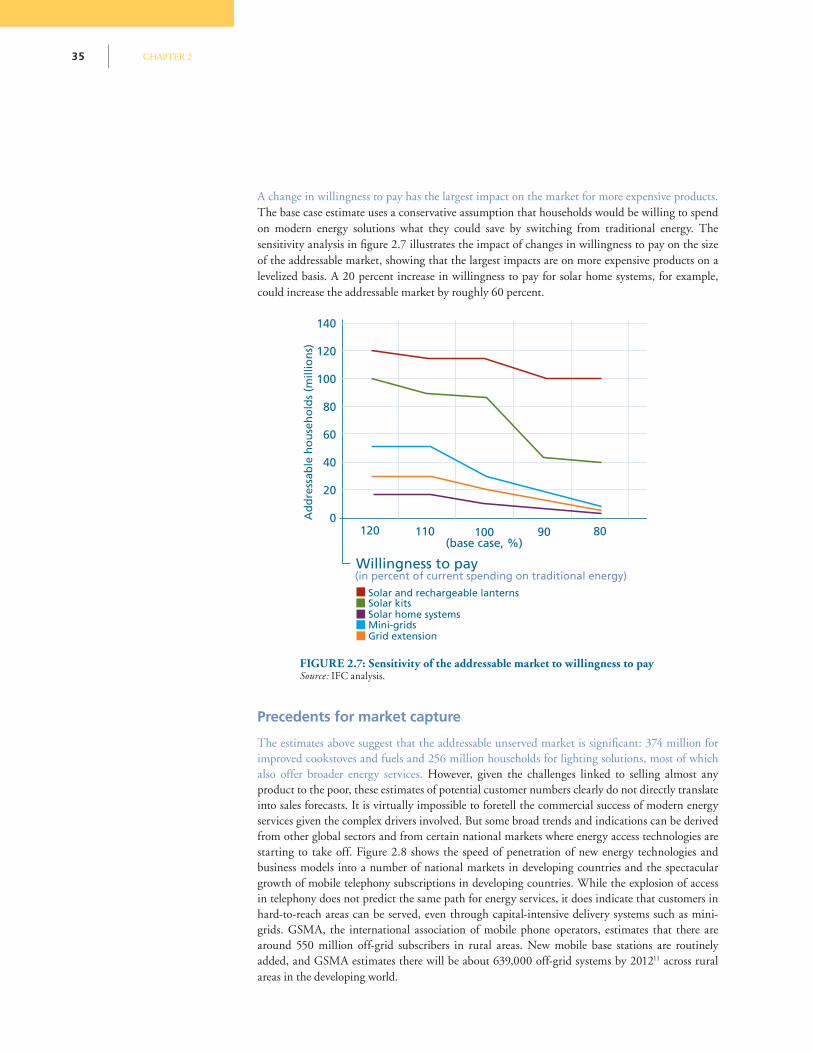
CHAPTER 235
A change in willingness to pay has the largest impact on the market for more expensive products. The base case estimate uses a conservative assumption that households would be willing to spend on modern energy solutions what they could save by switching from traditional energy. The sensitivity analysis in fi gure 2.7 illustrates the impact of changes in willingness to pay on the size of the addressable market, showing that the largest impacts are on more expensive products on a levelized basis. A 20 percent increase in willingness to pay for solar home systems, for example, could increase the addressable market by roughly 60 percent.
FIGURE 2.7: Sensitivity of the addressable market to willingness to paySource: IFC analysis.
Solar kitsSolar home systemsMini-gridsGrid extension
Solar and rechargeable lanterns
Ad
dre
ssab
le h
ou
seh
old
s (m
illio
ns)
140
120
100
80
60
40
20
0
Willingness to pay(in percent of current spending on traditional energy)
120 110 100(base case, %)
90 80
Precedents for market capture
The estimates above suggest that the addressable unserved market is signifi cant: 374 million for improved cookstoves and fuels and 256 million households for lighting solutions, most of which also offer broader energy services. However, given the challenges linked to selling almost any product to the poor, these estimates of potential customer numbers clearly do not directly translate into sales forecasts. It is virtually impossible to foretell the commercial success of modern energy services given the complex drivers involved. But some broad trends and indications can be derived from other global sectors and from certain national markets where energy access technologies are starting to take off. Figure 2.8 shows the speed of penetration of new energy technologies and business models into a number of national markets in developing countries and the spectacular growth of mobile telephony subscriptions in developing countries. While the explosion of access in telephony does not predict the same path for energy services, it does indicate that customers in hard-to-reach areas can be served, even through capital-intensive delivery systems such as mini-grids. GSMA, the international association of mobile phone operators, estimates that there are around 550 million off-grid subscribers in rural areas. New mobile base stations are routinely added, and GSMA estimates there will be about 639,000 off-grid systems by 201211 across rural areas in the developing world.
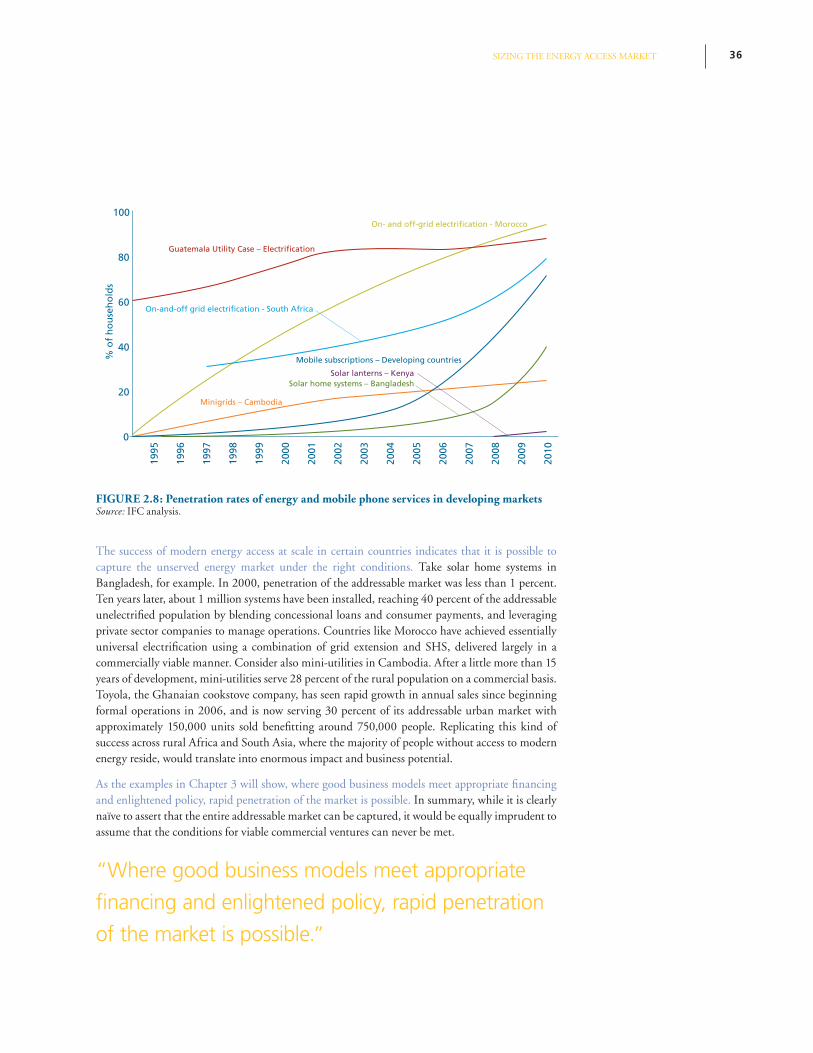
SIZING THE ENERGY ACCESS MARKET 36
FIGURE 2.8: Penetration rates of energy and mobile phone services in developing marketsSource: IFC analysis.
% o
f h
ou
seh
old
s
100
80
60
40
20
0
1995
1996
1997
1998
1999
2000
2001
2002
2003
2004
2005
2006
2007
2008
2009
2010
Guatemala Utility Case – Electrification
On- and off-grid electrification - Morocco
Minigrids – Cambodia
Mobile subscriptions – Developing countries
Solar home systems – BangladeshSolar lanterns – Kenya
On-and-off grid electrification - South Africa
“Where good business models meet appropriate
fi nancing and enlightened policy, rapid penetration
of the market is possible.”
The success of modern energy access at scale in certain countries indicates that it is possible to capture the unserved energy market under the right conditions. Take solar home systems in Bangladesh, for example. In 2000, penetration of the addressable market was less than 1 percent. Ten years later, about 1 million systems have been installed, reaching 40 percent of the addressable unelectrifi ed population by blending concessional loans and consumer payments, and leveraging private sector companies to manage operations. Countries like Morocco have achieved essentially universal electrifi cation using a combination of grid extension and SHS, delivered largely in a commercially viable manner. Consider also mini-utilities in Cambodia. After a little more than 15 years of development, mini-utilities serve 28 percent of the rural population on a commercial basis. Toyola, the Ghanaian cookstove company, has seen rapid growth in annual sales since beginning formal operations in 2006, and is now serving 30 percent of its addressable urban market with approximately 150,000 units sold benefi tting around 750,000 people. Replicating this kind of success across rural Africa and South Asia, where the majority of people without access to modern energy reside, would translate into enormous impact and business potential.
As the examples in Chapter 3 will show, where good business models meet appropriate fi nancing and enlightened policy, rapid penetration of the market is possible. In summary, while it is clearly naïve to assert that the entire addressable market can be captured, it would be equally imprudent to assume that the conditions for viable commercial ventures can never be met.
CHAPTER 337
Chapter 3: How Companies Are Serving the Market
ABOVE: THREE-STONE WOOD FIRE, NAMPULA DISTRICT, MOZAMBIQUE (CREDIT: SETAR)
38HOW COMPANIES ARE SERVING THE MARKET
Broadly speaking, basic energy needs can be met through household-level devices and systems, community-level mini-grids, and grid extension. Household-level devices and systems—covering cooking devices, solar lanterns, and solar home systems—offer a fi rst step up the energy ladder. While generally suited only to a limited number of tasks, they are often the most cost-effective option for the dispersed rural poor, and for many families living in urban slums. Community-level systems—mini-grids that serve from a dozen to several hundred households—provide electrical energy to power lights, appliances, and, beyond the home, small manufacturing and commercial fi rms. The “mini-utilities” that operate such systems serve customers often for much less than they currently spend. Finally, grid extension provides a more comprehensive solution, typically supplying enough energy for electrical and cooking needs. In addition, the grid can provide energy for productive purposes which, over time, enable socioeconomic development.
Over the years and across geographies, a range of approaches has been employed by the public and private sectors for providing the unserved with such modern energy alternatives. In some cases, focused national policy has led to the extension of the power grid to remote communities, or the installation of village-level systems, almost exclusively funded through the public purse. In other cases, appropriate consumer demand and ability to provide appropriate offerings have led to entrepreneurs selling energy products and services profi tably. There are also many instances where energy access activities occupy a middle ground of “quasi-commercial.” Here, companies may have to spend excessively on raising consumer awareness about a new technology, or they might even make a deliberate decision to charge subcommercial prices or rates for a product or service based on a social responsibility aim. In many cases, the difference between the cost of providing a service and the target consumers’ willingness or ability to pay is what limits a fi rm’s commercial returns. These ventures would be profi table under slightly different circumstances or with some grant support, given that they otherwise embody the elements of an effi cient private enterprise.
This chapter focuses almost exclusively on what we term “commercial, enterprise-based” approaches to serving the market for energy access. These businesses operate primarily or entirely with a profi t motive, and are already considered commercially viable or are on the cusp of becoming so. In some instances, notably in the mini-utilities and grid-based electrifi cation subsections, we explore particularly interesting quasi-commercial business models. All case studies cover ventures that serve the poor as all or a signifi cant part of their customer base, employ enterprise-based business models to deliver a product or service, have gone beyond the concept stage and are already operating at scale, and employ business models that we believe have the potential to grow further and be replicated under the right conditions. A selection of all of these types of businesses is shown in fi gure 3.1.
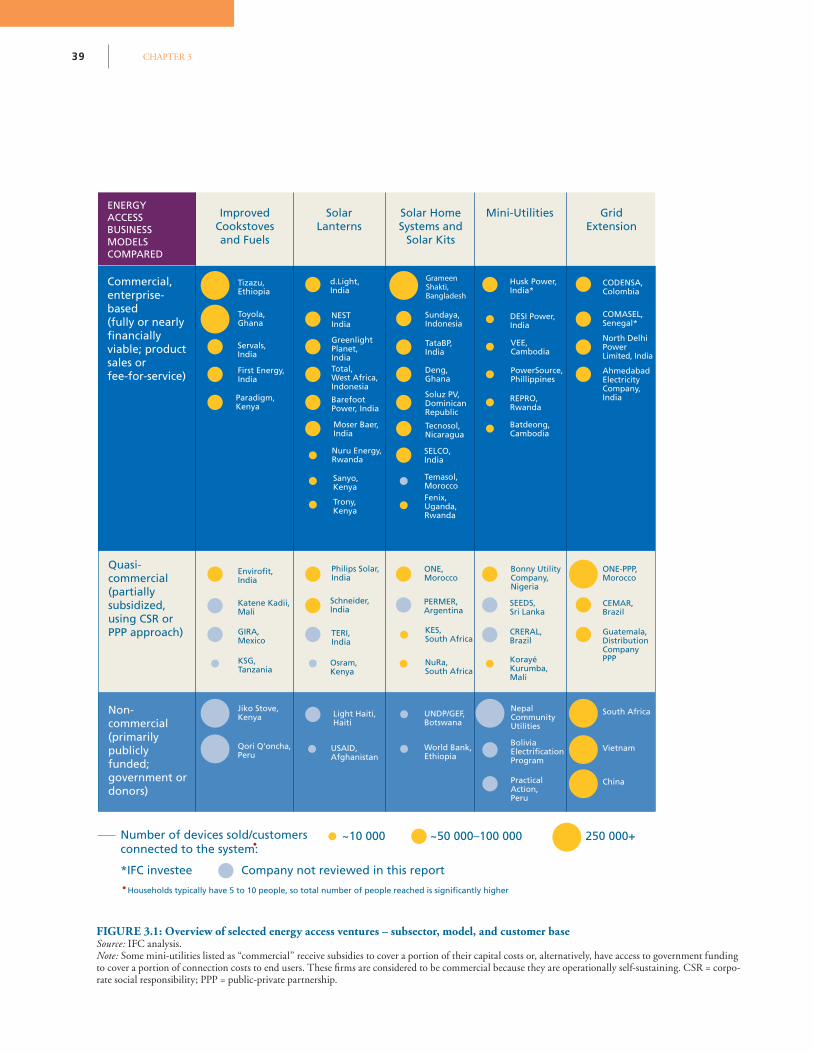
CHAPTER 339
ENERGY ACCESS BUSINESS MODELSCOMPARED
Commercial, enterprise-based(fully or nearly financially viable; product sales or fee-for-service)
Improved Cookstoves and Fuels
Solar Lanterns
Solar Home Systems and
Solar Kits
Mini-Utilities Grid Extension
Quasi-commercial(partially subsidized, using CSR or PPP approach)
Non- commercial(primarily publicly funded; government or donors)
Number of devices sold/customers connected to the system:
*IFC investee
Households typically have 5 to 10 people, so total number of people reached is significantly higher
Company not reviewed in this report
~10 000 ~50 000–100 000 250 000+
COMASEL,Senegal*
South AfricaNepal Community Utilities
BoliviaElectrificationProgram
Light Haiti,Haiti
USAID,Afghanistan
UNDP/GEF,Botswana
PracticalAction,Peru
Vietnam
China
Nuru Energy,Rwanda
Husk Power,India*
CODENSA,Colombia
AhmedabadElectricityCompany,India
Bonny Utility Company,Nigeria
Korayé Kurumba,Mali
CRERAL,Brazil
SEEDS,Sri Lanka
DESI Power,India
VEE,Cambodia
PowerSource,Phillippines
TERI,India
d.Light,India
Envirofit,India
Katene Kadii,Mali
GIRA,Mexico
KSG,Tanzania
Tizazu,Ethiopia
Jiko Stove,Kenya
Qori Q'oncha,Peru
Toyola,Ghana
Servals,India
First Energy,India
Philips Solar,India
NESTIndia
Total,West Africa, Indonesia
GreenlightPlanet,India
BarefootPower, India
Schneider,India
Osram,Kenya
TataBP,India
Deng,Ghana
Soluz PV,DominicanRepublic
Tecnosol,Nicaragua
SELCO,India
Moser Baer,India
Sanyo,Kenya
Temasol,Morocco
Trony,Kenya
Fenix,Uganda,Rwanda
KES,South Africa
ONE-PPP,Morocco
ONE,Morocco
CEMAR,Brazil
Guatemala,Distribution Company PPPNuRa,
South Africa
PERMER,Argentina
Sundaya,Indonesia
REPRO,Rwanda
Batdeong,Cambodia
World Bank,Ethiopia
North Delhi PowerLimited, India
Paradigm,Kenya
GrameenShakti,Bangladesh
FIGURE 3.1: Overview of selected energy access ventures – subsector, model, and customer baseSource: IFC analysis.Note: Some mini-utilities listed as “commercial” receive subsidies to cover a portion of their capital costs or, alternatively, have access to government funding to cover a portion of connection costs to end users. These fi rms are considered to be commercial because they are operationally self-sustaining. CSR = corpo-rate social responsibility; PPP = public-private partnership.
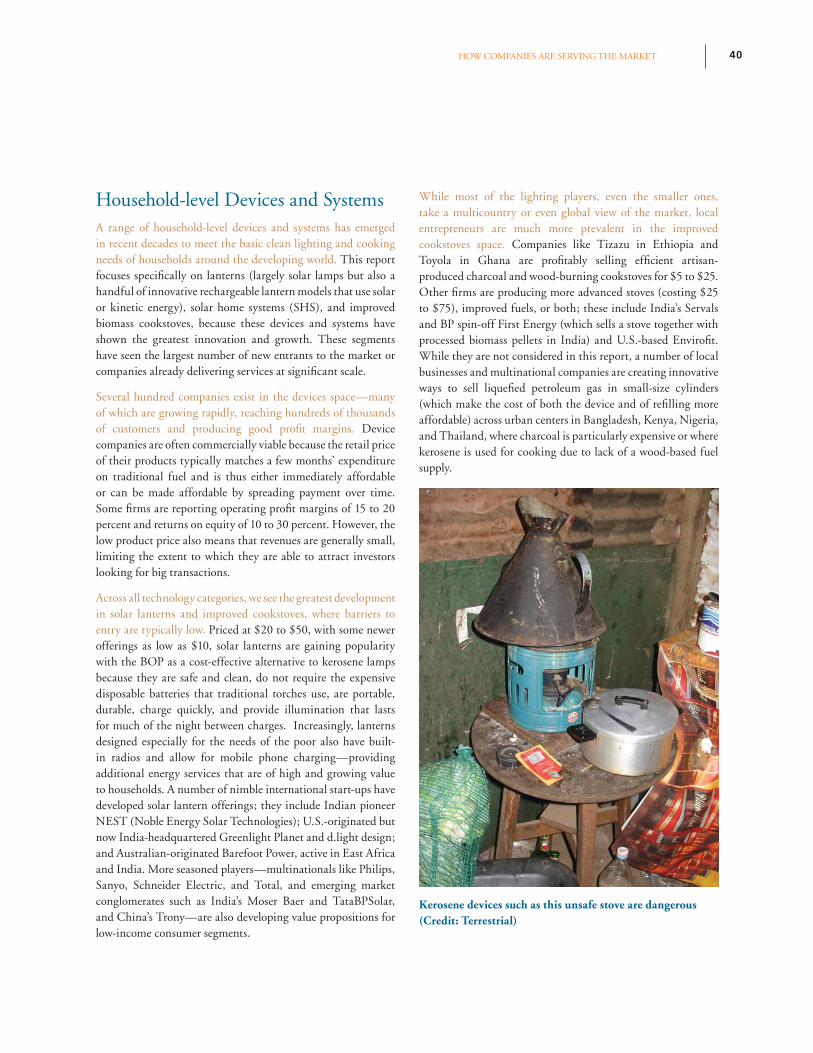
40HOW COMPANIES ARE SERVING THE MARKET
Household-level Devices and SystemsA range of household-level devices and systems has emerged in recent decades to meet the basic clean lighting and cooking needs of households around the developing world. This report focuses specifi cally on lanterns (largely solar lamps but also a handful of innovative rechargeable lantern models that use solar or kinetic energy), solar home systems (SHS), and improved biomass cookstoves, because these devices and systems have shown the greatest innovation and growth. These segments have seen the largest number of new entrants to the market or companies already delivering services at signifi cant scale.
Several hundred companies exist in the devices space—many of which are growing rapidly, reaching hundreds of thousands of customers and producing good profi t margins. Device companies are often commercially viable because the retail price of their products typically matches a few months’ expenditure on traditional fuel and is thus either immediately affordable or can be made affordable by spreading payment over time. Some fi rms are reporting operating profi t margins of 15 to 20 percent and returns on equity of 10 to 30 percent. However, the low product price also means that revenues are generally small, limiting the extent to which they are able to attract investors looking for big transactions.
Across all technology categories, we see the greatest development in solar lanterns and improved cookstoves, where barriers to entry are typically low. Priced at $20 to $50, with some newer offerings as low as $10, solar lanterns are gaining popularity with the BOP as a cost-effective alternative to kerosene lamps because they are safe and clean, do not require the expensive disposable batteries that traditional torches use, are portable, durable, charge quickly, and provide illumination that lasts for much of the night between charges. Increasingly, lanterns designed especially for the needs of the poor also have built-in radios and allow for mobile phone charging—providing additional energy services that are of high and growing value to households. A number of nimble international start-ups have developed solar lantern offerings; they include Indian pioneer NEST (Noble Energy Solar Technologies); U.S.-originated but now India-headquartered Greenlight Planet and d.light design; and Australian-originated Barefoot Power, active in East Africa and India. More seasoned players—multinationals like Philips, Sanyo, Schneider Electric, and Total, and emerging market conglomerates such as India’s Moser Baer and TataBPSolar, and China’s Trony—are also developing value propositions for low-income consumer segments.
Kerosene devices such as this unsafe stove are dangerous (Credit: Terrestrial)
While most of the lighting players, even the smaller ones, take a multicountry or even global view of the market, local entrepreneurs are much more prevalent in the improved cookstoves space. Companies like Tizazu in Ethiopia and Toyola in Ghana are profi tably selling effi cient artisan-produced charcoal and wood-burning cookstoves for $5 to $25. Other fi rms are producing more advanced stoves (costing $25 to $75), improved fuels, or both; these include India’s Servals and BP spin-off First Energy (which sells a stove together with processed biomass pellets in India) and U.S.-based Envirofi t. While they are not considered in this report, a number of local businesses and multinational companies are creating innovative ways to sell liquefi ed petroleum gas in small-size cylinders (which make the cost of both the device and of refi lling more affordable) across urban centers in Bangladesh, Kenya, Nigeria, and Thailand, where charcoal is particularly expensive or where kerosene is used for cooking due to lack of a wood-based fuel supply.
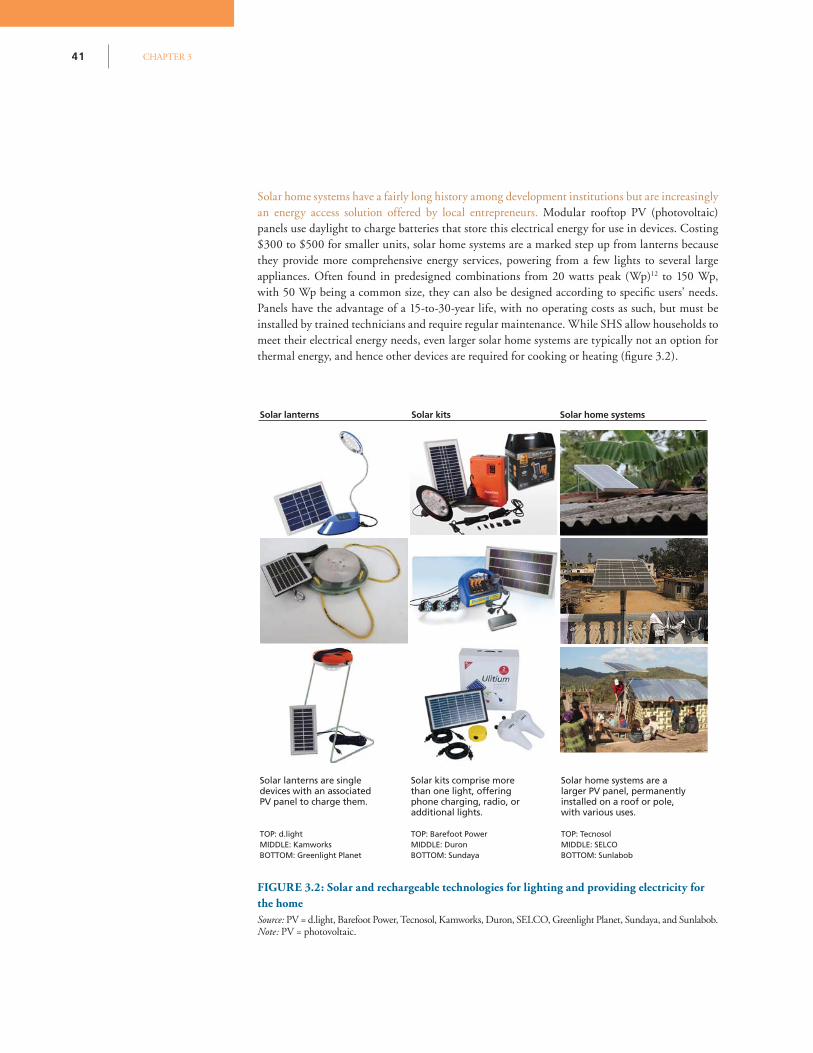
CHAPTER 341
Solar home systems have a fairly long history among development institutions but are increasingly an energy access solution offered by local entrepreneurs. Modular rooftop PV (photovoltaic) panels use daylight to charge batteries that store this electrical energy for use in devices. Costing $300 to $500 for smaller units, solar home systems are a marked step up from lanterns because they provide more comprehensive energy services, powering from a few lights to several large appliances. Often found in predesigned combinations from 20 watts peak (Wp)12 to 150 Wp, with 50 Wp being a common size, they can also be designed according to specifi c users’ needs. Panels have the advantage of a 15-to-30-year life, with no operating costs as such, but must be installed by trained technicians and require regular maintenance. While SHS allow households to meet their electrical energy needs, even larger solar home systems are typically not an option for thermal energy, and hence other devices are required for cooking or heating (fi gure 3.2).
FIGURE 3.2: Solar and rechargeable technologies for lighting and providing electricity for the homeSource: PV = d.light, Barefoot Power, Tecnosol, Kamworks, Duron, SELCO, Greenlight Planet, Sundaya, and Sunlabob.Note: PV = photovoltaic.
Solar lanterns
Solar lanterns are single devices with an associated PV panel to charge them.
TOP: d.lightMIDDLE: KamworksBOTTOM: Greenlight Planet
Solar kits comprise more than one light, offering phone charging, radio, or additional lights.
TOP: Barefoot PowerMIDDLE: DuronBOTTOM: Sundaya
Solar home systems are a larger PV panel, permanently installed on a roof or pole, with various uses.
TOP: TecnosolMIDDLE: SELCOBOTTOM: Sunlabob
Solar kits Solar home systems
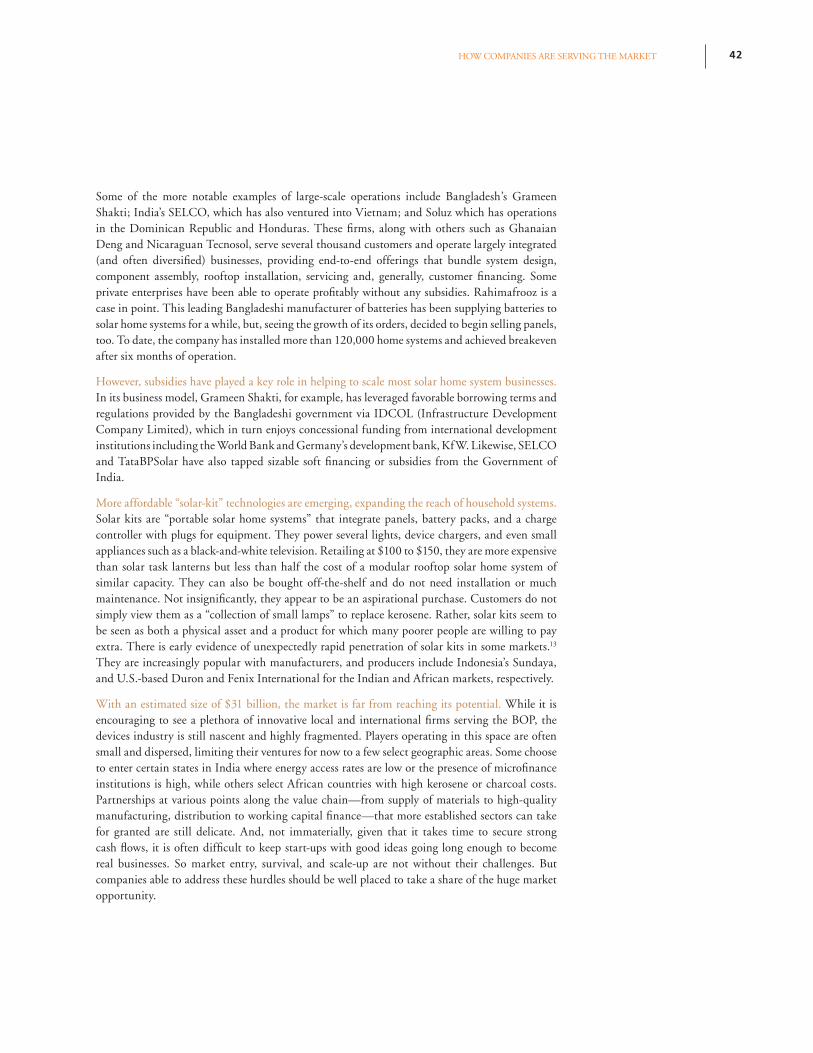
42HOW COMPANIES ARE SERVING THE MARKET
Some of the more notable examples of large-scale operations include Bangladesh’s Grameen Shakti; India’s SELCO, which has also ventured into Vietnam; and Soluz which has operations in the Dominican Republic and Honduras. These fi rms, along with others such as Ghanaian Deng and Nicaraguan Tecnosol, serve several thousand customers and operate largely integrated (and often diversifi ed) businesses, providing end-to-end offerings that bundle system design, component assembly, rooftop installation, servicing and, generally, customer fi nancing. Some private enterprises have been able to operate profi tably without any subsidies. Rahimafrooz is a case in point. This leading Bangladeshi manufacturer of batteries has been supplying batteries to solar home systems for a while, but, seeing the growth of its orders, decided to begin selling panels, too. To date, the company has installed more than 120,000 home systems and achieved breakeven after six months of operation.
However, subsidies have played a key role in helping to scale most solar home system businesses. In its business model, Grameen Shakti, for example, has leveraged favorable borrowing terms and regulations provided by the Bangladeshi government via IDCOL (Infrastructure Development Company Limited), which in turn enjoys concessional funding from international development institutions including the World Bank and Germany’s development bank, KfW. Likewise, SELCO and TataBPSolar have also tapped sizable soft fi nancing or subsidies from the Government of India.
More affordable “solar-kit” technologies are emerging, expanding the reach of household systems. Solar kits are “portable solar home systems” that integrate panels, battery packs, and a charge controller with plugs for equipment. They power several lights, device chargers, and even small appliances such as a black-and-white television. Retailing at $100 to $150, they are more expensive than solar task lanterns but less than half the cost of a modular rooftop solar home system of similar capacity. They can also be bought off-the-shelf and do not need installation or much maintenance. Not insignifi cantly, they appear to be an aspirational purchase. Customers do not simply view them as a “collection of small lamps” to replace kerosene. Rather, solar kits seem to be seen as both a physical asset and a product for which many poorer people are willing to pay extra. There is early evidence of unexpectedly rapid penetration of solar kits in some markets.13 They are increasingly popular with manufacturers, and producers include Indonesia’s Sundaya, and U.S.-based Duron and Fenix International for the Indian and African markets, respectively.
With an estimated size of $31 billion, the market is far from reaching its potential. While it is encouraging to see a plethora of innovative local and international fi rms serving the BOP, the devices industry is still nascent and highly fragmented. Players operating in this space are often small and dispersed, limiting their ventures for now to a few select geographic areas. Some choose to enter certain states in India where energy access rates are low or the presence of microfi nance institutions is high, while others select African countries with high kerosene or charcoal costs. Partnerships at various points along the value chain—from supply of materials to high-quality manufacturing, distribution to working capital fi nance—that more established sectors can take for granted are still delicate. And, not immaterially, given that it takes time to secure strong cash fl ows, it is often diffi cult to keep start-ups with good ideas going long enough to become real businesses. So market entry, survival, and scale-up are not without their challenges. But companies able to address these hurdles should be well placed to take a share of the huge market opportunity.
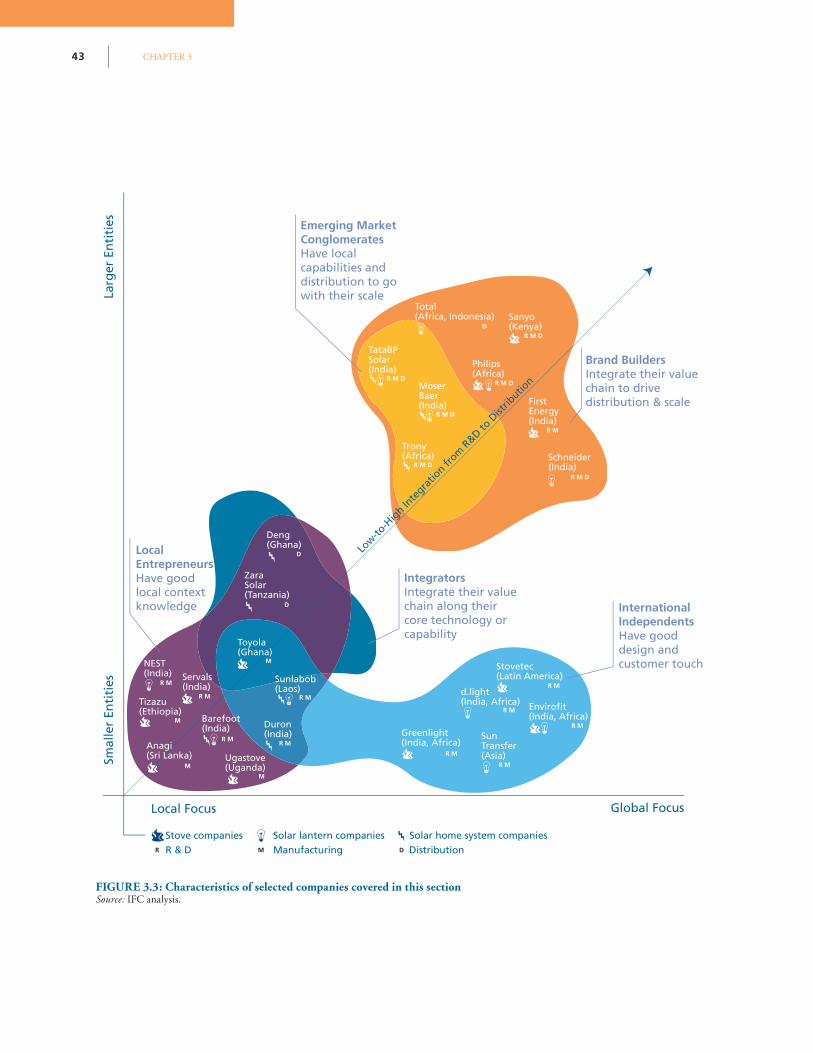
CHAPTER 343
Local Focus Global Focus
Smal
ler
Enti
ties
Larg
er E
nti
ties
R & D Manufacturing DistributionStove companies Solar lantern companies Solar home system companies
Brand BuildersIntegrate their value chain to drive distribution & scale
Emerging Market ConglomeratesHave local capabilities and distribution to go with their scale
IntegratorsIntegrate their value chain along their core technology or capability
Local EntrepreneursHave good local context knowledge International
IndependentsHave good design and customer touch
Philips(Africa)
Sanyo(Kenya)
TataBPSolar(India)
MoserBaer(India)
Total(Africa, Indonesia)
Trony(Africa)
ZaraSolar(Tanzania)
Toyola(Ghana)
Sunlabob(Laos)
Anagi(Sri Lanka) Ugastove
(Uganda)
Barefoot(India)
Tizazu(Ethiopia)
Servals(India)
FirstEnergy(India)
Stovetec(Latin America)
Sun Transfer(Asia)
Greenlight (India, Africa)
Duron(India)
d.light(India, Africa)
(India, Africa)
Deng(Ghana)
Schneider(India)
Low-to
-Hig
h Inte
gratio
n from
R&D to
Dist
ributio
n
NEST(India)
M D
M
R M
R M
R M
R M
R M
R M
R M
R M
R M
R M
R M
D
D
D
R M D
R M D
R M D
R M D
R M D
R M D
M
M
M
R
FIGURE 3.3: Characteristics of selected companies covered in this section Source: IFC analysis.
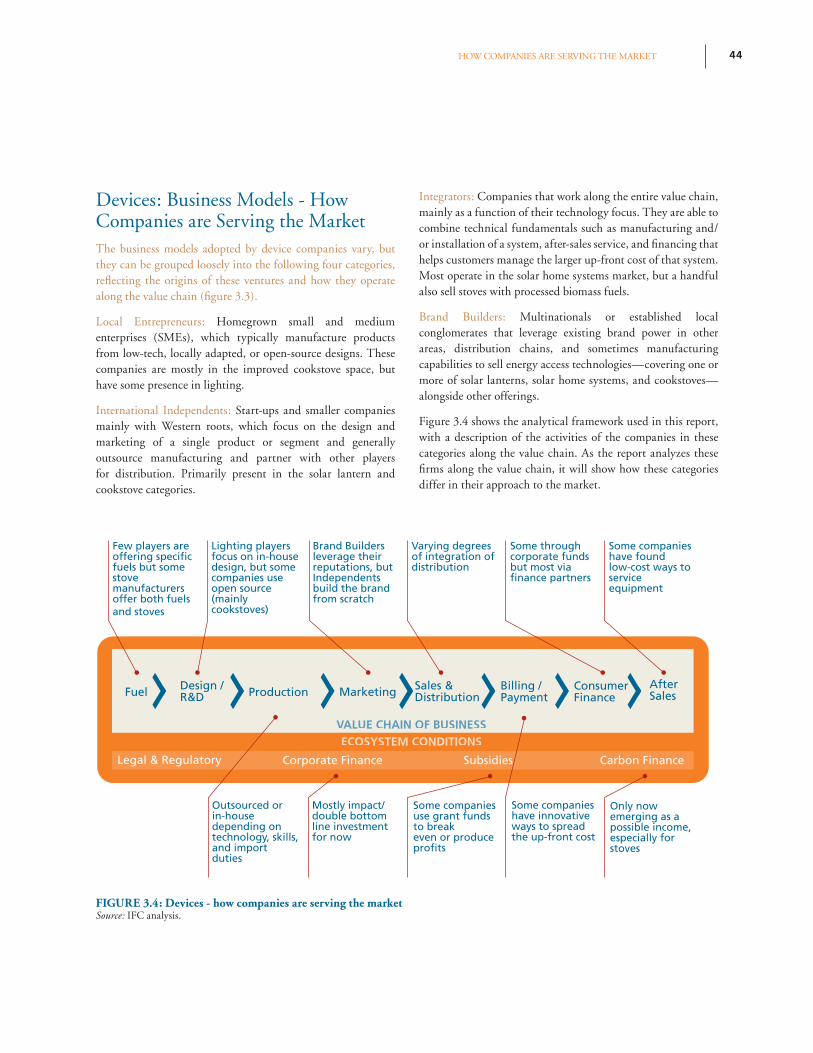
44HOW COMPANIES ARE SERVING THE MARKET
FIGURE 3.4: Devices - how companies are serving the marketSource: IFC analysis.
Devices: Business Models - How Companies are Serving the MarketThe business models adopted by device companies vary, but they can be grouped loosely into the following four categories, refl ecting the origins of these ventures and how they operate along the value chain (fi gure 3.3).
Local Entrepreneurs: Homegrown small and medium enterprises (SMEs), which typically manufacture products from low-tech, locally adapted, or open-source designs. These companies are mostly in the improved cookstove space, but have some presence in lighting.
International Independents: Start-ups and smaller companies mainly with Western roots, which focus on the design and marketing of a single product or segment and generally outsource manufacturing and partner with other players for distribution. Primarily present in the solar lantern and cookstove categories.
Integrators: Companies that work along the entire value chain, mainly as a function of their technology focus. They are able to combine technical fundamentals such as manufacturing and/or installation of a system, after-sales service, and fi nancing that helps customers manage the larger up-front cost of that system. Most operate in the solar home systems market, but a handful also sell stoves with processed biomass fuels.
Brand Builders: Multinationals or established local conglomerates that leverage existing brand power in other areas, distribution chains, and sometimes manufacturing capabilities to sell energy access technologies—covering one or more of solar lanterns, solar home systems, and cookstoves—alongside other offerings.
Figure 3.4 shows the analytical framework used in this report, with a description of the activities of the companies in these categories along the value chain. As the report analyzes these fi rms along the value chain, it will show how these categories differ in their approach to the market.
Fuel Design /R&D Production Marketing Sales &
DistributionBilling / Payment
After Sales
ECOSYSTEM CONDITIONS
Corporate Finance Carbon Finance
ConsumerFinance
Subsidies
VALUE CHAIN OF BUSINESS
Legal & Regulatory
Lighting players focus on in-house design, but some companies use open source (mainly cookstoves)
Brand Builders leverage their reputations, but Independents build the brand from scratch
Varying degrees of integration of distribution
Some through corporate funds but most via
Some companies have found low-cost ways to service equipment
Few players are offuels but some stove manufacturers offer both fuels and stoves
Outsourced or in-house depending on technology, skills, and import duties
Some companies have innovative ways to spread the up-front cost
Mostly impact/ double bottom line investment for now
Only now emerging as a possible income, especially for stoves
Some companies use grant funds to breakeven or produce profits
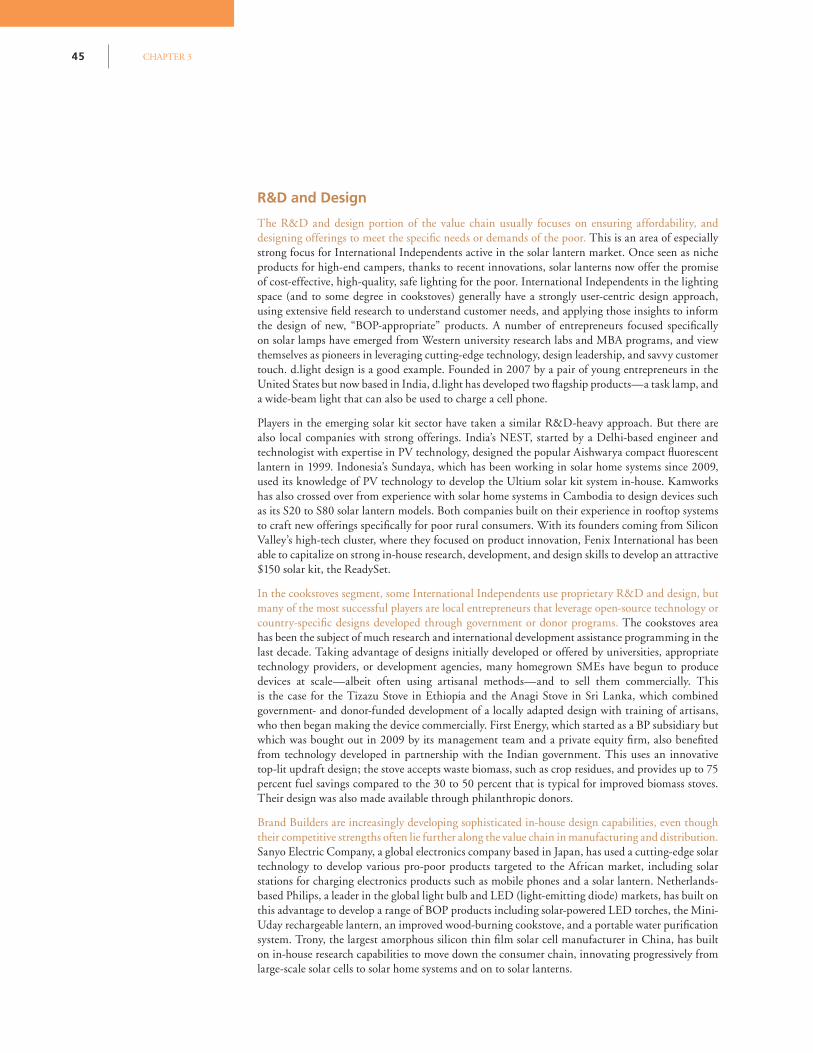
CHAPTER 345
R&D and Design
The R&D and design portion of the value chain usually focuses on ensuring affordability, and designing offerings to meet the specifi c needs or demands of the poor. This is an area of especially strong focus for International Independents active in the solar lantern market. Once seen as niche products for high-end campers, thanks to recent innovations, solar lanterns now offer the promise of cost-effective, high-quality, safe lighting for the poor. International Independents in the lighting space (and to some degree in cookstoves) generally have a strongly user-centric design approach, using extensive fi eld research to understand customer needs, and applying those insights to inform the design of new, “BOP-appropriate” products. A number of entrepreneurs focused specifi cally on solar lamps have emerged from Western university research labs and MBA programs, and view themselves as pioneers in leveraging cutting-edge technology, design leadership, and savvy customer touch. d.light design is a good example. Founded in 2007 by a pair of young entrepreneurs in the United States but now based in India, d.light has developed two fl agship products—a task lamp, and a wide-beam light that can also be used to charge a cell phone.
Players in the emerging solar kit sector have taken a similar R&D-heavy approach. But there are also local companies with strong offerings. India’s NEST, started by a Delhi-based engineer and technologist with expertise in PV technology, designed the popular Aishwarya compact fl uorescent lantern in 1999. Indonesia’s Sundaya, which has been working in solar home systems since 2009, used its knowledge of PV technology to develop the Ultium solar kit system in-house. Kamworks has also crossed over from experience with solar home systems in Cambodia to design devices such as its S20 to S80 solar lantern models. Both companies built on their experience in rooftop systems to craft new offerings specifi cally for poor rural consumers. With its founders coming from Silicon Valley’s high-tech cluster, where they focused on product innovation, Fenix International has been able to capitalize on strong in-house research, development, and design skills to develop an attractive $150 solar kit, the ReadySet.
In the cookstoves segment, some International Independents use proprietary R&D and design, but many of the most successful players are local entrepreneurs that leverage open-source technology or country-specifi c designs developed through government or donor programs. The cookstoves area has been the subject of much research and international development assistance programming in the last decade. Taking advantage of designs initially developed or offered by universities, appropriate technology providers, or development agencies, many homegrown SMEs have begun to produce devices at scale—albeit often using artisanal methods—and to sell them commercially. This is the case for the Tizazu Stove in Ethiopia and the Anagi Stove in Sri Lanka, which combined government- and donor-funded development of a locally adapted design with training of artisans, who then began making the device commercially. First Energy, which started as a BP subsidiary but which was bought out in 2009 by its management team and a private equity fi rm, also benefi ted from technology developed in partnership with the Indian government. This uses an innovative top-lit updraft design; the stove accepts waste biomass, such as crop residues, and provides up to 75 percent fuel savings compared to the 30 to 50 percent that is typical for improved biomass stoves. Their design was also made available through philanthropic donors.
Brand Builders are increasingly developing sophisticated in-house design capabilities, even though their competitive strengths often lie further along the value chain in manufacturing and distribution. Sanyo Electric Company, a global electronics company based in Japan, has used a cutting-edge solar technology to develop various pro-poor products targeted to the African market, including solar stations for charging electronics products such as mobile phones and a solar lantern. Netherlands-based Philips, a leader in the global light bulb and LED (light-emitting diode) markets, has built on this advantage to develop a range of BOP products including solar-powered LED torches, the Mini-Uday rechargeable lantern, an improved wood-burning cookstove, and a portable water purifi cation system. Trony, the largest amorphous silicon thin fi lm solar cell manufacturer in China, has built on in-house research capabilities to move down the consumer chain, innovating progressively from large-scale solar cells to solar home systems and on to solar lanterns.
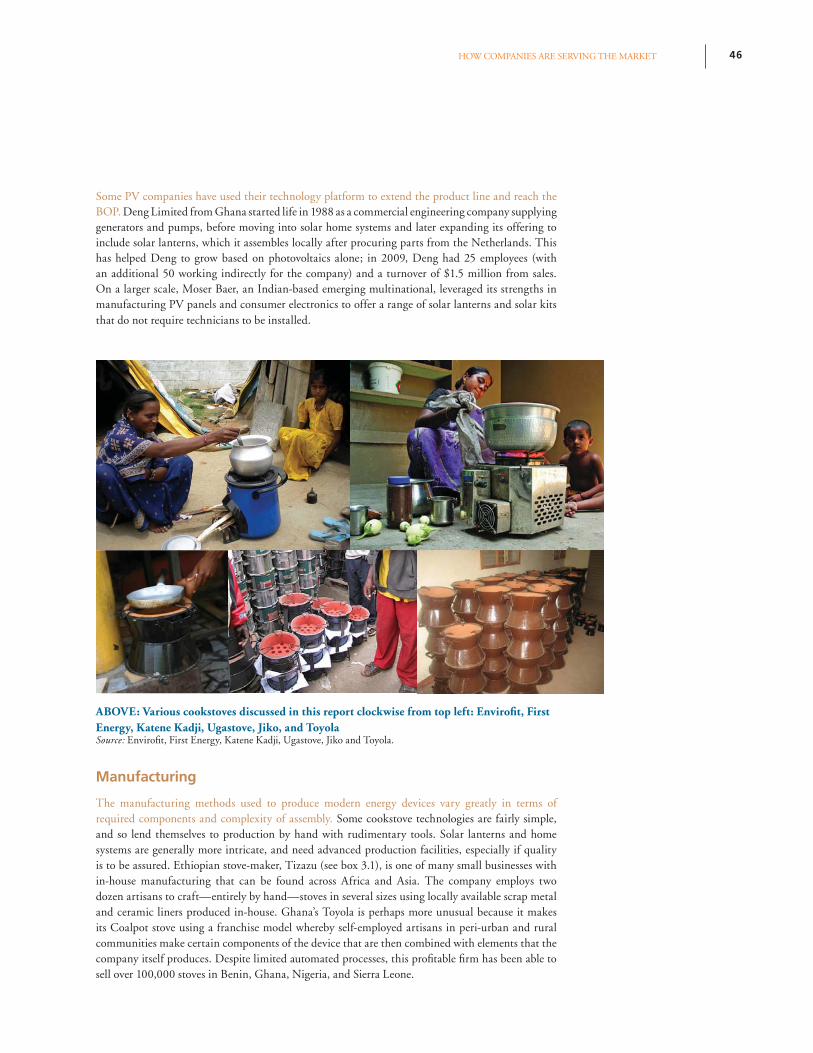
46HOW COMPANIES ARE SERVING THE MARKET
Some PV companies have used their technology platform to extend the product line and reach the BOP. Deng Limited from Ghana started life in 1988 as a commercial engineering company supplying generators and pumps, before moving into solar home systems and later expanding its offering to include solar lanterns, which it assembles locally after procuring parts from the Netherlands. This has helped Deng to grow based on photovoltaics alone; in 2009, Deng had 25 employees (with an additional 50 working indirectly for the company) and a turnover of $1.5 million from sales. On a larger scale, Moser Baer, an Indian-based emerging multinational, leveraged its strengths in manufacturing PV panels and consumer electronics to offer a range of solar lanterns and solar kits that do not require technicians to be installed.
ABOVE: Various cookstoves discussed in this report clockwise from top left: Envirofi t, First Energy, Katene Kadji, Ugastove, Jiko, and ToyolaSource: Envirofi t, First Energy, Katene Kadji, Ugastove, Jiko and Toyola.
Manufacturing
The manufacturing methods used to produce modern energy devices vary greatly in terms of required components and complexity of assembly. Some cookstove technologies are fairly simple, and so lend themselves to production by hand with rudimentary tools. Solar lanterns and home systems are generally more intricate, and need advanced production facilities, especially if quality is to be assured. Ethiopian stove-maker, Tizazu (see box 3.1), is one of many small businesses with in-house manufacturing that can be found across Africa and Asia. The company employs two dozen artisans to craft—entirely by hand—stoves in several sizes using locally available scrap metal and ceramic liners produced in-house. Ghana’s Toyola is perhaps more unusual because it makes its Coalpot stove using a franchise model whereby self-employed artisans in peri-urban and rural communities make certain components of the device that are then combined with elements that the company itself produces. Despite limited automated processes, this profi table fi rm has been able to sell over 100,000 stoves in Benin, Ghana, Nigeria, and Sierra Leone.
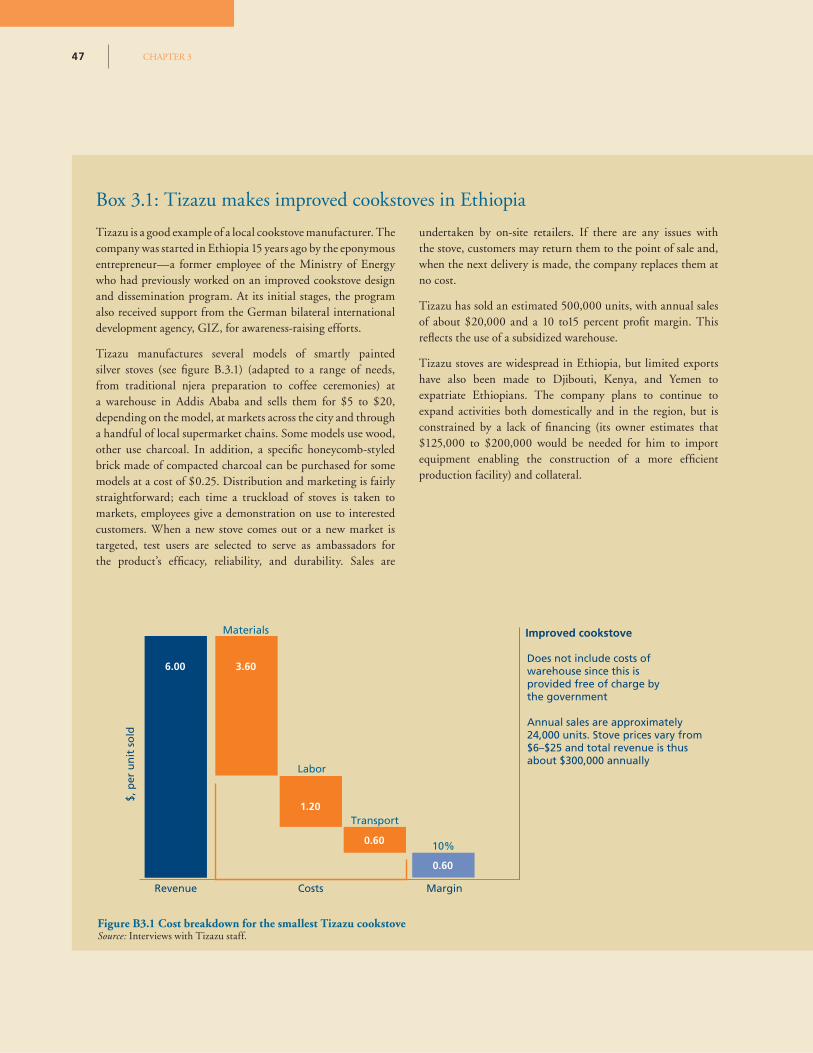
CHAPTER 347
Tizazu is a good example of a local cookstove manufacturer. The company was started in Ethiopia 15 years ago by the eponymous entrepreneur—a former employee of the Ministry of Energy who had previously worked on an improved cookstove design and dissemination program. At its initial stages, the program also received support from the German bilateral international development agency, GIZ, for awareness-raising efforts.
Tizazu manufactures several models of smartly painted silver stoves (see fi gure B.3.1) (adapted to a range of needs, from traditional njera preparation to coffee ceremonies) at a warehouse in Addis Ababa and sells them for $5 to $20, depending on the model, at markets across the city and through a handful of local supermarket chains. Some models use wood, other use charcoal. In addition, a specifi c honeycomb-styled brick made of compacted charcoal can be purchased for some models at a cost of $0.25. Distribution and marketing is fairly straightforward; each time a truckload of stoves is taken to markets, employees give a demonstration on use to interested customers. When a new stove comes out or a new market is targeted, test users are selected to serve as ambassadors for the product’s effi cacy, reliability, and durability. Sales are
undertaken by on-site retailers. If there are any issues with the stove, customers may return them to the point of sale and, when the next delivery is made, the company replaces them at no cost.
Tizazu has sold an estimated 500,000 units, with annual sales of about $20,000 and a 10 to15 percent profi t margin. This refl ects the use of a subsidized warehouse.
Tizazu stoves are widespread in Ethiopia, but limited exports have also been made to Djibouti, Kenya, and Yemen to expatriate Ethiopians. The company plans to continue to expand activities both domestically and in the region, but is constrained by a lack of fi nancing (its owner estimates that $125,000 to $200,000 would be needed for him to import equipment enabling the construction of a more effi cient production facility) and collateral.
Box 3.1: Tizazu makes improved cookstoves in Ethiopia
Figure B3.1 Cost breakdown for the smallest Tizazu cookstoveSource: Interviews with Tizazu staff.
Materials Improved cookstove
MarginCostsRevenue
$, p
er u
nit
so
ld
6.00 3.60
Labor
1.20Transport
0.60 10%
0.60
Does not include costs ofwarehouse since this isprovided free of charge bythe government
Annual sales are approximately 24,000 units. Stove prices vary from$6–$25 and total revenue is thusabout $300,000 annually
CHAPTER 347
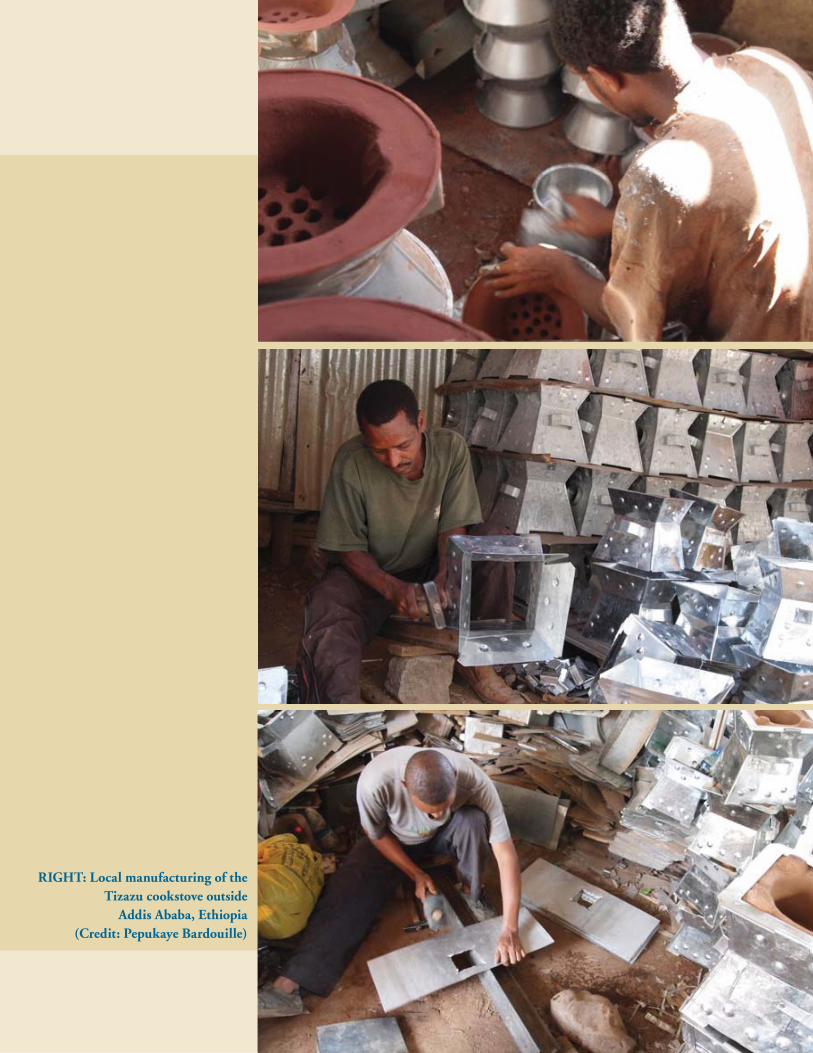
48HOW COMPANIES ARE SERVING THE MARKET
RIGHT: Local manufacturing of the Tizazu cookstove outside
Addis Ababa, Ethiopia (Credit: Pepukaye Bardouille)
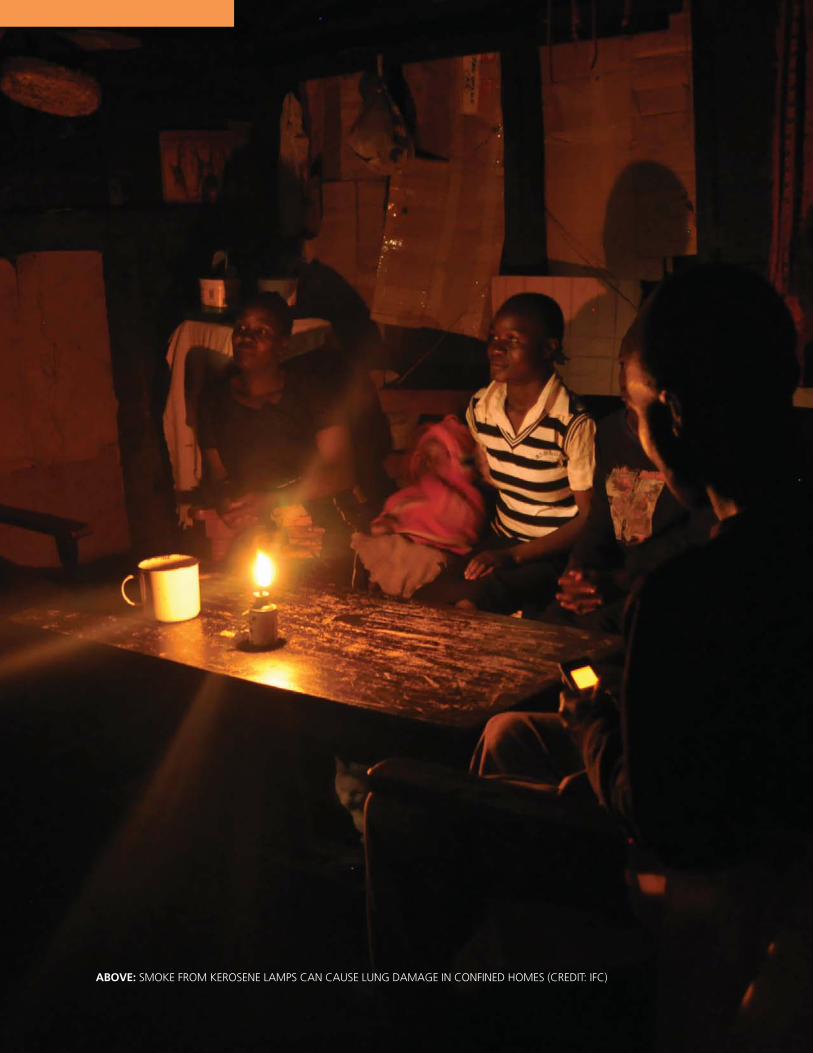
CHAPTER 349
ABOVE: SMOKE FROM KEROSENE LAMPS CAN CAUSE LUNG DAMAGE IN CONFINED HOMES (CREDIT: IFC)
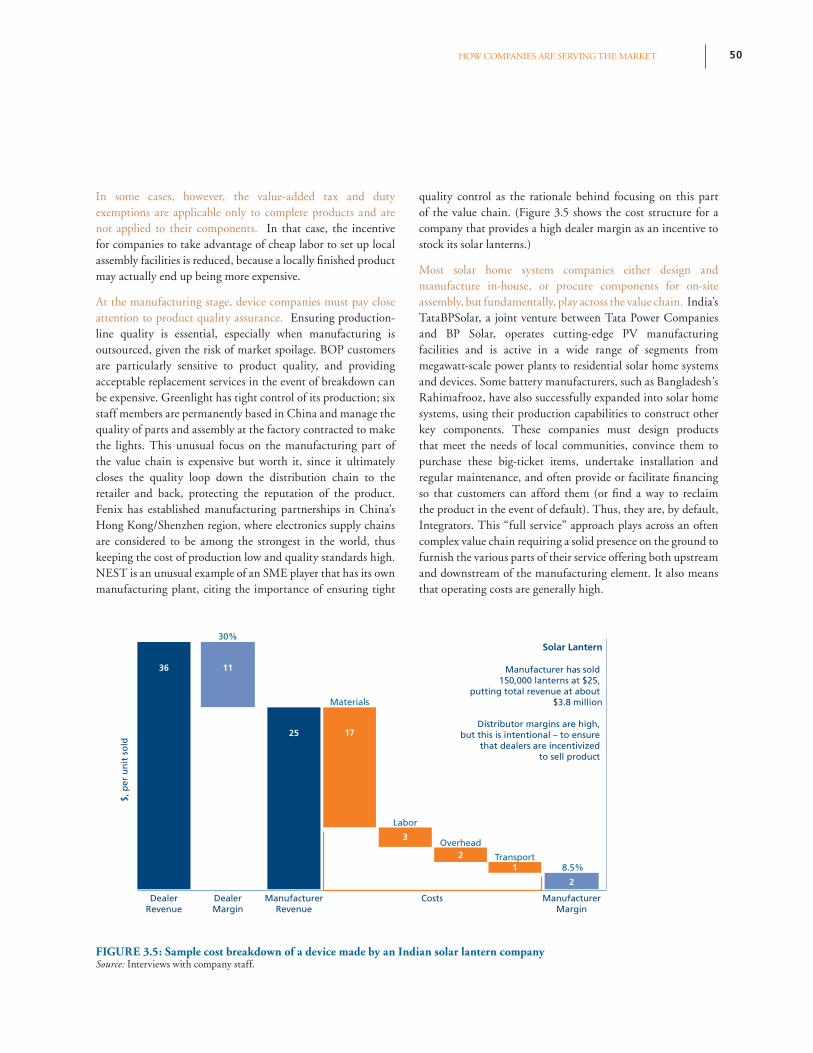
50HOW COMPANIES ARE SERVING THE MARKET
In some cases, however, the value-added tax and duty exemptions are applicable only to complete products and are not applied to their components. In that case, the incentive for companies to take advantage of cheap labor to set up local assembly facilities is reduced, because a locally fi nished product may actually end up being more expensive.
At the manufacturing stage, device companies must pay close attention to product quality assurance. Ensuring production-line quality is essential, especially when manufacturing is outsourced, given the risk of market spoilage. BOP customers are particularly sensitive to product quality, and providing acceptable replacement services in the event of breakdown can be expensive. Greenlight has tight control of its production; six staff members are permanently based in China and manage the quality of parts and assembly at the factory contracted to make the lights. This unusual focus on the manufacturing part of the value chain is expensive but worth it, since it ultimately closes the quality loop down the distribution chain to the retailer and back, protecting the reputation of the product. Fenix has established manufacturing partnerships in China’s Hong Kong/Shenzhen region, where electronics supply chains are considered to be among the strongest in the world, thus keeping the cost of production low and quality standards high. NEST is an unusual example of an SME player that has its own manufacturing plant, citing the importance of ensuring tight
quality control as the rationale behind focusing on this part of the value chain. (Figure 3.5 shows the cost structure for a company that provides a high dealer margin as an incentive to stock its solar lanterns.)
Most solar home system companies either design and manufacture in-house, or procure components for on-site assembly, but fundamentally, play across the value chain. India’s TataBPSolar, a joint venture between Tata Power Companies and BP Solar, operates cutting-edge PV manufacturing facilities and is active in a wide range of segments from megawatt-scale power plants to residential solar home systems and devices. Some battery manufacturers, such as Bangladesh’s Rahimafrooz, have also successfully expanded into solar home systems, using their production capabilities to construct other key components. These companies must design products that meet the needs of local communities, convince them to purchase these big-ticket items, undertake installation and regular maintenance, and often provide or facilitate fi nancing so that customers can afford them (or fi nd a way to reclaim the product in the event of default). Thus, they are, by default, Integrators. This “full service” approach plays across an often complex value chain requiring a solid presence on the ground to furnish the various parts of their service offering both upstream and downstream of the manufacturing element. It also means that operating costs are generally high.
FIGURE 3.5: Sample cost breakdown of a device made by an Indian solar lantern companySource: Interviews with company staff.
Materials
Labor
Transport
Overhead
Solar Lantern
Manufacturer has sold 150,000 lanterns at $25,
putting total revenue at about $3.8 million
Distributor margins are high, but this is intentional – to ensure
that dealers are incentivized to sell product
8.5%
ManufacturerMargin
ManufacturerRevenue
CostsDealerRevenue
DealerMargin
$, p
er u
nit
so
ld
36
25 17
3
12
2
30%
11
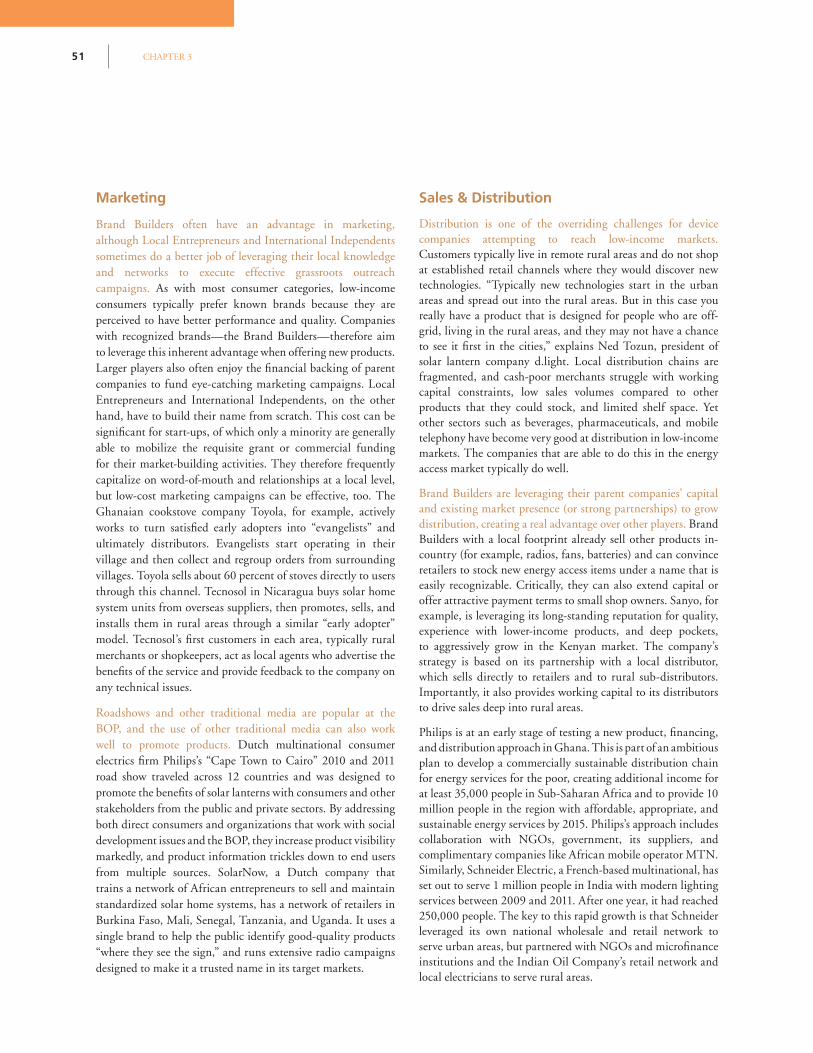
CHAPTER 351
Marketing
Brand Builders often have an advantage in marketing, although Local Entrepreneurs and International Independents sometimes do a better job of leveraging their local knowledge and networks to execute effective grassroots outreach campaigns. As with most consumer categories, low-income consumers typically prefer known brands because they are perceived to have better performance and quality. Companies with recognized brands—the Brand Builders—therefore aim to leverage this inherent advantage when offering new products. Larger players also often enjoy the fi nancial backing of parent companies to fund eye-catching marketing campaigns. Local Entrepreneurs and International Independents, on the other hand, have to build their name from scratch. This cost can be signifi cant for start-ups, of which only a minority are generally able to mobilize the requisite grant or commercial funding for their market-building activities. They therefore frequently capitalize on word-of-mouth and relationships at a local level, but low-cost marketing campaigns can be effective, too. The Ghanaian cookstove company Toyola, for example, actively works to turn satisfi ed early adopters into “evangelists” and ultimately distributors. Evangelists start operating in their village and then collect and regroup orders from surrounding villages. Toyola sells about 60 percent of stoves directly to users through this channel. Tecnosol in Nicaragua buys solar home system units from overseas suppliers, then promotes, sells, and installs them in rural areas through a similar “early adopter” model. Tecnosol’s fi rst customers in each area, typically rural merchants or shopkeepers, act as local agents who advertise the benefi ts of the service and provide feedback to the company on any technical issues.
Roadshows and other traditional media are popular at the BOP, and the use of other traditional media can also work well to promote products. Dutch multinational consumer electrics fi rm Philips’s “Cape Town to Cairo” 2010 and 2011 road show traveled across 12 countries and was designed to promote the benefi ts of solar lanterns with consumers and other stakeholders from the public and private sectors. By addressing both direct consumers and organizations that work with social development issues and the BOP, they increase product visibility markedly, and product information trickles down to end users from multiple sources. SolarNow, a Dutch company that trains a network of African entrepreneurs to sell and maintain standardized solar home systems, has a network of retailers in Burkina Faso, Mali, Senegal, Tanzania, and Uganda. It uses a single brand to help the public identify good-quality products “where they see the sign,” and runs extensive radio campaigns designed to make it a trusted name in its target markets.
Sales & Distribution
Distribution is one of the overriding challenges for device companies attempting to reach low-income markets. Customers typically live in remote rural areas and do not shop at established retail channels where they would discover new technologies. “Typically new technologies start in the urban areas and spread out into the rural areas. But in this case you really have a product that is designed for people who are off-grid, living in the rural areas, and they may not have a chance to see it fi rst in the cities,” explains Ned Tozun, president of solar lantern company d.light. Local distribution chains are fragmented, and cash-poor merchants struggle with working capital constraints, low sales volumes compared to other products that they could stock, and limited shelf space. Yet other sectors such as beverages, pharmaceuticals, and mobile telephony have become very good at distribution in low-income markets. The companies that are able to do this in the energy access market typically do well.
Brand Builders are leveraging their parent companies’ capital and existing market presence (or strong partnerships) to grow distribution, creating a real advantage over other players. Brand Builders with a local footprint already sell other products in-country (for example, radios, fans, batteries) and can convince retailers to stock new energy access items under a name that is easily recognizable. Critically, they can also extend capital or offer attractive payment terms to small shop owners. Sanyo, for example, is leveraging its long-standing reputation for quality, experience with lower-income products, and deep pockets, to aggressively grow in the Kenyan market. The company’s strategy is based on its partnership with a local distributor, which sells directly to retailers and to rural sub-distributors. Importantly, it also provides working capital to its distributors to drive sales deep into rural areas.
Philips is at an early stage of testing a new product, fi nancing, and distribution approach in Ghana. This is part of an ambitious plan to develop a commercially sustainable distribution chain for energy services for the poor, creating additional income for at least 35,000 people in Sub-Saharan Africa and to provide 10 million people in the region with affordable, appropriate, and sustainable energy services by 2015. Philips’s approach includes collaboration with NGOs, government, its suppliers, and complimentary companies like African mobile operator MTN. Similarly, Schneider Electric, a French-based multinational, has set out to serve 1 million people in India with modern lighting services between 2009 and 2011. After one year, it had reached 250,000 people. The key to this rapid growth is that Schneider leveraged its own national wholesale and retail network to serve urban areas, but partnered with NGOs and microfi nance institutions and the Indian Oil Company’s retail network and local electricians to serve rural areas.
52HOW COMPANIES ARE SERVING THE MARKET
BOX 3.2: Unilever Tea Kenya Limited has tapped CSR funding to success-fully purchase and disseminate solar PV devicesNot itself a device supplier, Unilever Tea Kenya Limited (UTKL) recognized the importance of providing modern energy access to its workers. After realizing that kerosene use among tea pickers living on unelectrifi ed plantations was resulting in high numbers of respiratory illnesses and burns, UTKL began supporting the supply of good-quality solar lanterns to their staff. They worked closely with IFC’s Lighting Africa program to defi ne acceptable quality standards for these devices and develop a consumer education initiative. In parallel, they designed a distribution and purchase model that would be fi nancially sustainable over the longer term.
UTKL staff are members of a number of offi cially recognized savings and credit organizations (called Saccos), and are familiar with saving in and taking loans from these groups. The tea company’s management decided to support the Saccos as an effi cient way of providing end-user fi nancing for energy devices, and invested money for the purpose of providing staff loans for the purchase of lanterns.
To buy a device, a staff member places an order at a central purchase point offered by UTKL and signs on for an equivalent loan from his or her Sacco. A portion of the device costs are paid for up front using a bank transfer, cash, or the Kenyan Mpesa mobile payment system. These orders are collated and sent to a local product distributor. On supplying the goods, the distributor is paid from the UTKL/Sacco account. The staff then receives the products as per their order and begins servicing the loan.
French-based oil company Total, a relatively new entrant in the lighting devices space, has made distribution its core competence in this space, using its network of retail outlets to resell PV lanterns in Cameroon, Indonesia, and Kenya. Unlike other multinational counterparts that design their own products, Total has selected a handful of existing lighting devices supplied by d.light, Phocos, and Sundaya and signed sales agreements to get the products to market. It focuses on reaching the last mile and leaves design to smaller, more nimble companies. Total purchases large volumes of desirable products, uses well-branded outlets to sell them, and offers fl exible payment terms and working capital to its partners. A central Paris-based purchasing entity deals with all issues related to suppliers and to importing and distributing product. In return, device suppliers gain access to fi nance and visibility in these markets under their own brand name. Total is aiming for 100,000 products sold by early 2012.
International Independents often have a harder time mastering networks or fi nancing distribution alone, but sometimes partner with social sector players to overcome challenges. Unable to leverage internal or existing partner resources more common to larger players, International Independents often sell into third-party channels or work with NGOs, community organizations, or village entrepreneurs to get their product to market. For instance, d.light uses two approaches to product distribution—partnering with Indian NGOs that have established means of reaching the end user in some areas, and employing a network of local entrepreneurs for others. Similarly, Barefoot Power has established subsidiaries in Kenya and Uganda, where it works closely with microfi nance institutions to identify entrepreneurs
able to sell the product. These have trained hundreds of microentrepreneurs who typically sell $30 worth of solar lanterns per day, and given the relatively high income that this provides, are signifi cantly incentivized to expand sales. In the Philippines, solar lantern company SunTransfer is a shareholder in Hybrid Solutions, a local distributor which itself has built partnerships with NGOs and microfi nance institutions that have long-standing and extensive networks in villages.
In several East African counties, Solar Aid is building a network of franchisees to sell its “Sunny Money” product through local entrepreneurs. NGOs are involved, but only to promote the franchise business opportunity to potential microentrepreneurs. Sunny Money handles the relationship with franchisees directly, giving them a one-week training course and access to capital and supply chain support. Solar lantern company ToughStuff has only 20 employees but has sold 200,000 units through third parties. The disadvantage of this model compared with the integrated distribution approach of larger players is that it reduces market reach and squeezes margins, effectively limiting the ability to grow the business. Using a different tactic, U.S.-based Envirofi t, which started in 2003 as a nonprofi t and began producing stoves for sale in East Africa and India in 2007, has accelerated its expansion using donor funds14 to discount cookstoves as an incentive for its distributors to stock their product rather than those of more expensive competitors.
Box 3.2 provides an example of how corporate social responsibility (CSR) funds were successfully used to disseminate solar PV devices.
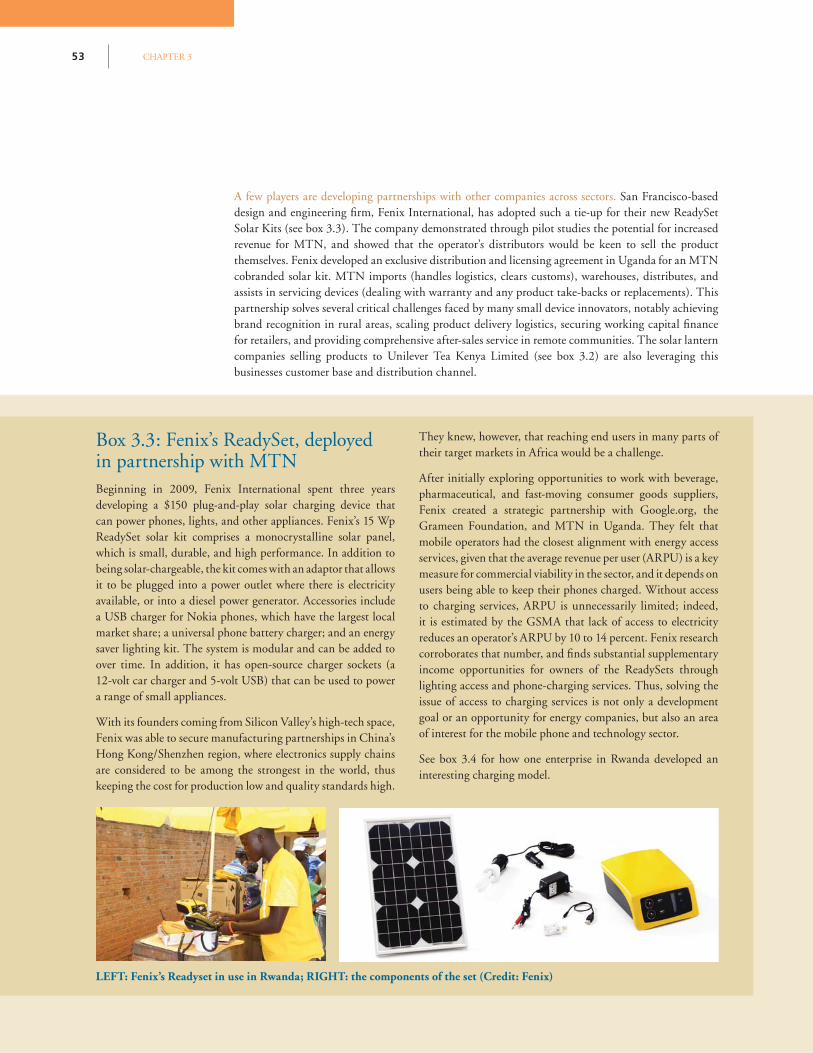
CHAPTER 353
Box 3.3: Fenix’s ReadySet, deployed in partnership with MTNBeginning in 2009, Fenix International spent three years developing a $150 plug-and-play solar charging device that can power phones, lights, and other appliances. Fenix’s 15 Wp ReadySet solar kit comprises a monocrystalline solar panel, which is small, durable, and high performance. In addition to being solar-chargeable, the kit comes with an adaptor that allows it to be plugged into a power outlet where there is electricity available, or into a diesel power generator. Accessories include a USB charger for Nokia phones, which have the largest local market share; a universal phone battery charger; and an energy saver lighting kit. The system is modular and can be added to over time. In addition, it has open-source charger sockets (a 12-volt car charger and 5-volt USB) that can be used to power a range of small appliances.
With its founders coming from Silicon Valley’s high-tech space, Fenix was able to secure manufacturing partnerships in China’s Hong Kong/Shenzhen region, where electronics supply chains are considered to be among the strongest in the world, thus keeping the cost for production low and quality standards high.
They knew, however, that reaching end users in many parts of their target markets in Africa would be a challenge.
After initially exploring opportunities to work with beverage, pharmaceutical, and fast-moving consumer goods suppliers, Fenix created a strategic partnership with Google.org, the Grameen Foundation, and MTN in Uganda. They felt that mobile operators had the closest alignment with energy access services, given that the average revenue per user (ARPU) is a key measure for commercial viability in the sector, and it depends on users being able to keep their phones charged. Without access to charging services, ARPU is unnecessarily limited; indeed, it is estimated by the GSMA that lack of access to electricity reduces an operator’s ARPU by 10 to 14 percent. Fenix research corroborates that number, and fi nds substantial supplementary income opportunities for owners of the ReadySets through lighting access and phone-charging services. Thus, solving the issue of access to charging services is not only a development goal or an opportunity for energy companies, but also an area of interest for the mobile phone and technology sector.
See box 3.4 for how one enterprise in Rwanda developed an interesting charging model.
LEFT: Fenix’s Readyset in use in Rwanda; RIGHT: the components of the set (Credit: Fenix)
A few players are developing partnerships with other companies across sectors. San Francisco-based design and engineering fi rm, Fenix International, has adopted such a tie-up for their new ReadySet Solar Kits (see box 3.3). The company demonstrated through pilot studies the potential for increased revenue for MTN, and showed that the operator’s distributors would be keen to sell the product themselves. Fenix developed an exclusive distribution and licensing agreement in Uganda for an MTN cobranded solar kit. MTN imports (handles logistics, clears customs), warehouses, distributes, and assists in servicing devices (dealing with warranty and any product take-backs or replacements). This partnership solves several critical challenges faced by many small device innovators, notably achieving brand recognition in rural areas, scaling product delivery logistics, securing working capital fi nance for retailers, and providing comprehensive after-sales service in remote communities. The solar lantern companies selling products to Unilever Tea Kenya Limited (see box 3.2) are also leveraging this businesses customer base and distribution channel.

54HOW COMPANIES ARE SERVING THE MARKET
need new image
ABOVE: NEW TECHNOLOGIES TEND TO REACH CITIES FIRST, SUCH AS THE ONE THIS MECHANIC LIVES IN; THEY TAKE MUCH
LONGER TO REACH RURAL AREAS (CREDIT: IFC)
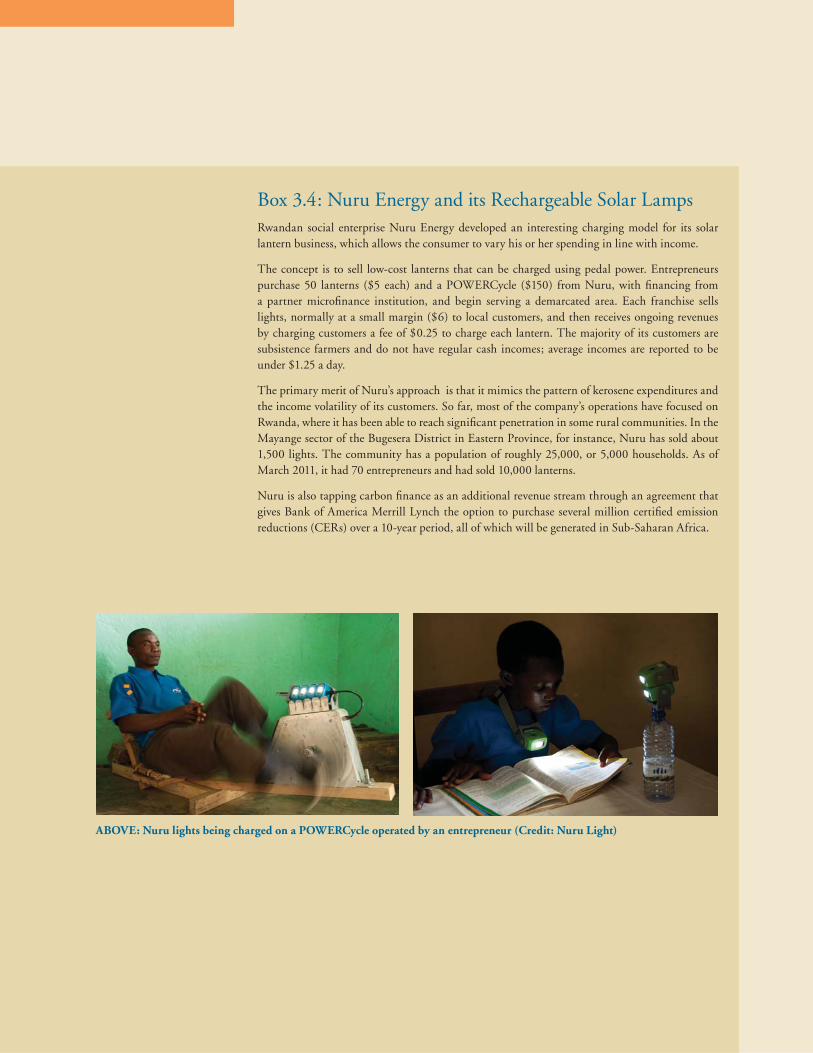
CHAPTER 355
Box 3.4: Nuru Energy and its Rechargeable Solar LampsRwandan social enterprise Nuru Energy developed an interesting charging model for its solar lantern business, which allows the consumer to vary his or her spending in line with income.
The concept is to sell low-cost lanterns that can be charged using pedal power. Entrepreneurs purchase 50 lanterns ($5 each) and a POWERCycle ($150) from Nuru, with fi nancing from a partner microfi nance institution, and begin serving a demarcated area. Each franchise sells lights, normally at a small margin ($6) to local customers, and then receives ongoing revenues by charging customers a fee of $0.25 to charge each lantern. The majority of its customers are subsistence farmers and do not have regular cash incomes; average incomes are reported to be under $1.25 a day.
The primary merit of Nuru’s approach is that it mimics the pattern of kerosene expenditures and the income volatility of its customers. So far, most of the company’s operations have focused on Rwanda, where it has been able to reach signifi cant penetration in some rural communities. In the Mayange sector of the Bugesera District in Eastern Province, for instance, Nuru has sold about 1,500 lights. The community has a population of roughly 25,000, or 5,000 households. As of March 2011, it had 70 entrepreneurs and had sold 10,000 lanterns.
Nuru is also tapping carbon fi nance as an additional revenue stream through an agreement that gives Bank of America Merrill Lynch the option to purchase several million certifi ed emission reductions (CERs) over a 10-year period, all of which will be generated in Sub-Saharan Africa.
ABOVE: Nuru lights being charged on a POWERCycle operated by an entrepreneur (Credit: Nuru Light)
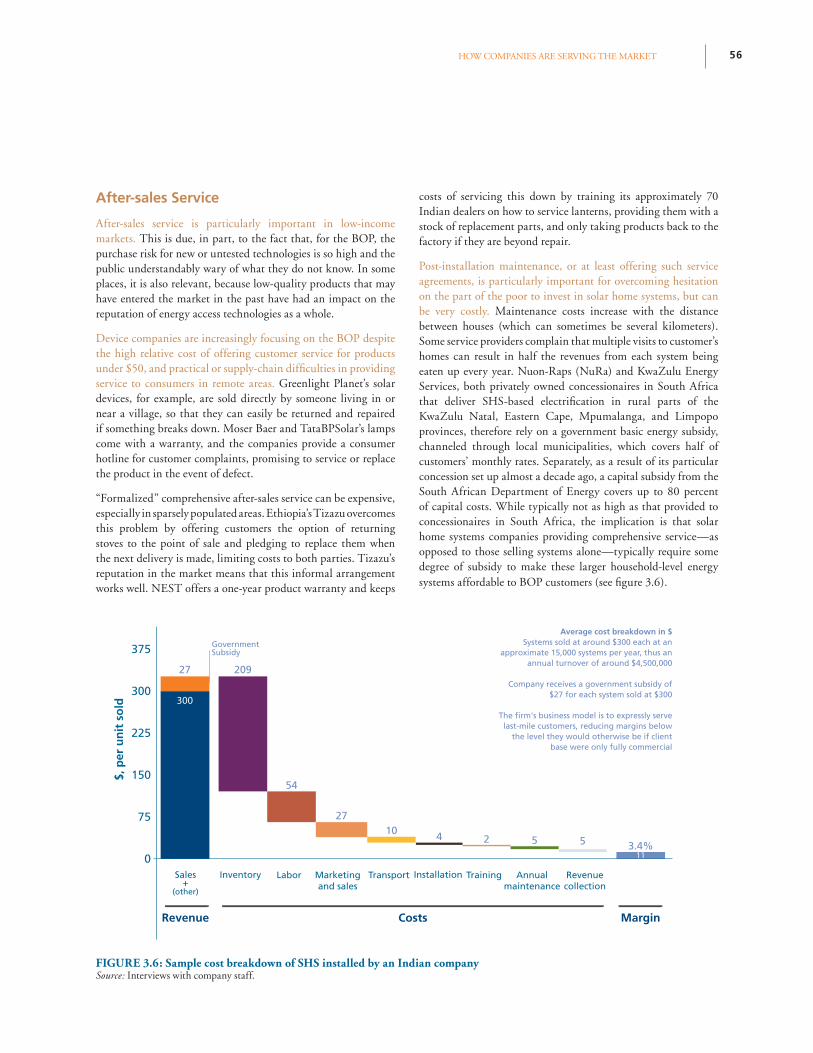
56HOW COMPANIES ARE SERVING THE MARKET
After-sales Service
After-sales service is particularly important in low-income markets. This is due, in part, to the fact that, for the BOP, the purchase risk for new or untested technologies is so high and the public understandably wary of what they do not know. In some places, it is also relevant, because low-quality products that may have entered the market in the past have had an impact on the reputation of energy access technologies as a whole.
Device companies are increasingly focusing on the BOP despite the high relative cost of offering customer service for products under $50, and practical or supply-chain diffi culties in providing service to consumers in remote areas. Greenlight Planet’s solar devices, for example, are sold directly by someone living in or near a village, so that they can easily be returned and repaired if something breaks down. Moser Baer and TataBPSolar’s lamps come with a warranty, and the companies provide a consumer hotline for customer complaints, promising to service or replace the product in the event of defect.
“Formalized” comprehensive after-sales service can be expensive, especially in sparsely populated areas. Ethiopia’s Tizazu overcomes this problem by offering customers the option of returning stoves to the point of sale and pledging to replace them when the next delivery is made, limiting costs to both parties. Tizazu’s reputation in the market means that this informal arrangement works well. NEST offers a one-year product warranty and keeps
costs of servicing this down by training its approximately 70 Indian dealers on how to service lanterns, providing them with a stock of replacement parts, and only taking products back to the factory if they are beyond repair.
Post-installation maintenance, or at least offering such service agreements, is particularly important for overcoming hesitation on the part of the poor to invest in solar home systems, but can be very costly. Maintenance costs increase with the distance between houses (which can sometimes be several kilometers). Some service providers complain that multiple visits to customer’s homes can result in half the revenues from each system being eaten up every year. Nuon-Raps (NuRa) and KwaZulu Energy Services, both privately owned concessionaires in South Africa that deliver SHS-based electrifi cation in rural parts of the KwaZulu Natal, Eastern Cape, Mpumalanga, and Limpopo provinces, therefore rely on a government basic energy subsidy, channeled through local municipalities, which covers half of customers’ monthly rates. Separately, as a result of its particular concession set up almost a decade ago, a capital subsidy from the South African Department of Energy covers up to 80 percent of capital costs. While typically not as high as that provided to concessionaires in South Africa, the implication is that solar home systems companies providing comprehensive service—as opposed to those selling systems alone—typically require some degree of subsidy to make these larger household-level energy systems affordable to BOP customers (see fi gure 3.6).
Revenue
Sales+
(other)
Inventory Labor Marketing and sales
Transport
Costs Margin
Installation Training Annualmaintenance
Revenuecollection
375
300
225
150
75
0
10 4 2 5 5 3.4%
27
54
20927
Average cost breakdown in $Systems sold at around $300 each at an
approximate 15,000 systems per year, thus an annual turnover of around $4,500,000
Company receives a government subsidy of $27 for each system sold at $300
last-mile customers, reducing margins below the level they would otherwise be if client
base were only fully commercial
GovernmentSubsidy
300
11
$, p
er u
nit
so
ld
FIGURE 3.6: Sample cost breakdown of SHS installed by an Indian companySource: Interviews with company staff.

CHAPTER 357
ABOVE: A SUNLABOB TECHNICIAN SERVICING SOLAR HOME SYSTEM EQUIPMENT, THE SUNLABOB YELLOW BOX
(CREDIT: SUNLABOB)
58HOW COMPANIES ARE SERVING THE MARKET
Consumer Financing
Despite the savings they provide, modern energy devices—in particular, solar home systems—can be too expensive for low-income consumers to buy up front, requiring companies to offer credit and staggered payment solutions. With product costs that can reach $300 to $400, solar home systems companies need to offer fi nancing to their customers. To increase affordability, they typically provide a combination of credit to cover a deposit and also offer the option of making additional monthly payments to cover the balance. TataBPSolar, for example, has “replaced” the up-front cost of its solar home system units entirely in favor of monthly payments over fi ve years, fi nanced through a mixture of the company’s own balance sheet, a $60 subsidy per connection from the Government of India, and carbon credits. The company had installed 100,000 systems by the end of 2010, and added another 100,000 in 2011. Grameen Shakti has also developed an in-house fi nancing solution for solar home systems, which is independent of its mother company, Grameen Bank. Customers can either pay $374 in cash for a unit, or make a down payment of $58 and pay an $11 monthly installment for three years. This implies a loan from Grameen Shakti to the customer at an interest rate of 15 percent.
A more common and possibly less burdensome approach is to partner with microfi nance institutions and rural banks that already provide fi nancing in target markets. SELCO relies on such tie-ups, working with about 40 rural banks that offer micro-loans to its customers in India. If a customer is unable to repay their loan, SELCO can reclaim the device and sell it on the second-hand market, returning the revenues to the bank. While less common for devices, there are cases of partnering with microfi nance institutions. Hybrid Solutions, a Filipino distributor of solar lanterns, has developed an interesting partnership with CARD MRI, a leading microfi nance institution that sells solar lanterns to its members bundled with a loan for the purchase, creating an additional distribution channel for the company and revenue for the microfi nance institution.
Despite lower up-front product costs, cookstove companies have also experimented with consumer fi nancing to increase reach among the poorest. Ugastove in Uganda makes its $7 improved wood and charcoal cookstoves more accessible by allowing fl exible repayment terms that correspond to the cash saved on charcoal. Since 2006, Ugastove has sold around 80,000 devices and is expanding into more remote parts of Uganda and neighboring countries. Toyola offers customers the option to buy on credit and to pay back the loan over two months using the money saved on charcoal, with many stashing their savings in a “Toyola Money Box.” Annual saving on charcoal of around $27 is signifi cant for a household with an annual cash income of around $800 a year, and means that the cost of buying a Coalpot is recovered within three or four months, with the company claiming a repayment rate of 99 percent. The funds it needs for such a credit plan come from concessional loans and are expected to be met by carbon fi nance in the future.
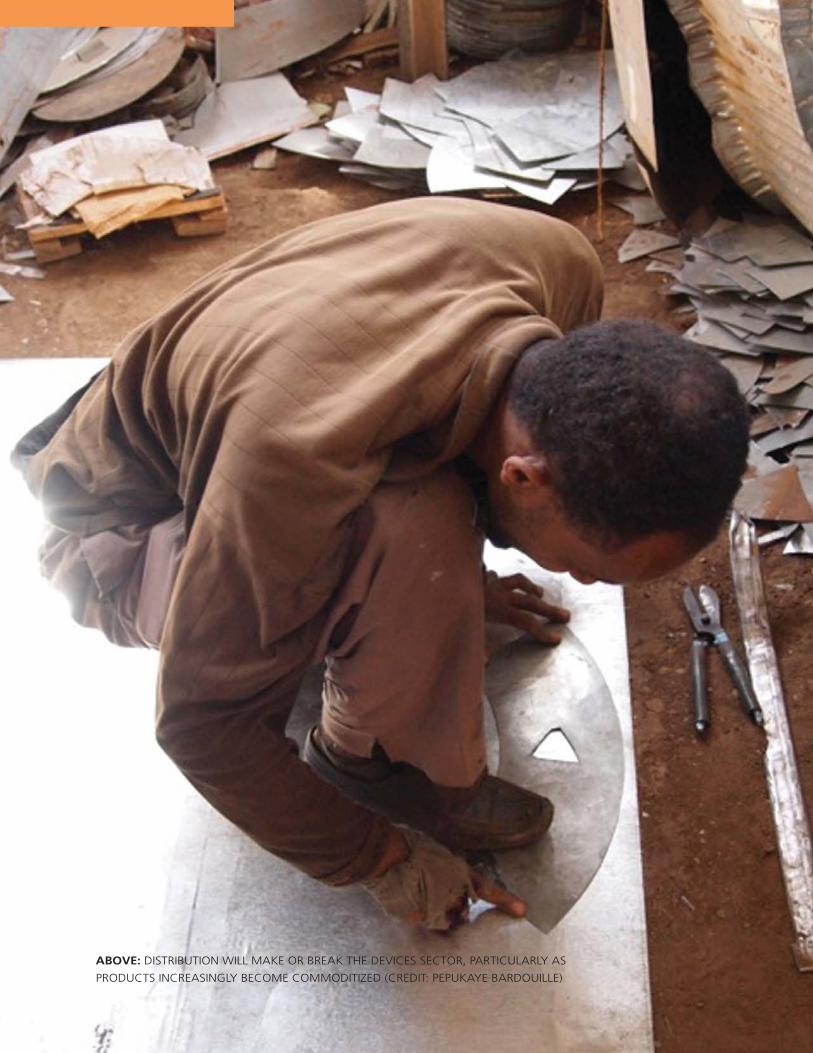
CHAPTER 359
ABOVE: DISTRIBUTION WILL MAKE OR BREAK THE DEVICES SECTOR, PARTICULARLY AS
PRODUCTS INCREASINGLY BECOME COMMODITIZED (CREDIT: PEPUKAYE BARDOUILLE)
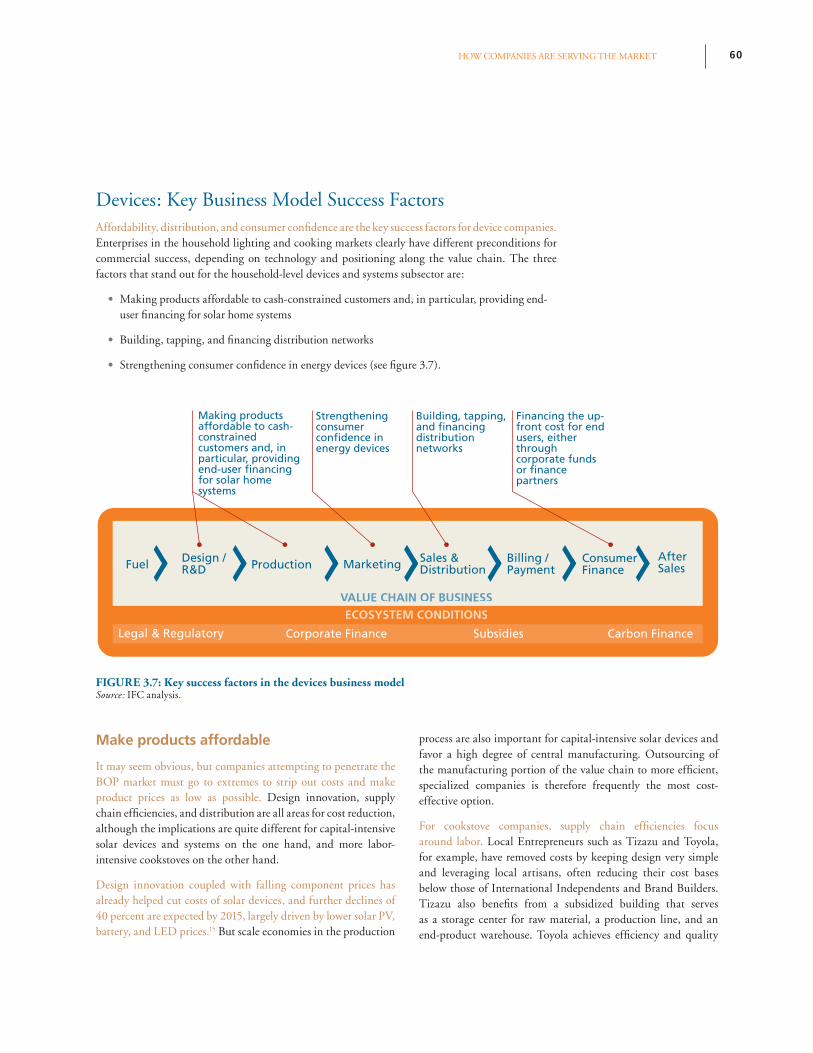
60HOW COMPANIES ARE SERVING THE MARKET
Devices: Key Business Model Success FactorsAffordability, distribution, and consumer confi dence are the key success factors for device companies. Enterprises in the household lighting and cooking markets clearly have different preconditions for commercial success, depending on technology and positioning along the value chain. The three factors that stand out for the household-level devices and systems subsector are:
• Making products affordable to cash-constrained customers and, in particular, providing end-user fi nancing for solar home systems
• Building, tapping, and fi nancing distribution networks
• Strengthening consumer confi dence in energy devices (see fi gure 3.7).
Make products affordable
It may seem obvious, but companies attempting to penetrate the BOP market must go to extremes to strip out costs and make product prices as low as possible. Design innovation, supply chain effi ciencies, and distribution are all areas for cost reduction, although the implications are quite different for capital-intensive solar devices and systems on the one hand, and more labor-intensive cookstoves on the other hand.
Design innovation coupled with falling component prices has already helped cut costs of solar devices, and further declines of 40 percent are expected by 2015, largely driven by lower solar PV, battery, and LED prices.15 But scale economies in the production
process are also important for capital-intensive solar devices and favor a high degree of central manufacturing. Outsourcing of the manufacturing portion of the value chain to more effi cient, specialized companies is therefore frequently the most cost-effective option.
For cookstove companies, supply chain effi ciencies focus around labor. Local Entrepreneurs such as Tizazu and Toyola, for example, have removed costs by keeping design very simple and leveraging local artisans, often reducing their cost bases below those of International Independents and Brand Builders. Tizazu also benefi ts from a subsidized building that serves as a storage center for raw material, a production line, and an end-product warehouse. Toyola achieves effi ciency and quality
Fuel Design /R&D Production Marketing Sales &
DistributionBilling / Payment
After Sales
ECOSYSTEM CONDITIONS
Corporate Finance Carbon Finance
ConsumerFinance
Subsidies
Making products affordable to cash- constrained customers and, in particular, providing end-user financing for solar homesystems
Strengthening consumer confidence in energy devices
Building, tapping, and financing distribution networks
Financing the up- front cost for end users, either through corporate funds or finance partners
VALUE CHAIN OF BUSINESS
Legal & Regulatory
FIGURE 3.7: Key success factors in the devices business modelSource: IFC analysis.
CHAPTER 361
control by outsourcing all but the key ceramic liner portion of its stoves, and by encouraging the artisans who form its supply chain to specialize in specifi c components. Some International Independents and Brand Builders are considering shifting to local fabrication to reduce transportation and import tariffs. The international transport component alone, of Envirofi t stoves manufactured in China and sold in India, for example, is estimated at 20 percent of total costs, driving the company’s move to localize production in India.
Distribution is another major cost driver in the supply chain. The examples above have demonstrated the choice is between proprietary distribution channels, which add fi xed costs but may bring competitive advantage, or third-party distribution, which can add fl exibility but also introduces a middleman and erodes margins. Either choice requires a diligent focus on controlling costs.
Another tactic for maximizing affordability is to adopt a payment profi le that mirrors the traditional spending profi le of customers who would otherwise use kerosene for lighting or charcoal for cooking, as discussed below. As described above, the subscription or fee-for-service model is a good solution for solar home systems, and allows customers to make regular payment for use rather than covering the entire cost at once. But this can be applied to devices, too, as has been done by Nuru and Sunlabob.
End-user fi nancing can be critical for ensuring affordability but introduces complications. We saw, above, how end-user fi nancing is also relevant, particularly for making solar home systems affordable. This is also discussed in a number of publications including Selling Solar.16 Firms that operate in regions such as South Asia, where strong microfi nance organizations are prevalent, may therefore have an advantage here. Certainly, Bangladesh and India, where microfi nance is most entrenched, have produced the most successful solar home system businesses. In-house fi nancing, however, offers management full oversight of the business but requires deep pockets and can create balance sheet complications for most companies. This is therefore probably best suited to those larger Brand Builders (in this case, typically local conglomerates as opposed to multinational corporations) that have the necessary skills to manage loan arrangements and payment tracking, on top of the already complex process of system delivery and maintenance in remote communities.
Many solar home systems companies would have struggled to succeed without the availability of soft loans from either international or local development institutions, which can be on-lent at a reasonable mark-up to customers. The success of
Grameen Shakti and other solar home systems entrepreneurs in Bangladesh is closely linked to government-owned IDCOL, which provides concessional monies for end-user fi nancing. Established in 1997, IDCOL is mandated to promote private sector fi nancing in the infrastructure and renewable energy sectors, and is currently implementing solar home system, domestic biogas, solar mini-grids and pumps, biomass, and biogas power projects.
In addition to providing concessional loans for end-user fi nance, IDCOL has played a vital role in building the solar home system market in Bangladesh, initially as a main component of the Rural Electrifi cation and Renewable Energy Development Project of the World Bank, by establishing solar home system product certifi cation supported using a subsidy incentive plan. The Government of Bangladesh fi nances IDCOL at 3 percent and acts as a conduit for fi nancing by the Asian Development Bank, GIZ, KfW, the Islamic Development Bank, the Global Environment Facility, and the World Bank. For a solar home system bought with a three-year credit with a 15 percent down payment, IDCOL lends to the distributor 80 percent of the amount borrowed at 6 to 8 percent over 7 to 10 years, with a one-to-two-year grace period. Using this capital, fi rms that are approved as suppliers of products with IDCOL’s technical specifi cations on-lend to customers at an annual interest rate equivalent to 15 percent.
Building, tapping, and fi nancing distribution networks
Fundamentally, distribution makes or breaks the devices sector, and this is only likely to become more important as all devices move toward product commoditization. Kerosene for lanterns, the latest mobile phone models, disposable batteries, soap products, and bottles of Coca-Cola have all managed to reach the most remote customers across the developing world. To date, since these are early-stage businesses, many solar lantern, solar home system, and cookstove players are still struggling to secure last-mile distribution. This report’s assessment is that, against a backdrop of potential product commoditization, the strategic weight of this industry is shifting from the design and manufacturing gurus to the distribution “gatekeepers.”
Box 3.5 explains how Greenlight Planet is building its own distribution network.
62HOW COMPANIES ARE SERVING THE MARKET
Greenlight Planet is a pioneer in the market for photovoltaic lighting for the poor, and its story highlights the central challenges for device companies launching new technology in hard-to-reach villages: distribution and customer awareness. The company was started by Mayank Sekhsaria, Anish Thakkar, and Patrick Walsh in 2005 while they were students at the University of Illinois in the United States. At that time, there was really no market for solar lanterns—only a need. The trio’s response was to create a for-profi t company. It started selling its Sun King solar lantern in mid-2008, fi rst in India and now in 10 African countries. Six years later, it has reached breakeven.
Greenlight experimented unsuccessfully for a year and a half with traditional distribution chains into rural India and had to navigate at least four links in the chain from master distributor down to a village retailer. Each link takes 8 to 15 percent margin and requires credit.
Even with 50 percent added to the manufactured cost, and suffi cient credit extended to get it to the retailer, the product would sit in a store without anyone knowing of its existence. The market is still so new that even today consumer misconceptions about solar lanterns abound. Some believe that the product will break prematurely or, without knowing the actual price, assume that it must be too expensive. Established consumer product companies overcome these problems with road shows that travel from village to village promoting new products—an expensive and not particularly effective way to get the job done, especially for a big-ticket item like this.
Greenlight decided to sell its products directly by recruiting respected members of the community, like a teacher or subsistence farmer, to become a part-time salesman for the company. These “saathis” spend several hours a day visiting people in their area of about 2,000 homes demonstrating and selling the product. Saathis can expect to about double the $50 to $80 per month that they earn in their “day job” with the extra income from selling lamps. Product demonstrations, together with the fact that saathis are known by and accountable to their neighbors, reassure customers about the product and increase uptake. Greenlight now has 650 saathis selling about six to eight units a month each, saturating 70 percent of their villages within six months, often with repeat purchases. The saathis report that at that point, they move on to other villages.
Knockoffs have appeared in small numbers without much sales success, but they do damage the reputation of solar lamps in general, resulting in market spoilage. For now, however, Greenlight is not concerned about the threat of competition; it believes that its distribution system is unique and hard to replicate, making this the main defense against competition.
The downside of building a distribution channel from scratch is that it limits a company’s ability to quickly scale. While Greenlight has ambitious expansion plans, it still sells only 8,000 units per month. When it expanded into Africa from India, it opted to use third-party distributors rather than recreating the saathi system, partly due to the scale issue, and partly due to the challenge of managing different national regulatory systems and cultural norms.
Box 3.5: Greenlight Planet: Building its own distribution network
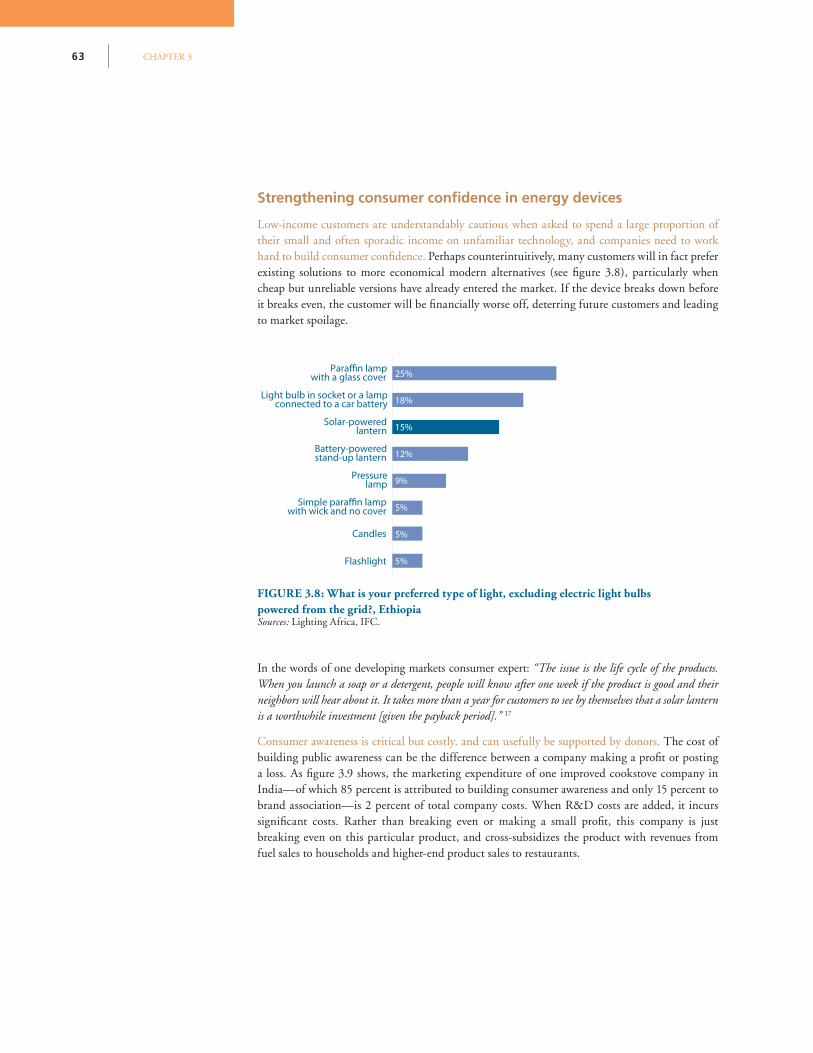
CHAPTER 363
Strengthening consumer confi dence in energy devices
Low-income customers are understandably cautious when asked to spend a large proportion of their small and often sporadic income on unfamiliar technology, and companies need to work hard to build consumer confi dence. Perhaps counterintuitively, many customers will in fact prefer existing solutions to more economical modern alternatives (see fi gure 3.8), particularly when cheap but unreliable versions have already entered the market. If the device breaks down before it breaks even, the customer will be fi nancially worse off, deterring future customers and leading to market spoilage.
Paraffin lampwith a glass cover
Light bulb in socket or a lamp connected to a car battery
Solar-powered
lantern
Battery-poweredstand-up lantern
Pressurelamp
Simple paraffin lampwith wick and no cover
Candles
Flashlight
25%
18%
15%
12%
9%
5%
5%
5%
FIGURE 3.8: What is your preferred type of light, excluding electric light bulbs powered from the grid?, EthiopiaSources: Lighting Africa, IFC.
In the words of one developing markets consumer expert: “The issue is the life cycle of the products. When you launch a soap or a detergent, people will know after one week if the product is good and their neighbors will hear about it. It takes more than a year for customers to see by themselves that a solar lantern is a worthwhile investment [given the payback period].” 17
Consumer awareness is critical but costly, and can usefully be supported by donors. The cost of building public awareness can be the difference between a company making a profi t or posting a loss. As fi gure 3.9 shows, the marketing expenditure of one improved cookstove company in India—of which 85 percent is attributed to building consumer awareness and only 15 percent to brand association—is 2 percent of total company costs. When R&D costs are added, it incurs signifi cant costs. Rather than breaking even or making a small profi t, this company is just breaking even on this particular product, and cross-subsidizes the product with revenues from fuel sales to households and higher-end product sales to restaurants.
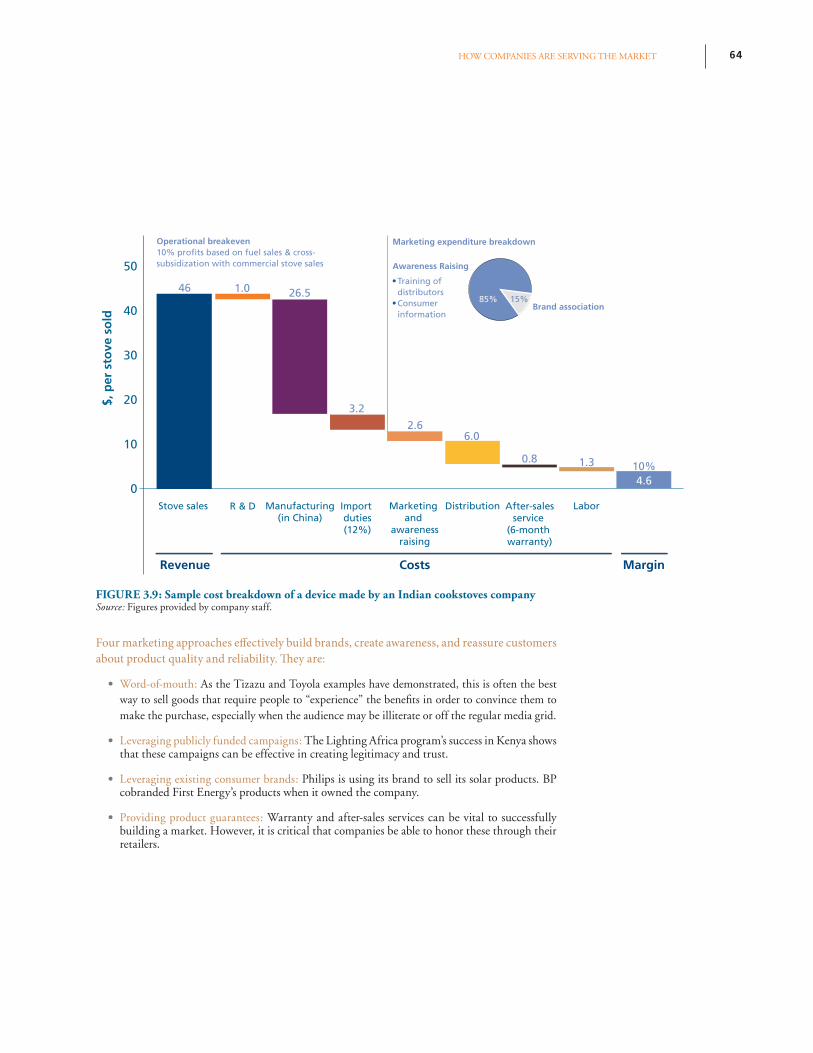
64HOW COMPANIES ARE SERVING THE MARKET
Four marketing approaches eff ectively build brands, create awareness, and reassure customers
about product quality and reliability. Th ey are:
• Word-of-mouth: As the Tizazu and Toyola examples have demonstrated, this is often the best way to sell goods that require people to “experience” the benefi ts in order to convince them to make the purchase, especially when the audience may be illiterate or off the regular media grid.
• Leveraging publicly funded campaigns: The Lighting Africa program’s success in Kenya shows that these campaigns can be effective in creating legitimacy and trust.
• Leveraging existing consumer brands: Philips is using its brand to sell its solar products. BP cobranded First Energy’s products when it owned the company.
• Providing product guarantees: Warranty and after-sales services can be vital to successfully building a market. However, it is critical that companies be able to honor these through their retailers.
FIGURE 3.9: Sample cost breakdown of a device made by an Indian cookstoves companySource: Figures provided by company staff.
Revenue
Stove sales R & D Manufacturing(in China)
Import duties(12%)
Marketing and
awarenessraising
Distribution
Awareness Raising
Marketing expenditure breakdown
Brand association
Costs Margin
After-salesservice
(6-month warranty)
Labor
50
40
30
20
10
0
6.0
0.8 1.3
2.6
3.2
26.51.046Training of distributorsConsumerinformation
Operational breakeven
subsidization with commercial stove sales
85%
10%
15%
$, p
er s
tove
so
ld
4.6
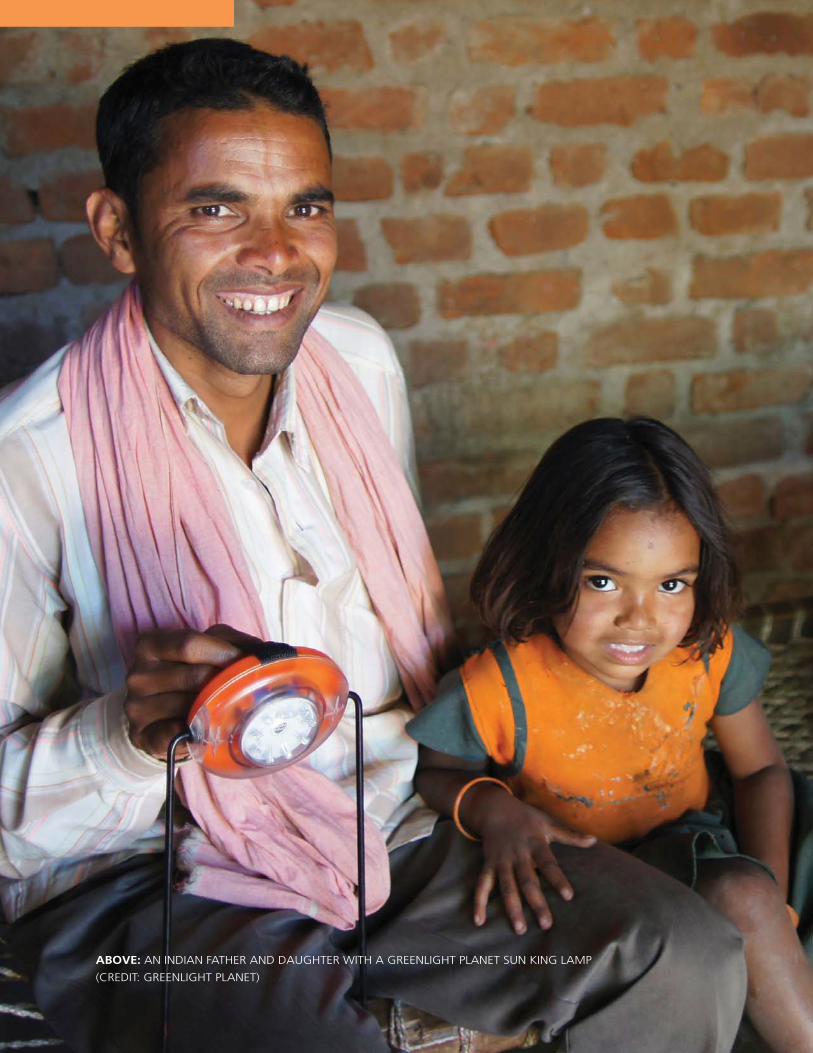
CHAPTER 365
ABOVE: AN INDIAN FATHER AND DAUGHTER WITH A GREENLIGHT PLANET SUN KING LAMP
(CREDIT: GREENLIGHT PLANET)
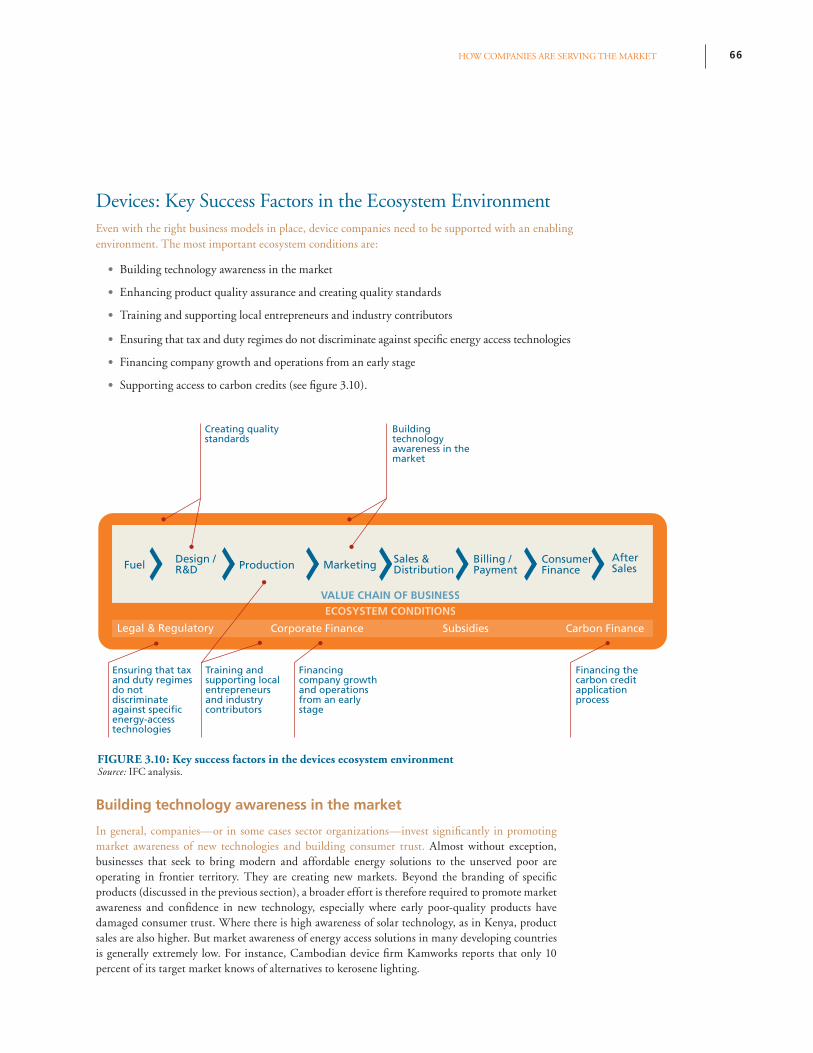
66HOW COMPANIES ARE SERVING THE MARKET
Devices: Key Success Factors in the Ecosystem EnvironmentEven with the right business models in place, device companies need to be supported with an enabling environment. The most important ecosystem conditions are:
• Building technology awareness in the market
• Enhancing product quality assurance and creating quality standards
• Training and supporting local entrepreneurs and industry contributors
• Ensuring that tax and duty regimes do not discriminate against specifi c energy access technologies
• Financing company growth and operations from an early stage
• Supporting access to carbon credits (see fi gure 3.10).
Building technology awareness in the market
In general, companies—or in some cases sector organizations—invest signifi cantly in promoting market awareness of new technologies and building consumer trust. Almost without exception, businesses that seek to bring modern and affordable energy solutions to the unserved poor are operating in frontier territory. They are creating new markets. Beyond the branding of specifi c products (discussed in the previous section), a broader effort is therefore required to promote market awareness and confi dence in new technology, especially where early poor-quality products have damaged consumer trust. Where there is high awareness of solar technology, as in Kenya, product sales are also higher. But market awareness of energy access solutions in many developing countries is generally extremely low. For instance, Cambodian device fi rm Kamworks reports that only 10 percent of its target market knows of alternatives to kerosene lighting.
Fuel Design /R&D Production Marketing Sales &
DistributionBilling / Payment
After Sales
ECOSYSTEM CONDITIONS
Corporate Finance Carbon Finance
ConsumerFinance
Subsidies
VALUE CHAIN OF BUSINESS
Legal & Regulatory
Creating quality standards
Building technology awareness in the market
Ensuring that tax and duty regimes do not discriminate against specificenergy-access technologies
Training and supporting local entrepreneurs and industry contributors
Financing company growth and operations from an early stage
Financing the carbon credit applicationprocess
FIGURE 3.10: Key success factors in the devices ecosystem environmentSource: IFC analysis.
CHAPTER 367
Advertising campaigns, standard-setting regimes, and training of distributors are critical for market development initiatives. Efforts intending to build technology awareness and assure product quality must ideally include these three central elements: public advertising campaigns, credible labeling and certifi cation standards that can be understood by consumers and bulk buyers, and training of entrepreneurs and distributors on the safe use of new technologies—particularly where installation and maintenance is required.
Donors have extensive experience in consumer awareness-raising tactics across sectors such as education and health care, which should be leveraged for energy services. This is already happening in some places. The Global Environment Facility and the United Nations Development Programme have worked to promote understanding of solar options in Tanzania by installing solar systems in schools or hospitals.18 In Ethiopia, the Ministry of Agriculture, together with Germany’s GIZ, the Shell Foundation, and the Netherlands Directorate-General of Development Cooperation, were instrumental in promoting clean cooking options. They focused specifi cally on the open-source Mirt Stove, but the impact has been much wider, with local companies benefi ting from improved awareness. So, while they are socially oriented in their objectives, public awareness efforts can also help establish conditions for commercial market entry.
Enhancing product quality assurance and creating quality standards
Quality standards are important for new and emerging technologies because they help consumers identify the right products to meet their needs, and they foster trust. If well-developed quality standards provide valuable information to customers and create a level playing fi eld in which companies compete on the basis of not only price but also performance, ultimately, cost-effective but also ethical competitors will enjoy an advantage, not because their products have been given an unfair advantage, but because their products have been given the opportunity to demonstrate their value. At the same time, such standards need to be suffi ciently practical to encourage, rather than hamper, innovation and competition.
“If the device breaks down before it breaks even, the customer will be fi nancially worse off, deterring future customers and leading to market spoilage.”
In addition to supporting consumer awareness, IFC’s Lighting Africa program has played a signifi cant role in establishing initial quality and performance standards and certifi cations to help consumers make informed choices, with very good results. One component of the program is the development of a locally appropriate, easily recognizable quality seal for solar lanterns in Kenya. The program worked with test laboratories in China, Germany, and the United States, and recently in Kenya, to establish low-cost testing services for lighting products. The tests allow manufacturers, distributors, NGOs, and other players to accurately measure a product’s performance. In Kenya, a mobile telephone SMS (short message service) has been launched, whereby a blank text message sent to a local number generates a real-time update on approved solar lantern products. This provides information to customers while they are in a shop and greatly reduces the need for separate advertising. The biannual Lighting Africa Business Conference and Trade Fair is seen as the industry reference event, facilitating business partnerships. Over 600 participants from 50 countries attended the 2010 conference. To date, companies that have passed Lighting Africa quality tests sold 175,000 products, translating into more than 850,000 people with access to modern lighting. It is now expanding activities into Ethiopia, Mali, Senegal, and Tanzania. Initiatives are under way to develop quality standards for stoves through the Global Alliance for Clean Cookstoves.
More than awareness, this illustrates that donors and governments can add signifi cant value by developing standards that spur confi dence in new technologies.
Training and supporting local entrepreneurs
Governments and development partners have helped companies by providing training and support to energy access entrepreneurs. A thriving device sector requires strong capabilities along the value chain, including local entrepreneurs who understand the opportunity and have the capacity to seize it. In many places, public sector players and other development partners are involved in training artisans, retailers, and technicians, particularly those entrepreneurs involved in last-mile distribution. In the cookstove industry, the Grassroots Business Fund provided enterprise development support to Servals in India, while in Ghana, Enterprise Works trained tinsmiths, ceramists, and retailers, and a developer that has supported Toyola. Lack of trained personnel has also been a barrier to the scale-up of solar home systems.
68HOW COMPANIES ARE SERVING THE MARKET
Also in Ghana, a local fi rm, Deng, established a training center in conjunction with the Kwame Nkrumah University of Science and Technology, developing accredited courses for technicians fi nanced with grant funding (this center has recently been spun off into a separate entity). Ultimately, developing a cadre of trained professionals has served its own business.
“Training and supporting entrepreneurs does not simply build improved products, but can help to build an industry.”It is crucial that governments, donors, NGOs, and other social entities play a role in market development and transformation activities. The goal of the initiatives described above is not to build improved cookstoves, solar lanterns, or solar home systems, but to build an industry. Early market development efforts such as technology awareness campaigns have high costs and little return on investment for companies themselves, because fast-follower competitors can easily reap the benefi ts. This is a gap that can usefully be fi lled by the public sector and development partners.
Ensuring that tax and duty regimes do not discriminate against specifi c energy access technologies
Inconsistent government duties discriminate against one technology over another, and can distort markets while limiting the potential for disruptive technologies to enter and reach scale. Governments sometimes impose heavy import duties on solar lanterns and home systems, improved cookstoves, or their key components, which increase sales prices and limit market penetration. This is surprising, given that grid extension often benefi ts from subsidies, and that tax revenue contribution from improved off-grid energy access devices is likely to be low in the bigger scheme of things.
A recent Lighting Africa survey19 in a dozen West African locations where solar lighting products are not prevalent showed that import duties range from 5 to 30 percent, and additional taxes such as the value-added tax can be up to 19 percent. This led to a total tax and duty burden of up to half of end-user cost in some countries. In Kenya, Envirofi t pays $8 in tariffs for a $15 stove. In Malawi, solar panels are subject to a 50 percent duty. In India, import duties and taxes add about 11 percent to the cost of d.light’s solar lanterns and 12 percent to the cost of First Energy’s improved cookstoves. In Cambodia, there is a 35 percent import tax on fi nished solar lighting products. The result, understandably, is slower uptake of energy access products.
It is important that tax exemptions be consistent across technologies and that import processes be streamlined. Interestingly, when tax exemptions exist, they might, for example, apply only to PV panels and not to other complementary solar home system components, or to lighting devices or stoves. And even where countries like Ethiopia, Kenya, and Tanzania have eliminated or substantially lowered such taxes, importers still complain of lengthy procedures at the port of entry that stem from a lack of understanding of solar products among customs agents, corruption, inconsistent tax treatment of goods, or all these factors.
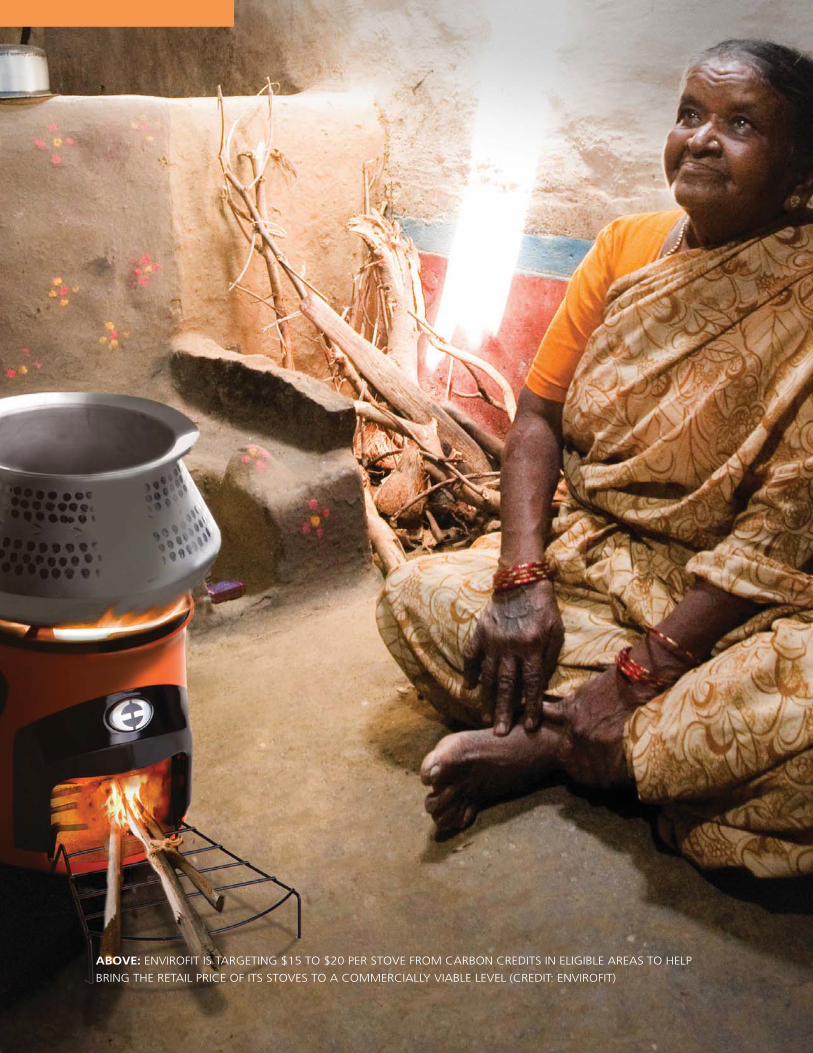
CHAPTER 369
ABOVE: ENVIROFIT IS TARGETING $15 TO $20 PER STOVE FROM CARBON CREDITS IN ELIGIBLE AREAS TO HELP
BRING THE RETAIL PRICE OF ITS STOVES TO A COMMERCIALLY VIABLE LEVEL (CREDIT: ENVIROFIT)
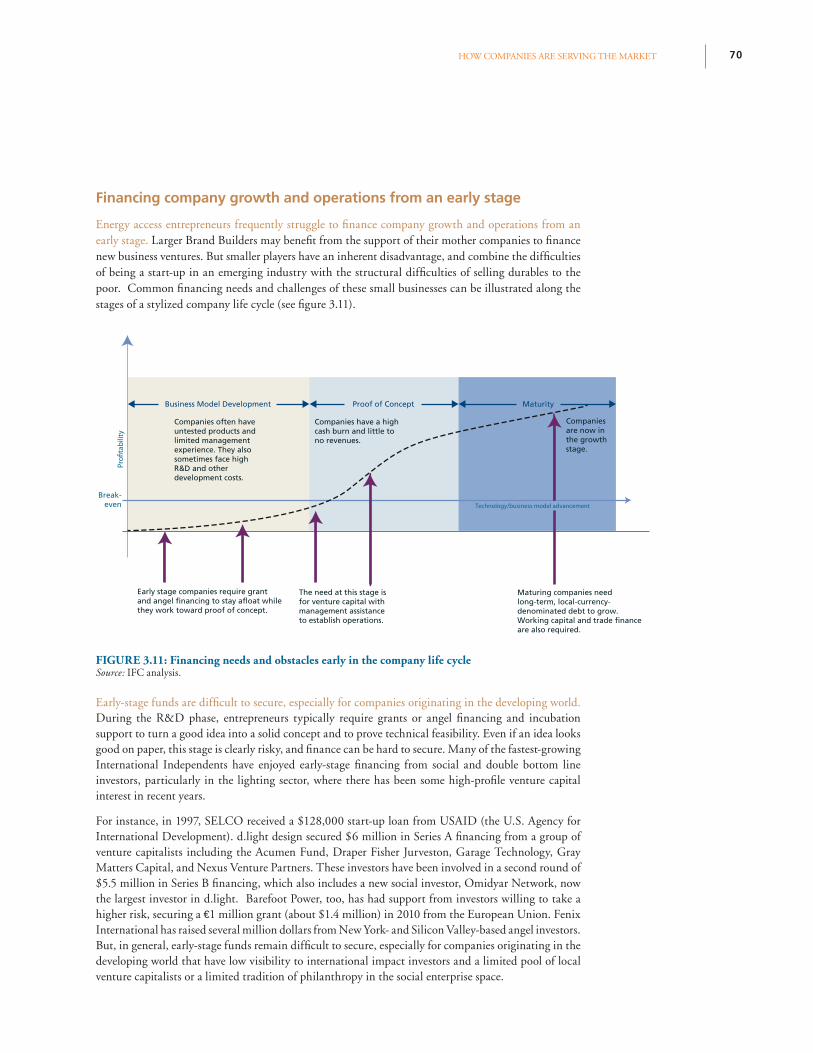
70HOW COMPANIES ARE SERVING THE MARKET
Financing company growth and operations from an early stage
Energy access entrepreneurs frequently struggle to fi nance company growth and operations from an early stage. Larger Brand Builders may benefi t from the support of their mother companies to fi nance new business ventures. But smaller players have an inherent disadvantage, and combine the diffi culties of being a start-up in an emerging industry with the structural diffi culties of selling durables to the poor. Common fi nancing needs and challenges of these small businesses can be illustrated along the stages of a stylized company life cycle (see fi gure 3.11).
Early-stage funds are diffi cult to secure, especially for companies originating in the developing world. During the R&D phase, entrepreneurs typically require grants or angel fi nancing and incubation support to turn a good idea into a solid concept and to prove technical feasibility. Even if an idea looks good on paper, this stage is clearly risky, and fi nance can be hard to secure. Many of the fastest-growing International Independents have enjoyed early-stage fi nancing from social and double bottom line investors, particularly in the lighting sector, where there has been some high-profi le venture capital interest in recent years.
For instance, in 1997, SELCO received a $128,000 start-up loan from USAID (the U.S. Agency for International Development). d.light design secured $6 million in Series A fi nancing from a group of venture capitalists including the Acumen Fund, Draper Fisher Jurveston, Garage Technology, Gray Matters Capital, and Nexus Venture Partners. These investors have been involved in a second round of $5.5 million in Series B fi nancing, which also includes a new social investor, Omidyar Network, now the largest investor in d.light. Barefoot Power, too, has had support from investors willing to take a higher risk, securing a €1 million grant (about $1.4 million) in 2010 from the European Union. Fenix International has raised several million dollars from New York- and Silicon Valley-based angel investors. But, in general, early-stage funds remain diffi cult to secure, especially for companies originating in the developing world that have low visibility to international impact investors and a limited pool of local venture capitalists or a limited tradition of philanthropy in the social enterprise space.
Pro
fita
bili
ty
Break-even
The need at this stage is for venture capital with management assistance to establish operations.
Early stage companies require grant and angel financing to stay afloat while they work toward proof of concept.
Business Model Development Proof of Concept Maturity
Technology/business model advancement
Companies often have untested products and limited management experience. They also sometimes face high R&D and other development costs.
Maturing companies need long-term, local-currency-denominated debt to grow. Working capital and trade finance are also required.
Companies are now in the growth stage.
Companies have a high cash burn and little to no revenues.
FIGURE 3.11: Financing needs and obstacles early in the company life cycleSource: IFC analysis.
CHAPTER 371
Patient capital and other forms of equity are critical as companies seek to prove commercial viability. After the development phase, start-ups need to prove commercial viability, but revenue generation and operational breakeven can take time. Cash-burn is often high while revenues are low. Entrepreneurs are rarely able to borrow from banks, and management teams need to stay motivated, and fed. This is where patient capital, such as that provided to Envirofi t by the Shell Foundation and other partners—collectively helping the business to transition to a for-profi t venture and sell some 300,000 stoves—can be of great help.20
As companies move into the growth stage, long-term investment in the form of both debt and equity is important. As operations enter steadier ground, entrepreneurs begin to focus on scale, which requires long-term investment. Both equity and debt are important, with debt ideally denominated in local currency to protect against exchange rate fl uctuations for those companies whose costs and revenues are primarily in local currencies. But even after many years of profi table operation, many local SMEs fi nd it diffi cult to borrow money. The number one constraint to growth for Tizazu’s stove business in Ethiopia, for example, is an inability to borrow money to buy equipment and automate its production line. Mr. Tizazu requires about $125,000, but does not have suffi cient collateral to secure capital from local banks, which are asking for a 200 percent guarantee. He does not own a warehouse and his inventory of cookstoves and supplies would neither suffi ce nor count toward the requirement. Meanwhile, these fi nancing needs are well below the threshold for most foreign investors, including development fi nance institutions looking for a larger fi nancial play. Mr. D. T. Barki of NEST, whose lenders require 150 percent collateral on loans, has been able to secure bank fi nancing to expand his operations because his manufacturing facility—built with his own equity—serves as an asset.
Besides the longer-term issue of corporate fi nancing, the day-to-day challenge of working capital is critical for lighting and cookstove companies and has led to tangible bottlenecks along the value chain. Some companies have managed to secure short-term working capital fi nancing. The Grassroots Business Fund, via Oikocredit, is providing Barefoot with a $1 million line of credit tied to international purchase orders to meet its working capital needs. In the case of Toyola, its fi rst $70,000 loan allowed the company to buy a truck, and provided enough working capital to help unlock a good part of its supply chain by supporting suppliers and distributors with favorable payment terms. Distributor fi nance is especially necessary for solar home system companies.
To meet the cash fl ow needs of its distributors, Ghanaian supplier Deng provides three months’ credit on components to its network of rural dealers, some of whom use this to allow reliable customers to pay two-thirds up front and the remaining third within three months—the credit term they have from Deng. In the case of commercial solar PV systems, all costs are paid for at installation. These examples show how a greater supply of working capital credit for device companies could help unlock potentially crippling bottlenecks along the value chain, catalyzing their growth. We estimate that the annual working capital needs of rapidly growing Independents such as d.light, Barefoot Power, and Greenlight Planet is about $3 million to $5 million each. But accessing even this relatively small amount of funds is not trivial, since working capital is not readily available from most investors interested in the space.
“Early-stage funds are diffi cult to secure, especially for companies originating in the developing world that have low visibility to international impact investors and a limited pool of local venture capitalists or philanthropists.”
72HOW COMPANIES ARE SERVING THE MARKET 72HOW COMPANIES ARE SERVING THE MARKET
“Patient capital is, of course, key for device companies to grow, but working capital is also critical; without this, even low-cost products cannot get to small, last-mile distributors and retailers.”
Supporting access to carbon credits
Carbon fi nance is proving to be an important alternative revenue stream for some cookstove manufacturers, which some believe could potentially transform the sector. The opportunity for companies to subsidize the end price of cookstoves with large carbon revenues is just emerging. In 2007,21 it became feasible for the fi rst time to earn and sell carbon credits from the reduction in greenhouse gas emissions that results when people switch to improved cookstoves. The Gold Standard Cooking Stove Methodology V.01 followed in June 2008. The Gold Standard is a form of accreditation allowing emissions reductions from improved cookstoves to be sold to other buyers.22
Several cookstove suppliers are starting to leverage carbon credits to allow for price reductions that increase market penetration. In 2009, Toyola registered the second-ever Gold Standard stove project worldwide23 with the assistance of E+Carbon, selling the fi rst tranche of carbon credits to Goldman Sachs in 2010. In 2009/10, Toyola derived 28 percent of its $550,000 income from carbon fi nance. Future revenues from carbon credits are also expected to reduce the price of the Toyola cookstove, enabling deeper market penetration. Players like Envirofi t are targeting $15 to $20 per stove from carbon credits in eligible areas to help bring the retail price of its stoves to a commercially viable level. A number of cookstove projects in Ghana, Kenya,24
Madagascar, Mali, Nigeria, and Uganda have also registered to receive carbon payments.25
Carbon credits have the potential to disrupt the cookstove market and drive market penetration much deeper than previously seen. An improved cookstove typically uses 35 percent to 50 percent less fuel than a traditional cooking solution, reducing emissions by up to 1 ton of carbon dioxide per year. Assuming that a reduction of 1 ton of carbon dioxide
is worth $1526 on the carbon market, a single stove, lasting fi ve years, could in theory generate as much as $75 in carbon payments. In practice, because stoves generally break before fi ve years and because of other adjustments in the methodology, $20 to $30 is a more likely achievable fi gure. Given that the cost of a new cookstove is between about $7 and $25, a company able to qualify for and leverage carbon credits could in theory use them to cover most or all of the cost of a stove. This development has the potential to disrupt the cookstove market and signifi cantly increase market penetration. Also, for lanterns and solar home systems, recent developments in the programmatic Clean Development Mechanism (CDM)27 might start to shift the cost-benefi t balance in favor of carbon fi nance. For example, AMS-III.AR methodology (for calculating emissions reductions achieved by substituting fossil-fuel-based lighting with LED lighting systems) is now harmonized with Lighting Africa quality assurance specifi cations, opening carbon fi nance for compliant products.
CHAPTER 373
While there is potential for carbon fi nance to catalyze the device space, there are four main constraints:
• Up-front cost: Registering a cookstove company for carbon credits can be expensive, typi-cally costing $120,000 to $200,000, which is prohibitively high for smaller companies. One developer estimates that only companies with sales of 12,000 units per year can reduce the price through carbon payments.28
• Time lag in receiving carbon revenues: Carbon payments are only generated after a crediting period and issuance of the fi rst emission certifi cates, which are then sold on the carbon mar-ket. It can typically take two years for revenues to fl ow. When they do come, revenues are paid annually. The need to fund fairly high outlays associated with strict monitoring requirements during the initial registration process means that most cookstove companies must access some form of external fi nance to start their carbon payment programs.
• Uncertain prices for carbon credits make it diffi cult to access external fi nancing: There is often uncertainty over whether a project will be able to access carbon fi nance. Even if it does, the price at which credits will be sold is uncertain.
• Often complex and expensive registration process. To benefi t from the potential of carbon payments, cookstove and other device companies generally need to access fi nance that spreads the cost of registration and covers the cash-fl ow gap between subsidies and carbon payments.
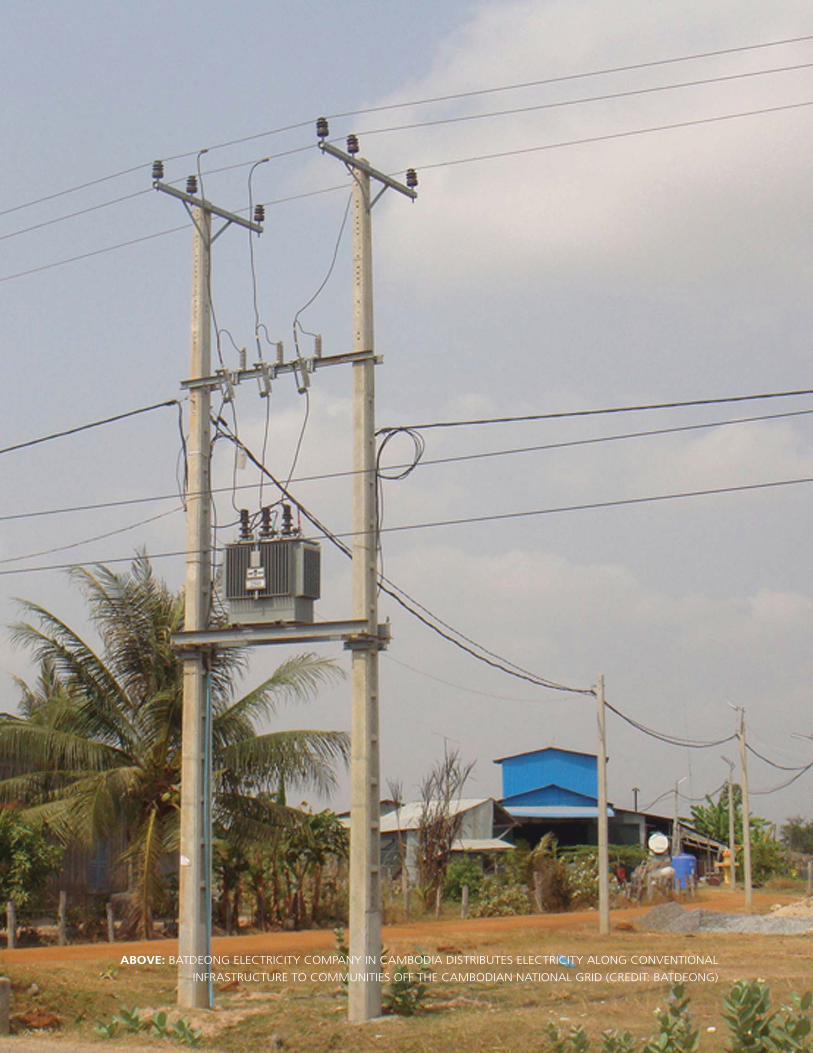
74HOW COMPANIES ARE SERVING THE MARKET
ABOVE: BATDEONG ELECTRICITY COMPANY IN CAMBODIA DISTRIBUTES ELECTRICITY ALONG CONVENTIONAL
INFRASTRUCTURE TO COMMUNITIES OFF THE CAMBODIAN NATIONAL GRID (CREDIT: BATDEONG)
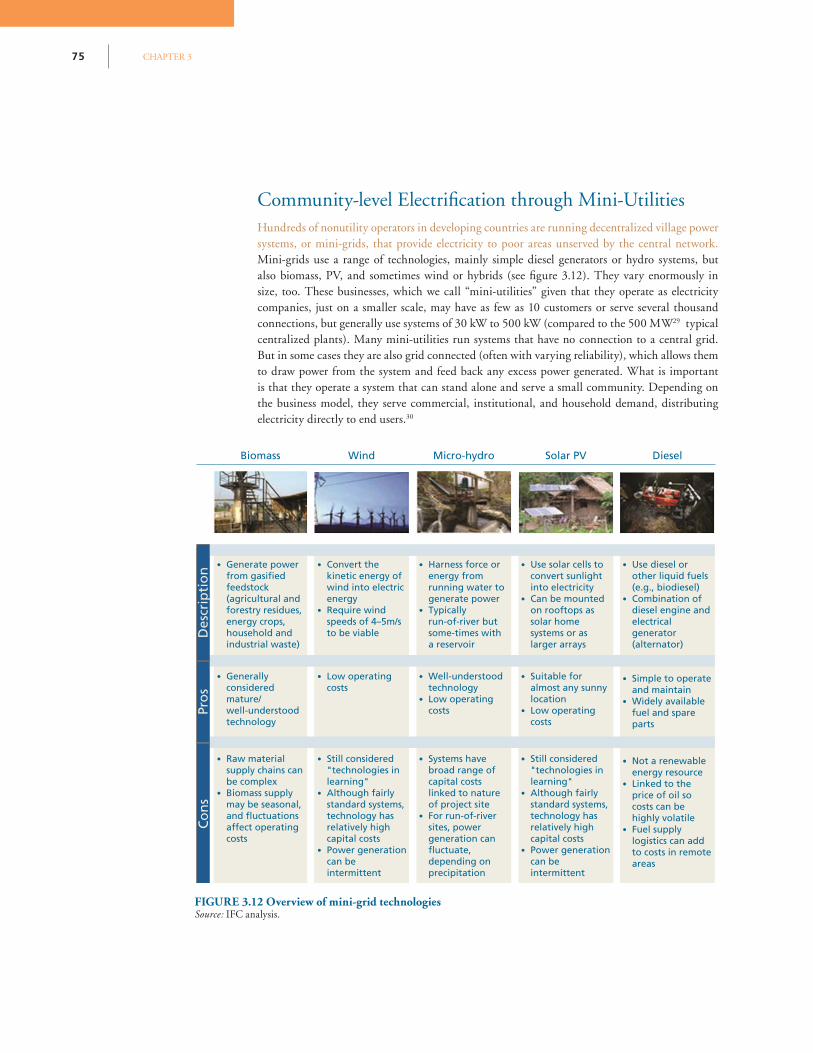
CHAPTER 375
Community-level Electrifi cation through Mini-Utilities Hundreds of nonutility operators in developing countries are running decentralized village power systems, or mini-grids, that provide electricity to poor areas unserved by the central network. Mini-grids use a range of technologies, mainly simple diesel generators or hydro systems, but also biomass, PV, and sometimes wind or hybrids (see fi gure 3.12). They vary enormously in size, too. These businesses, which we call “mini-utilities” given that they operate as electricity companies, just on a smaller scale, may have as few as 10 customers or serve several thousand connections, but generally use systems of 30 kW to 500 kW (compared to the 500 MW29 typical centralized plants). Many mini-utilities run systems that have no connection to a central grid. But in some cases they are also grid connected (often with varying reliability), which allows them to draw power from the system and feed back any excess power generated. What is important is that they operate a system that can stand alone and serve a small community. Depending on the business model, they serve commercial, institutional, and household demand, distributing electricity directly to end users.30
FIGURE 3.12 Overview of mini-grid technologiesSource: IFC analysis.
Pro
sD
escr
ipti
on
Co
ns
Biomass Wind Micro-hydro Solar PV Diesel
Generate power from gasified feedstock (agricultural and forestry residues, energy crops, household and industrial waste)
Simple to operate and maintain
Widely available fuel and spare parts
Suitable for almost any sunny location
Low operating costs
Well-understood technology
Low operating costs
Low operating costs
Use diesel or other liquid fuels (e.g., biodiesel)
Combination of diesel engine and electrical generator (alternator)
Convert the kinetic energy of wind into electric energy
Require wind speeds of 4–5m/s to be viable
Harness force or energy from running water to generate power
Typically run-of-river but some-times with a reservoir
Use solar cells to convert sunlight into electricity
Can be mounted on rooftops as solar home systems or as larger arrays
Generally considered mature/
well-understood technology
Still considered "technologies in learning"
Although fairly standard systems, technology has relatively high capital costs
Power generation can be intermittent
Systems have broad range of capital costs linked to nature of project site
For run-of-river sites, power generation can fluctuate, depending on precipitation
Still considered "technologies in learning"
Although fairly standard systems, technology has relatively high capital costs
Power generation can be intermittent
Raw material supply chains can be complex
Biomass supply may be seasonal, and fluctuations affect operating costs
Not a renewable energy resource
Linked to the price of oil so costs can be highly volatile
Fuel supply logistics can add to costs in remote areas
76HOW COMPANIES ARE SERVING THE MARKET
Decentralized power systems usually offer a signifi cant jump up the energy ladder31 from household-level devices and solar home systems because they allow AC (alternating current) appliances to operate. Mini-utilities do not always result in customers accessing comprehensive electricity services—in many cases they are initially only used for lighting because end users simply cannot afford more than this. Sometimes they provide unpredictable power, for instance, when there are diesel fuel shortages, when rivers run dry during parts of the year in hydro systems, or when poor maintenance results in outages. In addition, mini-utilities generally do not address thermal energy needs such as cooking or heating. However, what is important is that they do provide the option of more than just lighting, affording a much broader set of energy services, including the “productive” use of energy beyond the home, such as for running machinery, manufacturing, or service activities. This, in turn, can support income generation and economic development.
Mini-utility business models can be complex, requiring site planning and installation, institutional setup and governance, fi nancing and technical services, and maintenance. Some mini-grids are fairly straightforward, comprising a small generator and some wires, and run next to the demand center. Others, particularly those based on renewable energy, need signifi cant resource measurement and site planning before they can be (sensibly) built. Many need fuel supply chains, whether for diesel or biomass. Mini-grids also clearly need much more investment than household-level solutions (devices and solar home systems); they can cost from tens of thousands of dollars for a small diesel/biomass plant to the low hundreds of thousands for a hydro system, excluding the cost of power distribution infrastructure and meters. This needs to be recouped over a longer time frame and, ideally, from different customer categories. But the nature of the technology also means that a good operator must effectively source and manage the fuel used, or in the case of renewable energy, fully understand the resource potential, to generate power cost-effectively. Given that they are suppliers of electricity, mini-utilities are also often regulated, much like their larger counterparts.
Mini-utilities have sprung up around the developing world, from Cambodia and India to Bolivia, Brazil, Colombia, and Peru, across the Philippines, and in many parts of Mali and Nigeria, selling power to a mix of well-off and poorer customers. In Cambodia, for example, 42 percent of electrifi ed households outside the capital city of Phnom Penh are served by decentralized mini-grid systems. In Bangladesh, India, and the Philippines, entrepreneurs are supplying power in a similar manner. In Nigeria, it is not uncommon for operators to effi ciently serve sizable urban pockets that would otherwise resort to running expensive individual diesel generators as a backup to unreliable grid supply. In Colombia and Mali, privately owned and operated systems are central to the governments’ electrifi cation strategy for rural and remote areas, and in Rwanda, one entrepreneur has created a profi table mini-utility from an abandoned donor-fi nanced plan. It is in these locations, where grid electricity does not reach people who are willing to pay for electricity, given what they already spend on kerosene, that mini-utilities become viable.
There are also many examples of community-run mini-grids in countries such as Brazil and Nepal. Community-based power producers may be a good substitute to profi t-making entrepreneurs in some areas, especially for very small villages (see box 3.6). However, this report focuses on companies that seek a commercial return on investment and are either profi table or potentially profi table. Hence, ventures with a purely or largely social mandate fall outside its scope.
CHAPTER 377
It is important to distinguish between fi rms that follow a fully (or mostly) commercial model, and mostly donor-funded community power producers and village cooperatives. There are notable exceptions, but most often community-based systems are diffi cult to grow, or prove unsustainable, often due to complicated local, institutional, and governance arrangements and associated incentives. A World Bank surveya of small power providers found that most systems in Bangladesh and Cambodia are privately run, and are profi table. In contrast, most mini-grids in Kenya were community run, but were less fi nancially sustainable. The survey also included a group of 10 community-based hydro-powered mini-grids in the Philippines, which were unable to cover their operating costs and had an average negative gross operating margin of 17 percent.
Despite this, some community-based systems have reached an impressive scale, such as Creluz in Brazil. Started in 1966, this cooperative procures power from the grid but has also added 4 MW of run-of-river hydropower to the local network, manages
4,500 kilometers of power lines supplying power to 80,000 customers in 36 municipal areas and to rural communities, and had a turnover of $12.8 million in 2009. Another large-scale example is the United Nations Development Programme’s (UNDP’s) multifunctional platforms in Burkina Faso, Mali, and Senegal, in which almost 2,000 micro diesel generators have been installed. This initiative has facilitated productive, income-generating activities for thousands of local women with the added benefi t of extension for household electrifi cation in some cases.
Others are small scale (such as the Intermediate Technology Development Group/UNDP/Ministry of Energy pico-hydrob system in Kenya), but have been instrumental in demonstrating the value of off-grid approaches and have good replication potential. IBEKA (the People Centered Economic and Business Institute) in Indonesia, too, has been in existence for 20 years and brought power to nearly 40 communities using a cooperative model.
Box 3.6 Community-based systems have a role to play
Note: a. Kariuki, Mukami, and Schwartz 2005. b. Pico hydro is a term used for hydroelectric power generation of less than 5 kW.
While the potential market is much smaller than that for household-level devices, due to higher capital costs and population density requirements, at least32 30 million households could be served profi tably by mini-utilities, representing a market of up to $4 billion dollars. As shown in fi gure 3.13, the levelized cost of electricity generation varies by technology and location, but ranges from about $0.20/kWh for a biomass gasifer or micro-hydro33 plant to US$0.30/kWh for a small-scale wind or solar PV plant to $0.40/kWh for a diesel generator. At an estimated cost to the end user of $8 to $9 a month for basic “lighting plus” services, this is signifi cantly higher than the device alternative. In addition, only a small fraction (the exact share is unknown) of the addressable market lives in villages or close enough to densely populated areas to be connected to a mini-grid. As discussed in Chapter 2, however, if technology costs declined or capital costs were subsidized, the market size would be much larger.
Many “single system” mini-utilities are operating profi tably where the load is such that effi ciently sized systems can be installed, where incomes are suffi cient for customers to pay rates that allow companies to make a return on investment, and where the regulatory environment is conducive to doing business. Numerous entrepreneurs are running plants that are cash-fl ow positive without any public sector fi nancial or other preferential support. They report operating profi ts of 10 to 30 percent, and returns on equity of 20 to 25 percent.34 Most mini-utilities are simply doing business on their own.
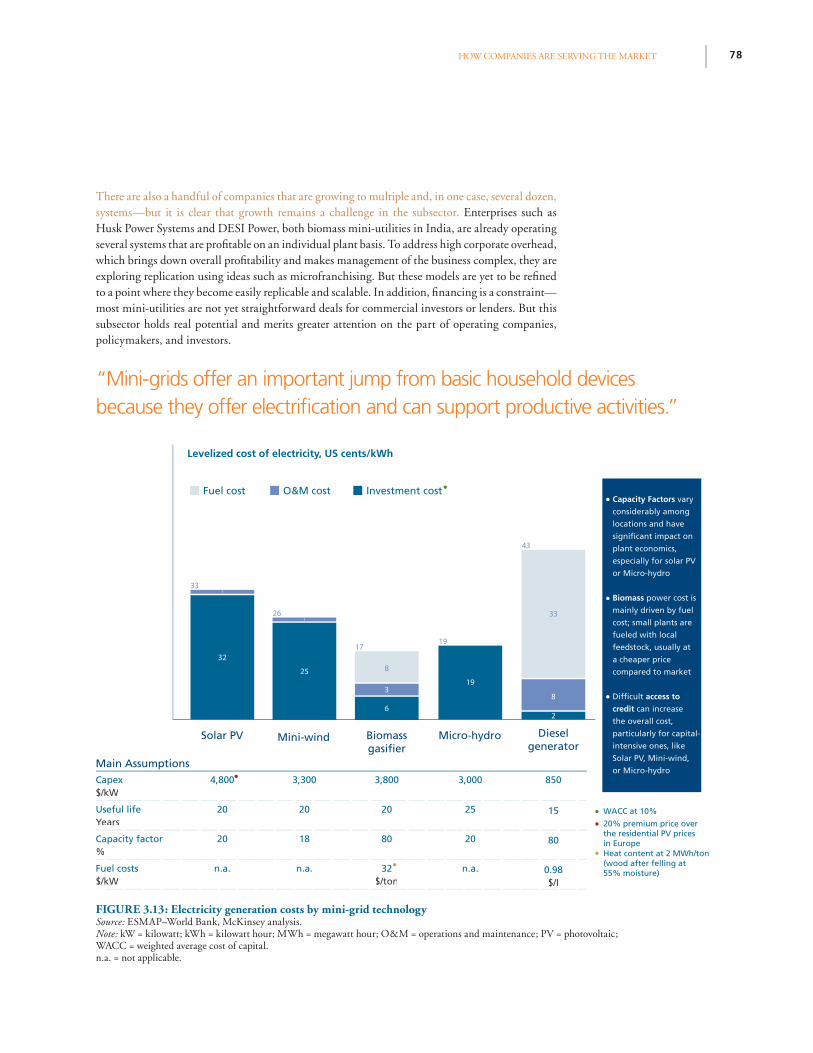
78HOW COMPANIES ARE SERVING THE MARKET
“Mini-grids offer an important jump from basic household devices because they offer electrifi cation and can support productive activities.”
Solar PV Mini-wind Biomass Micro-hydro
4,800 3,300 3,800 3,000 850
Levelized cost of electricity, US cents/kWh
20 20 20 25
20 80 20 80
n.a. n.a. 32 n.a. 0.98
68
19
2
32
25 8
33
43
1917
26
33
3
1
1
Capacity Factors
or Micro-hydro
Biomass
access to
credit
Solar PV, Mini-wind,
or Micro-hydro
FIGURE 3.13: Electricity generation costs by mini-grid technologySource: ESMAP–World Bank, McKinsey analysis.Note: kW = kilowatt; kWh = kilowatt hour; MWh = megawatt hour; O&M = operations and maintenance; PV = photovoltaic; WACC = weighted average cost of capital.n.a. = not applicable.
There are also a handful of companies that are growing to multiple and, in one case, several dozen, systems—but it is clear that growth remains a challenge in the subsector. Enterprises such as Husk Power Systems and DESI Power, both biomass mini-utilities in India, are already operating several systems that are profi table on an individual plant basis. To address high corporate overhead, which brings down overall profi tability and makes management of the business complex, they are exploring replication using ideas such as microfranchising. But these models are yet to be refi ned to a point where they become easily replicable and scalable. In addition, fi nancing is a constraint—most mini-utilities are not yet straightforward deals for commercial investors or lenders. But this subsector holds real potential and merits greater attention on the part of operating companies, policymakers, and investors.
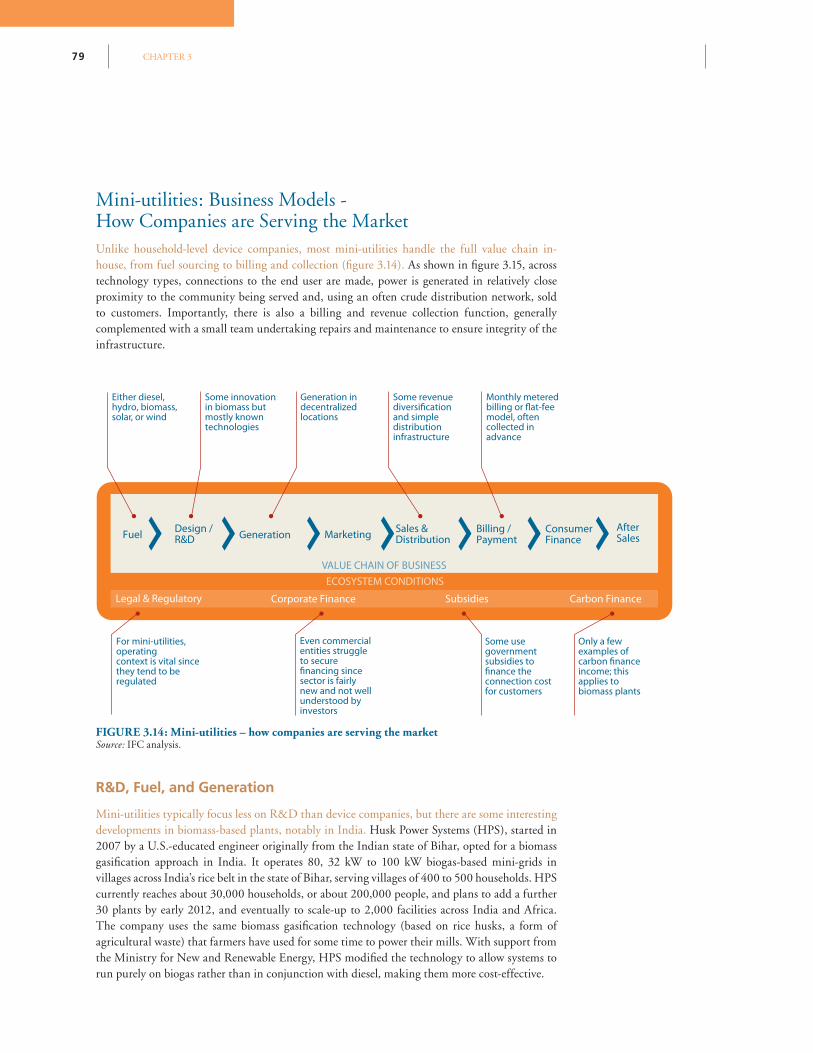
CHAPTER 379
Fuel Design /R&D Generation Marketing Sales &
DistributionBilling / Payment
After Sales
ECOSYSTEM CONDITIONS
Corporate Finance Carbon Finance
ConsumerFinance
Subsidies
VALUE CHAIN OF BUSINESS
Legal & Regulatory
Some use government subsidies to finance the connection cost for customers
Only a few examples of carbon finance income; this applies to biomass plants
Even commercial entities struggle to secure financing since sector is fairly new and not well understood by investors
For mini-utilities, operating context is vital since they tend to be regulated
Some innovation in biomass but mostly known technologies
Generation in decentralized locations
Monthly metered billing or flat-fee model, often collected in advance
Either diesel, hydro, biomass, solar, or wind
Some revenue diversification and simple distribution infrastructure
Mini-utilities: Business Models -How Companies are Serving the MarketUnlike household-level device companies, most mini-utilities handle the full value chain in-house, from fuel sourcing to billing and collection (fi gure 3.14). As shown in fi gure 3.15, across technology types, connections to the end user are made, power is generated in relatively close proximity to the community being served and, using an often crude distribution network, sold to customers. Importantly, there is also a billing and revenue collection function, generally complemented with a small team undertaking repairs and maintenance to ensure integrity of the infrastructure.
R&D, Fuel, and Generation
Mini-utilities typically focus less on R&D than device companies, but there are some interesting developments in biomass-based plants, notably in India. Husk Power Systems (HPS), started in 2007 by a U.S.-educated engineer originally from the Indian state of Bihar, opted for a biomass gasifi cation approach in India. It operates 80, 32 kW to 100 kW biogas-based mini-grids in villages across India’s rice belt in the state of Bihar, serving villages of 400 to 500 households. HPS currently reaches about 30,000 households, or about 200,000 people, and plans to add a further 30 plants by early 2012, and eventually to scale-up to 2,000 facilities across India and Africa. The company uses the same biomass gasifi cation technology (based on rice husks, a form of agricultural waste) that farmers have used for some time to power their mills. With support from the Ministry for New and Renewable Energy, HPS modifi ed the technology to allow systems to run purely on biogas rather than in conjunction with diesel, making them more cost-effective.
FIGURE 3.14: Mini-utilities – how companies are serving the marketSource: IFC analysis.
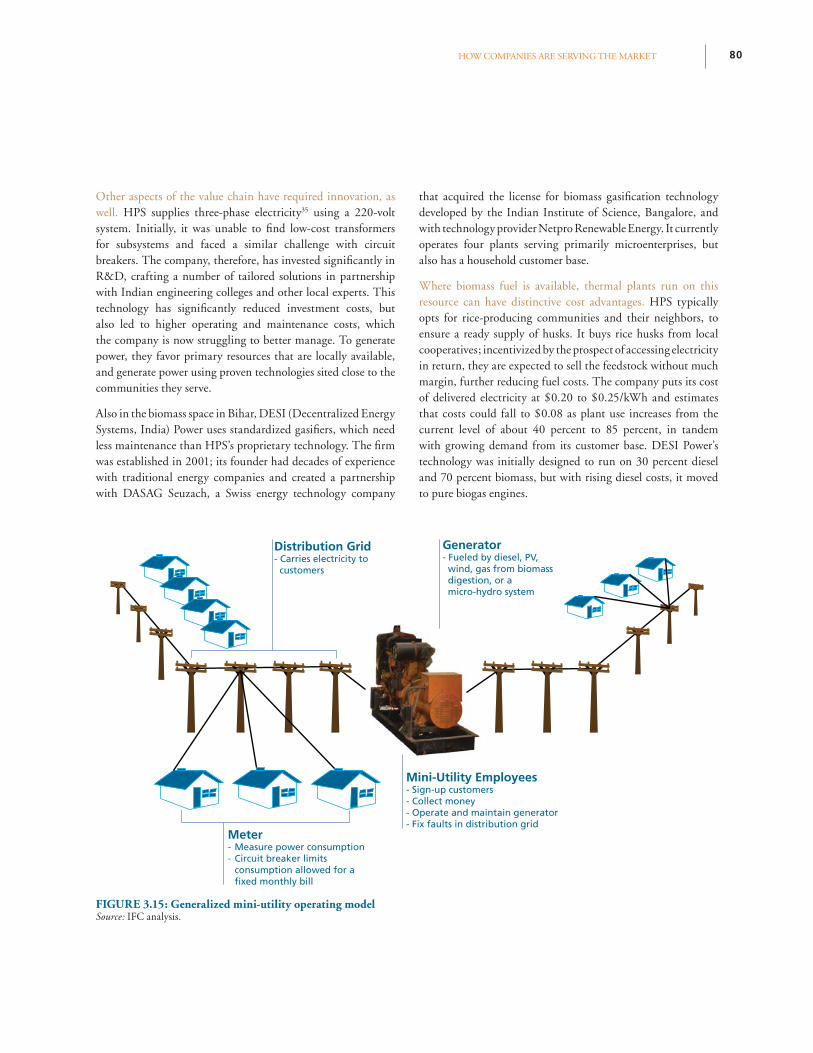
80HOW COMPANIES ARE SERVING THE MARKET
Other aspects of the value chain have required innovation, as well. HPS supplies three-phase electricity35 using a 220-volt system. Initially, it was unable to fi nd low-cost transformers for subsystems and faced a similar challenge with circuit breakers. The company, therefore, has invested signifi cantly in R&D, crafting a number of tailored solutions in partnership with Indian engineering colleges and other local experts. This technology has signifi cantly reduced investment costs, but also led to higher operating and maintenance costs, which the company is now struggling to better manage. To generate power, they favor primary resources that are locally available, and generate power using proven technologies sited close to the communities they serve.
Also in the biomass space in Bihar, DESI (Decentralized Energy Systems, India) Power uses standardized gasifi ers, which need less maintenance than HPS’s proprietary technology. The fi rm was established in 2001; its founder had decades of experience with traditional energy companies and created a partnership with DASAG Seuzach, a Swiss energy technology company
that acquired the license for biomass gasifi cation technology developed by the Indian Institute of Science, Bangalore, and with technology provider Netpro Renewable Energy. It currently operates four plants serving primarily microenterprises, but also has a household customer base.
Where biomass fuel is available, thermal plants run on this resource can have distinctive cost advantages. HPS typically opts for rice-producing communities and their neighbors, to ensure a ready supply of husks. It buys rice husks from local cooperatives; incentivized by the prospect of accessing electricity in return, they are expected to sell the feedstock without much margin, further reducing fuel costs. The company puts its cost of delivered electricity at $0.20 to $0.25/kWh and estimates that costs could fall to $0.08 as plant use increases from the current level of about 40 percent to 85 percent, in tandem with growing demand from its customer base. DESI Power’s technology was initially designed to run on 30 percent diesel and 70 percent biomass, but with rising diesel costs, it moved to pure biogas engines.
Generator- Fueled by diesel, PV, wind, gas from biomass digestion, or a micro-hydro system
Distribution Grid- Carries electricity to customers
Meter- Measure power consumption - Circuit breaker limits
consumption allowed for a fixed monthly bill
Mini-Utility Employees- Sign-up customers- Collect money- Operate and maintain generator- Fix faults in distribution grid
FIGURE 3.15: Generalized mini-utility operating modelSource: IFC analysis.
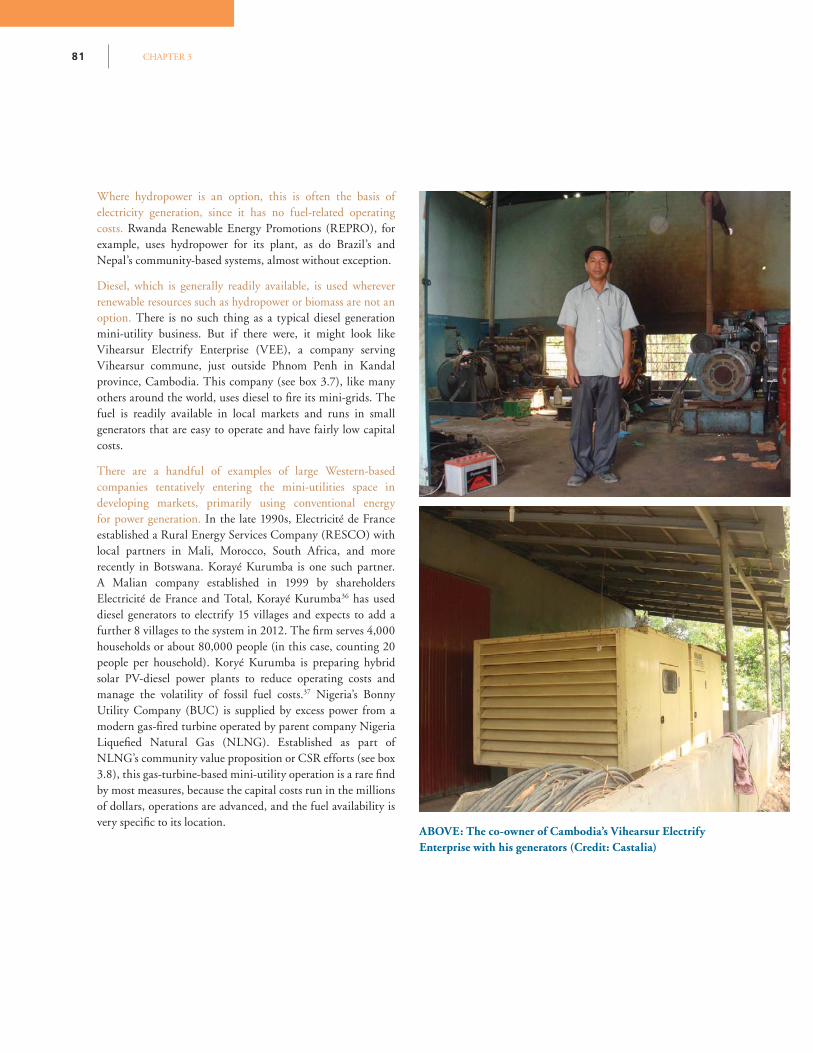
CHAPTER 381
Where hydropower is an option, this is often the basis of electricity generation, since it has no fuel-related operating costs. Rwanda Renewable Energy Promotions (REPRO), for example, uses hydropower for its plant, as do Brazil’s and Nepal’s community-based systems, almost without exception.
Diesel, which is generally readily available, is used wherever renewable resources such as hydropower or biomass are not an option. There is no such thing as a typical diesel generation mini-utility business. But if there were, it might look like Vihearsur Electrify Enterprise (VEE), a company serving Vihearsur commune, just outside Phnom Penh in Kandal province, Cambodia. This company (see box 3.7), like many others around the world, uses diesel to fi re its mini-grids. The fuel is readily available in local markets and runs in small generators that are easy to operate and have fairly low capital costs.
There are a handful of examples of large Western-based companies tentatively entering the mini-utilities space in developing markets, primarily using conventional energy for power generation. In the late 1990s, Electricité de France established a Rural Energy Services Company (RESCO) with local partners in Mali, Morocco, South Africa, and more recently in Botswana. Korayé Kurumba is one such partner. A Malian company established in 1999 by shareholders Electricité de France and Total, Korayé Kurumba36 has used diesel generators to electrify 15 villages and expects to add a further 8 villages to the system in 2012. The fi rm serves 4,000 households or about 80,000 people (in this case, counting 20 people per household). Koryé Kurumba is preparing hybrid solar PV-diesel power plants to reduce operating costs and manage the volatility of fossil fuel costs.37 Nigeria’s Bonny Utility Company (BUC) is supplied by excess power from a modern gas-fi red turbine operated by parent company Nigeria Liquefi ed Natural Gas (NLNG). Established as part of NLNG’s community value proposition or CSR efforts (see box 3.8), this gas-turbine-based mini-utility operation is a rare fi nd by most measures, because the capital costs run in the millions of dollars, operations are advanced, and the fuel availability is very specifi c to its location.
ABOVE: The co-owner of Cambodia’s Vihearsur Electrify Enterprise with his generators (Credit: Castalia)
82HOW COMPANIES ARE SERVING THE MARKET
Vihearsur Electrify Enterprise (VEE) was established in 2007 with $50,000. The partners knew about generating power from running an ice-making business with its own generator. They had seen mini-utilities operating in other towns in Cambodia and realized that such a business was relatively simple to run and could offer steady, reliable revenue. The company has expanded to supply power to 1,760 customers, 24 hours a day. The company plans to add another 2,000 customers over the next two years.
VEE’s customers pay around $8.44 for about 13 kWh of power per month. To put the cost in perspective, households that are not connected to a mini-utility may face monthly charges of $20 to $50 a month. Kerosene for lighting could cost $3.50 to $4.00; dry cell batteries and car batteries cost $5 to $7 for light only and $10 to $12 for light plus a small black and white TV. Cell phone charging can cost $3 to $5 per month. Solar home systems or individual household generators cost $30 to $50 per month in this village. Average income levels among VEEs customers are $400 per month per household, or $13 per day per household.
Like most mini-utilities in Cambodia, VEE uses a monthly billing system. Users pay for metered use at the end of the month. There is a charge of $50 for new connections. However, VEE will fi nance 50 percent of the connection charge for one year at zero interest and offers $10 to help pay for household wiring. In addition to price, key value propositions include the fact that villagers want to watch TV, that students can study at night, and that private schools can operate at night. Small businesses use power to operate a range of machinery.
Total investment in the business is now $250,000. Of this, $60,000 is funded with loans from commercial banks (ACLEDA Bank, a local commercial bank loaned $50,000, with a four-year tenor and a 13 percent interest rate; and ANZ Royal Bank loaned $10,000 with a two-year tenor and a 12 percent interest rate per year). The Rural Electrifi cation Fund provided $45,000 in grants; this is in the form of a $45 connection subsidy paying for 1,000 new connections. The remaining $145,000 is the shareholders’ equity investment.
The company sells 270,540 kWh per year at an average rate of $0.65 per kWh, for annual revenue of $175,848. After expenses, including interest, the company’s profi t is $40,956, a return on equity of around 28 percent. To strip out the effect of the subsidy, it can be assumed that the $45,000 in grant funding had instead been borrowed on commercial terms at 12 percent interest. Interest costs for the year would have been $5,400 higher than they actually were, reducing net profi t to $35,556, for a 25 percent return.
Box 3.7 Vihearsur Electrify Enterprise, Cambodia
CHAPTER 383
The Bonny Utility Company (BUC), a mini-utility operating on Bonny Island in Nigeria, is remarkable in that it is a CSR initiative that is transitioning into a fi nancially sustainable operation.
Taking advantage of a government decree allowing private power generation and distribution, Nigeria Liquefi ed Natural Gas (NLNG) signed a memorandum of understanding with the local community and negotiated a contractual agreement to supply power on the island. In the same spirit, the business is run under an inclusive governance structure bringing together the oil industry, local leaders and representatives, and government offi cials. BUC offers customers a progressive tariff schedule comprising six levels; there is a free basic allowance followed by increasing energy charges as a function of consumption. As a result, customers—who range from low-income households to larger service sector businesses—receive an indirect subsidy of from zero to 70 percent.
Contrary to market practice in many parts of the world, low-consumption users are subsidized by heavy consumers, and not the reverse. The utility uses prepayment metering and cash-free transactions to collect revenues. Customers—including businesses—pay their bill in advance at one of several bank branches in the vicinity, based on an estimated consumption for the month ahead. Proof of payment need not be presented to BUC’s front offi ce, since end users receive a 20-digit token directly from the bank teller, which is inserted into the meter. A central system allows BUC to track usage and alerts operators of any irregularities, and each connection is checked twice a year. A back-up meter can check whether customers have attempted to bypass the system. Nonpayments and irregular payments are estimated at 1.3 percent.
Currently, BUC serves 9,300 customers (corresponding to about 75,000 people), essentially covering the entire island via its 50 kilometers of distribution network. Approximately 40 percent of the company’s customers enjoy free service without buying credits, a further 40 percent are small residential customers paying up to $6.50 per month, and the remaining 20 percent are commercial customers, who account for 70 percent of sales owing to their higher tariff levels. The mini-utility earns an estimated monthly revenue of $37,000. In 2010, the company’s annual revenues were $500,000, but they are projected to increase to $1.9 million by 2015.
A total of $6.5 million has been invested in modern facilities, with connection costs of about $760 being a major cost driver. This investment has provided fi ve years of disturbance-free operation for NLNG. There has been high local development impact, with per capita electricity consumption increasing
from under 250 kWh per year to 960 kWh per year, a power availability of over 98 percent, and nearly 200 full-time jobs created.
BUC has had to overcome several stumbling blocks on the road to success, notably initially not consulting with or involving the community in its design or otherwise giving them a sense of participation and ownership, tolerating low levels of professional management, and miscalculating both pricing and demand. Lessons learned include:
1. Declare the venture part of the mother company’s core business
• Ensure that there is a champion of the project within top management of the company; do not leave design of strategic projects in the CSR department.
• Ensure that there is adequate organizational support and that other areas of the business are leveraged where appropriate, for example, in gaining access to logistics teams and in securing fuel supplies for the system.
• Link community development to company management and operational targets so that projects achieve both fi nancial and broader development objectives.
2. Plan to be in the game for the long term
• Bring stakeholders along, even if they risk initially slowing project implementation. Rather than rush the process, ensure that project lead times are long enough to accommodate it.
• As part of a “shared social contract,” develop a sense of ownership among stakeholders, build commitment to ensuring their continued involvement over time, and develop roles to help ensure that involvement.
3. Make clear agreements
• Avoid ambiguous deliverables. List both what the business venture will do and what is excluded. For instance, it will provide electricity but not cooking fuels.
• Do not cluster projects. Be explicit about individual project components, what their objectives are, and how and when they will each deliver against specifi c milestones.
• Defi ne a clear exit strategy. At what point and under what conditions and to whom will the mother company spin off the venture? What are the post-handover activities that must be undertaken to maintain the operational integrity, fi nancial viability, and social and environmental sustainability of the business?
• Keep all communications formal and in writing.
BOX 3.8:Bonny Utility Company, Nigeria
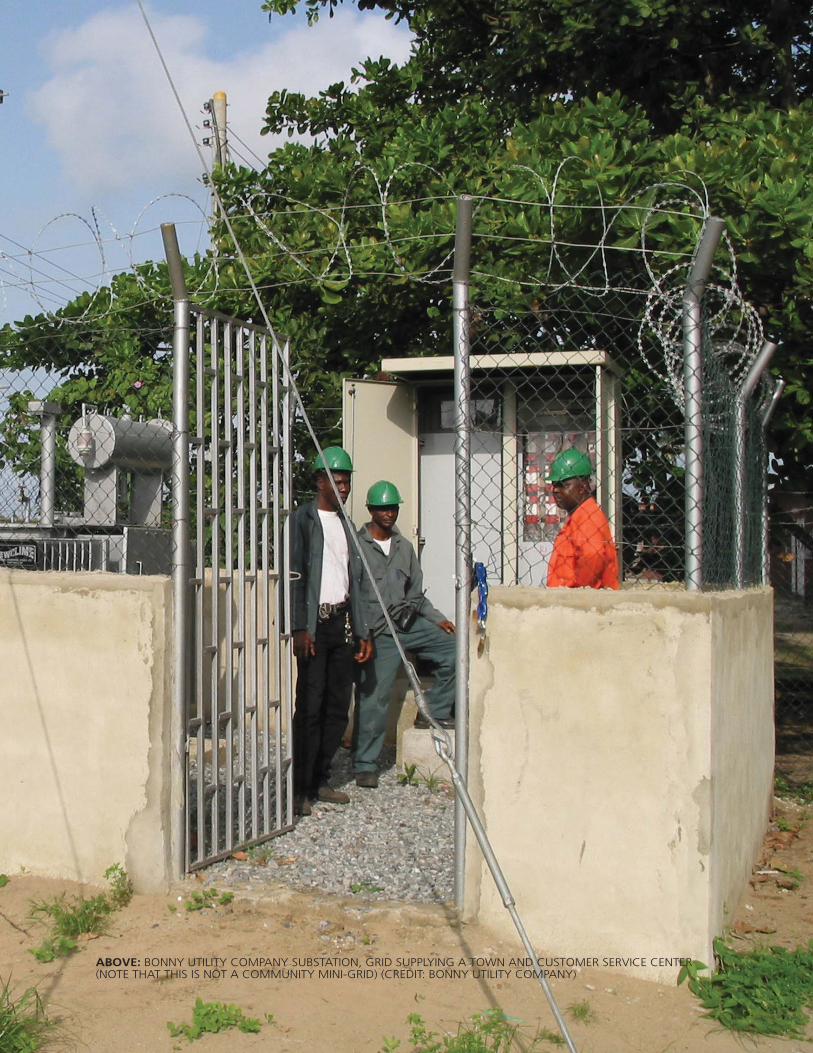
84HOW COMPANIES ARE SERVING THE MARKET
ABOVE: BONNY UTILITY COMPANY SUBSTATION, GRID SUPPLYING A TOWN AND CUSTOMER SERVICE CENTER (NOTE THAT THIS IS NOT A COMMUNITY MINI-GRID) (CREDIT: BONNY UTILITY COMPANY)
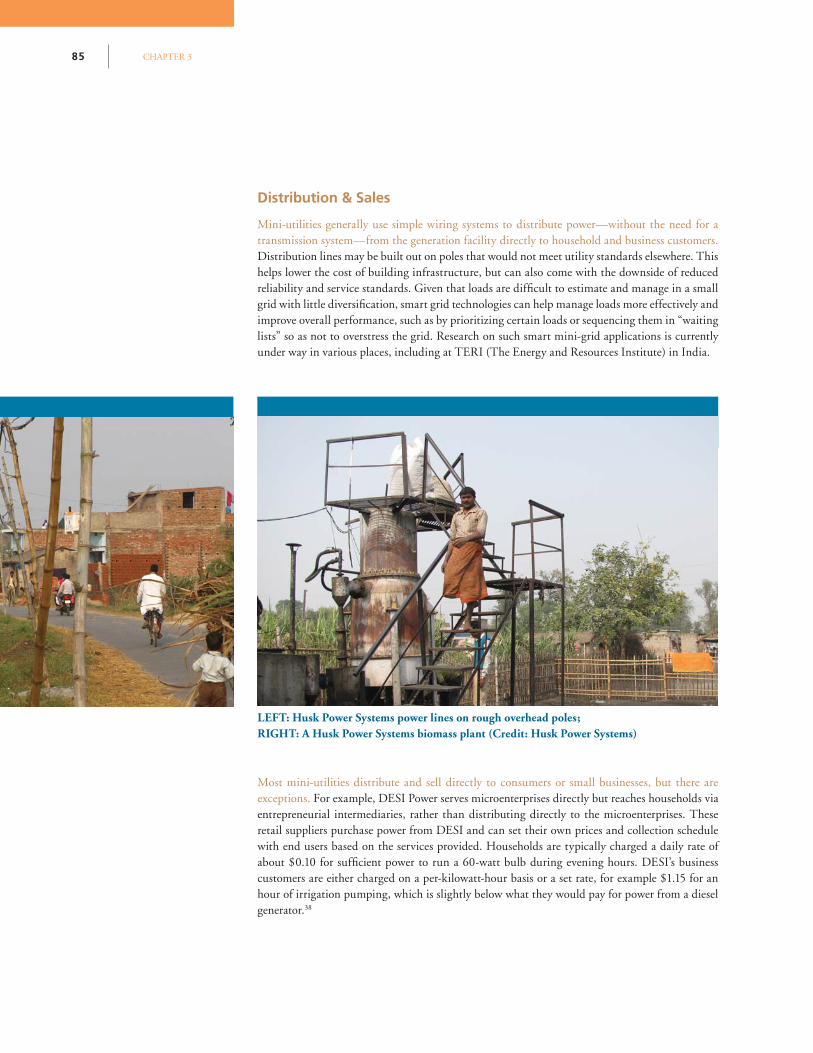
CHAPTER 385
Distribution & Sales
Mini-utilities generally use simple wiring systems to distribute power—without the need for a transmission system—from the generation facility directly to household and business customers. Distribution lines may be built out on poles that would not meet utility standards elsewhere. This helps lower the cost of building infrastructure, but can also come with the downside of reduced reliability and service standards. Given that loads are diffi cult to estimate and manage in a small grid with little diversifi cation, smart grid technologies can help manage loads more effectively and improve overall performance, such as by prioritizing certain loads or sequencing them in “waiting lists” so as not to overstress the grid. Research on such smart mini-grid applications is currently under way in various places, including at TERI (The Energy and Resources Institute) in India.
Most mini-utilities distribute and sell directly to consumers or small businesses, but there are exceptions. For example, DESI Power serves microenterprises directly but reaches households via entrepreneurial intermediaries, rather than distributing directly to the microenterprises. These retail suppliers purchase power from DESI and can set their own prices and collection schedule with end users based on the services provided. Households are typically charged a daily rate of about $0.10 for suffi cient power to run a 60-watt bulb during evening hours. DESI’s business customers are either charged on a per-kilowatt-hour basis or a set rate, for example $1.15 for an hour of irrigation pumping, which is slightly below what they would pay for power from a diesel generator.38
LEFT: Husk Power Systems power lines on rough overhead poles;RIGHT: A Husk Power Systems biomass plant (Credit: Husk Power Systems)
86HOW COMPANIES ARE SERVING THE MARKET
Mini-utilities need to recover fi xed costs and achieve an acceptable rate of return, which makes it critical to ensure that customers purchase suffi cient volumes of power. Poor customers can typically only afford a small number of appliances and therefore have limited electricity consumption, so mini-utility companies use a range of strategies to achieve requisite sales volumes to make their businesses viable. Philippines-based Power Source, for example, has an innovative approach that it calls a “Community Energizer Platform.” This is a modular system in which one container holds a generator while others house electric-powered equipment that can be valuable to the community, such as water purifi cation systems, communications (cell phones, computer, Internet, fax), refrigeration, ice-making, and entertainment (a movie theatre and small video game parlor). These modules both supply power to the community with limited distribution infrastructure, and create the demand for that power by offering services that require electricity, and are considered to be important for individuals or groups within that community.
Other mini-utilities have bolstered income by developing a more diversifi ed revenue base. REPRO, for example, supplements household billing income by feeding surplus power back to Rwanda’s national utility. BUC in Nigeria has instituted one of the more sophisticated revenue models by securing contracts with “anchor” commercial clients to help subsidize less profi table poorer customers. The benefi t of anchor clients is that they assure demand for the power generated, allowing for better planning and growth. With larger customers providing the backbone of its income, BUC is able to slash tariffs for low-consumption customers, many of whom pay little or nothing thanks to its multitiered tariff system. HPS is diversifying its current business beyond households to serve SME clients and, beyond power, is beginning to sell rice husk char39 and to tap carbon payments, the latter of which is estimated to contribute about 5 percent of revenues today, but which could account for as much as 50 percent of total sales by 2014.
Billing & Collection
Where ensuring that customers in extremely poor areas pay for the electricity that they consume is a challenge, mini-utilities are innovating in how they bill and collect revenues, with good results. Given the value of electricity to customers, most companies do not face major issues in collecting revenues. Indeed, companies report that developing a close relationship with the community is an important element of their business. Nonetheless, billing and collection approaches are being designed with the BOP in mind.
For example, HPS started with a fi xed price model that enabled each household to run two 15-watt compact fl orescent lights plus charge their mobile phones for 50 rupees, or about $1 per month. In time, HPS adjusted its pricing model to refl ect increasing fuel costs and to help optimize technical systems by requiring that each household sign up for two 45-watt connections. The approach allows each HPS mini-grid to be sized at 30 kW and, operating at 50 percent capacity, to serve about 1,000 to 1,050 connections, which is the average size of its target communities. Customers must also pay a connection cost of 100 rupees (about $2) to take the distribution network to their homes, and purchase the light bulbs that they use. The unit cost to the end user is about $0.25 per kWh. A 1,000-watt package is also available for customers with greater needs, and is priced at a signifi cantly lower rate of $0.17 per kWh.
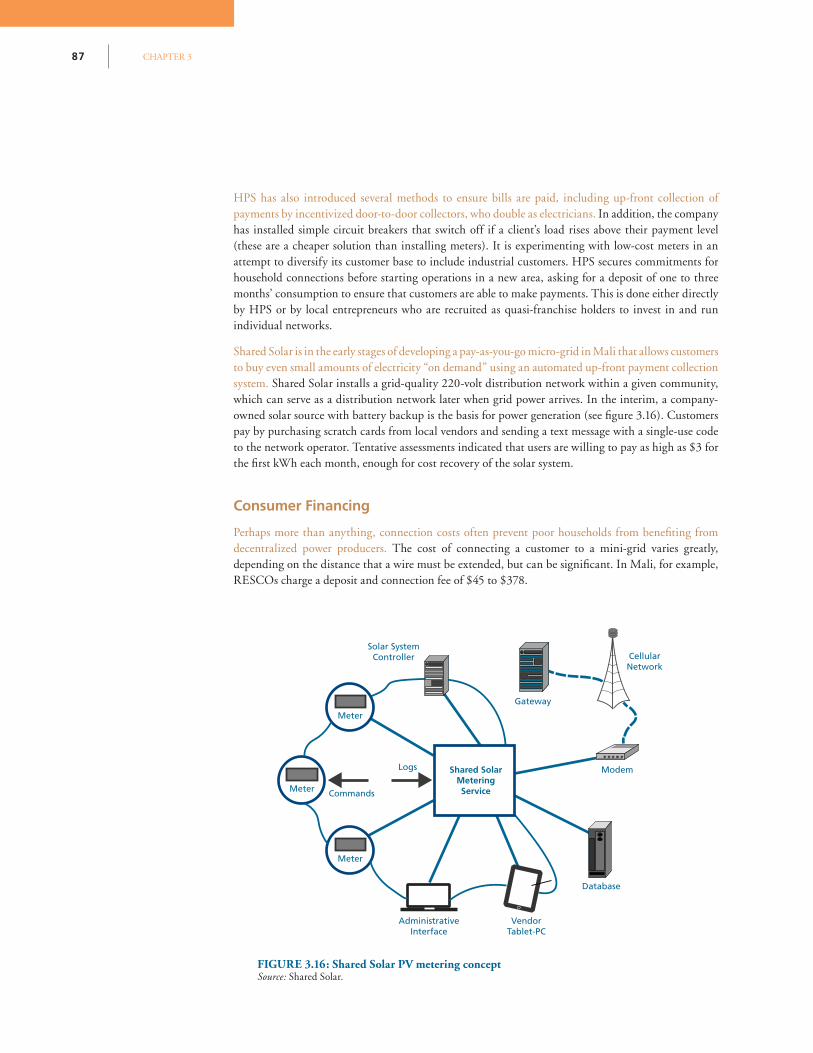
CHAPTER 387
HPS has also introduced several methods to ensure bills are paid, including up-front collection of payments by incentivized door-to-door collectors, who double as electricians. In addition, the company has installed simple circuit breakers that switch off if a client’s load rises above their payment level (these are a cheaper solution than installing meters). It is experimenting with low-cost meters in an attempt to diversify its customer base to include industrial customers. HPS secures commitments for household connections before starting operations in a new area, asking for a deposit of one to three months’ consumption to ensure that customers are able to make payments. This is done either directly by HPS or by local entrepreneurs who are recruited as quasi-franchise holders to invest in and run individual networks.
Shared Solar is in the early stages of developing a pay-as-you-go micro-grid in Mali that allows customers to buy even small amounts of electricity “on demand” using an automated up-front payment collection system. Shared Solar installs a grid-quality 220-volt distribution network within a given community, which can serve as a distribution network later when grid power arrives. In the interim, a company-owned solar source with battery backup is the basis for power generation (see fi gure 3.16). Customers pay by purchasing scratch cards from local vendors and sending a text message with a single-use code to the network operator. Tentative assessments indicated that users are willing to pay as high as $3 for the fi rst kWh each month, enough for cost recovery of the solar system.
Consumer Financing
Perhaps more than anything, connection costs often prevent poor households from benefi ting from decentralized power producers. The cost of connecting a customer to a mini-grid varies greatly, depending on the distance that a wire must be extended, but can be signifi cant. In Mali, for example, RESCOs charge a deposit and connection fee of $45 to $378.
Shared SolarMetering Service
Logs
Meter
Commands
Meter
Administrative Interface
Vendor Tablet-PC
Database
Modem
Gateway
Cellular Network
Solar SystemController
Meter
FIGURE 3.16: Shared Solar PV metering conceptSource: Shared Solar.
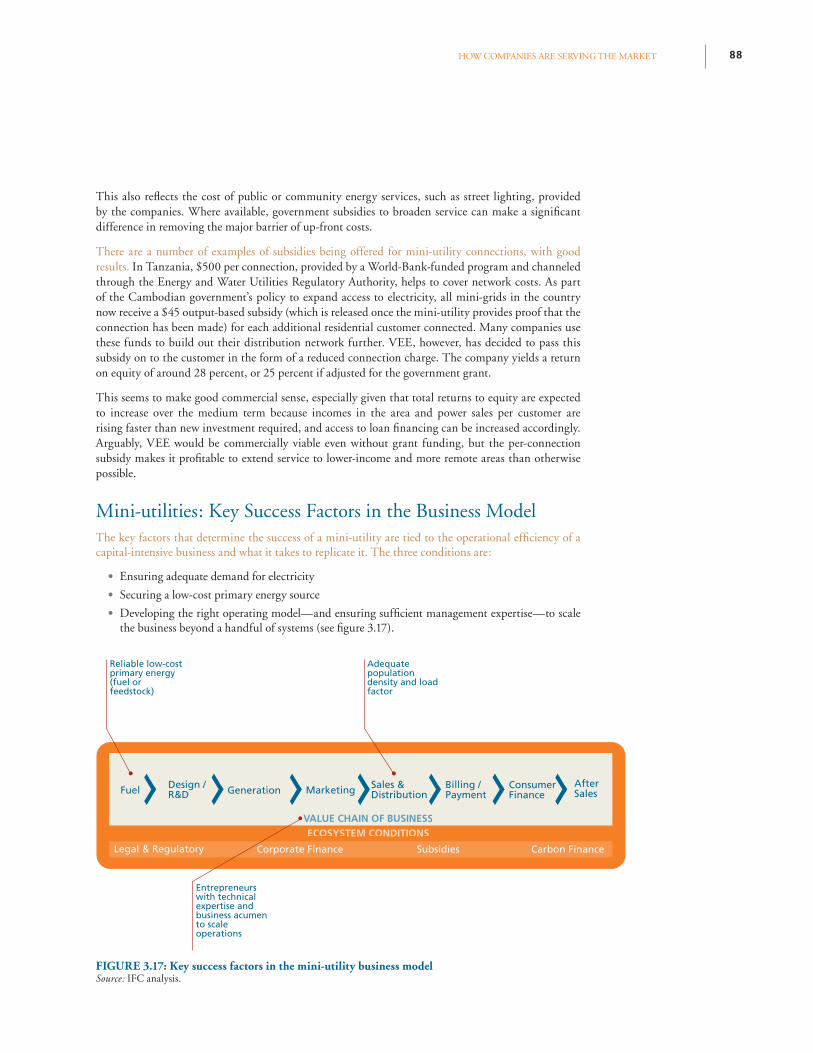
88HOW COMPANIES ARE SERVING THE MARKET
Fuel Design /R&D Generation Marketing Sales &
DistributionBilling / Payment
After Sales
ECOSYSTEM CONDITIONS
Corporate Finance Carbon Finance
ConsumerFinance
Subsidies
VALUE CHAIN OF BUSINESS
Legal & Regulatory
Reliable low-cost Adequate population density and load factor
Entrepreneurs with technical expertise and business acumen to scale operations
primary energy (fuel or feedstock)
Mini-utilities: Key Success Factors in the Business ModelThe key factors that determine the success of a mini-utility are tied to the operational effi ciency of a capital-intensive business and what it takes to replicate it. The three conditions are:
• Ensuring adequate demand for electricity
• Securing a low-cost primary energy source
• Developing the right operating model—and ensuring suffi cient management expertise—to scale the business beyond a handful of systems (see fi gure 3.17).
This also refl ects the cost of public or community energy services, such as street lighting, provided by the companies. Where available, government subsidies to broaden service can make a signifi cant difference in removing the major barrier of up-front costs.
There are a number of examples of subsidies being offered for mini-utility connections, with good results. In Tanzania, $500 per connection, provided by a World-Bank-funded program and channeled through the Energy and Water Utilities Regulatory Authority, helps to cover network costs. As part of the Cambodian government’s policy to expand access to electricity, all mini-grids in the country now receive a $45 output-based subsidy (which is released once the mini-utility provides proof that the connection has been made) for each additional residential customer connected. Many companies use these funds to build out their distribution network further. VEE, however, has decided to pass this subsidy on to the customer in the form of a reduced connection charge. The company yields a return on equity of around 28 percent, or 25 percent if adjusted for the government grant.
This seems to make good commercial sense, especially given that total returns to equity are expected to increase over the medium term because incomes in the area and power sales per customer are rising faster than new investment required, and access to loan fi nancing can be increased accordingly. Arguably, VEE would be commercially viable even without grant funding, but the per-connection subsidy makes it profi table to extend service to lower-income and more remote areas than otherwise possible.
FIGURE 3.17: Key success factors in the mini-utility business modelSource: IFC analysis.
CHAPTER 389
Ensuring adequate demand for electricity
Where there is high electricity demand in a tight geographic area, a standard grid-based system can likely supply power at a lower cost than any other energy service model. Similarly, mini-utilities work best when communities are too remote to connect to the grid, but have high population density. If customers are located far from each other, or when usage per customer is low, the cost per kilowatt per hour from a mini-utility increases. Suffi cient population density is therefore a key determinant when deciding among energy options. Where communities that are far from the grid have a high population density, they may be most economically served by mini-utilities.40 As the distance between houses increases, however, solar home systems become more economical, because they do not require a distribution system.
Beyond population density, income levels in an area also help determine mini-utility profi tability—but they do not need to be very high to allow viable mini-utilities. No matter how densely populated an area, if customers’ incomes are so low that they spend very little on power or require limited power for appliances, then mini-grids may not be the best option to provide the energy services they need; devices are potentially most realistic.
Encouragingly, as mentioned, incomes need not be very high to allow mini-utilities to be viable, since a basic level of electricity service can be supplied for less than $5 per month. VEE’s customers, for example, which are typically households with fi ve or six people and which pay a little more than $8 per month for power, have an average per capita income of $2.60 per person per day. While the delivered cost of diesel varies signifi cantly depending on how remote a community is, VEE’s cost levels are somewhat indicative of what could be achieved in many places with equivalent population density. HPS’s lower variable (fuel) cost allows it to sell power at around $2 per household per month, so the company can serve households with much lower income levels, increasing market size. The HPS cost structure is harder to replicate, given the need for a specifi c feedstock, such as rice husks, for production of biogas. But as shown in fi gure 3.13, other technology choices that might have higher capital costs but little or no operating costs (such as hydropower, PV, and wind) can generate power for under $0.33 per kWh or less than $5 per month, assuming electricity consumption of 13 kWh per month for very basic service, as is the case for VEE.
There are essentially two types of mini-utilities—“lighting-focused” and “total electrifi cation” types. Lighting-focused mini-utilities, such as HPS and VEE, can estimate their load curves relatively easily based on demand, making plants more effi cient. This might facilitate scalability but limits profi tability, since households are lower-profi t, lower-consumption customers. The total electrifi cation operators, such as BUC, DESI, and Power Source, aim to provide all the electrifi cation needs of an area. This allows for large baseload customers and higher fees, but requires a greater amount of capital investment.
Commercial and productive demand can make a major difference to the required load in an area, and hence to the viability of a mini-utility. These include power consumption from agriprocessing, trade, refrigeration, and communication technologies. As mentioned, Power Source’s “community load centers” create demand from small businesses. DESI Power also focuses on the establishment of micro- and small enterprises through two partner organizations.41 DESI is likely to focus increasingly on establishing plants where there is already suffi cient demand for power.
Adequate electricity demand can also be secured through offtake agreements with industrial anchor customers. Power demand in many areas may not initially be enough to justify investment in a mini-utility, even though demand may grow to a level that allows it to be profi table after the grid is installed. This paradox is a traditional justifi cation for government subsidy of rural electrifi cation. A far better alternative is for mini-utilities to set up new operations with offtake agreements with industrial customers that will provide long-term demand for baseload power.
BUC relies on a solid SME customer base for its operations. DESI Power did not start operations this way but is collaborating with the Rockefeller Foundation on a pilot project (SPEED) designed to link their plants with mobile phone base stations, so that tower demand would serve as the baseload. Though still in the early stages, Andoya Hydroelectric Power Company Limited, located in Mbinga Township some 1,000 kilometers from the capital city of Dar Es Salaam, is one of the local companies taking advantage of Tanzania’s attractive mini-utility framework (see box 3.9) to capture all of these market constituents. It takes advantage of a Standardized Power Purchase Agreement, which was introduced by the energy regulator to replace some or all of the rural diesel-based power generated by national utility Tanesco with power procured from private operators.
90HOW COMPANIES ARE SERVING THE MARKET
Box 3.9: Government policy drives mini-utility outcomes: Encouraging private developers in TanzaniaTo help meet Tanzania’s need for power, improve electricity access, and foster domestic private sector investment in small clean power sources, the Ministry of Energy and Minerals developed the small power producer (SPP) program in 2009. The detailed implementation rules and guidelines were developed by EWURA (the Energy and Water Utility Regulation Authority) with assistance from the World Bank.
These rules and guidelines encourage the development of renewable and cogenerated electricity through a combination of standardized power purchase contracts, feed-in tariff (FIT) payments, and streamlined interconnection and licensing requirements. The regulations provide the legal basis for private businesses and individuals to interconnect renewable energy generators into isolated mini-grids and to export excess power (up to 10 MW) to the national utility, Tanesco. This provides additional revenues to those from local communities but also, importantly, creates the demand needed for systems to be sized optimally.
Eligible projects must be at least 100 kW but no more than 10 MW. This means that, for example, a 17-MW biomass SPP powered by sugarcane bagasse could participate in the program as long as it uses at least 7 MW to power the host sugar factory and supplies a maximum of 10 MW to the grid. Future revisions to the regulations, currently in early stages of discussion with EWURA, may also create a category of very small power producers (VSPPs) with further streamlined regulations for projects less than 100 kW.
Tanzania currently has two FIT levels for wholesale sales of electricity by SPPs. The tariffs are calculated and paid in Tanzanian shillings (TSch). The fi rst FIT is for SPPs selling electricity to the national utility Tanesco’s main grid. It is differentiated by dry and wet season, and its current average value for 2011 is 112.43 TSch/kWh (6.7 U.S. cents). A second, higher level is for SPPs that sell electricity to one of Tanesco’s isolated mini-grids that currently receive electricity from diesel generators. Its value for 2011 is 380.22 TSch/kWh ($0.23). Both FIT values are based on annual estimates of different measures of Tanesco’s average avoided cost on the main grid and on isolated mini-grids. At the time of writing, Tanzania appears to be the only country in Sub-Saharan Africa that uses the buying entity’s avoided cost to set FIT values. Elsewhere in Africa, FIT values are based on estimates of the renewable generator’s technology-specifi c cost of service. A third approach, based on structured competitive bidding, was announced in South Africa in 2011.
The result of these efforts has been a marked increase in interest on the part of private players in developing mini-utilities in various parts of the country, some as cogeneration and others on a stand-alone basis. One such developer, Andoya Hydroelectric Power Company Limited, is profi led in Chapter 3.
CHAPTER 391
Andoya will sell about 85 percent of its generation to the national utility, its anchor client. The remaining 15 percent is distributed directly to about 1,000 households in three villages and to other local businesses, like mobile phone base stations in the vicinity directly via its own mini-grid. Operated by a local businessman whose ventures include milling and transportation, the 500-kW small hydro plant substitutes diesel use in the local utility mini-grid and businesses, creating a win-win for all constituents. The developer gets preferential feed-in tariffs42 to recover the investments while the customers reduce their current diesel-based power bill by more than half.
Securing a low-cost primary energy source
Securing reliable, low-cost primary energy is a major challenge for mini-utilities. If mini-utilities can be commercially viable where population density and customer willingness to pay is suffi cient, what explains their relatively low penetration into this huge market? Part of the answer lies in their ability to access reliable, low-cost energy sources for their power generation systems. Where the terrain is suitable, run-of-river micro-hydro systems can offer a good—and essentially free—resource. Solar and wind can also be reliable and result in low running costs. But mini-utilities must ultimately make the trade-off between capital and operating costs, and these renewable technologies are generally very capital intensive. The extent to which the primary energy can be transported to, or stored for use at, specifi c sites is another consideration. While solar energy is generally abundant in developing countries, wind resources are variable, and hydro energy much more so.
While most companies opt for diesel fuel, biomass fuels are increasingly being explored as a cost-effective option for mini-utilities. Biomass can be a reliable, low-cost fuel, especially when it comes from crop waste. HPS’s rice husk fuel, a by-product of rice milling, has a low value in alternative uses—currently it sells for about $22 per ton. At that price, its fuel costs amount to $0.04 per customer per month. There is an increasing interest in rice husks as a fuel source in Cambodia, too. Batdeong Electricity uses husks to make biogas, using a digester from Ankur Scientifi c Energy Technologies in India. As a result, its fuel costs are estimated to be about 72 percent lower than diesel-fi red VEE’s costs, also in Cambodia.
But biomass-based mini-utilities must manage their fuel supply chains and transportation costs carefully to maintain profi tability. Where its use is widespread, and demand for feedstock increases, biomass price volatility can become an issue. For example, supply uncertainty and price pressure could come from competition with animal feed producers and industrial energy cogeneration, both of which can use crop waste. Or there may simply be an issue with suppliers seeing more value in what was previously considered a by-product.
HPS saw rice husk feedstock prices rise about 35 percent in 2011 because it has not been able to secure long-term contracts for reliable supply. HPS buys rice husks from cooperatives or from centralized rice mills, which purchase them from local farmers in the mini-utility’s service area. Indeed, the basis for establishing its plants in certain communities has been the availability of fuel and a good informal relationship with producers. But, over time, the cooperatives and mills do not necessarily continue to share the incentives of individual farmers that HPS supplies.
In addition, changes in the price of diesel can result in spikes in the transport costs for getting the fuel to the plant. To manage both fuel supply chains and cost structures, biomass mini-utilities may need to enter into long-term guaranteed contracts with cooperatives or other third parties and build storage facilities to manage price volatility. Alternatively, they could consider introducing fl exibility in terms of the fuel options with which systems can operate. Finally, developing proprietary plantations near their mini-utilities may also help to manage costs. DESI’s
92HOW COMPANIES ARE SERVING THE MARKET
gasifi ers can run on a range of biomass including rice husk briquettes, sugarcane toppings, corn cob, mango kernels, coconut shells, and woody biomass. To further control fuel reliability and manage variable operating costs, DESI is also considering cultivating fast-growing wood crops on its own plantations.43 HPS is beginning to use a mix of rice and wheat husk, and is also adjusting its plants to use bagasse, sawdust, jute, and other biomass fuels.
“Interestingly, formal skills are not a key success factor for most small power providers, but they do
become critical for mini-utility scale-up.”
Developing the right operating model—and ensuring suffi cient management expertise—to scale the business beyond a handful of systems
Formal business skills are not a key success factor for most small power providers operating a single, often diesel-fi red, plant. Most mini-utilities are started by local business entrepreneurs with some background in running a small company and in the operation of engines or electrical systems. They often thrive when the entrepreneur has some basic business skills, technical knowledge, a good understanding of the locality, and some capital of his or her own to invest. But, interestingly, formal “utility business training” is not a key success factor for most small power providers.
A survey across Bangladesh, Cambodia, Kenya, and the Philippines found that only 20 percent of small power system operators have a technical secondary school or university degree. Skills development and capacity building are not major concerns for most small power providers.44 And as with the VEE example, where small diesel systems are used, the technology is quite simple, and the skills are not diffi cult to acquire.
Renewable energy, hybrid, or larger fossil fuel systems, however, require higher levels of technical sophistication to operate smoothly, and entrepreneurs often benefi t from focused training. Training has contributed to the success of the Bonny Utility Company in Nigeria, which serves over 8,000 customers. There, parent company Nigeria Liquid Natural Gas has implemented a capacity-building program to train local entrepreneurs to take over operations from NLNG employees within a given time frame. They have also built the distribution grid to conform to international standards, and instituted a safety culture, leveraging the mother company’s expertise.
This is also true for mini-utilities with operations at several sites. HPS has realized that, in order to scale-up beyond its 72 systems currently in place in Bihar to some 2,000 installations across India and in parts of Africa, it must have a growth-oriented business model and a high-caliber management team to design and oversee a complex rollout. On the business model side, it is exploring franchising. Under a franchise system, entrepreneurs would front a portion of the capital for a mini-grid system and HPS would facilitate fi nancing to cover the balance—through its own books or by guaranteed bank loans—and would provide operational support. HPS is receiving advisory support from IFC to help design information systems to manage a growing span of control, and to develop a tailored training program for operators and mechanics to run new plants. In tandem, it has invested almost $500,000 in a capacity-building venture called “Husk University,” which aims to develop a cadre of entrepreneurs to effi ciently run its systems using a combination of classroom and on-site programs.
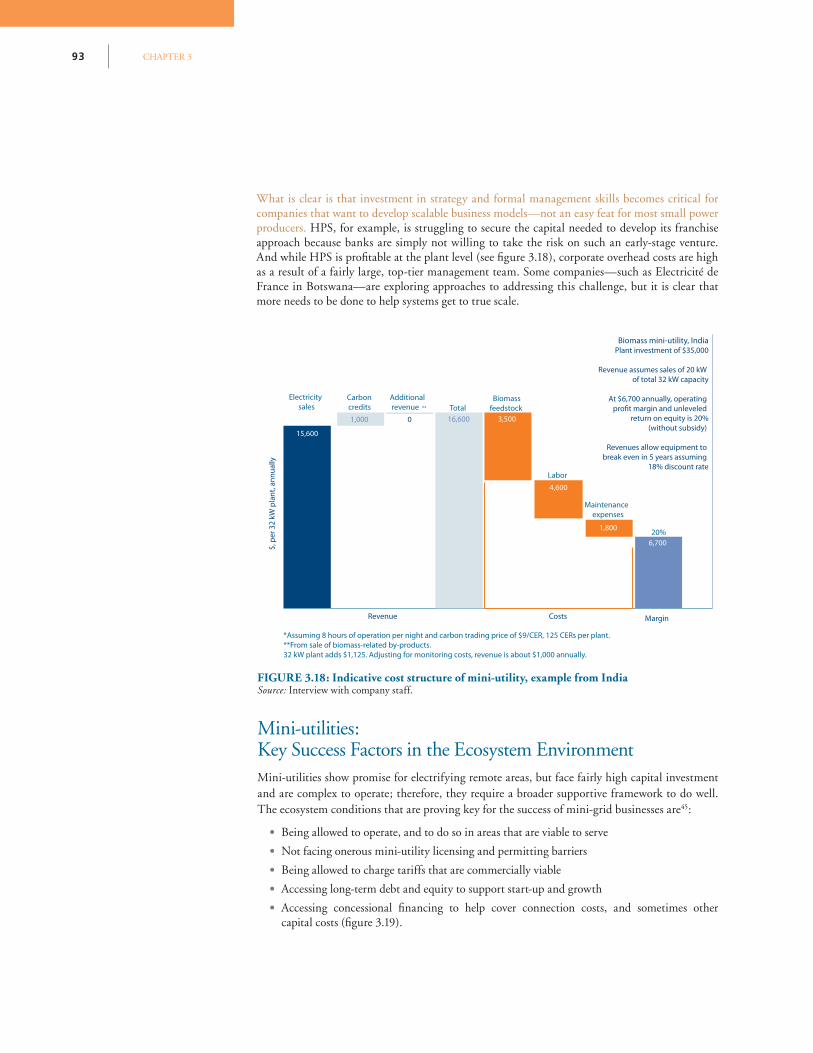
CHAPTER 393
Mini-utilities: Key Success Factors in the Ecosystem Environment Mini-utilities show promise for electrifying remote areas, but face fairly high capital investment and are complex to operate; therefore, they require a broader supportive framework to do well. The ecosystem conditions that are proving key for the success of mini-grid businesses are45:
• Being allowed to operate, and to do so in areas that are viable to serve
• Not facing onerous mini-utility licensing and permitting barriers
• Being allowed to charge tariffs that are commercially viable
• Accessing long-term debt and equity to support start-up and growth
• Accessing concessional fi nancing to help cover connection costs, and sometimes other capital costs (fi gure 3.19).
*Assuming 8 hours of operation per night and carbon trading price of $9/CER, 125 CERs per plant.
**From sale of biomass-related by-products.
32 kW plant adds $1,125. Adjusting for monitoring costs, revenue is about $1,000 annually.
Biomass
feedstock
Labor
Maintenance
expenses
20%
Total
Additional
revenue **
Carbon
credits
Electricity
sales
Biomass mini-utility, IndiaPlant investment of $35,000
Revenue assumes sales of 20 kW
of total 32 kW capacity
At $6,700 annually, operating
profit margin and unleveled
return on equity is 20%
(without subsidy)
Revenues allow equipment to
break even in 5 years assuming
18% discount rate
MarginCostsRevenue
$, p
er
32
kW
pla
nt,
an
nu
ally
15,600
16,6001,000 0 3,500
4,600
1,800
6,700
FIGURE 3.18: Indicative cost structure of mini-utility, example from IndiaSource: Interview with company staff.
What is clear is that investment in strategy and formal management skills becomes critical for companies that want to develop scalable business models—not an easy feat for most small power producers. HPS, for example, is struggling to secure the capital needed to develop its franchise approach because banks are simply not willing to take the risk on such an early-stage venture. And while HPS is profi table at the plant level (see fi gure 3.18), corporate overhead costs are high as a result of a fairly large, top-tier management team. Some companies—such as Electricité de France in Botswana—are exploring approaches to addressing this challenge, but it is clear that more needs to be done to help systems get to true scale.
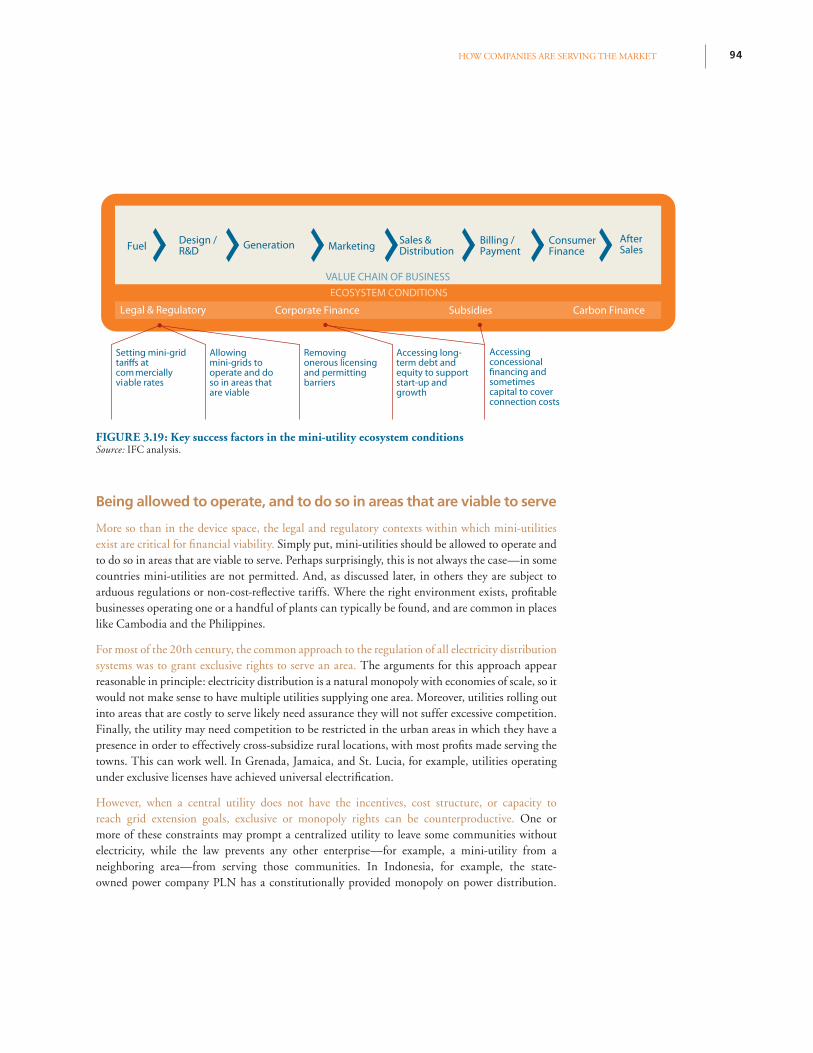
94HOW COMPANIES ARE SERVING THE MARKET
Being allowed to operate, and to do so in areas that are viable to serve
More so than in the device space, the legal and regulatory contexts within which mini-utilities exist are critical for fi nancial viability. Simply put, mini-utilities should be allowed to operate and to do so in areas that are viable to serve. Perhaps surprisingly, this is not always the case—in some countries mini-utilities are not permitted. And, as discussed later, in others they are subject to arduous regulations or non-cost-refl ective tariffs. Where the right environment exists, profi table businesses operating one or a handful of plants can typically be found, and are common in places like Cambodia and the Philippines.
For most of the 20th century, the common approach to the regulation of all electricity distribution systems was to grant exclusive rights to serve an area. The arguments for this approach appear reasonable in principle: electricity distribution is a natural monopoly with economies of scale, so it would not make sense to have multiple utilities supplying one area. Moreover, utilities rolling out into areas that are costly to serve likely need assurance they will not suffer excessive competition. Finally, the utility may need competition to be restricted in the urban areas in which they have a presence in order to effectively cross-subsidize rural locations, with most profi ts made serving the towns. This can work well. In Grenada, Jamaica, and St. Lucia, for example, utilities operating under exclusive licenses have achieved universal electrifi cation.
However, when a central utility does not have the incentives, cost structure, or capacity to reach grid extension goals, exclusive or monopoly rights can be counterproductive. One or more of these constraints may prompt a centralized utility to leave some communities without electricity, while the law prevents any other enterprise—for example, a mini-utility from a neighboring area—from serving those communities. In Indonesia, for example, the state-owned power company PLN has a constitutionally provided monopoly on power distribution.
Fuel Design /R&D Generation Marketing Sales &
DistributionBilling / Payment
After Sales
ECOSYSTEM CONDITIONS
Corporate Finance Carbon Finance
ConsumerFinance
Subsidies
VALUE CHAIN OF BUSINESS
Legal & Regulatory
Allowing mini-grids to operate and do so in areas that are viable
Accessing concessional financing and sometimes capital to cover connection costs
Removing onerous licensing and permitting barriers
Setting mini-grid tariffs at com mercially viable rates
Accessing long- term debt and equity to support start-up and growth
FIGURE 3.19: Key success factors in the mini-utility ecosystem conditionsSource: IFC analysis.
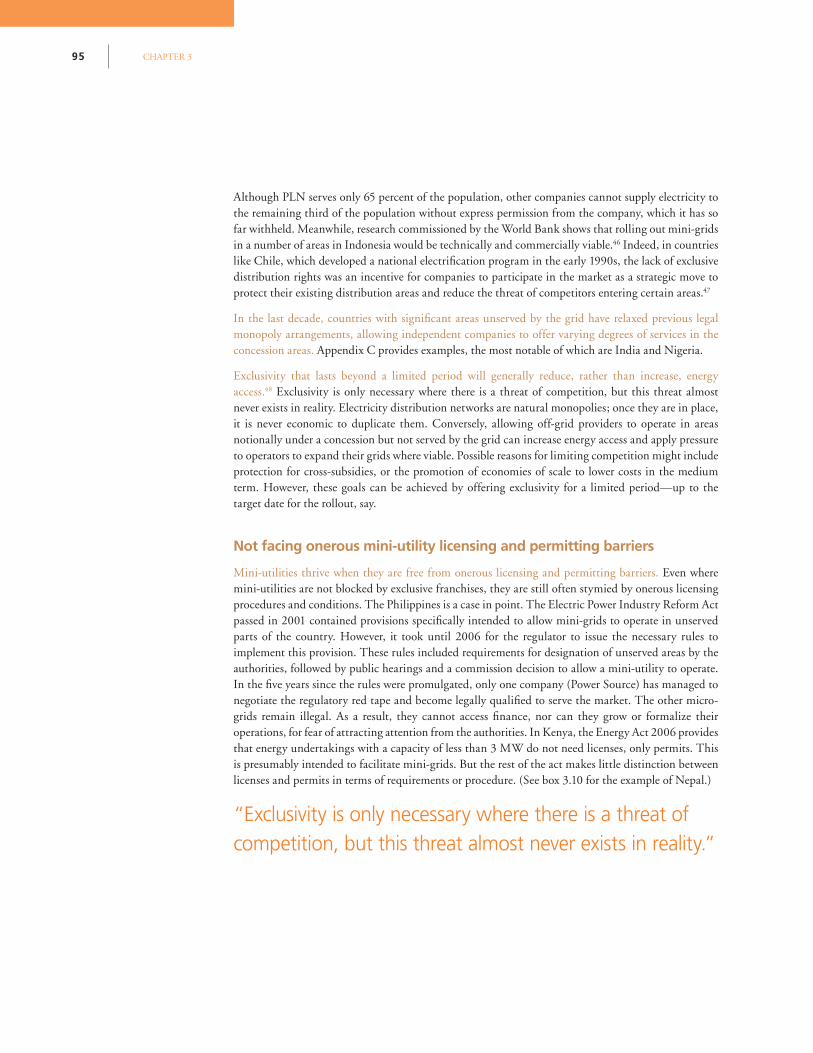
CHAPTER 395
Although PLN serves only 65 percent of the population, other companies cannot supply electricity to the remaining third of the population without express permission from the company, which it has so far withheld. Meanwhile, research commissioned by the World Bank shows that rolling out mini-grids in a number of areas in Indonesia would be technically and commercially viable.46 Indeed, in countries like Chile, which developed a national electrifi cation program in the early 1990s, the lack of exclusive distribution rights was an incentive for companies to participate in the market as a strategic move to protect their existing distribution areas and reduce the threat of competitors entering certain areas.47
In the last decade, countries with signifi cant areas unserved by the grid have relaxed previous legal monopoly arrangements, allowing independent companies to offer varying degrees of services in the concession areas. Appendix C provides examples, the most notable of which are India and Nigeria.
Exclusivity that lasts beyond a limited period will generally reduce, rather than increase, energy access.48 Exclusivity is only necessary where there is a threat of competition, but this threat almost never exists in reality. Electricity distribution networks are natural monopolies; once they are in place, it is never economic to duplicate them. Conversely, allowing off-grid providers to operate in areas notionally under a concession but not served by the grid can increase energy access and apply pressure to operators to expand their grids where viable. Possible reasons for limiting competition might include protection for cross-subsidies, or the promotion of economies of scale to lower costs in the medium term. However, these goals can be achieved by offering exclusivity for a limited period—up to the target date for the rollout, say.
Not facing onerous mini-utility licensing and permitting barriers
Mini-utilities thrive when they are free from onerous licensing and permitting barriers. Even where mini-utilities are not blocked by exclusive franchises, they are still often stymied by onerous licensing procedures and conditions. The Philippines is a case in point. The Electric Power Industry Reform Act passed in 2001 contained provisions specifi cally intended to allow mini-grids to operate in unserved parts of the country. However, it took until 2006 for the regulator to issue the necessary rules to implement this provision. These rules included requirements for designation of unserved areas by the authorities, followed by public hearings and a commission decision to allow a mini-utility to operate. In the fi ve years since the rules were promulgated, only one company (Power Source) has managed to negotiate the regulatory red tape and become legally qualifi ed to serve the market. The other micro-grids remain illegal. As a result, they cannot access fi nance, nor can they grow or formalize their operations, for fear of attracting attention from the authorities. In Kenya, the Energy Act 2006 provides that energy undertakings with a capacity of less than 3 MW do not need licenses, only permits. This is presumably intended to facilitate mini-grids. But the rest of the act makes little distinction between licenses and permits in terms of requirements or procedure. (See box 3.10 for the example of Nepal.)
“Exclusivity is only necessary where there is a threat of competition, but this threat almost never exists in reality.”

96HOW COMPANIES ARE SERVING THE MARKET
ABOVE: AN AFRICAN CLOTHES MAKER SEWING BY THE LIGHT OF A SOLAR LANTERN (CREDIT: IFC)
CHAPTER 397
Box 3.10: Government policy drives mini-utility outcomes: Community power in NepalThough different from Tanzania, Nepal is also an interesting case because over 2,000 micro-hydro mini-utility installations deliver 85 percent of off-grid electricity supply to 14 million households in a country that has one of the lowest rates of electricity use in the world (see fi gures B3.10a and B2.10b). (About 17 million Nepalese have no access to grid supply, and these households are predominantly rural.) This is a remarkable delivery of renewable off-grid electricity, and it has been driven by government policy, starting in 1975, which has together with donor-funded programs progressively promoted micro-hydro systems.
Houses electrified through micro & pico hydro
Hou
seho
lds
elec
trifi
ed in
‘000
1997 2000 2003 2006 20091962–1994
5
10
1
5
20 17
3 3 4
6 6
8 9
5
8
5
79
19 19
14
CooperativeNo ResponseCommunity Owned Privately Owned
Installations of micro-hydro
Ow
ner
ship
en
titi
es (
%)
2006–07 2007–08 2008–09
0%
5
0%
1
00%
12%
85% 97% 77%
23%
3%
3%
Community involvement ismandatory for subsidies
FIGURE B3.10a Number of households electrifi ed through pico- and micro-hydro schemesSource: IFC 2012; Intellecap analysis.
FIGURE B3.10b Ownership of micro-hydro installations in NepalSource: IFC 2012; Intellecap analysis.
This success in delivering energy to rural areas has, however, provided limited commercial opportunities for the private sector. The reason for this is that the design of policy drives remote installations that supply homes (which mostly only require lighting) and does not emphasize the relevance of baseload anchor customers for the success of operators. This, combined with a low ability of end users to pay, high installation costs, and operational challenges (also common to mini-utilities in other countries) has limited the opportunities for entrepreneurs. In addition, policy design requires community involvement and specifi es which technologies may be used for companies to qualify for subsidies. The lesson to governments is that policy guides the outcome; in this case, policy decisions have largely made private sector involvement in mini-grids inviable.
98HOW COMPANIES ARE SERVING THE MARKET
The success of mini-utilities in Cambodia and, increasingly, India is attributable primarily to regulatory regimes that allow them to exist. These examples provide models of regulatory approaches that may be valuable for other governments that would like local mini-grids to operate in unserved areas.
The fi rst lesson from Cambodia is simply the value of removing restrictions such as exclusive franchises, licensing, and tariff regulation. Mini-grids started to operate in Cambodia soon after the country’s civil war ended. Government capacity was very low and unable to reach most of the countryside. In this completely unserved and unregulated environment, people started to buy generators and sell power to their neighbors. Mini-utilities sprang up in many villages. Since those early days, the regime in Cambodia has evolved to regulate these enterprises, but with a light touch that allows the enterprises to prosper and grow. Companies such as VEE and Batdeong are now licensed by the Electricity Authority of Cambodia. The granting of such licenses has allowed mini-utilities to borrow from commercial banks. The Cambodian regulatory regime also provides a framework that allows off-grid systems to connect to larger utilities, purchase cheaper power from those utilities, and then on-sell that power to their customers at a regulated distribution margin.
India’s reforms offer a good model for those countries that have working regulatory regimes they wish to preserve, while simultaneously allowing mini-grids to serve communities that lack power. In all fairness, Cambodia is an extreme case, and there is no need to abandon all regulation to get mini-grids working. What is essentially required is to legalize their operations to put them on a sound regulatory footing so that they can do the essentials, such as raising debt. India’s Union Government Electricity Act of 2003 allowed mini-utilities to operate without licenses in rural areas49 providing they comply with safety standards. These reforms have encouraged fi rms to start up, and should be replicated elsewhere.
Being allowed to charge tariffs that are commercially viable
Mini-utilities are generally subject to tariff regulation intended to protect the consumer. But, if set at inappropriately low levels, this stifl es the sector. In Nigeria, mini-grids are legally allowed to operate, but need a license if they are over 100 kW in capacity, and may charge no more than the regulated tariff set for large distribution companies. While well intentioned, this often makes it unprofi table to run smaller systems, which invariably face higher costs and lower economies of scale than the grid.
Clearly, mini-utilities should be allowed to charge commercial prices to willing customers. There is a difference between a newly established mini-grid company bringing power to an area for the fi rst time, and a utility that has been serving an area for many years. When a service is provided for the fi rst time, customers have a genuine choice and will switch to the new provider only if it offers better value for money than their traditional solutions. In addition, in off-grid and mini-grid situations, where power is typically used for very basic applications such as lighting, operators compete not only with kerosene lanterns but also with solar lanterns and solar home systems. In Mali, the RESCOs are allowed to set their own tariffs, walking the line between affordability for the customer and allowing an acceptable rate of return for the supplier.
The risk that tariffs are set so low that mini-utilities become inviable, preventing customer choice altogether, probably outweighs any risks of monopoly profi t. Why not allow the market to determine what mini-utilities can reasonably charge? Indeed, it seems odd to worry about the risk of monopoly profi ts in an unelectrifi ed rural area when the generally accepted view is that these areas cannot be served profi tably at all. If the objective is expanded energy access, then allowing mini-utilities to make profi ts so as to access capital, grow their systems, and serve even larger populations would be a more logical direction for policy.
“It seems odd to worry about
the risk of monopoly profi ts in
an unelectrifi ed rural area when
the generally accepted view is
that these areas cannot be served
profi tably at all.”
CHAPTER 399
While the notion of unregulated mini-grid tariffs may seem unusual or even risky, it is reasonable from an economic perspective. Regulation of prices is used for monopolies. But a mini-utility entering a market is competing with many other energy sources besides the grid. And unregulated tariffs not only help energy access, but also create a competitive price environment, which will ultimately protect consumers.
Accessing long-term debt and equity to support start-up and growth
Mini-utilities are capital-intensive businesses requiring both equity and debt. Most struggle to raise either. According to a World Bank survey,50 37 percent of small power providers across four countries reported that access to fi nance was a severe or very severe business constraint, and 67 percent of small power providers rely on their own funds for investment. The entrepreneurs who set up Cambodia’s VEE invested $50,000 of their own equity to start their business, an amount that few entrepreneurs in developing countries would be able to match for a long-term investment in a rural area. The Korayé Kurumbu and Yeelen Kura RESCOs relied on support from Electricité de France, Total, and Malians living abroad to cover start-up costs.51
HPS is one of the few mini-grid companies to secure formal equity investment, but still it has mostly fi nanced its capital and operating costs from grants and some equity from the owners. In 2008, HPS added three new power plants with $100,000 in winnings from business plan competitions and grant funding from the Shell Foundation. In 2009, operations were expanded to 19 power plants with $1.65 million raised from Draper Fisher Jurvetson, the Acumen Fund, LGT Philanthropy, and IFC. Other examples remain elusive.
The ongoing success of mini-utilities will in large part be driven by the willingness of commercial banks to provide debt. Most large utilities are fi nanced by at least 50 percent debt, and similar levels would probably make sense for more mature mini-grids, although few have managed to access commercial fi nance. Those that have borrowed have benefi ted. For example, DESI Power has a commercial loan from ICICI Bank, and VEE has debt from ANZ Bank. Their growth would have been constrained without this capital. Meanwhile, Husk Power continues to struggle to secure loans from local banks.
Accessing concessional fi nancing to help cover connection and other capital costs
Subsidies can help mini-utilities cover connection and other capital costs and accelerate penetration into BOP areas by closing the “viability gap” (the shortfall between revenues that customers are able to contribute and those needed for enterprises to be fi nancially workable). Mini-utilities serve marginally viable customers, are often located in hard-to-serve areas with logistical challenges, and tend not to operate at scale. Subsidies can help offset the cost of connection, signifi cantly improving fi nancial performance and allowing them to reach households in poorer areas than otherwise would be the case.
100HOW COMPANIES ARE SERVING THE MARKET
Businesses in other sectors have realized that removing high up-front costs will increase growth and profi tability. In some countries, mobile phone companies routinely subsidize the handset purchased by consumers by spreading the cost over time through user charges. The handset is locked to a provider’s network, so the deal buys a customer relationship, too, and the provider profi ts for years to come. Cable TV fi rms, similarly, often connect customers for little or no charge in exchange for a multiyear contract. In the energy access space, there have been a number of approaches to reducing up-front costs of solar home systems.
For mini-utilities, waiving the connection fee can increase the amount of capital required by as much as 30 percent, and this is an area where targeted subsidies are being effectively channeled. Even if the cost is spread over time, most mini-utilities cannot offer to connect customers for little or no up-front payment; they are simply unable to fi nance such large capital outlays on their own. Financial support for these connections from governments or development agencies can help. These are offered in countries such as Cambodia and Tanzania and are successfully attracting businesses to the mini-utilities space.
While it is perhaps harder to ensure that they are appropriately applied—and not, for instance, used to keep an otherwise unviable business afl oat—another approach involves subsidizing plants with very high capital costs. Rwanda’s REPRO closed its viability gap with grant funding. Of the (approximately) $350,000 needed to buy and rehabilitate the hydropower plant it acquired from a failed donor-sponsored project, 32 percent was fi nanced from owners’ equity, 18 percent was borrowed commercially, and a grant from GIZ covered the remaining 50 percent. The grant increased return on equity from about 8 percent to above 16 percent, making it commercially attractive.
Recognizing the role that they play in energy access, up to 80 percent of the capital costs of hydropower, solar PV, and hybrid mini-utilities in Mali are paid by the national rural electrifi cation agency, AMADER, itself funded in large part by the World Bank. Also in Mali, but taking a novel approach to sources of funds, Electricité de France’s model has built on fi nancial assistance from migrants living in France. As a “stakeholder” of unelectrifi ed rural communities to which they still had family ties, the Malian Diaspora community has helped to cover the unviable portion of the Korayé Kurumbu and Yeelen Kura RESCO capital costs.
Nigeria’s BUC effectively uses subsidies in the form of CSR funds and in-kind contributions from the oil and gas industry to cover its viability gap. The BUC project was created as a means of securing a local “license to operate” on Bonny Island. The Nigeria Liquefi ed Natural Gas operations of Shell and other joint-venture oil companies export natural gas from a strategic terminal on the island, bringing value to both the initiator and the recipients. However, the high capital costs associated with extending connections to households and businesses across the island, coupled with the policy of not recovering these costs in full from end users, means that grants are required to cover this particular part of the investment. BUC has almost achieved breakeven on operations and maintenance, and has plans to increase tariffs to allow it to turn cash fl ow positive by 2014. Given that it is providing a service that the community would otherwise likely not receive, public sector concessional funding of connection costs could be justifi ed.
CHAPTER 3101
Grid-based Electrifi cation: Centralized Utility Approaches Given its importance for long-term economic progress, ensuring suffi cient low-cost, reliable electricity is a government priority in both developing and industrialized countries. However, unlike household-level devices and mini-utilities, the opportunity for private companies operating on a purely commercial basis to make money from grid extension in low-income areas is fairly limited. Almost without exception, governments are involved in the sector, through regulation, fi nance, ownership, and subsidies. This is in part because, as a natural monopoly, electricity grids are generally highly regulated. In addition, since the business of adding generation capacity and extending connections for many miles into often remote areas (where the demand of poorer end users is low and thus revenues limited) is highly capital intensive, returns on investment are low. With capacity addition and connection costs being relatively expensive, grid supply is the least-cost option only when population density and per capita demand are reasonably high.
Because fi nancial incentives are often required to encourage private participation in grid extension, this section showcases a range of successful strategies adopted by both governments and companies, often working together in public-private partnerships (PPPs), in various parts of the world. While acknowledging the importance of policies and management of broader power sector reform issues (such as cost-refl ective tariffs, availability of suffi cient capital to maintain existing systems and add new infrastructure, and prudent management), we focus specifi cally on tactics that have helped extend grid access to the poor.
Grid Extension: Business Models – How Companies are Serving the MarketTo achieve high levels of electrifi cation in a short time, China, Morocco, South Africa, and Vietnam have relied largely on public-sector-led programs, but their operational approaches have varied. China’s electrifi cation process, beginning in the 1950s, used a combination of centralized and local grids to achieve about 95 percent electrifi cation. South Africa went from less that 35 percent electrifi cation to over 80 percent between 1990 and 2007, largely leveraging a single state-owned utility to deliver connections, but complementing this with off-grid solar home systems delivered by private players. Morocco achieved 96 percent electrifi cation through a combination of grid extension and off-grid solar home systems. It fi nanced the former with a combination of end-user payments and local government subsidies, and direct investment by the utility that were recovered commercially. Vietnam jumped from 2.5 percent electrifi cation in 1975 to about 97 percent in less than three decades. Its program involved generation by the national utility and local distribution cooperatives that retailed to communities as small as 1,000 people.
In many other countries, service contracts supported by smart subsidies have been the basis for involving the private sector in grid-based electrifi cation. Utilities operating in Chile and Guatemala, for instance, have made strides in electrifi cation on the back of PPPs and output-based subsidies. Here, governments have auctioned off concession areas to private distribution companies, giving them specifi c targets to increase coverage and providing a direct payment for each connection made to cover the investment’s viability gap.
On their own initiative, distribution companies in Brazil, India, and Uganda have focused on solving effi ciency, distribution, and revenue issues linked to serving poorer customers. In these cases, utilities have made progress in reducing technical losses and theft in urban slums and are installing prepaid meters and other technologies. This improves service quality and reliability and, at the same time, enhances revenue recovery, which means that they can often extend access into unserved markets.
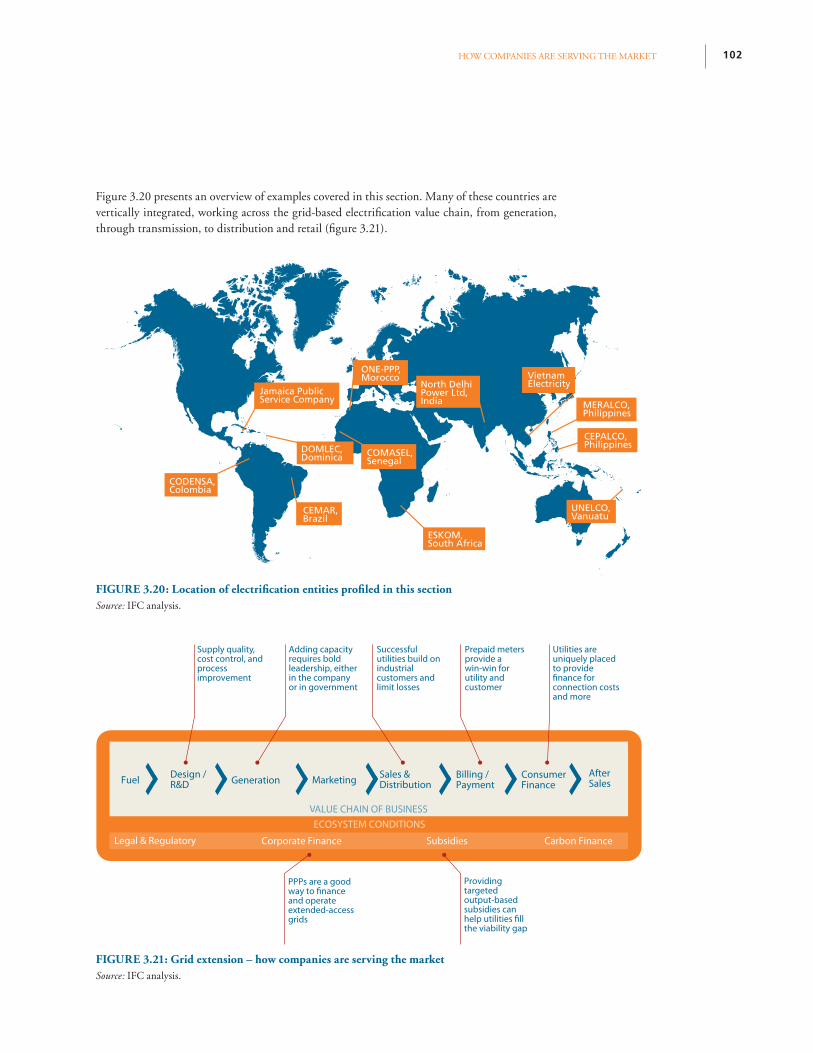
102HOW COMPANIES ARE SERVING THE MARKET
FIGURE 3.21: Grid extension – how companies are serving the marketSource: IFC analysis.
FIGURE 3.20: Location of electrifi cation entities profi led in this sectionSource: IFC analysis.
CEMAR,Brazil
DOMLEC,Dominica COMASEL,
Senegal
ONE-PPP,Morocco
Jamaica PublicService Company MERALCO,
Philippines
North DelhiPower Ltd,India
CEPALCO,Philippines
ESKOM,South Africa
UNELCO,Vanuatu
VietnamElectricity
CODENSA,Colombia
Fuel Design /R&D Generation Marketing Sales &
DistributionBilling / Payment
After Sales
ECOSYSTEM CONDITIONS
Corporate Finance Carbon Finance
ConsumerFinance
Subsidies
VALUE CHAIN OF BUSINESS
Legal & Regulatory
Providing targeted output-based subsidies can help utilities fill the viability gap
PPPs are a good way to finance and operate extended-access grids
Supply quality, cost control, and process improvement
Adding capacity requires bold leadership, either in the company or in government
Prepaid meters provide a win-win for utility and customer
Utilities are uniquely placed to provide finance for connection costs and more
Successful utilities build on industrial customers and limit losses
Figure 3.20 presents an overview of examples covered in this section. Many of these countries are vertically integrated, working across the grid-based electrifi cation value chain, from generation, through transmission, to distribution and retail (fi gure 3.21).
CHAPTER 3103
R&D and Design
Extending grid power to the poor requires technical innovation to reduce connection and infrastructure costs. Electricity utilities are not generally thought of as technical innovators. But the reality is that extending grid power to the poor requires many practical breakthroughs to reduce the planned cost per connection, and to minimize cost overruns over time. Morocco’s Global Rural Electrifi cation Program (PERG) was started in 1996 by the incumbent utility, ONE, and targeted universal electrifi cation by 2008. Following fairly slow progress on electrifi cation undertaken in a previous public-sector-led national electrifi cation effort, ONE looked at ways of innovating to keep the program on track fi nancially and operationally. ONE began by undertaking a detailed mapping—using geographical information systems—of all unelectrifi ed areas in the country. It developed an electrifi cation master plan that specifi ed which households in 40,000 villages could reasonably be connected to the grid, and which would need to be served using off-grid systems (for example, solar home systems and mini-hydro). Thereafter, it focused on lowering installation costs. For example, it cut about 30 percent of infrastructure costs by reducing the maximum height of poles, using post-mounted substations, and streamlining eligibility criteria for contracted construction companies.
Several utilities around the world have leveraged technical innovation to improve effi ciencies and to reduce commercial and technical distribution losses. The use of smart meters, in particular, has shown potential, as demonstrated by Ampla, the distribution company in Rio de Janeiro, Brazil. And while most of South African utility Eskom’s success can be attributed to the policy, institutional, planning, and fi nancing issues discussed below, innovation also played an important role in its activities. Charged with delivering on a government decree to achieve universal electrifi cation, but facing fi nancial constraints, Eskom had to think creatively about how to viably extend its grid. Initially it focused on supply-side, quality-driven technology optimization through, for example, research into the impact of lightning strikes on overhead distribution lines. Later it saved money by adopting technology more suited to typical customers, including prepaid electricity meters and single phase lines, which signifi cantly reduced capital costs. Improved processes played a role, too, including greater use of decision-making tools, adoption of new fi nancial evaluation methods, computer-based asset management, and software for feeder design.
Generation
Suffi cient generation capacity is a critical prerequisite for extending the grid to unserved areas in such a way as to truly increase access to reliable electricity; however, this can be a challenge for many developing countries. In Vietnam, for example, the government coupled its resource blessings (large hydro potential and coal) with a determination to build generation capacity that could—and did—reach the whole nation. In Sri Lanka, renewable energy feed-in-tariffs encouraged small grid-connected hydropower development. But many countries do not have suffi cient power plant capacity to serve currently connected populations, let alone new ones that might be connected. Any capacity added to the network would likely be consumed by existing customers that require more electricity than is currently available, leading to a situation where newly connected customers receive “rationed,” unreliable power.
More often than not, there is little incentive to add new capacity to the system. In countries where the utility lacks capital to install new capacity, there are usually other systemic issues.
104HOW COMPANIES ARE SERVING THE MARKET
These generally stem from the inability of the utility to recover costs. This might be due to weak transmission and distribution infrastructure that leads to high technical losses and a corresponding decline in revenues. Equally, it could be due to commercial losses, where the utility cannot recover the cost of power consumed from customers for various reasons—both political and practical. Whatever the reason, this undermines the ability of the utility to fi nance new generation capacity. The problem is particularly pronounced in countries with a vertically integrated monopoly, where a (mostly) state-owned company is responsible for generation, transmission, and distribution, with limited transparency into the overall system. But liberalized systems, where generation is split from distribution, are not immune to capacity challenges. In these instances, fi rms on the generation side often have reduced incentive to invest in capacity due to high credit risks associated with electricity offtakers (typically distribution companies that cannot collect the revenues they are due).
Both South Africa and Vietnam built their grid extension plans on the back of solid industrial use, and in both cases it was central to their success. South Africa has a very energy-intensive economy, primarily driven by the manufacturing and mining sectors. This provided suffi cient long-term sales revenue to fi nance investments to improve energy systems and to cross-subsidize rural access. Vietnam’s government was determined to provide rural access. But it fi rst built capacity for its rice production sector, where the provision of grid electricity increased revenues for rice producers. This fueled growth of the rice sector, creating more customers and in turn helping to fi nance grid extension. The result was a double win since Vietnam is today the world’s second-largest rice producer and has nearly universal electricity access. Industrial customers offer relatively reliable cash fl ows from power sales, especially in sectors where the returns to investments in electrifi cation are particularly high. Using these customers to cross-subsidize lower-income consumers appears to be one of the most practical and effective tactics used to extend electricity access.
So, while we see limited activity in the generation designed expressly to improve energy access for the poor, it is clear that improving electrifi cation requires both state utilities and independent power producers to add capacity to meet current and future system needs, including load growth from new
connections. Policymakers can play an important role here by helping these companies improve their revenues. Setting distribution companies on a sound footing by helping to improve their collection rates ensures that electricity retailers are in a position to recover the cost of power purchased from generators, and that these generators get paid for the power they sell, so are incentivized to build. In many countries, this is a highly political issue, since few governments want to be seen to encourage a “pay-or-disconnect” policy. But there are some successes.
Eskom’s ability to add generation capacity, for instance (while certainly made easier by access to local low-cost coal, skills, and capital) was considerably helped by an independent leadership in the 1980s and 1990s that managed to free itself enough from government infl uence to chart its own course.52 Another approach is to use power purchase agreements, often backed by government guarantees, to encourage capacity additions. While not without its issues, notably a signifi cant potential burden on public fi nances, especially if other fundamental market and sector reform issues are not resolved, this approach has been successful in attracting signifi cant new generation infrastructure in India, Kenya, Mexico, and Thailand.
Transmission, Distribution, and Sales
On the transmission and distribution side, system losses, through power theft or nonpayment, and technical ineffi ciencies, can be as high as 40 percent in some countries and have become a signifi cant barrier to the extension of service into unserved areas. Ironically, dealing with the problem blocks access in the short term (when nonpaying consumers are cut off) but is vital to long-term extension of access because high losses prevent investments in power generation and grid infrastructure.
To tackle the problem of commercial losses in the distribution system, a mix of technical, business model, and corporate social responsibility ideas have been employed. The Jamaica Public Service Company (JPSCo), for instance, has been adapting ideas from Brazil to stop power theft in low-income areas in inner-city Kingston by using insulated connections to homes to prevent the traditional method of throwing another line over the noninsulated connection and drawing power illegally.
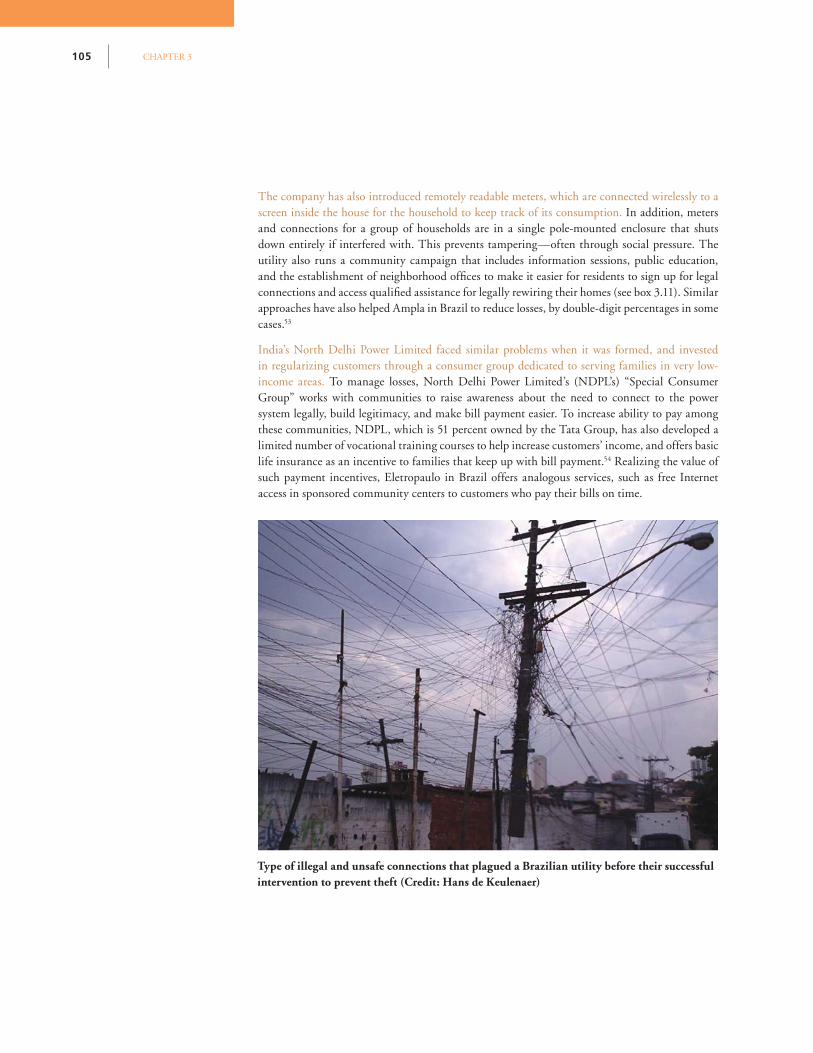
CHAPTER 3105
The company has also introduced remotely readable meters, which are connected wirelessly to a screen inside the house for the household to keep track of its consumption. In addition, meters and connections for a group of households are in a single pole-mounted enclosure that shuts down entirely if interfered with. This prevents tampering—often through social pressure. The utility also runs a community campaign that includes information sessions, public education, and the establishment of neighborhood offi ces to make it easier for residents to sign up for legal connections and access qualifi ed assistance for legally rewiring their homes (see box 3.11). Similar approaches have also helped Ampla in Brazil to reduce losses, by double-digit percentages in some cases.53
India’s North Delhi Power Limited faced similar problems when it was formed, and invested in regularizing customers through a consumer group dedicated to serving families in very low-income areas. To manage losses, North Delhi Power Limited’s (NDPL’s) “Special Consumer Group” works with communities to raise awareness about the need to connect to the power system legally, build legitimacy, and make bill payment easier. To increase ability to pay among these communities, NDPL, which is 51 percent owned by the Tata Group, has also developed a limited number of vocational training courses to help increase customers’ income, and offers basic life insurance as an incentive to families that keep up with bill payment.54 Realizing the value of such payment incentives, Eletropaulo in Brazil offers analogous services, such as free Internet access in sponsored community centers to customers who pay their bills on time.
Type of illegal and unsafe connections that plagued a Brazilian utility before their successful intervention to prevent theft (Credit: Hans de Keulenaer)
106HOW COMPANIES ARE SERVING THE MARKET
Box 3.11: Case studies on reduction of nontechnical losses – JPSCo and RAMIJamaica’s sole vertically integrated utility, Jamaica Public Service Company (JPSCo), serves approximately 582,000 customers across the island nation. Since privatization in 2001, JPSCo has struggled with persistent and growing electricity losses. Beginning in 2002, metered residential consumption began to decline as nontechnical (commercial) losses rose steadily, indicating a widening problem of illegal connections. By the end of 2009, total system losses were almost 24 percent. More than half were attributable to electricity theft.
To tackle theft of power, JPSCo has been creative in using both internal expertise and international best practice to develop an electricity loss reduction program that both deters power stealing and addresses the culture of nonpayment that has fl ourished in low-income areas like inner-city Kingston. With a newly organized loss control department staffed by almost 300 employees, the company began to focus on residential customers in the identifi ed “Red Zone” areas where losses were above 30 percent of electricity supplied. These communities and informal settlements accounted for an estimated 85 percent of total nontechnical losses. The program that developed was named the Residential Advanced Meter Infrastructure (RAMI).
RAMI projects are composed of an integrated package of outreach and technical offerings for local communities, including consensus building among various local stakeholders, maintaining a local presence at work sites, and sponsoring outreach campaigns to raise customer awareness and provide education about electricity bills and consumption. The utility also runs a community campaign together with the government. This includes information sessions, education through churches and schools, and the establishment of neighborhood satellite offi ces to encourage residents to sign up for legal connections. Residents who volunteer to have their houses safely and legally rewired are eligible for fi nancial assistance, including a four-year interest-free loan from JPSCo.
Once consumers are regularized, billing at full cost is gradually introduced. During the fi rst month, residential bills are 100 percent subsidized to allow the customers to evaluate their electricity use. Subsidies are gradually removed over several months. As consumers become customers, outreach workers go door to door to answer billing questions and educate communities about effi ciency options.
In addition, JPSCo targets illegal connections through a variety of technical strategies, including automated metering, theft-resistant distribution networks, ongoing customer audits, and effective maintenance and controls. In some pilot neighborhoods, meters and connections for a group of households are put in a single pole-mounted enclosure that is programmed to shut off entirely if the enclosure is breached. This has been successful at preventing tampering, a problem often exacerbated by social pressure.
While still in the early stages, JPSCo reports that the program is succeeding both in returning lost revenue and increasing its legal consumer base. Despite challenges and barriers to implementing the RAMI programs, the company estimates that the investment return from Red Zone interventions can be over 200 percent.
CHAPTER 3107
Companies in other grid-connected sectors including water and communications have also offered incentives to reduce theft and nonpayment. Manila Water, a successful private water utility, implemented a “Full Circle Approach,” which sought to expand micro-businesses by including them in its own supply chain, supplementing residents’ income, and helping them pay their monthly bills. Some mobile operators are looking into ways to provide some degree of community service and free cell phone charging (which also increases revenues to the operator from increased cell phone uptake and, thus, talk time) in remote areas. These include MTN and Airtel operating charging kiosks in Kenya and Uganda, respectively; rooftop solar-based power provided by Orange for a clinic in Niger; China Mobile with a mini-grid operation in Sichuan province; and several Safaricom sites across Kenya, providing street lighting, power for community centers, and mobile charging. Such approaches are often designed to help engender a sense of ownership, so that the community takes responsibility for protecting infrastructure, such as meters, water connections, and telecom base stations.55
Focusing on the more complex issue of land tenure in the Indian state of Gujarat, the Ahmedabad Electricity Company Limited has experimented with formalizing household titles as a means of increasing slum electrifi cation. Working together with the Ahmedabad Municipal Corporation, the Gujarat Mahila Housing Trust, and other public sector partners, the Ahmedabad Electricity Company Limited (AEC) introduced subsidized connections, funded in part by USAID and AEC but with a signifi cant payment from the end user. This, together with the issuing of a noneviction certifi cate to each household for a period of 10 years by the Ahmedabad Municipal Corporation, provided them with both the basis on which to secure a connection and a fi nancial incentive to do so. Local NGO partners mobilized the community, building trust and raising capital for the grid extension effort. During its pilot phase from 2001 to 2004, the project connected about 700 households. It has since scaled-up signifi cantly, without public support, and has successfully electrifi ed about 700 slums, reaching over 200,000 households.56
Billing and Payments
Nonpayment of electricity bills is an important concern for many companies in the energy access space, mainly due to the low and volatile incomes of poor families. It is not that people do not want to pay; rather, poor families have diffi culty saving up enough cash to mirror the monthly or quarterly billing cycles typical of utilities. The challenge of lump-sum payments is demonstrated by the continuing popularity of kerosene for lighting (a more expensive, less effi cient, and highly polluting fuel) in grid-connected low-income households, since kerosene can be bought in small volumes, allowing people to manage their energy expenditure more easily.57 The outcome is a no-win situation, because when families sign up for grid power but then fall quickly into arrears, utilities are discouraged from serving poor areas. Meanwhile, those same households may face disconnection, and are further penalized by additional charges (disconnection, reconnection fees) and a long wait for service to be restored, so they in turn begin to resent the utilities and may turn to expensive informal suppliers.
108HOW COMPANIES ARE SERVING THE MARKET
Utilities such as Dominica Electricity Services Limited (DOMLEC) and Umeme, a privately owned Ugandan electricity distributor (and IFC investee), are solving these problems with prepayment meters. Like prepayment for mobile phones, the customer buys widely available tokens, each with a unique code. The code is entered into the meter to credit the account and supply power. When credits run out, the account is not disconnected, but the electricity ceases, to be started again when the customer again has cash available. When prepaid meters are introduced in areas previously served by traditional meters, this can be politically diffi cult for utilities. Thus, such programs are mostly complemented with public education campaigns that explain the relationship between nonpayment and weak electricity service, and demonstrate a clear link between the introduction of prepaid meters and improved service, and grid extension.
DOMLEC, a private company,58 has used prepayment meters to cut billing costs and reduce average collection days, and is planning a full rollout. The company introduced the system after rising fuel prices pushed up the cost of electricity, with a subsequent increase in nonpayment of bills and a hit to the company’s cash fl ow. The new meters display not only the amount of electricity used, but also how many kilowatt hours a consumer has remaining in the account. This information is easy to read and helps households plan and budget their electricity use. The utility reports that the system has been popular with customers because it prevents disconnection and reconnection fees. In addition, DOMLEC spends less trying to collect on defaulted accounts and saves on billing and administrative costs. Midway through the full rollout of the new meters, average collection days had dropped 40 percent. The company now plans to expand the program with full rollout during 2012.
Umeme has also been piloting prepaid meters for its operations, and plans to spend $100 million installing them across the country. The utility cites the same advantages as DOMLEC, in particular lower administrative and bad debt costs.
Ahmedabad Electricity Company has used strategically placed bill collection units and collection vans to improve its billing system. Slum households receive monthly bills—as opposed to bimonthly invoices issued to other customers—while collection relies on a combination of strategically placed bill collection units, located in community organization offi ces, civic centers, post offi ces, gas agency offi ces, and mobile collection vans.
Consumer Financing
New approaches to consumer fi nancing are also emerging, particularly around connection fees. Traditionally, utilities charge customers for new connections, and these up-front charges can often be prohibitive for poor consumers. Many families could in theory afford a monthly power bill commensurate with their current spending on fuel, but not a large up-front connection fee, which can easily run in the hundreds of dollars, even in urban areas. A number of utilities around the world have broken with the traditional practice of connection charges in order to increase their customer base and, consequently, boost access.
CHAPTER 3109
Philippines-based Cagayan Electric Power and Light Company (CEPALCO) illustrates that waiving the connection fee can work. CEPALCO is an electricity distribution utility serving the City of Cagayan de Oro—a small town in the Mindanao region of the Philippines—and the surrounding municipalities. It makes it easy for new customers to connect by waiving the up-front connection fee and asking for a deposit on the fi rst month’s bill before recovering the cost of connection through the sales of power to all connected customers. CEPALCO has grown strongly, from serving 750 customers when it was founded in 1952, to a base of 100,000 customers in 2012. It now serves 96 percent of the households in its franchise area.59 Of course, not charging for the connection increases the amount of capital invested in the company. However, provided the investment is earning a return, in this case through enabling faster connection growth, this need not be a problem. CEPALCO has always been able to attract private equity and debt fi nance suffi cient to meet the company’s growing needs because of its overall performance, including consistent profi tability.
Codensa Hogar in Colombia has shown not only that power distribution companies can successfully provide fi nance to low-income customers, but that this ability may actually represent a valuable hidden asset. Colombia’s Codensa, the private utility supplying the capital Bogotá,60 leveraged its consumer information and utility bill payment track records to create a separate fi nancing arm—Codensa Hogar—to provide customers with consumer fi nancing. Codensa Hogar offers credit cards to Codensa customers, 60 percent of whom have no bank account and 35 percent of whom live on $2 or less per person per day. Codensa Hogar’s clients mostly use their new credit lines for purchasing electrical appliances, which of course spurs demand for power. Indeed, the consumer credit business line quickly became more profi table than Codensa’s core business, generating 7 percent of company revenue and 9 percent of its earnings before interest, taxes, depreciation, and amortization in 2008. In 2009, Codensa sold the business for $290 million to Multibanca Colpatria, which now provides the balance sheet to fi nance the further expansion of the business, while the company retains the role of marketing to its customers and collecting payments from them.
Codensa Hogar was successful because a utility is in a unique position to overcome the challenges of delivering fi nance to low-income markets. The utility already has infrastructure for sending bills, and the incremental cost of adding other fi nancial transactions is low. This is not dissimilar from the approach taken in the device segment of the market, where the distribution channel itself has become an asset for many companies. Cookstove players with strong distribution networks are starting to cross-sell lanterns, and vice versa, and microfi nance institutions are used as a means for selling energy products to borrowers. In this case, Codensa has a database of information relevant for credit-scoring, including repayment records. The question is how this asset can be used; knowing where the customer lives, and being able to cut off power in the event of nonpayment, makes enforcement easier.61
Corporate Finance
PPPs involving public fi nancing that subsidizes private investment have a good track record in extending the grid, connecting customers at a higher rate than national utilities. For example, North Delhi Power Limited (NDPL) was born from the privatization of Delhi’s power distribution company. The local government wanted to lessen subsidy spending and improve service quality by reducing system losses.62 Crucially for access extension, privatization was accompanied by subsidies and regulation reform. Distribution operations were divided into three companies, each covering part of the service territory, and bids were sought from private fi rms that would acquire 51 percent of the shares in each company, and operate and control the company. The government subsidized the price of bulk power for fi ve years to give the private companies time to turn around the loss-making operations, without leading to massive rate increases that would have led to a public outcry.NDPL was the joint venture formed between Tata and the government to manage one of the areas. Since its formation in 2002, NDPL has almost doubled connections to 1.2 million, much of this through grid extension, and has regularized connections in slum areas. Importantly, since privatization, it has also been able to attract fi nancing. Total capital investment in the company since 2003 is over $610 million.63
110HOW COMPANIES ARE SERVING THE MARKET
Guatemala’s rural electrifi cation concessions have succeeded in extending access by combining a well thought out package of sector reforms, private management and fi nance of the utility, a concession contract, and output-based subsidies for new connections. In 1999, Guatemala privatized its rural power distribution companies through a concession, which was won by Spanish utility Union Fenosa Internacional. The contract required Union Fenosa to connect at zero cost all customers in the area who wanted service, provided they were within 200 meters of the existing distribution grid. The government then established the Rural Electrifi cation Program to extend the distribution network to 2,633 communities beyond the 200-meter limit, by providing an Output-Based Aid subsidy of $650 per connection. This payment funded the rollout of the network to unserved communities and encouraged the company to deliver on policy goals. The combination of privatization with the incentive-based connection subsidies in the rural power sector has led to a more than doubling of connections to 810,000 within 10 years. The company is also profi table: in 2009 it reported earnings before income, tax, depreciation, and amortization of $45.5 million.64
In Chile, a concession-based PPP was used to attract private sector investment to electrify about 240,000 unserved households, primarily through grid extension. In the mid-1990s, about 50 percent of Chile’s rural population was electrifi ed compared with 97 percent in urban centers. The government established an electrifi cation fund designed to provide a one-time payment or viability gap subsidy on the capital costs of private companies connecting rural customers to the network. No subsidies were offered to cover operational costs. Competition was encouraged by requiring companies to propose electrifi cation projects to regional governments, which allocated fi nancing to the operator largely based on the lowest cost to serve. Regional governments, in turn, would receive a fi scal allocation from the central government based on their connection rate, so were incentivized to select high-performing companies to deliver services.65 The Government of Chile’s program was in part funded through concessional loans from the World Bank and the Inter-American Development Bank. Over the decade that it was operational, the program achieved almost universal rural electrifi cation, and is considered a good example of subsidy allocation.
The Government of Senegal has also opted for a concession contract approach rather than privatization to extend grid supply through its Senegal Rural Electrifi cation Concessions program. In 2004, it divided the unserved parts of the country into 10 rural electrifi cation zones then bid out contracts over time. Contractors have to meet connection quotas, which require that they build, fi nance, operate, and maintain a new rural distribution utility. The government subsidizes capital costs per new connection, given that much of the area cannot be served commercially. By covering the viability gap inherent in grid-based electrifi cation for poor communities, the subsidy has attracted private capital to the table, including an investment of $400,000 by IFC. This use of Output-Based Aid, combined with competitive tenders, should yield the maximum extension of access for any given level of public funding.66 The concession contract design is technology-neutral, which allows the concessionaire to decide which mix of technologies makes best commercial sense in which areas, and also provides for certain off-grid targets to be met, for example, with solar home systems. The fi rst concession was awarded to ONE, the Moroccan utility, in 2007/08, and covers 15 percent of Senegal.67 It will be contractually bound to provide over 19,000 connections—13,000 grid connections, and 6,000 solar home systems. Thirty-fi ve percent of the capital costs will be provided by a government grant.
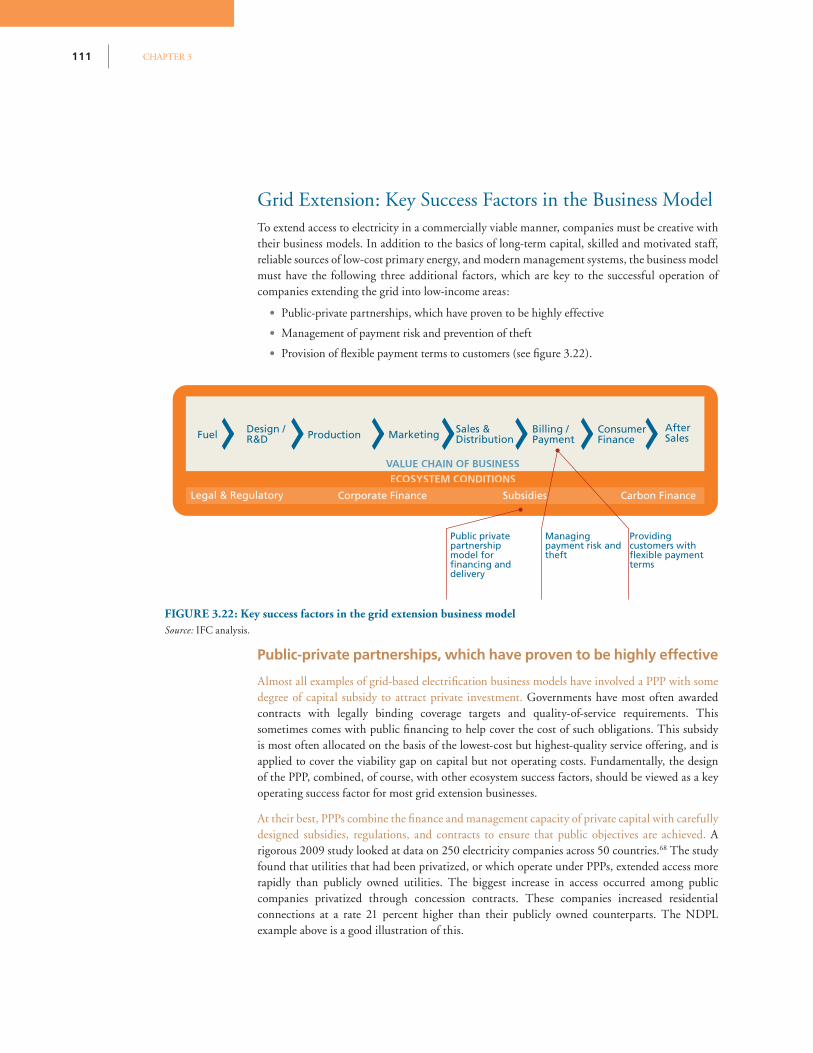
CHAPTER 3111
Grid Extension: Key Success Factors in the Business ModelTo extend access to electricity in a commercially viable manner, companies must be creative with their business models. In addition to the basics of long-term capital, skilled and motivated staff, reliable sources of low-cost primary energy, and modern management systems, the business model must have the following three additional factors, which are key to the successful operation of companies extending the grid into low-income areas:
• Public-private partnerships, which have proven to be highly effective
• Management of payment risk and prevention of theft
• Provision of fl exible payment terms to customers (see fi gure 3.22).
Public-private partnerships, which have proven to be highly effective
Almost all examples of grid-based electrifi cation business models have involved a PPP with some degree of capital subsidy to attract private investment. Governments have most often awarded contracts with legally binding coverage targets and quality-of-service requirements. This sometimes comes with public fi nancing to help cover the cost of such obligations. This subsidy is most often allocated on the basis of the lowest-cost but highest-quality service offering, and is applied to cover the viability gap on capital but not operating costs. Fundamentally, the design of the PPP, combined, of course, with other ecosystem success factors, should be viewed as a key operating success factor for most grid extension businesses.
At their best, PPPs combine the fi nance and management capacity of private capital with carefully designed subsidies, regulations, and contracts to ensure that public objectives are achieved. A rigorous 2009 study looked at data on 250 electricity companies across 50 countries.68 The study found that utilities that had been privatized, or which operate under PPPs, extended access more rapidly than publicly owned utilities. The biggest increase in access occurred among public companies privatized through concession contracts. These companies increased residential connections at a rate 21 percent higher than their publicly owned counterparts. The NDPL example above is a good illustration of this.
Fuel Design /R&D Production Marketing Sales &
DistributionBilling / Payment
After Sales
ECOSYSTEM CONDITIONS
Corporate Finance Carbon Finance
ConsumerFinance
Subsidies
Public private partnership model for financing and delivery
VALUE CHAIN OF BUSINESS
Legal & Regulatory
Managing payment risk and theft
Providing customers with flexible payment terms
FIGURE 3.22: Key success factors in the grid extension business modelSource: IFC analysis.
112HOW COMPANIES ARE SERVING THE MARKET
Management of payment risk and prevention of theft
Because weak revenues are the biggest deterrent to investments along the grid extension value chain, companies need to reduce power theft and improve collection rates to maximize viability. This may be done by using smart technologies such as prepaid meters.
However, companies should also build a social contract with communities to encourage legal connections. Leveraging CSR programs to encourage willingness to pay within a community can help—especially when they offer services that customers value, such as Internet facilities or life insurance, as has been the case with NDPL. Some fi rms have succeeded in developing more symbiotic relationships in their BOP service areas by explaining the link between theft and higher rates or frequent power outages (for technical and fi nancial reasons), and the impact of losses on grid expansion.
“Utilities that have been privatized, or which
operate under public-private partnerships, extend
access more rapidly than publicly owned utilities.”
Provision of fl exible payment terms to customers
It is crucial that fi rms fi nd ways to help poor customers keep up with electricity consumption bills when income is low and volatile. Prepayment meters can help to expand access by cutting administrative costs and bad debts, thus enhancing profi tability. And by making payment easier for customers, reducing the risk and cost of disconnection, they have an additional benefi t of encouraging demand.
As utilities adopt prepayment meters, opportunities to innovate further are likely to grow. For example, electricity companies could partner with phone companies to accept their scratch cards. This has the potential to further reduce costs and increase the convenience of the prepayment system. The meters could be enabled for mobile phone communications, allowing families and friends to pay an electricity bill by sending an SMS message transferring credit, as is commonly done between mobile phone accounts in developing countries. This could increase sales for the utility and also increase energy access, because better-off relatives would be able to cheaply and remotely pay the electricity bill of relatives in rural areas. Perhaps electricity will start to be sold as part of a “quintuple play” along with mobile, fi xed wireless, broadband Internet, and pay TV by companies that are already bundling the other four services, like Dialog in Sri Lanka. Or maybe electricity companies will start selling “microcredits,” for as little as U$0.25 worth of power at a time, like Idea Cellular has done with mobile talk time to drive its penetration of the rural telephony market in India.69
Smart metering could even be used to offer special “low-price power deals” to poor users when there is excess capacity, or to give low-income customers additional credit for reducing their demand during peak times when power cuts might otherwise be a risk.
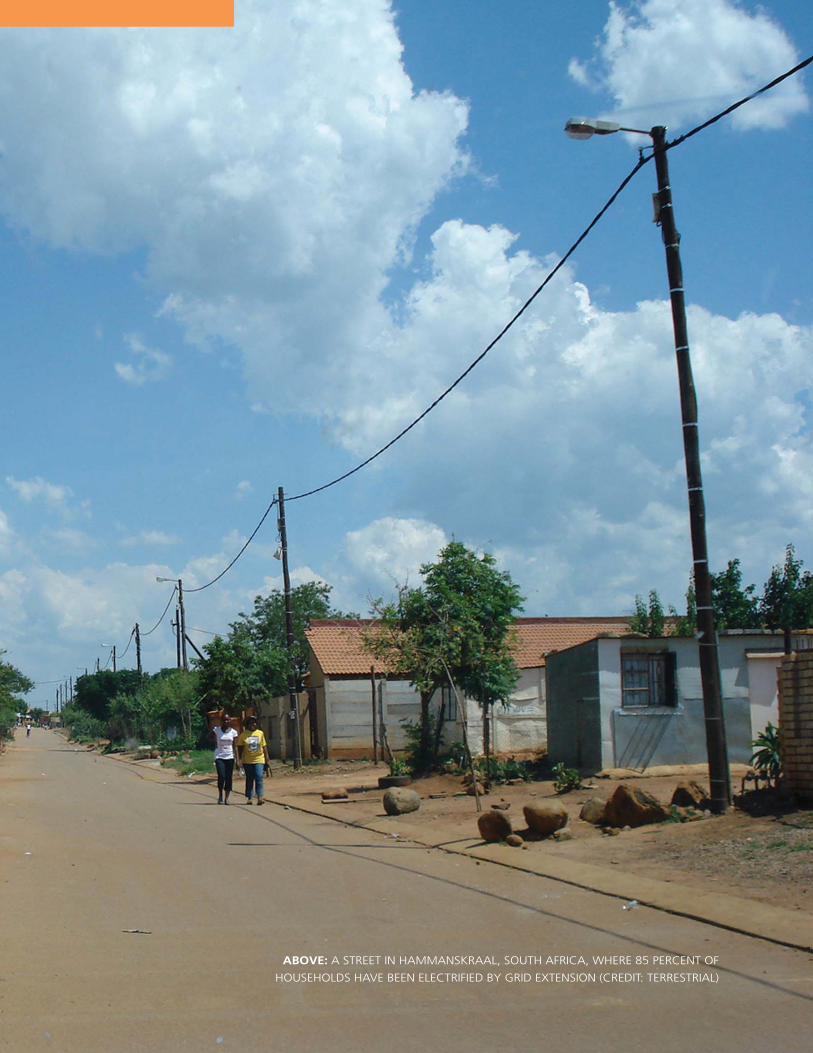
CHAPTER 3113
ABOVE: A STREET IN HAMMANSKRAAL, SOUTH AFRICA, WHERE 85 PERCENT OF
HOUSEHOLDS HAVE BEEN ELECTRIFIED BY GRID EXTENSION (CREDIT: TERRESTRIAL)
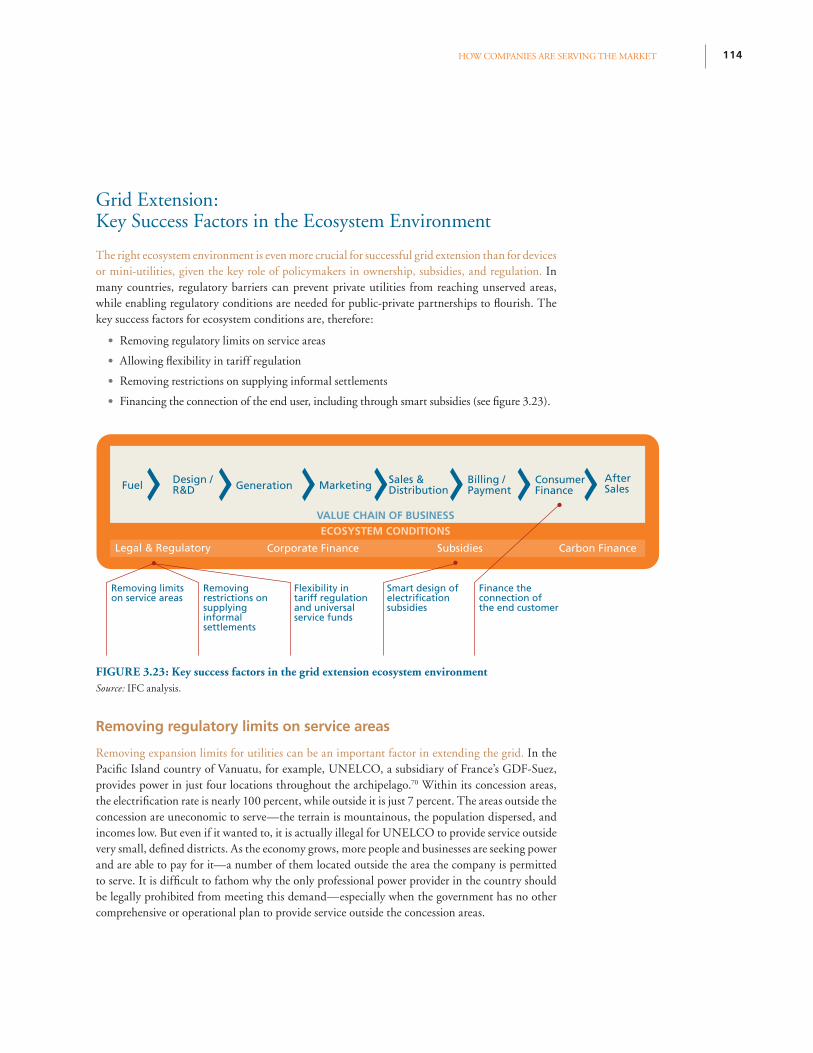
114HOW COMPANIES ARE SERVING THE MARKET
Grid Extension: Key Success Factors in the Ecosystem Environment
The right ecosystem environment is even more crucial for successful grid extension than for devices or mini-utilities, given the key role of policymakers in ownership, subsidies, and regulation. In many countries, regulatory barriers can prevent private utilities from reaching unserved areas, while enabling regulatory conditions are needed for public-private partnerships to fl ourish. The key success factors for ecosystem conditions are, therefore:
• Removing regulatory limits on service areas
• Allowing fl exibility in tariff regulation
• Removing restrictions on supplying informal settlements
• Financing the connection of the end user, including through smart subsidies (see fi gure 3.23).
Removing regulatory limits on service areas
Removing expansion limits for utilities can be an important factor in extending the grid. In the Pacifi c Island country of Vanuatu, for example, UNELCO, a subsidiary of France’s GDF-Suez, provides power in just four locations throughout the archipelago.70 Within its concession areas, the electrifi cation rate is nearly 100 percent, while outside it is just 7 percent. The areas outside the concession are uneconomic to serve—the terrain is mountainous, the population dispersed, and incomes low. But even if it wanted to, it is actually illegal for UNELCO to provide service outside very small, defi ned districts. As the economy grows, more people and businesses are seeking power and are able to pay for it—a number of them located outside the area the company is permitted to serve. It is diffi cult to fathom why the only professional power provider in the country should be legally prohibited from meeting this demand—especially when the government has no other comprehensive or operational plan to provide service outside the concession areas.
Fuel Design /R&D Generation Marketing Sales &
DistributionBilling / Payment
After Sales
ECOSYSTEM CONDITIONS
Corporate Finance Carbon Finance
ConsumerFinance
Subsidies
VALUE CHAIN OF BUSINESS
Legal & Regulatory
Removing limits on service areas
Removing restrictions on supplying informal settlements
Flexibility in tariff regulation and universal service funds
Smart design of electrification subsidies
Finance the connection of the end customer
FIGURE 3.23: Key success factors in the grid extension ecosystem environmentSource: IFC analysis.
CHAPTER 3115
Another option is to allow concessions to provide a monopoly for grid power, but then to open up competition in the off-grid and mini-grid power supply. From the outset, Vietnam followed this path, allowing mini-hydro systems to operate in hard-to-reach areas, even if these were technically part of a concession but not being served by the grid. Later, when the grid reached them, these previously isolated systems connected to it or, alternatively, stopped operating. Today, over 50,000 households are still electrifi ed by such installations. This scenario can also be observed in the Philippines and in a handful of other countries.71 Governments have been removing regulatory restrictions on mini-utilities. Logically, then, they could advance access by also allowing utilities that want to extend their grids outside their defi ned service areas to do so, where appropriate, with a minimum of regulatory hassle.
Removing restrictions on supplying informal settlements
Restrictions on supplying informal settlements in developing countries also hinder the extension of energy access. To discourage squatting, utilities are often banned from serving people living in slum areas and urban peripheries because dwellers do not have legal titles to the land.
In areas as diverse as Jamaica and the Indian National Capital Territory of Delhi, governments have managed to decouple utility supply from land title through simple legal changes. This has not been without debate, of course, but in both cases new rules make clear that the utility is allowed to supply any willing customer in the service area, and that legal supply of power does nothing to confer land title or government authorization of the dwelling. As a result, privately owned utilities such as JPSCo and NDPL have been able to profi tably supply slums and urban peripheries legally, as have others such as the Ahmedabad Electricity Company.
These initiatives have been highly successful and could be replicated by policymakers in other countries that limit informal settlement supply. Such models provide residents with access to a formal power connection while also allowing the utilities to cut down on the theft of power by regularizing illegal connections.
Allowing fl exibility in tariff regulation
Regulators should be allowed to set different tariffs for different areas, based on the cost of delivery, so that utilities can charge rates that make it commercially viable for them to extend the grid. Governments and regulatory bodies frequently set caps on tariffs that make it unprofi table for utilities to serve poor customers, especially those in rural areas where cost of service is typically higher. Although clearly intending to make power affordable for poor customers, this can in fact have the opposite effect, stopping utilities from extending access and thus forcing the poor to rely on even more expensive and problematic household fuels or illegal suppliers. One alternative is for regulators to set different tariffs for different areas, based on the cost of delivery. This approach is not dissimilar to the feed-in tariffs designed to attract renewable energy, which is often more expensive than conventional generation, into the supply mix.
116HOW COMPANIES ARE SERVING THE MARKET
There are other instances where tariff regimes fail to incentivize reductions in transmission and distribution losses—say, when any loss reduction is directly passed through to consumers through rate reductions. Instead of a full pass-through, regulators could incentivize loss reductions by progressively assuming linear loss reductions over time, thus forcing the utility to reduce losses by the assumed amount. This would permit the utility to maintain profi tability, while allowing companies to reap the benefi ts of any additional loss reductions above the “assumed rate” until the next tariff cycle.
Finally, policymakers could adapt the concept of a universal service fund from the telecommunications sector. Under this approach, a government plan levies a charge on customers in urban areas, to create a fund to subsidize service in rural areas that are more expensive to serve. The subsidies cover the difference between the rural tariff and the true cost of supply to a level where poorer areas are profi table to serve. The Philippines has done exactly this with its Missionary Electrifi cation Fund. Colombia does something similar to keep down tariffs charged by mini-utilities in the noninterconnected zone of the country. The same concept could easily be extended to the supply of power involving grid extension to a rural area, and should be considered as an alternative to straightforward tariff regulation.
Financing the connection of the end user, including through smart subsidies
Grid utilities, like mini-utilities, should fi nd a way to fi nance the up-front costs of connections. As noted throughout this report, credit supply is often a key factor for success in inclusive businesses across sectors. A majority of the 14 companies reviewed in a 2010 IFC publication on the base of the pyramid either provided consumer fi nance themselves, or partnered with another organization that did.72
Subsidies can sometimes help utilities cover connection costs, enabling grid extension into very poor areas. This need not always be the case—for instance, AEC in India and CEPALCO in the Philippines were able to extend access to slum areas without public funds. But in other instances, particularly when governments are determined to extend access to zones where customers are not willing and able to pay the full commercial cost of service, then much more public policy and fi nancial support is needed to incentivize companies to enter the market.
Well-designed public fi nancing policies ideally combine the best of private fi nance and management with a subsidy that fi lls the viability gap and allows grid extensions into areas that would otherwise be uneconomic to serve. This can either be achieved through a PPP, as in Guatemala, Morocco, and Senegal, where concession contracts place legally binding coverage and service targets on the company involved, and provide output-based subsidies, or subsidies can be provided to private utilities, as in Brazil. There, the governments sought to maximize the access achieved per dollar of public funding through a program called Luz para Todos, which provides capital subsidies to help fi ll the viability gap. CEMAR, the private utility serving the Brazilian State of Maranhão—one of the poorest in the country with 6.2 million inhabitants earning a per capita income 29 percent below the national average—was able to take advantage of this program and succeeded in extending access by 50 percent to the poor.73
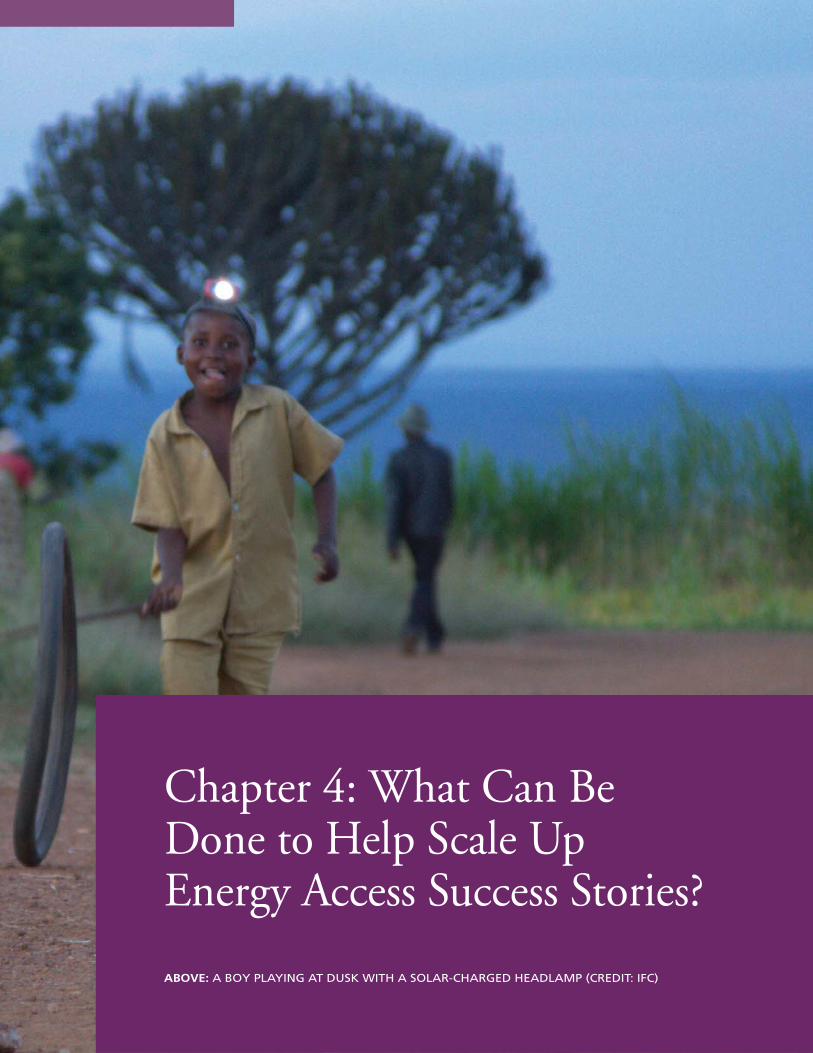
CHAPTER 4117
Chapter 4: What Can Be Done to Help Scale Up Energy Access Success Stories?
ABOVE: A BOY PLAYING AT DUSK WITH A SOLAR-CHARGED HEADLAMP (CREDIT: IFC)
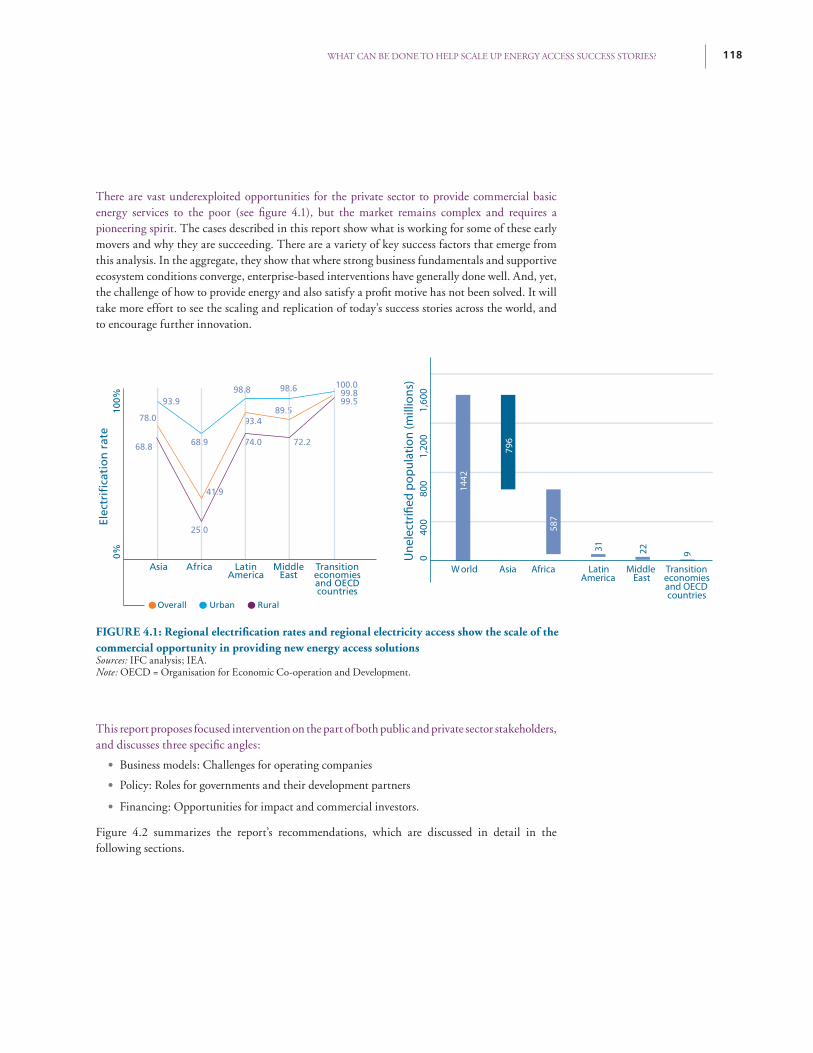
WHAT CAN BE DONE TO HELP SCALE UP ENERGY ACCESS SUCCESS STORIES?
There are vast underexploited opportunities for the private sector to provide commercial basic energy services to the poor (see fi gure 4.1), but the market remains complex and requires a pioneering spirit. The cases described in this report show what is working for some of these early movers and why they are succeeding. There are a variety of key success factors that emerge from this analysis. In the aggregate, they show that where strong business fundamentals and supportive ecosystem conditions converge, enterprise-based interventions have generally done well. And, yet, the challenge of how to provide energy and also satisfy a profi t motive has not been solved. It will take more effort to see the scaling and replication of today’s success stories across the world, and to encourage further innovation.
This report proposes focused intervention on the part of both public and private sector stakeholders, and discusses three specifi c angles:
• Business models: Challenges for operating companies
• Policy: Roles for governments and their development partners
• Financing: Opportunities for impact and commercial investors.
Figure 4.2 summarizes the report’s recommendations, which are discussed in detail in the following sections.
FIGURE 4.1: Regional electrifi cation rates and regional electricity access show the scale of the commercial opportunity in providing new energy access solutionsSources: IFC analysis; IEA.Note: OECD = Organisation for Economic Co-operation and Development.
Overall
93.9
78.0
68.8 68.9
41.9
98.8
93.4
74.0 72.2
100.099.899.5
89.5
98.6
25.0
Urban Rural
Elec
trifi
cati
on
rat
e10
0%0%
Asia Africa LatinAmerica
MiddleEast
Transitioneconomiesand OECDcountries
Une
lect
rified
pop
ulat
ion
(mill
ions
)0
400
8
00
1,2
00
1,6
00
Asia Africa W orld LatinAmerica
MiddleEast
Transitioneconomiesand OECDcountries
1442
31 22 9
796
587
118
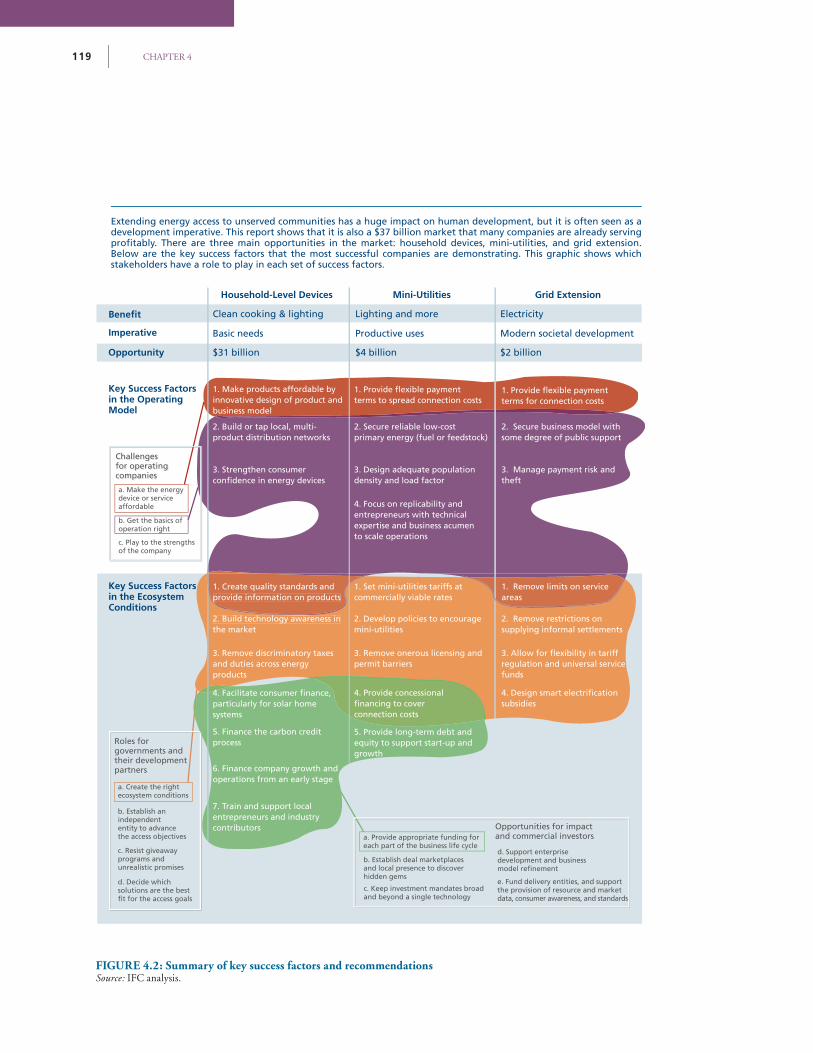
CHAPTER 4119
Extending energy access to unserved communities has a huge impact on human development, but it is often seen as a development imperative. This report shows that it is also a $37 billion market that many companies are already serving
Below are the key success factors that the most successful companies are demonstrating. This graphic shows which stakeholders have a role to play in each set of success factors.
Opportunity
Household-Level Devices Mini-Utilities Grid Extension
Clean cooking & lighting Lighting and more Electricity
Basic needs Productive uses Modern societal development
$31 billion $4 billion $2 billion
product distribution networks primary energy (fuel or feedstock)2. Secure business model with some degree of public support
3. Strengthen consumer 3. Design adequate population density and load factor
3. Manage payment risk and theft
1. Make products affordable by innovative design of product and business model
4. Focus on replicability and entrepreneurs with technical expertise and business acumen to scale operations
terms for connection coststerms to spread connection costs
c. Play to the strengthsof the company
1. Create quality standards and provide information on products commercially viable rates
1. Remove limits on service areas
2. Build technology awareness in the market
2. Develop policies to encourage 2. Remove restrictions on supplying informal settlements
3. Remove discriminatory taxes and duties across energy products
3. Remove onerous licensing and permit barriers regulation and universal service
funds
subsidies
Imperative
Key Success Factors in the OperatingModel
Challengesfor operating companies
Challenges for operating companies
Key Success Factors in the EcosystemConditions
Roles for governments andtheir developmentpartners
Roles for governments and their development partners
b. Get the basics of operation right
a. Make the energy device or service affordable
p
Opportunities for impact and commercial investorsOpportunities for impact and commercial investors
growth
4. Provide concessional
connection costsparticularly for solar home systems
7. Train and support local entrepreneurs and industry contributors
6. Finance company growth and operations from an early stage
5. Finance the carbon credit process
d. Decide which solutions are the best
b. Establish an independent entity to advance the access objectives
c. Resist giveaway programs and unrealistic promises
a. Create the right ecosystem conditions
c. Keep investment mandates broad and beyond a single technology
b. Establish deal marketplacesand local presence to discover hidden gems
a. Provide appropriate funding for each part of the business life cycle
d. Support enterprise development and business
e. Fund delivery entities, and support the provision of resource and market data, consumer awareness, and standards
FIGURE 4.2: Summary of key success factors and recommendationsSource: IFC analysis.
WHAT CAN BE DONE TO HELP SCALE UP ENERGY ACCESS SUCCESS STORIES?
Refi ning Business Models: Challenges for Operating CompaniesHigh sales volumes are essential in low-income consumer markets, and companies must strive to achieve scale. This is true because, even though many of these products and services sell at high margins, the revenue per item is low. The examples in this report show that scale is possible in these markets and that entrepreneurs can achieve this by:
• Making the energy device or service affordable
• Playing to the strengths of the company
• Getting the basics of operation right.
Making the energy device or service affordable
Affordability is a consistent theme in this report and is largely achieved through business model and device innovation together with the provision of consumer fi nance either directly or indirectly. Other strategies include rental models for devices, fi xed-fee/fi xed service mini-grids, and prepaid meters for grid electrifi cation. Companies should concentrate on as many of these as are relevant to their circumstances, especially in conjunction with the two recommendations below, to create an operating model that allows products to match customers’ available funds.
Playing to the strengths of the company
Capitalizing on inherent strengths is essential for companies to optimize operations and to develop a case for potential partnering. We have seen how smaller companies, especially those that are locally run, have several advantages; they are often nimble and have lower costs, good local knowledge, a deep understanding of the consumer, and reach through innovative networks. Larger fi rms have deep pockets, management expertise, some value chain advantages, convening power, and the ability to scale across geographies. In some cases, astute partnerships can tap the respective advantages of different players. Some companies are already doing this by developing, marketing, and cross-selling devices.
It is also important that energy access fi rms focus on making the business case clear and on building professional management teams. Given that many start-ups begin life as social enterprises, the social benefi ts of their endeavors are usually well communicated. But potential investors are looking for both a strong business case and perhaps also a great
story about potential development impact; rarely is the latter suffi cient for consistently attracting capital, even from impact investors. Hence, fundamental to securing fi nancing is that the commercial business plan be well thought through, and, fairly soon after they get going, fi rms think about professionalizing their management teams to take the business forward and help it grow sustainably.
Meanwhile, larger companies must ensure that ventures into the energy access market, which often start as relatively small initiatives below the top management radar screen, have good visibility within the company—as a CEO-sponsored effort, for example—and use this platform to leverage core competencies from around the business. The initiative may be incubated in the corporate social responsibility (CSR) department or another “soft start” area of the fi rm, but it cannot be allowed to remain there. After due time is allowed for the creation of an innovative model to serve target markets, it must be treated fully commercially. Lessons can be drawn from the Bonny Utility Company’s experience in moving from CSR to business (see box 3.8).
Getting the basics right: Devices companies must focus on mastering distribution
Distribution has emerged as the major determiner of commercial success in selling modern energy solutions to underserved households, and this report has discussed in detail the need for companies to master this challenge either by building their own channels or by leveraging those of partners. Historically, powerful distributors like Procter & Gamble and Unilever have managed to build strong bargaining positions and extract a substantial share of the value created by the consumer goods industry. We believe that a similar position of strength will accrue to those who win the distribution race in modern energy devices for the poor.
Companies can strengthen distribution by partnering strategically with businesses that have already established strong channels. In this report, we have discussed companies distributing through microfi nance institutions, government institutions, and international development agencies. We have also seen examples of and distribution through large local conglomerates or multinationals.
Successful companies, once they have built effective distribution networks, expand their product portfolios to include other devices, and also bundle these products with a fi nancing package. Another emerging approach with signifi cant potential could be to piggyback on broader country and potentially even
120
CHAPTER 4121
international distribution networks offered by, for example, mobile phone network operators. This approach could be used to solve several critical issues faced by many small device innovators, notably: strong brand recognition in rural areas, scaling product delivery logistics, securing working capital fi nance for retailers, and providing comprehensive after-sales service in remote communities.
Once companies have built effective distribution networks, they should consider expanding product portfolios to include other devices, and possibly to bundle these products with a fi nancing package. Equally, if an energy access company has been able to develop strong networks of its own, it can leverage this asset to cross-sell other products, be they complementary energy access devices (such as cookstove manufacturers also selling PV lanterns) or other products that would be desirable in their target markets (for example, cell phones, radios, irrigation pumps, water purifi ers). This has been demonstrated by a number of local cookstove players, which are now adding products to their portfolios and serving as distribution agents for business partners approaching them.
Getting the basics right: Mini-utilities must focus on developing innovative approaches to scaling up
The fi rst step is to secure adequate fuel or feedstock supply and then secure suffi cient energy demand. These may seem obvious, but both of these are described in our examples as serious challenges, alongside the strategies that successful mini-utilities are using to overcome them. They deserve proper consideration at the planning stages. A number of interesting options exist to build baseload. One centers around an “anchor client” in industries in or near communities needing power. Companies in remote areas could develop service agreements with larger government institutions. These might include agricultural training or extension facilities, clinics, and schools. They could also be remote power systems operated by the incumbent utility, as Andoya has done.
There is clearly no silver bullet when it comes to successfully scaling up a business model, and companies need to develop tailored, innovative solutions, which might include serving multiple anchor clients that are themselves owned or operated by a single company. As with devices, it is important for mini-grid businesses to fi nd ways to grow—both in order to attract capital and, importantly, talent, but also to capture operating and cost effi ciencies that come with scale.
There could be signifi cant potential for mini-utilities to engage mobile base stations owned by one or multiple mobile network
operators as anchor clients. As mentioned in the preceding section, mobile telephony is a sector that successfully managed the last-mile distribution challenge to remote off-grid areas. There are over half a billion off-grid subscribers today, and an estimated 639,000 off-grid base stations are expected to be in service by 2012, predominantly in the developing world. This could present an interesting opportunity for mini-utilities to tap the anchor load potential created by base stations.
Off-grid base stations are often located in remote, yet suffi ciently densely populated areas to justify the capital expenditure (excepting where required by regulation) and are normally powered by diesel generators with an average excess capacity of 5 kW. GSMA, in collaboration with IFC, is currently piloting models to leverage this infrastructure for the extension of electricity to unserved rural communities.74 A battery-charging service is being tested in Africa through the Lighting Africa program, which is exploring the commercial and operational viability of running third-party charging shops fed by the excess capacity of existing network-owned base station generators. Here, 5 kW of excess capacity could supply around 40 households using a basic mini-grid. The concept could then be taken to the next level by using base stations as baseload clients for independent local mini-utilities.
A precondition for this would be a well-functioning mini-utility that can guarantee power for the mobile tower, however, because system “up-time” is both critical to network profi tability and often a regulatory requirement. Outsourcing base station power to mini-utilities would allow mobile operators to concentrate on the operation of the base stations, freeing them from the noncore tasks of securing continuous power generation and protecting the equipment against theft. Also, a local independent operator could help mitigate the increasingly common community expectation that excess power from mobile towers should be available at all times and without cost. If designed properly, there is potential for local energy services companies and the mobile phone industry to partner and meet both base station power and local community needs commercially. Of course, effectively capturing this latent potential would require innovative business models, but also training of operators, and the extension of fi nancing options. (Figure 4.3 shows the growth of base stations in developing regions.)
An “umbrella company” franchise model could possibly deliver the required management expertise, economies of scale, and capital to develop “multiple site” mini-utilities. What would it take for mini-utilities to replicate in the tens or hundreds of systems across a country or region? Local entrepreneurs bring critical community knowledge and perhaps low overheads to
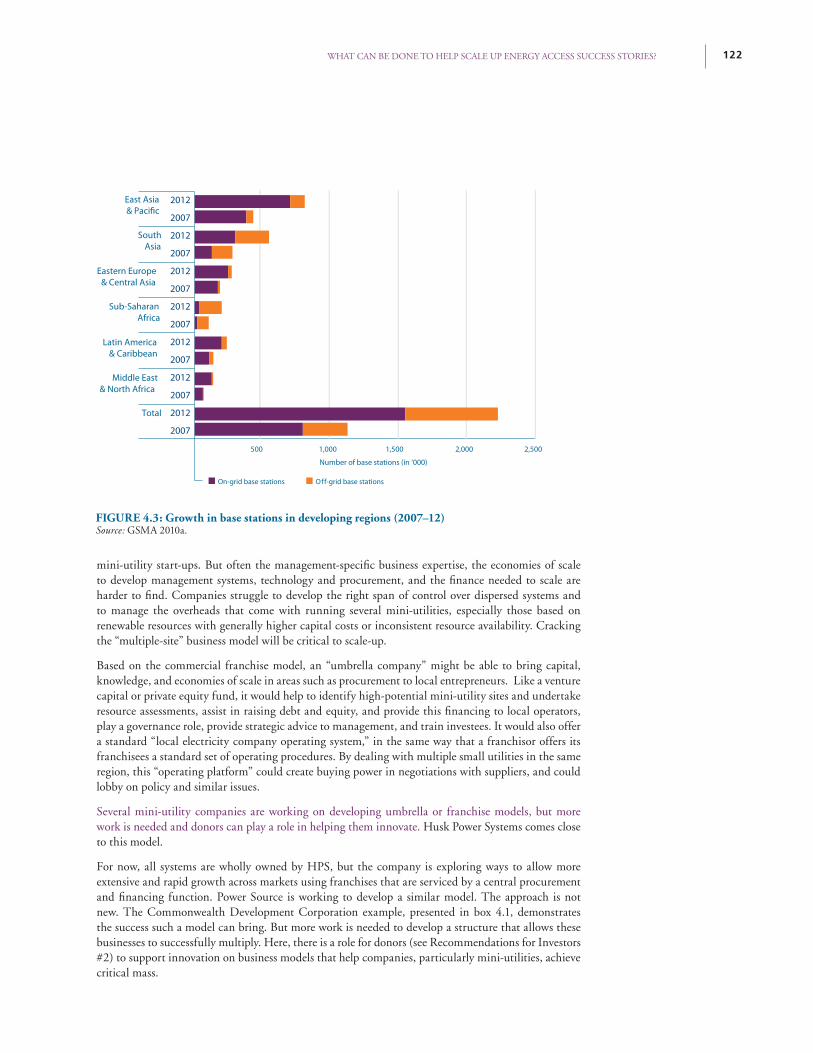
WHAT CAN BE DONE TO HELP SCALE UP ENERGY ACCESS SUCCESS STORIES?
mini-utility start-ups. But often the management-specifi c business expertise, the economies of scale to develop management systems, technology and procurement, and the fi nance needed to scale are harder to fi nd. Companies struggle to develop the right span of control over dispersed systems and to manage the overheads that come with running several mini-utilities, especially those based on renewable resources with generally higher capital costs or inconsistent resource availability. Cracking the “multiple-site” business model will be critical to scale-up.
Based on the commercial franchise model, an “umbrella company” might be able to bring capital, knowledge, and economies of scale in areas such as procurement to local entrepreneurs. Like a venture capital or private equity fund, it would help to identify high-potential mini-utility sites and undertake resource assessments, assist in raising debt and equity, and provide this fi nancing to local operators, play a governance role, provide strategic advice to management, and train investees. It would also offer a standard “local electricity company operating system,” in the same way that a franchisor offers its franchisees a standard set of operating procedures. By dealing with multiple small utilities in the same region, this “operating platform” could create buying power in negotiations with suppliers, and could lobby on policy and similar issues.
Several mini-utility companies are working on developing umbrella or franchise models, but more work is needed and donors can play a role in helping them innovate. Husk Power Systems comes close to this model.
For now, all systems are wholly owned by HPS, but the company is exploring ways to allow more extensive and rapid growth across markets using franchises that are serviced by a central procurement and fi nancing function. Power Source is working to develop a similar model. The approach is not new. The Commonwealth Development Corporation example, presented in box 4.1, demonstrates the success such a model can bring. But more work is needed to develop a structure that allows these businesses to successfully multiply. Here, there is a role for donors (see Recommendations for Investors #2) to support innovation on business models that help companies, particularly mini-utilities, achieve critical mass.
500
East Asia& Pacific
Eastern Europe& Central Asia
Sub-SaharanAfrica
Latin America& Caribbean
Middle East& North Africa
Total
South Asia
1,000
Number of base stations (in ‘000)
1,500 2,000 2,500
Off-grid base stationsOn-grid base stations
2012
2007
2012
2007
2012
2007
2012
2007
2012
2007
2012
2007
2012
2007
FIGURE 4.3: Growth in base stations in developing regions (2007–12)Source: GSMA 2010a.
122
CHAPTER 4123
Box 4.1: Commonwealth Development Corporation as a mini-utility developer and platform companyHistorically, the British Commonwealth Development Corporation (CDC) was a successful practitioner of the umbrella company concept in the Eastern Caribbean.
In the early 1960s, CDC acted as a developer and equity provider for what were effectively mini-utilities in the small territories of the Eastern Caribbean region, and played a vital role in the electrifi cation of several islands. CDC was the strategic founding shareholder in Dominica Electricity Services Limited (DOMLEC), St. Lucia Electricity Services (LUCELEC), Grenada Electricity Services (GRENLEC), St. Vincent Electricity Services Limited (VINLEC), and Montserrat Electricity Services (MONLEC), where it owned the majority of shares, generally in partnership with each island government. In each case, electrifi cation was at very low levels when the utilities were created.
Over the years, the electrifi cation of each island has steadily increased. In Grenada following incorporation of GRENLEC in 1960, installed generating capacity has increased steadily over the years from 1.85 MW in 1960 to 40 MW in 2003 to about 49 MW in 2012. During the same period, the number of consumers increased from 550 to about 40,000 in 2003 to about 41,300 in 2012. Almost the entire country (99.5 percent) is now electrifi ed.
In St. Lucia, LUCELEC was incorporated as a private limited liability company in 1964. The company, led by CDC, acquired the electricity business and assets of the Castries Town Council and the Government of St. Lucia, and LUCELEC’s license became effective in 1965. The number of consumers has increased from about 4,000 in 1965 to 18,000 in 1985 to about 59,600 in 2012. The other three utilities have shown similar growth patterns and have achieved universal electrifi cation.
The fi ve utilities were established on strictly commercial lines, with guaranteed rates of return. CDC ran each utility as a separate business, but kept a full-time Regional Engineering Advisor stationed in nearby Barbados. He was assisted by an electrical engineer stationed in St. Lucia who, among other things, conducted annual technical audits in each of the utilities but would also travel to each company to ensure compliance with established operating procedures and provide advice on problems as they arose. CDC also provided a central purchasing, accounting support, and fi nancial management facility.
DOMLEC, GRENLEC, and LUCELEC are all now profi table, privately owned companies. All have a mix of international strategic shareholders and local ownership, and all are listed on the local stock exchange. In contrast, VINLEC and the utility in Montserrat are now government owned, since CDC sold its shares.
CHAPTER 4123
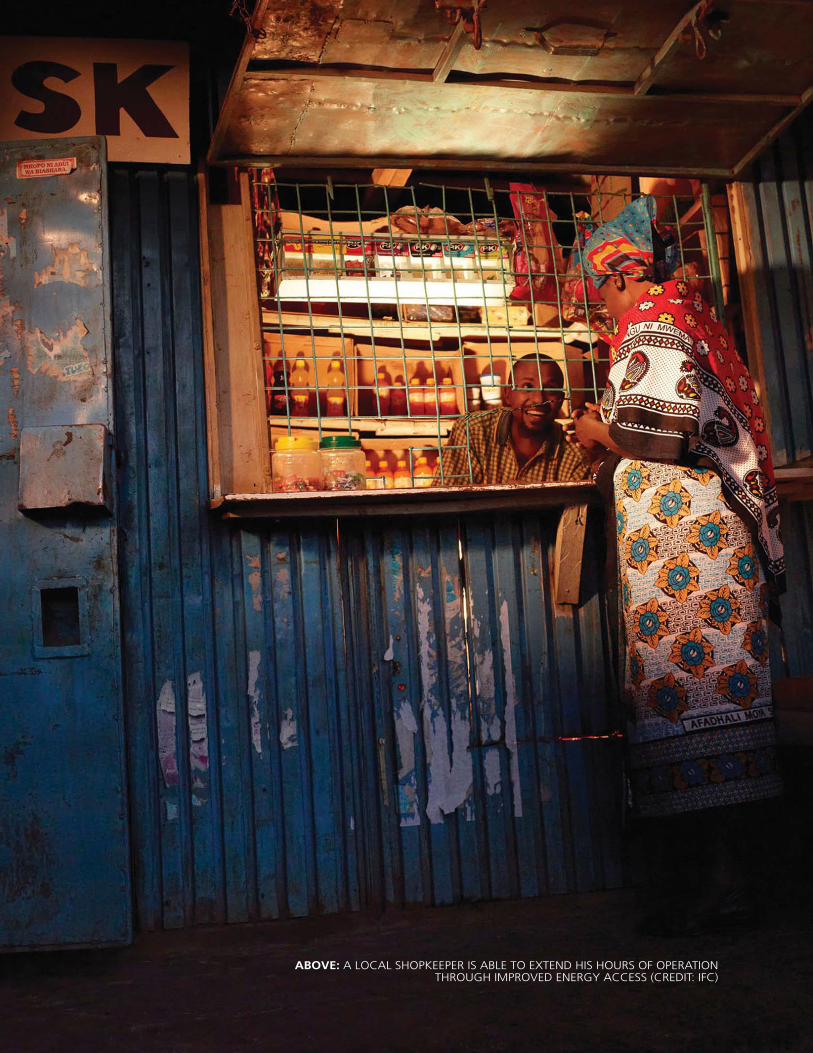
WHAT CAN BE DONE TO HELP SCALE UP ENERGY ACCESS SUCCESS STORIES?
ABOVE: A LOCAL SHOPKEEPER IS ABLE TO EXTEND HIS HOURS OF OPERATION THROUGH IMPROVED ENERGY ACCESS (CREDIT: IFC)
CHAPTER 4125
Getting the Basics Right: Grid-based Utilities Fundamentally should Focus on Becoming Fit for Purpose
It is critical that grid utilities operate effi ciently, which begins with reducing theft and improving payment management. For grid extension, public-private partnerships such as concessions hold promise to extend reach when they are carefully structured with incentives to connect end users. Here, it is important to prioritize delivery areas, structure subsidies to cover viability gaps (through, for example, negative concessions), and put mechanisms in place to ensure that regulatory counterparts and concessionaires are both delivering on their respective parts of the agreement. But, fundamentally, making utilities fi t for purpose—that is, ensuring that they are operating effi ciently—is the key point. This begins with investing in reducing both technical and nontechnical losses. While the skills and access to capital that led South Africa and Vietnam, for example, to achieve large-scale grid extension will take time to replicate in less industrialized nations, more straightforward tactics can be employed in the short term. These tactics center on preventing theft, managing payment risk, and introducing fl exible payment for customers. Utilities in Brazil, Colombia, India, and Uganda provide evidence that such measures, coupled with subsidies, can lead to increased connections for the poor, and can be replicated in many other locations.
WHAT CAN BE DONE TO HELP SCALE UP ENERGY ACCESS SUCCESS STORIES?
Rethinking Policy: Roles for Governments and their Development PartnersThe private sector represents a very good potential partner for closing the access gap, but it needs to be supported by an appropriate policy, legal, and regulatory environment. Despite the best of intentions, not enough progress has been made toward achieving universal access to modern energy by 2030. Indeed, the International Energy Agency estimates that, if the current trajectory is followed, 1.2 billion people will still lack access to clean fuels and electricity two decades hence. One fundamental reason is that policy thinking has been dominated by a public sector delivery model. It should be recognized that the private sector has the best chance of contributing to closing the access gap in specifi c markets, and that to do so it needs to be supported by an appropriate enabling environment. Other sectors, such as fi nancial services, telecommunications, and health care, have pioneered new and innovative ways to extend access through private enterprise, with impressive results. It is time the energy sector did the same.
A fi rst step for policymakers—governments and their development partners—is to develop an energy access strategy. Ideally this would not be done in isolation but, rather, within the context of a longer-term economic development framework. If universal energy access is to be achieved, policymakers need a plan to get there. Country-level plans should refl ect the demand side (long-term growth aspirations, short-term goals), and of course the supply side (what resources exist within the local context).
Within that strategy, policymakers can then defi ne the portions of the local market that can realistically be served through private enterprise, versus those that require some public support to overcome a commercial viability gap, and a third category that cannot be served commercially. For the market segment that is commercially viable, policymakers could outline an “investment prospectus” and a clear set of rules and regulations designed to attract investors, as well as other ecosystem conditions that are needed for overall market development. These regulations may vary from country to country and, of course, by subsegment—perhaps focusing more on standards and awareness raising for devices (discussed in Recommendations for Investors #3, below), streamlined or light-handed regulation for mini-utilities (Recommendations for Investors #3, below), or smart subsidies for grid-based electrifi cation (Recommendations for Investors #4, below).
An independent “delivery” entity could help advance achievement of the energy access objectives outlined by the government. The delivery entity could play a vital role in developing data on resources and on the market, and potentially in introducing specifi c incentives to kick-start action or encourage fi rst movers based on best practice (discussed in Recommendations for Investors # 3).
126
CHAPTER 4127
Drawing from the analysis of our three categories of energy access solutions, the recommendations to policymakers are to:
1. Resist giveaway programs and unrealistic promises
2. Remove discriminatory taxes and duties across energy access products
3. Develop specifi c policies to encourage mini-utilities
4. Leverage public-private partnerships and smart subsidies for grid extension
5. Establish delivery units and build institutions to drive quality standards, provide information on products, and increase consumer awareness of new device technologies (see Recommendations for Investors #3, below).
Resist giveaway programs and unrealistic promises
While smart subsidies can sometimes be helpful, governments and development partners should avoid distorting the market through well-intentioned but unrealistic promises and damaging “giveaway” programs. Policymakers can certainly support and encourage private sector efforts to extend energy access through smart subsidies and broad sector strategies—as long as these are limited cases with sound subsidy targeting and design that show clearly that their benefi ts outweigh their harm. It is also true that there could be a role for public-sector-sponsored bulk procurement in helping to grow the market for innovative products where practical; for instance, public institutions can help test, build confi dence in, market, and drive down costs through increased volumes of improved cookstoves and solar lanterns in specifi c markets. Subsidies can also be well designed to help those who cannot afford to pay the full price of a product to buy it from a commercial provider.
But policymakers (and donors or philanthropists) should avoid distorting the market through well-intentioned but unrealistic promises and damaging “giveaway” programs where they may not be needed, including massively subsidizing and distributing energy access products or initiating poorly planned or funded (and thus unsustainable) subsidies in areas where they may not be needed. Some development organizations have promoted energy access with programs that give away or very heavily subsidize particular energy access products such as cookstoves or solar home systems—even though these could largely be provided on a commercial basis in their target markets.
While this clearly benefi ts those receiving the products, they work against sustainably provided energy access in the longer term by spoiling the potentially much larger commercial opportunity for businesses to develop and sell goods that customers want, are willing to pay for and, thus, value. This is because customers who are willing and able to pay the full price hesitate to do so if they know that others received a giveaway. If customers favor certain types of products, giveaway programs also risk stunting innovation and encouraging companies to manufacture according to specifi cations that are not always optimal for the market. Free products also deter businesses from investing by creating risk that they will have to compete with giveaways.
Promises of giveaways that never materialize may be even worse than actual giveaway programs. The promise will stop customers from paying a commercial price, and businesses from trying to serve them, blocking the commercial route to energy access. If there is no subsidized or free product forthcoming or if the subsidy stops halfway through the program, the results can be perverse. For example, in El Salvador, Ghana, and Nepal, donor subsidies in support of private-sector-led solar home system plans have been unpredictable, often stopping for months before starting again. The result was that companies that had viewed households as their primary target market and that had begun to serve them profi tably, subsequently prioritized institutional clients, because grant support to help households cover part of the systems costs was inconsistent. Following the suspension of subsidies for many months, Accra-based Wilkin Solar, for example, moved away from selling solar home systems and solar-powered lanterns to urban and rural Ghanaian households in favor of larger institutional contracts to service schools and clinics.
Remove discriminatory taxes and duties across energy access products
Policymakers can help level the playing fi eld for energy providers by removing taxes and duties that discriminate against new solutions in favor of conventional grid supply. This report illustrates the ways in which many governments impose penalties on modern energy access products that are higher than the duties and taxes on conventional energy products. Often the effects are discriminatory and perverse, creating
128
a bias in energy provision toward better-off grid-connected people away from poorer households, and toward conventional rather than renewable generation sources. This need not be the case. Barbados has one of the world’s most successful solar water heater programs, and an essential factor in its success was the removal of all tariffs and duties on solar water heaters and their components. This allowed the development of a local solar water heating manufacturing industry, which is now starting to export to the rest of the region. In a number of African countries, including Ethiopia and Kenya, a reduction in import penalties has been an important factor in increasing sales of
solar lanterns over the past two years.
Develop specifi c policies to encourage mini-utilities
Governments and development partners can use specifi c policy to encourage mini-utilities, including service area defi nition, regulation, and the creation of a solid revenue framework. First, what a potential service area is and where it should be must be defi ned. Here, it is important for policymakers to be clear on where grid extension projects are likely to head, and to relax exclusivity on who can operate in other areas. Second, policymakers should create appropriate regulation for mini-utilities, rather than applying rules originally designed for large players. Third, a solid revenue framework for companies is critical. This involves enacting market-based pricing for tariffs; facilitating service agreements with large offtakers or anchor clients, including the incumbent utility that may be operating remote systems; and subsidizing connection costs where needed. Each is detailed in the sections that follow.
A) Rethink How Service Areas are Defi ned
Policymakers fi rst need to provide mini-utilities with clarity on its grid extension plans; in this regard, regulation is required to protect investors. In order for a mini-utility to take a decision on whether or not to invest in a given area, it needs to understand both the likelihood that it will make an acceptable return on investment, and its rights and obligations after the investment is made. A major barrier to mini-utility developers coming into a given area is uncertainty about how long it will take before the main grid is extended to that same location. Hence, perhaps the fi rst step for energy planners and other policymakers is to be clear on where grid extension projects are likely to head. In India, for example, there are a number of cases of mini-grid developers being hesitant to set up plants in certain communities because the government’s policy on
where the central grid would be extended was unclear or kept changing.
Governments should also ensure that the size and terms of service area concessions are appropriate to local conditions, and should avoid granting indefi nite exclusive rights. It is important to revisit the manner in which a service area is defi ned, both for a central grid-based company and for any mini-utility that may be providing power to a region. For instance, the size of a concession, and terms under which a service area is granted and monitored, should be appropriate to the local conditions. Prior to 2000, all mini-utilities above 300 kW in Bolivia were required to acquire a concession, but the rule was not systematically enforced. This meant that some companies were subject to onerous reporting requirements, but others were not. The playing fi eld was not level, nor were the returns.
In addition, policymakers should not award indefi nite exclusivity in a concession, because this can reduce access by allowing underperforming mini-utilities to retain control of a service area. Instead, if and when concessions are allocated, the length of the term should be clear, and rights should be clearly linked to corresponding obligations within a specifi ed time frame. This would compel service providers to deliver on their commitments. If agreed targets are not met, the regulator could reopen the market to other players.
B) Institute Light-handed Regulation of Mini-utilities
Mini-utilities do not require the same level of regulation as large incumbent utilities, and would benefi t from reduced red tape. The purpose of regulation is to ensure that products or services supplied to the public are not hazardous. But overregulation can be a signifi cant issue for often modest-sized businesses such as mini-utilities, which can typically operate effi ciently and safely with fewer rules and less onerous paperwork.75 In many countries it is illegal to supply power without a license or permit. Yet the processes required to get a license can be an insurmountable barrier to small businesses seeking to supply power in rural areas. As a result, these ventures are, at least technically, criminal enterprises, preventing them from growing, formalizing their business, raising fi nance, or selling out to a larger operator.
Policymakers can reduce red tape by simply relaxing licensing requirements, and instead requiring companies to register with a regulator or other government authority. The number of regulatory requirements or decisions, the number of government entities making separate decisions, and the amount of information required for the entities performing electrifi cation should be
WHAT CAN BE DONE TO HELP SCALE UP ENERGY ACCESS SUCCESS STORIES?
CHAPTER 4129
adjusted to attract and not stifl e mini-utilities.76 There are several ways of easing the burden on mini-utilities while, in general, improving effi ciency. For example, rural electrifi cation agencies can be delegated to decide on tariff and concession terms, with no further formal review required by the electricity regulator. Alternatively, a national or provincial regulator can designate the rural electrifi cation agency as its agent, with decisions taken on a no-objection basis. In Nicaragua, mini-grids are regulated by contract and law, with streamlined reporting rules and formal steps.
Safety concerns can be addressed by enforcing clear laws on safety and consumer protection, with regular inspections. Offenders should be shut down, similar to the way in which health and safety concerns are addressed in the hospitality industry. Where mini-utilities operate illegally because of diffi culties in getting a license, they are not subject to any kind of effective safety regulation at all, whereas our suggested approach would bring all electricity providers under enforceable registration and safety obligations, without imposing other unnecessary burdens. This approach has worked well in India, where the 2003 Electricity Act requires only that power providers in rural areas comply with safety rules. In Sri Lanka, the government sets technical specifi cations and safety standards and allows companies to “self-regulate.”
Policymakers also have an opportunity to extend energy access by removing rules that make it illegal to serve people who do not have formal title to their land—as Jamaica and the government in Delhi did. Going further, governments should consider removing rules that make it illegal to supply households that lack properly certifi ed wiring, or providing support to such households to install such wiring.
C) Create a Solid Revenue Framework for Mini-utilities
Governments can help develop a solid revenue framework for mini-utilities through a combination of appropriate tariff regimes, connection subsidies, and support for handling nonpayment. For mini-utilities to thrive, they should be allowed to make a return on investment. This requires that revenues be of a level appropriate to the nature of their business, and that supportive structures be put in place to help them manage excessive risks or income defi cits. A solid revenue framework for this subsector would have three components: an appropriate tariff regime, connection subsidies where there is a viability gap, and a facility to handle nonpayment by large clients where relevant.
Ideally, mini-utilities should be allowed to charge market prices—rather than be subject to tariff regimes designed for centralized plants—at least until they are established and can exploit economies of scale. Some countries have capped mini-utilities tariffs at the same level as grid utilities, which are often loss making and subsidized by the government, while others have set tariffs for mini-utilities separately, but still below the level needed to earn a commercial return on investment. Tariff caps are intended to counter the natural monopoly of typical grid utilities, and to make electricity affordable for the poor. But often they have the opposite effect by making it unviable for mini-utilities to enter the market. Mini-utilities typically have a higher cost of service than large integrated grids, but where they are used solely for lighting purposes they compete with solar home systems and lanterns. For example, in Cambodia, mini-utilities began and fl ourished with no tariff regulation. In Mali, the rural electrifi cation agency differentiates tariffs by the type of supplier, refl ecting their different cost structures.
Subsidies can help where signifi cant capital expenditure is needed to connect a consumer to an energy service, but cannot realistically be paid by the user. Grants (ideally administered based on outputs) would be a good way to cover connection costs where needed, helping to close the viability gap between realistic and commercial returns.
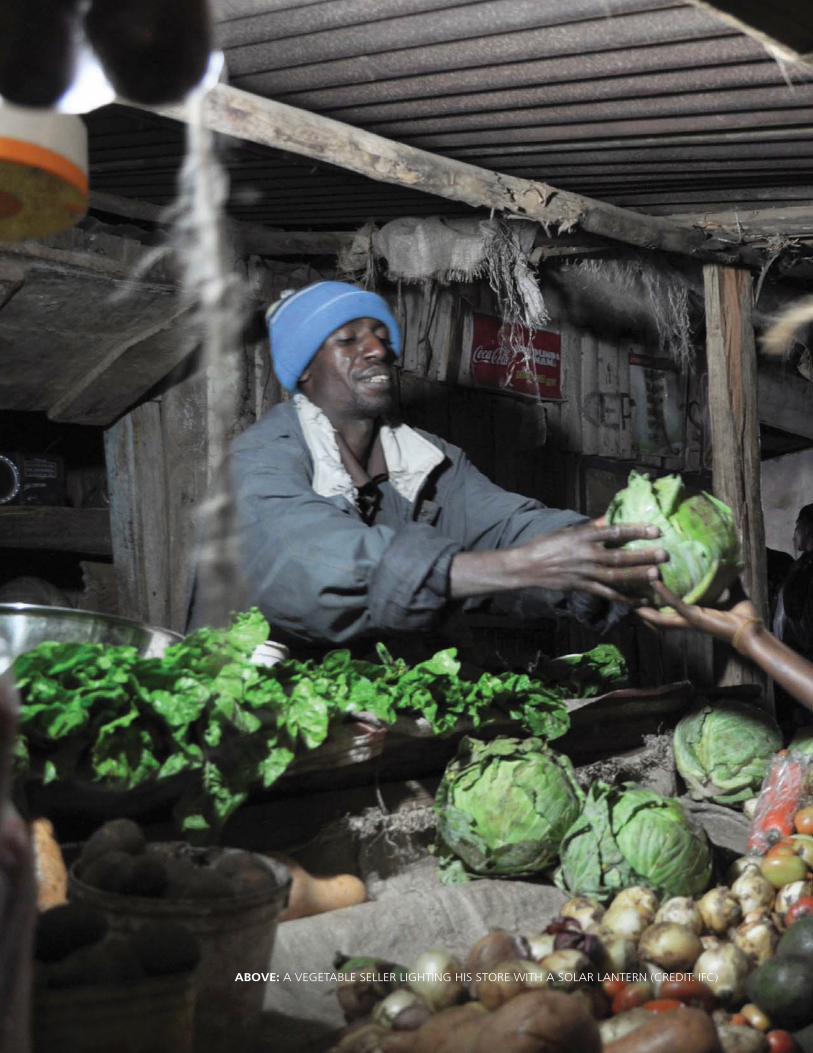
WHAT CAN BE DONE TO HELP SCALE UP ENERGY ACCESS SUCCESS STORIES?
ABOVE: A VEGETABLE SELLER LIGHTING HIS STORE WITH A SOLAR LANTERN (CREDIT: IFC)
CHAPTER 4131
If tariffs, connection subsidies, and revenue frameworks are attractive, there is a high likelihood that developers will enter the market. Andoya Hydroelectric Power Company in Tanzania is an example. First, Andoya benefi ts from a comprehensive revenue framework comprising three elements: attractive tariffs, a long-term debt facility, and a connection subsidy. Based on current regulations, tariffs are set at about $0.23/kWh (385 Tanzanian shillings), which is signifi cant for this hydropower-based mini-utility, given low operating (and no fuel) costs. Second, with the help of a long-term credit refi nancing facility from the World Bank, it can get long-term local loans from banks for 70 percent of project costs. Third, a World Bank and Government of Tanzania facility provides Andoya with a $500-per-connection grant—which counts as owner’s equity—to connect household customers, thus providing substantive capital up front without which this project would not be possible.
As an added bonus, the project is expecting to secure carbon revenue advances, given that it will offset diesel-based generation by Tanesco. A World Bank and local Rural Energy Facility guarantees market-based carbon income until 2020, much beyond the existing Kyoto regime, and provides a three-to-four-year equity advance based on future carbon revenues. This substantive, interlinked set of incentives and support structure makes possible a project that benefi ts the local community, entrepreneurs, the utility, and small businesses.
Other forms of revenue guarantee could also be used to facilitate mini-utility development. Under the Tanzanian standardized power purchase agreement, Tanesco is legally obliged to pay for the power supplied by small producers. There is no guarantee, however, on the utility’s payment, so if Tanesco’s fi nancial situation were to worsen and it could no longer honor its obligations, the mini-utilities would take the hit. Policymakers and the donors that support them should consider payment guarantee plans for offtake from public sector anchor clients.
Leverage public-private partnerships and smart subsidies for grid extension
Where the cost of service delivery is prohibitively high and public fi nance is scarce, governments can leverage public-private partnerships to extend access. In the case of grid extension, public utilities should serve public purposes including extending access to electricity. But in many countries, a lack of fi nance or other problems prevent this even in areas that could be cost-effectively served by grids. Rwanda, for example, has one of the lowest electrifi cation rates in the world—just 10 percent of the total population has access to electricity. In other words, only about 110,000 households are connected. Yet more than half the population of Rwanda lives within 5 kilometers of the existing (state-owned) transmission and distribution grid.
Recent in-depth studies77 showed that despite low income levels, more than 370,000 households would be willing and able to pay the full commercial cost of grid extension, thus quadrupling the number of people connected to the grid without any signifi cant public sector fi nancing. One way to potentially improve the effi ciency of grid-based electricity access is to privatize distribution systems. Another is for governments to award concession contracts for new or privately owned distribution companies to serve currently unserved areas. This can also be combined with smart subsidies to extend access even further than would be viable on a purely commercial basis.
WHAT CAN BE DONE TO HELP SCALE UP ENERGY ACCESS SUCCESS STORIES?
Private companies often bring access to capital and new management approaches that allow them to increase connections more quickly than public utilities, while improving the bottom line. The most comprehensive and meticulous analysis to date of the performance of privatized utilities compared to public utilities78 fi nds that the increase in the number of connections for utilities privatized as concessions is 21 percent higher than the increase in connections for utilities remaining in public hands. Private companies are often able to access capital to expand the network, something that many publicly owned utilities may struggle with. Moreover, private companies often bring new management approaches that allow the costs to be reduced and revenues increased, thus providing a return on the investment.
Access can be further extended through smart, technology-neutral subsidies and targeted concessional fi nance, although support should focus on impact and avoid unintended market distortions. For instance, to build the market in Bangladesh, IDCOL (Infrastructure Development Company Limited) has been giving a declining subsidy on solar home systems sold in Bangladesh, starting from $90 for the fi rst 20,000 units, and falling to $25 currently. This has helped a range of commercial market providers to enter the market with solar home systems that meet specifi ed standards adjusted over time, collectively installing about 1 million units as of June 2011.
While this declining payment is the ideal way to structure public funding interventions, one downside of this particular program has been a focus on specifi cations for modular home systems. As a result, fi rms offering solar lanterns and solar kits, which cost perhaps one-third of a traditional solar home system, have a hard time entering the market. Similarly, there should be a mechanism to ensure that projects deliver promised connections and do so in a reasonable period of time. The Comasel concession in Senegal, for example, meets all necessary requirements in terms of fi lling the viability gap with Output-Based Aid, but has yet to deliver a single connection several years after being signed. A number of issues are at play on the part of both the operator and the regulator, but an important shortcoming has been the inability to renegotiate contracts because delivery timelines have not been honored.
132
CHAPTER 4133
Refocusing Financing: Opportunities for Impact and Commercial InvestorsBoth impact and commercial investors can play a critical role in scaling up energy access success stories. Impact investors are fi nanciers seeking either a social return or a combination of social and fi nancial returns (such as social venture capitalists, local development banks, philanthropists, and international development agencies). Commercial investors seek largely or purely fi nancial returns.
There is scope for commercial investors to make good returns by serving the energy poor, but the sector may be more suited to impact investors seeking both social and fi nancial returns. Despite the promise of the energy access market, this is still an early-stage opportunity for capital seeking only high fi nancial returns. Most investment capital to date has come from impact investment funds, which have been a good match for the sector: they are patient, have appropriate risk/return profi les, and are also more willing to sit down and listen to the story of smaller companies. Some commercial funds have supported larger grid extension projects with attractive revenue streams but, generally, this sector is ideal for impact investing because it involves the attractive combination of renewable energy, social benefi ts, and the base-of-the-pyramid market.
New venture funds have recently emerged, however, targeting proven energy access companies, raising the risk that a relatively large pool of fi nance may soon be chasing a handful of high-profi le enterprises. In just the last two years, a number of new venture funds have emerged, generally seeking energy access investments with a proven business model, two to three years of fi nancial statements, highly experienced management teams, and the ability to absorb $500,000 to $5 million. While interest in the sector and the emergence of investable companies are good things, the reality is that few companies matching this profi le exist. And when they do, they tend to be piled on by investors, often causing much distraction to management’s ability to focus on operations. As a result, hundreds of millions of dollars in fi nancing may soon be crowding a limited number of high-profi le investment-ready enterprises.
To better support the market and meet their own return expectations, all investors would benefi t from keeping investment mandates broad and beyond a single technology (for example, avoid solar-only or cookstove-only funds), and include fi rms offering other products in low-income markets in their portfolios. Rather than technology, one might look for critical success factors relevant to the subsector—such as strong distribution channels in the devices space—as the common denominators for an investment approach. This could mean taking lighting and cooking devices, water purifi cation systems, and cell phones as offerings with common characteristics; they have similar price points and need comparable distribution networks and fi nancing. Investing in microfi nance institutions that can also serve as energy device distributors may also make sense.
To broaden the deal pipeline, investors would benefi t from “deal marketplaces” and a well-developed local presence that helps surface hidden gems. Without a good infrastructure, be it in the form of cooperative agreements with local NGOs and international agencies that work with or come across energy access businesses, or by setting up a local offi ce to stay on top of the market, it will be diffi cult to fi nd lower-profi le companies—many of which may be at the community level but hold potential for signifi cant scale.
Beyond this, there are three primary areas for both impact and commercial investors to act to further catalyze successful energy access businesses. They are:
• Providing appropriate funding for each part of the business life cycle
• Supporting enterprise development and business model refi nement
• Funding delivery units, and the provision of public goods: Resource mapping, market data, consumer awareness, and standards.
WHAT CAN BE DONE TO HELP SCALE UP ENERGY ACCESS SUCCESS STORIES?
ABOVE: A BOY USING A SOLAR-POWERED TORCH (CREDIT: IFC)
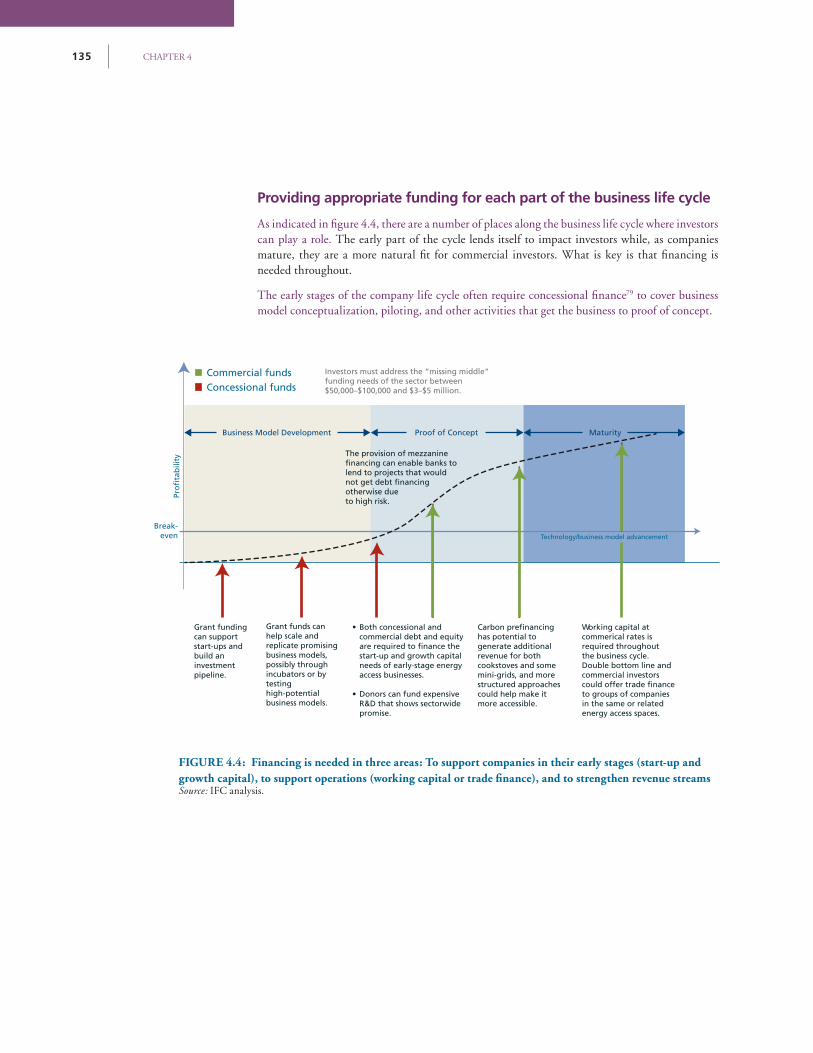
CHAPTER 4135
Providing appropriate funding for each part of the business life cycle
As indicated in fi gure 4.4, there are a number of places along the business life cycle where investors can play a role. The early part of the cycle lends itself to impact investors while, as companies mature, they are a more natural fi t for commercial investors. What is key is that fi nancing is needed throughout.
The early stages of the company life cycle often require concessional fi nance79 to cover business model conceptualization, piloting, and other activities that get the business to proof of concept.
Commercial funds
Pro
fita
bili
ty
Break-even
Concessional funds
Carbon prefinancing has potential to generate additional revenue for both cookstoves and some mini-grids, and more structured approaches could help make it more accessible.
Grant funding can support start-ups andbuild an investment pipeline.
Working capital at commerical rates is required throughout the business cycle. Double bottom line and commercial investors could offer trade finance to groups of companies in the same or related energy access spaces.
Business Model Development Proof of Concept Maturity
Technology/business model advancement
The provision of mezzanine financing can enable banks to lend to projects that would not get debt financing otherwise due to high risk.
Investors must address the “missing middle” funding needs of the sector between $50,000–$100,000 and $3–$5 million.
commercial debt and equity are required to finance the start-up and growth capital needs of early-stage energy access businesses.
R&D that shows sectorwide promise.
Grant funds can help scale and replicate promising business models, possibly through incubators or by testing high-potential business models.
FIGURE 4.4: Financing is needed in three areas: To support companies in their early stages (start-up and growth capital), to support operations (working capital or trade fi nance), and to strengthen revenue streamsSource: IFC analysis.
WHAT CAN BE DONE TO HELP SCALE UP ENERGY ACCESS SUCCESS STORIES?
Both debt and equity are required to fi nance the start-up and growth capital needs of early-stage energy access businesses. Investment funds fi nd the sector appropriate for equity fi nancing, due to the high-risk/high-growth nature of the companies, the need for multiple rounds of fi nancing, and the potential for a trade sale. And, generally, for scaling up and business expansion, equity is more appropriate than debt fi nancing. For working capital fi nancing, including for import, inventory, and stocking, manufacturers would prefer to use debt but have faced diffi culty fi nding it at an attractive price. Once companies are housing inventory in multiple localities, the accounts receivable gap is expensive to fi nance by debt capital. Where debt is required, various instruments, supported with concessional fi nancing, can be structured to encourage reluctant fi nancial intermediaries to provide most needed debt fi nancing to the projects. The example of risk-sharing facilities is discussed in box 4.2.
136
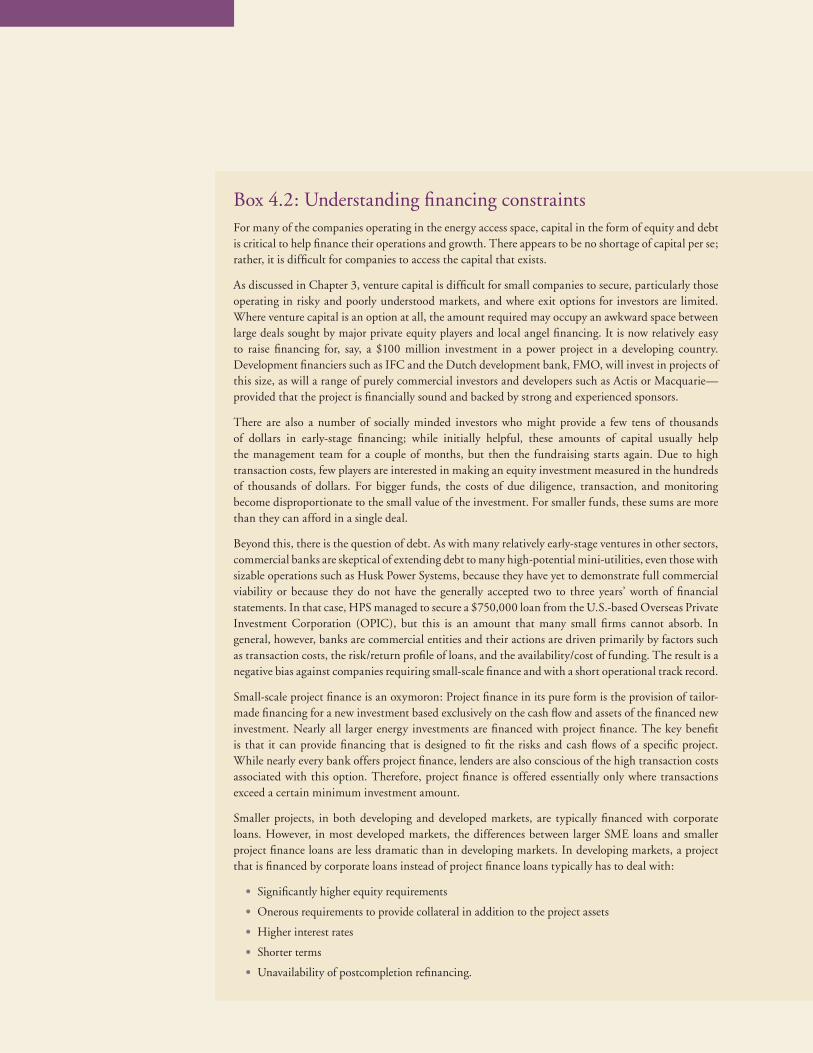
CHAPTER 4137
Box 4.2: Understanding fi nancing constraintsFor many of the companies operating in the energy access space, capital in the form of equity and debt is critical to help fi nance their operations and growth. There appears to be no shortage of capital per se; rather, it is diffi cult for companies to access the capital that exists.
As discussed in Chapter 3, venture capital is diffi cult for small companies to secure, particularly those operating in risky and poorly understood markets, and where exit options for investors are limited. Where venture capital is an option at all, the amount required may occupy an awkward space between large deals sought by major private equity players and local angel fi nancing. It is now relatively easy to raise fi nancing for, say, a $100 million investment in a power project in a developing country. Development fi nanciers such as IFC and the Dutch development bank, FMO, will invest in projects of this size, as will a range of purely commercial investors and developers such as Actis or Macquarie—provided that the project is fi nancially sound and backed by strong and experienced sponsors.
There are also a number of socially minded investors who might provide a few tens of thousands of dollars in early-stage fi nancing; while initially helpful, these amounts of capital usually help the management team for a couple of months, but then the fundraising starts again. Due to high transaction costs, few players are interested in making an equity investment measured in the hundreds of thousands of dollars. For bigger funds, the costs of due diligence, transaction, and monitoring become disproportionate to the small value of the investment. For smaller funds, these sums are more than they can afford in a single deal.
Beyond this, there is the question of debt. As with many relatively early-stage ventures in other sectors, commercial banks are skeptical of extending debt to many high-potential mini-utilities, even those with sizable operations such as Husk Power Systems, because they have yet to demonstrate full commercial viability or because they do not have the generally accepted two to three years’ worth of fi nancial statements. In that case, HPS managed to secure a $750,000 loan from the U.S.-based Overseas Private Investment Corporation (OPIC), but this is an amount that many small fi rms cannot absorb. In general, however, banks are commercial entities and their actions are driven primarily by factors such as transaction costs, the risk/return profi le of loans, and the availability/cost of funding. The result is a negative bias against companies requiring small-scale fi nance and with a short operational track record.
Small-scale project fi nance is an oxymoron: Project fi nance in its pure form is the provision of tailor-made fi nancing for a new investment based exclusively on the cash fl ow and assets of the fi nanced new investment. Nearly all larger energy investments are fi nanced with project fi nance. The key benefi t is that it can provide fi nancing that is designed to fi t the risks and cash fl ows of a specifi c project. While nearly every bank offers project fi nance, lenders are also conscious of the high transaction costs associated with this option. Therefore, project fi nance is offered essentially only where transactions exceed a certain minimum investment amount.
Smaller projects, in both developing and developed markets, are typically fi nanced with corporate loans. However, in most developed markets, the differences between larger SME loans and smaller project fi nance loans are less dramatic than in developing markets. In developing markets, a project that is fi nanced by corporate loans instead of project fi nance loans typically has to deal with:
• Signifi cantly higher equity requirements
• Onerous requirements to provide collateral in addition to the project assets
• Higher interest rates
• Shorter terms
• Unavailability of postcompletion refi nancing.
138
The combination of these constraints results in many sponsors abandoning smaller projects because they lack the equity required by the banks. If the sponsors can afford the required high equity, the risks often result in returns that are too low.
What makes a project bankable, or not?
In many market situations, the viability of projects or companies is decided primarily by fi nancing conditions. In particular, capital-intensive renewable energy technologies like PV, wind, or small hydro are only feasible if the fi nancing conditions are acceptable. To illustrate this constraint, let us look at the following hypothetical small hydro example:
• Investment cost: $10,000,000
• Projected annual revenue: $1,200,000
• With a loan tenor of 10 years and an interest rate of 9 percent per year, the project can comfortably be fi nanced with 30 percent project equity.
However, if the available fi nancing tenor is only fi ve years, the project promoter would have to fi nance 54 percent of the project with equity to be able to make the project viable, which is typically a prohibitively high equity requirement.
Lack of track record: In most markets, providing access to energy is still, from a commercial point of view, a risky and untested enterprise. This is typically compounded by the fact that the entrepreneurs have only a limited track record. For banks, these are indications that such companies are particularly risky and should therefore be avoided as loan clients. For example, a common complaint of small-scale operators in India is that, while funds are available through the Ministry for New and Renewable Energy (IREDA), they still face issues in raising fi nancing because the scale of their plants often falls below the minimum level set by that facility. Moreover, where IREDA does provide fi nancing, the entrepreneur still has to raise additional loan guarantees from banks, and these institutions are not willing to lend without any personal guarantees. As a result, bank fi nancing is available only if the fi rm shows three years of profi tability. Even where local banks are willing to lend, they typically offer short-term fi nancing at a high interest rate.
The provision of mezzanine fi nancing80 can enable banks to lend to projects that would not otherwise get debt fi nancing due to the high risk aversion of banks. With the support of concessional fi nancing, IFC is piloting such a mezzanine facility to support individual transactions in the following way:
• The bank identifi es a transaction that complies with agreed eligibility criteria—in this case that it provides energy access.
• While the bank is not comfortable with the risk of the identifi ed transaction, the project complies with simple agreed fi nancial criteria.
• An independent party selected by IFC confi rms the technical viability of the proposed project.
• IFC would then assume a subordinated position in the fi nancing of this project.81
For the bank, IFC’s subordinated participation would indirectly increase the project equity and therefore greatly enhance its creditworthiness. For the project developer, the loan would simply be slightly more expensive debt that helps to overcome the main hurdle, that is, obtaining fi nancing.
WHAT CAN BE DONE TO HELP SCALE UP ENERGY ACCESS SUCCESS STORIES?
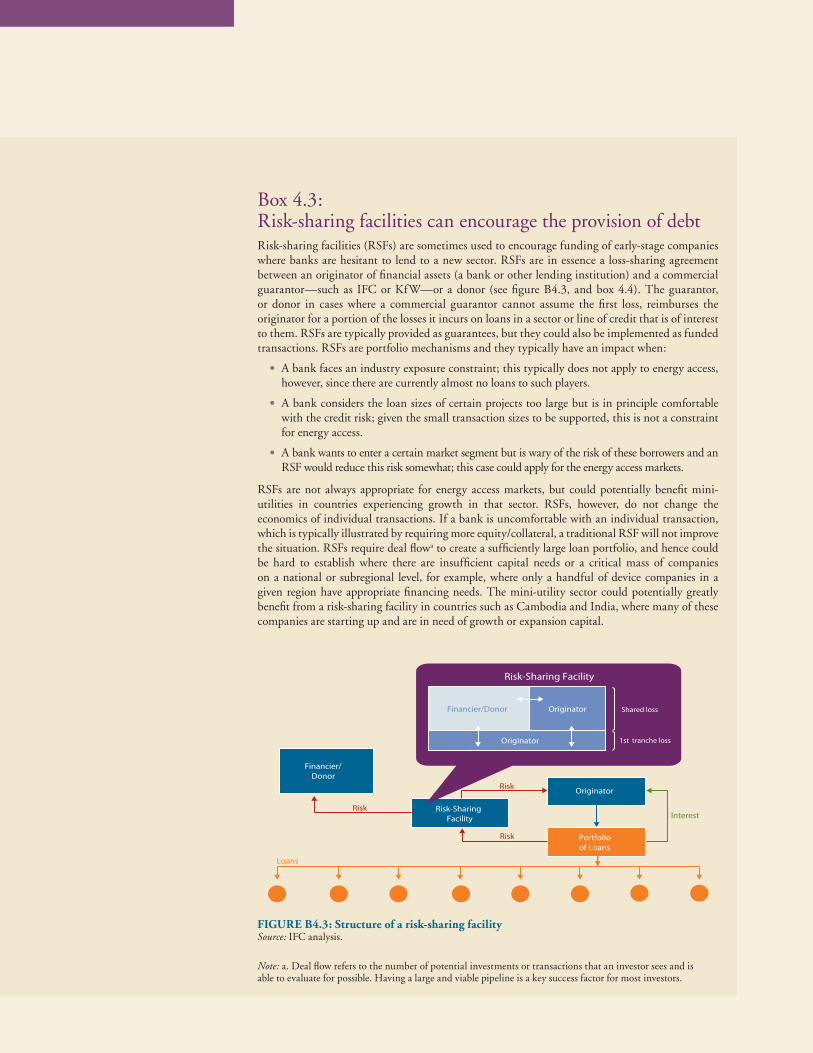
CHAPTER 4139
Box 4.3:Risk-sharing facilities can encourage the provision of debtRisk-sharing facilities (RSFs) are sometimes used to encourage funding of early-stage companies where banks are hesitant to lend to a new sector. RSFs are in essence a loss-sharing agreement between an originator of fi nancial assets (a bank or other lending institution) and a commercial guarantor—such as IFC or KfW—or a donor (see fi gure B4.3, and box 4.4). The guarantor, or donor in cases where a commercial guarantor cannot assume the fi rst loss, reimburses the originator for a portion of the losses it incurs on loans in a sector or line of credit that is of interest to them. RSFs are typically provided as guarantees, but they could also be implemented as funded transactions. RSFs are portfolio mechanisms and they typically have an impact when:
• A bank faces an industry exposure constraint; this typically does not apply to energy access, however, since there are currently almost no loans to such players.
• A bank considers the loan sizes of certain projects too large but is in principle comfortable with the credit risk; given the small transaction sizes to be supported, this is not a constraint for energy access.
• A bank wants to enter a certain market segment but is wary of the risk of these borrowers and an RSF would reduce this risk somewhat; this case could apply for the energy access markets.
RSFs are not always appropriate for energy access markets, but could potentially benefi t mini-utilities in countries experiencing growth in that sector. RSFs, however, do not change the economics of individual transactions. If a bank is uncomfortable with an individual transaction, which is typically illustrated by requiring more equity/collateral, a traditional RSF will not improve the situation. RSFs require deal fl owa to create a suffi ciently large loan portfolio, and hence could be hard to establish where there are insuffi cient capital needs or a critical mass of companies on a national or subregional level, for example, where only a handful of device companies in a given region have appropriate fi nancing needs. The mini-utility sector could potentially greatly benefi t from a risk-sharing facility in countries such as Cambodia and India, where many of these companies are starting up and are in need of growth or expansion capital.
Risk-Sharing Facility
Financier/Donor
Loans
Risk
Risk
Risk
Interest
Shared loss
1st tranche loss
Originator
Originator
Portfolioof Loans
Originator
Risk-SharingFacility
Financier/Donor
FIGURE B4.3: Structure of a risk-sharing facilitySource: IFC analysis.
Note: a. Deal fl ow refers to the number of potential investments or transactions that an investor sees and is able to evaluate for possible. Having a large and viable pipeline is a key success factor for most investors.
WHAT CAN BE DONE TO HELP SCALE UP ENERGY ACCESS SUCCESS STORIES?
Box 4.4: Examples of risk-sharing facilitiesRSFs have been set up around the world for a wide variety of loans. This includes mortgage loans; consumer, student, school, and energy effi ciency loans; and SME loans. Examples include:
Student Loans in Indonesia: IFC helped overcome the low enrolment in tertiary education caused by fi nancial diffi culties of poor students in a risk-sharing agreement with a private educational foundation and a private sector bank. The RSF was set up to leverage the foundation’s contribution by reducing its risk and, thus, offering more attractive interest rates to students. IFC provided a guarantee for 50 percent of the losses incurred beyond the fi rst loss threshold.
China’s Utility-based Energy Effi ciency Finance (CHUEE) Program: In 2006, IFC launched the CHUEE Program to support energy-effi ciency-related lending to increase energy savings and reduce carbon dioxide emissions in China. IFC has provided RSFs to three banks—the Industrial Bank, Bank of Beijing, and Shanghai Pudong Development Bank—for a maximum total portfolio size of $497 million. Concessional funds from the Global Environment Facility have been used to provide fi rst-loss coverage. As of December 2010, a $402 million portfolio of 163 loans was covered by the RSFs. Projects included industrial boiler retrofi tting, wasted heat recovery, power savings, and optimization of energy use. The partner banks and other market players have also received advisory support.
Kenya’s School Risk-Sharing Facility: IFC helped bridge the gap of supply and demand in the education sector in Kenya by extending the tenor of the available fi nancing for investors in private schools. To do so, IFC engaged in a risk-sharing facility with K-Rep—a bank with a local currency portfolio of loans to private schools—to fi nance construction, purchase of educational materials, and other capital expenditures. IFC agreed to cover 63 percent of all losses beyond a 5 percent fi rst-loss threshold. This risk reduction allowed K-Rep to increase the tenor of the loans it offers. The demonstrative effects of this endeavor are expected to lead other banks to target the education sector.
Double bottom line and commercial investors could offer trade fi nance to groups of companies in the energy access sector. Investors can usefully offer trade fi nance to individual companies, but it might be more effi cient to establish facilities for larger groups of companies. A sizable facility open to local and international fi rms making devices, solar home systems, or components for mini-grid systems, would help unlock supply chains and facilitate market penetration. The recently established and EU-backed Solar for All initiative, whose Solar Fund targets investments of around €3 million in the PV sector, will leverage a range of instruments designed to work along the supply chain, including providing working capital to companies. As the fund progresses, it may do well to consider widening its focus beyond PV alone.
Across the investment capital and trade fi nance spaces, it is important to address the “missing middle” funding needs of the sector. There currently appears to be a mismatch between the type of funds that energy access businesses need and what is available from a range of fi nanciers. A better fi t with the needs of the sector would be local currency investments between the “too small” ($50,000 to $100,000) investments typically available from philanthropists, on the one hand, and the “too big” ($3 million to $5 million) investments offered by larger institutions,
WHAT CAN BE DONE TO HELP SCALE UP ENERGY ACCESS SUCCESS STORIES? 140
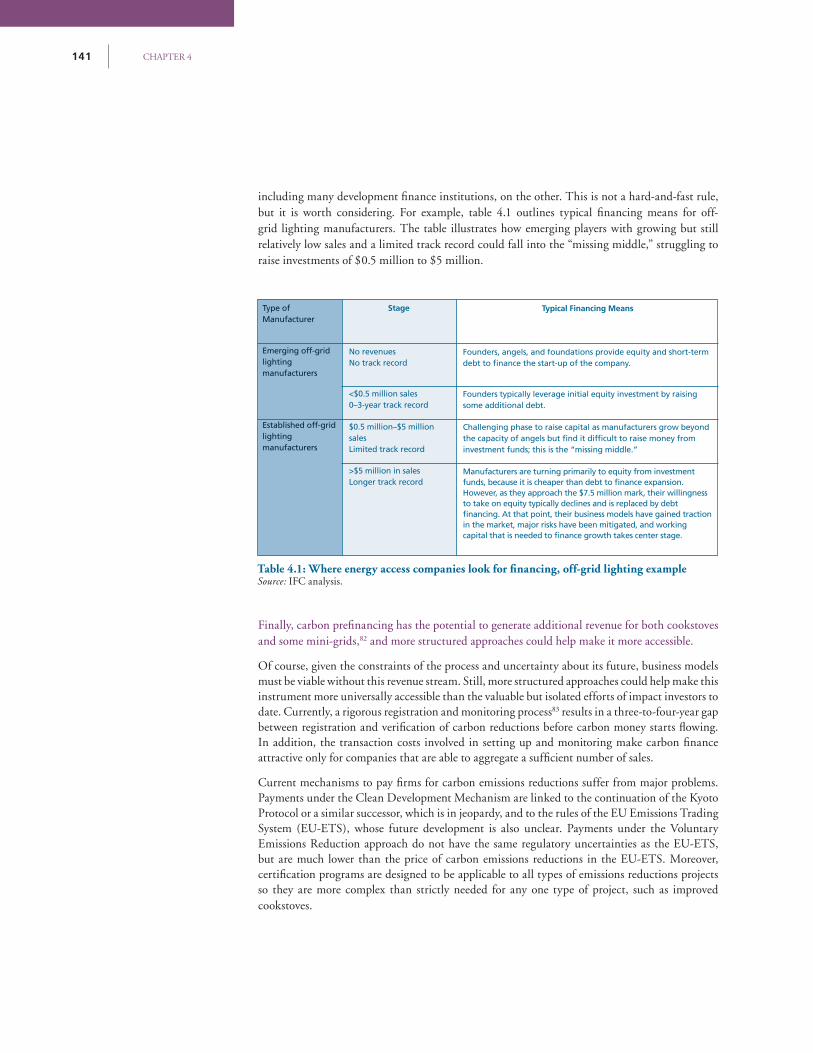
CHAPTER 4141
including many development fi nance institutions, on the other. This is not a hard-and-fast rule, but it is worth considering. For example, table 4.1 outlines typical fi nancing means for off-grid lighting manufacturers. The table illustrates how emerging players with growing but still relatively low sales and a limited track record could fall into the “missing middle,” struggling to raise investments of $0.5 million to $5 million.
Finally, carbon prefi nancing has the potential to generate additional revenue for both cookstoves and some mini-grids,82 and more structured approaches could help make it more accessible.
Of course, given the constraints of the process and uncertainty about its future, business models must be viable without this revenue stream. Still, more structured approaches could help make this instrument more universally accessible than the valuable but isolated efforts of impact investors to date. Currently, a rigorous registration and monitoring process83 results in a three-to-four-year gap between registration and verifi cation of carbon reductions before carbon money starts fl owing. In addition, the transaction costs involved in setting up and monitoring make carbon fi nance attractive only for companies that are able to aggregate a suffi cient number of sales.
Current mechanisms to pay fi rms for carbon emissions reductions suffer from major problems. Payments under the Clean Development Mechanism are linked to the continuation of the Kyoto Protocol or a similar successor, which is in jeopardy, and to the rules of the EU Emissions Trading System (EU-ETS), whose future development is also unclear. Payments under the Voluntary Emissions Reduction approach do not have the same regulatory uncertainties as the EU-ETS, but are much lower than the price of carbon emissions reductions in the EU-ETS. Moreover, certifi cation programs are designed to be applicable to all types of emissions reductions projects so they are more complex than strictly needed for any one type of project, such as improved cookstoves.
Table 4.1: Where energy access companies look for fi nancing, off-grid lighting exampleSource: IFC analysis.
Type of Manufacturer
Stage Typical Financing Means
Emerging off-grid lightingmanufacturers
No revenuesNo track record
Founders, angels, and foundations provide equity and short-term debt to fi nance the start-up of the company.
Established off-gridlightingmanufacturers
<$0.5 million sales0–3-year track record
Founders typically leverage initial equity investment by raising some additional debt.
$0.5 million–$5 million sales Limited track record
Challenging phase to raise capital as manufacturers grow beyond the capacity of angels but fi nd it diffi cult to raise money from investment funds; this is the “missing middle.”
>$5 million in salesLonger track record
Manufacturers are turning primarily to equity from investment funds, because it is cheaper than debt to fi nance expansion. However, as they approach the $7.5 million mark, their willingness to take on equity typically declines and is replaced by debt fi nancing. At that point, their business models have gained traction in the market, major risks have been mitigated, and working capital that is needed to fi nance growth takes center stage.
WHAT CAN BE DONE TO HELP SCALE UP ENERGY ACCESS SUCCESS STORIES?
In this context, fi nanciers and donors have an opportunity to make it easier for fi rms to monetize the carbon dioxide equivalent emission reductions they provide. Financiers may purchase or lend against Certifi ed or Voluntary Emissions reductions. Donors could also create simpler fi nance plans with lower certifi cation costs. For example, a donor could set up a program that would test stoves, and then purchase the rights to the resulting emissions reductions for a fi xed price. Doing this on a programmatic basis by country or region could reduce costs compared to current approaches, increasing energy access and reducing carbon dioxide equivalent emissions.
Supporting enterprise development and business model refi nement
Financing for energy access companies should be linked to advisory services that build management skills and help refi ne business models. Capital is often only half the battle. Energy access companies also need skilled entrepreneurs and new business models. It is therefore critical to link capital with advisory services that build business acumen and management skills. Additional support is also needed to refi ne business models more broadly.
Grant funds can be used to help identify, scale, and replicate promising access ventures. Initiatives such as the Ashden Awards, the World Bank’s Development Marketplace, and the Africa Enterprise Challenge Fund have already made a real contribution to surfacing innovative companies. But additional funding channeled through new or existing incubators that source and nurture promising ventures, run regional business plan competitions, organize training for entrepreneurs, and forge links with local business and engineering schools and partnerships with fi nancial institutions, could help accelerate the process.84
Combining investment and technical assistance funds is not new. One company based in the United States but which operated globally, took such an approach in the energy access space for well over a decade, and provided seed and growth capital to renewable energy businesses in Africa, Asia, and Latin America, investing $25,000 to $1 million. In parallel, the company provided capacity-building services designed to prepare clean energy businesses for investment, including business plan development, risk identifi cation and mitigation, basic bookkeeping and fi nancial modeling, organizational and ownership structuring, and legal and regulatory assistance. The World Bank Group’s infoDev is designing and launching a network of Climate Innovation Centers to help small emerging market clean tech businesses grow, access knowledge, and link to international markets.85 The recently commenced Shell Foundation Business Accelerator (box 4.5) is taking a similar approach, but specifi cally for access. Mumbai-based Dasra fulfi lled a similar role for community organizations for 12 years until three years ago when it extended its offering to include social businesses.86 Efforts like these should be expanded across all energy access sectors.
142
CHAPTER 4143
Box 4.5: The Shell Foundation is taking a venture capital approachShell Foundation is an example of an organization that deploys grant funding to for-profi t enterprises that provide energy access to the poor. It has also created two fi nancial intermediaries to address the wider gaps that exist in the Indian market. The fi rst is a Business Accelerator created in partnership with First Light Ventures, which will provide risk capital (up to $400,000 in convertible debt) to seed stage companies in the energy and affordable basic services sectors. The Accelerator will also provide meaningful levels of business development assistance via a dedicated team based in-country. Companies will be chosen for their projected ability to raise signifi cant scale-up funding from next-stage investors within 18 months. This approach—where Shell Foundation’s grant is pooled with First Light Ventures equity and deployed as convertible debt by First Light Ventures—allows both organizations to leverage their capital and make a greater number of investments at larger ticket sizes than either would do individually.
The second intermediary was created to help address the lack of commercial debt fi nancing to SMEs in India. In late 2010, Shell Foundation launched a credit facility in partnership with IntelleCash, an Indian nonbanking fi nance company, which provides commercial debt (less than $250,000 per loan) tied to specifi c anticipated cash infl ows. The facility specifi cally targets small businesses that do not have three-years-plus profi tability or full collateral (that is, are not able to be served by banks), comprising the “missing middle” asset class. The Shell Foundation has plans to scale the facility in ways similar to their strategic partner GroFin, in Africa.
WHAT CAN BE DONE TO HELP SCALE UP ENERGY ACCESS SUCCESS STORIES?
If promising companies are well screened at the due diligence stage, a fairly small amount of technical assistance funding can help determine whether they become bankable. For instance, one company estimated that if the cost of its business development support services were passed on to investees rather than absorbed by donors, this would increase the cost of debt it provided from about 12 percent to 15 to 18 percent. At the early stages of a business’ life, that 3 to 5 percent “subsidy” is a good investment. Unfortunately, there is currently a lack of funding for the kinds of blended capital business incubators and accelerators described above.
One reason could be the focus of donors (philanthropists, development execution agencies) on technical assistance, and of development fi nance institutions on investment. A second reason could be that donors sometimes shy away from supporting companies that make a profi t, preferring to focus on ventures with a primarily social bottom line. Meanwhile, given the risk of early-stage companies, most commercial investors do not have the luxury of reducing their returns by subsidizing capacity-building activities.
Grants can also meaningfully advance sector development if used to support business models more broadly. Over the last decade, a number of development agencies have invested in selected public good areas, notably R&D on appropriate technology, and public awareness raising on alternative energy options.87 These efforts have often helped small fi rms overcome signifi cant hurdles to the introduction of new technology and therefore made a valuable contribution to access. But more targeted funding of business model development activities is needed, particularly in the area of mini-utilities. One area needing more work, for example, is on ways to scale-up mini-grid businesses. In this space, we see limited progress, but we have also only begun to scratch the surface on early ideas for models mentioned in this report, such as linking to an anchor-client, microfranchising, or developing umbrella companies. This can be achieved by supporting entities that focus on developing and testing commercial approaches to energy access product or service delivery.
Funding delivery units, and the provision of public goods: Resource mapping, market data, consumer awareness, and standards
Governments and donors will need to take a coordinated approach to energy access if transformative results at the national level are to be achieved; a “delivery” entity can help in this regard. The entity could be an existing regulatory body with additional mandates related specifi cally to energy access, or a
new energy access unit tasked with and accountable for making progress on this front. In either case, such a body will need to be empowered to deliver results, and ought to be resourced appropriately. Although still early stage, such an entity could be modeled along the lines of delivery units used to implement agricultural sector priorities in Ethiopia (Agricultural Transformation Agency) and overall economic development activities in Malaysia (Performance Management and Delivery Unit). It would begin by defi ning specifi c energy access targets by technology and over a given period of time (for instance, access to clean cooking options, decentralized electrifi cation, or grid connections), and would then articulate a road map for achieving them. It would need to be resourced appropriately to bring best practice in regulation, business models, fi nancing options, and implementation capacity to bear, and to ensure active tracking of and reporting on progress. And, importantly, it would need to be empowered to recommend policy changes where needed and have a reporting line to or direct support from key decision makers to ensure the desired impact. While the actual management of such a delivery entity would be a natural role for government, grant funds could help to kick-start activities, by fi nancing its set-up (strategy, organizational design, staffi ng) and potentially part of its operations.
Grant funds can also be leveraged to fi nance the provision of market and resource data, and to develop standards. Companies have great diffi culty fi nancing high-cost items that would benefi t their businesses. This includes developing market intelligence; profi ling the availability of primary energy resources; and creating industry standards to guide manufacturers, distributors, and service providers. In the devices market, this helps companies better understand and segment customers, develop tailored products and models to serve them, and establish the necessary (hard and soft) infrastructure.
In the mini-grid and grid-based access markets, these enablers help companies effectively complement utilities and rural energy agencies by providing valuable information on where to site systems and how to size them.88 Finally, standards benefi t the entire sector because they help ensure the quality of products and services and, importantly, level the playing fi eld.
Consumer awareness is another public good that is critical to a business seeking to enter new markets, and can usefully be supported by donors. Chapter 3 illustrates how the cost of building public awareness can make a difference between a company making a profi t or posting a loss, and how donor-supported funds have made this difference. This leads to greater sustainability for companies in the long term, transforming the market for cleaner solutions.
144

CHAPTER 4145
Appendix A: Market-sizing Methodology This appendix explains the methodology, data used, and assumptions made in this report regarding market size, and provides additional sensitivity analyses.
The “addressable market” is the number of households that could afford to pay the full commercial price of a service (based on current spending levels for traditional energy), if it was offered by an effi cient company, earning a commercial return on capital but not constrained by lack of fi nance or excessive regulatory restrictions. The addressable market estimate.89 further assumes business, governments, fi nanciers, and donors all play their part. It is, therefore, a theoretically addressable market since these assumptions hold to different degrees across different geographic locations.
To assess how many additional households could afford modern energy services, the amount they are spending now on traditional energy is compared to the monthly cost of a range of modern energy services and products that would provide superior alternatives to traditional energies. These costs are commercial costs. They are based on actual observed costs of money-making enterprises supplying such services now. Our analysis shows that more than 90 percent of households could be commercially served with modern energy solutions, since they already spend more on traditional energy than the commercial cost of superior, modern energy solutions.
Data and Assumptions for the Market-sizing Methodology
Main data source for energy expenditures
Data for the household expenditures on lighting and cooking are derived from estimates on household and per capita expenditures in “The Next 4 Billion: Market Size and Business Strategy at the Base of the Pyramid,” a report published by IFC and the World Resources Institute (2007). The data presented are ultimately derived from expenditure data from household consumption surveys and were standardized as part of the 2003–06 round of the International Comparison Program (ICP) at the World Bank, which aims to produce internationally comparable price levels, expenditure values, and purchasing power parity estimates (PPP). For comparison across countries, the ICP has classifi ed products and services into 110 categories that broadly cover different household expenditures.
“The Next 4 Billion” focuses on the base of the pyramid (BOP) market and presents household expenditure data for 36 countries for the population with annual per capita expenditures ranging from $500 PPP to $3,000 PPP. These 36 countries are broadly representative of all the countries in the world. Per capita expenditures are categorized into 10 broad markets, one of which is energy. Estimates for household expenditures on lighting and cooking are based on the estimates for energy expenditures from “The Next 4 Billion.”
Assumptions
Proportion of expenditures on lighting and cooking
Household expenditures on energy include both electricity and cooking. To determine the proportion of each, we drew upon expenditures on different fuels from national-level household surveys. Data for this breakdown are not readily available for most countries, especially data with a focus on the population without energy access, so our methodology applies a global average based on indications from a number of selected countries.
APPENDIX145
WHAT CAN BE DONE TO HELP SCALE UP ENERGY ACCESS SUCCESS STORIES?
In general, we estimate that the share of energy expenditures is roughly equal between electricity and cooking. However, this allocation is correlated with income. Based on data from the Indian national household surveys,90 the average urban household in India spends roughly 51 percent of its energy expenditures on fuels related to lighting and electricity (mainly kerosene and electricity) and the rest on cooking. For a rural household, 35 percent of expenditures is spent for electricity and 65 percent is spent on cooking. Estimates from the Bangladesh Institute of Development Studies (BIDS) Survey of rural households in Bangladesh indicate that expenditures on lighting are higher than in India and range from 57 percent to 64 percent, depending on income levels. For Peru, estimates from the National Survey of Rural Household Energy Use show that households also spend a greater percentage of their total energy expenditures on lighting and electricity, estimated at about 65 percent.
For the market-sizing methodology, the assumption for the proportion of lighting and electricity to cooking is 40 percent and 60 percent, respectively, for the poorest households, and increases to 60 percent and 40 percent for wealthier households. The impact of these assumptions on the addressable market can be drawn from the sensitivity analysis on willingness to pay, addressed below.
Cash-only expenditures
The size of the addressable market depends on the ability of potential customers to pay for improved energy products and, therefore, estimated expenditures for households should only refl ect cash expenditures on energy. Estimates reported from household surveys will sometimes include the imputed cost of freely collected fuel as part of total expenditures. While fuel for electricity and lighting is rarely collected or home grown, collection of fuel for cooking for urban and rural households ranges between 20 and 60 percent of total consumption. As a conservative assumption, estimates of collection rates for fuel wood and charcoal from urban and rural households in India were applied to reduce the household expenditures on cooking fuels for all households. Our assumptions are that rural households purchase 40 percent of fuel wood and urban households purchase 70 percent of fuel wood.
Scaling up to 2010 population estimates
This report focuses on the population that currently lacks access to modern energy. For the lighting and electricity market, the target population is unelectrifi ed households in the developing world. For cooking, the target population is households without access to modern cooking fuels or improved cookstoves. Our estimates for both populations start with 2010 population estimates from the UN Population Division of the 36 countries presented in “The Next 4 Billion” report.
Target population for lighting and electricity
To size the market for the lighting and electricity, we apply national-level estimates for urban and rural electrifi cation rates from a number of different sources, including the IEA, UNDP, and national statistics. We also made adjustments to the urban and rural electrifi cation rates with respect to income levels, knowing that these two characteristics are highly correlated. However, data based on both criteria are not widely available for all countries. To estimate electrifi cation rates across income segments for both urban and rural populations, we determined the relationship between these characteristics based on available data and applied an appropriate factor to national urban and rural electrifi cation rates by region and the country’s GDP.
APPENDIX 146
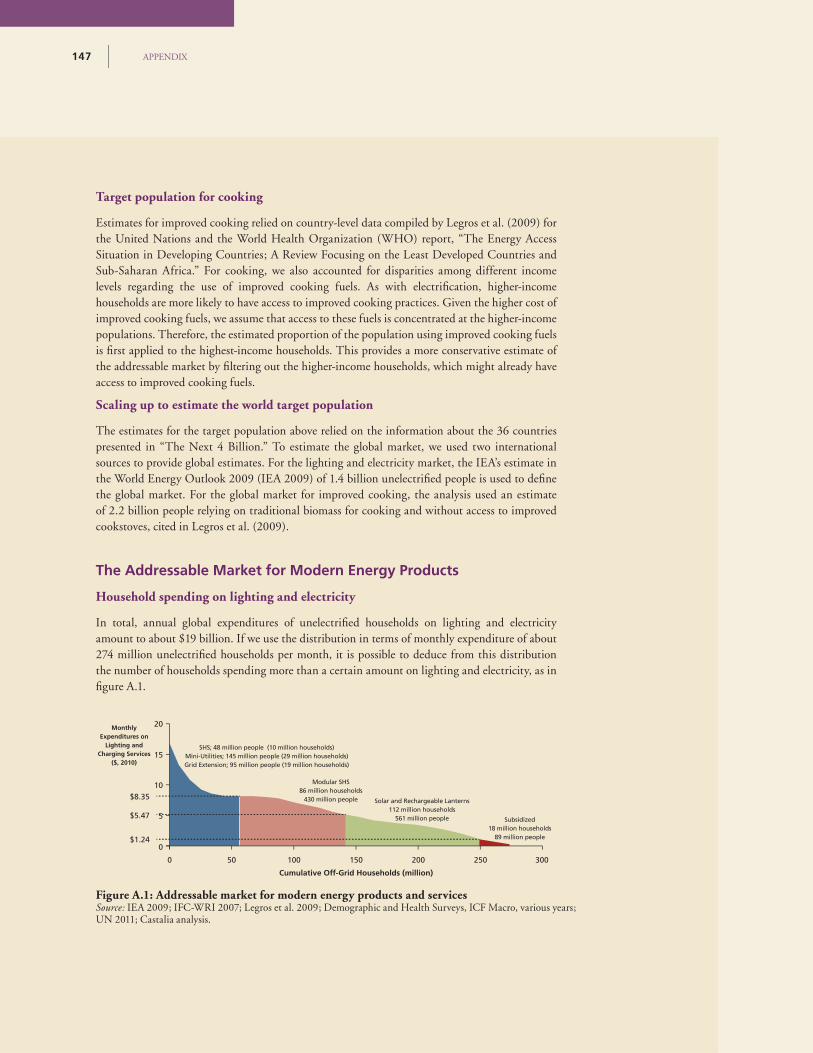
CHAPTER 4147
Target population for cooking
Estimates for improved cooking relied on country-level data compiled by Legros et al. (2009) for the United Nations and the World Health Organization (WHO) report, “The Energy Access Situation in Developing Countries; A Review Focusing on the Least Developed Countries and Sub-Saharan Africa.” For cooking, we also accounted for disparities among different income levels regarding the use of improved cooking fuels. As with electrifi cation, higher-income households are more likely to have access to improved cooking practices. Given the higher cost of improved cooking fuels, we assume that access to these fuels is concentrated at the higher-income populations. Therefore, the estimated proportion of the population using improved cooking fuels is fi rst applied to the highest-income households. This provides a more conservative estimate of the addressable market by fi ltering out the higher-income households, which might already have access to improved cooking fuels.
Scaling up to estimate the world target population
The estimates for the target population above relied on the information about the 36 countries presented in “The Next 4 Billion.” To estimate the global market, we used two international sources to provide global estimates. For the lighting and electricity market, the IEA’s estimate in the World Energy Outlook 2009 (IEA 2009) of 1.4 billion unelectrifi ed people is used to defi ne the global market. For the global market for improved cooking, the analysis used an estimate of 2.2 billion people relying on traditional biomass for cooking and without access to improved cookstoves, cited in Legros et al. (2009).
The Addressable Market for Modern Energy Products
Household spending on lighting and electricity
In total, annual global expenditures of unelectrifi ed households on lighting and electricity amount to about $19 billion. If we use the distribution in terms of monthly expenditure of about 274 million unelectrifi ed households per month, it is possible to deduce from this distribution the number of households spending more than a certain amount on lighting and electricity, as in fi gure A.1.
Figure A.1: Addressable market for modern energy products and servicesSource: IEA 2009; IFC-WRI 2007; Legros et al. 2009; Demographic and Health Surveys, ICF Macro, various years; UN 2011; Castalia analysis.
MonthlyExpenditures on
Lighting andCharging Services
($, 2010)
SHS; 48 million people (10 million households)Mini-Utilities; 145 million people (29 million households)Grid Extension; 95 million people (19 million households)
Subsidized18 million households
89 million people
Modular SHS86 million households
430 million people Solar and Rechargeable Lanterns112 million households
561 million people
Cumulative Off-Grid Households (million)
0
20
0
5
10
15
50 100 150 200 250 300
$8.35
$5.47
$1.24
APPENDIX147
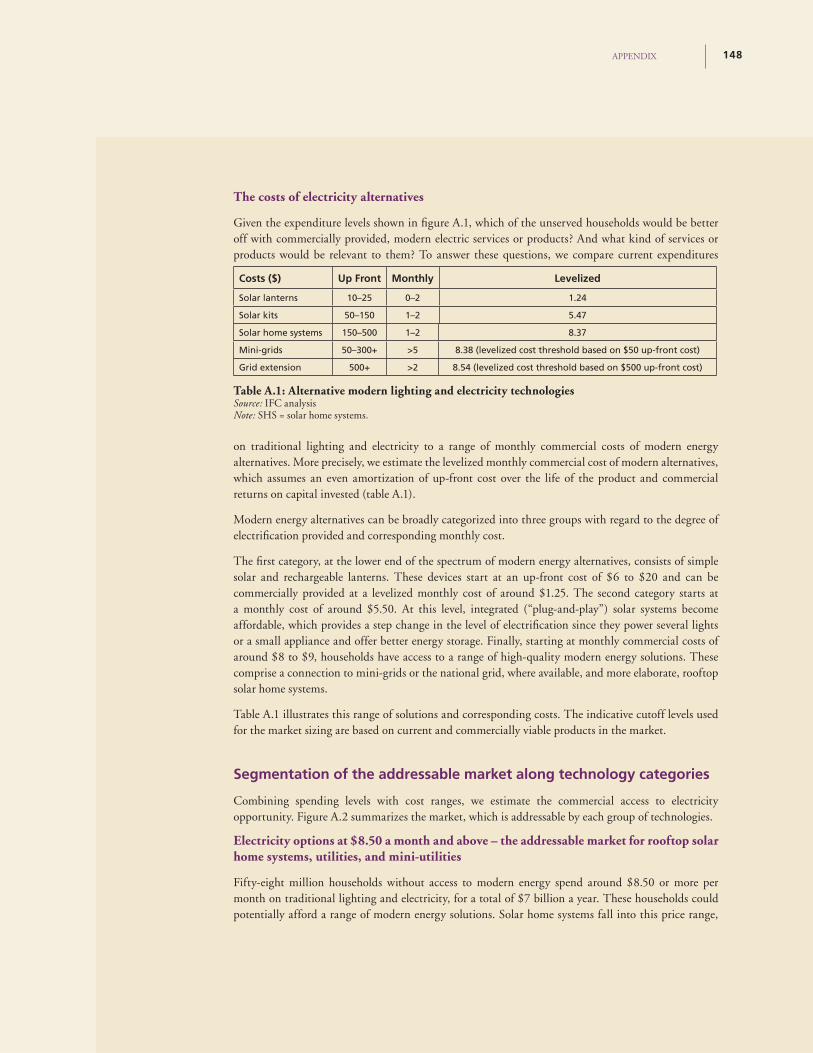
WHAT CAN BE DONE TO HELP SCALE UP ENERGY ACCESS SUCCESS STORIES?
The costs of electricity alternatives
Given the expenditure levels shown in fi gure A.1, which of the unserved households would be better off with commercially provided, modern electric services or products? And what kind of services or products would be relevant to them? To answer these questions, we compare current expenditures
on traditional lighting and electricity to a range of monthly commercial costs of modern energy alternatives. More precisely, we estimate the levelized monthly commercial cost of modern alternatives, which assumes an even amortization of up-front cost over the life of the product and commercial returns on capital invested (table A.1).
Modern energy alternatives can be broadly categorized into three groups with regard to the degree of electrifi cation provided and corresponding monthly cost.
The fi rst category, at the lower end of the spectrum of modern energy alternatives, consists of simple solar and rechargeable lanterns. These devices start at an up-front cost of $6 to $20 and can be commercially provided at a levelized monthly cost of around $1.25. The second category starts at a monthly cost of around $5.50. At this level, integrated (“plug-and-play”) solar systems become affordable, which provides a step change in the level of electrifi cation since they power several lights or a small appliance and offer better energy storage. Finally, starting at monthly commercial costs of around $8 to $9, households have access to a range of high-quality modern energy solutions. These comprise a connection to mini-grids or the national grid, where available, and more elaborate, rooftop solar home systems.
Table A.1 illustrates this range of solutions and corresponding costs. The indicative cutoff levels used for the market sizing are based on current and commercially viable products in the market.
Segmentation of the addressable market along technology categories
Combining spending levels with cost ranges, we estimate the commercial access to electricity opportunity. Figure A.2 summarizes the market, which is addressable by each group of technologies.
Electricity options at $8.50 a month and above – the addressable market for rooftop solar home systems, utilities, and mini-utilities
Fifty-eight million households without access to modern energy spend around $8.50 or more per month on traditional lighting and electricity, for a total of $7 billion a year. These households could potentially afford a range of modern energy solutions. Solar home systems fall into this price range,
Table A.1: Alternative modern lighting and electricity technologiesSource: IFC analysisNote: SHS = solar home systems.
Costs ($) Up Front Monthly Levelized
Solar lanterns 10–25 0–2 1.24
Solar kits 50–150 1–2 5.47
Solar home systems 150–500 1–2 8.37
Mini-grids 50–300+ >5 8.38 (levelized cost threshold based on $50 up-front cost)
Grid extension 500+ >2 8.54 (levelized cost threshold based on $500 up-front cost)
APPENDIX 148
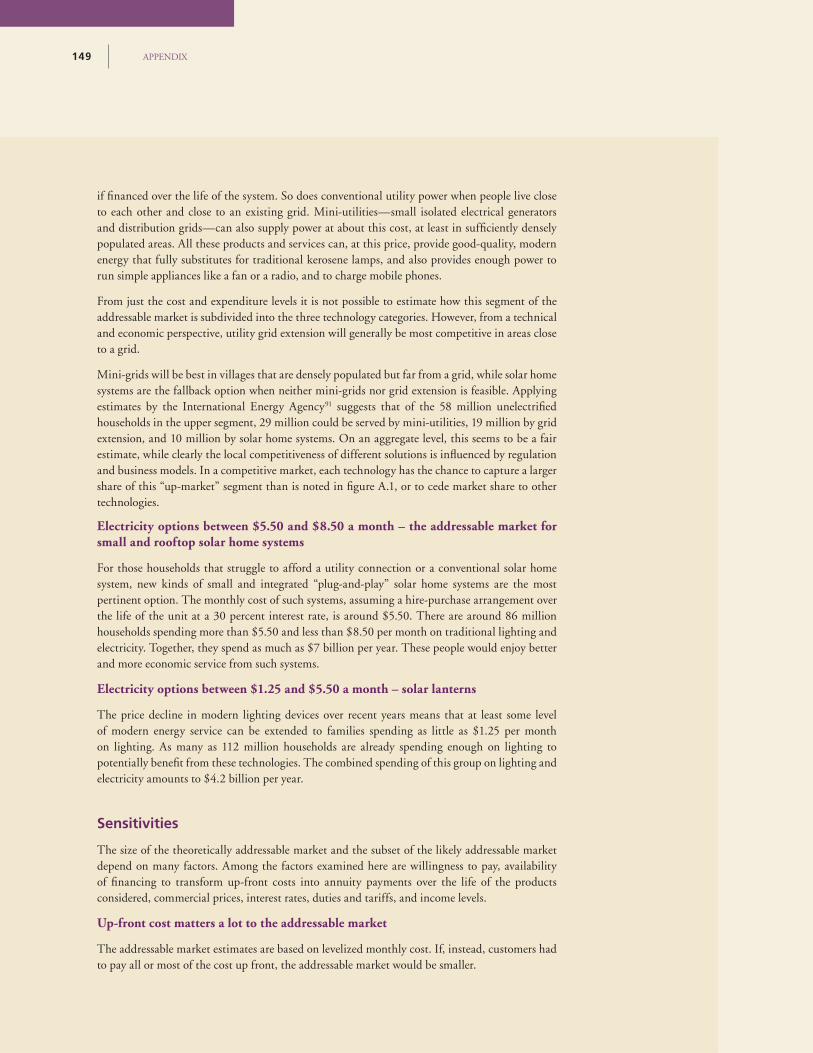
CHAPTER 4149
if fi nanced over the life of the system. So does conventional utility power when people live close to each other and close to an existing grid. Mini-utilities—small isolated electrical generators and distribution grids—can also supply power at about this cost, at least in suffi ciently densely populated areas. All these products and services can, at this price, provide good-quality, modern energy that fully substitutes for traditional kerosene lamps, and also provides enough power to run simple appliances like a fan or a radio, and to charge mobile phones.
From just the cost and expenditure levels it is not possible to estimate how this segment of the addressable market is subdivided into the three technology categories. However, from a technical and economic perspective, utility grid extension will generally be most competitive in areas close to a grid.
Mini-grids will be best in villages that are densely populated but far from a grid, while solar home systems are the fallback option when neither mini-grids nor grid extension is feasible. Applying estimates by the International Energy Agency91 suggests that of the 58 million unelectrifi ed households in the upper segment, 29 million could be served by mini-utilities, 19 million by grid extension, and 10 million by solar home systems. On an aggregate level, this seems to be a fair estimate, while clearly the local competitiveness of different solutions is infl uenced by regulation and business models. In a competitive market, each technology has the chance to capture a larger share of this “up-market” segment than is noted in fi gure A.1, or to cede market share to other technologies.
Electricity options between $5.50 and $8.50 a month – the addressable market for small and rooftop solar home systems
For those households that struggle to afford a utility connection or a conventional solar home system, new kinds of small and integrated “plug-and-play” solar home systems are the most pertinent option. The monthly cost of such systems, assuming a hire-purchase arrangement over the life of the unit at a 30 percent interest rate, is around $5.50. There are around 86 million households spending more than $5.50 and less than $8.50 per month on traditional lighting and electricity. Together, they spend as much as $7 billion per year. These people would enjoy better and more economic service from such systems.
Electricity options between $1.25 and $5.50 a month – solar lanterns
The price decline in modern lighting devices over recent years means that at least some level of modern energy service can be extended to families spending as little as $1.25 per month on lighting. As many as 112 million households are already spending enough on lighting to potentially benefi t from these technologies. The combined spending of this group on lighting and electricity amounts to $4.2 billion per year.
Sensitivities
The size of the theoretically addressable market and the subset of the likely addressable market depend on many factors. Among the factors examined here are willingness to pay, availability of fi nancing to transform up-front costs into annuity payments over the life of the products considered, commercial prices, interest rates, duties and tariffs, and income levels.
Up-front cost matters a lot to the addressable market
The addressable market estimates are based on levelized monthly cost. If, instead, customers had to pay all or most of the cost up front, the addressable market would be smaller.
APPENDIX149
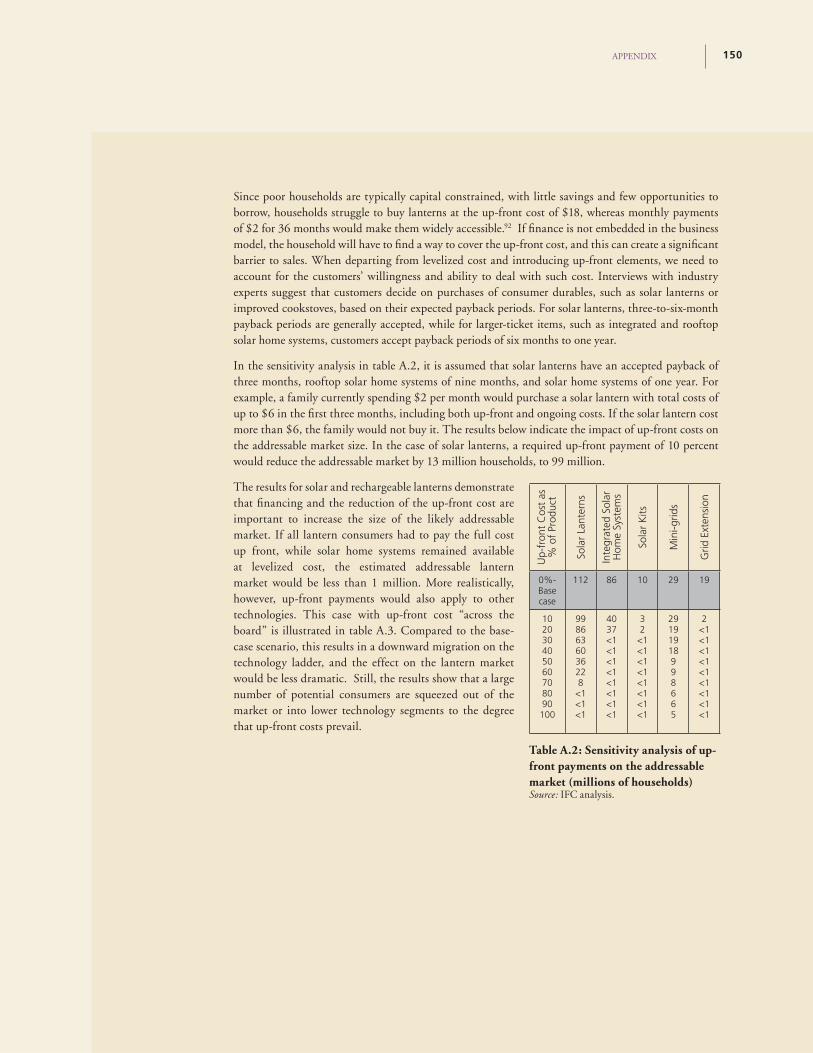
WHAT CAN BE DONE TO HELP SCALE UP ENERGY ACCESS SUCCESS STORIES?
Since poor households are typically capital constrained, with little savings and few opportunities to borrow, households struggle to buy lanterns at the up-front cost of $18, whereas monthly payments of $2 for 36 months would make them widely accessible.92 If fi nance is not embedded in the business model, the household will have to fi nd a way to cover the up-front cost, and this can create a signifi cant barrier to sales. When departing from levelized cost and introducing up-front elements, we need to account for the customers’ willingness and ability to deal with such cost. Interviews with industry experts suggest that customers decide on purchases of consumer durables, such as solar lanterns or improved cookstoves, based on their expected payback periods. For solar lanterns, three-to-six-month payback periods are generally accepted, while for larger-ticket items, such as integrated and rooftop solar home systems, customers accept payback periods of six months to one year.
In the sensitivity analysis in table A.2, it is assumed that solar lanterns have an accepted payback of three months, rooftop solar home systems of nine months, and solar home systems of one year. For example, a family currently spending $2 per month would purchase a solar lantern with total costs of up to $6 in the fi rst three months, including both up-front and ongoing costs. If the solar lantern cost more than $6, the family would not buy it. The results below indicate the impact of up-front costs on the addressable market size. In the case of solar lanterns, a required up-front payment of 10 percent would reduce the addressable market by 13 million households, to 99 million.
The results for solar and rechargeable lanterns demonstrate that fi nancing and the reduction of the up-front cost are important to increase the size of the likely addressable market. If all lantern consumers had to pay the full cost up front, while solar home systems remained available at levelized cost, the estimated addressable lantern market would be less than 1 million. More realistically, however, up-front payments would also apply to other technologies. This case with up-front cost “across the board” is illustrated in table A.3. Compared to the base-case scenario, this results in a downward migration on the technology ladder, and the effect on the lantern market would be less dramatic. Still, the results show that a large number of potential consumers are squeezed out of the market or into lower technology segments to the degree that up-front costs prevail.
Up-
fron
t C
ost
as
% o
f Pr
oduc
t
Sola
r La
nter
ns
Inte
grat
ed S
olar
H
ome
Syst
ems
Sola
r K
its
Min
i-grid
s
Grid
Ext
ensi
on
0%- Base case
112 86 10 29 19
102030405060708090
100
9986636036228
<1<1<1
4037<1<1<1<1<1<1<1<1
32
<1<1<1<1<1<1<1<1
29191918998665
2<1<1<1<1<1<1<1<1<1
Table A.2: Sensitivity analysis of up-front payments on the addressable market (millions of households)Source: IFC analysis.
APPENDIX 150
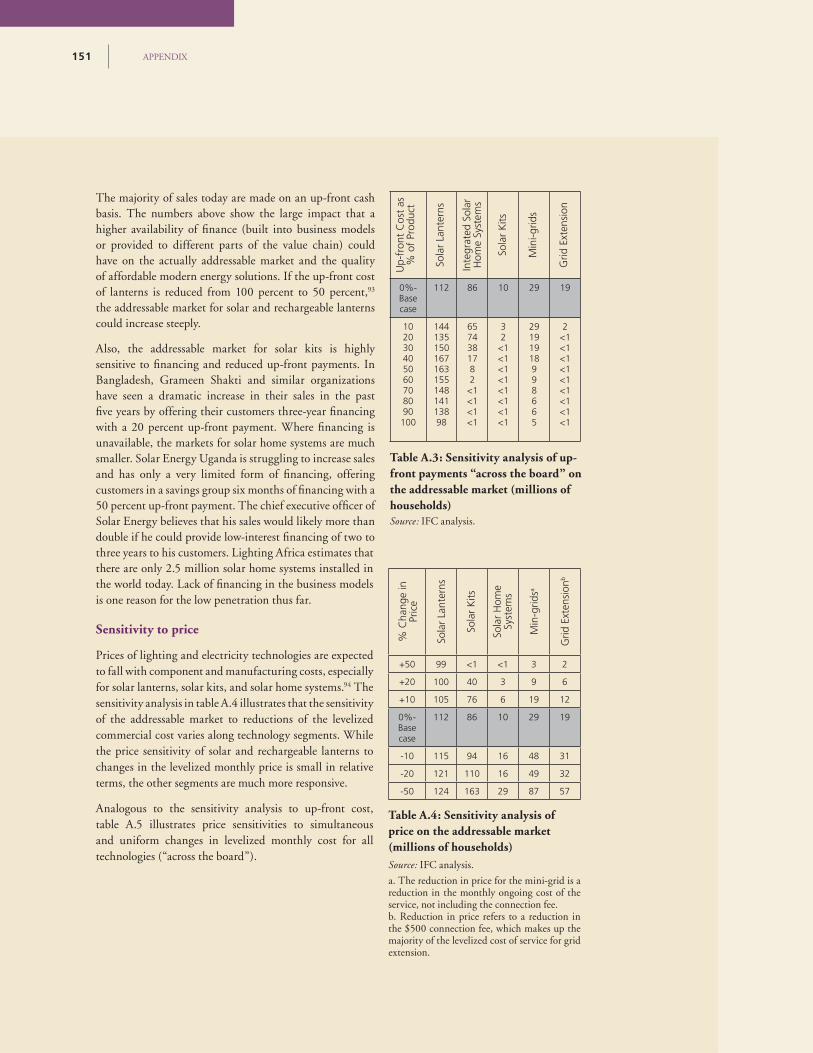
CHAPTER 4151
The majority of sales today are made on an up-front cash basis. The numbers above show the large impact that a higher availability of fi nance (built into business models or provided to different parts of the value chain) could have on the actually addressable market and the quality of affordable modern energy solutions. If the up-front cost of lanterns is reduced from 100 percent to 50 percent,93
the addressable market for solar and rechargeable lanterns could increase steeply.
Also, the addressable market for solar kits is highly sensitive to fi nancing and reduced up-front payments. In Bangladesh, Grameen Shakti and similar organizations have seen a dramatic increase in their sales in the past fi ve years by offering their customers three-year fi nancing with a 20 percent up-front payment. Where fi nancing is unavailable, the markets for solar home systems are much smaller. Solar Energy Uganda is struggling to increase sales and has only a very limited form of fi nancing, offering customers in a savings group six months of fi nancing with a 50 percent up-front payment. The chief executive offi cer of Solar Energy believes that his sales would likely more than double if he could provide low-interest fi nancing of two to three years to his customers. Lighting Africa estimates that there are only 2.5 million solar home systems installed in the world today. Lack of fi nancing in the business models is one reason for the low penetration thus far.
Sensitivity to price
Prices of lighting and electricity technologies are expected to fall with component and manufacturing costs, especially for solar lanterns, solar kits, and solar home systems.94 The sensitivity analysis in table A.4 illustrates that the sensitivity of the addressable market to reductions of the levelized commercial cost varies along technology segments. While the price sensitivity of solar and rechargeable lanterns to changes in the levelized monthly price is small in relative terms, the other segments are much more responsive.
Analogous to the sensitivity analysis to up-front cost, table A.5 illustrates price sensitivities to simultaneous and uniform changes in levelized monthly cost for all technologies (“across the board”).
Source: IFC analysis.
a. The reduction in price for the mini-grid is a reduction in the monthly ongoing cost of the service, not including the connection fee. b. Reduction in price refers to a reduction in the $500 connection fee, which makes up the majority of the levelized cost of service for grid extension.
Up-
fron
t C
ost
as
% o
f Pr
oduc
t
Sola
r La
nter
ns
Inte
grat
ed S
olar
H
ome
Syst
ems
Sola
r K
its
Min
i-grid
s
Grid
Ext
ensi
on
0%- Base case
112 86 10 29 19
102030405060708090
100
14413515016716315514814113898
6574381782
<1<1<1<1
32
<1<1<1<1<1<1<1<1
29191918998665
2<1<1<1<1<1<1<1<1<1
% C
hang
e in
Pr
ice
Sola
r La
nter
ns
Sola
r K
its
Sola
r H
ome
Syst
ems
Min
-grid
sa
Grid
Ext
ensi
onb
+50 99 <1 <1 3 2
+20 100 40 3 9 6
+10 105 76 6 19 12
0%- Base case
112 86 10 29 19
-10 115 94 16 48 31
-20 121 110 16 49 32
-50 124 163 29 87 57
Source: IFC analysis.
Table A.3: Sensitivity analysis of up-front payments “across the board” on the addressable market (millions of households)
Table A.4: Sensitivity analysis of price on the addressable market (millions of households)
APPENDIX151
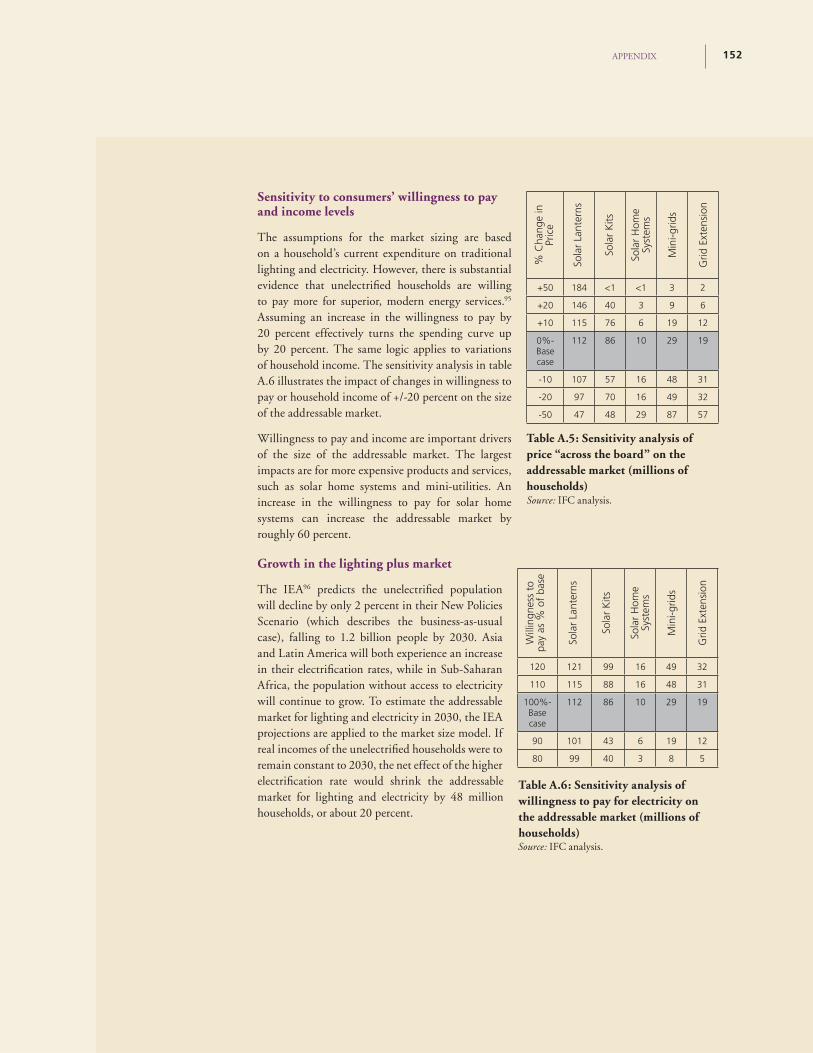
WHAT CAN BE DONE TO HELP SCALE UP ENERGY ACCESS SUCCESS STORIES?
Sensitivity to consumers’ willingness to pay and income levels
The assumptions for the market sizing are based on a household’s current expenditure on traditional lighting and electricity. However, there is substantial evidence that unelectrifi ed households are willing to pay more for superior, modern energy services.95
Assuming an increase in the willingness to pay by 20 percent effectively turns the spending curve up by 20 percent. The same logic applies to variations of household income. The sensitivity analysis in table A.6 illustrates the impact of changes in willingness to pay or household income of +/-20 percent on the size of the addressable market.
Willingness to pay and income are important drivers of the size of the addressable market. The largest impacts are for more expensive products and services, such as solar home systems and mini-utilities. An increase in the willingness to pay for solar home systems can increase the addressable market by roughly 60 percent.
Growth in the lighting plus market
The IEA96 predicts the unelectrifi ed population will decline by only 2 percent in their New Policies Scenario (which describes the business-as-usual case), falling to 1.2 billion people by 2030. Asia and Latin America will both experience an increase in their electrifi cation rates, while in Sub-Saharan Africa, the population without access to electricity will continue to grow. To estimate the addressable market for lighting and electricity in 2030, the IEA projections are applied to the market size model. If real incomes of the unelectrifi ed households were to remain constant to 2030, the net effect of the higher electrifi cation rate would shrink the addressable market for lighting and electricity by 48 million households, or about 20 percent.
% C
hang
e in
Pr
ice
Sola
r La
nter
ns
Sola
r K
its
Sola
r H
ome
Syst
ems
Min
i-grid
s
Grid
Ext
ensi
on
+50 184 <1 <1 3 2
+20 146 40 3 9 6
+10 115 76 6 19 12
0%- Base case
112 86 10 29 19
-10 107 57 16 48 31
-20 97 70 16 49 32
-50 47 48 29 87 57
Will
ingn
ess
to
pay
as %
of
base
Sola
r La
nter
ns
Sola
r K
its
Sola
r H
ome
Syst
ems
Min
i-grid
s
Grid
Ext
ensi
on
120 121 99 16 49 32
110 115 88 16 48 31
100%- Base case
112 86 10 29 19
90 101 43 6 19 12
80 99 40 3 8 5
Source: IFC analysis.
Source: IFC analysis.
Table A.5: Sensitivity analysis of price “across the board” on the addressable market (millions of households)
Table A.6: Sensitivity analysis of willingness to pay for electricity on the addressable market (millions of households)
APPENDIX 152
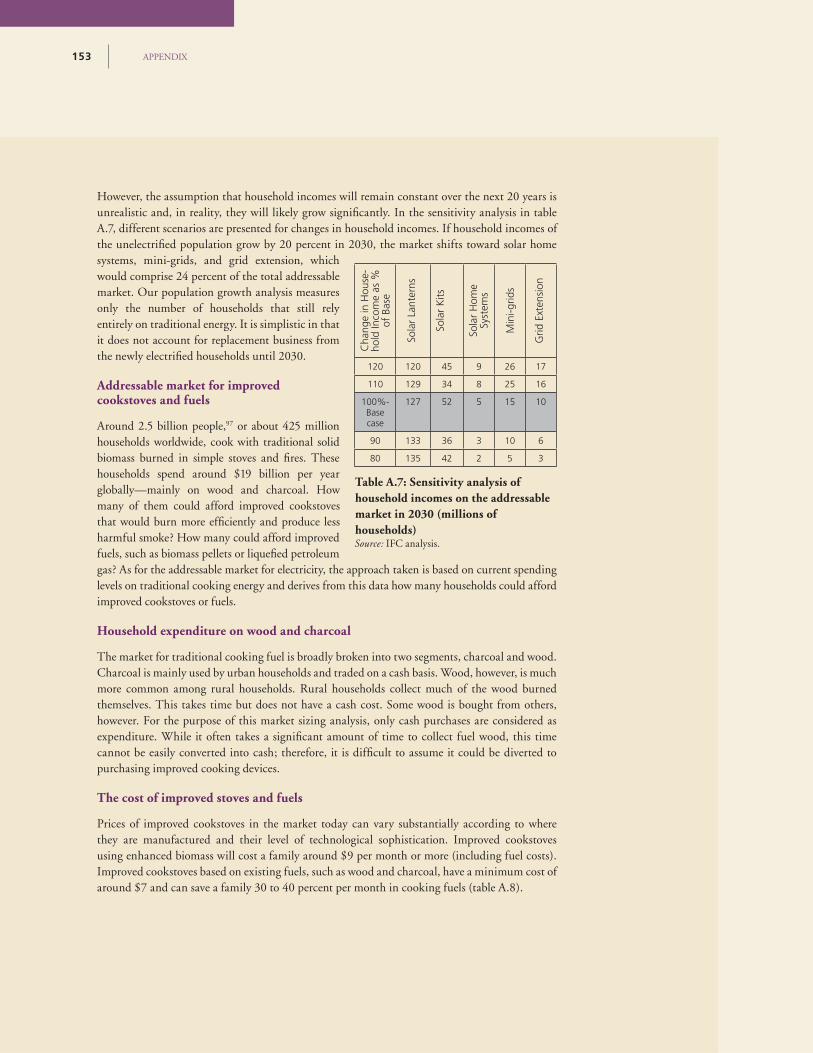
CHAPTER 4153
However, the assumption that household incomes will remain constant over the next 20 years is unrealistic and, in reality, they will likely grow signifi cantly. In the sensitivity analysis in table A.7, different scenarios are presented for changes in household incomes. If household incomes of the unelectrifi ed population grow by 20 percent in 2030, the market shifts toward solar home systems, mini-grids, and grid extension, which would comprise 24 percent of the total addressable market. Our population growth analysis measures only the number of households that still rely entirely on traditional energy. It is simplistic in that it does not account for replacement business from the newly electrifi ed households until 2030.
Addressable market for improved cookstoves and fuels
Around 2.5 billion people,97 or about 425 million households worldwide, cook with traditional solid biomass burned in simple stoves and fi res. These households spend around $19 billion per year globally—mainly on wood and charcoal. How many of them could afford improved cookstoves that would burn more effi ciently and produce less harmful smoke? How many could afford improved fuels, such as biomass pellets or liquefi ed petroleum gas? As for the addressable market for electricity, the approach taken is based on current spending levels on traditional cooking energy and derives from this data how many households could afford improved cookstoves or fuels.
Household expenditure on wood and charcoal
The market for traditional cooking fuel is broadly broken into two segments, charcoal and wood. Charcoal is mainly used by urban households and traded on a cash basis. Wood, however, is much more common among rural households. Rural households collect much of the wood burned themselves. This takes time but does not have a cash cost. Some wood is bought from others, however. For the purpose of this market sizing analysis, only cash purchases are considered as expenditure. While it often takes a signifi cant amount of time to collect fuel wood, this time cannot be easily converted into cash; therefore, it is diffi cult to assume it could be diverted to purchasing improved cooking devices.
The cost of improved stoves and fuels
Prices of improved cookstoves in the market today can vary substantially according to where they are manufactured and their level of technological sophistication. Improved cookstoves using enhanced biomass will cost a family around $9 per month or more (including fuel costs). Improved cookstoves based on existing fuels, such as wood and charcoal, have a minimum cost of around $7 and can save a family 30 to 40 percent per month in cooking fuels (table A.8).
Cha
nge
in H
ouse
-ho
ld In
com
e as
%
of B
ase
Sola
r La
nter
ns
Sola
r K
its
Sola
r H
ome
Syst
ems
Min
i-grid
s
Grid
Ext
ensi
on
120 120 45 9 26 17
110 129 34 8 25 16
100%- Base case
127 52 5 15 10
90 133 36 3 10 6
80 135 42 2 5 3
Source: IFC analysis.
Table A.7: Sensitivity analysis of household incomes on the addressable market in 2030 (millions of households)
APPENDIX153
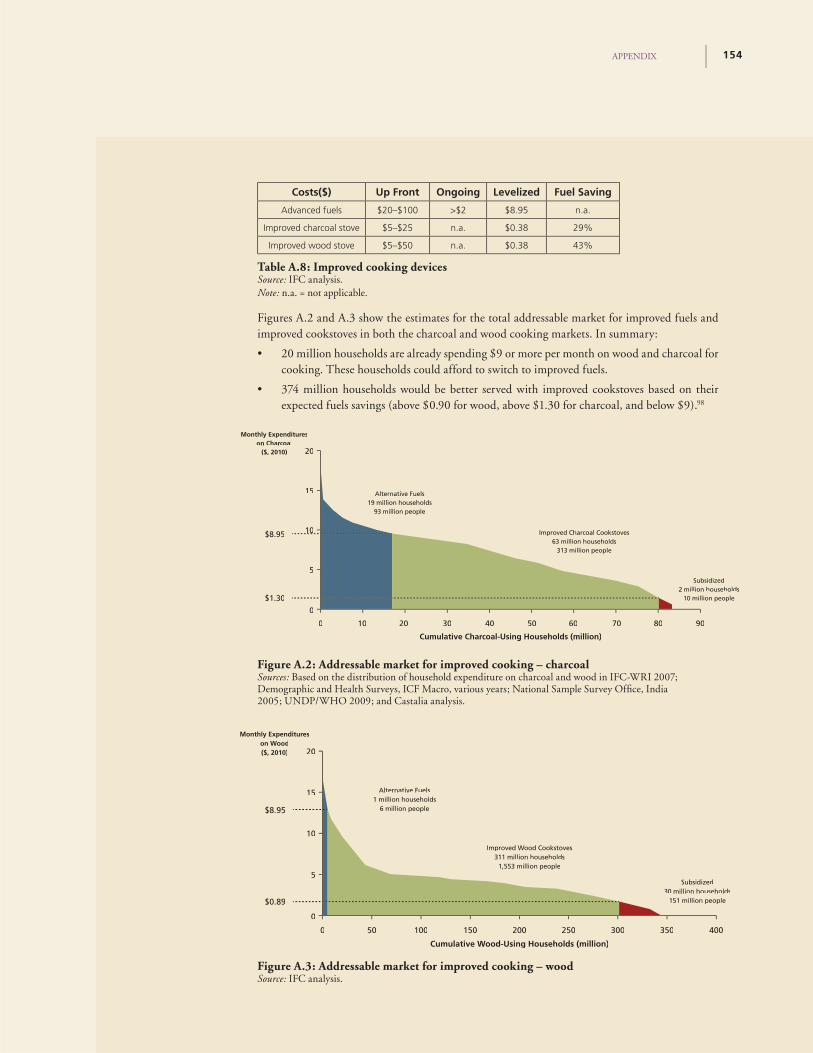
WHAT CAN BE DONE TO HELP SCALE UP ENERGY ACCESS SUCCESS STORIES?
Table A.8: Improved cooking devicesSource: IFC analysis.Note: n.a. = not applicable.
Figures A.2 and A.3 show the estimates for the total addressable market for improved fuels and improved cookstoves in both the charcoal and wood cooking markets. In summary:
• 20 million households are already spending $9 or more per month on wood and charcoal for cooking. These households could afford to switch to improved fuels.
• 374 million households would be better served with improved cookstoves based on their expected fuels savings (above $0.90 for wood, above $1.30 for charcoal, and below $9).98
Costs($) Up Front Ongoing Levelized Fuel Saving
Advanced fuels $20–$100 >$2 $8.95 n.a.
Improved charcoal stove $5–$25 n.a. $0.38 29%
Improved wood stove $5–$50 n.a. $0.38 43%
Monthly Expenditureson Charcoal
($, 2010)
Subsidized2 million households
10 million people
Improved Charcoal Cookstoves63 million households
313 million people
Alternative Fuels19 million households
93 million people
Cumulative Charcoal-Using Households (million)
0
20
0
5
10
15
908070605040302010
$8.95
$1.30
Monthly Expenditureson Wood($, 2010)
Subsidized30 million households
151 million people
Improved Wood Cookstoves311 million households
1,553 million people
Alternative Fuels1 million households
6 million people
20
0
5
10
15
400350300250200150100500
$8.95
$0.89
Cumulative Wood-Using Households (million)
Figure A.3: Addressable market for improved cooking – woodSource: IFC analysis.
Figure A.2: Addressable market for improved cooking – charcoalSources: Based on the distribution of household expenditure on charcoal and wood in IFC-WRI 2007; Demographic and Health Surveys, ICF Macro, various years; National Sample Survey Offi ce, India 2005; UNDP/WHO 2009; and Castalia analysis.
APPENDIX 154
CHAPTER 4155
Cooking for over $9 per month – the addressable market for modern improved cooking fuels
Households spending over $9 on traditional biomass for cooking have the potential to switch to a modern, more advanced fuel. These fuels include new technologies that turn agricultural waste into biomass pellets, charcoal-dust, and liquid fuels, and also more established modern fuels, such as liquefi ed petroleum gas. Additional benefi ts from switching to an improved fuel for cooking not only include improved health impacts, but these technologies often have reduced cooking times and less impact on the environment.
Cooking for ~$1 to $9 per month – the addressable market for improved wood and charcoal cookstoves
Households that are spending $.90 for wood or $1.30 for charcoal, and up to $8.95 per month, could afford to purchase an improved cookstove based on the expected fuel savings over the product’s life. The lowest-cost improved cookstoves on the market today are about $7 and can save a family at least 30 percent in charcoal over traditional cookstoves, or 40 percent in wood over a three-stone fi re.
The estimate of the addressable market for improved cookstoves is based on the expected monthly fuel savings per family. If these savings are greater than or equal to the monthly cost of the cookstove,99 the household would benefi t from purchasing an improved cookstove. The monthly capital cost for a $7 cookstove is $0.38. This capital cost would be more than compensated by fuel savings at monthly expenditures on charcoal of at least $1.30, or $0.90 on wood.
As for the electricity market, this is a theoretically addressable market, since certain segments of this market will be foreclosed by local cooking practices that are incompatible with standard improved cookstoves or modern fuel devices. Also, the decision to purchase a cookstove is not entirely based on fuel savings. While savings remain the fi rst priority of many poor households, design elements such as portability, ease of use, and cooking time are also important factors that infl uence willingness to pay. The effect of fi nancing constraints, resulting in higher up-front costs, or variations in willingness to pay, can be seen in the following sensitivity analysis.
Sensitivities of the addressable market for improved cookstoves and fuels
Analogous to the electricity section, this section analyzes the sensitivity of the addressable market estimates to up-front cost, to the price of the product, to incomes or willingness to pay, and to future scenarios.
APPENDIX155
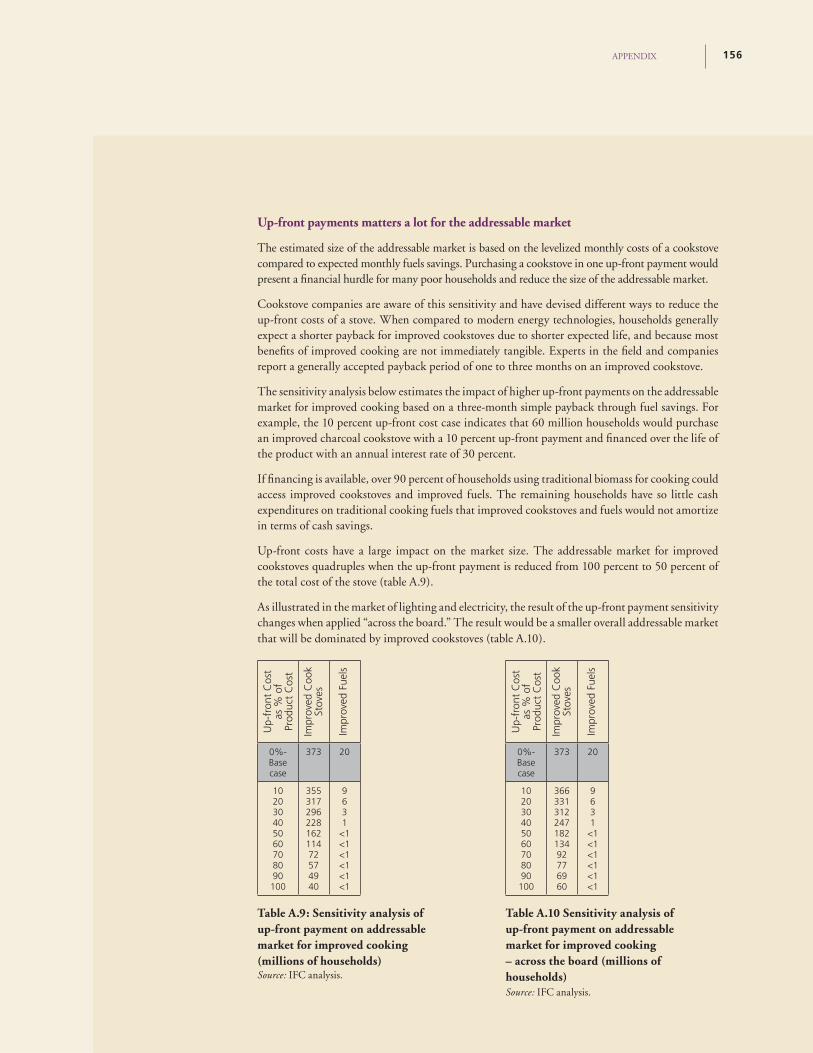
WHAT CAN BE DONE TO HELP SCALE UP ENERGY ACCESS SUCCESS STORIES?
Up-front payments matters a lot for the addressable market
The estimated size of the addressable market is based on the levelized monthly costs of a cookstove compared to expected monthly fuels savings. Purchasing a cookstove in one up-front payment would present a fi nancial hurdle for many poor households and reduce the size of the addressable market.
Cookstove companies are aware of this sensitivity and have devised different ways to reduce the up-front costs of a stove. When compared to modern energy technologies, households generally expect a shorter payback for improved cookstoves due to shorter expected life, and because most benefi ts of improved cooking are not immediately tangible. Experts in the fi eld and companies report a generally accepted payback period of one to three months on an improved cookstove.
The sensitivity analysis below estimates the impact of higher up-front payments on the addressable market for improved cooking based on a three-month simple payback through fuel savings. For example, the 10 percent up-front cost case indicates that 60 million households would purchase an improved charcoal cookstove with a 10 percent up-front payment and fi nanced over the life of the product with an annual interest rate of 30 percent.
If fi nancing is available, over 90 percent of households using traditional biomass for cooking could access improved cookstoves and improved fuels. The remaining households have so little cash expenditures on traditional cooking fuels that improved cookstoves and fuels would not amortize in terms of cash savings.
Up-front costs have a large impact on the market size. The addressable market for improved cookstoves quadruples when the up-front payment is reduced from 100 percent to 50 percent of the total cost of the stove (table A.9).
As illustrated in the market of lighting and electricity, the result of the up-front payment sensitivity changes when applied “across the board.” The result would be a smaller overall addressable market that will be dominated by improved cookstoves (table A.10).
Up-
fron
t C
ost
as %
of
Prod
uct
Cos
t
Impr
oved
Coo
k St
oves
Impr
oved
Fue
ls
0%- Base case
373 20
102030405060708090100
35531729622816211472574940
9631
<1<1<1<1<1<1
Source: IFC analysis.
Table A.9: Sensitivity analysis of up-front payment on addressable market for improved cooking (millions of households)
Up-
fron
t C
ost
as %
of
Prod
uct
Cos
t
Impr
oved
Coo
k St
oves
Impr
oved
Fue
ls
0%- Base case
373 20
102030405060708090
100
36633131224718213492776960
9631
<1<1<1<1<1<1
Source: IFC analysis.
Table A.10 Sensitivity analysis of up-front payment on addressable market for improved cooking – across the board (millions of households)
APPENDIX 156
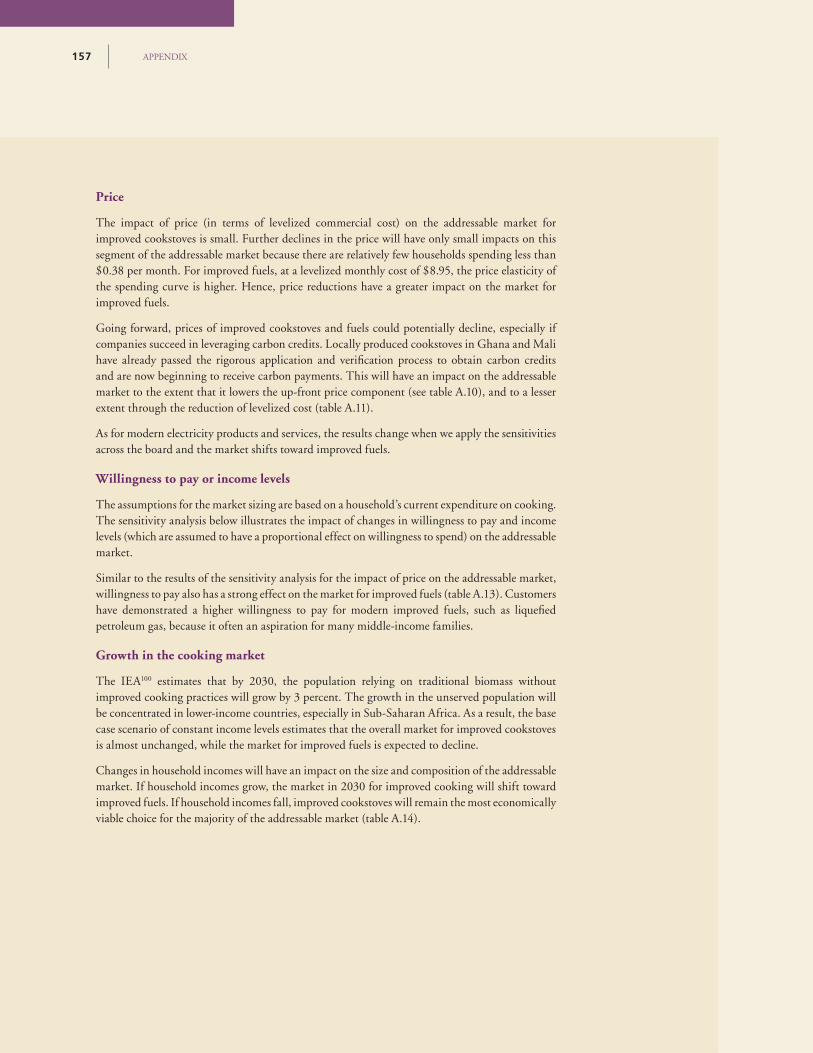
CHAPTER 4157
Price
The impact of price (in terms of levelized commercial cost) on the addressable market for improved cookstoves is small. Further declines in the price will have only small impacts on this segment of the addressable market because there are relatively few households spending less than $0.38 per month. For improved fuels, at a levelized monthly cost of $8.95, the price elasticity of the spending curve is higher. Hence, price reductions have a greater impact on the market for improved fuels.
Going forward, prices of improved cookstoves and fuels could potentially decline, especially if companies succeed in leveraging carbon credits. Locally produced cookstoves in Ghana and Mali have already passed the rigorous application and verifi cation process to obtain carbon credits and are now beginning to receive carbon payments. This will have an impact on the addressable market to the extent that it lowers the up-front price component (see table A.10), and to a lesser extent through the reduction of levelized cost (table A.11).
As for modern electricity products and services, the results change when we apply the sensitivities across the board and the market shifts toward improved fuels.
Willingness to pay or income levels
The assumptions for the market sizing are based on a household’s current expenditure on cooking. The sensitivity analysis below illustrates the impact of changes in willingness to pay and income levels (which are assumed to have a proportional effect on willingness to spend) on the addressable market.
Similar to the results of the sensitivity analysis for the impact of price on the addressable market, willingness to pay also has a strong effect on the market for improved fuels (table A.13). Customers have demonstrated a higher willingness to pay for modern improved fuels, such as liquefi ed petroleum gas, because it often an aspiration for many middle-income families.
Growth in the cooking market
The IEA100 estimates that by 2030, the population relying on traditional biomass without improved cooking practices will grow by 3 percent. The growth in the unserved population will be concentrated in lower-income countries, especially in Sub-Saharan Africa. As a result, the base case scenario of constant income levels estimates that the overall market for improved cookstoves is almost unchanged, while the market for improved fuels is expected to decline.
Changes in household incomes will have an impact on the size and composition of the addressable market. If household incomes grow, the market in 2030 for improved cooking will shift toward improved fuels. If household incomes fall, improved cookstoves will remain the most economically viable choice for the majority of the addressable market (table A.14).
APPENDIX157
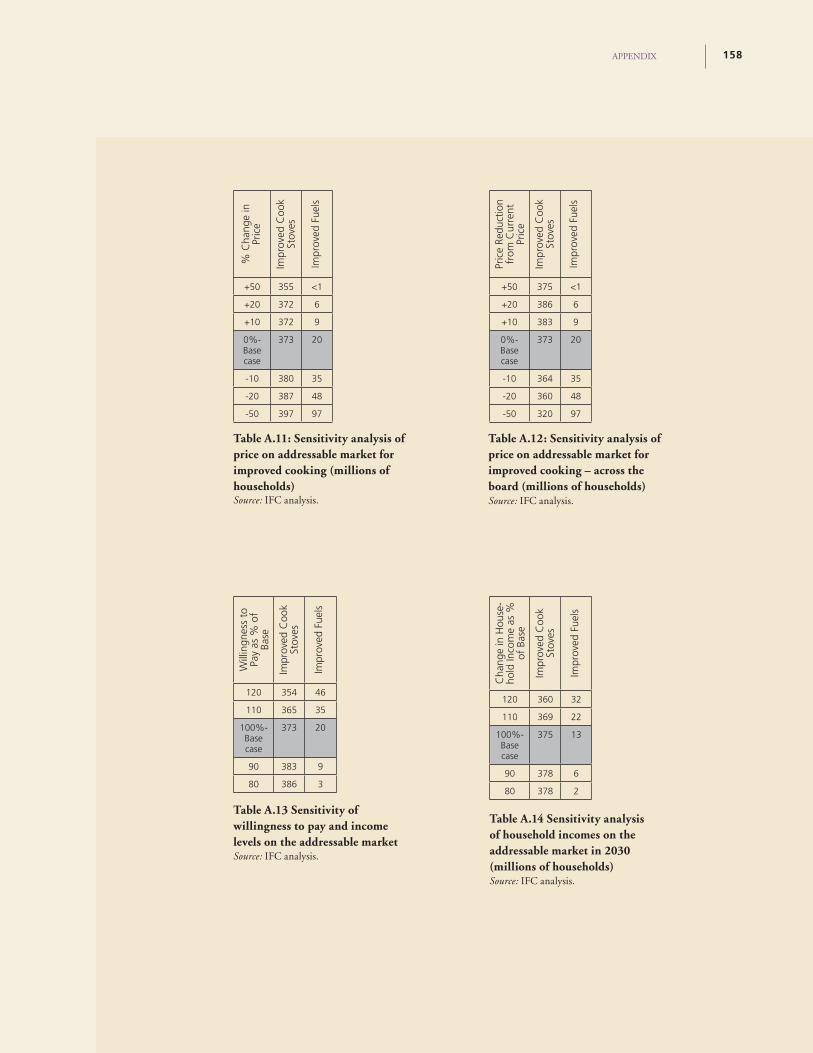
WHAT CAN BE DONE TO HELP SCALE UP ENERGY ACCESS SUCCESS STORIES?
% C
hang
e in
Pr
ice
Impr
oved
Coo
k St
oves
Impr
oved
Fue
ls
+50 355 <1
+20 372 6
+10 372 9
0%- Base case
373 20
-10 380 35
-20 387 48
-50 397 97
Source: IFC analysis.
Table A.11: Sensitivity analysis of price on addressable market for improved cooking (millions of households)
Pric
e Re
duct
ion
from
Cur
rent
Pr
ice
Impr
oved
Coo
k St
oves
Impr
oved
Fue
ls
+50 375 <1
+20 386 6
+10 383 9
0%- Base case
373 20
-10 364 35
-20 360 48
-50 320 97
Source: IFC analysis.
Table A.12: Sensitivity analysis of price on addressable market for improved cooking – across the board (millions of households)
Will
ingn
ess
to
Pay
as %
of
Base
Impr
oved
Coo
k St
oves
Impr
oved
Fue
ls
120 354 46
110 365 35
100%- Base case
373 20
90 383 9
80 386 3
Source: IFC analysis.
Table A.13 Sensitivity of willingness to pay and income levels on the addressable market
Cha
nge
in H
ouse
-ho
ld In
com
e as
%
of B
ase
Impr
oved
Coo
k St
oves
Impr
oved
Fue
ls
120 360 32
110 369 22
100%- Base case
375 13
90 378 6
80 378 2
Source: IFC analysis.
Table A.14 Sensitivity analysis of household incomes on the addressable market in 2030 (millions of households)
APPENDIX 158
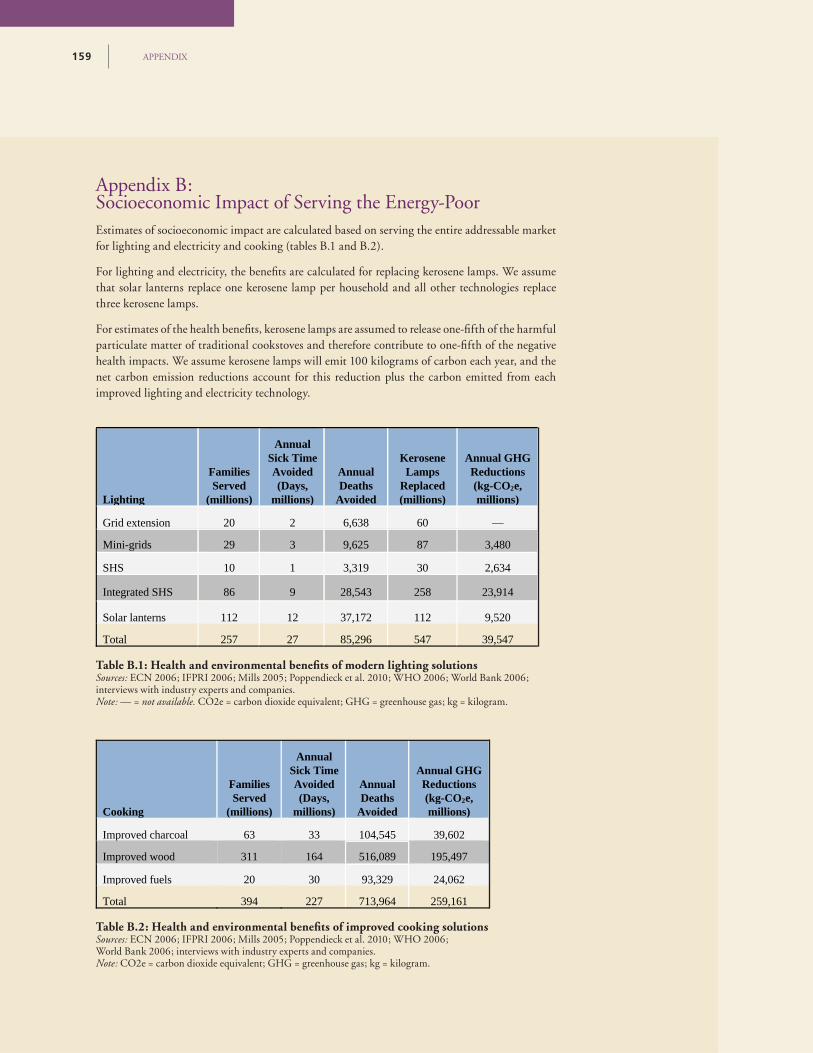
CHAPTER 4159
Appendix B: Socioeconomic Impact of Serving the Energy-PoorEstimates of socioeconomic impact are calculated based on serving the entire addressable market for lighting and electricity and cooking (tables B.1 and B.2).
For lighting and electricity, the benefi ts are calculated for replacing kerosene lamps. We assume that solar lanterns replace one kerosene lamp per household and all other technologies replace three kerosene lamps.
For estimates of the health benefi ts, kerosene lamps are assumed to release one-fi fth of the harmful particulate matter of traditional cookstoves and therefore contribute to one-fi fth of the negative health impacts. We assume kerosene lamps will emit 100 kilograms of carbon each year, and the net carbon emission reductions account for this reduction plus the carbon emitted from each improved lighting and electricity technology.
Table B.1: Health and environmental benefi ts of modern lighting solutionsSources: ECN 2006; IFPRI 2006; Mills 2005; Poppendieck et al. 2010; WHO 2006; World Bank 2006; interviews with industry experts and companies. Note: — = not available. CO2e = carbon dioxide equivalent; GHG = greenhouse gas; kg = kilogram.
Table B.2: Health and environmental benefi ts of improved cooking solutionsSources: ECN 2006; IFPRI 2006; Mills 2005; Poppendieck et al. 2010; WHO 2006;World Bank 2006; interviews with industry experts and companies.Note: CO2e = carbon dioxide equivalent; GHG = greenhouse gas; kg = kilogram.
Cooking
Families Served
(millions)
Annual Sick Time Avoided (Days,
millions)
Annual Deaths
Avoided
Annual GHG Reductions (kg-CO2e, millions)
Improved charcoal 63 33 104,545 39,602
Improved wood 311 164 516,089 195,497
Improved fuels 20 30 93,329 24,062
Total 394 227 713,964 259,161
Lighting
Families Served
(millions)
Annual Sick Time Avoided (Days,
millions)
Annual Deaths
Avoided
Kerosene Lamps
Replaced (millions)
Annual GHG Reductions (kg-CO2e, millions)
Grid extension 20 2 6,638 60 —
Mini-grids 29 3 9,625 87 3,480
SHS 10 1 3,319 30 2,634
Integrated SHS 86 9 28,543 258 23,914
Solar lanterns 112 12 37,172 112 9,520
Total 257 27 85,296 547 39,547
APPENDIX159
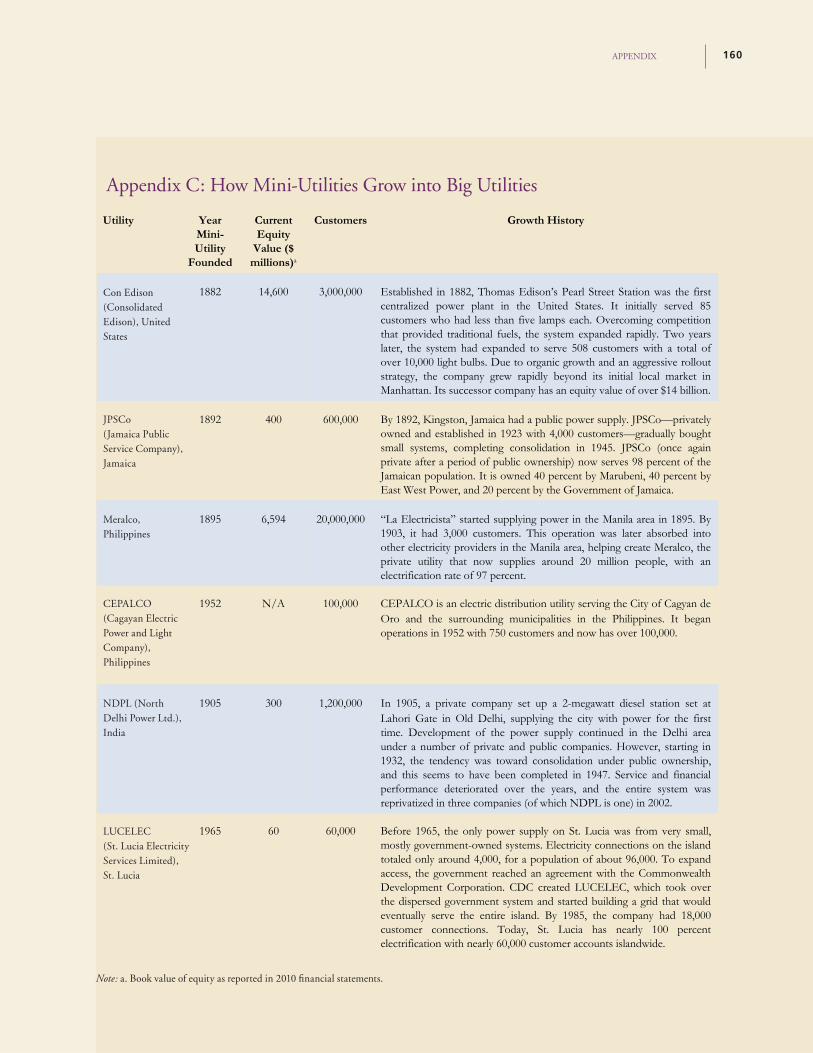
WHAT CAN BE DONE TO HELP SCALE UP ENERGY ACCESS SUCCESS STORIES?
119 Book value of equity, 2010 fi nancial statements
Appendix C: How Mini-Utilities Grow into Big Utilities
Note: a. Book value of equity as reported in 2010 fi nancial statements.
Utility Year Mini-Utility
Founded
Current Equity
Value ($ millions)a
Customers Growth History
Con Edison (Consolidated Edison), United States
1882 14,600 3,000,000 Established in 1882, Thomas Edison’s Pearl Street Station was the first centralized power plant in the United States. It initially served 85 customers who had less than five lamps each. Overcoming competition that provided traditional fuels, the system expanded rapidly. Two years later, the system had expanded to serve 508 customers with a total of over 10,000 light bulbs. Due to organic growth and an aggressive rollout strategy, the company grew rapidly beyond its initial local market in Manhattan. Its successor company has an equity value of over $14 billion.
JPSCo (Jamaica Public Service Company), Jamaica
1892 400 600,000 By 1892, Kingston, Jamaica had a public power supply. JPSCo—privately owned and established in 1923 with 4,000 customers—gradually bought small systems, completing consolidation in 1945. JPSCo (once again private after a period of public ownership) now serves 98 percent of the Jamaican population. It is owned 40 percent by Marubeni, 40 percent by East West Power, and 20 percent by the Government of Jamaica.
Meralco, Philippines
1895 6,594 20,000,000 “La Electricista” started supplying power in the Manila area in 1895. By 1903, it had 3,000 customers. This operation was later absorbed into other electricity providers in the Manila area, helping create Meralco, the private utility that now supplies around 20 million people, with an electrification rate of 97 percent.
CEPALCO (Cagayan Electric Power and Light Company), Philippines
1952 N/A 100,000 CEPALCO is an electric distribution utility serving the City of Cagyan de Oro and the surrounding municipalities in the Philippines. It began operations in 1952 with 750 customers and now has over 100,000.
NDPL (North Delhi Power Ltd.), India
1905 300 1,200,000 In 1905, a private company set up a 2-megawatt diesel station set at Lahori Gate in Old Delhi, supplying the city with power for the first time. Development of the power supply continued in the Delhi area under a number of private and public companies. However, starting in 1932, the tendency was toward consolidation under public ownership, and this seems to have been completed in 1947. Service and financial performance deteriorated over the years, and the entire system was reprivatized in three companies (of which NDPL is one) in 2002.
LUCELEC
(St. Lucia Electricity Services Limited), St. Lucia
1965 60 60,000 Before 1965, the only power supply on St. Lucia was from very small, mostly government-owned systems. Electricity connections on the island totaled only around 4,000, for a population of about 96,000. To expand access, the government reached an agreement with the Commonwealth Development Corporation. CDC created LUCELEC, which took over the dispersed government system and started building a grid that would eventually serve the entire island. By 1985, the company had 18,000 customer connections. Today, St. Lucia has nearly 100 percent electrification with nearly 60,000 customer accounts islandwide.
CEPALCO (Cagayan Electric Power and LightCompany), Philippines
NDPL (North Delhi Power Ltd.), India
LUCELEC(St. Lucia Electricity Services Limited), St. Lucia
Meralco, Philippines
JPSCo (Jamaica Public Service Company), Jamaica
Con Edison (Consolidated Edison), United States
APPENDIX 160
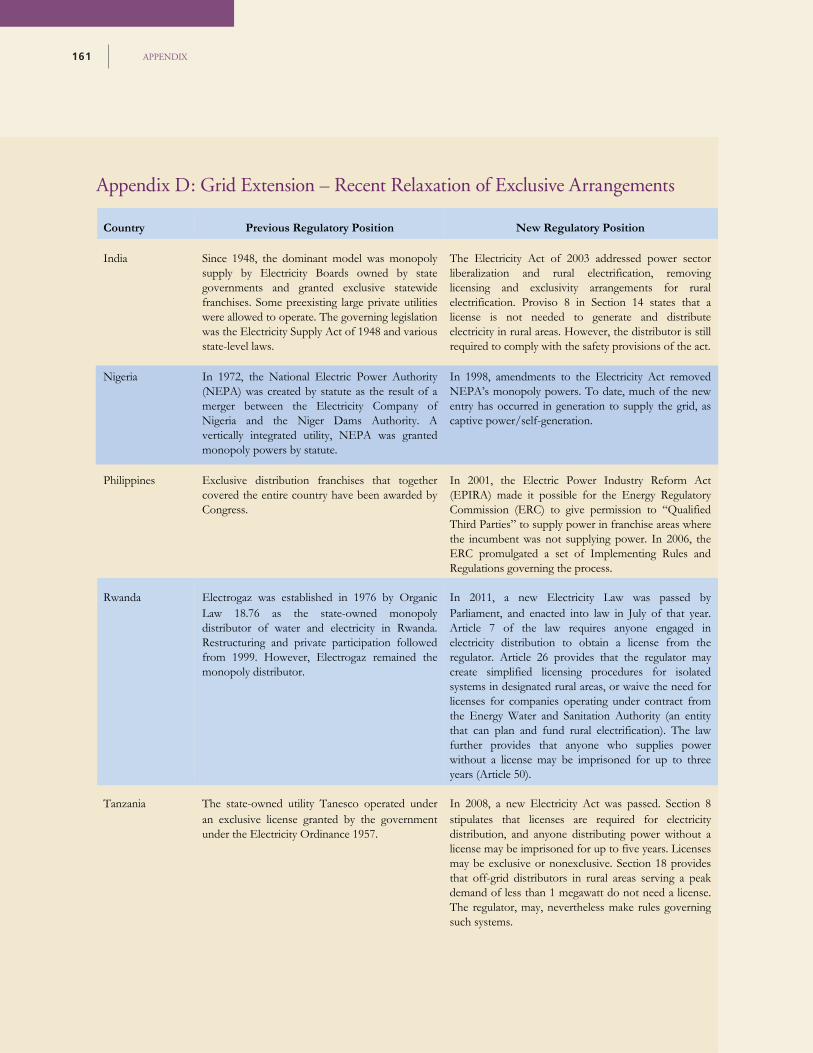
CHAPTER 4161
Appendix D: Grid Extension – Recent Relaxation of Exclusive Arrangements
Country Previous Regulatory Position New Regulatory Position
India Since 1948, the dominant model was monopoly supply by Electricity Boards owned by state governments and granted exclusive statewide franchises. Some preexisting large private utilities were allowed to operate. The governing legislation was the Electricity Supply Act of 1948 and various state-level laws.
The Electricity Act of 2003 addressed power sector liberalization and rural electrification, removing licensing and exclusivity arrangements for rural electrification. Proviso 8 in Section 14 states that a license is not needed to generate and distribute electricity in rural areas. However, the distributor is still required to comply with the safety provisions of the act.
Nigeria In 1972, the National Electric Power Authority (NEPA) was created by statute as the result of a merger between the Electricity Company of Nigeria and the Niger Dams Authority. A vertically integrated utility, NEPA was granted monopoly powers by statute.
In 1998, amendments to the Electricity Act removed NEPA’s monopoly powers. To date, much of the new entry has occurred in generation to supply the grid, as captive power/self-generation.
Philippines Exclusive distribution franchises that together covered the entire country have been awarded by Congress.
In 2001, the Electric Power Industry Reform Act (EPIRA) made it possible for the Energy Regulatory Commission (ERC) to give permission to “Qualified Third Parties” to supply power in franchise areas where the incumbent was not supplying power. In 2006, the ERC promulgated a set of Implementing Rules and Regulations governing the process.
Rwanda Electrogaz was established in 1976 by Organic Law 18.76 as the state-owned monopoly distributor of water and electricity in Rwanda. Restructuring and private participation followed from 1999. However, Electrogaz remained the monopoly distributor.
In 2011, a new Electricity Law was passed by Parliament, and enacted into law in July of that year. Article 7 of the law requires anyone engaged in electricity distribution to obtain a license from the regulator. Article 26 provides that the regulator may create simplified licensing procedures for isolated systems in designated rural areas, or waive the need for licenses for companies operating under contract from the Energy Water and Sanitation Authority (an entity that can plan and fund rural electrification). The law further provides that anyone who supplies power without a license may be imprisoned for up to three years (Article 50).
Tanzania The state-owned utility Tanesco operated under an exclusive license granted by the government under the Electricity Ordinance 1957.
In 2008, a new Electricity Act was passed. Section 8 stipulates that licenses are required for electricity distribution, and anyone distributing power without a license may be imprisoned for up to five years. Licenses may be exclusive or nonexclusive. Section 18 provides that off-grid distributors in rural areas serving a peak demand of less than 1 megawatt do not need a license. The regulator, may, nevertheless make rules governing such systems.
APPENDIX161
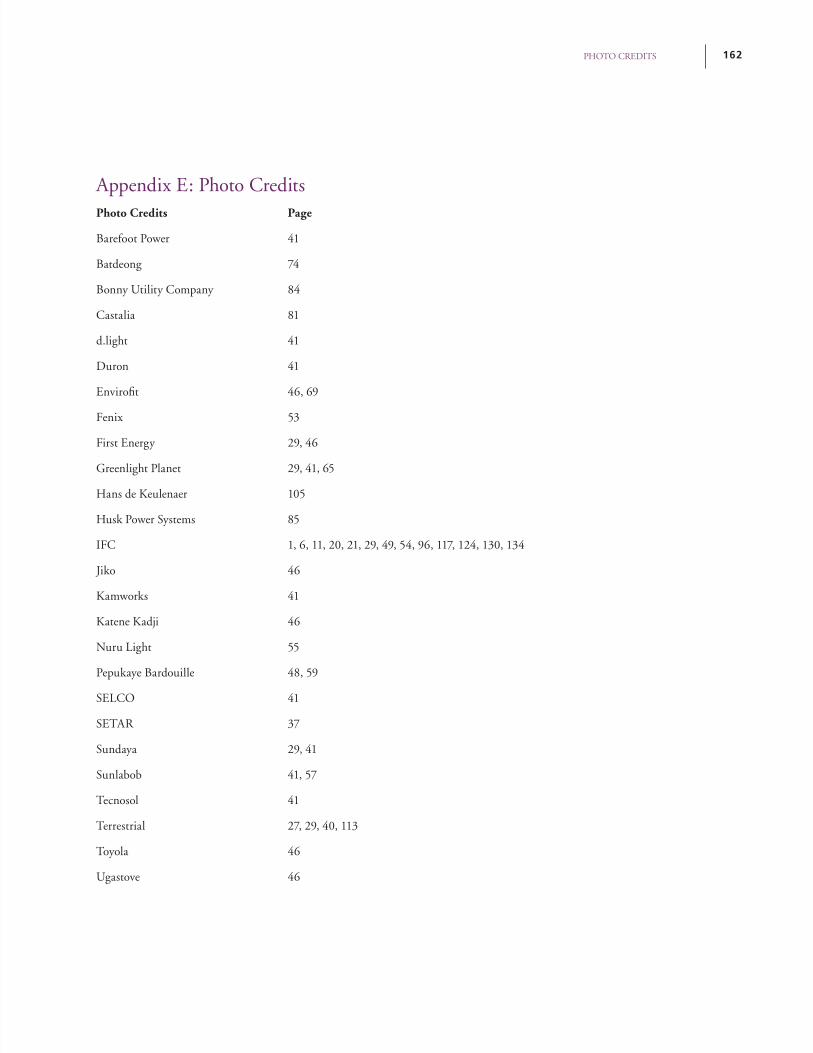
Appendix E: Photo Credits Photo Credits Page
Barefoot Power 41
Batdeong 74
Bonny Utility Company 84
Castalia 81
d.light 41
Duron 41
Envirofi t 46, 69
Fenix 53
First Energy 29, 46
Greenlight Planet 29, 41, 65
Hans de Keulenaer 105
Husk Power Systems 85
IFC 1, 6, 11, 20, 21, 29, 49, 54, 96, 117, 124, 130, 134
Jiko 46
Kamworks 41
Katene Kadji 46
Nuru Light 55
Pepukaye Bardouille 48, 59
SELCO 41
SETAR 37
Sundaya 29, 41
Sunlabob 41, 57
Tecnosol 41
Terrestrial 27, 29, 40, 113
Toyola 46
Ugastove 46
PHOTO CREDITS 162
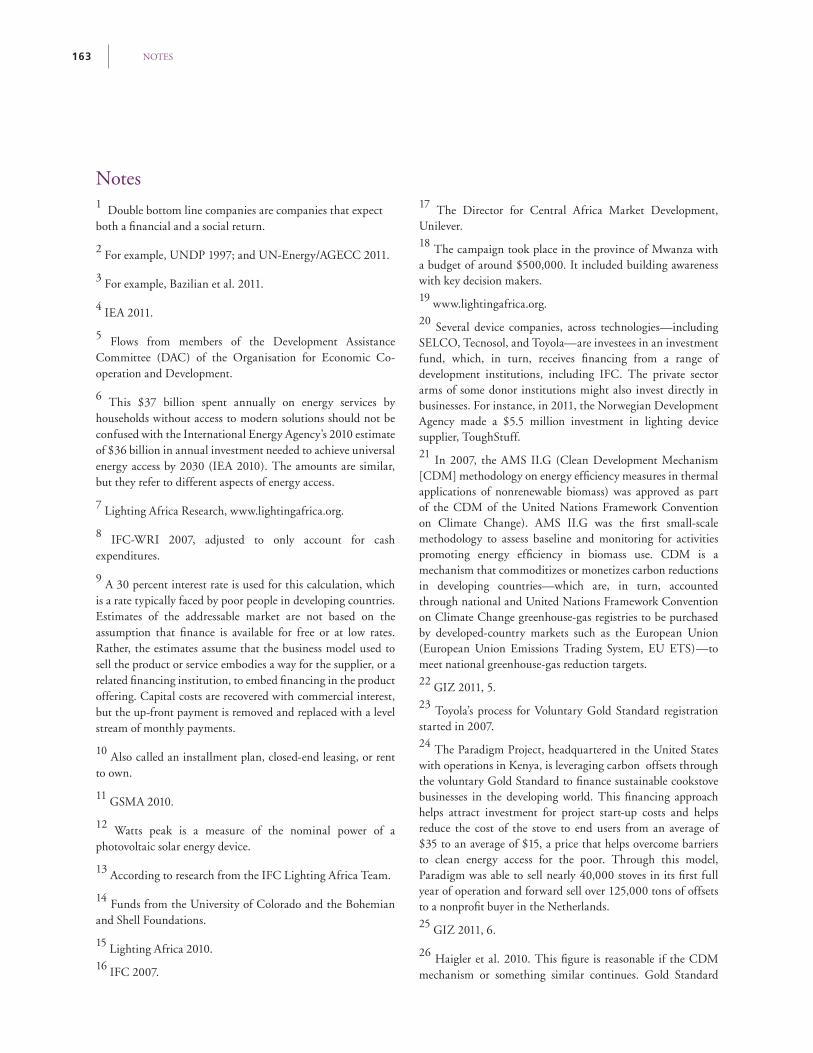
163
1 Double bottom line companies are companies that expect both a fi nancial and a social return.
2 For example, UNDP 1997; and UN-Energy/AGECC 2011.
3 For example, Bazilian et al. 2011.
4 IEA 2011.
5 Flows from members of the Development Assistance Committee (DAC) of the Organisation for Economic Co-operation and Development.
6 This $37 billion spent annually on energy services by households without access to modern solutions should not be confused with the International Energy Agency’s 2010 estimate of $36 billion in annual investment needed to achieve universal energy access by 2030 (IEA 2010). The amounts are similar, but they refer to different aspects of energy access.
7 Lighting Africa Research, www.lightingafrica.org.
8 IFC-WRI 2007, adjusted to only account for cash expenditures.
9 A 30 percent interest rate is used for this calculation, which is a rate typically faced by poor people in developing countries. Estimates of the addressable market are not based on the assumption that fi nance is available for free or at low rates. Rather, the estimates assume that the business model used to sell the product or service embodies a way for the supplier, or a related fi nancing institution, to embed fi nancing in the product offering. Capital costs are recovered with commercial interest, but the up-front payment is removed and replaced with a level stream of monthly payments.
10 Also called an installment plan, closed-end leasing, or rent to own.
11 GSMA 2010.
12 Watts peak is a measure of the nominal power of a photovoltaic solar energy device.
13 According to research from the IFC Lighting Africa Team.
14 Funds from the University of Colorado and the Bohemian and Shell Foundations.
15 Lighting Africa 2010.16 IFC 2007.
17 The Director for Central Africa Market Development, Unilever.18 The campaign took place in the province of Mwanza with a budget of around $500,000. It included building awareness with key decision makers.19 www.lightingafrica.org.20 Several device companies, across technologies—including SELCO, Tecnosol, and Toyola—are investees in an investment fund, which, in turn, receives fi nancing from a range of development institutions, including IFC. The private sector arms of some donor institutions might also invest directly in businesses. For instance, in 2011, the Norwegian Development Agency made a $5.5 million investment in lighting device supplier, ToughStuff.21 In 2007, the AMS II.G (Clean Development Mechanism [CDM] methodology on energy effi ciency measures in thermal applications of nonrenewable biomass) was approved as part of the CDM of the United Nations Framework Convention on Climate Change). AMS II.G was the fi rst small-scale methodology to assess baseline and monitoring for activities promoting energy effi ciency in biomass use. CDM is a mechanism that commoditizes or monetizes carbon reductions in developing countries—which are, in turn, accounted through national and United Nations Framework Convention on Climate Change greenhouse-gas registries to be purchased by developed-country markets such as the European Union (European Union Emissions Trading System, EU ETS)—to meet national greenhouse-gas reduction targets. 22 GIZ 2011, 5.23 Toyola’s process for Voluntary Gold Standard registration started in 2007. 24 The Paradigm Project, headquartered in the United States with operations in Kenya, is leveraging carbon offsets through the voluntary Gold Standard to fi nance sustainable cookstove businesses in the developing world. This fi nancing approach helps attract investment for project start-up costs and helps reduce the cost of the stove to end users from an average of $35 to an average of $15, a price that helps overcome barriers to clean energy access for the poor. Through this model, Paradigm was able to sell nearly 40,000 stoves in its fi rst full year of operation and forward sell over 125,000 tons of offsets to a nonprofi t buyer in the Netherlands. 25 GIZ 2011, 6.
26 Haigler et al. 2010. This fi gure is reasonable if the CDM mechanism or something similar continues. Gold Standard
Notes
NOTES
NOTES 164
Carbon Credits may sell for less than this, perhaps around $5.27 Programmatic CDM is also called a program of activities (PoA). This is a voluntary action undertaken by a private or public entity that coordinates and implements any policy, measure, or stated goal (that is, incentive schemes and voluntary programs), which leads to greenhouse gas emission reductions that are additional to any that would occur in the absence of the PoA.28 Wurster 2011.29 1,000 kW = 1 MW.30 This differs from independent or merchant power producers, which feed power into the grid using an offtake agreement with the incumbent utility, supply large customers through bilateral arrangements, or generate power for their own consumption.31 Used broadly to describe the shift, as incomes rise and preferences change, to increasingly effi cient and less directly polluting energy carriers and conversion devices. For cooking and heating, the steps rise from dung or crop residues to fuel wood, charcoal, kerosene, and liquefi ed petroleum gas, natural gas, or electricity. In the case of lighting, the steps are initially fi re then kerosene or candles and then electric bulbs.32 Since the report does not consider the additional restriction of load density, but only income levels.33 Micro hydro is a type of hydroelectric power that typically produces up to 100 kW of electricity using the natural fl ow of water. 34 According to interviews with three mini-utility companies.35 Three-phase electric power, the most common method used by grids worldwide to transfer power, is a method of alternating current electric power generation, transmission, and distribution.36 Electricité de France and Total sold their shares to RESCO employees in 1999.37 UNDP 2011.38 IFMR 2010.39 Silica and rice husk char are by-products of HPS’s operations. Rice husk char can be compressed into incense sticks.40 As the distance between customers increases, the cost of distributing power to each user rises (because more investment in wires and poles is needed), and at a certain point the additional cost of distribution starts to exceed the cost advantage that the mini-utility has in generation. The crossover point between the costs of the different technologies depends on many location-
specifi c factors, notably the cost of generation by the mini-utility, the quality of the solar resource powering a solar home system, and the cost per kilometer of erecting distribution lines. Other factors, like the diversity of load profi le in the area served, can also come into it.41 The nonprofi t arm is DESI Management Training Centre for Rural Women, or Mantra, and the loan provider is Baharbari Odhyogik Vikash Sahkari Samiti.42 Feed-in tariffs are a policy mechanism used in a number of countries to accelerate investment in renewable energy technologies by offering power producers long-term supply contracts, generally refl ecting the technology-specifi c cost of generation.43 IFMR 2010.44 Baker 2009, 18.45 While there are a few examples of mini-utilities leveraging carbon fi nance, these are limited, and therefore will not be discussed here.46 Castalia research for World Bank.47 Jadresic 2000.48 The arguments in this section are based, in part, on Ehrhardt and Burdon 1999.49 State governments specify which parts of the state are to be classifi ed as rural for these purposes.50 Baker 2009.51 Marboeuf 2009.52 This later resulted in signifi cant overcapacity. These circumstances reversed dramatically under different leadership a decade later, leading to rolling blackouts. But due to the bulky nature of power generation investments and lag times in new capacity coming online, such dynamics are, unfortunately, widespread.53 Ampla’s initiative has won multiple prizes, including “Best International Metering Initiative” in 2006.
54 The company offers basic life insurance to families that remain current with their bills. This is valued by customers because life insurance is otherwise not available in these communities, and the loss of a breadwinner can leave a family destitute. NDPL is able to create a risk pool that is insurable and to provide a low-cost distribution mechanism for the families. The company pays the premium to keep the insurance current so long as their bill is paid. This creates a strong incentive for families to pay their bills, since there is no other way to obtain
165
or maintain life insurance.
55 IFC 2010, 46.
56 World Bank 2011.
57 Smith 1995, 48–9.
58 Majority owned by WRB Enterprises of Florida, DOMLEC was established in 1949 as a private company and has grown to serve nearly 100 percent of the population, using a mix of hydro- and oil-based thermal plants. In 2009, it earned revenues of $76.8 million and has averaged above a 5 percent return on assets over the last fi ve years.
59 The utility is regulated by the Energy Regulatory Commission, which has traditionally operated on a U.S.-style, cost-plus regulatory plan, in which tariffs are adjusted only when the utility so requests. The dynamic in the Philippines under this regime has been that companies that grow quickly do well—since the reductions in cost from growing economies of scale can outstrip cost increases from infl ation, allowing companies to earn attractive rates of return. It thus seems likely that a strategy to promote rapid growth will contribute to higher returns on investment for the company.
60 Codensa emerged from the 1997 unbundling and privatization of the public utility and has extended electrifi cation in its area to 99.98 percent.
61 Another relevant point for the Codensa Hogar model is that the utility also has the fi nancial strength and reliable brand name needed to encourage merchants to accept its card.
62 The source for statements about government motivation is a Castalia interview with a member of the Privatization Task Force. The information presented on North Delhi Power Ltd. was kindly supplied by the senior management team of the utility in a half-day interview at the company headquarters in Delhi, and supporting documentation provided by the company.
63 That is, $80 million from the initial cash equity investment, $210 million in retained earnings, and $320 million in bank debt. Major lenders include IDBI (Industrial Development Bank of India), IDFC (Infrastructure Development Finance Company Limited), and the State Bank of India. Return on equity from 2002 to 2010 was around 21 percent on capital invested.
64 Return on equity fi gures were not available.
65 Jadresic 2000.
66 In a competitive situation, the subsidy required should be no more than the gap between the (present value of) returns expected on the area and the returns required for commercial viability. This kind of output-based plan can also be referred to as “Viability Gap Financing,” since the government puts in only the minimum amount of grant fi nance needed to fi ll the gap between the expected returns and commercially viable returns. Both Output-Based Aid and Viability Gap Financing fall into the broad category of Results-Based Financing.
67 ONE will operate the concession through a special purpose company known as Comasel de St. Louis, a new company set up specifi cally for the purpose, under a 25-year concession. The company is a wholly owned subsidiary of ONE, the Moroccan electricity utility. Comasel’s target for equity returns is in the mid-teens. It is expected that the fi rst customers will be supplied during 2012, after some contractual issues have been resolved with the regulator.
68 Gassner, Popov, and Pushak 2009.
69 For information on Dialog and Idea Cellular, see IFC 2010.
70 UNELCO serves Port Vila (the capital); Luganville, part of the island of Tanna; and part of the island of Malekula. The company was founded in 1945, and has been privately operated and profi table throughout that time; in recent years, it earned a return on equity invested of over 20 percent.
71 In the Philippines, utilities from the smallest rural cooperative to huge enterprises like MERALCO have been granted franchises by the Philippine Congress. No utility is allowed to serve outside its franchise area. MERALCO is the Philippines’s largest electric power distributor. It supplies around 5 million customers, with an electrifi cation rate in its franchise area of 97 percent. An estimated 20 to 25 percent of Filipinos are without power supply. Some of these could be commercially served by utility grids, but neither MERALCO nor any other utility is allowed to extend service to unserved customers if they lie outside its franchise area.
72 IFC 2010, 9–10.
73 CEMAR, the previously state-owned utility, was privatized in 2000. The utility was bought by its current owners, GP Investimentos, in 2004, and since then it has provided
NOTES
NOTES 166
electricity to over 500,000 new customers. A universal electrifi cation program, Luz para Todos, was a key driver, but so was the company’s own ability to improve management effi ciency and attract capital. In part because of this expansion of access, CEMAR has achieved an annual average growth in revenue of 12 percent, and a margin of around 40 percent on it earnings before interest, taxes, depreciation, and amortization.
74 GSMA 2010b.
75 As asserted in Tenenbaum (2006), the two golden rules for regulation should be that (a) regulation is a means to an end. What ultimately matters are outcomes (sustainable electrifi cation) not regulatory rules; and (b) the benefi ts of regulation must exceed the costs. The economics of off-grid electrifi cation are fragile, with the most expensive electricity being “no electricity.”
76 Reiche, Tenenbaum, and Torres de Mästle 2006.
77 Castalia research funded by the World Bank.
78 Gassner, Popov, and Pushak 2009.
79 Concessional fi nancing typically refers to fi nancing which, compared with commercial terms, provides a subsidy. This subsidy can be in the form of a low interest rate, a long tenure, a subordination, or a grant. (“Subordination” refers to the priority in which fi nancial returns are redistributed to investors in a company or project. Typically, senior debt gets paid back fi rst, subordinated debt gets paid back next, and then holders of a company’s or project’s equity, the highest risk category in a capital structure, would see returns from their investment.) Concessional fi nancing takes the brunt of the risk and, as such, aims to incentivize investors and banks to support an asset class that otherwise has no or limited access to fi nancing. It is used to help design and test innovative business models (not just technologies), and to take them to proof of concept. At that stage, commercial capital can come in. The concessionality is typically provided by philanthropic donors, governments, international development institutions, or double bottom line investors, either directly or in cooperation with other development fi nance or commercial institutions.
80 Mezzanine fi nancing is part of the capital structure, typically convertible equity or subordinated debt, which has characteristics of both equity and debt. It is subordinate to senior debt but senior to the equity.
81 The arrangement would in addition be backed by several other fi nancial covenants to align the interests between the bank as lender and IFC, which assumes the project risk without
due diligence.
82 Through a certifi cation by Det Norske Veritas, DESI Power has been able to validate its project plans as per the United Nations Framework Convention on Climate Change criteria, and carbon credits equivalent to 5.15 MW of power generation have been sold in advance (Intellecap/IFC-Lighting Asia).
83 Of both CDM and Gold Standard CERs (Certifi ed Emission Reductions).
84 The Global Energy Entrepreneurship Program intends to launch an Energy Enterprise Portal to help connect potential investors to early-stage funding deal opportunities.
85 The network has ambitious plans to create over 2,400 enterprises, generate 240,000 direct and indirect jobs, install 3,000 MW of off-grid energy capacity, provide energy access to over 28 million people, deliver clean water to over 10 million households, and mitigate 65 million tons of carbon dioxide. The fi rst center in Kenya, which secured $15 million in funding, was launched in 2011.
86 Dasra, a nonprofi t funded entirely by grants, works with philanthropists, corporate foundations, and the government to pool and structure capital to meet their needs. It also serves as a conduit for eager impact investors, using its research arm and strong local networks to identify high-potential investees and document their business models. From that knowledge base, they pick companies that move into what is termed their “portfolio.” These portfolio businesses benefi t from an intense nine-month executive education program (which brings together 20 social businesses and 20 nonprofi t organizations in an attempt to cross-pollinate the two categories) that builds investment readiness, develops and articulates business plans and a compelling growth story, and details their fundamental operating approach. Dasra helped Husk Power Systems raise its fi rst round of equity, and has also been involved in d.light’s fund-raising efforts.
87 The focus has often been on cooking—SNV (the Dutch international nonprofi t organization) on biogas, GTZ and USAID on improved cookstoves, and DfID on indoor air pollution, for example.
88 For instance, until recently, there was very little data on kerosene spend in East Africa and, therefore, limited interest in alternatives. Data provision attracted market entrants. Another case showed that low quality solar lanterns have spoiled consumer confi dence in many markets. These data, which have enabled the
167
development of national level initiatives involving both business and public sector entities, would probably not have been generated without donor supported programs. The same is true for mini-utilities. Without basic mappings of both renewable energy (hydro resources, biomass availability, solar irradiation and wind speeds) and a detailed understanding of demand centers, mini-utility developers will struggle to build businesses.
89 The addressable market is not the maximum market size. Rather, calculations for estimating the size of the addressable market are based on a mix of conservative and more aggressive assumptions. Equalizing willingness to spend with current spending on primitive energy (not increasing it for better service levels) is conservative; using levelized cost is more aggressive.
90 Household Consumer Expenditure in India 2007–2008, National Sample Survey Offi ce India, 2008.
91 The market size model used estimates of the breakdown between grid access, mini-grid, and off-grid energy solutions to meet the target in the Universal Modern Energy Access Case presented by the IEA in IEA (2010). The Universal Modern Energy Access Case quantifi es a scenario in which only 1 billion people have access to electricity by 2015. To reach this target, the scenario estimates that 100 percent of the urban population and 30 percent of the rural population will have grid access. Of the remaining 70 percent of the rural population, 75 percent will be served by mini-grids and 25 percent will be served by off-grid solutions, such as solar home systems. These estimates are taken as indicative of a potential market share of these technologies.
92 Note that the present value of costs under the two payment options is the same (at a 30 percent interest rate, a rate typically faced by poor people in developing countries). Estimates of the addressable market are not based on the assumption that fi nance is available for free or at low rates. Rather, the estimates assume that the business model used to sell the product or service embodies a way for the supplier, or a related fi nancing institution, to embed fi nancing in the product offering. Capital costs are recovered with commercial interest, but the up-front payment is removed and replaced with a level stream of monthly payments.
93 While amortizing the remaining 50 percent at an interest rate of 30 percent over the three years.
94 Lighting Africa 2010.
95 World Bank 2007.
96 IEA/OECD 2010.
97 UNDP/WHO 2009.
98 The threshold for charcoal-fueled cookstoves ($1.30 per month) is higher than the one for wood ($0.90 per month) because the effi ciency gains are higher for wood. As a consequence, fuel savings are higher for wood, and cookstoves amortize faster. Improved cookstoves achieve fuel economies of 30 to 60 percent over traditional charcoal stoves, and they achieve 40 to 80 percent for wood. For the purposes of the market size methodology, 30 percent is used as a conservative estimate for charcoal and 40 percent for wood. These differences are linked to the fuel used and not to technical differences between improved charcoal and wood stoves, which have the same capital cost.
99 Assuming fi nancing over the life of the stove, with a 30 percent annual interest rate.
100 IEA/OECD 2010.
NOTES
LIST OF REFERENCES 168
References Baker, Julie L. 2009. “Opportunities and Challenges for Small Scale Private Service Provider
in Electricity and Water Supply: Evidence from Bangladesh, Cambodia, Kenya, and the Philippines.” World Bank, Washington, D.C.
Bazilian, M., P. Nussbauaumer, G. Gualberti, E. Haites, M. Levi, J. Siegel, D. Kammen, and J. Fenhann. 2011. “Informing the Financing of Universal Energy Access: An Assessment of Current Flows.” Fondazione Eni Enrico Mattei (FEEM) Working Paper No. 56, Milan.
Demographic and Health Surveys, ICF Macro, various years–United States. International Finance Corporation, Washington, D.C.
ECN. 2006. “Towards a Streamlined CDM Process for Solar Home Systems.” ECN, Petten, the Netherlands.
Ehrhardt, David, and Rebecca Burdon. 1999. “Free Entry in Infrastructure.” World Bank, Washington, D.C.
Gassner, Katharina, Alexander A. Popov, and Nataliya Pushak. 2009. “Does Private SectorParticipation Improve Performance in Electricity and Water Utilities?” World Bank, Washington, D.C.
GIZ. 2011. “Carbon Markets for Improved Cooking Stoves, A GIZ Guide for Project Operators,” Revised Edition. GIZ, Eschborn, Germany, January, p. 5.
GSMA. 2010a. “Green Power for Mobile.” GSMA, London. . 2010b. “Community Power from Mobile.” GSMA, London.
Haigler, Evan, Matt Evans, Erik Wurster, Alex Rau, Neil Bellefeuille, and Kirk Smith. 2010. “Concept Note: Cookstove Accelerator Facility.” ImpactCarbon, San Francisco, August 25.
“Household Consumer Expenditure in India 2007–2008.” 2008. National Sample Survey Offi ce India, New Delhi.
IEA (International Energy Agency). 2009. World Energy Outlook 2009. Paris: International Energy Agency.
. 2010. World Energy Outlook 2009. Paris: International Energy Agency. . 2011. World Energy Outlook 2011. Paris: International Energy Agency.
IEA/OECD (International Energy Agency/Organisation for Economic Co-operation and Development). 2010. “Energy Poverty: How to Make Modern Energy Access Universal.” International Energy Agency/Organisation for Economic Co-operation and Development, Paris.
IFC (International Finance Corporation). 2007. “Selling Solar: Lessons from More than a Decade of IFC’s Experience.” International Finance Corporation, Washington, D.C.
. 2010. “Inclusive Business Solutions: Expanding Opportunity and Access at the Base of the Pyramid.” International Finance Corporation, Washington, D.C.
. 2012. “Lighting Asia: Solar Off-Grid Lighting; Market Analysis of India, Bangladesh, Nepal, Pakistan, Indonesia, Cambodia and the Philippines.” International Finance Corporation, Washington, D.C.
169
IFC-WRI (International Finance Corporation/World Resources Institute. 2007. “The Next 4 Billion: Market Size and Business Strategy at the Base of the Pyramid.” (Allen Hammond, William J. Kramer, Julia Tran, Rob Katz, and Courtland Walker, authors.) International Finance Corporation/World Resources Institute, Washington, D.C.
IFMR Research Centre for Development Finance. 2010. “Empowering Villages: A Comparative Analysis of DESI Power and Husk Power Systems: Small-scale Biomass Power Generators in India.” IFMR Research Centre for Development Finance, Chennai, India.
IFPRI (International Food Policy Research Institute). 2006. “Bioenergy and Agriculture: Promises and Challenges.” International Food Policy Research Institute, Washington, D.C.
Jadresic, A. 2000. “A Case Study on Subsidizing Rural Electrifi cation in Chile.” Energy Services for the World’s Poor, World Bank, Washington, D.C.
Kariuki, Mukami, and Jordan Schwartz. 2005. “Small-Scale Private Service Providers of Water Supply and Electricity: A Review of Incidence, Structure, Pricing, and Operating Characteristics.” World Bank Policy Research Working Paper 3727. Energy and Water Department and PPIAF, World Bank, Washington, D.C.
Legros, G., I. Havet, N. Bruce, and S. Bonjour. 2009. “The Energy Access Situation in Developing Countries; A Review Focusing on the Least Developed Countries and Sub-Saharan Africa.” United Nations Development Programme, New York.
Lighting Africa. 2010. “Solar Lighting for the Base of the Pyramid: An Overview of an Emerging Market.” Lighting Africa, IFC, Washington, D.C., www.lightingafrica.org.
Marboeuf, Guy. 2009. “EDF’s Experience in the Field of RE in Developing Countries.” Presentation at e8, University of New South Wales, AusAID, Sekolah Tinggi Teknologi Nasional Yogyakarta Workshop on Renewable Energy & Sustainable Development, Jakarta, January 19–20.
Mills, Evan. 2005. “The Specter of Fuel-based Lighting.” Science 308 (May 27): 1263–64.
National Sample Survey Offi ce. 2005. “Public Distribution System and other Sources of Consumption.” National Sample Survey Offi ce of India, New Delhi.
Poppendieck, Dustin, James Apple, Ryan Vicente, Andrea Yarberry, Nathan Lohse, and Jenny Tracy. 2010. “Exposure to Particulate from Kerosene Lamps.” Indoor Air 20 (5): 399–411.
Reiche, K., B. Tenenbaum, and C. Torres de Mästle. 2006. “Electrifi cation and Regulation: Principles and a Model Law.” World Bank, Washington, D.C.
Smith, K. R. 1995. “Health, Energy, and Greenhouse-gas Impacts of Biomass Combustion in Household Stoves.” Energy for Sustainable Development I (4): 23–9.
Tenenbaum, B. 2006. “Regulation and Electrifi cation: Four Principles and a Model Law.” Presentation to the Department for International Development, London, October 30.
UN (United Nations). 2011. “World Population Prospects: The 2010 Revision.” United Nations Population Division, United Nations, New York.
LIST OF REFERENCES
LIST OF REFERENCES 170
UN-Energy/AGECC (UN Advisory Group on Energy and Climate Change). 2011. “Energy for a Sustainable Future.” UN-Energy/AGECC, New York.
UNDP (United Nations Development Programme). 1997. “Energy After Rio.” United Nations Development Programme, New York.
. 2011. “Growing Inclusive Markets – Rural Electrifi cation in Mali.” United Nations Development Programme, New York.
UNDP/WHO (United Nations Development Programme /World Health Organization). 2009. “The Energy Access Situation in Developing Countries.” United Nations Development Programme, New York.
WHO (World Health Organization). 2006. “Evaluation of Cost and Benefi ts of Household Energy and Health Interventions at Global and Regional Levels.” World Health Organization, Geneva.
World Bank. 2006. “Technical and Economic Assessment of Grid, Mini-grid, and Off-Grid Electrifi cation Technologies.” World Bank, Washington, D.C.
. 2007. “Energy Policies and Multitopic Household Surveys: Guidelines for Questionnaire Design in Living Standards Measurement Studies.” World Bank, Washington, D.C.
. 2011. “Improving Energy Access to the Urban Poor in Developing Countries.” World Bank Energy Sector Management Assistance Program, World Bank, Washington, D.C.
Wurster, Erik. 2011. “Ghana Case Study: Using Carbon Finance to Promote Improved Cooking Technology.” http://www.compete-bioafrica.net/events/events2/Dakar/3-3-COMPETE-Conference-Dakar-Wurster.pdf.
Copyright © 2012 IFC. All Rights Reserved.
IFC, a member of the World Bank Group, creates opportunity for people to escape poverty and improve their lives. We foster sustainable economic growth in developing countries by supporting private sector development, mobilizing private capital, and providing advisory and risk mitigation services to businesses and governments. This report was commissioned by IFC through its Sustainable Business Advisory, which works with companies to adopt environmental, social, and governance practices and technologies that create a competitive edge. IFC seeks the broad adoption of these practices to transform markets and improve people’s lives.
The conclusions and judgments contained in this report should not be attributed to, and do not necessarily represent the views of, IFC or its Board of Directors or the World Bank or its Executive Directors, or the countries they represent. IFC and the World Bank do not guarantee the accuracy of the data in this publication and accept no responsibility for any consequences of their use.
Contact Information
IFC Advisory Services in
Sustainable Business
2121 Pennsylvania Ave, NW
Washington, DC 20433, USA
ifc.org/sustainablebusiness
2012
Related Documents