From DREAM to Realitiy: Specificities of Interactive Systems Development with respect to Rationale Management Xavier Lacaze, Philippe Palanque, Eric Barboni, Rémi Bastide & David Navarre LIIHS-IRIT, University Paul Sabatier 118 route de Narbonne, 31062 Toulouse Cedex {lacaze, palanque, barboni, bastide, navarre}@irit.fr Abstract. This chapter presents a notation and a tool dedicated to the support of exploration of option and traceability of choices during the development process of interactive safety critical systems. The paper presents first the notation TEAM (Traceability, Exploration and Analysis Model) and its specificities with respect to other Design Rationale notations. Both the notation and the tools called DREAM (Design Rationale Environment for Argumentation and Modelling) are presented on a case study showing how they can support design of interaction techniques for Air Traffic Control work-stations. 1. Introduction Interactive systems construction requires customised development processes (with respect to main stream software engineering) [29] making more salient the implication of users throughout the various phases and especially during requirements elicitation and evaluation for which evaluation with users is critical. In the same way these development processes advocate the design of multiple solutions (in order to foster users' involvement) providing users with various kinds of prototypes (both low-fidelity and high-fidelity) [35]. The fact that several prototypes, either paper or software are proposed and evaluated, increases the communication between designers and users and also increases usability of the system. However, this proliferation of options and solutions makes rationale management much more cumbersome. In the field of safety critical interactive software, such as Air Traffic Control workstations or interactive cockpits, rationale management becomes more and more critical. Incidents/accidents investigation and certification prior to deployment are two main reasons for such an interest on the rationale under selected design options. Since 1990 we have been working in the field of formal description techniques for safety critical interactive distributed software. This work encompasses the definition of a formalism called Interactive Cooperative Objects based on High-level Petri nets and objects [3], [4], specific extensions for distributed interactive systems [5], [6] and a CASE tool called PetShop [26], [27] for the edition, formal analysis and execution of the models. Our notation and tools have been applied to several application domains such as satellite command and control workstations [32], Air Traffic Control workstation for en-route air traffic management [33], interactive military cockpits (RAFALE Aircraft) [7] or interactive civil aircraft cockpits (Airbus A380) [28].

Welcome message from author
This document is posted to help you gain knowledge. Please leave a comment to let me know what you think about it! Share it to your friends and learn new things together.
Transcript
From DREAM to Realitiy: Specificities of Interactive Systems Development with respect to Rationale Management
Xavier Lacaze, Philippe Palanque, Eric Barboni, Rémi Bastide & David Navarre
LIIHS-IRIT, University Paul Sabatier 118 route de Narbonne, 31062 Toulouse Cedex
{lacaze, palanque, barboni, bastide, navarre}@irit.fr
Abstract. This chapter presents a notation and a tool dedicated to the support of exploration of option and traceability of choices during the development process of interactive safety critical systems. The paper presents first the notation TEAM (Traceability, Exploration and Analysis Model) and its specificities with respect to other Design Rationale notations. Both the notation and the tools called DREAM (Design Rationale Environment for Argumentation and Modelling) are presented on a case study showing how they can support design of interaction techniques for Air Traffic Control work-stations.
1. Introduction
Interactive systems construction requires customised development processes (with respect to main stream software engineering) [29] making more salient the implication of users throughout the various phases and especially during requirements elicitation and evaluation for which evaluation with users is critical. In the same way these development processes advocate the design of multiple solutions (in order to foster users' involvement) providing users with various kinds of prototypes (both low-fidelity and high-fidelity) [35]. The fact that several prototypes, either paper or software are proposed and evaluated, increases the communication between designers and users and also increases usability of the system. However, this proliferation of options and solutions makes rationale management much more cumbersome.
In the field of safety critical interactive software, such as Air Traffic Control workstations or interactive cockpits, rationale management becomes more and more critical. Incidents/accidents investigation and certification prior to deployment are two main reasons for such an interest on the rationale under selected design options.
Since 1990 we have been working in the field of formal description techniques for safety critical interactive distributed software. This work encompasses the definition of a formalism called Interactive Cooperative Objects based on High-level Petri nets and objects [3], [4], specific extensions for distributed interactive systems [5], [6] and a CASE tool called PetShop [26], [27] for the edition, formal analysis and execution of the models. Our notation and tools have been applied to several application domains such as satellite command and control workstations [32], Air Traffic Control workstation for en-route air traffic management [33], interactive military cockpits (RAFALE Aircraft) [7] or interactive civil aircraft cockpits (Airbus A380) [28].
2 Xavier Lacaze, Philippe Palanque, Eric Barboni, Rémi Bastide & David Navarre
Applying our research results to several domains has brought a new light on our work by showing that providing a reliable solution is not more valuable than providing the detailed rationale for that particular solution. For approximately three years now we have been working on a project for finding ways of providing the various participants throughout the development process of interactive safety critical software with notations and tools for the rationale management. The first version of the notation called TEAM and its CASE tool (called DREAM for Design Rationale Environment for Argumentation and Modelling) are available on the web at the following address http://liihs.irit.fr/dream. They have been applied to several case studies and the aim of the chapter proposal is to present those results in details.
2. State of art in rationale management for interactive systems
Since the seminal work from Toulmin [40] in the late 50's design management and argumentation have been the focus of many research activities. This section presents a non-exhaustive but structured state of the art in that field. Indeed, our objective is not to provide a detailed description of each notation and related tools but to emphasise the issues that are still open in order to make the bridge more efficient between design management and interactive system design.
Interactive systems design (and more broadly speaking the Human Computer Interaction field) promotes a user-centred design approach [30] to interactive system engineering that involves users in various phases. For instance, task analysis and modelling provide support for capturing and representing user activities [12] while interacting with a system. Such information is then incorporated in many places in the design process as, for instance, in the design phases when the allocation of functions between the system and the users is defined, or later (in the evaluation phases) when the system is tested in order to check whether or not users' activities are exhaustively supported by the system.
Toulmin's work [40] presents a notation dedicated to structuring and modelling argumentation and that work has been the inspiration for many work in that field. That related work on rationale management can be structured around 3 axes: argumentation, historical data and decision making.
IBIS (Issue-Based Information System) [18] is a notation designed for modelling argumentation. An IBIS model is made up with three mains entities: issues, positions, and arguments. An issue is related to several positions, and arguments can be associated to a position (for or against that position). gIBIS [11], QuestMap (a preliminary version of Compendium) and Compendium [38] are three tools supporting IBIS notation. Compendium is more than a tool as it embeds a methodology to capture rationale management especially during design meeting. The two main issues with the use of IBIS are related to scalability and more precisely to hierarchical structuring. PHI provides extension for IBIS some of them solving some of the issues for IBIS. Indeed, extensions provide a formal framework for hierarchical dependencies in order on one hand to address inconsistency in models and on the other hand to allow imprecise entries called miscellaneous (that is an entry not finalised yet but that requires further attention) that will be later defined as position, issue or argument. Lastly, even though diagrams are more structured, as IBIS and PHI modelling is involved during the discussion (i.e. built during meeting) the models only store a lot of information and some of this information is not validated or precise. HERMES [19] also extends IBIS notation by defining the notion of constraint between two entities. Thanks to this addition of constraints, HERMES supports designers in making decisions, and in structuring the argumentation. EDEN (Evidential Discourse for ENgineering) [22] extends IBIS notation too, by adding quantitative information to
From DREAM to Realitiy: Specificities of Interactive Systems Development with respect to Rationale Management 3
entities and offering a graphical representation. EDEN associates relative weight to positions, issues, and arguments. Degree of support or opposal are associated to arguments, and then quantitative values (called measures) are propagated to the connected position and issue using mathematical theory [23]. A tool supports graphical representation as well as the computation of measures. As for HERMES, EDEN support decision making activities and based on the computations made even proposes a final decision.
QOC (Questions, Options, Criteria) [21] is dedicated to argumentation structuring and to keep trace of all decision taken during design process. Options describe an alternative for a question. The association criterion-option holds a value meaning that the criterion supports, denies or is neutral with respect to that option. Questions or options can be refined in sub question. The main difference other notations is the notion of criterion. The valuation allows a qualitative and comparative analysis amongst the various options related to a question. Desperado [31] and the QOC Editor Design [36] are two tools supporting the edition of QOC models. Desperado manages a database and, during edition steps, proposes possible questions, options, criteria according to contextual information that is preliminarily field-in. Desperado favours reuse of past design solutions, but does not provide a graphical representation and does not allow the use of constraints. The edition of diagram is heavily structured and enforces the following sequential activities: first fill-in contextual information, then add questions, then add related options and lastly add criteria. Sage and Johnson designed the QOC Editor Design as a case study, so this tool is not an editor per se. Nevertheless, authors report the scalability issue that is systematically raised with design rationale notations, and propose several filtered views such as questions and options; questions and selected options; questions, selected options, and criteria; and a full view. RAT (Rationale-based Analysis Tool) [41] tool focuses on rationale for Unified Modelling Language [8] diagrams. RAT associates QOC matrix within UML edition diagrams. DQN (Design Question Notation) [9] adds formal aspects to QOC notation. More specifically, DQN tackles consistency issue in QOC diagrams as the notation provides a way to use formal analysis techniques on models to detect inconsistency. This addition makes DQN less easily understandable by all participants involved in design process and no tool supports it.
Despite of all this work in rationale management, notations do not meet the constraints imposed by the design processes of interactive systems and mainly because they are not connected well enough with current practice of software engineering. The only exception with that respect is RAT that deals explicitly with UML and its development process RUP.
Our proposal (detailed in next section) is to provide interactive systems designers with a notation for rationale management able to take into account specificities of interactive systems and more precisely safety critical ones. To this end, our approach focuses on Human-Computer Interaction concepts and how to integrate them. Besides, the approach is tool supported in order to address both scalability and cost/benefice concerns.
3. TEAM notation
TEAM (Traceability, Exploration and Analysis Mode) notation is based on QOC (as stated above introduced by Allan MacLean [21]) and proposes several extensions in order to deal with the specificities of safety critical interactive systems and also to address some of the usability issues of QOC. The rationale for extending QOC is mainly based on its simplicity and readability that makes
4 Xavier Lacaze, Philippe Palanque, Eric Barboni, Rémi Bastide & David Navarre
it understandable by most of the actors involved in interactive systems design such as: graphic designers, developers, customers, certification authorities, etc.
3.1. Dealing with usability (criteria and factors)
MacLean introduced the notion of criteria and criteria that are more general in order to gather criteria. Having the same name for two concepts makes diagrams fuzzy, so we decided to define criteria that are more general into factors (which is a concept largely used in software engineering). We exploit the definition from McCall’s work on factors from [24] and from other work [37] that defines a relationship between criteria and factors. The notion of criteria in QOC is thus defined by the following: (1) quality factors correspond to requirements expressed by the clients and/or users; (2) quality criteria are elements that can be measured; (3) metrics: is the actual value of a couple option-criterion for a given scenario of use. Metrics values can be written on the connector between an option and a criterion. Metrics information must be considered as quantitative information and not as qualitative information. Additionally, previous work [20] we have done in the field explains how such values can be computed using performance evaluation techniques.
Simon Buckingham Shum's [39] usability studies on QOC notation reveal that QOC users need to be able to compare the criteria related to an option (i.e. to express which one is more important for instance). To address this issue, our proposal is to associate a weight to criteria and to factors. Weights range from 1 (important) to 5 (optional). This extension allows users to capture more information in the models. However, Buckingham Shum warns that weight can make it possible for users to distort argumentation.
3.2. Integrating Task Analysis / Task modelling aspects
Task analysis and modelling [ 12] is also a critical element of user centred design methods and thus critical for the engineering of safety critical interactive systems. We propose extensions to QOC in order to deal explicitly with task models as well as with scenarios that correspond to execution paths in the task models. We add two new entities to QOC notation namely task models and scenarios. A design option, dealing with dialogue aspect (see section 3.3), can propose a task model. From the task model we can extract relevant scenarios. A relevant scenario focuses on one of the metrics (introduced above) we want to measure on the interactive system. To this end, a scenario is related to a couple criterion-option and the metrics is directly stored on the edge between the option and the criterion.
3.3. Software architecture structuring of rationale management
Software architectures dedicated to interactive software have been proposed since the early 80s and the most known ones are Seeheim model [15] or ARCH model [1], [2]. ARCH model breaks down an interactive system into five components: domain specific component, domain adaptor component, dialogue component, logical presentation component, and physical presentation component. The first two components are dedicated to the non interactive part of an interactive system and are thus merged in a component called functional core. As we are less concerned with implementation issues than design ones we have decided to merge presentation components
From DREAM to Realitiy: Specificities of Interactive Systems Development with respect to Rationale Management 5
together in a component called presentation component. In our models, questions can be structured according to that architecture and thus related to one of the components: functional core, dialogue, and presentation. This relationship might not be defined and thus a questions in not necessarily related to a component to capture, for instance, broader topics.
This structuring supports decomposition of problems adequately when dealing with interactive systems. In addition, it makes it possible for managing the argumentation at various levels of abstraction from higher-level phases such as specifications but also at lower level phases such as detailed design and implementation phases and that for any of these components.
3.4. Conclusion
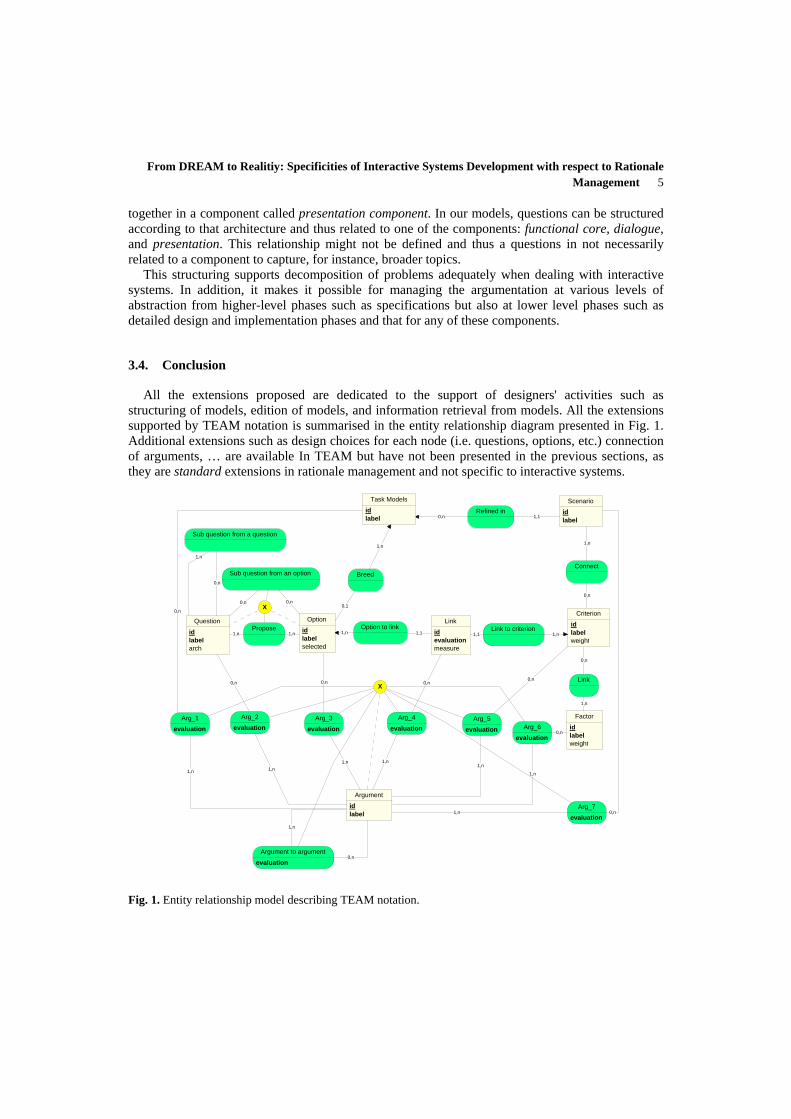
All the extensions proposed are dedicated to the support of designers' activities such as structuring of models, edition of models, and information retrieval from models. All the extensions supported by TEAM notation is summarised in the entity relationship diagram presented in Fig. 1. Additional extensions such as design choices for each node (i.e. questions, options, etc.) connection of arguments, … are available In TEAM but have not been presented in the previous sections, as they are standard extensions in rationale management and not specific to interactive systems.
0,n
1,n
0,n
Task Models
idlabel
1,n
0,n
1,n
0,n
0,n
Question
idlabelarch
1,1
1,n
0,n
Scenario
idlabel
0,n
0,n
1,n
0,n
Criterion
idlabelweight
0,n
1,n
Factor
idlabelweight
1,n1,n
1,n
1,n
1,n
1,n
1,n
0,n
1,n
Argument
idlabel
1,n
0,10,n
0,n
1,n
Option
idlabelselected
Propose
Refined in
Connect
Arg_5
evaluation
Arg_2
evaluationArg_3
evaluationArg_1
evaluation
0,n
Arg_4
evaluation Arg_6
evaluation
Breed
Sub question from a question
Arg_7
evaluation
Sub question from an option
X
X
Argument to argument
evaluation
1,1 1,1
Link
idevaluationmeasure
Option to link Link to criterion
Link
Fig. 1. Entity relationship model describing TEAM notation.
6 Xavier Lacaze, Philippe Palanque, Eric Barboni, Rémi Bastide & David Navarre
Fig. 1 displays the entity relationship model of the TEAM notation. Rectangles represent entities; entity name is the first item in the box and the attributes describing the content of the entity below. Similarly, rounded rectangles represent relationships. Keys attributes are both bold and underlined while required attributes (at modelling time) are highlighted in bold. Cross in the circle highlights exclusions constraints between relationships.
4. DREAM tool
TEAM notation is supported by a tool and an environment called DREAM (Design Rationale Environment for Argumentation and Modelling) for the edition of models (taking into account all the elements of the notation presented above), the analysis of models (to check whether all the options have been argued, commented, …) and the exploitation of models (to allow for argumentation and traceability of the models throughout the project and to allow for reuse for further projects).
DREAM tool also supports the management of teamwork and sessions thus supporting traceability of decisions according to the people that make them, but also according to the time when those decisions have been made. DREAM1 is publicly available and can be downloaded on the following web page: http://liihs.irit.fr/dream/.
4.1. Overview and Principle
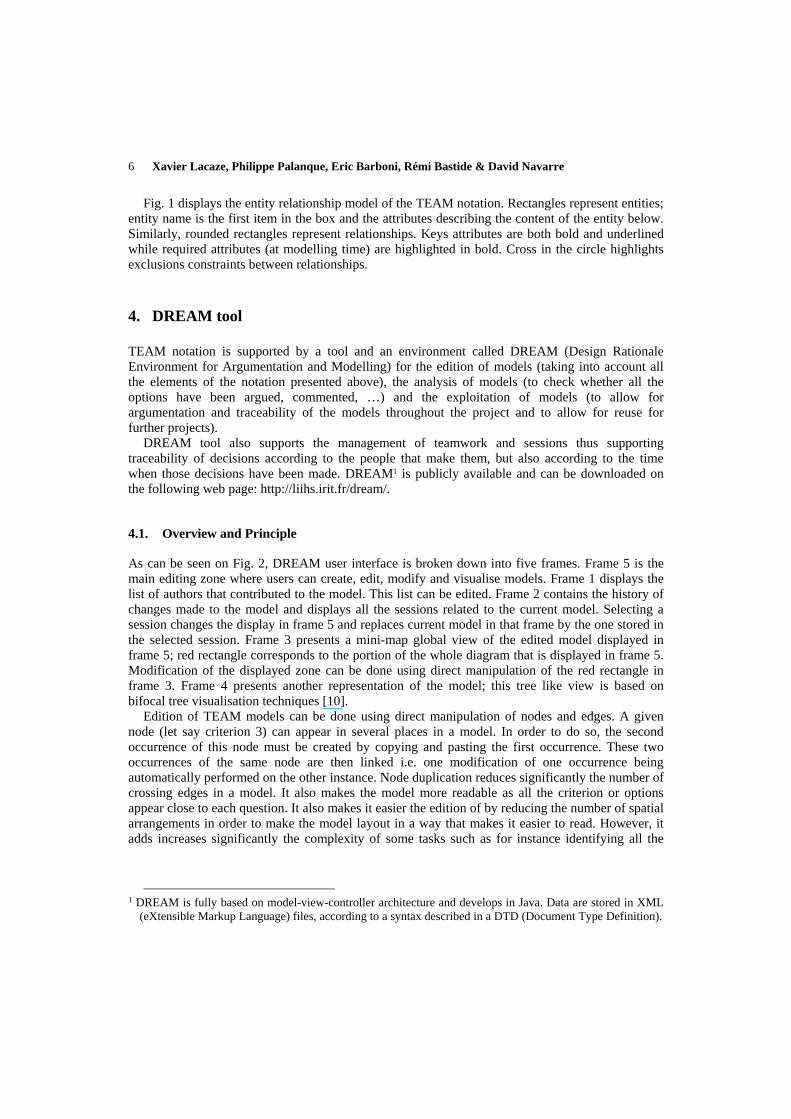
As can be seen on Fig. 2, DREAM user interface is broken down into five frames. Frame 5 is the main editing zone where users can create, edit, modify and visualise models. Frame 1 displays the list of authors that contributed to the model. This list can be edited. Frame 2 contains the history of changes made to the model and displays all the sessions related to the current model. Selecting a session changes the display in frame 5 and replaces current model in that frame by the one stored in the selected session. Frame 3 presents a mini-map global view of the edited model displayed in frame 5; red rectangle corresponds to the portion of the whole diagram that is displayed in frame 5. Modification of the displayed zone can be done using direct manipulation of the red rectangle in frame 3. Frame 4 presents another representation of the model; this tree like view is based on bifocal tree visualisation techniques [10].
Edition of TEAM models can be done using direct manipulation of nodes and edges. A given node (let say criterion 3) can appear in several places in a model. In order to do so, the second occurrence of this node must be created by copying and pasting the first occurrence. These two occurrences of the same node are then linked i.e. one modification of one occurrence being automatically performed on the other instance. Node duplication reduces significantly the number of crossing edges in a model. It also makes the model more readable as all the criterion or options appear close to each question. It also makes it easier the edition of by reducing the number of spatial arrangements in order to make the model layout in a way that makes it easier to read. However, it adds increases significantly the complexity of some tasks such as for instance identifying all the
1 DREAM is fully based on model-view-controller architecture and develops in Java. Data are stored in XML
(eXtensible Markup Language) files, according to a syntax described in a DTD (Document Type Definition).
From DREAM to Realitiy: Specificities of Interactive Systems Development with respect to Rationale Management 7
option related to a given criterion if that criterion has been duplicated several times2. Frame 4 has been introduced in order to solve this problem. Indeed, manipulation in that frame allows users to select a given node to precisely check all its connected nodes.
5
1
2
3
4
Fig. 2. User interface of DREAM.
Performing a user centred design approach on our tool, we have done some tasks analysis on users involved in rationale management. Two mains tasks have been identified; first models creation and modification (called models edition); second models exploitation involving reading, printing, checking … models. DREAM tool explicitly supports these two tasks (described in the following two sections) providing users with highly interactive manipulation and visualisation techniques.
2 Simon Buckingham Shum's studies have shown that [16] paper-based use of QOC models is cumbersome.
Indeed, users spend 52% of the time in renaming nodes when reusing criteria to keep consistency in the diagrams.
8 Xavier Lacaze, Philippe Palanque, Eric Barboni, Rémi Bastide & David Navarre
4.2. Models edition
Users build models by creating and editing TEAM models elements such as questions, options, criteria, links, etc. A toolbar allowing creation of elements is available on the top of the window. Once node created, user set its label. Model edition is made on workspace (frame 5). Global view (frame 3) and workspace (frame 5) display diagram in a different scale in order to help user in focus and work on a detailed question while remaining aware of contextual information i.e. where the currently edited zone is located in the whole diagram. DREAM embeds some constraints about edition, making it impossible to build models that are not compatible with the constraints described in the entity/relationship diagram of Fig. 1.
Each node has a graphical representation made up of two elements: a glyph (i.e. a shape) and a colour. Questions are depicted as red rounded squares, options as orange discs, criteria as green triangles, factors as blue triangles, arguments as grey triangle, etc. When a decision has been made about an option, its appearance changes to an orange disc with a black bold line (see the option on the right hand side of the black 5 in frame 5. Shape and colour for criteria and factors change according to the weight assigned to them. A strong weight is represented by a brightness colour and straight shape, whereas a weak weight is displayed by a pastel colour and a fuzzy shape. Users can zoom-in and zoom-out models.
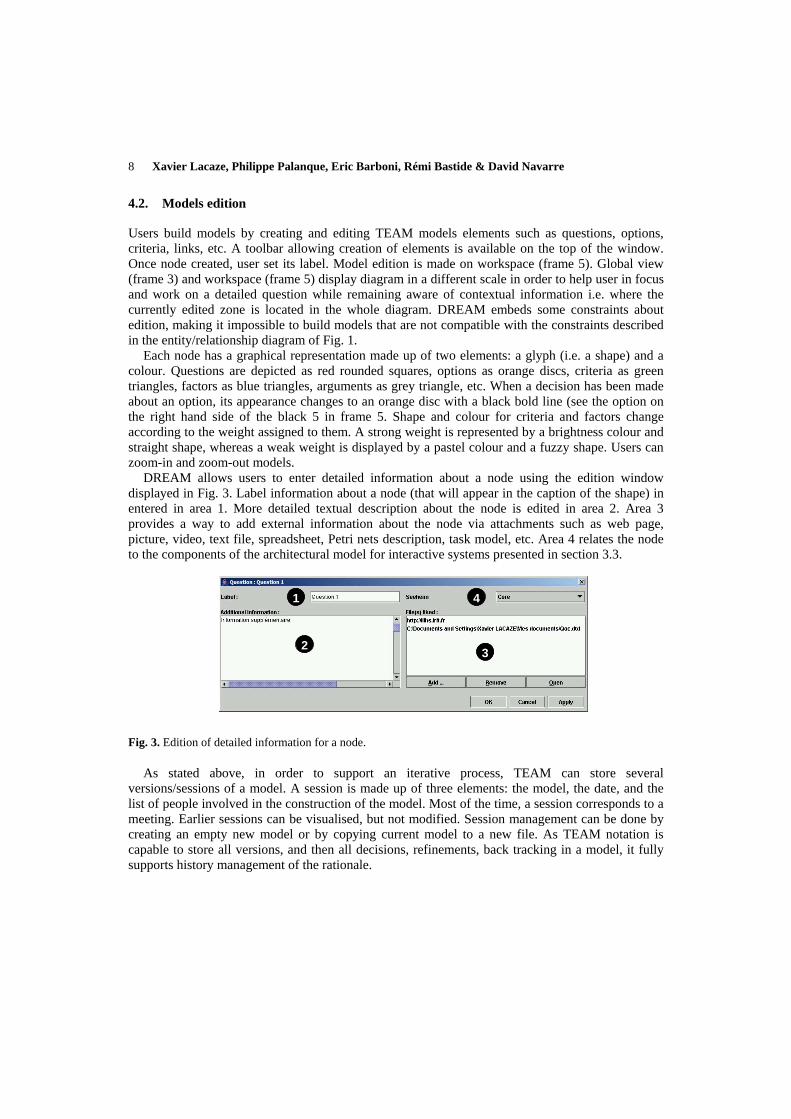
DREAM allows users to enter detailed information about a node using the edition window displayed in Fig. 3. Label information about a node (that will appear in the caption of the shape) in entered in area 1. More detailed textual description about the node is edited in area 2. Area 3 provides a way to add external information about the node via attachments such as web page, picture, video, text file, spreadsheet, Petri nets description, task model, etc. Area 4 relates the node to the components of the architectural model for interactive systems presented in section 3.3.
11
22 33
44
Fig. 3. Edition of detailed information for a node.
As stated above, in order to support an iterative process, TEAM can store several versions/sessions of a model. A session is made up of three elements: the model, the date, and the list of people involved in the construction of the model. Most of the time, a session corresponds to a meeting. Earlier sessions can be visualised, but not modified. Session management can be done by creating an empty new model or by copying current model to a new file. As TEAM notation is capable to store all versions, and then all decisions, refinements, back tracking in a model, it fully supports history management of the rationale.
From DREAM to Realitiy: Specificities of Interactive Systems Development with respect to Rationale Management 9
4.3. Exploitation and Analysis of Models
TEAM offers several ways for users to extract information from models. One way is directly provided thanks to the graphical representation of the elements of TEAM, another one is offered by session history.
First to all, the graphical representation of models reveals several aspects of the diagram. Questions solved (i.e. presenting one and only one selected option) and question still to be resolved are quickly identified by users. This is mainly due to the different appearance of these two types of options. Poorly argumented questions are also highlighted by the lack of criteria associated to their options. As we split design into four mains trends (related to architectural concerns) such as dialogue part, functional core part, presentation part, and miscellaneous part, it is easy to detect which parts of the design has been the focus of a significant amount of work and which ones have not. The more the model contains resolved questions the more likely the model construction is close to be finished.
A lot of information can be extracted from sessions. Sessions offer a view of the diagram evolution: appearance of new branches, and disappearance of dead branches. New branches are the new questions, and dead branches are question not discussed anymore without having reached a consensus i.e. an option selected. Exploration of all sessions provides information about designers' backtracking, i.e. an option selected in one session and not selected anymore in following sessions. A regularly expanding part of a model clearly states that the question under consideration is important, gets a growing interest and raises hard to solve new problems.
DREAM provides support for constructing consistent models. All items of a duplicated option (i.e. several items sharing the same data) should have the same state: selected or not. DREAM detects such inconsistency notifies users.
DREAM provides three visualisations and two different representations of the same model. Bifocal tree representation (frame 4) modify diagram into tree. Indeed, TEAM diagrams are not tree-like due to possible duplication of nodes. Leafs are factors and/or criteria. Criteria (resp. factors) are duplicated for each relation with options (resp. criteria). Arguments, task models, and scenarios are not represented in the tree to prevent cyclic tree. Bifocal tree representation allows user to focus on a specific option without interference of other options evaluations. Bifocal tree visualisation was built to support reading activity and analysing importance of node for the design by looking (for instance) at their number of occurrence in the model.
Both representation are synchronised, a node selected in one of the view being also selected and displayed in the other views. Scalability issue is also addressed by bifocal tree visualisation as this visualisation technique has been explicitly design to handle large trees [10].
5. Case study
This section presents the use of TEAM and DREAM on a case study. This case study comes from the Air Traffic Management domain and deals with interaction design issues on an Air Traffic Control workstation.
The case study has been developed with colleagues at the CENA (French Centre for Studies on Air Traffic Management) and is based on an interactive application designed and developed by them. The context is the one of so called approach air traffic controllers i.e. controllers in charge of aircraft approaching an airport. Landing aircrafts are handed over to them by so called enroute air
10 Xavier Lacaze, Philippe Palanque, Eric Barboni, Rémi Bastide & David Navarre
traffic controllers and they are supposed (after preparing aircrafts' route appropriately) to transfer them to the tower controllers in charge of take-off, landing and taxiing at the airport.
The approach air traffic controller can be in charge of a significant number of aircrafts and might have to issue a lot of clearances3 in a very short period of time. This activity is different from the one of the other types of controllers (such as enroute ones) for whom time scale is much longer.
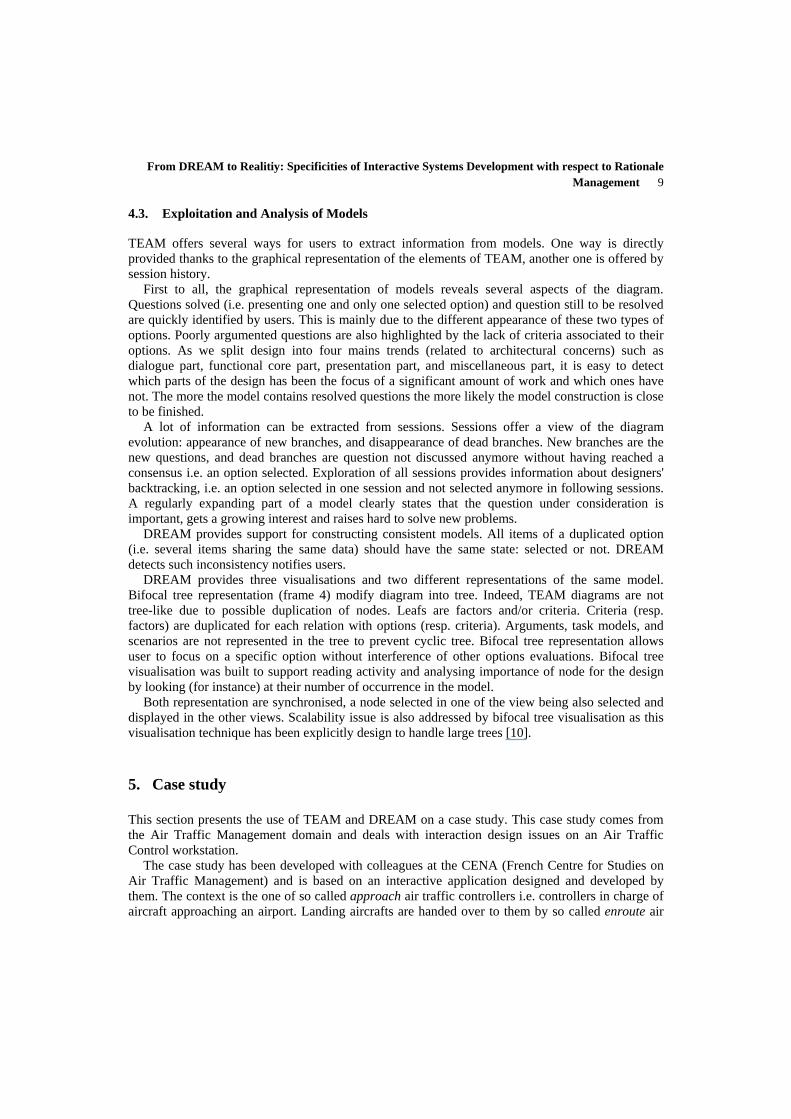
Fig. 4. Task model describing ATC activity.
Fig. 4 presents (using the CTT notation [34]) a task model of an approach air traffic controller. This task model is only partial but conveys all the information relevant to the case study. The task is divided into four high level sub-tasks: select a flight, select clearance (level, cap (i.e. heading), speed, rate, etc.), select value and confirm or cancel. After selecting the aircraft, the ATC selects the type of clearance to be issued. The selection of the type of clearance is made by pressing at least once on the keys named "level", "cap", "direct" and "speed". The clearance value is typed-in using the keyboard and can be a new value (i.e. a number), a confirmation "maintain" or a correction "resume" the previous value. A graphical feedback is provided when the value is validated.
level heading direct
speed
cancel
valid
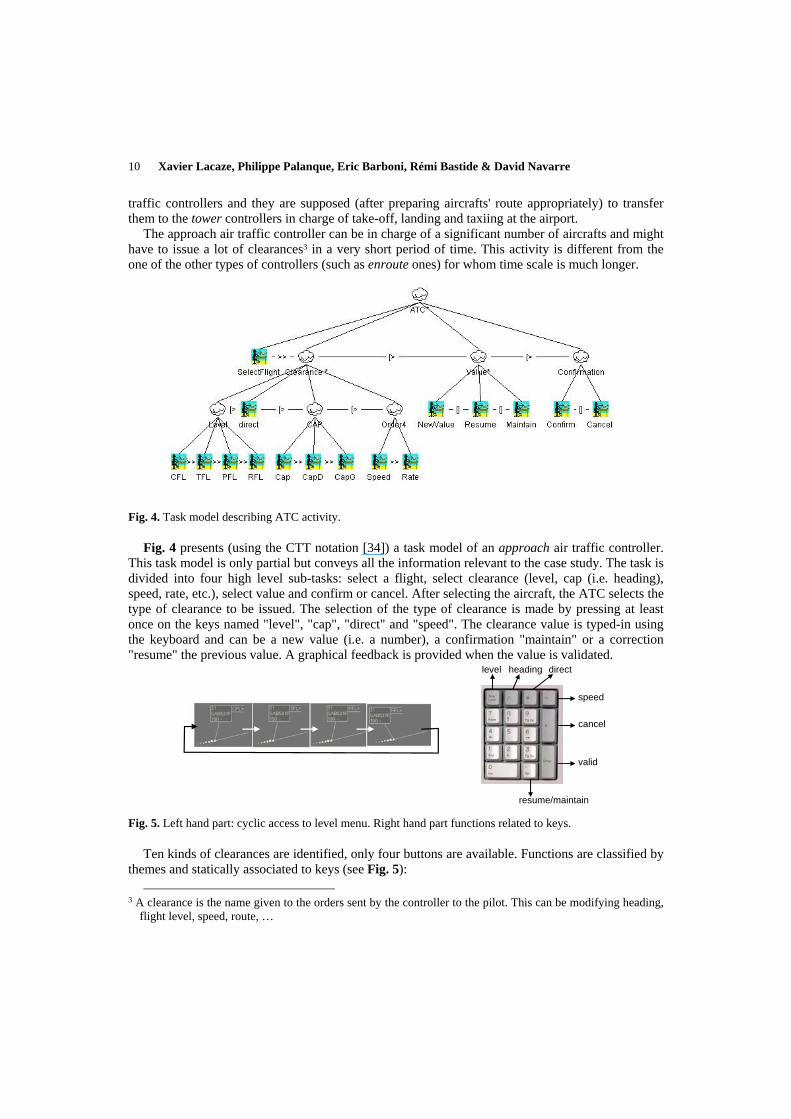
resume/maintain Fig. 5. Left hand part: cyclic access to level menu. Right hand part functions related to keys.
Ten kinds of clearances are identified, only four buttons are available. Functions are classified by themes and statically associated to keys (see Fig. 5):
3 A clearance is the name given to the orders sent by the controller to the pilot. This can be modifying heading,
flight level, speed, route, …
From DREAM to Realitiy: Specificities of Interactive Systems Development with respect to Rationale Management 11
• Key "num lock" corresponds to level menu (CFL, TFL, PFL, RFL); • Key "/" corresponds to direct menu; • Key "*" corresponds to cap menu (Cap, Right Cap, Left Cap) ; • Key "-" corresponds to speed menu (Speed, Rate).
Fig. 5 (right hand part) presents the four functions accessible sequentially via key "num lock". Menus are cyclic, for example to reach PFL function user press three times (modulo four) key "num lock".
The interactive system designed by CENA was mainly aimed at allowing ATC to issue clearances as rapidly as possible. Other (secondary) concerns were making error rate as low as possible and avoiding syntactically incorrect clearances as much as possible. The current interactive application consists in a radar screen, a mouse and a keyboard. The radar screen displays all flights controlled by the air traffic controller as well as incoming and outgoing flights. Each flight is graphically represented by a label (see left hand side of Figure 5), a set of dots representing the past 5 positions of the aircraft and speed vector (a straight line) providing information about both speed (line length) and direction (line direction). The flight label contains the following information flight id, plane id and altitude level.
The design team at CENA followed a user centred design [29] and iterative approach. After some information gathering, they implemented a first prototype. This version evolved during several meetings involving users and designers. After each meeting minutes were prepared and distributed. Those meeting, held on a regular basis, offered the opportunity to users to comment and practice the various prototypes. The process ended after the tenth meeting.
In order to validate the DREAM/TEAM approach we used the tool and the notation to model all the information contained in the minutes. The information gathered was ranging from graphical design sketches (representing graphical appearance of objects), automata (describing the interaction technique) as well as decisions about the retained and discarded design options. A last report summarising all the choices made during the meeting was also available and has been used by CENA team as a set of requirements for the development of the final application. In order to trace the process we built diagrams starting from these ten reports and the summarising report. We built a first diagram and this diagram evolved with information extracted from meetings in a chronological way. Only six sessions appear in the diagram as four sessions were not containing relevant information or ended prematurely. Customers/users gave two strong requirements: data entries have to be fast, and application had to be quickly implemented.
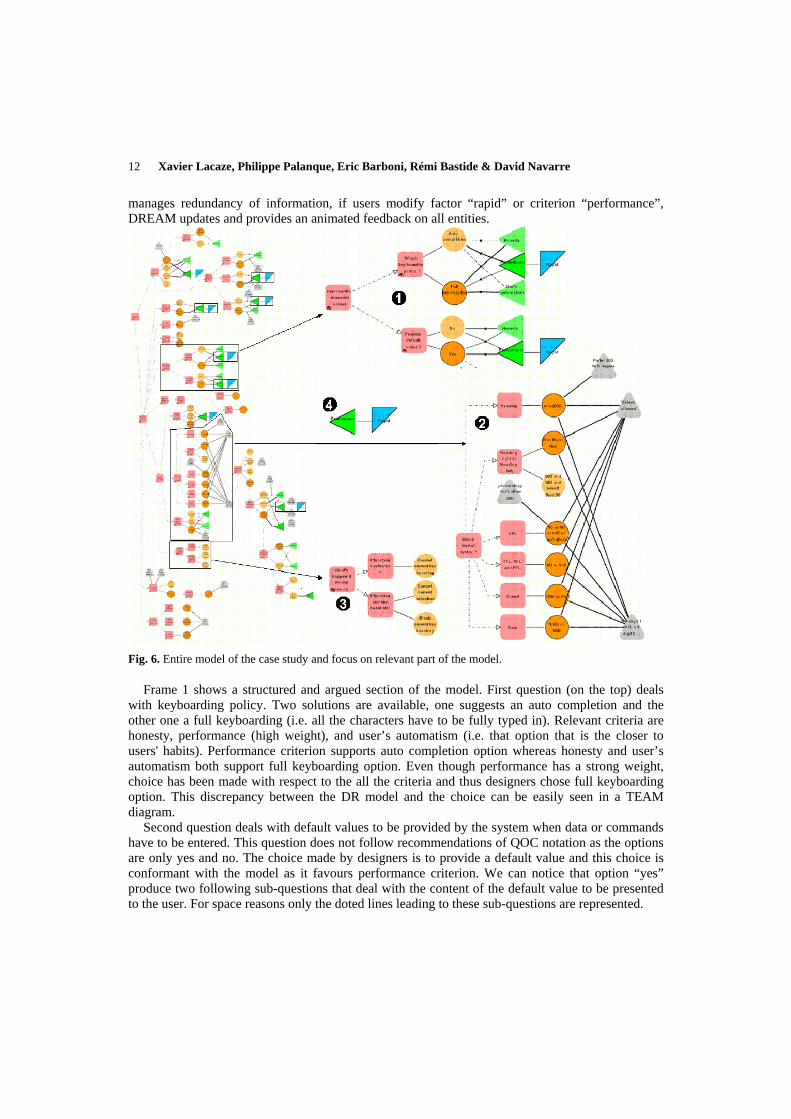
For space reasons we do not present in this section the modelling process itself but we describe the output of the process. Task models and scenarios were not used in the design process by CENA and this is the reason why do not appear on the diagram. Four criteria were identified and are duplicated (i.e. "rapid", "honesty", "user's automatism", and "efficient quickly"). They are connected to most of the options. The resulting diagram is displayed on Fig. 6 and contains 203 nodes (41 questions, 55 options, 21 criteria, 6 factors, and 20 arguments). The point here is not to describe individually each node but to present salient information that provides insights about the process, the notation and the tool.
Right hand side of Fig. 6 presents the entire diagram resulting from the modelling process while left hand side emphasises five graphs extracted from the diagram and are discussed hereafter.
The five rectangles highlight one couple criterion/factor, see graph 4 on right side of the figure. This couple appears five times in the diagram. The criterion is "performance" meaning that performance can be assessed in several places in the diagram for several options. The factor is "rapid" and models a customer/user requirement that interaction is required to be fast. DREAM
12 Xavier Lacaze, Philippe Palanque, Eric Barboni, Rémi Bastide & David Navarre
manages redundancy of information, if users modify factor “rapid” or criterion “performance”, DREAM updates and provides an animated feedback on all entities.
Fig. 6. Entire model of the case study and focus on relevant part of the model.
Frame 1 shows a structured and argued section of the model. First question (on the top) deals with keyboarding policy. Two solutions are available, one suggests an auto completion and the other one a full keyboarding (i.e. all the characters have to be fully typed in). Relevant criteria are honesty, performance (high weight), and user’s automatism (i.e. that option that is the closer to users' habits). Performance criterion supports auto completion option whereas honesty and user’s automatism both support full keyboarding option. Even though performance has a strong weight, choice has been made with respect to the all the criteria and thus designers chose full keyboarding option. This discrepancy between the DR model and the choice can be easily seen in a TEAM diagram.
Second question deals with default values to be provided by the system when data or commands have to be entered. This question does not follow recommendations of QOC notation as the options are only yes and no. The choice made by designers is to provide a default value and this choice is conformant with the model as it favours performance criterion. We can notice that option “yes” produce two following sub-questions that deal with the content of the default value to be presented to the user. For space reasons only the doted lines leading to these sub-questions are represented.
From DREAM to Realitiy: Specificities of Interactive Systems Development with respect to Rationale Management 13
Frame 2 is one of the most disputed points of the diagram and has been modified at each meeting. It deals with the syntax of each clearance (heading, speed, rate, TFL, PFL, RFL) and aims as defining how to represent authorised values. N represents a digit between one and nine and n a digit between 0 and nine; for example, Nnn5 means that 5605 is a correct value, and 0125 is a wrong value. In the first session, designer proposed a different syntax for each clearance with no argumentation and only one option for each question. We believe that this is the main reason why users discussed strongly that point. As we can see, in the final session argumentation is still not present and no criteria have been provided.
Frame 3 deals with unexpected moves of the mouse. This question has been raised by an Air Traffic Controller during the second session. Designers broke down this issue into two different questions depending on the when the mouse move occurs. If move occurs when a function is selected, they propose to cancel the current input while if move occurs when an input has already been made, they propose to cancel the current selection or lock the current input (via the keyboard). As it can be easily seen on the diagram, no choice has been made by designers. During the following sessions the question has not been raised again. We believe that this point has been lost during the design process. TEAM notation provides support to this issue by making explicit in the diagram these unsolved dead branches.
Additionally, session management as provided by DREAM helps storing and retrieving information about design management. First, discussed points can be modified at each step, modifications can be traced and the visual representation supports readers in identifying poorly / nicely argued points, solved issues and diagram evolution. Sessions management also provides relevant information about backtrackings made during the design process (a choice made early in the design process and then cancelled later on).
In this case study we have shown that TEAM notation was able to store all the information related to design process. Factors were integrated easily and make explicit customers' requirements. Impacts of user requirements appear in the entire diagram. Weights associated to criteria and factors help in understanding and reading the diagrams as well as in understanding choices made during design process. Iterative process and meeting with users advocate the need for session management. DREAM tool supports DR management activities by making impossible the edition of inconsistent diagrams.
6. Conclusion
This chapter has presented a notation (TEAM) and a tool (DREAM) dedicated to the engineering of interactive systems. Instead of focussing on the result of the development process i.e. the actual application, this approach focuses on the process itself and provides several means for improving it. The notation is anchored in HCI research and provides explicit links to architecture (Arch), user centred development process (iterative prototyping), task analysis and modelling and scenarios and thus provides a generic framework for gathering these multiple information sources in a single model. The approach builds on existing work in the field of design rationale integrating successful aspects and providing solutions to the identified limitations. The approach has been applied to several case studies including interaction techniques design, graphic design and software engineering side of interactive systems design.
14 Xavier Lacaze, Philippe Palanque, Eric Barboni, Rémi Bastide & David Navarre
The work presented in this chapter aims at supporting activities currently under considered in the field of interactive systems design and engineering such as the certification phase of safety critical applications. If product certification (when the actual application is checked through by the certifiers) cannot be considered as feasible when large applications are concerned, process certification (when the design process itself is evaluated) can be highly facilitated by exploiting an approach like TEAM/DREAM.
Bibliography
1. Bass, L., Little, R., Pellegrino, R., Reed, S., Seacord, R., Sheppard, S., Szezur, M. The Arch Model: Seeheim Revisited. User Interface Developpers' Workshop. (1991)
2. Bass, L., & Coutaz, J. Developing Software for the User Interface, Len Bass and J. Coutaz, Addison-Wesley (1991).
3. Bastide, R., Palanque, P. A Petri Net Based Environment for the Design of Event-Driven Interfaces. 16th International Conference on Application and theory of Petri Nets (ATPN'95) Torino, Italy, 20-22 June 1995. (1995)
4. Bastide, R., Palanque, P. A Visual and Formal Glue between Application and Interaction. International Journal of Visual Language and Computing, Academic Press Vol. 10, No. 5, 1999, pp. 481-507. (1999)
5. Bastide, R., Sy, O., Palanque, P. Formal Specification and Prototyping of CORBA servers. European Conference on Object Oriented Programming, ECOOP 99, 14-18 juin 1999, Lisboa (Portugal)Lecture Notes in Computer Science Serie, Springer Verlag. (1999)
6. Bastide, R., Sy, O., Palanque, P., and Navarre, D. Formal specification of CORBA services: experience and lessons learned. ACM Conference on Object-Oriented Programming, Systems, Languages, and Applications (OOPSLA'2000); Minneapolis, Minnesota USA. ACM Press; (2000)
7. Bastide, R., Navarre, D., Palanque, P., Schyn, A. & Dragicevic, P. A Model-Based Approach for Real-Time Embedded Multimodal Systems in Military Aircrafts. Sixth International Conference on Multimodal Interfaces (ICMI'04) October 14-15, 2004 Pennsylvania State University, USA. (2004)
8. Booch, G., Rumbaugh, J., Jacobson, I. The Unified Modeling Language User Guide. Addison-Wesley. (1998)
9. Bramwell, C. Formal Development Methods for Interactive System: Combining Interactors and Design Rationale. Ph.D. Thesis. University of York. (1995)
10. Cava, R.A., Luzzardi, P.R.G., Freitas, C.M.D.S. The Bifocal Tree: a Technique for the Visualization of Hierarchical Information Structures. In IHC 2002 – 5th Workshop On Human Factors In Computer Systems, Fortaleza. (2002).
11. Conklin, J., Begeman, M.L. GIBIS: A Hypertext Tool for Exploratory Policy Discussion. ACM Transactions on Office Information Systems, Vol. 6(4). (1988) 303-31.
12. Diaper, D., Stanton, N. The Handbook of Task Analysis for Human-Computer Interaction.Lawrence Erlbaum Associates. (2003)
13. Dutoit, A.H., Paech, B. Rationale-Based Use Case Specification. Requirements Engineering Journal, Vol. 7(1). (2002) 3-9.
14. ESARR 6. EUROCONTROL Safety Regulatory Requirement. Software in ATM Systems. Edition 1.0. http://www.eurocontrol.int/src/public/standard_page/esarr6.html (2003)
15. Green, M. Report on Dialogue Specification Tools. User Interface Management Systems. Springer-Verlag, (1985) 9-20.
16. Horn, R.E. Visual Language. Global communication for the 21st century. Macro VU Inc. USA. ISBN 189263709X. (1998)
17. Johnson, C.W. Using Design Rationale To Support Formal Methods In The Development of Human-Computer Interfaces. HCI Journal. Vol. 11(4) (1996) 291-320.
18. Kunz, W., Rittel, H. Issues As Elements of Information Systems. PhD, Univ. of California. (1970).
From DREAM to Realitiy: Specificities of Interactive Systems Development with respect to Rationale Management 15
19. Karacapilidis, N., Papadias, D. Computer Supported Argumentation and Collaborative Decision Making: The HERMES system. Information Systems, 26(4). (2001) 259-277.
20. Lacaze, X., Palanque, P., Navarre, D., & Bastide, R. Performance Evaluation as a Tool for Quantitative Assessment of Complexity of Interactive Systems. DSV-IS'02, 12-14 June 2002. Lecture Notes in Computer Science, no 2545, Springer Verlag. (2002) 208 -222.
21. MacLean, A., Young, R.M., Bellotti, V.M.E., Moran, T.P. Questions, Options, Criteria: Elements of Design Space Analysis. In.[25] (1996)
22. Marashi, E., Davis, J.P. A framework for supporting discourse in the design decision-making process. 4th International Conference on Decision-Making in Urban and Civil Engineering. Porto, Portugal. (2004).
23. Marashi, E., Davis, J.P. A systems approach to resolving complex issues in a design process. 2nd workshop on Complexity in Design and Engineering. C.W. Johnson (ed.). (2005). 140-149.
24. McCall, J., Richards, P., Walters, G. Factors in Software Quality. Rome Air Development Center (RADC), RADC-TR-77-369, Vol III, November. (1977)
25. Moran, T.P. and Carroll, J.M., eds . Design Rationale: Concepts, Techniques, and Use, Lawrence Erlbaum Associates (1996)
26. Navarre, D., Palanque, P., Bastide, R., and Sy, O. A Model-Based Tool for Interactive Prototyping of Highly Interactive Applications. 12th IEEE, International Workshop on Rapid System Prototyping ; Monterey (USA). IEEE. (2001)
27. Navarre, D., Palanque, P., Bastide, R. A Tool-Supported Design Framework for Safety Critical Interactive Systems in Interacting with computers, Elsevier, Vol. 15(3). (2003) 309-328.
28. Navarre, D., Palanque, P. & Bastide, R. A Formal Description Technique for the Behavioural Description of Interactive Applications Compliant with ARINC 661 Specification. HCI-Aero'04 Toulouse, France, 29 September-1st October 2004. (2004)
29. Newman, W.M, Lamming, M.G. Interactive system design. Addison-Wesley. (1995) 30. Norman, D.A., & Draper, S.W. User-Centred System Design: New Perspectives on Human Computer
Interaction. Lawrence Erlbaum Associates. Hillsdale. (1986) 31. Ormerod, T.C., Mariani, J. Ball, L.J. & Lambell, N. Desperado: Three-in-one indexing for innovative
design: Interact -Seventh IFIP Conference on Human-Computer Interaction. IOS Press, London. (1999) 32. Ould, M., Palanque, P., Schyn, A., Bastide, R., Navarre, D., Rubio, F. Multimodal and 3D Graphic Man-
Machine Interfaces to Improve Operations, Proceeding of the Eighth International Conference on Space Operations (SpaceOps 2004), May 17-21, 2004. Canada. (2004)
33. Palanque, P., Paternò, F., Bastide, R. Formal Specification for Designing User Interfaces of Air Traffic Control Applications (not available yet) In proceedings of the Second International Workshop on Formal Methods for Industrial Critical Systems , CESENA (Italy), July 4-5. (1997).
34. Paternò, F. Model-Based Design and Evaluation of Interactive Application. Springer Verlag, ISBN 1-85233-155-0, (1999)
35. Rettig, M. Prototyping for tiny fingers. Communications of the ACM. Volume 37, Issue 4 (April 1994). (1994) 21-27.
36. Sage, M., Johnson, C.W. Pragmatic Formal Design: A Case Study in Integrating Formal Methods into the HCI Development Cycle. DSVIS’98. Springer Verlag, (1998) 134-155.
37. Scapin, D.L., Bastien, J.M.C. Ergonomic criteria for evaluating the ergonomic quality of interactive systems. Behaviour & Information Technology, 6(4-5). (1997) 220-231.
38. Selvin, A., Buckingham Shum, S., Sierhuis, M., Conklin, J., Zimmermann, B., Palus, C., Drath, W., Horth, D., Domingue, J., Motta, E., & Li, G. Compendium: Making Meetings into Knowledge Events. Knowledge Technologies 2001, March 4-7, Austin, TX. Retrieved August 10, 2002. (2001)
39. Shum, S.J. Cognitive analysis of design rationale representation. PhD Thesis. York, UK: Department of Psychology, University of York. (1991).
40. Toulmin, S.E. The Uses of Argument. Cambridge: Cambridge University Press. (1958) 41. Wolf, T., Dutoit, A.H. A Rationale-based Analysis Tool 13th International Conference on Intelligent &
Adaptive Systems and Software Engineering, July 1-3, 2004, Nice, France (2004)
Related Documents