From Continental Priorities to Local Conservation: A Multi-Level Analysis for African Tortoises Pierluigi Bombi 1* , Manuela D’Amen 1,2 , Luca Luiselli 3,4 1 Institute of Agro-environmental and Forest Biology, National Research Council, Monterotondo, Italy, 2 Centro Nazionale Biodiversità Forestale ‘Bosco Fontana’, Corpo Forestale dello Stato, Verona, Italy, 3 Centre of Environmental Studies Demetra s.r.l., Rome, Italy, 4 Eni s.p.a. Environmental Department, Rome, Italy Abstract Terrestrial tortoises are the most endangered group of vertebrates but they are still largely ignored for defining global conservation priorities. In this paper, we explored within a hierarchical framework the potential contribution of prioritization studies at the continental scale to the planning of local initiatives for the conservation of African tortoises at the regional level. First, we modeled the distribution of all the African tortoise species, we calculated three indicators of conservation priority (i.e. species richness, conservation value, and complementarity), and we carried out a gap analysis at continental scale. Second, we focused on the most important region for tortoise conservation and performed the same analyses at higher resolution. Finally, we compared the results from the two scales for understanding the degree to which they are complementary. Southern Africa emerged from the continental analysis as the most important region for tortoises. Within this area, the high-resolution analysis pointed out specific core sites for conservation. The relative degree of species protection was assessed similarly at the two different resolutions. Two species appeared particularly vulnerable at both scales. Priority indices calculated at high resolution were correlated to the values calculated for the corresponding cells at low resolution but the congruence was stronger for species richness. Our results suggest to integrate the calculation of conservation value and complementarity into a hierarchical framework driven by species richness. The advantages of large scale planning include its broad perspective on complementarity and the capability to identify regions with greatest conservation potential. In this light, continental analyses allow targeting fine scale studies toward regions with maximum priority. The regional analyses at fine scale allow planning conservation measure at a resolution similar to that required for the practical implementation, reducing the uncertainty associated with low resolution studies. Citation: Bombi P, D’Amen M, Luiselli L (2013) From Continental Priorities to Local Conservation: A Multi-Level Analysis for African Tortoises. PLoS ONE 8(10): e77093. doi:10.1371/journal.pone.0077093 Editor: Brock Fenton, University of Western Ontario, Canada Received May 26, 2013; Accepted August 29, 2013; Published October 8, 2013 Copyright: © 2013 Bombi et al. This is an open-access article distributed under the terms of the Creative Commons Attribution License, which permits unrestricted use, distribution, and reproduction in any medium, provided the original author and source are credited. Funding: The authors have no support or funding to report. Competing interests: The authors have declared that no competing interests exist. * E-mail: [email protected] Introduction The limited availability of resources for biodiversity conservation worldwide makes essential targeting the practical efforts for maximizing the ratio between amount of biodiversity protected and money invested [1]. The process of systematic conservation planning [2] provides an efficient mechanism for identifying priorities, in terms of species and areas that should be the primarily focus of conservation initiatives. Several criteria have been adopted for defining such priorities [3,4] and most of them involve the analysis of species distributions. Like all spatially explicit processes, systematic conservation planning produces outcomes that depend on selected resolution and extent of analysis [5]. In addition, there is often a gap between the grain size used in conservation planning and the resolution at which conservation initiatives should be practically implemented. The selection of grain size in conservation planning is often an arbitrary choice and generally depends on the availability of high resolution data, the aim of the study, and/or computational constrains. On the other hand, the resolution at which conservation initiatives should be practically implemented is generally related to the scale of biological processes and to the extent of operative units of management [5,6]. For this reason, it is important to fully understand how the various attributes of biodiversity may change across spatial scales [7] for implementing conservation plans at different levels. The resolution and the extent of analysis may directly influence the selection of conservation priorities throughout several phases. The grain size of species distribution maps introduces some uncertainty in the representation of the true distribution of species on the ground [8]. Such uncertainty may PLOS ONE | www.plosone.org 1 October 2013 | Volume 8 | Issue 10 | e77093

Welcome message from author
This document is posted to help you gain knowledge. Please leave a comment to let me know what you think about it! Share it to your friends and learn new things together.
Transcript
From Continental Priorities to Local Conservation: AMulti-Level Analysis for African TortoisesPierluigi Bombi1*, Manuela D’Amen1,2, Luca Luiselli3,4
1 Institute of Agro-environmental and Forest Biology, National Research Council, Monterotondo, Italy, 2 Centro Nazionale Biodiversità Forestale ‘BoscoFontana’, Corpo Forestale dello Stato, Verona, Italy, 3 Centre of Environmental Studies Demetra s.r.l., Rome, Italy, 4 Eni s.p.a. Environmental Department,Rome, Italy
Abstract
Terrestrial tortoises are the most endangered group of vertebrates but they are still largely ignored for defining globalconservation priorities. In this paper, we explored within a hierarchical framework the potential contribution ofprioritization studies at the continental scale to the planning of local initiatives for the conservation of African tortoisesat the regional level. First, we modeled the distribution of all the African tortoise species, we calculated threeindicators of conservation priority (i.e. species richness, conservation value, and complementarity), and we carriedout a gap analysis at continental scale. Second, we focused on the most important region for tortoise conservationand performed the same analyses at higher resolution. Finally, we compared the results from the two scales forunderstanding the degree to which they are complementary. Southern Africa emerged from the continental analysisas the most important region for tortoises. Within this area, the high-resolution analysis pointed out specific core sitesfor conservation. The relative degree of species protection was assessed similarly at the two different resolutions.Two species appeared particularly vulnerable at both scales. Priority indices calculated at high resolution werecorrelated to the values calculated for the corresponding cells at low resolution but the congruence was stronger forspecies richness. Our results suggest to integrate the calculation of conservation value and complementarity into ahierarchical framework driven by species richness. The advantages of large scale planning include its broadperspective on complementarity and the capability to identify regions with greatest conservation potential. In this light,continental analyses allow targeting fine scale studies toward regions with maximum priority. The regional analysesat fine scale allow planning conservation measure at a resolution similar to that required for the practicalimplementation, reducing the uncertainty associated with low resolution studies.
Citation: Bombi P, D’Amen M, Luiselli L (2013) From Continental Priorities to Local Conservation: A Multi-Level Analysis for African Tortoises. PLoS ONE8(10): e77093. doi:10.1371/journal.pone.0077093
Editor: Brock Fenton, University of Western Ontario, Canada
Received May 26, 2013; Accepted August 29, 2013; Published October 8, 2013
Copyright: © 2013 Bombi et al. This is an open-access article distributed under the terms of the Creative Commons Attribution License, which permitsunrestricted use, distribution, and reproduction in any medium, provided the original author and source are credited.
Funding: The authors have no support or funding to report.
Competing interests: The authors have declared that no competing interests exist.
* E-mail: [email protected]
Introduction
The limited availability of resources for biodiversityconservation worldwide makes essential targeting the practicalefforts for maximizing the ratio between amount of biodiversityprotected and money invested [1]. The process of systematicconservation planning [2] provides an efficient mechanism foridentifying priorities, in terms of species and areas that shouldbe the primarily focus of conservation initiatives. Severalcriteria have been adopted for defining such priorities [3,4] andmost of them involve the analysis of species distributions. Likeall spatially explicit processes, systematic conservationplanning produces outcomes that depend on selectedresolution and extent of analysis [5]. In addition, there is often agap between the grain size used in conservation planning andthe resolution at which conservation initiatives should be
practically implemented. The selection of grain size inconservation planning is often an arbitrary choice and generallydepends on the availability of high resolution data, the aim ofthe study, and/or computational constrains. On the other hand,the resolution at which conservation initiatives should bepractically implemented is generally related to the scale ofbiological processes and to the extent of operative units ofmanagement [5,6]. For this reason, it is important to fullyunderstand how the various attributes of biodiversity maychange across spatial scales [7] for implementing conservationplans at different levels.
The resolution and the extent of analysis may directlyinfluence the selection of conservation priorities throughoutseveral phases. The grain size of species distribution mapsintroduces some uncertainty in the representation of the truedistribution of species on the ground [8]. Such uncertainty may
PLOS ONE | www.plosone.org 1 October 2013 | Volume 8 | Issue 10 | e77093
change with the method used for mapping species distributions[9,10]. Even if species maps are generated by distributionmodeling techniques, the resolution still influences modelperformance [11,12]. The definition of specific conservationtargets and the quantification of species protection levels aresensitive to over- or under-estimations of species distributions[10]. Since model errors propagate through the process ofoverlaying distribution maps [13], biodiversity patterns changewith the grain size [14,15]. In addition, the size of spatial units,when it is different from the management units, influences theestimated representation of species in protected areas [16],introducing further uncertainty in the prioritization process. Forthese reasons, it is advised that the implementation ofconservation efforts is conducted within a multi-scaleframework for greater effectiveness.
A number of studies investigated conservation priorities atglobal and continental scale [4,17]. In Africa, these studiesencompassed different taxa and utilized several approaches[18,19]. Most of the studies analyzed the distribution patterns ofmammals, amphibians, birds, and snakes [18–20]. Only fewstudies investigated the conservation requirements ofchelonians, focusing exclusively on freshwater species [10,21],with only a single study identifying priorities through a spatiallyexplicit approach [10].
Many species of terrestrial chelonians live in Africa andSouth Africa has been identified as the global hotspot fortortoise diversity [22,23], housing almost one third of all theexisting species in the world. Five genera and 14 species ofTestudinids occur in the subcontinent [24] and three generaand 11 species of these are endemic to the area. Nevertheless,this group is still largely ignored in spatially explicitprioritizations. Since chelonians are the most endangeredgroup of vertebrates in the world in terms of proportion ofthreatened species according to the International Union forConservation of Nature (IUCN) Red List [22], improvingconservation instruments for this taxon is of extremeimportance, especially in Africa where pristine environmentsare collapsing and vanishing at a fast rate.
In this study we investigate the potential contribution ofprioritization exercises at the continental scale to the definitionof local priorities for the conservation of African tortoises at theregional level. To do this, we adopt a double-level approach.First, we evaluate the conservation priorities for tortoises in thewhole of Africa and identify the highest priority region. Second,we focus on this high priority region to define core areas fortortoise conservation at an increased spatial resolution. Foreach species, we estimate the degree of protection at bothscales and we analyzed the congruence in outcomes ofcontinental and regional prioritizations. Our results must not beinterpreted as ready-to-use indications for the practicalimplementation of conservation measures, but as a contributionto the understanding of how conservation planning may changeacross spatial scales. Our approach clarifies how differentlevels of analysis can interact, integrating the respective rolesand providing a reciprocal complement.
Methods
Species locality recordsWe utilized species data provided by the “EMYSystem
Global Turtle Database” [25]. These data consist of localityrecords from Iverson [26,27], collected in a web site by the“Terra Cognita” laboratory (Geosciences Department ofOregon State University in Corvallis, Oregon). Iverson’s works[26,27] are recognized as the state of the art and a milestone inthe study of turtle distributions and are still used as referencesin fundamental papers in this field [24,28,29], being consideredthe most authoritative, comprehensive, and precise source ofturtle distribution data, especially in Africa where frequentupdating are not available. The EMYSystem Global TurtleDatabase contains distribution records for every species offreshwater and terrestrial chelonian that has been collected bya museum, private individual, or referenced in a publication. Inthe database, locations for sea turtles and for non-marinespecies described later than 1992 are not included. Localityrecords are mapped at a spatial resolution of 0.01 geographicdegrees (about 1.1 km).
In total, we considered 16 species of Testudinidae:Centrochelys sulcata, Chersina angulata, Homopus areolatus,Homopus boulengeri, Homopus femoralis, Homopus signatus,Homopus solus, Kinixys belliana, Kinixys erosa, Kinixyshomeana, Kinixys natalensis, Malacochersus tornieri,Psammobates geometricus, Psammobates oculifer,Psammobates tentorius, Stigmochelys pardalis. These speciesare only a very small fraction of the overall African biodiversity.Nevertheless, according to the Turtle Taxonomy WorkingGroup of the IUCN/SSC Tortoise and Freshwater TurtleSpecialist Group [24], this set of species represents almost theentire fauna of tortoises in Sub-Saharan Africa, only twospecies being excluded (Kinixys lobatsiana, Kinixys spekii).However, other studies consider additional taxa which were notrecognized by Iverson et al. [25] and Rhodin et al. [24]. Forinstance, some authors considered Kinixys nogueyi as a validWest African species [30,31] rather than a subspecies ofKinixys belliana as in Rhodin et al. [24]. The number of usablerecords was extremely variable between species (mean =81.50, SD = 96.62): there was only one record for H. solus and,for the other species, the range was from 11 records (for K.natalensis) to 316 records (for K. belliana).
Environmental predictorsFor both continental and regional analyses, we fitted species
distribution models (SDMs) utilizing four groups ofenvironmental predictors with high resolution (i.e. < 30 arcseconds): (i) 19 climatic variables from the WorldClim databank[32], (ii) two land morphology descriptors from the UNEPEnvironmental Data Explorer, (iii) three variables relating towater bodies from the FAO GeoNetwork, and (iv) one landcover variable from the JRC databank (see Table S1 for datasources and description). All the variables were re-sampled inArcGIS 9.3 at the resolutions of one geographic degree for theentire continent and of five arc minutes for the regionalanalysis, by calculating the most common class for land coverand the average value for the other parameters. We calculated
Conservation Priorities for African Tortoise
PLOS ONE | www.plosone.org 2 October 2013 | Volume 8 | Issue 10 | e77093
the variance inflation factor (VIF) to eliminate correlatedvariables [33]. VIF measures the degree of inflation of theunexplained variance due to the inter-correlation amongindependent variables [34,35]. We removed variables until allVIFs were below 5 [33], consequently we trained the modelsutilizing a subset of 11 and 10 predictors for continental andregional analyses respectively (Table S1). This processreduced the comparability of distribution models betweenscales but, at the same time, allowed to optimize the models byavoiding the introduction of biases due to correlation betweenpredictors.
Modeling procedureBecause the choice of algorithm influences the performance
of SDMs, we adopted an ensemble forecasting approach [36].We used five different techniques for modeling habitatsuitability in the R-based (version 2.8.1 [37]) package BIOMOD[38], at two spatial resolutions for the continental and theregional analyses (one degree and five arcmin respectively).We fitted Generalized Boosting Model (GBM [39]), GeneralizedLinear Models (GLM [40]), Multiple Adaptive RegressionSplines (MARS [41]), Flexible Discriminant Analysis (FDA [42]),and random forest for classification and regression (RF [43]) onpresence and pseudo-absence data for all the speciesoccurring in the considered area. Generalized Boosting Modelare models that combine two different techniques – regressiontrees and boosting – to optimize predictive performance [39],Generalized Linear Models are regression models that allownon-linear distributions for the response variable [40]. MultipleAdaptive Regression Splines are models that combine linearregression, mathematical construction of splines, and binaryrecursive partitioning to produce a local model [41]. FlexibleDiscriminant Analysis are classification models based on thewell-known linear discriminant analysis [42]. Random Forest forclassification and regression are models that create a suite ofmodels using a classification and regression tree [43]. Weselected 500 (in the continental analysis) and 200 (in theregional analysis) random cells across the study area aspseudo-absences in order to have a good representation of thebackground conditions. With a fixed number of pseudo-absence points, the prevalence changed across species andwas proportional to the number of species presences. Wevalidated each model by calculating the Area Under Curve(AUC) through a 10-fold cross-validation procedure [44]. Foreach species, we produced a single consensus model bycalculating the weighted average of any single model with AUC> 0.7 [36] using AUC values as model weights.
We converted to predicted presence/absence the continuousvalues of habitat suitability (HS) predicted by the consensusmodels according to the minimal predicted area criterion[45,46], i.e. HS threshold selected to achieve a sensitivity (i.e.the true positive fraction) of 0.9. We chose this threshold, byproducing a set of thresholds from different criteria (i.e.maximum percentage of presence and absence correctlypredicted, maximum kappa, maximum TSS) and selecting thecriterion that produced the highest threshold, in order to reducethe rate of commission error in SDMs. Grid cells where aspecies was recorded were treated as presences regardless of
the model predictions. In order to exclude the areas wellbeyond the known range of a species, we removed all areasthat do not currently contain locality records and are isolatedfrom other areas that do contain records by a barrier ofunsuitable habitat wider than the mean distance betweenclosest pairs of locality records for the species. This procedureproduced one continuous area or few separated areas perspecies that can be considered as the best approximation ofthe true species distribution at the given resolution. In the caseof Homopus solus, which has only one record in our dataset,we considered the unique occupied cell as the entiredistribution at both the resolutions.
Measures of conservation priorityWe performed all analyses of conservation priority at both
continental and regional scale. We used species distributionsto estimate three indicators of conservation priority for eachgrid cell in the study areas: (i) species richness, (ii)conservation value, and (iii) complementarity with existingreserves. Species richness was derived by simply counting thenumber of species estimated to occur in each cell. In order toevaluate conservation value and complementarity of the gridcells we used an approach based on the principle ofirreplaceability [47]. We used the C-Plan SystematicConservation Planning System, Version 4 to predictirreplaceability [48]. Irreplaceability of each cell was estimatedas the number of possible combinations of cells that include thefocal cell and meet a predefined set of specific conservationtargets, but which would not meet the targets if the focal cellwas removed, divided by the total number of possiblecombinations that meet the targets (see 3 for details). Valuesclose to 1 indicate sites difficult to replace, often containingspecies endemic to those sites, while values close to 0 indicateeasily replaceable sites, containing only widely distributedspecies. Following the suggestion by Pressey et al. [47], inorder to estimate the ‘landscape’ of conservation value, wecalculated the irreplaceability on the entire study areas,considering all the cells as non-protected. In order to estimatethe potential contribution of each available cell to theimprovement of the established network of protected areas, wecalculated the level of complementarity of the cells as theirreplaceability value calculated for unprotected cells by takinginto account the existing reserves [47].
Dealing with large scale datasets, a problem arises whenreserve boundaries, which are mapped as polygons, should bematched with species distribution maps in regular grids [16]. Inthese cases, it is necessary to define a threshold percentage ofintersection between cells of distribution maps and polygons ofreserves boundaries for determining whether a grid cell shouldbe considered protected or not. This choice is crucial, becauseit potentially generates an over- or under-estimation of theprotection level. For solving this issue, we tested differentthresholds, using the 2010 WDPA annual release of reserveboundaries [49]. Protected areas with only a point locationwere mapped as circles with appropriate surface. At both thescales of analysis, we chose the thresholds that selected anumber of cells with a total surface equal to the total surface ofreserves in the study areas [50]. On the basis of this approach,
Conservation Priorities for African Tortoise
PLOS ONE | www.plosone.org 3 October 2013 | Volume 8 | Issue 10 | e77093
we considered protected any cell with a proportion of parkcoverage larger than 36.95%.
In the gap analysis, we determined whether each speciesmet a conservation target set in terms of percentage of itsdistribution intersecting the current reserve system. We definedthe conservation target for each species as the minimumnumber of cells that should be protected to consider thespecies sufficiently represented. We established theconservation targets for species on the basis of range sizes,following Rodrigues et al. [17]. We set the conservation targetto 100% of the cells protected for the species with the smallestextent of occurrence. On the other hand, we set to 5% theconservation target of the most widespread species. Targetsfor all species with intermediate range sizes were calculated byinterpolating the extreme range size targets using a linearregression on the log-transformed number of occupied cells.We considered those species not represented in any protectedarea as total gap species and species that met only a portion oftheir conservation target as partial gap species [17].
Cross-levels comparisonIn order to explore the potential cross-scale interaction, we
compared the outcomes of continental and regionalprioritizations. More specifically, we evaluated if (i) the relativedegree of species protection and (ii) the land priority valueswere congruent at the two resolutions. To do this, we adopteda null models approach, contrasting the observed correlationcoefficient r with those simulated by 3 × 10⁴ random MonteCarlo permutations in EcoSim 7.0 [51]. This number ofpermutations ensures that algorithm biases are avoided [52].The index (r) was calculated for the original data as well as for
the simulated matrices and results were compared, calculatingthe probability (P) of the null hypothesis that the observedindex (robs) was drawn at random from the distribution of thesimulated indices (rexp) [53]. This means that the observedcorrelation in the data does not reflect real patterns, butrepresents chance variation or sampling effects. Non-randomcorrelations were assumed when PFobs≥Fexp ≤ 0.05 [54]. Inaddition, we defined as priority sites the envelope of the cellswith priority score higher than the threshold that selects anumber of cells as close as possible to the best 1%, and wemeasured if the priority sites identified at high resolution werenested across the priority sites identified at low resolution.
Results
Continental analysisAt the continental scale, we obtained high validation scores
for all the species (mean AUC ± SD = 0.894 ± 0.041). One halfof the species appeared localized to relatively small areas (<100 cells) and most of them are endemic to Southern Africa(Table 1). On the contrary, we evidenced only three verywidespread species (> 500 cells). The protection provided totortoises by the African network of protected areas was highlyvariable (Table 1). Similarly, the percentage of target met byeach species changed. Three species met their respectiveconservation targets but, at the same time, two species werenot represented at all in the reserve system (Table 1).
The combination of species models produced very clearpatterns of species richness, conservation value, andcomplementarity. We observed the highest values of speciesrichness in Southern Africa (especially in central and southern
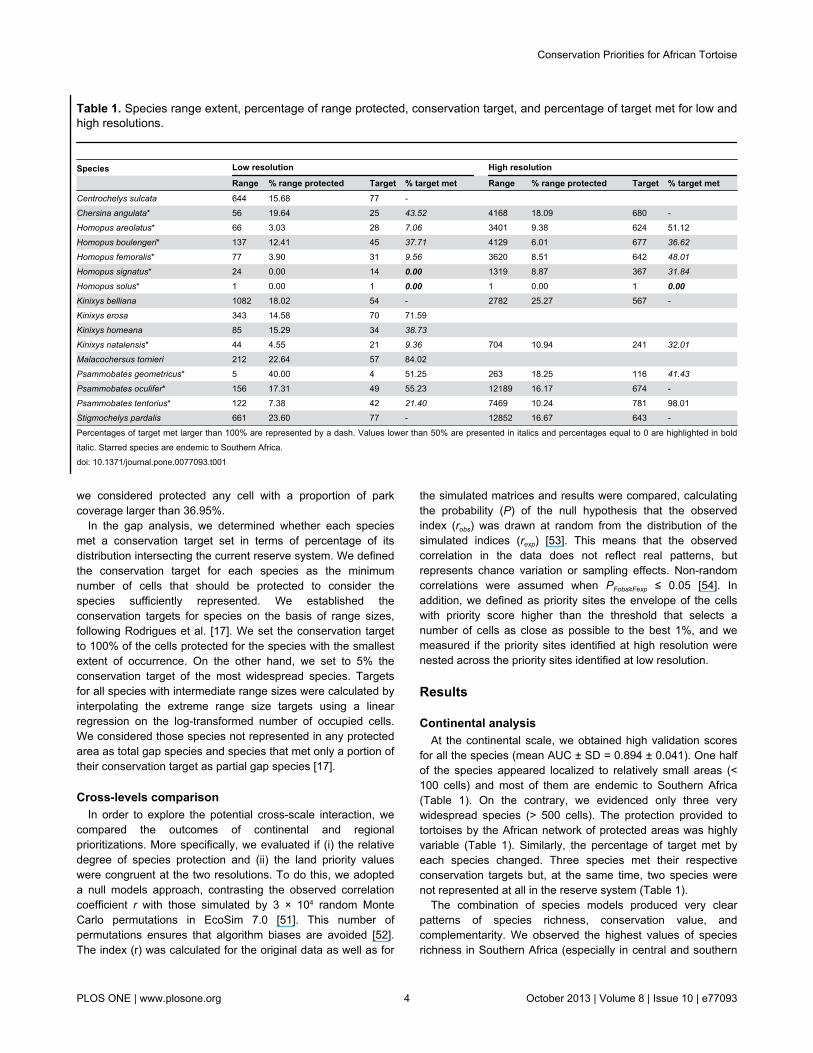
Table 1. Species range extent, percentage of range protected, conservation target, and percentage of target met for low andhigh resolutions.
Species Low resolution High resolution
Range % range protected Target % target met Range % range protected Target % target metCentrochelys sulcata 644 15.68 77 - Chersina angulata* 56 19.64 25 43.52 4168 18.09 680 -Homopus areolatus* 66 3.03 28 7.06 3401 9.38 624 51.12Homopus boulengeri* 137 12.41 45 37.71 4129 6.01 677 36.62
Homopus femoralis* 77 3.90 31 9.56 3620 8.51 642 48.01
Homopus signatus* 24 0.00 14 0.00 1319 8.87 367 31.84
Homopus solus* 1 0.00 1 0.00 1 0.00 1 0.00Kinixys belliana 1082 18.02 54 - 2782 25.27 567 -Kinixys erosa 343 14.58 70 71.59 Kinixys homeana 85 15.29 34 38.73 Kinixys natalensis* 44 4.55 21 9.36 704 10.94 241 32.01
Malacochersus tornieri 212 22.64 57 84.02 Psammobates geometricus* 5 40.00 4 51.25 263 18.25 116 41.43
Psammobates oculifer* 156 17.31 49 55.23 12189 16.17 674 -Psammobates tentorius* 122 7.38 42 21.40 7469 10.24 781 98.01Stigmochelys pardalis 661 23.60 77 - 12852 16.67 643 -
Percentages of target met larger than 100% are represented by a dash. Values lower than 50% are presented in italics and percentages equal to 0 are highlighted in bolditalic. Starred species are endemic to Southern Africa.doi: 10.1371/journal.pone.0077093.t001
Conservation Priorities for African Tortoise
PLOS ONE | www.plosone.org 4 October 2013 | Volume 8 | Issue 10 | e77093
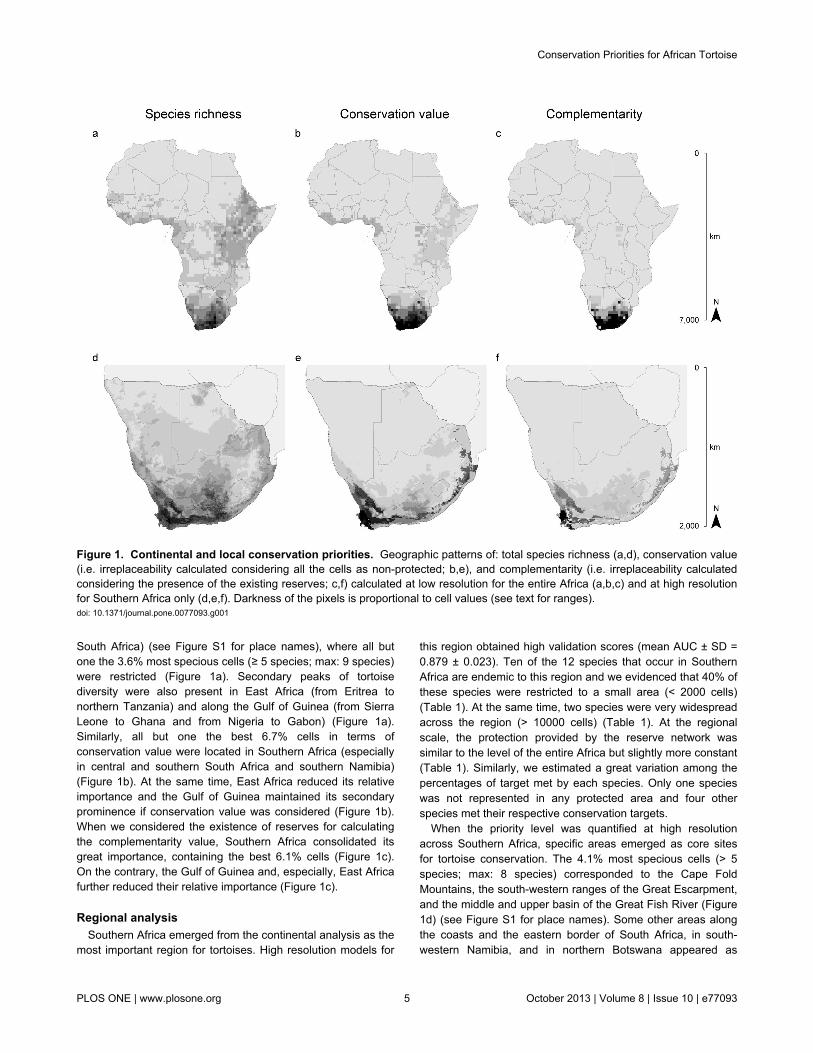
South Africa) (see Figure S1 for place names), where all butone the 3.6% most specious cells (≥ 5 species; max: 9 species)were restricted (Figure 1a). Secondary peaks of tortoisediversity were also present in East Africa (from Eritrea tonorthern Tanzania) and along the Gulf of Guinea (from SierraLeone to Ghana and from Nigeria to Gabon) (Figure 1a).Similarly, all but one the best 6.7% cells in terms ofconservation value were located in Southern Africa (especiallyin central and southern South Africa and southern Namibia)(Figure 1b). At the same time, East Africa reduced its relativeimportance and the Gulf of Guinea maintained its secondaryprominence if conservation value was considered (Figure 1b).When we considered the existence of reserves for calculatingthe complementarity value, Southern Africa consolidated itsgreat importance, containing the best 6.1% cells (Figure 1c).On the contrary, the Gulf of Guinea and, especially, East Africafurther reduced their relative importance (Figure 1c).
Regional analysisSouthern Africa emerged from the continental analysis as the
most important region for tortoises. High resolution models for
this region obtained high validation scores (mean AUC ± SD =0.879 ± 0.023). Ten of the 12 species that occur in SouthernAfrica are endemic to this region and we evidenced that 40% ofthese species were restricted to a small area (< 2000 cells)(Table 1). At the same time, two species were very widespreadacross the region (> 10000 cells) (Table 1). At the regionalscale, the protection provided by the reserve network wassimilar to the level of the entire Africa but slightly more constant(Table 1). Similarly, we estimated a great variation among thepercentages of target met by each species. Only one specieswas not represented in any protected area and four otherspecies met their respective conservation targets.
When the priority level was quantified at high resolutionacross Southern Africa, specific areas emerged as core sitesfor tortoise conservation. The 4.1% most specious cells (> 5species; max: 8 species) corresponded to the Cape FoldMountains, the south-western ranges of the Great Escarpment,and the middle and upper basin of the Great Fish River (Figure1d) (see Figure S1 for place names). Some other areas alongthe coasts and the eastern border of South Africa, in south-western Namibia, and in northern Botswana appeared as
Figure 1. Continental and local conservation priorities. Geographic patterns of: total species richness (a,d), conservation value(i.e. irreplaceability calculated considering all the cells as non-protected; b,e), and complementarity (i.e. irreplaceability calculatedconsidering the presence of the existing reserves; c,f) calculated at low resolution for the entire Africa (a,b,c) and at high resolutionfor Southern Africa only (d,e,f). Darkness of the pixels is proportional to cell values (see text for ranges).doi: 10.1371/journal.pone.0077093.g001
Conservation Priorities for African Tortoise
PLOS ONE | www.plosone.org 5 October 2013 | Volume 8 | Issue 10 | e77093
secondary peaks of species richness. In terms of conservationvalue, the highest levels (best 0.6% cells) were evidenced inthe coastal area south-west of the Cape Fold Mountains and ina single cell in the south-western Namibia (Figure 1e). TheCape Fold Mountains themselves and the south-westernranges of the Great Escarpment maintained an outstandingvalue (best 4.0% cells), which was also obtained by the south-eastern slopes of the Drakensberg mountain range. On thecontrary, the basin of the Great Fish River reduced itsimportance. Measuring the value of complementarity withrespect to the existing reserve network, the coastal area south-west of the Cape Fold Mountains and the cell in south-westernNamibia further increased their importance with respect to theother zones (Figure 1f), containing the best 0.4% cells.
Cross-levels comparisonThe relative degree of species protection was assessed
similarly at the two different resolutions. For the speciesendemic to Southern Africa, the percentages of protectedrange measured at low and high resolutions were stronglycorrelated (arc-sine transformed % protected range(LR vs HR): robs
= 0.699, Pobs ≥ exp = 0.006). Similarly, considering that specieswith the percentage of protected range ≥ 100% meet theirtargets and have, consequently, the percentages of target met= 100%, the percentages of target met calculated at high andlow resolutions were correlated (arc-sine transformed % targetmet(LR vs HR): robs = 0.666, Pobs ≥ exp = 0.008). The relative priorityvalues of the cells at high resolution were similar to the relativepriority values of the corresponding cells at low resolution. Allthe three indices of priority (species richness, conservationvalue, and complementarity) calculated at high resolution werecorrelated to the values calculated for the corresponding cellsat low resolution (robs = 0.709, robs = 0.336, and robs = 0.374respectively, Pobs ≥ exp ≤ 0.001 in every case). The highestpriorities identified at the regional level were nested across thepriorities defined at the continental scale. Almost all (98.7%)the 1.5% most specious cells at high resolution were containedin the 2.3% most specious cells at low resolution. At the sametime, 94.3% of the 0.9% most valuable cells and 90.7% of the1.9% most complementary cells at high resolution werecontained in the best 0.9% and 1.9% cells at low resolution interms of conservation value and complementarity respectively.
Discussion
Although both spatial resolution and extent of analysis inprioritization exercises depend on the level of detail desired,their choice is generally constrained by the availability of dataand resources. Coarse data sets are usually available atcontinental scale, but this information alone is of little use forpractical implementations. On the contrary, fine-scale presencedatasets are usually limited to small areas. In addition, even ifdetailed records would be available, identifying conservationpriorities at high resolution on very large surfaces (e.g.continents) can require an overwhelming mass of calculations,which are intractable with standard hardware instruments. Theconstraints on fine-scale mapping across large regions can beovercome by a hierarchical approach, if one can show the
capability of large scale planning to identify regions withgreatest conservation potential [14]. Here, we observedcongruence in the geographic pattern of priorities and speciesconservation needs identified at the continental and regionallevels. This congruence has been already observed previously[14,55], further supporting the use of this approach.
In our study, the correlation observed between regional andcontinental values is stronger for species richness than for theother indices. Similarly, the degree to which the most importantsites at the regional level are nested in the most important sitesat the continental level is higher for species richness than forthe other indices. Even the visual inspection of the prioritymaps reveals that the patterns of species richness in SouthernAfrica determined by the two levels of analysis coincide morestrictly than the patterns of conservation value andcomplementarity. This dissimilarity is due to the sensitivity ofthe irreplaceability calculation to different sources ofuncertainty (e.g. definition of protected units, communitycomposition, extent of study area). Operatively, the scale-dependence of conservation value and complementaritysuggests to use the geographic pattern of species richness forlinking the different levels of analysis in a hierarchicalframework of prioritization.
The two levels of analysis quantified similarly the degree ofprotection for each species. Most of the species are under-represented in the protected areas with respect to ourconservation targets in the entire continent and in SouthernAfrica as well. Two species appear particularly neglected atboth scales of analysis. Although this evidence may be due tothe mapping method used for Homopus solus, which canunderestimate its real distribution, this species does not occurin any reserve and is listed as Vulnerable in the IUCN Red-List[56]. Similarly, Homopus signatus is completely uncovered atlow resolution and meets only one third of its target at highresolution. However, this species is listed as ‘Lower Risk/NearThreatened’ in the Red-List [56]. These two species should beconsidered as priorities in future management actions anddeserve further studies for clarifying their conservation status.
The percentages of target met by species were slightlyhigher at local than at continental scale. If not a byproduct ofchance, this small difference may be due to the criterionadopted for setting the conservation targets, which selectedless demanding targets at high resolution. However, thesevalues as well as the percentages of range protected estimatedat high resolution are proportional to the corresponding valuesat low resolution. In addition, the percentages of rangeprotected are also similar in value. These factors suggest thatthe criterion for conservation targets should be changed withthe study resolution but also that our approach for definingprotected cells is robust to cross-scale variations. Therefore,continental analyses can represent a preliminary instrument fordefining priority species at regional level.
South Africa emerged as by far the most important area fortortoise conservation at the continental level. This finding doesagree with the outcomes of other studies [22,23]. The mostimportant areas for tortoises identified in Southern Africacorrespond to global priorities for ecoregion conservation. TheCape Fold Mountains and the coastal area south-west of them
Conservation Priorities for African Tortoise
PLOS ONE | www.plosone.org 6 October 2013 | Volume 8 | Issue 10 | e77093
belong to one of the Global 200 ecoregions (i.e. ‘Fynbos’ [57])and to one of the global biodiversity hotspot (i.e. ‘Cape floristicprovince’ [4]). Similarly, the south-western ranges of the GreatEscarpment match with the ‘Namib and Karoo deserts andshrublands’ ecoregion [57] and the ‘succulent karoo’ hotspot[4]. The importance of the coastal area south-west of CapeFold Mountains in terms of both conservation value andcomplementarity is further increased by the presence ofseveral small ranging species and the relative lack of protectedareas. Future plans for the conservation of tortoises inSouthern Africa should be focused especially on these areas,where detailed studies will be required in order to identifyspecific sites and practical guidelines for species management.These detailed studies will have to (i) identify species ofconservation concern, (ii) define species distribution at veryhigh resolution by talking to local experts, (iii) quantify the levelof protection actually provided by the existing reserves to thetarget species, (iv) highlight demographic and life-history traitsfor these populations, and (v) work with stakeholders to identifysites where conservation action is feasible. Furthermore, thisarea is expected to require high costs for conservationimplementation [58], reinforcing the importance of optimizationstrategies for tortoise protection and of large investments fromfunding agencies.
On the other hand, the importance of this region does notmatch with the conservation assessment for other animalgroups in Africa [10,19]. A mismatch in the geographiclocalization of high priority areas for different animal groups hasalready been shown elsewhere [50,59]. The prioritizationapproach often aims to preserve all species from a selectedarea considering together different taxonomic groups. Treatingin a unique step different taxa may underestimate the needs ofsingle, less numerous and more specialist groups. Moreover,this could be true not only from a taxonomical point of view, butalso it can be related to the ecological needs. Indeed, thepriorities we identified for terrestrial tortoises are completelydifferent from those for freshwater turtles [10]. The evidencethat Southern Africa represents a specific priority for tortoisesbut not for other wildlife should encourage the conservationagencies in this area (e.g. national administrations, country-based and international organizations, managers of protectedareas) to systematically focus their efforts on terrestrialchelonians.
Other regions are also relatively important for tortoiseconservation at the continental level. The Gulf of Guinea andespecially East Africa reduce their relative importance whenconservation value is considered in place of species richness.This reduction is due to the large distribution of the speciesoccurring in these areas that, therefore, give a smallcontribution to the irreplaceability of the occupied cell. This
reduction could be smaller if different taxonomic arrangementsare considered. Indeed, the splitting of the Kinixys bellianagroup would reduce the range extent of the different species.The further reduction of importance of East Africa, andsecondarily of the Gulf of Guinea, in terms of complementaritywith respect to the existing reserves testifies that the largeprotected areas established for protecting other wildlife in theseregions obtained a sufficient representation also for tortoises.Both Gulf of Guinea and East Africa have been highlighted ashotspots for mammals, birds, amphibians, and other reptiles[10,18,19,60]. In this light, further studies at higher resolutionare required in these areas for understanding whether tortoisesshould be considered in future conservation planning.
Conclusions
Performing two levels of prioritization analyses can providereciprocal complements. On the one hand, continentalanalyses allow us to overcome the ‘tyranny of the local’ (sensu[61]), which consists in overlooking important areas at the largescale when reserves are planned locally. On the other hand,regional analyses allow planning conservation initiatives at thesame resolution as their practical implementation. This reducesthe uncertainty due to modeling species distributions anddefining priorities at low resolution. When only coarse-graindistribution data are available (e.g. atlas maps), downscalingtechniques can be used for increasing the resolution of spatialpredictions in local analyses [62]. Thus, organizing multiplelevels of analysis into a hierarchical framework of prioritizationcan represent a helpful strategy for overcoming the limits of thesingle, independent levels and further improving the overallefficacy of conservation planning processes.
Supporting Information
Figure S1. Geographic location of place names used inthe text.(DOCX)
Table S1. Variables selected for modelling speciesdistribution at low and high resolution and relative datasource (see main text for details).(DOCX)
Author Contributions
Conceived and designed the experiments: PB LL. Analyzed thedata: PB MD. Wrote the manuscript: PB MD LL.
References
Conservation Priorities for African Tortoise
PLOS ONE | www.plosone.org 7 October 2013 | Volume 8 | Issue 10 | e77093

1. Pressey RL, Humphries CJ, Margules CR, Vane-Wright RI, WilliamsPH (1993) Beyond opportunism: key principles for systematic reserveselection. Tree 8: 124–128. PubMed: 21236127.
2. Margules CR, Pressey RL (2000) Systematic conservation planning.Nature 405: 243-253. doi:10.1038/35012251. PubMed: 10821285.
3. Ferrier S, Pressey RL, Barrett TW (2000) A new predictor of theirreplaceability of areas for achieving a conservation goal, itsapplication to real-world planning, and a research agenda for furtherrefinement. Biol Conserv 93: 303-325. doi:10.1016/S0006-3207(99)00149-4.
4. Myers N, Mittermeier RA, Mittermeier CG, da Fonseca GAB, Kent J(2000) Biodiversity hotspots for conservation priorities. Nature 403:853–858. doi:10.1038/35002501. PubMed: 10706275.
5. Erasmus BFN, Freitag S, Gaston KJ, Erasmus BH, Jaarsveld AS(1999) Scale and conservation planning in the real world. Proc R SocLond B 266: 315. doi:10.1098/rspb.1999.0640.
6. Boyd C, Brooks TM, Butchart SHM, Edgar GJ, da Fonseca GAB et al.(2008) Spatial scale and the conservation of threatened species.Conserv Lett 1: 37-43. doi:10.1111/j.1755-263X.2008.00002.x.
7. Shriner SA, Wilson KR, Flather CH (2006) Reserve networks based onrichness hotspots and representation vary with scale. Ecol Appl 16:1660-1673. doi:10.1890/1051-0761(2006)016[1660:RNBORH]2.0.CO;2. PubMed: 17069361.
8. Hurlbert AH, Jetz W (2007) Species richness, hotspots, and the scaledependence of range maps in ecology and conservation. Proc NatlAcad Sci USA 104: 13384-13389. doi:10.1073/pnas.0704469104.PubMed: 17686977.
9. Graham CH, Hijmans RJ (2006) A comparison of methods for mappingspecies ranges and species richness. Glob Ecol Biogeogr 15: 578–587.doi:10.1111/j.1466-8238.2006.00257.x.
10. Bombi P, Luiselli L, D’Amen M (2011) When the method for mappingspecies matters: defining priority areas for conservation of Africanfreshwater turtles. Distrib. Div: 17: 581-592
11. Trivedi MR, Berry PM, Morecroft MD, Dawson TP (2008) Spatial scaleaffects bioclimate model projections of climate change impacts onmountain plants. Glob Change Biol 14: 1089-1103. doi:10.1111/j.1365-2486.2008.01553.x.
12. Seo C, Thorne JH, Hannah L, Thuiller W (2009) Scale effects inspecies distribution models: implications for conservation planningunder climate change. Biol Lett 5: 39-43. doi:10.1098/rsbl.2008.0476.PubMed: 18986960.
13. Araújo MB, Thuiller W, Williams PH, Reginster I (2005) DownscalingEuropean species atlas distributions to a finer resolution: implicationsfor conservation planning. Glob Ecol Biogeogr 14: 17-30. doi:10.1111/j.1466-822X.2004.00128.x.
14. Larsen FW, Rahbek C (2003) Influence of scale on conservationpriority setting–a test on african mammals. Biodiv Conserv 12: 599–614. doi:10.1023/A:1022448928753.
15. Huber PR, Greco SE, Thorne JH (2010) Spatial scale effects onconservation network design: trade-offs and omissions in regionalversus local scale planning. Landsc Ecol 25: 683–695. doi:10.1007/s10980-010-9447-4.
16. Araújo MB (2004) Matching species with reserves – uncertainties fromusing data at different resolutions. Biol Conserv 118: 533-538. doi:10.1016/j.biocon.2003.10.006.
17. Rodrigues ASL, Andelman SJ, Bakarr MI, Boitani L et al. (2004)Effectiveness of the global protected area network in representingspecies diversity. Nature 428: 640–643. doi:10.1038/nature02422.PubMed: 15071592.
18. Hacker J (1998) Patterns of African primate diversity and theirevaluation for the selection of conservation areas. Biol Conserv 84:251-262. doi:10.1016/S0006-3207(97)00115-8.
19. Brooks TM, Balmford A, Burgess ND, Fjeldså J, Hansen LA et al.(2001) Toward a Blueprint for Conservation in Africa. BioScience 51:613.
20. Burgess N, de Klerk H, Fjeldså J, Crowe T, Rahbek C (1997) Mappingafrotropical birds: links between atlas studies and conservation priorityanalyses 4. Bull Afr Bird Club. pp. 93–98.
21. Luiselli L (2008) A model assessing the conservation threats tofreshwater turtles of Sub-Saharan Africa predicts urgent need forcontinental conservation planning. Biodiv Conserv 18: 1349-1360.
22. Turtle Conservation Fund (2002) A global action plan for conservationof tortoises and freshwater turtles: strategy and funding prospectus2002-2007. Washington, DC: Conservation International and ChelonianResearch Foundation.
23. Buhlmann KA, Akre TSB, Iverson JB, Karapatakis D et al. (2009) AGlobal Analysis of Tortoise and Freshwater Turtle Distributions withIdentification of Priority Conservation Areas. Chelonian Conserv Biol 8:116-149. doi:10.2744/CCB-0774.1.
24. Rhodin AGJ, van Dijk PP, Iverson J, Shaffer HB (2010) Turtles of theworld, 2010 update: Annotated checklist of taxonomy, synonymy,distribution, and conservation status. Chelon. Res Monogr 5: 85-164.
25. Iverson JB, Kiester AR, Hughes LE, Kimerling AJ (2003) TheEMYSystem world turtle database. Available: http://emys.geo.orst.edu.
26. Iverson JB (1992) Species richness maps of the freshwater andterrestrial turtles of the world. Smithson Herpetol INFORM Serv 88: 1–18.
27. Iverson JB (1992) Global correlates of species richness in turtles.Herpetol J 2: 77–81.
28. Bickham JW, Iverson JB, Parham JF, Philippen HD (2007) AnAnnotated List of Modern Turtle Terminal Taxa with Comments onAreas of Taxonomic Instability and Recent Change. Chelonian ResMonogr 4: 173–199.
29. Fritz U, Havas P (2007) Checklist of chelonians of the world. VertebrZool 57: 148–368.
30. Chirio L, LeBreton M (2007) Atlas des reptiles du Cameroun.Publications Scientifiques du Museum Nationale d’Histoire. Paris:Naturelle.
31. Branch B (2008) Tortoises, terrapins & turtles of Africa. Cape Town:Struik Publishers.
32. Hijmans RJ, Cameron SE, Parra JL, Jones PG, Jarvis A (2005) Veryhigh resolution interpolated climate surfaces for global land areas. Int JClimatol 25: 1965–1978. doi:10.1002/joc.1276.
33. Belsley DA, Kuh E, Welsch RE (1980) Regression diagnostics. NewYork: John Wiley.
34. Braunisch V, Coppes J, Arlettaz R, Suchant R et al. (2013) Selectingfrom correlated climate variables: a major source of uncertainty forpredicting species distributions under climate change. Ecography 36:1–13. doi:10.1111/j.1600-0587.2012.07785.x.
35. Dormann CF, Elith J, Bacher S, Buchmann C et al. (2013) Collinearity:a review of methods to deal with it and a simulation study evaluatingtheir performance. Ecography 36: 27-46. doi:10.1111/j.1600-0587.2012.07348.x.
36. Araújo MB, New M (2007) Ensemble forecasting of speciesdistributions. Tree 22: 42-47. PubMed: 17011070.
37. R Development Core Team (2010) R: a language and environment forstatistical computing. Vienna: R Foundation for Statistical Computing.
38. Thuiller W (2009) BIOMOD: species/climate modeling functions.Available: http://R-Forge.R-project.org/projects/biomod.
39. Friedman JH (2001) Greedy function approximation: a gradientboosting machine. Ann Stat 29: 1189-1232. doi:10.1214/aos/1013203451.
40. McCullagh P, Nelder JA (1989) Generalized Linear Models. London:Chapman and Hall.
41. Friedman JH (1991) Multivariate additive regression splines. Ann Stat19: 1-141. doi:10.1214/aos/1176347963.
42. Hastie T, Tibshirani R, Buja A (1994) Flexible Discriminant Analysis byOptimal Scoring. J Am Stat Assoc 89: 1255-1270. doi:10.1080/01621459.1994.10476866.
43. Breiman L (2001) Random forests. Mach Learn 45: 5–32. doi:10.1023/A:1010933404324.
44. Fielding AH, Bell JF (1997) A review of methods for the assessment ofprediction errors in conservation presence/absence models. EnvironConserv 24: 38–49. doi:10.1017/S0376892997000088.
45. Engler R, Guisan A, Rechsteiner L (2004) An improved approach forpredicting the distribution of rare and endangered species fromoccurrence and pseudo-absence data. J Appl Ecol 41: 263–274. doi:10.1111/j.0021-8901.2004.00881.x.
46. Bean WT, Stafford R, Brashares JS (2012) The effects of small samplesize and sample bias on threshold selection and accuracy assessmentof species distribution models. Ecography 35: 250–258. doi:10.1111/j.1600-0587.2011.06545.x.
47. Pressey RL, Johnson IR, Wilson PD (1994) Shades of irreplaceability:towards a measure of the contribution of sites to a reservation goal.Biodiv Conserv 3: 242–262. doi:10.1007/BF00055941.
48. Pressey RL, Watts ME, Barrett TW, Ridges MJ (2009) The C-Planconservation planning system: origins, applications, and possiblefutures. Spatial models for conservation. Oxford: Oxford UniversityPress. Available: http://www.uq.edu.au/~uqmwatts/cplan.html.
49. IUCN, UNEP WCMC (2010) The world database on protected areas(WDPA): annual release (on-line). UNEP- WCMC, Cambridge, UK.Available: http://www.wdpa.org.
50. D’Amen M, Bombi P, Pearman PB, Schmatz DR et al. (2011) Willclimate change reduce the efficacy of protected areas for amphibianconservation in Italy? Biol Conserv 144: 989-997. doi:10.1016/j.biocon.2010.11.004.
Conservation Priorities for African Tortoise
PLOS ONE | www.plosone.org 8 October 2013 | Volume 8 | Issue 10 | e77093
51. Gotelli NJ, Entsminger GL (2001) EcoSim: null models software forecology, version 7 Acquired; Intelligence Inc. & Kesey-Bear, Jericho,VT. Available: http://garyentsminger.com/ecosim/index.htm.
52. Lehsten V, Harmand P (2006) Null models for species cooccurrencepatterns: assessing bias and minimum iteration number for thesequential swap. Ecography 29: 786-792. doi:10.1111/j.0906-7590.2006.04626.x.
53. Gotelli NJ (2000) Null model analysis of species co-occurrencepatterns. Ecology 81: 2606–2621. doi:10.1890/0012-9658(2000)081[2606:NMAOSC]2.0.CO;2.
54. Gotelli NJ, Graves GR (1996) Null models in ecology. Washington, DC:Smithsonian Institution Press.
55. Rouget M (2003) Measuring conservation value at fine and broadscales: implications for a diverse and fragmented region, the agulhasplain. Biol Conserv 112: 217-232. doi:10.1016/S0006-3207(02)00415-9.
56. IUCN (2011) IUCN Red List of Threatened Species. Available:www.iucnredlist.org.
57. Olson DM, Dinerstein E (1998) The Global 200: a representationapproach to conserving the Earth’s most biologically valuable
ecoregions. Conserv Biol 12: 502–515. doi:10.1046/j.1523-1739.1998.012003502.x.
58. Moore J, Balmford A, Allnutt T, Burgess N (2004) Integrating costs intoconservation planning across Africa. Biol Conserv 117: 343–350. doi:10.1016/j.biocon.2003.12.013.
59. D’Amen M, Bombi P, Campanaro A, Zapponi L et al. (2013) Protectedareas and insect conservation: questioning the effectiveness of Natura2000 network for saproxylic beetles in Italy. Anim Conserv. doi:10.1111/acv.12016.
60. Jetz W, Rahbek C (2001) Geometric constraints explain much of thespecies richness pattern in African birds. Proc Natl Acad Sci USA 98:5661-5666. doi:10.1073/pnas.091100998. PubMed: 11344307.
61. Groves CR (2003) Drafting a conservation blueprint: a practitioner’sguide to planning for biodiversity. Washington, DC: Island Press.
62. Bombi P, D’Amen M (2011) Scaling down distribution maps from atlasdata: a test of different approaches with virtual species. J Biogeogr. doi:10.1111/j.1365-2699.2011.02627.x.
Conservation Priorities for African Tortoise
PLOS ONE | www.plosone.org 9 October 2013 | Volume 8 | Issue 10 | e77093
Related Documents