METHODOLOGY ARTICLE Open Access From cheek swabs to consensus sequences: an A to Z protocol for high-throughput DNA sequencing of complete human mitochondrial genomes Andrew C Clarke 1,2,3* , Stefan Prost 1,2,4* , Jo-Ann L Stanton 1 , W Timothy J White 5 , Matthew E Kaplan 6 , Elizabeth A Matisoo-Smith 1,2 and The Genographic Consortium Abstract Background: Next-generation DNA sequencing (NGS) technologies have made huge impacts in many fields of biological research, but especially in evolutionary biology. One area where NGS has shown potential is for high-throughput sequencing of complete mtDNA genomes (of humans and other animals). Despite the increasing use of NGS technologies and a better appreciation of their importance in answering biological questions, there remain significant obstacles to the successful implementation of NGS-based projects, especially for new users. Results: Here we present an ‘A to Z’ protocol for obtaining complete human mitochondrial (mtDNA) genomes – from DNA extraction to consensus sequence. Although designed for use on humans, this protocol could also be used to sequence small, organellar genomes from other species, and also nuclear loci. This protocol includes DNA extraction, PCR amplification, fragmentation of PCR products, barcoding of fragments, sequencing using the 454 GS FLX platform, and a complete bioinformatics pipeline (primer removal, reference-based mapping, output of coverage plots and SNP calling). Conclusions: All steps in this protocol are designed to be straightforward to implement, especially for researchers who are undertaking next-generation sequencing for the first time. The molecular steps are scalable to large numbers (hundreds) of individuals and all steps post-DNA extraction can be carried out in 96-well plate format. Also, the protocol has been assembled so that individual ‘modules’ can be swapped out to suit available resources. Keywords: Human, Mitochondrial DNA, Next-generation sequencing, 454 sequencing, Long-range PCR, Bioinformatics Background Next-generation DNA sequencing (NGS) technologies have made huge impacts in many fields of biological research, but especially in evolutionary biology [1,2]. Concurrent with the increased use of NGS technologies has been an improved understanding of the amount and type of data required to answer certain types of evolutionary and population genetics questions. For example, where mitochondrial DNA (mtDNA) data are required, it is seen as increasingly necessary to obtain complete mito- chondrial genomes. This is especially true in studies of humans, but for other animal species also [3]. The use of complete mtDNA genomes can help mitigate the reduced phylogenetic resolution, homoplasy and ascertainment bias that is otherwise encountered when using markers for known single nucleotide polymorphisms (SNPs) or shorter mtDNA sequences (e.g., control region) [4,5]. For human populations that are poorly studied, complete mtDNA genomes are even more important because there are often few known SNPs and, therefore, the relevant regions of the mitochondrial phylogenetic tree may be poorly resolved. In addition to evolutionary applications, complete mtDNA genomes are also being sequenced to identify * Correspondence: [email protected]; [email protected]; 1 Department of Anatomy, University of Otago, Dunedin, New Zealand 2 Allan Wilson Centre for Molecular Ecology and Evolution, Dunedin, New Zealand Full list of author information is available at the end of the article © 2014 Clarke et al.; licensee BioMed Central Ltd. This is an Open Access article distributed under the terms of the Creative Commons Attribution License (http://creativecommons.org/licenses/by/2.0), which permits unrestricted use, distribution, and reproduction in any medium, provided the original work is properly cited. The Creative Commons Public Domain Dedication waiver (http://creativecommons.org/publicdomain/zero/1.0/) applies to the data made available in this article, unless otherwise stated. Clarke et al. BMC Genomics 2014, 15:68 http://www.biomedcentral.com/1471-2164/15/68

Welcome message from author
This document is posted to help you gain knowledge. Please leave a comment to let me know what you think about it! Share it to your friends and learn new things together.
Transcript
Clarke et al. BMC Genomics 2014, 15:68http://www.biomedcentral.com/1471-2164/15/68
METHODOLOGY ARTICLE Open Access
From cheek swabs to consensus sequences:an A to Z protocol for high-throughput DNAsequencing of complete human mitochondrialgenomesAndrew C Clarke1,2,3*, Stefan Prost1,2,4*, Jo-Ann L Stanton1, W Timothy J White5, Matthew E Kaplan6,Elizabeth A Matisoo-Smith1,2 and The Genographic Consortium
Abstract
Background: Next-generation DNA sequencing (NGS) technologies have made huge impacts in many fieldsof biological research, but especially in evolutionary biology. One area where NGS has shown potential is forhigh-throughput sequencing of complete mtDNA genomes (of humans and other animals). Despite the increasinguse of NGS technologies and a better appreciation of their importance in answering biological questions, there remainsignificant obstacles to the successful implementation of NGS-based projects, especially for new users.
Results: Here we present an ‘A to Z’ protocol for obtaining complete human mitochondrial (mtDNA) genomes – fromDNA extraction to consensus sequence. Although designed for use on humans, this protocol could also be used tosequence small, organellar genomes from other species, and also nuclear loci. This protocol includes DNA extraction,PCR amplification, fragmentation of PCR products, barcoding of fragments, sequencing using the 454 GS FLX platform,and a complete bioinformatics pipeline (primer removal, reference-based mapping, output of coverage plots andSNP calling).
Conclusions: All steps in this protocol are designed to be straightforward to implement, especially for researcherswho are undertaking next-generation sequencing for the first time. The molecular steps are scalable to large numbers(hundreds) of individuals and all steps post-DNA extraction can be carried out in 96-well plate format. Also, the protocolhas been assembled so that individual ‘modules’ can be swapped out to suit available resources.
Keywords: Human, Mitochondrial DNA, Next-generation sequencing, 454 sequencing, Long-range PCR, Bioinformatics
BackgroundNext-generation DNA sequencing (NGS) technologies havemade huge impacts in many fields of biological research,but especially in evolutionary biology [1,2]. Concurrentwith the increased use of NGS technologies has beenan improved understanding of the amount and type ofdata required to answer certain types of evolutionaryand population genetics questions. For example, wheremitochondrial DNA (mtDNA) data are required, it is
* Correspondence: [email protected]; [email protected];1Department of Anatomy, University of Otago, Dunedin, New Zealand2Allan Wilson Centre for Molecular Ecology and Evolution, Dunedin,New ZealandFull list of author information is available at the end of the article
© 2014 Clarke et al.; licensee BioMed Central LCommons Attribution License (http://creativecreproduction in any medium, provided the orwaiver (http://creativecommons.org/publicdomstated.
seen as increasingly necessary to obtain complete mito-chondrial genomes. This is especially true in studies ofhumans, but for other animal species also [3]. The use ofcomplete mtDNA genomes can help mitigate the reducedphylogenetic resolution, homoplasy and ascertainmentbias that is otherwise encountered when using markers forknown single nucleotide polymorphisms (SNPs) or shortermtDNA sequences (e.g., control region) [4,5]. For humanpopulations that are poorly studied, complete mtDNAgenomes are even more important because there are oftenfew known SNPs and, therefore, the relevant regions of themitochondrial phylogenetic tree may be poorly resolved.In addition to evolutionary applications, complete
mtDNA genomes are also being sequenced to identify
td. This is an Open Access article distributed under the terms of the Creativeommons.org/licenses/by/2.0), which permits unrestricted use, distribution, andiginal work is properly cited. The Creative Commons Public Domain Dedicationain/zero/1.0/) applies to the data made available in this article, unless otherwise
Clarke et al. BMC Genomics 2014, 15:68 Page 2 of 12http://www.biomedcentral.com/1471-2164/15/68
markers associated with mitochondrial disease, and theadvent of NGS has seen the significant expansion ofresearch in this area [6]. For example, NGS of mtDNAgenomes is being used to clinically diagnose mitochon-drial diseases in individuals with phenotypic evidenceof mitochondrial oxidative phosphorylation disease [7].The high sensitivity of NGS means it is also being used todiscover diseases associated with low-level mitochondrialheteroplasmy that would be undetectable with conven-tional Sanger sequencing [8].Despite the increasing use of NGS technologies and
a better appreciation of their importance, there remainsignificant obstacles to the successful implementationof NGS-based projects. These challenges often relateto assembling the constituent components of a NGSsequencing protocol into a single workflow to suit a givenstudy. NGS workflows are often complex, and necessarilyspan everything from the generation of suitable startingtemplate, to various molecular biological steps, to thegeneration of the raw sequence data, and finally tothe bioinformatic steps required to convert those datainto a suitable format for downstream phylogenetic orpopulation genetic analyses. New problems can arisewhen scaling up a protocol for use on tens or hundredsof individuals; protocols need to be robust and remaintime efficient. The bioinformatics steps offer their ownchallenges because although many of the individualcomponents/programs are available (e.g., for primerremoval, mapping/assembly, and SNP calling) it is oftendifficult to get the outputs from one component into aformat where they can be used as inputs for othercomponents. Taken together, the challenges in assemblinga complete NGS protocol represent a major source ofinertia for researchers wanting to undertake NGS studiesfor the first time.Here we present an ‘A to Z’ protocol for obtaining
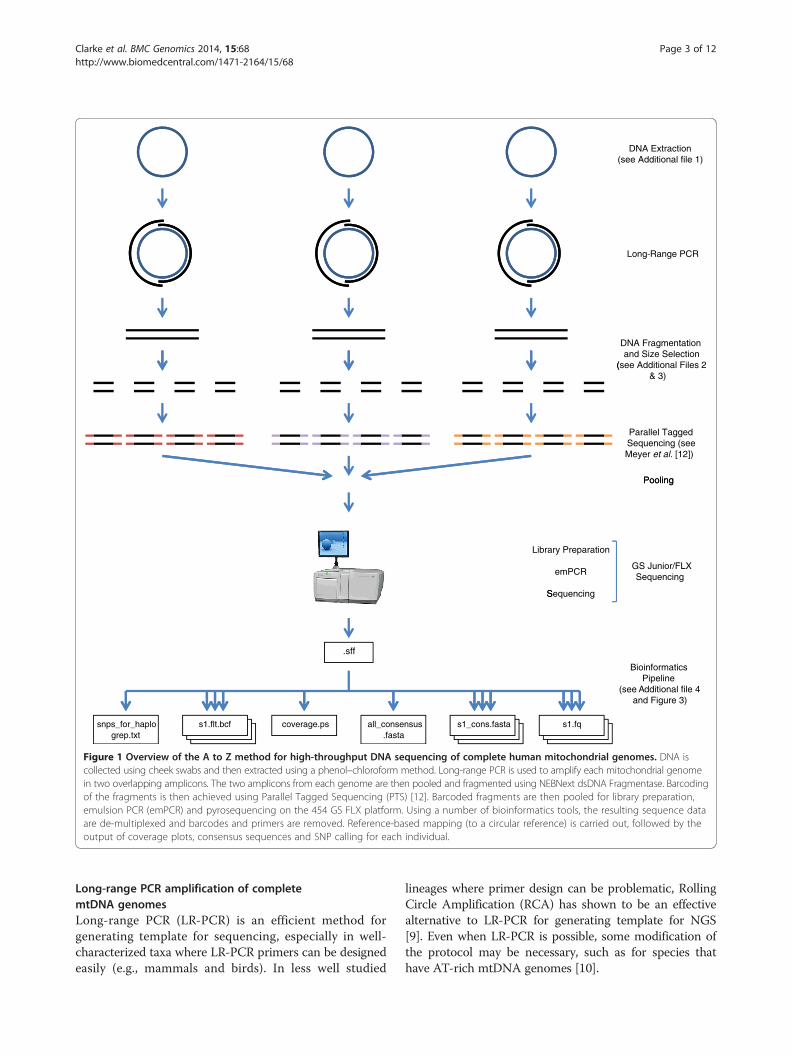
complete human mitochondrial (mtDNA) genomes –from DNA extraction to consensus sequence. Althoughdesigned for use on humans, this protocol could also –with minor modifications – be used to sequence small,organellar genomes from other species, and also nuclearloci. An overview of the A to Z method is presentedin Figure 1.All steps in this protocol are designed to be straight-
forward to implement; although the particular combinationof steps is novel, the reagents and recommended equip-ment are widely available, and the bioinformatics is easilyperformed by non-experts (and can be modified wherenecessary). The molecular steps are scalable to largenumbers (hundreds) of individuals and all steps post-DNAextraction can be carried out in 96-well plate format(throughput is often a limitation in other protocols).Also, the protocol has been assembled so that individual‘modules’ can be swapped out to suit different scientific
questions, facilities, skill sets and budgets. Some of thesealternatives are described in the protocol.It should be noted that the protocol here is largely
kit-based, with speed, efficiency and throughput themain priorities. Labs with limited consumables budgetsmay wish to investigate non-kit-based alternatives forsome of the more expensive steps. Non-kit-basedmethods may, however, decrease reliability and in-crease labour costs through additional time spent pre-paring reagents, etc. The decision of whether to use akit or a non-kit alternative may also depend on accessto the equipment required in either case, and equip-ment requirements should be thoroughly investigatedbeforehand.Both consumables and labour costs vary dramatically
across countries, and therefore we have not includeda cost analysis for this protocol because it would notbe broadly applicable. Instead, it is recommended thatresearchers create a budget before using this protocol,where the costs of consumables are balanced againstlabour costs, the technical expertise required for differentmethods, the number of samples to be processed and thedeadlines for the project.Although initial sample preparation is still largely carried
out by researchers ‘in-house’, it is increasingly common totake advantage of the significant cost savings associatedwith out-sourcing NGS to an external provider. As such,researchers using the early steps of the protocol may wishto investigate out-sourcing the wet lab stages from libraryprep onwards. The decision of whether or not to use anexternal sequencing provider should also form part ofthe project plan.
MethodsSample collection and DNA extractionDNA was collected from participants using a buccalswab. Two swabs were obtained for each participant(one for immediate use, and one as a back-up). Allsamples were obtained with informed consent (Univer-sity of Auckland Human Participants Ethics Committee(UAHPEC), Ref. 2008/203). DNA was extracted fromthe cheek swabs using a phenol–chloroform method(see Additional file 1 for the full extraction protocol).Briefly, DNA samples were digested overnight withproteinase K and then extracted with phenol, chloro-form and isoamyl alcohol. DNA was precipitated withisopropanol, washed with ethanol and eluted in LowTE (10 mM Tris (pH 8.0), 0.1 mM EDTA (pH 8.0)).DNA was visualised by running 5 μL aliquots of eachextraction on a 1% (w/v) agarose gel, and successfulDNA extractions were confirmed by the presence of aband of high molecular weight DNA. DNA sampleswere quantified using a PicoGreen quantification assay.
DNA Extraction(see Additional file 1)
DNA Fragmentationand Size Selection
((see Additional Files 2& 3)
Library Preparation
emPCR
SSequencing
.sff
snps_for_haplogrep.txt
s1.flt.bcf coverage.ps all_consensus.fasta
s1_cons.fasta s1.fq
Parallel TaggedSequencing (seeMeyer et al. [12])
PoolingPooling
GS Junior/FLXSequencing
BioinformaticsPipeline
(see Additional file 4and Figure 3)
Figure 1 Overview of the A to Z method for high-throughput DNA sequencing of complete human mitochondrial genomes. DNA iscollected using cheek swabs and then extracted using a phenol–chloroform method. Long-range PCR is used to amplify each mitochondrial genomein two overlapping amplicons. The two amplicons from each genome are then pooled and fragmented using NEBNext dsDNA Fragmentase. Barcodingof the fragments is then achieved using Parallel Tagged Sequencing (PTS) [12]. Barcoded fragments are then pooled for library preparation,emulsion PCR (emPCR) and pyrosequencing on the 454 GS FLX platform. Using a number of bioinformatics tools, the resulting sequence dataare de-multiplexed and barcodes and primers are removed. Reference-based mapping (to a circular reference) is carried out, followed by theoutput of coverage plots, consensus sequences and SNP calling for each individual.
Clarke et al. BMC Genomics 2014, 15:68 Page 3 of 12http://www.biomedcentral.com/1471-2164/15/68
Long-range PCR amplification of completemtDNA genomesLong-range PCR (LR-PCR) is an efficient method forgenerating template for sequencing, especially in well-characterized taxa where LR-PCR primers can be designedeasily (e.g., mammals and birds). In less well studied
lineages where primer design can be problematic, RollingCircle Amplification (RCA) has shown to be an effectivealternative to LR-PCR for generating template for NGS[9]. Even when LR-PCR is possible, some modification ofthe protocol may be necessary, such as for species thathave AT-rich mtDNA genomes [10].
Clarke et al. BMC Genomics 2014, 15:68 Page 4 of 12http://www.biomedcentral.com/1471-2164/15/68
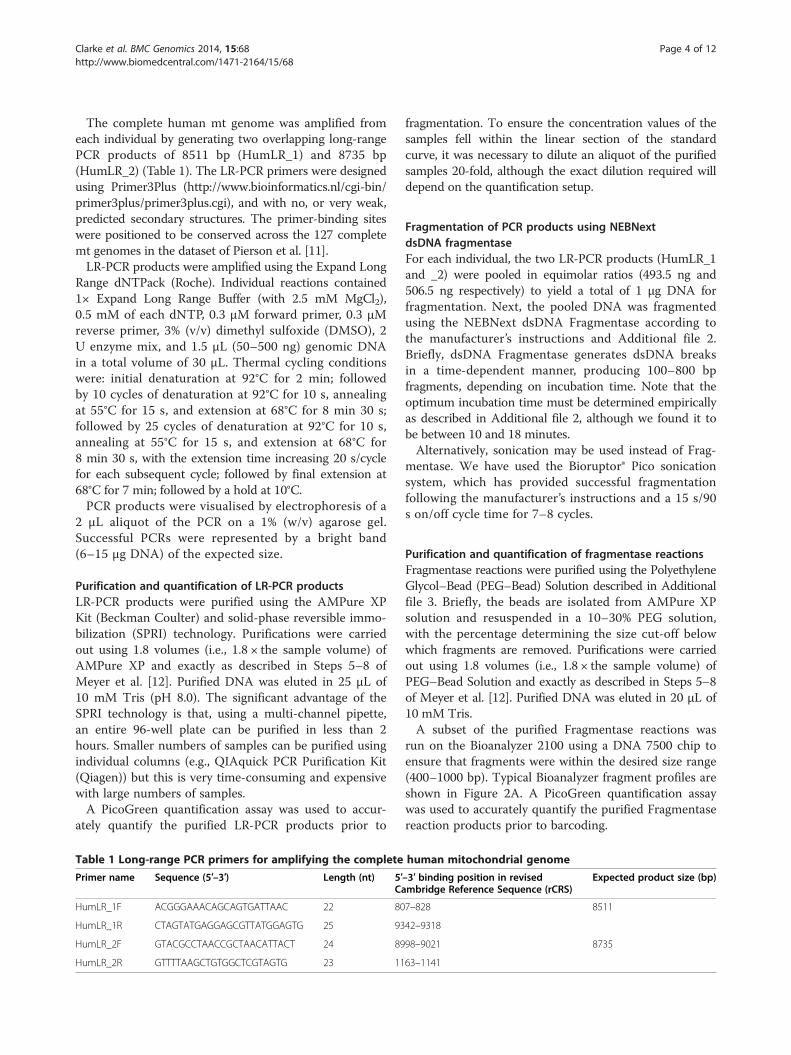
The complete human mt genome was amplified fromeach individual by generating two overlapping long-rangePCR products of 8511 bp (HumLR_1) and 8735 bp(HumLR_2) (Table 1). The LR-PCR primers were designedusing Primer3Plus (http://www.bioinformatics.nl/cgi-bin/primer3plus/primer3plus.cgi), and with no, or very weak,predicted secondary structures. The primer-binding siteswere positioned to be conserved across the 127 completemt genomes in the dataset of Pierson et al. [11].LR-PCR products were amplified using the Expand Long
Range dNTPack (Roche). Individual reactions contained1× Expand Long Range Buffer (with 2.5 mM MgCl2),0.5 mM of each dNTP, 0.3 μM forward primer, 0.3 μMreverse primer, 3% (v/v) dimethyl sulfoxide (DMSO), 2U enzyme mix, and 1.5 μL (50–500 ng) genomic DNAin a total volume of 30 μL. Thermal cycling conditionswere: initial denaturation at 92°C for 2 min; followedby 10 cycles of denaturation at 92°C for 10 s, annealingat 55°C for 15 s, and extension at 68°C for 8 min 30 s;followed by 25 cycles of denaturation at 92°C for 10 s,annealing at 55°C for 15 s, and extension at 68°C for8 min 30 s, with the extension time increasing 20 s/cyclefor each subsequent cycle; followed by final extension at68°C for 7 min; followed by a hold at 10°C.PCR products were visualised by electrophoresis of a
2 μL aliquot of the PCR on a 1% (w/v) agarose gel.Successful PCRs were represented by a bright band(6–15 μg DNA) of the expected size.
Purification and quantification of LR-PCR productsLR-PCR products were purified using the AMPure XPKit (Beckman Coulter) and solid-phase reversible immo-bilization (SPRI) technology. Purifications were carriedout using 1.8 volumes (i.e., 1.8 × the sample volume) ofAMPure XP and exactly as described in Steps 5–8 ofMeyer et al. [12]. Purified DNA was eluted in 25 μL of10 mM Tris (pH 8.0). The significant advantage of theSPRI technology is that, using a multi-channel pipette,an entire 96-well plate can be purified in less than 2hours. Smaller numbers of samples can be purified usingindividual columns (e.g., QIAquick PCR Purification Kit(Qiagen)) but this is very time-consuming and expensivewith large numbers of samples.A PicoGreen quantification assay was used to accur-
ately quantify the purified LR-PCR products prior to
Table 1 Long-range PCR primers for amplifying the complete
Primer name Sequence (5′–3′) Length (nt) 5′Ca
HumLR_1F ACGGGAAACAGCAGTGATTAAC 22 80
HumLR_1R CTAGTATGAGGAGCGTTATGGAGTG 25 93
HumLR_2F GTACGCCTAACCGCTAACATTACT 24 89
HumLR_2R GTTTTAAGCTGTGGCTCGTAGTG 23 11
fragmentation. To ensure the concentration values of thesamples fell within the linear section of the standardcurve, it was necessary to dilute an aliquot of the purifiedsamples 20-fold, although the exact dilution required willdepend on the quantification setup.
Fragmentation of PCR products using NEBNextdsDNA fragmentaseFor each individual, the two LR-PCR products (HumLR_1and _2) were pooled in equimolar ratios (493.5 ng and506.5 ng respectively) to yield a total of 1 μg DNA forfragmentation. Next, the pooled DNA was fragmentedusing the NEBNext dsDNA Fragmentase according tothe manufacturer’s instructions and Additional file 2.Briefly, dsDNA Fragmentase generates dsDNA breaksin a time-dependent manner, producing 100–800 bpfragments, depending on incubation time. Note that theoptimum incubation time must be determined empiricallyas described in Additional file 2, although we found it tobe between 10 and 18 minutes.Alternatively, sonication may be used instead of Frag-
mentase. We have used the Bioruptor® Pico sonicationsystem, which has provided successful fragmentationfollowing the manufacturer’s instructions and a 15 s/90s on/off cycle time for 7–8 cycles.
Purification and quantification of fragmentase reactionsFragmentase reactions were purified using the PolyethyleneGlycol–Bead (PEG–Bead) Solution described in Additionalfile 3. Briefly, the beads are isolated from AMPure XPsolution and resuspended in a 10–30% PEG solution,with the percentage determining the size cut-off belowwhich fragments are removed. Purifications were carriedout using 1.8 volumes (i.e., 1.8 × the sample volume) ofPEG–Bead Solution and exactly as described in Steps 5–8of Meyer et al. [12]. Purified DNA was eluted in 20 μL of10 mM Tris.A subset of the purified Fragmentase reactions was
run on the Bioanalyzer 2100 using a DNA 7500 chip toensure that fragments were within the desired size range(400–1000 bp). Typical Bioanalyzer fragment profiles areshown in Figure 2A. A PicoGreen quantification assaywas used to accurately quantify the purified Fragmentasereaction products prior to barcoding.
human mitochondrial genome
–3′ binding position in revisedmbridge Reference Sequence (rCRS)
Expected product size (bp)
7–828 8511
42–9318
98–9021 8735
63–1141
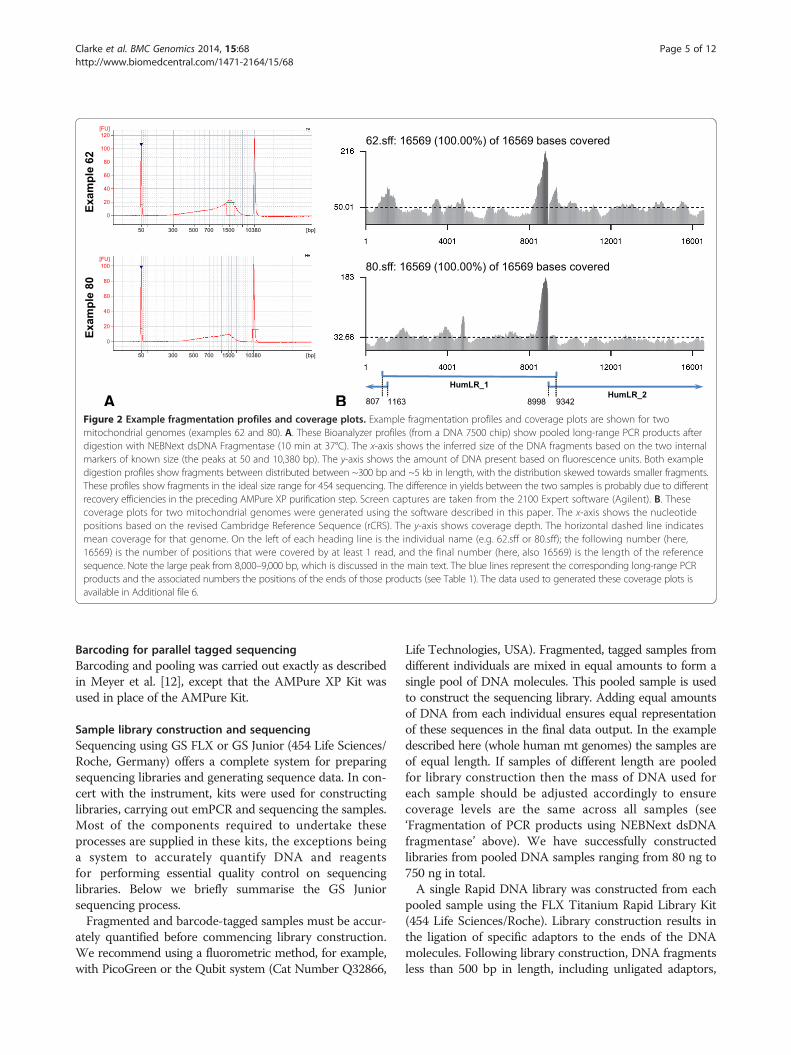
Figure 2 Example fragmentation profiles and coverage plots. Example fragmentation profiles and coverage plots are shown for twomitochondrial genomes (examples 62 and 80). A. These Bioanalyzer profiles (from a DNA 7500 chip) show pooled long-range PCR products afterdigestion with NEBNext dsDNA Fragmentase (10 min at 37°C). The x-axis shows the inferred size of the DNA fragments based on the two internalmarkers of known size (the peaks at 50 and 10,380 bp). The y-axis shows the amount of DNA present based on fluorescence units. Both exampledigestion profiles show fragments between distributed between ~300 bp and ~5 kb in length, with the distribution skewed towards smaller fragments.These profiles show fragments in the ideal size range for 454 sequencing. The difference in yields between the two samples is probably due to differentrecovery efficiencies in the preceding AMPure XP purification step. Screen captures are taken from the 2100 Expert software (Agilent). B. Thesecoverage plots for two mitochondrial genomes were generated using the software described in this paper. The x-axis shows the nucleotidepositions based on the revised Cambridge Reference Sequence (rCRS). The y-axis shows coverage depth. The horizontal dashed line indicatesmean coverage for that genome. On the left of each heading line is the individual name (e.g. 62.sff or 80.sff); the following number (here,16569) is the number of positions that were covered by at least 1 read, and the final number (here, also 16569) is the length of the referencesequence. Note the large peak from 8,000–9,000 bp, which is discussed in the main text. The blue lines represent the corresponding long-range PCRproducts and the associated numbers the positions of the ends of those products (see Table 1). The data used to generated these coverage plots isavailable in Additional file 6.
Clarke et al. BMC Genomics 2014, 15:68 Page 5 of 12http://www.biomedcentral.com/1471-2164/15/68
Barcoding for parallel tagged sequencingBarcoding and pooling was carried out exactly as describedin Meyer et al. [12], except that the AMPure XP Kit wasused in place of the AMPure Kit.
Sample library construction and sequencingSequencing using GS FLX or GS Junior (454 Life Sciences/Roche, Germany) offers a complete system for preparingsequencing libraries and generating sequence data. In con-cert with the instrument, kits were used for constructinglibraries, carrying out emPCR and sequencing the samples.Most of the components required to undertake theseprocesses are supplied in these kits, the exceptions beinga system to accurately quantify DNA and reagentsfor performing essential quality control on sequencinglibraries. Below we briefly summarise the GS Juniorsequencing process.Fragmented and barcode-tagged samples must be accur-
ately quantified before commencing library construction.We recommend using a fluorometric method, for example,with PicoGreen or the Qubit system (Cat Number Q32866,
Life Technologies, USA). Fragmented, tagged samples fromdifferent individuals are mixed in equal amounts to form asingle pool of DNA molecules. This pooled sample is usedto construct the sequencing library. Adding equal amountsof DNA from each individual ensures equal representationof these sequences in the final data output. In the exampledescribed here (whole human mt genomes) the samples areof equal length. If samples of different length are pooledfor library construction then the mass of DNA used foreach sample should be adjusted accordingly to ensurecoverage levels are the same across all samples (see‘Fragmentation of PCR products using NEBNext dsDNAfragmentase’ above). We have successfully constructedlibraries from pooled DNA samples ranging from 80 ng to750 ng in total.A single Rapid DNA library was constructed from each
pooled sample using the FLX Titanium Rapid Library Kit(454 Life Sciences/Roche). Library construction results inthe ligation of specific adaptors to the ends of the DNAmolecules. Following library construction, DNA fragmentsless than 500 bp in length, including unligated adaptors,
Clarke et al. BMC Genomics 2014, 15:68 Page 6 of 12http://www.biomedcentral.com/1471-2164/15/68
were removed from the sample using the AMPure XP Kit(Beckman Coulter). This was achieved by first isolatingthe DNA-bead mixture on a SPRIPlate and then discard-ing the derived buffer as per the manufacturer’s protocol.The AMPure XP beads were then washed in Size Solution(supplied with the Rapid Library Kit, 454 Life Sciences/Roche, Germany) to remove short DNA fragments andany buffer components from previous reactions. Twowashes using 70% (v/v) ethanol were then carried outaccording to the AMPure XP protocol. The bead pelletwas air-dried completely and the size-selected sequencinglibrary eluted by resuspending the pellet in 53 μL of TEbuffer (10 mM Tris (pH 8.0), 1 mM EDTA (ph 8.0)). Thesequencing library was transferred to a clean tube bydrawing down the beads with the magnet prior to transfer.Library quality was determined in two ways. First, one
of the sequencing adaptors is supplied pre-labelled withfluoroscein isothiocyanate (FITC), allowing a fluorescentplate reader to be used to determine the concentration ofthe library in molecules/μL (based on a standard curve).Standards are supplied with the GS FLX Titanium RapidLibrary Kit (454 Life Sciences/Roche). In our experience,these libraries yielded between 4.19 × 10⁸ and 5.5 × 10⁸
molecules/μL. Second, the size distribution of the sequen-cing library is determined from a 1 μL aliquot run ona High Sensitivity DNA Chip (Agilent Technologies)on the Bioanalyzer instrument (Agilent Technologies).Sequencing library DNA fragment size distribution shouldbe between 350 bp and 2000 bp with a peak distributionaround 700 bp. Libraries with fragment sizes significantlyoutside of this range should not be used; this indicates thatFragmentase reaction conditions should be reoptimisedfor DNA preparation.Preparation of the library for sequencing starts with
emulsion PCR (emPCR) [13], which was carried out usingthe GS Junior Titanium emPCR Kit (Lib-L) (454 LifeSciences/Roche). This process begins with binding a singleDNA molecule from the library to a single SequenceCapture Bead. The amount of DNA added is criticallyimportant: if too much DNA is added, the beads will bindmultiple DNA molecules resulting in mixed sequenceon each bead and as a result will be unreadable; if notenough DNA is added, the emPCR will not deliver enoughSequence Capture Beads for efficient sequencing. For thisproject, a ratio of two DNA molecules per bead was used.The volume of library to add to an aliquot of SequenceCapture Beads is calculated using the equation (1):
μL of library ¼ molecules per bead� 10 million beadslibrary concentration molecules=μLð Þ
ð1Þ
The steps from emulsion formation to biotin–strepta-vidin-enrichment were carried out according to the
manufacturer’s protocols. Following the enrichment process,approximately 500,000 Sequence Capture Beads shouldremain. Fewer than 500,000 Sequence Capture Beads willbe insufficient for a sequencing run. More than 1.5 millionbeads remaining after enrichment indicates that there aretoo many beads coated with multiple sequences. Thesebeads should not be used, as the sequences they holdcannot be resolved and they will be discarded from thefinal data set.Sequencing was performed using the GS Junior and a
PTP Kit and Sequencing Kit (454 Life Sciences/Roche,Germany). This method of pyrophosphate-based sequen-cing is described elsewhere [14,15]. Each run took 10hours to complete. Control beads seeded onto thePicoTiterPlate (PTP) at the time of loading indepen-dently indicated both the chemical and instrumentperformance of each sequencing run. The output fromthe sequencing run is a computer file (.sff ), containingquality scores and raw data for each sequence generatedfrom the run. Only those sequences that pass five qualityfilters are present in the final data set. This ensures onlyhigh quality sequence reads progress into the analysisphase of the project. The final output from the GS Juniortypically yielded between 60,000 and 100,000 qualitysequence reads with an average length of between 350and 450 bp.
Computational raw data processingIn the next step the raw sequencing data are processed foruse in downstream analysis (see Figure 3 for an overview).Here we present an easy-to-use bash-script-based pipelinethat allows the user to automatically process sequencingfiles for single or multiple individuals. The presentedpipeline runs on all UNIX-based operating systems. Thestep-by-step protocol is provided in Additional file 4 andthe associated scripts in Additional file 5. Additional file 6contains two example .sff files that can be used to performtest runs of the scripts. The presented pipeline consistsof freely available standard tools for read mappingand post-processing, such as BWA [16], SAMtools [17]and our own scripts, which complement these tools.All incorporated scripts run either on Python or Perl,which should be pre-installed on UNIX operating systems.It can be used to map and process sequencing readsfrom different data sources, such as evolutionary genetics,medical research or even short, damaged ancient DNAreads (see [18]).The presented pipeline first sorts individual reads ac-
cording to their barcodes (for multiplexed libraries), thenremoves PCR priming sites, performs reference-basedmapping and finally genotype and variant calling. Differentdata quality and quantity statistics are included. Thesesteps are discussed in more detail below.
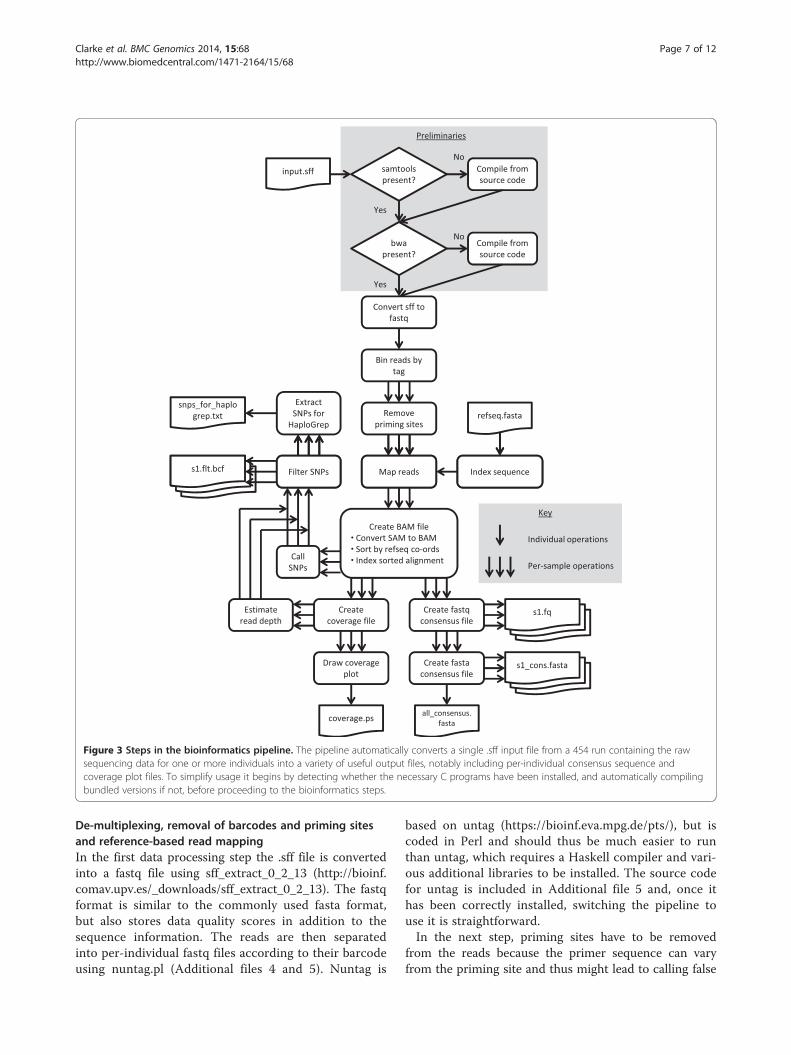
Figure 3 Steps in the bioinformatics pipeline. The pipeline automatically converts a single .sff input file from a 454 run containing the rawsequencing data for one or more individuals into a variety of useful output files, notably including per-individual consensus sequence andcoverage plot files. To simplify usage it begins by detecting whether the necessary C programs have been installed, and automatically compilingbundled versions if not, before proceeding to the bioinformatics steps.
Clarke et al. BMC Genomics 2014, 15:68 Page 7 of 12http://www.biomedcentral.com/1471-2164/15/68
De-multiplexing, removal of barcodes and priming sitesand reference-based read mappingIn the first data processing step the .sff file is convertedinto a fastq file using sff_extract_0_2_13 (http://bioinf.comav.upv.es/_downloads/sff_extract_0_2_13). The fastqformat is similar to the commonly used fasta format,but also stores data quality scores in addition to thesequence information. The reads are then separatedinto per-individual fastq files according to their barcodeusing nuntag.pl (Additional files 4 and 5). Nuntag is
based on untag (https://bioinf.eva.mpg.de/pts/), but iscoded in Perl and should thus be much easier to runthan untag, which requires a Haskell compiler and vari-ous additional libraries to be installed. The source codefor untag is included in Additional file 5 and, once ithas been correctly installed, switching the pipeline touse it is straightforward.In the next step, priming sites have to be removed
from the reads because the primer sequence can varyfrom the priming site and thus might lead to calling false
Clarke et al. BMC Genomics 2014, 15:68 Page 8 of 12http://www.biomedcentral.com/1471-2164/15/68
sequence variation. The tagcleaner software [19] (http://tagcleaner.sourceforge.net/) was used to remove thelong-range priming sites. This software tool looks forthe specific sequences within a specified distance to the5′ and the 3′ end of the reads. To account for mismatchesand partial primer sites present, the last five nucleotides ofthe respective primers were used. The trim_within regionswas specified as 26 for HumLR_1F and HumLR_1R and 25for HumLR_2F and HumLR_2R, respectively. Alternatively,the freely available software tool AdapterRemoval [20] canbe used.In the next step the cleaned reads are aligned using
reference-based mapping. To do so, the pipeline appliesthe Burrows–Wheeler Alignment Tool (BWA) with thebwasw algorithm, which uses heuristic Smith–Waterman-like alignment to find high-scoring local hits [16]. This ap-proach is very powerful when applied to long read datawith a high error rate, but can be slower and less accuratefor short low-error mappings [21]. The revised CambridgeReference Sequence (rCRS [22]) was used as a reference forthe mapping. Alternatively, other sequences can be used.For comparing called SNPs across datasets, the same ref-erence is required for each. In some cases, the rCRSmight differ substantially from the consensus sequenceof the processed reads. In this case a second mappingagainst a reference for the inferred haplotype mightlead to more reads being mapped.
Downstream variant and haplotype callingThe resulting sam file is then processed with the soft-ware SAMtools [17] to call the consensus sequenceand variants such as SNPs. It should be noted thatSAMtools 0.1.18 treats N’s in the reference as A’s whencalling the consensus. Furthermore, wherever a regionof the reference is covered by a single or multiple gapsin the reads, the program will call the nucleotide(s) ofthe reference instead of the gap. Thus, it is recommendedthat suspicious SNPs or regions in the original mappingare checked.In the following step, the filtered SNPs output from
bcftools (part of the SAMtools software package) aretransformed into an input file for the haplogroup-assign-ing tool HaploGrep (http://haplogrep.uibk.ac.at/) using aPerl script (see Additional file 4). The haplotypes can thenbe called online (or locally) using HaploGrep.It should be noted that the current setup does not allow
for calling of indels. Indels are insertions or deletions ofpoint mutations. In recent years indels in mitochondrialDNA and mitochondrial DNA analysis in general havegained wide interest in genetic medicine [23-25]. However,data produced on the 454 platform shows an increasedrate of false-positive SNPs [26-28], due to problems in call-ing the correct number of nucleotides in polynucleotidestretches because of signal-to-noise threshold issues.
This limitation might be overcome by deeper sequencing(higher coverage of the position in question). However,studies have shown that a higher coverage is not sufficientto overcome this effect if homopolymeric nucleotidestretches are longer than 10 nucleotides [26,29]. Studies inwhich indels are particularly important, such as on humandiseases [24,25], might need to adapt the approach bydeeper sequencing and allowing SAMtools to call indels(see online supplementary bioinformatics protocol) orby avoiding using 454 altogether. It is recommendedthat indels are called using technologies with low indelerror rates, such as Illumina.Heteroplasmy (the presence of more than one mito-
chondrial haplotype per cell) is a common phenomenonin human mitochondrial DNA. Thus, by default the pipe-line includes ambiguity codes in the consensus sequence.However, it should be noted that the downstream haplo-type assignment using HaploGrep does not supportheteroplasmic sites. Therefore, the major nucleotide hasto be determined by eye prior to using Haplogrep. Incases of heteroplasmic length polymorphisms a de novoapproach might be more appropriate than reference-basedmapping (see below).
Read qualityThe data quality of the mapped reads can be checkedusing the freely available software tool FastQC (http://www.bioinformatics.babraham.ac.uk/projects/fastqc/).FastQC can be used to infer sequence quality scores, GCcontent, read lengths distribution and to identify over-represented sequences. Base-calling algorithms, such asPyrobayes [27] for 454 data, produce per-base qualityscores by analysis of incorporation signals, so-called Phredscores [30,31]. A Phred score of 20, for example, meansthat there is a 1 in 100 chance that the read is incorrectlymapped [31]. The distribution of Phred scores can easily beassessed using FastQC. The software is further able toassess quality values such as read length, sequence GC con-tent, etc. If the read quality is low, reads can be trimmede.g. with the freely available software tool trimmomatic [32].
Coverage plotsCoverage plots showing the number of reads overlappingeach position in the reference genome are useful forquickly assessing mapping quality (see Figure 2B). Thepresented pipeline (Additional file 5 and online sup-plementary bioinformatics protocol: Additional file 4)automatically produces a coverage plot for each sample,which shows coverage level versus reference position asa greyscale bar graph and the average coverage level asa dashed line. Plots are broken across lines and pagesas necessary; the default scale factor fits up to 20,000nucleotides per row and 5 rows per page, which is con-venient for examining multiple mitochondrial genomes,
Clarke et al. BMC Genomics 2014, 15:68 Page 9 of 12http://www.biomedcentral.com/1471-2164/15/68
but these settings can be adjusted by the user. Theplots are in high-resolution (vector) PostScript formatand can be viewed or printed using the freely availableGhostView program (http://pages.cs.wisc.edu/~ghost/).A healthy coverage plot shows near-average coverageacross the genome.All coverage plots we have generated show a peak of
high coverage between 8,000–9,000 bp, which roughlycorresponds to the location of atp8. At the time of writing,we do not have an explanation for the high number ofreads at this location, but we have ruled out low GCcontent (which would cause the dsDNA Fragmentaseto cut more frequently) and it does not appear to beassociated with the end of the long-range fragments, asno equivalent peak appears near the overlap of HumLR_1and _2 between positions 807 and 1163. We have alsoruled out any artefacts associated with the bioinformaticspipeline. The consistent appearance of this peak acrossall individuals suggest that it is a product of the nucleo-tide order in this region (that, for example, may affectsecondary folding and ultimately the number of readsderived). This high coverage region has no effects onthe consensus sequence obtained.
Important considerations for alignment and assemblyA critical decision is the choice of the appropriate strategyfor alignment and assembly of the sequencing reads. Ingeneral, two approaches can be used to obtain a consensussequence or an assembly to call variants: “reference-basedmapping” and “de novo assembly”. If a high-quality refer-ence sequence is available, as in the case of the humanmitochondrial genome, the sequencing reads can bemapped against this reference. Reference-based mappinghas some advantages over de novo assembly. Since thereads are mapped against a reference, reads can beassembled even if regions in between are poorly or notat all covered (even without paired-end sequencing librar-ies). This allows consensus sequences to be generated evenin the presence of missing data. Furthermore, contamin-ation or sequencing artefacts are usually filtered becausethey are unlikely to align to the reference.Reference-based mapping is commonly used in human
genetic studies that are based upon mitochondrial genomes.A multitude of freely available software tools for reference-based mapping are available, including the commonlyused software tools BWA [16] and Bowtie 2 [33]. Availablemitochondrial genome sequences such as the revisedCambridge Reference Sequence (rCRS) can be used forthe mapping. However, due to the mapping algorithms,problems can occur in cases such as duplication or dele-tion of genomic regions. For example, a commonly foundmotif in mitochondrial genomes obtained from the Pacificregion is the deletion of a 9 bp (CCCCCTCTA) repetitivesequence, located between the cytochrome oxidase II
(COII) and lysine tRNA (tRNALys) genes. This motif iscommonly present in two copies in Europeans and onlyone in the Pacific or Asia [34]. Reference-based mappingof reads from an individual having only one copy against areference containing two copies (such as the rCRS) canlead to false consensus calling. This phenomenon is due tothe possibility of aligning this motif either to the first orthe second copy in the reference. If different reads arealigned to different copies, the consensus will call bothcopies (see Figure S1 in Additional file 4). This problemcan be overcome either by applying realignment tools(such as GATK [35]) or de novo assembly. UnfortunatelyGATK cannot handle 454 data and was thus not includedin the pipeline. For known deletion or insertion of repeats,the excessive copy in the reference can be substitutedby “-”, which allows for mapping of the same numberof or fewer copies.De novo assembly is a powerful approach to align
reads if no high-quality reference sequence or sequenceof a closely related taxon is present. Different free softwaretools are available to perform de novo assembly, such asVelvet [36], MIRA 3 [37] or Newbler (454 software; http://my454.com/products/analysis-software/index.asp). For adetailed review on available methods see [38,39]. De novoassembly is based upon the redundancy of short-readsequencing and the resulting possibility to find overlap-ping sequencing reads. This approach strongly benefitsfrom the availability of longer reads (such as from 454data) or the sheer number of data reads provided by next-generation sequencing platforms (such as the IlluminaHiSeq, etc.). The advantages of de novo assembly are thatit is independent of any reference sequence and that itcan be used to detect variants on a population level(see discussion of repetitive sequence mapping above).Disadvantages include substantially higher computationalrequirements and problems resolving contigs (sequencefragments inferred from clusters of overlapping reads) intothe correct linear order. Although not implemented inthe presented protocol, software tools such as MIRA 3[37] (http://sourceforge.net/projects/mira-assembler/) orthe standard 454 de novo assembler Newbler 2.5 (http://my454.com/products/analysis-software/index.asp) can alsobe easily implemented in the pipeline if desired.
Results and discussionDNA extractionDNA extractions typically yielded 1–50 μg of high mo-lecular weight total genomic DNA (that probably alsoincludes a large proportion of microbial DNA). ThisDNA was suitable for routinely amplifying long-rangePCR products (~9 kb). In addition, DNA extractedusing this method was found to be stable at 4°C for atleast 2 months, avoiding the need to repeatedly freeze–thaw the DNA samples.
Clarke et al. BMC Genomics 2014, 15:68 Page 10 of 12http://www.biomedcentral.com/1471-2164/15/68
Long-range PCR amplification of completemtDNA genomesThe long-range primers described in Table 1 have beenused to amplify mt genomes from phylogenetically diverseindividuals (including from haplogroups B, L3*, P, Q, H,W and T), but it is possible that mutations in the primer-binding sites for some haplogroups may interfere withamplification. In these cases, it might be necessary toredesign the primers for different primer-binding sites,or to include degenerate bases.The LR-PCR proved to be highly reliable, with > 95%
of individuals yielding both LR-PCR products on thefirst amplification attempt. When the PCR failed, it wasusually for both products of an individual, suggesting aproblem with the DNA, rather than with the PCR itself.In these cases, if a second PCR attempt also failed thenthat individual was re-extracted using the back-up buccalswab.The concentration of the undiluted purified LR-PCR
products was typically 200–500 ng/μL.
Fragmentation of PCR ProductsAlthough it is necessary to optimise the dsDNA Frag-mentase reactions for a given template, this proved to bean efficient method for fragmenting the long-range PCRproducts of a large number of individuals, and producedconsistent results. Although mechanical shearing orsonication methods (e.g., Covaris and Bioruptor) maybe suitable for small numbers of samples, enzymaticfragmentation allows higher throughput.
BioinformaticsThe presented pipeline is an easy-to-use Unix shell scriptthat runs a series of programs (such as TaqCleaner, BWA,SAMtools) to transform a set of raw-read input filesinto a variety of useful output files. In addition to applyingexisting freely available software tools, new scripts havealso been developed, e.g. to produce coverage plots, whichshow the number of reads overlapping each position inthe reference genome for easy quality assessment, and toconvert SAMtools output files into HaploGrep input filesfor convenient haplotype calling. The pipeline has beenset up to work for reads from the 454 sequencing plat-form (Roche), but it can easily be adjusted to be usedfor different platforms such as Illumina Miseq, Hiseqor IonTorrent (Life Technologies). Due to its modularorganization, it is straightforward to change different partsof the data processing. Recently, Wilm et al. [40] presentedLoFreq, a freely available variant calling tool (http://sourceforge.net/projects/lofreq/), that has similar precisionto SAMtools [17] but shows a higher sensitivity in callingrare variants. Alternative tools, such as LoFreq, can easilybe incorporated into the processing. Our pipeline canprocess reads for hundreds of sequences in a very short
amount of time (depending on the number of reads thisis typically only a few minutes on a desktop computerfor mtDNA data). The performance is strongly dependenton the different tools used in the processing. For detaileddiscussions on the performance for different steps suchas variant calling please see the publications for therespective tools.
ConclusionsHere we present a protocol for sequencing completehuman mitochondrial genomes. This protocol could, how-ever, be used to sequence mitochondrial genomes fromother species, and also nuclear loci of a similar length.Our aim is for this protocol to help researchers who arenew to next-generation sequencing make full use ofthis technology. The benefits of this protocol includethat it is straightforward to implement, and that themolecular steps are scalable to large numbers of individuals.The bioinformatics modules are designed to be reasonablyeasy to use for researchers new to command line-basedinputs. Conscious of the different questions, facilities,skill sets and budgets available across research groups,we have assembled the protocol so that individual‘modules’ can be changed to suit a particular project.
Additional files
Additional file 1: Phenol–chloroform DNA extraction protocol. PDFfile of the phenol–chloroform protocol for isolating human genomicDNA from buccal (cheek) swabs.
Additional file 2: Fragmentase digestion protocol. PDF file of theprotocol for fragmenting LR-PCR products with NEBNext® dsDNAFragmentase™.
Additional file 3: Size selection protocol. PDF file of the protocol forDNA size selection using AMPure XP-derived PEG–Bead solution.
Additional file 4: Bioinformatics pipeline. PDF file of thebioinformatics protocol.
Additional file 5: Bioinformatics pipeline. tar.gz file (compressed tararchive) of the bioinformatics scripts.
Additional file 6: Example .sff files. tar.gz file (compressed tar archive)of two example .sff files.
Competing interestsThe authors declare that they have no competing interests.
Authors’ contributionsACC developed the molecular biology protocols, drafted the manuscript andoversaw the integration of protocol components into a single workflow. SP andWTJW developed the bioinformatics protocols and drafted the manuscript. JALScarried out the library construction and sequencing, advised on the molecularbiology protocols and drafted the manuscript. MEK developed the DNAextraction protocol. EAMS contributed to the project design, provided overallguidance to the project and revised the manuscript. Members of theGenographic Consortium assisted with the project design and revised themanuscript. All authors read and approved the final manuscript.
AcknowledgementsFor technical assistance we thank Aaron Jeffs, Martin Kircher, Sebastian Lippold,Ross Marshall-Seeley and Christy Rand. The Genographic Project is funded byIBM, the Waitt Family Foundation and the National Geographic Society.
Clarke et al. BMC Genomics 2014, 15:68 Page 11 of 12http://www.biomedcentral.com/1471-2164/15/68
Genographic Consortium members: Syama Adhikarla1, Christina J. Adler2,Elena Balanovska3, Oleg Balanovsky3, Jaume Bertranpetit4, David Comas4,Alan Cooper2, Clio S. I. Der Sarkissian2, Matthew C. Dulik5, Jill B. Gaieski5,ArunKumar GaneshPrasad1, Wolfgang Haak2, Marc Haber4,6, Li Jin7, Shilin Li7,Begoña Martínez-Cruz4, Nirav C. Merchant8, R. John Mitchell9, Amanda C.Owings5, Laxmi Parida10, Ramasamy Pitchappan1, Daniel E. Platt10, LluisQuintana-Murci11, Colin Renfrew12, Daniela R. Lacerda13, Ajay K. Royyuru10,Fabrício R. Santos13, Theodore G. Schurr5, Himla Soodyall14, David F. SoriaHernanz15,4, Pandikumar Swamikrishnan16, Chris Tyler-Smith17, Arun VaratharajanSanthakumari1, Pedro Paulo Vieira18, Miguel G. Vilar5, Pierre A. Zalloua6, Janet S.Ziegle19, and R. Spencer Wells15.Addresses: 1Madurai Kamaraj University, Madurai, Tamil Nadu, India.2University of Adelaide, South Australia, Australia. 3Research Centre forMedical Genetics, Russian Academy of Medical Sciences, Moscow, Russia.4Universitat Pompeu Fabra, Barcelona, Spain. 5University of Pennsylvania,Philadelphia, Pennsylvania, United States. 6Lebanese American University,Chouran, Beirut, Lebanon. 7Fudan University, Shanghai, China. 8University ofArizona, Tucson, Arizona, United States. 9La Trobe University, Melbourne,Victoria, Australia. 10IBM, Yorktown Heights, New York, United States. 11InstitutPasteur, Paris, France. 12University of Cambridge, Cambridge, UnitedKingdom. 13Universidade Federal de Minas Gerais, Belo Horizonte, MinasGerais, Brazil. 14National Health Laboratory Service, Johannesburg, SouthAfrica. 15National Geographic Society, Washington, District of Columbia,United States. 16IBM, Somers, New York, United States. 17The Wellcome TrustSanger Institute, Hinxton, United Kingdom. 18Universidade Federal do Rio deJaneiro, Rio de Janeiro, Brazil. 19Applied Biosystems, Foster City, California,United States.
Author details1Department of Anatomy, University of Otago, Dunedin, New Zealand. 2AllanWilson Centre for Molecular Ecology and Evolution, Dunedin, New Zealand.3Current address: School of Life Sciences, University of Warwick, Coventry,United Kingdom. 4Department of Integrative Biology, University of California,Berkeley, California, USA. 5Department of Mathematics and Statistics,University of Otago, Dunedin, New Zealand. 6Human Origins GenotypingLaboratory, Arizona Research Laboratories, Division of Biotechnology,University of Arizona, Arizona, USA.
Received: 11 November 2013 Accepted: 17 January 2014Published: 25 January 2014
References1. Rokas A, Abbot P: Harnessing genomics for evolutionary insights.
Trends Ecol Evol 2009, 24:192–200.2. Metzker ML: Sequencing technologies – the next generation. Nat Rev
Genet 2010, 11:31–46.3. Schuster SC: Next-generation sequencing transforms today’s biology.
Nat Methods 2008, 5:16–18.4. Jex AR, Hall RS, Littlewood DTJ, Gasser RB: An integrated pipeline for
next-generation sequencing and annotation of mitochondrial genomes.Nucleic Acids Res 2010, 38:522–533.
5. Jex AR, Littlewood DTJ, Gasser RB: Toward next-generation sequencing ofmitochondrial genomes – focus on parasitic worms of animals andbiotechnological implications. Biotechnol Adv 2010, 28:151–159.
6. Vasta V, Ng SB, Turner EH, Shendure J, Houn Hahn S: Next generationsequence analysis for mitochondrial disorders. Genome Medicine 2009, 1:100.
7. Calvo SE, Compton AG, Hershman SG, Lim SC, Lieber DS, Tucker EJ,Laskowski A, Garone C, Liu ST, Jaffe DB, et al: Molecular diagnosis of infantilemitochondrial disease with targeted next-generation sequencing. Sci TranslMed 2012, 4:118ra10.
8. Zaragoza MV, Fass J, Diegoli M, Lin D, Arbustini E: Mitochondrial DNAvariant discovery and evaluation in human cardiomyopathies throughnext-generation sequencing. PLoS ONE 2010, 5:e12295.
9. Simison WB, Lindberg DR, Boore JL: Rolling circle amplification ofmetazoan mitochondrial genomes. Mol Phylogenet Evol 2006, 39:562–567.
10. Hu M, Jex AR, Campbell BE, Gasser RB: Long PCR amplification of theentire mitochondrial genome from individual helminths for directsequencing. Nat Protoc 2007, 2:2339–2344.
11. Pierson MJ, Martinez-Arias R, Holland BR, Gemmell NJ, Hurles ME, Penny D:Deciphering past human population movements in Oceania: provablyoptimal trees of 127 mtDNA genomes. Mol Biol Evol 2006, 23:1966–1975.
12. Meyer M, Stenzel U, Hofreiter M: Parallel tagged sequencing on the 454platform. Nat Protoc 2008, 3:267–278.
13. Nakano M, Komatsu J, Matsuura S, Takashima K, Katsura S, Mizuno A: Single-molecule PCR using water-in-oil emulsion. J Biotechnol 2003, 102:117–124.
14. Margulies M, Egholm M, Altman WE, Attiya S, Bader JS, Bemben LA, Berka J,Braverman MS, Chen Y-J, Chen Z, et al: Genome sequencing in microfabricatedhigh-density picolitre reactors. Nature 2005, 437:376–380.
15. Ronaghi M, Uhlén M, Nyrén P: A sequencing method based on real-timepyrophosphate. Science 1998, 281:363–365.
16. Li H, Durbin R: Fast and accurate short read alignment with Burrows–Wheelertransform. Bioinformatics 2009, 25:1754–1760.
17. Li H, Handsaker B, Wysoker A, Fennell T, Ruan J, Homer N, Marth G, Abecasis G,Durbin R, 1000 genome project data processing subgroup: The SequenceAlignment/Map format and SAMtools. Bioinformatics 2009, 25:2078–2079.
18. Knapp M, Horsburgh KA, Prost S, Stanton J-A, Buckley HR, Walter RK,Matisoo-Smith EA: Complete mitochondrial DNA genome sequences fromthe first New Zealanders. Proc Natl Acad Sci 2012, 109:18350–18354.
19. Schmieder R, Lim YW, Rohwer F, Edwards R: TagCleaner: identification andremoval of tag sequences from genomic and metagenomic datasets.BMC Bioinformatics 2010, 11:341.
20. Lindgreen S: AdapterRemoval: easy cleaning of next-generation sequencingreads. BMC Research Notes 2012, 5:337.
21. Li H, Durbin R: Fast and accurate long-read alignment withBurrows–Wheeler transform. Bioinformatics 2010, 26:589–595.
22. Andrews RM, Kubacka I, Chinnery PF, Lightowlers RN, Turnbull DM, Howell N:Reanalysis and revision of the Cambridge reference sequence for humanmitochondrial DNA. Nat Genet 1999, 23:147.
23. Bender A, Krishnan KJ, Morris CM, Taylor GA, Reeve AK, Perry RH, Jaros E,Hersheson JS, Betts J, Klopstock T, et al: High levels of mitochondrial DNAdeletions in substantia nigra neurons in aging and Parkinson disease.Nat Genet 2006, 38:515–517.
24. Pleasance ED, Cheetham RK, Stephens PJ, McBride DJ, Humphray SJ,Greenman CD, Varela I, Lin M-L, Ordóñez GR, Bignell GR, et al: A comprehensivecatalogue of somatic mutations from a human cancer genome. Nature 2010,463:191–196.
25. Taylor RW, Turnbull DM: Mitochondrial DNA mutations in human disease.Nat Rev Genet 2005, 6:389–402.
26. Kircher M, Kelso J: High throughput DNA sequencing – concepts andlimitations. Bioessays 2010, 32:524–536.
27. Quinlan AR, Stewart DA, Strömberg MP, Marth GT: Pyrobayes: an improvedbase caller for SNP discovery in pyrosequences. Nat Methods 2008,5:179–181.
28. Thomas RK, Nickerson E, Simons JF, Jänne PA, Tengs T, Yuza Y, Garraway LA,LaFramboise T, Lee JC, Shah K, et al: Sensitive mutation detection inheterogeneous cancer specimens by massively parallel picoliter reactorsequencing. Nat Med 2006, 12:852–855.
29. Green RE, Malaspinas A-S, Krause J, Briggs AW, Johnson PLF, Uhler C, Meyer M,Good JM, Maricic T, Stenzel U, et al: A complete Neandertal mitochondrialgenome sequence determined by high-throughput sequencing. Cell 2008,134:416–426.
30. Ewing B, Green P: Base-calling of automated sequencer traces usingPhred. II. Error probabilities. Genome Res 1998, 8:186–194.
31. Nielsen R, Paul JS, Albrechtsen A, Song YS: Genotype and SNP calling fromnext-generation sequencing data. Nat Rev Genet 2011, 12:443–451.
32. Bolger A, Giorgi F: Trimmomatic: A Flexible Read Trimming Tool forIllumina NGS Data. http://www.usadellab.org/cms/index.php.
33. Langmead B, Salzberg SL: Fast gapped-read alignment with Bowtie 2.Nat Methods 2012, 9:357–359.
34. Thomas MG, Cook CE, Miller KWP, Warin MJ, Hagelberg E: Molecularinstability in the COII–tRNALys intergenic region of the humanmitochondrial genome: multiple origins of the 9-bp deletion andheteroplasmy for expanded repeats. Philosophical Transactions of the RoyalSociety B: Biological Sciences 1998, 353:955–965.
35. McKenna A, Hanna M, Banks E, Sivachenko A, Cibulskis K, Kernytsky A,Garimella K, Altshuler D, Gabriel S, Daly M, et al: The Genome AnalysisToolkit: a MapReduce framework for analyzing next-generation DNAsequencing data. Genome Res 2010, 20:1297–1303.
36. Zerbino DR, Birney E: Velvet: algorithms for de novo short read assemblyusing de Bruijn graphs. Genome Res 2008, 18:821–829.
37. Chevreux BWT, Suhai S: Genome sequence assembly using trace signalsand additional sequence information. In Computer Science and Biology:
Clarke et al. BMC Genomics 2014, 15:68 Page 12 of 12http://www.biomedcentral.com/1471-2164/15/68
Proceedings of the German Conference on Bioinformatics (GCB). Berlin:Springer; 1999:45–56.
38. Miller JR, Koren S, Sutton G: Assembly algorithms for next-generationsequencing data. Genomics 2010, 95:315–327.
39. Scheibye-Alsing K, Hoffmann S, Frankel A, Jensen P, Stadler PF, Mang Y,Tommerup N, Gilchrist MJ, Nygård A-B, Cirera S, et al: Sequence assembly.Comput Biol Chem 2009, 33:121–136.
40. Wilm A, Aw PPK, Bertrand D, Yeo GHT, Ong SH, Wong CH, Khor CC, Petric R,Hibberd ML, Nagarajan N: LoFreq: a sequence-quality aware, ultra-sensitivevariant caller for uncovering cell-population heterogeneity from high-throughput sequencing datasets. Nucleic Acids Res 2012, 40:11189–11201.
doi:10.1186/1471-2164-15-68Cite this article as: Clarke et al.: From cheek swabs to consensussequences: an A to Z protocol for high-throughput DNA sequencing ofcomplete human mitochondrial genomes. BMC Genomics 2014 15:68.
Submit your next manuscript to BioMed Centraland take full advantage of:
• Convenient online submission
• Thorough peer review
• No space constraints or color figure charges
• Immediate publication on acceptance
• Inclusion in PubMed, CAS, Scopus and Google Scholar
• Research which is freely available for redistribution
Submit your manuscript at www.biomedcentral.com/submit
Related Documents