Friction Stir Processed AA5182-O and AA6111-T4 Aluminum Alloys. Part 1: Electron Backscattered Diffraction Analysis Sumit Agarwal, Clyde L. Briant, Louis G. Hector Jr., and Yen-Lung Chen (Submitted January 9, 2007; in revised form March 9, 2007) The present article is the first part in a two-part series in which crystallographic texture developed during friction stir processing of AA5182-O and AA6111-T4 is characterized and its impact on tensile properties explored. For the texture measurements, coupons were cut from the friction stir processed zone at selected orientations relative to the direction of tool translation. Texture was characterized with electron backscatter diffraction (EBSD) in a scanning electron microscope. Measurements were made at key positions along the coupon surfaces and texture differences between the two friction stir processed Al alloys are discussed in detail. Grain size variations were also measured in both the base and friction stir processed materials and subsequently compared. In part 2, a state-of-art digital image correlation technique is used to investigate tensile properties of both friction stir processed Al alloys. The impact of crystallographic texture on mechanical properties is also explored in this latter part. Keywords aluminum alloys AA5182-O AA6111-T4, electron backscattered diffraction, friction stir processing 1. Introduction The reduced weight and high strength-to-weight ratio of Al alloys makes them desirable alternatives to ferrous materials in specific automotive applications. However, some significant challenges remain in the large-scale implementation of Al alloys in the automotive industry. One of these pertains to the selection of joining methodologies and how these methodol- ogies impact the mechanical integrity of Al structures. Another and perhaps more daunting issue is the joining of dissimilar materials such as Al and steel, and Al and Mg. Friction stir welding is a relatively new solid-state joining process in which a rotating tool is plunged into and then translated across the joint line between two metal sheets (Ref 1). Friction between the rotating tool (which consists of a threaded pin surrounded by a shoulder region) and the surface, produces temperatures which are in upwards of 80% of the melting point of the metal. A plastically worked zone is generated around the tool due to subsequent material soften- ing leading to transference of joined material from the leading to the trailing edge of the tool. Characteristic ‘‘bands’’ appear in the wake of the tool after each complete rotation; these bands are evident on the surface of the weld track. The resulting complex flow patterns have been the subject of ongoing research (Ref 2, 3) since these are related to joint properties. Schneider and Nunes (Ref 3) identified three key zones in a friction stir processed material. The first zone inwards from the base material is the heat affected zone (HAZ), wherein significant hardness gradients are found. The next zone is the thermomechanical zone (TMAZ) in which thermomechanical deformation is prevalent. The third zone is the stir zone (SZ) which contains dynamically recrystallized grains and has a characteristic weld nugget geometry that is similar to the joints produced with more conventional processes. Friction stir welding is advantageous in that it does not involve any melting, does not require filler materials, and does not produce fumes, weld spatter, or arc glare (Ref 4). Although commonly applied to join Al, friction stir welding has been used to join copper, lead, and Mg alloys which are otherwise difficult to join with conventional fusion welding techniques. In fact, friction stir welded Al materials display several advantages over fusion welded Al alloys. These advantages include improved weld strength, and the elimination of porosity and solidification cracking (Ref 5). Mazda announced in late 2005 that friction stir welding had been successfully applied to join an Al alloy to galvanized sheet steel in a component of the 2006 MX-5 sports car (Ref 6). Crystallographic texture often contributes to anisotropic mechanical properties. An important technique for texture characterization in metals is electron backscattered diffraction (EBSD) (the EBSD technique is described in detail in Schwartz et al. (Ref 7). While the EBSD technique has been widely used to investigate texture in Al alloys, it has only recently been used to investigate texture in Al welds. Most of the texture studies relative to Al weld materials have focused on friction stir welds (Ref 3, 5, 8) and these studies have reported heterogeneous This article was presented at Materials Science & Technology 2006, Innovations in Metal Forming symposium held in Cincinnati, OH, October 15-19, 2006. Sumit Agarwal, Applied Materials, Inc, 21515 N.W. Evergreen Parkway, Hillsboro, OR 97124; Clyde L. Briant, Brown University, Providence, RI 02912; Louis G. Hector Jr., and Yen-Lung Chen, General Motors Research and Development Center, 30500 Mound Road, Warren, MI 48090. Contact e-mail: [email protected]. JMEPEG (2007) 16:391–403 ÓASM International DOI: 10.1007/s11665-007-9064-9 1059-9495/$19.00 Journal of Materials Engineering and Performance Volume 16(4) August 2007—391

Welcome message from author
This document is posted to help you gain knowledge. Please leave a comment to let me know what you think about it! Share it to your friends and learn new things together.
Transcript

Friction Stir Processed AA5182-O and AA6111-T4Aluminum Alloys. Part 1: Electron Backscattered
Diffraction AnalysisSumit Agarwal, Clyde L. Briant, Louis G. Hector Jr., and Yen-Lung Chen
(Submitted January 9, 2007; in revised form March 9, 2007)
The present article is the first part in a two-part series in which crystallographic texture developed duringfriction stir processing of AA5182-O and AA6111-T4 is characterized and its impact on tensile propertiesexplored. For the texture measurements, coupons were cut from the friction stir processed zone at selectedorientations relative to the direction of tool translation. Texture was characterized with electron backscatterdiffraction (EBSD) in a scanning electron microscope. Measurements were made at key positions along thecoupon surfaces and texture differences between the two friction stir processed Al alloys are discussed indetail. Grain size variations were also measured in both the base and friction stir processed materials andsubsequently compared. In part 2, a state-of-art digital image correlation technique is used to investigatetensile properties of both friction stir processed Al alloys. The impact of crystallographic texture onmechanical properties is also explored in this latter part.
Keywords aluminum alloys AA5182-O AA6111-T4, electronbackscattered diffraction, friction stir processing
1. Introduction
The reduced weight and high strength-to-weight ratio of Alalloys makes them desirable alternatives to ferrous materials inspecific automotive applications. However, some significantchallenges remain in the large-scale implementation of Alalloys in the automotive industry. One of these pertains to theselection of joining methodologies and how these methodol-ogies impact the mechanical integrity of Al structures. Anotherand perhaps more daunting issue is the joining of dissimilarmaterials such as Al and steel, and Al and Mg.
Friction stir welding is a relatively new solid-state joiningprocess in which a rotating tool is plunged into and thentranslated across the joint line between two metal sheets (Ref1). Friction between the rotating tool (which consists of athreaded pin surrounded by a shoulder region) and thesurface, produces temperatures which are in upwards of 80%of the melting point of the metal. A plastically worked zone isgenerated around the tool due to subsequent material soften-ing leading to transference of joined material from the leadingto the trailing edge of the tool. Characteristic ‘‘bands’’ appear
in the wake of the tool after each complete rotation; thesebands are evident on the surface of the weld track. Theresulting complex flow patterns have been the subject ofongoing research (Ref 2, 3) since these are related to jointproperties. Schneider and Nunes (Ref 3) identified three keyzones in a friction stir processed material. The first zoneinwards from the base material is the heat affected zone(HAZ), wherein significant hardness gradients are found. Thenext zone is the thermomechanical zone (TMAZ) in whichthermomechanical deformation is prevalent. The third zone isthe stir zone (SZ) which contains dynamically recrystallizedgrains and has a characteristic weld nugget geometry that issimilar to the joints produced with more conventionalprocesses.
Friction stir welding is advantageous in that it does notinvolve any melting, does not require filler materials, and doesnot produce fumes, weld spatter, or arc glare (Ref 4). Althoughcommonly applied to join Al, friction stir welding has beenused to join copper, lead, and Mg alloys which are otherwisedifficult to join with conventional fusion welding techniques. Infact, friction stir welded Al materials display several advantagesover fusion welded Al alloys. These advantages includeimproved weld strength, and the elimination of porosity andsolidification cracking (Ref 5). Mazda announced in late 2005that friction stir welding had been successfully applied to joinan Al alloy to galvanized sheet steel in a component of the 2006MX-5 sports car (Ref 6).
Crystallographic texture often contributes to anisotropicmechanical properties. An important technique for texturecharacterization in metals is electron backscattered diffraction(EBSD) (the EBSD technique is described in detail in Schwartzet al. (Ref 7). While the EBSD technique has been widely usedto investigate texture in Al alloys, it has only recently been usedto investigate texture in Al welds. Most of the texture studiesrelative to Al weld materials have focused on friction stir welds(Ref 3, 5, 8) and these studies have reported heterogeneous
This article was presented at Materials Science & Technology 2006,Innovations in Metal Forming symposium held in Cincinnati, OH,October 15-19, 2006.
Sumit Agarwal, Applied Materials, Inc, 21515 N.W. EvergreenParkway, Hillsboro, OR 97124; Clyde L. Briant, Brown University,Providence, RI 02912; Louis G. Hector Jr., and Yen-Lung Chen,General Motors Research and Development Center, 30500 MoundRoad, Warren, MI 48090. Contact e-mail: [email protected].
JMEPEG (2007) 16:391–403 �ASM InternationalDOI: 10.1007/s11665-007-9064-9 1059-9495/$19.00
Journal of Materials Engineering and Performance Volume 16(4) August 2007—391
texture variations. For example, Sato et al. (Ref 9) found thatthe weld center in AA6063 contains a recrystallized grainstructure with a shear texture component containing both {110}Æ001æ and {114} Æ221æ orientations. In their studies of texture infriction stir welded AA1100 and AA6061, Field et al. (Ref 5)concluded that severe gradients in crystallographic texture arefound in the welds and generally one or more ideal fcc sheartextures predominates. Using EBSD, Jin et al. (Ref 10) found adynamically recrystallized fine grain structure in the weld zonesof AA5754 and AA5182 joints. At present, the extent to whichcrystallographic texture impacts tensile properties of frictionstir processed Al alloys is largely unknown.
In the present article, we investigate the texture of frictionstir processed AA5182-O and AA6111-T4 alloys, which arecommon automotive materials, using EBSD. Variations intexture, as suggested by other reports (Ref 3, 5), are charac-terized in detail from coupons cut from single stir processedtracks on sheets of both materials (no joint materials areconsidered). In addition, variations in grain size and micro-structure are also analyzed and compared with the correspond-ing base material alloys. This is the first part in a two-part serieson crystallographic texture and mechanical property character-ization of friction stir processed Al alloys. In Part 2, a state-of-art digital image correlation technique is used to investigatetensile properties of both friction stir processed Al alloys. Sincethere is a dearth of information linking texture and mechanicalproperties of friction stir processing materials, the impact ofcrystallographic texture on tensile properties is also explored inthis latter part in order to tie up results from both parts.
The remainder of this article is organized as follows. InSection 2, we summarize salient experimental details. InSection 3, results from EBSD analysis of specific regionswithin the friction stir processed zones of each alloy arepresented. Additional discussion of the results is provided inSection 4, and concluding remarks are presented in Section 5.
2. Experimental
2.1 Friction Stir Processing Parameters
A schematic of the friction stir processing technique isshown in Fig. 1. The friction stir tool is plunged into the sheetmaterial with the profiled pin penetrating to a depth of greater
than 50% of the sheet thickness. Frictional heating plasticizesmaterial beneath the tool and the profiled pin, which isthreaded, ‘‘stirs’’ this plasticized material from the front to theback of the sheet/tool conjunction. Rotational and translationalspeeds were held constant at 1800 rpm and 8 mm/s, respec-tively, giving a pitch of 268 lm. The pitch is the centerlinedistance between overlapping bands shed in the wake of thetool following one complete rotation. Loads were maintained at3.23 kN for AA5182-O and 3.5 kN for AA6111-T4. The toolwas H-13 tool steel with a shoulder diameter of 10 mm and wastranslated along the rolling direction of each sheet. Thethreaded pin was 1.6 mm in length. Single friction stirprocessed tracks with a 10 mm width were generated in eachsheet.
2.2 Aluminum Alloys
The sheet materials examined in this work were AA5182-O(2.0 mm thickness) and AA6111-T4 (2.6 mm thickness). TheAA5182-O alloy is a solid solution strengthened material that iscommonly used for automotive structural components.AA6111-T4 is a solution treated and naturally aged alloy thatis often employed for automotive body panels due to itsrelatively high strength and good dent resistance. Typicalchemical compositions and thermophysical properties of thesealloys are listed in Table 1 and 2 and published tensileproperties at ambient temperature are listed in Table 3 (Ref 11).
The microstructure of the material in the advancing side(where the translational and rotational motions of the tool are inthe same direction) is typically found to be different from thatin the retreating side where the translational and rotationalmotions of the tool are in opposite directions. Figure 2(a) is across-section of a AA5182-O friction stir processed zone. The
Fig. 1 Schematic of the friction stir processing technique
Table 3 Available mechanical properties of materialsused in this study. Data taken from (Ref 11)
Alloy Yield strength, MPaUltimate strength, MPaElongation, %
6111-T4165 285 255182-O 130 275 21
Table 2 Thermophysical properties of aluminum. Datataken from (Ref 11)
Alloy AA5182-O AA6111-T4
Liquidus temperature, �C 638 652Coherency temperature, �C 617 629Solidus temperature, �C 577 582Thermal conductivity, W/mm K 0.126 0.167Volumetric heat capacity, Ws/mm3 K 0.0027 0.0027
Table 1 Typical chemical compositions (wt.%) of alloysused in this study (Ref 11)
Alloy Fe Si Cu Mn Mg
6111 0.40 max 0.6-1.1 0.5-0.9 0.1-0.45 0.50-1.05182 0.35 max 0.20 max 0.15 max 0.20-0.50 4.0-5.0
392—Volume 16(4) August 2007 Journal of Materials Engineering and Performance
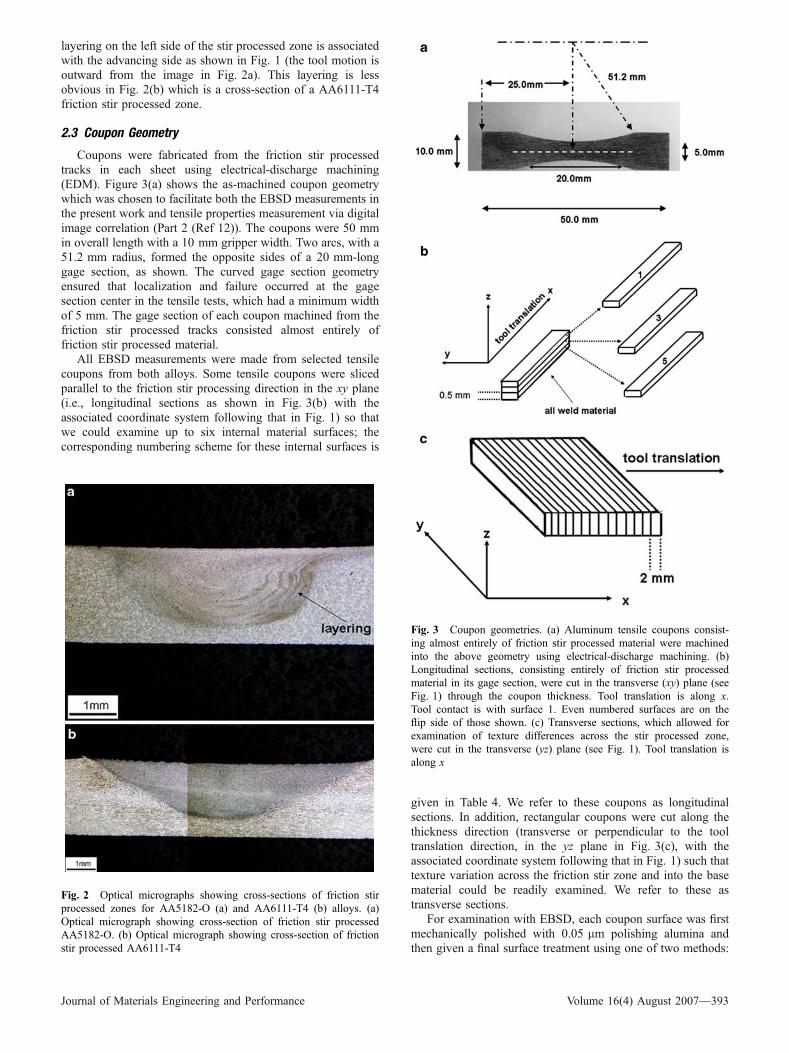
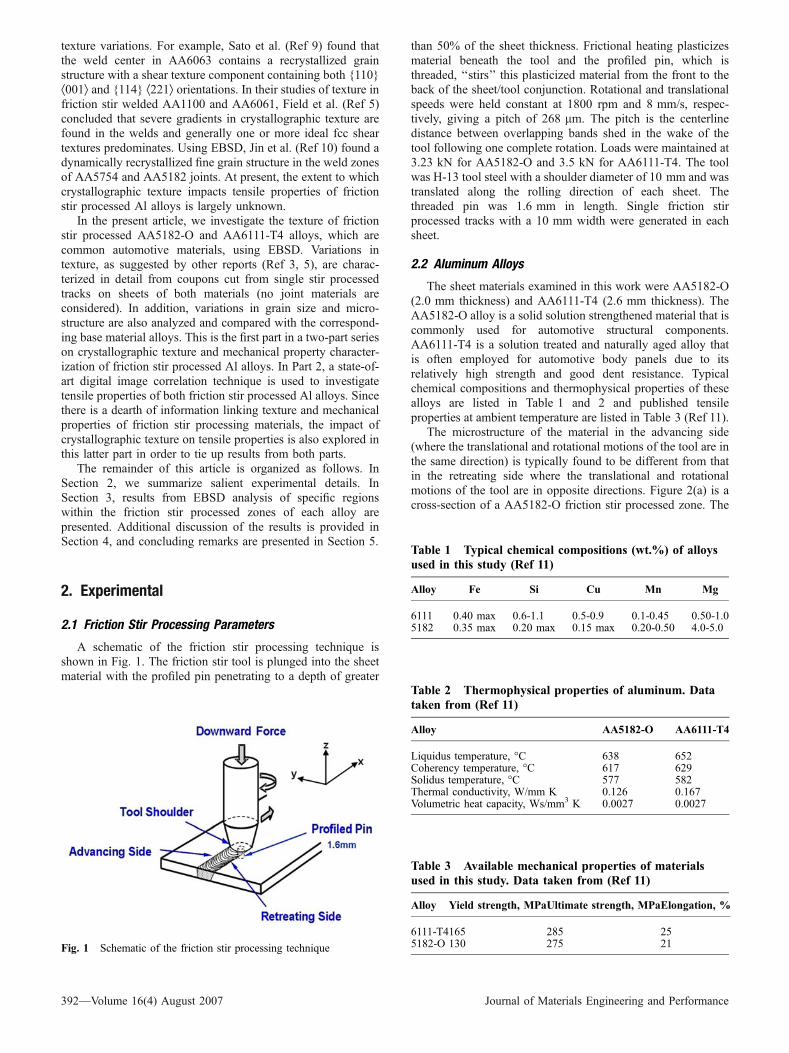
layering on the left side of the stir processed zone is associatedwith the advancing side as shown in Fig. 1 (the tool motion isoutward from the image in Fig. 2a). This layering is lessobvious in Fig. 2(b) which is a cross-section of a AA6111-T4friction stir processed zone.
2.3 Coupon Geometry
Coupons were fabricated from the friction stir processedtracks in each sheet using electrical-discharge machining(EDM). Figure 3(a) shows the as-machined coupon geometrywhich was chosen to facilitate both the EBSD measurements inthe present work and tensile properties measurement via digitalimage correlation (Part 2 (Ref 12)). The coupons were 50 mmin overall length with a 10 mm gripper width. Two arcs, with a51.2 mm radius, formed the opposite sides of a 20 mm-longgage section, as shown. The curved gage section geometryensured that localization and failure occurred at the gagesection center in the tensile tests, which had a minimum widthof 5 mm. The gage section of each coupon machined from thefriction stir processed tracks consisted almost entirely offriction stir processed material.
All EBSD measurements were made from selected tensilecoupons from both alloys. Some tensile coupons were slicedparallel to the friction stir processing direction in the xy plane(i.e., longitudinal sections as shown in Fig. 3(b) with theassociated coordinate system following that in Fig. 1) so thatwe could examine up to six internal material surfaces; thecorresponding numbering scheme for these internal surfaces is
given in Table 4. We refer to these coupons as longitudinalsections. In addition, rectangular coupons were cut along thethickness direction (transverse or perpendicular to the tooltranslation direction, in the yz plane in Fig. 3(c), with theassociated coordinate system following that in Fig. 1) such thattexture variation across the friction stir zone and into the basematerial could be readily examined. We refer to these astransverse sections.
For examination with EBSD, each coupon surface was firstmechanically polished with 0.05 lm polishing alumina andthen given a final surface treatment using one of two methods:
Fig. 2 Optical micrographs showing cross-sections of friction stirprocessed zones for AA5182-O (a) and AA6111-T4 (b) alloys. (a)Optical micrograph showing cross-section of friction stir processedAA5182-O. (b) Optical micrograph showing cross-section of frictionstir processed AA6111-T4
Fig. 3 Coupon geometries. (a) Aluminum tensile coupons consist-ing almost entirely of friction stir processed material were machinedinto the above geometry using electrical-discharge machining. (b)Longitudinal sections, consisting entirely of friction stir processedmaterial in its gage section, were cut in the transverse (xy) plane (seeFig. 1) through the coupon thickness. Tool translation is along x.Tool contact is with surface 1. Even numbered surfaces are on theflip side of those shown. (c) Transverse sections, which allowed forexamination of texture differences across the stir processed zone,were cut in the transverse (yz) plane (see Fig. 1). Tool translation isalong x
Journal of Materials Engineering and Performance Volume 16(4) August 2007—393

(1) electropolishing for 5 min with a solution of 250 mLethanol, 50 mL perchloric acid at 0 �C, 15V DC and a graphitecathode or (2) etching with 1% hydrofluoric acid solution for2 min at room temperature. Both of the etchants were suitablefor EBSD specimen preparation.
2.4 Electron Backscattered Diffraction (EBSD)
Coupons with the various geometries in Fig. 3 wereanalyzed for crystallographic texture using electron backscat-tered diffraction (EBSD). Electron backscattered diffraction is apoint analysis technique in which the electron beam is focusedon a small area of the order of a few microns or smaller. Thebackscattered electrons from the specimen are diffracted andform Kossel cones, which are intercepted on a phosphor screen.The apex angle of the cones is close to 180�, so theintersections of the cones with the screen are straight lineswhich form bands called Kikuchi bands. The Kikuchi bands
can be indexed to identify the crystallographic orientation atthat location in the specimen. This process is repeated at a largenumber of points to scan a large area and data can be used tocreate a crystallographic map of the specimen (Ref 7).
EBSD was performed in a JEOL 845 scanning electronmicroscope using the Channel 5 software fromHKLTechnology,Inc. (Ref 13). A 60� tilt and step sizes of 0.75-5 lmwere used fordata collection. Coupons were mounted such that the widthsection (6.4 mm) was visible. EBSD maps from several areaswere stitched together to create a map of a larger region. Subsetsfrom these maps were then selected and used to plot pole figuresand inverse pole figures in a local region using the Channel 5software fromHKLTechnology, Inc. The texture intensity valueswere obtained from the pole figures and inverse pole figures.
During EBSD data collection, the sample was arranged sothat the x-direction was parallel to the tool translation direction,the y-direction was in the plane of the sample but perpendicularto the translation direction, and the z-direction was normal tothe sample surface (i.e., parallel to the tool rotation axis). Oneach longitudinal surface, the EBSD runs covered an area ofabout 0.3-0.5 mm in the x-direction and 0.2-0.3 mm in the y-direction.
On the longitudinal sections (see Fig. 3b), EBSD wasperformed on surfaces 1, 2, 5, and 6 to obtain a completetexture distribution with depth through the friction stir pro-cessed zone (see Table 4). Surfaces 3 and 4 were next tosurfaces 2 and 5, respectively, and were thus not expected toprovide any additional information. EBSD maps were obtainedat five locations on each surface. A schematic of these locationsis shown in Fig. 4 in which the EBSD locations are markedwith solid circles labeled with letters �a� through �e�. Eachlocation was ~1 mm away from an adjacent location. TheEBSD runs covered between 0.3 and 0.5 mm in the x-directionand 0.2-0.3 mm in the y-direction (see Fig. 1). Note that theorientations of surfaces 2 and 6 were rotated by 180� around thex-axis relative to surface 1 since surfaces 1 and 2 were theopposite sides of the same coupon and similarly, surfaces 5 and6 were the opposite sides of the same section. However, all dataused in this study were rotated appropriately to match thecoordinate system shown in Fig. 1. On the transverse coupons,EBSD maps were obtained at nine locations making a 3· 3 gridacross and covering the entire depth of the friction stirprocessed region. The orientation of the transverse specimenswas kept such that the x, y, and z directions were parallel to y, z,
Table 4 Surface identification for the longitudinalsections in Fig. 3(b)
Slice/Surface Number Identification
Top/1 and 2 Top surface (1) and surface next to cut (2)Middle/3 and 4 Both surfaces next to cuts;
surface 3 opposite surface 2Bottom/5 and 6 Surface next to cut (5) and bottom surface (6)
Fig. 4 Schematic showing EBSD locations (marked by black circleslabeled with letters ‘‘a’’ through ‘‘e’’) on longitudinal sections cutfrom friction stir processed tensile coupons. All dimensions in mm
Fig. 5 EBSD maps of (b) AA5182-O, and (c) AA6111-T4 base materials (acquired from transverse sections). EBSD data are rotated to matchthe coordinate axes shown in Fig. 1. Color code is in (a)
394—Volume 16(4) August 2007 Journal of Materials Engineering and Performance

and x, respectively, in Fig. 1. EBSD data taken from transversecoupons were also rotated to match the coordinate axes used forlongitudinal sections. All EBSD data for friction stir processedmaterial, therefore, have coordinate axes consistent with Fig. 1and follow the color scheme in Fig. 5.
3. Electron Backscattered Diffraction Analysis
Electron backscattered diffraction maps taken fromAA5182-O and AA6111-T4 base material are shown in
Fig. 5, with the color scheme used for all EBSD results givenin (a) at the top of the figure. The EBSD maps in Fig. 5 weretaken from a region outside of the friction stir processedmaterial from selected transverse sections (see Fig. 3c). Theaverage grain sizes were measured to be 21.3 and 35.3 lm forAA5182-O and AA6111-T4, respectively. Grain size measure-ment was made with the HKL Channel 5 software by detectinggrain boundaries with a misorientation angle greater than orequal to 10�. Figure 5 shows that the base material in bothalloys has a random texture.
In the friction stir processed regions, we found variations intexture, grain shape and size with depth in the coupons and also
Fig. 6 EBSD map taken from a region of the centerline of the friction stir processed zone on surface 1 of an AA5182-O longitudinal section.The orientations are color-coded as shown in Fig. 5. Two distinct bands of crystallographic texture are observed
Fig. 7 EBSD subset maps with the corresponding pole figures for bands in Fig. 6. (a) Band 1 EBSD subset map and corresponding pole fig-ures. (b) Band 2 EBSD subset map and corresponding pole figures
Journal of Materials Engineering and Performance Volume 16(4) August 2007—395
on a given coupon surface. These observations are discussedbelow.
3.1 AA5182-O: Longitudinal Section
An EBSD map taken from location �a� on surface 1 of anAA5182-O friction stir processed longitudinal section is shownin Fig. 6. The average grain size is ~4.7 lm. It can easily beseen from Fig. 6 that the grains are oriented in bands ofdifferent textures where one band has a majority of blue coloredgrains (called band 1) while the other does not have a dominantcolor (called band 2). Subsets from each of these bands wereselected and used to plot pole figures. These subsets and theircorresponding pole figures are shown in Fig. 7. Note that Y0points to the advancing side of the friction stir processedregion; while X0 corresponds to the direction of tool translation(see Fig. 1). In band 1, the grains are oriented such that theÆ001æ crystallographic direction is parallel to x, or parallel to thedirection of tool translation as can be seen from the blue colorin the EBSD map in Fig. 7(a) (far left). The (100) pole figurefor band 1, given in Fig. 7(a) (far right) shows that one of the{100} poles is oriented parallel to the x-axis and the other twoare oriented along a direction between the y and z axes. Theintensity of texture is 4.72 times than that of the uniformdistribution. In addition, a Æ111æ texture component is alsoobserved. We can see from the (100) pole figure in Fig. 7(b)that in band 2, {100} poles are not strongly oriented in anyparticular direction and this results in the bands in the polefigure. Also, the maximum intensity in Fig. 7(b) is only 3.8times that of a uniform distribution.
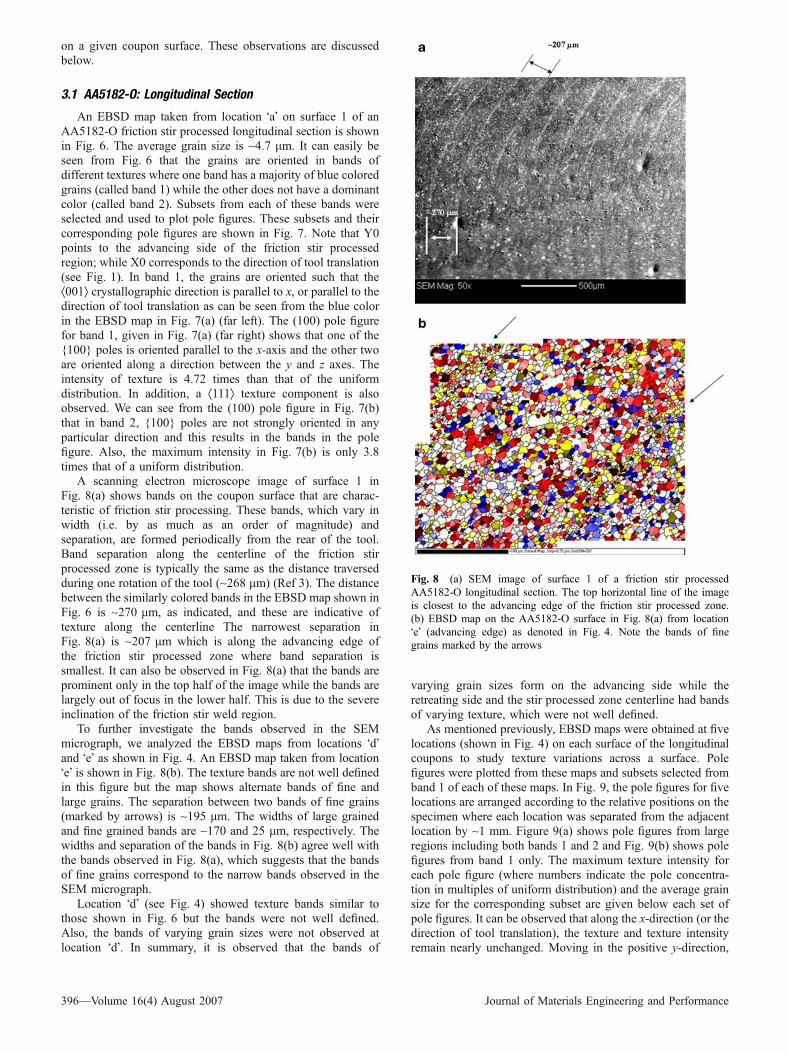
A scanning electron microscope image of surface 1 inFig. 8(a) shows bands on the coupon surface that are charac-teristic of friction stir processing. These bands, which vary inwidth (i.e. by as much as an order of magnitude) andseparation, are formed periodically from the rear of the tool.Band separation along the centerline of the friction stirprocessed zone is typically the same as the distance traversedduring one rotation of the tool (~268 lm) (Ref 3). The distancebetween the similarly colored bands in the EBSD map shown inFig. 6 is ~270 lm, as indicated, and these are indicative oftexture along the centerline The narrowest separation inFig. 8(a) is ~207 lm which is along the advancing edge ofthe friction stir processed zone where band separation issmallest. It can also be observed in Fig. 8(a) that the bands areprominent only in the top half of the image while the bands arelargely out of focus in the lower half. This is due to the severeinclination of the friction stir weld region.
To further investigate the bands observed in the SEMmicrograph, we analyzed the EBSD maps from locations �d�and �e� as shown in Fig. 4. An EBSD map taken from location�e� is shown in Fig. 8(b). The texture bands are not well definedin this figure but the map shows alternate bands of fine andlarge grains. The separation between two bands of fine grains(marked by arrows) is ~195 lm. The widths of large grainedand fine grained bands are ~170 and 25 lm, respectively. Thewidths and separation of the bands in Fig. 8(b) agree well withthe bands observed in Fig. 8(a), which suggests that the bandsof fine grains correspond to the narrow bands observed in theSEM micrograph.
Location �d� (see Fig. 4) showed texture bands similar tothose shown in Fig. 6 but the bands were not well defined.Also, the bands of varying grain sizes were not observed atlocation �d�. In summary, it is observed that the bands of
varying grain sizes form on the advancing side while theretreating side and the stir processed zone centerline had bandsof varying texture, which were not well defined.
As mentioned previously, EBSD maps were obtained at fivelocations (shown in Fig. 4) on each surface of the longitudinalcoupons to study texture variations across a surface. Polefigures were plotted from these maps and subsets selected fromband 1 of each of these maps. In Fig. 9, the pole figures for fivelocations are arranged according to the relative positions on thespecimen where each location was separated from the adjacentlocation by ~1 mm. Figure 9(a) shows pole figures from largeregions including both bands 1 and 2 and Fig. 9(b) shows polefigures from band 1 only. The maximum texture intensity foreach pole figure (where numbers indicate the pole concentra-tion in multiples of uniform distribution) and the average grainsize for the corresponding subset are given below each set ofpole figures. It can be observed that along the x-direction (or thedirection of tool translation), the texture and texture intensityremain nearly unchanged. Moving in the positive y-direction,
Fig. 8 (a) SEM image of surface 1 of a friction stir processedAA5182-O longitudinal section. The top horizontal line of the imageis closest to the advancing edge of the friction stir processed zone.(b) EBSD map on the AA5182-O surface in Fig. 8(a) from location�e� (advancing edge) as denoted in Fig. 4. Note the bands of finegrains marked by the arrows
396—Volume 16(4) August 2007 Journal of Materials Engineering and Performance

the {100} poles are rotated clockwise (in the direction of toolrotation, see Fig. 1) around the z-axis (i.e., normal to the page).This rotation of {100} poles can be clearly seen from the polefigures arranged in the vertical direction in Fig. 9. Additionally,an alignment of {111} poles parallel to y can be observed atlocation �e� (i.e., on the advancing side). Another point to beobserved from Fig. 9(a) is that one of the {100} poles isoriented in a particular direction and the other two {100} polesare randomly oriented which results in the formation of a bandin the pole figure.
Rotation of average texture components was observed whenmoving along the positive y-direction on surfaces 2 and 5, butthe bands of varying texture were not well defined. Figure 10shows an EBSD map taken from surface 2 of an AA5182-Ofriction stir processed coupon. Note that diffuse banding ofalternate ‘‘blue-dominated’’ and ‘‘random-colored’’ regions canbe seen. Also, the texture intensity decreased when goingdeeper into the stir processed zone and surface 5 had a poledensity of only 2-3 times that of uniform distribution (anobservation to be addressed shortly). Bands of fine grains were
Fig. 9 Pole figures from locations a-e (see Fig. 4) on surface 1 of AA5182-O. Grain sizes are in microns. (a) Pole figures due to averaging ofbands 1 and 2. (b) Pole figures constructed from band 1 only
Fig. 10 EBSD map taken from the region of weld centerline on surface 2 (see Fig. 3b) of AA5182-O friction stir processed material. Note dif-fuse banding of varying textures
Journal of Materials Engineering and Performance Volume 16(4) August 2007—397
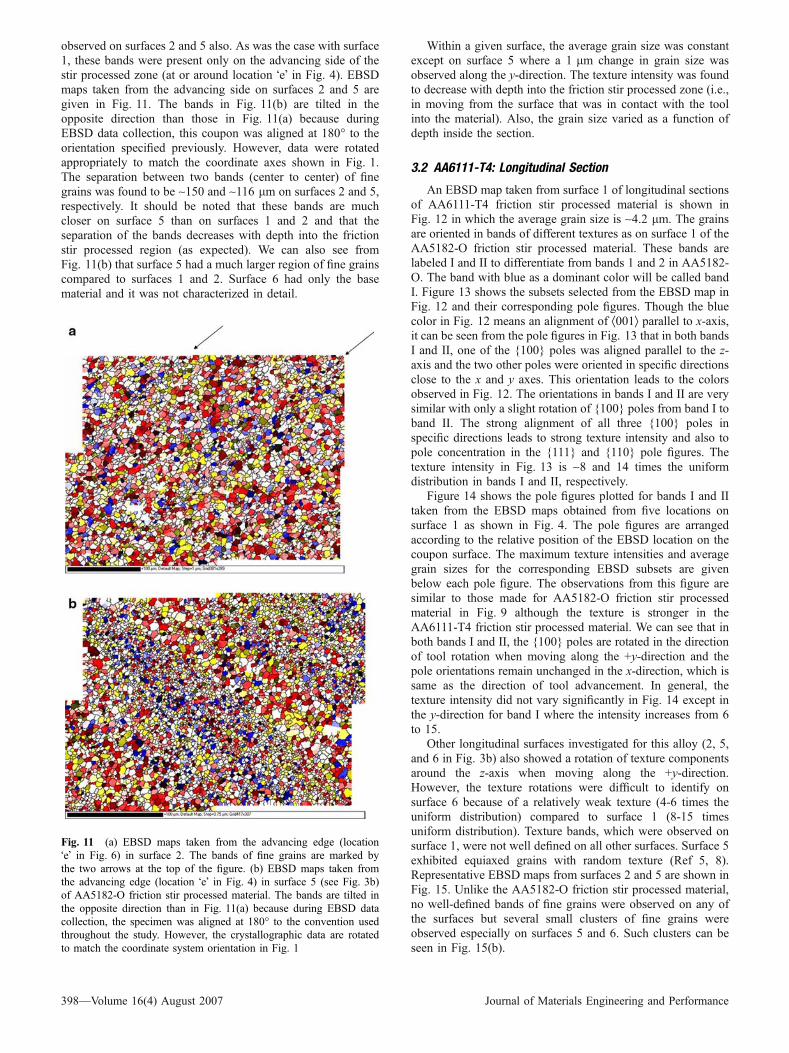
observed on surfaces 2 and 5 also. As was the case with surface1, these bands were present only on the advancing side of thestir processed zone (at or around location �e� in Fig. 4). EBSDmaps taken from the advancing side on surfaces 2 and 5 aregiven in Fig. 11. The bands in Fig. 11(b) are tilted in theopposite direction than those in Fig. 11(a) because duringEBSD data collection, this coupon was aligned at 180� to theorientation specified previously. However, data were rotatedappropriately to match the coordinate axes shown in Fig. 1.The separation between two bands (center to center) of finegrains was found to be ~150 and ~116 lm on surfaces 2 and 5,respectively. It should be noted that these bands are muchcloser on surface 5 than on surfaces 1 and 2 and that theseparation of the bands decreases with depth into the frictionstir processed region (as expected). We can also see fromFig. 11(b) that surface 5 had a much larger region of fine grainscompared to surfaces 1 and 2. Surface 6 had only the basematerial and it was not characterized in detail.
Within a given surface, the average grain size was constantexcept on surface 5 where a 1 lm change in grain size wasobserved along the y-direction. The texture intensity was foundto decrease with depth into the friction stir processed zone (i.e.,in moving from the surface that was in contact with the toolinto the material). Also, the grain size varied as a function ofdepth inside the section.
3.2 AA6111-T4: Longitudinal Section
An EBSD map taken from surface 1 of longitudinal sectionsof AA6111-T4 friction stir processed material is shown inFig. 12 in which the average grain size is ~4.2 lm. The grainsare oriented in bands of different textures as on surface 1 of theAA5182-O friction stir processed material. These bands arelabeled I and II to differentiate from bands 1 and 2 in AA5182-O. The band with blue as a dominant color will be called bandI. Figure 13 shows the subsets selected from the EBSD map inFig. 12 and their corresponding pole figures. Though the bluecolor in Fig. 12 means an alignment of Æ001æ parallel to x-axis,it can be seen from the pole figures in Fig. 13 that in both bandsI and II, one of the {100} poles was aligned parallel to the z-axis and the two other poles were oriented in specific directionsclose to the x and y axes. This orientation leads to the colorsobserved in Fig. 12. The orientations in bands I and II are verysimilar with only a slight rotation of {100} poles from band I toband II. The strong alignment of all three {100} poles inspecific directions leads to strong texture intensity and also topole concentration in the {111} and {110} pole figures. Thetexture intensity in Fig. 13 is ~8 and 14 times the uniformdistribution in bands I and II, respectively.
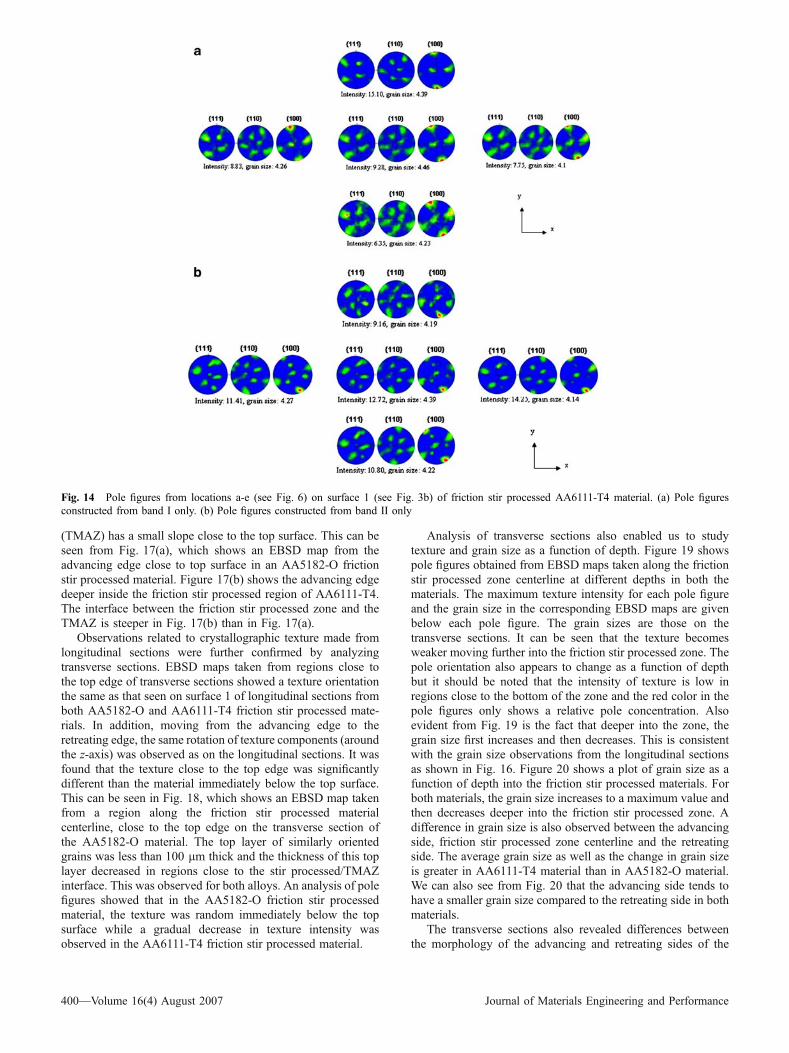
Figure 14 shows the pole figures plotted for bands I and IItaken from the EBSD maps obtained from five locations onsurface 1 as shown in Fig. 4. The pole figures are arrangedaccording to the relative position of the EBSD location on thecoupon surface. The maximum texture intensities and averagegrain sizes for the corresponding EBSD subsets are givenbelow each pole figure. The observations from this figure aresimilar to those made for AA5182-O friction stir processedmaterial in Fig. 9 although the texture is stronger in theAA6111-T4 friction stir processed material. We can see that inboth bands I and II, the {100} poles are rotated in the directionof tool rotation when moving along the +y-direction and thepole orientations remain unchanged in the x-direction, which issame as the direction of tool advancement. In general, thetexture intensity did not vary significantly in Fig. 14 except inthe y-direction for band I where the intensity increases from 6to 15.
Other longitudinal surfaces investigated for this alloy (2, 5,and 6 in Fig. 3b) also showed a rotation of texture componentsaround the z-axis when moving along the +y-direction.However, the texture rotations were difficult to identify onsurface 6 because of a relatively weak texture (4-6 times theuniform distribution) compared to surface 1 (8-15 timesuniform distribution). Texture bands, which were observed onsurface 1, were not well defined on all other surfaces. Surface 5exhibited equiaxed grains with random texture (Ref 5, 8).Representative EBSD maps from surfaces 2 and 5 are shown inFig. 15. Unlike the AA5182-O friction stir processed material,no well-defined bands of fine grains were observed on any ofthe surfaces but several small clusters of fine grains wereobserved especially on surfaces 5 and 6. Such clusters can beseen in Fig. 15(b).
Fig. 11 (a) EBSD maps taken from the advancing edge (location�e� in Fig. 6) in surface 2. The bands of fine grains are marked bythe two arrows at the top of the figure. (b) EBSD maps taken fromthe advancing edge (location �e� in Fig. 4) in surface 5 (see Fig. 3b)of AA5182-O friction stir processed material. The bands are tilted inthe opposite direction than in Fig. 11(a) because during EBSD datacollection, the specimen was aligned at 180� to the convention usedthroughout the study. However, the crystallographic data are rotatedto match the coordinate system orientation in Fig. 1
398—Volume 16(4) August 2007 Journal of Materials Engineering and Performance

Within a given surface, the average grain size was constantexcept on surface 5 where a 1 lm change in grain size wasobserved along the y-direction. Note that this change issignificant in comparison to the average grain size whichranged between 4 and 6 lm. This observation is the same asthat made for the AA5182-O friction stir processed material.Changes in average grain size on all other surfaces were lessthan 0.5 lm. The grain size was also largest on surface 5. Ahistogram of AA6111-T4 grain sizes on different surfaces isalso given in Fig. 16. Both materials showed a similar variationin grain size with depth though the change in grain size waslarger in AA6111-T4 material than in the AA5182-O material.
All materials in the friction stir processed region aredynamically recrystallized because the grain size in this region(4-7 lm) is much smaller than the starting grain size (20-30 lm) in both alloys. It is interesting to note that in the frictionstir processed zones of both AA5182-O and AA6111-T4,
{100} poles were oriented in specific directions and that thesepoles were rotated in the direction of the tool rotation. Thisimplies that the friction stir processed regions have a recrys-tallization texture in which {100} poles are preferably orientedin some directions which, in turn can be rotated in the directionof the tool rotation due to repeated mechanical work. It shouldbe noted that the time for which any region experiences severemechanical deformation is the time it takes for the tool toadvance by a distance equal to its diameter. The rotation of{100} poles that is observed in this study is probably causedduring a single rotation of the tool as the tool advances andleaves plastically worked material in its wake.
3.3 Transverse Sections
Analysis of the transverse sections (see Fig. 3(c) for coupongeometry) revealed that the interface between the friction stirprocessed zone and the thermomechanically affected zone
Fig. 12 EBSD map taken from a region close to the centerline on surface 1 (see Fig. 3b) of AA6111-T4 friction stir processed material
Fig. 13 EBSD subset maps for AA6111-T4 with the corresponding pole figures for bands (from Fig. 12). (a) Band I (with blue color domi-nance) EBSD subset map and corresponding pole figures. (b) Band II EBSD subset map and corresponding pole figures
Journal of Materials Engineering and Performance Volume 16(4) August 2007—399
(TMAZ) has a small slope close to the top surface. This can beseen from Fig. 17(a), which shows an EBSD map from theadvancing edge close to top surface in an AA5182-O frictionstir processed material. Figure 17(b) shows the advancing edgedeeper inside the friction stir processed region of AA6111-T4.The interface between the friction stir processed zone and theTMAZ is steeper in Fig. 17(b) than in Fig. 17(a).
Observations related to crystallographic texture made fromlongitudinal sections were further confirmed by analyzingtransverse sections. EBSD maps taken from regions close tothe top edge of transverse sections showed a texture orientationthe same as that seen on surface 1 of longitudinal sections fromboth AA5182-O and AA6111-T4 friction stir processed mate-rials. In addition, moving from the advancing edge to theretreating edge, the same rotation of texture components (aroundthe z-axis) was observed as on the longitudinal sections. It wasfound that the texture close to the top edge was significantlydifferent than the material immediately below the top surface.This can be seen in Fig. 18, which shows an EBSD map takenfrom a region along the friction stir processed materialcenterline, close to the top edge on the transverse section ofthe AA5182-O material. The top layer of similarly orientedgrains was less than 100 lm thick and the thickness of this toplayer decreased in regions close to the stir processed/TMAZinterface. This was observed for both alloys. An analysis of polefigures showed that in the AA5182-O friction stir processedmaterial, the texture was random immediately below the topsurface while a gradual decrease in texture intensity wasobserved in the AA6111-T4 friction stir processed material.
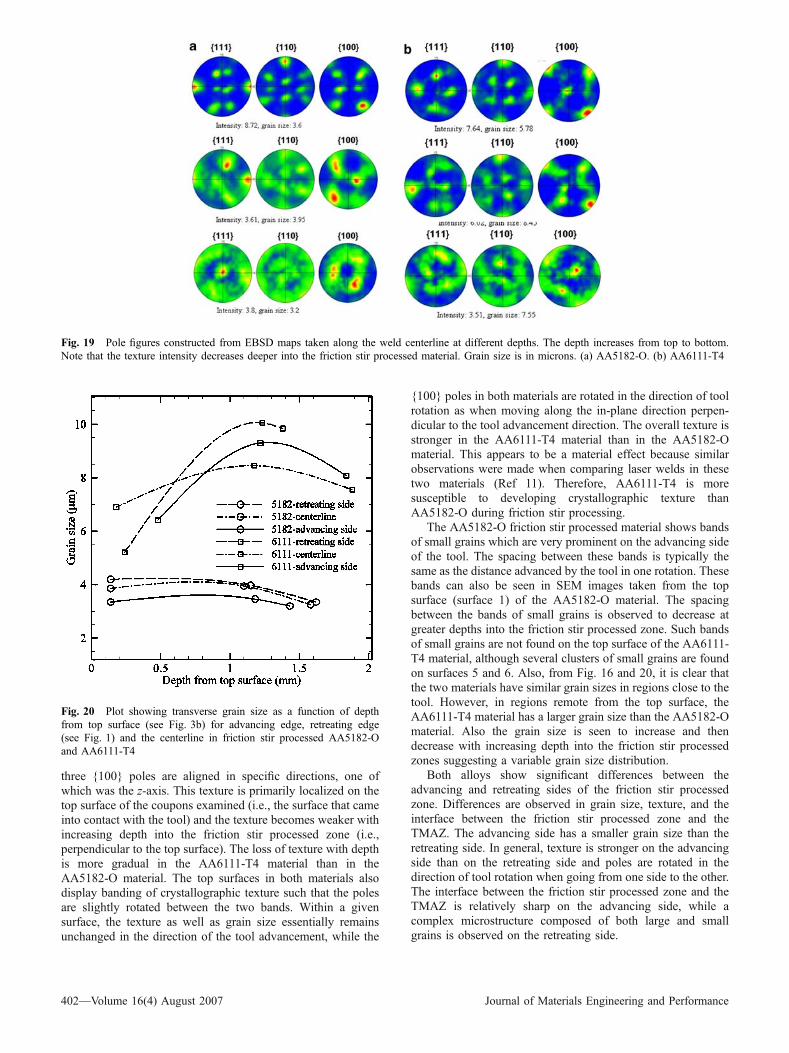
Analysis of transverse sections also enabled us to studytexture and grain size as a function of depth. Figure 19 showspole figures obtained from EBSD maps taken along the frictionstir processed zone centerline at different depths in both thematerials. The maximum texture intensity for each pole figureand the grain size in the corresponding EBSD maps are givenbelow each pole figure. The grain sizes are those on thetransverse sections. It can be seen that the texture becomesweaker moving further into the friction stir processed zone. Thepole orientation also appears to change as a function of depthbut it should be noted that the intensity of texture is low inregions close to the bottom of the zone and the red color in thepole figures only shows a relative pole concentration. Alsoevident from Fig. 19 is the fact that deeper into the zone, thegrain size first increases and then decreases. This is consistentwith the grain size observations from the longitudinal sectionsas shown in Fig. 16. Figure 20 shows a plot of grain size as afunction of depth into the friction stir processed materials. Forboth materials, the grain size increases to a maximum value andthen decreases deeper into the friction stir processed zone. Adifference in grain size is also observed between the advancingside, friction stir processed zone centerline and the retreatingside. The average grain size as well as the change in grain sizeis greater in AA6111-T4 material than in AA5182-O material.We can also see from Fig. 20 that the advancing side tends tohave a smaller grain size compared to the retreating side in bothmaterials.
The transverse sections also revealed differences betweenthe morphology of the advancing and retreating sides of the
Fig. 14 Pole figures from locations a-e (see Fig. 6) on surface 1 (see Fig. 3b) of friction stir processed AA6111-T4 material. (a) Pole figuresconstructed from band I only. (b) Pole figures constructed from band II only
400—Volume 16(4) August 2007 Journal of Materials Engineering and Performance
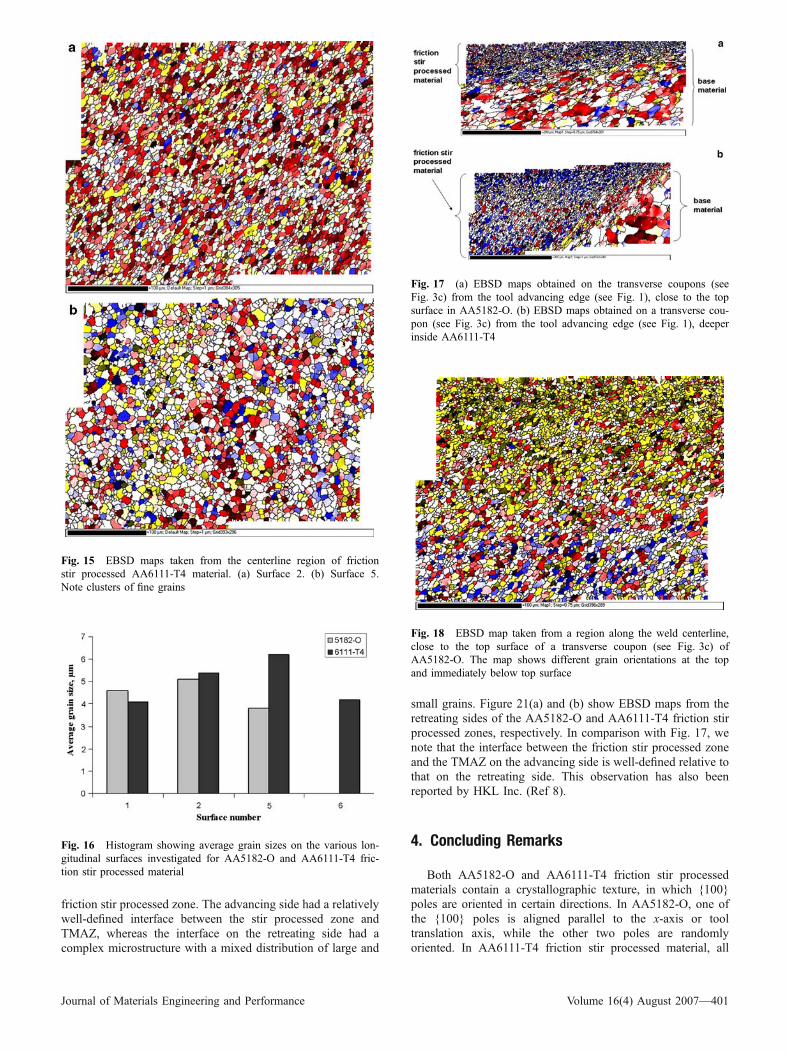
friction stir processed zone. The advancing side had a relativelywell-defined interface between the stir processed zone andTMAZ, whereas the interface on the retreating side had acomplex microstructure with a mixed distribution of large and
small grains. Figure 21(a) and (b) show EBSD maps from theretreating sides of the AA5182-O and AA6111-T4 friction stirprocessed zones, respectively. In comparison with Fig. 17, wenote that the interface between the friction stir processed zoneand the TMAZ on the advancing side is well-defined relative tothat on the retreating side. This observation has also beenreported by HKL Inc. (Ref 8).
4. Concluding Remarks
Both AA5182-O and AA6111-T4 friction stir processedmaterials contain a crystallographic texture, in which {100}poles are oriented in certain directions. In AA5182-O, one ofthe {100} poles is aligned parallel to the x-axis or tooltranslation axis, while the other two poles are randomlyoriented. In AA6111-T4 friction stir processed material, all
Fig. 15 EBSD maps taken from the centerline region of frictionstir processed AA6111-T4 material. (a) Surface 2. (b) Surface 5.Note clusters of fine grains
Fig. 16 Histogram showing average grain sizes on the various lon-gitudinal surfaces investigated for AA5182-O and AA6111-T4 fric-tion stir processed material
Fig. 17 (a) EBSD maps obtained on the transverse coupons (seeFig. 3c) from the tool advancing edge (see Fig. 1), close to the topsurface in AA5182-O. (b) EBSD maps obtained on a transverse cou-pon (see Fig. 3c) from the tool advancing edge (see Fig. 1), deeperinside AA6111-T4
Fig. 18 EBSD map taken from a region along the weld centerline,close to the top surface of a transverse coupon (see Fig. 3c) ofAA5182-O. The map shows different grain orientations at the topand immediately below top surface
Journal of Materials Engineering and Performance Volume 16(4) August 2007—401
three {100} poles are aligned in specific directions, one ofwhich was the z-axis. This texture is primarily localized on thetop surface of the coupons examined (i.e., the surface that cameinto contact with the tool) and the texture becomes weaker withincreasing depth into the friction stir processed zone (i.e.,perpendicular to the top surface). The loss of texture with depthis more gradual in the AA6111-T4 material than in theAA5182-O material. The top surfaces in both materials alsodisplay banding of crystallographic texture such that the polesare slightly rotated between the two bands. Within a givensurface, the texture as well as grain size essentially remainsunchanged in the direction of the tool advancement, while the
{100} poles in both materials are rotated in the direction of toolrotation as when moving along the in-plane direction perpen-dicular to the tool advancement direction. The overall texture isstronger in the AA6111-T4 material than in the AA5182-Omaterial. This appears to be a material effect because similarobservations were made when comparing laser welds in thesetwo materials (Ref 11). Therefore, AA6111-T4 is moresusceptible to developing crystallographic texture thanAA5182-O during friction stir processing.
The AA5182-O friction stir processed material shows bandsof small grains which are very prominent on the advancing sideof the tool. The spacing between these bands is typically thesame as the distance advanced by the tool in one rotation. Thesebands can also be seen in SEM images taken from the topsurface (surface 1) of the AA5182-O material. The spacingbetween the bands of small grains is observed to decrease atgreater depths into the friction stir processed zone. Such bandsof small grains are not found on the top surface of the AA6111-T4 material, although several clusters of small grains are foundon surfaces 5 and 6. Also, from Fig. 16 and 20, it is clear thatthe two materials have similar grain sizes in regions close to thetool. However, in regions remote from the top surface, theAA6111-T4 material has a larger grain size than the AA5182-Omaterial. Also the grain size is seen to increase and thendecrease with increasing depth into the friction stir processedzones suggesting a variable grain size distribution.
Both alloys show significant differences between theadvancing and retreating sides of the friction stir processedzone. Differences are observed in grain size, texture, and theinterface between the friction stir processed zone and theTMAZ. The advancing side has a smaller grain size than theretreating side. In general, texture is stronger on the advancingside than on the retreating side and poles are rotated in thedirection of tool rotation when going from one side to the other.The interface between the friction stir processed zone and theTMAZ is relatively sharp on the advancing side, while acomplex microstructure composed of both large and smallgrains is observed on the retreating side.
Fig. 19 Pole figures constructed from EBSD maps taken along the weld centerline at different depths. The depth increases from top to bottom.Note that the texture intensity decreases deeper into the friction stir processed material. Grain size is in microns. (a) AA5182-O. (b) AA6111-T4
Fig. 20 Plot showing transverse grain size as a function of depthfrom top surface (see Fig. 3b) for advancing edge, retreating edge(see Fig. 1) and the centerline in friction stir processed AA5182-Oand AA6111-T4
402—Volume 16(4) August 2007 Journal of Materials Engineering and Performance

There are some interesting texture differences between laserand friction stir processed AA5182-O and AA6111-T4. Forexample, only columnar grains on the edges (i.e., boundarybetween the fusion and HAZ zones) of the Nd:YAG laserprocessed materials are textured (Ref 11). However, in thefriction stir processed materials investigated in the present work,it is the equiaxed grains that are textured. Columnar grains formin laser welding due to solidification, while equiaxed grainspredominate in friction stir processing (and in friction stir weldedmaterials as well) due to recrystallization. In laser weldedAA5182-O, the Æ001æ poles are aligned parallel to the axis ofcolumnar grains. In friction stir processed AA5182-O, the Æ001æpoles are aligned parallel to the direction of tool advancement.
In the second part, tensile mechanical properties of frictionstir processed AA5182-O and AA6111-T4 are quantified usinga state-of-the art digital image correlation technique. Theimpact of crystallographic texture (determined in Part 1) ontensile properties is explored in this latter part in order to tie upthe work in both parts.
References
1. W.M. Thomas, E.D. Nicholas, J.C. Needham, M.G. Murch, P. Temple-Smith, and C.J. Dawes, ‘‘Friction Stir Butt Welding,’’ GB Patent No.9125978.8, International Patent No. PCT/GB92/02203, 1991
2. K. Colligan, Material Flow Behavior During Friction Stir Welding ofAluminum, Welding Research Supplement, Welding J., 1999, 78, p229.s–237.s
3. J.A. Schneider and A.C. Nunes Jr, Characterization of Plastic Flow andResulting Microtextures in a Friction Stir Weld, Metall. Mater. Trans.B, 2004, 35, p 777–783
4. T.U. Seidel and A.P. Reynolds, Visualization of the Material Flow inAA2195 Friction Stir Welds using a Marker Insert Technique, Metall.Mater. Trans. A, 2001, 32, p 2879–2884
5. D.P. Field, T.W. Nelson, Y. Hovanski, and K.V. Jata, Heterogeneity ofCrystallographic Texture in Friction Stir welds of Aluminum, Metall.Mater. Trans. A, 2001, 32, p 2869–2877
6. [http://www.aluminum.org/ANTemplate.cfm?IssueDate=11/01/2005&Template=/ContentManagement/ContentDisplay.cfm&Conten-tID=9294]
7. A.J. Schwartz, M. Kumar, and B.L. Adams, Electron BackscatterDiffraction in Materials Science. Kluwer academic/Plenum publishers,New York (NY), 2000
8. Characterizing texture variations in a friction stir welded aluminumalloy. http://www.hkltechnology.com/data/0-FSW-aluminium.pdf
9. Y.S. Sato, H. Hiroyuki, K. Ikeda, M. Enomoto, S. Jogan, and T.Hashimoto, Microtexture in the Friction-Stir Weld of an AluminumAlloy, Metall. Mater. Trans. A, 2001, 32, p 941–948
10. H. Jin, S. Saimoto, M. Ball, and P.L. Threadgill, Characterization ofMicrostructure and Texture in Friction Stir Welded Joints of 5754 and5182 Aluminum Alloy Sheets, Mater. Sci. Technol., 2001, 17, p 1605–1614
11. L.G. Hector Jr., Y.-L. Chen, S. Agarwal, and C.L. Briant, TextureCharacterization of Autogenous Nd: YAG Laser Welds in AA5182-Oand AA6111-T4 Aluminum Alloys, Metall. Mater. Trans. A., 2004, 35,p 3032–3037
12. L.G. Hector, Jr., Y.-L. Chen, S. Agarwal, and C.L. Briant, ‘‘Friction StirProcessed AA5182-O and AA6111-T4 Aluminum Alloys. Part 2:Tensile Properties and Strain Field Evolution,’’ J. Mater. Eng. Perf., inreview, 2007, DOI 10.1007/s11665-007-9060-0
13. http://www.hkltechnology.com/
Fig. 21 EBSD maps taken from the retreating edges of both alloys. A complex microstructure with large and small grains can be observed atthe interface between the main portion of the friction stir processed zone and the thermomechanically affected zone (TMAZ). (a) EBSD map ofretreating edge in AA5182-O. (b) EBSD map of retreating edge in AA6111-T4
Journal of Materials Engineering and Performance Volume 16(4) August 2007—403
Related Documents