FRESNO POLICE DEPARTMENT DEMOGRAPHIC DATA COLLECTION First Quarter 2016 (January/February/March) Jerry P. Dyer Chief of Police

Welcome message from author
This document is posted to help you gain knowledge. Please leave a comment to let me know what you think about it! Share it to your friends and learn new things together.
Transcript

FRESNO POLICE DEPARTMENTDEMOGRAPHIC DATA COLLECTION
First Quarter 2016(January/February/March)
Jerry P. DyerChief of Police

TABLE OF CONTENTS
Page Nbr.
DATA ANALYSIS:
Census 2010 Population of Fresno 1
Demographic Data 1
Traffic Stops by Race 2
Traffic Stops by Reason for Stop 2-3
Traffic Stops by Type of Action Taken 3
Traffic Stops Action Taken by Race 4-5
Traffic Stops With Reason for Vehicle Search by Race 6
Traffic Stops City-Wide by District/Race 7-9
Traffic Stops by Patrol Support Division 9
Traffic Stops by Day of the Week 10
Traffic Stops by Hour of the Day 11
Traffic Stops by Age and Race 11
Daily Crime Bulletin by Race 12

1
DATA ANALYSIS:
Census 2010 Population of Fresno(Incorporated City)
Total Population – 494,665
Asian Black Hispanic White Other
Population 60,939 37,885 232,055 148,598 15,188 Percent ofPopulation 12.3% 7.7% 46.9% 30.0% 3.1%
Census 2010 Data
RACE
0.0%
5.0%
10.0%
15.0%
20.0%
25.0%
30.0%
35.0%
40.0%
45.0%
50.0%
Asian Black Hispanic
White Other
Population 12.3% 7.7% 46.9% 30.0% 3.1%Traffic Stops 5.6% 13.9% 50.0% 24.3% 6.2%
Per
cen
tag
e
% Population vs. % of Drivers Stopped by Race

2
TOTAL TRAFFIC STOPS FIRST QUARTER 2016 – 12,742
TRAFFIC STOPS BY RACE
Order by Race: Hispanic - 50.0%White - 24.3%Black - 13.9%Other - 6.2%Asian - 5.6%
TRAFFIC STOPS BY REASON FOR STOP
Reason for Stop Asian Black Hispanic White Other TOTALCourtesy Stop - Flagged by Citizen 1 3 10 10 24Driver Wanted - Daily Crime Bulletin / Warrant 1 7 5 1 14DUI - Driving Under the Influence 17 21 189 89 24 340
Hazardous Moving Violation 375 739 3,040 1,762 486 6,402Investigative Stop - Observed Criminal Activity 20 41 115 67 10 253Non-Hazardous Moving Violation 131 409 1,321 518 119 2,498
Other Motor Vehicle Violation 15 58 225 93 25 416
Seat Belt Violation 14 45 135 48 14 256
Vehicle Equipment Violation 132 444 1,307 507 114 2,504
Of the 12,742 recorded traffic stops, 12,707 electronic reports were received where both the reason for the stop and race indicator keys were properly entered.
Asian5.6%
Black13.9%
Hispanic50.0%
White24.3%
Other6.2%
Traffic Stops by Race

3
TRAFFIC STOP BY TYPE OF ACTION TAKEN
Reason for Stop ArrestCitation Issued
Citizen Assistance/
Courtesy
Field Interrogation
Card Warning Given TOTALCourtesy Stop - Flagged by Citizen 11 7 3 21Driver Wanted - Daily Crime Bulletin / Warrant 10 4 14DUI - Driving Under the Influence 14 323 2 1 340
Hazardous Moving Violation 30 5157 5 1 1201 6,394Investigative Stop - Observed Criminal Activity 4 179 9 4 53 249Non-Hazardous Moving Violation 16 1596 3 2 882 2,499
Other Motor Vehicle Violation 2 321 3 90 416
Seat Belt Violation 1 233 22 256
Vehicle Equipment Violation 11 1205 1 2 1285 2,504
*Statistics reflect traffic stops initiated by District and Patrol Support Division personnel
Courtesy Stop - Flagged by Citizen0.2%
Driver Wanted - Daily Crime Bulletin / Warrant
0.1%DUI - Driving Under the
Influence2.7%
Hazardous Moving Violation50.4%
Investigative Stop - Observed Criminal Activity
2.0%
Non-Hazardous Moving Violation19.7%
Other Motor Vehicle Violation3.3%
Seat Belt Violation2.0%
Vehicle Equipment Violation19.7%
Reason for Traffic Stop

4
ACTION TAKEN BY RACE
Description Asian Black Hispanic White Other TOTAL
Arrest 4 16 42 15 1 78Citation Issued 471 1,085 4,578 2,290 642 9,066Citizen Assistance / Courtesy 6 5 9 10 30Field Interrogation Card 1 1 6 1 9Warning Given 226 656 1,728 781 151 3,542
Of the 12,742 traffic stops, 12,725 electronic reports were received where both the action taken andrace indicator keys were properly entered.
Asian5.2% Black
12.0%
Hispanic50.5%
White25.3%
Other7.1%
Action Taken - Citation by Race
Asian5.1%
Black20.5%
Hispanic53.8%
White19.2%
Other1.3%
Action Taken - Arrest by Race

5
Asian6.4%
Black18.5%
Hispanic48.8%
White22.0%
Other4.3%
Action Taken - Warning Given by Race
Asian20.0%
Black16.7%Hispanic
30.0%
White33.3% Other
0.0%
Action Taken - Citizen Assistance by Race
Asian11.1%
Black11.1%
Hispanic66.7%
White11.1%
Other0.0%
Action Taken - Field Interrogation Card

6
TRAFFIC STOPS WITH REASON FOR VEHICLE SEARCH BY RACE
Reason for Stop – Vehicle Searched Asian Black Hispanic White Other TOTAL
Courtesy Stop - Flagged by Citizen 2 2Driver Wanted - Daily Crime Bulletin / Warrant 1 2 3DUI - Driving Under the Influence 8 13 98 39 8 166
Hazardous Moving Violation 13 67 213 49 9 351Investigative Stop - Observed Criminal Activity 2 11 23 6 2 44Non-Hazardous Moving Violation 15 95 203 29 7 349
Other Motor Vehicle Violation 1 8 21 2 3 35
Seat Belt Violation 1 3 20 3 1 28
Vehicle Equipment Violation 12 80 220 46 2 360
Of the 12,742 traffic stops, 1,338 electronic reports were received indicating a vehicle was searched.
*10.5% of the 12,742 traffic stops resulted in a vehicle search
Order by Race: Hispanic - 59.8%Black - 20.8%White - 13.2%Asian - 3.9%Other - 2.4%
Asian3.9%
Black20.8%
Hispanic59.8%
White13.2%
Other2.4%
Vehicles Searched by Race

7
CITY-WIDE TRAFFIC STOPS BY DISTRICT/RACE
District Asian Black Hispanic White Other TOTAL
Southwest 41 294 501 162 21 1,019
Northwest 27 124 318 171 38 678
Southeast 68 64 318 68 10 528Northeast 32 64 204 163 25 488
Of the 12,742 recorded traffic stops, there were 2,713 where both the race indicator anddistrict indictor keys were properly entered.
*Statistics reflect traffic stops initiated by both District and Patrol Support Division personnel
Order by District: Southwest - 37.6%Northwest - 25.0%Southeast - 19.5%Northeast - 18.0%
Southwest37.6%
Northwest25.0%
Southeast19.5%
Northeast18.0%
City-Wide Traffic Stops by District
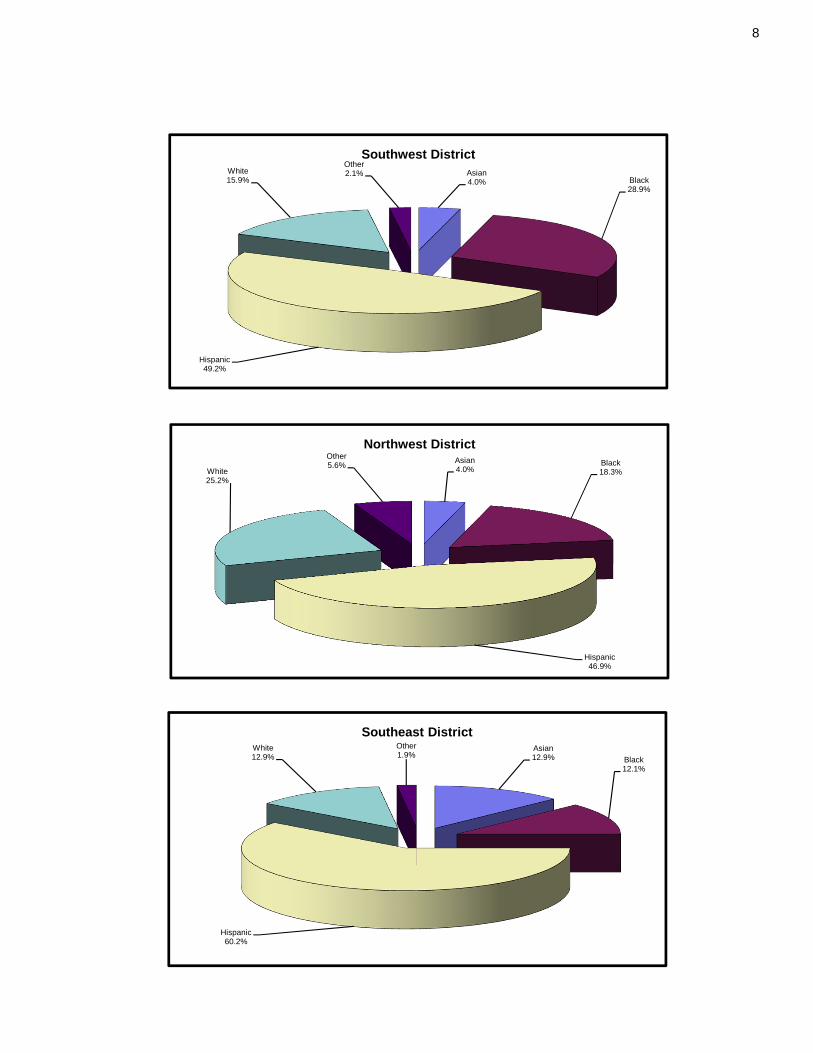
8
Asian4.0% Black
28.9%
Hispanic49.2%
White15.9%
Other2.1%
Southwest District
Asian12.9% Black
12.1%
Hispanic60.2%
White12.9%
Other1.9%
Southeast District
Asian4.0%
Black18.3%
Hispanic46.9%
White25.2%
Other5.6%
Northwest District

9
TRAFFIC STOPS BY PATROL SUPPORT DIVISIONTotal 588 Traffic Stops
District Asian Black Hispanic White Other TOTAL
Southwest 16 125 144 33 4 322
Northwest 3 24 35 12 4 78
Southeast 12 16 60 9 97Northeast 7 19 39 22 4 91
*Patrol Support Division consists of MAGEC, POP, Patrol TAC, Multi-Agency, K9, Juvenile TAC, HEAT and etc.
Asian6.6% Black
13.1%
Hispanic41.8%
White33.4%
Other5.1%
Northeast District

10
TRAFFIC STOPS BY DAYS OF THE WEEK CITY-WIDE
Order by Day of the Week:
Wednesday - 18.0%Saturday - 16.8%Tuesday - 16.3%Thursday - 15.6%Monday - 12.1%Friday - 11.6%Sunday - 9.7%
FRI11.6%
MON12.1%
SAT16.8%
SUN9.7%
THUR15.6%
TUE16.3%
WED18.0%
Traffic Stops by Days of the Week

11
TRAFFIC STOPS BY HOUR OF THE DAY CITY-WIDE
Order by Hours of the Day:
1200 to 1759 hrs - 34.4%1800 to 2359 hrs - 30.4%0600 to 1159 hrs - 25.9%0000 to 0559 hrs - 9.2%
TRAFFIC STOPS BY AGE AND RACE
Age Group Asian Black Hispanic White Other TOTAL
12-17 7 14 93 47 17 17818-23 169 435 1557 548 192 290124-29 150 370 1393 523 172 260830-35 127 233 1044 379 101 188436-41 67 173 740 307 95 138242-47 72 177 545 341 47 118248-53 34 132 391 289 66 91254-59 33 97 273 254 45 70260-65 31 82 153 190 26 48266-71 7 30 70 107 12 22672-77 1 10 37 50 9 10778-83 2 3 13 29 3 5084-89 4 14 2 2090-95 1 4 5
Of the 12,742 traffic stops, 12,639 electronic reports were received where both the age and raceindicator keys were properly entered.
0000-05599.2%
0600-115925.9%
1200-175934.4%
1800-235930.4%
Traffic Stops by Hours of the Day

12
DAILY CRIME BULLETIN (WANTED PERSONS) BY RACELISTINGS – 269
TOTAL 269Asian 5Black 71
Hispanic 140White 48Other 4
Unknown 1
Order by Race: Hispanic - 52.0%Black - 26.4%White - 17.8%Asian - 1.9%Other - 1.5%Unknown - 0.4%
Asian1.9%
Black26.4%
Hispanic52.0%
White17.8%
Other1.5%
Unknown0.4%
DCB by Race

POLICE DEP DATE: TO: THROUG FROM: SUBJECT The 2016reviewed.program mCrossroadMDS). Of the 1212,725 elefor eventsthird quarthe methoofficer useuse one d The demo
His Wh Bla Asi Oth
PARTMENT
AP
JE Ch
H: D Ad
CA Pr
SE Ac
T: 20
6 first quartThe DDC
maintained ds program
2,742 trafficectronic DDs with the orter of 2015od by whiches one dispdisposition o
ographic bre
spanic 46.9hite 30.0%; ack 7.7%; ian 12.3%; her 3.1%.
PRIL 21, 20
ERRY P. DYhief of Polic
EPUTY CHdministrativ
APTAIN LYrofessional
ERGEANT ccountabilit
016 FIRST
ter DemogrC informatio
by ISB perm (utilized b
c stops recDC collectioopening clas5. The diffeh the DDC pposition of aof “3C” for m
eakdown of
%;
and
016
YER ce
HIEF ROBEve Services
YDIA CARRStandards
JAIME RIOty and Com
QUARTER
raphic Dataon containrsonnel. It y the Traffi
corded by ton forms wss of “3C” erence betwprogram coa “3C” for eamultiple traf
f the City of
ERT NEVARs Division C
RASCO Bureau Co
OS mpliance Se
R DEMOGR
a Collectioned in the contains a ic Bureau)
he DDC prwere submit
revealed thween CAD llects DDCach traffic sffic stops, s
f Fresno is
REZ Commander
ommander
ection
RAPHIC DA
n (DDC) rereport is combinatioand Data 9
rogram durtted correcthere were 1and DDC data. Onestop they msuch as a D
as follows;
r
ATA ANALY
eport has bgenerated
on of traffic 911(DDC fo
ring the firstly. A revie12,707 trafftraffic stop
e example wmake and a DUI check p
;
YSIS
been producby an austop data f
orms comp
st quarter oew of CAD fic stops dunumbers is
would be wmotor offic
point.
ced and tomated from the
pleted on
of 2016, records
uring the s due to
when one cer might

2016 first Quarter Demographic Analysis April 21, 2016
The percentage of subjects stopped by race is as follows;
Hispanic 50.0%; White 24.3%; Black 13.9%; Asian 5.6%; and Other 6.2%.
The majority of traffic stops were made in the Southwest District (37.6%), followed by Northwest District (25.0%) followed by Southeast (19.5%) then Northeast District (18.0%). The most frequent reason cited for traffic stops was hazardous moving violations (50.4%), followed by non-hazardous moving violations and vehicle equipment violations both at (19.7%). Less than 1% of the traffic stops are for DCB entries. The demographics for Daily Crime Bulletin (DCB) wanted subjects were as follows;
Hispanic 52.0%; Black 26.4%; White 17.8%; Asian 1.9%; Other 1.6%; and Unknown .04%
Approximately 10.5% of traffic stops resulted in the vehicle being searched by officers. After comparing Fresno’s demographic breakdown of traffic stops per district and reason for the traffic stop, it appears there are no trends that are out of the normal range at this time.
The data reflected in the current DDC report should be reviewed to determine what modifications, if any, should be made to the program to enhance its effectiveness. Currently, Traffic Section and Patrol Division traffic stop data is combined and cannot be differentiated when reviewing the report.
Related Documents