Frequency-Domain Speech Analysis Short-Time Fourier Analysis Windowed (short-time) Fourier Transform Spectrogram of speech signals Filter bank implementation* Cepstral Analysis (Real) cepstrum and complex cepstrum Complex cepstrum for speech Pitch detection Echo hiding

Welcome message from author
This document is posted to help you gain knowledge. Please leave a comment to let me know what you think about it! Share it to your friends and learn new things together.
Transcript

FrequencyDomain Speech Analysis
ShortTime Fourier Analysis Windowed (shorttime) Fourier Transform Spectrogram of speech signals Filter bank implementation*
Cepstral Analysis (Real) cepstrum and complex cepstrum Complex cepstrum for speech Pitch detection
Echo hiding

Fourier Transform
Joseph Fourier(17681830)
F w =∫−∞
∞f t e− jwt
f t =12π
∫−∞
∞F w e jwtdw
It’s a simple and powerful idea:Can any signal be represented by linear combination of sines and cosines?
Deep Impact of FT
A versatile tool for solving many problems in science and engineering Mathematics: functional/harmonic analysis Physics: thermodynamics, Fourier optics Astronomy: radar imaging, FT Spectrometer Biomedical engineering: MRI, FT infrared
spectrography Electrical engineering: frequencydomain
analysis, wireless communication, signal processing

Spectral Analysis
http://130.191.21.201/multimedia/jiracek/dga/spectralanalysis/examples.html

Discrete Fourier Transform (DFT)
X e jw=∑
−∞
∞
x n e− jwn
Fourier Transform of a Sequence
w=2kπN
X k =∑n=0
N−1
x n e− j 2kπ
Nn
DFT

Properties of DFT
Linearity Periodicity
Shift
Convolution

DFT Under MATLAB
>X=fft(x) For a lengthN real signal x, output X will be
lengthN complex sequence with lowfrequency clustered around 1 and N
X=fftshift(fft(x)) will put lowfrequency to the center instead of boundary of X.
>X=fft(x,N) pad with zeros if x has less than N points and
truncated if it has more

DFT of Simple Waveforms
Time Frequency
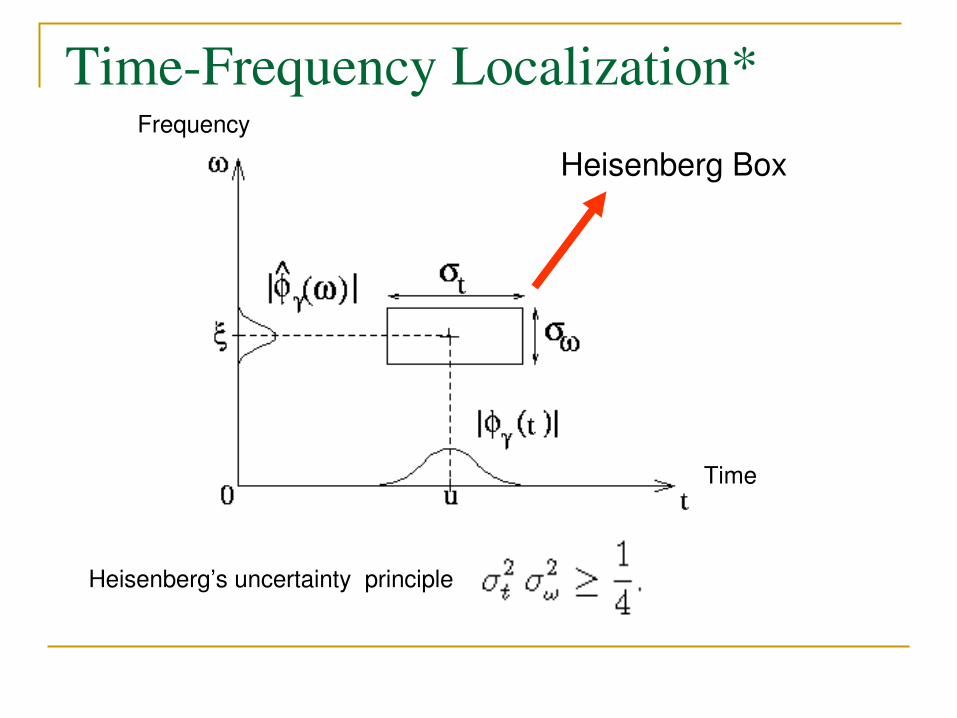
TimeFrequency Localization*
Time
FrequencyHeisenberg Box
Heisenberg’s uncertainty principle

Implication into Signal Analysis
You CANNOT arbitrarily improve both the resolution of time analysis and frequency analysis.
Timedomain representation Frequencydomain representation
FT
FT
How do we define “Instantaneous frequency”?

Speech Signal Analysis Why (longterm) FT is not appropriate for speech
signals? FT is the ideal tool for analyzing periodic or stationary
signals – frequency domain representation greatly helps the analysis
Like many other phenomena we observe in the natural worlds, speeches are transient or nonstationary signals whose properties change markedly as a function of time
Due to Heisenberg’s uncertainty principle, we can only find some compromised solution between time and frequency localization

ShortTime (Windowed) FT(Normal) Fourier Transform of a Sequence
TimeDependent Fourier Transform
X e jw=∑
−∞
∞
x n e− jwn
Xn ejw=∑
−∞
∞
wn−m x m e− jwm
window (typically Hamming)time frequency

Definition of Spectrogram (Sonogram) Windowed speech
window
speech
time freq.
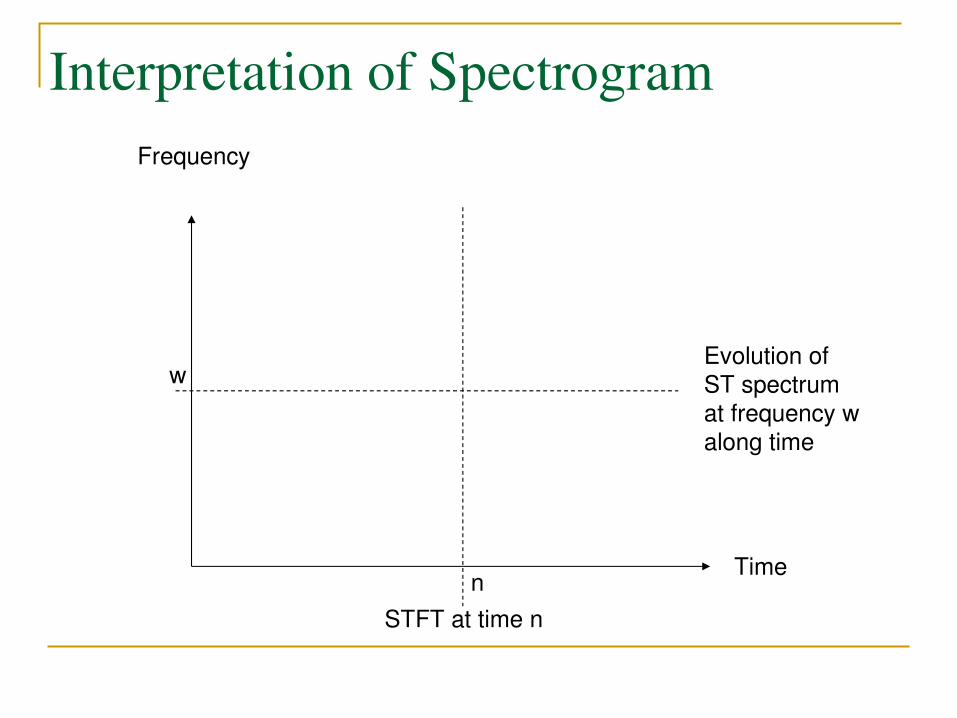
Interpretation of Spectrogram
Time
Frequency
STFT at time nn
Evolution ofST spectrumat frequency walong time
w
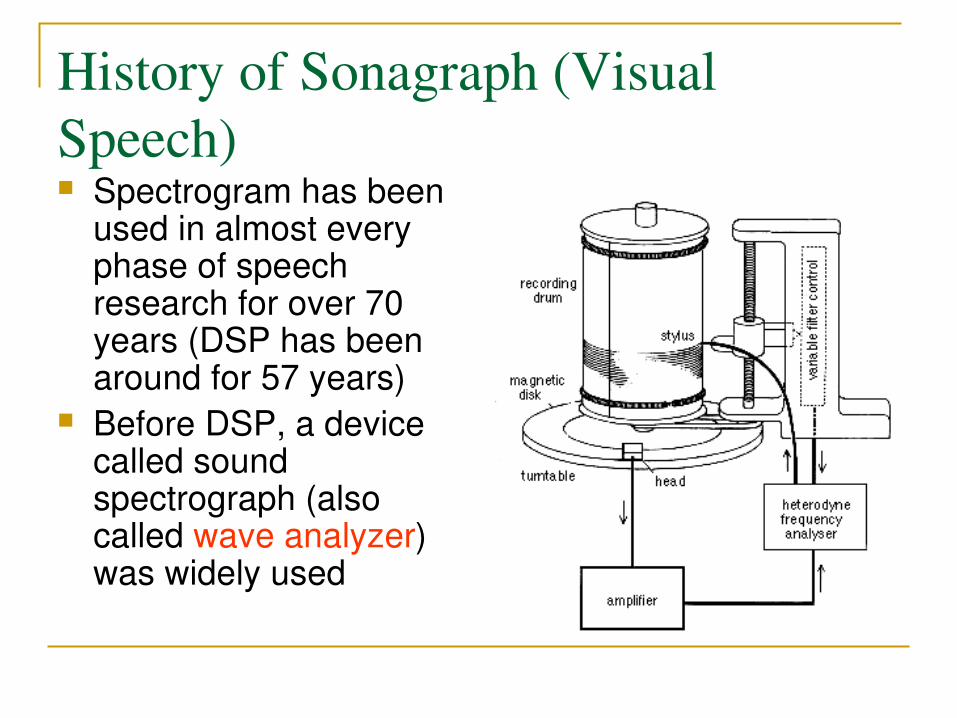
History of Sonagraph (Visual Speech) Spectrogram has been
used in almost every phase of speech research for over 70 years (DSP has been around for 57 years)
Before DSP, a device called sound spectrograph (also called wave analyzer) was widely used

Example of Spectrogram: Chirps
Chirps are analytic signals which have a particular instantaneous frequency

Example of Speech Spectrogram

Spectrogram Reading
We will use MATLAB demo to test your spectrogram reading capability

Spectrogram via Filter Bank*
Filter Bank

Spectrogram Calculation Under MATLABMethod 1: Use COLEA toolbox (it has a nice GUI)
Method 2: Use the demo program on the right
Cutandpaste it and saveIt as specgram_demo.m
>[x,fs]=wavread(filename);>specgram_demo(x,fs);
% function specgram_demo(y,fs)% display the spectrogram of speech signal% demo for EE493Q Fall 2006
function specgram_demo(y,fs)
% calculate the table of amplitudes[B,f,t]=specgram(y,1024,fs,256,192);% calculate amplitude 50dB down from maximumbmin=max(max(abs(B)))/300;% plot top 50dB as imageimagesc(t,f,20*log10(max(abs(B),bmin)/bmin));% label plotaxis xy;xlabel('Time (s)');ylabel('Frequency (Hz)');% build and use a grey scalelgrays=zeros(100,3);for i=1:100 lgrays(i,:) = 1i/100;endcolormap(hot);

/Hello/

/Don’t ask me/
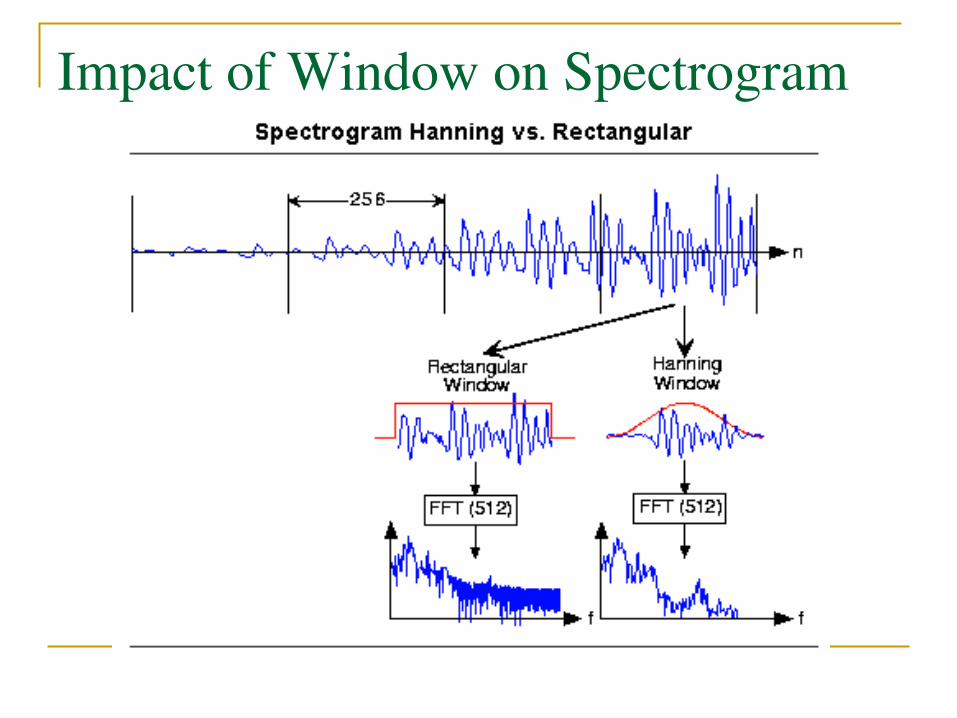
Impact of Window on Spectrogram

FrequencyDomain Speech Analysis
ShortTime Fourier Analysis Windowed (shorttime) Fourier Transform Spectrogram of speech signals Filter bank implementation*
Cepstral Analysis (Real) cepstrum and complex cepstrum Complex cepstrum for speech pitch detection
Echo hiding
From Spectrum to Cepstrum Recall fundamental assumption about
speech signal: speech can be represented as the output of a linear filtering system whose excitation and system response vary slowly with time To separate excitation e(n) from the system
response h(n), we need to perform some kind of deconvolution in the frequency domain: X(w)=E(w)H(w)
Multiplication is not as easy as addition to deal with; can we convert product into sum?
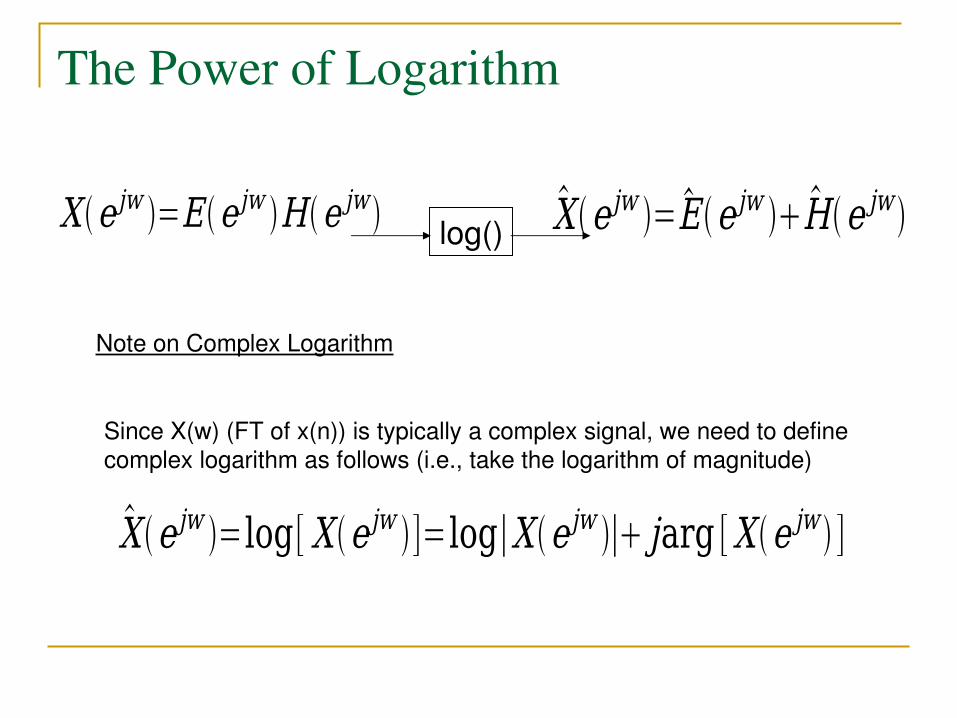
The Power of Logarithm
log()X e jw =Ee jw He jw X e jw = Ee jw He jw
Note on Complex Logarithm
Since X(w) (FT of x(n)) is typically a complex signal, we need to definecomplex logarithm as follows (i.e., take the logarithm of magnitude)
X e jw =log[ X e jw ]=log∣X e jw ∣ jarg [X e jw ]
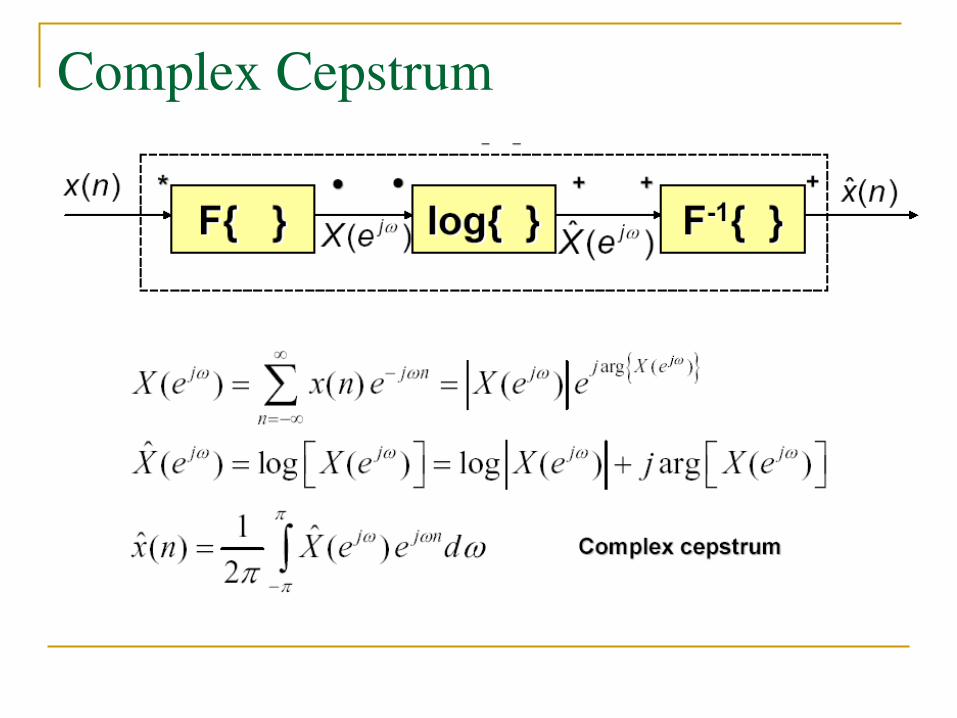
Complex Cepstrum

Phase Unwrapping Problem*
Note that

(Real) Cepstrum
cn =12π∫−π
πlog∣X e jw ∣e jwndw
F() Logmagnitude F1()x(n) X(ejw) log|X(ejw)| c(n)
Can show that cepstrum c(n) is the even part of complex cepstrum, i.e.
cn =12[ x n x −n ]
Hint: |X(w)| and arg[X(w)] are even and odd functions respectively

Complex Cepstrum Examplex n =δ n aδ n−N ,0a1
X e jw =1ae− jwN
X e jw =log[ X e jw ]=log[1ae− jwN]
¿∑n=1
∞ −1 n1
nane− jwnN
x n =∑k=1
∞ −1 k1
kδn−kN
Conclusion: the complex cepstrum of a train of uniformly spaced impulsesis also a uniformly spaced impulse train with the same spacing

Complex Cepstrum of Speech
Model of speech Voiced speech is produced by quasiperiodic
pulse train exciting slowly time varying linear system, i.e. e(n)=p(n)
Unvoiced speech is produced by random noise exciting slowly time varying linear system, i.e. e(n)=u(n)
Glottis, vocal tract and radiation at the lip can all be modeled by slowly time varying linear systems

Full Model for Voiced Speech
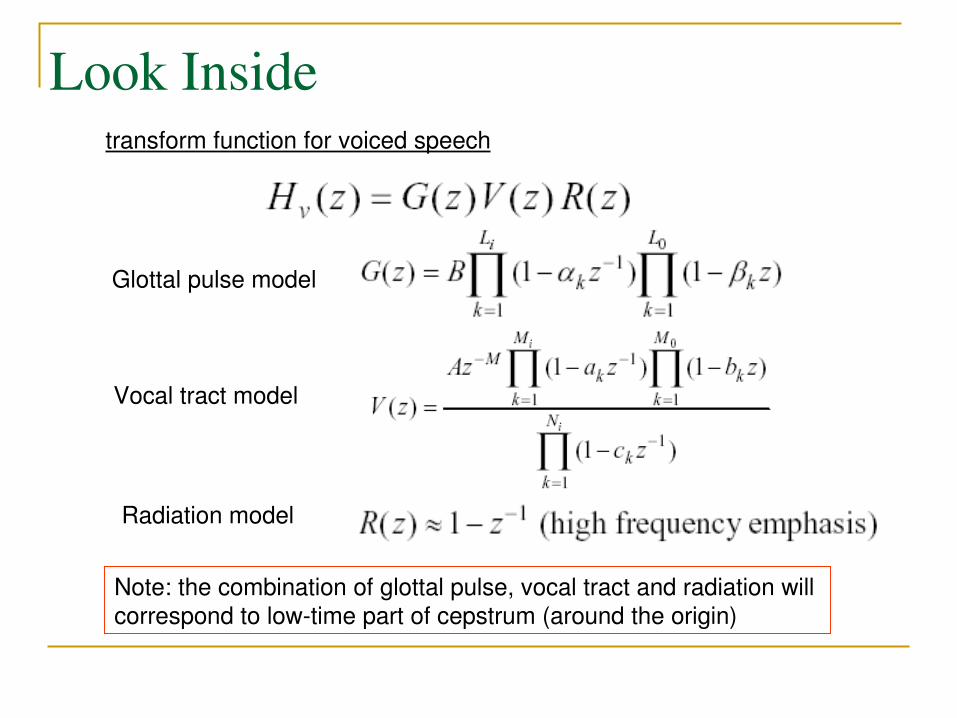
Look Insidetransform function for voiced speech
Glottal pulse model
Vocal tract model
Radiation model
Note: the combination of glottal pulse, vocal tract and radiation will correspond to lowtime part of cepstrum (around the origin)

Complex Cepstrum for Voiced Speech
ARG(X(ejw))
arg(X(ejw))

Full Model for Unvoiced Speech
Transfer function for unvoiced speech
Note the two differences from voiced speech: 2) Excitation is no longer an impulse train but random noise3) No glottal pulse model is involved

Complex Cepstrum for Unvoiced Speech

Pitch Detection in Cepstrum Domain

ShortTime Fourier Analysis Windowed (shorttime) Fourier Transform Spectrogram of speech signals Filter bank implementation*
Cepstral Analysis (Real) cepstrum and complex cepstrum Complex cepstrum for speech pitch detection
Echo hiding
FrequencyDomain Speech Analysis

Background on Music Piracy
An estimate of $4.3 billion loss each year due to piracy of digital music content
That is what the whole napster story about – no more free music
Watermarking was proposed as one possible technical solution to copyright protection but its future remains uncertainty

What is Watermarking?

Echo Hiding
Proposed by Gruhl, Bender and Lu of MIT Media Lab in 1999 Since then, various audio data hiding techniques have
been proposed Basic idea is to exploit the masking property of human
auditory system – when an echoed signal is placed close to the host signal, it is inaudible to human ears but detectable by machine
Decoding is done in cepstrum domain That is why we are interested in it here!
Demo of Speech with Echoes
Original speech
Modified speech with severe echo
Modified speech with slight echo
Modified speech with five echoes
Conclusion: as long as echoes are inserted to the right place and

How to Hide One Bit?

Toy Example

Encoding Multiple Bits

Encoding Multiple Bits (Con’t)

Cepstrum Decoding

Decoding Examples
Bit “1”
Bit “0”

Echo Hiding Summary
Information is embedded by adding echoes located at different positions
By controlling the amplitude and distance of echoes, we can achieve perceptual transparency
Embedded information can be extracted by detecting echoes in the cepstrum domain
The down side of this approach is lack of security – i.e., hacker can easily remove echoes or make it undetectable

OneMinute Survey
What is the muddiest point in this week’s lecture?
What is the difference between shorttime FT and FT?
What is the use of cepstrum in echo hiding applications?
Related Documents