Pergamon Mechatronics Vol. 6, No. 8, pp. 855-866, 1996 Copyright © 1996 Elsevier Science Ltd. All rights reserved. Printed in Great Britain. 0957-4158/96 $15.00+0.00 PII: S0957-4158 (96) 00031-1 FREQUENCY TRANSFER FUNCTION OF AN OPTO-PNEUMATIC DETECTOR G. BELFORTE,* T. RAPARELLI,* V. VIKTOROV,* G. EULA* and A. IVANOV* *Department of Mechanics, Politecnico di Torino C.so Duca degli Abruzzi 24, 10129 Torino, Italy and tDepartment of Energetics, Universith di L'Aquila 67040 Roio Poggio, L'Aquila, Italy (Received 26 May 1996; accepted 4 July 1996) Abstract--An example of an opto-pneumatic detector's (OPD) frequency trans- fer function is presented for the development of an opto-pneumatic interface. The theoretical model is tested through experiments in the laboratory on a real OPD prototype. In this way many of the model's parameters are studied and evaluated, such as the dimensions of the gas chamber, the thickness of the absorbent body, and the load of the OPD. The results obtained are good and show the utility of the studies described here. Copyright (~) 1996 Elsevier Science Ltd. NOMENCLATURE C thermal capacitance Cp specific heat at constant pressure F impulse frequency G fluid conductance L length L' effective length M mass p pressure Q volume flow rate q power of the optic signal qs surface signal power R thermal resistance R ° gas constant T time constant T ° temperature t time r chamber radius S surface area V volume thermal conductivity 855

Welcome message from author
This document is posted to help you gain knowledge. Please leave a comment to let me know what you think about it! Share it to your friends and learn new things together.
Transcript
Pergamon
Mechatronics Vol. 6, No. 8, pp. 855-866, 1996 Copyright © 1996 Elsevier Science Ltd. All rights reserved.
Printed in Great Britain. 0957-4158/96 $15.00+0.00
PII: S0957-4158 (96) 00031-1
FREQUENCY TRANSFER FUNCTION OF AN OPTO-PNEUMATIC DETECTOR
G. BELFORTE,* T. RAPARELLI,* V. VIKTOROV,* G. EULA* and A. IVANOV*
*Department of Mechanics, Politecnico di Torino C.so Duca degli Abruzzi 24, 10129 Torino, Italy and tDepartment of Energetics, Universith di L'Aquila 67040 Roio Poggio,
L'Aquila, Italy
(Received 26 May 1996; accepted 4 July 1996)
Abstract--An example of an opto-pneumatic detector's (OPD) frequency trans- fer function is presented for the development of an opto-pneumatic interface. The theoretical model is tested through experiments in the laboratory on a real OPD prototype. In this way many of the model's parameters are studied and evaluated, such as the dimensions of the gas chamber, the thickness of the absorbent body, and the load of the OPD. The results obtained are good and show the utility of the studies described here. Copyright (~) 1996 Elsevier Science Ltd.
NOMENCLATURE
C thermal capacitance Cp specific heat at constant pressure F impulse frequency G fluid conductance L length L' effective length M mass p pressure Q volume flow rate q power of the optic signal qs surface signal power R thermal resistance R ° gas constant T time constant T ° temperature t time r chamber radius S surface area V volume
thermal conductivity
855
856 G. BELFORTE et al.
p density e coefficient
Subscr ip t s
a absorbent ad additional chamber am ambient g gas O initial conditions
INTRODUCTION
The opto-pneumatic interface offers the greatest promise in the automation of installations located under fire- and explosive-hazardous conditions and under condi- tions where there are electromagnetic or radiation field actions, whereby electrical communication channel application is undesirable or impossible, and where pneumatic channels do not provide the required speed of response [1-10]. The opto-pneumatic converter (OPC) is a key component of the opto-pneumatic interface. It provides communication between control systems with an optical output signal and pneumatic servo-drives, sensors and other automatic devices. Optical signals are transmitted to the OPC on fibre-optic channels. One of the best methods of creating the OPC is based on the operational concept of a conversion of optical energy into heat form in the opto-pneumatic detector (OPD), producing the expansion of gas and increasing pressure in a detector chamber [11-16] connected to a laminar fluidic amplifier [4,5, 9, 10]. Research into this type of OPC began in the mid 1980s [5]. The opto-to-pressure jet deflection (OPJD) OPC has no electrical elements, as distinct, for example, from one [1,8] having no moving parts such as the OPC with an elastic membrane and a nozzle [12]. It is far simpler and has a light absorption body more guarded against soiling and wear than OPCs operating by a method of deflection of a supply jet resulting from an optical action on the fluid viscosity which creates an asymmetric jet flow [2], and it is faster acting than direct optical-to-mechanical actuation devices [6].
As a result of the above, OPJD OPCs have an advantage over other types of OPCs, and they are a topical subject of research. In order to improve the performance of the OPJD OPCs it is very important to obtain a high pressure level and a fast-response output signal from the OPD. To solve this problem it is necessary to have a mathematical model of the OPD. In many instances of engineering practice it is helpful to have an identification model expressed by a frequency transfer function (FTF) of the process. A model of this type provides the possibility of analysing processes using well known methods and elaborated software. In the case of the OPD, where very often the optic signal used as input has a rectangular pulse, the determination of a response of the FTF on step input is the solution to the problem. The solution can be split into two parts: an elaboration of a mathematical model in lumped elements and then, after comparison of the theoretical and the experimental results, a definition of compensating factors.
Frequency transfer function of an opto-pneumatic detector 857
ELABORATION OF THE MATHEMATICAL MODEL
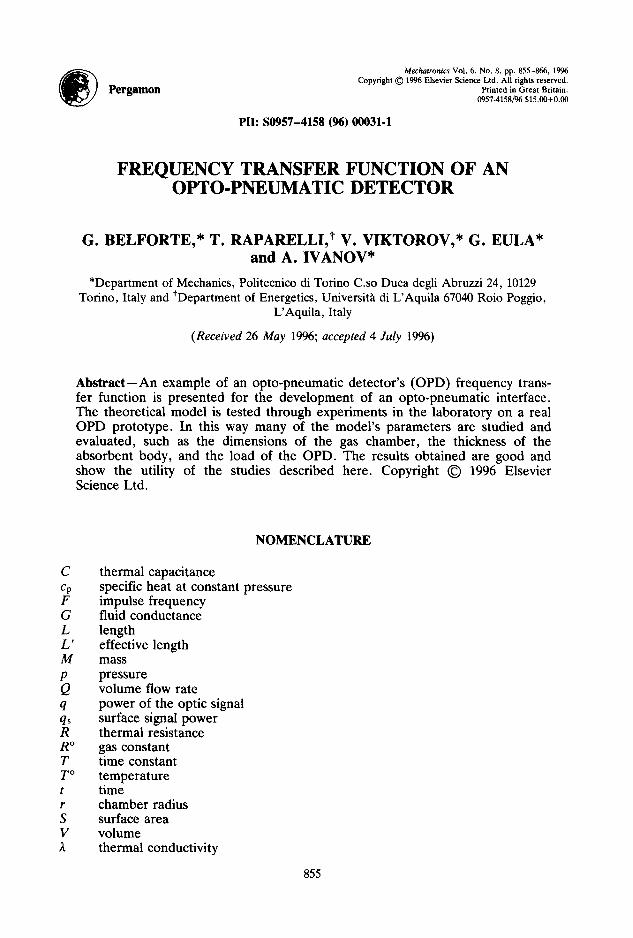
Figure 1 shows a schematic diagram of the OPD, which consists of an optical absorbent (1), a gas chamber (2), a frame (3), a transparent plate (4), a cover (5), and an outlet (6) connected with a fluid load (7). An input optical signal q passes through the transparent plate (4) towards the gas chamber (2) and interacts with absorbent (1) located at the gas chamber bottom, changing its temperature. Because of this the distribution of the gas temperature in chamber (2) is varied, resulting in a change of pressure p in the chamber. The difference in pressure between p and ambient pressure Pare is usually an output signal.
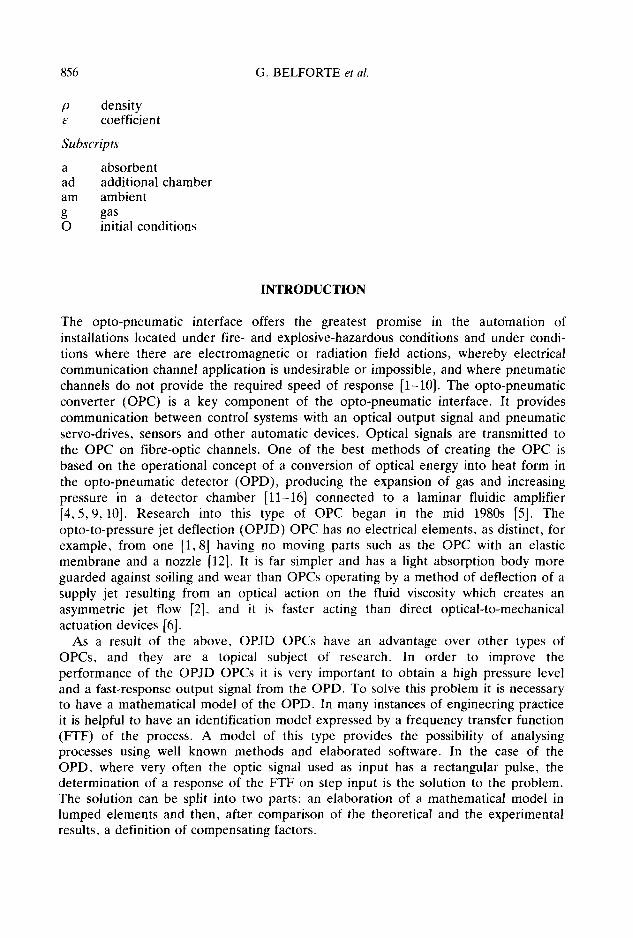
It is usual to construct the massive frame (3) from metals which have very high thermal conductivity and capacity. Taking into consideration that we are dealing with dynamic thermal processes having relatively high frequency and in the majority of instances we would like to know the values of an increment in the pressure pg in the OPD, it is possible to assume that the temperature of the inner frame wall is equal to ambient temperature T ° . The same assumption is taken for the inner side of the transparent plate (4), which usually has a small thickness and is connected with the frame by the massive metal cover (5). The OPD thermal circuit represented in the lumped elements is shown in Fig. 2. In this circuit thermal resistance is expressed as R -- L/A.S, where L is length in the axis direction, A is thermal conductivity, S is area of the absorbent surface, and capacitance is given as C = pcpLS, where p is density and Cp is specific heat at constant pressure. The subscript a stands for the absorbent and the subscript g for the gas in the chamber. The temperature of the absorbent illuminated surface is labelled T ° . The resistances of the absorbent and the gas are separable by two components ( 1 - e~)Ra, e~R~, and ( 1 - eg)Rg, egRg, respectively, where 0 < ea,g < 1, for purposes of extending identification possibilities. From the basic laws of heat conduction it is possible to write five equations for the circuit
q = qa + qg (1)
S
V
Fig. 1. Schematic diagram of the OPD.
858 G. BELFORTE et al.
~ a 0
U.T/L
(1 ~<)< (]
' :g r ~ i / %
J l - < - - " .... / (]9' L ,,
J~ c , c '%o 1 0 (2 i
7, o 7 , ° (ZT~ (ZT~
Fig. 2. The OPD thermal circuit.
. . . . 0 ~ O
~77Z
q a - -
q g - -
T 7 - - T O m d W ° ~ a + C a - - (2)
a'aR a dt
r7 - ~; qa - (3)
(1 - G)Ra o o o
T g - Tam dTg + C - (4)
~gR~ g dt o
T O - Tg (5) qg - ( 1 - £g)Rg
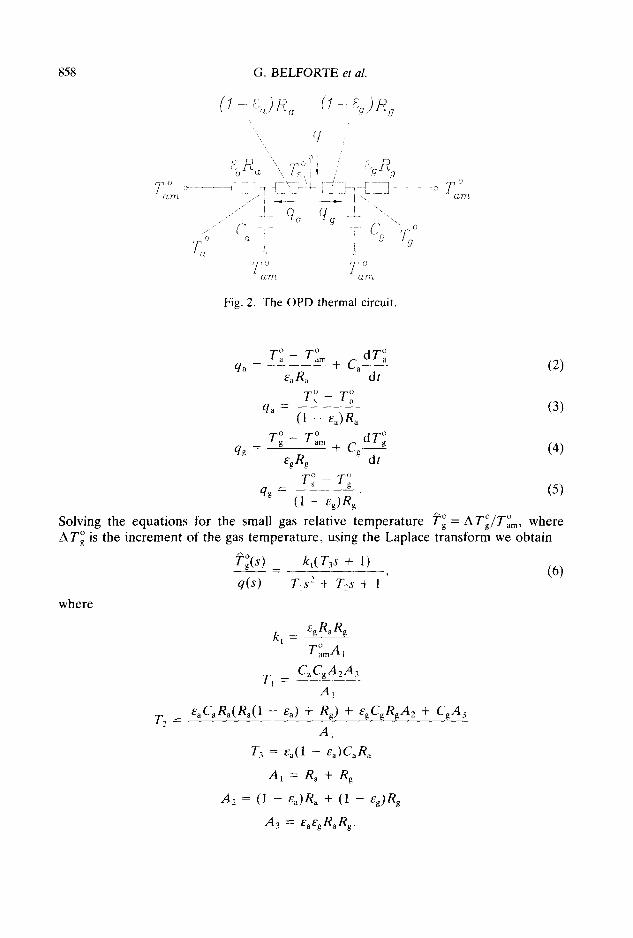
h O 0 0 Solving the equat ions for the small gas relative t e m p e r a t u r e Tg = A Tg/Tam, where A Tg is the increment of the gas t empe ra tu r e , using the Laplace t r ans form we obta in
A o Tg(s) _ kt(T3s + 1) (6) q(s) Tls: + T 2 s + 1
where
=
k t - ~'gRaRg
T~mA I
T 1 - CaCgA2A3
AI
G C a R d R a ( 1 - G) + Rg) + CgCgRgA 2 + CgA 3
A 1
r~ = e . ( 1 - ~ . ) c o R .
A l = R ~ + Rg
A 2 = (1 - ~'a)Ra + ( l -- £g)Rg
A3 -- eaegRaRg.
Frequency transfer function of an opto-pneumatic detector 859
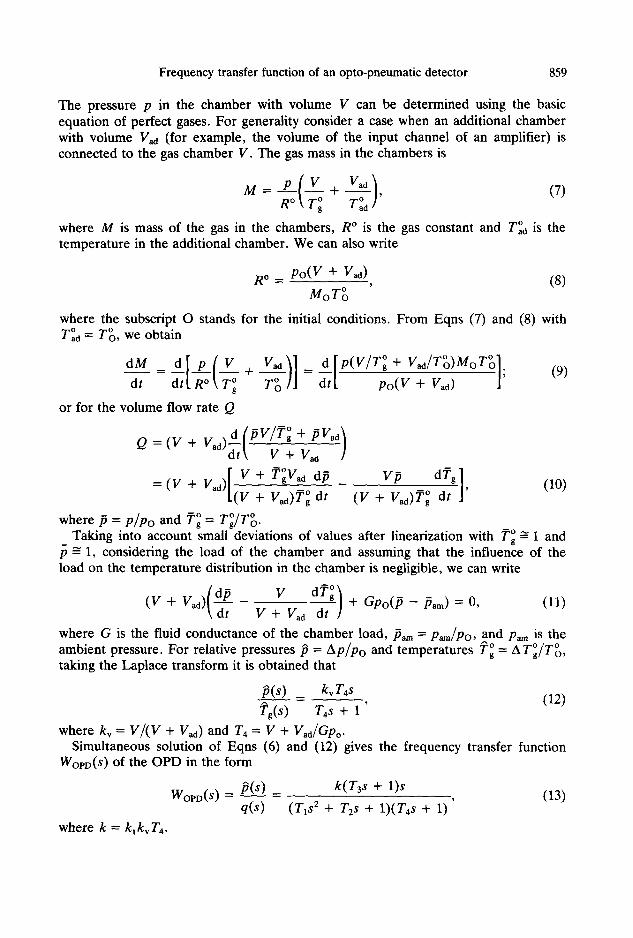
The pressure p in the chamber with volume V can be determined using the basic equation of perfect gases. For generality consider a case when an additional chamber with volume Vaa (for example, the volume of the input channel of an amplifier) is connected to the gas chamber V. The gas mass in the chambers is
Tg Ta°d
where M is mass of the gas in the chambers, R ° is the gas constant and T°o is the temperature in the additional chamber. We can also write
R o = p o ( V + Vao), (8) MoT~
where the subscript O stands for the initial conditions. From Eqns (7) and (8) with T°o = T~, we obtain
aM v.o)] alP(v/r° + v o/r°o)Mor°o 1. dr dt r~ + T~ a t [ po(V + Vad) ] (9)
or for the volume flow rate Q
, , , a_lpvL + pvao I Q = (V + ,aS,,dt[ V + ~'~a ]
[ V + T~V~o d p V , dT~.], (10) = ( V + V~d) ( + Vad)T~dt (V + Vao)T~ dt J
- - 0 0 0 where p = MOo and = r d r o .
- - 0 Taking into account small deviations of values after linearization with Tg ~ 1 and /5 ~ 1, considering the load of the chamber and assuming that the influence of the load on the temperature distribution in the chamber is negligible, we can write
(V + Vao)( dp - V __dTg/ + Gpo(/5 - tSam ) = 0, (11) \ d t V + Vad dt /
where G is the fluid conductance of the chamber load, /5~ = P~/Po, and p ~ is the ambient pressure. For relative pressures p = Ap/po and temperatures Tg = AT°g/T°o, taking the Laplace transform it is obtained that
p ( S ) - kvT4s , (12)
Tg(s) T4s + 1 where kv = V/(V + Vao) and T4 = V + Vao/GPo.
Simultaneous solution of Eqns (6) and (12) gives the frequency transfer function Woer)(s) of the OPD in the form
WOPD(S ) -- p(S) -- k(T3s + 1)s (13) q(s) (Tx s2 + T2s + 1)(T4s + 1)'
where k = k t kv To.
860 G. BELFORTE et al.
E X P E R I M E N T A L A P P A R A T U S A N D P R O C E D U R E S
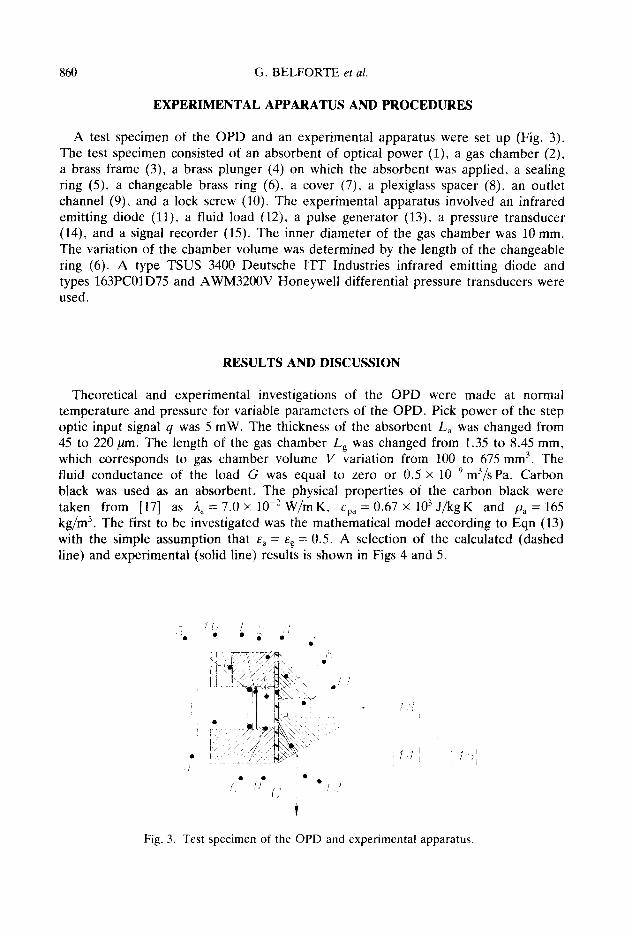
A test specimen of the OPD and an experimental apparatus were set up (Fig. 3). The test specimen consisted of an absorbent of optical power (i), a gas chamber (2), a brass frame (3), a brass plunger (4) on which the absorbent was applied, a sealing ring (5), a changeable brass ring (6), a cover (7), a plexiglass spacer (8), an outlet channel (9), and a lock screw (10). The experimental apparatus involved an infrared emitting diode (11), a fluid load (12), a pulse generator (13), a pressure transducer (14), and a signal recorder (15). The inner diameter of the gas chamber was 10 mm. The variation of the chamber volume was determined by the length of the changeable ring (6). A type TSUS 3400 Deutsche ITT Industries infrared emitting diode and types 163PC01D75 and AWM3200V Honeywell differential pressure transducers were used.
RESULTS AND DISCUSSION
Theoretical and experimental investigations of the OPD were made at normal temperature and pressure for variable parameters of the OPD. Pick power of the step optic input signal q was 5 roW. The thickness of the absorbent La was changed from 45 to 220/~m. The length of the gas chamber L g w a s changed from 1.35 to 8.45 ram, which corresponds to gas chamber volume V variation from 100 to 675 mm 3. The fluid conductance of the load G was equal to zero or 0.5 × 10 -9 m3/sPa. Carbon black was used as an absorbent. The physical properties of the carbon black were taken from [17] as A a = 7 . 0 × 10-2W/mK, Cp, = 0 . 6 7 × 10³j /kgK and Pa = 165 kg/m 3. The first to be investigated was the mathematical model according to Eqn (13) with the simple assumption that e~ = eg -- 0.5. A selection of the calculated (dashed line) and experimental (solid line) results is shown in Figs 4 and 5.
• J ,
• J /
,~) (?
i i
Fig. 3. Test specimen of the OPD and experimental apparatus.
Frequency transfer function of an opto-pneumatic detector 861
30
20
10
i
0
L a = 150 ~m, V = 105 mm 3 !
- . / y ' . . . . . .
/
i i
I
0.05 0.1
t (s)
20
15
10
5
0 0
L a = 150 I~m, V = 350 mm 3 i
0.05 O. 1
t (s)
10 L a = 150 ~m, V = 665 mm 3 L a = 45 Ixm, V = 675 mm 3
8
6
4
2
0 0 0.05 0.1
v
4
3
2
1
0 0 0.05 0. l
t (s) t (s)
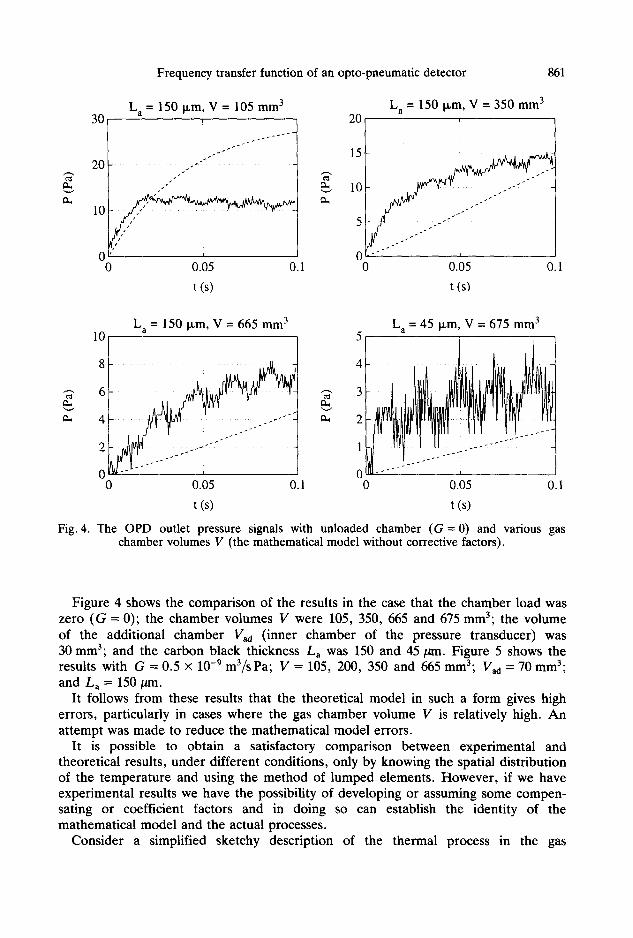
Fig. 4. The OPD outlet pressure signals with unloaded chamber (G = 0) and various gas chamber volumes V (the mathematical model without corrective factors).
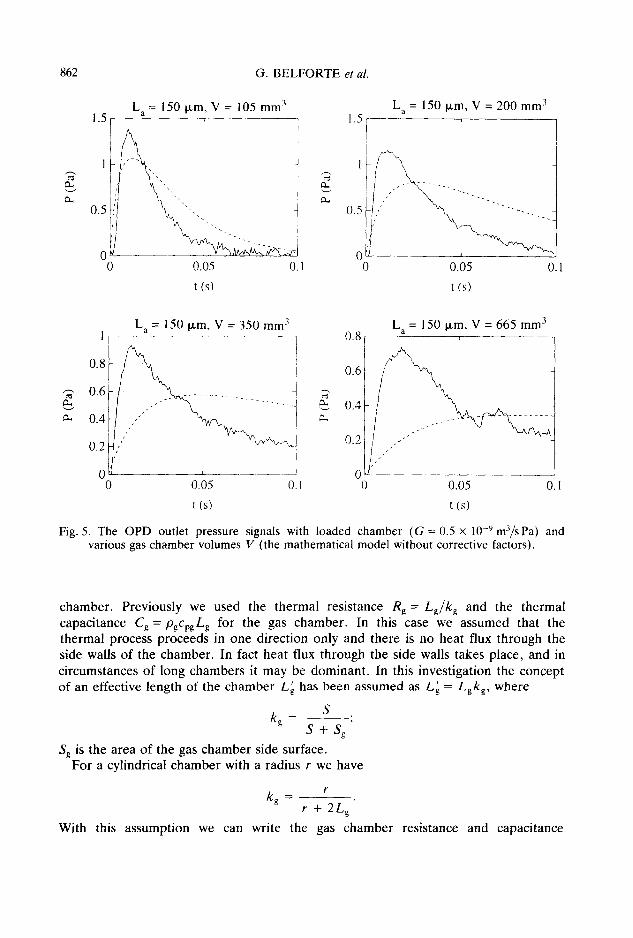
Figure 4 shows the comparison of the results in the case that the chamber load was zero (G = 0); the chamber volumes V were 105, 350, 665 and 675 ram3; the volume of the additional chamber Vaa (inner chamber of the pressure transducer) was 30 mm3; and the carbon black thickness La was 150 and 45/an . Figure 5 shows the results with G = 0.5 × 10 -9 m3/sPa; V = 105, 200, 350 and 665 mm3; Vad = 70 mm3; and L a = 150/~m.
I t follows f rom these results that the theoretical model in such a form gives high errors, particularly in cases where the gas chamber volume V is relatively high. An at tempt was made to reduce the mathematical model errors.
It is possible to obtain a satisfactory comparison between experimental and theoretical results, under different conditions, only by knowing the spatial distribution of the tempera ture and using the method of lumped elements. However , if we have experimental results we have the possibility of developing or assuming some compen- sating or coefficient factors and in doing so can establish the identity of the mathematical model and the actual processes.
Consider a simplified sketchy description of the thermal process in the gas
862 G. BELFORTE et al.
L a = 150 txm, V = 105 mm 3 1.5
0 2~ 0 0.05 O. 1
1.5 L a = 150 ~m, V = 200 mm 3
0.5
0 0 0.05 0.
t ( s ) t ( s )
L = 150 Ixm, V = 350 mm 3 L a = 150 t~m, V = 665 mm 3 1 _a ,
i ' -g, 0.6 ~, . . . . . . . . . ¢~ 0.4
a. 0.4 ~" "
0 . . . . . 0 0 0.05 0.1 0 0.05 0.1
t (s) t (s)
Fig. 5. The OPD outlet pressure signals with loaded chamber (G = 0.5 x 10 -9 m3/sPa) and various gas chamber volumes V (the mathematical model without corrective factors).
chamber . Prev ious ly we used the t he rma l res is tance Rg = Lg/kg and the the rmal capac i t ance Cg = pgcpgLg for the gas chamber . In this case we as sumed that the t he rma l process p roceeds in one d i rec t ion only and the re is no hea t flux th rough the side walls of the chamber . In fact hea t flux th rough the side walls t akes p lace , and in c i rcumstances o f long chamber s it m a y be dominan t . In this inves t iga t ion the concep t
t of an effect ive length of the c h a m b e r L~ has been as sumed a s t g = Lgkg, where
S k g -
s+s~ Sg is the a r ea o f the gas c h a m b e r side surface.
F o r a cyl indr ica l c h a m b e r with a rad ius r we have
r
k g - r + 2Lg"
Wi th this a s sumpt ion we can wri te the gas c h a m b e r res is tance and capac i t ance
Frequency transfer function of an opto-pneumatic detector 863
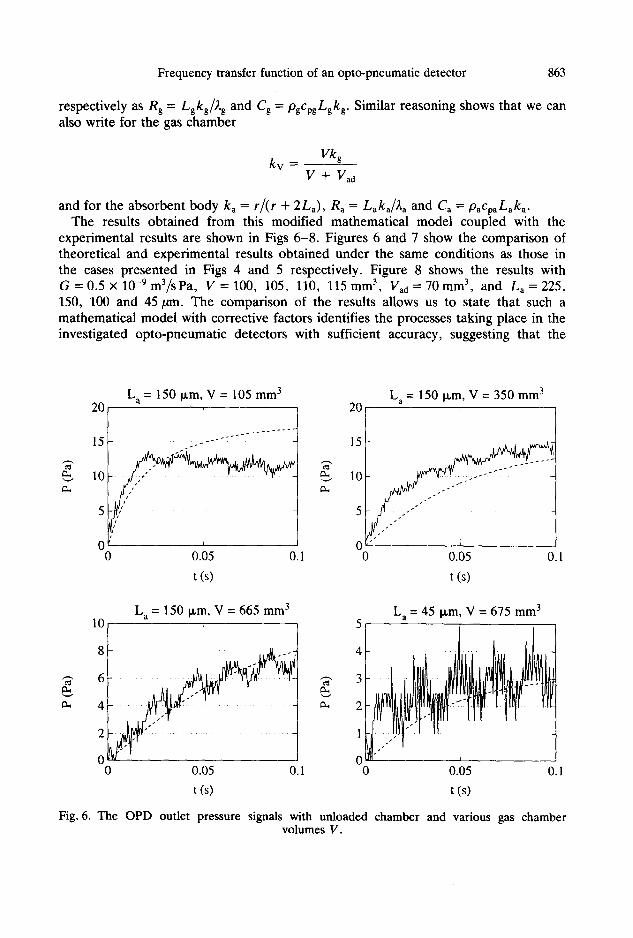
respectively as R e = Lgkg/~,g and Cg = pgcpgLgkg. Similar reasoning shows that we can also write for the gas chamber
kv = Vkg V -4- Vad
and for the absorbent body k a = r/(r + 2La), Ra = Laka/~.~ and C a = p~cpaLak a. The results obtained from this modified mathematical model coupled with the
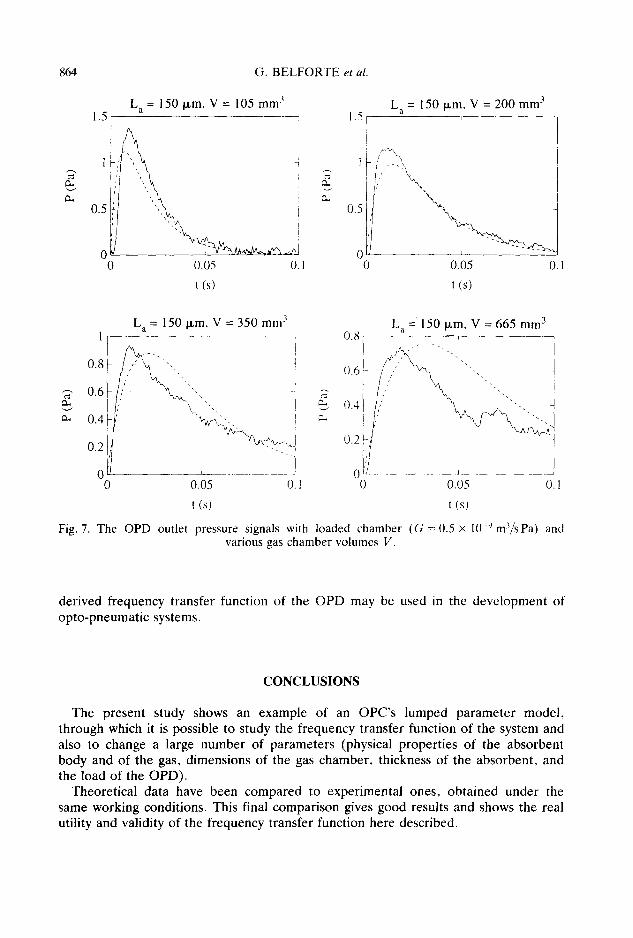
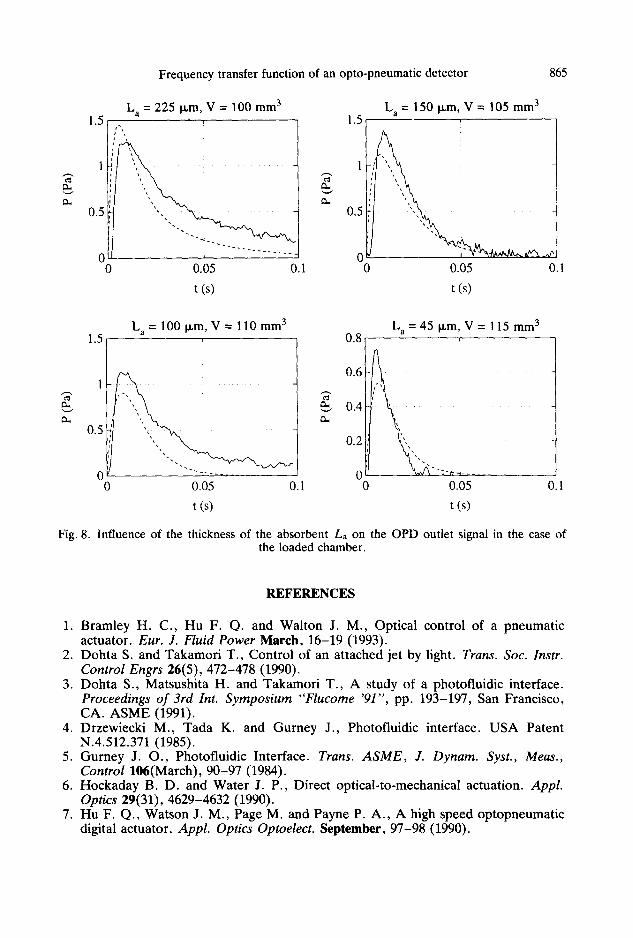
experimental results are shown in Figs 6-8. Figures 6 and 7 show the comparison of theoretical and experimental results obtained under the same conditions as those in the cases presented in Figs 4 and 5 respectively. Figure 8 shows the results with G = 0.5 × 10 -9 m3/sPa, V = 100, 105, 110, 115 mm 3, Vad = 70 mm 3, and La = 225, 150, 100 and 45/an. The comparison of the results allows us to state that such a mathematical model with corrective factors identifies the processes taking place in the investigated opto-pneumatic detectors with sufficient accuracy, suggesting that the
L a = 150 p,m, V = 105 mm 3 L a = 150 I~m, V = 350 mm 3 20 20
15
10
5
0 0
i
i t •
1
0.05 0.1
t (s)
-ff
r ~
15
10
5
0 0 0.05 O. 1
t (s)
10 L a = 150 ~m, V = 665 mm 3
8
6
4
2
0 0
I
0.05 0.1
L a = 45 ~m, V = 675 mm 3
v
0 0.05
t (s) t (s)
0.1
Fig. 6. The OPD outlet pressure signals with unloaded chamber and various gas chamber volumes V.
864 G. BELFORTE et al.
1.5
0.5
0 0
L a = 150 I~m, V = 105 mm 3
0.05 0. I
,q
1.5
0.5
0 0
L a = 150 I, zm, V = 200 mm 3
"
O.05 O. 1
t (s) t(s)
L a = 150 Ixm, V = 350 mm ~ 0.8
~'~-~-. '?1
o o.05 o. 1
0.8:
0.6
z~ 0.4
0.2
L a 1 5 0 ~m, V = 665 mm 3 i
o4 l/' \ ' i ' -..
0 . . . .
0 0.05 0. l
t (s) t (s)
Fig. 7. The OPD outlet pressure signals with loaded chamber (G = 0.5 × 10 --9 m3/sPa) and various gas chamber volumes V.
derived f requency transfer function of the O P D may be used in the deve lopment of op to-pneumat ic systems.
C O N C L U S I O N S
The present study shows an example of an O P C ' s lumped pa ramete r model , th rough which it is possible to study the f requency transfer function of the system and also to change a large number of parameters (physical propert ies of the absorbent body and of the gas, dimensions of the gas chamber , thickness of the absorbent , and the load of the OPD) .
Theoret ical data have been compared to experimental ones, obta ined under the same working conditions. This final compar ison gives good results and shows the real utility and validity of the f requency transfer function here described.
Frequency transfer function of an opto-pneumatic detector 865
-ff
1.5 L a = 225 Ixm, V = 100 mm 3
0.5
0 0
I
0.05 0.1
t (s)
-ff v
t~
1 . 5 - -
0.5
0 0
L a = 150 I-~m, V = 105 mm 3
0.05 0.1
t (s)
1.5
0.5
L a = 1 O0 p.m, V = 110 mm 3
t~
" 1 - - - - ° . . ,
0.05 0.1 0 II k , ~ / ~,
0 0 0.05 0.1
0.8
0.6
0.4
0.2
0
L a = 45 ~m, V = 115 mm 3
t (s) t (s)
Fig. 8. Influence of the thickness of the absorbent La on the OPD outlet signal in the case of the loaded chamber.
REFERENCES
1. Bramley H. C., Hu F. Q. and Walton J. M., Optical control of a pneumatic actuator. Eur. J. Fluid Power March, 16-19 (1993).
2. Dohta S. and Takamor i T., Control of an attached jet by light. Trans. Soc. Instr. Control Engrs 26(5), 472-478 (1990).
3. Dohta S., Matsushita H. and Takamor i T. , A study of a photofiuidic interface. Proceedings of 3rd Int. Symposium "Flucome '91", pp. 193-197, San Francisco, CA. ASME (1991).
4. Drzewiecki M., Tada K. and Gurney J., Photofluidic interface. USA Patent N.4.512.371 (1985).
5. Gurney J. O. , Photofluidic Interface. Trans. ASME, J. Dynam. Syst., Meas., Control 106(March), 90-97 (1984).
6. Hockaday B. D. and Water J. P., Direct optical-to-mechanical actuation. Appl. Optics 29(31), 4629-4632 (1990).
7. Hu F. Q. , Watson J. M., Page M. and Payne P. A. , A high speed optopneumat ic digital actuator, Appl. Optics Optoelect. September, 97-98 (1990).
866 G. BELFORTE et al.
8. Hu F. Q., Watson J. M., Page M. and Payne P. A., A fast opto-pneumatic converter. Mechatronics 3,369-374 (1993).
9. Viktorov V., An optofluidic converter. Transaction of the All-Union Conference "Pneumohydroautomatic and Hydraulic Power, Suzdal, URSS (1990).
10. Yamamoto K., Characteristic of an optofluidic converter utilizing photoacoustic effect. Trans. Soc. Instr. Control Engrs 27(12), 78-85 (1991).
11. Golay M. J. E., Theoretical consideration in heat and infrared detection, with particular reference to the pneumatic detector. Rev. Sci. Instr. 18(5), 347-356 (1947).
12. Hale K. F., Clack C., Duggen R. F. and Jones B. E., High sensitivity optopneumatic converter, lEE Proc. 135(5), 348-352 (1988).
13. Murphy J. C. and Aamodt L. C., The photothermophone, a device for absolute calibration of photoacoustic spectrometers. Appl. Phys. Lett. 31(1), 728-730 (1977).
14. Nelson D. F., Wecht K. W. and Kleinman D. A., Photophone performance. J. Acoust. Soc. 60(1), 251-255 (1976).
15. Parker L. C., Size considerations in the design of cells for photoacoustic spectroscopy. J. Appl. Phys. 48(3), 927-933 (1977).
16. Pinnock R. A., A photoacoustic measuring device. U.K. Patent Application GB2194049A (1988).
17. Kutateladze S. S. and Borishanskii V. M., A Concise Encyclopedia of Heat Transfer. Pergamon Press, Oxford (1966).
Related Documents