Frequency Response of a Circuit Z. Aliyazicioglu Electrical and Computer Engineering Department Cal Poly Pomona ECE307 ECE 307-4 2 Frequency Response of a Circuit Analysis of a circuit with varying frequency of a sinusoidal sources is called the frequency response of a circuit Some Preliminaries , Frequency selection in the circuits are called filters because of their ability to filter out certain input signals on the basis of frequency Filter Input signal Output signal

Welcome message from author
This document is posted to help you gain knowledge. Please leave a comment to let me know what you think about it! Share it to your friends and learn new things together.
Transcript

1
Frequency Response of a Circuit
Z. Aliyazicioglu
Electrical and Computer Engineering DepartmentCal Poly Pomona
ECE307
ECE 307-4 2
The Laplace TransformFrequency Response of a Circuit
Analysis of a circuit with varying frequency of a sinusoidal sources is called the frequency response of a circuit
Some Preliminaries
, Frequency selection in the circuits are called filters because of their ability to filter out certain input signals on the basis of frequency
FilterFilterInput signal Output signal

2
ECE 307-4 3
Frequency Response of a Circuit
We remember that the transfer function is the output voltage to the input voltage of a circuit in s-domain is.
0( )( )( )i
V sH sV s
=
0( )( )( )i
V jH jV j
ωωω
=
Using sinusoidal source, the transfer function will be the magnitude and phase of output voltage to the magnitude and phase of input voltage of a circuit .
In this case we will use (jω) instead of s .
Some Preliminaries
ECE 307-4 4
Frequency Response of a Circuit
Using transfer function of circuit, we plot a frequency response of the circuit for both amplitude and phasewith changing source frequency
One graph of |H(jω)| versus frequency jω. It is called the Magnitude plot.One graph of θ(jω) versus frequency ω. It is called the Phase Angle plot
Frequency Response
Passband
ωc
ω
|H(jω)|
Stopband
ωc
ωθ(jω)
θ(jωc)
ωc : Cutoff frequency
3
ECE 307-4 5
Frequency Response of a Circuit
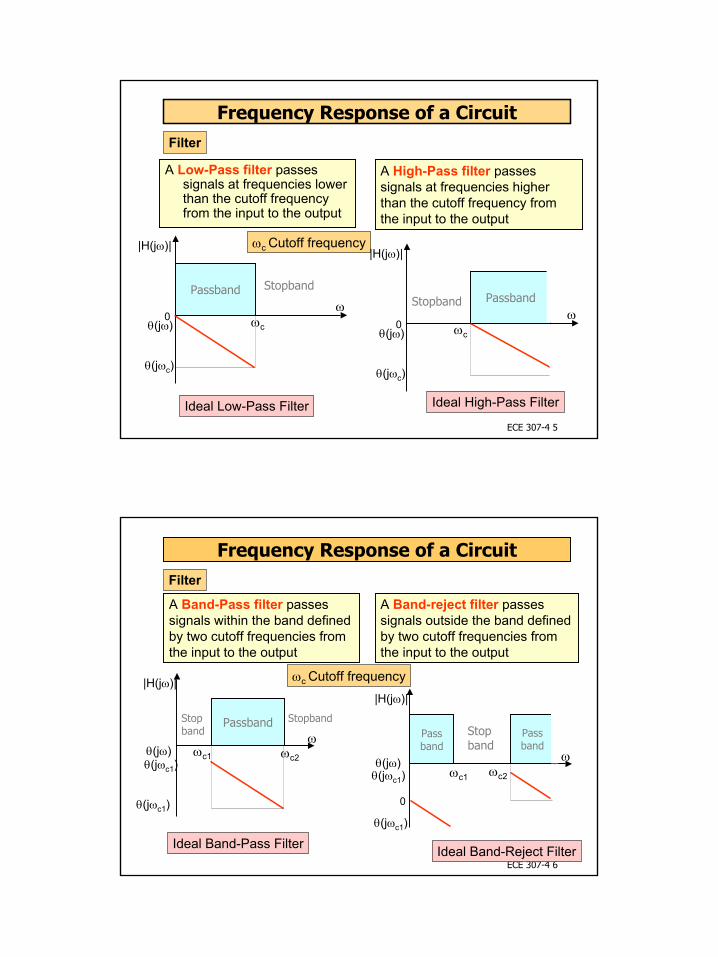
A Low-Pass filter passes signals at frequencies lower than the cutoff frequency from the input to the output
Filter
A High-Pass filter passes signals at frequencies higher than the cutoff frequency from the input to the output
Passbandω
|H(jω)|
Stopband
ωcθ(jω)
θ(jωc)
ωc Cutoff frequency
Passbandω
|H(jω)|
Stopband
ωcθ(jω)
θ(jωc)
Ideal Low-Pass Filter Ideal High-Pass Filter
00
ECE 307-4 6
Passband
Frequency Response of a CircuitFilter
A Band-reject filter passes signals outside the band defined by two cutoff frequencies from the input to the output
Passbandω
|H(jω)|
Stopband
ωc2θ(jω)θ(jωc1)
ωc Cutoff frequency
Passband
ω
|H(jω)|
Stopband
θ(jω)
θ(jωc1)
Ideal Band-Pass Filter Ideal Band-Reject Filter
Stopband
ωc1
θ(jωc1)
ωc2ωc1θ(jωc1)
0
A Band-Pass filter passes signals within the band defined by two cutoff frequencies from the input to the output

4
ECE 307-4 7
Frequency Response of a Circuit
ω = max1( )2cH j H
The transfer function magnitude is decreased by the factor 1/√2 from its maximum value is called cutoff frequency
Cutoff Frequency
|Hmax | is the maximum magnitude of the transfer function
ECE 307-4 8
Frequency Response of a Circuit
A Serial RL CircuitLow-Pass Filter
( )
RLH s RsL
=+
0( )( )i
V s RV s sL R
=+
( )
RLH j RjL
ωω
=+
To find frequency response, substitute s=jω in equation
22
( )
RLH jRL
ω
ω
= +
1( ) tan LjRωθ ω − = −
Phase ResponseMagnitude Response
RVi(s)
-
+
sL1 2
Vo(s)

5
ECE 307-4 9
Frequency Response of a Circuit
When ω=0
22
( 0) 1
0
RLH jRL
= = +
1 0( 0) tan 0LjR
θ − = − =
To find Cutoff Frequency
When ω=∞
22
( ) 0
RLH jRL
∞ = = ∞ +
1( ) tan 90LjR
θ − ∞ ∞ = − = −
22
1( )2c
c
RLH jRL
ω
ω
= = +
cRL
ω =
A Serial RL Circuit
Result
ECE 307-4 10
Frequency Response of a Circuit
Example
1000 0.1592 * *1000c
RL Hω π
= = =
R=1KΩ F=1KHz. L=? Plot H(jω). 10000.159( ) 1000
0.159
H jj
ωω
=+
>> R=1000;>> L=0.159;>> f=0:25:10000;>> w=2*pi*f;>> subplot (2,1,1)>> h=abs((R/L)./(j*w+(R/L)));>> semilogx(w,h)>> grid on>> title('|H(j\omega)|')>> xlabel ('\omega')>> ylabel ('|H(j\omega)|')>> theta=angle((R/L)./(j*w+(R/L)));>> subplot (2,1,2)>> degree=theta*180/pi;>> semilogx(w,degree)>> grid on>> title('\theta(j\omega)')>> xlabel('\omega')>> ylabel('\theta(j\omega)')

6
ECE 307-4 11
Frequency Response of a Circuit
Example
/( )/
R LH ss R L
=+
R=1KΩ F=1KHz. L=? Plot H(jω).
>> syms s
>> n=[0 1000/0.159];
>> d=[1 1000/0.159];
>> g=tf(n,d)
Transfer function:
6289
--------
s + 6289
>> bode (g)
>> grid on
Matlab
ECE 307-4 12
Frequency Response of a Circuit
V11Vac0Vdc
L1
0.159H1 2
R1
1k
VV
0
Fr e q u e n c y
1 0 0 Hz 3 0 0 Hz 1 . 0 KHz 3 . 0 KHz 1 0 KHz 3 0 KHz 1 0 0 KHzV( L1 : 2 ) V( V1 : +)
0 V
0 . 5 V
1 . 0 V
Example
fc=1KHz

7
ECE 307-4 13
Frequency Response of a Circuit
A Serial RC CircuitLow-Pass Filter
1
( ) 1RCH s
sRC
=+
0
1( )
1( )i
V s sCV s R
sC
=+
1
( ) 1RCH j
jRC
ωω
=+
To find frequency response, substitute s=jω in equation
22
1
( )1
RCH j
RC
ω
ω
= +
( )1( ) tanj RCθ ω ω−= −
Phase ResponseMagnitude Response
-Vo(s)+
R
1/sCVi(s)
ECE 307-4 14
Frequency Response of a Circuit
When ω=0
22
1
( 0) 110
RCH j
RC
= = +
( )1( 0) tan 0 0j RCθ −= − =
To find Cutoff Frequency
When ω=∞
22
1
( ) 01
RCH j
RC
∞ = = ∞ +
( )1( ) tan 90j RCθ −∞ = − ∞ = −
22
11( )21
c
c
RCH j
RC
ω
ω
= = +
1c RC
ω =
A Serial RC Circuit
Result

8
ECE 307-4 15
Frequency Response of a Circuit
Example A series RC low-pass filter cutoff frequency is 8KHz. R=10KΩ Find the capacitor value
1c RC
ω =1c
CRω
= 1 1.992 * * 8000 10000
C nFxπ
= =
Example A series RL low-pass filter cutoff frequency is 2KHz. R=5KΩ Find the inductor value. Find |H(jω)| at 50 KHz?
cRL
ω =c
RLω
=5000 2.52000
L H= =
50 2 22 2
50002.5( ) 0.0635
5000(2 * * 50000)2.5
KHz
RLH jRL
ω
ω π
= = = + +
ECE 307-4 16
Frequency Response of a Circuit
Example A series RC low-pass filter cutoff frequency is 8KHz. R=10KΩ, C=1.99 nF
r=10000;c=19.9*10^-9;
f=0:25:100000;w=2*pi*f;h=abs((1/(r*c))./(j*w+1/(r*c)));subplot (2,1,1)semilogx(w,h)grid ontitle('|H(j\omega)')xlabel ('\omega')ylabel ('|H(j\omega)')theta=angle((1/(r*c))./(j*w+1/(r*c)));subplot (2,1,2)degree=theta*180/pi;semilogx (w, degree)grid ontitle('\theta(j\omega)')xlabel('\omega')ylabel('\theta(j\omega)')

9
ECE 307-4 17
Frequency Response of a Circuit
V
R1
10k
C1
1.99n
0
V
V11Vac0Vdc
Fr e q u e n c y
1 0 0 Hz 1 . 0 KHz 1 0 KHz 1 0 0 KHz 1 . 0 MHzV( R1 : 1 ) V( V1 : +)
0 V
0 . 5 V
1 . 0 V
Example
fc=8KHz =1( )2cH f
ECE 307-4 18
Frequency Response of a Circuit
A Serial RC CircuitHigh-Pass Filter
( ) 1sH s
sRC
=+
0( )1( )i
V s RV s R
sC
=+
( ) 1jH j
jRC
ωωω
=+
To find frequency response, substitute s=jω in equation
22
( )1
H j
RC
ωω
ω
= +
( )1( ) 90 tanj RCθ ω ω−= −
Phase ResponseMagnitude Response
1/sC
Vi(s)-
R Vo(s)+

10
ECE 307-4 19
Frequency Response of a Circuit
When ω=0
22
0( 0) 010
H j
RC
= = +
1 0( 0) 90 tan 90jRC
θ − = − =
To find Cutoff Frequency
When ω=∞
22
( ) 11
H j
RC
∞∞ = =
∞ +
1( ) 90 tan 0jRC
θ − ∞ ∞ = − =
22
1( )21
cc
c
H j
RC
ωω
ω
= = +
1c RC
ω =
A Serial RC Circuit
Result
ECE 307-4 20
Frequency Response of a Circuit
A Serial RL CircuitHigh-Pass Filter
( ) sH s RsL
=+
0( )( )i
V s sLV s sL R
=+
( ) jH j RjL
ωωω
=+
To find frequency response, substitute s=jω in equation
22
( )H jRL
ωω
ω
= +
1( ) 90 tan LjRωθ ω − = −
Phase ResponseMagnitude Response
Vi(s) sL
1
2 -Vo(s)
+
R

11
ECE 307-4 21
Frequency Response of a Circuit
When ω=0
22
0( 0) 0
0
H jRL
= = +
1 0( 0) 90 tan 90LjR
θ − = − =
To find Cutoff Frequency
When ω=∞
22
( ) 1H jRL
∞∞ = =
∞ +
1( ) 90 tan 0LjR
θ − ∞ ∞ = − =
22
1( )2
cc
c
H jRL
ωω
ω
= = +
cRL
ω =
A Serial RL Circuit
Result
ECE 307-4 22
Frequency Response of a Circuit
Example Define R and L values for a high pass filter with a cutoff frequency of 10KHz. Find |H(jω)|at 5 KHz
Let
We can’t calculate R and L values independently. We can select R or L values then define the other
1R K= Ω
c
RLω
= 1000 15.92 * *10000
L mHπ
= =
5 2 22 2
2 * * 5000( ) 0.44691000(2 * * 5000)
0.0159
KHzH jRL
ω πω
ω π
= = = + +
cRL
ω =
Result

12
ECE 307-4 23
Frequency Response of a Circuit
Example A RL high pass filter with a cutoff frequency of 10KHz. 1R K= Ω 1000 15.9
2 * *10000L mH
π= =
R=1000;L=15.9*10^-3;
f=0:25:70000;w=2*pi*f;h=abs((j*w)./(j*w+R/L));subplot (2,1,1)semilogx(w,h)grid ontitle('|H(j\omega)')xlabel ('\omega')ylabel ('|H(j\omega)')theta=angle((j*w)./(j*w+R/L));subplot (2,1,2)plot (w, theta)degree=theta*180/pi;semilogx (f, degree)grid ontitle('\theta(j\omega)')xlabel('\omega')ylabel('\theta(j\omega)')
ECE 307-4 24
Frequency Response of a Circuit
V11Vac0Vdc
V
L2
15.9mH
1
2
R1
1K V
0
Fr e q u e n c y
1 0 0 Hz 1 . 0 KHz 1 0 KHz 1 0 0 KHz 1 . 0 MHzV( R1 : 2 ) V( V1 : +)
0 V
0 . 5 V
1 . 0 V
fc=8KHz
Example
=1( )2cH f

13
ECE 307-4 25
Frequency Response of a Circuit
L2
15.9mH
1
2
V11Vac0Vdc
VPVP
0
R1
1K
Plotting phase: Take the probe Phase of Voltage, which is under Pspice, Markers, and Advanced. Marked the node you want to see phase
Fr e q u e n c y
1 0 0 Hz 1 . 0 KHz 1 0 KHz 1 0 0 KHz 1 . 0 MHzVP( V1 : +) VP( R1 : 2 )
0 d
5 0 d
1 0 0 d
fc=8KHz =( ) 45cH f
ECE 307-4 26
Frequency Response of a Circuit
Example Let’s place load resister in parallel to inductor in RL high-pass filter shown in the figure a. Find the transfer functionb. Rs=RL=1KΩ, find L value for cutoff frequency at
10KHz.
cRKL
ω =
0( )( )
L
L
Li
L
R sLV s R sL
R sLV s RR sL
+=
++
( )
L
L
L
L
R sR R KsH s R R Rs s KR R L L
+= =
+ ++
L
L
RKR R
=+
where 1 0.51 1
K = =+
10.5 7.952 * *10c
RL K mHω π
= = =
Result
-
Vo(s)
R
+sL
1
2
Vi(s) RL
14
ECE 307-4 27
Frequency Response of a Circuit
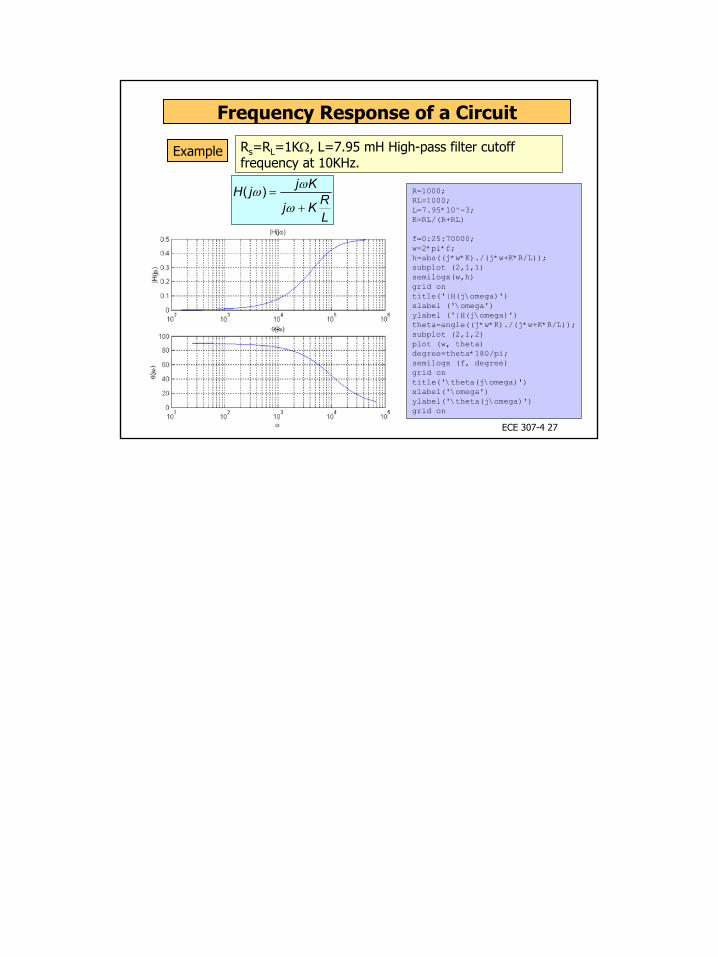
Example Rs=RL=1KΩ, L=7.95 mH High-pass filter cutoff frequency at 10KHz.
( ) j KH j Rj KL
ωωω
=+
R=1000;RL=1000;L=7.95*10^-3;K=RL/(R+RL)
f=0:25:70000;w=2*pi*f;h=abs((j*w*K)./(j*w+K*R/L));subplot (2,1,1)semilogx(w,h)grid ontitle('|H(j\omega)')xlabel ('\omega')ylabel ('|H(j\omega)')theta=angle((j*w*K)./(j*w+K*R/L));subplot (2,1,2)plot (w, theta)degree=theta*180/pi;semilogx (f, degree)grid ontitle('\theta(j\omega)')xlabel('\omega')ylabel('\theta(j\omega)')grid on
Related Documents