Chapter 7 Frequency Distribution Tables and Graphs Frequency Distribution Tables and Graphs 7.0 Introduction Jagadeesh is watching sports news. A visual appeared on the T.V. screen giving details of the medals won by different countries in Olympics 2012. Olympics 2012 - Medals Tally Rank Country Gold Silver Bronze Total 1 United States 46 29 29 104 2 China 38 27 23 88 3 Great Britain 29 17 19 65 4 Russia 24 26 32 82 5 Korea 13 8 7 28 The above table provides data about the top five countries that got the highest number of medals in the olympics 2012 as well as the number of medals they won. Information, available in the numerical form or verbal form or graphical form that helps in taking decisions or drawing conclusions is called Data. l Which country has got the highest number of medals ? l Which country has got the highest number of bronze medals ? l Write three more questions based on data provided in the table . Try This Give any three examples of data which are in situations or in numbers. 7.1 Basic measures of central tendency Usually we collect data and draw certain conclusions based on the nature of a data. Understanding its nature, we do certain computations like mean, median and mode which are referred as measures of central tendency. Let us recall. 7.1.1 Arithmetic Mean It is the most commonly used measure of central tendency. For a set of numbers, the mean is simply the average, i.e., sum of all observations divided by the number of observations. Arithmetic mean of x 1 , x 2 , x 3 , x 4 , ....... x n is Arithmetic mean = = (short representation) ∑ x i represents the sum of all x i s where i takes the values from 1 to n Example 1: Ashok got the following marks in different subjects in a unit test. 20, 11, 21, 25, 23 and 14. What is arithmetic mean of his marks? Solution: Observations = 20, 11, 21, 25, 23 and 14 Arithmetic mean = = = = 19

Welcome message from author
This document is posted to help you gain knowledge. Please leave a comment to let me know what you think about it! Share it to your friends and learn new things together.
Transcript
Chapter7
FrequencyDistributionTablesandGraphsFrequencyDistributionTablesandGraphs7.0Introduction
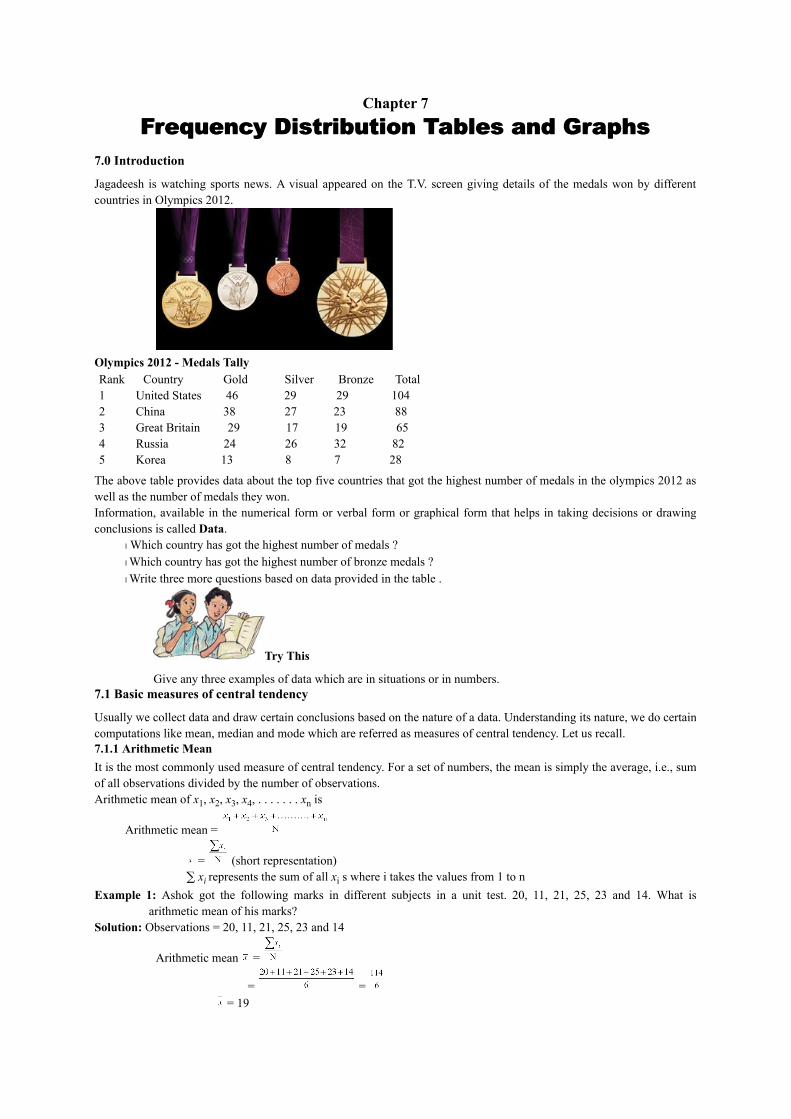
Jagadeesh iswatchingsportsnews.Avisualappearedon theT.V. screengivingdetailsof themedalswonbydifferentcountriesinOlympics2012.
Olympics2012-MedalsTallyRankCountryGoldSilverBronzeTotal1UnitedStates4629291042China382723883GreatBritain291719654Russia242632825Korea138728
Theabovetableprovidesdataaboutthetopfivecountriesthatgotthehighestnumberofmedalsintheolympics2012aswellasthenumberofmedalstheywon.Information,availableinthenumericalformorverbalformorgraphicalformthathelpsintakingdecisionsordrawingconclusionsiscalledData.
lWhichcountryhasgotthehighestnumberofmedals?lWhichcountryhasgotthehighestnumberofbronzemedals?lWritethreemorequestionsbasedondataprovidedinthetable.
TryThis
Giveanythreeexamplesofdatawhichareinsituationsorinnumbers.7.1Basicmeasuresofcentraltendency
Usuallywecollectdataanddrawcertainconclusionsbasedonthenatureofadata.Understandingitsnature,wedocertaincomputationslikemean,medianandmodewhicharereferredasmeasuresofcentraltendency.Letusrecall.7.1.1ArithmeticMeanItisthemostcommonlyusedmeasureofcentraltendency.Forasetofnumbers,themeanissimplytheaverage,i.e.,sumofallobservationsdividedbythenumberofobservations.Arithmeticmeanofx1,x2,x3,x4,.......xnis
Arithmeticmean=
= (shortrepresentation)∑xirepresentsthesumofallxiswhereitakesthevaluesfrom1ton
Example 1:Ashok got the following marks in different subjects in a unit test. 20, 11, 21, 25, 23 and 14. What isarithmeticmeanofhismarks?
Solution:Observations=20,11,21,25,23and14
Arithmeticmean =
= ==19
Example2:Arithmeticmeanof7observationswasfoundtobe32.Ifonemoreobservation48wastobeaddedtothedatawhatwouldbethenewmeanofthedata?
Solution:Meanof7observations =32Sumof7observationsis xi=32×7=224Addedobservation=48Sumof8observations xi=224+48=272
∴Meanof8observations = =34Example3:Meanageof25membersofaclubwas38years.If5memberswithmeanageof42yearshavelefttheclub,
whatisthepresentmeanageoftheclubmembers?Solution:Meanageof25membersoftheclub=38years
Totalageofallthe25members=38×25=950Meanageof5members=42yearsTotalageof5members=42×5=210Totalageofremaining20members=950–210=740
∴Presentmeanageofclubmembers = = =37yearsExample4:Arithmeticmeanof9observationswascalculatedas45.Indoingsoanobservationwaswronglytakenas42
for24.Whatwouldthenbethecorrectmean?Solution:Meanof9observations=45
Sumof9observations=45×9=405Whencomputingmean42wastakeninsteadof24∴Correctsumof9observations=405–42+24=387
Actualmeanof9observations= = =43Weobserve,
lFromtheaboveexampleswecanseethatArithmeticMeanisarepresentativevalueoftheentiredata.lArithmeticmeandependsonbothnumberofobservationsandvalueofeachobservationinadata.lItisuniquevalueofthedata.lWhenalltheobservationsofthedataareincreasedordecreasedbyacertainnumber,themeanalsoincreasesor
decreasesbythesamenumber.lWhenall theobservationsofthedataaremultipliedordividedbyacertainnumber, themeanalsomultipliedor
dividedbythesamenumber.7.1.2ArithmeticMeanbyDeviationMethodTherearefiveobservationsinadata,7,10,15,21,27.WhentheteacheraskedtoestimatetheArithmeticMeanofthedatawithoutactualcalculation,threestudentsKamal,NeelimaandLekhyaestimatedasfollows:Kamalestimatedthatitliesexactlybetweenminimumandmaximumvalues,i.e.17,Neelimaestimatedthatitisthemiddlevalueoftheordered(ascendingordescending)data;15,Lekhyaaddedalltheobservationsanddividedbytheirnumber,i.e.16.Wecalleachoftheseestimationsas‘estimatedmean’or‘assumedmean’isrepresentedwith‘A’.Letusverifywhichoftheestimationscoincideswiththeactualmean.Case1:ConsiderKamal’sestimatedarithmeticmeanA=17
Theiractualarithmeticmeanis = = =ScoreAinTermsofDeviations7177=17−10101710=17−7151715=17−2211721=17+4271727=17+10
IfeachobservationiswrittenintermsofdeviationfromassumedmeanA,wehave
=
=
=17+ =17–1=16∴Arithmeticmean=Estimatedmean+Averageofdeviations

Case2:ConsiderNeelima’sestimatedarithmeticmeanA=15
Theirarithmeticmeanis = =
intermsofdeviations=
=
=15+ =15+1=16Case3:ConsiderLekhya’sestimatedarithmeticmeanA=16
Theirarithmeticmeanis = =
intermsofdeviations=
=
=16+ =16
TryThesePrepareatableofestimatedmean,deviationsof theabovecases.Observe theaverageofdeviationswiththedifferenceofestimatedmeanandactualmean.Whatdoyouinfer?[Hint:Comparewithaveragedeviations]
It is clear that the estimated mean becomes the actual arithmetic mean if the sum (or average) of deviations of allobservationsfromtheestimatedmeanis‘zero’.WemayusethisverificationprocessasameanstofindtheArithmeticMeanofthedata.Fromtheabovecases,itisevidentthatthearithmeticmeanmaybefoundthroughtheestimatedmeananddeviationofallobservationsfromit.
Thedifferencebetweenanyscoreofdataandassumedmeaniscalleddeviations.Arithmeticmean=Estimatedmean+Averageofdeviations
=Estimatedmean+
=A+Example5:Findthearithmeticmeanof10observations14,36,25,28,35,32,56,42,50,62byassumingmeanas40.
Alsofindmeanbyregularformula.Doyoufindanydifference.Solution:Observationsofthedata=14,25,28,32,35,36,42,50,56,62LettheassumedmeanisA=40
∴Arithmeticmean=A+
=40+
=40+
=40+
=40–=40−2=38
Byusualformula = =
= =38Inboththemethodswegotthesamemean.
This way of computing arithmetic mean by deviation method is conveniently used for data with large numbers anddecimalnumbers.
Considerthefollowingexample.Example6:Marketvalue(inrupees)ofasharethroughaweekischangingas3672,3657,3673,3665,3668.Findthe
arithmeticmeanofthemarketvalueoftheshare.Solution:Observationsofthedata=3657,3665,3668,3672,3673Estimatedmean=3668
Arithmeticmean =A+
=3668+
=3668+ =3668+ =3668-1=`3667.
TryThese
1.Estimatethearithmeticmeanofthefollowingdata(i)17,25,28,35,40(ii)5,6,7,8,8,10,10,10,12,12,13,19,19,19,20Verifyyouranswersbyactualcalculations.
Projectwork
1.Collectmarksof10ofyourclassmatesindifferentsubjectsintherecentexaminations.Estimatethearithmeticmeanofmarksineachsubjectandverifythembyactualcalculations.Howmanyofyourestimationsrepresentexactmean?
2.Measuretheheightsofstudentsofyourclassandestimatethemeanheight.Verifytheirmeanfromrecordsofyourphysicaleducationteacher.Doyounoticeanydifference?
7.1.3Median
Medianisanotherfrequentlyusedmeasureofcentraltendency.Themedianissimplythemiddletermofthedistributionwhenitisarrangedineitherascendingordescendingorder,i.e.thereareasmanyobservationsaboveitasbelowit.Ifnnumberofobservationsinthedataarrangedinascendingordescendingorder
•Whennisodd, observationisthemedian.
•Whenniseven,arithmeticmeanoftwomiddleobservations and isthemedianofthedata.Example7:Findthemedianof9observations14,36,25,28,35,32,56,42,50.Solution:Ascendingorderofthedata=14,25,28,32,35,36,42,50,56
Noofobservationsn=9(oddnumber)
Medianofthedata= observation=5thobservation=35∴Median=35
Example8:Ifanotherobservation61isalsoincludedtotheabovedatawhatwouldbethemedian?Solution:Ascendingorderofthedata=14,25,28,32,35,36,42,50,56,61
Noofobservationsn=10(evennumber)Thentherewouldbetwonumbersatthemiddleofthedata.
Medianofthedata=arithmeticmeanof and observations=arithmeticmeanof5thand6thobservations
= =35.5DoThisHerearetheheightsofsomeofIndiancricketers.Findthemedianheightoftheteam.
S.No.PlayersNameHeights1.VVSLaxman5’11’’2.ParthivPatel5’3’’3.HarbhajanSingh6’0’’4.SachinTendulkar5’5’’5.GautamGambhir5’7’’6.YuvrajSingh6’1’’7.RobinUthappa5’9’’8.VirenderSehwag5’8’’9.ZaheerKhan6’0’’10.MSDhoni5’11’’
5’10’’means5feet10inchesNote:
lMedianisthemiddlemostvalueinordereddata.lItdependsonnumberofobservationsandmiddleobservationsoftheordereddata.Itisnoteffectedbyanychange
inextremevalues.
TryThese1.Findthemedianofthedata24,65,85,12,45,35,15.2.Ifthemedianofx,2x,4xis12,thenfindmeanofthedata.3.Ifthemedianofthedata24,29,34,38,xis29thenthevalueof‘x’is
(i)x>38(ii)x<29(iii)xliesinbetween29and34(iv)none7.1.4ModeWhenweneedtoknowwhatisthefavouriteuniformcolour inaclassormostsellingsizeof theshirt inshop,weusemode.Themodeissimplythemostfrequentlyoccurringvalue.Considerthefollowingexamples.Example9:Inashoemartdifferentsizes(ininches)ofshoessoldinaweekare;7,9,10,8,7,9,7,9,6,3,5,5,7,10,7,
8,7,9,6,7,7,7,10,5,4,3,5,7,8,7,9,7.Whichsizeoftheshoesmustbekeptmoreinnumberfornextweektosell?Givethereasons.
Solution:Ifwewritetheobservationsinthedatainorderwehave3,3,4,5,5,5,5,6,6,7,7,7,7,7,7,7,7,7,7,7,7,8,8,8,9,9,9,9,9,10,10,10.Fromthedataitisclearthat7inchsizeshoesaresoldmoreinnumber.Thusthemodeofthegivendatais7.
So7inchsizeshoesmustbekeptmoreinnumberforsale.Example10:Thebloodgroupof50donors,participatedinblooddonationcampareA,AB,B,A,O,AB,O,O,A,AB,
B,A,O,AB,O,O,A,B,A,O,AB,O,O,A,AB,B,O,AB,O,B,A,O,AB,O,O,A,AB,B,A,O,AB,O,A,AB,B,A,O,AB,O,O.Findthemodeoftheaboveverbaldata.
Solution:Byobserving the datawe can find thatA group is repeated for 12,B group is repeated for 7,ABgroup isrepeatedfor12,Ogroupisrepeatedfor19times.∴Modeofthedatais=‘O’group.
Think,DiscussandWrite
Istheiranychangeinmode,ifoneortwomoreobservations,equaltomodeareincludedinthedata?Note:
lModeisthemostfrequentobservationofthegivendata.lItdependsneitheronnumberofobservationsnorvaluesofallobservations.lItisusedtoanalysebothnumericalandverbaldata.lTheremaybe2or3ormanymodesforthesamedata.
Exercise-7.1
1.Findthearithmeticmeanofthesalesperdayinafairpriceshopinaweek.`10000,`.10250,`.10790,`.9865,`.15350,`.10110
2.Findthemeanofthedata;10.25,9,4.75,8,2.65,12,2.353.Meanofeightobservationsis25.Ifoneobservation11isexcluded,findthemeanoftheremaining.4.Arithmeticmeanofnineobservationsiscalculatedas38.Butindoingso,anobservation27ismistakenfor72.Find
theactualmeanofthedata.5.Fiveyearsagomeanageofafamilywas25years.Whatisthepresentmeanageofthefamily?6.Twoyearsagothemeanageof40peoplewas11years.Nowapersonleftthegroupandthemeanageischangedto12
years.Findtheageofthepersonwholeftthegroup.7Findthesumofdeviationsofallobservationsofthedata5,8,10,15,22fromtheirmean.8.Ifsumofthe20deviationsfromthemeanis100,thenfindthemeandeviation.9.Marksof12studentsinaunittestaregivenas4,21,13,17,5,9,10,20,19,12,20,14.Assumeameanandcalculate
thearithmeticmeanofthedata.Assumeanothernumberasmeanandcalculatethearithmeticmeanagain.Doyougetthesameresult?Comment.
10.Arithmeticmeanofmarks(outof25)scoredby10studentswas15.Oneofthestudent,namedKarishmaenquiredtheother9studentsandfindthedeviationsfromhermarksarenotedas 8, 6, 3, 1,0,2,3,4,6.FindKarishma’smarks.
11.Thesumofdeviationsof‘n’observationsfrom25is25andsumofdeviationsofthesame‘n’observationsfrom35is25.Findthemeanoftheobservations.
12.Findthemedianofthedata;3.3,3.5,3.1,3.7,3.2,3.813.Themedianofthefollowingobservations,arrangedinascendingorderis15.10,12,14,x 3,x,x+2,25.Thenfindx.14.Findthemodeof10,12,11,10,15,20,19,21,11,9,10.15.Modeofcertainscoresisx.Ifeachscoreisdecreasedby3,thenfindthemodeofthenewseries.16.Findthemodeofalldigitsusedinwritingthenaturalnumbersfrom1to100.17.Observationsofarawdataare5,28,15,10,15,8,24.Addfourmorenumberssothatmeanandmedianofthedata
remainthesame,butmodeincreasesby1.18.Ifthemeanofasetofobservationsx1,x2,....,....,x10is20.Findthemeanofx1+4,x2+8,x3+12,........,x10+40.19.Sixnumbersfromalistofnineintegersare7,8,3,5,9and5.Findthelargestpossiblevalueofthemedianofallnine
numbersinthislist.20.Themedianofasetof9distinctobservationsis20.Ifeachofthelargest4observationsofthesetisincreasedby2,
findthemedianoftheresultingset.7.2OrganisationofGroupedDataWehavelearnttoorganizesmallerdatabyusingtallymarksinpreviousclass.Butwhathappensifthedataislarge?Weorganizethedatabydividingitintoconvenientgroups.Itiscalledgroupeddata.Letusobservethefollowingexample.Aconstructioncompanyplannedtoconstructvarioustypesofhousesfortheemployeesbasedontheirincomelevels.Sotheycollectedthedataaboutmonthlynetincomeofthe100employees,whowishtohaveahouse.Theyare(inrupees)15000,15750,16000,16000,16050,16400,16600,16800,17000,17250,17250………………75000.This is a largedataof100observations, ranging from`15000 to` 75000.Even ifwemake frequency table for eachobservationthetablebecomeslarge.Insteadthedatacanbeclassifiedintosmallincomegroupslike10001 20000,2000130000,...,70001 80000.
Thesesmallgroupsarecalled‘classintervals’.Theintervals10001 20000hasalltheobservationsbetween10001and20000includingboth10001and20000.Thisformofclassintervaliscalled‘inclusiveform’,where10001isthe‘lowerlimit’,20000isthe‘upperlimit’.
7.2.1InterpretationofGroupedfrequencydistribution:Example11:Marksof30studentsinmathematicstestaregivenintheadjacentgroupedfrequencydistribution.
Sl.NoMarksNoofStudents10–5525–107310–1510415–206520–252
(i)Intohowmanygroupsthedataisclassified?(ii)Howmanystudentsarethereinthethirdgroup?(iii)Ifastudentgets10marks,shouldhebeincludedin2ndor3rdclass?(iv)Whatarethemarksof6studentswhoarein4thclassinterval?(v)Whataretheindividualmarksof2studentsinthefifthgroup?
Answers(i)Thedataisclassifiedinto5groupsor5classes.(ii)Thereare10studentsinthethirdgroup.(iii)Here10istheupperlimitof2ndclassandlowerlimitof3rdclass.Insuchcaseupperlimitisnotincludedin
theclass.So10isincludedinthe3rdclassinterval.(iv)Marksof6studentsin4thclassintervalvariesfrom15andbelow20.(v)Individualmarksofstudentscan’tbeidentifiedfromthisfrequencydistribution,theymaybefrom20andbelow
25.
DoThis
Agesof90peopleinanapartmentaregivenintheadjacentgroupedfrequencydistributionAgesNoofPeople1–101511–201421–301731–402041–501851–60461–702
(i)HowmanyClassIntervalsarethereinthetable?(ii)HowmanypeoplearethereintheClassInterval21-30?(iii)Whichagegrouppeoplearemoreinthatapartment?(iv)Canwesaythatbothpeoplethelastagegroup(61-70)areof61,70oranyotherage?
7.2.2LimitsandBoundariesSupposewehavetoorganizeadataofmarksinatest.Wemakeclassintervalslike1-10,11-20,......Ifastudentgets10.5marks,wheredoesitfall?Inclass1-10or11-20?Inthissituationwemakeuseofreallimitsorboundaries.Considertheclassintervalsshownintheadjacenttable.
LimitsBoundaries1–100.5-10.511–2010.5–20.521–3020.5–30.531–4030.5–40.5
lAverageofUpperLimit (UL)offirstclassandLowerLimit (LL)ofsecondclassbecomes theUpperBoundary
(UB)ofthefirstclassandLowerBoundary(LB)ofthesecondclass.i.e.,Averageof10,11; =10.5istheboundary.
lNowalltheobservationsbelow10.5fallintogroup1-10andtheobservationsfrom10.5tobelow20.5willfallintonextclassi.e11-20havingboundaries10.5to20.5.Thus10.5fallsintoclassintervalof11-20.
lImaginetheULofthepreviousclassinterval(usuallyzero)andcalculatetheLBofthefirstclassinterval.Average
of0,1is =0.5istheLB.lSimilarly imagine theLLof theclassafter the lastclass intervalandcalculate theUBof the lastclass interval.
Averageof40,41is =40.5istheUB.Theseboundariesarealsocalled“trueclasslimits”.Observelimitsandboundariesforthefollowingclassintervals.ClassintervalLimitsBoundaries
InclusiveclassesLowerlimitUpperlimitLowerboundariesUpperboundaries1-101100.510.511-20112010.520.521-30213020.530.5
ClassintervalLimitsBoundaries
exclusiveclassesLowerlimitUpperlimitLowerboundariesUpperboundaries
1-1011001011-201120102021-3021302030
Thereintheaboveillustrationwecanobservethatincaseofdiscreteseries(Inclusiveclassintervals)limitandboundariesaredifferent.But incaseofcontinuousseries (exclusiveclass intervals) limitsandboundariesare thesame.Differencebetweenupperandlowerboundariesofaclassiscalled‘classlength’,representedby‘C’.
DoThese
1.Longjumpmadeby30studentsofaclassaretabulatedasDistance(cm)101–200201–300301–400401–500501–600Noofstudents471531
I.Arethegivenclassintervalsinclusiveorexclusive?II.Howmanystudentsareinsecondclassinterval?III.Howmanystudentsjumpedadistanceof3.01mormore?IV.Towhichclassintervaldoesthestudentwhojumpedadistanceof4.005mbelongs?
2.Calculatetheboundariesoftheclassintervalsintheabovetable.3.Whatisthelengthofeachclassintervalintheabovetable?7.2.3ConstructionofgroupedfrequencyDistribution
Consider themarksof50students inMathematicssecured inSummativeassessment Ias31,14,0,12,20,23,26,36,33,41,37,25,22,14,3,25,27,34,38,43,32,22,28,18,7,21,20,35,36,45,9,19,29,25,33,47,35,38,25,34,38,24,39,1,10,24,27,25,18,8.After seeing the data, you might be thinking, into how many intervals the data could be classified? How frequencydistributiontablecouldbeconstructed?Thefollowingstepshelpinconstructionofgroupedfrequencydistribution.
ClassintervalsTallymarksFrequency(Noofstudents)
0–7||||408–15 |616–23 ||||924–31 |||1332–39 ||||1440–47||||4
Step1:Findtherangeofthedata.Range=Maximumvalue–Minimumvalue
=47–0=47Step2:Decidethenumberofclassintervals.(Generallynumberofclassintervalsare5to8)
Ifnoofclassintervals=6
Lengthoftheclassinterval= 8(approximately)Step3:Writeinclusiveclassintervalsstartingfromminimumvalueofobservations.
i.e0-7,8-15andsoon...Step4:Usingthetallymarksdistributetheobservationsofthedataintorespectiveclassintervals.Step5:Countthetallymarksandwritethefrequenciesinthetable.Nowconstructgroupedfrequencydistributiontableforexclusiveclasses.
Think,DiscussandWrite
1.Makeafrequencydistributionofthefollowingseries.1,2,2,3,3,3,3,3,4,4,4,4,4,4,4,4,4,5,5,5,5,5,5,5,6,6,6,6,7,7.
2.Constructafrequencydistributionforthefollowingseriesofnumbers.2,3,4,6,7,8,9,9,11,12,12,13,13,13,14,14,14,15,16,17,18,18,19,20,20,21,22,24,24,25.(Hint:Use
inclusiveclasses)3.Whatarethedifferencesbetweentheabovetwofrequencydistributiontables?4.Fromwhichofthefrequencydistributionswecanwritetherawdataagain?
7.2.4CharacteristicsofGroupedFrequencyDistribution1.Itdividesthedataintoconvenientandsmallgroupscalled‘classintervals’.2.Inaclassinterval5-10,5iscalledlowerlimitand10iscalledupperlimit.3.Classintervalslike1-10,11-20,21-30....arecalledinclusiveclassintervals,becausebothlowerandupper
limitsofaparticularclassbelongtothatparticularclassinterval.4.Classintervalslike0-10,10-20,20-30...arecalledexclusiveclassintervals,becauseonlylowerlimitofa
particularclassbelongstothatclass,butnotitsupperlimit.5.Averageofupperlimitofaclassandlowerlimitofthenextclassiscalledupperboundofthefirstclass
andlowerboundofthenextclass.6.In exclusive class intervals, both limits andboundaries are equal but in caseof inclusive class intervals
limitsandboundariesarenotequal.7.Differencebetweenupperandlowerboundariesofaclassiscalled‘lengthoftheclass’.8.Individualvaluesofallobservationscan’tbeidentifiedfromthistable,butvalueofeachobservationofa
particularclassisassumedtobetheaverageofupperandlowerboundariesof thatclass.Thisvalue iscalled‘classmark’or‘midvalue’(x).
Example12:Thefollowingmarksachievedby30candidatesinmathematicsofSSCexaminationheldintheyear2010.45,56,75,68,35,69,98,78,89,90,70,56,59,35,46,47,13,29,32,39,93,84,76,79,40,54,68,69,60,59.
Constructthefrequencydistributiontablewiththeclassintervals;failed(0–34),thirdclass(35–49),secondclass(50–60),firstclass(60–74)anddistinction(75–100).
Solution:ClassintervalsTallymarksFrequency(Noofstudents)
0–34|||335–49||||||750–59||||560–74|||||675–100||||||||9
Classintervalsarealreadygiven.Soproceedfromstep3Step3:Writeclassintervalsasgiven.
Step 4: These are inclusive class intervals. Recall that upper limits also belong to the class. Using the tally marks,distributetheobservationsofthedataintodifferentclassintervals.
Step5:Countthetallymarksandwritethefrequenciesinthetable.(Note:Thelengthsofclassintervalsarenotsameinthiscase)Example13:Agroupedfrequencydistributiontableisgivenbelowwithclassmark(midvaluesofclassintervals)and
frequencies.Findtheclassintervals.Classmarks71523313947Frequency5111921126
Solution:Weknowthatclassmarksarethemidvaluesofclassintervals.Thatimpliesclassboundariesliebetweeneverytwosuccessiveclassmarks.Step1:Findthedifferencebetweentwosuccessiveclassmarks;h=15-7=8.(Findwhetherdifferencebetweeneverytwosuccessiveclassesissame)Step2:Calculatelowerandupperboundariesofeveryclasswithclassmark‘x’,asx–h/2andx+h/2
Forexampleboundariesoffirstclassare7– =3or7+ =11ClassMarksClassintervalsFrequency
7(7–4)–(7+4)=03–11515(15–4)–(15+4)=11–191123(23–4)–(23+4)=19–271931(31–4)–(31+4)=27–352139(39–4)–(39+4)=35–431247(47–4)–(47+4)=43–516
7.3CumulativeFrequencyIn a competitive examination 1000 candidates appeared for a written test. Theirmarks are announced in the form ofgroupedfrequencydistributionasshownintheadjacenttable.
ClassInterval(Marks)NoofCandidates0–102510–204520–306030–4012040–5030050–6036060–705070–802580–901090–1005
TwocandidatesSarath,Sankararelookingatthetableanddiscussinglike…Sarath:Howmanycandidateshaveappearedforthetest?Sankar:Itseems1000candidatesappearedforthetest.Sarath:See,360candidatesachieved50-60marks.Sankar:If60isthecutoffmark,howmanycandidatesareeligibletogetcallletter?Sarath:Doyoumeanhowmanygot60andabovemarksinaltogether?Sankar:Itis50+25+10+5,thatis90candidateswillbeeligible.Sarath:Butthereareonly105jobs.Howmanycandidatesareeligible,ifcutoffmarkas50.Sankar : In that case, 360 + 50 + 25 + 10 + 5, that is totally 450 candidates are eligible to get call letter for
interview.Similarlywecanmakesomemoreconclusions.Numberofcandidates,whogotequalormorethan90(Lowerboundary)=5Numberofcandidates,whogotequalormorethanLBofninthCI=10+5=15Numberofcandidates,whogotequalormorethanLBofeighthCI=25+15=40Numberofcandidates,whogotequalormorethanLBofseventhCI=50+40=90
Wearegettingthesevaluesbytakingprogressive totaloffrequenciesfromeither thefirstor lastclass to theparticularclass.Thesearecalledcumulativefrequencies.Theprogressivesumoffrequenciesfromthelastclassofthetothelowerboundaryofparticularclassiscalled‘GreaterthanCumulativeFrequency’(G.C.F.).ClassIntervaLBFrequencyGreaterthan(Marks)(NoofCandidates)cumulativefrequency
0–1002525+975=100010–20104545+930=97520–30206060+870=93030–4030120120+750=87040–5040300300+450=75050–6050360360+90=45060–70605050+40=9070–80702525+15=40
80–90801010+5=1590–1009055
Watchouthowwecanwritethesegreaterthancumulativefrequenciesinthetable.1.Frequencyinlastclassintervalitselfisgreaterthancumulativefrequencyofthatclass.2.Add the frequencyof theninthclass interval to thegreater thancumulative frequencyof the tenthclass
intervaltogivethegreaterthancumulativefrequencyoftheninthclassinterval3.Successivelyfollowthesameproceduretogettheremaininggreaterthancumulativefrequencies.
The distribution that represent lower boundaries of the classes and their respective Greater than cumulativefrequenciesiscalledGreaterthanCumulativeFrequencyDistribution.
Similarlyinsomecasesweneedtocalculatelessthancumulativefrequencies.Forexampleifateacherwantstogivesomeextrasupportforthosestudents,whogotlessmarksthanaparticularlevel,weneedtocalculatethelessthancumulativefrequencies.Thus theprogressive totalof frequenciesfromfirstclass to theupperboundaryofaparticularclass iscalledLess thanCumulativeFrequency(L.C.F.).
ClassIntervalUBNoofLessthan(Marks)Candidatescumulativefrequency0–55775–10101010+7=1710–15151515+17=3215–202088+32=4020–252533+40=43
Considerthegroupedfrequencydistributionexpressingthemarksof43studentsinaunittest.1.Frequencyinfirstclassintervalisdirectlywrittenintolessthancumulativefrequency.2.Addthefrequencyofthesecondclassintervaltothelessthancumulativefrequencyofthefirstclassintervalto
givethelessthancumulativefrequencyofthesecondclassinterval3.Successivelyfollowthesameproceduretogetremaininglessthancumulativefrequencies.The distribution that represents upper boundaries of the classes and their respective less than cumulativefrequenciesiscalledLessthanCumulativeFrequencyDistribution.
TryThese
1.Lessthancumulativefrequencyisrelatedto_______________2.Greaterthancumulativefrequencyisrelatedto_______________3.WritetheLessthanandGreaterthancumulativefrequenciesforthefollowingdata
ClassInterval1-1011-2021-3031-4041-50Frequency471252
4.Whatistotalfrequencyandlessthancumulativefrequencyofthelastclassaboveproblem?Whatdoyouinfer?Example14:Givenbeloware themarksofstudents ina less thancumulativae frequencydistribution table..Write the
frequenciesoftherespectiveclasses.AlsowritetheGreaterthancumulativefrequencies.Howmanystudents’marksaregiveninthetable?
ClassInterval(Marks)1-1011-2021-3031-4041-50L.C.F.(Noofstudents)1227546775Solution:
ClassIntervalL.C.F.FrequencyG.C.F.(Marks)(Noofstudents)1–10121212+63=7511–202727-12=1515+48=6321–305454-27=2727+21=4831–406767-54=1313+8=2141–507575-67=88
Totalnumberofstudentsmentionedinthetableisnothingbuttotaloffrequenciesorlessthancumulativefrequencyofthelastclassorgreaterthancumulativefrequencyofthefirstclassinterval,i.e.75.
Exercise-7.2
1.Givenbelowaretheagesof45peopleinacolony.
3387253126550254856332822156259161419243526912461542633252211422352486210244351374836Constructgroupedfrequencydistributionforthegivendatawith6classintervals.
2.Numberofstudentsin30classroomsinaschoolaregivenbelow.Constructafrequencydistributiontableforthedatawithaexclusiveclassintervalof4(students).253024182124323422202232402830222631341538282016152024302518
3.Classintervalsinagroupedfrequencydistributionaregivenas4–11,12–19,20–27,28–35,36–43.Writethenexttwoclassintervals.(i)Whatisthelengthofeachclassinterval?(ii)Writetheclassboundariesofallclasses,(iii)Whataretheclassmarksofeachclass?
4.Inthefollowinggroupedfrequencydistributiontableclassmarksaregiven.ClassMarks102234465870Frequency614202195
(i)Constructclassintervalsofthedata.(Exclusiveclassintervals)(ii)Constructlessthancumulativefrequenciesand(iii)Constructgreaterthancumulativefrequencies.
5.Themarksobtainedby35studentsinatestinstatistics(outof50)areasbelow.35115354523314021131520474842344345333711132718123739381613185414743
Constructafrequencydistributiontablewithequalclassintervals,oneofthembeing10-20(20isnotincluded).6.Construct theclassboundariesof thefollowingfrequencydistribution table.Alsoconstruct less thancumulativeand
greaterthancumulativefrequencytables.Ages1-34-67-910-1213-15Noofchildren101215139
7.Cumulativefrequencytableisgivenbelow.Whichtypeofcumulativefrequencyisgiven.Trytobuildthefrequenciesofrespectiveclassintervals.Runs0-1010-2020-3030-4040-50Noofcricketers38192530
8.Number of readers in a library are given below.Write the frequency of respective classes.Alsowrite the less thancumulativefequencytable.
Numberofbooks1-1011-2021-3031-4041-50GreaterthanCumulativefrequency4236231467.4GraphicalRepresentationofData:
Frequencydistributionisanorganiseddatawithobservationsorclassintervalswithfrequencies.Wehavealreadystudiedhowtorepresentofdiscreteseriesintheformofpictographs,bargraphs,doublebargraphandpiecharts.Letusrecallbargraphfirst.7.4.1BarGraph
Adisplayofinformationusingverticalorhorizontalbarsofuniformwidthanddifferentlengthsbeingproportionaltotherespectivevaluesiscalledabargraph.Letusseewhatabargraphcanrepresent.Studythefollowingverticalbargraph.
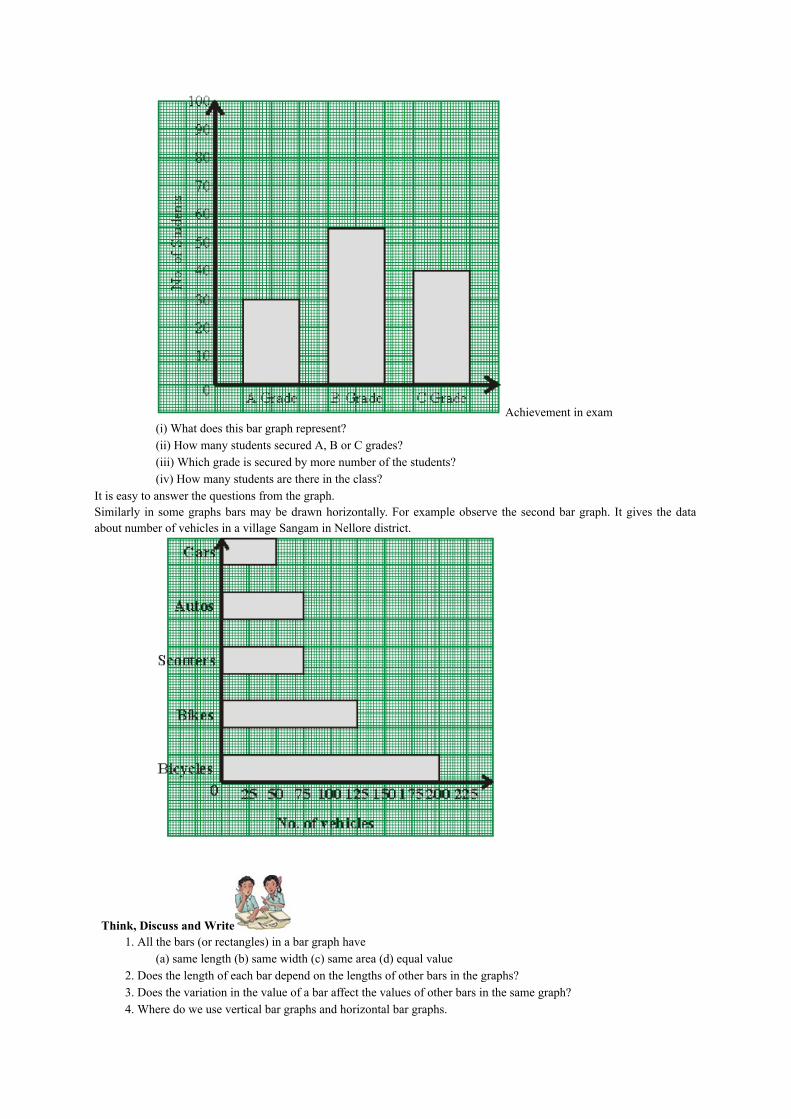
Achievementinexam(i)Whatdoesthisbargraphrepresent?(ii)HowmanystudentssecuredA,BorCgrades?(iii)Whichgradeissecuredbymorenumberofthestudents?(iv)Howmanystudentsarethereintheclass?
Itiseasytoanswerthequestionsfromthegraph.Similarly insomegraphsbarsmaybedrawnhorizontally.Forexampleobserve thesecondbargraph. Itgives thedataaboutnumberofvehiclesinavillageSangaminNelloredistrict.
Think,DiscussandWrite1.Allthebars(orrectangles)inabargraphhave
(a)samelength(b)samewidth(c)samearea(d)equalvalue2.Doesthelengthofeachbardependonthelengthsofotherbarsinthegraphs?3.Doesthevariationinthevalueofabaraffectthevaluesofotherbarsinthesamegraph?4.Wheredoweuseverticalbargraphsandhorizontalbargraphs.
7.5GraphicalRepresentationofGroupedFrequencyDistribution
Letuslearnthegraphicalrepresentationofgroupedfrequencydistributionsofcontinuousseriesi.e.withexclusiveclassintervals.Firstoneofitskindishistogram.7.5.1Histogram
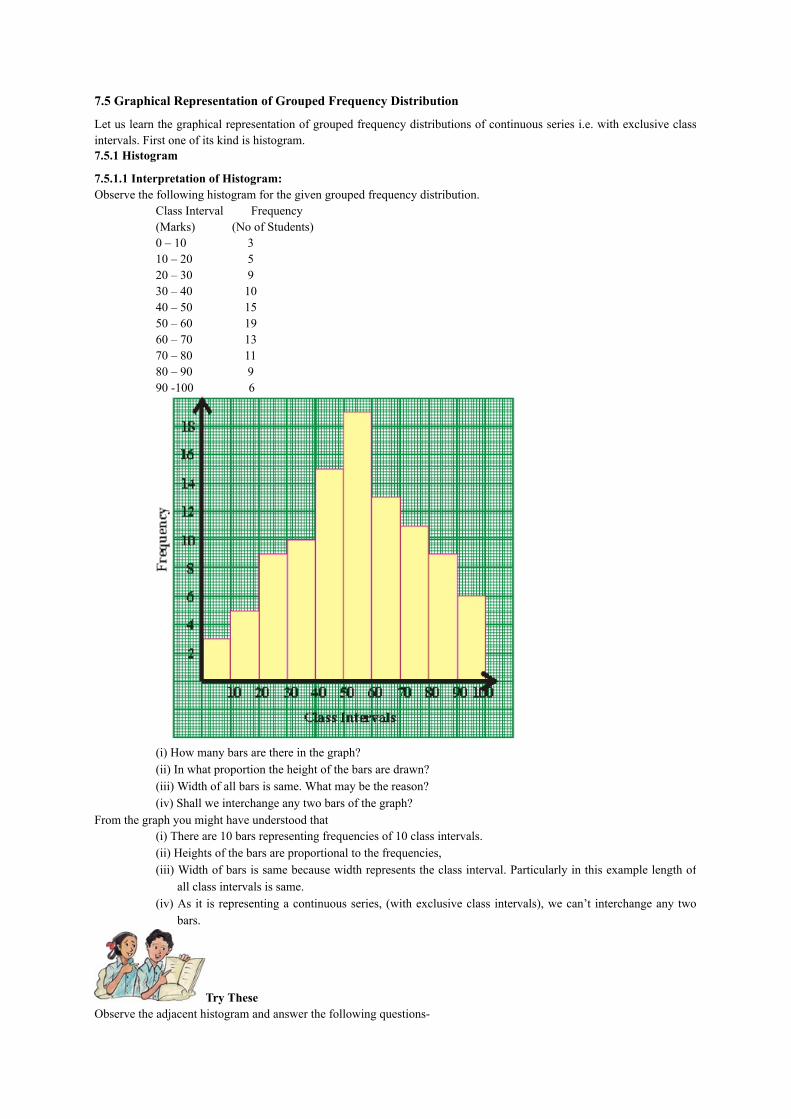
7.5.1.1InterpretationofHistogram:Observethefollowinghistogramforthegivengroupedfrequencydistribution.
ClassIntervalFrequency(Marks)(NoofStudents)0–10310–20520–30930–401040–501550–601960–701370–801180–90990-1006
(i)Howmanybarsarethereinthegraph?(ii)Inwhatproportiontheheightofthebarsaredrawn?(iii)Widthofallbarsissame.Whatmaybethereason?(iv)Shallweinterchangeanytwobarsofthegraph?
Fromthegraphyoumighthaveunderstoodthat(i)Thereare10barsrepresentingfrequenciesof10classintervals.(ii)Heightsofthebarsareproportionaltothefrequencies,(iii)Widthofbarsissamebecausewidthrepresentstheclassinterval.Particularlyinthisexamplelengthof
allclassintervalsissame.(iv)Asit isrepresentingacontinuousseries, (withexclusiveclass intervals),wecan’t interchangeanytwo
bars.
TryTheseObservetheadjacenthistogramandanswerthefollowingquestions-
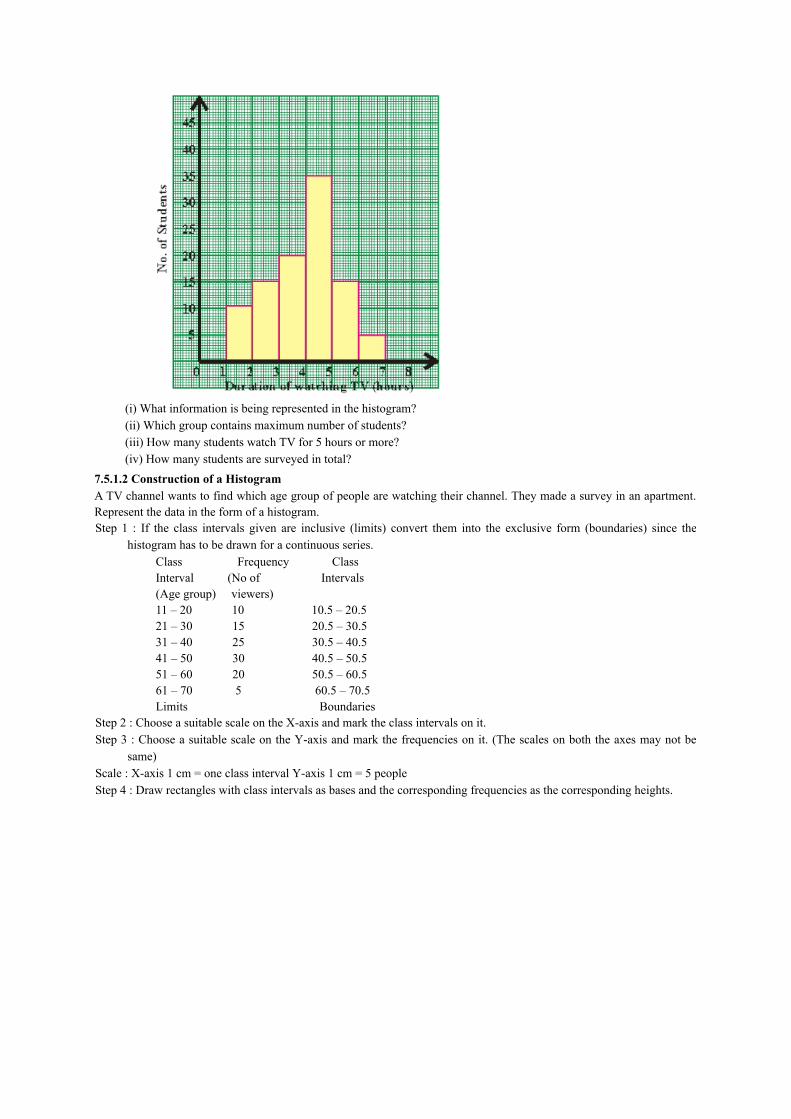
(i)Whatinformationisbeingrepresentedinthehistogram?(ii)Whichgroupcontainsmaximumnumberofstudents?(iii)HowmanystudentswatchTVfor5hoursormore?(iv)Howmanystudentsaresurveyedintotal?
7.5.1.2ConstructionofaHistogramATVchannelwantstofindwhichagegroupofpeoplearewatchingtheirchannel.Theymadeasurveyinanapartment.Representthedataintheformofahistogram.Step 1 : If the class intervals given are inclusive (limits) convert them into the exclusive form (boundaries) since the
histogramhastobedrawnforacontinuousseries.ClassFrequencyClassInterval(NoofIntervals(Agegroup)viewers)11–201010.5–20.521–301520.5–30.531–402530.5–40.541–503040.5–50.551–602050.5–60.561–70560.5–70.5LimitsBoundaries
Step2:ChooseasuitablescaleontheX-axisandmarktheclassintervalsonit.Step3:ChooseasuitablescaleontheY-axisandmarkthefrequenciesonit.(Thescalesonboththeaxesmaynotbe
same)Scale:X-axis1cm=oneclassintervalY-axis1cm=5peopleStep4:Drawrectangleswithclassintervalsasbasesandthecorrespondingfrequenciesasthecorrespondingheights.
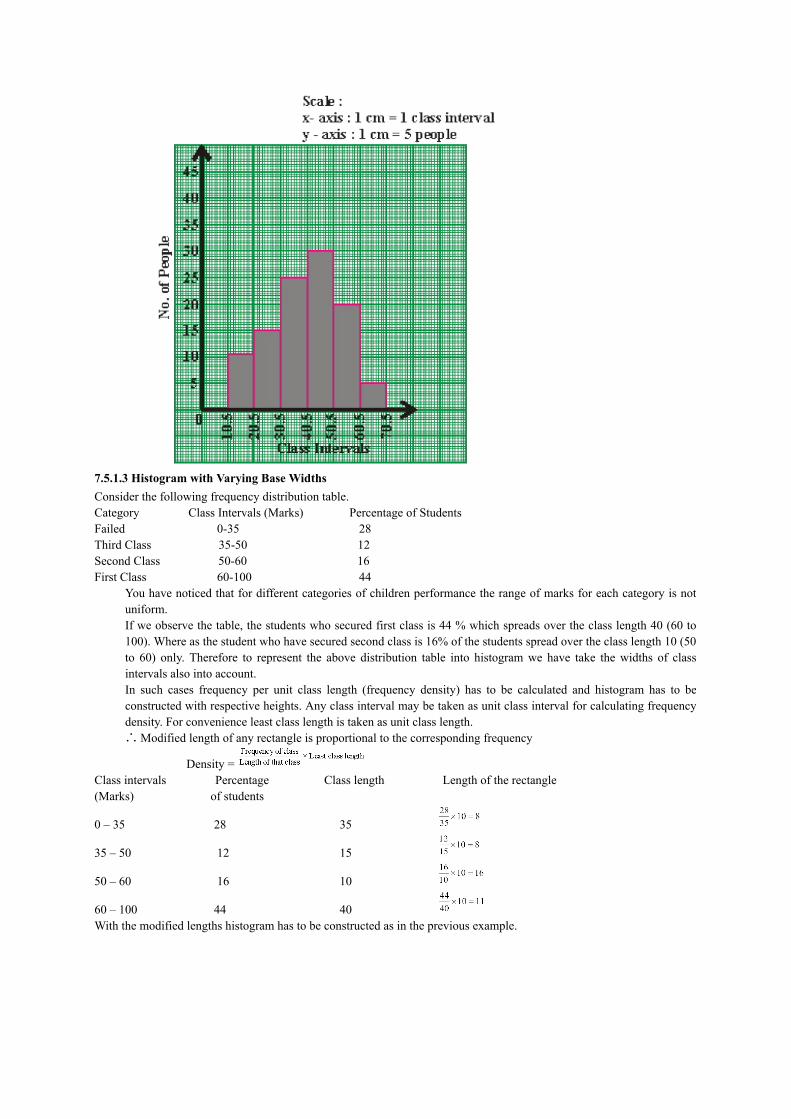
7.5.1.3HistogramwithVaryingBaseWidthsConsiderthefollowingfrequencydistributiontable.CategoryClassIntervals(Marks)PercentageofStudentsFailed0-3528ThirdClass35-5012SecondClass50-6016FirstClass60-10044
Youhavenoticedthatfordifferentcategoriesofchildrenperformancetherangeofmarksforeachcategoryisnotuniform.Ifweobservethetable,thestudentswhosecuredfirstclassis44%whichspreadsovertheclasslength40(60to100).Whereasthestudentwhohavesecuredsecondclassis16%ofthestudentsspreadovertheclasslength10(50to 60) only. Therefore to represent the above distribution table into histogramwe have take thewidths of classintervalsalsointoaccount.In such cases frequency per unit class length (frequency density) has to be calculated and histogram has to beconstructedwithrespectiveheights.Anyclassintervalmaybetakenasunitclassintervalforcalculatingfrequencydensity.Forconvenienceleastclasslengthistakenasunitclasslength.∴Modifiedlengthofanyrectangleisproportionaltothecorrespondingfrequency
Density=ClassintervalsPercentageClasslengthLengthoftherectangle(Marks)ofstudents
0–352835
35–501215
50–601610
60–1004440Withthemodifiedlengthshistogramhastobeconstructedasinthepreviousexample.
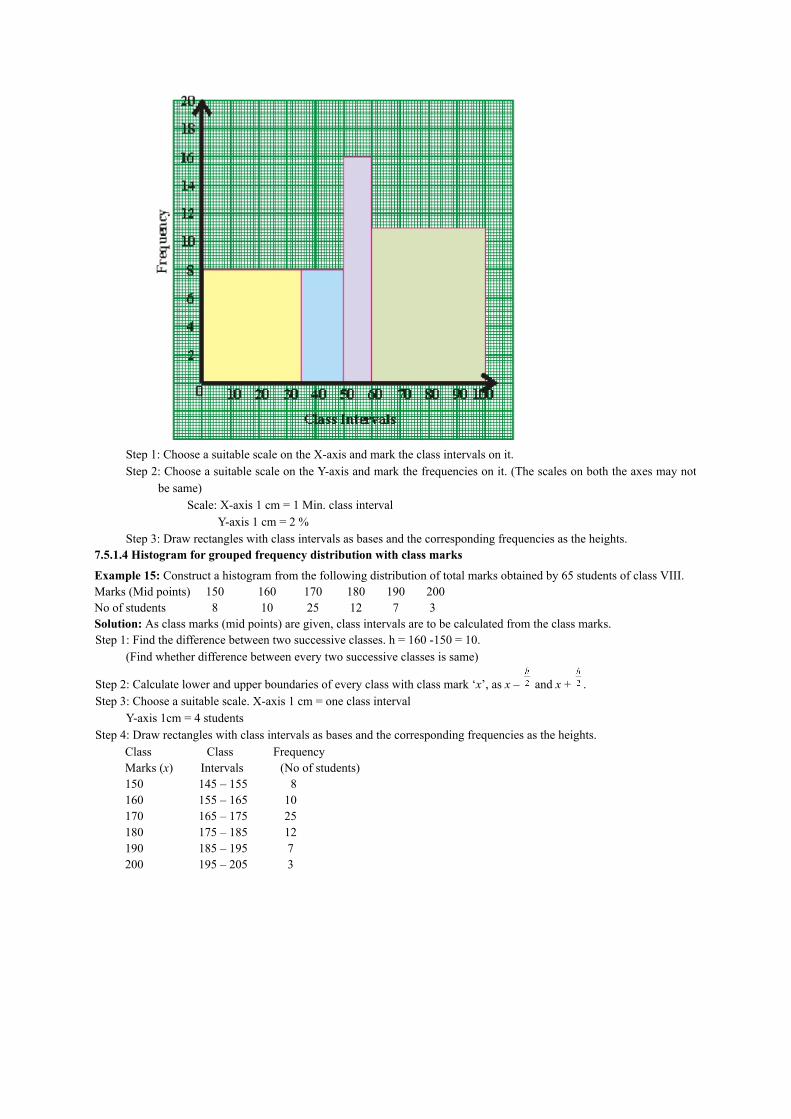
Step1:ChooseasuitablescaleontheX-axisandmarktheclassintervalsonit.Step2:ChooseasuitablescaleontheY-axisandmarkthefrequenciesonit.(Thescalesonboththeaxesmaynot
besame)Scale:X-axis1cm=1Min.classinterval
Y-axis1cm=2%Step3:Drawrectangleswithclassintervalsasbasesandthecorrespondingfrequenciesastheheights.
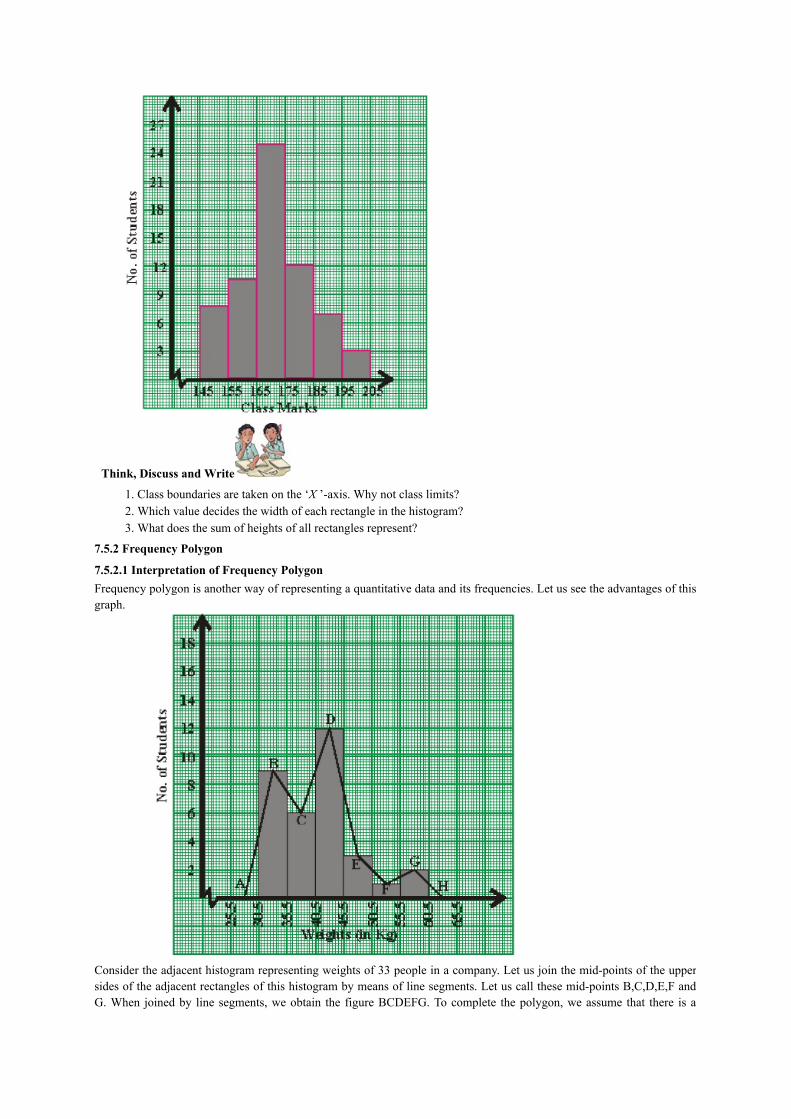
7.5.1.4Histogramforgroupedfrequencydistributionwithclassmarks
Example15:Constructahistogramfromthefollowingdistributionoftotalmarksobtainedby65studentsofclassVIII.Marks(Midpoints)150160170180190200Noofstudents810251273Solution:Asclassmarks(midpoints)aregiven,classintervalsaretobecalculatedfromtheclassmarks.Step1:Findthedifferencebetweentwosuccessiveclasses.h=160-150=10.
(Findwhetherdifferencebetweeneverytwosuccessiveclassesissame)
Step2:Calculatelowerandupperboundariesofeveryclasswithclassmark‘x’,asx– andx+ .Step3:Chooseasuitablescale.X-axis1cm=oneclassinterval
Y-axis1cm=4studentsStep4:Drawrectangleswithclassintervalsasbasesandthecorrespondingfrequenciesastheheights.
ClassClassFrequencyMarks(x)Intervals(Noofstudents)150145–1558160155–16510170165–17525180175–18512190185–1957200195–2053
Think,DiscussandWrite
1.Classboundariesaretakenonthe‘X’-axis.Whynotclasslimits?2.Whichvaluedecidesthewidthofeachrectangleinthehistogram?3.Whatdoesthesumofheightsofallrectanglesrepresent?
7.5.2FrequencyPolygon
7.5.2.1InterpretationofFrequencyPolygonFrequencypolygonisanotherwayofrepresentingaquantitativedataanditsfrequencies.Letusseetheadvantagesofthisgraph.
Considertheadjacenthistogramrepresentingweightsof33peopleinacompany.Letusjointhemid-pointsoftheuppersidesoftheadjacentrectanglesofthishistogrambymeansoflinesegments.Letuscallthesemid-pointsB,C,D,E,FandG.When joinedby line segments,weobtain the figureBCDEFG.Tocomplete thepolygon,weassume that there isa
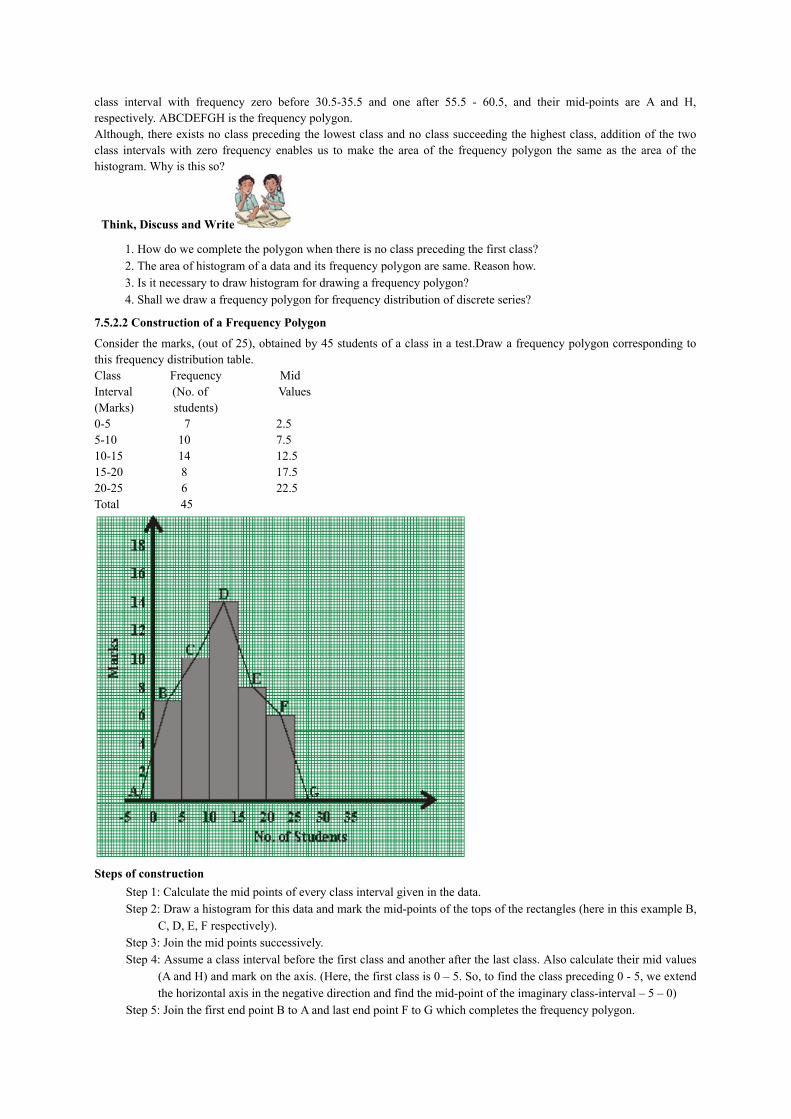
class interval with frequency zero before 30.5-35.5 and one after 55.5 - 60.5, and their mid-points are A and H,respectively.ABCDEFGHisthefrequencypolygon.Although,thereexistsnoclassprecedingthelowestclassandnoclasssucceedingthehighestclass,additionofthetwoclass intervalswith zero frequency enables us tomake the area of the frequency polygon the same as the area of thehistogram.Whyisthisso?
Think,DiscussandWrite
1.Howdowecompletethepolygonwhenthereisnoclassprecedingthefirstclass?2.Theareaofhistogramofadataanditsfrequencypolygonaresame.Reasonhow.3.Isitnecessarytodrawhistogramfordrawingafrequencypolygon?4.Shallwedrawafrequencypolygonforfrequencydistributionofdiscreteseries?
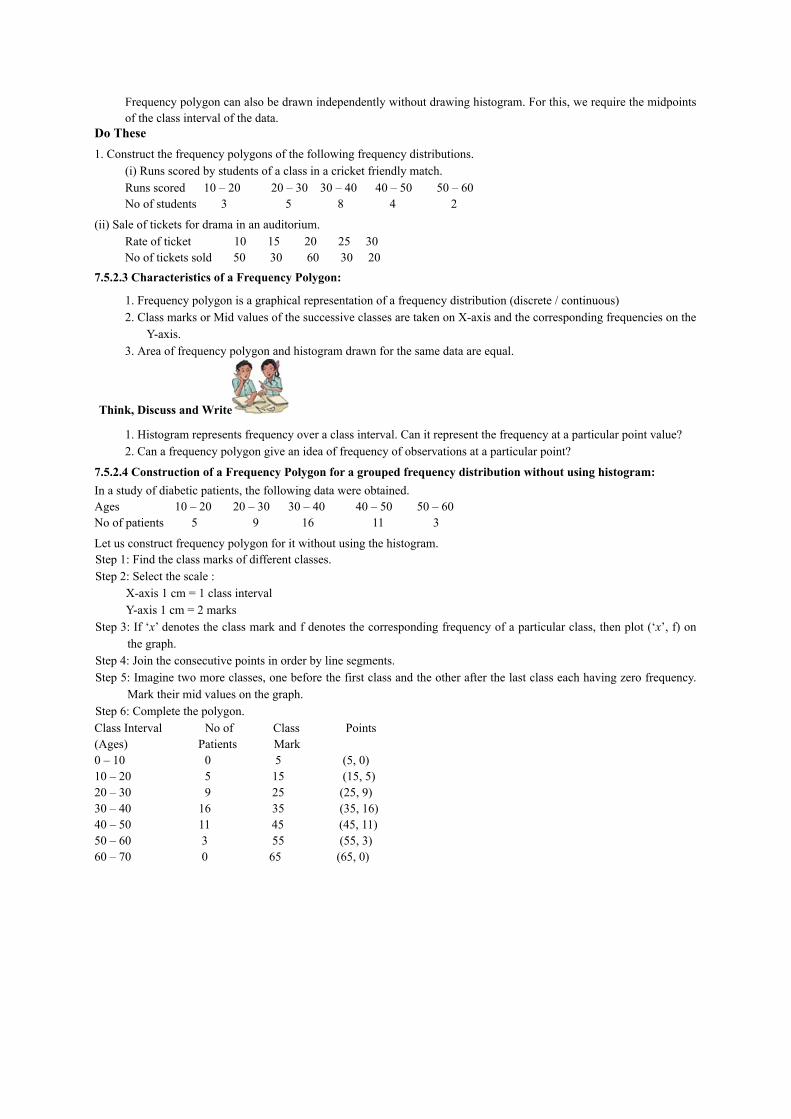
7.5.2.2ConstructionofaFrequencyPolygon
Considerthemarks,(outof25),obtainedby45studentsofaclassinatest.Drawafrequencypolygoncorrespondingtothisfrequencydistributiontable.ClassFrequencyMidInterval(No.ofValues(Marks)students)0-572.55-10107.510-151412.515-20817.520-25622.5Total45
StepsofconstructionStep1:Calculatethemidpointsofeveryclassintervalgiveninthedata.Step2:Drawahistogramforthisdataandmarkthemid-pointsofthetopsoftherectangles(hereinthisexampleB,
C,D,E,Frespectively).Step3:Jointhemidpointssuccessively.Step4:Assumeaclassintervalbeforethefirstclassandanotherafterthelastclass.Alsocalculatetheirmidvalues
(AandH)andmarkontheaxis.(Here,thefirstclassis0–5.So,tofindtheclasspreceding0-5,weextendthehorizontalaxisinthenegativedirectionandfindthemid-pointoftheimaginaryclass-interval–5–0)
Step5:JointhefirstendpointBtoAandlastendpointFtoGwhichcompletesthefrequencypolygon.
Frequencypolygoncanalsobedrawnindependentlywithoutdrawinghistogram.Forthis,werequirethemidpointsoftheclassintervalofthedata.
DoThese1.Constructthefrequencypolygonsofthefollowingfrequencydistributions.
(i)Runsscoredbystudentsofaclassinacricketfriendlymatch.Runsscored10–2020–3030–4040–5050–60Noofstudents35842
(ii)Saleofticketsfordramainanauditorium.Rateofticket1015202530Noofticketssold5030603020
7.5.2.3CharacteristicsofaFrequencyPolygon:
1.Frequencypolygonisagraphicalrepresentationofafrequencydistribution(discrete/continuous)2.ClassmarksorMidvaluesofthesuccessiveclassesaretakenonX-axisandthecorrespondingfrequenciesonthe
Y-axis.3.Areaoffrequencypolygonandhistogramdrawnforthesamedataareequal.
Think,DiscussandWrite
1.Histogramrepresentsfrequencyoveraclassinterval.Canitrepresentthefrequencyataparticularpointvalue?2.Canafrequencypolygongiveanideaoffrequencyofobservationsataparticularpoint?
7.5.2.4ConstructionofaFrequencyPolygonforagroupedfrequencydistributionwithoutusinghistogram:Inastudyofdiabeticpatients,thefollowingdatawereobtained.Ages10–2020–3030–4040–5050–60Noofpatients5916113
Letusconstructfrequencypolygonforitwithoutusingthehistogram.Step1:Findtheclassmarksofdifferentclasses.Step2:Selectthescale:
X-axis1cm=1classintervalY-axis1cm=2marks
Step3:If‘x’denotestheclassmarkandfdenotesthecorrespondingfrequencyofaparticularclass,thenplot(‘x’,f)onthegraph.
Step4:Jointheconsecutivepointsinorderbylinesegments.Step5:Imaginetwomoreclasses,onebeforethefirstclassandtheotherafterthelastclasseachhavingzerofrequency.
Marktheirmidvaluesonthegraph.Step6:Completethepolygon.ClassIntervalNoofClassPoints(Ages)PatientsMark0–1005(5,0)10–20515(15,5)20–30925(25,9)30–401635(35,16)40–501145(45,11)50–60355(55,3)60–70065(65,0)
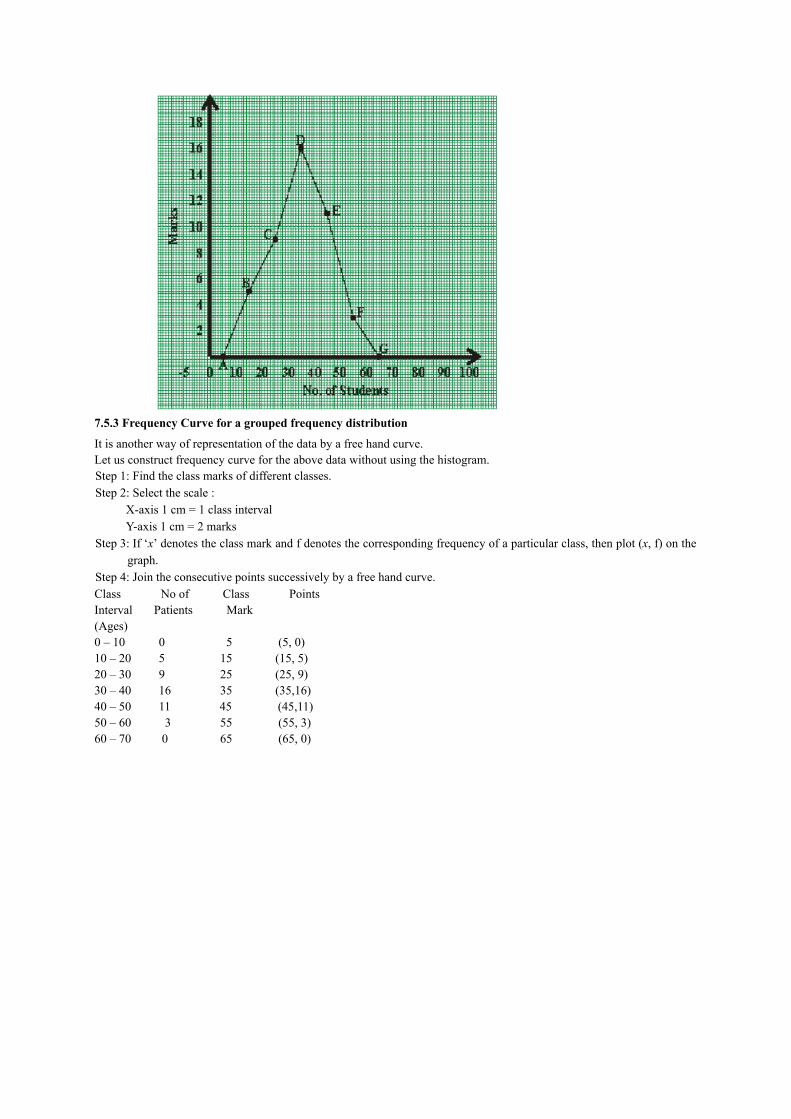
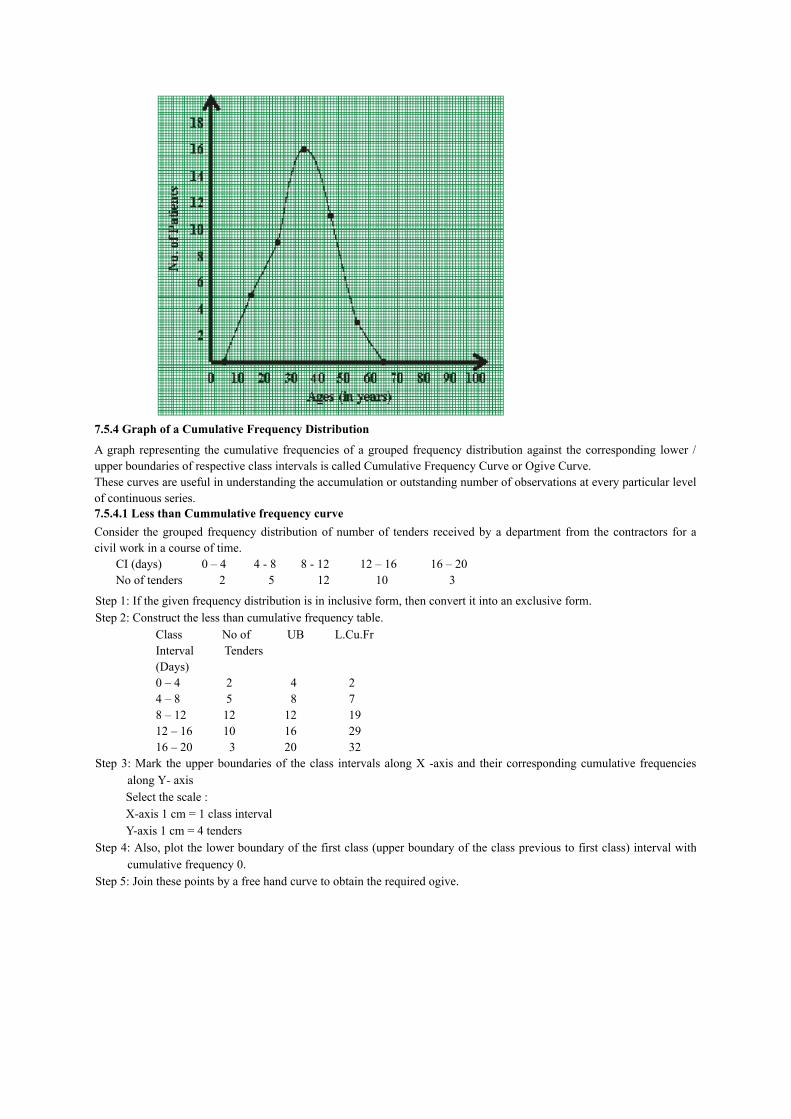
7.5.3FrequencyCurveforagroupedfrequencydistribution
Itisanotherwayofrepresentationofthedatabyafreehandcurve.Letusconstructfrequencycurvefortheabovedatawithoutusingthehistogram.Step1:Findtheclassmarksofdifferentclasses.Step2:Selectthescale:
X-axis1cm=1classintervalY-axis1cm=2marks
Step3:If‘x’denotestheclassmarkandfdenotesthecorrespondingfrequencyofaparticularclass,thenplot(x,f)onthegraph.
Step4:Jointheconsecutivepointssuccessivelybyafreehandcurve.ClassNoofClassPointsIntervalPatientsMark(Ages)0–1005(5,0)10–20515(15,5)20–30925(25,9)30–401635(35,16)40–501145(45,11)50–60355(55,3)60–70065(65,0)
7.5.4GraphofaCumulativeFrequencyDistribution
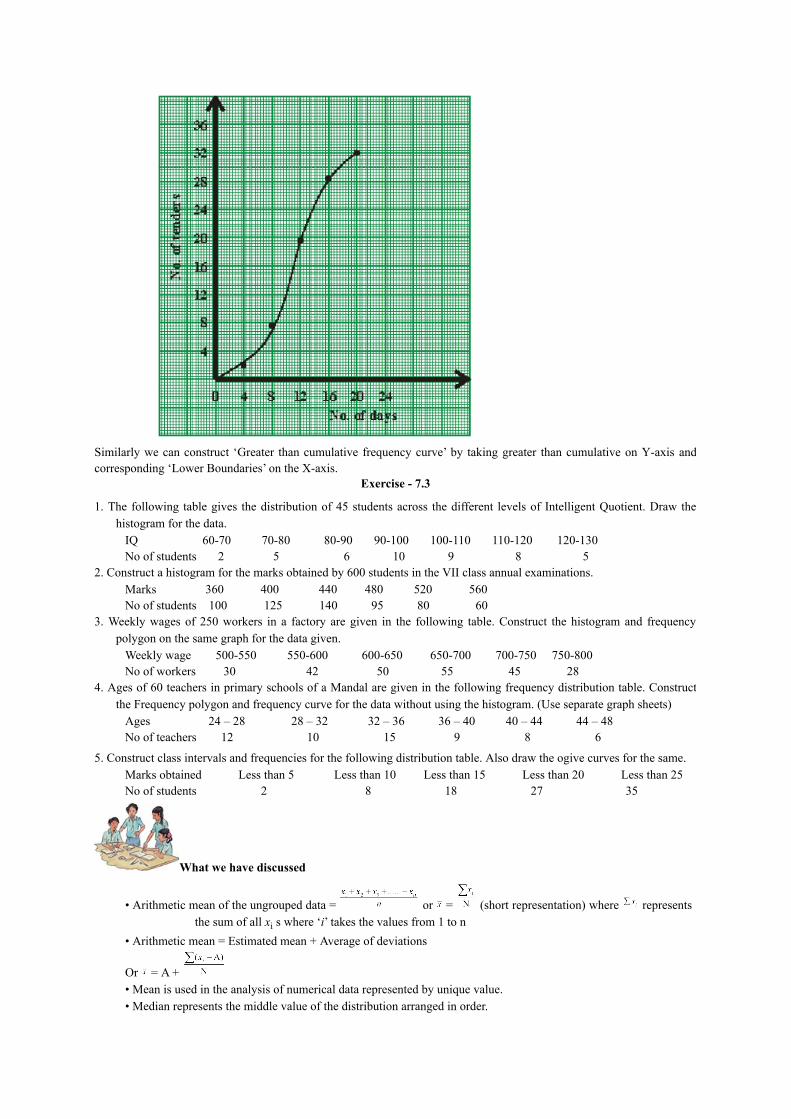
Agraph representing thecumulative frequenciesof agrouped frequencydistributionagainst thecorresponding lower /upperboundariesofrespectiveclassintervalsiscalledCumulativeFrequencyCurveorOgiveCurve.Thesecurvesareusefulinunderstandingtheaccumulationoroutstandingnumberofobservationsateveryparticularlevelofcontinuousseries.7.5.4.1LessthanCummulativefrequencycurveConsider thegrouped frequencydistributionofnumberof tenders receivedby adepartment from the contractors for acivilworkinacourseoftime.
CI(days)0–44-88-1212–1616–20Nooftenders2512103
Step1:Ifthegivenfrequencydistributionisininclusiveform,thenconvertitintoanexclusiveform.Step2:Constructthelessthancumulativefrequencytable.
ClassNoofUBL.Cu.FrIntervalTenders(Days)0–42424–85878–1212121912–1610162916–2032032
Step3:Mark theupperboundariesof theclass intervalsalongX -axisand theircorrespondingcumulative frequenciesalongY-axisSelectthescale:X-axis1cm=1classintervalY-axis1cm=4tenders
Step4:Also,plotthelowerboundaryofthefirstclass(upperboundaryoftheclassprevioustofirstclass)intervalwithcumulativefrequency0.
Step5:Jointhesepointsbyafreehandcurvetoobtaintherequiredogive.
Similarlywecanconstruct ‘Greater thancumulative frequencycurve’by takinggreater thancumulativeonY-axis andcorresponding‘LowerBoundaries’ontheX-axis.
Exercise-7.3
1.The following tablegives thedistributionof45studentsacross thedifferent levelsof IntelligentQuotient.Drawthehistogramforthedata.IQ60-7070-8080-9090-100100-110110-120120-130Noofstudents25610985
2.Constructahistogramforthemarksobtainedby600studentsintheVIIclassannualexaminations.Marks360400440480520560Noofstudents100125140958060
3.Weeklywages of 250workers in a factory are given in the following table.Construct the histogramand frequencypolygononthesamegraphforthedatagiven.Weeklywage500-550550-600600-650650-700700-750750-800Noofworkers304250554528
4.Agesof60teachersinprimaryschoolsofaMandalaregiveninthefollowingfrequencydistributiontable.ConstructtheFrequencypolygonandfrequencycurveforthedatawithoutusingthehistogram.(Useseparategraphsheets)Ages24–2828–3232–3636–4040–4444–48Noofteachers121015986
5.Constructclassintervalsandfrequenciesforthefollowingdistributiontable.Alsodrawtheogivecurvesforthesame.MarksobtainedLessthan5Lessthan10Lessthan15Lessthan20Lessthan25Noofstudents28182735
Whatwehavediscussed
•Arithmeticmeanoftheungroupeddata= or = (shortrepresentation)where representsthesumofallxiswhere‘i’takesthevaluesfrom1ton
•Arithmeticmean=Estimatedmean+Averageofdeviations
Or =A+•Meanisusedintheanalysisofnumericaldatarepresentedbyuniquevalue.•Medianrepresentsthemiddlevalueofthedistributionarrangedinorder.
•Themedianisusedtoanalysethenumericaldata,particularlyusefulwhenthereareafewobservationsthatareunlikemean,itisnotaffectedbyextremevalues.
•Modeisusedtoanalysebothnumericalandverbaldata.•Modeisthemostfrequentobservationofthegivendata.Theremaybemorethanonemodeforthegivendata.•Representationofclassifieddistinctobservationsofthedatawithfrequenciesiscalled‘FrequencyDistribution’
or‘DistributionTable’.•Differencebetweenupperandlowerboundariesofaclassiscalledlengthoftheclassdenotedby‘C’.•Inaaclasstheinitialvalueandendvalueofeachclassiscalledthelowerlimitandupperlimitrespectivelyof
thatclass.•Theaverageofupperlimitofaclassandlowerlimitofsuccessiveclassiscalledupperboundaryofthatclass.•Theaverageofthelowerlimitofaclassanduperlimitofpreceedingclassiscalledthelowerboundaryofthe
class.•Theprogressivetotaloffrequenciesfromthelastclassofthetabletothelowerboundaryofparticularclassis
calledGreaterthanCumulativeFrequency(G.C.F).•TheprogressivetotaloffrequenciesfromfirstclasstotheupperboundaryofparticularclassiscalledLessthan
CumulativeFrequency(L.C.F.).•Histogramisagraphicalrepresentationoffrequencydistributionofexclusiveclassintervals.•When the class intervals in a grouped frequency distribution are varying we need to construct rectangles in
histogramonthebasisoffrequencydensity.
Frequencydensity= Leastclasslengthinthedata•Frequencypolygonisagraphicalrepresentationofafrequencydistribution(discrete/continuous)•Infrequencypolygonorfrequencycurve,classmarksormidvaluesoftheclassesaretakenonX-axisandthe
correspondingfrequenciesontheY-axis.•Areaoffrequencypolygonandhistogramdrawnforthesamedataareequal.•Agraphrepresenting thecumulativefrequenciesofagroupedfrequencydistributionagainst thecorresponding
lower / upper boundaries of respective class intervals is called Cumulative Frequency Curve or“OgiveCurve”.
ThinkingCriticallyTheabilityofsomegraphsandcharts todistortdatadependsonperceptionof individuals tofigures.Considerthesediagramsandanswereachquestionbothbeforeandafterchecking.
(a)Whichislonger,theverticalorhorizontalline?(b)Arelineslandmstraightandparallel?(c)Whichlinesegmentislonger: or(d)Howmanysidesdoesthepolygonhave?Isitasquare?(e)Stare at the diagrambelow.Canyou see four large posts rising upout of the paper?State
someandseefoursmallposts.
(a) (b) (c) (d) (e)
Related Documents