Frequency and Fitness Consequences of Bacteriophage 6 Host Range Mutations Brian E. Ford 1,2" , Bruce Sun 1"¤a , James Carpino 1¤a , Elizabeth S. Chapler 1 , Jane Ching 1¤b , Yoon Choi 1¤c , Kevin Jhun 1¤d , Jung D. Kim 1¤e , Gregory G. Lallos 1 , Rachelle Morgenstern 1¤f , Shalini Singh 1 , Sai Theja 1 , John J. Dennehy 1 * ¤a 1 Biology Department, Queens College of the City University of New York, New York, New York, United States of America, 2 The Graduate Center of the City University of New York, New York, New York, United States of America Abstract Viruses readily mutate and gain the ability to infect novel hosts, but few data are available regarding the number of possible host range-expanding mutations allowing infection of any given novel host, and the fitness consequences of these mutations on original and novel hosts. To gain insight into the process of host range expansion, we isolated and sequenced 69 independent mutants of the dsRNA bacteriophage 6 able to infect the novel host, Pseudomonas pseudoalcaligenes. In total, we found at least 17 unique suites of mutations among these 69 mutants. We assayed fitness for 13 of 17 mutant genotypes on P. pseudoalcaligenes and the standard laboratory host, P. phaseolicola. Mutants exhibited significantly lower fitnesses on P. pseudoalcaligenes compared to P. phaseolicola. Furthermore, 12 of the 13 assayed mutants showed reduced fitness on P. phaseolicola compared to wildtype 6, confirming the prevalence of antagonistic pleiotropy during host range expansion. Further experiments revealed that the mechanistic basis of these fitness differences was likely variation in host attachment ability. In addition, using computational protein modeling, we show that host-range expanding mutations occurred in hotspots on the surface of the phage’s host attachment protein opposite a putative hydrophobic anchoring domain. Citation: Ford BE, Sun B, Carpino J, Chapler ES, Ching J, et al. (2014) Frequency and Fitness Consequences of Bacteriophage 6 Host Range Mutations. PLoS ONE 9(11): e113078. doi:10.1371/journal.pone.0113078 Editor: Mark J. van Raaij, Centro Nacional de Biotecnologia - CSIC, Spain Received May 7, 2014; Accepted October 15, 2014; Published November 19, 2014 Copyright: ß 2014 Ford et al. This is an open-access article distributed under the terms of the Creative Commons Attribution License, which permits unrestricted use, distribution, and reproduction in any medium, provided the original author and source are credited. Data Availability: The authors confirm that all data underlying the findings are fully available without restriction. All genetic sequences were deposited with Genbank (Accession numbers KF027227 - KF027297). Data files have been deposited to Dryad (doi:10.5061/dryad.5cs10). Funding: This work was supported by the National Science Foundation Faculty Early Career Award #1148879 (JJD), Professional Staff Congress of the City University of New York Award #62886-00-40 (JJD), and National Science Foundation Division of Environmental Biology Award #0804039 (JJD). The funders had no role in study design, data collection and analysis, decision to publish, or preparation of the manuscript. Competing Interests: The authors have declared that no competing interests exist. * Email: [email protected] " These authors are co-first authors on this work. ¤a Current address: The New York Stem Cell Foundation, New York, New York, United States of America ¤b Current address: University of Maryland School of Pharmacy, Baltimore, Maryland, United States of America ¤c Current address: Smilow Research Center, New York University Medical Center, New York, New York, United States of America ¤d Current address: Icahn School of Medicine at Mount Sinai, New York, New York, United States of America ¤e Current address: Epidemiology and Public Health, City University of New York School of Public Health, New York, New York, United States of America ¤f Current address: Mailman School of Public Health, Columbia University, New York, New York, United States of America Introduction After a long period of steady decline, mortality due to infectious disease increased over the past several decades, largely because of the emergence of new infectious diseases including HIV [1,2]. Of these new diseases, a disproportionate number have been viruses [3,4]. Because of their high mutation rates and vast population sizes, viruses have higher probabilities of acquiring the requisite mutation(s) allowing infection of novel hosts than do other types of pathogens [5]. A common fear is that a highly transmissible and virulent virus will spread pandemically among humans, causing widespread mortality and economic damage. Thus, there is a strong motivation to understand and predict virus emergence. Virus emergence is a two-step process. A virus first mutates to gain the ability to infect a new host, and then fully emerges by achieving positive population growth on that host via adaptation [6]. Theoretical modeling has shown that emergence probabilities are highly sensitive towards the type of mutation(s) required to productively infect a novel host [7]. Emergence events requiring single nucleotide substitutions are far more likely to occur than those that require several simultaneous point mutations or recombination [8]. While mutations altering virus host specificity can involve large-scale genomic rearrangements, most virus host shifts likely entail the modification of a small number of virus receptor amino acid residues [9]. In fact, single nucleotide substitutions are often sufficient to expand a virus’s host range [10]. If this mechanism of host range expansion were common, the number of host range expanding mutations and their frequency of appearance would be important parameters governing the probability of emergence of a potential human pathogen. Few studies have systematically determined the type, number, frequency, and fitness consequences of host range expanding PLOS ONE | www.plosone.org 1 November 2014 | Volume 9 | Issue 11 | e113078

Welcome message from author
This document is posted to help you gain knowledge. Please leave a comment to let me know what you think about it! Share it to your friends and learn new things together.
Transcript
Frequency and Fitness Consequences of Bacteriophage6 Host Range Mutations
Brian E. Ford 1,2", Bruce Sun1"¤a, James Carpino1¤a, Elizabeth S. Chapler1, Jane Ching1¤b, Yoon Choi1¤c,
Kevin Jhun1¤d, Jung D. Kim1¤e, Gregory G. Lallos1, Rachelle Morgenstern1¤f, Shalini Singh1, Sai Theja1,
John J. Dennehy1*¤a
1 Biology Department, Queens College of the City University of New York, New York, New York, United States of America, 2 The Graduate Center of the City University of
New York, New York, New York, United States of America
Abstract
Viruses readily mutate and gain the ability to infect novel hosts, but few data are available regarding the number of possiblehost range-expanding mutations allowing infection of any given novel host, and the fitness consequences of thesemutations on original and novel hosts. To gain insight into the process of host range expansion, we isolated and sequenced69 independent mutants of the dsRNA bacteriophage 6 able to infect the novel host, Pseudomonas pseudoalcaligenes. Intotal, we found at least 17 unique suites of mutations among these 69 mutants. We assayed fitness for 13 of 17 mutantgenotypes on P. pseudoalcaligenes and the standard laboratory host, P. phaseolicola. Mutants exhibited significantly lowerfitnesses on P. pseudoalcaligenes compared to P. phaseolicola. Furthermore, 12 of the 13 assayed mutants showed reducedfitness on P. phaseolicola compared to wildtype 6, confirming the prevalence of antagonistic pleiotropy during host rangeexpansion. Further experiments revealed that the mechanistic basis of these fitness differences was likely variation in hostattachment ability. In addition, using computational protein modeling, we show that host-range expanding mutationsoccurred in hotspots on the surface of the phage’s host attachment protein opposite a putative hydrophobic anchoringdomain.
Citation: Ford BE, Sun B, Carpino J, Chapler ES, Ching J, et al. (2014) Frequency and Fitness Consequences of Bacteriophage 6 Host Range Mutations. PLoSONE 9(11): e113078. doi:10.1371/journal.pone.0113078
Editor: Mark J. van Raaij, Centro Nacional de Biotecnologia - CSIC, Spain
Received May 7, 2014; Accepted October 15, 2014; Published November 19, 2014
Copyright: � 2014 Ford et al. This is an open-access article distributed under the terms of the Creative Commons Attribution License, which permits unrestricteduse, distribution, and reproduction in any medium, provided the original author and source are credited.
Data Availability: The authors confirm that all data underlying the findings are fully available without restriction. All genetic sequences were deposited withGenbank (Accession numbers KF027227 - KF027297). Data files have been deposited to Dryad (doi:10.5061/dryad.5cs10).
Funding: This work was supported by the National Science Foundation Faculty Early Career Award #1148879 (JJD), Professional Staff Congress of the CityUniversity of New York Award #62886-00-40 (JJD), and National Science Foundation Division of Environmental Biology Award #0804039 (JJD). The funders hadno role in study design, data collection and analysis, decision to publish, or preparation of the manuscript.
Competing Interests: The authors have declared that no competing interests exist.
* Email: [email protected]
" These authors are co-first authors on this work.
¤a Current address: The New York Stem Cell Foundation, New York, New York, United States of America¤b Current address: University of Maryland School of Pharmacy, Baltimore, Maryland, United States of America¤c Current address: Smilow Research Center, New York University Medical Center, New York, New York, United States of America¤d Current address: Icahn School of Medicine at Mount Sinai, New York, New York, United States of America¤e Current address: Epidemiology and Public Health, City University of New York School of Public Health, New York, New York, United States of America¤f Current address: Mailman School of Public Health, Columbia University, New York, New York, United States of America
Introduction
After a long period of steady decline, mortality due to infectious
disease increased over the past several decades, largely because of
the emergence of new infectious diseases including HIV [1,2]. Of
these new diseases, a disproportionate number have been viruses
[3,4]. Because of their high mutation rates and vast population
sizes, viruses have higher probabilities of acquiring the requisite
mutation(s) allowing infection of novel hosts than do other types of
pathogens [5]. A common fear is that a highly transmissible and
virulent virus will spread pandemically among humans, causing
widespread mortality and economic damage. Thus, there is a
strong motivation to understand and predict virus emergence.
Virus emergence is a two-step process. A virus first mutates to
gain the ability to infect a new host, and then fully emerges by
achieving positive population growth on that host via adaptation
[6]. Theoretical modeling has shown that emergence probabilities
are highly sensitive towards the type of mutation(s) required to
productively infect a novel host [7]. Emergence events requiring
single nucleotide substitutions are far more likely to occur than
those that require several simultaneous point mutations or
recombination [8]. While mutations altering virus host specificity
can involve large-scale genomic rearrangements, most virus host
shifts likely entail the modification of a small number of virus
receptor amino acid residues [9]. In fact, single nucleotide
substitutions are often sufficient to expand a virus’s host range
[10]. If this mechanism of host range expansion were common, the
number of host range expanding mutations and their frequency of
appearance would be important parameters governing the
probability of emergence of a potential human pathogen.
Few studies have systematically determined the type, number,
frequency, and fitness consequences of host range expanding
PLOS ONE | www.plosone.org 1 November 2014 | Volume 9 | Issue 11 | e113078
mutations for any particular virus-host combination [11]. Such
data can aid the parameterization of evolutionary ecological model
of virus emergence. Factoring in other parameters, such as
transmission rates and population densities, may allow quantitative
predictions of the likelihood a particular virus is able to emerge on
a new host. This type of prioritization is critical before allocating
resources to interdict potential pathogenic viruses before they
emerge.
Here we use an experimental model system, the bacteriophage
(phage) 6, to determine number, frequency, fitness and structural
consequences of mutations allowing infection of a novel host.
Phage 6 (family Cystoviridae) is a dsRNA virus with a tripartite
genome divided into Small (2,948 bp), Medium (4,061 bp) and
Large (6,374 bp) segments [12–14]. Mutations allowing 6 to
infect novel hosts have been localized to the gene encoding the P3
protein on the Medium segment [11,15].
Two previous studies have systematically examined 6 host
range expansion [11,15]. Duffy et al. isolated 10 6 host range
mutants on each of three different Pseudomonas host strains
including Pseudomonas pseudoalcaligenes [15]. Genetic sequenc-
ing revealed that all mutations occurred in the P3 attachment
protein. Moreover, the authors reported that 7 of the 9 host range
mutations imposed a fitness cost on the canonical host, indicative
of antagonistic pleiotropy. Ferris et al. isolated 40 6 host range
mutants on P. glycinea, of which 16 contained novel mutations
[11]. The authors used a statistical approach to predict the
existence of a further 39 mutations that were missed by their
screen. In addition, they observed broad fitness costs on the
canonical host in agreement with Duffy et al. [11,15].
Our study builds on each of these earlier studies in order to
present a more complete picture of host range expansion in 6.
We isolated 69 independent 6 mutants able to infect the novel
host, P. pseudoalcaligenes, and sequenced the entire P3 gene for
each of them in order to determine the number, location, and
frequency of host range expanding genotypes. For a subset of
unique mutant genotypes, we quantified plaque size on P.pseudoalcaligenes, and reproductive capacity (fitness) and host
attachment rate on both the canonical host P. phaseolicola and the
novel host, P. pseudoalcaligenes. Finally, we used protein
structural modeling to predict the effects of host range mutations
on P3 attachment protein structure. Our work comes to
qualitatively different conclusions than earlier work, namely that:
1) the coupon collector’s model, as currently construed, cannot
successfully predict the number of potential host range mutations;
2) there are fewer than expected mutations allowing host range
expansion; and 3) fine-grained host infectibility cannot be
accurately predicted by phylogeny. Furthermore, we show that
6 host range mutations usually occur in hotspots on the face of
the P3 attachment protein opposite a hydrophobic anchoring
domain. We propose that mutations on this surface allow 6 to
bind novel host receptors.
Methods and Materials
Study Organisms and Culture ConditionsCystovirus 6 used in these experiments is a descendant of the
strain originally isolated from bean straw in 1973 [16]. 6’s host of
isolation was the Gram-negative bacterium, P. syringae pathovar
phaseolicola (ATCC # 21781; hereafter PP) [16]. In our study, we
used a nonpermissive host, P. pseudoalcaligenes East River isolate
A (hereafter ERA), to isolate 6 host range mutants (HRMs). The
ERA receptor to which 6 binds has not been determined, but is
likely the ERA pili. Two other nonpermissive hosts, P. syringae pv.
tomato (hereafter TOM) and P. syringae pv. atrofaciens (hereafter
ATRO), were used in some assays. All bacteria and virus stocks
were obtained from Paul Turner, Yale University, New Haven,
CT.
All phages and bacteria were propagated in lysogeny broth (LB:
10 g NaCl, 10 g Bacto tryptone, and 5 g Bacto yeast extract per
liter of water) at pH 7. Bacterial cultures were initiated by
transferring a single colony from a streak plate into 10 mL LB in a
sterile 50 mL flask capped with a 20 mL beaker. Culture flasks
were incubated with shaking (120 rpm) at 25uC for 18 hours,
allowing bacteria to attain stationary-phase density (,66109 cells
mL21).
Virus Stock PreparationHigh-titer phage lysates were prepared by adding 1 mL stock
lysate and bacteria (200 mL of PP/ATRO/TOM or 20 mL ERA)
to 3 mL top agar (LB with 0.7% Bacto agar; stored as liquid at
45uC, solidifies at 25uC), and pouring onto 35 mL bottom agar
(LB with 1.5% Bacto agar) in a sterile Petri dish. After 24 hours at
25uC, the resulting plaques were harvested and resuspended in
4 mL of LB, followed by 10 min centrifugation at RCF = 14006g
to pellet agar and bacterial debris. Bacteria-free lysates were
obtained by filtering the supernatant through a 0.22 mm filter
(Durapore; Millipore, Bedford, MA). Phage particles per mL in the
lysates were quantified via serial dilution and titering. Plaques
were counted on plates where 30–500 plaques were visible. The
number of plaque forming units per mL (pfu mL21) in the original
lysate was obtained by multiplying the number of plaques times
the dilution factor. Lysates were mixed 1:1 (v/v) with 80% glycerol
and were stored at 220uC.
Host Range Mutant FrequencyThe frequency of HRMs in a phage population was estimated
by plating a known number of wildtype 6 on a lawn of a
nonpermissive host and counting the resulting number of plaques.
Each plaque represents the descendants of a single HRM in the
parent population. To perform this assay, a single plaque was
picked off a lawn of PP and placed in 1 mL LB. This mixture was
serially diluted and plated on PP to estimate phage pfu mL21.
Subsequently, 107 or (108 for TOM) phages were plated on lawns
of the nonpermissive hosts, ERA, TOM and ATRO. Typically, a
6 plaque contains ,56108 pfu/mL so sufficient phage for
plating were easily obtained [17]. Following 48 hrs growth,
plaques were counted to estimate the number of spontaneous
HRMs among the descendants of a single phage. This assay was
repeated at least twenty times per nonpermissive host strain.
Mutant frequency was calculated by dividing the number of
plaques observed by the initial inocula. The resulting data were
analyzed using a one-way analysis of variance (ANOVA) model
with host as a factor. A Tukey-Kramer honest significant
difference test was applied post-hoc to ascertain significant
differences among mean mutant frequencies on each host type.
Host Range Mutant IsolationEach HRM was isolated independently to minimize bias due to
a ‘‘jackpot effect’’ where multiple descendants of the same
mutational event appear in a population [18]. A 6 lysate was
serially diluted and plated on a PP lawn such that only a few
widely spaced plaques appeared on the bacterial lawn. A single
plaque was picked at random and placed in 1 mL LB. After
vortexing, 100 mL of the plaque suspension was added to 20 mL
ERA and 3 mL top agar and plated. Following 48 hrs growth, a
single HRM plaque was picked from the ERA lawn and
suspended in 500 mL LB. 10 mL from this solution was plated
on an ERA lawn to obtain phage lysate for RNA extraction.
Phage Host Range Mutation Frequency
PLOS ONE | www.plosone.org 2 November 2014 | Volume 9 | Issue 11 | e113078
500 mL 80% glycerol was added to the remainder which was then
stored at 220uC. This protocol was repeated 69 times to obtain 69
independent HRM isolates.
RNA Extraction and SequencingTo sequence the region of the Medium segment encoding the
P3 protein, 3 mL phage lysate from each mutant was concentrated
by centrifuging at RCF = 100,0006g for 3 hrs at 4uC using a
Beckman TL-100 ultracentrifuge. The supernatant was discarded
and the pellet was resuspended in 150 mL nuclease-free water.
RNA was extracted using a QIAamp Viral RNA Mini Kit
(QIAGEN, Valencia, CA). Phage RNA was reverse transcribed
using random hexamer primers and Superscript III reverse
transcriptase (Life Technologies, Grand Island, NY), and the
resulting cDNA was used as template for PCR. Three sets of
oligonucleotide primers corresponding to bases 1298–2142, 2042–
3052, and 2877–3873 of 6’s Medium segment were used for the
PCR amplification of the region encoding the P3 host attachment
protein. PCR product was purified for sequencing using ExoSAP-
It (Affymetrix, Santa Clara, CA). PCR product was sequenced in
both directions with a minimum of 3-fold replication (6-fold
coverage). Sequencing was performed at the DNA Analysis
Facility on Science Hill at Yale University. Sequence data were
analyzed using Geneious Pro Ver. 5.4 [19] and MEGA Ver. 5.05
[20]. Chromatograms were verified via MacVector Ver. 12.5.1
bioinformatics software.
Mutant CharacterizationWe phenotypically characterized HRM genotypes by deter-
mining plaque size on ERA, and by assaying reproductive capacity
(fitness) and attachment rates on ERA and PP. Of our unique
mutant genotypes, we did not assay the three mutants whose
mutations were not identified (see Table 1). Furthermore, we only
assayed one mutant in situations where differences between
genotypes were attributable to synonymous amino acid substitu-
tions. Finally, for one mutant, stored frozen lysate degraded due to
a freezer failure following sequencing, and viable phage could not
be recovered for phenotypic characterization. In sum, we
phenotypically characterized 13 of our 17 unique HRM
genotypes.
Plaque Size EstimatesPlaque sizes for 13 HRM genotypes were estimated from digital
photographs of plaques formed on ERA. All LB plates used for
plaque assays were poured at the same time and were weighed to
maintain consistency. Each mutant’s lysate was diluted and plated
such that between 20 to 100 plaques formed on the ERA lawn
after 48 hrs growth. Digital photographs were taken using a
Kodak Gel Logic 440 digital imaging system. ImageJ software
(NIH, Bethesda, MD; http://rsb.info.nih.gov/ij/) was used to
estimate the total area of the plaque. For each genotype, at least 35
plaque size estimates were made across 3 plates.
Mutant Fitness on Native and Novel HostsWe assayed absolute fitness for 13 of our 6 mutants and the
wildtype on native and novel hosts using traditional plating
methods. Here 105 phages were added to 36108 host cells in
10 mL LB and incubated at 25uC with rotary shaking (120 rpm)
for 24 hrs. All assays were replicated 5x. Bacteria-free lysates were
obtained by centrifuging 3 mL culture at RCF = 2.756g for
10 min to pellet bacterial debris, then passing the supernatant
through a 0.22 mm filter. Phage particles per mL in the lysates
were quantified via serial dilution and titering on host lawns. For
each assayed mutant genotype, we estimated absolute fitness using
the equation, W~ln NtNi
� �, where Ni is the starting number of
phage and Nt is the total number of progeny phage produced
during the infection period.
Attachment Rate AssaysThe rate of attachment to native and novel hosts of 13 mutant
HRM genotypes was measured using a centrifugation method.
This method relies on the fact that, following centrifugation,
attached phages are pelleted with host cells, while unattached
phages remain in the supernatant. The decline of unattached
phage over time is quantified to give the rate of phage attachment
to host cells. In this assay, 103 phages, which were titered on the
same host as the assay host, were mixed with 56109 exponentially
growing host cells in 10 mL LB with 3-fold replication. The
mixture was incubated with orbital shaking for 40 min. Immedi-
ately after mixing and every 10 min thereafter, a 1 mL sample
from the mixture was centrifuged (RCF = 1,7006g) for 1 min to
pellet the cells then 100 mL from the supernatant was plated on a
PP lawn. The attachment rate constant (k) is calculated as
k~ln ( Nf
Ni)
Ct
where Ni is the total number of phage added, Nf is the number of
unattached phage, C is the concentration of bacteria, and t is the
incubation time in minutes.
Attachment Protein P3 3D Structure PredictionThree-dimensional structures of canonical bacteriophage 6
ancestral strain P3 attachment protein were predicted by
homologue modeling based on nucleotide sequences submitted
to the online I-TASSER server (http://zhanglab.ccmb.med.
umich.edu/I-TASSER) [21,22]. I-TASSER generates three-di-
mensional (3D) atomic models from multiple threading alignments
and iterative structural assembly simulations. Default parameters
were used for the I-TASSER submission. The P3 amino acid
sequence was submitted to the transmembrane structure predic-
tion Dense Alignment Surface software (DAS) website (http://
www.sbc.su.se/,miklos/DAS/maindas.html). DAS uses low-
stringency dot-plots of the query sequence against a collection of
non-homologous membrane proteins using a previously derived,
special scoring matrix to identify transmembrane helices of
integral membrane proteins. Default parameters were used for
the DAS submission.
Results
Mutation Frequency6 HRMs were readily isolated by plating wildtype phages on
lawns of the nonpermissive hosts, ERA, TOM and ATRO. The
frequency in which ERA-infective HRMs appeared in populations
of 6 phages was 1.1561026 (n = 21, SD 65.21961027). This
value is only slightly lower than 6’s spontaneous mutation rate,
2.761026 [23]. Rates on TOM and ATRO were 1.3961027
(n = 21, SD 61.48961028) and 4.4561027 (n = 21, SD6
1.00161027) respectively. We conducted a one-way ANOVA on
log10 mutant frequency with bacterial host strain as a factor, and
found significant differences in mutant frequency across different
host strains (F = 198.54, DF = 2, P,0.0001). A Tukey-Kramer
post hoc test with a= 0.05 revealed that all compared means were
significantly different from each other. Interestingly, HRMs
Phage Host Range Mutation Frequency
PLOS ONE | www.plosone.org 3 November 2014 | Volume 9 | Issue 11 | e113078
Ta
ble
1.
Ph
ageQ
6M
uta
tio
ns
Allo
win
gIn
fect
ion
of
No
vel
Ho
stER
A.
Nu
cle
icA
cid
(Am
ino
Aci
d)
NG
22
A(E
8K
)A
23
G(E
8G
)A
23
C(E
8A
)G
24
T(E
8D
)G
24
C(E
8D
)T
13
7C
(F4
6S
)T
13
8A
(F4
6L
)T
17
7C
D5
9D
)A
38
9G
(Q1
30
R)
T4
81
C(S
16
1P
)C
89
6G
(S2
99
W)
C1
58
8T
(L5
30
L)
A1
66
1G
(D5
54
G)
A1
66
1C
(D5
54
A)
C1
66
3T
(L5
55
F)
No
nP
3
Sin
gle
(n=
56
)2
0&
24
&
4%
3%
1%
1&
2&
1%
Do
ub
le(n
=8
)1
&&
1&
&
1&
&
1%
%
3&
&
1&
%
Tri
ple
(n=
2)
1&
&
1&
&
Un
kno
wn
3m
To
tal
#O
bse
rve
d6
92
32
85
31
11
17
11
13
11
3
Inth
ista
ble
,th
eco
lum
ns
sho
wth
en
ucl
eo
tid
ean
dam
ino
acid
sub
stit
uti
on
sfo
un
dit
all
69
ERA
ho
stra
ng
em
uta
nts
.R
ow
ssh
ow
un
iqu
eg
en
oty
pe
s.N
isth
en
um
be
ro
fm
uta
nts
wit
ha
par
ticu
lar
ge
no
typ
e.
Th
ela
stro
wsh
ow
sth
en
um
be
ro
fti
me
sa
giv
en
mu
tati
on
app
ear
sam
on
gal
lmu
tan
ts.T
ran
siti
on
sar
ein
dic
ate
db
ycl
ose
dsq
uar
es,
tran
sve
rsio
ns
wit
ho
pe
nsq
uar
es,
syn
on
ymo
us
sub
stit
uti
on
sw
ith
op
en
circ
les
and
un
kno
wn
chan
ge
sw
ith
afi
lled
tria
ng
le.
do
i:10
.13
71
/jo
urn
al.p
on
e.0
11
30
78
.t0
01
Phage Host Range Mutation Frequency
PLOS ONE | www.plosone.org 4 November 2014 | Volume 9 | Issue 11 | e113078
appeared more readily on the phylogenetic outgroup P.pseudoalcaligenes ERA than they do on other conspecific P.syringae pathovars such as P. syringae atrofaciens and P. syringaetomato [24].
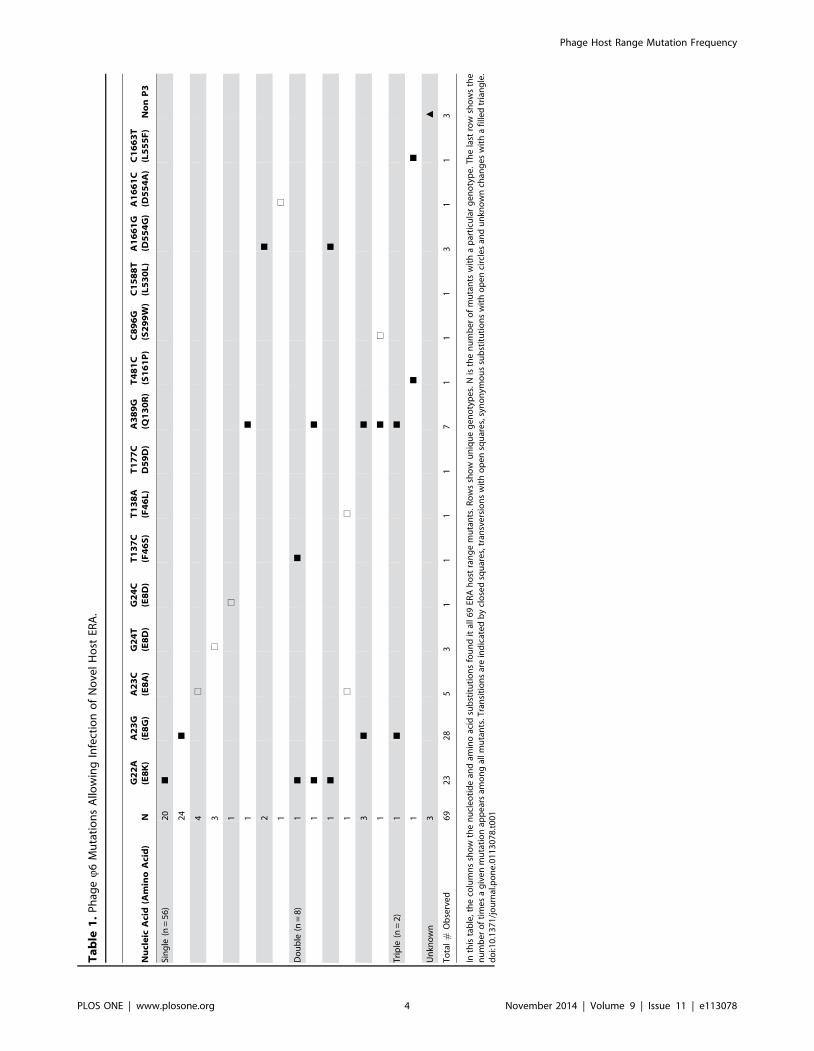
We found at least 17 unique genotypes among the 69 ERA
HRMs isolated and partially sequenced (Table 1). Three HRMs
had no mutations in the sequenced region of the genome, thus we
count them as, at a minimum, one unique genotype. Out of a
combined 78 identified mutations from three studies, the majority
resulted in nonsynonymous substitutions in the P3 amino acid
sequence. Only 2 synonymous substitutions were identified
(Table 1). This result conforms to Duffy et al.’s report of only 1
synonymous substitution among 31 mutations [15]. Synonymous
substitution frequencies were similar between the two studies
(2.5% vs. 3.2%).
Mutation Substitution FrequencyAmong all nucleotide substitutions identified by our screen, the
estimated transition/transversion bias R was 1.90. At the 8th
residue, at least 5 possible substitutions (G22A, A23G, A23C,
G24T and G24C) allow infection of ERA. However, of all
substitutions observed, the majority were transitions (51 vs. 9).
These results suggest that host range mutations allowing infection
of ERA are heavily biased towards transitional substitutions. The
significance of this finding is not clear, and may simply be a
consequence of spontaneous deamination.
87% (60 of 69) of all mutants possessed a mutation at the 8th
amino acid residue in the P3 protein. Only 9 mutants (4 single, 1
double, 1 triple and 3 unknowns) did not show a mutation at the
8th residue. This imbalance is higher than was observed in Duffy et
al.’s study, where only 14 of 30 mutants isolated on ERA possessed
mutations at the 8th residue [15]. However, we note that Duffy et
al.’s study did not control for the ‘‘jackpot effect’’ and 20 of 30
mutants were isolated from hosts other than ERA. The dominance
of a single residue is not unprecedented. Ferris et al. reported that
12 of 40 mutants isolated on P. glycinea showed a mutation at the
554th residue [11]. Across all 3 studies and 5 different hosts, there
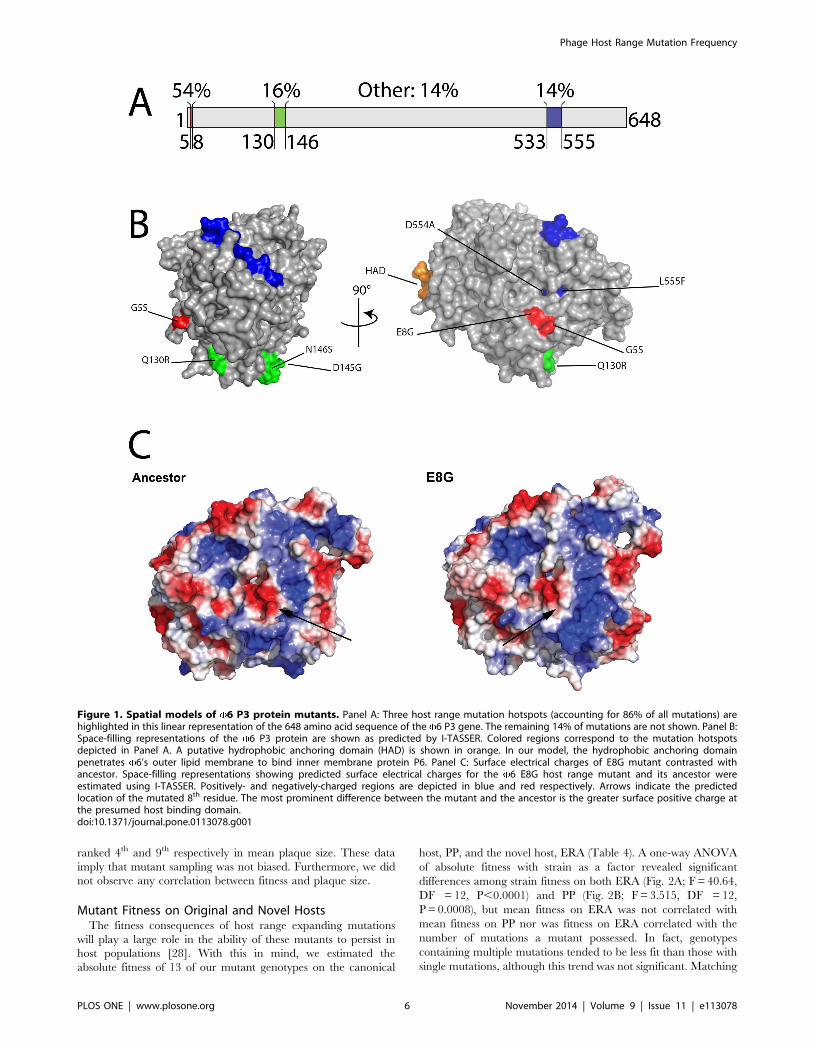
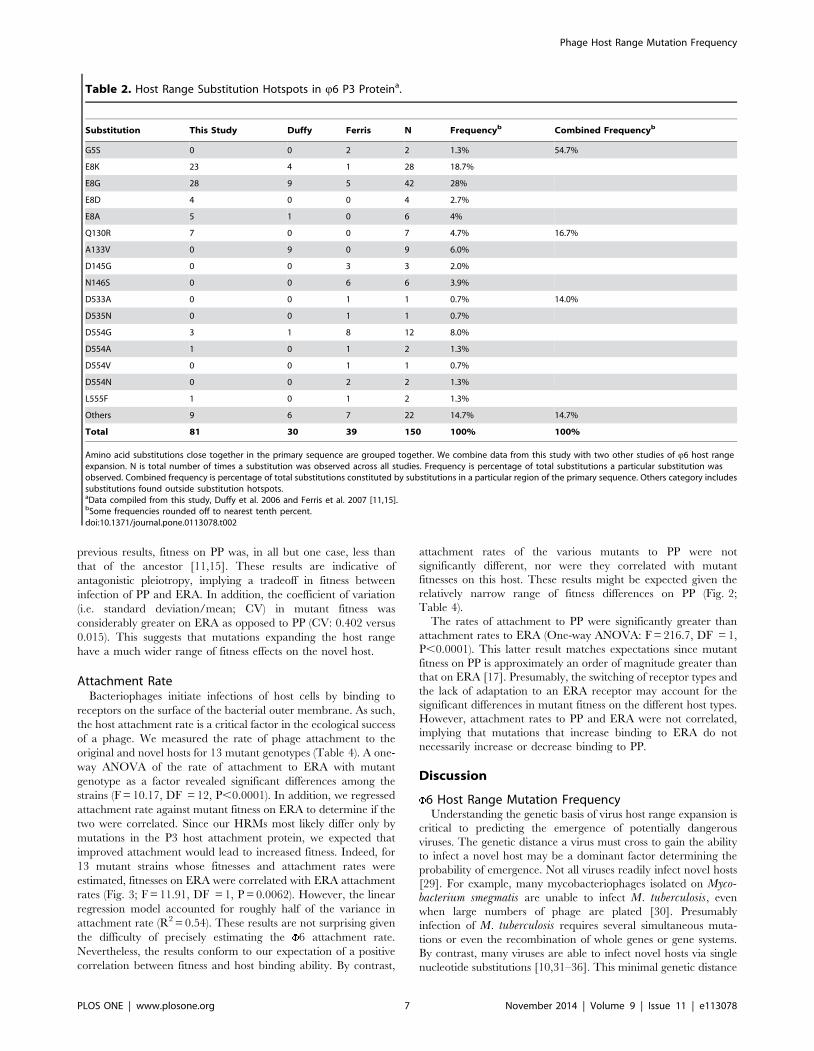
seems to be 3 ‘‘hotspots’’ for host range mutations in 6. 85.4% of
all amino acid substitutions occurred close to the 8th (54.7%), 138th
(16.7%) and 544th (14%) residues (Fig. 1A; Table 2).
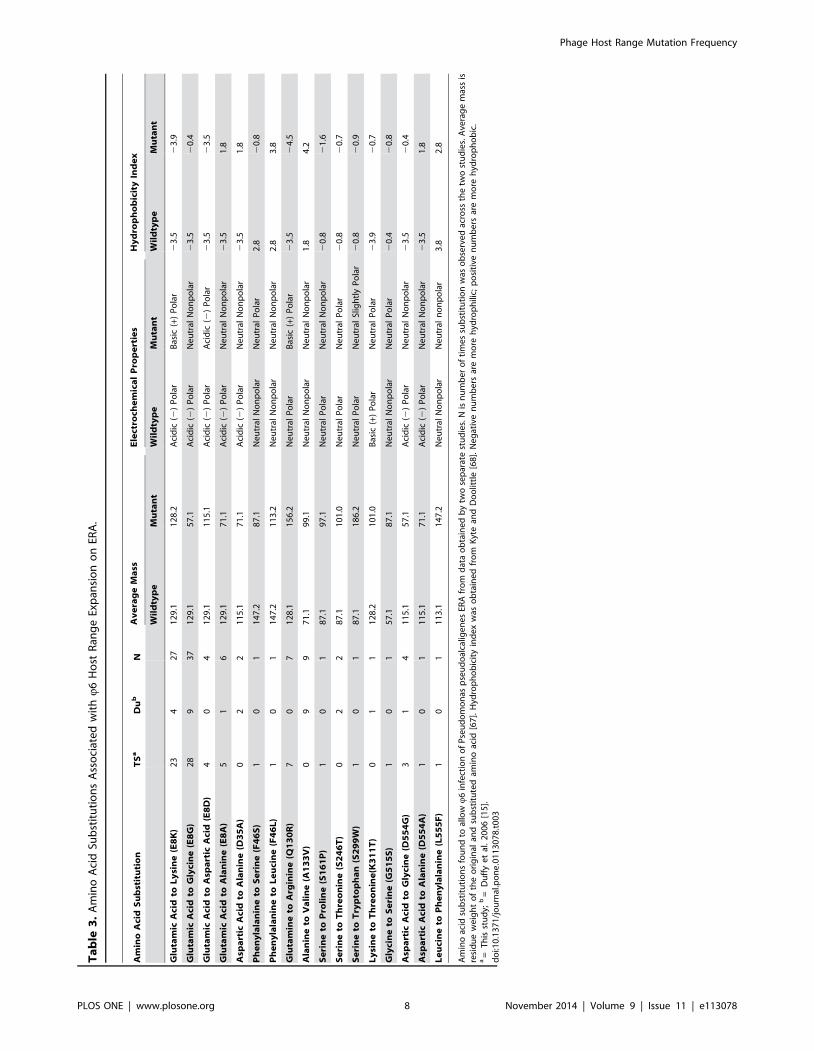
Phenotypic Change AnalysisChanges in mass, electrical charge and hydrophobicity
presumably can alter host receptor binding by changing the
protein’s tertiary structure and altering protein-protein interac-
tions. In Table 3, we compiled the phenotypic characteristics of all
amino acid substitutions allowing infection of ERA observed in
this study and in Duffy et al. [15]. Using this data, we performed a
paired t-test on amino acid mass for each mutation with strain type
(wildtype or mutant) as a factor. Both factors had significant effects
on amino acid mass. Substituted amino acids in mutants had
significantly less mass than the original amino acids in the wildtype
strain (t = 6.73, DF = 77, P,0.0001). This effect was most
pronounced in mutation hotspots (F = 7.25, DF = 71, P,
0.0001). Perhaps lower mass substitutions permit greater flexibility
at the host binding site.
Electrostatic interactions between host and phage proteins are
most likely the basis of phage attachment. If so, we expect that
charge changes incurred by host range mutations should be
consistently in the same direction. A X2 test was used to determine
whether chemical properties of substituted amino acids differed
significantly from the random expectation based on the amino
acid composition of the P3: 9.16% acidic, 8.69% basic, 24.53%
hydrophilic, and 57.45% hydrophobic. We found that mutant
amino acids were significantly more likely to be basic or
hydrophilic than expected by chance (X2 = 110.008, DF = 3,
P,0.0001). Furthermore, the frequency of mutations occurring at
acidic residues was disproportionately high (81/106 or 76%).
Ferris et al. also observed a greater than expected number of loss
of charge mutations [11]. We speculate that these chemical
changes make the P3 protein’s host-binding site more permissive
for binding host receptors.
P3 3D Structure PredictionLittle is known regarding how host range expanding amino acid
substitutions affect phage attachment protein structure. We used I-
TASSER [21,22] and DAS modeling software [25] to predict
structural features of the P3 protein. I-TASSER generates three-
dimensional atomic models from multiple threading alignments
and iterative structural assembly simulations based on homology
to solved structures (Fig. 1B). The predicted model’s confidence
score (C-score) was 22.12, which is intermediate confidence
where scores range from high (2) to low (25) confidence. When
predicting known structures, and using a C-score cutoff .21.5 for
the models of correct topology, both false positive and false
negative rates are below 0.1 [21]. While our C-score did not meet
this threshold, we are confident that the probability of an incorrect
structure is still low. Our view is supported by the ability of the
predicted structure to provide a biologically plausible interpreta-
tion of the mechanistic basis of host range expansion.
DAS modeling software predicts transmembrane protein
segments based on low-stringency dot-plots of query sequences
against a collection of non-homologous membrane proteins using
a previously derived, scoring matrix. Although P3 is soluble [26],
DAS predicted a 21 amino acid hydrophobic membrane-
interactive domain at residues 271 to 291. Based on the fact that,
on the predicted structure, this domain extends out from the P3
core (Fig. 1B), we venture that domain likely anchors the P3
protein to the integral membrane protein P6 [27], thus we will
refer to it as the hydrophobic anchoring domain, or HAD. All host
range mutations occurred on the face opposite the HAD,
suggesting that the opposite surface binds the host receptor, and
that mutations in this region allow infection of novel hosts.
However, this hypothesis assumes that amino acid substitutions do
not substantially alter the protein shape, and that residues on this
face in the ancestor would remain on this face in the mutant.
Figure 1C suggests our conjecture is valid as the E8G mutant’s
predicted structure does not show major structural rearrangements
compared to the wildtype. Interestingly, the most common host
range mutations found in our study alter the surface charge at this
location from negative to neutral, hinting at a proximate
mechanism for host range expansion (Fig. 1C).
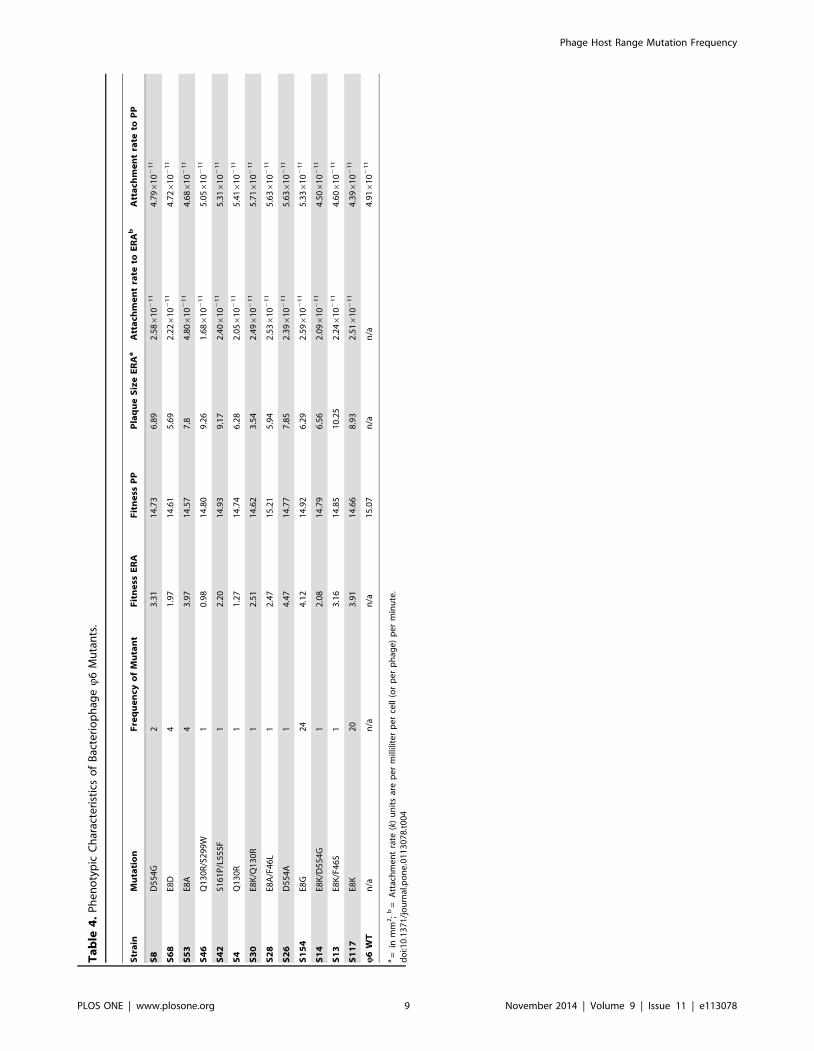
Plaque SizeWe isolated HRMs by visually identifying and picking plaques
off lawns of the nonpermissive host, ERA. Our results showed that
host range mutations were heavily biased towards the 8th residue.
One possible criticism of our mutant isolation process is that it may
have been biased towards certain mutations simply because these
mutants formed larger plaques that were more likely to be spotted
by the sampler. To test this hypothesis, we determined from digital
photographs the average plaque size for 13 of 17 of our identified
HRMs. Mean plaque size for our mutants ranged from 3.5 to 10.3
mm2 (Table 4). We performed an ANOVA of mean plaque size
with mutant frequency as a factor, and the results confirmed that
plaque size did not predict mutant frequency. While we did find
significant differences in plaque size among genotypes, the two
most frequent genotypes found by our study (E8K and E8G)
Phage Host Range Mutation Frequency
PLOS ONE | www.plosone.org 5 November 2014 | Volume 9 | Issue 11 | e113078
ranked 4th and 9th respectively in mean plaque size. These data
imply that mutant sampling was not biased. Furthermore, we did
not observe any correlation between fitness and plaque size.
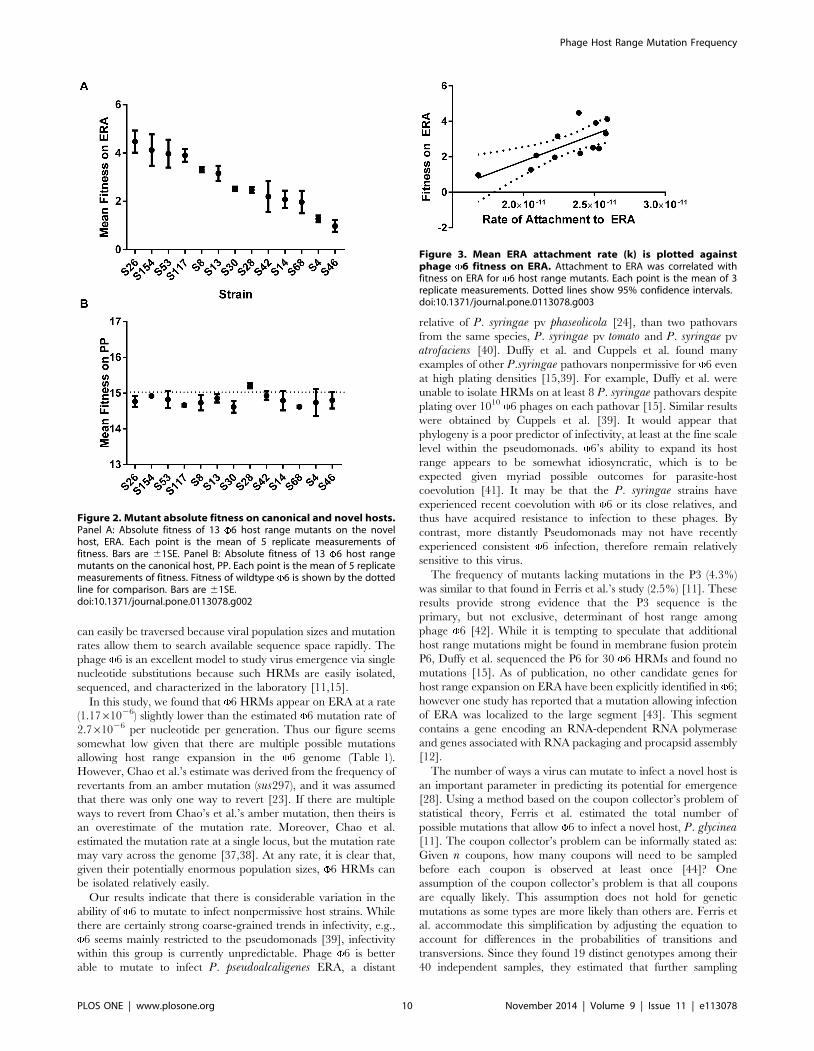
Mutant Fitness on Original and Novel HostsThe fitness consequences of host range expanding mutations
will play a large role in the ability of these mutants to persist in
host populations [28]. With this in mind, we estimated the
absolute fitness of 13 of our mutant genotypes on the canonical
host, PP, and the novel host, ERA (Table 4). A one-way ANOVA
of absolute fitness with strain as a factor revealed significant
differences among strain fitness on both ERA (Fig. 2A; F = 40.64,
DF = 12, P,0.0001) and PP (Fig. 2B; F = 3.515, DF = 12,
P = 0.0008), but mean fitness on ERA was not correlated with
mean fitness on PP nor was fitness on ERA correlated with the
number of mutations a mutant possessed. In fact, genotypes
containing multiple mutations tended to be less fit than those with
single mutations, although this trend was not significant. Matching
Figure 1. Spatial models of 6 P3 protein mutants. Panel A: Three host range mutation hotspots (accounting for 86% of all mutations) arehighlighted in this linear representation of the 648 amino acid sequence of the 6 P3 gene. The remaining 14% of mutations are not shown. Panel B:Space-filling representations of the 6 P3 protein are shown as predicted by I-TASSER. Colored regions correspond to the mutation hotspotsdepicted in Panel A. A putative hydrophobic anchoring domain (HAD) is shown in orange. In our model, the hydrophobic anchoring domainpenetrates 6’s outer lipid membrane to bind inner membrane protein P6. Panel C: Surface electrical charges of E8G mutant contrasted withancestor. Space-filling representations showing predicted surface electrical charges for the 6 E8G host range mutant and its ancestor wereestimated using I-TASSER. Positively- and negatively-charged regions are depicted in blue and red respectively. Arrows indicate the predictedlocation of the mutated 8th residue. The most prominent difference between the mutant and the ancestor is the greater surface positive charge atthe presumed host binding domain.doi:10.1371/journal.pone.0113078.g001
Phage Host Range Mutation Frequency
PLOS ONE | www.plosone.org 6 November 2014 | Volume 9 | Issue 11 | e113078
previous results, fitness on PP was, in all but one case, less than
that of the ancestor [11,15]. These results are indicative of
antagonistic pleiotropy, implying a tradeoff in fitness between
infection of PP and ERA. In addition, the coefficient of variation
(i.e. standard deviation/mean; CV) in mutant fitness was
considerably greater on ERA as opposed to PP (CV: 0.402 versus
0.015). This suggests that mutations expanding the host range
have a much wider range of fitness effects on the novel host.
Attachment RateBacteriophages initiate infections of host cells by binding to
receptors on the surface of the bacterial outer membrane. As such,
the host attachment rate is a critical factor in the ecological success
of a phage. We measured the rate of phage attachment to the
original and novel hosts for 13 mutant genotypes (Table 4). A one-
way ANOVA of the rate of attachment to ERA with mutant
genotype as a factor revealed significant differences among the
strains (F = 10.17, DF = 12, P,0.0001). In addition, we regressed
attachment rate against mutant fitness on ERA to determine if the
two were correlated. Since our HRMs most likely differ only by
mutations in the P3 host attachment protein, we expected that
improved attachment would lead to increased fitness. Indeed, for
13 mutant strains whose fitnesses and attachment rates were
estimated, fitnesses on ERA were correlated with ERA attachment
rates (Fig. 3; F = 11.91, DF = 1, P = 0.0062). However, the linear
regression model accounted for roughly half of the variance in
attachment rate (R2 = 0.54). These results are not surprising given
the difficulty of precisely estimating the 6 attachment rate.
Nevertheless, the results conform to our expectation of a positive
correlation between fitness and host binding ability. By contrast,
attachment rates of the various mutants to PP were not
significantly different, nor were they correlated with mutant
fitnesses on this host. These results might be expected given the
relatively narrow range of fitness differences on PP (Fig. 2;
Table 4).
The rates of attachment to PP were significantly greater than
attachment rates to ERA (One-way ANOVA: F = 216.7, DF = 1,
P,0.0001). This latter result matches expectations since mutant
fitness on PP is approximately an order of magnitude greater than
that on ERA [17]. Presumably, the switching of receptor types and
the lack of adaptation to an ERA receptor may account for the
significant differences in mutant fitness on the different host types.
However, attachment rates to PP and ERA were not correlated,
implying that mutations that increase binding to ERA do not
necessarily increase or decrease binding to PP.
Discussion
6 Host Range Mutation FrequencyUnderstanding the genetic basis of virus host range expansion is
critical to predicting the emergence of potentially dangerous
viruses. The genetic distance a virus must cross to gain the ability
to infect a novel host may be a dominant factor determining the
probability of emergence. Not all viruses readily infect novel hosts
[29]. For example, many mycobacteriophages isolated on Myco-bacterium smegmatis are unable to infect M. tuberculosis, even
when large numbers of phage are plated [30]. Presumably
infection of M. tuberculosis requires several simultaneous muta-
tions or even the recombination of whole genes or gene systems.
By contrast, many viruses are able to infect novel hosts via single
nucleotide substitutions [10,31–36]. This minimal genetic distance
Table 2. Host Range Substitution Hotspots in Q6 P3 Proteina.
Substitution This Study Duffy Ferris N Frequencyb Combined Frequencyb
G5S 0 0 2 2 1.3% 54.7%
E8K 23 4 1 28 18.7%
E8G 28 9 5 42 28%
E8D 4 0 0 4 2.7%
E8A 5 1 0 6 4%
Q130R 7 0 0 7 4.7% 16.7%
A133V 0 9 0 9 6.0%
D145G 0 0 3 3 2.0%
N146S 0 0 6 6 3.9%
D533A 0 0 1 1 0.7% 14.0%
D535N 0 0 1 1 0.7%
D554G 3 1 8 12 8.0%
D554A 1 0 1 2 1.3%
D554V 0 0 1 1 0.7%
D554N 0 0 2 2 1.3%
L555F 1 0 1 2 1.3%
Others 9 6 7 22 14.7% 14.7%
Total 81 30 39 150 100% 100%
Amino acid substitutions close together in the primary sequence are grouped together. We combine data from this study with two other studies of Q6 host rangeexpansion. N is total number of times a substitution was observed across all studies. Frequency is percentage of total substitutions a particular substitution wasobserved. Combined frequency is percentage of total substitutions constituted by substitutions in a particular region of the primary sequence. Others category includessubstitutions found outside substitution hotspots.aData compiled from this study, Duffy et al. 2006 and Ferris et al. 2007 [11,15].bSome frequencies rounded off to nearest tenth percent.doi:10.1371/journal.pone.0113078.t002
Phage Host Range Mutation Frequency
PLOS ONE | www.plosone.org 7 November 2014 | Volume 9 | Issue 11 | e113078
Ta
ble
3.
Am
ino
Aci
dSu
bst
itu
tio
ns
Ass
oci
ate
dw
ithQ
6H
ost
Ran
ge
Exp
ansi
on
on
ERA
.
Am
ino
Aci
dS
ub
stit
uti
on
TS
aD
ub
NA
ve
rag
eM
ass
Ele
ctro
che
mic
al
Pro
pe
rtie
sH
yd
rop
ho
bic
ity
Ind
ex
Wil
dty
pe
Mu
tan
tW
ild
typ
eM
uta
nt
Wil
dty
pe
Mu
tan
t
Glu
tam
icA
cid
toL
ysi
ne
(E8
K)
23
42
71
29
.11
28
.2A
cid
ic(2
)P
ola
rB
asic
(+)
Po
lar
23
.52
3.9
Glu
tam
icA
cid
toG
lyci
ne
(E8
G)
28
93
71
29
.15
7.1
Aci
dic
(2)
Po
lar
Ne
utr
alN
on
po
lar
23
.52
0.4
Glu
tam
icA
cid
toA
spa
rtic
Aci
d(E
8D
)4
04
12
9.1
11
5.1
Aci
dic
(2)
Po
lar
Aci
dic
(2)
Po
lar
23
.52
3.5
Glu
tam
icA
cid
toA
lan
ine
(E8
A)
51
61
29
.17
1.1
Aci
dic
(2)
Po
lar
Ne
utr
alN
on
po
lar
23
.51
.8
Asp
art
icA
cid
toA
lan
ine
(D3
5A
)0
22
11
5.1
71
.1A
cid
ic(2
)P
ola
rN
eu
tral
No
np
ola
r2
3.5
1.8
Ph
en
yla
lan
ine
toS
eri
ne
(F4
6S
)1
01
14
7.2
87
.1N
eu
tral
No
np
ola
rN
eu
tral
Po
lar
2.8
20
.8
Ph
en
yla
lan
ine
toL
eu
cin
e(F
46
L)
10
11
47
.21
13
.2N
eu
tral
No
np
ola
rN
eu
tral
No
np
ola
r2
.83
.8
Glu
tam
ine
toA
rgin
ine
(Q1
30
R)
70
71
28
.11
56
.2N
eu
tral
Po
lar
Bas
ic(+
)P
ola
r2
3.5
24
.5
Ala
nin
eto
Va
lin
e(A
13
3V
)0
99
71
.19
9.1
Ne
utr
alN
on
po
lar
Ne
utr
alN
on
po
lar
1.8
4.2
Se
rin
eto
Pro
lin
e(S
16
1P
)1
01
87
.19
7.1
Ne
utr
alP
ola
rN
eu
tral
No
np
ola
r2
0.8
21
.6
Se
rin
eto
Th
reo
nin
e(S
24
6T
)0
22
87
.11
01
.0N
eu
tral
Po
lar
Ne
utr
alP
ola
r2
0.8
20
.7
Se
rin
eto
Try
pto
ph
an
(S2
99
W)
10
18
7.1
18
6.2
Ne
utr
alP
ola
rN
eu
tral
Slig
htl
yP
ola
r2
0.8
20
.9
Ly
sin
eto
Th
reo
nin
e(K
31
1T
)0
11
12
8.2
10
1.0
Bas
ic(+
)P
ola
rN
eu
tral
Po
lar
23
.92
0.7
Gly
cin
eto
Se
rin
e(G
51
5S
)1
01
57
.18
7.1
Ne
utr
alN
on
po
lar
Ne
utr
alP
ola
r2
0.4
20
.8
Asp
art
icA
cid
toG
lyci
ne
(D5
54
G)
31
41
15
.15
7.1
Aci
dic
(2)
Po
lar
Ne
utr
alN
on
po
lar
23
.52
0.4
Asp
art
icA
cid
toA
lan
ine
(D5
54
A)
10
11
15
.17
1.1
Aci
dic
(2)
Po
lar
Ne
utr
alN
on
po
lar
23
.51
.8
Le
uci
ne
toP
he
ny
lala
nin
e(L
55
5F
)1
01
11
3.1
14
7.2
Ne
utr
alN
on
po
lar
Ne
utr
aln
on
po
lar
3.8
2.8
Am
ino
acid
sub
stit
uti
on
sfo
un
dto
allo
wQ
6in
fect
ion
of
Pse
ud
om
on
asp
seu
do
alca
lige
ne
sER
Afr
om
dat
ao
bta
ine
db
ytw
ose
par
ate
stu
die
s.N
isn
um
be
ro
fti
me
ssu
bst
itu
tio
nw
aso
bse
rve
dac
ross
the
two
stu
die
s.A
vera
ge
mas
sis
resi
du
ew
eig
ht
of
the
ori
gin
alan
dsu
bst
itu
ted
amin
oac
id[6
7].
Hyd
rop
ho
bic
ity
ind
ex
was
ob
tain
ed
fro
mK
yte
and
Do
olit
tle
[68
].N
eg
ativ
en
um
be
rsar
em
ore
hyd
rop
hili
c;p
osi
tive
nu
mb
ers
are
mo
reh
ydro
ph
ob
ic.
a=
Th
isst
ud
y;b
=D
uff
ye
tal
.2
00
6[1
5].
do
i:10
.13
71
/jo
urn
al.p
on
e.0
11
30
78
.t0
03
Phage Host Range Mutation Frequency
PLOS ONE | www.plosone.org 8 November 2014 | Volume 9 | Issue 11 | e113078
Ta
ble
4.
Ph
en
oty
pic
Ch
arac
teri
stic
so
fB
acte
rio
ph
ageQ
6M
uta
nts
.
Str
ain
Mu
tati
on
Fre
qu
en
cyo
fM
uta
nt
Fit
ne
ssE
RA
Fit
ne
ssP
PP
laq
ue
Siz
eE
RA
aA
tta
chm
en
tra
teto
ER
Ab
Att
ach
me
nt
rate
toP
P
S8
D5
54
G2
3.3
11
4.7
36
.89
2.5
861
02
11
4.7
961
02
11
S6
8E8
D4
1.9
71
4.6
15
.69
2.2
261
02
11
4.7
261
02
11
S5
3E8
A4
3.9
71
4.5
77
.84
.806
10
21
14
.686
10
21
1
S4
6Q
13
0R
/S2
99
W1
0.9
81
4.8
09
.26
1.6
861
02
11
5.0
561
02
11
S4
2S1
61
P/L
55
5F
12
.20
14
.93
9.1
72
.406
10
21
15
.316
10
21
1
S4
Q1
30
R1
1.2
71
4.7
46
.28
2.0
561
02
11
5.4
161
02
11
S3
0E8
K/Q
13
0R
12
.51
14
.62
3.5
42
.496
10
21
15
.716
10
21
1
S2
8E8
A/F
46
L1
2.4
71
5.2
15
.94
2.5
361
02
11
5.6
361
02
11
S2
6D
55
4A
14
.47
14
.77
7.8
52
.396
10
21
15
.636
10
21
1
S1
54
E8G
24
4.1
21
4.9
26
.29
2.5
961
02
11
5.3
361
02
11
S1
4E8
K/D
55
4G
12
.08
14
.79
6.5
62
.096
10
21
14
.506
10
21
1
S1
3E8
K/F
46
S1
3.1
61
4.8
51
0.2
52
.246
10
21
14
.606
10
21
1
S1
17
E8K
20
3.9
11
4.6
68
.93
2.5
161
02
11
4.3
961
02
11
Q6
WT
n/a
n/a
n/a
15
.07
n/a
n/a
4.9
161
02
11
a=
inm
m2;
b=
Att
ach
me
nt
rate
(k)
un
its
are
pe
rm
illili
ter
pe
rce
ll(o
rp
er
ph
age
)p
er
min
ute
.d
oi:1
0.1
37
1/j
ou
rnal
.po
ne
.01
13
07
8.t
00
4
Phage Host Range Mutation Frequency
PLOS ONE | www.plosone.org 9 November 2014 | Volume 9 | Issue 11 | e113078
can easily be traversed because viral population sizes and mutation
rates allow them to search available sequence space rapidly. The
phage 6 is an excellent model to study virus emergence via single
nucleotide substitutions because such HRMs are easily isolated,
sequenced, and characterized in the laboratory [11,15].
In this study, we found that 6 HRMs appear on ERA at a rate
(1.1761026) slightly lower than the estimated 6 mutation rate of
2.761026 per nucleotide per generation. Thus our figure seems
somewhat low given that there are multiple possible mutations
allowing host range expansion in the 6 genome (Table 1).
However, Chao et al.’s estimate was derived from the frequency of
revertants from an amber mutation (sus297), and it was assumed
that there was only one way to revert [23]. If there are multiple
ways to revert from Chao’s et al.’s amber mutation, then theirs is
an overestimate of the mutation rate. Moreover, Chao et al.
estimated the mutation rate at a single locus, but the mutation rate
may vary across the genome [37,38]. At any rate, it is clear that,
given their potentially enormous population sizes, 6 HRMs can
be isolated relatively easily.
Our results indicate that there is considerable variation in the
ability of 6 to mutate to infect nonpermissive host strains. While
there are certainly strong coarse-grained trends in infectivity, e.g.,
6 seems mainly restricted to the pseudomonads [39], infectivity
within this group is currently unpredictable. Phage 6 is better
able to mutate to infect P. pseudoalcaligenes ERA, a distant
relative of P. syringae pv phaseolicola [24], than two pathovars
from the same species, P. syringae pv tomato and P. syringae pv
atrofaciens [40]. Duffy et al. and Cuppels et al. found many
examples of other P.syringae pathovars nonpermissive for 6 even
at high plating densities [15,39]. For example, Duffy et al. were
unable to isolate HRMs on at least 8 P. syringae pathovars despite
plating over 1010 6 phages on each pathovar [15]. Similar results
were obtained by Cuppels et al. [39]. It would appear that
phylogeny is a poor predictor of infectivity, at least at the fine scale
level within the pseudomonads. 6’s ability to expand its host
range appears to be somewhat idiosyncratic, which is to be
expected given myriad possible outcomes for parasite-host
coevolution [41]. It may be that the P. syringae strains have
experienced recent coevolution with 6 or its close relatives, and
thus have acquired resistance to infection to these phages. By
contrast, more distantly Pseudomonads may not have recently
experienced consistent 6 infection, therefore remain relatively
sensitive to this virus.
The frequency of mutants lacking mutations in the P3 (4.3%)
was similar to that found in Ferris et al.’s study (2.5%) [11]. These
results provide strong evidence that the P3 sequence is the
primary, but not exclusive, determinant of host range among
phage 6 [42]. While it is tempting to speculate that additional
host range mutations might be found in membrane fusion protein
P6, Duffy et al. sequenced the P6 for 30 6 HRMs and found no
mutations [15]. As of publication, no other candidate genes for
host range expansion on ERA have been explicitly identified in 6;
however one study has reported that a mutation allowing infection
of ERA was localized to the large segment [43]. This segment
contains a gene encoding an RNA-dependent RNA polymerase
and genes associated with RNA packaging and procapsid assembly
[12].
The number of ways a virus can mutate to infect a novel host is
an important parameter in predicting its potential for emergence
[28]. Using a method based on the coupon collector’s problem of
statistical theory, Ferris et al. estimated the total number of
possible mutations that allow 6 to infect a novel host, P. glycinea[11]. The coupon collector’s problem can be informally stated as:
Given n coupons, how many coupons will need to be sampled
before each coupon is observed at least once [44]? One
assumption of the coupon collector’s problem is that all coupons
are equally likely. This assumption does not hold for genetic
mutations as some types are more likely than others are. Ferris et
al. accommodate this simplification by adjusting the equation to
account for differences in the probabilities of transitions and
transversions. Since they found 19 distinct genotypes among their
40 independent samples, they estimated that further sampling
Figure 2. Mutant absolute fitness on canonical and novel hosts.Panel A: Absolute fitness of 13 6 host range mutants on the novelhost, ERA. Each point is the mean of 5 replicate measurements offitness. Bars are 61SE. Panel B: Absolute fitness of 13 6 host rangemutants on the canonical host, PP. Each point is the mean of 5 replicatemeasurements of fitness. Fitness of wildtype 6 is shown by the dottedline for comparison. Bars are 61SE.doi:10.1371/journal.pone.0113078.g002
Figure 3. Mean ERA attachment rate (k) is plotted againstphage 6 fitness on ERA. Attachment to ERA was correlated withfitness on ERA for 6 host range mutants. Each point is the mean of 3replicate measurements. Dotted lines show 95% confidence intervals.doi:10.1371/journal.pone.0113078.g003
Phage Host Range Mutation Frequency
PLOS ONE | www.plosone.org 10 November 2014 | Volume 9 | Issue 11 | e113078
would uncover an additional 36 mutations [11]. If Ferris et al.’s
estimates are correct, it would mean that 1.3% of all possible
nonsynonymous substitutions in P3 confer the ability to infect
ERA (i.e., 55 of 4,380 potential nonsynonymous changes expand
host range).
Although their HRMs were isolated on a different host, P.glycinea, both their study and ours found similar frequencies of
transitions among all mutations (90% in Ferris et al., 84% in our
study). However, out of 69 HRMs, we found only 17 distinct
genotypes. Ferris et al. isolated almost the same number of distinct
genotypes in half as many samples [11], which may be a
consequence of the different hosts of isolation. Since Duffy et al.
observed 10 unique genotypes out of 30 isolates (33% unique) [15]
and we observed at least 17 unique genotypes out of 69 (26%
unique), the implication is that more unique genotypes would be
found with further sampling. However, a closer inspection of our
data suggests otherwise. 8 of 17 of our unique genotypes were only
unique because of second- or third-site mutations. If we consider
only those mutations that are sensu stricto necessary for infection
of ERA, we only find a combined 13/99 (13%) unique genotypes
among our and Duffy et al.’s study [15]. In fact, we only found 3
unique sensu stricto substitutions not found by Duffy et al. study
and they found 6 not identified in ours.
If 1.3% of all possible nonsynonymous substitutions allowed 6
to infect ERA, we would expect to see more unique genotypes
among our isolates. Our results also indicate that some mutations
occur far more frequently than expected by chance even if
differences in transitions and transversions are accounted for. One
possibility is that low fitness HRMs are eliminated by within
plaque selection and consequently are not represented in the
mutant collection sampled. We have no means to ascertain the
validity of this hypothesis at this point, but it could be an
interesting question to approach by deep sequencing of single
HRM plaques. However, at the same time, it seems likely that
additional factors that are not currently well understood, such as
RNA structure, codon bias and variation in the mutation rate
across the genome, influence the probability of mutation at any
particular locus. Nonetheless, Ferris et al.’s method is a valuable
step forward towards the estimation of an important parameter
relevant to virus emergence.
Mutation HotspotsWe found that mutations expanding the host range of phage 6
were more likely to appear in certain regions of the P3 gene than
others. Such mutation hotspots have been observed among virus
drug resistance [45–47], host range [48,49], hemagglutinin [50],
capsid [51], and core antigen genes [52] among others. Mutation
hotspots are evidence of strong positive selection for substitutions
that provide an adaptive advantage in a particular environment
[53,54]. Growth on a novel host should impose strong positive
selection for nonsynonymous substitutions at loci associated with
host range expansion. Thus, we can use the frequency of
mutations found in our survey to identify regions of the P3
protein that are important in attachment to a host receptor. 85.4%
of all mutations identified by our study and by Duffy et al. [15]
were found in just three regions (near 8th, 133rd and 554th residues)
of the P3 gene (Fig. 1A; Table 2). We venture that these hotspots
on the P3 protein are important in host range determination
among 6 phages.
Structural SpeculationsWe used the structural modeling software I-TASSER [21,22] to
predict the structure of the P3 protein from its amino acid
sequence. The resulting structure showed homology to bacterial
alcohol dehydrogenase quinoproteins [55–57]. Interestingly, in the
best-fit model, our putative mutation hotspots were located close
together on one face of the ,60 A diameter P3 protein (Fig. 1B).
Residues 8 and 130 were located at the surface 18 A from each
other, and residue 554 was located subsurface about 15 A from
residue 8 and 23 A from residue 130. Other less frequently
observed mutations also occur near this region (Fig. 1B). We
propose that this region of the P3 protein is a host-binding domain
and directly interacts with host receptors. This supposition is
supported by the fact that the host binding domain is diametrically
opposite the hydrophobic anchoring domain (residues 271–291)
predicted by DAS (Fig. 1B). The most parsimonious explanation is
that this domain serves to anchor the P3 to the integral membrane
protein P6 [27], which leaves the putative host binding domain
exposed to the environment.
Mutations allowing infection of ERA may not significantly alter
the tertiary structure of the P3 protein. I-TASSER structural
modeling did not show any major structural rearrangements in
predicted structures for mutant strains. Rather mutations may
alter the host-binding domain’s electrical charge from negative to
positive or neutral (Fig. 1C). This difference in electrical charge
may allow mutant 6 to bind the ERA host receptor. The
presumptive ERA receptor is its pilus, but this has not been
definitively determined. If the ERA receptor were indeed the pilus,
it would be interesting to know if its electrical properties are
appreciably different from those of the pilus of PP. Moreover, it is
plausible that neutral or positive electric charges and smaller mass
amino acids confer more flexibility to the binding region, allowing
a greater variety of structures to be bound [58]. It would be
interesting to determine if host range expanding mutations more
frequently result in the substitution of small for large amino acids
or alter the charge of the binding site.
Fitness on Native and Novel HostsFitness on native and novel hosts was assessed using standard
flask productivity assays. Phage 6 HRMs showed a broad range
of fitness values on ERA, some of which were significantly different
from the others (Fig. 2A). Mutant fitnesses on the native host, PP,
were much greater than those on ERA (Fig. 2B). Since 6 is
presumably well adapted to native but not novel hosts, these results
meet our expectations. Supporting these results, we found that the
coefficient of variation (CV) of mutant fitnesses on PP was much
lower than CV of mutant fitnesses on ERA. These results conform
to theoretical expectations that there should be less variation in
fitness values close to a fitness peak on an adaptive landscape [59].
Directional selection should erode the variation in fitness as a
population increases in fitness in a particular environment. Thus, a
virus that is adapted to a particular host should have lower
variation in fitness on that host as opposed to a host to which it is
not well adapted.
We found that, in concert with previous studies [11,15],
mutations expanding the 6 host range usually reduced fitness
on the original host, PP. On average, HRM fitness on PP was
reduced about 2.5% compared to the wildtype. Negative genetic
associations between host types is an example of antagonistic
pleiotropy [60,61]. The adage that ‘‘a jack of all trades is a master
of none’’ is well supported, at least among 6 host infections.
However, the ultimate cause of host specialism or generalism
remains opaque. Intuitively one would imagine that a broader host
range would produce greater returns than a narrow one as long as
the reduction in productivity on a single host was offset by an
increase in overall productivity [62]. With regard to the present
system, it seems unlikely that the relatively minor cost in fitness on
the original host imposed by host range expansion should
Phage Host Range Mutation Frequency
PLOS ONE | www.plosone.org 11 November 2014 | Volume 9 | Issue 11 | e113078
outweigh the benefits of an expanded host range. Moreover, we
isolated one mutant (S28) whose fitness on the canonical host
actually increased following the acquisition of a mutation
permitting infection of ERA. Why then are broad host range
phages relatively rare? The rarity of generalism may be a result of
the interaction of widespread habitat patchiness, reduced dispersal
and the ubiquity of local adaptation [63]. If these general trends
hold, competition within a patch should favor the evolution of
specialism. This hypothesis should be amenable to testing via
experimental evolution studies.
As a rule, we might expect that novel hosts will present a greater
challenge to virus reproduction than native hosts, a conclusion that
is supported by many examples in the literature [64–66]. Novel
hosts may represent ecological sinks, defined as habitats where the
basic reproductive rate is ,1. Our fitness results support this
conjecture, and suggest that 6 probably experiences a broader
range of sink conditions on ERA than it does on PP.
Consequently, 6 population extinction is more likely in a habitat
populated by ERA than one populated by PP [17]. Given the
many HRM genotypes over a broad range of fitness values, 6
should be a valuable system to test hypotheses regarding virus
emergence [28].
Attachment to Native and Novel HostsWith the exception of the three non-P3 mutants, the mutant
strains are most likely isogenic outside the host attachment protein
region. The differences in fitness are expected to result mainly
from differences in binding efficiency to the host receptor. Our
results indicate that different suites of mutations had highly
divergent attachment rates and fitnesses on the novel host (Fig. 2
and 3). Nonetheless, a regression of phage fitness on ERA against
attachment rate to ERA revealed a significant positive correlation.
Ferris et al. reported a similar result for 6 infecting P. glycinea[11]. These results make intuitive sense as mutants that are better
able to bind to the host are expected to reproduce at a higher rate.
Moreover, attachment to ERA was significantly lower than to PP,
which is also reflected in the large differences in fitness.
Implications for Disease EmergenceThis study and other recent studies of 6 host range expansion
suggest several generalizations. First, phylogeny may only allow
relatively coarse-grained predictions of virus host range. Phage
6’s ability to mutate to infect close relatives was frequently worse
than its ability to infect distant relatives. Second, nonsynonymous
substitutions allowing host range expansion may occur at hotspots
in the host attachment protein. This prediction makes intuitive
sense as host attachment relies on binding affinity between host
and virus proteins. In addition, many host range-expanding
mutations may not result in large structural rearrangements in host
attachment proteins. Rather, amino acid substitutions may result
in more subtle changes in protein surface charges, allowing
binding to different host proteins. Furthermore, the number of
nonsynonymous substitutions allowing host range expansion is
probably relatively small considering the number of possible
substitutions. Nonetheless, the relatively high virus mutation rate
allows viruses to rapidly acquire host range expanding mutations
despite their relative rarity. Finally, initial fitness on a novel host is
usually much less than that on the original host, and antagonistic
pleiotropy among host range mutations is common. This
generalization conforms to our expectations since evolutionary
tradeoffs in different habitats are anticipated to be ubiquitous.
Acknowledgments
We thank Paul Turner for providing phage and bacterial strains and Tim
Short for technical advice. Constructive criticism from Paul Gottlieb and
three anonymous reviewers was much appreciated. This work was
completed in part using equipment in the Core Facility for Imaging,
Cellular and Molecular Biology at Queens College.
Author Contributions
Conceived and designed the experiments: BEF JJD. Performed the
experiments: BEF BS J. Carpino ESC J. Ching YC KJ JDK GGL RM
SS ST JJD. Analyzed the data: BEF BS J. Ching KJ GGL RM JJD. Wrote
the paper: BEF BS J. Carpino GL JJD.
References
1. Christensen KLY, Holman RC, Steiner CA, Sejvar JJ, Stoll BJ, et al. (2009)
Infectious disease hospitalizations in the United States. Clinical Infectious
Diseases 49: 1025–1035.
2. Armstrong GL, Conn LA, Pinner RW (1999) Trends in infectious disease
mortality in the United States during the 20th century. JAMA-Journal of theAmerican Medical Association 281: 61–66.
3. Woolhouse M, Gaunt E (2007) Ecological origins of novel human pathogens.Critical Reviews in Microbiology 33: 231–242.
4. Cleaveland S, Laurenson MK, Taylor LH (2001) Diseases of humans and theirdomestic mammals: pathogen characteristics, host range and the risk of
emergence. Philosophical Transactions of the Royal Society of London Series B-Biological Sciences 356: 991–999.
5. Woolhouse MEJ, Haydon DT, Antia R (2005) Emerging pathogens: theepidemiology and evolution of species jumps. Trends in Ecology and Evolution
20: 238–244.
6. Antia R, Regoes RR, Koella JC, Bergstrom CT (2003) The role of evolution in
the emergence of infectious diseases. Nature 426: 658–661.
7. Gandon S, Hochberg ME, Holt RD, Day T (2012) What limits the evolutionary
emergence of pathogens? Philosophical Transactions of the Royal Society ofLondon Series B-Biological Sciences 368.
8. Alexander HK, Day T (2010) Risk factors for the evolutionary emergence ofpathogens. Journal of the Royal Society Interface 7: 1455–1474.
9. Holmes EC, Drummond AJ (2007) The evolutionary genetics of viralemergence. Wildlife and Emerging Zoonotic Diseases: the Biology, Circum-
stances and Consequences of Cross-Species Transmission 315: 51–66.
10. Baranowski E, Ruiz-Jarabo CM, Pariente N, Verdaguer N, Domingo E (2003)
Evolution of cell recognition by viruses: A source of biological novelty with
medical implications. Advances in Virus Research, Vol 62 62: 19–111.
11. Ferris MT, Joyce P, Burch CL (2007) High frequency of mutations that expand
the host range of an RNA virus. Genetics 176: 1013–1022.
12. Mindich L, Nemhauser I, Gottlieb P, Romantschuk M, Carton J, et al. (1988)
Nucleotide sequence of the large double stranded RNA segment of
bacteriophage 6 - genes specifying the viral replicase and transcriptase.
Journal of Virology 62: 1180–1185.
13. Mindich L, Nemhauser I, Gottlieb P, Romantschuk M, Carton J, et al. (1988)
Nucleotide sequence of the large dsRNA segment of bacteriophage 6 - genes
specifying the viral replicase and transcriptase. Journal of Virology 62: 1180–
1185.
14. McGraw T, Mindich L, Frangione B (1986) Nucleotide sequence of the small
double stranded RNA segment of bacteriophage 6 - novel mechanism of
natural translational control. Journal of Virology 58: 142–151.
15. Duffy S, Turner PE, Burch CL (2006) Pleiotropic costs of niche expansion in the
RNA bacteriophage 6. Genetics 172: 751–757.
16. Vidaver AK, Koski RK, Vanetten JL (1973) Bacteriophage 6 - lipid containing
virus of Pseudomonas phaseolicola. Journal of Virology 11: 799–805.
17. Dennehy JJ, Friedenberg NA, Holt RD, Turner PE (2006) Viral ecology and the
maintenance of novel host use. The American Naturalist 167: 429–439.
18. Luria SE, Delbruck M (1943) Mutations of bacteria from virus sensitivity to virus
resistance. Genetics 28: 491–511.
19. Kearse M, Moir R, Wilson A, Stones-Havas S, Cheung M, et al. (2012)
Geneious Basic: an integrated and extendable desktop software platform for the
organization and analysis of sequence data. Bioinformatics 28: 1647–1649.
20. Tamura K, Peterson D, Peterson N, Stecher G, Nei M, et al. (2011) MEGA5:
molecular evolutionary genetics analysis using maximum likelihood, evolution-
ary distance, and maximum parsimony methods. Molecular Biology and
Evolution 28: 2731–2739.
21. Zhang Y (2008) I-TASSER server for protein 3D structure prediction. BMC
Bioinformatics 9: 40.
22. Roy A, Kucukural A, Zhang Y (2010) I-TASSER: a unified platform for
automated protein structure and function prediction. Nat Protoc 5: 725–738.
23. Chao L, Rang CU, Wong LE (2002) Distribution of spontaneous mutants and
inferences about the replication mode of the RNA bacteriophage 6. Journal of
Virology 76: 3276–3281.
Phage Host Range Mutation Frequency
PLOS ONE | www.plosone.org 12 November 2014 | Volume 9 | Issue 11 | e113078
24. Mulet M, Lalucat J, Garcia-Valdes E (2010) DNA sequence-based analysis of the
Pseudomonas species. Environmental Microbiology 12: 1513–1530.
25. Cserzo M, Wallin E, Simon I, von Heijne G, Elofsson A (1997) Prediction of
transmembrane alpha-helices in prokaryotic membrane proteins: the densealignment surface method. Protein Engineering 10: 673–676.
26. Stitt BL, Mindich L (1983) Morphogenesis of bacteriophage 6 - a presumptiveviral membrane precursor. Virology 127: 446–458.
27. Kenney JM, Hantula J, Fuller SD, Mindich L, Ojala PM, et al. (1992)
Bacteriophage 6 envelope elucidated by chemical cross-linking, immunodetec-
tion, and cryoelectron microscopy. Virology 190: 635–644.
28. Dennehy J (2009) Bacteriophages as model organisms for virus emergenceresearch. Trends in Microbiology 17: 450–457.
29. Ayora-Talavera G, Shelton H, Scull MA, Ren JY, Jones IM, et al. (2009)Mutations in H5N1 Influenza virus hemagglutinin that confer binding to human
tracheal airway epithelium. PLoS One 4.
30. Sampson T, Broussard GW, Marinelli LJ, Jacobs-Sera D, Ray M, et al. (2009)
Mycobacteriophages BPs, Angel and Halo: comparative genomics reveals anovel class of ultra-small mobile genetic elements. Microbiology-Sgm 155: 2962–
2977.
31. Cox J, Putonti C (2010) Mechanisms responsible for a X174 mutant’s ability to
infect Escherichia coli by phosphorylation. Journal of Virology 84: 4860–4863.
32. Baranowski E, Ruiz-Jarabo CM, Domingo E (2001) Evolution of cell recognition
by viruses. Science 292: 1102–1105.
33. Li ZJ, Chen HL, Jiao PR, Deng GH, Tian GB, et al. (2005) Molecular basis ofreplication of duck H5N1 influenza viruses in a mammalian mouse model.
Journal of Virology 79: 12058–12064.
34. Subbarao EK, London W, Murphy BR (1993) A single amino acid in the PB2
gene of influenza A virus is a determinant of host range. Journal of Virology 67:
1761–1764.
35. Jonah G, Rainey A, Natonson A, Maxfield LF, Coffin JM (2003) Mechanisms ofavian retroviral host range extension. Journal of Virology 77: 6709–6719.
36. Yamada S, Suzuki Y, Suzuki T, Le MQ, Nidom CA, et al. (2006)Haemagglutinin mutations responsible for the binding of H5N1 influenza A
viruses to human-type receptors. Nature 444: 378–382.
37. Baer CF, Miyamoto MM, Denver DR (2007) Mutation rate variation in
multicellular eukaryotes: causes and consequences. Nature Reviews Genetics 8:619–631.
38. Ellegren H, Smith NGC, Webster MT (2003) Mutation rate variation in themammalian genome. Current Opinion in Genetics & Development 13: 562–
568.
39. Cuppels DA, Vanetten JL, Lambrecht P, Vidaver AK (1981) Survey of
phytopathogenic pseudomonads for a restriction and modification system activeon the double-stranded ribonucleic acid phage 6. Current Microbiology 5:
247–249.
40. Bono LM, Gensel CL, Pfennig DW, Burch CL (2013) Competition and the
origins of novelty: experimental evolution of niche-width expansion in a virus.Biology Letters 9.
41. Dennehy JJ (2012) What can phages tell us about host-pathogen coevolution?
International Journal of Evolutionary Biology 2012: 396165.
42. Gottlieb P, Metzger S, Romantschuk M, Carton J, Strassman J, et al. (1988)
Nucleotide sequence of the middle dsRNA segment of bacteriophage 6 -
placement of the genes of membrane associated proteins. Virology 163: 183–190.
43. Mindich L, Mackenzie G, Strassman J, McGraw T, Metzger S, et al. (1985)
cDNA cloning of portions of the bacteriophage 6 genome Journal of
Bacteriology 162: 992–999.
44. Dawkins B (1991) Siobhan’s problem: the coupon collector revisited. TheAmerican Statistician 45: 76–82.
45. Yamada S, Matsumoto Y, Takashima Y, Otsuka H (2005) Mutation hot spots inthe canine herpesvirus thymidine kinase gene. Virus Genes 31: 107–111.
46. Sasadeusz JJ, Tufaro F, Safrin S, Schubert K, Hubinette MM, et al. (1997)
Homopolymer mutational hot spots mediate herpes simplex virus resistance toacyclovir. Journal of Virology 71: 3872–3878.
47. Ng TI, Shi Y, Huffaker HJ, Kati W, Liu Y, et al. (2001) Selection and
characterization of varicella-zoster virus variants resistant to (R)-9-[4-Hydroxy-2-(hydroxymethy)butyl] guanine. Antimicrobial Agents and Chemotherapy 45:
1629–1636.48. Wu K, Peng G, Wilken M, Geraghty RJ, Li F (2012) Mechanisms of host
receptor adaptation by severe acute respiratory syndrome coronavirus. Journal
of Biological Chemistry 287: 8904–8911.49. Hall AR, Scanlan PD, Buckling A (2011) Bacteria-phage coevolution and the
emergence of generalist pathogens. The American Naturalist 177: 44–53.50. Hoeper D, Kalthoff D, Hoffmann B, Beer M (2012) Highly pathogenic avian
influenza virus subtype H5N1 escaping neutralization: more than HA variation.Journal of Virology 86: 1394–1404.
51. Tapparel C, Cordey S, Junier T, Farinelli L, Van Belle S, et al. (2011)
Rhinovirus genome variation during chronic upper and lower respiratory tractinfections. PLoS One 6.
52. Yuang TTT, Shih C (2000) A frequent, naturally occurring mutation (P130T) ofhuman hepatitis B virus core antigen is compensatory for immature secretion
phenotype of another frequent variant (I97L). Journal of Virology 74: 4929–
4932.53. Chattopadhyay S, Weissman SJ, Minin VN, Russo TA, Dykhuizen DE, et al.
(2009) High frequency of hotspot mutations in core genes of Escherichia coli dueto short-term positive selection. Proceedings of the National Academy of
Sciences of the United States of America 106: 12412–12417.54. Hughes AL, Nei M (1988) Pattern of nucleotide substitution at major
histocompatibility complex class I loci reveals overdominant selection. Nature
335: 167–170.55. Keitel T, Diehl A, Knaute T, Stezowski JJ, Hohne W, et al. (2000) X-ray
structure of the quinoprotein ethanol dehydrogenase from Pseudomonasaeruginosa: basis of substrate specificity. J Mol Biol 297: 961–974.
56. Ghosh M, Anthony C, Harlos K, Goodwin MG, Blake C (1995) The refined
structure of the quinoprotein methanol dehydrogenase from Methylobacteriumextorquens at 1.94 A. Structure 3: 177–187.
57. Oubrie A, Rozeboom HJ, Kalk KH, Huizinga EG, Dijkstra BW (2002) Crystalstructure of quinohemoprotein alcohol dehydrogenase from Comamonastestosteroni: structural basis for substrate oxidation and electron transfer. J BiolChem 277: 3727–3732.
58. Petsko GA, Ringe D (2004) Protein Structure and Function. Sunderland, MA:
New Science Press.59. Fisher RA (1930) The Genetical Theory of Natural Selection. Oxford, UK:
Clarendon Press.60. Rose MR (1982) Antagonistic pleiotropy, dominance and genetic variation.
Heredity 48: 63–78.
61. Cooper VS, Lenski RE (2000) The population genetics of ecologicalspecialization in evolving Escherichia coli populations. Nature 407: 736–739.
62. Kassen R (2002) The experimental evolution of specialists, generalists, and themaintenance of diversity. Journal of Evolutionary Biology 15: 173–190.
63. Dennehy JJ (2014) What ecologists can tell virologists. Annu Rev Microbiol.64. Sokurenko EV, Gomulkiewicz R, Dykhuizen DE (2006) Opinion - Source-sink
dynamics of virulence evolution. Nature Reviews Microbiology 4: 548–555.
65. Chattopadhyay S, Feldgarden M, Weissman SJ, Dykhuizen DE, van Belle G,et al. (2007) Haplotype diversity in ‘‘source-sink’’ dynamics of Escherichia coliurovirulence. Journal of Molecular Evolution 64: 204–214.
66. Williams PD (2010) Darwinian interventions: taming pathogens through
evolutionary ecology. Trends in Parasitology 26: 83–92.
67. Lide DR (1991) Handbook of Chemistry and Physics. Boca Raton, FL: CRCPress.
68. Kyte J, Doolittle RF (1982) A simple method for displaying the hydropathiccharacter of a protein. Journal of Molecular Biology 157: 105–132.
Phage Host Range Mutation Frequency
PLOS ONE | www.plosone.org 13 November 2014 | Volume 9 | Issue 11 | e113078
Related Documents


![BACTERIOPHAGE-RESISTANT AND BACTERIOPHAGE-SENSITIVE ...halsmith/phagemutantsubmitted_2.pdf · BACTERIOPHAGE-RESISTANT AND BACTERIOPHAGE-SENSITIVE BACTERIA IN A CHEMOSTAT ... [22],](https://static.cupdf.com/doc/110x72/5b3839687f8b9a5a518d2ce1/bacteriophage-resistant-and-bacteriophage-sensitive-halsmithphagemutantsubmitted2pdf.jpg)