NCDENR, Division of Water Quality Ambient Monitoring System Report French Broad River Basin – January 2009 AMS-1 French Broad River Basin Ambient Monitoring System Report January 1, 2003 through December 31, 2007

Welcome message from author
This document is posted to help you gain knowledge. Please leave a comment to let me know what you think about it! Share it to your friends and learn new things together.
Transcript

NCDENR, Division of Water Quality Ambient Monitoring System Report
French Broad River Basin – January 2009 AMS-1
French Broad River Basin Ambient Monitoring System Report
January 1, 2003 through December 31, 2007
NCDENR, Division of Water Quality Ambient Monitoring System Report
French Broad River Basin – January 2009 AMS-2
TABLE OF CONTENTS
EXECUTIVE SUMMARY .................................................................................................................................................... 4
INTRODUCTION ................................................................................................................................................................ 7
PARAMETERS ................................................................................................................................................................. 11 Dissolved Oxygen ......................................................................................................................................................... 11 pH.................................................................................................................................................................................. 11 Specific Conductance.................................................................................................................................................... 11 Turbidity......................................................................................................................................................................... 11 Nutrients ........................................................................................................................................................................ 11 Fecal Coliform Bacteria ................................................................................................................................................. 12
WATER QUALITY MONITORING RESULTS SUMMARY............................................................................................... 13
ASSESSMENT AND INTERPRETATION METHODS ..................................................................................................... 15 Assessment Considerations.......................................................................................................................................... 15 Providing Confidence in the Exceedance of Water Quality Standards......................................................................... 15 Methods Used to Summarize Results........................................................................................................................... 17 Box and Whisker Plots .................................................................................................................................................. 17 Scatter Plots – Change Over Time ............................................................................................................................... 18 Maps.............................................................................................................................................................................. 19
WATER QUALITY ANALYSIS.......................................................................................................................................... 20 Basinwide Correlations.................................................................................................................................................. 20 Stream Flow and Drought ............................................................................................................................................. 21 Seasonal Variation ........................................................................................................................................................ 22 Comparing Hydrologic Regions .................................................................................................................................... 23 Significant Issues .......................................................................................................................................................... 24 Basinwide Assessment ................................................................................................................................................. 26
Evaluation Levels In order to assist the reader in developing a rapid understanding of the summary statistics provided throughout this data review, concentrations of water quality variables may be compared to an Evaluation Level (EL). Evaluation levels may be a water quality standard, an action level, an ecological threshold, or simply an arbitrary threshold that facilitates a rapid data review. Evaluation levels are further examined for frequency to determine if they have been exceeded in more than 10 percent of the observed samples. This summary approach facilitates a rapid and straightforward presentation of the data but may not be appropriate for making specific use support decisions necessary for identification of impaired waters under the Clean Water Act's requirements for 303(d) listings. The reader is advised to review the states 303(d) listing methodology for this purpose. (see http://h2o.enr.state.nc.us/tmdl/General_303d.htm).

NCDENR, Division of Water Quality Ambient Monitoring System Report
French Broad River Basin – January 2009 AMS-3
TABLES
Table 1. Areas of Concern in the French Broad River Basin.............................................................................................. 5 Table 2. Parametric coverage for the Ambient Monitoring System. ................................................................................... 8 Table 3. Selected water quality standards.......................................................................................................................... 8 Table 4. Monitoring stations in the French Broad River Basin, 2003 - 2007. ................................................................... 10 Table 5. Frequency of Evaluation Level Exceedances..................................................................................................... 13 Table 6. Summary of Water Quality Parameter Averages (Arithmetic Means) ................................................................ 14 Table 7. Exceedance Confidence..................................................................................................................................... 16 Table 8. Fecal Coliform Standard Assessments 2003-2007 ............................................................................................ 24
FIGURES
Figure 1. A Summary of Station Exceedances................................................................................................................... 6 Figure 2. DWQ’s Ambient Monitoring System in the French Broad River Basin................................................................ 9 Figure 3. An Example Box Plot for a Station .................................................................................................................... 17 Figure 4. A Box Plot for Comparing HUCs ....................................................................................................................... 18 Figure 5. Scatter Plot Example, Dissolved Oxygen over Time......................................................................................... 18 Figure 6 Example Map...................................................................................................................................................... 19 Figure 7. Fecal Coliform & Total Organic Nitrogen vs. Turbidity ...................................................................................... 20 Figure 8. Dissolved Oxygen vs. Water Temperature & Turbidity vs. Water Flow ............................................................ 20 Figure 9. Average Monthly Flow at Three Locations in the French Broad River Basin.................................................... 21 Figure 10. Seasonal Variation in Water Temperature ...................................................................................................... 22 Figure 11. Seasonal Variation in Dissolved Oxygen ........................................................................................................ 22 Figure 12. Fecal Coliform and Turbidity By HUC.............................................................................................................. 23 Figure 13. Total Inorganic Nitrogen and Total Phosphorus by HUC ................................................................................ 23 Figure 14. pH in the French Broad River Basin................................................................................................................ 26 Figure 15. Turbidity in the French Broad River Basin....................................................................................................... 27 Figure 16. Fecal Coliform in the French Broad River Basin ............................................................................................. 28 Figure 17. Box Plots of Temperature in the French Broad River Basin ........................................................................... 55 Figure 18. Box Plots of Dissolved Oxygen in the French Broad River Basin ................................................................... 56 Figure 19. Box Plots of pH in the French Broad River Basin............................................................................................ 57 Figure 20. Box Plots of Specific Conductance in the French Broad River Basin ............................................................. 58 Figure 21. Box Plots of Turbidity in the French Broad River Basin .................................................................................. 59 Figure 22. Box Plots of Ammonia as Nitrogen in the French Broad River Basin ............................................................. 60 Figure 23. Box Plots of Total Kjeldahl Nitrogen in the French Broad River Basin............................................................ 61 Figure 24. Box Plots of Total Nitrate & Nitrite as Nitrogen in the French Broad River Basin ........................................... 62 Figure 25. Box Plots of Total Phosphorus in the French Broad River Basin.................................................................... 63 Figure 26. Box Plots of Fecal Coliform in the French Broad River Basin......................................................................... 64
APPENDIXES
Appendix A. AMS Station Summary Sheets.................................................................................................................... 29 Appendix B. Station Box & Whisker Plots........................................................................................................................ 54 Appendix C. References .................................................................................................................................................. 65
NCDENR, Division of Water Quality Ambient Monitoring System Report
French Broad River Basin – January 2009 AMS-4
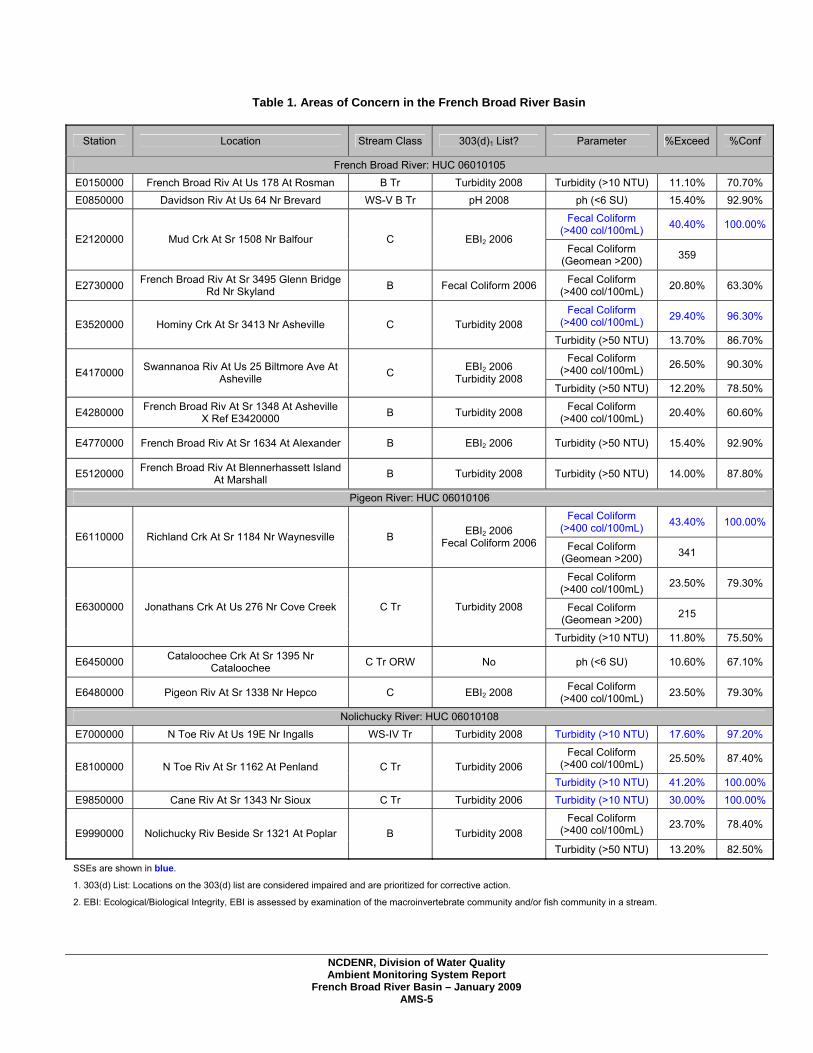
EXECUTIVE SUMMARY A general understanding of human activities and natural forces that affect pollution loads and their potential impacts on water quality can be obtained through routine sampling from fixed water quality monitoring stations. During this assessment period (January 1, 2003 through December 31, 2007) chemical and physical measurements were obtained by DWQ from 24 stations located throughout the French Broad River Basin. In order to evaluate acceptable water quality criteria at least 10 observations are desired. If at least 10 results were collected for a given site for a given parameter, the results are then compared to water quality evaluation levels. The water quality evaluation level may be an ecological evaluation level, a narrative or a numeric standard. If less than 10 results were collected, then no comparison to evaluation levels was made. When more than 10 percent of the results exceeded the evaluation level (10% criteria), a binomial statistical test was employed to determine how much statistical confidence there is that the results statistically exceed the 10% criteria. If at least 95% confidence was found that a 10% exceedance occurred, then that is termed a statistically significant exceedance (SSE). This method was applied for all parameters with an evaluation level, except for fecal coliform bacteria, which uses a 20% criteria in most waters as well as a geometric mean criteria. See page 12 for an explanation of fecal coliform methods. The results of the data analysis are displayed in tables, box plots, scatter plots, and maps. For complete summaries on each station, reference the AMS Station Summary Sheets located in Appendix A. This review of water quality exceedances was performed using data that were collected between January 1, 2003 and December 31, 2007. A total of six sites were found with SSEs. None of these sites were found to have more than one SSE however. SSEs were found for fecal coliform screening at three sites and turbidity at three sites. Eleven sites with 10% exceedances did not rise to the level of SSEs, and six sites did not have any 10% exceedances. Table 1 summarizes areas of potential concern in the French Broad River Basin using these criteria. While reading the table please note the following: The majority of the parameters listed are compared directly to their standards. There is one exception, however. The fecal coliform standard requires that five samples be taken in the span of 30 days, which was not done for the ambient data. Therefore the review of fecal coliform ambient data should be taken as a screening only. A summary of the evaluation level data is included as Figure 1. With three sites having SSEs for fecal coliform screening and seven more having 20% exceedances, fecal coliform appears to be the most widespread issue in the basin. Fecal coliform screening data is assessed annually. When the annual screening indicates that the standard may have been violated, additional sampling will be done to assess the standard. To assess the standard five samples must be collected a span of 30 days or less. This is called “5 in 30” sampling. Class B waters identified as potential concerns during the annual screening are prioritized for 5 in 30 sampling. 5 in 30 sampling is completed for other waters as resources permit. The French Broad River Basin includes many Class B recreational waters. Nine of these have been assessed with 5 in 30 sampling for compliance with the fecal coliform standard during the current assessment period. The site is considered impaired if greater then 20% of the samples are above 400 colonies per 100 mL, or the geometric mean of the samples is greater than 200 colonies per 100 mL. Four sites, the French Broad River at Skyland, the French Broad River at Marshall, Richland Creek near Waynesville, and the Swannanoa River at Black Mountain Recreational Park, were found to be in violation of the standard. The remaining five were not. Note that the Swannanoa River site is not an ambient site. Other parameters of note in the basin include turbidity and pH. Ten stations in the basin exceeded the standard for Turbidity more then 10% of the time. In particular, four of the five stations in the Nolichucky HUC exceed the standard for turbidity. Half of the ten impaired sites are trout waters, which have stricter limits on turbidity. pH exceeded the standard at two sites more then 10% of the time.
NCDENR, Division of Water Quality Ambient Monitoring System Report
French Broad River Basin – January 2009 AMS-5
Table 1. Areas of Concern in the French Broad River Basin
Station Location Stream Class 303(d)1 List? Parameter %Exceed %Conf
French Broad River: HUC 06010105 E0150000 French Broad Riv At Us 178 At Rosman B Tr Turbidity 2008 Turbidity (>10 NTU) 11.10% 70.70% E0850000 Davidson Riv At Us 64 Nr Brevard WS-V B Tr pH 2008 ph (<6 SU) 15.40% 92.90%
Fecal Coliform (>400 col/100mL) 40.40% 100.00%
E2120000 Mud Crk At Sr 1508 Nr Balfour C EBI2 2006 Fecal Coliform
(Geomean >200) 359
E2730000 French Broad Riv At Sr 3495 Glenn Bridge Rd Nr Skyland B Fecal Coliform 2006 Fecal Coliform
(>400 col/100mL) 20.80% 63.30%
Fecal Coliform (>400 col/100mL) 29.40% 96.30%
E3520000 Hominy Crk At Sr 3413 Nr Asheville C Turbidity 2008 Turbidity (>50 NTU) 13.70% 86.70%
Fecal Coliform (>400 col/100mL) 26.50% 90.30%
E4170000 Swannanoa Riv At Us 25 Biltmore Ave At Asheville C EBI2 2006
Turbidity 2008 Turbidity (>50 NTU) 12.20% 78.50%
E4280000 French Broad Riv At Sr 1348 At Asheville X Ref E3420000 B Turbidity 2008 Fecal Coliform
(>400 col/100mL) 20.40% 60.60%
E4770000 French Broad Riv At Sr 1634 At Alexander B EBI2 2006 Turbidity (>50 NTU) 15.40% 92.90%
E5120000 French Broad Riv At Blennerhassett Island At Marshall B Turbidity 2008 Turbidity (>50 NTU) 14.00% 87.80%
Pigeon River: HUC 06010106
Fecal Coliform (>400 col/100mL) 43.40% 100.00%
E6110000 Richland Crk At Sr 1184 Nr Waynesville B EBI2 2006 Fecal Coliform 2006 Fecal Coliform
(Geomean >200) 341
Fecal Coliform (>400 col/100mL) 23.50% 79.30%
Fecal Coliform (Geomean >200) 215 E6300000 Jonathans Crk At Us 276 Nr Cove Creek C Tr Turbidity 2008
Turbidity (>10 NTU) 11.80% 75.50%
E6450000 Cataloochee Crk At Sr 1395 Nr Cataloochee C Tr ORW No ph (<6 SU) 10.60% 67.10%
E6480000 Pigeon Riv At Sr 1338 Nr Hepco C EBI2 2008 Fecal Coliform (>400 col/100mL) 23.50% 79.30%
Nolichucky River: HUC 06010108 E7000000 N Toe Riv At Us 19E Nr Ingalls WS-IV Tr Turbidity 2008 Turbidity (>10 NTU) 17.60% 97.20%
Fecal Coliform (>400 col/100mL) 25.50% 87.40%
E8100000 N Toe Riv At Sr 1162 At Penland C Tr Turbidity 2006 Turbidity (>10 NTU) 41.20% 100.00%
E9850000 Cane Riv At Sr 1343 Nr Sioux C Tr Turbidity 2006 Turbidity (>10 NTU) 30.00% 100.00%
Fecal Coliform (>400 col/100mL) 23.70% 78.40%
E9990000 Nolichucky Riv Beside Sr 1321 At Poplar B Turbidity 2008 Turbidity (>50 NTU) 13.20% 82.50%
SSEs are shown in blue.
1. 303(d) List: Locations on the 303(d) list are considered impaired and are prioritized for corrective action. 2. EBI: Ecological/Biological Integrity, EBI is assessed by examination of the macroinvertebrate community and/or fish community in a stream.

NCDENR, Division of Water Quality Ambient Monitoring System Report
French Broad River Basin – January 2009 AMS-6
Figure 1. A Summary of Station Exceedances
NCDENR, Division of Water Quality Ambient Monitoring System Report
French Broad River Basin – January 2009 AMS-7
INTRODUCTION
The DWQ’s Ambient Monitoring System (AMS) is a network of stream, lake, and estuarine stations strategically located for the collection of physical and chemical water quality data. The stations are located at convenient access points (e.g. bridge crossings) that are sampled on a monthly basis. These locations were chosen to characterize the effects of point source dischargers and nonpoint sources such as agriculture, animal operations, and urbanization within watersheds. The data are used to identify long term trends within watersheds, to develop Total Maximum Daily Loads (TMDLs) and to compare measured values with water quality standards to identify possible areas of impairment. Parametric coverage is determined by freshwater or saltwater waterbody classification and corresponding water quality standards. Under this arrangement, core parameters are based on Class C waters with additional parameters added when justified (Table 2). Within this document, an analysis of how monitoring results compare with water quality standards and evaluation levels is presented. A conceptual overview of water quality standards is provided at: http://www.epa.gov/waterscience/standards. Specific information on North Carolina water quality standards is provided at: http://h2o.enr.state.nc.us/csu/swstdsfaq.html. A summary of selected water quality standards are listed in Table 3. Water quality data are evaluated in five year periods. Some stations have little or no data for several parameters over the period. However, for the purpose of standardization, data summaries for each station are included in this report. DWQ monitored water quality and collected samples at 24 stations throughout the basin. The locations of the sampling sites are illustrated in Figure 2, and listed in Table 4. In January 2007 the DWQ began collection of samples from a series of randomly determined sites. A description of the Random Sampling Program can be found here: http://h2o.enr.state.nc.us/esb/rams.html. There are three random sites located in the French Broad River Basin. Because this report assesses in a five-year window and RAMS stations will only have 2 years of data, they are not included in the ambient report. Once a sufficient number of samples have been collected statewide, RAMS data will be discussed in a separate report.
NCDENR, Division of Water Quality Ambient Monitoring System Report
French Broad River Basin – January 2009 AMS-8
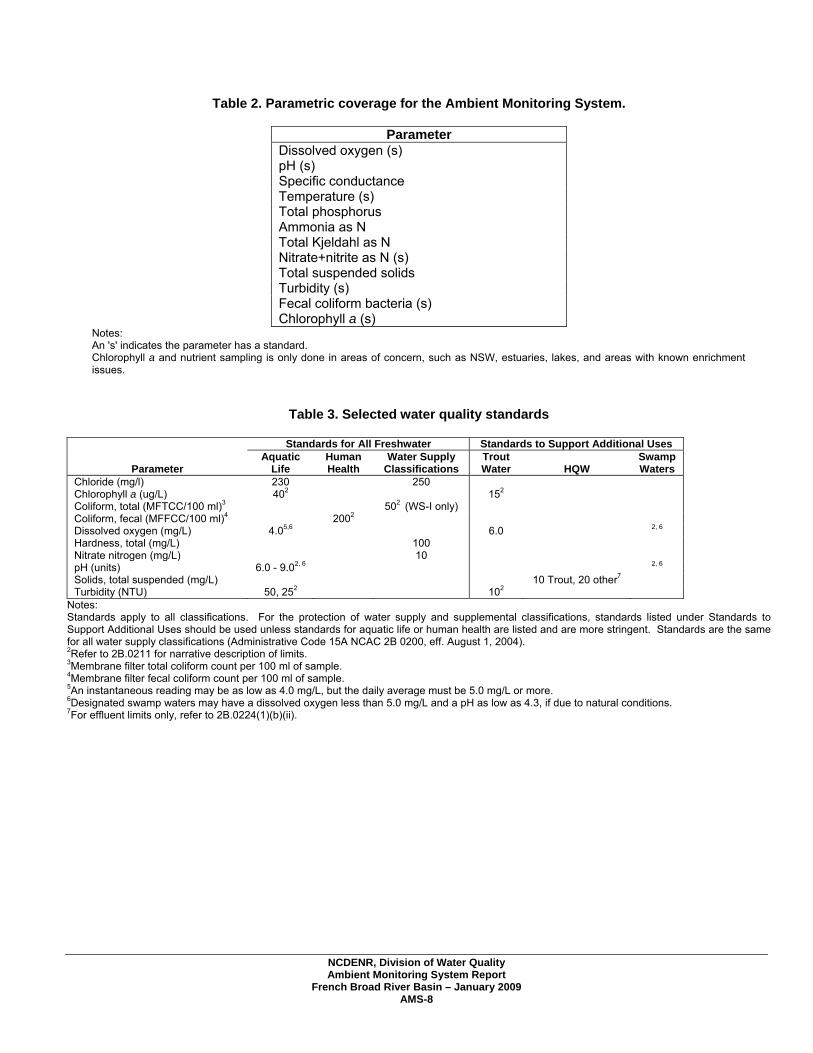
Table 2. Parametric coverage for the Ambient Monitoring System.
Parameter Dissolved oxygen (s) pH (s) Specific conductance Temperature (s) Total phosphorus Ammonia as N Total Kjeldahl as N Nitrate+nitrite as N (s) Total suspended solids Turbidity (s) Fecal coliform bacteria (s) Chlorophyll a (s)
Notes: An 's' indicates the parameter has a standard. Chlorophyll a and nutrient sampling is only done in areas of concern, such as NSW, estuaries, lakes, and areas with known enrichment issues.
Table 3. Selected water quality standards
Standards for All Freshwater Standards to Support Additional Uses
Parameter Aquatic
Life Human Health
Water Supply Classifications
Trout Water
HQW
Swamp Waters
Chloride (mg/l) 230 250 Chlorophyll a (ug/L) 402 152 Coliform, total (MFTCC/100 ml)3 502 (WS-I only) Coliform, fecal (MFFCC/100 ml)4 2002 Dissolved oxygen (mg/L) 4.05,6 6.0 2, 6 Hardness, total (mg/L) 100 Nitrate nitrogen (mg/L) 10 pH (units) 6.0 - 9.02, 6 2, 6
Solids, total suspended (mg/L) 10 Trout, 20 other7 Turbidity (NTU) 50, 252 102
Notes: Standards apply to all classifications. For the protection of water supply and supplemental classifications, standards listed under Standards to Support Additional Uses should be used unless standards for aquatic life or human health are listed and are more stringent. Standards are the same for all water supply classifications (Administrative Code 15A NCAC 2B 0200, eff. August 1, 2004). 2Refer to 2B.0211 for narrative description of limits. 3Membrane filter total coliform count per 100 ml of sample. 4Membrane filter fecal coliform count per 100 ml of sample. 5An instantaneous reading may be as low as 4.0 mg/L, but the daily average must be 5.0 mg/L or more. 6Designated swamp waters may have a dissolved oxygen less than 5.0 mg/L and a pH as low as 4.3, if due to natural conditions. 7For effluent limits only, refer to 2B.0224(1)(b)(ii).

NCDENR, Division of Water Quality Ambient Monitoring System Report
French Broad River Basin – January 2009 AMS-9
Figure 2. DWQ’s Ambient Monitoring System in the French Broad River Basin.
NCDENR, Division of Water Quality Ambient Monitoring System Report
French Broad River Basin – January 2009 AMS-10
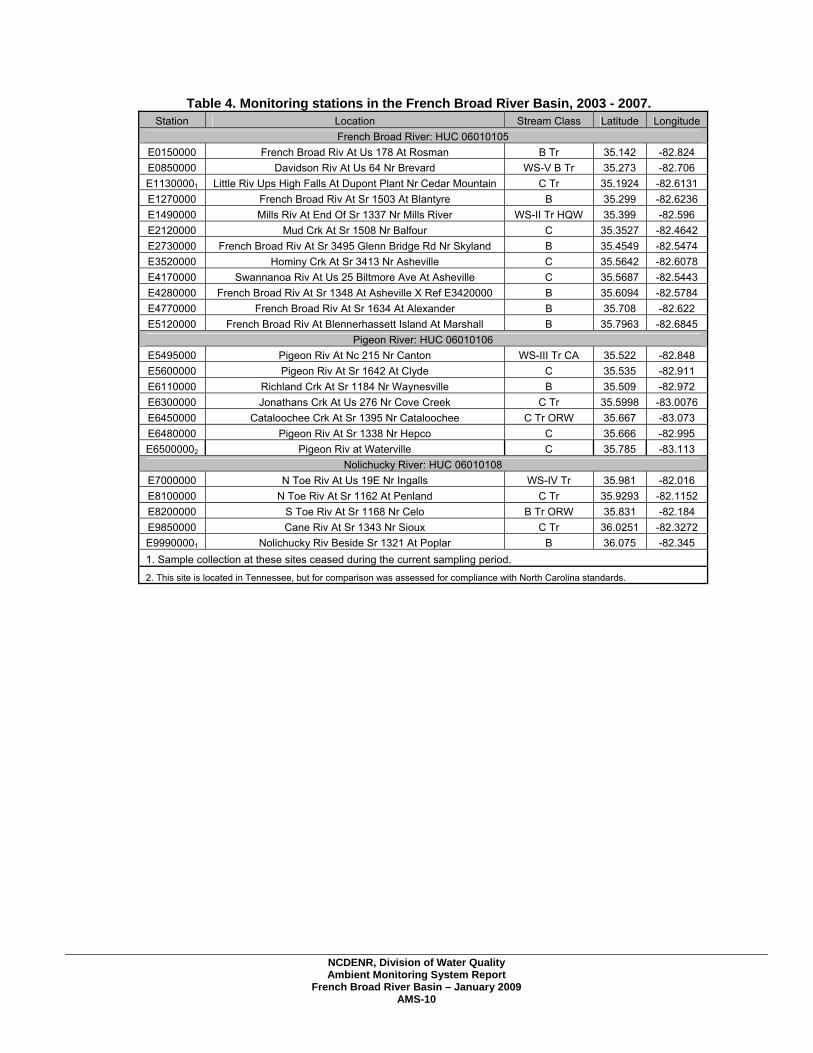
Table 4. Monitoring stations in the French Broad River Basin, 2003 - 2007. Station Location Stream Class Latitude Longitude
French Broad River: HUC 06010105 E0150000 French Broad Riv At Us 178 At Rosman B Tr 35.142 -82.824 E0850000 Davidson Riv At Us 64 Nr Brevard WS-V B Tr 35.273 -82.706 E11300001 Little Riv Ups High Falls At Dupont Plant Nr Cedar Mountain C Tr 35.1924 -82.6131 E1270000 French Broad Riv At Sr 1503 At Blantyre B 35.299 -82.6236 E1490000 Mills Riv At End Of Sr 1337 Nr Mills River WS-II Tr HQW 35.399 -82.596 E2120000 Mud Crk At Sr 1508 Nr Balfour C 35.3527 -82.4642 E2730000 French Broad Riv At Sr 3495 Glenn Bridge Rd Nr Skyland B 35.4549 -82.5474 E3520000 Hominy Crk At Sr 3413 Nr Asheville C 35.5642 -82.6078 E4170000 Swannanoa Riv At Us 25 Biltmore Ave At Asheville C 35.5687 -82.5443 E4280000 French Broad Riv At Sr 1348 At Asheville X Ref E3420000 B 35.6094 -82.5784 E4770000 French Broad Riv At Sr 1634 At Alexander B 35.708 -82.622 E5120000 French Broad Riv At Blennerhassett Island At Marshall B 35.7963 -82.6845
Pigeon River: HUC 06010106 E5495000 Pigeon Riv At Nc 215 Nr Canton WS-III Tr CA 35.522 -82.848 E5600000 Pigeon Riv At Sr 1642 At Clyde C 35.535 -82.911 E6110000 Richland Crk At Sr 1184 Nr Waynesville B 35.509 -82.972 E6300000 Jonathans Crk At Us 276 Nr Cove Creek C Tr 35.5998 -83.0076 E6450000 Cataloochee Crk At Sr 1395 Nr Cataloochee C Tr ORW 35.667 -83.073 E6480000 Pigeon Riv At Sr 1338 Nr Hepco C 35.666 -82.995 E65000002 Pigeon Riv at Waterville C 35.785 -83.113
Nolichucky River: HUC 06010108 E7000000 N Toe Riv At Us 19E Nr Ingalls WS-IV Tr 35.981 -82.016 E8100000 N Toe Riv At Sr 1162 At Penland C Tr 35.9293 -82.1152 E8200000 S Toe Riv At Sr 1168 Nr Celo B Tr ORW 35.831 -82.184 E9850000 Cane Riv At Sr 1343 Nr Sioux C Tr 36.0251 -82.3272 E99900001 Nolichucky Riv Beside Sr 1321 At Poplar B 36.075 -82.345 1. Sample collection at these sites ceased during the current sampling period.
2. This site is located in Tennessee, but for comparison was assessed for compliance with North Carolina standards.

NCDENR, Division of Water Quality Ambient Monitoring System Report
French Broad River Basin – January 2009 AMS-11
PARAMETERS
Dissolved Oxygen Dissolved oxygen is one of the most important of all the chemical measurements. Dissolved oxygen provides valuable information about the ability of the water to support aquatic life and the capacity of water to assimilate point and nonpoint discharges. Water quality standards for dissolved oxygen vary depending on the classification of the body of water. For freshwaters, 15A NCAC 02B .0211 (3)(b) specifies: Dissolved oxygen: not less than 6.0 mg/l for trout waters; for non-trout waters, not less than a daily average of 5.0 mg/l with a minimum instantaneous value of not less than 4.0 mg/l; swamp waters, lake coves or backwaters, and lake bottom waters may have lower values if caused by natural conditions. pH The pH of natural waters can vary throughout the state. Low values, such as less than 7.0 Standard Units (SU), can be found in waters rich in dissolved organic matter, such as swamp lands. High values, such as greater than 7.0 SU may be found during algal blooms. Point source dischargers can also influence the pH of a stream. The measurement of pH is relatively easy; however the accuracy of field measurements is limited by the abilities of the field equipment, which is generally accurate to within 0.2 SU. This is due, in part, because the scale for measuring pH is logarithmic (i.e. a pH of 8 is ten times less concentrated in hydrogen ions than a pH of 7). The water quality standards for pH in freshwaters consider values less than 6.0 SU. or greater than 9.0 SU. to warrant attention. In swamp waters, a pH below 4.3 SU. is of concern. Specific Conductance In this report, conductivity is synonymous with specific conductance. It is reported in micro-mhos per centimeter (µmhos/cm) at 25°C. Conductivity is a measure of the ability of water to conduct an electric current. The presence of ions and temperature are major factors in the ability of water to conduct a current. Clean freshwater has a low conductivity, whereas high conductivities may indicate polluted water or saline conditions. Measurements reported are corrected for temperature, thus the range of values reported over a period of time indicate the relative presence of ions in water. North Carolina freshwater streams have a natural conductance range of 17-65 μmhos/cm (USGS 1992). Conductivity can be used to evaluate variations in dissolved mineral concentrations (ions) among sites with varying degrees of impact resulting from point source discharges. Generally, impacted sites show elevated and widely ranging values for conductivity. Turbidity Turbidity data may denote episodic high values on particular dates or within narrow time periods. These can often be the result of intense or sustained rainfall events; however elevated values can occur at other times. Nutrients Compounds of nitrogen and phosphorus are major components of living organisms and thus are essential to maintain life. These compounds are collectively referred to as “nutrients.” Nitrogen compounds include ammonia-nitrogen (NH3-N), total Kjeldahl nitrogen (TKN) and nitrite+nitrate nitrogen (NO2+NO3-N). Phosphorus is measured as total phosphorus. When nutrients are introduced to an aquatic ecosystem from municipal and industrial treatment processes, or runoff from urban or agricultural land, the excessive growth of algae (algal blooms) and other plants may be accelerated.
NCDENR, Division of Water Quality Ambient Monitoring System Report
French Broad River Basin – January 2009 AMS-12
At neutral pH in water, ammonia normally forms an ionized solution of ammonium hydroxide, with a small amount of deionized ammonia. However, as pH increases, more ammonia is left deionized. Deionized ammonia is toxic to fish and other aquatic organisms. Fecal Coliform Bacteria Concentrations of fecal coliform bacteria can vary greatly. The descriptive statistics used to evaluate fecal coliform bacteria data include the geometric mean and the median depending on the classification of the waterbody. For all sites in the French Broad River Basin, the standard specified in Administrative Code 15A NCAC 02B.0211 (3)(e) (May 1, 2007) is applicable: "Organisms of the coliform group: fecal coliforms shall not exceed a geometric mean of 200/100ml (MF count) based upon at least five consecutive samples examined during any 30 day period, nor exceed 400/100ml in more than 20 percent of the samples examined during such period; violations of the fecal coliform standard are expected during rainfall events and, in some cases, this violation is expected to be caused by uncontrollable nonpoint source pollution; all coliform concentrations are to be analyzed using the membrane filter technique unless high turbidity or other adverse conditions necessitate the tube dilution method; in case of controversy over results, the MPN 5-tube dilution technique shall be used as the reference method.” All of the French Broad basin in North Carolina is composed of fresh waters. All sites where the geometric mean was greater than 200 colonies/100ml, or where greater than 20 percent of the results exceed 400 colonies/100ml (i.e. all sites that exceed the evaluation level) are indicated on the respective station summary sheets. Fecal coliform problems are screened using annual summaries of Ambient sampling results. If the screening indicates that the station may be in violation of the standard, the standard is assessed using the method required by law. All such class B (and class SB/SA in coastal basins) waters are assessed, and other waters as resources permit. The required assessment method is known as “5 in 30”, collecting a minimum five samples within a span of 30 days. If a water body exceeds the standard more then 20% of the time during the 30-day period or the geomean for the 30-day period is greater than 200, then that water body is considered impaired and is added to the impaired water list, the 303(d) list.

NCDENR, Division of Water Quality Ambient Monitoring System Report
French Broad River Basin – January 2009 AMS-13
WATER QUALITY MONITORING RESULTS SUMMARY Water Quality within the basin during the evaluation period is summarized in the following tables. Table 5 shows how often water quality evaluation levels were exceeded. Table 6 shows average values, for comparison against HUC and basinwide averages.
Table 5. Frequency of Evaluation Level Exceedances
Sta
tion
ID
Stre
am C
lass
Wat
er T
empe
ratu
re (>
29 ºC
) M
ount
ain/
U. P
iedm
ont W
ater
s
Dis
solv
ed O
xyge
n (<
4 m
g/L)
Dis
solv
ed O
xyge
n (<
6 m
g/L)
Tr
out W
ater
s
pH (<
6 S
U) (
fresh
wat
er)
pH (>
9 S
U) (
fresh
wat
er)
Turb
idity
(>10
NTU
)
Trou
t Wat
ers
Turb
idity
(>50
NTU
)
Nitr
ate
& N
itrite
(>10
mg/
L)
Flou
ride
(>1.
8)
Feca
l Col
iform
(>40
0 co
loni
es/1
00 m
L)
French Broad River: HUC 06010105 E0150000 B Tr 0.0% NS 0.0% 3.8% 0.0% 11.1% NS NS NC 9.3% E0850000 WS-V B Tr 0.0% NS 0.0% 15.4% 0.0% 1.9% NS L10 NC 0.0% E1130000 C Tr 0.0% NS 0.0% 4.3% 0.0% 2.2% NS L10 NC 0.0% E1270000 B 0.0% 0.0% NS 3.8% 1.9% NS 1.9% L10 NC 11.1% E1490000 WS-II Tr HQW 0.0% NS 0.0% 2.0% 0.0% 5.9% NS 0.0% NC 9.8% E2120000 C 0.0% 0.0% NS 2.0% 0.0% NS 5.8% NS NC 40.4% E2730000 B 0.0% 0.0% NS 0.0% 0.0% NS 9.4% NS NC 20.8% E3520000 C 0.0% 0.0% NS 0.0% 0.0% NS 13.7% NS NC 29.4% E4170000 C 0.0% 0.0% NS 0.0% 0.0% NS 12.2% NS NC 26.5% E4280000 B 0.0% 0.0% NS 0.0% 0.0% NS 9.3% NS NC 20.4% E4770000 B 0.0% 0.0% NS 0.0% 0.0% NS 15.4% NS NC 17.3% E5120000 B 0.0% 0.0% NS 0.0% 0.0% NS 14.0% NS NC 18.0%
Pigeon RIver: HUC 06010106 E5495000 WS-III Tr CA 0.0% NS 0.0% 4.2% 0.0% 3.9% NS 0.0% NC 7.8% E5600000 C 0.0% 0.0% NS 0.0% 0.0% NS 3.9% NS NC 13.7% E6110000 B 0.0% 0.0% NS 0.0% 0.0% NS 1.9% L10 NC 43.4% E6300000 C Tr 0.0% NS 0.0% 0.0% 0.0% 11.8% NS L10 NC 23.5% E6450000 C Tr ORW 0.0% NS 0.0% 10.6% 0.0% 2.1% NS NS NC 0.0% E6480000 C 0.0% 0.0% NS 0.0% 0.0% NS 5.9% NS NC 23.5% E6500000 C 0.0% 0.0% NS 0.0% 0.0% NS 0.0% NS NC 11.8%
Nolichucky River: HUC 06010108 E7000000 WS-IV Tr 0.0% NS 0.0% 0.0% 0.0% 17.6% NS NC 0.0% 11.8% E8100000 C Tr 0.0% NS 0.0% 0.0% 0.0% 41.2% NS L10 4.1% 25.5% E8200000 B Tr ORW 0.0% NS 0.0% 8.3% 0.0% 4.0% NS NS NC 6.0% E9850000 C Tr 0.0% NS 0.0% 0.0% 0.0% 30.0% NS NS NC 18.0% E9990000 B 0.0% 0.0% NS 0.0% 0.0% NS 13.2% L10 0.0% 23.7%
Notes: NS: No Standard exists for this parameter in this stream class.
NC: Samples for this parameter were Not Collected. L10: Less than 10 samples were collected for this parameter, therefore the results were not assessed. 1: In trout waters, a dissolved oxygen standard of 6 mg/L applies.

NCDENR, Division of Water Quality Ambient Monitoring System Report
French Broad River Basin – January 2009 AMS-14
Table 6. Summary of Water Quality Parameter Averages (Arithmetic Means)
Sta
tion
Stre
am C
lass
N S
ampl
e D
ates
Wat
er T
empe
ratu
re (°
C)
D.O
. (m
g/L)
pH (S
U)
Spe
c. c
ondu
ctan
ce (u
mho
s/cm
at 2
5°C
)
Turb
idity
(NTU
)
Feca
l col
iform
(# c
olon
ies
per 1
00m
L)
Tota
l Ino
rgan
ic N
itrog
en (m
g/L)
Tota
l Org
anic
Nitr
ogen
(mg/
L)
NH
3 as
N (m
g/L)
NO
2 +
NO
3 as
N (m
g/L)
TKN
as
N (m
g/L)
Tota
l Pho
spho
rus
(mg/
L)
Flou
ride(
mg/
L)
Entire Basin 1215 13.6 10.4 6.9 67.6 12.6 0.36 0.23 0.04 0.32 0.27 0.07 0.63 HUC 06010105 619 13.8 10.1 6.8 39.4 13.9 0.42 0.23 0.05 0.38 0.27 0.07 NC
E0150000 B Tr 54 12.4 10.6 6.7 18.0 5.2 38 0.24 0.18 0.03 0.22 0.21 0.05 NC E0850000 WS-V B Tr 53 11.8 10.7 6.4 14.0 2.1 18 L10 L10 L10 L10 L10 L10 NC E1130000 C Tr 46 13.6 9.8 6.5 16.5 2.8 35 L10 L10 L10 L10 L10 L10 NC E1270000 B 54 13.8 9.6 6.6 23.8 10.3 82 L10 L10 L10 L10 L10 L10 NC
E1490000 WS-II Tr
HQW 51 12.5 10.7 6.6 15.1 4.0 64 0.12 0.19 0.02 0.10 0.21 0.03 NC E2120000 C 52 13.7 9.5 6.6 59.4 15.3 359 0.64 0.24 0.04 0.61 0.27 0.06 NC E2730000 B 53 13.8 9.8 6.8 36.6 16.8 156 0.37 0.20 0.03 0.34 0.23 0.08 NC E3520000 C 51 14.5 10.1 7.0 69.2 25.0 198 0.55 0.26 0.05 0.50 0.30 0.07 NC E4170000 C 49 14.8 10.2 7.0 59.4 16.7 187 NC NC NC NC NC NC NC E4280000 B 54 14.2 10.3 7.1 44.5 21.4 82 0.38 0.24 0.03 0.34 0.27 0.08 NC E4770000 B 52 15.7 9.9 7.2 59.6 25.1 39 0.67 0.30 0.13 0.54 0.43 0.16 NC E5120000 B 50 15.1 10.3 7.2 62.3 22.1 48 NC NC NC NC NC NC NC
HUC 06010106 356 13.5 10.4 7.1 127.1 7.7 0.30 0.24 0.03 0.26 0.28 0.08 NC
E5495000 WS-III Tr
CA 51 13.1 10.9 6.8 23.4 7.0 60 0.22 0.19 0.02 0.20 0.21 0.04 NC E5600000 C 51 15.8 9.9 7.5 374.2 10.5 118 0.29 0.32 0.05 0.24 0.37 0.16 NC E6110000 B 53 12.8 10.5 6.9 50.2 8.3 341 L10 L10 L10 L10 L10 L10 NC E6300000 C Tr 51 12.5 10.5 6.9 40.1 8.3 215 L10 L10 L10 L10 L10 L10 NC E6450000 C Tr ORW 48 11.5 10.8 6.6 15.2 2.0 4 0.16 0.19 0.02 0.14 0.21 0.03 NC E6480000 C 51 14.4 10.2 7.7 237.4 12.6 173 0.49 0.27 0.04 0.45 0.32 0.12 NC E6500000 C 51 14.1 9.9 7.1 151.2 5.0 30 NC NC NC NC NC NC NC
HUC 06010108 240 13.4 10.9 7.0 50.5 16.6 0.14 0.19 0.02 0.12 0.21 0.03 0.63 E7000000 WS-IV Tr 51 12.8 10.9 7.1 47.0 13.6 42 NC NC NC NC NC NC 0.50 E8100000 C Tr 51 13.3 10.8 7.1 83.5 27.3 86 L10 L10 L10 L10 L10 L10 0.85 E8200000 B Tr ORW 50 11.9 11.0 6.5 15.7 2.1 23 0.12 0.18 0.02 0.10 0.21 0.02 NC E9850000 C Tr 50 14.3 11.0 7.2 48.2 16.1 91 NC NC NC NC NC NC NC E9990000 B 38 15.0 10.7 7.1 59.1 25.7 106 L10 L10 L10 L10 L10 L10 0.50
Notes: NC: Samples for this parameter were Not Collected. L10: less than 10 samples were collected for this parameter. Fecal Coliform shows geometric means for stations.

NCDENR, Division of Water Quality Ambient Monitoring System Report
French Broad River Basin – January 2009 AMS-15
ASSESSMENT AND INTERPRETATION METHODS Monitoring and sampling results considered in this report represent samples collected or measurements taken at less than one-meter depth. Percentile statistics were calculated for most of the data using JMP statistical software (version 5.01; SAS Institute, Cary, NC). Values less than the minimum reporting level (non-detects) were evaluated as equal to the reporting level. Box and whisker plots (constructed using SigmaPlot version 9) and maps are presented for most water quality parameters collected at each monitoring station. Significant trends in water quality parameters (constructed using Microsoft Excel) are illustrated as scatterplots. Significant trends are found by assessing the probability that the linear model explains the data no better then chance. If that chance is 5% or less (an observed significance probability of 0.05 or less) then that is considered evidence of a regression effect in this document. The strength of the regression effect is given as an r2 value, the portion of the data that is explained by the linear model. There are many other types of modeling (non-linear) that can be used to explore trends, but they were not used in this document. Assessment Considerations Total Metals The North Carolina Division of Water Quality is currently reviewing water quality standards for metals. Review of historical total metals data and biological data has shown that no correlation exists between exceedance of total metals ambient standards and biological impairment. Therefore, as of May 2007 DWQ has suspended collection of total metals at AMS stations. Providing Confidence in the Exceedance of Water Quality Standards Historically, NC DWQ has used guidance provided by the US EPA for determining when the number of results that exceed a water quality standard indicate potential water quality issues. The US EPA has suggested that management actions be implemented when 10 percent of the results exceeded a water quality standard. This interpretation is the same whether 1 out of 10, or 5 out of 50, or 25 out of 250 results exceed a standard. Evaluating exceedances in this manner is termed the “raw-score” approach. Although this “10 percent exceedance criterion” defines a point where potential water quality issues may be present, it does not consider uncertainty. Some results are subject to chance or other factors such as calibration errors or sample mishandling. Uncertainty levels change with sample size. The smaller the sample size, the greater the uncertainty. This document uses a nonparametric procedure (Lin et al. 2000) to identify when a sufficient number of exceedances have occurred that indicate a true exceedance probability of 10 percent. Calculating the minimum number of exceedances needed for a particular sample size was done using the BINOMDIST function in Microsoft Excel®. This statistical function suggests that at least three exceedances need to be observed in a sample of 10 in order to be [about] 95 percent confident that the results statistically exceed the water quality standard more than 10% of the time. For example, there is less statistical confidence associated with a 1 exceedance out of 10 (74 percent) than when there are 3 exceedances out of 10 (99 percent confidence) (Table 7).

NCDENR, Division of Water Quality Ambient Monitoring System Report
French Broad River Basin – January 2009 AMS-16
Table 7. Exceedance Confidence
Number of Exceedances
1 2 3 4 5 6 7 8 9 10 11 12 13 14 15 16 17
10 74% 93% 99% 100% 100% 100% 100% 100% 100% 100%
12 66% 89% 97% 100% 100% 100% 100% 100% 100% 100% 100% 100%
14 58% 84% 96% 99% 100% 100% 100% 100% 100% 100% 100% 100% 100% 100%
16 51% 79% 93% 98% 100% 100% 100% 100% 100% 100% 100% 100% 100% 100% 100% 100%
18 45% 73% 90% 97% 99% 100% 100% 100% 100% 100% 100% 100% 100% 100% 100% 100% 100%
20 39% 68% 87% 96% 99% 100% 100% 100% 100% 100% 100% 100% 100% 100% 100% 100% 100%
22 34% 62% 83% 94% 98% 100% 100% 100% 100% 100% 100% 100% 100% 100% 100% 100% 100%
24 29% 56% 79% 91% 97% 99% 100% 100% 100% 100% 100% 100% 100% 100% 100% 100% 100%
26 25% 51% 74% 89% 96% 99% 100% 100% 100% 100% 100% 100% 100% 100% 100% 100% 100%
28 22% 46% 69% 86% 94% 98% 100% 100% 100% 100% 100% 100% 100% 100% 100% 100% 100%
30 18% 41% 65% 82% 93% 97% 99% 100% 100% 100% 100% 100% 100% 100% 100% 100% 100%
32 16% 37% 60% 79% 91% 96% 99% 100% 100% 100% 100% 100% 100% 100% 100% 100% 100%
34 13% 33% 55% 75% 88% 95% 98% 99% 100% 100% 100% 100% 100% 100% 100% 100% 100%
36 11% 29% 51% 71% 85% 94% 98% 99% 100% 100% 100% 100% 100% 100% 100% 100% 100%
38 10% 25% 46% 67% 83% 92% 97% 99% 100% 100% 100% 100% 100% 100% 100% 100% 100%
40 8% 22% 42% 63% 79% 90% 96% 98% 99% 100% 100% 100% 100% 100% 100% 100% 100%
42 7% 20% 38% 59% 76% 88% 95% 98% 99% 100% 100% 100% 100% 100% 100% 100% 100%
44 6% 17% 35% 55% 73% 85% 93% 97% 99% 100% 100% 100% 100% 100% 100% 100% 100%
46 5% 15% 31% 51% 69% 83% 92% 96% 99% 100% 100% 100% 100% 100% 100% 100% 100%
48 4% 13% 28% 47% 65% 80% 90% 95% 98% 99% 100% 100% 100% 100% 100% 100% 100%
50 3% 11% 25% 43% 62% 77% 88% 94% 98% 99% 100% 100% 100% 100% 100% 100% 100%
52 3% 10% 22% 40% 58% 74% 86% 93% 97% 99% 100% 100% 100% 100% 100% 100% 100%
54 2% 8% 20% 36% 54% 71% 83% 91% 96% 98% 99% 100% 100% 100% 100% 100% 100%
56 2% 7% 18% 33% 51% 67% 81% 90% 95% 98% 99% 100% 100% 100% 100% 100% 100%
58 2% 6% 16% 30% 47% 64% 78% 88% 94% 97% 99% 100% 100% 100% 100% 100% 100%
60 1% 5% 14% 27% 44% 61% 75% 86% 93% 97% 99% 99% 100% 100% 100% 100% 100%
62 1% 5% 12% 24% 40% 57% 72% 84% 91% 96% 98% 99% 100% 100% 100% 100% 100%
64 1% 4% 11% 22% 37% 54% 69% 81% 90% 95% 98% 99% 100% 100% 100% 100% 100%
66 1% 3% 9% 20% 34% 51% 66% 79% 88% 94% 97% 99% 99% 100% 100% 100% 100%
68 1% 3% 8% 18% 31% 47% 63% 76% 86% 93% 96% 98% 99% 100% 100% 100% 100%
70 1% 2% 7% 16% 29% 44% 60% 74% 84% 91% 96% 98% 99% 100% 100% 100% 100%
72 0% 2% 6% 14% 26% 41% 57% 71% 82% 90% 95% 97% 99% 100% 100% 100% 100%
74 0% 2% 5% 13% 24% 38% 54% 68% 80% 88% 94% 97% 99% 99% 100% 100% 100%
76 0% 1% 5% 11% 22% 35% 51% 65% 77% 86% 93% 96% 98% 99% 100% 100% 100%
78 0% 1% 4% 10% 20% 33% 48% 62% 75% 85% 91% 95% 98% 99% 100% 100% 100%
80 0% 1% 4% 9% 18% 30% 45% 59% 72% 83% 90% 95% 97% 99% 99% 100% 100%
Number of
Samples
Note: Bold entries indicate that there is at least 95% confidence that at least 10% of the possible samples exceed the evaluation level.

NCDENR, Division of Water Quality Ambient Monitoring System Report
French Broad River Basin – January 2009 AMS-17
Methods Used to Summarize Results Methods used to summarize the results in this report encompass both tabular and graphical formats. Individual summary sheets for each station provide details on station location, stream classification, along with specifics on what parameters were measured, the number of samples taken (i.e. sample size), the number of results below reporting levels, the number of results exceeding a water quality standard or evaluation level, statistical confidence that 10% of results exceeded the evaluation level, and a general overview of the distribution of the results using percentiles. These station summary sheets provide the greatest details on a station-by-station basis. They are included as Appendix A to this report. Box and whisker plots, scatterplots, and maps were used to depict data for a variety of water quality parameters throughout the basin. For the box plots, stations with fewer then 10 data points for a given parameter were not included. This occasionally occurred when a new station was added, an old station was removed, or a station was moved to a new location in the basin. Comparisons were depicted in the following ways:
• Comparing stations – box plots • Assessing Stations – tables • Comparing HUCs – box plots and scatterplots • Assessing trends - scatterplots • Assessing the basin – maps
Box and Whisker Plots The primary method of analyzing data in this report is through the use of box and whisker plots. Figure 3 is an annotated example of a box and whisker plot that illustrates the distribution of the results for a particular parameter at a single site. This box plot contains both the median and mean values. Differences between the median and mean can illustrate the distribution of the results. For example, if the mean is considerably larger then the median, then there are likely a few very high concentrations raising the mean. Another useful measure is to compare the 90th percentile against the evaluation level. For most parameters, 10% exceedance of the evaluation levels is considered a violation. Therefore the 90th (or 10th in the case of minimum evaluation levels) percentile exceeding the evaluation level is an equivalent statement.
10th Percentile
25th Percentile
50th Percentile (Median)
Mean (Average)
75th Percentile
90th Percentile
Evaluation Level
95th Percentile
0 1 2 3 4 5 6 7
5th Percentile
Q9200000d C HWQ
Station Identifier
Agency Identifier
Primary Water Use Classification
Secondary Water Use Classification
Agency Identifiersd - Division of Water Quality
Primary Water Use ClassificationsC - Aquatic LifeB - Primary RecreationWS (I, II, III, IV, or V) - Water SupplySC - Saltwater Aquatic LifeSB - Saltwater Primary RecreationSA - Saltwater Shellfish Harvesting
Secondary Water Use ClassificationsSW - Swamp WatersHQW - High Quality WatersORW - Outstanding Resource WatersCA - Critical AreaTr - Trout Waters
Figure 3. An Example Box Plot for a Station
NCDENR, Division of Water Quality Ambient Monitoring System Report
French Broad River Basin – January 2009 AMS-18
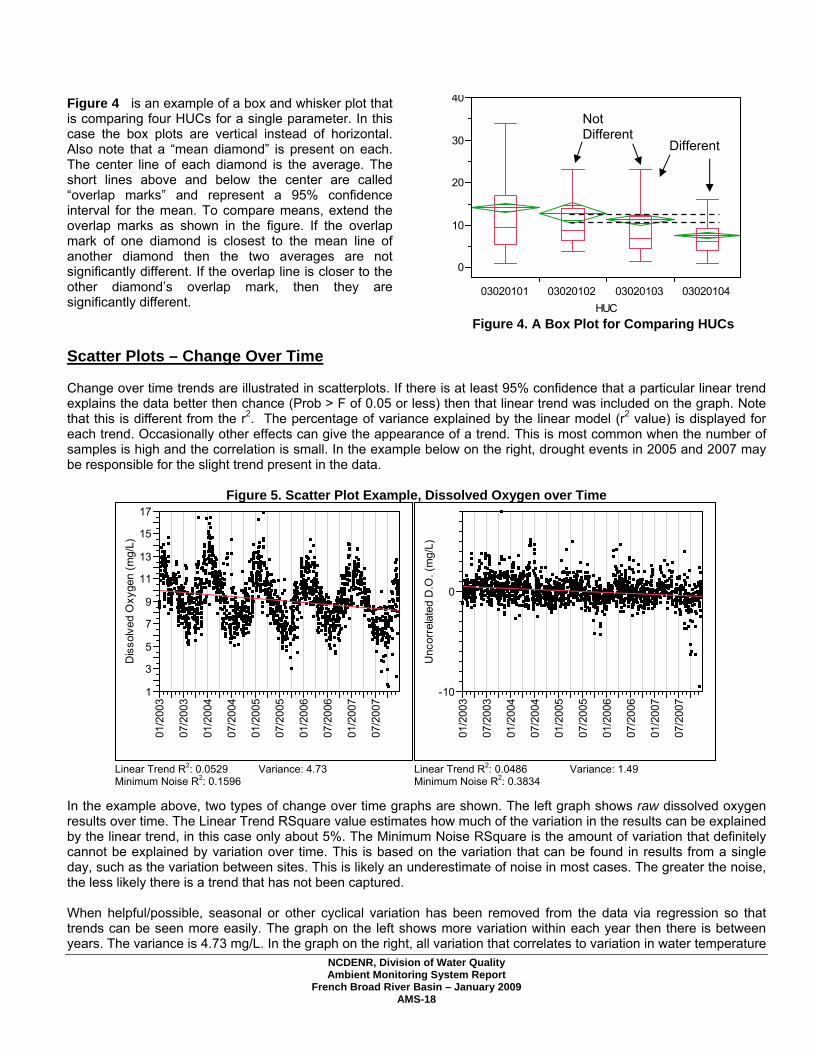
Figure 4 is an example of a box and whisker plot that is comparing four HUCs for a single parameter. In this case the box plots are vertical instead of horizontal. Also note that a “mean diamond” is present on each. The center line of each diamond is the average. The short lines above and below the center are called “overlap marks” and represent a 95% confidence interval for the mean. To compare means, extend the overlap marks as shown in the figure. If the overlap mark of one diamond is closest to the mean line of another diamond then the two averages are not significantly different. If the overlap line is closer to the other diamond’s overlap mark, then they are significantly different.
0
10
20
30
40
03020101 03020102 03020103 03020104HUC
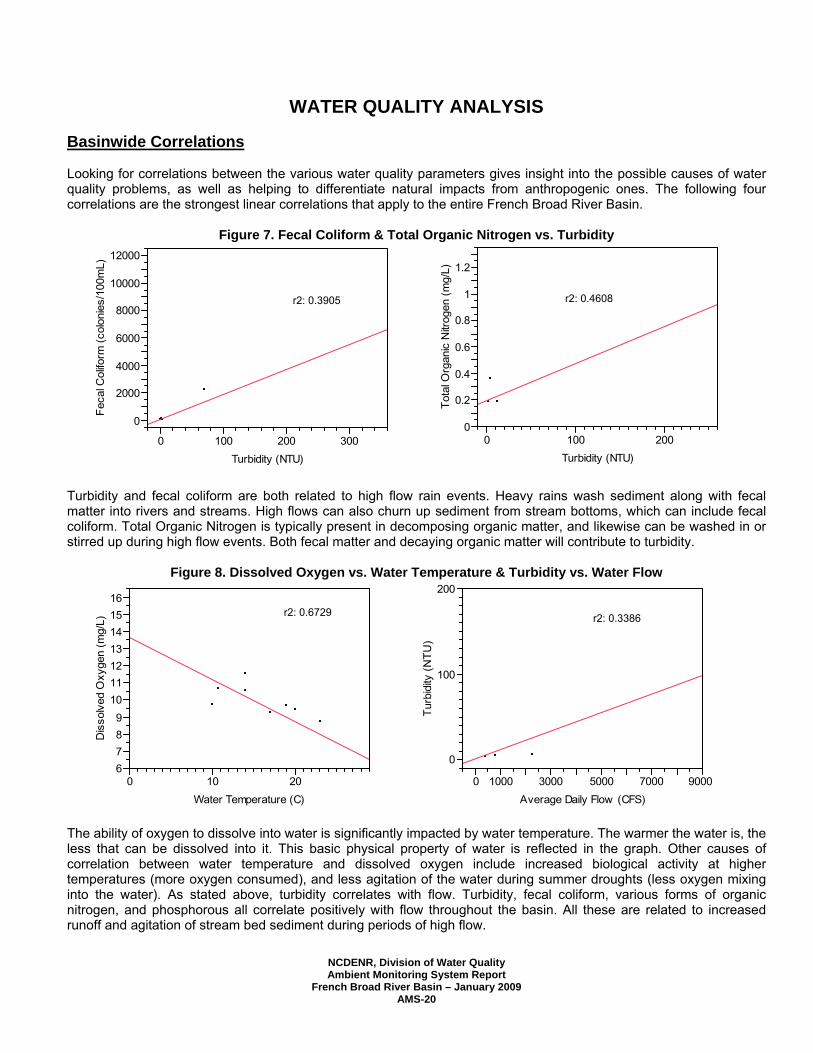
Figure 4. A Box Plot for Comparing HUCs Scatter Plots – Change Over Time Change over time trends are illustrated in scatterplots. If there is at least 95% confidence that a particular linear trend explains the data better then chance (Prob > F of 0.05 or less) then that linear trend was included on the graph. Note that this is different from the r2. The percentage of variance explained by the linear model (r2 value) is displayed for each trend. Occasionally other effects can give the appearance of a trend. This is most common when the number of samples is high and the correlation is small. In the example below on the right, drought events in 2005 and 2007 may be responsible for the slight trend present in the data.
Figure 5. Scatter Plot Example, Dissolved Oxygen over Time
1
3
5
7
9
11
13
15
17
Dis
solv
ed O
xyge
n (m
g/L)
01/2
003
07/2
003
01/2
004
07/2
004
01/2
005
07/2
005
01/2
006
07/2
006
01/2
007
07/2
007
-10
0
Unc
orre
late
d D
.O. (
mg/
L)
01/2
003
07/2
003
01/2
004
07/2
004
01/2
005
07/2
005
01/2
006
07/2
006
01/2
007
07/2
007
Linear Trend R2: 0.0529 Variance: 4.73 Linear Trend R2: 0.0486 Variance: 1.49 Minimum Noise R2: 0.1596 Minimum Noise R2: 0.3834
In the example above, two types of change over time graphs are shown. The left graph shows raw dissolved oxygen results over time. The Linear Trend RSquare value estimates how much of the variation in the results can be explained by the linear trend, in this case only about 5%. The Minimum Noise RSquare is the amount of variation that definitely cannot be explained by variation over time. This is based on the variation that can be found in results from a single day, such as the variation between sites. This is likely an underestimate of noise in most cases. The greater the noise, the less likely there is a trend that has not been captured. When helpful/possible, seasonal or other cyclical variation has been removed from the data via regression so that trends can be seen more easily. The graph on the left shows more variation within each year then there is between years. The variance is 4.73 mg/L. In the graph on the right, all variation that correlates to variation in water temperature
Not Different
Different
NCDENR, Division of Water Quality Ambient Monitoring System Report
French Broad River Basin – January 2009 AMS-19
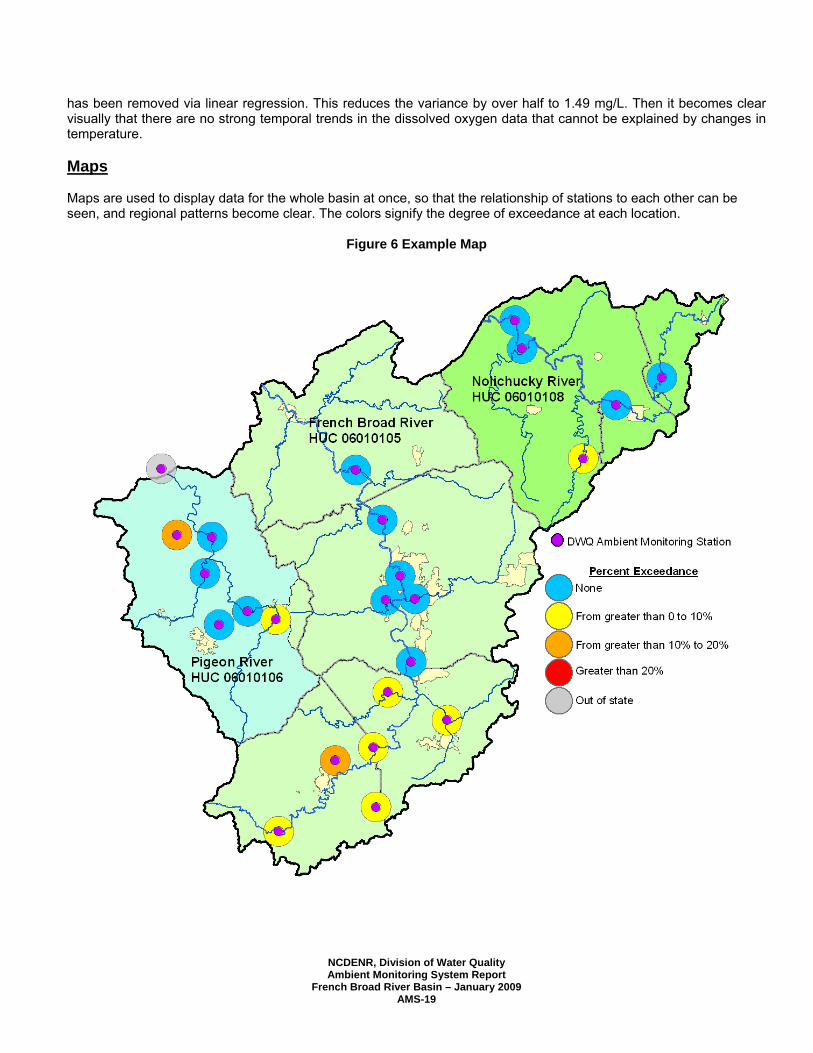
has been removed via linear regression. This reduces the variance by over half to 1.49 mg/L. Then it becomes clear visually that there are no strong temporal trends in the dissolved oxygen data that cannot be explained by changes in temperature. Maps Maps are used to display data for the whole basin at once, so that the relationship of stations to each other can be seen, and regional patterns become clear. The colors signify the degree of exceedance at each location.
Figure 6 Example Map
NCDENR, Division of Water Quality Ambient Monitoring System Report
French Broad River Basin – January 2009 AMS-20
WATER QUALITY ANALYSIS Basinwide Correlations Looking for correlations between the various water quality parameters gives insight into the possible causes of water quality problems, as well as helping to differentiate natural impacts from anthropogenic ones. The following four correlations are the strongest linear correlations that apply to the entire French Broad River Basin.
Figure 7. Fecal Coliform & Total Organic Nitrogen vs. Turbidity
0
2000
4000
6000
8000
10000
12000
Feca
l Col
iform
(col
onie
s/10
0mL)
0 100 200 300Turbidity (NTU)
0
0.2
0.4
0.6
0.8
1
1.2
Tota
l Org
anic
Nitr
ogen
(mg/
L)0 100 200
Turbidity (NTU)
Turbidity and fecal coliform are both related to high flow rain events. Heavy rains wash sediment along with fecal matter into rivers and streams. High flows can also churn up sediment from stream bottoms, which can include fecal coliform. Total Organic Nitrogen is typically present in decomposing organic matter, and likewise can be washed in or stirred up during high flow events. Both fecal matter and decaying organic matter will contribute to turbidity.
Figure 8. Dissolved Oxygen vs. Water Temperature & Turbidity vs. Water Flow
6789
10111213141516
Dis
solv
ed O
xyge
n (m
g/L)
0 10 20Water Temperature (C)
0
100
200
Turb
idity
(NTU
)
0 1000 3000 5000 7000 9000Average Daily Flow (CFS)
The ability of oxygen to dissolve into water is significantly impacted by water temperature. The warmer the water is, the less that can be dissolved into it. This basic physical property of water is reflected in the graph. Other causes of correlation between water temperature and dissolved oxygen include increased biological activity at higher temperatures (more oxygen consumed), and less agitation of the water during summer droughts (less oxygen mixing into the water). As stated above, turbidity correlates with flow. Turbidity, fecal coliform, various forms of organic nitrogen, and phosphorous all correlate positively with flow throughout the basin. All these are related to increased runoff and agitation of stream bed sediment during periods of high flow.
r2: 0.3905 r2: 0.4608
r2: 0.6729 r2: 0.3386
NCDENR, Division of Water Quality Ambient Monitoring System Report
French Broad River Basin – January 2009 AMS-21
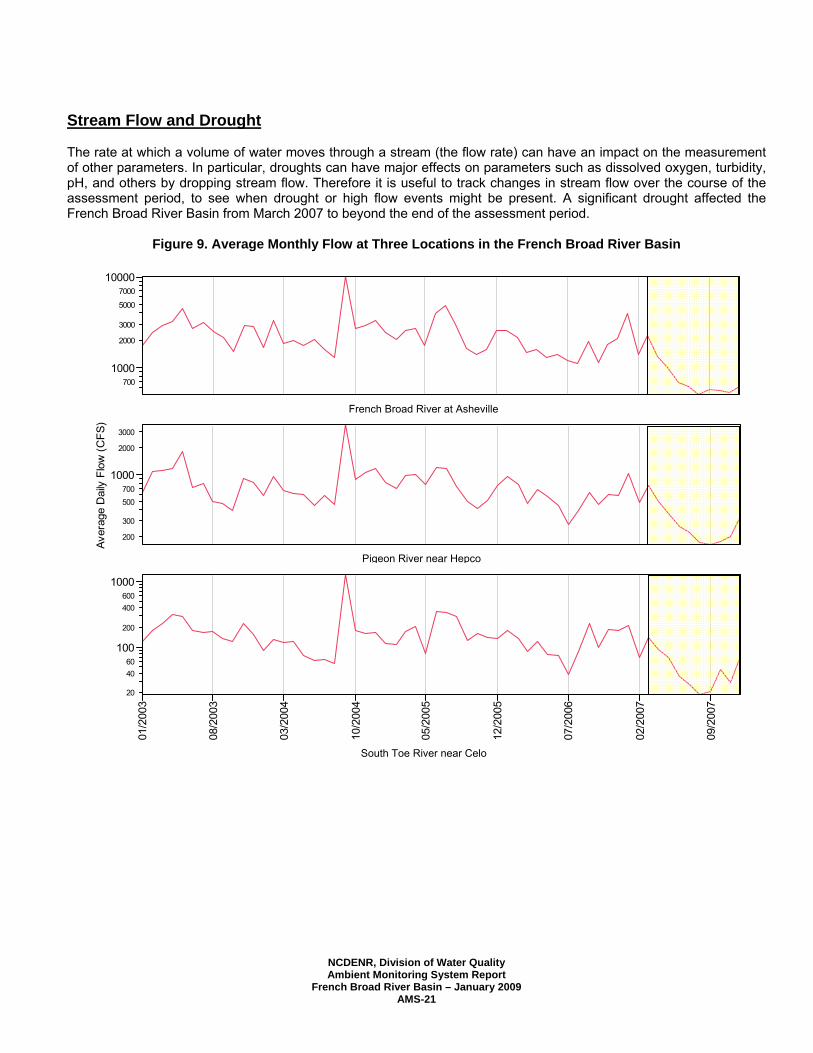
Stream Flow and Drought The rate at which a volume of water moves through a stream (the flow rate) can have an impact on the measurement of other parameters. In particular, droughts can have major effects on parameters such as dissolved oxygen, turbidity, pH, and others by dropping stream flow. Therefore it is useful to track changes in stream flow over the course of the assessment period, to see when drought or high flow events might be present. A significant drought affected the French Broad River Basin from March 2007 to beyond the end of the assessment period.
Figure 9. Average Monthly Flow at Three Locations in the French Broad River Basin
1000700
100007000
5000
3000
2000
1000700500
300
200
2000
3000
Aver
age
Dai
ly F
low
(CFS
)
1006040
20
1000600400
200
Mea
n(Fl
ow)
01/2
003
08/2
003
03/2
004
10/2
004
05/2
005
12/2
005
07/2
006
02/2
007
09/2
007
Month-year
French Broad River at Asheville
Pigeon River near Hepco
South Toe River near Celo
NCDENR, Division of Water Quality Ambient Monitoring System Report
French Broad River Basin – January 2009 AMS-22
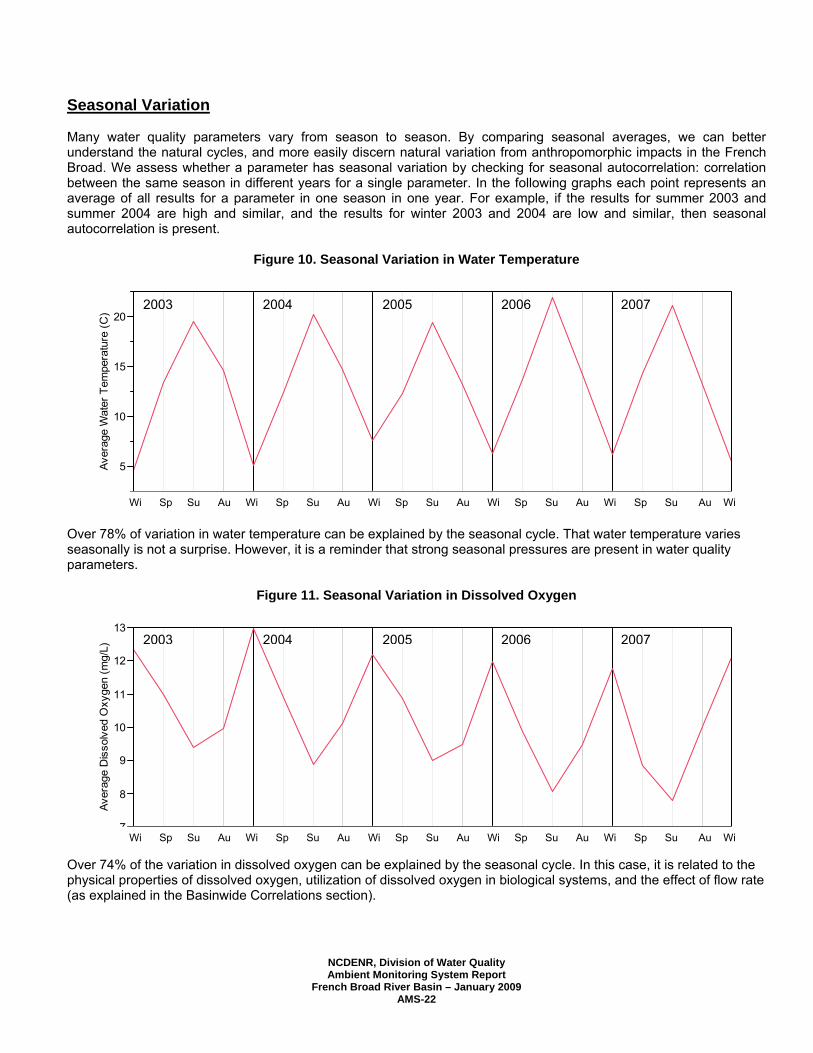
Seasonal Variation Many water quality parameters vary from season to season. By comparing seasonal averages, we can better understand the natural cycles, and more easily discern natural variation from anthropomorphic impacts in the French Broad. We assess whether a parameter has seasonal variation by checking for seasonal autocorrelation: correlation between the same season in different years for a single parameter. In the following graphs each point represents an average of all results for a parameter in one season in one year. For example, if the results for summer 2003 and summer 2004 are high and similar, and the results for winter 2003 and 2004 are low and similar, then seasonal autocorrelation is present.
Figure 10. Seasonal Variation in Water Temperature
5
10
15
20
Aver
age
Wat
er T
empe
ratu
re (C
)
4 8 12 16 20
Over 78% of variation in water temperature can be explained by the seasonal cycle. That water temperature varies seasonally is not a surprise. However, it is a reminder that strong seasonal pressures are present in water quality parameters.
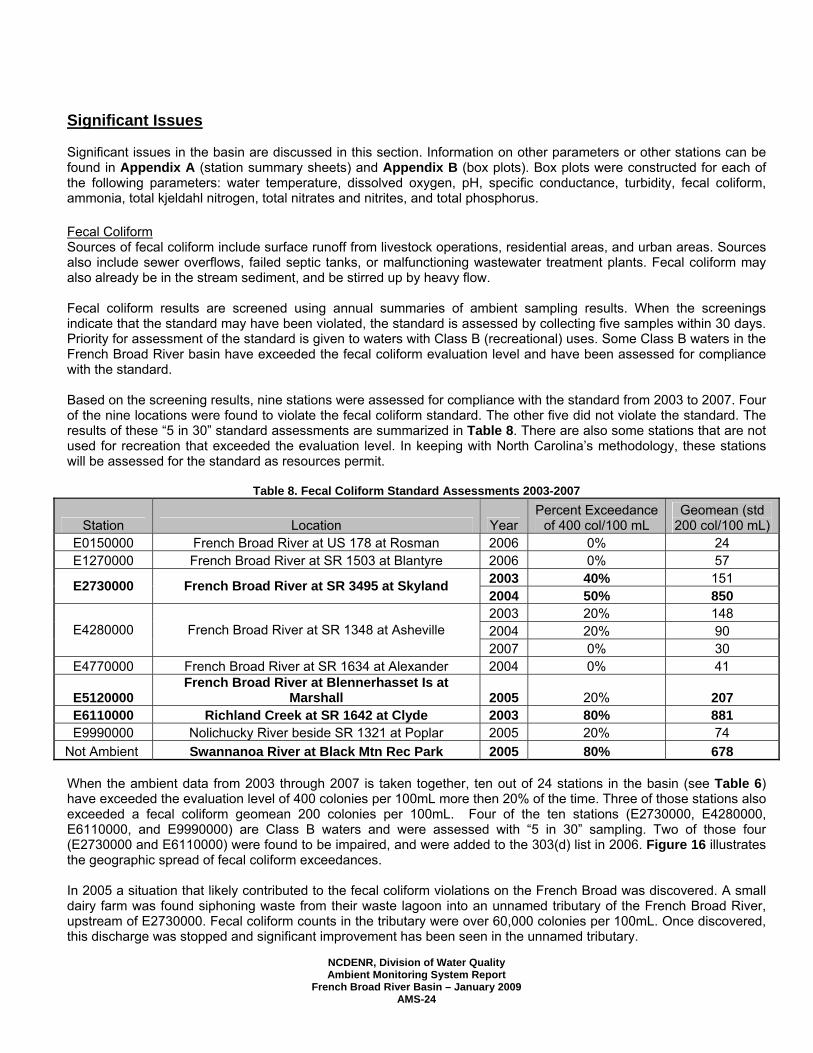
Figure 11. Seasonal Variation in Dissolved Oxygen
7
8
9
10
11
12
13
Aver
age
Dis
solv
ed O
xyge
n (m
g/L)
4 8 12 16 20
Over 74% of the variation in dissolved oxygen can be explained by the seasonal cycle. In this case, it is related to the physical properties of dissolved oxygen, utilization of dissolved oxygen in biological systems, and the effect of flow rate (as explained in the Basinwide Correlations section).
2003 2004 2005 2006 2007
Wi Sp Su Au Wi Sp Su Au Wi Sp Su Au Wi Sp Su Au Wi Sp Su Au Wi
2003 2004 2005 2006 2007
Wi Sp Su Au Wi Sp Su Au Wi Sp Su Au Wi Sp Su Au Wi Sp Su Au Wi

NCDENR, Division of Water Quality Ambient Monitoring System Report
French Broad River Basin – January 2009 AMS-23
Comparing Hydrologic Regions Comparisons between the three hydrologic unit codes (HUCs) are illustrated with box and whisker plots. For each box plot, the data for each station in the HUC is composited. For HUC locations, refer to Figure 2, and Table 4. Refer to Figure 4 and Figure 5 for a description of box and whisker plots. In the following discussion, each HUC is referred to by its last two digits, e.g. HUC 03020101 is HUC01.
Figure 12. Fecal Coliform and Turbidity By HUC
0
100
200
300
Spec
ific C
ondu
ctan
ce (u
mho
s/cm
)
06010105 06010106 06010108HUC
0
10
20
Turb
idity
(NTU
)06010105 06010106 06010108
HUC
Specific conductance in HUC 06010106 (the Pigeon River and tributaries) appears to be elevated compared to the rest of the basin. This may be caused by effluent from the Champion Paper Mill, as the elevated conductance first appears downstream of the mill effluent, and continues further downstream. If Pigeon River stations are not included in the average, the Pigeon River HUC is similar to the other HUCs. Turbidity is low throughout the basin. High turbidity can typically be caused by runoff or disturbance of stream sediments. Observe that the mean turbidity is noticeably higher then the median in each HUC. This is caused by a few large flow events that were accompanied by heavy sediment load. These events are not numerous enough to raise the median.
Figure 13. Total Inorganic Nitrogen and Total Phosphorus by HUC
00.10.20.30.40.50.60.70.80.9
11.1
Tota
l Ino
rgan
ic N
itrog
en (m
g/L)
06010105 06010106 06010108HUC
0
0.1
0.2
Tota
l Pho
spho
rus
(mg/
L)
06010105 06010106 06010108HUC
Inorganic Nitrogen and total Phosphorus are commonly correlated with population and/or livestock centers. Nitrogen and phosphorus are ingredients in fertilizer, and are also found in wastewater effluent. Therefore both agriculture, urban, and suburban areas will tend to have higher nitrogen and phosphorus concentrations then undeveloped areas. HUC 06010105 includes the Asheville area, which likely explains the higher Inorganic Nitrogen concentration there. HUC 06010108 is less developed then the other two, however there is only one station in that HUC that collected significant nutrient data during the monitoring period, so the displayed average my not be accurate for the whole HUC. These concentrations are all low when compared to other more developed portions of the state. Inorganic Nitrogen concentrations in the Charlotte area for the same time period are approximately 10 times greater then these.
NCDENR, Division of Water Quality Ambient Monitoring System Report
French Broad River Basin – January 2009 AMS-24
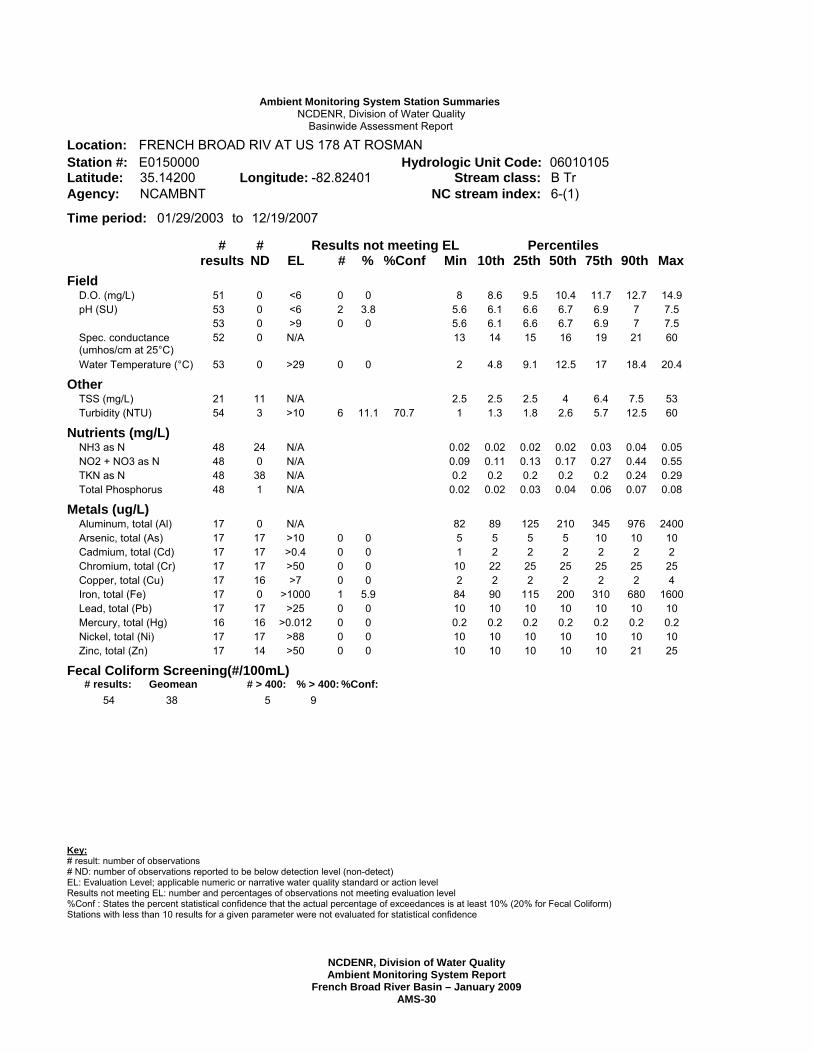
Significant Issues Significant issues in the basin are discussed in this section. Information on other parameters or other stations can be found in Appendix A (station summary sheets) and Appendix B (box plots). Box plots were constructed for each of the following parameters: water temperature, dissolved oxygen, pH, specific conductance, turbidity, fecal coliform, ammonia, total kjeldahl nitrogen, total nitrates and nitrites, and total phosphorus. Fecal Coliform Sources of fecal coliform include surface runoff from livestock operations, residential areas, and urban areas. Sources also include sewer overflows, failed septic tanks, or malfunctioning wastewater treatment plants. Fecal coliform may also already be in the stream sediment, and be stirred up by heavy flow. Fecal coliform results are screened using annual summaries of ambient sampling results. When the screenings indicate that the standard may have been violated, the standard is assessed by collecting five samples within 30 days. Priority for assessment of the standard is given to waters with Class B (recreational) uses. Some Class B waters in the French Broad River basin have exceeded the fecal coliform evaluation level and have been assessed for compliance with the standard. Based on the screening results, nine stations were assessed for compliance with the standard from 2003 to 2007. Four of the nine locations were found to violate the fecal coliform standard. The other five did not violate the standard. The results of these “5 in 30” standard assessments are summarized in Table 8. There are also some stations that are not used for recreation that exceeded the evaluation level. In keeping with North Carolina’s methodology, these stations will be assessed for the standard as resources permit.
Table 8. Fecal Coliform Standard Assessments 2003-2007
Station Location Year Percent Exceedance
of 400 col/100 mL Geomean (std
200 col/100 mL) E0150000 French Broad River at US 178 at Rosman 2006 0% 24 E1270000 French Broad River at SR 1503 at Blantyre 2006 0% 57
2003 40% 151 E2730000 French Broad River at SR 3495 at Skyland 2004 50% 850 2003 20% 148 2004 20% 90 E4280000 French Broad River at SR 1348 at Asheville 2007 0% 30
E4770000 French Broad River at SR 1634 at Alexander 2004 0% 41
E5120000 French Broad River at Blennerhasset Is at
Marshall 2005 20% 207 E6110000 Richland Creek at SR 1642 at Clyde 2003 80% 881 E9990000 Nolichucky River beside SR 1321 at Poplar 2005 20% 74
Not Ambient Swannanoa River at Black Mtn Rec Park 2005 80% 678 When the ambient data from 2003 through 2007 is taken together, ten out of 24 stations in the basin (see Table 6) have exceeded the evaluation level of 400 colonies per 100mL more then 20% of the time. Three of those stations also exceeded a fecal coliform geomean 200 colonies per 100mL. Four of the ten stations (E2730000, E4280000, E6110000, and E9990000) are Class B waters and were assessed with “5 in 30” sampling. Two of those four (E2730000 and E6110000) were found to be impaired, and were added to the 303(d) list in 2006. Figure 16 illustrates the geographic spread of fecal coliform exceedances. In 2005 a situation that likely contributed to the fecal coliform violations on the French Broad was discovered. A small dairy farm was found siphoning waste from their waste lagoon into an unnamed tributary of the French Broad River, upstream of E2730000. Fecal coliform counts in the tributary were over 60,000 colonies per 100mL. Once discovered, this discharge was stopped and significant improvement has been seen in the unnamed tributary.

NCDENR, Division of Water Quality Ambient Monitoring System Report
French Broad River Basin – January 2009 AMS-25
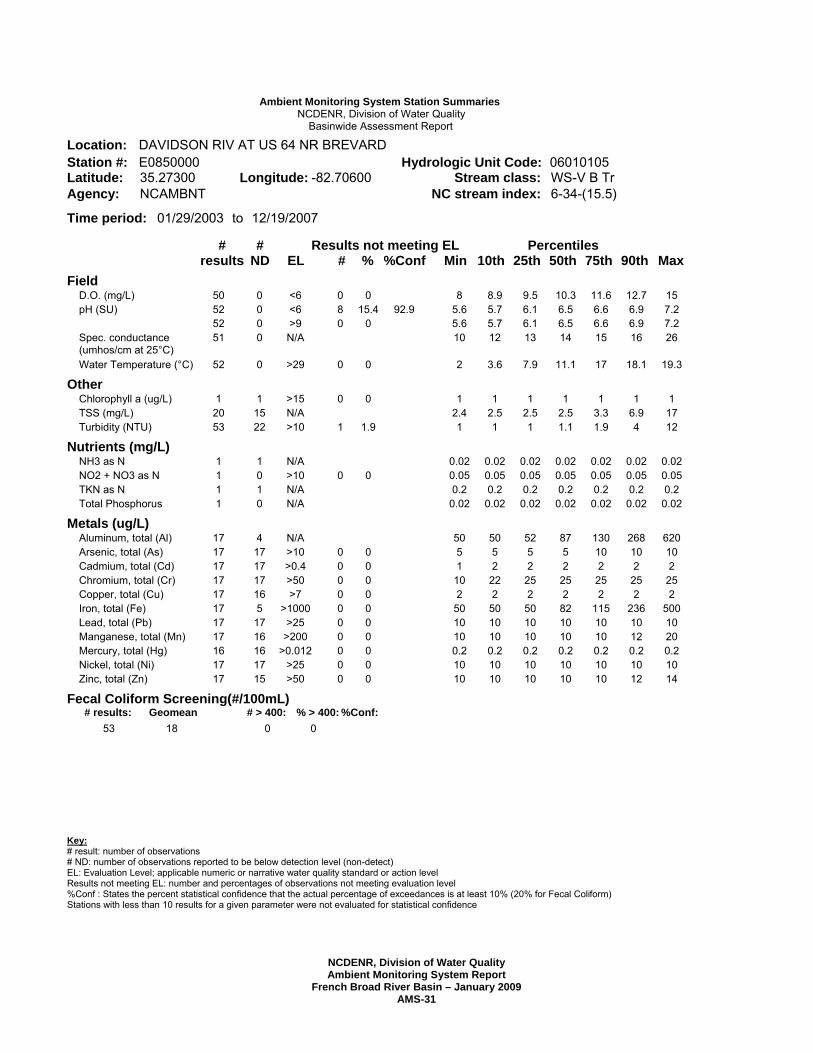
Turbidity Ten out of 24 stations in the basin (see Table 6) have exceeded the evaluation level of either 10 NTU (for trout streams) or 50 NTU (for all other waters) over the five-year time period more then 10% of the time. As stated in the Basinwide Correlation section, turbidity is correlated to stream flow. Heavy rains in developed areas where stream buffers are insufficient can result in sediment-laden water being added to the river, or in stream bottom sediments being re-suspended. In recent years residential and commercial development has increased significantly in the French Broad river basin, increasing the effect of heavy rains on stream turbidity. Figure 15 illustrates turbidity through the basin. pH Two of 24 stations in the basin (see Table 6) have exceeded the evaluation level of less than six SU over the five year time period more then 10% of the time. The stations are both located in relatively undisturbed areas. One (E6450000) is located within the boundary of the Great Smoky Mountains National Park, and the other (E0850000) is downstream of Pisgah National Forest land. One potential source of low pH is rockfalls and road construction. There are many rock formations in the Southern Appalachians that contain graphitic-sulfidic rocks that when exposed by construction activities or rockfall create acidic runoff. Figure 14 illustrates pH throughout the basin.

NCDENR, Division of Water Quality Ambient Monitoring System Report
French Broad River Basin – January 2009 AMS-26
Basinwide Assessment The following maps help to assess the basin as a whole.
Figure 14. pH in the French Broad River Basin
All the stations with exceedances are in the upper portions of the basin or in smaller tributaries, where the impact of population is less. The source of the pH violations may be related to natural conditions or agriculture.

NCDENR, Division of Water Quality Ambient Monitoring System Report
French Broad River Basin – January 2009 AMS-27
Figure 15. Turbidity in the French Broad River Basin
Every station in the basin has occasionally exceeded the turbidity standard. One episode of heavy rain is enough to cause an exceedance in areas where there are not thick vegetative buffers surrounding the rivers and streams, either by introduction of new sediment into the stream or by scouring the banks of the stream. In and downstream of urban areas, turbidity exceedances may also be due to the turbidity of wastewater treatment plant effluent, or storm sewer runoff. Many agricultural areas are lacking in vegetative buffers as well.

NCDENR, Division of Water Quality Ambient Monitoring System Report
French Broad River Basin – January 2009 AMS-28
Figure 16. Fecal Coliform in the French Broad River Basin
Areas with elevated concentrations of fecal coliform appear to be widespread throughout the basin. Some of these high concentrations may be related to wastewater treatment plants, or runoff from agricultural, suburban, or urban areas. Several of these sites are Class B waters, and have been assessed for violation of the standard, as stated in the previous section. Waters that exceed the evaluation limit but are not Class B waters will be assessed for violation of the standard as resources permit.

NCDENR, Division of Water Quality Ambient Monitoring System Report
French Broad River Basin – January 2009 AMS-29
Appendix A: Station Summary Sheets
NCDENR, Division of Water Quality Ambient Monitoring System Report
French Broad River Basin – January 2009 AMS-30
Ambient Monitoring System Station Summaries NCDENR, Division of Water Quality Basinwide Assessment Report Location: FRENCH BROAD RIV AT US 178 AT ROSMAN Station #: E0150000 Hydrologic Unit Code: 06010105 Latitude: 35.14200 Longitude: -82.82401 Stream class: B Tr Agency: NCAMBNT NC stream index: 6-(1) Time period: 01/29/2003 to 12/19/2007 # # Results not meeting EL Percentiles results ND EL # % %Conf Min 10th 25th 50th 75th 90th Max Field D.O. (mg/L) 51 0 <6 0 0 8 8.6 9.5 10.4 11.7 12.7 14.9 pH (SU) 53 0 <6 2 3.8 5.6 6.1 6.6 6.7 6.9 7 7.5 53 0 >9 0 0 5.6 6.1 6.6 6.7 6.9 7 7.5 Spec. conductance 52 0 N/A 13 14 15 16 19 21 60 (umhos/cm at 25°C) Water Temperature (°C) 53 0 >29 0 0 2 4.8 9.1 12.5 17 18.4 20.4 Other TSS (mg/L) 21 11 N/A 2.5 2.5 2.5 4 6.4 7.5 53 Turbidity (NTU) 54 3 >10 6 11.1 70.7 1 1.3 1.8 2.6 5.7 12.5 60 Nutrients (mg/L) NH3 as N 48 24 N/A 0.02 0.02 0.02 0.02 0.03 0.04 0.05 NO2 + NO3 as N 48 0 N/A 0.09 0.11 0.13 0.17 0.27 0.44 0.55 TKN as N 48 38 N/A 0.2 0.2 0.2 0.2 0.2 0.24 0.29 Total Phosphorus 48 1 N/A 0.02 0.02 0.03 0.04 0.06 0.07 0.08 Metals (ug/L) Aluminum, total (Al) 17 0 N/A 82 89 125 210 345 976 2400 Arsenic, total (As) 17 17 >10 0 0 5 5 5 5 10 10 10 Cadmium, total (Cd) 17 17 >0.4 0 0 1 2 2 2 2 2 2 Chromium, total (Cr) 17 17 >50 0 0 10 22 25 25 25 25 25 Copper, total (Cu) 17 16 >7 0 0 2 2 2 2 2 2 4 Iron, total (Fe) 17 0 >1000 1 5.9 84 90 115 200 310 680 1600 Lead, total (Pb) 17 17 >25 0 0 10 10 10 10 10 10 10 Mercury, total (Hg) 16 16 >0.012 0 0 0.2 0.2 0.2 0.2 0.2 0.2 0.2 Nickel, total (Ni) 17 17 >88 0 0 10 10 10 10 10 10 10 Zinc, total (Zn) 17 14 >50 0 0 10 10 10 10 10 21 25 Fecal Coliform Screening(#/100mL) # results: Geomean # > 400: % > 400: %Conf: 54 38 5 9
Key: # result: number of observations # ND: number of observations reported to be below detection level (non-detect) EL: Evaluation Level; applicable numeric or narrative water quality standard or action level Results not meeting EL: number and percentages of observations not meeting evaluation level %Conf : States the percent statistical confidence that the actual percentage of exceedances is at least 10% (20% for Fecal Coliform) Stations with less than 10 results for a given parameter were not evaluated for statistical confidence
NCDENR, Division of Water Quality Ambient Monitoring System Report
French Broad River Basin – January 2009 AMS-31
Ambient Monitoring System Station Summaries NCDENR, Division of Water Quality Basinwide Assessment Report Location: DAVIDSON RIV AT US 64 NR BREVARD Station #: E0850000 Hydrologic Unit Code: 06010105 Latitude: 35.27300 Longitude: -82.70600 Stream class: WS-V B Tr Agency: NCAMBNT NC stream index: 6-34-(15.5) Time period: 01/29/2003 to 12/19/2007 # # Results not meeting EL Percentiles results ND EL # % %Conf Min 10th 25th 50th 75th 90th Max Field D.O. (mg/L) 50 0 <6 0 0 8 8.9 9.5 10.3 11.6 12.7 15 pH (SU) 52 0 <6 8 15.4 92.9 5.6 5.7 6.1 6.5 6.6 6.9 7.2 52 0 >9 0 0 5.6 5.7 6.1 6.5 6.6 6.9 7.2 Spec. conductance 51 0 N/A 10 12 13 14 15 16 26 (umhos/cm at 25°C) Water Temperature (°C) 52 0 >29 0 0 2 3.6 7.9 11.1 17 18.1 19.3 Other Chlorophyll a (ug/L) 1 1 >15 0 0 1 1 1 1 1 1 1 TSS (mg/L) 20 15 N/A 2.4 2.5 2.5 2.5 3.3 6.9 17 Turbidity (NTU) 53 22 >10 1 1.9 1 1 1 1.1 1.9 4 12 Nutrients (mg/L) NH3 as N 1 1 N/A 0.02 0.02 0.02 0.02 0.02 0.02 0.02 NO2 + NO3 as N 1 0 >10 0 0 0.05 0.05 0.05 0.05 0.05 0.05 0.05 TKN as N 1 1 N/A 0.2 0.2 0.2 0.2 0.2 0.2 0.2 Total Phosphorus 1 0 N/A 0.02 0.02 0.02 0.02 0.02 0.02 0.02 Metals (ug/L) Aluminum, total (Al) 17 4 N/A 50 50 52 87 130 268 620 Arsenic, total (As) 17 17 >10 0 0 5 5 5 5 10 10 10 Cadmium, total (Cd) 17 17 >0.4 0 0 1 2 2 2 2 2 2 Chromium, total (Cr) 17 17 >50 0 0 10 22 25 25 25 25 25 Copper, total (Cu) 17 16 >7 0 0 2 2 2 2 2 2 2 Iron, total (Fe) 17 5 >1000 0 0 50 50 50 82 115 236 500 Lead, total (Pb) 17 17 >25 0 0 10 10 10 10 10 10 10 Manganese, total (Mn) 17 16 >200 0 0 10 10 10 10 10 12 20 Mercury, total (Hg) 16 16 >0.012 0 0 0.2 0.2 0.2 0.2 0.2 0.2 0.2 Nickel, total (Ni) 17 17 >25 0 0 10 10 10 10 10 10 10 Zinc, total (Zn) 17 15 >50 0 0 10 10 10 10 10 12 14 Fecal Coliform Screening(#/100mL) # results: Geomean # > 400: % > 400: %Conf: 53 18 0 0
Key: # result: number of observations # ND: number of observations reported to be below detection level (non-detect) EL: Evaluation Level; applicable numeric or narrative water quality standard or action level Results not meeting EL: number and percentages of observations not meeting evaluation level %Conf : States the percent statistical confidence that the actual percentage of exceedances is at least 10% (20% for Fecal Coliform) Stations with less than 10 results for a given parameter were not evaluated for statistical confidence

NCDENR, Division of Water Quality Ambient Monitoring System Report
French Broad River Basin – January 2009 AMS-32
Ambient Monitoring System Station Summaries NCDENR, Division of Water Quality Basinwide Assessment Report Location: LITTLE RIV UPS HIGH FALLS AT DUPONT PLANT NR CEDAR MOUNTAIN Station #: E1130000 Hydrologic Unit Code: 06010105 Latitude: 35.19238 Longitude: -82.61308 Stream class: C Tr Agency: NCAMBNT NC stream index: 6-38-(1) Time period: 01/29/2003 to 12/05/2006 # # Results not meeting EL Percentiles results ND EL # % %Conf Min 10th 25th 50th 75th 90th Max Field D.O. (mg/L) 45 0 <6 0 0 7.1 8 8.8 9.8 10.8 11.6 14.2 pH (SU) 46 0 <6 2 4.3 5.6 6.1 6.3 6.5 6.7 7 7.5 46 0 >9 0 0 5.6 6.1 6.3 6.5 6.7 7 7.5 Spec. conductance 46 0 N/A 13 14 15 16 18 18 25 (umhos/cm at 25°C) Water Temperature (°C) 46 0 >29 0 0 3 5.6 10 13.2 19 20 21.5 Other TSS (mg/L) 17 10 N/A 2.4 2.5 2.5 2.5 4.7 8 13 Turbidity (NTU) 46 0 >10 1 2.2 1.1 1.2 1.4 1.7 3.1 6.6 16 Nutrients (mg/L) NH3 as N 1 1 N/A 0.02 0.02 0.02 0.02 0.02 0.02 0.02 NO2 + NO3 as N 1 0 N/A 0.03 0.03 0.03 0.03 0.03 0.03 0.03 TKN as N 1 1 N/A 0.2 0.2 0.2 0.2 0.2 0.2 0.2 Total Phosphorus 1 0 N/A 0.02 0.02 0.02 0.02 0.02 0.02 0.02 Metals (ug/L) Aluminum, total (Al) 16 0 N/A 54 68 76 104 210 559 790 Arsenic, total (As) 16 16 >10 0 0 5 5 5 5 10 10 10 Cadmium, total (Cd) 16 16 >0.4 0 0 2 2 2 2 2 2 2 Chromium, total (Cr) 16 16 >50 0 0 25 25 25 25 25 25 25 Copper, total (Cu) 16 15 >7 0 0 2 2 2 2 2 2 2 Iron, total (Fe) 16 0 >1000 0 0 180 201 220 280 352 518 630 Lead, total (Pb) 16 16 >25 0 0 10 10 10 10 10 10 10 Mercury, total (Hg) 16 16 >0.012 0 0 0.2 0.2 0.2 0.2 0.2 0.2 0.2 Nickel, total (Ni) 16 16 >88 0 0 10 10 10 10 10 10 10 Zinc, total (Zn) 16 13 >50 0 0 10 10 10 10 10 35 50 Fecal Coliform Screening(#/100mL) # results: Geomean # > 400: % > 400: %Conf: 46 35 0 0
Key: # result: number of observations # ND: number of observations reported to be below detection level (non-detect) EL: Evaluation Level; applicable numeric or narrative water quality standard or action level Results not meeting EL: number and percentages of observations not meeting evaluation level %Conf : States the percent statistical confidence that the actual percentage of exceedances is at least 10% (20% for Fecal Coliform) Stations with less than 10 results for a given parameter were not evaluated for statistical confidence

NCDENR, Division of Water Quality Ambient Monitoring System Report
French Broad River Basin – January 2009 AMS-33
Ambient Monitoring System Station Summaries NCDENR, Division of Water Quality Basinwide Assessment Report Location: FRENCH BROAD RIV AT SR 1503 AT BLANTYRE Station #: E1270000 Hydrologic Unit Code: 06010105 Latitude: 35.29898 Longitude: -82.62364 Stream class: B Agency: NCAMBNT NC stream index: 6-(27) Time period: 01/29/2003 to 12/06/2007 # # Results not meeting EL Percentiles results ND EL # % %Conf Min 10th 25th 50th 75th 90th Max Field D.O. (mg/L) 51 0 <4 0 0 6.7 7.5 8.5 9.6 10.8 11.9 14.5 51 0 <5 0 0 6.7 7.5 8.5 9.6 10.8 11.9 14.5 pH (SU) 53 0 <6 2 3.8 5.8 6.2 6.4 6.5 6.7 6.9 10.6 53 0 >9 1 1.9 5.8 6.2 6.4 6.5 6.7 6.9 10.6 Spec. conductance 52 0 N/A 16 20 21 24 27 28 31 (umhos/cm at 25°C) Water Temperature (°C) 53 0 >29 0 0 4 5.1 9.8 13.4 19 21 22.1 Other TSS (mg/L) 21 4 N/A 2.5 2.8 5 8.4 16.5 31.4 50 Turbidity (NTU) 54 0 >50 1 1.9 1.6 2.5 3.1 4.8 12.2 27 60 Nutrients (mg/L) NH3 as N 1 0 N/A 0.07 0.07 0.07 0.07 0.07 0.07 0.07 NO2 + NO3 as N 1 0 N/A 0.16 0.16 0.16 0.16 0.16 0.16 0.16 TKN as N 1 1 N/A 0.2 0.2 0.2 0.2 0.2 0.2 0.2 Total Phosphorus 1 0 N/A 0.03 0.03 0.03 0.03 0.03 0.03 0.03 Metals (ug/L) Aluminum, total (Al) 17 0 N/A 110 142 230 310 995 2020 2100 Arsenic, total (As) 17 17 >10 0 0 5 5 5 5 10 10 10 Cadmium, total (Cd) 17 17 >2 0 0 1 2 2 2 2 2 2 Chromium, total (Cr) 17 17 >50 0 0 10 22 25 25 25 25 25 Copper, total (Cu) 17 15 >7 0 0 2 2 2 2 2 3 4 Iron, total (Fe) 17 0 >1000 3 17.6 91.7 200 224 265 410 855 1520 1600 Lead, total (Pb) 17 17 >25 0 0 10 10 10 10 10 10 10 Mercury, total (Hg) 16 16 >0.012 0 0 0.2 0.2 0.2 0.2 0.2 0.2 0.2 Nickel, total (Ni) 17 17 >88 0 0 10 10 10 10 10 10 10 Zinc, total (Zn) 17 11 >50 0 0 10 10 10 10 14 18 23 Fecal Coliform Screening(#/100mL) # results: Geomean # > 400: % > 400: %Conf: 54 82 6 11
Key: # result: number of observations # ND: number of observations reported to be below detection level (non-detect) EL: Evaluation Level; applicable numeric or narrative water quality standard or action level Results not meeting EL: number and percentages of observations not meeting evaluation level %Conf : States the percent statistical confidence that the actual percentage of exceedances is at least 10% (20% for Fecal Coliform) Stations with less than 10 results for a given parameter were not evaluated for statistical confidence

NCDENR, Division of Water Quality Ambient Monitoring System Report
French Broad River Basin – January 2009 AMS-34
Ambient Monitoring System Station Summaries NCDENR, Division of Water Quality Basinwide Assessment Report Location: MILLS RIV AT END OF SR 1337 NR MILLS RIVER Station #: E1490000 Hydrologic Unit Code: 06010105 Latitude: 35.39900 Longitude: -82.59600 Stream class: WS-II Tr HQW Agency: NCAMBNT NC stream index: 6-54-(1) Time period: 01/15/2003 to 12/06/2007 # # Results not meeting EL Percentiles results ND EL # % %Conf Min 10th 25th 50th 75th 90th Max Field D.O. (mg/L) 50 0 <6 0 0 7.5 8.6 9.4 10.8 12 13.1 13.8 pH (SU) 50 0 <6 1 2 5.7 6.1 6.5 6.6 6.8 6.9 7.2 50 0 >9 0 0 5.7 6.1 6.5 6.6 6.8 6.9 7.2 Spec. conductance 47 0 N/A 12 13 14 15 16 17 21 (umhos/cm at 25°C) 1 1 N/A 15 15 15 15 15 15 15 Water Temperature (°C) 50 0 >29 0 0 2 4.1 7 14 17 19 22.7 Other TSS (mg/L) 20 15 N/A 2.3 2.3 2.5 2.5 4.9 11.4 38 Turbidity (NTU) 51 7 >10 3 5.9 0.8 1 1.1 1.9 3.3 6.9 45 Nutrients (mg/L) NH3 as N 46 43 N/A 0.02 0.02 0.02 0.02 0.02 0.02 0.05 NO2 + NO3 as N 46 1 >10 0 0 0.02 0.04 0.06 0.07 0.09 0.12 0.55 TKN as N 46 41 N/A 0.2 0.2 0.2 0.2 0.2 0.2 0.34 Total Phosphorus 46 21 N/A 0.02 0.02 0.02 0.02 0.02 0.05 0.2 Metals (ug/L) Aluminum, total (Al) 18 3 N/A 50 50 59 84 158 567 1800 Arsenic, total (As) 18 18 >10 0 0 5 5 5 5 10 10 10 Cadmium, total (Cd) 18 18 >0.4 0 0 1 1 2 2 2 2 2 Chromium, total (Cr) 18 18 >50 0 0 10 10 25 25 25 25 25 Copper, total (Cu) 18 16 >7 0 0 2 2 2 2 2 2 2 Iron, total (Fe) 18 0 >1000 1 5.6 53 61 71 110 192 537 1500 Lead, total (Pb) 18 18 >25 0 0 10 10 10 10 10 10 10 Manganese, total (Mn) 18 12 >200 0 0 10 10 10 10 11 27 120 Mercury, total (Hg) 16 16 >0.012 0 0 0.2 0.2 0.2 0.2 0.2 0.2 0.2 Nickel, total (Ni) 18 18 >25 0 0 10 10 10 10 10 10 10 Zinc, total (Zn) 18 18 >50 0 0 10 10 10 10 10 10 10 Fecal Coliform Screening(#/100mL) # results: Geomean # > 400: % > 400: %Conf: 51 64 5 10
Key: # result: number of observations # ND: number of observations reported to be below detection level (non-detect) EL: Evaluation Level; applicable numeric or narrative water quality standard or action level Results not meeting EL: number and percentages of observations not meeting evaluation level %Conf : States the percent statistical confidence that the actual percentage of exceedances is at least 10% (20% for Fecal Coliform) Stations with less than 10 results for a given parameter were not evaluated for statistical confidence
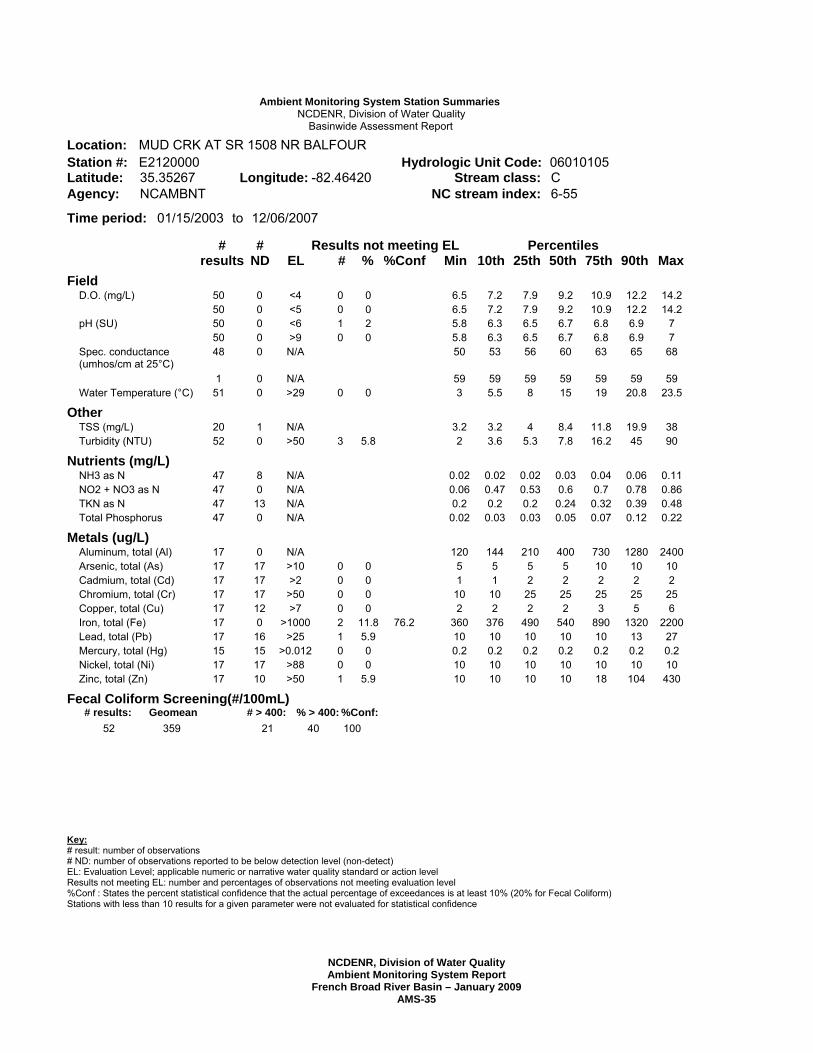
NCDENR, Division of Water Quality Ambient Monitoring System Report
French Broad River Basin – January 2009 AMS-35
Ambient Monitoring System Station Summaries NCDENR, Division of Water Quality Basinwide Assessment Report Location: MUD CRK AT SR 1508 NR BALFOUR Station #: E2120000 Hydrologic Unit Code: 06010105 Latitude: 35.35267 Longitude: -82.46420 Stream class: C Agency: NCAMBNT NC stream index: 6-55 Time period: 01/15/2003 to 12/06/2007 # # Results not meeting EL Percentiles results ND EL # % %Conf Min 10th 25th 50th 75th 90th Max Field D.O. (mg/L) 50 0 <4 0 0 6.5 7.2 7.9 9.2 10.9 12.2 14.2 50 0 <5 0 0 6.5 7.2 7.9 9.2 10.9 12.2 14.2 pH (SU) 50 0 <6 1 2 5.8 6.3 6.5 6.7 6.8 6.9 7 50 0 >9 0 0 5.8 6.3 6.5 6.7 6.8 6.9 7 Spec. conductance 48 0 N/A 50 53 56 60 63 65 68 (umhos/cm at 25°C) 1 0 N/A 59 59 59 59 59 59 59 Water Temperature (°C) 51 0 >29 0 0 3 5.5 8 15 19 20.8 23.5 Other TSS (mg/L) 20 1 N/A 3.2 3.2 4 8.4 11.8 19.9 38 Turbidity (NTU) 52 0 >50 3 5.8 2 3.6 5.3 7.8 16.2 45 90 Nutrients (mg/L) NH3 as N 47 8 N/A 0.02 0.02 0.02 0.03 0.04 0.06 0.11 NO2 + NO3 as N 47 0 N/A 0.06 0.47 0.53 0.6 0.7 0.78 0.86 TKN as N 47 13 N/A 0.2 0.2 0.2 0.24 0.32 0.39 0.48 Total Phosphorus 47 0 N/A 0.02 0.03 0.03 0.05 0.07 0.12 0.22 Metals (ug/L) Aluminum, total (Al) 17 0 N/A 120 144 210 400 730 1280 2400 Arsenic, total (As) 17 17 >10 0 0 5 5 5 5 10 10 10 Cadmium, total (Cd) 17 17 >2 0 0 1 1 2 2 2 2 2 Chromium, total (Cr) 17 17 >50 0 0 10 10 25 25 25 25 25 Copper, total (Cu) 17 12 >7 0 0 2 2 2 2 3 5 6 Iron, total (Fe) 17 0 >1000 2 11.8 76.2 360 376 490 540 890 1320 2200 Lead, total (Pb) 17 16 >25 1 5.9 10 10 10 10 10 13 27 Mercury, total (Hg) 15 15 >0.012 0 0 0.2 0.2 0.2 0.2 0.2 0.2 0.2 Nickel, total (Ni) 17 17 >88 0 0 10 10 10 10 10 10 10 Zinc, total (Zn) 17 10 >50 1 5.9 10 10 10 10 18 104 430 Fecal Coliform Screening(#/100mL) # results: Geomean # > 400: % > 400: %Conf: 52 359 21 40 100
Key: # result: number of observations # ND: number of observations reported to be below detection level (non-detect) EL: Evaluation Level; applicable numeric or narrative water quality standard or action level Results not meeting EL: number and percentages of observations not meeting evaluation level %Conf : States the percent statistical confidence that the actual percentage of exceedances is at least 10% (20% for Fecal Coliform) Stations with less than 10 results for a given parameter were not evaluated for statistical confidence
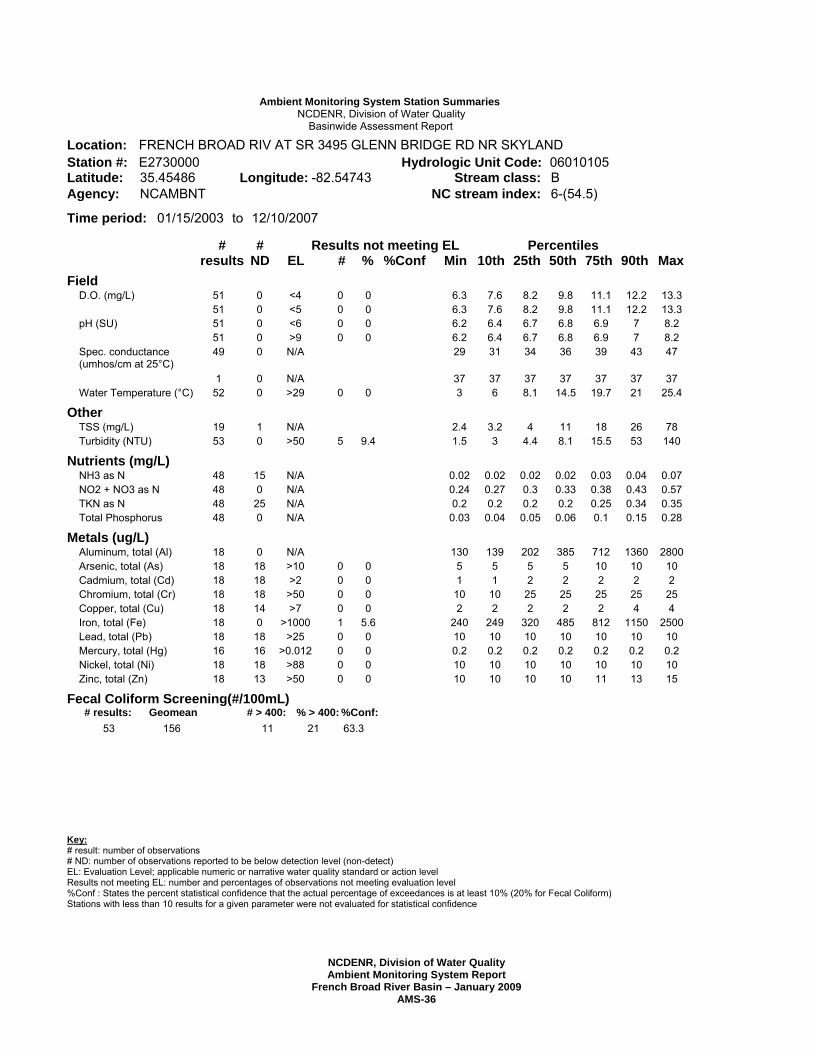
NCDENR, Division of Water Quality Ambient Monitoring System Report
French Broad River Basin – January 2009 AMS-36
Ambient Monitoring System Station Summaries NCDENR, Division of Water Quality Basinwide Assessment Report Location: FRENCH BROAD RIV AT SR 3495 GLENN BRIDGE RD NR SKYLAND Station #: E2730000 Hydrologic Unit Code: 06010105 Latitude: 35.45486 Longitude: -82.54743 Stream class: B Agency: NCAMBNT NC stream index: 6-(54.5) Time period: 01/15/2003 to 12/10/2007 # # Results not meeting EL Percentiles results ND EL # % %Conf Min 10th 25th 50th 75th 90th Max Field D.O. (mg/L) 51 0 <4 0 0 6.3 7.6 8.2 9.8 11.1 12.2 13.3 51 0 <5 0 0 6.3 7.6 8.2 9.8 11.1 12.2 13.3 pH (SU) 51 0 <6 0 0 6.2 6.4 6.7 6.8 6.9 7 8.2 51 0 >9 0 0 6.2 6.4 6.7 6.8 6.9 7 8.2 Spec. conductance 49 0 N/A 29 31 34 36 39 43 47 (umhos/cm at 25°C) 1 0 N/A 37 37 37 37 37 37 37 Water Temperature (°C) 52 0 >29 0 0 3 6 8.1 14.5 19.7 21 25.4 Other TSS (mg/L) 19 1 N/A 2.4 3.2 4 11 18 26 78 Turbidity (NTU) 53 0 >50 5 9.4 1.5 3 4.4 8.1 15.5 53 140 Nutrients (mg/L) NH3 as N 48 15 N/A 0.02 0.02 0.02 0.02 0.03 0.04 0.07 NO2 + NO3 as N 48 0 N/A 0.24 0.27 0.3 0.33 0.38 0.43 0.57 TKN as N 48 25 N/A 0.2 0.2 0.2 0.2 0.25 0.34 0.35 Total Phosphorus 48 0 N/A 0.03 0.04 0.05 0.06 0.1 0.15 0.28 Metals (ug/L) Aluminum, total (Al) 18 0 N/A 130 139 202 385 712 1360 2800 Arsenic, total (As) 18 18 >10 0 0 5 5 5 5 10 10 10 Cadmium, total (Cd) 18 18 >2 0 0 1 1 2 2 2 2 2 Chromium, total (Cr) 18 18 >50 0 0 10 10 25 25 25 25 25 Copper, total (Cu) 18 14 >7 0 0 2 2 2 2 2 4 4 Iron, total (Fe) 18 0 >1000 1 5.6 240 249 320 485 812 1150 2500 Lead, total (Pb) 18 18 >25 0 0 10 10 10 10 10 10 10 Mercury, total (Hg) 16 16 >0.012 0 0 0.2 0.2 0.2 0.2 0.2 0.2 0.2 Nickel, total (Ni) 18 18 >88 0 0 10 10 10 10 10 10 10 Zinc, total (Zn) 18 13 >50 0 0 10 10 10 10 11 13 15 Fecal Coliform Screening(#/100mL) # results: Geomean # > 400: % > 400: %Conf: 53 156 11 21 63.3
Key: # result: number of observations # ND: number of observations reported to be below detection level (non-detect) EL: Evaluation Level; applicable numeric or narrative water quality standard or action level Results not meeting EL: number and percentages of observations not meeting evaluation level %Conf : States the percent statistical confidence that the actual percentage of exceedances is at least 10% (20% for Fecal Coliform) Stations with less than 10 results for a given parameter were not evaluated for statistical confidence
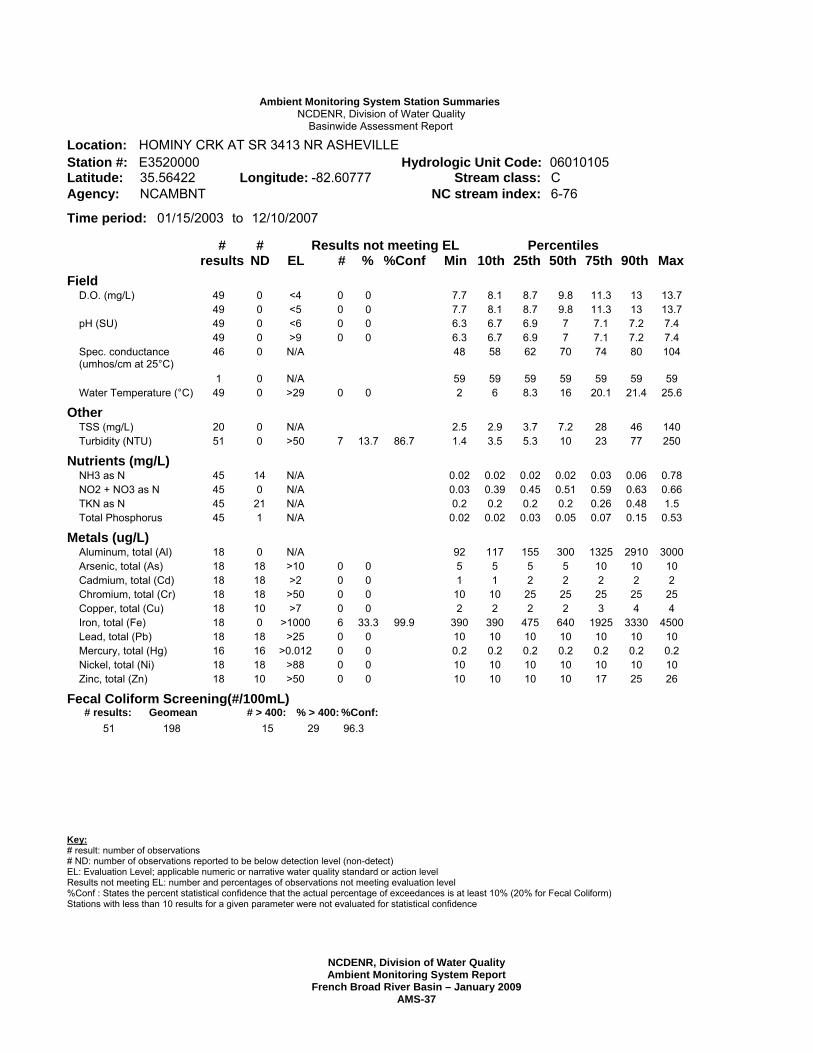
NCDENR, Division of Water Quality Ambient Monitoring System Report
French Broad River Basin – January 2009 AMS-37
Ambient Monitoring System Station Summaries NCDENR, Division of Water Quality Basinwide Assessment Report Location: HOMINY CRK AT SR 3413 NR ASHEVILLE Station #: E3520000 Hydrologic Unit Code: 06010105 Latitude: 35.56422 Longitude: -82.60777 Stream class: C Agency: NCAMBNT NC stream index: 6-76 Time period: 01/15/2003 to 12/10/2007 # # Results not meeting EL Percentiles results ND EL # % %Conf Min 10th 25th 50th 75th 90th Max Field D.O. (mg/L) 49 0 <4 0 0 7.7 8.1 8.7 9.8 11.3 13 13.7 49 0 <5 0 0 7.7 8.1 8.7 9.8 11.3 13 13.7 pH (SU) 49 0 <6 0 0 6.3 6.7 6.9 7 7.1 7.2 7.4 49 0 >9 0 0 6.3 6.7 6.9 7 7.1 7.2 7.4 Spec. conductance 46 0 N/A 48 58 62 70 74 80 104 (umhos/cm at 25°C) 1 0 N/A 59 59 59 59 59 59 59 Water Temperature (°C) 49 0 >29 0 0 2 6 8.3 16 20.1 21.4 25.6 Other TSS (mg/L) 20 0 N/A 2.5 2.9 3.7 7.2 28 46 140 Turbidity (NTU) 51 0 >50 7 13.7 86.7 1.4 3.5 5.3 10 23 77 250 Nutrients (mg/L) NH3 as N 45 14 N/A 0.02 0.02 0.02 0.02 0.03 0.06 0.78 NO2 + NO3 as N 45 0 N/A 0.03 0.39 0.45 0.51 0.59 0.63 0.66 TKN as N 45 21 N/A 0.2 0.2 0.2 0.2 0.26 0.48 1.5 Total Phosphorus 45 1 N/A 0.02 0.02 0.03 0.05 0.07 0.15 0.53 Metals (ug/L) Aluminum, total (Al) 18 0 N/A 92 117 155 300 1325 2910 3000 Arsenic, total (As) 18 18 >10 0 0 5 5 5 5 10 10 10 Cadmium, total (Cd) 18 18 >2 0 0 1 1 2 2 2 2 2 Chromium, total (Cr) 18 18 >50 0 0 10 10 25 25 25 25 25 Copper, total (Cu) 18 10 >7 0 0 2 2 2 2 3 4 4 Iron, total (Fe) 18 0 >1000 6 33.3 99.9 390 390 475 640 1925 3330 4500 Lead, total (Pb) 18 18 >25 0 0 10 10 10 10 10 10 10 Mercury, total (Hg) 16 16 >0.012 0 0 0.2 0.2 0.2 0.2 0.2 0.2 0.2 Nickel, total (Ni) 18 18 >88 0 0 10 10 10 10 10 10 10 Zinc, total (Zn) 18 10 >50 0 0 10 10 10 10 17 25 26 Fecal Coliform Screening(#/100mL) # results: Geomean # > 400: % > 400: %Conf: 51 198 15 29 96.3
Key: # result: number of observations # ND: number of observations reported to be below detection level (non-detect) EL: Evaluation Level; applicable numeric or narrative water quality standard or action level Results not meeting EL: number and percentages of observations not meeting evaluation level %Conf : States the percent statistical confidence that the actual percentage of exceedances is at least 10% (20% for Fecal Coliform) Stations with less than 10 results for a given parameter were not evaluated for statistical confidence

NCDENR, Division of Water Quality Ambient Monitoring System Report
French Broad River Basin – January 2009 AMS-38
Ambient Monitoring System Station Summaries NCDENR, Division of Water Quality Basinwide Assessment Report Location: SWANNANOA RIV AT US 25 BILTMORE AVE AT ASHEVILLE Station #: E4170000 Hydrologic Unit Code: 06010105 Latitude: 35.56872 Longitude: -82.54434 Stream class: C Agency: NCAMBNT NC stream index: 6-78 Time period: 01/15/2003 to 11/15/2007 # # Results not meeting EL Percentiles results ND EL # % %Conf Min 10th 25th 50th 75th 90th Max Field D.O. (mg/L) 46 0 <4 0 0 7.2 8.1 8.5 10.1 11.3 12.6 14.3 46 0 <5 0 0 7.2 8.1 8.5 10.1 11.3 12.6 14.3 pH (SU) 47 0 <6 0 0 6.1 6.6 6.8 7 7.2 7.3 7.5 47 0 >9 0 0 6.1 6.6 6.8 7 7.2 7.3 7.5 Spec. conductance 44 0 N/A 37 45 51 58 65 78 100 (umhos/cm at 25°C) 1 0 N/A 49 49 49 49 49 49 49 Water Temperature (°C) 47 0 >29 0 0 2 6.2 8.3 16 20.5 22 26.2 Other TSS (mg/L) 20 5 N/A 2.3 2.4 2.5 6.2 14.5 75.3 100 Turbidity (NTU) 49 0 >50 6 12.2 78.5 1.3 1.8 3.2 5.7 12 55 130 Metals (ug/L) Aluminum, total (Al) 18 1 N/A 50 63 78 170 588 2300 2300 Arsenic, total (As) 18 18 >10 0 0 5 5 5 5 10 10 10 Cadmium, total (Cd) 18 18 >2 0 0 1 1 2 2 2 2 2 Chromium, total (Cr) 18 18 >50 0 0 10 10 25 25 25 25 25 Copper, total (Cu) 18 13 >7 1 5.6 2 2 2 2 2 5 11 Iron, total (Fe) 18 0 >1000 4 22.2 97.2 260 305 390 520 1068 3930 4200 Lead, total (Pb) 18 18 >25 0 0 10 10 10 10 10 10 10 Mercury, total (Hg) 16 16 >0.012 0 0 0.2 0.2 0.2 0.2 0.2 0.2 0.2 Nickel, total (Ni) 18 18 >88 0 0 10 10 10 10 10 10 10 Zinc, total (Zn) 18 9 >50 1 5.6 10 10 10 10 19 31 64 Fecal Coliform Screening(#/100mL) # results: Geomean # > 400: % > 400: %Conf: 49 187 13 27 90.3
Key: # result: number of observations # ND: number of observations reported to be below detection level (non-detect) EL: Evaluation Level; applicable numeric or narrative water quality standard or action level Results not meeting EL: number and percentages of observations not meeting evaluation level %Conf : States the percent statistical confidence that the actual percentage of exceedances is at least 10% (20% for Fecal Coliform) Stations with less than 10 results for a given parameter were not evaluated for statistical confidence

NCDENR, Division of Water Quality Ambient Monitoring System Report
French Broad River Basin – January 2009 AMS-39
Ambient Monitoring System Station Summaries NCDENR, Division of Water Quality Basinwide Assessment Report Location: FRENCH BROAD RIV AT SR 1348 AT ASHEVILLE X REF E3420000 Station #: E4280000 Hydrologic Unit Code: 06010105 Latitude: 35.60943 Longitude: -82.57841 Stream class: B Agency: NCAMBNT NC stream index: 6-(54.5) Time period: 01/15/2003 to 12/17/2007 # # Results not meeting EL Percentiles results ND EL # % %Conf Min 10th 25th 50th 75th 90th Max Field D.O. (mg/L) 51 0 <4 0 0 6.7 7.9 8.9 10.2 11.4 12.8 14.5 51 0 <5 0 0 6.7 7.9 8.9 10.2 11.4 12.8 14.5 pH (SU) 52 0 <6 0 0 6.3 6.5 6.8 7 7.3 7.6 8.5 52 0 >9 0 0 6.3 6.5 6.8 7 7.3 7.6 8.5 Spec. conductance 50 0 N/A 32 37 39 44 48 56 70 (umhos/cm at 25°C) 1 0 N/A 40 40 40 40 40 40 40 Water Temperature (°C) 53 0 >29 0 0 2 5.9 8 16 20 22 25.8 Other TSS (mg/L) 20 2 N/A 2.3 2.4 4 11.5 33.2 44.4 130 Turbidity (NTU) 54 0 >50 5 9.3 1.7 2.6 4.2 8.4 20.2 61 190 Nutrients (mg/L) NH3 as N 48 30 N/A 0.02 0.02 0.02 0.02 0.03 0.07 0.33 NO2 + NO3 as N 48 0 N/A 0.23 0.28 0.29 0.34 0.39 0.44 0.49 TKN as N 48 21 N/A 0.2 0.2 0.2 0.2 0.31 0.43 0.92 Total Phosphorus 48 0 N/A 0.02 0.03 0.04 0.05 0.08 0.19 0.37 Metals (ug/L) Aluminum, total (Al) 18 0 N/A 96 118 178 495 1475 2300 3200 Arsenic, total (As) 18 18 >10 0 0 5 5 5 5 10 10 10 Cadmium, total (Cd) 18 18 >2 0 0 1 1 2 2 2 2 2 Chromium, total (Cr) 18 18 >50 0 0 10 10 25 25 25 25 25 Copper, total (Cu) 18 12 >7 0 0 2 2 2 2 2 4 4 Iron, total (Fe) 18 0 >1000 5 27.8 99.4 220 256 320 620 1575 2290 4000 Lead, total (Pb) 18 18 >25 0 0 10 10 10 10 10 10 10 Mercury, total (Hg) 16 16 >0.012 0 0 0.2 0.2 0.2 0.2 0.2 0.2 0.2 Nickel, total (Ni) 18 18 >88 0 0 10 10 10 10 10 10 10 Zinc, total (Zn) 18 11 >50 0 0 10 10 10 10 13 20 25 Fecal Coliform Screening(#/100mL) # results: Geomean # > 400: % > 400: %Conf: 54 82 11 20 60.6
Key: # result: number of observations # ND: number of observations reported to be below detection level (non-detect) EL: Evaluation Level; applicable numeric or narrative water quality standard or action level Results not meeting EL: number and percentages of observations not meeting evaluation level %Conf : States the percent statistical confidence that the actual percentage of exceedances is at least 10% (20% for Fecal Coliform) Stations with less than 10 results for a given parameter were not evaluated for statistical confidence

NCDENR, Division of Water Quality Ambient Monitoring System Report
French Broad River Basin – January 2009 AMS-40
Ambient Monitoring System Station Summaries NCDENR, Division of Water Quality Basinwide Assessment Report Location: FRENCH BROAD RIV AT SR 1634 AT ALEXANDER Station #: E4770000 Hydrologic Unit Code: 06010105 Latitude: 35.70800 Longitude: -82.62200 Stream class: B Agency: NCAMBNT NC stream index: 6-(54.5) Time period: 01/15/2003 to 11/13/2007 # # Results not meeting EL Percentiles results ND EL # % %Conf Min 10th 25th 50th 75th 90th Max Field D.O. (mg/L) 49 0 <4 0 0 7.2 7.7 8.4 10.1 11.2 12.2 13.3 49 0 <5 0 0 7.2 7.7 8.4 10.1 11.2 12.2 13.3 pH (SU) 51 0 <6 0 0 6.1 6.8 7.1 7.3 7.4 7.6 7.7 51 0 >9 0 0 6.1 6.8 7.1 7.3 7.4 7.6 7.7 Spec. conductance 47 0 N/A 40 47 52 58 63 78 90 (umhos/cm at 25°C) 1 0 N/A 56 56 56 56 56 56 56 Water Temperature (°C) 51 0 >29 0 0 3 7 9.4 17 21.7 24.7 28.3 Other TSS (mg/L) 20 3 N/A 2.1 2.5 6 10.2 33.5 73.8 190 Turbidity (NTU) 52 0 >50 8 15.4 92.9 1.9 3.8 5.2 10 23 78.5 180 Nutrients (mg/L) NH3 as N 47 0 N/A 0.04 0.06 0.09 0.13 0.17 0.19 0.28 NO2 + NO3 as N 47 0 N/A 0.28 0.38 0.42 0.5 0.59 0.85 1.3 TKN as N 47 0 N/A 0.22 0.28 0.34 0.4 0.51 0.61 0.83 Total Phosphorus 47 0 N/A 0.08 0.09 0.1 0.14 0.19 0.25 0.38 Metals (ug/L) Aluminum, total (Al) 18 0 N/A 100 154 210 445 1650 3920 5900 Arsenic, total (As) 18 18 >10 0 0 5 5 5 5 10 10 10 Cadmium, total (Cd) 18 18 >2 0 0 1 1 2 2 2 2 2 Chromium, total (Cr) 18 18 >50 0 0 10 10 25 25 25 25 25 Copper, total (Cu) 18 10 >7 1 5.6 2 2 2 2 3 6 8 Iron, total (Fe) 18 0 >1000 5 27.8 99.4 230 293 355 600 1700 3620 7400 Lead, total (Pb) 18 18 >25 0 0 10 10 10 10 10 10 10 Mercury, total (Hg) 16 16 >0.012 0 0 0.2 0.2 0.2 0.2 0.2 0.2 0.2 Nickel, total (Ni) 18 18 >88 0 0 10 10 10 10 10 10 10 Zinc, total (Zn) 18 9 >50 0 0 10 10 10 10 18 29 35 Fecal Coliform Screening(#/100mL) # results: Geomean # > 400: % > 400: %Conf: 52 39 9 17
Key: # result: number of observations # ND: number of observations reported to be below detection level (non-detect) EL: Evaluation Level; applicable numeric or narrative water quality standard or action level Results not meeting EL: number and percentages of observations not meeting evaluation level %Conf : States the percent statistical confidence that the actual percentage of exceedances is at least 10% (20% for Fecal Coliform) Stations with less than 10 results for a given parameter were not evaluated for statistical confidence

NCDENR, Division of Water Quality Ambient Monitoring System Report
French Broad River Basin – January 2009 AMS-41
Ambient Monitoring System Station Summaries NCDENR, Division of Water Quality Basinwide Assessment Report Location: FRENCH BROAD RIV AT BLENNERHASSETT ISLAND AT MARSHALL Station #: E5120000 Hydrologic Unit Code: 06010105 Latitude: 35.79630 Longitude: -82.68447 Stream class: B Agency: NCAMBNT NC stream index: 6-(54.5) Time period: 01/15/2003 to 11/13/2007 # # Results not meeting EL Percentiles results ND EL # % %Conf Min 10th 25th 50th 75th 90th Max Field D.O. (mg/L) 47 0 <4 0 0 7 8 8.6 10.2 11.4 12.9 15 47 0 <5 0 0 7 8 8.6 10.2 11.4 12.9 15 pH (SU) 49 0 <6 0 0 6.5 6.8 7 7.2 7.4 7.6 7.7 49 0 >9 0 0 6.5 6.8 7 7.2 7.4 7.6 7.7 Spec. conductance 46 0 N/A 43 50 55 59 70 82 92 (umhos/cm at 25°C) 1 0 N/A 62 62 62 62 62 62 62 Water Temperature (°C) 49 0 >29 0 0 2 6 8.6 16 21.5 24 27.4 Other TSS (mg/L) 20 3 N/A 2.4 2.8 5.1 9.5 34.8 61.2 200 Turbidity (NTU) 50 0 >50 7 14 87.8 1.9 3.6 5 10.2 26.8 64.5 140 Metals (ug/L) Aluminum, total (Al) 18 0 N/A 110 128 188 455 1850 3160 6400 Arsenic, total (As) 18 18 >10 0 0 5 5 5 5 10 10 10 Cadmium, total (Cd) 18 18 >2 0 0 1 1 2 2 2 2 2 Chromium, total (Cr) 18 18 >50 0 0 10 10 25 25 25 25 25 Copper, total (Cu) 18 9 >7 1 5.6 2 2 2 2 3 5 9 Iron, total (Fe) 18 0 >1000 5 27.8 99.4 240 276 325 600 1950 4040 8000 Lead, total (Pb) 18 18 >25 0 0 10 10 10 10 10 10 10 Mercury, total (Hg) 16 16 >0.012 0 0 0.2 0.2 0.2 0.2 0.2 0.2 0.2 Nickel, total (Ni) 18 18 >88 0 0 10 10 10 10 10 10 10 Zinc, total (Zn) 18 8 >50 0 0 10 10 10 10 19 23 34 Fecal Coliform Screening(#/100mL) # results: Geomean # > 400: % > 400: %Conf: 50 48 9 18
Key: # result: number of observations # ND: number of observations reported to be below detection level (non-detect) EL: Evaluation Level; applicable numeric or narrative water quality standard or action level Results not meeting EL: number and percentages of observations not meeting evaluation level %Conf : States the percent statistical confidence that the actual percentage of exceedances is at least 10% (20% for Fecal Coliform) Stations with less than 10 results for a given parameter were not evaluated for statistical confidence

NCDENR, Division of Water Quality Ambient Monitoring System Report
French Broad River Basin – January 2009 AMS-42
Ambient Monitoring System Station Summaries NCDENR, Division of Water Quality Basinwide Assessment Report Location: PIGEON RIV AT NC 215 NR CANTON Station #: E5495000 Hydrologic Unit Code: 06010106 Latitude: 35.52200 Longitude: -82.84800 Stream class: WS-III Tr CA Agency: NCAMBNT NC stream index: 5-(6.5) Time period: 01/13/2003 to 12/17/2007 # # Results not meeting EL Percentiles results ND EL # % %Conf Min 10th 25th 50th 75th 90th Max Field D.O. (mg/L) 47 0 <6 0 0 7.8 8.7 9.5 10.9 11.9 13.5 15.1 pH (SU) 48 0 <6 2 4.2 5.6 6.2 6.6 6.8 7 7.2 7.6 48 0 >9 0 0 5.6 6.2 6.6 6.8 7 7.2 7.6 Spec. conductance 47 0 N/A 17 20 21 22 26 28 33 (umhos/cm at 25°C) Water Temperature (°C) 49 0 >29 0 0 2 4.9 8.1 13 19 21 25.4 Other Chlorophyll a (ug/L) 1 0 >15 0 0 5 5 5 5 5 5 5 TSS (mg/L) 20 16 N/A 2.2 2.4 2.5 2.5 5.6 6.2 6.2 Turbidity (NTU) 51 9 >10 2 3.9 0.1 1 1.3 1.9 3.3 6.2 120 Nutrients (mg/L) NH3 as N 45 42 N/A 0.02 0.02 0.02 0.02 0.02 0.02 0.03 NO2 + NO3 as N 45 0 >10 0 0 0.02 0.1 0.16 0.2 0.25 0.27 0.29 TKN as N 45 40 N/A 0.2 0.2 0.2 0.2 0.2 0.2 0.57 Total Phosphorus 45 12 N/A 0.02 0.02 0.02 0.02 0.03 0.05 0.35 Metals (ug/L) Aluminum, total (Al) 17 0 N/A 51 52 56 82 160 282 290 Arsenic, total (As) 17 17 >10 0 0 5 5 5 5 10 10 10 Cadmium, total (Cd) 17 17 >0.4 0 0 1 2 2 2 2 2 2 Chromium, total (Cr) 17 17 >50 0 0 10 22 25 25 25 25 25 Copper, total (Cu) 17 15 >7 0 0 2 2 2 2 2 3 5 Iron, total (Fe) 17 0 >1000 0 0 64 74 86 150 255 410 530 Lead, total (Pb) 17 17 >25 0 0 10 10 10 10 10 10 10 Manganese, total (Mn) 17 5 >200 0 0 10 10 10 14 18 23 33 Mercury, total (Hg) 16 16 >0.012 0 0 0.2 0.2 0.2 0.2 0.2 0.2 0.2 Nickel, total (Ni) 17 17 >25 0 0 10 10 10 10 10 10 10 Zinc, total (Zn) 17 16 >50 0 0 10 10 10 10 10 11 14 Fecal Coliform Screening(#/100mL) # results: Geomean # > 400: % > 400: %Conf: 51 60 4 8
Key: # result: number of observations # ND: number of observations reported to be below detection level (non-detect) EL: Evaluation Level; applicable numeric or narrative water quality standard or action level Results not meeting EL: number and percentages of observations not meeting evaluation level %Conf : States the percent statistical confidence that the actual percentage of exceedances is at least 10% (20% for Fecal Coliform) Stations with less than 10 results for a given parameter were not evaluated for statistical confidence

NCDENR, Division of Water Quality Ambient Monitoring System Report
French Broad River Basin – January 2009 AMS-43
Ambient Monitoring System Station Summaries NCDENR, Division of Water Quality Basinwide Assessment Report Location: PIGEON RIV AT SR 1642 AT CLYDE Station #: E5600000 Hydrologic Unit Code: 06010106 Latitude: 35.53500 Longitude: -82.91100 Stream class: C Agency: NCAMBNT NC stream index: 5-(7) Time period: 01/13/2003 to 12/17/2007 # # Results not meeting EL Percentiles results ND EL # % %Conf Min 10th 25th 50th 75th 90th Max Field D.O. (mg/L) 47 0 <4 0 0 6.9 7.6 8.4 9.9 11.3 12.3 15.7 47 0 <5 0 0 6.9 7.6 8.4 9.9 11.3 12.3 15.7 pH (SU) 48 0 <6 0 0 6.6 7 7.2 7.6 7.8 7.9 8.4 48 0 >9 0 0 6.6 7 7.2 7.6 7.8 7.9 8.4 Spec. conductance 47 0 N/A 45 117 224 317 495 667 1640 (umhos/cm at 25°C) Water Temperature (°C) 49 0 >29 0 0 5 8 10 16 21.9 24 28.4 Other TSS (mg/L) 20 8 N/A 2.4 2.5 2.5 4.5 8.2 12.9 20 Turbidity (NTU) 51 1 >50 2 3.9 1 1.7 2.5 4.1 6.4 11.5 160 Nutrients (mg/L) NH3 as N 45 22 N/A 0.02 0.02 0.02 0.02 0.03 0.1 0.48 NO2 + NO3 as N 45 0 N/A 0.07 0.14 0.21 0.24 0.3 0.31 0.34 TKN as N 45 7 N/A 0.2 0.2 0.23 0.3 0.42 0.66 1.1 Total Phosphorus 45 0 N/A 0.04 0.05 0.07 0.12 0.2 0.34 0.62 Metals (ug/L) Aluminum, total (Al) 17 0 N/A 110 110 125 190 305 708 1100 Arsenic, total (As) 17 17 >10 0 0 5 5 5 5 10 10 10 Cadmium, total (Cd) 17 17 >2 0 0 1 2 2 2 2 2 2 Chromium, total (Cr) 17 17 >50 0 0 10 22 25 25 25 25 25 Copper, total (Cu) 17 12 >7 1 5.9 2 2 2 2 2 4 8 Iron, total (Fe) 17 0 >1000 1 5.9 110 118 145 180 430 888 1400 Lead, total (Pb) 17 17 >25 0 0 10 10 10 10 10 10 10 Mercury, total (Hg) 16 16 >0.012 0 0 0.2 0.2 0.2 0.2 0.2 0.2 0.2 Nickel, total (Ni) 17 17 >88 0 0 10 10 10 10 10 10 10 Zinc, total (Zn) 17 13 >50 0 0 10 10 10 10 10 13 13 Fecal Coliform Screening(#/100mL) # results: Geomean # > 400: % > 400: %Conf: 51 118 7 14
Key: # result: number of observations # ND: number of observations reported to be below detection level (non-detect) EL: Evaluation Level; applicable numeric or narrative water quality standard or action level Results not meeting EL: number and percentages of observations not meeting evaluation level %Conf : States the percent statistical confidence that the actual percentage of exceedances is at least 10% (20% for Fecal Coliform) Stations with less than 10 results for a given parameter were not evaluated for statistical confidence
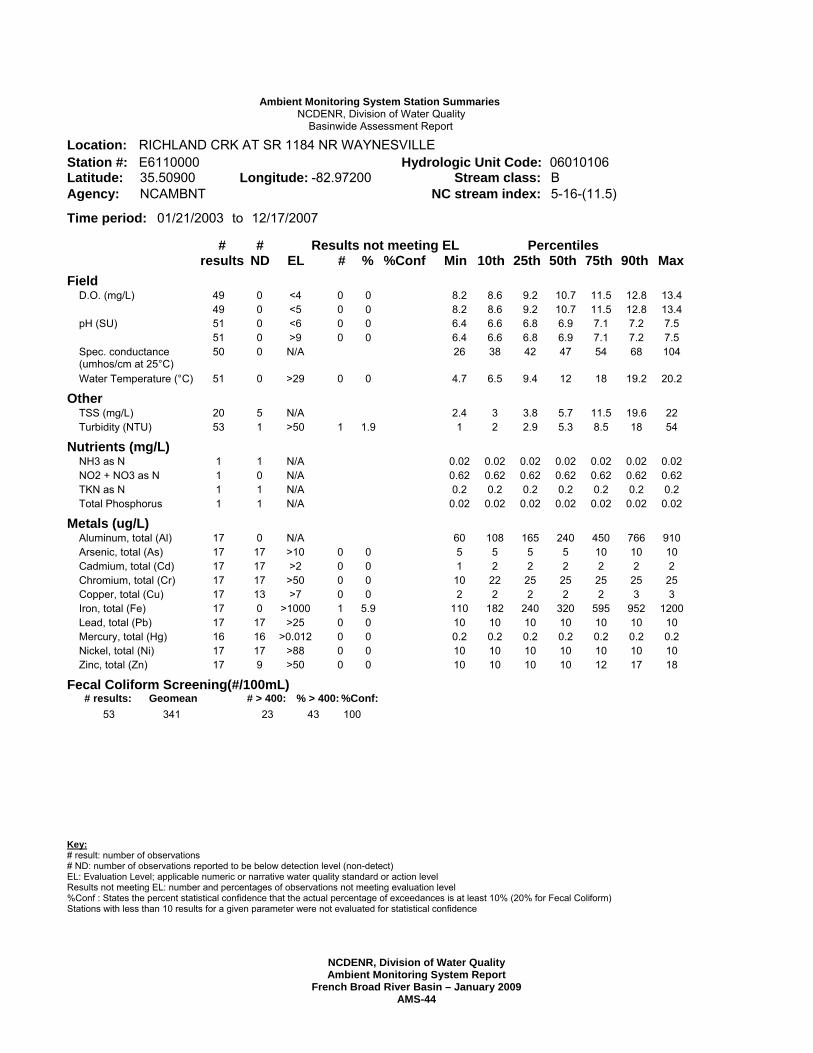
NCDENR, Division of Water Quality Ambient Monitoring System Report
French Broad River Basin – January 2009 AMS-44
Ambient Monitoring System Station Summaries NCDENR, Division of Water Quality Basinwide Assessment Report Location: RICHLAND CRK AT SR 1184 NR WAYNESVILLE Station #: E6110000 Hydrologic Unit Code: 06010106 Latitude: 35.50900 Longitude: -82.97200 Stream class: B Agency: NCAMBNT NC stream index: 5-16-(11.5) Time period: 01/21/2003 to 12/17/2007 # # Results not meeting EL Percentiles results ND EL # % %Conf Min 10th 25th 50th 75th 90th Max Field D.O. (mg/L) 49 0 <4 0 0 8.2 8.6 9.2 10.7 11.5 12.8 13.4 49 0 <5 0 0 8.2 8.6 9.2 10.7 11.5 12.8 13.4 pH (SU) 51 0 <6 0 0 6.4 6.6 6.8 6.9 7.1 7.2 7.5 51 0 >9 0 0 6.4 6.6 6.8 6.9 7.1 7.2 7.5 Spec. conductance 50 0 N/A 26 38 42 47 54 68 104 (umhos/cm at 25°C) Water Temperature (°C) 51 0 >29 0 0 4.7 6.5 9.4 12 18 19.2 20.2 Other TSS (mg/L) 20 5 N/A 2.4 3 3.8 5.7 11.5 19.6 22 Turbidity (NTU) 53 1 >50 1 1.9 1 2 2.9 5.3 8.5 18 54 Nutrients (mg/L) NH3 as N 1 1 N/A 0.02 0.02 0.02 0.02 0.02 0.02 0.02 NO2 + NO3 as N 1 0 N/A 0.62 0.62 0.62 0.62 0.62 0.62 0.62 TKN as N 1 1 N/A 0.2 0.2 0.2 0.2 0.2 0.2 0.2 Total Phosphorus 1 1 N/A 0.02 0.02 0.02 0.02 0.02 0.02 0.02 Metals (ug/L) Aluminum, total (Al) 17 0 N/A 60 108 165 240 450 766 910 Arsenic, total (As) 17 17 >10 0 0 5 5 5 5 10 10 10 Cadmium, total (Cd) 17 17 >2 0 0 1 2 2 2 2 2 2 Chromium, total (Cr) 17 17 >50 0 0 10 22 25 25 25 25 25 Copper, total (Cu) 17 13 >7 0 0 2 2 2 2 2 3 3 Iron, total (Fe) 17 0 >1000 1 5.9 110 182 240 320 595 952 1200 Lead, total (Pb) 17 17 >25 0 0 10 10 10 10 10 10 10 Mercury, total (Hg) 16 16 >0.012 0 0 0.2 0.2 0.2 0.2 0.2 0.2 0.2 Nickel, total (Ni) 17 17 >88 0 0 10 10 10 10 10 10 10 Zinc, total (Zn) 17 9 >50 0 0 10 10 10 10 12 17 18 Fecal Coliform Screening(#/100mL) # results: Geomean # > 400: % > 400: %Conf: 53 341 23 43 100
Key: # result: number of observations # ND: number of observations reported to be below detection level (non-detect) EL: Evaluation Level; applicable numeric or narrative water quality standard or action level Results not meeting EL: number and percentages of observations not meeting evaluation level %Conf : States the percent statistical confidence that the actual percentage of exceedances is at least 10% (20% for Fecal Coliform) Stations with less than 10 results for a given parameter were not evaluated for statistical confidence
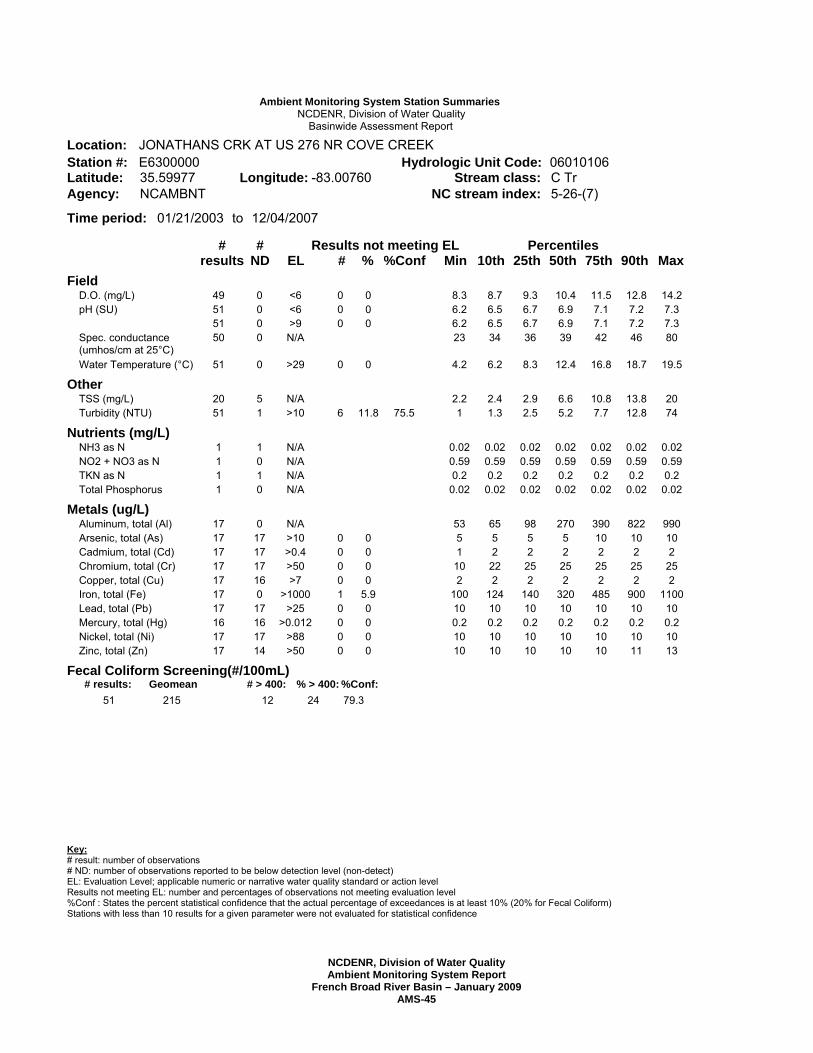
NCDENR, Division of Water Quality Ambient Monitoring System Report
French Broad River Basin – January 2009 AMS-45
Ambient Monitoring System Station Summaries NCDENR, Division of Water Quality Basinwide Assessment Report Location: JONATHANS CRK AT US 276 NR COVE CREEK Station #: E6300000 Hydrologic Unit Code: 06010106 Latitude: 35.59977 Longitude: -83.00760 Stream class: C Tr Agency: NCAMBNT NC stream index: 5-26-(7) Time period: 01/21/2003 to 12/04/2007 # # Results not meeting EL Percentiles results ND EL # % %Conf Min 10th 25th 50th 75th 90th Max Field D.O. (mg/L) 49 0 <6 0 0 8.3 8.7 9.3 10.4 11.5 12.8 14.2 pH (SU) 51 0 <6 0 0 6.2 6.5 6.7 6.9 7.1 7.2 7.3 51 0 >9 0 0 6.2 6.5 6.7 6.9 7.1 7.2 7.3 Spec. conductance 50 0 N/A 23 34 36 39 42 46 80 (umhos/cm at 25°C) Water Temperature (°C) 51 0 >29 0 0 4.2 6.2 8.3 12.4 16.8 18.7 19.5 Other TSS (mg/L) 20 5 N/A 2.2 2.4 2.9 6.6 10.8 13.8 20 Turbidity (NTU) 51 1 >10 6 11.8 75.5 1 1.3 2.5 5.2 7.7 12.8 74 Nutrients (mg/L) NH3 as N 1 1 N/A 0.02 0.02 0.02 0.02 0.02 0.02 0.02 NO2 + NO3 as N 1 0 N/A 0.59 0.59 0.59 0.59 0.59 0.59 0.59 TKN as N 1 1 N/A 0.2 0.2 0.2 0.2 0.2 0.2 0.2 Total Phosphorus 1 0 N/A 0.02 0.02 0.02 0.02 0.02 0.02 0.02 Metals (ug/L) Aluminum, total (Al) 17 0 N/A 53 65 98 270 390 822 990 Arsenic, total (As) 17 17 >10 0 0 5 5 5 5 10 10 10 Cadmium, total (Cd) 17 17 >0.4 0 0 1 2 2 2 2 2 2 Chromium, total (Cr) 17 17 >50 0 0 10 22 25 25 25 25 25 Copper, total (Cu) 17 16 >7 0 0 2 2 2 2 2 2 2 Iron, total (Fe) 17 0 >1000 1 5.9 100 124 140 320 485 900 1100 Lead, total (Pb) 17 17 >25 0 0 10 10 10 10 10 10 10 Mercury, total (Hg) 16 16 >0.012 0 0 0.2 0.2 0.2 0.2 0.2 0.2 0.2 Nickel, total (Ni) 17 17 >88 0 0 10 10 10 10 10 10 10 Zinc, total (Zn) 17 14 >50 0 0 10 10 10 10 10 11 13 Fecal Coliform Screening(#/100mL) # results: Geomean # > 400: % > 400: %Conf: 51 215 12 24 79.3
Key: # result: number of observations # ND: number of observations reported to be below detection level (non-detect) EL: Evaluation Level; applicable numeric or narrative water quality standard or action level Results not meeting EL: number and percentages of observations not meeting evaluation level %Conf : States the percent statistical confidence that the actual percentage of exceedances is at least 10% (20% for Fecal Coliform) Stations with less than 10 results for a given parameter were not evaluated for statistical confidence

NCDENR, Division of Water Quality Ambient Monitoring System Report
French Broad River Basin – January 2009 AMS-46
Ambient Monitoring System Station Summaries NCDENR, Division of Water Quality Basinwide Assessment Report Location: CATALOOCHEE CRK AT SR 1395 NR CATALOOCHEE Station #: E6450000 Hydrologic Unit Code: 06010106 Latitude: 35.66700 Longitude: -83.07301 Stream class: C Tr ORW Agency: NCAMBNT NC stream index: 5-41 Time period: 02/04/2003 to 12/04/2007 # # Results not meeting EL Percentiles results ND EL # % %Conf Min 10th 25th 50th 75th 90th Max Field D.O. (mg/L) 45 0 <6 0 0 8.5 8.8 9.6 10.5 12.1 13.2 14.4 pH (SU) 47 0 <6 5 10.6 67.1 5.3 5.8 6.4 6.8 7 7.1 7.3 47 0 >9 0 0 5.3 5.8 6.4 6.8 7 7.1 7.3 Spec. conductance 47 0 N/A 13 14 14 15 16 17 23 (umhos/cm at 25°C) Water Temperature (°C) 48 0 >29 0 0 3.4 5.9 7.7 11.5 15.8 17 18.3 Other TSS (mg/L) 19 14 N/A 2.2 2.2 2.5 2.5 4 6.2 10 Turbidity (NTU) 48 18 >10 1 2.1 1 1 1 1.3 2.3 3.4 16 Nutrients (mg/L) NH3 as N 44 44 N/A 0.02 0.02 0.02 0.02 0.02 0.02 0.02 NO2 + NO3 as N 44 2 N/A 0.02 0.05 0.11 0.15 0.18 0.2 0.28 TKN as N 44 40 N/A 0.2 0.2 0.2 0.2 0.2 0.2 0.33 Total Phosphorus 44 11 N/A 0.02 0.02 0.02 0.02 0.03 0.04 0.09 Metals (ug/L) Aluminum, total (Al) 16 6 N/A 50 50 50 66 96 151 270 Arsenic, total (As) 16 16 >10 0 0 5 5 5 5 10 10 10 Cadmium, total (Cd) 16 16 >0.4 0 0 1 1 2 2 2 2 2 Chromium, total (Cr) 16 16 >50 0 0 10 10 25 25 25 25 25 Copper, total (Cu) 16 16 >7 0 0 2 2 2 2 2 2 2 Iron, total (Fe) 16 8 >1000 0 0 50 50 50 55 92 162 320 Lead, total (Pb) 16 16 >25 0 0 10 10 10 10 10 10 10 Mercury, total (Hg) 15 15 >0.012 0 0 0.2 0.2 0.2 0.2 0.2 0.2 0.2 Nickel, total (Ni) 16 16 >88 0 0 10 10 10 10 10 10 10 Zinc, total (Zn) 16 16 >50 0 0 10 10 10 10 10 10 10 Fecal Coliform Screening(#/100mL) # results: Geomean # > 400: % > 400: %Conf: 48 4 0 0
Key: # result: number of observations # ND: number of observations reported to be below detection level (non-detect) EL: Evaluation Level; applicable numeric or narrative water quality standard or action level Results not meeting EL: number and percentages of observations not meeting evaluation level %Conf : States the percent statistical confidence that the actual percentage of exceedances is at least 10% (20% for Fecal Coliform) Stations with less than 10 results for a given parameter were not evaluated for statistical confidence

NCDENR, Division of Water Quality Ambient Monitoring System Report
French Broad River Basin – January 2009 AMS-47
Ambient Monitoring System Station Summaries NCDENR, Division of Water Quality Basinwide Assessment Report Location: PIGEON RIV AT SR 1338 NR HEPCO Station #: E6480000 Hydrologic Unit Code: 06010106 Latitude: 35.66600 Longitude: -82.99500 Stream class: C Agency: NCAMBNT NC stream index: 5-(7) Time period: 01/21/2003 to 12/04/2007 # # Results not meeting EL Percentiles results ND EL # % %Conf Min 10th 25th 50th 75th 90th Max Field D.O. (mg/L) 49 0 <4 0 0 7.7 8 8.9 10 11.6 12.3 16 49 0 <5 0 0 7.7 8 8.9 10 11.6 12.3 16 pH (SU) 51 0 <6 0 0 6.9 7.2 7.4 7.7 8 8.1 8.9 51 0 >9 0 0 6.9 7.2 7.4 7.7 8 8.1 8.9 Spec. conductance 50 0 N/A 54 129 162 214 318 400 484 (umhos/cm at 25°C) Water Temperature (°C) 51 0 >29 0 0 5.3 6.3 9.4 14 19.4 22.1 24 Other Chlorophyll a (ug/L) 1 0 >40 0 0 5 5 5 5 5 5 5 TSS (mg/L) 20 7 N/A 2.5 2.5 4.2 6.2 8 16.7 35 Turbidity (NTU) 51 1 >50 3 5.9 1 1.7 3 6.2 10 37.2 97 Nutrients (mg/L) NH3 as N 46 10 N/A 0.02 0.02 0.02 0.03 0.05 0.08 0.16 NO2 + NO3 as N 46 0 N/A 0.27 0.35 0.39 0.44 0.5 0.58 0.68 TKN as N 46 8 N/A 0.2 0.2 0.21 0.28 0.41 0.49 0.69 Total Phosphorus 46 0 N/A 0.04 0.06 0.07 0.09 0.12 0.2 0.77 Metals (ug/L) Aluminum, total (Al) 17 0 N/A 90 98 150 280 425 1012 1500 Arsenic, total (As) 17 17 >10 0 0 5 5 5 5 10 10 10 Cadmium, total (Cd) 17 17 >2 0 0 1 2 2 2 2 2 2 Chromium, total (Cr) 17 17 >50 0 0 10 22 25 25 25 25 25 Copper, total (Cu) 17 12 >7 0 0 2 2 2 2 2 3 6 Iron, total (Fe) 17 0 >1000 2 11.8 76.2 130 162 200 340 605 1240 1800 Lead, total (Pb) 17 17 >25 0 0 10 10 10 10 10 10 10 Mercury, total (Hg) 16 16 >0.012 0 0 0.2 0.2 0.2 0.2 0.2 0.2 0.2 Nickel, total (Ni) 17 17 >88 0 0 10 10 10 10 10 10 10 Zinc, total (Zn) 17 12 >50 0 0 10 10 10 10 12 23 24 Fecal Coliform Screening(#/100mL) # results: Geomean # > 400: % > 400: %Conf: 51 173 12 24 79.3
Key: # result: number of observations # ND: number of observations reported to be below detection level (non-detect) EL: Evaluation Level; applicable numeric or narrative water quality standard or action level Results not meeting EL: number and percentages of observations not meeting evaluation level %Conf : States the percent statistical confidence that the actual percentage of exceedances is at least 10% (20% for Fecal Coliform) Stations with less than 10 results for a given parameter were not evaluated for statistical confidence

NCDENR, Division of Water Quality Ambient Monitoring System Report
French Broad River Basin – January 2009 AMS-48
Ambient Monitoring System Station Summaries NCDENR, Division of Water Quality Basinwide Assessment Report Location: PIGEON RIV AT WATERVILLE Station #: E6500000 Hydrologic Unit Code: 06010106 Latitude: 35.78506 Longitude: -83.11300 Stream class: C Agency: NCAMBNT NC stream index: 5-(7) Time period: 01/21/2003 to 12/04/2007 # # Results not meeting EL Percentiles results ND EL # % %Conf Min 10th 25th 50th 75th 90th Max Field D.O. (mg/L) 49 0 <4 0 0 6.9 7.7 8.4 9.7 11.5 12.4 15.4 49 0 <5 0 0 6.9 7.7 8.4 9.7 11.5 12.4 15.4 pH (SU) 51 0 <6 0 0 6.7 6.9 7 7.1 7.2 7.4 7.8 51 0 >9 0 0 6.7 6.9 7 7.1 7.2 7.4 7.8 Spec. conductance 50 0 N/A 20 86 104 128 176 233 430 (umhos/cm at 25°C) Water Temperature (°C) 51 0 >29 0 0 5 6 9 15.8 19.3 21.7 23 Other TSS (mg/L) 20 11 N/A 2.5 2.5 2.5 4.1 6.2 6.6 12 Turbidity (NTU) 51 0 >50 0 0 1.4 1.7 2.5 3.2 5.6 9.8 24 Metals (ug/L) Aluminum, total (Al) 17 0 N/A 73 75 90 140 255 426 970 Arsenic, total (As) 17 17 >10 0 0 5 5 5 5 10 10 10 Cadmium, total (Cd) 17 17 >2 0 0 1 2 2 2 2 2 2 Chromium, total (Cr) 17 17 >50 0 0 10 22 25 25 25 25 25 Copper, total (Cu) 17 14 >7 0 0 2 2 2 2 2 3 3 Iron, total (Fe) 17 0 >1000 0 0 110 118 135 240 340 486 950 Lead, total (Pb) 17 17 >25 0 0 10 10 10 10 10 10 10 Mercury, total (Hg) 16 16 >0.012 0 0 0.2 0.2 0.2 0.2 0.2 0.2 0.2 Nickel, total (Ni) 17 17 >88 0 0 10 10 10 10 10 10 10 Zinc, total (Zn) 17 14 >50 0 0 10 10 10 10 10 13 14 Fecal Coliform Screening(#/100mL) # results: Geomean # > 400: % > 400: %Conf: 51 30 6 12
Key: # result: number of observations # ND: number of observations reported to be below detection level (non-detect) EL: Evaluation Level; applicable numeric or narrative water quality standard or action level Results not meeting EL: number and percentages of observations not meeting evaluation level %Conf : States the percent statistical confidence that the actual percentage of exceedances is at least 10% (20% for Fecal Coliform) Stations with less than 10 results for a given parameter were not evaluated for statistical confidence

NCDENR, Division of Water Quality Ambient Monitoring System Report
French Broad River Basin – January 2009 AMS-49
Ambient Monitoring System Station Summaries NCDENR, Division of Water Quality Basinwide Assessment Report Location: N TOE RIV AT US 19E NR INGALLS Station #: E7000000 Hydrologic Unit Code: 06010108 Latitude: 35.98100 Longitude: -82.01601 Stream class: WS-IV Tr Agency: NCAMBNT NC stream index: 7-2-(21.5) Time period: 01/28/2003 to 12/05/2007 # # Results not meeting EL Percentiles results ND EL # % %Conf Min 10th 25th 50th 75th 90th Max Field D.O. (mg/L) 46 0 <6 0 0 7.5 8.4 9 10.6 12.9 13.8 15.5 pH (SU) 48 0 <6 0 0 6.1 6.7 6.9 7.1 7.5 7.6 8.5 48 0 >9 0 0 6.1 6.7 6.9 7.1 7.5 7.6 8.5 Spec. conductance 47 0 N/A 25 40 43 47 52 56 59 (umhos/cm at 25°C) Water Temperature (°C) 48 0 >29 0 0 1 3.6 6.6 13.5 19 20.6 22.7 Other Chloride (mg/L) 6 0 >250 0 0 4 4 4 5 5 6 6 Fluoride (mg/L) 49 46 >1.8 0 0 0 0 0 0 0 0 1 Sulfate (mg/L) 6 6 >250 0 0 2 2 2 2 2 2 2 TSS (mg/L) 20 5 N/A 2.4 2.5 3.1 6.4 9.6 19.3 480 Turbidity (NTU) 51 2 >10 9 17.6 97.2 1 1.5 2.3 4.2 8.4 18.8 240 Metals (ug/L) Aluminum, total (Al) 17 0 N/A 56 107 140 290 440 4000 16000 Arsenic, total (As) 17 17 >10 0 0 5 5 5 5 10 10 10 Cadmium, total (Cd) 18 18 >0.4 0 0 1 2 2 2 2 2 2 Chromium, total (Cr) 18 18 >50 0 0 10 24 25 25 25 25 25 Copper, total (Cu) 18 13 >7 2 11.1 73.4 2 2 2 2 2 16 25 Iron, total (Fe) 17 0 >1000 2 11.8 76.2 120 168 225 400 615 5440 22000 Lead, total (Pb) 18 16 >25 0 0 10 10 10 10 10 14 14 Manganese, total (Mn) 17 0 >200 1 5.9 10 11 14 21 30 162 640 Mercury, total (Hg) 16 16 >0.012 0 0 0.2 0.2 0.2 0.2 0.2 0.2 0.2 Nickel, total (Ni) 18 17 >25 0 0 10 10 10 10 10 11 17 Zinc, total (Zn) 18 16 >50 1 5.6 10 10 10 10 10 26 82 Fecal Coliform Screening(#/100mL) # results: Geomean # > 400: % > 400: %Conf: 51 42 6 12
Key: # result: number of observations # ND: number of observations reported to be below detection level (non-detect) EL: Evaluation Level; applicable numeric or narrative water quality standard or action level Results not meeting EL: number and percentages of observations not meeting evaluation level %Conf : States the percent statistical confidence that the actual percentage of exceedances is at least 10% (20% for Fecal Coliform) Stations with less than 10 results for a given parameter were not evaluated for statistical confidence

NCDENR, Division of Water Quality Ambient Monitoring System Report
French Broad River Basin – January 2009 AMS-50
Ambient Monitoring System Station Summaries NCDENR, Division of Water Quality Basinwide Assessment Report Location: N TOE RIV AT SR 1162 AT PENLAND Station #: E8100000 Hydrologic Unit Code: 06010108 Latitude: 35.92929 Longitude: -82.11521 Stream class: C Tr Agency: NCAMBNT NC stream index: 7-2-(27.7) Time period: 01/28/2003 to 12/05/2007 # # Results not meeting EL Percentiles results ND EL # % %Conf Min 10th 25th 50th 75th 90th Max Field D.O. (mg/L) 46 0 <6 0 0 7.6 8 8.9 10.7 12.6 13.8 15.2 pH (SU) 48 0 <6 0 0 6.1 6.6 6.8 7 7.4 7.6 8.5 48 0 >9 0 0 6.1 6.6 6.8 7 7.4 7.6 8.5 Spec. conductance 47 0 N/A 41 52 63 75 90 127 217 (umhos/cm at 25°C) Water Temperature (°C) 48 0 >29 0 0 1 3 6.4 14 20 22.1 24.2 Other Chloride (mg/L) 6 0 >230 0 0 5 5 6 8 9 10 10 Fluoride (mg/L) 49 13 >1.8 2 4.1 0 0 0 1 1 1 3 TSS (mg/L) 21 0 N/A 3 3.6 5.1 7.6 15 73.4 550 Turbidity (NTU) 51 0 >10 21 41.2 100 1.3 2.4 4.4 8.9 16 102 340 Nutrients (mg/L) NH3 as N 2 0 N/A 0.02 0.02 0.02 0.02 0.02 0.02 0.02 NO2 + NO3 as N 2 0 N/A 0.46 0.46 0.46 0.5 0.54 0.54 0.54 TKN as N 2 2 N/A 0.2 0.2 0.2 0.2 0.2 0.2 0.2 Total Phosphorus 2 1 N/A 0.02 0.02 0.02 0.02 0.02 0.02 0.02 Metals (ug/L) Aluminum, total (Al) 18 0 N/A 200 209 270 655 1275 9690 24000 Arsenic, total (As) 18 18 >10 0 0 5 5 5 5 10 10 10 Cadmium, total (Cd) 19 19 >0.4 0 0 1 2 2 2 2 2 2 Chromium, total (Cr) 19 18 >50 0 0 10 25 25 25 25 25 28 Copper, total (Cu) 19 10 >7 1 5.3 2 2 2 2 3 7 33 Iron, total (Fe) 18 0 >1000 5 27.8 99.4 270 288 328 715 1450 7210 28000 Lead, total (Pb) 19 18 >25 0 0 10 10 10 10 10 10 20 Mercury, total (Hg) 17 17 >0.012 0 0 0.2 0.2 0.2 0.2 0.2 0.2 0.2 Nickel, total (Ni) 19 18 >88 0 0 10 10 10 10 10 10 20 Zinc, total (Zn) 19 9 >50 1 5.3 10 10 10 11 15 20 89 Fecal Coliform Screening(#/100mL) # results: Geomean # > 400: % > 400: %Conf: 51 86 13 25 87.4
Key: # result: number of observations # ND: number of observations reported to be below detection level (non-detect) EL: Evaluation Level; applicable numeric or narrative water quality standard or action level Results not meeting EL: number and percentages of observations not meeting evaluation level %Conf : States the percent statistical confidence that the actual percentage of exceedances is at least 10% (20% for Fecal Coliform) Stations with less than 10 results for a given parameter were not evaluated for statistical confidence

NCDENR, Division of Water Quality Ambient Monitoring System Report
French Broad River Basin – January 2009 AMS-51
Ambient Monitoring System Station Summaries NCDENR, Division of Water Quality Basinwide Assessment Report Location: S TOE RIV AT SR 1168 NR CELO Station #: E8200000 Hydrologic Unit Code: 06010108 Latitude: 35.83100 Longitude: -82.18401 Stream class: B Tr ORW Agency: NCAMBNT NC stream index: 7-2-52-(1) Time period: 01/28/2003 to 12/05/2007 # # Results not meeting EL Percentiles results ND EL # % %Conf Min 10th 25th 50th 75th 90th Max Field D.O. (mg/L) 46 0 <6 0 0 7.5 8.6 9.6 10.7 12.6 13.6 15.6 pH (SU) 48 0 <6 4 8.3 5.4 6 6.4 6.5 6.8 7 7.2 48 0 >9 0 0 5.4 6 6.4 6.5 6.8 7 7.2 Spec. conductance 46 0 N/A 12 14 14 15 17 18 23 (umhos/cm at 25°C) Water Temperature (°C) 48 0 >29 0 0 1 3.9 6.1 12 17.2 19 20.8 Other TSS (mg/L) 20 17 N/A 2.1 2.4 2.5 2.5 2.5 6.2 48 Turbidity (NTU) 50 26 >10 2 4 0.6 1 1 1 1.6 3.7 21 Nutrients (mg/L) NH3 as N 45 43 N/A 0.02 0.02 0.02 0.02 0.02 0.02 0.15 NO2 + NO3 as N 45 2 N/A 0.02 0.03 0.07 0.11 0.13 0.16 0.26 TKN as N 45 43 N/A 0.2 0.2 0.2 0.2 0.2 0.2 0.39 Total Phosphorus 45 27 N/A 0.02 0.02 0.02 0.02 0.02 0.03 0.08 Metals (ug/L) Aluminum, total (Al) 17 3 N/A 50 50 54 78 125 512 1800 Arsenic, total (As) 17 17 >10 0 0 5 5 5 5 10 10 10 Cadmium, total (Cd) 17 17 >0.4 0 0 1 2 2 2 2 2 2 Chromium, total (Cr) 17 17 >50 0 0 10 22 25 25 25 25 25 Copper, total (Cu) 17 15 >7 0 0 2 2 2 2 2 2 3 Iron, total (Fe) 17 4 >1000 1 5.9 50 50 54 95 135 596 2100 Lead, total (Pb) 17 17 >25 0 0 10 10 10 10 10 10 10 Mercury, total (Hg) 16 16 >0.012 0 0 0.2 0.2 0.2 0.2 0.2 0.2 0.2 Nickel, total (Ni) 17 17 >88 0 0 10 10 10 10 10 10 10 Zinc, total (Zn) 17 14 >50 0 0 10 10 10 10 10 27 39 Fecal Coliform Screening(#/100mL) # results: Geomean # > 400: % > 400: %Conf: 50 23 3 6
Key: # result: number of observations # ND: number of observations reported to be below detection level (non-detect) EL: Evaluation Level; applicable numeric or narrative water quality standard or action level Results not meeting EL: number and percentages of observations not meeting evaluation level %Conf : States the percent statistical confidence that the actual percentage of exceedances is at least 10% (20% for Fecal Coliform) Stations with less than 10 results for a given parameter were not evaluated for statistical confidence

NCDENR, Division of Water Quality Ambient Monitoring System Report
French Broad River Basin – January 2009 AMS-52
Ambient Monitoring System Station Summaries NCDENR, Division of Water Quality Basinwide Assessment Report Location: CANE RIV AT SR 1343 NR SIOUX Station #: E9850000 Hydrologic Unit Code: 06010108 Latitude: 36.02505 Longitude: -82.32715 Stream class: C Tr Agency: NCAMBNT NC stream index: 7-3-(13.7) Time period: 02/05/2003 to 11/13/2007 # # Results not meeting EL Percentiles results ND EL # % %Conf Min 10th 25th 50th 75th 90th Max Field D.O. (mg/L) 42 0 <6 0 0 7.8 8.7 9.4 10.7 12.5 14.4 15.7 pH (SU) 48 0 <6 0 0 6.4 6.6 6.8 7.1 7.7 8 8.3 48 0 >9 0 0 6.4 6.6 6.8 7.1 7.7 8 8.3 Spec. conductance 47 0 N/A 25 37 44 48 53 58 73 (umhos/cm at 25°C) Water Temperature (°C) 49 0 >29 0 0 1 4 8.3 15 21 23 25.3 Other TSS (mg/L) 20 6 N/A 2.3 2.5 4.5 7.6 15.5 40.6 440 Turbidity (NTU) 50 0 >10 15 30 100 1.1 1.6 2.4 7.5 13.5 33.8 270 Metals (ug/L) Aluminum, total (Al) 17 0 N/A 51 57 175 370 730 4360 17000 Arsenic, total (As) 17 17 >10 0 0 5 5 5 5 10 10 10 Cadmium, total (Cd) 17 17 >0.4 0 0 1 2 2 2 2 2 2 Chromium, total (Cr) 17 17 >50 0 0 10 22 25 25 25 25 25 Copper, total (Cu) 17 10 >7 1 5.9 2 2 2 2 2 6 16 Iron, total (Fe) 17 0 >1000 4 23.5 97.8 110 134 280 570 1050 5360 20000 Lead, total (Pb) 17 17 >25 0 0 10 10 10 10 10 10 10 Mercury, total (Hg) 16 16 >0.012 0 0 0.2 0.2 0.2 0.2 0.2 0.2 0.2 Nickel, total (Ni) 17 16 >88 0 0 10 10 10 10 10 10 12 Zinc, total (Zn) 17 11 >50 1 5.9 10 10 10 10 16 46 74 Fecal Coliform Screening(#/100mL) # results: Geomean # > 400: % > 400: %Conf: 50 91 9 18
Key: # result: number of observations # ND: number of observations reported to be below detection level (non-detect) EL: Evaluation Level; applicable numeric or narrative water quality standard or action level Results not meeting EL: number and percentages of observations not meeting evaluation level %Conf : States the percent statistical confidence that the actual percentage of exceedances is at least 10% (20% for Fecal Coliform) Stations with less than 10 results for a given parameter were not evaluated for statistical confidence

NCDENR, Division of Water Quality Ambient Monitoring System Report
French Broad River Basin – January 2009 AMS-53
Ambient Monitoring System Station Summaries NCDENR, Division of Water Quality Basinwide Assessment Report Location: NOLICHUCKY RIV BESIDE SR 1321 AT POPLAR Station #: E9990000 Hydrologic Unit Code: 06010108 Latitude: 36.07500 Longitude: -82.34500 Stream class: B Agency: NCAMBNT NC stream index: 7 Time period: 02/05/2003 to 10/18/2006 # # Results not meeting EL Percentiles results ND EL # % %Conf Min 10th 25th 50th 75th 90th Max Field D.O. (mg/L) 36 0 <4 0 0 7.4 8.2 9 10.4 12.3 14.3 15.6 36 0 <5 0 0 7.4 8.2 9 10.4 12.3 14.3 15.6 pH (SU) 37 0 <6 0 0 6.7 6.8 6.9 7.1 7.4 7.4 8 37 0 >9 0 0 6.7 6.8 6.9 7.1 7.4 7.4 8 Spec. conductance 37 0 N/A 30 46 50 59 66 73 90 (umhos/cm at 25°C) Water Temperature (°C) 37 0 >29 0 0 2 3.9 9.2 15.2 22 23.6 26.4 Other Fluoride (mg/L) 36 33 >1.8 0 0 0 0 0 0 0 0 1 TSS (mg/L) 14 2 N/A 2.5 2.5 2.9 8.4 33 206 310 Turbidity (NTU) 38 0 >50 5 13.2 82.5 1.1 1.7 2.6 10.5 23.2 90.5 170 Nutrients (mg/L) NH3 as N 1 1 N/A 0.02 0.02 0.02 0.02 0.02 0.02 0.02 NO2 + NO3 as N 1 0 N/A 0.19 0.19 0.19 0.19 0.19 0.19 0.19 TKN as N 1 0 N/A 0.53 0.53 0.53 0.53 0.53 0.53 0.53 Total Phosphorus 1 0 N/A 0.21 0.21 0.21 0.21 0.21 0.21 0.21 Metals (ug/L) Aluminum, total (Al) 16 0 N/A 63 74 145 210 2850 5950 9100 Arsenic, total (As) 16 16 >10 0 0 5 5 5 5 10 10 10 Cadmium, total (Cd) 16 16 >2 0 0 2 2 2 2 2 2 2 Chromium, total (Cr) 16 16 >50 0 0 25 25 25 25 25 25 25 Copper, total (Cu) 16 7 >7 3 18.8 93.2 2 2 2 3 5 11 13 Iron, total (Fe) 16 0 >1000 5 31.2 99.7 150 199 250 370 3950 7800 12000 Lead, total (Pb) 16 16 >25 0 0 10 10 10 10 10 10 10 Mercury, total (Hg) 16 16 >0.012 0 0 0.2 0.2 0.2 0.2 0.2 0.2 0.2 Nickel, total (Ni) 16 15 >88 0 0 10 10 10 10 10 11 13 Zinc, total (Zn) 16 10 >50 0 0 10 10 10 10 21 35 48 Fecal Coliform Screening(#/100mL) # results: Geomean # > 400: % > 400: %Conf: 38 106 9 24 78.4
Key: # result: number of observations # ND: number of observations reported to be below detection level (non-detect) EL: Evaluation Level; applicable numeric or narrative water quality standard or action level Results not meeting EL: number and percentages of observations not meeting evaluation level %Conf : States the percent statistical confidence that the actual percentage of exceedances is at least 10% (20% for Fecal Coliform) Stations with less than 10 results for a given parameter were not evaluated for statistical confidence

NCDENR, Division of Water Quality Ambient Monitoring System Report
French Broad River Basin – January 2009 AMS-54
Appendix B: Station Box & Whisker Plots

NCDENR, Division of Water Quality Ambient Monitoring System Report
French Broad River Basin – January 2009 AMS-55
Water Temperature (oC)-5 0 5 10 15 20 25 30
E9990000d B
E9850000d C Tr
E8200000d B Tr ORW
E8100000d C Tr
E7000000d WS-IV Tr
E6500000d C
E6480000d C
E6450000d C Tr ORW
E6300000d C Tr
E6110000d B
E5600000d C
E5495000d WS-III Tr CA
E5120000d B
E4770000d B
E4280000d B
E4170000d C
E3520000d C
E2730000d B
E2120000d C
E1490000d WS-II Tr HQW
E1270000d B
E1130000d C Tr
E0850000d WS-V B Tr
E0150000d B Tr French Broad RiverUS 78 RosmanMaximum Evaluation
Level: 29
HUC 06010105: French Broad River
Davidson RiverUS 64 Brevard
Little Riverupstream High FallsCedar Mountain
French Broad RiverSR 1503 Blantyre
Mud CreekSR 1508 Balfour
French Broad RiverSR 3495 Skyland
Hominy CreekSR 3413 Asheville
Swannanoa RiverUS 25 Biltmore Ave Asheville
French Broad RiverSR 1348 Ashville
French Broad RiverSR 1634 Alexander
French Broad RiverBlennerhassett IslandMarshall
Pigeon RiverNC 215 Canton
Pigeon RiverSR 1642 Clyde
Richland CreekSR 1184 Waynesville
Jonathans CreekUS 276 Cove Creek
Cataloochee CreekSR 1395 Cataloochee
Pigeon RiverSR 1338 Hepco
Pigeon RiverWaterville
North Toe RiverUS 19E Ingalls
North Toe RiverSR 1162 Penland
South Toe RiverSR 1168 Celo
Cane RiverSR 1343 Sioux
Nolichucky RiverSR 1321 Poplar
Mills RiverSR1337 Mills River
HUC 06010106: Pigeon River
HUC 06010108: Nolichucky River
Figure 17. Box Plots of Temperature in the French Broad River Basin

NCDENR, Division of Water Quality Ambient Monitoring System Report
French Broad River Basin – January 2009 AMS-56
Dissolved Oxygen (mg/L)2 4 6 8 10 12 14 16
E9990000d B
E9850000d C Tr
E8200000d B Tr ORW
E8100000d C Tr
E7000000d WS-IV Tr
E6500000d C
E6480000d C
E6450000d C Tr ORW
E6300000d C Tr
E6110000d B
E5600000d C
E5495000d WS-III Tr CA
E5120000d B
E4770000d B
E4280000d B
E4170000d C
E3520000d C
E2730000d B
E2120000d C
E1490000d WS-II Tr HQW
E1270000d B
E1130000d C Tr
E0850000d WS-V B Tr
E0150000d B Tr French Broad RiverUS 78 Rosman
Minimum EvaluationLevel for non-Troutwaters: 4
HUC 06010105: French Broad River
Davidson RiverUS 64 Brevard
Little Riverupstream High FallsCedar Mountain
French Broad RiverSR 1503 Blantyre
Mud CreekSR 1508 Balfour
French Broad RiverSR 3495 Skyland
Hominy CreekSR 3413 Asheville
Swannanoa RiverUS 25 Biltmore Ave Asheville
French Broad RiverSR 1348 Ashville
French Broad RiverSR 1634 Alexander
French Broad RiverBlennerhassett IslandMarshall
Pigeon RiverNC 215 Canton
Pigeon RiverSR 1642 Clyde
Richland CreekSR 1184 Waynesville
Jonathans CreekUS 276 Cove Creek
Cataloochee CreekSR 1395 Cataloochee
Pigeon RiverSR 1338 Hepco
Pigeon RiverWaterville
North Toe RiverUS 19E Ingalls
North Toe RiverSR 1162 Penland
South Toe RiverSR 1168 Celo
Cane RiverSR 1343 Sioux
Nolichucky RiverSR 1321 Poplar
Mills RiverSR1337 Mills River
HUC 06010106: Pigeon River
HUC 06010108: Nolichucky River
Minimum EvaluationLevel for Tout waters: 6
Figure 18. Box Plots of Dissolved Oxygen in the French Broad River Basin
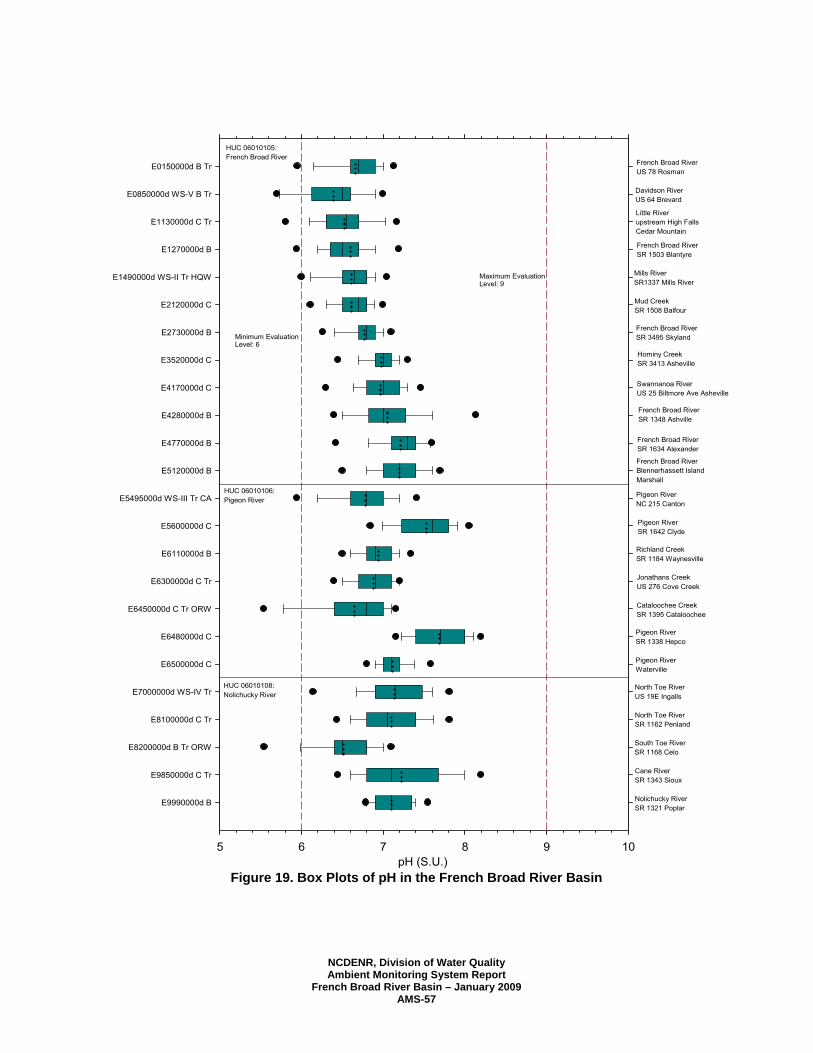
NCDENR, Division of Water Quality Ambient Monitoring System Report
French Broad River Basin – January 2009 AMS-57
pH (S.U.)5 6 7 8 9 10
E9990000d B
E9850000d C Tr
E8200000d B Tr ORW
E8100000d C Tr
E7000000d WS-IV Tr
E6500000d C
E6480000d C
E6450000d C Tr ORW
E6300000d C Tr
E6110000d B
E5600000d C
E5495000d WS-III Tr CA
E5120000d B
E4770000d B
E4280000d B
E4170000d C
E3520000d C
E2730000d B
E2120000d C
E1490000d WS-II Tr HQW
E1270000d B
E1130000d C Tr
E0850000d WS-V B Tr
E0150000d B Tr French Broad RiverUS 78 Rosman
Maximum EvaluationLevel: 9
HUC 06010105: French Broad River
Davidson RiverUS 64 Brevard
Little Riverupstream High FallsCedar Mountain
French Broad RiverSR 1503 Blantyre
Mud CreekSR 1508 Balfour
French Broad RiverSR 3495 Skyland
Hominy CreekSR 3413 Asheville
Swannanoa RiverUS 25 Biltmore Ave Asheville
French Broad RiverSR 1348 Ashville
French Broad RiverSR 1634 Alexander
French Broad RiverBlennerhassett IslandMarshall
Pigeon RiverNC 215 Canton
Pigeon RiverSR 1642 Clyde
Richland CreekSR 1184 Waynesville
Jonathans CreekUS 276 Cove Creek
Cataloochee CreekSR 1395 Cataloochee
Pigeon RiverSR 1338 Hepco
Pigeon RiverWaterville
North Toe RiverUS 19E Ingalls
North Toe RiverSR 1162 Penland
South Toe RiverSR 1168 Celo
Cane RiverSR 1343 Sioux
Nolichucky RiverSR 1321 Poplar
Mills RiverSR1337 Mills River
HUC 06010106: Pigeon River
HUC 06010108: Nolichucky River
Minimum EvaluationLevel: 6
Figure 19. Box Plots of pH in the French Broad River Basin
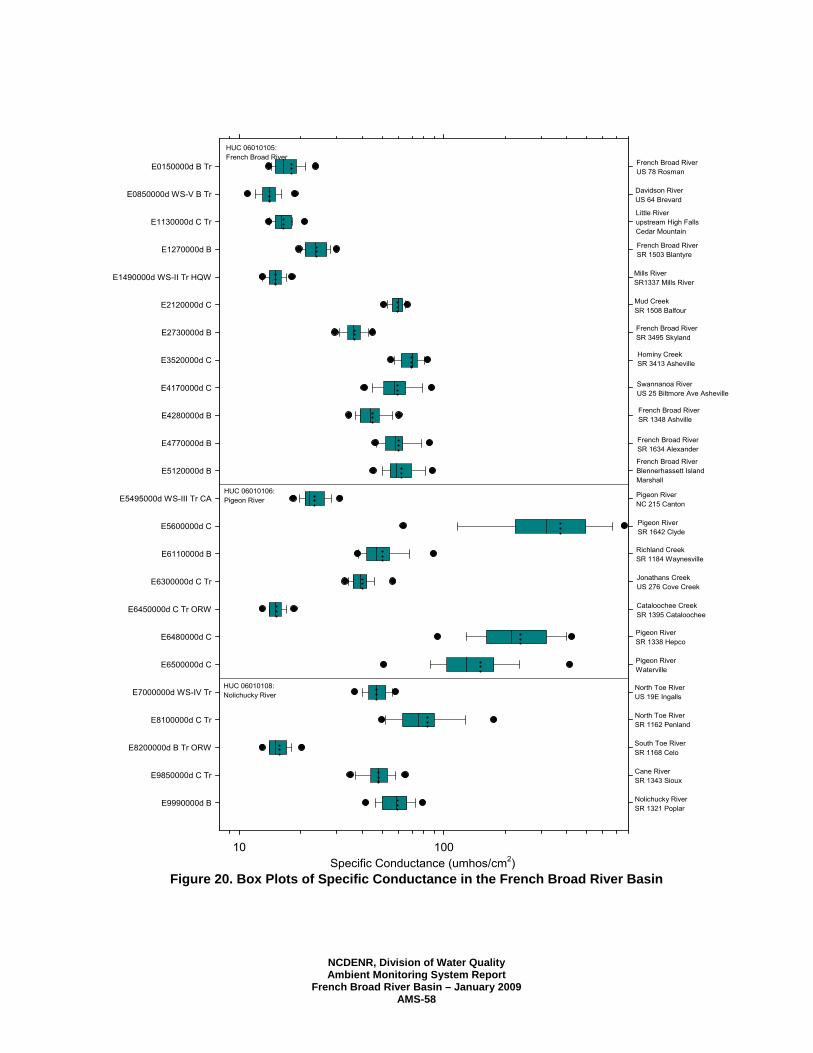
NCDENR, Division of Water Quality Ambient Monitoring System Report
French Broad River Basin – January 2009 AMS-58
Specific Conductance (umhos/cm2)10 100
E9990000d B
E9850000d C Tr
E8200000d B Tr ORW
E8100000d C Tr
E7000000d WS-IV Tr
E6500000d C
E6480000d C
E6450000d C Tr ORW
E6300000d C Tr
E6110000d B
E5600000d C
E5495000d WS-III Tr CA
E5120000d B
E4770000d B
E4280000d B
E4170000d C
E3520000d C
E2730000d B
E2120000d C
E1490000d WS-II Tr HQW
E1270000d B
E1130000d C Tr
E0850000d WS-V B Tr
E0150000d B Tr French Broad RiverUS 78 Rosman
HUC 06010105: French Broad River
Davidson RiverUS 64 Brevard
Little Riverupstream High FallsCedar Mountain
French Broad RiverSR 1503 Blantyre
Mud CreekSR 1508 Balfour
French Broad RiverSR 3495 Skyland
Hominy CreekSR 3413 Asheville
Swannanoa RiverUS 25 Biltmore Ave Asheville
French Broad RiverSR 1348 Ashville
French Broad RiverSR 1634 Alexander
French Broad RiverBlennerhassett IslandMarshall
Pigeon RiverNC 215 Canton
Pigeon RiverSR 1642 Clyde
Richland CreekSR 1184 Waynesville
Jonathans CreekUS 276 Cove Creek
Cataloochee CreekSR 1395 Cataloochee
Pigeon RiverSR 1338 Hepco
Pigeon RiverWaterville
North Toe RiverUS 19E Ingalls
North Toe RiverSR 1162 Penland
South Toe RiverSR 1168 Celo
Cane RiverSR 1343 Sioux
Nolichucky RiverSR 1321 Poplar
Mills RiverSR1337 Mills River
HUC 06010106: Pigeon River
HUC 06010108: Nolichucky River
Figure 20. Box Plots of Specific Conductance in the French Broad River Basin
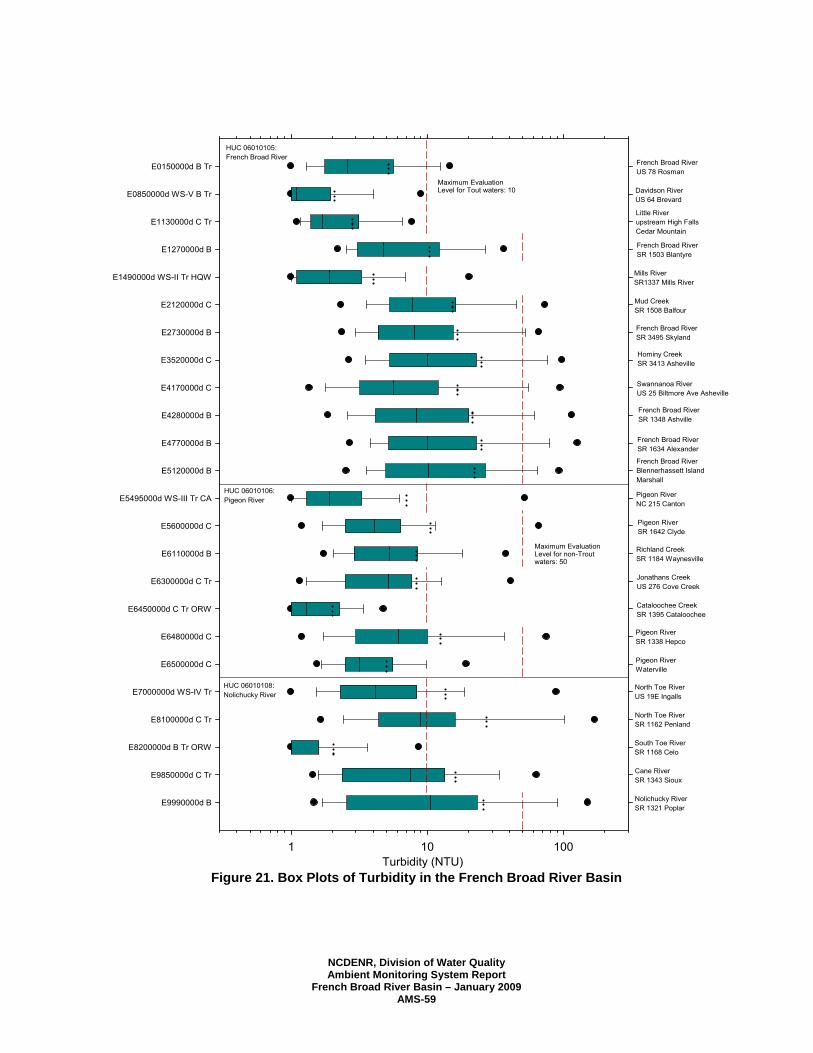
NCDENR, Division of Water Quality Ambient Monitoring System Report
French Broad River Basin – January 2009 AMS-59
Turbidity (NTU)1 10 100
E9990000d B
E9850000d C Tr
E8200000d B Tr ORW
E8100000d C Tr
E7000000d WS-IV Tr
E6500000d C
E6480000d C
E6450000d C Tr ORW
E6300000d C Tr
E6110000d B
E5600000d C
E5495000d WS-III Tr CA
E5120000d B
E4770000d B
E4280000d B
E4170000d C
E3520000d C
E2730000d B
E2120000d C
E1490000d WS-II Tr HQW
E1270000d B
E1130000d C Tr
E0850000d WS-V B Tr
E0150000d B Tr French Broad RiverUS 78 Rosman
Maximum EvaluationLevel for non-Troutwaters: 50
HUC 06010105: French Broad River
Davidson RiverUS 64 Brevard
Little Riverupstream High FallsCedar Mountain
French Broad RiverSR 1503 Blantyre
Mud CreekSR 1508 Balfour
French Broad RiverSR 3495 Skyland
Hominy CreekSR 3413 Asheville
Swannanoa RiverUS 25 Biltmore Ave Asheville
French Broad RiverSR 1348 Ashville
French Broad RiverSR 1634 Alexander
French Broad RiverBlennerhassett IslandMarshall
Pigeon RiverNC 215 Canton
Pigeon RiverSR 1642 Clyde
Richland CreekSR 1184 Waynesville
Jonathans CreekUS 276 Cove Creek
Cataloochee CreekSR 1395 Cataloochee
Pigeon RiverSR 1338 Hepco
Pigeon RiverWaterville
North Toe RiverUS 19E Ingalls
North Toe RiverSR 1162 Penland
South Toe RiverSR 1168 Celo
Cane RiverSR 1343 Sioux
Nolichucky RiverSR 1321 Poplar
Mills RiverSR1337 Mills River
HUC 06010106: Pigeon River
HUC 06010108: Nolichucky River
Maximum EvaluationLevel for Tout waters: 10
Figure 21. Box Plots of Turbidity in the French Broad River Basin

NCDENR, Division of Water Quality Ambient Monitoring System Report
French Broad River Basin – January 2009 AMS-60
Ammonia as Nitrogen (mg/L)0.01 0.1
E8200000d B Tr ORW
E6480000d C
E6450000d C Tr ORW
E5600000d C
E5495000d WS-III Tr CA
E4770000d B
E4280000d B
E3520000d C
E2730000d B
E2120000d C
E1490000d WS-II Tr HQW
E0150000d B Tr French Broad RiverUS 78 Rosman
HUC 06010105: French Broad River
Mud CreekSR 1508 Balfour
French Broad RiverSR 3495 Skyland
Hominy CreekSR 3413 Asheville
French Broad RiverSR 1348 Ashville
French Broad RiverSR 1634 Alexander
Pigeon RiverNC 215 Canton
Pigeon RiverSR 1642 Clyde
Cataloochee CreekSR 1395 Cataloochee
Pigeon RiverSR 1338 Hepco
South Toe RiverSR 1168 Celo
Mills RiverSR1337 Mills River
HUC 06010106: Pigeon River
HUC 06010108: Nolichucky River
Figure 22. Box Plots of Ammonia as Nitrogen in the French Broad River Basin

NCDENR, Division of Water Quality Ambient Monitoring System Report
French Broad River Basin – January 2009 AMS-61
Total Kjeldahl Nitrogen (mg/L)1
E8200000d B Tr ORW
E6480000d C
E6450000d C Tr ORW
E5600000d C
E5495000d WS-III Tr CA
E4770000d B
E4280000d B
E3520000d C
E2730000d B
E2120000d C
E1490000d WS-II Tr HQW
E0150000d B Tr French Broad RiverUS 78 Rosman
HUC 06010105: French Broad River
Mud CreekSR 1508 Balfour
French Broad RiverSR 3495 Skyland
Hominy CreekSR 3413 Asheville
French Broad RiverSR 1348 Ashville
French Broad RiverSR 1634 Alexander
Pigeon RiverNC 215 Canton
Pigeon RiverSR 1642 Clyde
Cataloochee CreekSR 1395 Cataloochee
Pigeon RiverSR 1338 Hepco
South Toe RiverSR 1168 Celo
Mills RiverSR1337 Mills River
HUC 06010106: Pigeon River
HUC 06010108: Nolichucky River
Figure 23. Box Plots of Total Kjeldahl Nitrogen in the French Broad River Basin

NCDENR, Division of Water Quality Ambient Monitoring System Report
French Broad River Basin – January 2009 AMS-62
Nitrates and Nitrites as Nitrogen (mg/L)0.1 1
E8200000d B Tr ORW
E6480000d C
E6450000d C Tr ORW
E5600000d C
E5495000d WS-III Tr CA
E4770000d B
E4280000d B
E3520000d C
E2730000d B
E2120000d C
E1490000d WS-II Tr HQW
E0150000d B TrFrench Broad RiverUS 78 Rosman
HUC 06010105: French Broad River
Mud CreekSR 1508 Balfour
French Broad RiverSR 3495 Skyland
Hominy CreekSR 3413 Asheville
French Broad RiverSR 1348 Ashville
French Broad RiverSR 1634 Alexander
Pigeon RiverNC 215 Canton
Pigeon RiverSR 1642 Clyde
Cataloochee CreekSR 1395 Cataloochee
Pigeon RiverSR 1338 Hepco
South Toe RiverSR 1168 Celo
Mills RiverSR1337 Mills River
HUC 06010106: Pigeon River
HUC 06010108: Nolichucky River
Maximum EvaluationLevel for Water SupplyWaters: 1
Figure 24. Box Plots of Total Nitrate & Nitrite as Nitrogen in the French Broad River Basin
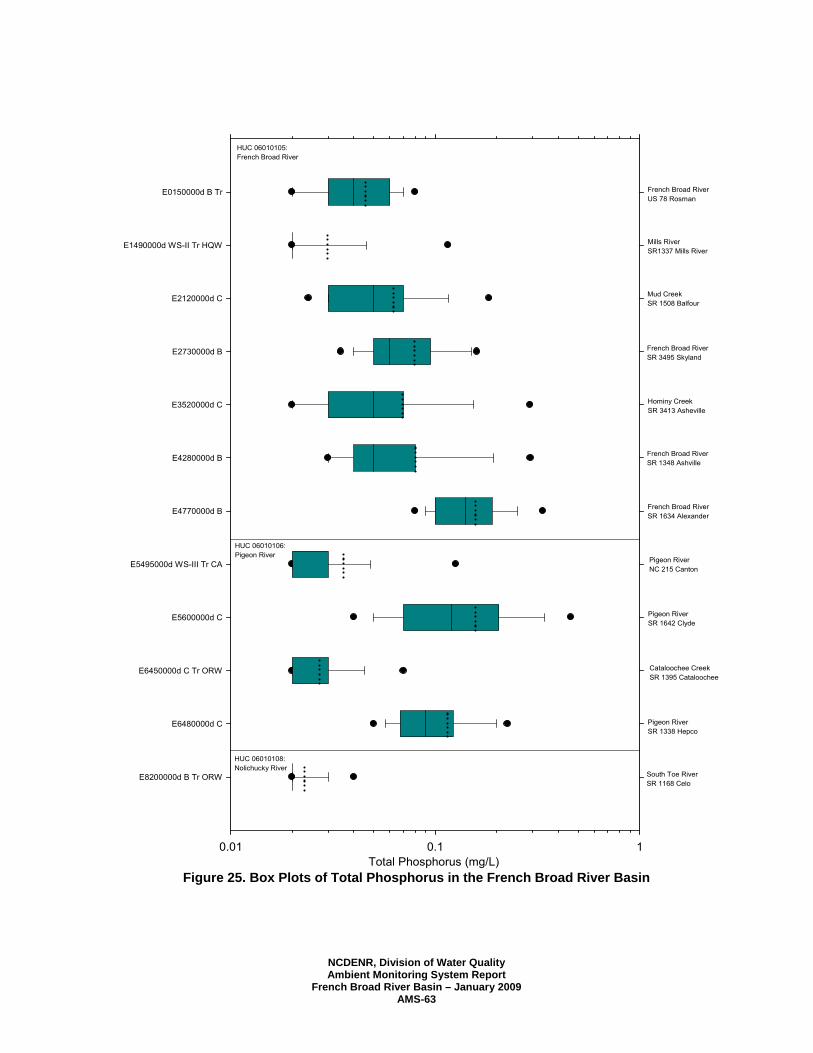
NCDENR, Division of Water Quality Ambient Monitoring System Report
French Broad River Basin – January 2009 AMS-63
Total Phosphorus (mg/L)0.01 0.1 1
E8200000d B Tr ORW
E6480000d C
E6450000d C Tr ORW
E5600000d C
E5495000d WS-III Tr CA
E4770000d B
E4280000d B
E3520000d C
E2730000d B
E2120000d C
E1490000d WS-II Tr HQW
E0150000d B Tr French Broad RiverUS 78 Rosman
HUC 06010105: French Broad River
Mud CreekSR 1508 Balfour
French Broad RiverSR 3495 Skyland
Hominy CreekSR 3413 Asheville
French Broad RiverSR 1348 Ashville
French Broad RiverSR 1634 Alexander
Pigeon RiverNC 215 Canton
Pigeon RiverSR 1642 Clyde
Cataloochee CreekSR 1395 Cataloochee
Pigeon RiverSR 1338 Hepco
South Toe RiverSR 1168 Celo
Mills RiverSR1337 Mills River
HUC 06010106: Pigeon River
HUC 06010108: Nolichucky River
Figure 25. Box Plots of Total Phosphorus in the French Broad River Basin
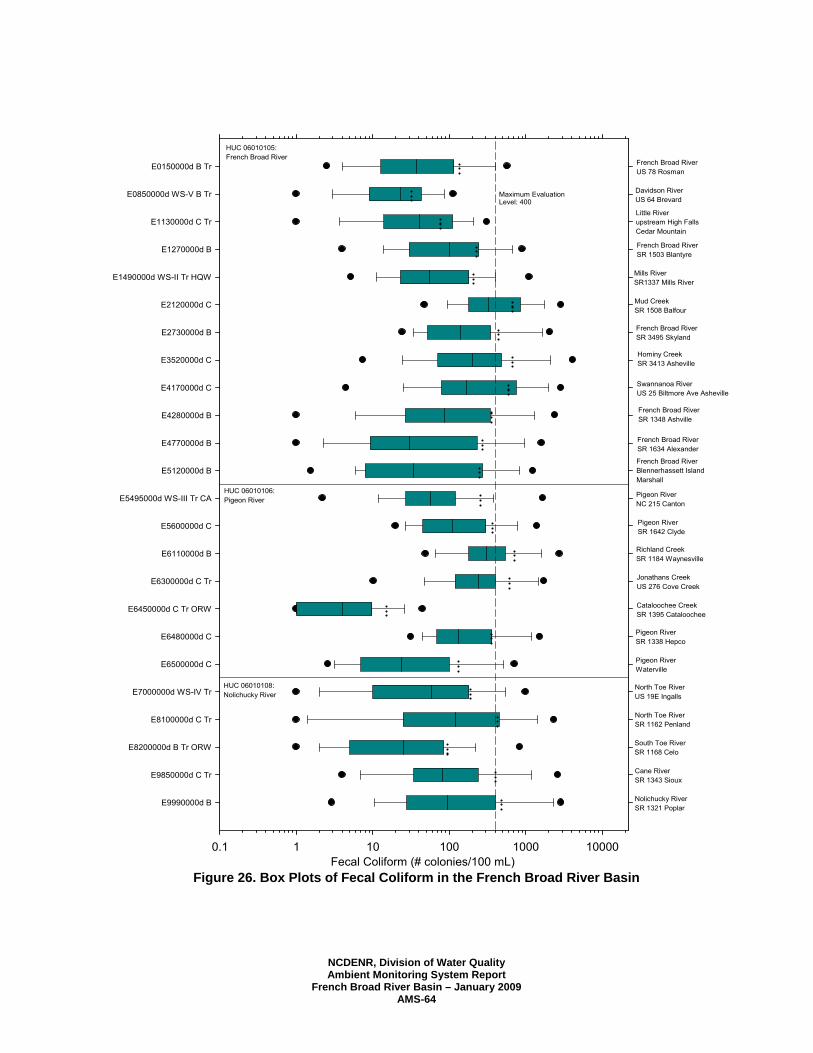
NCDENR, Division of Water Quality Ambient Monitoring System Report
French Broad River Basin – January 2009 AMS-64
Fecal Coliform (# colonies/100 mL)0.1 1 10 100 1000 10000
E9990000d B
E9850000d C Tr
E8200000d B Tr ORW
E8100000d C Tr
E7000000d WS-IV Tr
E6500000d C
E6480000d C
E6450000d C Tr ORW
E6300000d C Tr
E6110000d B
E5600000d C
E5495000d WS-III Tr CA
E5120000d B
E4770000d B
E4280000d B
E4170000d C
E3520000d C
E2730000d B
E2120000d C
E1490000d WS-II Tr HQW
E1270000d B
E1130000d C Tr
E0850000d WS-V B Tr
E0150000d B Tr French Broad RiverUS 78 Rosman
Maximum EvaluationLevel: 400
HUC 06010105: French Broad River
Davidson RiverUS 64 Brevard
Little Riverupstream High FallsCedar Mountain
French Broad RiverSR 1503 Blantyre
Mud CreekSR 1508 Balfour
French Broad RiverSR 3495 Skyland
Hominy CreekSR 3413 Asheville
Swannanoa RiverUS 25 Biltmore Ave Asheville
French Broad RiverSR 1348 Ashville
French Broad RiverSR 1634 Alexander
French Broad RiverBlennerhassett IslandMarshall
Pigeon RiverNC 215 Canton
Pigeon RiverSR 1642 Clyde
Richland CreekSR 1184 Waynesville
Jonathans CreekUS 276 Cove Creek
Cataloochee CreekSR 1395 Cataloochee
Pigeon RiverSR 1338 Hepco
Pigeon RiverWaterville
North Toe RiverUS 19E Ingalls
North Toe RiverSR 1162 Penland
South Toe RiverSR 1168 Celo
Cane RiverSR 1343 Sioux
Nolichucky RiverSR 1321 Poplar
Mills RiverSR1337 Mills River
HUC 06010106: Pigeon River
HUC 06010108: Nolichucky River
Figure 26. Box Plots of Fecal Coliform in the French Broad River Basin

NCDENR, Division of Water Quality Ambient Monitoring System Report
French Broad River Basin – January 2009 AMS-65
Appendix C: References

NCDENR, Division of Water Quality Ambient Monitoring System Report
French Broad River Basin – January 2009 AMS-66
North Carolina Division of Water Quality, North Carolina Administrative Code Section 15A 2B .0200 (Red Book), May 1, 2007.
North Carolina Division of Water Quality, Planning Section Website, 303d and 305b Lists, http://h2o.enr.state.nc.us/tmdl/General_303d.htm.
North Carolina Division of Water Quality, 2004 French Broad River Basinwide Assessment Report. North Carolina Division of Water Quality, 2007 Catawba River Basinwide Assessment Report. Pi-Erh Lin, Duane Meeter, and Xu-Feng Niu, A Nonparametric Procedure for Listing and Delisting Impaired Waters
Based on Criterion Exceedances, Florida State University,Tallahassee, FL., October 2000.
Related Documents