Freed from Illiteracy? A Closer Look at Venezuela’s Robinson Literacy Campaign * Daniel Ortega Instituto de Estudios Superiores de Administración Francisco Rodríguez Wesleyan University October 2006 JEL Codes: I21, I38. Keywords: Literacy Programs, Venezuela, Household Surveys. * We thank the Venezuelan National Institute of Statistics for providing access to the Household Surveys and Sergio Guerra for excellent research assistance. This paper has benefited from lengthy discussions with Chang- Tai Hsieh and Edward Miguel, who collaborated in an earlier version of this paper. María Eugenia Boza, Ricardo Hausmann, Manolis Kaparakis, José Pineda, Sanjay Reddy, Cameron Shelton, Alberto Unanue, Mark Weisbrot, and seminar participants at the New School for Social Research, the 2007 NECLAS Annual Meeting and the Woodrow Wilson School also provided valuable comments and suggestions. Corresponding author: Francisco Rodriguez, [email protected], Wesleyan University, 238 Church Street, Middletown, CT 06459. 1

Welcome message from author
This document is posted to help you gain knowledge. Please leave a comment to let me know what you think about it! Share it to your friends and learn new things together.
Transcript
Freed from Illiteracy?
A Closer Look at Venezuela’s Robinson Literacy Campaign*
Daniel Ortega
Instituto de Estudios Superiores de Administración
Francisco Rodríguez
Wesleyan University
October 2006
JEL Codes: I21, I38. Keywords: Literacy Programs, Venezuela, Household Surveys.
* We thank the Venezuelan National Institute of Statistics for providing access to the Household Surveys and Sergio Guerra for excellent research assistance. This paper has benefited from lengthy discussions with Chang-Tai Hsieh and Edward Miguel, who collaborated in an earlier version of this paper. María Eugenia Boza, Ricardo Hausmann, Manolis Kaparakis, José Pineda, Sanjay Reddy, Cameron Shelton, Alberto Unanue, Mark Weisbrot, and seminar participants at the New School for Social Research, the 2007 NECLAS Annual Meeting and the Woodrow Wilson School also provided valuable comments and suggestions. Corresponding author: Francisco Rodriguez, [email protected], Wesleyan University, 238 Church Street, Middletown, CT 06459.
1
Abstract
We evaluate the success of the Venezuelan government’s latest nation-wide
literacy program, Misión Robinson, using official Venezuelan government
survey data. Controlling for existing trends in literacy rates by age groups
over the period 1975 to 2005, we find at most a small positive effect of
Robinson on literacy rates, and in many specifications the program impact is
statistically indistinguishable from zero. This main result is robust to time
series analysis by birth cohort, and to state-level difference-in-differences
estimation. The results appear to be inconsistent with recent official claims of
the complete eradication of illiteracy in Venezuela, but resonate with existing
research on other adult literacy programs, which have usually been expensive
failures.
2

I. Introduction
On October 28, 2005, the Venezuelan government announced that the country had
been declared “Illiteracy-Free Territory”1, marking the success of the two-year old national
literacy campaign Misión Robinson. According to the statement, between the start of the
program and the announcement, the Cuban designed Yo Sí Puedo program had helped teach
1,482,543 persons how to read and write (Gobierno Bolivariano de Venezuela, 2005b, p.5).
The achievement received considerable international recognition, and is generally taken at
face value by specialists as well as by casual observers. A recent article in the San Francisco
Chronicle, for example, reports that “illiteracy, formerly at 10 percent of the population, has
been completely eliminated.” UNESCO’s latest Education for All Global Monitoring Report
reports that 1 million people learned to read and write in Venezuela between July 2003 and
December 20052.
If true, the success of the Venezuelan program would have significant implications for
the design of literacy programs in developing countries. The literature on literacy programs in
the developing world has generally been skeptical of large-scale adult literacy programmes,
which tend to be plagued by low initial enrolments, high dropout rates, and rapid loss of
acquired skills (Romain and Armstrong, 1987). Abadzi (1994) found that the percentage of
students passing exams in large scale literacy programs ranged between a low of 8 percent
and high of 47 percent. This general scepticism has been a main cause for a substantial
reduction of World Bank financing of adult literacy programs since 1990 (Chowdury, 1995).
If Misión Robinson has indeed achieved the results claimed by the Venezuelan government, it
would demonstrate that adequately designed large-scale national programmes can be
successful at reducing illiteracy, with possible implications for many other countries.
3
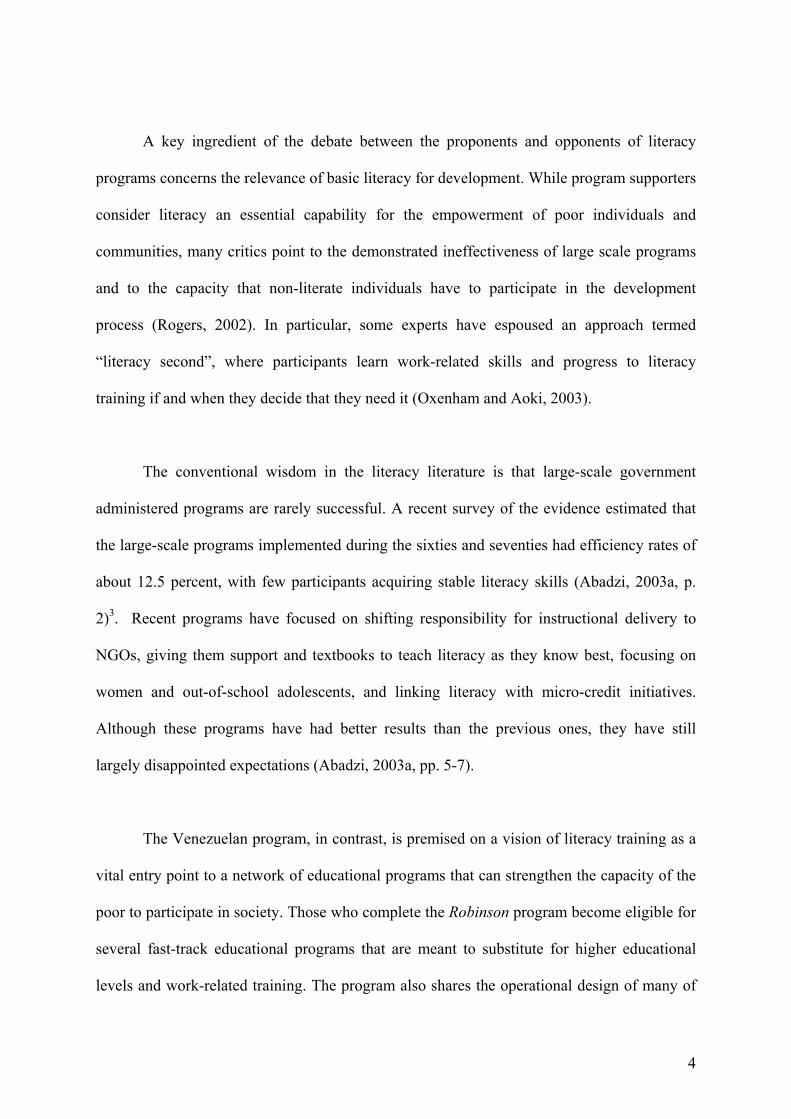
A key ingredient of the debate between the proponents and opponents of literacy
programs concerns the relevance of basic literacy for development. While program supporters
consider literacy an essential capability for the empowerment of poor individuals and
communities, many critics point to the demonstrated ineffectiveness of large scale programs
and to the capacity that non-literate individuals have to participate in the development
process (Rogers, 2002). In particular, some experts have espoused an approach termed
“literacy second”, where participants learn work-related skills and progress to literacy
training if and when they decide that they need it (Oxenham and Aoki, 2003).
The conventional wisdom in the literacy literature is that large-scale government
administered programs are rarely successful. A recent survey of the evidence estimated that
the large-scale programs implemented during the sixties and seventies had efficiency rates of
about 12.5 percent, with few participants acquiring stable literacy skills (Abadzi, 2003a, p.
2)3. Recent programs have focused on shifting responsibility for instructional delivery to
NGOs, giving them support and textbooks to teach literacy as they know best, focusing on
women and out-of-school adolescents, and linking literacy with micro-credit initiatives.
Although these programs have had better results than the previous ones, they have still
largely disappointed expectations (Abadzi, 2003a, pp. 5-7).
The Venezuelan program, in contrast, is premised on a vision of literacy training as a
vital entry point to a network of educational programs that can strengthen the capacity of the
poor to participate in society. Those who complete the Robinson program become eligible for
several fast-track educational programs that are meant to substitute for higher educational
levels and work-related training. The program also shares the operational design of many of
4
the large scale literacy programs of the sixties and seventies: management and instructional
delivery are government-administered, the courses are brief (lasting seven weeks), there is no
role for NGO participation, and there is no systematic effort to evaluate reading speed.
Evidence of success of the Robinson program would shed doubt on the recent conventional
wisdom on the design of successful interventions.
This paper will assess the evidence of the success of the Robinson program using
evidence from the Venezuelan Household Surveys, which includes self-reports on literacy, to
evaluate official claims of having wiped out illiteracy and to assess the effectiveness of the
program. We examine country-level impacts using a battery of alternative time-series
methods in an attempt to estimate whether the implementation of Robinson coincides with
significant reductions in overall Venezuelan illiteracy. We also adopt a more disaggregated
state-level approach, combining official data on the number of Misión Robinson literacy
trainers enrolled by state with the household data, in order to evaluate whether states that
experienced higher program intensity also witnessed larger reductions in illiteracy over time.
In both cases we find evidence for, at most, small positive literacy gains as a result of the
program, though in many specifications Robinson program impacts are statistically
indistinguishable from zero.
II. The Venezuelan Literacy Program Misión Robinson
Misión Robinson, also known as the Simón Rodríguez Extraordinary Literacy
Program, was launched by the Venezuelan government in a nationally televised program on
July 1, 2003. The program uses the “Yo Sí Puedo” (“Yes I Can”) method designed by Cuban
5
educator Leonela Relys, which consists of sixty-five 45-minute video classes and practical
exercises supervised by trained instructors4.
The “Yo Sí Puedo” method builds on the fact that non-literate individuals are often
familiar with numbers by asking students to identify unknown letters with known numbers.
In Misión Robinson, each class is supervised by a government-appointed trainer who assists
students in carrying out exercises and in evaluating their progress. Trainers were paid a
monthly stipend of 160.000 Bs. (US$100). The intensive course lasts seven weeks, by the end
of which students are expected to be able to write a letter to demonstrate their acquisition of
skills. Graduates have immediate access to Misión Robinson 2, a follow-up program
designed to provide the equivalent of a primary school education5.
According to official announcements, the program was successful in almost
completely eradicating illiteracy in Venezuela. Although there is some variation in the figures
presented by different government spokespersons, estimates generally range between 1.4 and
1.5 million. However, the precise source of these claims remains unclear. Although the
program was overseen by a Presidential Commission (Comisión Nacional de Alfabetización),
it has not published any official reports describing the methodology used to arrive at the
estimates of the reduction in illiteracy. It is likely that these estimates were arrived at on the
basis of the collected field reports of trainers and program supervisors.
One puzzling fact about the government’s claim is that, according to official statistics,
the number of illiterate Venezuelans before the start of Misión Robinson was already well
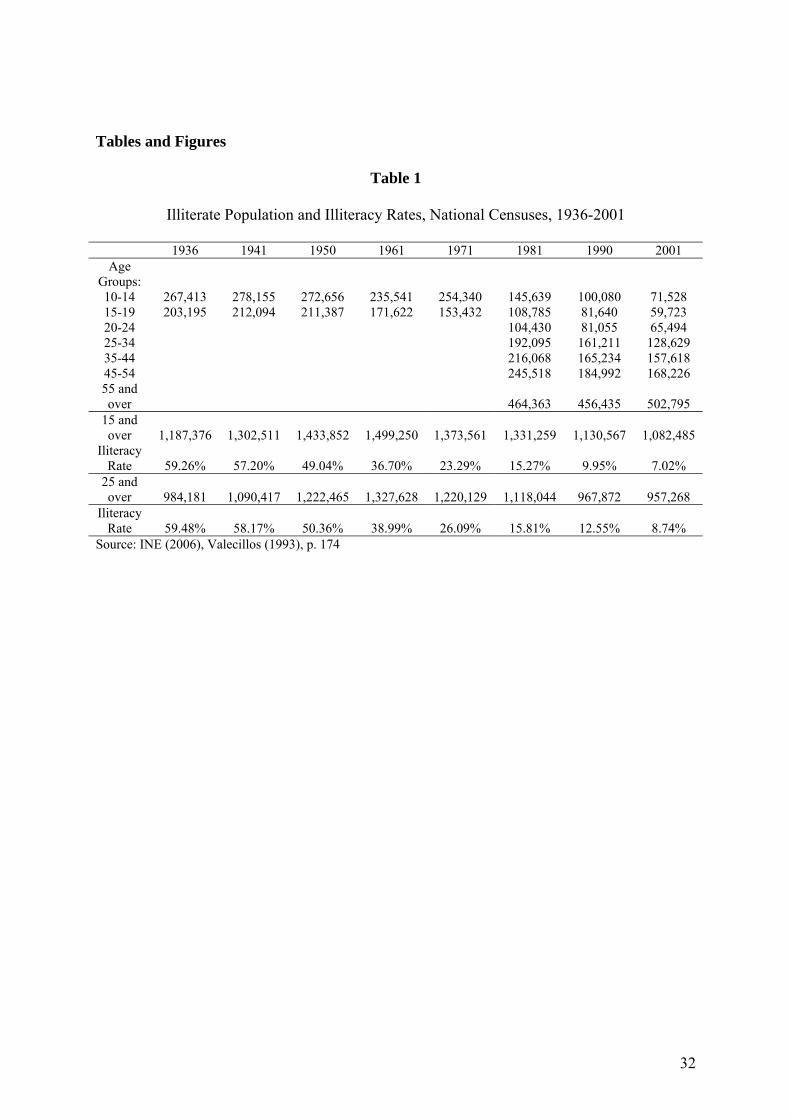
below 1.5 million persons. Table 1 presents the evolution of Venezuelan illiteracy as reported
by the national censuses from 1936 to 20016. The pre-Robinson 2001 census reports only
6
1.08 million illiterate Venezuelans of age 15 and greater – the standard UNESCO threshold -
in 2001. Indeed, according to the census data, Venezuela appears to never have had as many
as 1.5 million illiterate adults during the past seventy years.
This inconsistency was recognized by Education Minister Aristóbulo Istúriz, who has
claimed that the Census figure of 1.2 million illiterate individuals underestimated illiteracy
rates and that estimates carried out by the Ministry of Education in 2003 had put the number
of illiterates at the higher 1.5 million7. These estimates referred to by the minister do not
appear in any official publication and are therefore difficult to evaluate8. If we take this figure
to be correct, the government’s claim of having taught how to read and write to 1.4-1.5
million persons would imply a reduction of illiteracy to less than 0.1% of the country’s adult
population. According to UNDP (2005), no country outside the original OECD and Eastern
Europe has an adult illiteracy rate lower than 0.1%9. The highest literacy rate in Latin
America is that of Uruguay, at 97.7%. Cuba’s literacy rate is 96.9%10.
III. Empirical Analysis
1. Data
The analysis in our paper will be based on the National Statistical Institute’s (Instituto
Nacional de Estadística, INE) Household Survey. This survey, which is available through the
second half of 2005, has included a question on self-reported literacy since 1975. In the
survey, interviewers ask respondents the following question: “Does this family member know
how to read and write?” (“¿Sabe leer y escribir?”). The question is asked to the person or
persons present at the moment of the interview about all household members.
7
The focus of our analysis will be a set of pre and post-Misión Robinson estimates of
literacy rates based on answers to this question. Unfortunately, no attempt is made by the
interviewer to directly assess the respondent’s real reading skills. One concern with a self-
report of this kind is that some newly literate or semi-literate people may exaggerate their
reading skills, thus overstating the effect of a literacy program. This possible response bias
arguably allows us to place upper bounds on estimated program impacts, as discussed below.
We will start by analyzing whether the implementation of Robinson is associated with
a change from the long-run trend evolution of literacy in the national data. We test whether
this discontinuity or break in trend occurs for different age subgroups as well as by national
cohorts and different econometric specifications. This analysis is obviously limited by the
fact that Robinson may have coincided with other changes in economic and social trends that
also affected illiteracy. Our second set of estimates will thus rely on the analysis of the
evolution of state and state-cohort literacy rates and their relation with two measured of
program intensity derived from official statistics on program trainers by state.
The data on trainers is derived from two official sources: The 2004 Annual Report of
the Education Ministry, (Ministerio de Educación, Cultura y Deportes, 2005, p. 913), and the
electronic database of the Ministry of Planning and Development’s School of Social Work.
(Ministerio de Planificación y Desarrollo, 2006). The latter series reports a total of 110,703
trainers involved in Misión Robinson, while the former claims a considerably higher figure,
210,353 trainers. The difference between the series may be due to the high turnover rates of
trainers, which some informal field reports have put at around 40%11.
8
2. Analysis of National Time Series Trends
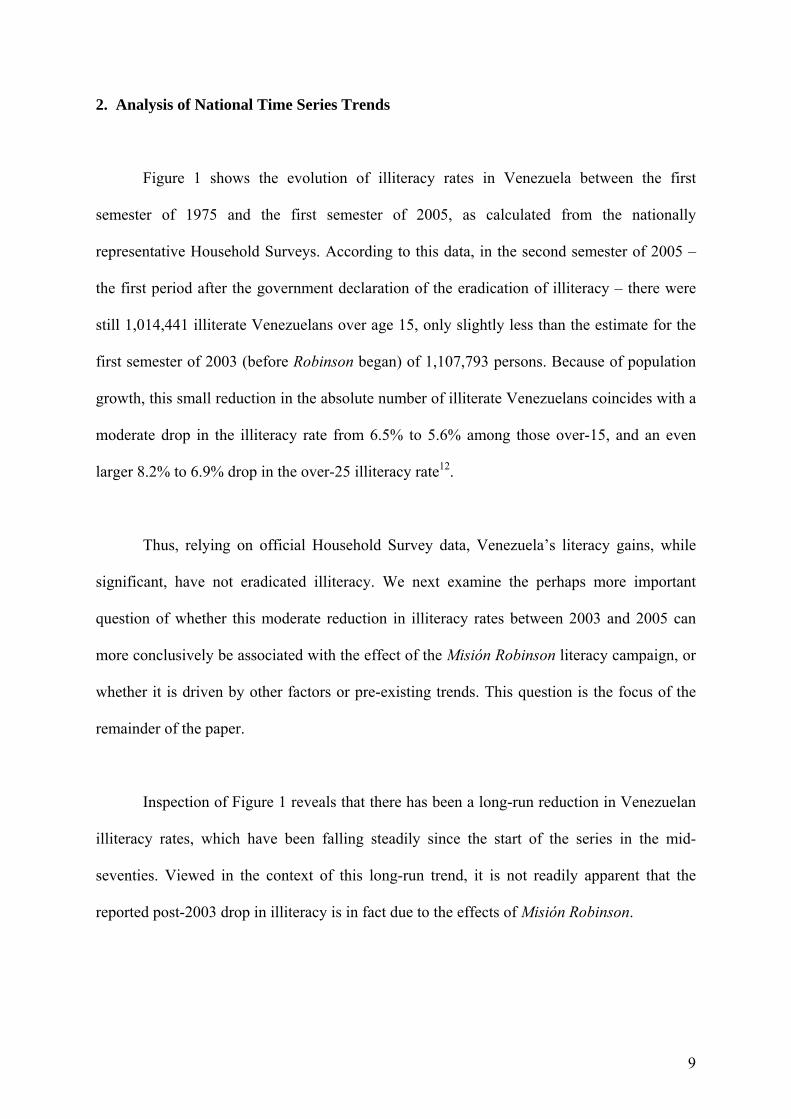
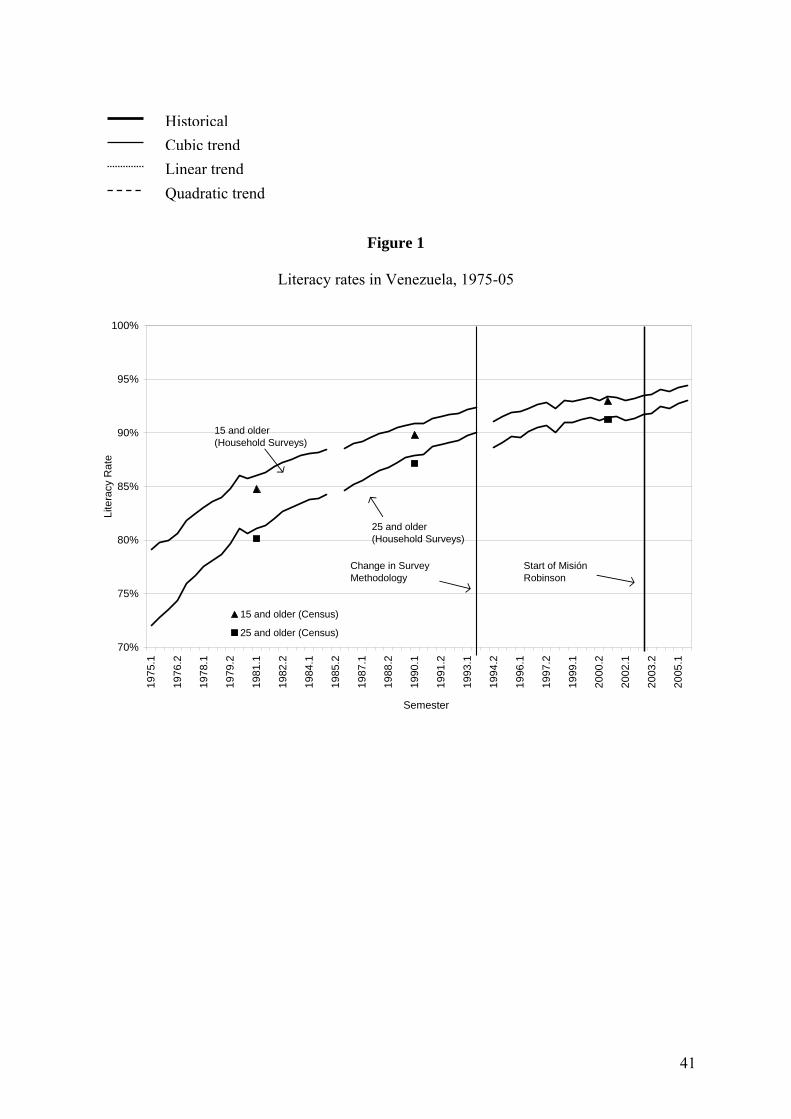
Figure 1 shows the evolution of illiteracy rates in Venezuela between the first
semester of 1975 and the first semester of 2005, as calculated from the nationally
representative Household Surveys. According to this data, in the second semester of 2005 –
the first period after the government declaration of the eradication of illiteracy – there were
still 1,014,441 illiterate Venezuelans over age 15, only slightly less than the estimate for the
first semester of 2003 (before Robinson began) of 1,107,793 persons. Because of population
growth, this small reduction in the absolute number of illiterate Venezuelans coincides with a
moderate drop in the illiteracy rate from 6.5% to 5.6% among those over-15, and an even
larger 8.2% to 6.9% drop in the over-25 illiteracy rate12.
Thus, relying on official Household Survey data, Venezuela’s literacy gains, while
significant, have not eradicated illiteracy. We next examine the perhaps more important
question of whether this moderate reduction in illiteracy rates between 2003 and 2005 can
more conclusively be associated with the effect of the Misión Robinson literacy campaign, or
whether it is driven by other factors or pre-existing trends. This question is the focus of the
remainder of the paper.
Inspection of Figure 1 reveals that there has been a long-run reduction in Venezuelan
illiteracy rates, which have been falling steadily since the start of the series in the mid-
seventies. Viewed in the context of this long-run trend, it is not readily apparent that the
reported post-2003 drop in illiteracy is in fact due to the effects of Misión Robinson.
9
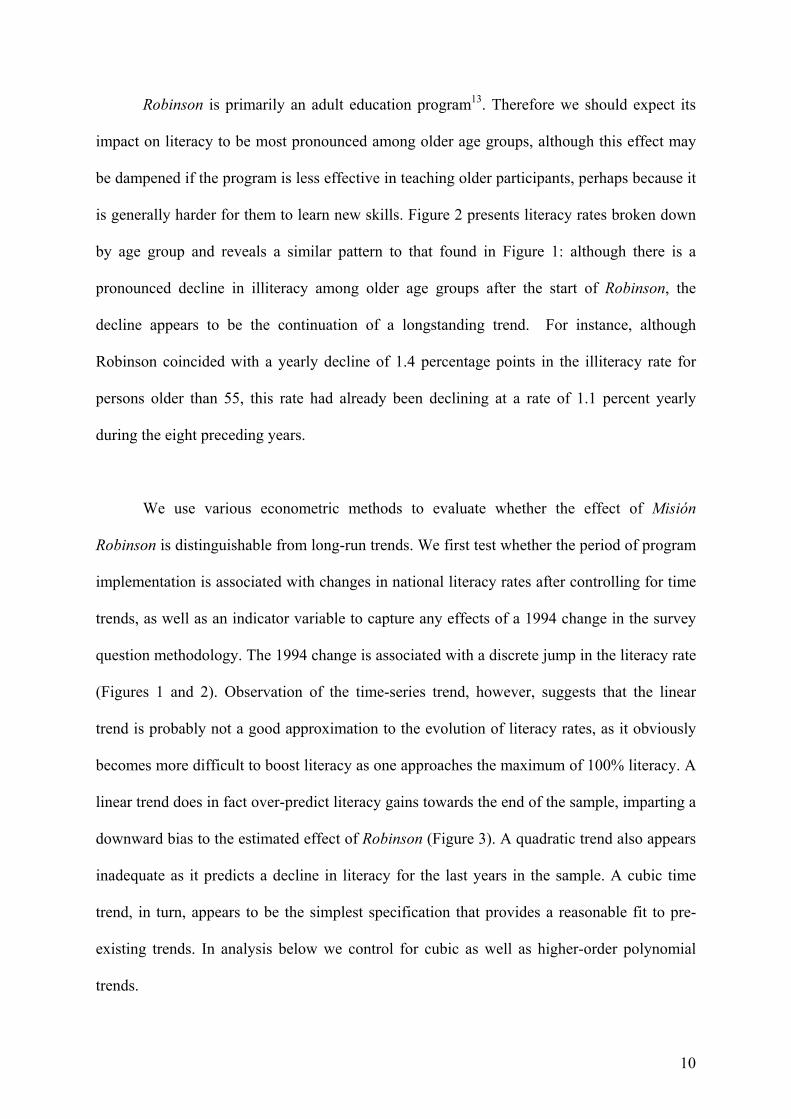
Robinson is primarily an adult education program13. Therefore we should expect its
impact on literacy to be most pronounced among older age groups, although this effect may
be dampened if the program is less effective in teaching older participants, perhaps because it
is generally harder for them to learn new skills. Figure 2 presents literacy rates broken down
by age group and reveals a similar pattern to that found in Figure 1: although there is a
pronounced decline in illiteracy among older age groups after the start of Robinson, the
decline appears to be the continuation of a longstanding trend. For instance, although
Robinson coincided with a yearly decline of 1.4 percentage points in the illiteracy rate for
persons older than 55, this rate had already been declining at a rate of 1.1 percent yearly
during the eight preceding years.
We use various econometric methods to evaluate whether the effect of Misión
Robinson is distinguishable from long-run trends. We first test whether the period of program
implementation is associated with changes in national literacy rates after controlling for time
trends, as well as an indicator variable to capture any effects of a 1994 change in the survey
question methodology. The 1994 change is associated with a discrete jump in the literacy rate
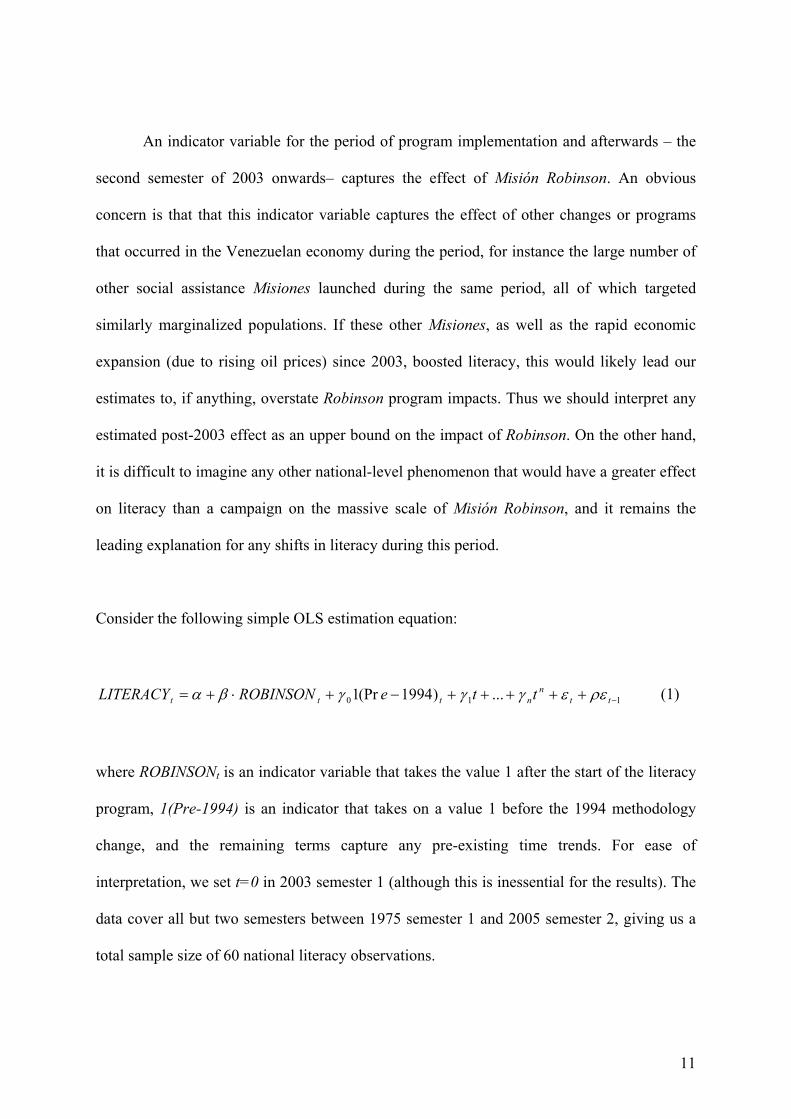
(Figures 1 and 2). Observation of the time-series trend, however, suggests that the linear
trend is probably not a good approximation to the evolution of literacy rates, as it obviously
becomes more difficult to boost literacy as one approaches the maximum of 100% literacy. A
linear trend does in fact over-predict literacy gains towards the end of the sample, imparting a
downward bias to the estimated effect of Robinson (Figure 3). A quadratic trend also appears
inadequate as it predicts a decline in literacy for the last years in the sample. A cubic time
trend, in turn, appears to be the simplest specification that provides a reasonable fit to pre-
existing trends. In analysis below we control for cubic as well as higher-order polynomial
trends.
10
An indicator variable for the period of program implementation and afterwards – the
second semester of 2003 onwards– captures the effect of Misión Robinson. An obvious
concern is that that this indicator variable captures the effect of other changes or programs
that occurred in the Venezuelan economy during the period, for instance the large number of
other social assistance Misiones launched during the same period, all of which targeted
similarly marginalized populations. If these other Misiones, as well as the rapid economic
expansion (due to rising oil prices) since 2003, boosted literacy, this would likely lead our
estimates to, if anything, overstate Robinson program impacts. Thus we should interpret any
estimated post-2003 effect as an upper bound on the impact of Robinson. On the other hand,
it is difficult to imagine any other national-level phenomenon that would have a greater effect
on literacy than a campaign on the massive scale of Misión Robinson, and it remains the
leading explanation for any shifts in literacy during this period.
Consider the following simple OLS estimation equation:
110 ...)1994(Pr1 −+++++−+⋅+= ttn
nttt tteROBINSONLITERACY ρεεγγγβα (1)
where ROBINSONt is an indicator variable that takes the value 1 after the start of the literacy
program, 1(Pre-1994) is an indicator that takes on a value 1 before the 1994 methodology
change, and the remaining terms capture any pre-existing time trends. For ease of
interpretation, we set t=0 in 2003 semester 1 (although this is inessential for the results). The
data cover all but two semesters between 1975 semester 1 and 2005 semester 2, giving us a
total sample size of 60 national literacy observations.
11
Controlling for a cubic time trend (Table 2, column 1) the estimated Robinson effect
is slightly negative but statistically insignificant, with an estimated drop in literacy of only
0.2 percentage points associated with the program (the 95% confidence interval ranges from -
.008 to .004). Any gains in literacy in Venezuela between 2003 and 2005 appear likely to
reflect long-standing trends in Venezuelan society rather than the impact of Misión Robinson.
Focusing on those aged 25 and older, who were more likely to enroll in Robinson than
adolescents, yields very similar results: Robinson is associated with a small and statistically
insignificant decrease in literacy of 0.09 percentage points with a cubic time control (Table 2,
column 3).
In order to verify that our results are not caused by misspecification of the time trend
term, Table 2 shows an additional pair of specifications, in which the order of the Taylor
approximation used to capture the time trend is selected by introducing additional polynomial
time terms until the marginal time polynomial term lacks statistically significant predictive
power. In our data, this method selects a sixth order polynomial trend. Controlling for this
polynomial (Table 2, columns 2 and 4) yields a positive and statistically insignificant effect
of Robinson on both the over-15 (.0029, s.e.=.0018) and the over-25 (.0033, s.e.=.0022)
national literacy rates. The increase in the literacy rate associated with Robinson according to
the point estimates of this specification are in both cases less than one-half of the increase in
national literacy experienced between the first semester of 2003 and the first semester of
2005. They would imply that Misión Robinson coincided with an above-trend increase of
49,431 in the number of literate Venezuelans aged 15 or over, and 43,299 among those aged
25 or over, by 2005, although note that even these very modest gains are not robust to even
seemingly minor changes in how we control pre-existing time trends. This gain is only a tiny
fraction of the 957,268 people who were illiterate according to government statistics in 2001.
12
We next turn to estimating more disaggregated effects by age subgroups. Column (1)
of Table 3 reports the coefficients obtained from estimation of equation (1) for each of five
distinct age groups (15 to 24, 25 to 34, 35 to 44, 45 to 54 and 55 or older), with the system is
then estimated by Seemingly Unrelated Regressions (SUR). For comparison purposes, we
also report the OLS estimates for the whole adult population. Reported results include a cubic
time trend control14. The results are again very similar: for none of the age groups do we find
a statistically significant effect of Robinson, and a joint test of the significance of the age
group effects is also insignificant (p=.469). Effects on literacy are statistically
indistinguishable from zero, although the point estimates range from 0.01 percentage points
for those aged 35-44 up to 0.55 percentage points for the over-55 group. This corresponds to
a reduction in illiteracy in this age group of roughly 1/6 of the total reduction observed
between the first semester of 2003 and the second semester of 2005.
Table 3 also shows a number of additional robustness tests which try slightly different
specifications of the potential Robinson effect. A potential source of misspecification may
come from the fact that the program’s effects are observed with a lag. Since the program
courses are designed to last seven weeks, it is probable that Household Survey respondents
enrolled in Robinson will not report having learned to read and write until the semester after
taking the course. In order to determine whether this affects the main results, we report in
column (2) the result of running our same tests with the ROBINSON indicator variable term
lagged by one semester, thus taking on a value of one after the first semester of 2004. This
makes little difference in the estimated program impacts (column 2, Table 3). The SUR
coefficient estimates on the older age groups now become marginally statistically significant.
Somewhat surprisingly, so does the coefficient on the 15-24 age subgroup. Yet even in the
13
case of this age group, the largest estimated effect in the table, the magnitude remains
moderate at a 1.18 percentage point literacy gain.
As we have argued previously, individuals may exaggerate their literacy in self-
reported assessments. Ideally, we could limit this bias by restricting our sample to the
assessment by respondents of the literacy status of other family members. Regrettably, the
National Institute stopped identifying the family member that served as informant in its
database in 2000. Using surveys previous to that year, we have indeed found that informants’
assessment of their own literacy tends to be consistently higher than their assessment of
others’ status, even after controlling for gender, education, age, and head of household status
of the subject assessed15. We have also found that the literacy status for heads of households
and their spouses is much more likely to be self-reported than that of other household
members16. Column 3 of Table 3 thus uses literacy estimates derived from individuals other
than the head of household or their spouse. The coefficient of Robinson is now positive, but
very far from economically or statistically significant. Since the age composition of the
restricted subsample is very different from that of the population as a whole, it may make
more sense to concentrate on the estimates for age subgroups. Here we find that the point
estimate actually turns negative for three of the five age subgroups, and is statistically
insignificant for all the subgroups. Restricting the sample to answers that are less likely to be
self-reported thus does not seem to strengthen the evidence in favour of program
effectiveness.
Our baseline specification tests for a discontinuity in literacy rates associated with the
implementation of the program. The fourth and fifth columns of Table 3 try two alternative
specifications that introduce a continuous effect. In the first one the effect of Robinson is
14
assumed to increase uniformly in every period during which the program was in operation17.
This specification attributes no significant effect to Robinson on the oldest age subgroup but
does find a significant effect on the youngest age subgroup, of a still moderate 1.64
percentage points. The second specification evaluates instead whether the implementation of
the program coincided with a change in the trend of literacy rates by testing for the
significance of an interaction between the Robinson dummy and the terms that make up the
cubic time trend. In none of the cases do we find statistical evidence that a break in trend can
be associated with the program.
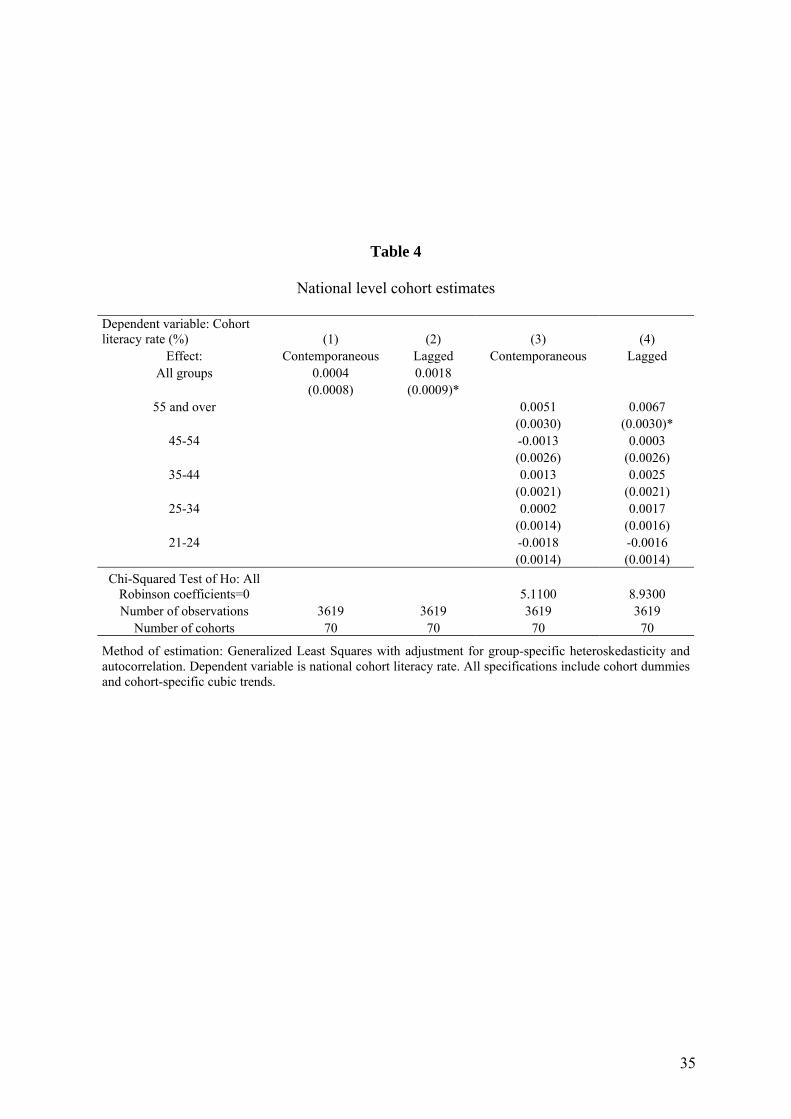
Table 4 presents the result of a specification very similar to equation 1, but in which
the dependent variable is the birth cohort-specific literacy rate, controlling for a cohort fixed
effect and cohort-specific time trends. We report specifications with both the
contemporaneous and the lagged specification. In columns (1) and (2) we restrict all cohorts
to have the same coefficient on Robinson, while in columns (3) and (4) we allow those
coefficients to vary by groups of cohorts classified according to their age in the last semester
of our sample.
A virtue of this specification is that the cohort-specific literacy rates will not be as
affected by changes in composition as age-specific regressions are. Age-specific literacy rates
will tend to increase over time as their composition changes from older, less literate cohorts,
which either die or exit the group, to younger cohorts that enter the group. This effect is
absent in the cohort-specific rates18. In the analysis we denote cohorts by their age in 2005
and keep only the cohorts for which we have at least three years of observations previous to
the implementation of Robinson in mid-2003. We also drop all cohorts older than 90 years
15
(which accounted for 0.14% of the population at the start of the program) since we have too
few observations to reliably calculate literacy rates for them.
The results of this specification are broadly similar to those of the previous exercise,
but with some interesting distinctions. While the contemporaneous specification gives a
positive insignificant coefficient, the lagged specification gives a borderline statistically
significant but economically small coefficient estimate which implies an overall increase in
literacy of 0.18 percentage points attributable to the program. When we break up the exercise
by age groups, we find that only the 55 and over cohort sees a positive, borderline significant
coefficient. Except for this cohort, all remaining estimated effects are far from statistical
significance and some are negative. The point estimate on the over-55 age subgroup, (.51-.67
percentage points) is slightly lower than that which is estimated in the analogous
specifications in Table 3, although the effects are not strictly comparable.
In sum, the analysis of time series trends fails to consistently find that Misión
Robinson had a significant impact on aggregate literacy rates in Venezuela. If there is such an
effect, according to our estimates, it is positive but quite small, a reduction of well under one
percentage point in illiteracy in most regression specifications. The bulk of program impact
estimates are positive but small and not statistically significant at traditional confidence
levels, with some of them small and negative. Most of the estimates presented in this section
are essentially precisely estimated zeroes, as the standard errors of the estimated coefficients
tend to be very low (between .001 and .004 for most estimates).19 The largest point estimate
for the national data presented in this section (Table 3, column 2) associates the program with
an increase in the literacy rate of 0.54 percentage points, representing 65,748 adults. A few
of our age group specifications do appear to capture a significant effect of Robinson of the
16
self-reported literacy rates of the 55 and older group. Even this effect, which our estimates
put well below 1 percentage point, is at best a minor contributor to the increase in the
aggregate literacy rate, given that this group constitutes less than 15% of the Venezuelan
adult population.
The use of deviations from pre-existing time trends to estimate the effect of Misión
Robinson has obvious limitations. The period between the second semester of 2003 and the
first semester of 2005 saw a number of other changes in the Venezuelan economy and in
society, several of which may have also affected literacy rates. Recall that these estimates are
likely to be upper bounds on literacy gains for at least two reasons – first, the exaggeration of
literacy among recent program participants in survey self-reports, and second possible
positive contemporaneous impacts of other government programs – so actual program
impacts are plausibly smaller. However, the strong economic recovery during this period
could have also raised the opportunity cost of participating in adult education programs,
dampening program effects – unless new job opportunities generated by the booming
economy led some people to become literate independently of Robinson, a bias that would go
in the other direction. Between the first semester of 2003 and the first semester of 2005, the
Venezuelan economy grew at an annual rate of 15.9%, in part as a result of the recovery from
the national strike of December 2002 and the large increase of government spending linked to
rising oil revenue.
In order to at least partially address some these concerns about national economic and
social trends, which could conceivably bias estimates in either direction, in the next section
we turn to state-level estimation of impacts using a difference-in-differences econometric
approach.
17
3. State Panel Regressions
We utilize variation in the number of trainers involved in Misión Robinson at the state
level to estimate the effect of the program on literacy. We have a continuous time series of
literacy rates for 21 of the 24 Venezuelan states. Both the overall state literacy rate, and the
birth cohort specific literacy rate by state, are used as dependent variables. The first
specification estimates:
ittjjjjjtjt tttTRAINERSLiteracy εθηγγγβα ++++++⋅+= 33
221 (2)
where Literacyjt is the literacy rate of state j at time t, ηj and θt are state and semester fixed
effects, respectively, and captures state-specific cubic trends.
TRAINERS
33
221 ttt jjj γγγ ++
jt denotes the number of trainer-semesters per adult used in the program in state j
up until semester t. It thus captures the fact that the intensity of the program depends
positively both on the duration and the number of trainers used in each period. In this sense,
it is analogous to the specification used in column (3) of Table 3. We report the results both
under the 15 years and 25 year threshold to define adulthood. Equation (2) is estimated by
Generalized Least Squares with correction for autocorrelation and a heteroskedastic error
structure with cross-state correlation. Since this method requires a balanced panel, we drop
the three states for which a complete time series is not available since 1975 (Amazonas, Delta
Amacuro and Vargas). These three states accounted for 2.17% of Venezuela’s population in
2003.
18
There are two sources of data on the number of trainers, which give somewhat
contradictory figures, as was already discussed above. One series is provided by the
Venezuelan School of Social Management, which is formally part of the national Ministry of
Planning and Development (Ministerio de Planificación y Desarrollo, 2006). The second
series is reported in the 2004 Annual Report of the Ministry of Education (Ministerio de
Educación, Cultura y Deportes, 2005). Both series of state-level data are presented in
Appendix Table A1.
The Ministry of Education Robinson series has considerably higher values for the
number of trainers than the Ministry of Planning’s series for all states except Amazonas, the
only state for which they are exactly equal. According to the Ministry of Education data,
1.16% of all adult Venezuelans participated as trainers in these literacy campaigns, while
according to the Ministry of Planning data, that figure was approximately half, at 0.61%.
Both of these series report the total number of trainers involved during the duration of the
program. Since the program did not exist before the second semester of 2003 and was
declared finished at the end of the first semester of 2005, we set TRAINERSit=0 for all periods
before the start of the program. There is state-level literacy data for every semester between
1975 and 2005 (except for the first semester of 1994, coinciding with the change of survey
methodology, as well as the second semester of 1985, both of which are missing).
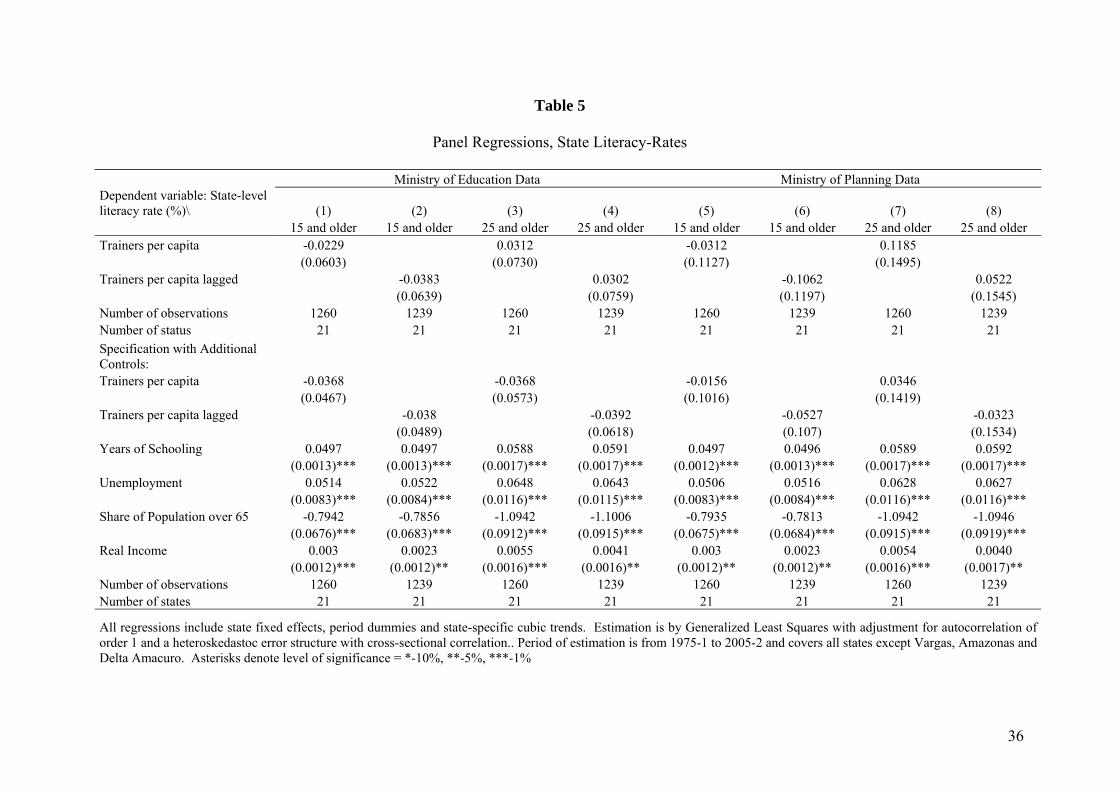
Table 5 shows the results of estimating the state-level panel specification of equation
(2). Both the Ministry of Education and the Ministry of Planning data give similar results.
Coefficient estimates are far from statistical significance in all cases. Estimates for the 15 and
older age threshold are negative, while those for the 25 and older age subgroup are positive.
Even the positive point estimates imply very small effects of Robinson. To understand their
19
magnitude, note that the average number of semester-trainers per adult person by the end of
the program was 0.033 for the Ministry of Planning Data and 0.067 for the Ministry of
Education data. Thus a coefficient estimate like that found in column (4) of Table 5 (0.0302)
implies an increase in literacy of 0.2 percentage points due to the program, with associated
confidence interval bounds of -0.7 and 1.1 percentage points. The largest point estimate on
the table (column 7), implies an average increase in literacy over the duration of the program
of 0.40 percentage points, or 48,327 persons. As in the case of the time-series regressions,
these estimates are inconsistent with a large literacy effect of Robinson.
The key role of the state-specific cubic trend that we have used in estimating equation
(2) is to capture the effect of long-run trends that may have affected literacy in each state and
that may also have been correlated with the variation in intensity of the Robinson program,
thus possibly biasing the estimate of β. For example, if the national government targeted
states that were experiencing deteriorations in literacy with higher resources, then a negative
correlation would emerge between program intensity and changes in literacy. While the
introduction of state-specific trends will pick up the longer-term tendencies, they will be
inappropriate at capturing short-run variations that may still be associated with program
intensity and literacy improvement. For example, states that were hardest hit by the 2002-03
recession may have as a result received more government resources through the program. If
state income is correlated with literacy, this will produce a downward bias in β. One way to
tackle this issue is to include control for these potentially omitted variables. Thus in the lower
panel of Table 5 we augment equation (2) with controls for state-level years of education,
unemployment, share of population over 65, and average real income. We find that all of
these variables have significant effects. Interestingly, unemployment is positively associated
with improvements of literacy. This might be a reflection of the fact that individuals take
20
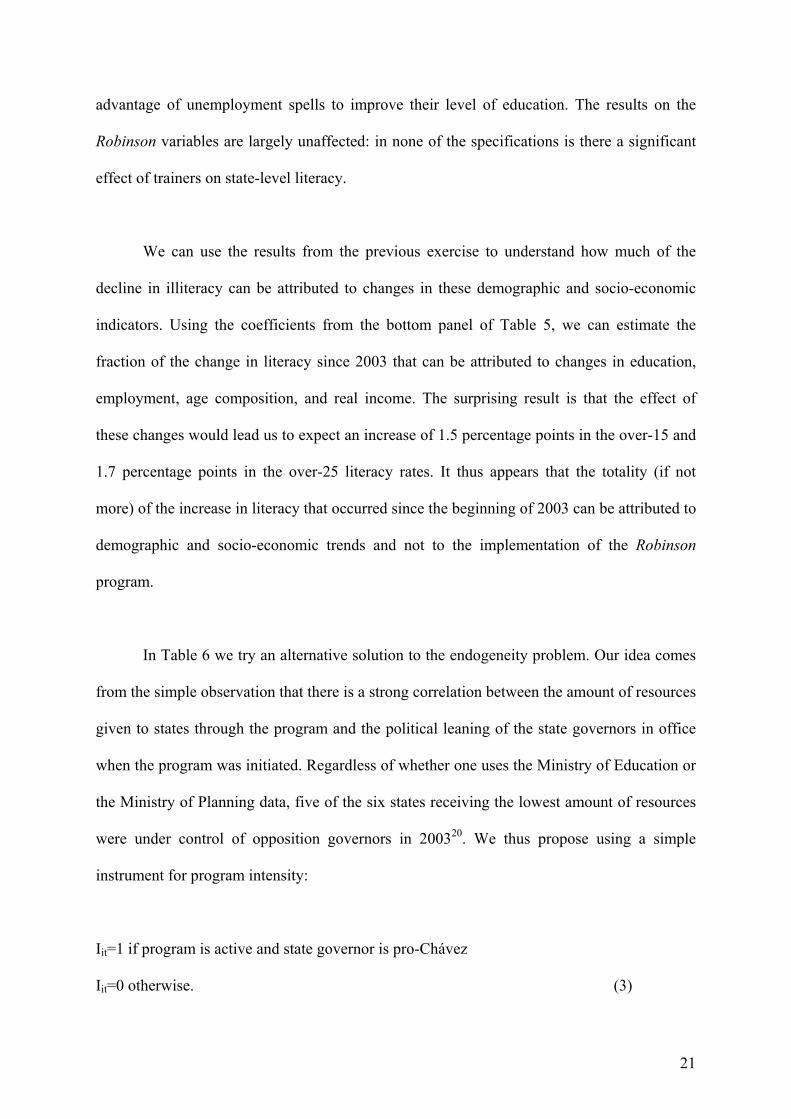
advantage of unemployment spells to improve their level of education. The results on the
Robinson variables are largely unaffected: in none of the specifications is there a significant
effect of trainers on state-level literacy.
We can use the results from the previous exercise to understand how much of the
decline in illiteracy can be attributed to changes in these demographic and socio-economic
indicators. Using the coefficients from the bottom panel of Table 5, we can estimate the
fraction of the change in literacy since 2003 that can be attributed to changes in education,
employment, age composition, and real income. The surprising result is that the effect of
these changes would lead us to expect an increase of 1.5 percentage points in the over-15 and
1.7 percentage points in the over-25 literacy rates. It thus appears that the totality (if not
more) of the increase in literacy that occurred since the beginning of 2003 can be attributed to
demographic and socio-economic trends and not to the implementation of the Robinson
program.
In Table 6 we try an alternative solution to the endogeneity problem. Our idea comes
from the simple observation that there is a strong correlation between the amount of resources
given to states through the program and the political leaning of the state governors in office
when the program was initiated. Regardless of whether one uses the Ministry of Education or
the Ministry of Planning data, five of the six states receiving the lowest amount of resources
were under control of opposition governors in 200320. We thus propose using a simple
instrument for program intensity:
Iit=1 if program is active and state governor is pro-Chávez
Iit=0 otherwise. (3)
21
In other words, our instrument is an interaction between having a state governor
whose political orientation coincides with the national government and the implementation of
the program. One obvious problem with this instrument comes from the possibility that
shocks to literacy could affect the election of state governors. However, all governors in
power in 2003 had been elected in the 2000 local elections, a full three years before the
program started. Our key identifying assumption is that shocks to literacy in 2003 are
uncorrelated with electoral results in 2000. Given that low frequency fluctuations in state
literacy rates will be picked up by the state-specific cubic trends, this assumption appears
reasonable21. Our exclusion restriction assumption also seems reasonable: it is hard to think
of a reason why pro-Chávez state governors would become more efficient at reducing
illiteracy after 2003 that is not associated to the implementation of the Robinson program22.
An alternative potential problem with our instrument comes from the possibility that it
may capture the effect of omitted variables that are correlated with both literacy and the
allocation of trainers. Poorer states, for example, could be more likely to have pro-Chávez
governors while also being the recipients of a higher program effort. The lower panel of
Table 6 shows that our instrument retains its strength even after we include controls for
schooling, unemployment, share of population over 65, and real income. Obviously, these
control variables may only imperfectly capture the variations across time in state-level
unobservables, so that our results must be interpreted with caution. Nevertheless, it is
reassuring to note that introducing these controls does not have a significant effect on the
explanatory power of our instrument.
Indeed, our crude instrument is a very good predictor of program effort, attaining
significance at 1% in all eight of the first stage specifications. According to the estimates
form the first-stage regressions, states with pro-opposition governors received on average
22
between 13 and 20 trainers (equivalent to 1.8-2.7 standard deviations) per thousand adults
less than those with pro-Chávez governors. It is interesting to note that neither education nor
average income appear to be significantly related to the variation in the number of trainers in
these regressions. Instead, the data suggests that higher unemployment and a younger
population are associated with higher program effort. These results are consistent with the
hypothesis that Robinson may have been primarily viewed as a program to generate jobs as
trainers for young and middle-aged unemployed workers. The results in Table 6 also show
that the instrumental variables estimates do not strengthen the evidence in favour of a
program effect. Indeed, the point estimates for the 15 and older literacy rate now turn
negative, although none of the estimated program effects are significant.
Our next specification uses the state-specific birth cohort literacy rate as the
dependent variable. In order to minimize measurement error while taking full advantage of
the information in our data, we group state-level cohorts into groups of five-year intervals
according to the age of the person in the last semester of our data. In other words, one cohort
will correspond to those who reach ages 20-24 in the second semester of 2005, another one to
those aged 25-29, etc. We also exclude from analysis those cohorts of individuals aged less
than 20 years – for which there is no sufficient pre-Robinson information on their literacy
attainment to evaluate the program - as well as those cohorts aged over 80 (for which there
are very few state-level observations in the cohort group by state in any given semester).
Similarly to the analysis in Table 4 above, we estimate one specification where the Robinson
effect is constrained to be the same across all birth cohorts, and another one in which the
effect can vary by age subgroup of the cohort members at the end of the sample. We estimate
the equation:
23
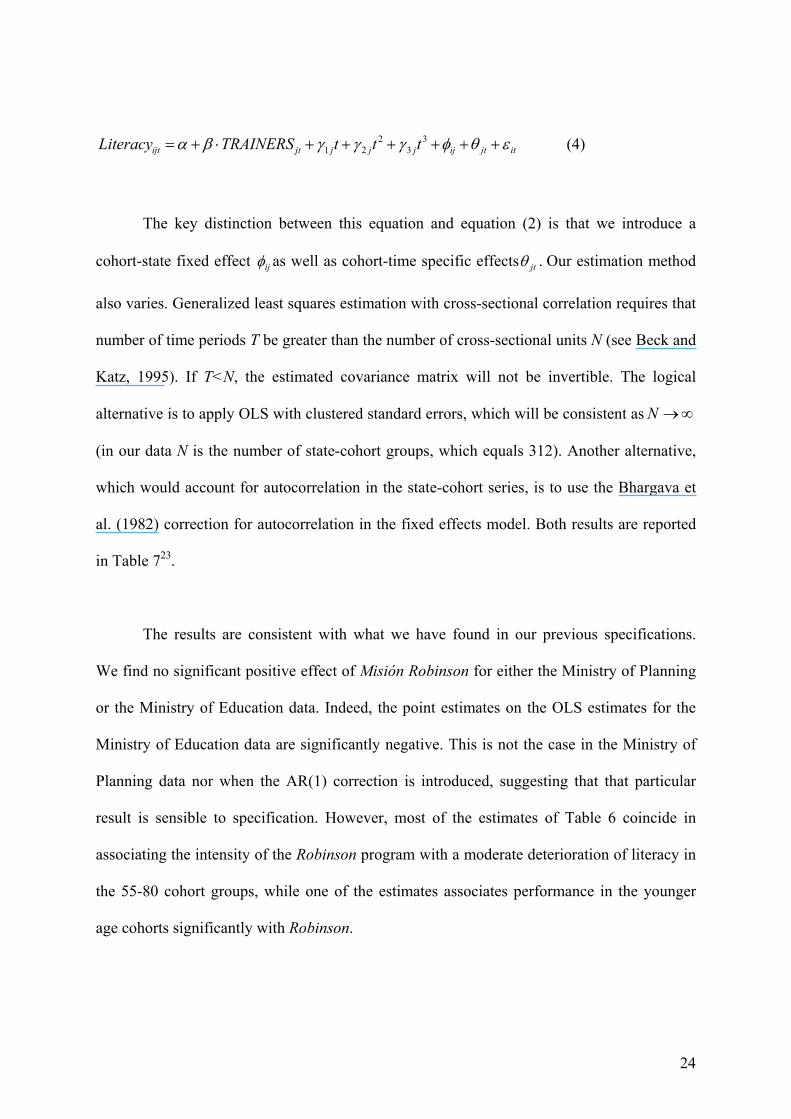
itjtijjjjjtijt tttTRAINERSLiteracy εθφγγγβα ++++++⋅+= 33
221 (4)
The key distinction between this equation and equation (2) is that we introduce a
cohort-state fixed effect ijφ as well as cohort-time specific effects jtθ . Our estimation method
also varies. Generalized least squares estimation with cross-sectional correlation requires that
number of time periods T be greater than the number of cross-sectional units N (see Beck and
Katz, 1995). If T<N, the estimated covariance matrix will not be invertible. The logical
alternative is to apply OLS with clustered standard errors, which will be consistent as ∞→N
(in our data N is the number of state-cohort groups, which equals 312). Another alternative,
which would account for autocorrelation in the state-cohort series, is to use the Bhargava et
al. (1982) correction for autocorrelation in the fixed effects model. Both results are reported
in Table 723.
The results are consistent with what we have found in our previous specifications.
We find no significant positive effect of Misión Robinson for either the Ministry of Planning
or the Ministry of Education data. Indeed, the point estimates on the OLS estimates for the
Ministry of Education data are significantly negative. This is not the case in the Ministry of
Planning data nor when the AR(1) correction is introduced, suggesting that that particular
result is sensible to specification. However, most of the estimates of Table 6 coincide in
associating the intensity of the Robinson program with a moderate deterioration of literacy in
the 55-80 cohort groups, while one of the estimates associates performance in the younger
age cohorts significantly with Robinson.
24
One possibility is that these results are due to the misspecification that comes from the
fact that literacy rates are constrained to be on the 0-1 range while a linear model is by
definition unconstrained in this respect. This problem is likely to worsen if the state-cohort
observations are observed with greater error, since in that case the upper bound on literacy is
likely to be hit more frequently, biasing downwards the estimate of any variable that has a
positive effect. In our data, literacy rates hit a boundary condition on 1.58% of observations.
In order to verify that this is not affecting our results, we reran the specifications of Table 7
using as our dependent variable the logit transform ))1/(ln( ijtijtijt LITLITx −= . The results –
available upon request – are broadly similar to those of Table 6, with the 55-90 cohort
associated with a significantly negative effect of Robinson in 5 out of 8 estimations. We have
also attempted a number of alternative specifications – among them omitting state trends,
defining the cohort groups more or less broadly, including older cohorts, using the Baltagi
and Wu (1999) random effects estimate – all of which give substantively the same results.
The estimated pattern of coefficients is surprising. One possible explanation is that is
that the high profile literacy drive may have reduced the stigma from reporting illiteracy
among older age cohorts. An alternative interpretation is that a broad-based program such as
Robinson could have been effective in raising literacy among younger cohorts, but that the
dismantling of existing programs could have had more detrimental effects among those older
cohorts that traditional programs were designed to benefit. While those interpretations are
certainly plausible, we would caution against reading too much into the pattern of the
estimates. Both state-cohort literacy rates and our measure of intensity of the program are
measured with error, and some of those errors could be correlated in ways that may invalidate
our estimates. Our reading is thus much more conservative. We take these results as evidence
that, even if one takes the data to a very fine level of detail, it is extremely hard to find
25
significant positive effects of Robinson on Venezuelan literacy. The specification of Table 7
should be interpreted as the final in a battery of tests which have attempted to identify effects
of the program on the literacy data by looking at increasingly finer levels of detail. The fact
that at none of these levels have we been able to find decisive evidence in favour of a
Robinson effect suggests that the effect either does not exist or, if it does, is very hard to
detect and thereby probably not very large.
IV. Concluding Remarks
This paper has shown that the implementation of Misión Robinson coincided with at
most a moderate reduction in Venezuelan illiteracy. Most of our estimates of program impact
represent quantitatively small and rarely statistically significant effects of Robinson, while
some point estimates are actually negative. Even the most favourable estimates to Misión
Robinson – such as, for example, the lagged specifications of the state panel regressions in
Table 5 – imply quantitatively minor effects (in that case, an increase in literacy of 48,327
persons). The possibility that the Robinson program led some newly semi-literate individuals
to claim they are literate in surveys means that even these very small gains might be
overstated.
One way to evaluate the program’s returns is by comparing our estimated program
impacts with the program’s official expenditures. According to the Ministry of Finance,
Misión Robinson has received an investment of 80 billion Bolívares (US$50 million)24. This
amount may well substantially understate Robinson expenditures, since it excludes a number
of off-budget expenditures on the program25. Even if one attributes all of the reduction in
illiteracy observed between the first semester of 2003 and the second semester of 2005 to
26
Robinson, the estimated cost would be $536 per pupil who learned to read. In contrast, a
recent study by UNESCO of 29 international adult literacy programmes estimated the
average cost per successful learner to be $47 in sub-Saharan Africa, $30 in Asia, and $61 in
Latin America26. Under a more conservative – yet still optimistic - estimate of program
success, namely that the total number of people who become literate through the program
was only 48,327, then the cost per newly literate person would be much higher, at US$1035.
Why was Robinson unsuccessful? By any standards, Robinson was a large, well-
funded, and high-profile effort. How then can we understand its failure to generate visible
reductions in illiteracy? Does this failure reflect the idiosyncrasies of the Venezuelan
experience with social policies during the Chávez era, or does it have broader implications
for the design of adult literacy programmes in developing countries?
It appears probable that part of the failure of Robinson comes from the fact that the
program was never as large as the government claimed. Official estimates of the number of
program trainers imply a mobilization in this program of between 0.9 and 1.8% of the entire
national labor force. Simply paying that number of trainers during two years would have
entailed expenditures of $265-504 million, much higher than the $50 million allocated to the
program. It would also have entailed an expansion in public employment by between 7.0%
and 13.3%, which appears inconsistent with the evolution of public employment statistics27.
Several characteristics of the program’s design may also have contributed to its lack
of success. The allocation of hundred-dollars-a-month scholarships to the program’s needy
participants – an amount equal to the legal minimum wage and significantly higher than
informal sector wages - could have generated incentives for misrepresentation of literacy
27
status28. This effect may have been exacerbated by the perception of Robinson as an entry
point to some of the government’s other social programs, such as Vuelvan Caras (a training
program for unemployed workers) that could ultimately lead to obtaining public sector
employment. Anecdotal evidence also suggests that trainers devoted considerable class time
to the political formation of program participants, a phenomenon that might have been
exacerbated by the coincidence of the implementation period with the campaign for the 2004
recall referendum29. The program also appears to have been plagued by significant delays in
payments to trainers, which in many cases led to high turnover rates30.
Politicization, inadequate incentives, and budgetary problems are, however, common
characteristics of large-scale literacy programs which do not appear to distinguish Robinson
from many other cases of previous failures. Indeed what is remarkable about the record on
literacy programs is that, despite a broad diversity in approaches, there are few cases of
resounding success. Recent research has suggested that the problem may be in the cognitive
model underlying the design of most literacy programs. As Abadzi (2003b) has argued,
cognitive research has found that the process of learning to read in adult individuals may be
systematically different from that in young children. The results of this literature suggest that
significant changes must be made to the basic design of adult literacy programs in order for
them to be successful.
28
References
Abadzi, Helen. 1994. “What We Know about Acquisition of Adult Literacy: Is there
Hope.” World Bank Discussion Paper no. 245, World Bank, Washington, DC.
-------------- 2003a. “Adult Literacy: A Review of Implementation Experience.” Working
Paper, Operations Evaluation Department, World Bank, Washington, DC.
--------------. 2003b. Improving Adult Literacy Outcomes: Lessons form Cognitive
Research for Developing Countries. Washington, DC: The World Bank.
Bhargava, A., L. Franzini, and W. Narendranathan. 1982 “Serial correlation and the fixed
effects model.” Review of Economic Studies 49: 533–549.
Baltagi, P. H. and P. X. Wu. 1999 “Unequally spaced panel data regressions with AR(1)
disturbances.” Econometric Theory 15:814-823.
Beck, N. and Jonathan Katz. 1995. “What to Do (and Not to Do) with Time-Series—
Cross-Section Data.” American Political Science Review 89: 634-647.
Chowdury, K. 1995. “Literacy and Primary Education.” Discussion Paper no. 50, Human
Capital and Development Operations Policy, World Bank, Washington, DC.
Frente Internacional ‘Yo si puedo’. “Intervención de la Alfabetizada Venezolana Eugenia
Tuba en el Congreso Mundial de Alfabetización.”
http://www.frenteinternacional.yosipuedo.com.ar/congreso-mundial/eugenia.htm (accessed
Aug 18, 2007).
Gobierno Bolivariano de Venezuela. 2004. “Palabras del Presidente Hugo Chávez Frías,
Acto de promoción al quinto grado Misión Robinson: ‘Yo sí puedo’ desde el Teatro Teresa
Carreño. Viernes, 03 de diciembre de 2004.” http://www.mci.gob.ve/imagnot/03-DIC-
2004%20ACTO%20DE%20PROMOCION%205%20to.%20GRADO%20MISION%20ROB
INSON%20-%20DEFINITIVA.doc (accessed August 25, 2006).
29
------------------------------- 2005a. “Aló Presidente No. 227.”
http://www.mre.gov.ve/Noticias/Presidente-Chavez/A2005/alo-227.htm (accessed June 19,
2006).
----------------------- 2005b. “Declaratoria de Venezuela como Territorio Libre de
Analfabetismo”
http://www.minci.gob.ve/imagnot/28oct2005/venezuelalibredeanalfabetismo.teatroteresacarre
%C3%B1o.doc (accessed June 19, 2006).
INE. 2006. Encuesta de hogares por muestreo. Instituto Nacional de Estadísticas.
Caracas: Venezuela.
Mendoza, Mariely. “40% de facilitadores ha desertado de Misión Robinson en
Carabobo.” Diario El Carabobeño. Aug 31, 2005. Carabobo: Venezuela.
Ministerio de Educación, Cultura y Deportes. 2005. Meoria y Cuenta 2004. Caracas:
Ministerio de Educación, Cultura y Deportes.
Ministerio de Finanzas. 2006. Recursos Asignados a las Misiones hasta el 2005 y su
Correspondiente Ejecución. Electronic File. Caracas: Ministerio de Finanzas.
Ministerio de Planificación y Desarrollo. 2006. “Base de Datos Social: Misiones.”
Escuela de Gerencia Social.
http://www.gerenciasocial.org.ve/bases_datos/gerenciasocial/Index.htm (accessed August
16, 2006).
Oxenham, John and Aya Aoki. 2002. Including the 900 Million. Washington, DC: World
Bank.
Penfold, Michael. 2007. “Clientelism and Social Funds: Empirical Evidence from
Chávez’s Misiones Programs.” Latin American Politics and Society (forthcoming).
Prato, Jaimet C. “Misión Robinson: un híbrido cubano en Venezuela” Diario El Impulso.
May 13, 2006. Barquisimeto: Venezuela.
30
http://www.minci.gob.ve/imagnot/28oct2005/venezuelalibredeanalfabetismo.teatroteresacarre%C3%B1o.doc
Rogers, Alan. 2002. Re-thinking Adult Literacy and Post-Literacy from an International
Perspective: The Roby Kidd Memorial Lecture. Uppingham: Uppingham Press.
Romain, Ralph I. and Lenor Armstrong. 1987. “Review of World Bank Operations in
Nonformal Education and Training.” Discussion Paper Report no. EDT63, Education and
Training Series, World Bank, Washington, DC.
Sánchez, Mariela. 2003. “Denuncian falta de pago por parte del INCE a facilitadores de la
Misión Robinson en el barrio Blandín de Caracas.”
http://www.aporrealos.org/actualidad/n10128.html (accessed August 18, 2005)
UNDP. 2005. Human Development Report 2005. New York: United Nations
Development Programme.
UNESCO. 2006. Literacy for Life: Education for All Global Monitoring Report 2006.
Paris: United Nations Educational, Scientific and Cultural Organisation.
Valecillos, Héctor. 1993. Estadísticas socio-laborales de Venezuela : Series históricas
1936-1990. Caracas: Venezuela. Colección Cincuentenaria Banco Central de Venezuela
31
Tables and Figures
Table 1
Illiterate Population and Illiteracy Rates, National Censuses, 1936-2001
1936 1941 1950 1961 1971 1981 1990 2001 Age
Groups: 10-14 267,413 278,155 272,656 235,541 254,340 145,639 100,080 71,528 15-19 203,195 212,094 211,387 171,622 153,432 108,785 81,640 59,723 20-24 104,430 81,055 65,494 25-34 192,095 161,211 128,629 35-44 216,068 165,234 157,618 45-54 245,518 184,992 168,226 55 and over 464,363 456,435 502,795
15 and over 1,187,376 1,302,511 1,433,852 1,499,250 1,373,561 1,331,259 1,130,567 1,082,485
Iliteracy Rate 59.26% 57.20% 49.04% 36.70% 23.29% 15.27% 9.95% 7.02%
25 and over 984,181 1,090,417 1,222,465 1,327,628 1,220,129 1,118,044 967,872 957,268
Iliteracy Rate 59.48% 58.17% 50.36% 38.99% 26.09% 15.81% 12.55% 8.74%
Source: INE (2006), Valecillos (1993), p. 174
32
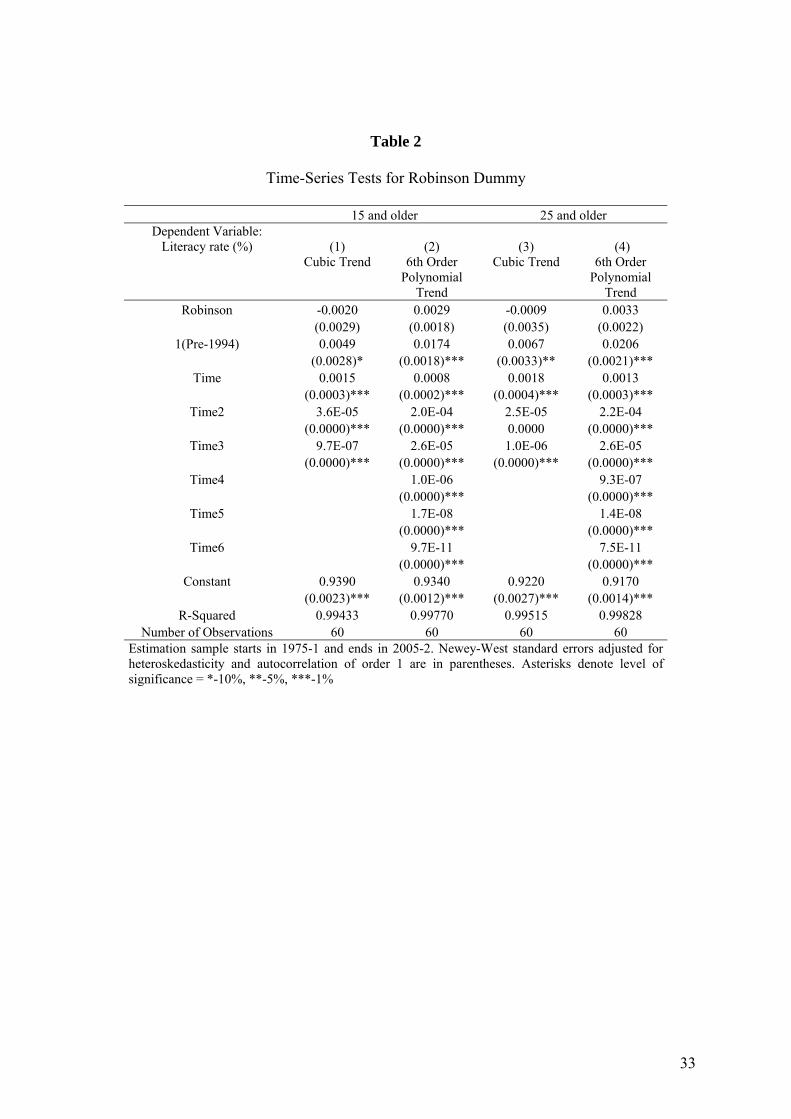
Table 2
Time-Series Tests for Robinson Dummy
15 and older 25 and older Dependent Variable:
Literacy rate (%) (1) (2) (3) (4) Cubic Trend 6th Order
Polynomial Trend
Cubic Trend 6th Order Polynomial
Trend Robinson -0.0020 0.0029 -0.0009 0.0033
(0.0029) (0.0018) (0.0035) (0.0022) 1(Pre-1994) 0.0049 0.0174 0.0067 0.0206
(0.0028)* (0.0018)*** (0.0033)** (0.0021)*** Time 0.0015 0.0008 0.0018 0.0013
(0.0003)*** (0.0002)*** (0.0004)*** (0.0003)*** Time2 3.6E-05 2.0E-04 2.5E-05 2.2E-04
(0.0000)*** (0.0000)*** 0.0000 (0.0000)*** Time3 9.7E-07 2.6E-05 1.0E-06 2.6E-05
(0.0000)*** (0.0000)*** (0.0000)*** (0.0000)*** Time4 1.0E-06 9.3E-07
(0.0000)*** (0.0000)*** Time5 1.7E-08 1.4E-08
(0.0000)*** (0.0000)*** Time6 9.7E-11 7.5E-11
(0.0000)*** (0.0000)*** Constant 0.9390 0.9340 0.9220 0.9170
(0.0023)*** (0.0012)*** (0.0027)*** (0.0014)*** R-Squared 0.99433 0.99770 0.99515 0.99828
Number of Observations 60 60 60 60 Estimation sample starts in 1975-1 and ends in 2005-2. Newey-West standard errors adjusted for heteroskedasticity and autocorrelation of order 1 are in parentheses. Asterisks denote level of significance = *-10%, **-5%, ***-1%
33
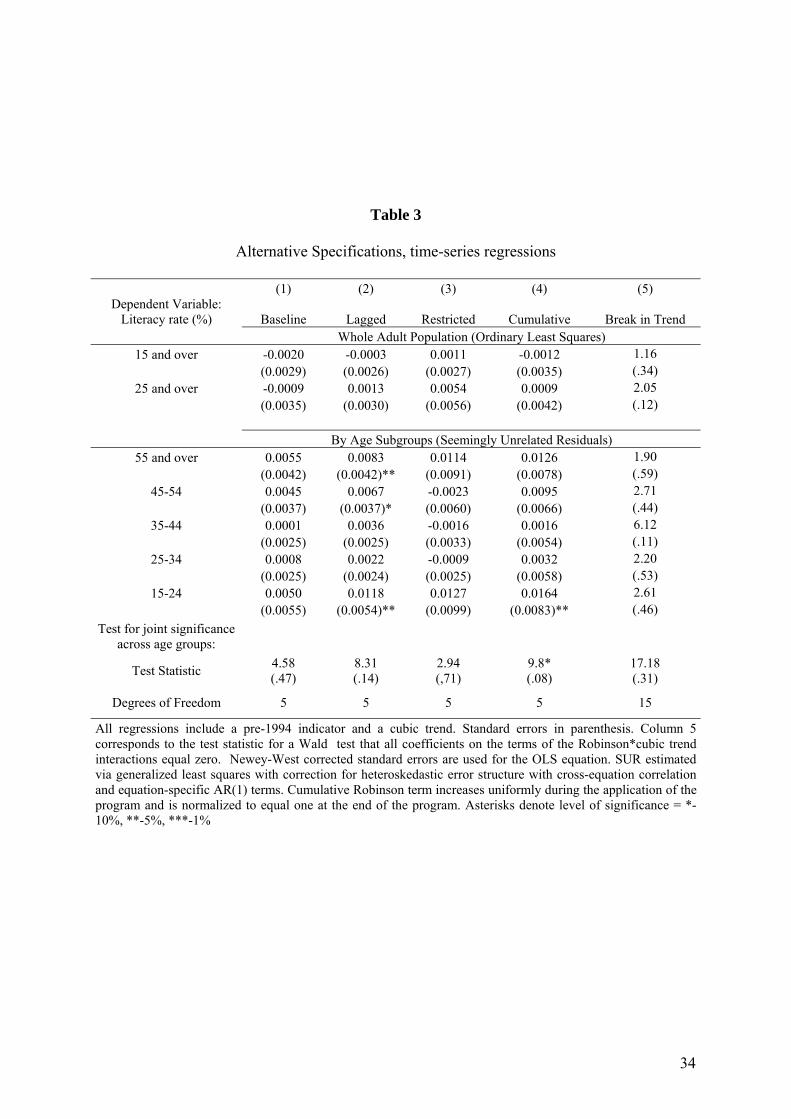
Table 3
Alternative Specifications, time-series regressions
(1) (2) (3) (4) (5) Dependent Variable:
Literacy rate (%) Baseline Lagged Restricted Cumulative Break in Trend Whole Adult Population (Ordinary Least Squares)
15 and over -0.0020 -0.0003 0.0011 -0.0012 1.16 (0.0029) (0.0026) (0.0027) (0.0035) (.34)
25 and over -0.0009 0.0013 0.0054 0.0009 2.05 (0.0035) (0.0030) (0.0056) (0.0042) (.12) By Age Subgroups (Seemingly Unrelated Residuals)
55 and over 0.0055 0.0083 0.0114 0.0126 1.90 (0.0042) (0.0042)** (0.0091) (0.0078) (.59)
45-54 0.0045 0.0067 -0.0023 0.0095 2.71 (0.0037) (0.0037)* (0.0060) (0.0066) (.44)
35-44 0.0001 0.0036 -0.0016 0.0016 6.12 (0.0025) (0.0025) (0.0033) (0.0054) (.11)
25-34 0.0008 0.0022 -0.0009 0.0032 2.20 (0.0025) (0.0024) (0.0025) (0.0058) (.53)
15-24 0.0050 0.0118 0.0127 0.0164 2.61 (0.0055) (0.0054)** (0.0099) (0.0083)** (.46)
Test for joint significance across age groups:
Test Statistic 4.58 (.47)
8.31 (.14)
2.94 (,71)
9.8* (.08)
17.18 (.31)
Degrees of Freedom 5 5 5 5 15
All regressions include a pre-1994 indicator and a cubic trend. Standard errors in parenthesis. Column 5 corresponds to the test statistic for a Wald test that all coefficients on the terms of the Robinson*cubic trend interactions equal zero. Newey-West corrected standard errors are used for the OLS equation. SUR estimated via generalized least squares with correction for heteroskedastic error structure with cross-equation correlation and equation-specific AR(1) terms. Cumulative Robinson term increases uniformly during the application of the program and is normalized to equal one at the end of the program. Asterisks denote level of significance = *-10%, **-5%, ***-1%
34
35
Table 4
National level cohort estimates
Dependent variable: Cohort literacy rate (%) (1) (2) (3) (4)
Effect: Contemporaneous Lagged Contemporaneous Lagged All groups 0.0004 0.0018
(0.0008) (0.0009)* 55 and over 0.0051 0.0067
(0.0030) (0.0030)* 45-54 -0.0013 0.0003
(0.0026) (0.0026) 35-44 0.0013 0.0025
(0.0021) (0.0021) 25-34 0.0002 0.0017
(0.0014) (0.0016) 21-24 -0.0018 -0.0016
(0.0014) (0.0014) Chi-Squared Test of Ho: All
Robinson coefficients=0 5.1100 8.9300 Number of observations 3619 3619 3619 3619
Number of cohorts 70 70 70 70
Method of estimation: Generalized Least Squares with adjustment for group-specific heteroskedasticity and autocorrelation. Dependent variable is national cohort literacy rate. All specifications include cohort dummies and cohort-specific cubic trends.
Ministry of Education Data Ministry of Planning Data Dependent variable: State-level literacy rate (%)\ (1) (2) (3) (4) (5) (6) (7) (8)
15 and older 15 and older 25 and older 25 and older 15 and older 15 and older 25 and older 25 and older Trainers per capita -0.0229 0.0312 -0.0312 0.1185 (0.0603) (0.0730) (0.1127) (0.1495) Trainers per capita lagged -0.0383 0.0302 -0.1062 0.0522 (0.0639) (0.0759) (0.1197) (0.1545) Number of observations 1260 1239 1260 1239 1260 1239 1260 1239 Number of status 21 21 21 21 21 21 21 21 Specification with Additional Controls: Trainers per capita -0.0368 -0.0368 -0.0156 0.0346 (0.0467) (0.0573) (0.1016) (0.1419) Trainers per capita lagged -0.038 -0.0392 -0.0527 -0.0323 (0.0489) (0.0618) (0.107) (0.1534) Years of Schooling 0.0497 0.0497 0.0588 0.0591 0.0497 0.0496 0.0589 0.0592 (0.0013)*** (0.0013)*** (0.0017)*** (0.0017)*** (0.0012)*** (0.0013)*** (0.0017)*** (0.0017)*** Unemployment 0.0514 0.0522 0.0648 0.0643 0.0506 0.0516 0.0628 0.0627 (0.0083)*** (0.0084)*** (0.0116)*** (0.0115)*** (0.0083)*** (0.0084)*** (0.0116)*** (0.0116)*** Share of Population over 65 -0.7942 -0.7856 -1.0942 -1.1006 -0.7935 -0.7813 -1.0942 -1.0946 (0.0676)*** (0.0683)*** (0.0912)*** (0.0915)*** (0.0675)*** (0.0684)*** (0.0915)*** (0.0919)*** Real Income 0.003 0.0023 0.0055 0.0041 0.003 0.0023 0.0054 0.0040 (0.0012)*** (0.0012)** (0.0016)*** (0.0016)** (0.0012)** (0.0012)** (0.0016)*** (0.0017)** Number of observations 1260 1239 1260 1239 1260 1239 1260 1239 Number of states 21 21 21 21 21 21 21 21
All regressions include state fixed effects, period dummies and state-specific cubic trends. Estimation is by Generalized Least Squares with adjustment for autocorrelation of order 1 and a heteroskedastoc error structure with cross-sectional correlation.. Period of estimation is from 1975-1 to 2005-2 and covers all states except Vargas, Amazonas and Delta Amacuro. Asterisks denote level of significance = *-10%, **-5%, ***-1%
36
Panel Regressions, State Literacy-Rates
Table 5
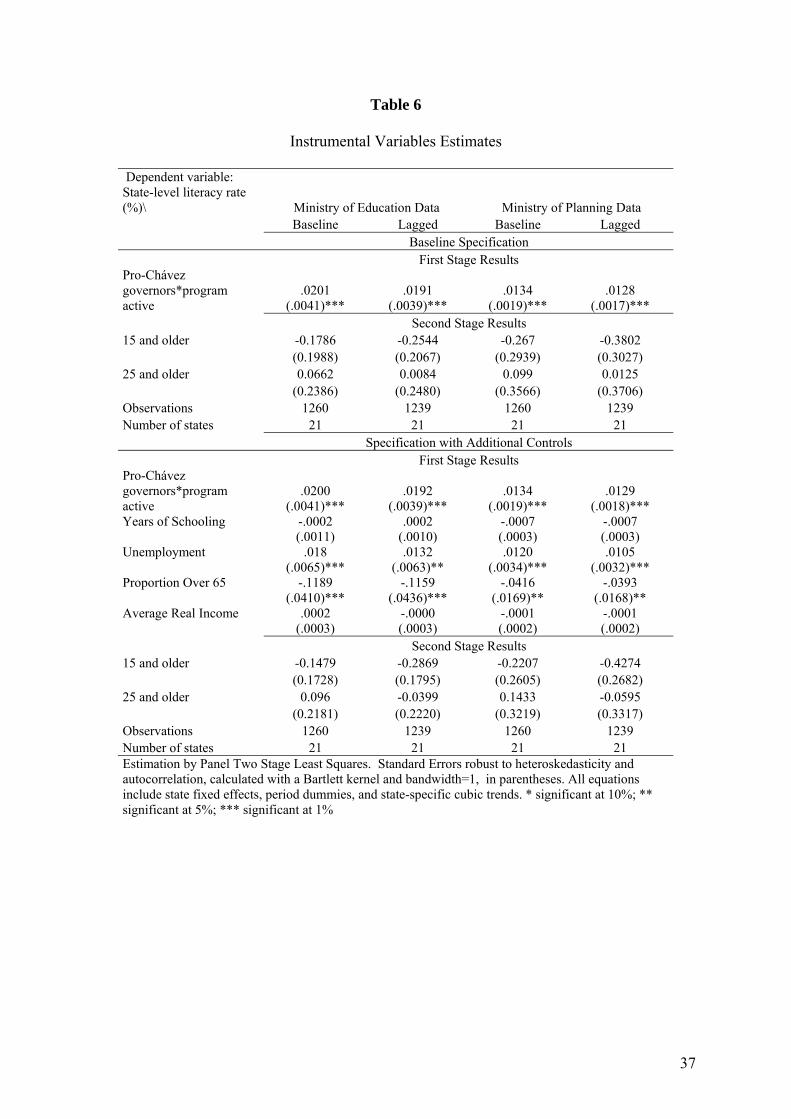
Table 6
Instrumental Variables Estimates
Dependent variable: State-level literacy rate (%)\ Ministry of Education Data Ministry of Planning Data Baseline Lagged Baseline Lagged Baseline Specification First Stage Results Pro-Chávez governors*program active
.0201 (.0041)***
.0191 (.0039)***
.0134 (.0019)***
.0128 (.0017)***
Second Stage Results 15 and older -0.1786 -0.2544 -0.267 -0.3802 (0.1988) (0.2067) (0.2939) (0.3027) 25 and older 0.0662 0.0084 0.099 0.0125 (0.2386) (0.2480) (0.3566) (0.3706) Observations 1260 1239 1260 1239 Number of states 21 21 21 21 Specification with Additional Controls First Stage Results Pro-Chávez governors*program active
.0200 (.0041)***
.0192 (.0039)***
.0134 (.0019)***
.0129 (.0018)***
Years of Schooling -.0002 (.0011)
.0002 (.0010)
-.0007 (.0003)
-.0007 (.0003)
Unemployment .018 (.0065)***
.0132 (.0063)**
.0120 (.0034)***
.0105 (.0032)***
Proportion Over 65 -.1189 (.0410)***
-.1159 (.0436)***
-.0416 (.0169)**
-.0393 (.0168)**
Average Real Income .0002 (.0003)
-.0000 (.0003)
-.0001 (.0002)
-.0001 (.0002)
Second Stage Results 15 and older -0.1479 -0.2869 -0.2207 -0.4274 (0.1728) (0.1795) (0.2605) (0.2682) 25 and older 0.096 -0.0399 0.1433 -0.0595 (0.2181) (0.2220) (0.3219) (0.3317) Observations 1260 1239 1260 1239 Number of states 21 21 21 21 Estimation by Panel Two Stage Least Squares. Standard Errors robust to heteroskedasticity and autocorrelation, calculated with a Bartlett kernel and bandwidth=1, in parentheses. All equations include state fixed effects, period dummies, and state-specific cubic trends. * significant at 10%; ** significant at 5%; *** significant at 1%
37
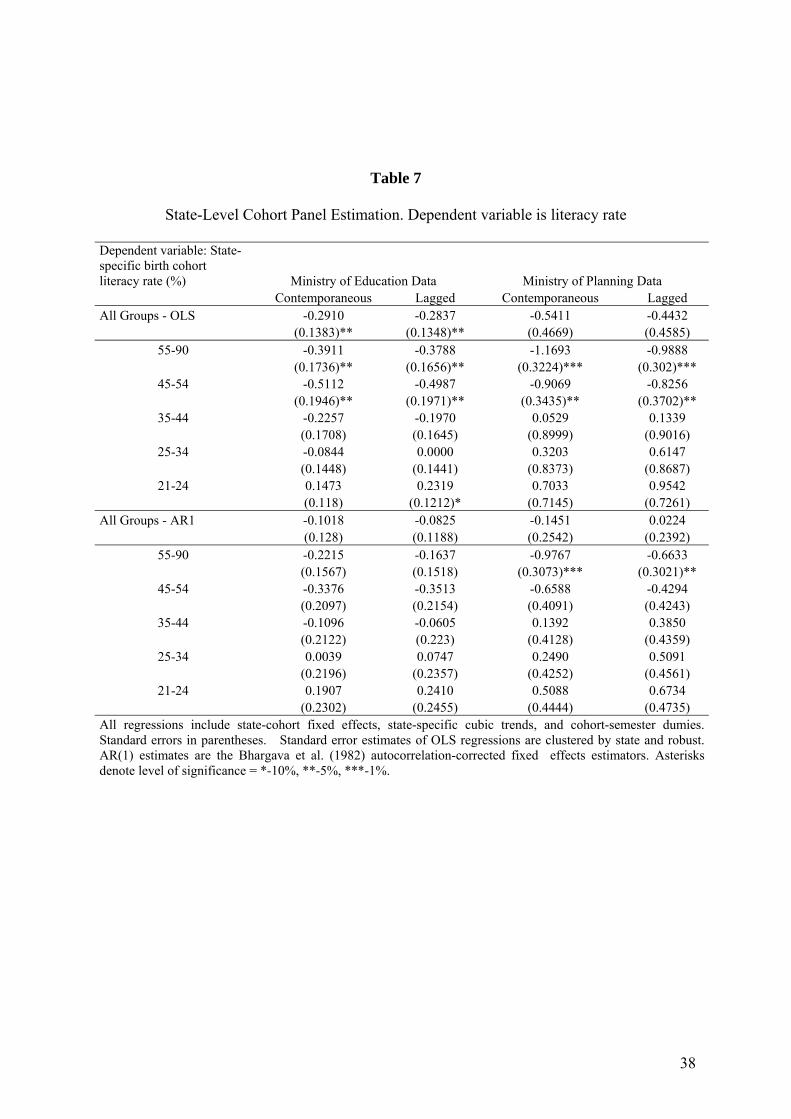
Table 7
State-Level Cohort Panel Estimation. Dependent variable is literacy rate
Dependent variable: State-specific birth cohort literacy rate (%) Ministry of Education Data Ministry of Planning Data
Contemporaneous Lagged Contemporaneous Lagged All Groups - OLS -0.2910 -0.2837 -0.5411 -0.4432 (0.1383)** (0.1348)** (0.4669) (0.4585)
55-90 -0.3911 -0.3788 -1.1693 -0.9888 (0.1736)** (0.1656)** (0.3224)*** (0.302)***
45-54 -0.5112 -0.4987 -0.9069 -0.8256 (0.1946)** (0.1971)** (0.3435)** (0.3702)**
35-44 -0.2257 -0.1970 0.0529 0.1339 (0.1708) (0.1645) (0.8999) (0.9016)
25-34 -0.0844 0.0000 0.3203 0.6147 (0.1448) (0.1441) (0.8373) (0.8687)
21-24 0.1473 0.2319 0.7033 0.9542 (0.118) (0.1212)* (0.7145) (0.7261)
All Groups - AR1 -0.1018 -0.0825 -0.1451 0.0224 (0.128) (0.1188) (0.2542) (0.2392)
55-90 -0.2215 -0.1637 -0.9767 -0.6633 (0.1567) (0.1518) (0.3073)*** (0.3021)**
45-54 -0.3376 -0.3513 -0.6588 -0.4294 (0.2097) (0.2154) (0.4091) (0.4243)
35-44 -0.1096 -0.0605 0.1392 0.3850 (0.2122) (0.223) (0.4128) (0.4359)
25-34 0.0039 0.0747 0.2490 0.5091 (0.2196) (0.2357) (0.4252) (0.4561)
21-24 0.1907 0.2410 0.5088 0.6734 (0.2302) (0.2455) (0.4444) (0.4735)
All regressions include state-cohort fixed effects, state-specific cubic trends, and cohort-semester dumies. Standard errors in parentheses. Standard error estimates of OLS regressions are clustered by state and robust. AR(1) estimates are the Bhargava et al. (1982) autocorrelation-corrected fixed effects estimators. Asterisks denote level of significance = *-10%, **-5%, ***-1%.
38
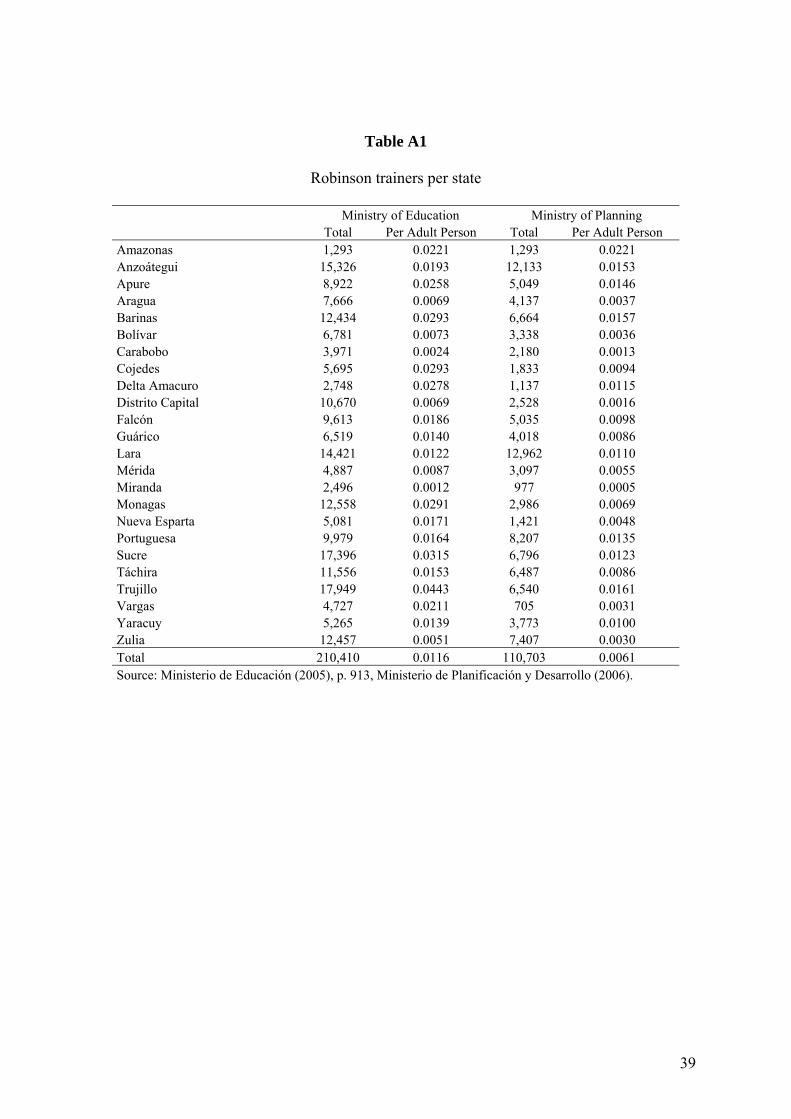
Table A1
Robinson trainers per state
Ministry of Education Ministry of Planning Total Per Adult Person Total Per Adult Person Amazonas 1,293 0.0221 1,293 0.0221 Anzoátegui 15,326 0.0193 12,133 0.0153 Apure 8,922 0.0258 5,049 0.0146 Aragua 7,666 0.0069 4,137 0.0037 Barinas 12,434 0.0293 6,664 0.0157 Bolívar 6,781 0.0073 3,338 0.0036 Carabobo 3,971 0.0024 2,180 0.0013 Cojedes 5,695 0.0293 1,833 0.0094 Delta Amacuro 2,748 0.0278 1,137 0.0115 Distrito Capital 10,670 0.0069 2,528 0.0016 Falcón 9,613 0.0186 5,035 0.0098 Guárico 6,519 0.0140 4,018 0.0086 Lara 14,421 0.0122 12,962 0.0110 Mérida 4,887 0.0087 3,097 0.0055 Miranda 2,496 0.0012 977 0.0005 Monagas 12,558 0.0291 2,986 0.0069 Nueva Esparta 5,081 0.0171 1,421 0.0048 Portuguesa 9,979 0.0164 8,207 0.0135 Sucre 17,396 0.0315 6,796 0.0123 Táchira 11,556 0.0153 6,487 0.0086 Trujillo 17,949 0.0443 6,540 0.0161 Vargas 4,727 0.0211 705 0.0031 Yaracuy 5,265 0.0139 3,773 0.0100 Zulia 12,457 0.0051 7,407 0.0030 Total 210,410 0.0116 110,703 0.0061 Source: Ministerio de Educación (2005), p. 913, Ministerio de Planificación y Desarrollo (2006).
39
Figure Legends
Figure 1
Title: Literacy rates in Venezuela, 1975-05
Legend:
15 and older (Household surveys) 25 and older (Household surveys) 15 and older (Census)25 and older (Census)
Figure 2
Title: Literacy rates by age groups, 1994-2004
Legend:
15 to 2425 to 3435 to 4445 to 54 55 and over Census datapoints
Figure 3
Title: Historical and fitted national literacy rate for alternative trends
Legend:
40
HistoricalCubic trendLinear trendQuadratic trend
Figure 1
Literacy rates in Venezuela, 1975-05
70%
75%
80%
85%
90%
95%
100%
1975
.1
1976
.2
1978
.1
1979
.2
1981
.1
1982
.2
1984
.1
1985
.2
1987
.1
1988
.2
1990
.1
1991
.2
1993
.1
1994
.2
1996
.1
1997
.2
1999
.1
2000
.2
2002
.1
2003
.2
2005
.1
Semester
Lite
racy
Rat
e
15 and older (Census)
25 and older (Census)
Change in Survey Methodology
Start of MisiónRobinson
15 and older (Household Surveys)
25 and older (Household Surveys)
41
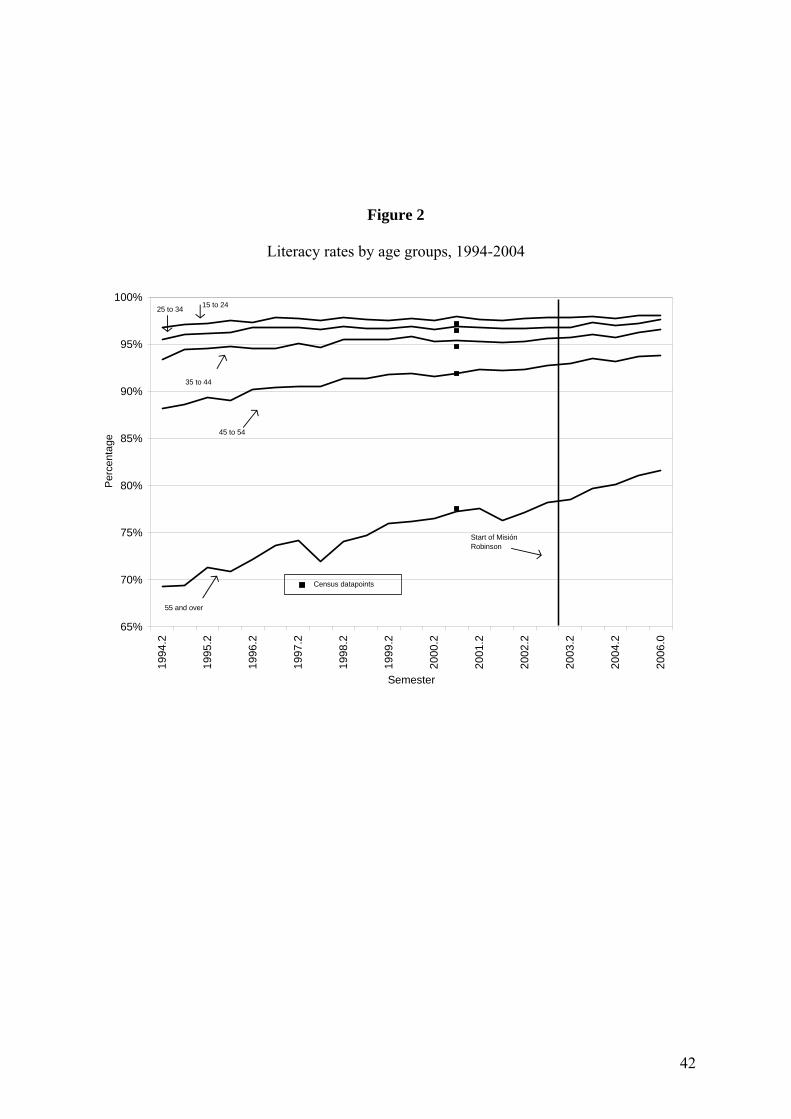
Figure 2
Literacy rates by age groups, 1994-2004
65%
70%
75%
80%
85%
90%
95%
100%
1994
.2
1995
.2
1996
.2
1997
.2
1998
.2
1999
.2
2000
.2
2001
.2
2002
.2
2003
.2
2004
.2
2006
.0
Semester
Per
cent
age
Start of MisiónRobinson
15 to 2425 to 34
35 to 44
55 and over
45 to 54
Census datapoints
42
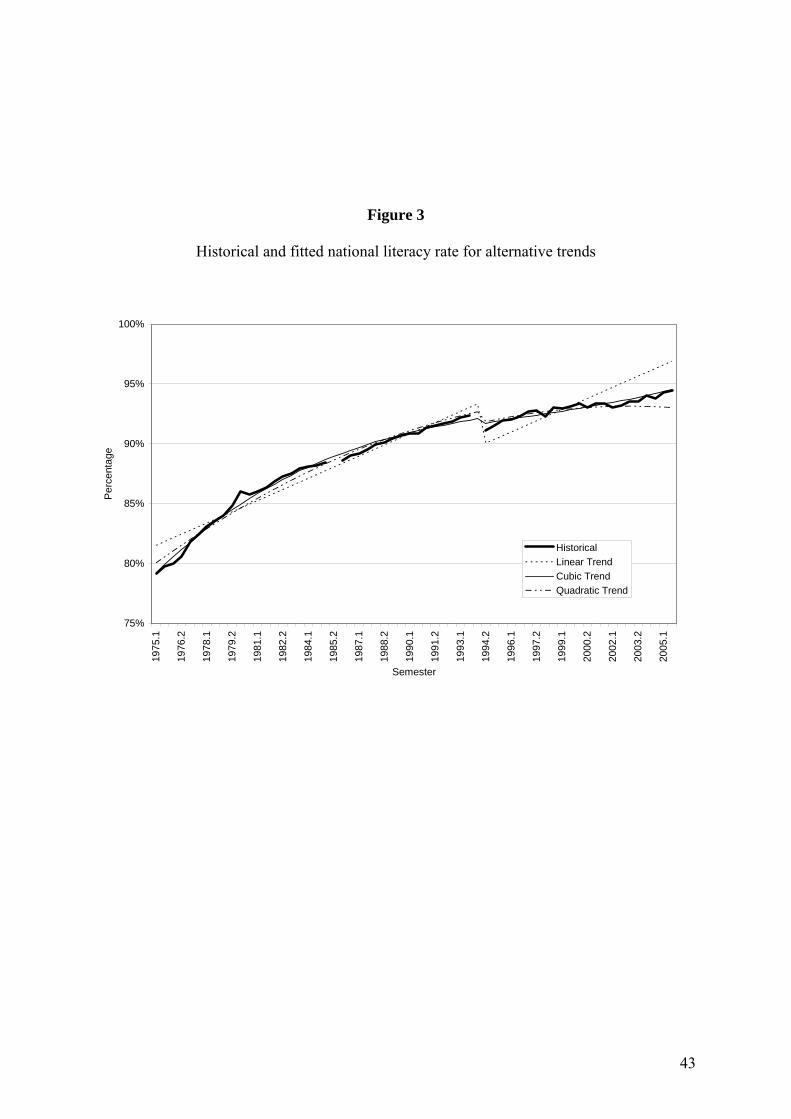
Figure 3
Historical and fitted national literacy rate for alternative trends
75%
80%
85%
90%
95%
100%
1975
.1
1976
.2
1978
.1
1979
.2
1981
.1
1982
.2
1984
.1
1985
.2
1987
.1
1988
.2
1990
.1
1991
.2
1993
.1
1994
.2
1996
.1
1997
.2
1999
.1
2000
.2
2002
.1
2003
.2
2005
.1Semester
Per
cent
age
HistoricalLinear TrendCubic TrendQuadratic Trend
43
Notes
1 “Territorio Libre de Analfabetismo” in Spanish. Gobierno Bolivariano de Venezuela
(2005a), p. 19.
2 The source cited for this information is a presentation made at the UNESCO meetings
by the Cuban Communist Party’s organization Juventud Rebelde.
3 The efficiency rate of a literacy program is the fraction of those enrolled who are able to
pass a writing and reading comprehension exam and do not drop back into illiteracy later on.
4 See Prato (2006).
5 Gobierno Bolivariano de Venezuela (2004), p. 11.
6 The census figures are based on respondents’ answer to the question “Does this family
member know how to read and write?” (“¿Sabe leer y escribir?”) and is thus identical to the
Household Survey Question we will use in the rest of the analysis. Both the Census and the
Households Survey are administered by the National Statistical Institute.
7 Gobierno Bolivariano de Venezuela (2005a), p. 17.
8 On October 29th, Minister Istúriz noted that the 1.2 and 1.5 million estimates referred to
the over-15 rate, citing a 2000 UNESCO study (instead of the 2001 Census) as the source for
the 1.2 million figure (Gobierno Bolivariano de Venezuela, 2005b, p. 5).
9 Traditionally developed economies generally do not collect adult illiteracy data and are
assumed to have adult literacy rates above 99%. See UNDP (2005), p. 222, footnote e to
Table 1.
10 This refers to the UNESCO Institute of Statistics 2002 estimate. See UNDP (2005), p.
222, footnote k to Table 1.
44
11 See Mendoza (2005).
12 Figure 1 also shows that the literacy estimates derived from the household survey
became quite close to those derived from the national census after the 1994 change in
methodology, suggesting that the survey does not systematically under represent illiterate
groups of the population. It is of course possible that both the census and the survey fail to
pick up some illiterate groups, leading to an underestimate of the level of illiteracy in both
series. If these groups become more likely to be picked up by the survey once they become
literate, then our estimates of program effectiveness will be biased upwards. If, in contrast,
these groups remain out of the survey coverage even if they become literate, the bias may
operate in either direction. Even in that case, our estimate of absolute number of illiterate
persons would still be a lower bound for the actual number.
13 According to official estimates, 57.4% of program participants were older than 41, a
much greater proportion than their share of the population, which is 34.2% (Gobierno
Bolivariano de Venezuela, 2005b, p. 31).
14 Estimation for higher order polynomial trends, available from the authors upon request,
yielded substantially the same results.
15 For the 1994-2000 sample, we find that literacy rates among individuals who self-
report their status tend to be 1.15 percentage points higher than among those whose status is
reported by others. The specification includes controls for gender, level of education, head of
household status, age, and semester dummies. Details of the estimation are available from the
authors.
16 39.6% of heads of households and 56.8% of spouses are informants, in contrast to
13.5% of other respondents. This is primarily a result of the interview protocol, which orders
interviewers to select as their informant the head of household or, if s(he) is not present, their
45
spouse. If neither of these is present, the interviewer can choose another adult as the
informant.
17 The total effect is normalized to equal one in the last period during which the program
was operative. Therefore, this variable takes the value 0 up to the first semester of 2003, after
which it increases by ¼ every semester until the first semester of 2005, when it reaches 1 and
remains there until the end of the sample.
18 Cohort-specific literacy rates may still be affected by compositional changes due to
migration and mortality among members of the birth cohort.
19 We have carried out a number of simulations to estimate the power of our tests against
the alternative of a moderately effective program and have found them to be reasonably high
powered. For example, in the case of equation (1) in Table 1, our simulations indicate that
under an AR(1) disturbance with autoregressive coefficient of .8 and standard error of the
white noise component of half a percentage point, the power of the z-statistic would be .70
against an alternative in which Robinson’s effect was 1 percentage point and .98 against one
in which it was 2 percentage points.
20 See Penfold (2007) for evidence of the use of political criteria in the allocation of
Misiones expenditure.
21 After accounting for state-specific cubic trends, we found no evidence of serial
correlation of order greater than one in the state-level series.
22 Even if pro-Chávez governors became more efficient at reducing illiteracy after 2003
for reasons unrelated to the implementation of the program, this would actually bias the
coefficient on trainers upwards and thus against our null. Note that the just-identified nature
of our system impedes us from testing the exclusion restriction directly.
46
23 We drop all state-age cohorts older than 80, fore which there are too few observations
to estimate state-cohort literacy rates with any degree of precision. Our results are
qualitatively similar if we include those age cohorts.
24 Ministerio de Finanzas (2006). Interestingly, all of this allocation belongs to the 2003
budget, with no budget allocations for 2004 and 2005. However, Venezuelan law allows
carrying over non-spent budget lines from one year to another, so that these resources may
have been spread out over the whole period. According to its financial statements, the state-
owned oil enterprise PDVSA (which directly finances many of the misiones) did not give any
additional funding to Misión Robinson. It is, however, possible that other state-owned
enterprises financed Robinson directly.
25 For example, it excludes the value of donations made by Cuba within the context of the
Cuban-Venezuelan Cooperation Agreement, through which Venezuela receives in-kind
transfers in exchange for favourable conditions in oil sales. Cuban donations to the program
included 1.9 million textbooks, 200,000 literacy trainer manuals, 80,000 television sets and
VCR’s for classroom use, 1 million literacy lesson videotapes, 2 million family libraries and
300,000 pairs of eyeglasses. Gobierno Bolivariano de Venezuela (2005b), p.2. Since the
Agreement also covers donations given by Cuba to Venezuela for other purposes (among
them the services of more than 10,000 Cuban doctors that participate in Misión Barrio
Adentro), it is difficult to disentangle the cost to Venezuela of the donations given for Misión
Robinson.
26 UNESCO (2006), p. 235.
27 Public employment did grow significantly during this period, but most of this growth
appears to have come from other misiones – which did receive much higher levels of funding
- and an expansion of public employment in areas unrelated to social policy such as the state-
owned oil enterprise.
47
28 Gobierno Bolivariano de Venezuela (2004)
29 Trainers were required to devote time to “citizen formation”, defined as “learning in
subjects referred to the Constitution, the re-foundation of the Fatherland, the Boliviarian
revolution, among others.” (Ministerio de Educación, Cultura y Deportes 2005, p. 98) The
program’s final assignment required students to demonstrate their newly acquired skills by
writing a letter to president Chávez. See Frente Internacional "Yo si puedo" (2007).
30 See, for example Mendoza (2005), and Sánchez (2003)
48
Related Documents