econstor Make Your Publications Visible. A Service of zbw Leibniz-Informationszentrum Wirtschaft Leibniz Information Centre for Economics Heyman, Fredrik; Norbäck, Pehr-Johan; Hammarberg, Rickard Working Paper Foreign Direct Investment, Source Country Heterogeneity and Management Practices IFN Working Paper, No. 1041 Provided in Cooperation with: Research Institute of Industrial Economics (IFN), Stockholm Suggested Citation: Heyman, Fredrik; Norbäck, Pehr-Johan; Hammarberg, Rickard (2014) : Foreign Direct Investment, Source Country Heterogeneity and Management Practices, IFN Working Paper, No. 1041, Research Institute of Industrial Economics (IFN), Stockholm This Version is available at: http://hdl.handle.net/10419/109124 Standard-Nutzungsbedingungen: Die Dokumente auf EconStor dürfen zu eigenen wissenschaftlichen Zwecken und zum Privatgebrauch gespeichert und kopiert werden. Sie dürfen die Dokumente nicht für öffentliche oder kommerzielle Zwecke vervielfältigen, öffentlich ausstellen, öffentlich zugänglich machen, vertreiben oder anderweitig nutzen. Sofern die Verfasser die Dokumente unter Open-Content-Lizenzen (insbesondere CC-Lizenzen) zur Verfügung gestellt haben sollten, gelten abweichend von diesen Nutzungsbedingungen die in der dort genannten Lizenz gewährten Nutzungsrechte. Terms of use: Documents in EconStor may be saved and copied for your personal and scholarly purposes. You are not to copy documents for public or commercial purposes, to exhibit the documents publicly, to make them publicly available on the internet, or to distribute or otherwise use the documents in public. If the documents have been made available under an Open Content Licence (especially Creative Commons Licences), you may exercise further usage rights as specified in the indicated licence. www.econstor.eu

Welcome message from author
This document is posted to help you gain knowledge. Please leave a comment to let me know what you think about it! Share it to your friends and learn new things together.
Transcript
econstorMake Your Publications Visible.
A Service of
zbwLeibniz-InformationszentrumWirtschaftLeibniz Information Centrefor Economics
Heyman, Fredrik; Norbäck, Pehr-Johan; Hammarberg, Rickard
Working Paper
Foreign Direct Investment, Source CountryHeterogeneity and Management Practices
IFN Working Paper, No. 1041
Provided in Cooperation with:Research Institute of Industrial Economics (IFN), Stockholm
Suggested Citation: Heyman, Fredrik; Norbäck, Pehr-Johan; Hammarberg, Rickard (2014) :Foreign Direct Investment, Source Country Heterogeneity and Management Practices, IFNWorking Paper, No. 1041, Research Institute of Industrial Economics (IFN), Stockholm
This Version is available at:http://hdl.handle.net/10419/109124
Standard-Nutzungsbedingungen:
Die Dokumente auf EconStor dürfen zu eigenen wissenschaftlichenZwecken und zum Privatgebrauch gespeichert und kopiert werden.
Sie dürfen die Dokumente nicht für öffentliche oder kommerzielleZwecke vervielfältigen, öffentlich ausstellen, öffentlich zugänglichmachen, vertreiben oder anderweitig nutzen.
Sofern die Verfasser die Dokumente unter Open-Content-Lizenzen(insbesondere CC-Lizenzen) zur Verfügung gestellt haben sollten,gelten abweichend von diesen Nutzungsbedingungen die in der dortgenannten Lizenz gewährten Nutzungsrechte.
Terms of use:
Documents in EconStor may be saved and copied for yourpersonal and scholarly purposes.
You are not to copy documents for public or commercialpurposes, to exhibit the documents publicly, to make thempublicly available on the internet, or to distribute or otherwiseuse the documents in public.
If the documents have been made available under an OpenContent Licence (especially Creative Commons Licences), youmay exercise further usage rights as specified in the indicatedlicence.
www.econstor.eu

IFN Working Paper No. 1041, 2014 Foreign Direct Investment, Source Country Heterogeneity and Management Practices Fredrik Heyman, Pehr-Johan Norbäck and Rickard Hammarberg
Research Institute of Industrial Economics P.O. Box 55665
SE-102 15 Stockholm, Sweden [email protected] www.ifn.se
Foreign Direct Investment, Source Country
Heterogeneity and Management Practices
Fredrik Heyman
Pehr-Johan Norbäck
Rickard Hammarberg
This version: September 25, 2014
Abstract: This paper examines whether and, if so, why source country heterogeneity exists in foreign direct investment (FDI). Using detailed data on all Swedish firms for the period from 1996 to 2009, we find statistical evidence that affiliate performance differs systematically across source countries. For instance, affiliates of US multinational enterprises (MNEs) are, on average, approximately three times more productive than affiliates headquartered in the Nordic countries. One possible explanation for these discrepancies is differences in organization practices across source countries. Using new firm-level data from the World Management Survey to estimate a global index of the quality of management practices for MNEs with headquarters in our source countries of interest, we find that source country heterogeneity in affiliate performance is highly correlated with differences in management practices. JEL: F21, F23, L1, M1 Keywords: Multinational firms, FDI, Management practices, Firm performance
Acknowledgements: We are grateful for helpful comments from Trond Randøy, David Dorn, and seminar participants at SNEE 2014 and NOITS 2014. Fredrik Heyman acknowledges financial support from the Swedish Research Council for Health, Working Life, and Welfare (Forte) and Torsten Söderberg's foundation, Pehr-Johan Norbäck from the Tom Hedelius' and Jan Wallander's Research Foundation and Rickard Hammarberg from the Marianne and Marcus Wallenberg Foundation. The Research Institute of Industrial Economics (IFN), P.O. Box 55665, SE-102 15 Stockholm, Sweden, [email protected], [email protected] and [email protected].
1
1. Introduction It is a stylized fact that multinational enterprises (MNEs) pay higher wages, have
higher productivity, and perform more R&D than indigenous firms. In his seminal work,
Dunning (1980) provided an early explanation for this pattern, arguing that MNEs possess
unique knowledge of production methods, management practices, or technologies. With the
ownership of such firm-specific assets, he argued, MNEs are able to maintain the sales,
profits, and productivity levels that are required to cover the additional costs associated with
foreign expansion. Firm-specific assets have also been integrated into more formal theories on
foreign direct investment (FDI), such as the Knowledge-Capital Model (see Markusen, 2001),
and more recent models with heterogeneous firms, in which firms select into different entry
modes to serve a foreign market conditional on the quality of their firm-specific assets (see
e.g., Helpman et al., 2004).
Dunning’s original concept was inspired by British industry studies conducted in the
1950s, which revealed that US affiliates where more productive than indigenous British firms.
US firms were superior to British firms, he argued, because production factors were better
managed in US firms and because management practices constituted a firm-specific asset that
could be transferred across borders (from the US to the UK) at little cost.
In this paper, we revisit the question whether source country-specific differences in
productivity exist between foreign affiliates and, if so, what explains such differences. Using
detailed Swedish firm-level data and information on foreign affiliates in Sweden
headquartered in up to 20 source countries, we first establish that significant differences in
productivity exist between foreign-owned firms in general and Swedish firms. We then show
that this foreign productivity premium masks significant source country differences in
productivity between foreign affiliates from different source countries. Using newly available
data from research by Bloom et al. (the World Management Survey (WMS)), we find that the
observed source country heterogeneity in productivity between foreign affiliates is largely
explained by differences in source country MNEs’ global management practices.
We proceed as follows: In the next section, we provide a simple theoretical framework
that we use to discuss the identification of source country-specific differences in productivity.
Ultimately, we are interested in determining whether there exists a pure source country
productivity effect that stems from the institutional or economic conditions of the source
country. In a setting in which foreign firms can enter the market through greenfield entry or
acquisitions of indigenous firms, we demonstrate that productivity differences between source
2
countries can stem from both a selection effect generated by source country-specific entry
barriers (owing to, e.g., geographical or cultural distance to the host country), which compel
foreign firms that enter the country to have unusually high productivity, and a “pure” source
country-specific effect (from, e.g., institutions) that affects productivity in foreign affiliates
regardless of the location of the host country. From our oligopoly model, we also show that
average differences in productivity between foreign affiliates and indigenous firms may arise
through so-called “cherry-picking”, by which foreign firms will have an incentive to purchase
high-quality indigenous firms.
For this purpose, we first estimate average differences in productivity between foreign
affiliates from various source countries and indigenous Swedish firms. To control for cherry-
picking we also estimate how productivity changes after a foreign takeover and compare this
takeover effect for different source countries. Section 3 presents the baseline estimates. We
find significant source country-specific productivity differences, regardless of whether the
estimates arise from cross-sectional variation or within-firm variation generated by ownership
changes. Consistent with Dunning’s original finding, we observe that affiliates of US MNEs
have approximately 30% higher productivity than Swedish firms. Affiliates of Nordic MNEs
and UK MNEs have a productivity premium of only approximately 10% relative to Swedish
firms. Affiliates with France, Germany, Japan, or the Netherlands as a source country lie
between these extremes. Regarding foreign acquisitions, we find smaller effects (as suggested
by foreign “cherry-picking”), but the ranking across source countries remains the same. We
obtain similar results when we compare foreign affiliates to Swedish local firms and Swedish
MNEs and when we divide the estimates into manufacturing and service sectors. We also
document significant additional source country heterogeneity in other firm outcomes.
Having established that significant productivity differences exist between foreign
affiliates from different source countries, Section 4 aims to explain these source country
differences and, in particular, to determine whether management practices can provide an
explanation for these differences. In a series of important contributions, Nicholas Bloom,
Raffaella Sadun, John Van Reenen and co-authors have studied how firms are organized and
operated from a management perspective.1 They have demonstrated that management
1 See Bloom and Van Reenen (2007; 2010), Bloom et al. (2012a), Bloom et al. (2012b), Bloom et al. (2012c), and Bloom et al. (2014) for a summary of this research.
3

practices differ systematically across countries and that firm performance is positively related
to firm management quality.2
To consider management quality, we first use the firm-level data on management
practices in the WMS to estimate an index of the quality of management practices for the
MNEs with headquarters in our source countries. By including host country and year fixed
effects, as well as industry fixed effects, we can estimate average differences in global
management practices for MNEs emanating from source countries with significant ownership
in Sweden. As this global management index is, by construction, not influenced by source
country barriers to investing in Sweden, we can use this index to estimate the effect of MNEs’
source country-specific management practices on the performance of foreign affiliates in
Sweden.
We find that the global management practices of source country MNEs are
significantly correlated with the productivity of their foreign affiliates and that this variable
robustly explains source country heterogeneity in affiliate performance. Further, this
correlation remains statistically and quantitatively significant even after we include numerous
controls for other source country characteristics that may account for source country-specific
barriers or other institutions or economic outcomes in the source country that may affect
foreign affiliates’ productivity. For instance, our estimates reveal that a transfer of ownership
from Luxembourg or Norway, which are revealed to have the lowest estimated MNE
management practices, to the US, which has the highest estimated management practices, is
associated with an increase in affiliate productivity of approximately 18% (in the case of
Norway, explaining nearly the entire difference in average productivity between US and
Norwegian affiliates). The positive relationship between the global management practices of
source country MNEs and the productivity of foreign affiliates in Sweden is also robust to
adding additional source countries, dividing the estimations into different sectors, or using the
different sub-indexes of the WMS.
Our paper makes three contributions to the literature. First, the overwhelming
empirical literature on MNEs and FDI examines the effects of FDI on performance in terms
of employment, productivity, or wages by comparing national firms and foreign firms with all
2 Evidence presented in Bloom et al. (2012c) indicates that management accounts for up to half of the total factor productivity gap between the US and other countries. They also demonstrate that US firms are managed more efficiently than firms from European countries and that this more efficient management is due to a higher level of competition in the US domestic market and better legal traditions in the US. Conditions in the home market of the investing firm can therefore influence the operations of a subsidiary and are hence a potentially important mechanism explaining cross-country differences in FDI outcomes.
4
different source countries combined into a single “foreign ownership” variable. While a few
papers have followed Dunning’s original work on source country heterogeneity, these studies
only examine a limited number of source countries.3 As our data allow us to identify the
source country for each foreign-owned firm in Sweden, we obtain a much richer set of source
countries than that used in previous studies. Thus, the first contribution of this paper is to
document a high degree of source country heterogeneity in FDI outcomes.
Our next contribution is that we also examine the origin of source country
heterogeneity in FDI in detail. By correlating the performance of foreign affiliates in Sweden
with a large number of explanatory variables, ranging from geography to institutions in the
source country, the results also indicate which types of source country characteristics that
provide the greatest benefits for a host country.
In our empirical analysis, we find that the most important variable for affiliate
performance is an index of global management practices, which we estimate for affiliates of
MNEs headquartered in the identified source countries by using data from the WMS. We thus
contribute to the growing field of the new empirical economics of management, which has
demonstrated that a large share of cross-country and within-country productivity, as well as
productivity gaps between firms, can be explained by differences in management practices.
Thus far, this literature stream has put less emphasis on source country differences in the
management practices of MNEs. An exception is Bloom et al. (2012d) who find that US
multinationals obtain higher productivity from IT than non-US multinationals or domestic
firms in Europe, since better (people) management practices in US firms enable them to better
exploit IT. Our study thus goes beyond this US vs. non-US MNE comparison, documenting
large productivity differences between foreign affiliates from numerous source countries, and
that source country-specific variation in the management practices of MNEs explains up to
one-third of this variation.
3 Girma et al. (1999), for instance, investigate foreign ownership in the UK’s manufacturing sector and examine whether productivity and wage differentials are related to the home country of the ultimate holding companies. This division is made for the US, Japan and others. The results reveal that US firms are the most productive and that they pay the highest wages. Conyon et al. (2002) instead distinguish between acquisitions in the UK by examining the acquirer’s country of origin by using binary variables for firms from the US, the EU, and other foreign countries. They observe an increase in productivity across all types of foreign acquisitions, with the greatest increase observed for US firms, followed by EU firms, both being significantly larger than firms in other countries. Finally, Griffith and Simpson (2004) consider foreign-owned firms in the British manufacturing sector and expand the analysis further by including four different countries: the US, France, Germany, and Japan. They find that US firms have become increasingly more productive than domestic British firms and that US firms are the most productive among firms from the four countries. The other countries show no clear patterns.
5
2. Theoretical framework In this section, we describe a simple oligopoly model that will serve as a useful tool
for considering how the source country of ownership affects firm performance and how this
ownership effect can be identified in the data. While the model highlights the ownership
effects of entry by foreign firms in heterogeneous source countries (in a setting in which
foreign firms enter the market through indigenous firm acquisition or greenfield entry), it is
not a structural model.
2.1 Benchmark model
Consider an industry in a country labeled “Home” with n firms present. Let 𝑆 =
{ℎ, 1, … ,𝑚, … ,𝑀} be the set of source countries, where country m is the country where the
owners of firm i reside. Let s = h indicate an indigenous firm, and let s = m indicate that a
firm is foreign owned, where foreign owners can be located in countries {1, … ,𝑚, … ,𝑀}. For
simplicity, suppose that each firm uses capital and labor with Cobb-Douglas technology
𝑞𝑖 = 𝑒𝐴𝑖𝑠 𝐾𝑖𝛼𝐿𝑖𝛽 (1)
In Equation (1), output is 𝑞𝑖, 𝐿𝑖 is the amount of labor hired, and 𝐾𝑖 is the amount of
capital used. The parameter 𝐴𝑖𝑠 captures firm-specific differences in productivity, where 𝑖𝑠
indicates that firm i is headquartered in country s. We let 𝐀 = {𝐴1𝑠 ,𝐴2𝑠 , …𝐴𝑖𝑠 , … ,𝐴𝑛𝑠} be the
vector of firm-specific assets in the market.4
In the empirical analysis, we will examine whether the source country affects firm
performance, as measured by value added per employee. We will then assume that a firm’s
productivity 𝐴𝑖𝑠 is the sum of an idiosyncratic component 𝜙𝑖 and a source country-specific
component 𝜙𝑠
4 Firm-specific assets are central to our analysis, as they explain how heterogeneity across firms from different source countries can arise. Firm-specific assets are also central to the so-called OLI approach to explaining FDI (see Dunning, 1974, 1985, and 1988)). According to the OLI approach, FDI can be explained by multinational firms’ access to Ownership advantages (O), Location advantages (L), and Internalization advantages (I). Firms consist of a collection of assets, which have a public good character within the firm: such assets can be used in multiple locations without decreasing their value. Firm-specific assets stem from knowledge concerning production methods, management practices, technologies, or the ownership of patents and brand names. Ownership of firm-specific assets gives a firm ownership advantages (O). A firm can then use ownership advantages to locate production abroad and to compete across national borders. Location advantages (L) pertain to where the firm will utilize of the services provided by these assets and therefore explain where a firm chooses to locate. Finally, internalization advantages (I) refer to whether firm-specific assets should be retained within the firm or whether the services of these assets can be used by other firms in the host country through, for instance, licensing agreements. While the OLI framework is not a formal theory, it has inspired recent theoretical contributions on FDI and MNEs (see Neary, 2009 for a discussion).
6

𝐴𝑖𝑠 = 𝜙𝑖 + 𝜙𝑠. (2)
We assume that 𝜙𝑖 has been drawn from some distribution G(𝜙𝑖) and that it is taken as
given by the firm. We further assume that 𝜙𝑖 is known by all firms but unknown to the
econometrician, who only has information on the distribution G(𝜙𝑖).
Cost minimization implies that the cost function associated with the technology in (1)
is
𝐶𝑖�𝑤, 𝑟,𝐴𝑖𝑠 , 𝑞𝑖� = 𝜙(𝑤, 𝑟)𝑞𝑖1
𝛼+𝛽𝑒−𝐴𝑖𝑠 , (3)
where 𝜙(𝑤, 𝑟) = 𝜉(𝛼,𝛽)𝑟𝛼
𝛼+𝛽𝑤𝛽
𝛼+𝛽 is a function of the cost shares 𝛼 and 𝛽, the wage rate w,
and the rent to capital r, (all of which we assume to be exogenous). It follows that the
marginal cost is 𝑑𝐶𝑖/𝑑𝑞𝑖 = 𝑐𝑖, or
𝑐𝑖�𝑞𝑖,𝐴𝑖𝑠� = 1𝛼+𝛽
𝜙(𝑤, 𝑟)𝑞𝑖−(𝛼+𝛽−1𝛼+𝛽 )𝑒−𝐴𝑖𝑠 (4)
Suppose that firms compete a la Cournot in selling homogenous goods (we discuss
other oligopoly models below). The inverse demand is 𝑃(𝑄), where 𝑄 = ∑ 𝑞𝑖𝑛𝑖=1 is the
aggregate output, and we assume that the aggregate demand is concave 𝑃′(𝑄) < 0 and
𝑃′′(𝑄) ≤ 0. Firms in the industry have profits
𝜋𝑖 = �𝑃(𝑄) − 𝑐𝑖�𝑞𝑖,𝐴𝑖𝑠��𝑞𝑖 − 𝐹𝑖𝑠 , (5)
where 𝐹𝑖𝑠 is the entry cost into the industry for firm i with headquarters in country s. The first-
order conditions defining the Nash-equilibrium 𝐪∗(𝐀) = (𝑞𝑖∗(𝐀),𝑞−𝑖∗ (𝐀)) are 𝜕𝜋𝑖𝜕𝑞𝑖
(𝑞𝑖∗,𝑞−𝑖∗ ) =
0, where 𝐀 is, again, the vector of firm-specific assets in the market. The first-order
conditions take the following form
𝜕𝜋𝑖𝜕𝑞𝑖
= 𝑃(𝑄∗) − 𝑐𝑖�𝑞𝑖∗,𝐴𝑖𝑠� − 𝑃′(𝑄∗) = 0,∀𝑖. (6)
7

Assuming that the stability conditions for the Nash-equilibrium 𝐪∗(𝐀) = (𝑞𝑖∗(𝐀),𝑞−𝑖∗ (𝐀)) are
fulfilled, we can use (5) and (6) to derive optimal profits 𝜋𝑖∗(𝐀) = �𝑃(𝑄∗(𝐀)) −
𝑐𝑖�𝑞𝑖∗(𝐀),𝐴𝑖𝑠��𝑞𝑖∗(𝐀) − 𝐹𝑖𝑠 , where the total output is 𝑄∗(𝐀) = ∑ 𝑞𝑖∗(𝐀)𝑛
𝑖=1 and the marginal
cost 𝑐𝑖�𝑞𝑖∗(𝐀),𝐴𝑖𝑠� is given by (4). Assuming, for simplicity, a linear demand, 𝑃(𝑄) = 𝑎 − 𝑄,
it is straightforward to show that the following Lemma holds:
Lemma 1 Holding the number of firms constant, firm i’s profit is increasing in its own
productivity 𝑑𝜋𝑖∗(𝐀)
𝑑𝐴𝑖𝑠> 0 but decreasing in the productivity of its rivals, 𝑑𝜋𝑖
∗(𝐀) 𝑑𝐴𝑗𝑠
< 0, 𝑖 ≠ 𝑗.
To close the model, firms—both foreign and domestic—will enter the market by exploiting
profit opportunities. Firms may then enter an industry by purchasing existing firms or
establishing new plants, and existing firms may merge if doing so is profitable. A complete
analysis of this process is outside the scope of this paper. As our interest lies in identifying
source country-specific differences in productivity,𝜙𝑠, we will instead use the model to
highlight specific problems that arise when we attempt to identify these source country-
specific differences in productivity.
2.2 Econometric model In the empirical analysis, we will estimate how labor productivity depends on a firm’s
source country. Without intermediate inputs, we can write value added per employee as
𝑉𝐴𝑖
∗
𝐿𝑖∗ = 𝑃(𝑄∗)𝑞𝑖
∗
𝐿𝑖∗ , (7)
where we have omitted the asset vector 𝐀 and where Shephard’s Lemma 𝜕𝐶𝑖� 𝐴𝑖𝑠 , 𝑞𝑖∗�/𝜕𝑤 =
𝐿𝑖∗ gives the demand for labor. If we substitute (1) and (2) into (7) and if we rewrite and take
logs, we obtain
log �𝑉𝐴𝑖∗
𝐿𝑖∗ � = 𝑃(𝑄∗) + 𝛼 log �𝐾𝑖
∗
𝐿𝑖∗� + (𝛼 + 𝛽 − 1) log(𝐿𝑖∗) + 𝜙𝑠 + 𝜙𝑖. (8)
Equation (8) can be used to estimate how source country differences affect productivity,
where 𝜙𝑖 is the error term and 𝜙𝑠 captures the influence of the source country on productivity.
Identifying 𝜙𝑠 is associated with at least two challenges, as described below.
8
2.2.1 Barriers to greenfield entry
Domestic firms likely have lower entry costs than foreign firms, as domestic firms
have greater knowledge of the domestic market. This is the "foreign liability effect"
(Dunning, 1980 and Beugelsdijk et al., 2013), which suggests that foreign firms will need to
have unusually high draws on their idiosyncratic productivity 𝜙𝑖 to enter the domestic market.
To illustrate this effect, suppose that entry costs are
𝐹𝑖𝑠 = 𝐹𝑖 + 𝐹𝑠 = � 𝐹𝑖, 𝑖𝑓 𝑠 = ℎ𝐹𝑖 + Δ𝑚, 𝑖𝑓 𝑠 = 𝑚, (9)
In Equation (9), the term Δ𝑚 > 0 captures the foreign liability effect. Let 𝐴ℎ = 𝜙�𝑖ℎ + 𝜙ℎ be
the lowest productivity associated with entry by a domestic firm, and let 𝐴𝑚 = 𝜙�𝑖𝑚 + 𝜙𝑚 be
the lowest productivity associated with entry by a foreign firm headquartered in country m.
Then
𝜋𝑖∗�𝐴ℎ� = 𝐹, 𝜋𝑖∗�𝐴𝑚� = 𝐹 + Δ𝑚. (10)
If Δ𝑚 > 0, it follows from Lemma 1 that 𝐴𝑚 = 𝜙�𝑖𝑚 + 𝜙𝑚 > 𝐴ℎ = 𝜙�𝑖ℎ + 𝜙ℎ, i.e.,
foreign firms need a higher minimum productivity to enter the market. This selection effect is
a potential problem for identifying source country-specific productivity differences: if the
“entry hurdle”, Δ𝑚, in (9) and hence the implied cut-off 𝜙�𝑖𝑚 are correlated with the source
country-specific productivity 𝜙𝑚, we cannot identify whether foreign source country
productivity 𝜙𝑚 differs from domestic source country productivity 𝜙ℎ when estimating (8).
To address this problem, we will try to measure 𝜙𝑠 directly by using data on
management practices from the WMS. Firms may have different abilities to adopt best
management practices, or they may have obtained innovations or found ways to motivate staff
in ways that rivals are unable to copy. Research by Bloom, Sadun and Van Reenen and co-
authors has shown that these abilities differ systematically across source countries. To control
for the foreign liability effect, or the hurdle effect, we will also control for other source
country factors that may influence the ease of entry to isolate the impact of source country-
generated management practices.
9

2.2.2 Acquisition entry and "cherry-picking"
A large share of FDI occurs through foreign acquisitions of domestic firms rather than
through greenfield entry. In an oligopoly, entry by acquisition may then generate so-called
"cherry-picking": foreign firms tend to purchase the “best” domestic firms—in our
framework, domestic firms with high productivity, 𝐴𝑖ℎ. This cherry-picking creates an
upward bias in our estimates of the effect of foreign ownership on productivity in (8) and may
also bias comparisons between foreign owners (to the extent that “cherry-picking” occurs
differently among source countries).
To illustrate, let us follow the approach in Neary (2007) and examine bilateral,
“myopic” merger incentives for foreign takeovers.5 To see how “cherry-picking” can arise,
define 𝑣𝑖 = 𝜋𝑖∗(𝐀) as the reservation price for a domestic firm (for simplicity, we call it firm
i), where, again, 𝜋𝑖∗(𝐀) indicates that firms are in possession of assets 𝐴𝑖𝑠 in the initial
equilibrium with an asset vector 𝐀 = (𝐴1𝑠 ,𝐴2𝑠 , … ,𝐴𝑛𝑠). The value of a foreign firm j with its
headquarters in country m of purchasing domestic firm i is then 𝑣𝑗𝑖 = 𝜋𝑗∗�𝐀𝑗𝑖� − 𝜋𝑗∗(𝐀) −
𝑇𝑗𝑚, where 𝑇𝑗𝑚 is the transaction cost and 𝜋𝑗∗�𝐀𝑗𝑖� is the profit of firm j, when—in addition to
its assets 𝐴𝑗𝑚—it also possesses firm i’s assets 𝐴𝑖ℎ, i.e., 𝐀𝑗𝑖 = �𝐴1𝑠 , … , 0, … ,𝐴𝑗𝑚 +
𝐴𝑖ℎ , … ,𝐴𝑛𝑠�, where the zero entry indicates that firm i sold its assets. To purchase firm i, firm
j thus needs to have a willingness to pay 𝑣𝑗𝑖 that exceeds 𝑣𝑖, i.e., 𝑣𝑗𝑖 > 𝑣𝑖 . The standard
Salant, Switzer, and Reynolds (1983) result implies that a foreign acquisition will not be
profitable at low asset quality (when 𝐴𝑖ℎis low). Essentially, at low asset quality, the increase
in profit for the acquirer from its increased market power will not exceed the profit that it
would earn if it did not make the acquisition. However, note that Lemma 1 implies that a
foreign firm’s valuation tends to increase more rapidly than the reservation price when the
target’s assets increase in quality, since
𝑑(𝑣𝑗𝑖−𝑣𝑖)𝑑𝐴𝑖ℎ
=𝑑𝜋𝑗
∗�𝐀𝑖𝑗�
𝑑𝐴𝑖ℎ�����(+)
−𝑑𝜋𝑗
∗(𝐀)
𝑑𝐴𝑖ℎ���(+)
−𝜋𝑗∗(𝐀)
𝑑𝐴𝑖ℎ�−
. (11)
5 A more complicated strategy is to use an endogenous merger approach in which fewer assumptions are made in determining which firms are potential buyers and sellers. As our goal is merely to illustrate the mechanisms, we use the simple “exogenous” mergers approach. For endogenous mergers, see e.g., Norbäck and Persson (2007), Horn and Persson (2001), and Jehiel and Modovano (2000).
10
The two first terms show that higher productivity increases the possessor’s profit, (the
possessor’s profit increases irrespective of the identity of the owner of 𝐴𝑖ℎ). Thus, their sum is
ambiguous, and the sign depends on details such as how the concentration effect influences
the sensitivity of the profits of the possessor to increasing productivity, whether synergies
arise between firm j’s and firm i’s assets, and so on. However, from Lemma 1, we have that 𝜋𝑗∗(𝐀)
𝑑𝐴𝑖ℎ< 0, and hence, the negative externality faced by firm j from a higher quality of firm i’s
assets (when firm i does not sell to firm j) creates an additional incentive for firm j to
purchase firm i. If the latter effect is substantial, while the former is netted out or small, 𝑑(𝑣𝑗𝑖−𝑣𝑖)𝑑𝐴𝑖ℎ
> 0, ”cherry-picking” will arise. Domestic targets will then tend to be firms with
high-quality assets, i.e., firms with a high 𝐴𝑖ℎ. Productivity differences between domestic and
foreign firms in a cross-sectional analysis such as (9) may then stem from foreign firms
purchasing the "best" indigenous firms.
To address ”cherry-picking”, we use a panel analysis and replace 𝜙𝑖 in (8) with
𝜙𝑖 + 𝜀𝑖, where 𝜙𝑖 is now a fixed effect and 𝜖𝑖 is a standard iid error term.
log �𝑉𝐴𝑖∗
𝐿𝑖∗ � = 𝑃(𝑄∗) + 𝛼 log �𝐾𝑖
∗
𝐿𝑖∗� + (𝛼 + 𝛽 − 1) log(𝐿𝑖∗) + 𝜙�𝑠 + 𝜙𝑖 + 𝜀𝑖 . (12)
With a firm-specific effect, 𝜙𝑖, estimates of 𝜙�𝑠 will reveal the effect on productivity when an
acquisition changes the source country of ownership, where 𝜙�𝑠 = 𝜙ℎ holds before the
acquisition and 𝜙�𝑠 = 𝜙𝑚 + 𝜙ℎ after a foreign acquisition. We can then infer source country-
specific differences in productivity between different home countries by comparing different
foreign source countries with one another, provided that source countries do not differ in their
propensity to cherry pick. This assumption may not hold, however, if foreign firms face
different transactions costs in acquisitions, 𝑇𝑗𝑚, creating a “hurdle effect” similar to that
observed in greenfield entry.
While the panel estimates from (12) should enable us to identify the source country-
specific effect 𝜙𝑚, foreign acquisitions also create an additional potential econometric
problem. Estimates of 𝜙�𝑚 in (12) can be upward biased if an acquisition implies a reduction
in the number of firms in the market, which will increase the product market price 𝑃(𝑄∗) in
(12) under standard assumptions. However, if this market power effect is similar between
foreign acquisitions, it may vanish when we compare acquisitions from different source
11

countries. Thus, even if the effect of a foreign acquisition on the productivity of the target
firm is potentially upward biased, we can eliminate or limit this upward bias if we compare
the effect of foreign acquisitions on domestic firms among foreign source countries.
2.2.3 Other oligopoly models
To highlight results, we have used a Cournot model with homogenous products. It is
however straightforward to extend the analysis to other forms of oligopoly interaction.
Suppose for instance that firms produce differentiated products and compete in prices, with
variable profits 𝜋𝑖 = �𝑝𝑖 − 𝑐𝑖�𝑞𝑖,𝐴𝑖𝑠��𝑞𝑖(𝑝𝑖,𝑝−𝑖), where 𝑝𝑖 is the price of firm i, 𝑝−𝑖 is the
price of its rivals and 𝑞𝑖(𝑝𝑖,𝑝−𝑖) is the demand facing firm i with 𝜕𝑞𝑖𝜕𝑝𝑖
< 0 and 𝜕𝑞𝑖𝜕𝑝−𝑖
> 0. Then,
the Nash-equilibrium in prices is given from 𝜕𝜋𝑖(𝑝𝑖∗,𝑝−𝑖
∗ )𝜕𝑝𝑖
= 0. Write the Nash-equilibrium as
𝐩∗(𝐀) = (𝑝𝑖∗(𝐀),𝑝−𝑖∗ (𝐀)) and note that 𝜋𝑖(𝐀) = �𝑝𝑖∗ − 𝑐𝑖�𝑞𝑖(𝐩∗(𝐀)),𝐴𝑖𝑠��𝑞𝑖(𝐩∗(𝐀)). In most
oligopoly models, including Bertrand competition, one can then show that Lemma 1 applies.
Under Bertrand competition, labor productivity is �𝑉𝐴𝑖∗
𝐿𝑖∗ � = 𝑝𝑖
∗𝑞𝑖(𝐩∗)𝐿𝑖∗ . If we substitute (1) and (2)
into the former expression, rewrite and take logs, we obtain
log �𝑉𝐴𝑖∗
𝐿𝑖∗ � = 𝑝𝑖∗ + 𝛼 log �𝐾𝑖
∗
𝐿𝑖∗� + (𝛼 + 𝛽 − 1) log(𝐿𝑖∗) + 𝐴𝑖𝑠. (13)
Note that estimating (13) is then synonymous to estimating equation (12).
3. Empirical analysis
3.1 Data To examine if source country productivity differences are present, we will use detailed
data from a very extensive and detailed database from Statistics Sweden (SCB). The database
comprises firm, plant and individual data, linked together with unique identification numbers.
The analysis covers the period 1997 to 2009 and is based on all firms with at least 10
employees.
Firm-level data are taken from several register-based data sets in Statistics Sweden
that cover the entire private sector. First, the financial statistics contain detailed firm-level
information on all Swedish firms in the private sector. Examples of variables are value added,
12
capital stock (book value), number of employees, total wages, ownership status, profits, sales,
and industry affiliation. Second, the Regional Labor Market Statistics (RAMS) includes plant-
level data on all firms. The RAMS adds firm information on the composition of the labor
force with respect to educational level and demographics.6
In order to examine the role of the nationality of the foreign owned firms, we have
matched our firm-level data with data from the Swedish Agency for Economic and Regional
Growth (Tillväxtanalys).7 These data contain information about the nationality of foreign
multinational firms operating in Sweden. The data from the Swedish Agency for Economic
and Regional Growth allows us to distinguish between the nationalities (source countries) of
owners of foreign owned firms that control firms in Sweden. The main owner’s place of
origin defines the nationality. The Agency uses definitions of nationality of firms that are in
accordance with definitions in similar data from the OECD and Eurostat.
A firm is finally classified as a foreign-owned MNE if more than 50 percent of the
equity is foreign-owned.8 A foreign acquisition is defined as a firm that switches from being
Swedish owned to being foreign owned. All firms except those that experience more than two
ownership changes during the time period we study are included in the analysis. Furthermore,
we only study acquisitions of firms where we have yearly information before and after the
acquisition. We can relax these restrictions without qualitatively changing our results.
3.2 Descriptive statistics This section presents descriptive evidence on source country differences. We begin by
documenting the evolution and importance of foreign ownership in Sweden and then present
evidence on differences between Swedish-owned firms and foreign firms from different
countries.
Employment in foreign-owned firms
Figure 1 depicts the evolution of the total number of employees in Sweden in firms
with at least 10 employees and the total number of employees in Swedish-owned firms. The
difference between the two curves constitutes the number of employees in foreign-owned
firms in Sweden. A number of observations emerge from Figure 1.
6 Plant-level data are aggregated at the firm level. 7 Detailed information regarding the data on nationality of firms can be found in Tillväxtanalys 2011. 8 Statistics Sweden uses the internationally common 50 percent cut-off in defining foreign ownership. Other studies on FDI do typically not find lower cut-off values to matter for the results (see e.g. Huttunen, 2007 and Barbosa and Louri, 2002).
13
--Figure 1 about here--
Total employment varies substantially over the 1996-2009 period. Sweden
experienced its greatest economic crisis in the post-war period during the early 1990s, when
Swedish companies lost their competitiveness in the world market while the Swedish state
became very highly leveraged. During the recovery over the two following decades, total
employment increased steadily until the IT crisis at the turn of the millennium. As the
economy again recovered, total employment increased until circa 2008 at the outbreak of the
financial crisis.9
Foreign firms were crucial in this process, as employment increased much more in
foreign-owned firms than in Swedish-owned firms; in 1996, foreign subsidiaries accounted
for less than one-fifth of total employment; by 2009, however, foreign firms represent nearly
one-third of total employment in firms with at least 10 employees. More than 80% of the new
jobs were created in foreign-owned firms.10 These trends can also be seen in Table 1, which
reports the total number of firms in Sweden, the total number of Swedish-owned firms, and
the total number of foreign-owned firms during the 1996-2009 period. During this period, the
number of foreign-owned firms more than doubled, while the corresponding increase in the
number of Swedish-owned firms was only 35%.
--Table 1 about here—
Foreign acquisitions
Foreign acquisitions were also clearly important. The last column in Table 1 reports
annual figures on the number of foreign acquisitions in Sweden during the 1997-2009 period.
Table 1 shows that a large share of the increase in foreign ownership occurred through foreign
acquisitions, including foreign acquisitions of large Swedish MNEs, such as car producers
Volvo and SAAB Automobile. The number of acquisitions varies significantly over the
9 The Swedish economy was reformed in fundamental ways in response to the recession that followed in the beginning of the 1990s. Reforms included shifting to a flexible exchange rate regime, cutting public spending, implementing major privatization and widespread market deregulation, reforming the budget system, and increasing Central Bank autonomy with a fixed inflation target. 10 Major explanations for this increase in foreign ownership include improvements in the business climate through the reformation of the Swedish economy. Examples of reforms are deregulated capital and foreign exchange markets in the late 1980s and reduced barriers to foreign ownership. The large currency crisis in 1992 also reduced the cost of Swedish assets and the cost of locating production in Sweden.
14
period considered, with an average of 352 acquisitions of Swedish-owned firms with at least
10 employees per year.
Different source countries
Then, from what countries does the foreign ownership in Sweden primarily originate?
In Table 2, we report the share of employment in foreign-owned Swedish firms with owners
from twelve countries. The selection of countries is based on the countries with the largest
number of firms located in Sweden. Therefore, apart from China, these countries dominate
foreign ownership in the Swedish business sector.11 The figures in Table 2 are presented as
annual averages for three separate periods—1996-2000, 2001-2005, and 2006-2009—as well
as for the entire 1996-2009 period.
--Table 2 about here--
Regardless of the period considered, US firms dominate, and approximately 20% of
all workers are employed in a foreign firm with a US parent company. Firms from large
European countries such as the UK, Germany, and France together employ approximately
28% of Swedish workers in foreign-owned firms. Firms from the Nordic countries represent a
similar share of foreign employment in Sweden to that of the larger European countries.
While the Nordic countries are much smaller, they are geographically closer to Sweden. From
the discussion above, firms from countries closer to Sweden are likely to face lower entry
costs, which can explain their large presence in Sweden. Somewhat surprisingly,
approximately 4% of all employees in foreign firms during the 2006-2009 period have
owners headquartered in Luxembourg. A potential explanation for this result is that locating
the head office in Luxembourg entails tax advantages.
The last column in Table 2 reports the average number of affiliates emanating from
different source countries during the considered period. Consistent with the employment
shares, US firms have the largest number of subsidiaries, followed by Norway and Germany.
Source country differences in performance
Let us now examine source country differences in affiliate performance. The first
column in Tables 3 compares the average labor productivity in foreign firms with owners
from selected countries with Swedish firms of different types (China now being omitted).
11 China’s miniscule share of the total employment in foreign-owned firms in Sweden indicates that despite the strong growth and development of the Chinese economy, Chinese ownership in Sweden has not expanded.
15
Regardless of the country of origin, foreign subsidiaries have a higher average productivity
than Swedish firms. Moreover, US firms have the largest difference: the average difference in
labor productivity between a US-owned firm and a Swedish-owned firm is 260,000 SEK.
Norwegian firms have the smallest average difference; their labor productivity merely
exceeds that of Swedish firms by 70,000 SEK. This pattern is consistent with the discussion
in Section 2.2.1 regarding the higher barriers to entry for far-distant US firms than closer
Nordic firms, which force US firms that enter Sweden to be more productive on average than
their Nordic rivals (which, in turn, must be more productive than indigenous Swedish firms
facing the lowest barriers). However, as also noted in that section, such source country-
specific differences can also mirror specific institutions in the source countries: for instance,
the large and competitive home market in the US is likely to foster highly productive firms, of
which some will invest abroad.
--Table 3 about here--
It is a well-known stylized fact that MNEs should be more productive, on average,
than local firms. Comparing affiliates of Swedish multinational firms in Sweden with
Swedish local (non-multinational) firms provides evidence of the higher productivity of
MNEs relative to local firms. Swedish MNEs have a labor productivity exceeding that of
Swedish local firms by 160,000 SEK. Swedish parent also have higher labor productivity than
foreign affiliates from several other countries, possibly reflecting that headquarters services
compose a larger share of activities for Swedish MNEs than for foreign affiliates.
Finally, Table 3 examines how source country ownership affects affiliate size in terms
of the number of employees, average wages in the affiliates, and the share of workers with
university education. Figure 2 shows that all these measures are highly correlated with
affiliate productivity. Beginning at the top left in Figure 2, source country labor productivity
is highly correlated with number of employees.12 Swedish parent MNEs are somewhat an
outlier in terms of the number of employees, but this result should again not be surprising, as
Sweden is the home country of these firms. Finally, Figure 2 indicates that source country
productivity is highly correlated with the mean wage and skill share of firms from the same
source country.
12 Under mild assumptions, this correlation can also be shown to hold by using the factor demand for labor in Section 2, which increases with source country labor productivity.
16
--Figure 2 about here—
3.3 Estimating source country differences in productivity We now turn to the regression analysis. We first empirically estimate the “ownership”
Equation (8) in Section 2.1 as follows:
log �𝑉𝐴𝑖𝑡∗
𝐿𝑖𝑡∗ � = 𝛿 + ∑ 𝛾𝑚𝐷𝑖𝑚𝑡𝑚 + 𝜑 log �𝐾𝑖𝑡
∗
𝐿𝑖𝑡∗ � + 𝜓 log(𝐿𝑖𝑡∗ ) + 𝜗𝑆ℎ𝑎𝑟𝑒_𝑠𝑘𝑖𝑙𝑙𝑒𝑑 + 𝜇ℎ𝑡 + 𝜀𝑖𝑡
(14)
In Equation (14), we control for product market prices 𝑃(𝑄∗) by adding industry, year, and
combined industry-year fixed effects. We also control for a firm’s capital intensity and size in
terms of employment in logs. The share of skilled workers, defined as the percentage share of
employees with a higher education, is added as an additional control. 13 The dummy variable
𝐷𝑖𝑚𝑡 contains information on the ownership of firm i at time t, where 𝐷𝑖𝑚𝑡 = 1 holds if the
firm is owned by a firm headquartered in a foreign country m and 𝐷𝑖𝑚𝑡 = 0 holds if firm i has
a Swedish owner. Swedish ownership is then our base category and is captured by the
intercept 𝛿; hence, the estimated coefficient 𝛾�𝑚 indicates the average percentage difference in
labor productivity between a foreign-owned firm with controlling owners located in country
m and a Swedish-owned firm, in a given industry-year pair. As in Section 3.2, we let country
𝑚 be represented by Denmark, Finland, France, Germany, Japan, Luxembourg, Netherlands,
Norway, Switzerland, UK, and the US. While these countries dominate foreign ownership in
Sweden, as a robustness check, we will also include additional countries in our analysis.
The foreign firms that are used to estimate Equation (14) are subsidiaries that were
established before 1996, established as start-ups or greenfields during the given time period,
or established through acquisitions of Swedish firms. As noted in Section 2.2, differences in
labor productivity between foreign-owned firms and Swedish-owned firms might arise
because foreign firms tend to acquire (“cherry-pick”) high-quality Swedish firms. To control
for “cherry-picking” and unobservable firm characteristics, we estimate the acquisition
Equation (12) from Section 2.2 as follows:
13 We have thus added skilled labor as an input in the production function (1). Formally, we should then take the log of the share of skilled labor. However, as many firms, often smaller firms, may have a zero skill share, we do not include the log of the skill share. However, we also estimated (14) with the skill share in logs and did not observe qualitative changes in the results.
17

log �𝑉𝐴𝑖𝑡∗
𝐿𝑖𝑡∗ � = 𝛿 + ∑ 𝛾𝑚𝐷𝑖𝑚𝑡𝑚 + 𝜑 log �𝐾𝑖𝑡
∗
𝐿𝑖𝑡∗ � + 𝜓 log(𝐿𝑖𝑡∗ ) + 𝜗𝑆ℎ𝑎𝑟𝑒_𝑠𝑘𝑖𝑙𝑙𝑒𝑑+𝜇𝑡+𝜙𝑖 + 𝜀𝑖𝑡. (15)
In Equation (15), we include a firm fixed effect 𝜙𝑖 to control for unobserved
heterogeneity in productivity and estimate the equation on all Swedish firms that become
acquired. Firms that change ownership may, however, already before the takeover be
developing differently from firms that are not acquired.14 Our approach to this problem is to
address the issue of potentially omitted variables that may be related to the likelihood of being
a takeover target. For this purpose, we exploit the fact that all acquisitions do not occur during
the same time period. Using the “staggered” nature of the data, we can compare estimates
from the full sample of firms to estimates obtained when we drop all firms that are never
takeover targets from the sample. As identification in both cases comes from within-firm
variation, the difference between the two approaches lies in the choice of the control group.15
If takeover targets as a group have different observable and unobservable characteristics from
other firms, using the target sample would provide a better estimate of the actual takeover
effect, provided that the characteristics are not time varying.
Thus, in our main specification, Equation (15) is estimated on the sample of Swedish
firms that are acquired at some point from 1996 to 2009 by a foreign firm headquartered in
country m.16 This implies that identification of the effect of foreign ownership then stems
from the variation over time within firms. In this “difference-in-difference” approach, the
estimated coefficient 𝛾�𝑚 shows the average difference change in labor productivity that
occurs in a Swedish firm after the change to foreign ownership from source country m.
In Section 2.2, we also noted that the effects on the performance of the target firm
from a foreign acquisition can be inflated by market power effects. With one fewer firm in the
market, the remaining firms can raise prices, which can inflate labor productivity. In Equation
(15), we thus control for this market power effect by comparing different foreign acquisitions
and by assuming that the market power effects are similar between acquisitions from different
14 In other words, the concern is that the “parallel trends” assumption is violated or, more technically, that acquisitions are correlated with the error term. 15 See Stevenson and Wolfers (2006) for a detailed discussion of such a “staggered” difference-in-difference approach. 16 As a comparison, we also estimated Equation (15) on the sample of all firms (not only on target firms). This estimation provided qualitatively identical results, which are available upon request.
18

source countries. We also distinguish between Swedish local firms and Swedish parent MNEs
in Equations (14) and (15) and between the manufacturing and the service sector.
Finally, note that we cannot claim that our estimates of source country-specific effects
on productivity are causal. To identify causal effects, we would need to randomly allocate
ownership and to then measure the effects. Specification (15) is the best approximation of a
causal effect, as it allows us to compare the same firm when it is Swedish owned and when it
is foreign owned.
4. Source country heterogeneity in affiliate productivity In this section, we present statistical evidence on cross-country differences in productivity
among foreign affiliates headquartered in different source countries. In the next section, we
examine the sources of these differences.
4.1 Foreign ownership As a point of reference, we begin Table 4 with a version of Equation (14) in which we
omit firm controls and in which only estimate a single foreign ownership dummy. Column (1)
then indicates that in a given industry-year, foreign-owned firms have approximately 18%
higher labor productivity than Swedish-owned firms. This estimate is also statistically
significant at the 1% level and is approximately half the size of the foreign productivity
premium emerging from Table 3.
--Table 4 about here--
In Specification (2), we divide the effect of foreign ownership into a number of
different source countries specified in Equation (14). These estimates (all highly significant)
reveal considerable source country heterogeneity: at the top end, we again find that US firms
have approximately 30% higher labor productivity on average than Swedish firms; at the
bottom, we find that firms headquartered in the Nordic countries have only an approximately
10% higher productivity premium than Swedish firms.
Specification (3) provides the results of estimating Equation (14) with firm controls.
We find that adding firm controls reduces the estimated source country differences in
productivity. However, the ranking is not affected. This result is further illustrated in the top
panel of Figure 3 (Panel I), which depicts the point estimates 𝛾�𝑚 together with their 95%
19
confidence intervals. When the affiliates are ranked according to source country productivity,
US affiliates are followed by Swiss, French, and Japanese affiliates, which are in turn
followed by affiliates from Germany, Holland, and Luxembourg. UK affiliates have a
productivity differential from Swedish firms that is similar to that of Nordic firms and thus
are at the bottom of the distribution.
--Figure 3 about here--
Figure 3 (Panel I) and Table 4 thus indicate that significant differences in productivity
exist between source countries. Table A1 in the Appendix tests this hypothesis statistically by
using Wald tests of the equality of the estimated source country coefficients, i.e., tests of
whether 𝛾�𝑚𝑗 = 𝛾�𝑚𝑘 . The top panel in Table A1 in Appendix reveals that US affiliates have a
significantly higher productivity than affiliates from all other source countries. Further, Swiss
affiliates have significantly higher productivity than affiliates from most other source
countries, while Danish affiliates have lower average productivity than most other source
countries.
To further explore how foreign ownership depends on the source country, we divide
our sample into manufacturing and service sectors. The results are qualitatively similar,
although we tend to obtain estimates that are more significant for the service sector (see
columns 4 and 5 in Table 4).
Next, we compare foreign-owned firms with non-multinational Swedish firms, i.e.,
“local firms”, and with multinational Swedish firms. We first estimate Equation (14) for
Swedish local firms and foreign affiliates and then for Swedish parent firms (the home
components of Swedish MNEs) and foreign affiliates. Column 6 reports the estimates with
Swedish local firms as the reference, while column 7 provides the estimates with Swedish
MNEs as the reference.17 The results are clear: the significant differences in performance
between foreign firms and Swedish firms are predominately attributable to differences
between foreign-owned firms and Swedish local firms. While we find that US affiliates have
17 Our theoretical framework does not distinguish between domestic local firms and domestic MNEs. It is straightforward, however, to also include a foreign investment decision for domestic firms. Including this variable would generate the same type of hurdle effect for domestic MNEs, which would also render these firms more productive than purely local firms. However, a complication arises because Sweden is the headquarters country for Swedish MNEs. As headquarters activities might differ from affiliate activities (headquarters activities may include R&D, marketing, and sales, for instance), we need to be careful in making a comparison with foreign firms. In this respect, comparing foreign affiliates to Swedish local firms is the closest practical approximation of the theoretical discussion above.
20

a statistically significant productivity premium relative to Swedish MNEs, Swedish parent
MNEs exhibit a statically significant productivity premium relative to affiliates from most
other source countries. However, if we compare relative performance measures across source
countries, the results for the two control groups of Swedish firms are very similar. This
similarity is revealed by comparing the two upper panels (Panel I and II) in Figure 4. Wald
tests in Table A1 also reveal that we obtain nearly identical results for relative source country
performance, regardless of which control group we use.
In summary, our results thus far regarding heterogeneity across different foreign
owners of Swedish affiliates reveal stable source country differences. Moreover, these source
country differences are robust to the use of different comparison groups, namely, to a
comparison of performance between foreign-owned firms and Swedish MNEs or Swedish
local firms.
--Figure 4 about here--
4.2 Foreign acquisitions We now continue to examine how source country origin affects firm performance in
foreign acquisitions of Swedish-owned firms. Table 5 reports the results of estimating
Equation (15) on Swedish firms that become acquired at some point during the 1996-2009
period. In column 1, we again first report the unconditional effect on productivity of a change
from Swedish to foreign ownership, without accounting for the nationality of the foreign
buyer. The point estimate, which is significant at the 5% level, reveals that when a firm
transitions from Swedish to foreign ownership (irrespective of the source country), this
ownership change is associated with an increase in productivity of approximately 2.2%. This
acquisition effect is considerably smaller than the effect of foreign ownership in Table 4,
which suggests that ”cherry-picking” (i.e., foreign firms purchasing high-performing Swedish
firms) might explain some of the performance difference between foreign and Swedish firms
observed in Table 4.
--Table 5 about here--
In column 2, we divide foreign ownership by source countries. Again, we find
estimated coefficients that are smaller than those presented in column 2 in Table 4.
21
Acquisitions from most source countries do not increase productivity after the ownership
change, with the notable exceptions of US and Dutch acquisitions. Adding firm controls when
estimating Equation (15) yields a larger estimated productivity increase following a US
takeover. Dividing the sample into manufacturing and services again yields differences that
are more significant (columns 4 and 5). Finally, dividing Swedish acquired firms into local
firms and MNEs, we find that labor productivity significantly increases by approximately
10% after a US takeover of a local firm, while this effect is not significant when the target is a
Swedish MNE.
Comparing the estimates for different foreign source countries again reveals
interesting source country differences. Such differences are illustrated in the lower panels of
Figure 4 (Panel III and IV), while the Appendix provides Wald tests on the differences
between the different source country estimates. These Wald tests, based on specification 3 in
Table 5, indicate that US acquisitions generate a significantly larger increase in productivity
than acquisitions from e.g., Luxembourg, Norway, and the UK. In Table 5, we also find that
foreign acquisition from Luxembourg even significantly decreases firm productivity in the
service sector. This result is somewhat remarkable, as only US and Japanese affiliates have
higher average productivity than affiliates from Luxembourg when we compare the effect of
ownership on productivity (see Table 4). This may suggest that firms locate their headquarters
in Luxembourg to gain tax advantages, which provide an advantage when acquirers bid for
high-quality Swedish target firms.
4.3 Other performance measures We conclude this section with Table 6, which reports results for other selected
performance measures. Columns 1-3 present cross-sectional differences, and columns 4-6
report estimates from acquisition regressions. Focusing on acquisitions, we find that a shift
from Swedish to US ownership increases employment in a Swedish firm by approximately
11%, on average, while the average wage increases by approximately 9%. Acquisitions by
firms headquartered in several other countries are also estimated to significantly increase the
average wage, but the estimated effects are smaller than the wage increase associated with a
change to US ownership. We also find that the US wage premium is significant in all source
country comparisons except in that for France. No effects are found when we analyze the
impact on the share of skilled employees (column 5).
--Table 6 about here--
22
This section has presented strong evidence on cross-country differences in
productivity among foreign affiliates headquartered in different source countries. We find that
the source country of a foreign firm has a significant impact on its productivity even after we
control for various firm controls and industry and time effects, divide the sample into
different industries or firm types, or control for different types of foreign entry. Our results
indicate that certain countries perform better as owners than others, measured in terms of
labor productivity, mean wages, skill share, and employment. For instance, affiliates of US
firms tend be more productive and tend to pay higher wages than those from most other
source countries.
5. Why do source country differences in performance arise? The
role of management practices What does then explain the differences in performance across affiliates of different
source countries? Section 2 suggested that source country differences in productivity may be
due to either a selection effect arising from, for example, the geographical or cultural
proximity of the source country to Sweden or a “pure” source country productivity effect
arising from source country-specific institutions. To measure the latter source country
influence on productivity, we will first estimate a global index of management practices for
MNEs headquartered in different source countries by using recent data on management
practices available from Bloom, Sadun and Van Reenen and co-authors
(http://worldmanagementsurvey.org). We will then examine whether source country variation
in MNEs’ management practices can provide an explanation for the observed differences in
the productivity of foreign affiliates in Sweden across source countries.
Our analysis is based on the following version of Equation (14):
log �𝑉𝐴𝑖𝑡∗
𝐿𝑖𝑡∗ � = 𝛿 + 𝛽𝑀𝑎𝑛𝑎𝑔𝑒𝑚𝑒𝑛𝑡𝑚 + 𝜑 log �𝐾𝑖𝑡
∗
𝐿𝑖𝑡∗ � + 𝜓 log(𝐿𝑖𝑡∗ ) + 𝜗𝑆ℎ𝑎𝑟𝑒_𝑠𝑘𝑖𝑙𝑙𝑒𝑑 +
𝜽′𝑿𝑚𝑡 + 𝜇ℎ𝑡 + 𝜀𝑖𝑡 (16)
In Equation (16), the variable 𝑀𝑎𝑛𝑎𝑔𝑒𝑚𝑒𝑛𝑡𝑚 measures time-invariant source
country management practices estimated across all host countries in which MNEs from the
various source countries with significant ownership in Sweden are active. We describe this
23
variable in detail below. Note that we do not include Swedish firms in Equation (16); rather,
only foreign affiliates are included. We include only foreign affiliates because we aim to
explain the source country differences in productivity between foreign firms that we
documented in the previous section. Because of this focus, all of the variation in the variable
of interest, namely, management practices, will originate from foreign countries.
Management practices by MNEs from different countries may, of course, be
correlated with other source country characteristics that affect their foreign investments. We
therefore include a vector 𝑿𝑚𝑡 in Equation (16), which contains other source country-specific
variables. In addition to other source country-specific factors affecting the productivity of
foreign affiliates, these variables should control for source country-specific barriers to
investing in Sweden.
In our default specification, we include geographical distance from the source country
to Sweden. Our distance variable, Distance, measures the distance between the source country
and Sweden and is based on the CEPII distance measure, which is a population-weighted
measure that accounts for internal distances and population dispersion.18 We also include
Business Freedom and Freedom to Trade from the Heritage Foundation, as well as Rule of
Law from the Worldwide Governance Indicators (WGI) developed by Kaufman et al. (1999)
and supplied by the World Bank. In the robustness section, we include numerous other source
country characteristic variables such as legal institutions, economic freedom, human capital,
and cultural differences. Table A5 in the Appendix provides a descriptive overview of all the
included variables.
5.1 Estimating source country-specific management practices We use data from the WMS to estimate our source country management variable,
𝑀𝑎𝑛𝑎𝑔𝑒𝑚𝑒𝑛𝑡𝑚. The WMS data originate from several different surveys; the 2004 survey is
used in Bloom and Van Reenen (2007), the 2006 survey is used in Bloom and van Reenen
(2010), and finally, the combined 2004-2010 survey is described in Bloom et al. (2012a).
The WMS is based on randomly drawn samples of mid-size firms, employing between
100 and 5000 workers in multiple industries in 20 different countries. The survey is an
interview-based evaluation tool that consists of 18 questions regarding management practices.
The answers to each question are rated on a scale from 1 (“worst practice”) to 5 (“best
practice”). The WMS data cover both national and multinational firms. Multinational firms
include both foreign affiliates and “parent firms”, that is, the part of the MNEs located in the
18 Further information on CEPII’s distance measure is found in Mayer and Zignago (2006).
24

source country. Interviews were conducted with mid-level managers in manufacturing plants,
retail stores, hospitals, and schools, who have an overview of the management practices but
who remain involved in the day-to-day work. We will focus on the manufacturing data, as
these data are the most comprehensive.
The manufacturing data include over 9,000 firm-year observations in 20 host
countries. Approximately 2,400 of these observations involve foreign affiliates, which have
ownership spread across 52 different source countries. We will focus on the source country
affiliation, which is more relevant for the present analysis than host country affiliation. The
reason for this focus is that source country affiliation is the same connection that is used in the
Swedish dataset, i.e., multinational affiliates from different source countries found in a
foreign host country. Therefore, we use the source country variable to assign the country of
interest rather than the host country variable, as used in the Bloom et al. studies. The use of
this source country affiliation also provides us with a much richer country spectrum to work
with compared to host country affiliation (52 countries instead of 20 countries). The
remainder of the observations, when domestic multinationals are excluded, belong to local
domestic firms. In all, approximately 4800 firm-year observations pertain to local domestic
firms and are included in the country-specific management sample. Overall, our dataset
contains more than 7000 firm-year observations for the period between 2000 and 2009.
The reason for not including the domestic MNEs is that the survey only samples firms
with between 100 and 5000 employees. These domestic MNEs would be too small relative to
the overall population of MNEs headquartered in these 20 countries. Including such firms
would create a potential bias in measured management practices for these domestic MNEs.
However, as foreign affiliates are, on average, much smaller than their “parent firm” in the
source country, this selection problem will be much less severe if we examine the
management practices of the foreign affiliates of MNEs headquartered in the various source
countries.
The WMS data can also be disaggregated into three different areas: Monitoring,
Targets, and Incentives. Monitoring focuses on how well companies observe internal
activities and how well they use this information for continuous improvement. Targets
investigates whether the company establishes the correct targets, tracks the correct outcome,
and takes correct action if the targets and outcomes are inconsistent. Finally, Incentives
considers whether an organization promotes and rewards its employees based on performance
and prioritized hiring while attempting to retain its best workers. These sub-indices are of
interest because they indicate that management styles can vary within each country and
25

because certain countries might score high in some measurement areas but low in others. The
overall management index is an average of the three sub-indices.
To extract source country differences in management practices among MNEs from
different source countries, we estimate the following model, which estimates the average
difference in management practices between the foreign affiliates of MNEs headquartered in
the US, UK, France, Germany, Netherlands, Norway, Denmark, Finland, Luxembourg,
Japan, and Switzerland:
𝑀𝑎𝑛𝑎𝑔𝑒𝑚𝑒𝑛𝑡𝑖𝑚𝑡 = 𝛼+∑ 𝛿𝑚𝐷𝑖𝑚𝑡 +𝑚∈𝑀 𝜇𝑚𝑡 + 𝜀𝑖𝑚𝑡, (17)
where i indexes firms, t indexes years, and m indexes the country where the owners of firm i
reside. The dependent variable 𝑀𝑎𝑛𝑎𝑔𝑒𝑚𝑒𝑛𝑡𝑖𝑚𝑡 is the overall management index. The
control group in Equation (17) consists of MNEs and local firms from other countries.19 In
our preferred specification, we use combined time and country fixed effects. We then control
for all variation in management practices that is common to every investigated host country in
the BVR data in each survey year while excluding domestic multinationals. This procedure
isolates the quality of management practices in the foreign operations of MNEs that stems
from the institutions or economic conditions in the source country m, which improves the
MNEs’ management practices globally. We label these estimates 𝛿𝑚, “Management1”.20
We also estimate Equation (17), without the combined time and country fixed effects,
𝜇𝑡𝑚,. In this specification, the estimated coefficients 𝛿𝑗𝑚 capture the influence of the source
country—as well as management practices potentially acquired in the host countries—on the
management practices of MNEs. We label this variable Management2. For robustness, we
also estimate alternative specifications with and without fixed effects and domestic
multinationals. Column 1 in Table 7 reports the results from estimating Equation (17) with
pairwise time- and host-country fixed effects, labelled “Management1”. The baseline for the
estimated management index is the constant. The country-specific estimates are then added to
the constant, leaving firms headquartered in the US with the highest ranking, with an
estimated coefficient of 𝛿𝑗 = 0.505. From this estimation, we obtain a management index of
19 See Section 3.2 above for details concerning the choice of countries. We will also present results where additional countries are included in the analysis. 20 This method also removes the time variation in the management index for each country. The removal of such variation is preferred, as the dataset primarily consists of data from cross-sectional surveys conducted at different points in time rather than data with a panel structure; hence, the number of observations across countries and years varies.
26
3.536 for the US. US MNEs are then followed by MNEs from France, Japan, Switzerland,
and Germany. MNEs headquartered in the Nordic countries and in Luxembourg are at the
bottom of the distribution. As reported in the remaining columns in Table 7, the ranking of
multinationals from different countries does not appear to be particularly sensitive to how
source country-specific management is estimated: the US remains at the top and the Nordic
countries at the bottom.21
--Table 7 about here--
Finding that US MNEs score highest on the estimated management index and that the
Nordic countries and Luxembourg score among the lowest hints at a correlation between the
estimated source county MNE management index and our estimated average difference in
labor productivity between MNEs from different source countries in Table 4. This correlation
is also illustrated in Figure 5a, in which we plot estimated country coefficients for
manufacturing firms from column 4 in Table 4 against the estimated source country
Management1 indices. The upper panel reveals a strong correlation between the average
percentage difference in productivity in the manufacturing sector between foreign affiliates
and Swedish firms and the estimated average management index for MNEs from the
examined source countries.22 MNEs from source countries with a higher management index
also have a higher average difference in labor productivity vis-à-vis Swedish firms.
In the lower panel, Figure 5b, we depict the correlation when we also include
additional countries as a robustness check. The additionally selected countries are found in
both the Swedish firm data and the WMS data set, although they are not as common in the
data as the original countries. The additional countries are Australia, Austria, Belgium,
Canada, India, Ireland, Italy, Singapore, and Spain. We find that the fit is slightly worse when
we include the additional countries but that the correlation remains highly positive.
--Figure 5 about here--
21 Table A4 in the Appendix presents an additional estimation of the management index. This specification also includes the management index of local firms and domestic MNEs for the selected countries: the US, Sweden, Germany, the UK, and France. Again, the ranking of MNE source countries, which is our outcome of interest, is not affected by this alternative specification. 22 The estimated Person correlation coefficient is 0.64.
27

5.2 Results Table 8 presents results from estimating Equation (16), in which the source country
management variable 𝑀𝑎𝑛𝑎𝑔𝑒𝑚𝑒𝑛𝑡𝑚 is included. The table reports results for which the
management index is calculated in a number of different ways. Management1 is the preferred
measure, as described above.
Column 1 in Table 8 reports the unconditional effect of management practices on the
productivity of foreign affiliates when we control for only pairwise industry and time-specific
effects. Specification 2 adds firm controls, as discussed above.
--Table 8 about here--
Regardless of which controls are used, columns 1-2 indicate that source country-
specific management practices have a positive and statistically significant effect on the
productivity of foreign affiliates in Sweden. The positive correlation between source country-
specific productivity and source country management practices, as illustrated in Figure 5, is
thus statistically significant even after we control for a variety of firm controls and even after
we include pairwise industry and year fixed effects.
In column 3 in Table 8, we add source country-specific controls. Somewhat
surprisingly, we do not observe a statistically significant effect of geographical distance from
the source country to Sweden. Only the source country’s Rule of Law has a statistically
significant effect on the productivity of foreign affiliates in Sweden. This result suggests that
better legal institutions foster higher quality firm-specific assets in general, which increases
affiliates’ productivity. However, source country management remains statistically significant
even when we control for these other source country variables.
Using our preferred specification 3 in Table 8, which includes firm and source country
controls, we find that a one-unit change in the management index is associated with a
0.353 ∗ 100% ≈ 35% increase in labor productivity. If we use the information in Table 7 and
compare identical foreign affiliates where one is from the US and another is from
Luxembourg, we would predict that the US affiliate should have a productivity advantage of
0.5 ∗ 0.353 ∗ 100% ≈ 18%. This figure is only slightly larger than the 11% average
difference in productivity between affiliates found in Table 4, column 3. The same result also
applies to a comparison between US-owned affiliates and Norwegian-owned affiliates , where
we find that the same 18% productivity advantage from better management practices arises
28

even when we control for the Norway’s geographical proximity to Sweden and the similarity
between this difference in productivity and the 14% productivity gap between US and
Norwegian firms shown in Table 4. This finding indicates that source country-specific
management practices explain a large share of the differences in country specific productivity
that we estimated in the previous section.
Studying the other specifications in Table 8, in which source country management is
estimated in alternative ways, reveals that the relationship between the management practices
of source country MNEs and the productivity of affiliates in Sweden is not dependent on our
approach to estimating the source country management index (columns 4-9).
These results indicate that differences in management practises of MNEs are
important for explaining differences in productivity between foreign affiliates. In the next
section, we examine the robustness of these results in more detail.
5.3 Robustness
Additional countries
As mentioned above in the discussion regarding Figure 5b, the particular countries
that are included in the analysis might be important. To explore this possibility, we now
extend the number of source countries in the regression analysis. Extending the number of
source countries is feasible in this section because we do not need to estimate average
differences between affiliates from each source country and Swedish firms, as in Section 4.
The additional countries are Australia, Austria, Belgium, Canada, India, Ireland, Italy,
Singapore, and Spain. The results from the extended source country sample are presented in
Table 9.
--Table 9 about her--
We re-estimate specifications 1-6 in Table 8 on the extended sample. When
comparing the estimated coefficients for Management1 and Management2 in specifications 1-
6 in Table 9 with the corresponding specifications 1-6 in Table 8, we find that the results are
not affected by the inclusion of additional source countries. Indeed, the estimated coefficients
are very similar. The somewhat modest increase in the number of observations, from 8,464 to
9,111, again reflects the fact that most foreign affiliates in Sweden are headquartered in the
original 11 source countries.
29

Sub-indices
In Table 10, we use the same specification as in Table 8, column 3, but we
disaggregate the effect of Management1 into its sub-indices: Monitoring, Targets and
Incentives. Beginning with Monitoring, which indicates how well firms observe internal
activities and how well they use this information to make improvements, we find that
monitoring is positively and significantly related to labor productivity.
The same result holds for the other two sub-indices. Column 2 reports the results for
the incentive variable, Targets, which indicates whether a firm “sets the right targets, tracks
the right outcome, and takes the right action”. Finally, in column 3, we present the results for
Incentives, which measures whether an organization promotes and rewards its employees
based on performance and prioritized hiring while retaining its best workers.
--Table 10 about here--
Additional source country characteristics
We now continue to examine whether other characteristics of the country of origin
influence the productivity of the foreign-owned MNEs and whether these variables affect the
basic results presented thus far. To do so, we focus on a number of additional source country
characteristics related to openness, trade, legal structure, and human capital. To conserve
space, we focus on the impact of our estimated Management1 index (from column 3 in Table
8) on labor productivity. The results are presented in Table 11.
--Table 11 about here--
We first consider the impact of globalization. If foreign ownership results from more
internationally integrated countries or more productive economies, then foreign ownership
might influence the relationship between the quality of management and labor productivity.
To further account for this effect, we sequentially add variables related to economic
integration. These variables are Trade openness from the Penn data set, FDI inflow (net
inflows as a percentage of GDP) from the World Development Indicators (WDI), and
Freedom to trade internationally from the Fraser Institute. As Table 11 shows, none of these
controls affect the positive relationship between the management quality index and labor
productivity (see columns 1-3). We find that only the freedom to trade variable has a positive
and significant estimated coefficient. This result indicates that the degree of international
30

integration, as measured by freedom to trade in the source country where the parent company
is located, is positively related to the labor productivity of the affiliates located in Sweden.
Next, we consider country characteristics related to the legal structure of the country
of origin of the foreign MNEs. These variables are Legal Structure and Secure Property
Rights from the Fraser Institute (column 4) and Property rights collected from the Heritage
Foundation (column 5). Adding these two variables has no impact on the estimated coefficient
for management. We also find that only source country property rights are significantly
related to labor productivity. This result suggests that secure source country property rights
generate firm-specific assets that are also transferred to affiliates located in Sweden.
We also add variables from the Heritage Foundation associated with business freedom
and corruption. We find that Financial freedom and Investment freedom in the country of
origin of the foreign multinationals (columns 6 and 7) have no effect on the labor productivity
of the Swedish affiliates, and we obtain similar results for the variable Freedom from
corruption (column 8). Again, our baseline results regarding the association between the
management quality index and labor productivity remain intact. Thus, this relationship is not
affected by adding controls related to business freedom and corruption.
Another potentially important source country-specific characteristic is human capital
accumulation. Columns 9 and 10 in Table 11 report the influence of the average number of
years of education for males and females separately (collected from the Quality of
Government Institute (QOG) at the University of Gothenburg). The results reveal no impact
of the education levels in an MNE’s country of origin and, again, no influence on the basic
relationship between management quality and productivity.
In columns 11 and 12, we also include source country GDP per capita and the size of
the source country measured by its population, both from Penn. We then find that larger
source countries are associated with significantly higher affiliate labor productivity. We find
no significant effect of the GDP per capita of the source country on affiliate productivity.
However, adding GDP per capita as a source country control renders the Management1 index
for source country MNEs non-significant. This result is not particularly surprising: if the
management practices of MNEs from different source countries increase the productivity of
their Swedish affiliates, the same management practices will also increase the productivity of
the parts of these firms located in the source country. In the Appendix, we examine the
correlation between our measure of management practices and GDP per capita (see Tables
A3a-A3e). Somewhat surprisingly, we find that source country management practices are
negatively correlated with GDP per capita (Table A3a). However, if we exclude Luxembourg
31

and Norway (a tax haven and an oil rich country, respectively, and countries with high GDP
per capita and low management), we find a large and positive correlation between source
country management and GDP per capita (Table A3d).
Our final approach to analyzing the influence of other source country characteristics is
to add two variables associated with cultural differences compared to Sweden. These
variables originate from the World Value Survey database. One is the traditional vs. secular
variable, which captures the contrasts between societies in which religion is important and
those in which it is not, and the other is a survival vs. self-expression variable, which is
associated with the transition from industrial to post-industrial societies. These two variables
explain more than 70% of the cross-cultural variance on scores of more specific values
according to the World Values Surveys. The results are presented in columns 13 and 14 in
Table 11. Once again, we find that our basic results regarding a positive relationship between
management practices and productivity remain unchanged.
Entire economy
Finally, in Table 12, we estimate our management-productivity regressions on the
entire economy, instead of only on the manufacturing sector. The first two columns compare
the impact of analyzing 11 vs. 20 countries. These columns can be compared to column 3 in
Tables 8 and 9 separately. We find that the estimated coefficient on the management variable
is stronger when only the manufacturing sector is studied. This result applies to both the 11-
and the 20-country specifications. However, the larger sample size when both sectors are
included increases the efficiency of our estimates.
In columns 3 and 4, we show that the larger sample size when we increase the
sample from 11 to 20 source countries yields a significant estimate of the relationship
between management practices by MNEs headquartered in the different source countries and
affiliate labor productivity in Sweden, even when we control for the both distance and GDP
per capita of the source country. The observed significance is due to the greater variation in
the data when we use 20 countries. The impact of this approach can also be observed in the
different correlation coefficients presented in Tables A3a-A3e in the Appendix.
--Table 12 about here—
32
Ultimately, we conclude that differences in the global management practices of MNEs from
different source countries robustly explain productivity differences between their affiliates in
Sweden.
6. Summary and conclusions Is FDI from certain countries preferable to FDI from other countries? Are there
differences in productivity between foreign affiliates with headquarters in different source
countries? Do such differences originate from differences in management practices between
source countries?
Our theoretical framework suggests that source country heterogeneity in affiliate
performance can arise in several ways: Institutional factors may promote efficient
organizations and management in a source country (such as intense product market
competition), and such efficiency might spill over to MNEs’ affiliates in host markets.
Moreover, MNEs headquartered in source countries that are proximate to the host country
may face lower barriers to entry and therefore might need to be less efficient to recoup
investment costs. Foreign firms also frequently invest in a country by purchasing domestic
firms, and market power effects or source country tax advantages may then affect the buyer’s
ability to acquire targets, which will affect post-takeover performance.
Using detailed Swedish firm-level data and information on foreign affiliates, we first
demonstrate that the well-known foreign productivity premium masks significant source
country heterogeneity in productivity between foreign affiliates from different source
countries. This result holds regardless of whether source country differences in affiliate
productivity are estimated along a cross-sectional dimension (comparing Swedish-owned
firms with foreign affiliates from different source countries) or are estimated from foreign
acquisitions (estimating the effect of a transfer from Swedish to foreign ownership in order to
control for unobserved heterogeneity and so-called “cherry-picking”).
For instance, we find that US affiliates are approximately three times more productive
than affiliates with headquarters in Norway. This source country difference may arise because
institutions may promote efficient management in US firms. Alternatively, the difference may
indicate that Norwegian firms have better information on the culture in neighbouring Sweden,
engendering a lower entry barrier for Norwegian firms. We therefore examine why source
country differences arise by assessing the impact of numerous source country characteristics
33
on the performance of foreign affiliates. In particular, using newly available data from the
WMS, we find that approximately one-third of the observed source country variation in
productivity between foreign affiliates is explained by differences in foreign MNEs’ global
management practices.
In addition to presenting new and more extensive evidence on source country
heterogeneity in FDI outcomes, our paper contributes to a growing literature stream on the
impact on management quality and its relationship with observed variation in productivity
across firms. We do so by investigating a new channel, namely, the impact of source country
differences in MNE performance. Differences in management practices not only explain the
variation in productivity but also correlate with the variation in the skill share, wages, and
employment of foreign affiliates. Future research could contribute further knowledge on other
aspects of firm internationalization and could examine the relation between such aspects and
management practices. One such aspect is a firm’s export behaviour, as recent evidence
indicates that substantial variation exists across firms in terms of both the magnitude and the
duration of exports.
34

References Barbosa, N. and H. Louri (2002), “On the determinants of multinationals’ ownership preferences: evidence from Greece and Portugal”, International Journal of Industrial Organization, 20(4), 493-515. Beugelsdijk, S., S. Brakman, H. Garretsen and C. Van Marrewijk (2013), “International economics and business: nations and firms in the global economy”, Cambridge University Press. Bloom, N. and J. Van Reenen (2007), ‘‘Measuring and Explaining Management Practices across Firms and Countries’’, Quarterly Journal of Economics, 122(4), 1351–1408. Bloom, N. and J. Van Reenen (2010), “Why Do Management Practices Differ across Firms and Countries?”, The Journal of Economic Perspectives, 24(1), 203-224. Bloom, N., R. Sadum and J. Van Reenen (2012a), “The Organization of firms across countries”, Quarterly Journal of Economics, 127(4), 1663–1705. Bloom, N., C. Genakos, R. Sadum and J. Van Reenen (2012b), “Management Practices Across Firms and Countries”, Academy of Management Perspectives, 26(1), 12-33. Bloom, N., R. Sadun and J. Van Reenen, (2012c), Management as a Technology, LSE mimeo. Bloom, N., R. Sadum and J. Van Reenen (2012d) “Americans do I.T. better: US multinationals and the productivity miracle”, American Economic Review, 102(1), 167-201. Bloom, N., R. Lemos, R. Sadun, D. Scur and J. Van Reenen (2014), “The New Empirical Economics of Management”, Journal of the Eurooean Economic Association, 12(4), 835-1126. Conyon, M., S. Girma, S. Thompson and PW. Wright (2002), “The Productivity and Wage Effects of Foreign Acquisition in the United Kingdom”, Journal of Industrial Economics, 50(1), 85-102. Dunning, J. (1974), “Economic analysis and the multinational enterprise”, Routledge. Dunning, J. (1980), “Toward an Eclectic Theory of International Production: Some Empirical Tests”, Journal of International Business Studies, 11(1), 9-31. Dunning, J. (1985), “Multinational enterprises, economic structure, and international competitiveness”, John Wiley & Sons Inc. Dunning, J. (1988), “The Eclectic Paradigm of International Production: A Restatement and Some Possible Extensions”, Journal of International Business Studies, 19(1), 1-31. Griffith, R. and H. Simpson (2004), “Characteristics of Foreign-Owned Firms in British Manufacturing” in Seeking a Premier Economy: The Economic Effects of British Economic Reforms, 1980-2000, eds D. Card, R. Blundell and R. B. Freeman, University of Chicago
35
Press. Grima, S., D. Greenaway and K. Wakelin (1999), “Wages, Productivity and Foreign Ownership in UK Manufacturing”, University of Nottingham. Helpman, E., M. Melitz and S. Yeaple (2004), “Exports versus FDI with Heterogeneous Firms.”, American Economic Review 94(1), 300-16. Horn, H. and L. Persson (2001), ”Endogenous mergers in concentrated markets”, International Journal of Industrial Organization, 19(8), 1213-1244. Huttunen, K. (2007), “The Effect of Foreign Acquisition on Employment and Wages: Evidence from Finnish Establishments”, Review of Economics and Statistics, 89(3), 497-509. Jehiel, P. and B. Moldovanu (2000), “Auctions with Downstream Interaction among Buyers”, The RAND Journal of Economics, 31(4), 768-791. Kaufman, D., A. Kraay and P. Zoido-Lobatón (1999), Aggregating governance indicators (Vol. 2195). World Bank Publications. Markusen, J. (2001), “General-Equilibrium Approaches to the Multinational Firm: A Review of Theory and Evidence”, Journal of International Economics 53(1), 189-204. Mayer, T. and S. Zignago (2006), “Notes on CEPII’s distance measures”, MPRA Paper No. 26469. Neary, JP. (2009), “Foreign direct investment: The OLI framework” in K.A. Reinert, R.S. Rajan, A.J. Glass and L.S. Davis (eds.): The Princeton Encyclopedia of the World Economy, Volume I, Princeton: Princeton University Press, 12, 472-477. Neary, JP. (2007), “Cross-border Mergers as Instruments of Comparative Advantage”, Review of Economic Studies 74(4): 1229-57. Norbäck, PJ. and L. Persson (2007) ”Investment Liberalization - Why a Restrictive Cross-Border Merger Policy Can Be Counterproductive”, Journal of International Economics, 72(2), 366-380. Salant, S., S. Switzer and R. Reynolds (1983), “Losses from Horizontal Merger: The Effects of an Exogenous Change in Industry Structure on Cournot-Nash Equilibrium”, Quarterly Journal of Economics, 98(2), 185-199. Stevenson, B. and J. Wolfers (2006), “Bargaining in the Shadow of the Law: Divorce Laws and Family Distress”, Quarterly Journal of Economics, 121(1), 267-288.
36

Figure 1: Total employment and employment in foreign owned firms 1996-2009 (at least10 employees).
Employment in Foreign-owned firms in 2009
Employment in Foreign-owned firms in 1996
37

Table 1: Number of firms and foreign acquisitions of Swedish firms, 1996-2009 (at least 10 employees).
Table 2: Country specific share of total employment in foreign-owned firms and the number of foreign firms, 1996-2009 (at least 10 employees).
Number of firms Acquisitions
Share of employment
Number of firms
Year Foreign Sweden Total
Foreign
Country of origin
1996-2000
2001-2005
2006-2009
Average 1996-2009
Average
1996-2009
1996 1826 22219 24045
-
US 0,194 0,216 0,185 0,2
519 1997 1955 23495 25450
129
UK 0,102 0,105 0,12 0,11
275
1998 2137 24735 26872
205
Finland 0,113 0,105 0,102 0,11
280 1999 2265 25005 27270
230
Germany 0,079 0,082 0,096 0,09
313
2000 2624 25908 28532
497
Norway 0,074 0,076 0,083 0,08
370 2001 3294 25914 29208
742
Denmark 0,093 0,093 0,077 0,09
307
2002 3360 25739 29099
356
Netherlands 0,097 0,098 0,077 0,09
277 2003 3503 25227 28730
364
France 0,081 0,075 0,072 0,08
146
2004 3376 25069 28445
198
Luxembourg 0,004 0,015 0,043 0,02
86 2005 3586 25420 29006
358
Switzerland 0,111 0,052 0,043 0,07
150
2006 3730 26574 30304
308
Japan 0,013 0,013 0,013 0,01
72 2007 3951 27949 31900
405
China 0 0 0,001 0 2
2008 4117 29019 33136
403
Note: Table sorted on average of employment share.
2009 4260 28241 32501 386 Average 3142 25751 28893 352 Note: See section 3.1 for details on measuring foreign acquisitions.
38
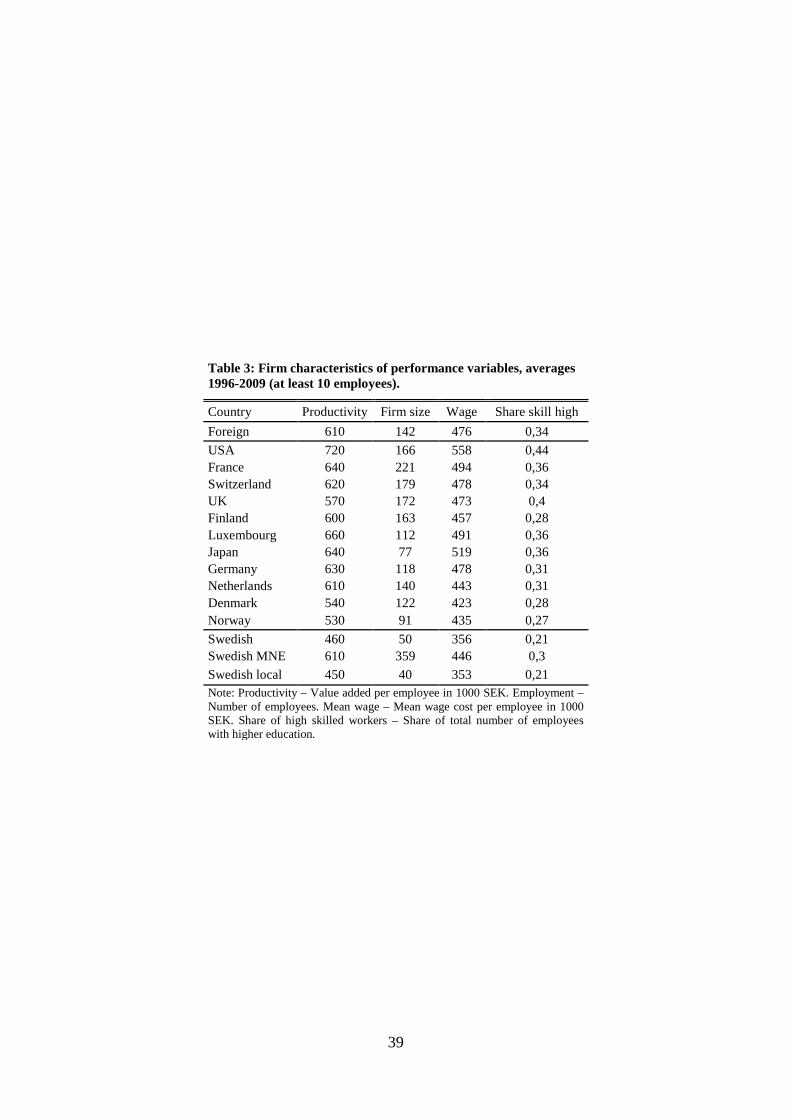
Table 3: Firm characteristics of performance variables, averages 1996-2009 (at least 10 employees).
Country Productivity Firm size Wage Share skill high Foreign 610 142 476 0,34 USA 720 166 558 0,44 France 640 221 494 0,36 Switzerland 620 179 478 0,34 UK 570 172 473 0,4 Finland 600 163 457 0,28 Luxembourg 660 112 491 0,36 Japan 640 77 519 0,36 Germany 630 118 478 0,31 Netherlands 610 140 443 0,31 Denmark 540 122 423 0,28 Norway 530 91 435 0,27 Swedish 460 50 356 0,21 Swedish MNE 610 359 446 0,3 Swedish local 450 40 353 0,21 Note: Productivity – Value added per employee in 1000 SEK. Employment – Number of employees. Mean wage – Mean wage cost per employee in 1000 SEK. Share of high skilled workers – Share of total number of employees with higher education.
39

Figure 2: Affiliate performance and source country origin: means of different firm characteristics (affiliates with at least 10 employees), 2000-2009.
Note: The figure explores how source country origin affects affiliate characteristics and how different affiliate characteristics are related. Affiliate performance are measured as the average productivity, employment, mean wages and share of skilled workers for affiliates with ownership in different source countries during the period 2000-2009. For instance, inspecting the second graph in the top row, there is a clear positive relationship between the average productivity and the mean wage of affiliates with ownership in different source countries. It is also clear that US firms have on average the highest productivity and pay the highest wage.
40

Table 4: Productivity differences between foreign and Swedish firms, 1996-2009 (at least 10 employees).
All firms All firms All firms Manu. Service Local firms MNE
(1) (2) (3) (4) (5) (6) (7) Foreign 0.182*** (0.007) Japan 0.216*** 0.138*** -0.016 0.175*** 0.152*** -0.046
(0.044) (0.039) (0.062) (0.044) (0.039) (0.038) US 0.305*** 0.214*** 0.163*** 0.232*** 0.231*** 0.045***
(0.016) (0.015) (0.028) (0.017) (0.015) (0.016) Denmark 0.085*** 0.048*** 0.038 0.053*** 0.061*** -0.104***
(0.019) (0.017) (0.026) (0.020) (0.017) (0.018) UK 0.160*** 0.086*** 0.089*** 0.084*** 0.103*** -0.072***
(0.017) (0.016) (0.027) (0.019) (0.016) (0.018) Germany 0.190*** 0.105*** 0.088*** 0.112*** 0.121*** -0.054***
(0.016) (0.015) (0.030) (0.018) (0.015) (0.017) France 0.202*** 0.139*** 0.043 0.175*** 0.157*** -0.016
(0.026) (0.024) (0.038) (0.030) (0.024) (0.025) Norway 0.102*** 0.073*** -0.023 0.114*** 0.085*** -0.085***
(0.015) (0.014) (0.023) (0.017) (0.014) (0.016) Netherlands 0.187*** 0.113*** 0.086*** 0.126*** 0.128*** -0.032*
(0.019) (0.017) (0.025) (0.021) (0.017) (0.018) Luxembourg 0.178*** 0.105*** -0.035 0.157*** 0.119*** -0.061*
(0.036) (0.034) (0.048) (0.041) (0.034) (0.035) Finland 0.141*** 0.094*** 0.090*** 0.090*** 0.111*** -0.045**
(0.018) (0.017) (0.023) (0.024) (0.017) (0.018) Switzerland 0.224*** 0.146*** 0.137*** 0.154*** 0.163*** -0.007
(0.022) (0.019) (0.029) (0.024) (0.019) (0.020)
Log(K/L) 0.114*** 0.112*** 0.115*** 0.114*** 0.110***
(0.001) (0.003) (0.001) (0.001) (0.004) Log(L) 0.017*** 0.022*** 0.016*** 0.009*** 0.000
(0.002) (0.004) (0.002) (0.002) (0.004) Share skill high 0.579*** 0.447*** 0.599*** 0.563*** 0.703***
(0.010) (0.027) (0.010) (0.010) (0.028)
Firm controls No No Yes Yes Yes Yes Yes
Observations 381,403 381,403 381,403 94,344 286,268 370,797 46,815 R-squared 0.178 0.180 0.303 0.203 0.324 0.303 0.219 Note: The dependent variable is logged value added per employee. Reference group consists of Swedish firms; ”All”, ”MNEs” (multinational domestic firms), or ”Local” (non-multinational domestic firms). Firm controls are logged capital per employee, logged number of employees, and share of skilled workers at firm. ”Manu.” refers to the manufacturing sector and ”Service” is the service sector. All regressions include interacted and individual time and industry controls. Standard errors are clustered by firm. ***, **, * show significance at the 1%, 5%, and 10% level, respectively.
41
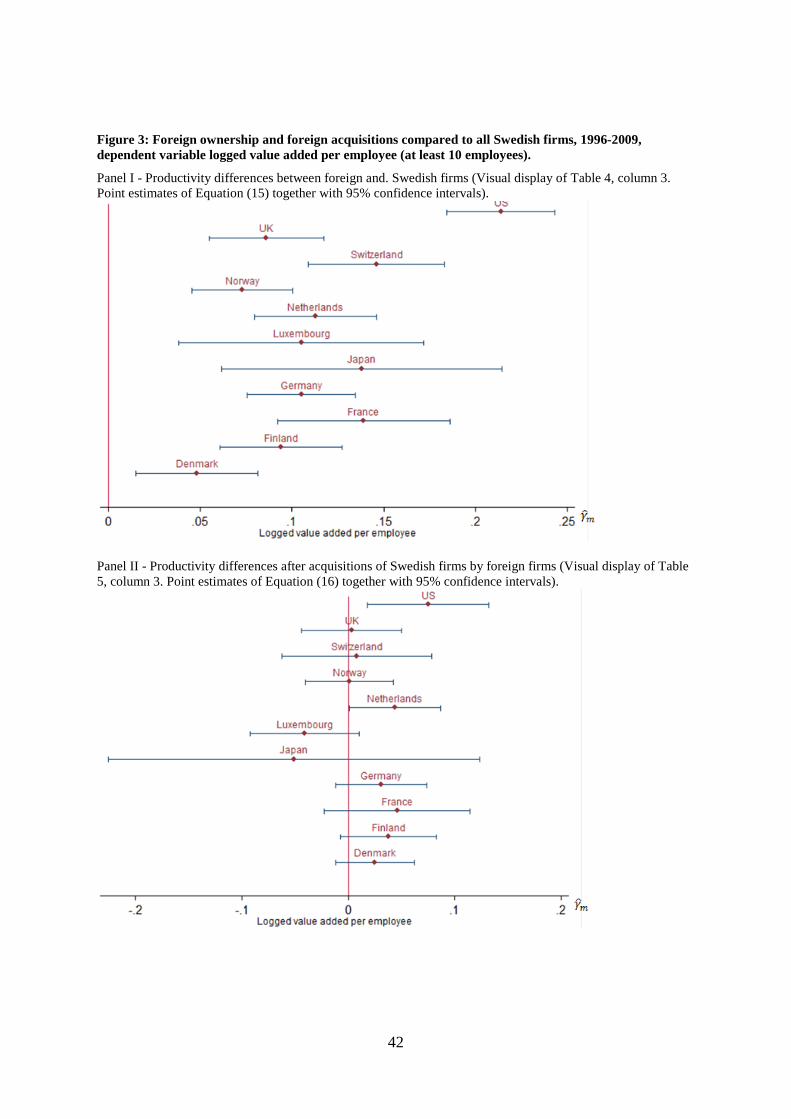
Figure 3: Foreign ownership and foreign acquisitions compared to all Swedish firms, 1996-2009, dependent variable logged value added per employee (at least 10 employees).
Panel I - Productivity differences between foreign and. Swedish firms (Visual display of Table 4, column 3. Point estimates of Equation (15) together with 95% confidence intervals).
Panel II - Productivity differences after acquisitions of Swedish firms by foreign firms (Visual display of Table 5, column 3. Point estimates of Equation (16) together with 95% confidence intervals).
42

Figure 4: Foreign ownership and foreign acquisitions compared to Swedish local firms and MNEs, 1996-2009, dependent variable logged value added per employee (at least 10 employees).
Panel I - Productivity differences between foreign and Swedish local firms (Visual display of Table 4, column 6, point estimates and 95% confidence intervals).
Panel II - Productivity differences between foreign firms and Swedish MNEs (Visual display of Table 4, column 7, point estimates and 95% confidence intervals).
Panel III - Productivity differences after acquisitions of Swedish local firms by foreign firms (Visual display of Table 5, column 6, point estimates and 95% confidence intervals).
Panel IV - Productivity differences after acquisitions of Swedish MNEs by foreign firms (Visual display of Table 5, column 7, point estimates and 95% confidence intervals).
43

Table 5: Productivity differences after acquisitions of Swedish firms by foreign firms 1996-2009 (at least 10 employees).
All firms All firms All firms Manu. Service Local firms MNEs
(1) (2) (3) (4) (5) (6) (7) Foreign 0.022** (0.009) Japan -0.037 -0.051 0.051 -0.071 -0.014 -0.182
(0.083) (0.089) (0.129) (0.110) (0.106) (0.121) US 0.050* 0.075*** 0.075* 0.066* 0.101*** 0.046
(0.029) (0.029) (0.040) (0.038) (0.035) (0.054) Denmark 0.023 0.025 0.039 0.018 0.020 0.049
(0.019) (0.019) (0.029) (0.026) (0.020) (0.051) UK -0.012 0.003 -0.049 0.013 0.008 -0.006
(0.024) (0.024) (0.044) (0.028) (0.027) (0.062) Germany 0.031 0.031 0.044 0.026 0.038 -0.001
(0.022) (0.022) (0.042) (0.028) (0.024) (0.056) France 0.032 0.046 -0.042 0.059* 0.043 0.057
(0.035) (0.035) (0.095) (0.034) (0.040) (0.076) Norway 0.003 0.001 -0.099** 0.020 -0.005 0.010
(0.021) (0.021) (0.043) (0.025) (0.022) (0.062) Netherlands 0.048** 0.044** 0.032 0.053* 0.034 0.084**
(0.023) (0.022) (0.037) (0.028) (0.025) (0.041) Luxembourg -0.042 -0.041 -0.078 -0.059** -0.033 0.010
(0.026) (0.026) (0.053) (0.029) (0.029) (0.057) Finland 0.028 0.038* 0.004 0.076** 0.055** 0.042
(0.023) (0.023) (0.032) (0.034) (0.027) (0.040) Switzerland 0.011 0.008 -0.022 0.044 -0.007 0.090
(0.036) (0.036) (0.062) (0.043) (0.033) (0.116)
Log(K/L) 0.074*** 0.090*** 0.068*** 0.071*** 0.077***
(0.007) (0.025) (0.006) (0.010) (0.020) Log(L) -0.109*** -0.105*** -0.126*** -0.094*** -0.139***
(0.012) (0.021) (0.016) (0.015) (0.029) Share skill high 0.059 -0.030 0.053 0.088 0.085
(0.056) (0.114) (0.065) (0.067) (0.210)
Firm controls No No Yes Yes Yes Yes Yes Observations 39,369 39,369 39,369 11,889 25,594 25,664 5,660 R-squared 0.032 0.033 0.058 0.056 0.058 0.057 0.076 Note: The dependent variable is logged value added per employee. Reference group consists of Swedish firms; ”All”, ”MNEs” (multinational domestic firms), or ”Local” (non-multinational domestic firms). Firm controls are logged capital per employee, logged number of employees, and share of skilled workers at firm. ”Manu.” refers to the manufacturing sector and ”Service” is the service sector. All regressions include interacted and individual time and industry controls. Standard errors are clustered by firm. ***, **, * show significance at the 1%, 5%, and 10% level, respectively.
44

Table 6: Differences in other performance variables for foreign vs. Swedish firms (FOF) and acquisition of Swedish firms (ACQ) 1996-2009 (at least 10 employees).
FOF ACQ
Log(L) Share skill high Log(w) Log(L) Share
skill high Log(w)
(1) (2) (3) (4) (5) (6)
Japan 0.552*** 0.140*** 0.201***
-0.032 0.016 -0.005
(0.092) (0.018) (0.020)
(0.057) (0.014) (0.035) US 0.802*** 0.138*** 0.206***
0.112*** 0.004 0.094***
(0.040) (0.007) (0.009)
(0.029) (0.004) (0.020) Denmark 0.626*** 0.043*** 0.085***
0.071*** 0.004 0.025**
(0.046) (0.008) (0.008)
(0.021) (0.004) (0.010) UK 0.801*** 0.098*** 0.105***
0.085*** -0.002 0.039**
(0.052) (0.008) (0.010)
(0.026) (0.004) (0.019) Germany 0.683*** 0.089*** 0.139***
0.044 -0.006 0.030**
(0.049) (0.008) (0.009)
(0.028) (0.005) (0.015) France 1.053*** 0.098*** 0.154***
0.047 0.007 0.058**
(0.087) (0.011) (0.013)
(0.046) (0.007) (0.024) Norway 0.570*** 0.028*** 0.135***
-0.002 -0.004 0.018**
(0.038) (0.005) (0.008)
(0.023) (0.004) (0.009) Netherlands 0.685*** 0.078*** 0.103***
0.047* 0.004 0.050***
(0.054) (0.007) (0.010)
(0.025) (0.003) (0.015) Luxembourg 0.534*** 0.076*** 0.125***
0.020 -0.005 0.008
(0.069) (0.013) (0.017)
(0.028) (0.005) (0.015) Finland 0.869*** 0.049*** 0.135***
0.030 0.003 0.019*
(0.054) (0.007) (0.008)
(0.029) (0.004) (0.011) Switzerland 0.850*** 0.104*** 0.156***
0.018 -0.000 0.009
(0.071) (0.012) (0.012)
(0.036) (0.007) (0.018)
Firm
controls Yes Yes Yes
Yes Yes Yes
Observations 386,816 386,816 385,934
40,534 40,534 40,424 R-squared 0.126 0.471 0.296 0.099 0.108 0.162 Note: The dependent variables are logged capital per employee, share of skilled workers at firm, and logged wage cost per employee. Reference group consists of all Swedish firms. Firm controls are logged capital per employee, logged number of employees, and share of skilled workers at the firm. All regressions include firm and year fixed effects. Standard errors are clustered by firm. ***, **, * show significance at the 1%, 5%, and 10% level, respectively.
45
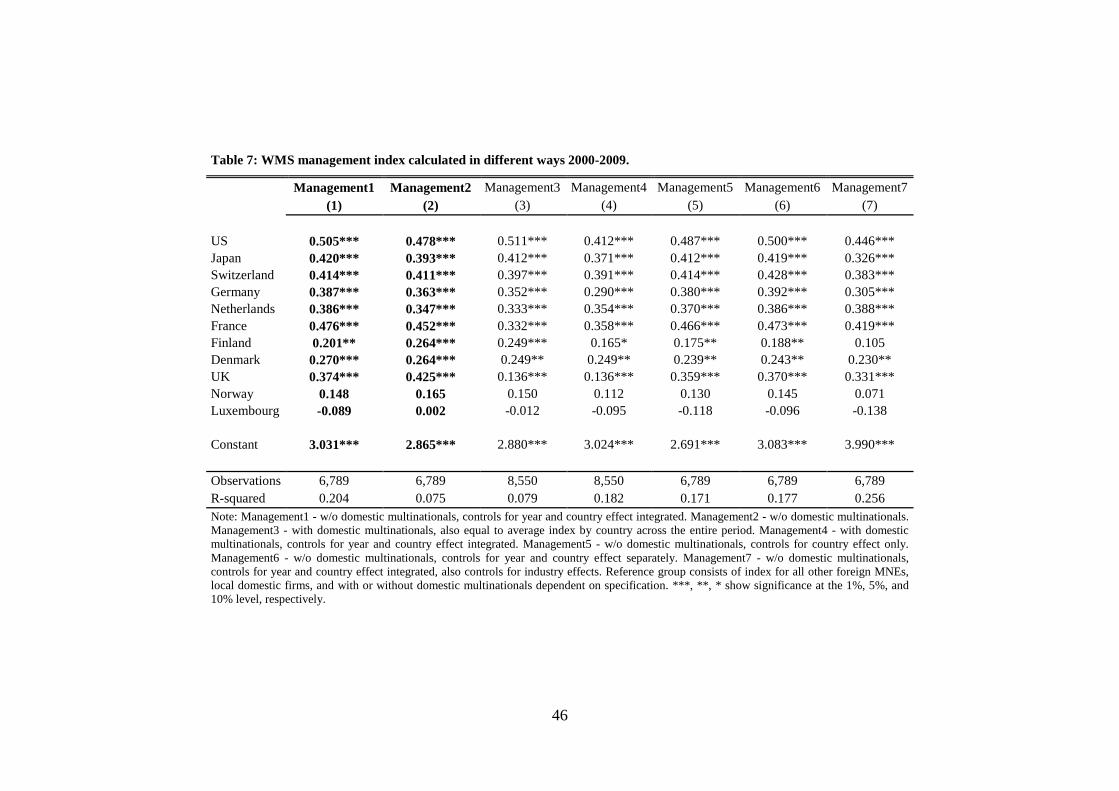
Table 7: WMS management index calculated in different ways 2000-2009.
Management1 Management2 Management3 Management4 Management5 Management6 Management7
(1) (2) (3) (4) (5) (6) (7)
US 0.505*** 0.478*** 0.511*** 0.412*** 0.487*** 0.500*** 0.446*** Japan 0.420*** 0.393*** 0.412*** 0.371*** 0.412*** 0.419*** 0.326*** Switzerland 0.414*** 0.411*** 0.397*** 0.391*** 0.414*** 0.428*** 0.383*** Germany 0.387*** 0.363*** 0.352*** 0.290*** 0.380*** 0.392*** 0.305*** Netherlands 0.386*** 0.347*** 0.333*** 0.354*** 0.370*** 0.386*** 0.388*** France 0.476*** 0.452*** 0.332*** 0.358*** 0.466*** 0.473*** 0.419*** Finland 0.201** 0.264*** 0.249*** 0.165* 0.175** 0.188** 0.105 Denmark 0.270*** 0.264*** 0.249** 0.249** 0.239** 0.243** 0.230** UK 0.374*** 0.425*** 0.136*** 0.136*** 0.359*** 0.370*** 0.331*** Norway 0.148 0.165 0.150 0.112 0.130 0.145 0.071 Luxembourg -0.089 0.002 -0.012 -0.095 -0.118 -0.096 -0.138
Constant 3.031*** 2.865*** 2.880*** 3.024*** 2.691*** 3.083*** 3.990*** Observations 6,789 6,789 8,550 8,550 6,789 6,789 6,789 R-squared 0.204 0.075 0.079 0.182 0.171 0.177 0.256 Note: Management1 - w/o domestic multinationals, controls for year and country effect integrated. Management2 - w/o domestic multinationals. Management3 - with domestic multinationals, also equal to average index by country across the entire period. Management4 - with domestic multinationals, controls for year and country effect integrated. Management5 - w/o domestic multinationals, controls for country effect only. Management6 - w/o domestic multinationals, controls for year and country effect separately. Management7 - w/o domestic multinationals, controls for year and country effect integrated, also controls for industry effects. Reference group consists of index for all other foreign MNEs, local domestic firms, and with or without domestic multinationals dependent on specification. ***, **, * show significance at the 1%, 5%, and 10% level, respectively.
46

Figure 5a: Plotted estimates from regression model on productivity differences between foreign and Swedish firms for 11 countries for firms in the manufacturing sector (Table 4, column 4) against the Management1 index regression (Table 7, column 1). The figure also includes correlations and fitted linear regression equation.
Fitted line equation Correlations Intercept: -0.74 Pearson correlation: 0.64 Beta: 0.24*** Spearman correlation: 0.50 R-squared: 0.40 Figure 5b: Plotted estimates for 20 countries from regression model on productivity differences between foreign and Swedish firms for 11 countries for firms in the manufacturing sector (Table 4, column 4) against the Management1 index regression (Table 7, column 1). The figure also includes correlations and fitted linear regression equation.
Fitted line equation Correlations Intercept: -1.28 Pearson correlation: 0.53 Beta: 0.40*** Spearman correlation: 0.51 R-squared: 028
47

Table 8: Management and productivity, 2000-2009 (at least 10 employees). Comparing different management indices.
Management1
Management2
Management3 Management4 Management7
(1) (2) (3) (4) (5) (6) (7) (8) (9)
Management 0.451** 0.290** 0.353*** 0.600*** 0.399*** 0.517*** 0.376** 0.249** 0.261**
(0.152) (0.112) (0.107) (0.159) (0.114) (0.134) (0.135) (0.104) (0.101) Log(K/L) 0.118*** 0.118*** 0.118*** 0.119*** 0.118*** 0.118*** 0.118***
(0.012) (0.012) (0.012) (0.012) (0.012) (0.012) (0.012) Log(L) 0.028* 0.028* 0.026* 0.026* 0.028* 0.028* 0.028*
(0.013) (0.014) (0.013) (0.014) (0.014) (0.014) (0.014) Share skill high 0.678*** 0.677*** 0.674*** 0.675*** 0.685*** 0.681*** 0.674***
(0.106) (0.104) (0.107) (0.104) (0.104) (0.104) (0.104) Weighted distance 0.000 0.000 -0.000 0.000 0.000
(0.000) (0.000) (0.000) (0.000) (0.000) Rule of Law 0.119** 0.139** 0.024 0.041 0.094**
(0.042) (0.048) (0.055) (0.053) (0.040) Business freedom 0.004 -0.003 0.015 0.014 0.007
(0.016) (0.013) (0.020) (0.020) (0.017) Freedom to trade -0.081 -0.080 -0.029 -0.041 -0.071
(0.117) (0.103) (0.115) (0.127) (0.119) Observations 8,464 8,464 8,464 8,464 8,464 8,464 8,464 8,464 8,464 R-squared 0.050 0.154 0.155 0.052 0.156 0.157 0.157 0.154 0.154 Note: The dependent variable is logged value added per employee. Management1 - w/o domestic multinationals, controls for year and country effect integrated. Management2 - w/o domestic multinationals. Management3 - with domestic multinationals, also equal to average index by country across the entire period. Management4 - with domestic multinationals, controls for year and country effect integrated. Management7 - w/o domestic multinationals, controls for year and country effect integrated, also controls for industry effects. Firm controls are logged capital per employee, logged number of employees, and share of skilled workers at firm. Country controls include; CEPII population weighted distance measure, WGIs level of legal institutions ”Rule of Law”, and the Heritage foundation measures of economic freedom. All regressions include interacted and individual time and industry controls as well as clustered standard errors on country id. ***, **, * show significance at the 1%, 5%, and 10% level, respectively.
48
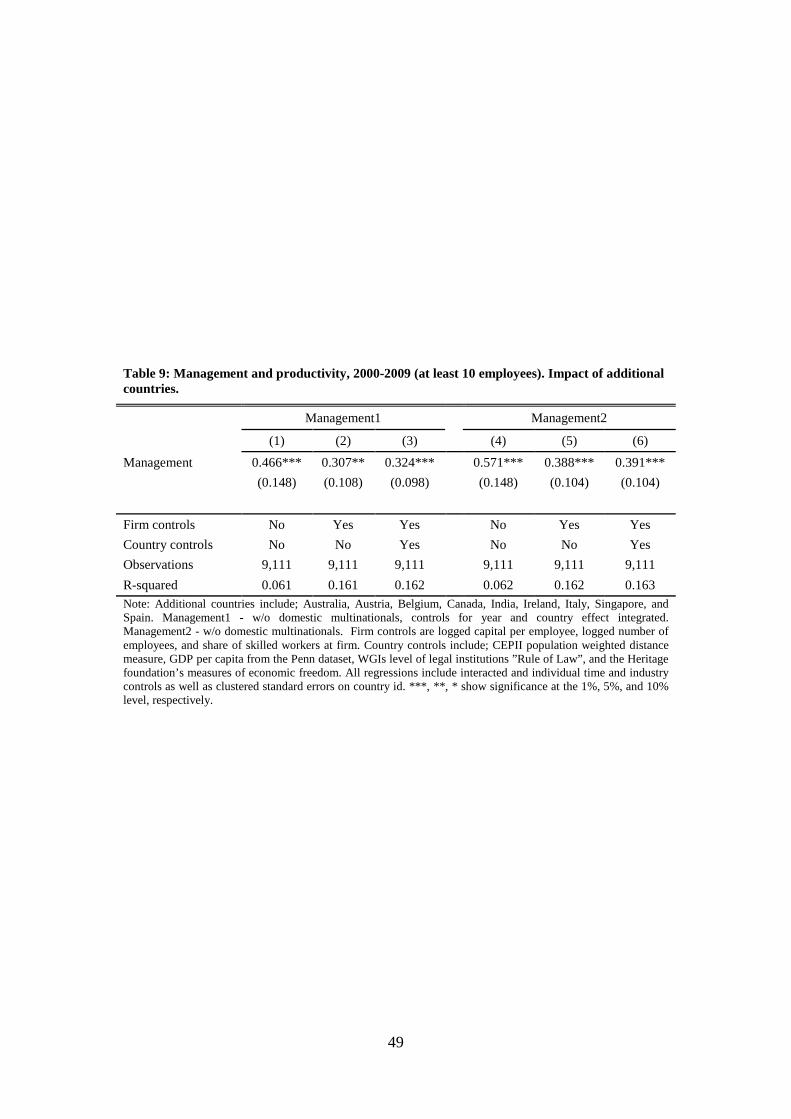
Table 9: Management and productivity, 2000-2009 (at least 10 employees). Impact of additional countries.
Management1
Management2
(1) (2) (3) (4) (5) (6)
Management 0.466*** 0.307** 0.324*** 0.571*** 0.388*** 0.391***
(0.148) (0.108) (0.098) (0.148) (0.104) (0.104)
Firm controls No Yes Yes No Yes Yes Country controls No No Yes
No No Yes
Observations 9,111 9,111 9,111 9,111 9,111 9,111 R-squared 0.061 0.161 0.162 0.062 0.162 0.163 Note: Additional countries include; Australia, Austria, Belgium, Canada, India, Ireland, Italy, Singapore, and Spain. Management1 - w/o domestic multinationals, controls for year and country effect integrated. Management2 - w/o domestic multinationals. Firm controls are logged capital per employee, logged number of employees, and share of skilled workers at firm. Country controls include; CEPII population weighted distance measure, GDP per capita from the Penn dataset, WGIs level of legal institutions ”Rule of Law”, and the Heritage foundation’s measures of economic freedom. All regressions include interacted and individual time and industry controls as well as clustered standard errors on country id. ***, **, * show significance at the 1%, 5%, and 10% level, respectively.
49
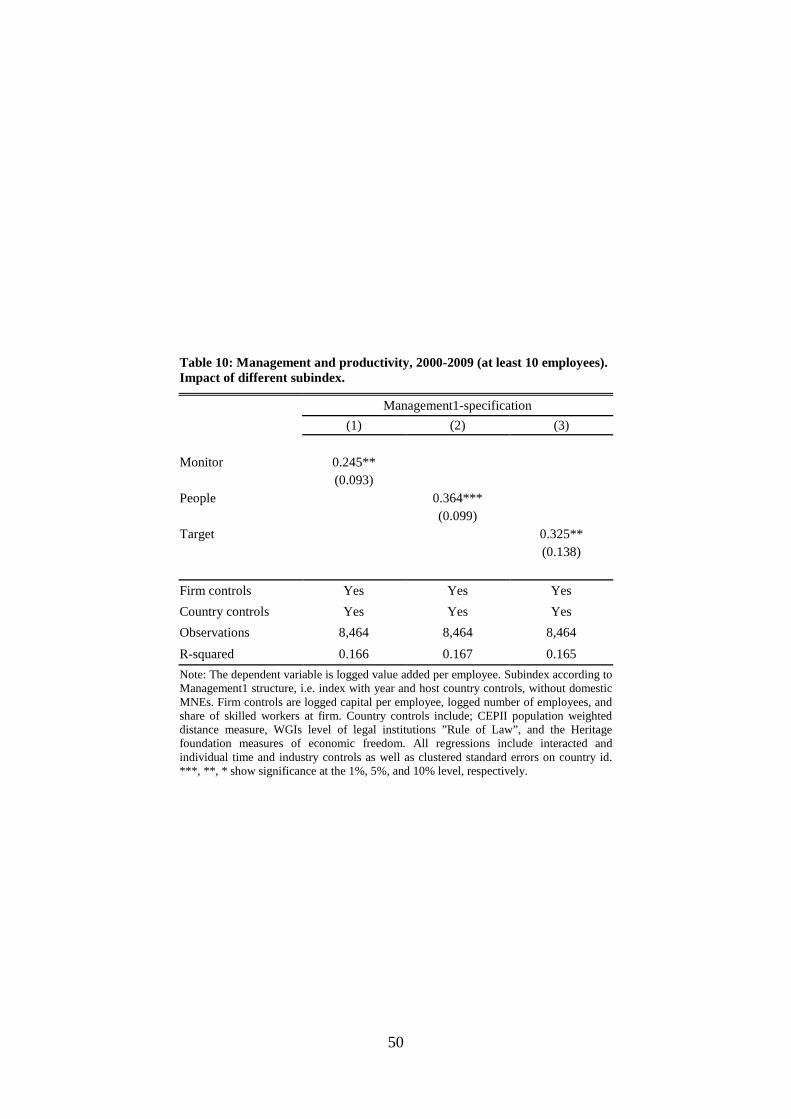
Table 10: Management and productivity, 2000-2009 (at least 10 employees). Impact of different subindex.
Management1-specification
(1) (2) (3)
Monitor 0.245**
(0.093)
People 0.364***
(0.099) Target 0.325**
(0.138) Firm controls Yes Yes Yes Country controls Yes Yes Yes Observations 8,464 8,464 8,464 R-squared 0.166 0.167 0.165 Note: The dependent variable is logged value added per employee. Subindex according to Management1 structure, i.e. index with year and host country controls, without domestic MNEs. Firm controls are logged capital per employee, logged number of employees, and share of skilled workers at firm. Country controls include; CEPII population weighted distance measure, WGIs level of legal institutions ”Rule of Law”, and the Heritage foundation measures of economic freedom. All regressions include interacted and individual time and industry controls as well as clustered standard errors on country id. ***, **, * show significance at the 1%, 5%, and 10% level, respectively.
50
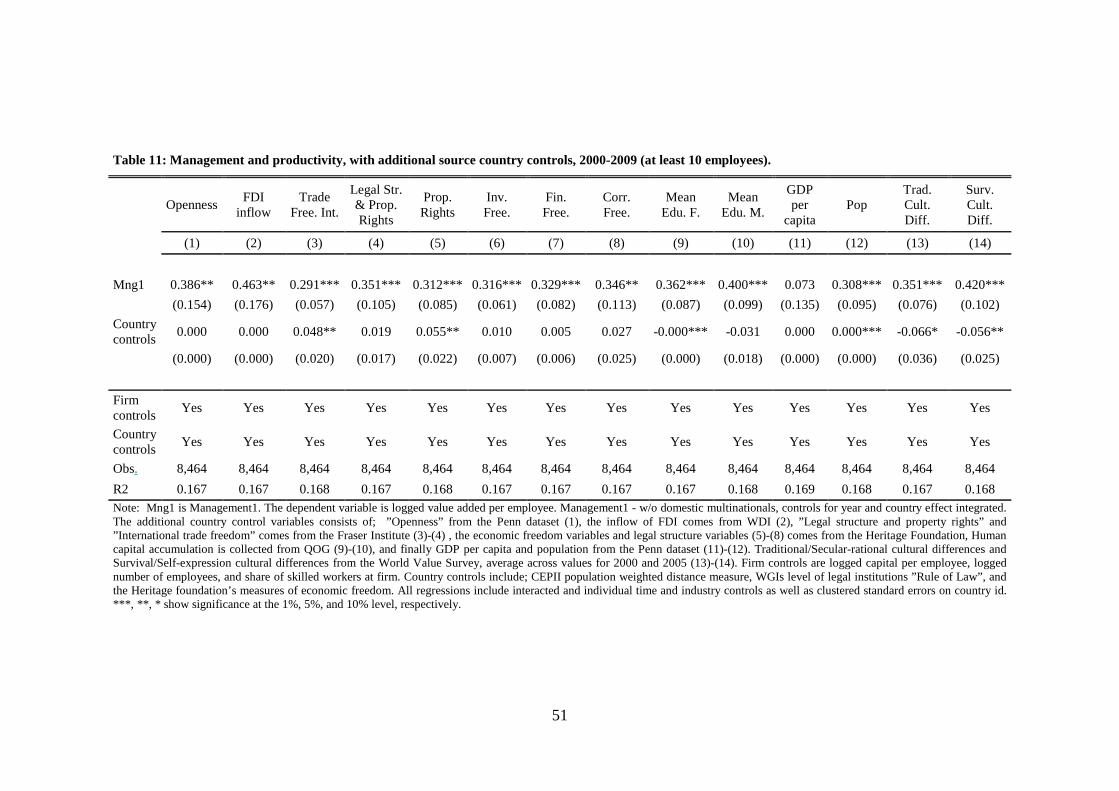
Table 11: Management and productivity, with additional source country controls, 2000-2009 (at least 10 employees).
Openness FDI
inflow Trade
Free. Int.
Legal Str. & Prop. Rights
Prop. Rights
Inv. Free.
Fin. Free.
Corr. Free.
Mean Edu. F.
Mean Edu. M.
GDP per
capita Pop
Trad. Cult. Diff.
Surv. Cult. Diff.
(1) (2) (3) (4) (5) (6) (7) (8) (9) (10) (11) (12) (13) (14)
Mng1 0.386** 0.463** 0.291*** 0.351*** 0.312*** 0.316*** 0.329*** 0.346** 0.362*** 0.400*** 0.073 0.308*** 0.351*** 0.420***
(0.154) (0.176) (0.057) (0.105) (0.085) (0.061) (0.082) (0.113) (0.087) (0.099) (0.135) (0.095) (0.076) (0.102)
Country controls 0.000 0.000 0.048** 0.019 0.055** 0.010 0.005 0.027 -0.000*** -0.031 0.000 0.000*** -0.066* -0.056**
(0.000) (0.000) (0.020) (0.017) (0.022) (0.007) (0.006) (0.025) (0.000) (0.018) (0.000) (0.000) (0.036) (0.025)
Firm controls Yes Yes Yes Yes Yes Yes Yes Yes Yes Yes Yes Yes Yes Yes
Country controls Yes Yes Yes Yes Yes Yes Yes Yes Yes Yes Yes Yes Yes Yes
Obs. 8,464 8,464 8,464 8,464 8,464 8,464 8,464 8,464 8,464 8,464 8,464 8,464 8,464 8,464 R2 0.167 0.167 0.168 0.167 0.168 0.167 0.167 0.167 0.167 0.168 0.169 0.168 0.167 0.168 Note: Mng1 is Management1. The dependent variable is logged value added per employee. Management1 - w/o domestic multinationals, controls for year and country effect integrated. The additional country control variables consists of; ”Openness” from the Penn dataset (1), the inflow of FDI comes from WDI (2), ”Legal structure and property rights” and ”International trade freedom” comes from the Fraser Institute (3)-(4) , the economic freedom variables and legal structure variables (5)-(8) comes from the Heritage Foundation, Human capital accumulation is collected from QOG (9)-(10), and finally GDP per capita and population from the Penn dataset (11)-(12). Traditional/Secular-rational cultural differences and Survival/Self-expression cultural differences from the World Value Survey, average across values for 2000 and 2005 (13)-(14). Firm controls are logged capital per employee, logged number of employees, and share of skilled workers at firm. Country controls include; CEPII population weighted distance measure, WGIs level of legal institutions ”Rule of Law”, and the Heritage foundation’s measures of economic freedom. All regressions include interacted and individual time and industry controls as well as clustered standard errors on country id. ***, **, * show significance at the 1%, 5%, and 10% level, respectively.
51
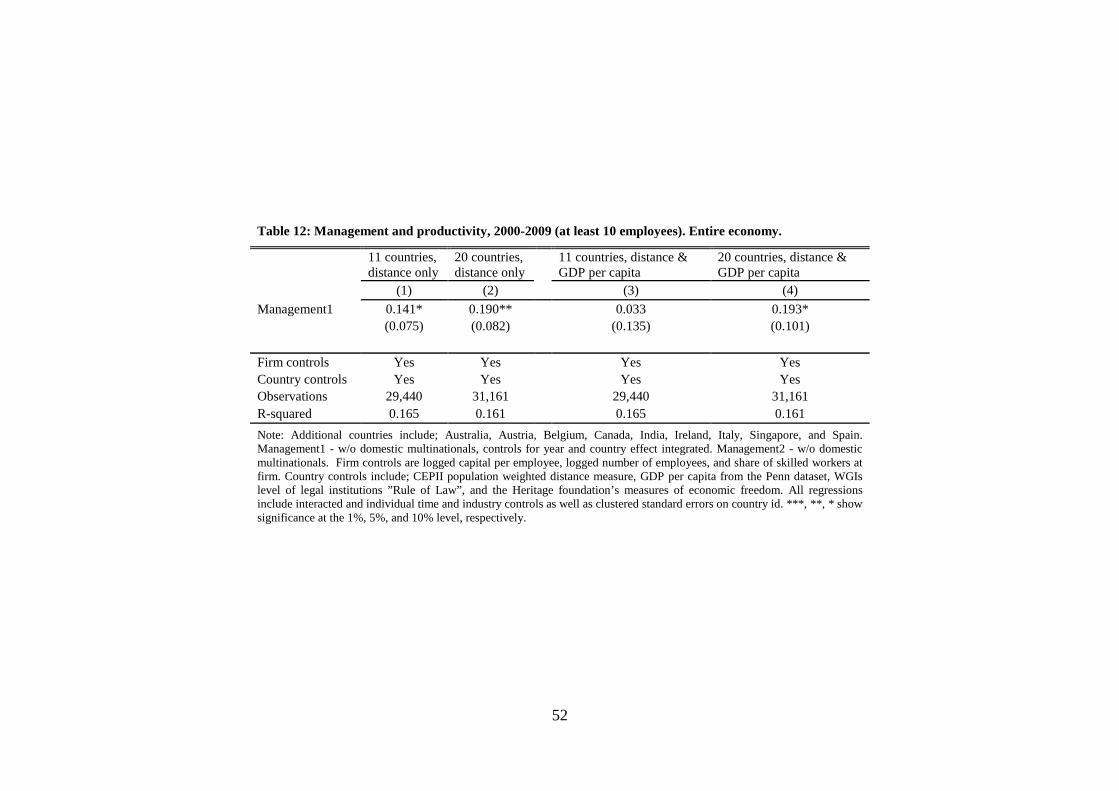
Table 12: Management and productivity, 2000-2009 (at least 10 employees). Entire economy.
11 countries, distance only
20 countries, distance only
11 countries, distance & GDP per capita
20 countries, distance & GDP per capita
(1) (2) (3) (4)
Management1 0.141* 0.190** 0.033 0.193*
(0.075) (0.082) (0.135) (0.101)
Firm controls Yes Yes Yes Yes Country controls Yes Yes Yes Yes Observations 29,440 31,161 29,440 31,161 R-squared 0.165 0.161 0.165 0.161 Note: Additional countries include; Australia, Austria, Belgium, Canada, India, Ireland, Italy, Singapore, and Spain. Management1 - w/o domestic multinationals, controls for year and country effect integrated. Management2 - w/o domestic multinationals. Firm controls are logged capital per employee, logged number of employees, and share of skilled workers at firm. Country controls include; CEPII population weighted distance measure, GDP per capita from the Penn dataset, WGIs level of legal institutions ”Rule of Law”, and the Heritage foundation’s measures of economic freedom. All regressions include interacted and individual time and industry controls as well as clustered standard errors on country id. ***, **, * show significance at the 1%, 5%, and 10% level, respectively.
52

Appendix Table A1: Wald tests of estimates from Table 4 (specifications with firm controls) – Reference group: Swedish firms; All, Manufacturing, Service, MNEs, Local.
All firms Finland Luxembourg Netherlands Norway France Germany UK Denmark US Japan
Switzerland 0,03 0,29 0,18 0,00 0,82 0,08 0,01 0,00 0,00 0,84 Finland 0,76 0,40 0,33 0,12 0,60 0,72 0,05 0,00 0,30 Luxembourg 0,83 0,37 0,42 1,00 0,60 0,13 0,00 0,53 Netherland 0,06 0,37 0,73 0,22 0,01 0,00 0,56 Norway 0,02 0,11 0,53 0,25 0,00 0,12 France 0,23 0,06 0,00 0,01 0,97 Germany 0,36 0,01 0,00 0,44 UK 0,09 0,00 0,22 Denmark 0,00 0,03 US 0,06 Manu. firms Finland Luxembourg Netherlands Norway France Germany UK Denmark US Japan Switzerland 0,19 0,00 0,16 0,00 0,05 0,23 0,22 0,01 0,52 0,02 Finland 0,02 0,90 0,00 0,28 0,96 0,98 0,12 0,04 0,11 Luxembourg 0,02 0,82 0,20 0,03 0,02 0,18 0,00 0,81 Netherland 0,00 0,34 0,95 0,93 0,17 0,03 0,12 Norway 0,13 0,00 0,00 0,07 0,00 0,92 France 0,33 0,32 0,90 0,01 0,41 Germany 0,98 0,18 0,06 0,12 UK 0,16 0,05 0,12 Denmark 0,00 0,42 US 0,01 Service firms Finland Luxembourg Netherlands Norway France Germany UK Denmark US Japan
Switzerland 0,09 0,92 0,37 0,19 0,37 0,18 0,03 0,00 0,01 0,64 Finland 0,26 0,36 0,53 0,02 0,55 0,84 0,17 0,00 0,10 Luxembourg 0,60 0,44 0,44 0,44 0,19 0,03 0,06 0,64 Netherland 0,70 0,08 0,68 0,20 0,01 0,00 0,28 Norway 0,03 0,98 0,32 0,02 0,00 0,18 France 0,03 0,00 0,00 0,17 0,83 Germany 0,34 0,02 0,00 0,17 UK 0,17 0,00 0,06 Denmark 0,00 0,01 US 0,21 MNE firms Finland Luxembourg Netherlands Norway France Germany UK Denmark US Japan Switzerland 0,13 0,17 0,31 0,00 0,77 0,05 0,01 0,00 0,02 0,35 Finland 0,67 0,56 0,07 0,32 0,68 0,23 0,01 0,00 0,98 Luxembourg 0,44 0,51 0,29 0,86 0,76 0,25 0,00 0,77 Netherland 0,01 0,59 0,31 0,07 0,00 0,00 0,72 Norway 0,02 0,14 0,55 0,36 0,00 0,34 France 0,18 0,05 0,00 0,03 0,50 Germany 0,41 0,02 0,00 0,84 UK 0,16 0,00 0,53 Denmark 0,00 0,16 US 0,02 Local firms Finland Luxembourg Netherlands Norway France Germany UK Denmark US Japan Switzerland 0,04 0,25 0,16 0,00 0,84 0,07 0,01 0,00 0,00 0,80 Finland 0,83 0,46 0,22 0,12 0,68 0,70 0,03 0,00 0,33 Luxembourg 0,80 0,35 0,36 0,97 0,66 0,12 0,00 0,52 Netherland 0,04 0,32 0,73 0,26 0,00 0,00 0,57 Norway 0,01 0,08 0,39 0,27 0,00 0,10 France 0,20 0,06 0,00 0,01 0,92 Germany 0,40 0,01 0,00 0,44 UK 0,06 0,00 0,24 Denmark 0,00 0,03 US 0,05 Note: Numbers in red indicate significant values, i.e. that the coefficients compared are significantly different from another at the 10 % level or lower.
53

Table A2: Wald tests of estimates from Table 5 (specifications with firm controls) – Reference group: Swedish firms; All, Manufacturing, Service, MNEs, Local.
All firms Finland Luxembourg Netherlands Norway France Germany UK Denmark US Japan Switzerland 0,48 0,27 0,39 0,87 0,45 0,57 0,92 0,67 0,14 0,54 Finland
0,02 0,83 0,24 0,84 0,84 0,31 0,68 0,31 0,34
Luxembourg
0,01 0,20 0,05 0,03 0,21 0,04 0,00 0,91 Netherland
0,16 0,97 0,68 0,21 0,51 0,40 0,30
Norway
0,27 0,31 0,95 0,39 0,04 0,57 France
0,72 0,32 0,60 0,52 0,31
Germany
0,39 0,83 0,23 0,37 UK
0,48 0,06 0,56
Denmark
0,15 0,40 US
0,18
Manu. firms Finland Luxembourg Netherlands Norway France Germany UK Denmark US Japan Switzerland 0,71 0,49 0,46 0,31 0,86 0,37 0,73 0,37 0,19 0,61 Finland 0,19 0,58 0,06 0,65 0,44 0,33 0,41 0,17 0,72 Luxembourg 0,09 0,76 0,74 0,07 0,67 0,05 0,02 0,36 Netherland 0,02 0,47 0,82 0,16 0,87 0,43 0,89 Norway 0,58 0,02 0,41 0,01 0,00 0,27 France 0,41 0,95 0,41 0,26 0,56 Germany 0,12 0,92 0,60 0,96 UK 0,09 0,04 0,46 Denmark 0,47 0,93 US 0,86 Service firms Finland Luxembourg Netherlands Norway France Germany UK Denmark US Japan
Switzerland 0,57 0,04 0,87 0,62 0,78 0,71 0,53 0,60 0,70 0,33 Finland 0,00 0,61 0,19 0,74 0,26 0,16 0,18 0,85 0,20 Luxembourg 0,00 0,03 0,01 0,03 0,07 0,04 0,01 0,92 Netherland 0,37 0,88 0,49 0,31 0,35 0,78 0,27 Norway 0,34 0,87 0,84 0,96 0,30 0,42 France 0,44 0,29 0,33 0,89 0,26 Germany 0,74 0,84 0,39 0,39 UK 0,88 0,25 0,46 Denmark 0,29 0,43 US 0,24 MNE firms Finland Luxembourg Netherlands Norway France Germany UK Denmark US Japan Switzerland 0,70 0,54 0,97 0,54 0,81 0,47 0,47 0,74 0,74 0,10 Finland
0,66 0,47 0,66 0,86 0,51 0,52 0,92 0,95 0,08
Luxembourg
0,29 0,99 0,63 0,88 0,85 0,61 0,65 0,15 Netherland
0,32 0,75 0,21 0,22 0,58 0,58 0,04
Norway
0,63 0,89 0,86 0,64 0,66 0,15 France
0,53 0,53 0,93 0,91 0,09
Germany
0,96 0,49 0,53 0,16 UK
0,50 0,52 0,19
Denmark
0,98 0,08 US
0,08
Local firms Finland Luxembourg Netherlands Norway France Germany UK Denmark US Japan Switzerland 0,15 0,55 0,32 0,95 0,34 0,27 0,73 0,48 0,02 0,95 Finland
0,03 0,57 0,09 0,80 0,63 0,22 0,30 0,30 0,53
Luxembourg
0,08 0,43 0,12 0,06 0,30 0,13 0,00 0,86 Netherland
0,25 0,85 0,92 0,48 0,66 0,12 0,66
Norway
0,30 0,20 0,72 0,41 0,01 0,93 France
0,91 0,47 0,61 0,27 0,62
Germany
0,41 0,57 0,14 0,63 UK
0,71 0,03 0,84
Denmark
0,04 0,75 US 0,30 Note: Numbers in red indicate significant values, i.e. that the coefficients compared are significantly different from another at the 10 % level or lower.
54
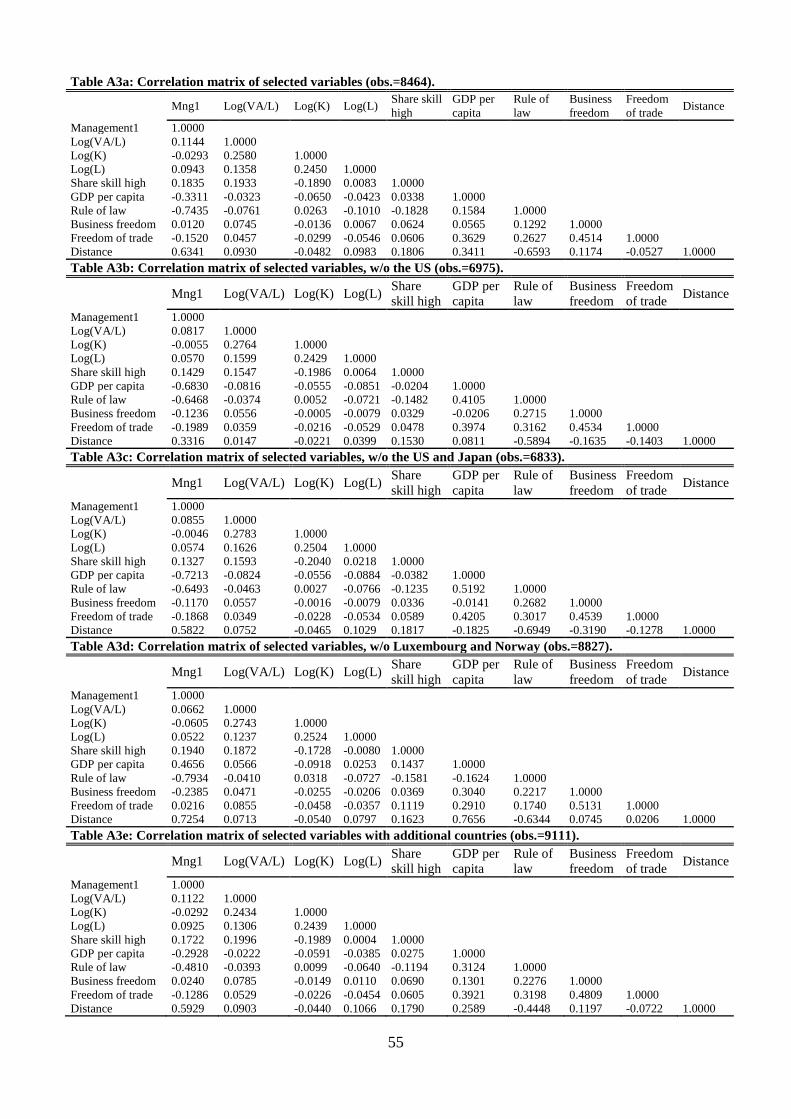
Table A3a: Correlation matrix of selected variables (obs.=8464).
Mng1 Log(VA/L) Log(K) Log(L) Share skill high
GDP per capita
Rule of law
Business freedom
Freedom of trade Distance
Management1 1.0000 Log(VA/L) 0.1144 1.0000
Log(K) -0.0293 0.2580 1.0000 Log(L) 0.0943 0.1358 0.2450 1.0000
Share skill high 0.1835 0.1933 -0.1890 0.0083 1.0000 GDP per capita -0.3311 -0.0323 -0.0650 -0.0423 0.0338 1.0000
Rule of law -0.7435 -0.0761 0.0263 -0.1010 -0.1828 0.1584 1.0000 Business freedom 0.0120 0.0745 -0.0136 0.0067 0.0624 0.0565 0.1292 1.0000
Freedom of trade -0.1520 0.0457 -0.0299 -0.0546 0.0606 0.3629 0.2627 0.4514 1.0000 Distance 0.6341 0.0930 -0.0482 0.0983 0.1806 0.3411 -0.6593 0.1174 -0.0527 1.0000
Table A3b: Correlation matrix of selected variables, w/o the US (obs.=6975).
Mng1 Log(VA/L) Log(K) Log(L) Share
skill high GDP per capita
Rule of law
Business freedom
Freedom of trade Distance
Management1 1.0000 Log(VA/L) 0.0817 1.0000
Log(K) -0.0055 0.2764 1.0000 Log(L) 0.0570 0.1599 0.2429 1.0000
Share skill high 0.1429 0.1547 -0.1986 0.0064 1.0000 GDP per capita -0.6830 -0.0816 -0.0555 -0.0851 -0.0204 1.0000
Rule of law -0.6468 -0.0374 0.0052 -0.0721 -0.1482 0.4105 1.0000 Business freedom -0.1236 0.0556 -0.0005 -0.0079 0.0329 -0.0206 0.2715 1.0000
Freedom of trade -0.1989 0.0359 -0.0216 -0.0529 0.0478 0.3974 0.3162 0.4534 1.0000 Distance 0.3316 0.0147 -0.0221 0.0399 0.1530 0.0811 -0.5894 -0.1635 -0.1403 1.0000
Table A3c: Correlation matrix of selected variables, w/o the US and Japan (obs.=6833).
Mng1 Log(VA/L) Log(K) Log(L) Share
skill high GDP per capita
Rule of law
Business freedom
Freedom of trade Distance
Management1 1.0000 Log(VA/L) 0.0855 1.0000
Log(K) -0.0046 0.2783 1.0000 Log(L) 0.0574 0.1626 0.2504 1.0000
Share skill high 0.1327 0.1593 -0.2040 0.0218 1.0000 GDP per capita -0.7213 -0.0824 -0.0556 -0.0884 -0.0382 1.0000
Rule of law -0.6493 -0.0463 0.0027 -0.0766 -0.1235 0.5192 1.0000 Business freedom -0.1170 0.0557 -0.0016 -0.0079 0.0336 -0.0141 0.2682 1.0000
Freedom of trade -0.1868 0.0349 -0.0228 -0.0534 0.0589 0.4205 0.3017 0.4539 1.0000 Distance 0.5822 0.0752 -0.0465 0.1029 0.1817 -0.1825 -0.6949 -0.3190 -0.1278 1.0000
Table A3d: Correlation matrix of selected variables, w/o Luxembourg and Norway (obs.=8827).
Mng1 Log(VA/L) Log(K) Log(L) Share
skill high GDP per capita
Rule of law
Business freedom
Freedom of trade Distance
Management1 1.0000 Log(VA/L) 0.0662 1.0000
Log(K) -0.0605 0.2743 1.0000 Log(L) 0.0522 0.1237 0.2524 1.0000
Share skill high 0.1940 0.1872 -0.1728 -0.0080 1.0000 GDP per capita 0.4656 0.0566 -0.0918 0.0253 0.1437 1.0000
Rule of law -0.7934 -0.0410 0.0318 -0.0727 -0.1581 -0.1624 1.0000 Business freedom -0.2385 0.0471 -0.0255 -0.0206 0.0369 0.3040 0.2217 1.0000
Freedom of trade 0.0216 0.0855 -0.0458 -0.0357 0.1119 0.2910 0.1740 0.5131 1.0000 Distance 0.7254 0.0713 -0.0540 0.0797 0.1623 0.7656 -0.6344 0.0745 0.0206 1.0000
Table A3e: Correlation matrix of selected variables with additional countries (obs.=9111).
Mng1 Log(VA/L) Log(K) Log(L) Share
skill high GDP per capita
Rule of law
Business freedom
Freedom of trade Distance
Management1 1.0000 Log(VA/L) 0.1122 1.0000
Log(K) -0.0292 0.2434 1.0000 Log(L) 0.0925 0.1306 0.2439 1.0000
Share skill high 0.1722 0.1996 -0.1989 0.0004 1.0000 GDP per capita -0.2928 -0.0222 -0.0591 -0.0385 0.0275 1.0000
Rule of law -0.4810 -0.0393 0.0099 -0.0640 -0.1194 0.3124 1.0000 Business freedom 0.0240 0.0785 -0.0149 0.0110 0.0690 0.1301 0.2276 1.0000
Freedom of trade -0.1286 0.0529 -0.0226 -0.0454 0.0605 0.3921 0.3198 0.4809 1.0000 Distance 0.5929 0.0903 -0.0440 0.1066 0.1790 0.2589 -0.4448 0.1197 -0.0722 1.0000
55
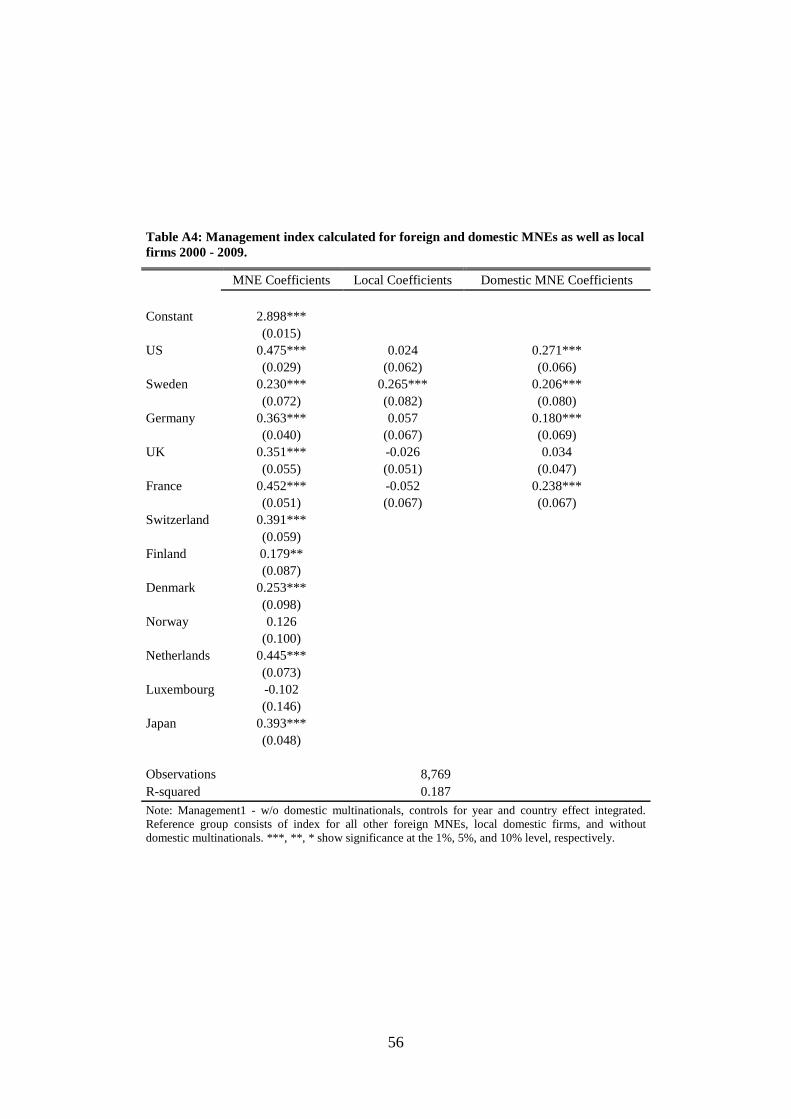
Table A4: Management index calculated for foreign and domestic MNEs as well as local firms 2000 - 2009.
MNE Coefficients Local Coefficients Domestic MNE Coefficients
Constant 2.898*** (0.015) US 0.475*** 0.024 0.271***
(0.029) (0.062) (0.066) Sweden 0.230*** 0.265*** 0.206***
(0.072) (0.082) (0.080) Germany 0.363*** 0.057 0.180***
(0.040) (0.067) (0.069) UK 0.351*** -0.026 0.034
(0.055) (0.051) (0.047)
France 0.452*** -0.052 0.238***
(0.051) (0.067) (0.067)
Switzerland 0.391***
(0.059)
Finland 0.179**
(0.087)
Denmark 0.253*** (0.098) Norway 0.126 (0.100) Netherlands 0.445*** (0.073) Luxembourg -0.102 (0.146) Japan 0.393***
(0.048)
Observations 8,769 R-squared 0.187 Note: Management1 - w/o domestic multinationals, controls for year and country effect integrated. Reference group consists of index for all other foreign MNEs, local domestic firms, and without domestic multinationals. ***, **, * show significance at the 1%, 5%, and 10% level, respectively.
56

Table A5a: Definitions and descriptive statistics (means and standard deviations). Firms with at least 10 employees 1996-2009.
Firm variables: Definition: All firms
All Swedish firms
Local Swedish firms
Swedish MNEs
Service firms
Manufacturing firms
Foreign firms (11 countries) Source:
Productivity Value added per employee (MSEK) 0.47 0.46 0.45 0.61 0.48 0.46 0.61 Swedish firm data (SCB)
(0.43) (0.41) (0.40) (0.58) (0.47) (0.31) (0.56)
Capital intensity Capital divided by labor ratio 0.47 0.48 0.49 0.37 0.54 0.27 0.33 -
(2.81) (2.88) (2.91) (1.85) (3.38) (1.00) (2.01)
Firm size Number of employees 58.68 49.62 39.77 360.35 51.16 85.33 143.57 -
(383.14) (365.27) (297.70) (1203.13) (368.39) (460.69) (513.83)
Share skill high Percentage share of employees with a higher education 0.22 0.21 0.21 0.30 0.27 0.28 0.34 -
(0.24) (0.24) (0.24) (0.24) (0.27) (0.27) (0.25)
57

Table A5b: Definitions and descriptive statistics (means and standard deviations). Firms with at least 10 employees 2000-2009, selected countries, manufacturing sector.
11 countries
20 countries
Management variables: Definition: Mean: SD: Mean: SD: Source:
Management1 Index w/o domestic multinationals, controls for year and country effect integrated. 3.17 (0.11)
3.17 (0.11) World Management Survey
Management2 Index w/o domestic multinationals. 3.16 (0.29)
3.15 (0.29) - Monitor1 Organization monitoring index of home country. Management1 method. 3.50 (0.17)
3.50 (0.17) -
Target1 Target setting index of home country. Management1 method. 3.18 (0.09)
3.18 (0.10) - People1 Incentive index of home country. Management1 method. 2.91 (0.14)
2.91 (0.13) -
Country variables: Definition: Mean: SD: Mean: SD: Source: Distance Weighted distance (pop-wt. km) 2162 (2639)
2248 (2734) CEPII distance measure
Rule of law Rule of law estimate 8.65 (0.33)
8.60 (0.44) Worldwide Governance Indicators (WGI)
Business freedom Business freedom 8.47 (0.93)
8.44 (0.96) Heritage Foundation Freedom to trade Freedom of trade 8.32 (0.32)
8.31 (0.35) -
Openness Share of Exports and imports (% of GDP) 78.67 (51.03)
80.24 (52.29) Penn FDI inflow Foreign direct investment. net inflows (% of GDP) 14.50 (62.77) 13.90 (60.66) WDI Legal structure and secure property rights Legal structure and secure property rights. 8.58 (0.61)
8.51 (0.69) Fraser Institute
Freedom to trade internationally Freedom to trade internationally. 7.69 (0.57)
7.70 (0.58) -
Investment freedom Investment freedom. 7.37 (1.30)
7.36 (1.31) Heritage Foundation Financial freedom Financial freedom. 7.44 (1.61)
7.42 (1.59) -
Property rights Property rights. 8.87 (0.49)
8.81 (0.65) - Freedom from corruption Freedom from corruption. 8.51 (0.88)
8.41 (1.01) -
Average years of education (F) Average number of years of education of women aged 25 and older. 12.18 (1.04)
12.08 (1.22)
Quality of Government Institute (QOG)
Average years of education (M) Average number of years of education of men aged 25 and older. 12.35 (1.00)
12.27 (1.11) -
GDP per capita GDP per capita (constant 2000 US$) 31 652 (7252)
31 030 (7487) Penn Population Population, total 7.44*107 (1.06*108)
7.38*107 (1.17*108) -
Traditional/Secular Traditional/Secular-rational cultural differences from Sweden. Average 2000 and 2005. -0.89 (0.37)
-0.93 (0.39) World Value Surveys
Survival/Self Survival/Self-expression cultural differences from Sweden. Average 2000 and 2005. -0.74 (0.50)
-0.76 (0.50) -
58
Related Documents