FRCR: Physics Lectures Diagnostic Radiology Lectures 6 & 7 Fluoroscopy equipment, operation and digital subtraction angiography Dr Tim Wood Clinical Scientist

FRCR: Physics Lectures Diagnostic Radiology Lectures 6 & 7 Fluoroscopy equipment, operation and digital subtraction angiography Dr Tim Wood Clinical Scientist.
Jan 11, 2016
Welcome message from author
This document is posted to help you gain knowledge. Please leave a comment to let me know what you think about it! Share it to your friends and learn new things together.
Transcript

FRCR: Physics Lectures
Diagnostic Radiology
Lectures 6 & 7Fluoroscopy equipment, operation and
digital subtraction angiography
Dr Tim WoodClinical Scientist

Overview
• An introduction to fluoroscopy• Clinical applications• Fluoroscopy equipment
– The image intensifier– Flat panel fluoroscopy
• Gain, magnification and ABC• Patient dose and deterministic effects• Image quality• Digital Subtraction Angiography (DSA)
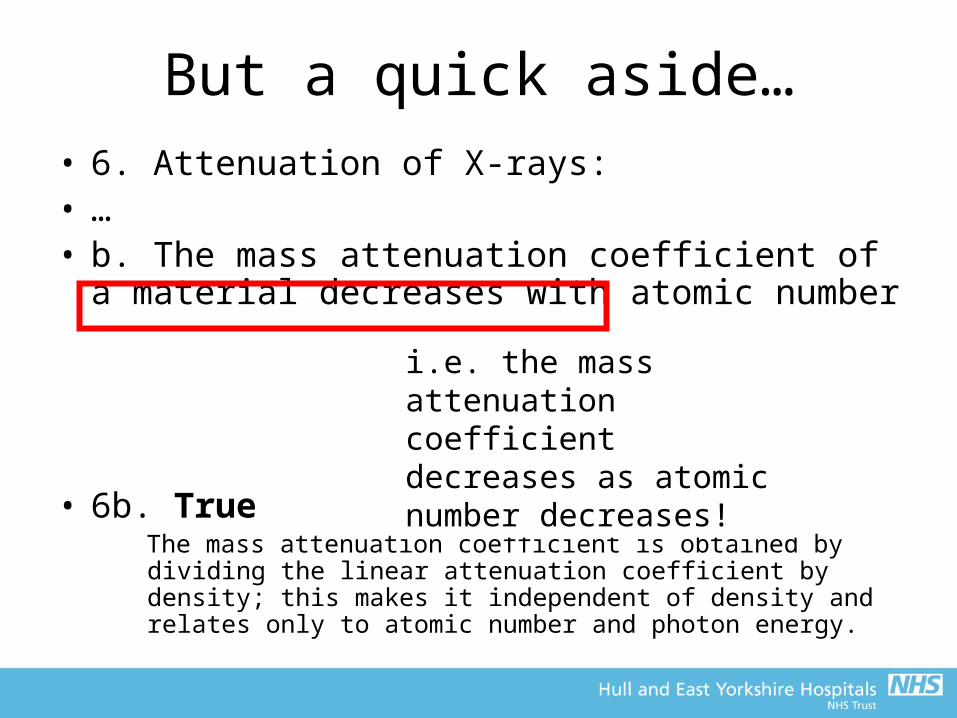
But a quick aside…• 6. Attenuation of X-rays:• …• b. The mass attenuation coefficient of a material
decreases with atomic number
• 6b. TrueThe mass attenuation coefficient is obtained by dividing the linear attenuation coefficient by density; this makes it independent of density and relates only to atomic number and photon energy.
i.e. the mass attenuation coefficient decreases as atomic number decreases!
Introduction
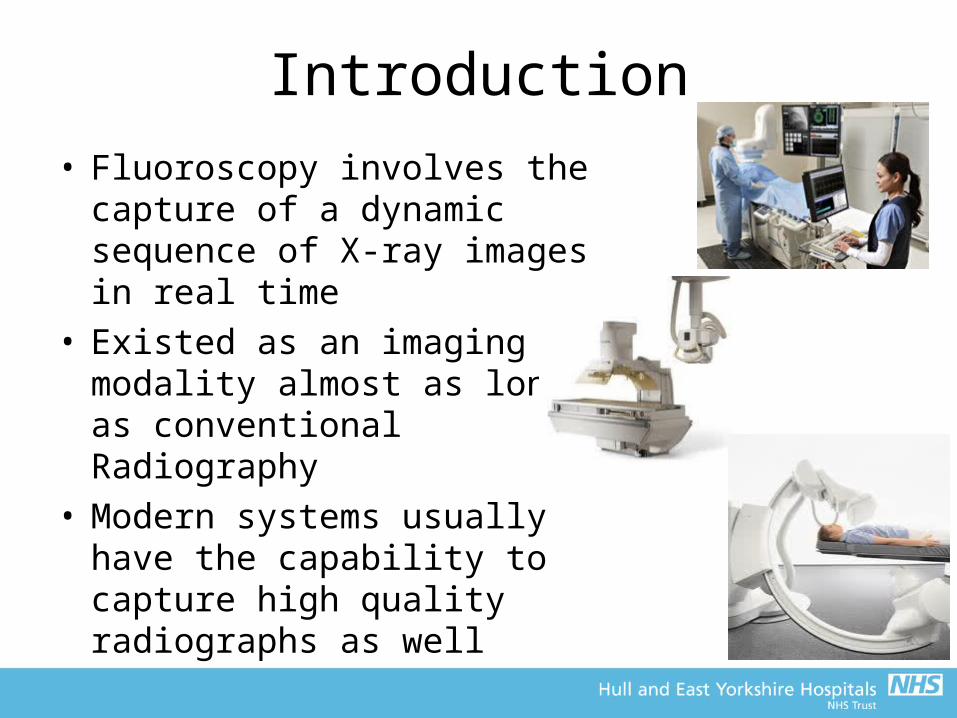
• Fluoroscopy involves the capture of a dynamic sequence of X-ray images in real time
• Existed as an imaging modality almost as long as conventional Radiography
• Modern systems usually have the capability to capture high quality radiographs as well
Applications• Ba swallows, meals and enemas• Positioning of ‘things’ in theatre
– Orthopaedics– Brachytherapy (radioactive sources)
• Cardiology– Image beating heart and surrounding vessels to diagnose
and treat heart disease
• Vascular– Digital subtraction angiography to diagnose blockages in
blood vessels– Interventional – unblock and insert stents
• And many, many more…
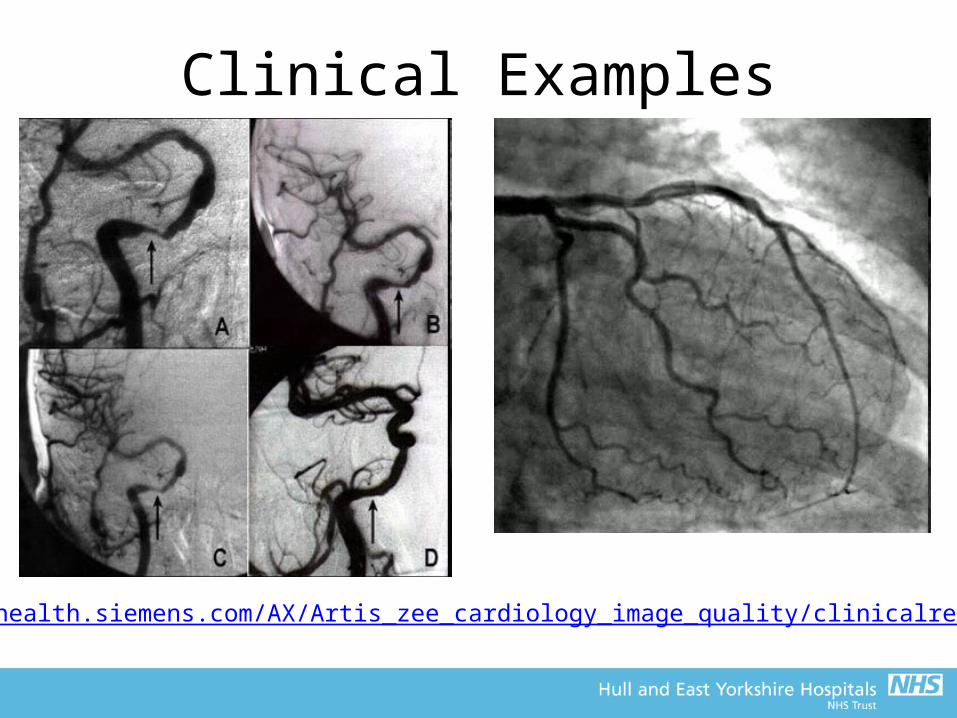
Clinical Examples
http://health.siemens.com/AX/Artis_zee_cardiology_image_quality/clinicalresults.swf
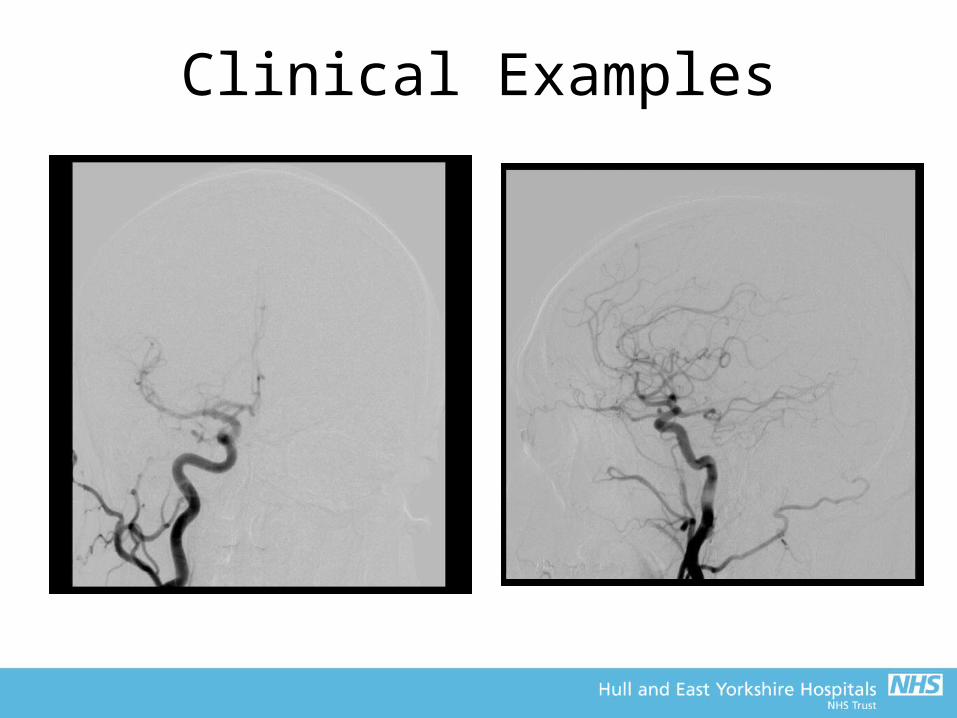
Clinical Examples

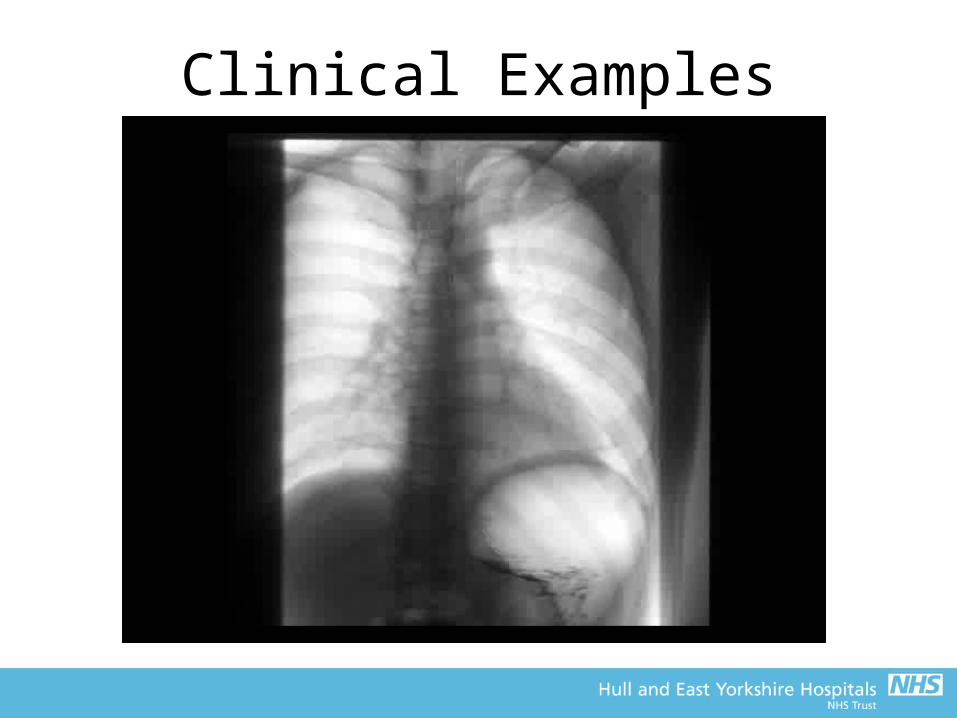
Clinical Examples
Clinical Examples
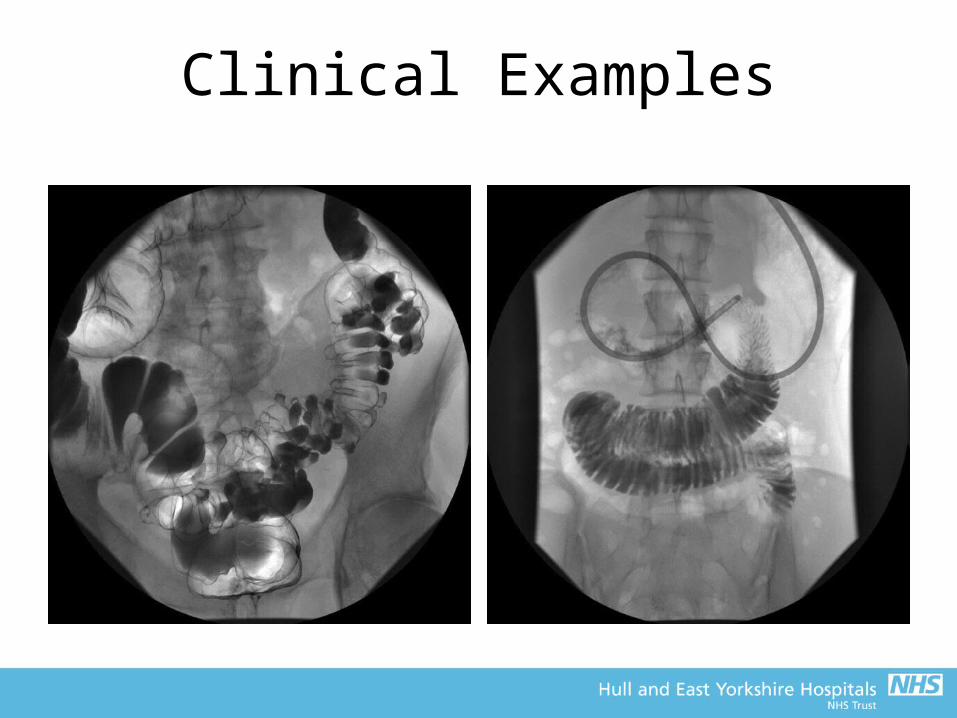
Clinical Examples
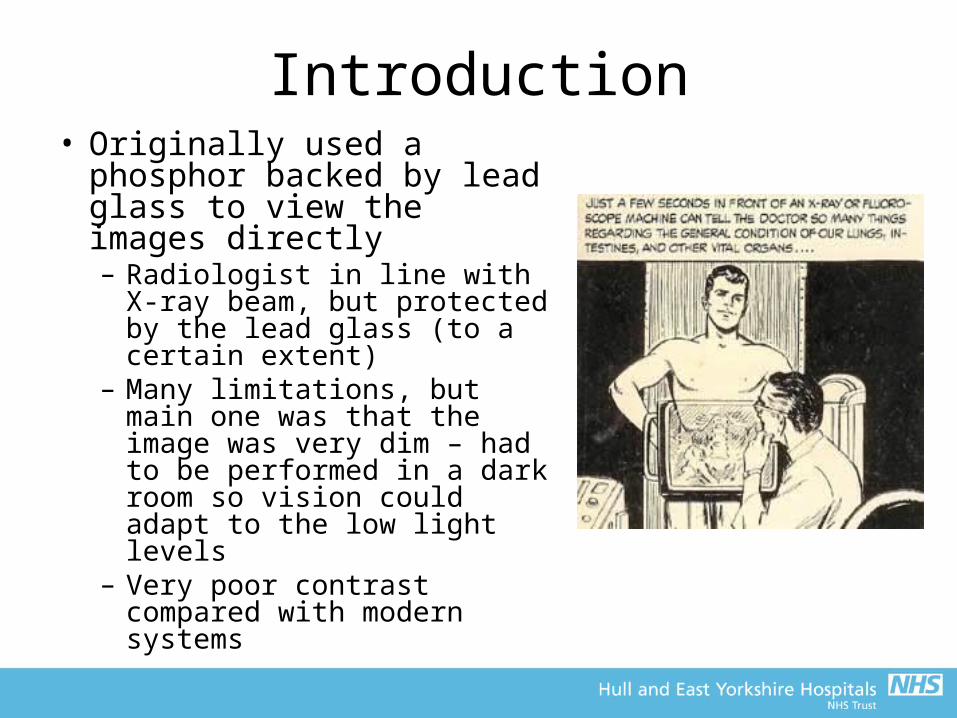
Introduction• Originally used a phosphor
backed by lead glass to view the images directly– Radiologist in line with X-ray
beam, but protected by the lead glass (to a certain extent)
– Many limitations, but main one was that the image was very dim – had to be performed in a dark room so vision could adapt to the low light levels
– Very poor contrast compared with modern systems

The Image Intensifier
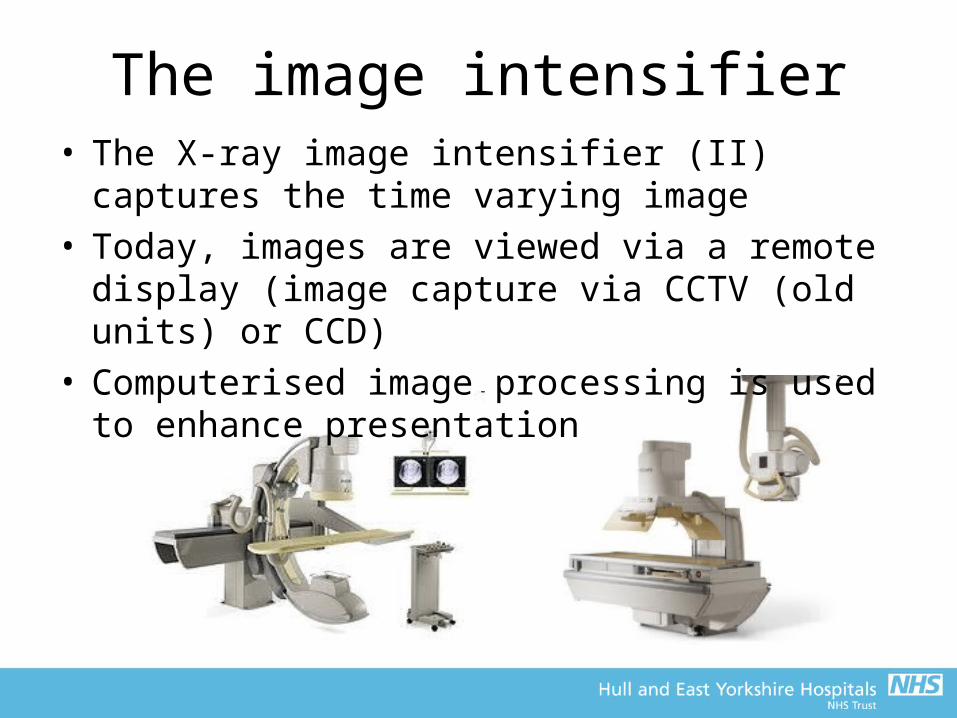
The image intensifier• The X-ray image intensifier (II) captures the time
varying image• Today, images are viewed via a remote display
(image capture via CCTV (old units) or CCD)• Computerised image processing is used to
enhance presentation

Image Intensifier Construction• Evacuated electron-optical device
– Glass or ceramic envelope surrounded by metal housing
• Constructed from non-magnetic materials
• Prevent stray light getting into the system
• Large field has typical input diameter of 35-40 cm
• Internal vacuum due to electron optics (more later)– Robust construction to withstand
vacuum
The image intensifier
• Three main components:– The input screen
• The input window• The input phosphor• The photocathode
– The electron-optics– The output screen


Input Window• Must satisfy a number of competing technical
requirements• Sufficiently robust to support vacuum• But, at same time, not so thick that a significant
proportion of incident X ray photons are absorbed or scattered
• Excessive interactions increases image noise, reduces contrast and increases patient dose– Early designs – thick glass window– Now – low Z materials e.g. Aluminium or Titanium– Titanium foil allows up to 90% transmission of incident
X ray photons
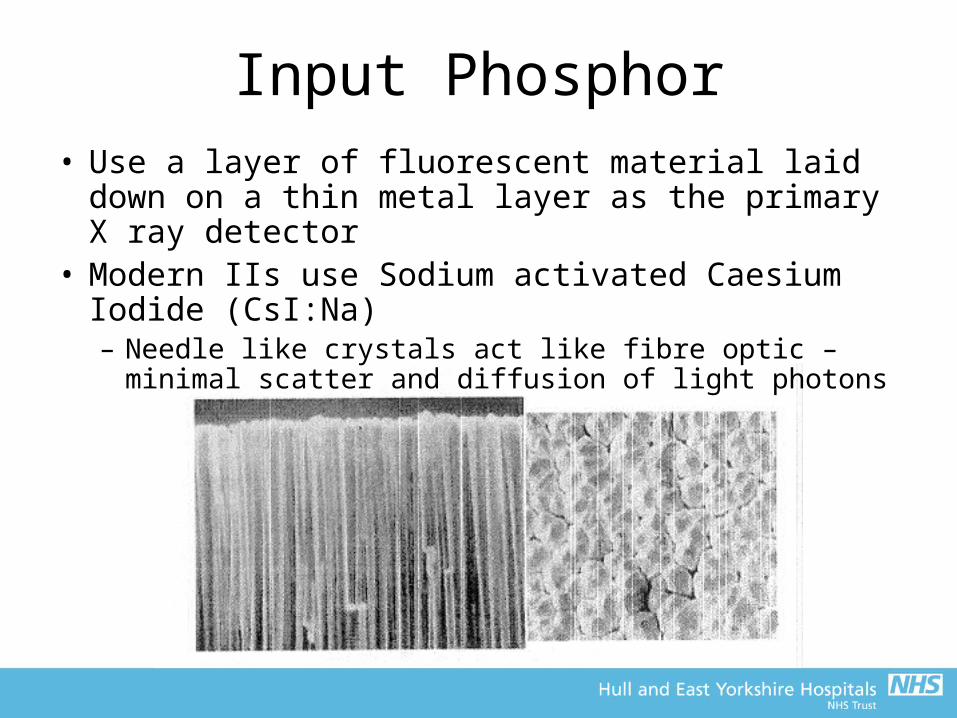
Input Phosphor• Use a layer of fluorescent material laid down on
a thin metal layer as the primary X ray detector• Modern IIs use Sodium activated Caesium
Iodide (CsI:Na)– Needle like crystals act like fibre optic – minimal
scatter and diffusion of light photons

Input Phosphor• CsI:Na layer ~200-400 µm thick• Average diameter of a crystal needle is typically
< 5 µm• Fractional X-ray absorption efficiency typically
lies in the range 0.5-0.8– Due to K-edge of Cs (36 keV) and I (33 keV) lying just
below the peak or the Bremsstrahlung used clinically
• Each X-ray photon absorbed yields approx. 3000 light photons in the blue part of the visible spectrum
• Approx two thirds of these light photons reach the photocathode layer
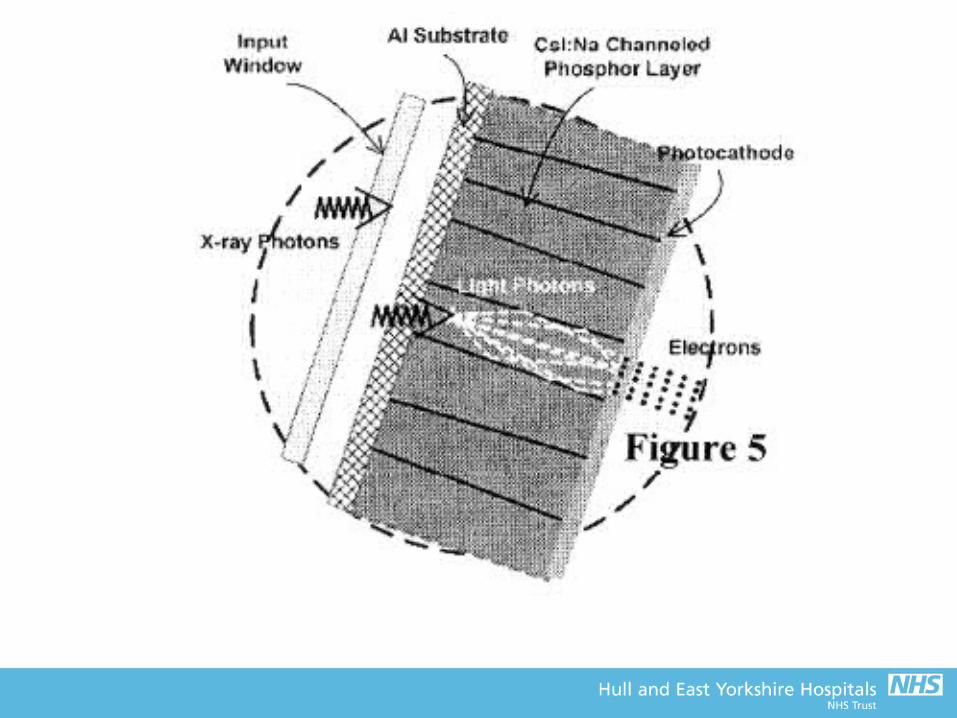

Photocathode Layer
• Converts the pattern of light photons emitted by the input phosphor into electrons
• The photocathode layer is deposited on the inside surface of the CsI:Na layer
• The photocathode comprises a layer of Caesium Antimonide which is well matched to the blue light emitted by the input phosphor
• Typical photon sensitivity of photocathode is 15%• Number of electrons produced is directly
proportional to the intensity of the X-ray photons
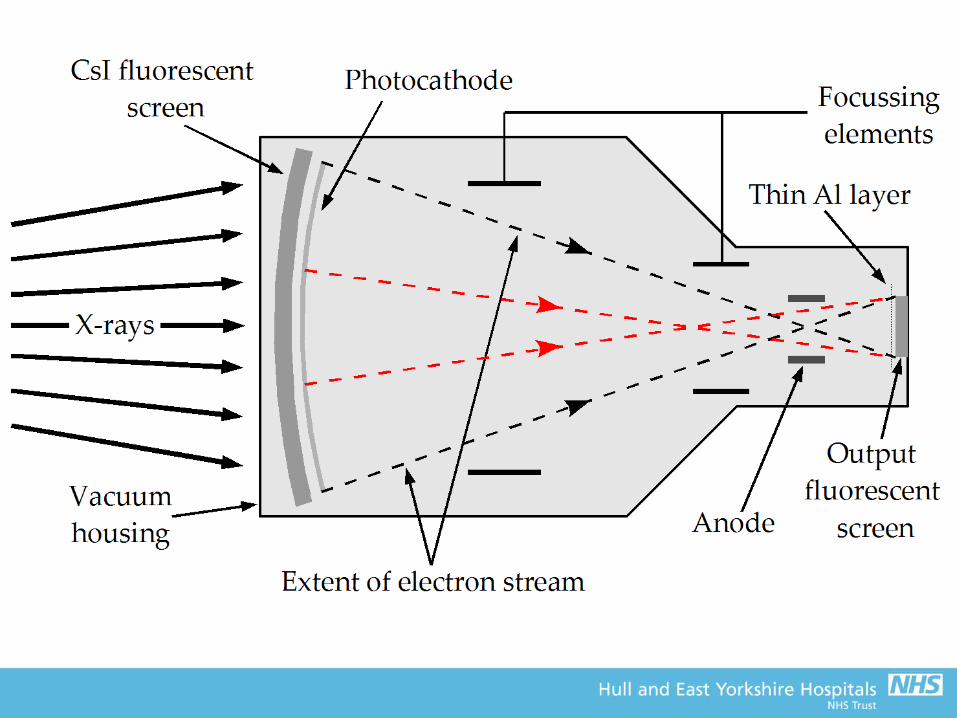
Electron Optics• A 2D time varying pattern of photo-electrons is
released from the surface of the photocathode• The released electrons are accelerated across the
II through a high positive voltage (~25-35 keV)• This voltage is applied to a cylindrical anode
structure attached to the II output• Curvature of input means that all electrons have
same path length to the output window– Also means that input X-ray intensity is lower on the
periphery (known as vignetting)
Electron Optics• Additional focussing electrodes (metal rings at
positive potential) ensure the electrons travel across the II in straight lines– Voltages must be set up correctly for this– Would not get a recognisable image without them!
• Act as an electronic lens (hence the term electron optics)
• Can alter focussing to magnify central region of input (but Automatic Brightness Control (ABC) will increase exposure factors, and hence dose, to maintain brightness – more on this later)

Output Phosphor/Window• The output phosphor screen is bombarded with
high energy electrons• Very thin, fine grain phosphor layer is deposited
on the inside surface of the II output window– Electrons have a very limited range in phosphor– Minimises spread of light!
• Viewed remotely by CCTV or CCD– Incorporate features like ‘last frame hold’ to reduce
exposure to the patient– Can capture high quality static images under ABC
control (fluorography)
Output Phosphor/Window• ~25-35 mm in diameter (much smaller than input)• Acceleration and minimisation results in
amplification of image brightness• Brightness controlled by ABC (more on this later)
– This will select kV and mA appropriate for clinical task, based on the intensity of light coming out of the II
• A thin layer of aluminium over the output screen prevents scatter of light from the output, back into the II– Would release more electrons from photocathode =
white out of image– This Al layer is sufficiently thin (0.5 μm) that high energy
electrons pass straight through
The TV system• Original TV systems used a lens system to focus
the output screen onto the CCTV camera• CCTV camera is a vacuum device with a
scanning electron beam that produces a voltage on a signal plate
• The voltage is proportional to the light intensity striking it (and hence X-ray intensity), and is fed to the monitor for display
• Modern II systems have digital functionality– The signal is fed into a computer for processing (e.g
noise reduction, sharpening, etc) and storage before display
– Performed in real time

CCD cameras• The TV camera produces an analogue signal that
has to be converted to digital• Easier to produce the image in a digital format• CCDs (like in your digital camera) have a thin layer
of amorphous silicon that is divided into pixels– Each one acts like a small capacitor and stores charge
proportional to the light hitting it
• The charge is read out row-by-row, very quickly (sufficient for 30 frames per second)
• CCD cameras have greater bit depth than CCTV• Now use fibre optic coupling rather than lens
systems
Gain
• Extent to which the II has intensified the light output from the system
• Ratio of the brightness of the output phosphor to that of the input phosphor
• Generally, 1 light photon from the input = 1 electron from the photocathode
• After acceleration to 25 keV, 1 electron = many light photons in output phosphor
• This is the flux gain– Typically ~50
Gain• Minification gain is intensification from reducing
the image size at the output• Equal to the ratio of the areas of the two screens
– For a 300 mm input and 30 mm output, minification gain would be (300/30)2 = 100
• Overall gain is the product of the two– ~5000 for this case!
• Gain is not measurable – use the conversion factor as more practical descriptor– Ratio of brightness out to dose rate at the input
(typically 25-30 Cd m-2 (μGys-1)-1
• Conversion factor deteriorates with time and usage (loss of detection efficiency in the phosphor)
Magnification• Change the voltages of the focussing electrodes
to move the electron cross-over point nearer to the input– Results in a more limited area of the input being
projected onto the output screen• The TV system used to view the images
generally limits spatial resolution, so magnification in this way improves spatial resolution compared with the full field image
• However, magnification reduces minimisation gain, so brightness (and overall gain) falls– The ABC compensates for this by increasing
exposure factors at the expense of increased patient dose

The ABC• In fluoroscopy, manual control of exposure
factors is not practical• ABC takes a measurement of light intensity of
the output, or signal from the camera (most common on modern systems) and feeds back changes required to the X-ray generator to maintain adequate light intensity
• Generally, only the central region of the image is used by the ABC
• Can increase kV and/or mA• The way it changes exposure factors can be
quite complex, and will depend on the clinical application
The ABC• Generally;
– As radiological thickness increases, increase kV to give more penetrating beam, and mA to increase the intensity
– If using Iodine, may hold kV between 60 and 65 kV to provide the optimum spectrum for the K-edge of I (33 keV), and increase mA more rapidly. When max power is reached, start to increase kV whilst reducing mA (maintain max power output). High dose as uses lower kV
– Finally, may increase kV more rapidly without increasing mA to minimise dose (at expense of IQ). More suitable for paediatrics

The ABC
Brightness controlled mainly by adjustment of kVp
Brightness controlled by simultaneous adjustment of kVp and mA
Tube heating kV x mA
(99% energy goes to heat)
X-ray intensity kV2 x mA
Penetrating power with kV
Contrast with kV
The tube current is maximised at 3 mA
Automatic gain control
• It is also possible to automatically adjust the sensitivity of the TV system to maintain image brightness (i.e. does not feedback to adjust exposure factors, just accommodates what is presented to it)
• However, this may be at the expense of high noise or high dose– If the TV system increases sensitivity to
accommodate a dark output from the II, it will be noisy– If the TV system reduces sensitivity to accommodate
a very bright output from the II, doses will be too high

Dose in Fluoroscopy
Dose rates• Fluoroscopy screening times will depend upon
the clinical task and expertise of the operator (and the equipment setup)– A few seconds for fracture fixations, – A few minutes for Ba studies, – Tens of minutes for complex interventions (even over
an hour in some extreme cases!)• Hence, fluoro has the potential for high
patient doses, which in turn may give a high dose to the operator
• Critical factor in determining the required dose rate is the level of noise that can be accepted clinically– Usual play-off between dose and image quality!
Dose rates• General rule;
– Lower input dose to the intensifier, higher noise in the image
• If magnification is used, brightness decreases in proportion to the area of the field of view
• If gain of TV not adjusted, dose rate must be increased inversely proportionally to area to maintain brightness
• Dose Area Product (DAP) would remain constant in this case– In practice, TV gain is increased slightly to minimise
the increase in dose rate

Dose rates
• Patient entrance surface dose rate (ESDR) depends on sensitivity of detector– Generally, low input dose rate to the II = lower patient
dose
• International absolute limit of 100 mGy/min, but UK ‘remedial level’ set at 50 mGy/min
• Real clinical doses between 5-30 mGy/min
Pulsed fluoroscopy
• Pulse X-ray beam to reduce patient dose• ‘Continuous’ mode is often 25-30 pulses/s, so
not detectable to the eye• Dose rates fall approx. proportionally with pulse
rate• Reduce pulse rate to the minimum required for
the clinical task– Low pulse rates where little or very slow movement
(e.g. fracture fixation)– Higher pulse rates where fast movement to avoid
blurring or lag (e.g. heart)

Pulsed fluoroscopy
• Pulsing achieved either by;– Turning the generator on and off rapidly– Grid-controlled tubes, where an additional
electrode in the tube repels electrons from the target. Rapidly switch the voltage to pulse the beam.
• More precise and greater control over intensity
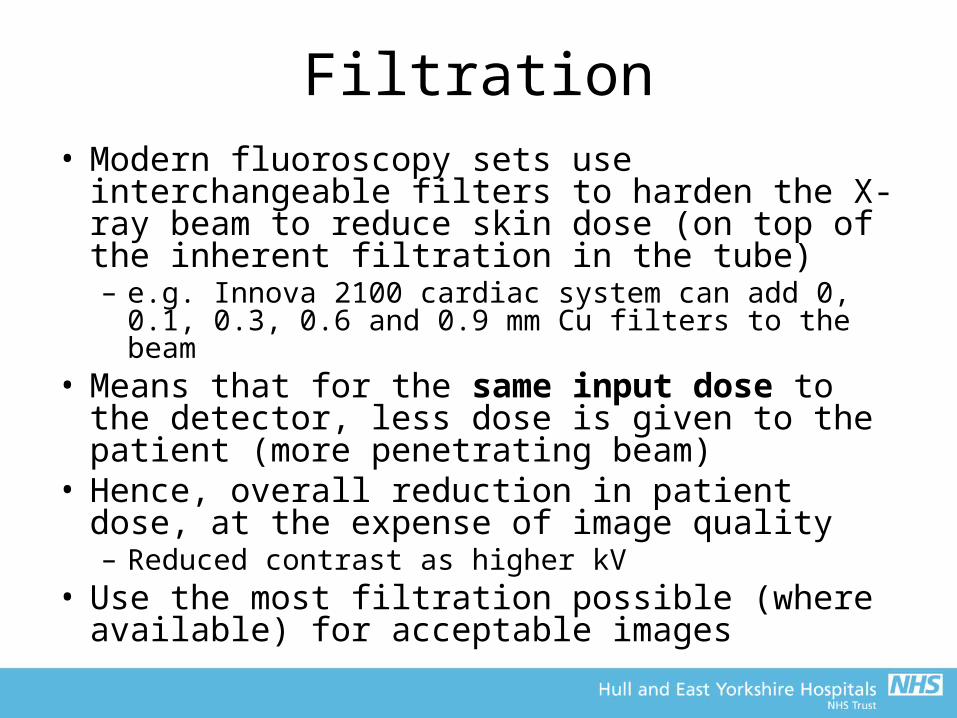
Filtration• Modern fluoroscopy sets use interchangeable
filters to harden the X-ray beam to reduce skin dose (on top of the inherent filtration in the tube)– e.g. Innova 2100 cardiac system can add 0, 0.1, 0.3,
0.6 and 0.9 mm Cu filters to the beam• Means that for the same input dose to the
detector, less dose is given to the patient (more penetrating beam)
• Hence, overall reduction in patient dose, at the expense of image quality – Reduced contrast as higher kV
• Use the most filtration possible (where available) for acceptable images

Dose Settings
• Vary with manufacturer and model• Beware - can vary between different sets of
same manufacturer and model!• Low dose
– more filtration, higher kV, less pulses/second
• High contrast – less filtration, low kV, more pulses/second
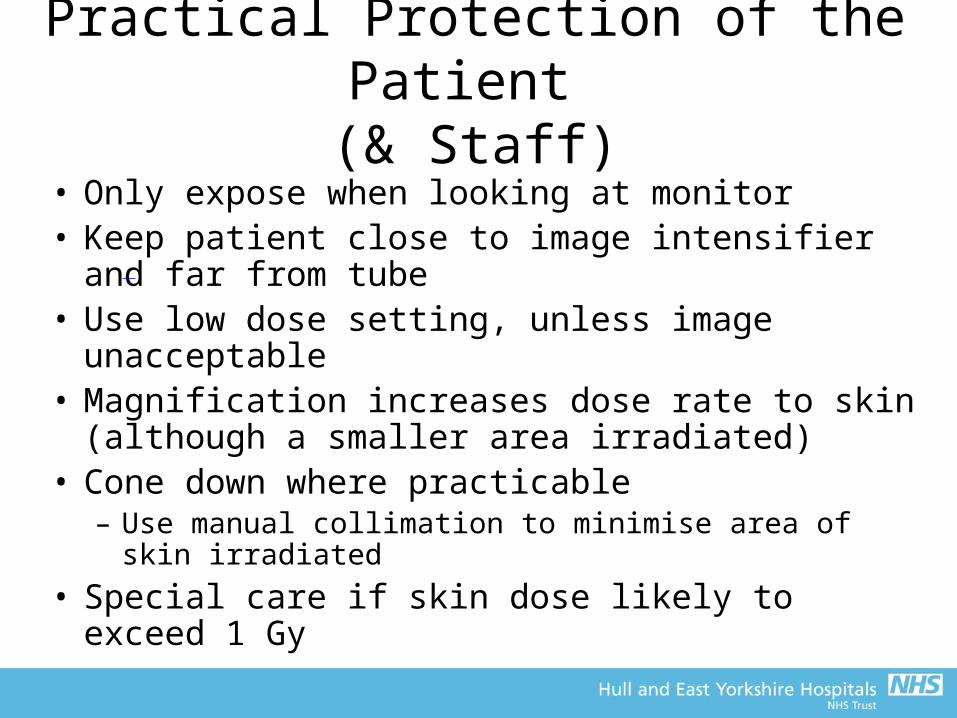
Practical Protection of the Patient (& Staff)
• Only expose when looking at monitor• Keep patient close to image intensifier and far
from tube• Use low dose setting, unless image unacceptable• Magnification increases dose rate to skin
(although a smaller area irradiated)• Cone down where practicable
– Use manual collimation to minimise area of skin irradiated
• Special care if skin dose likely to exceed 1 Gy

An aside on skin dose
An aside on skin dose…
• Fluoroscopically guided procedures are on the increase
• Whilst the risks to the patient are usually lower than the more invasive alternatives (or doing nothing at all!), the potential for radiation induced skin injuries needs to be considered (especially for repeated procedures)
• So what’s all the fuss about?...
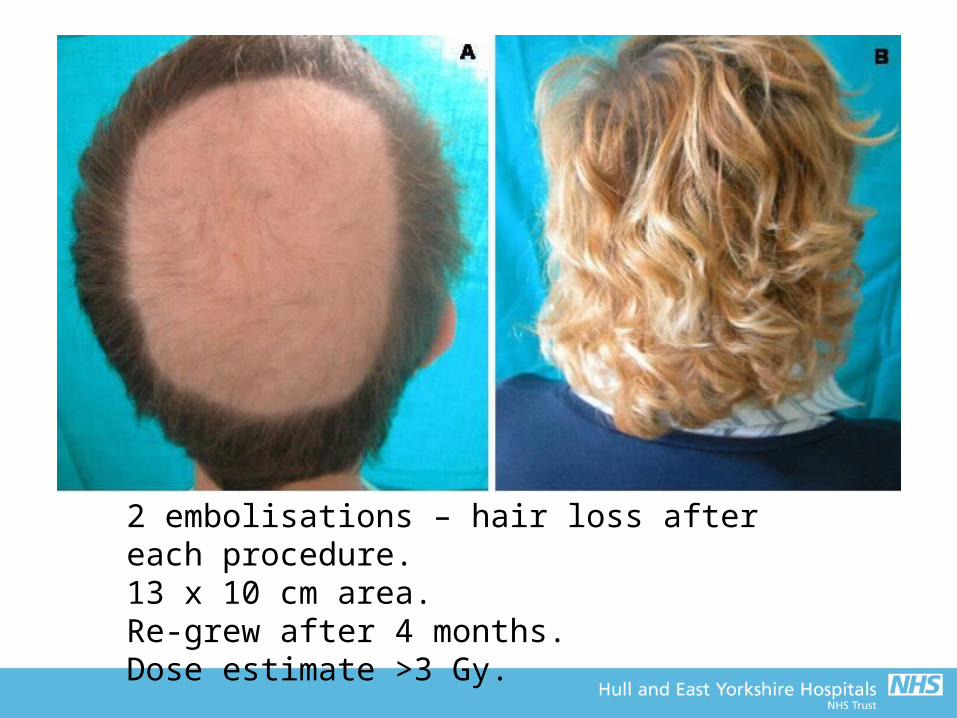
2 embolisations – hair loss after each procedure.13 x 10 cm area. Re-grew after 4 months.Dose estimate >3 Gy.
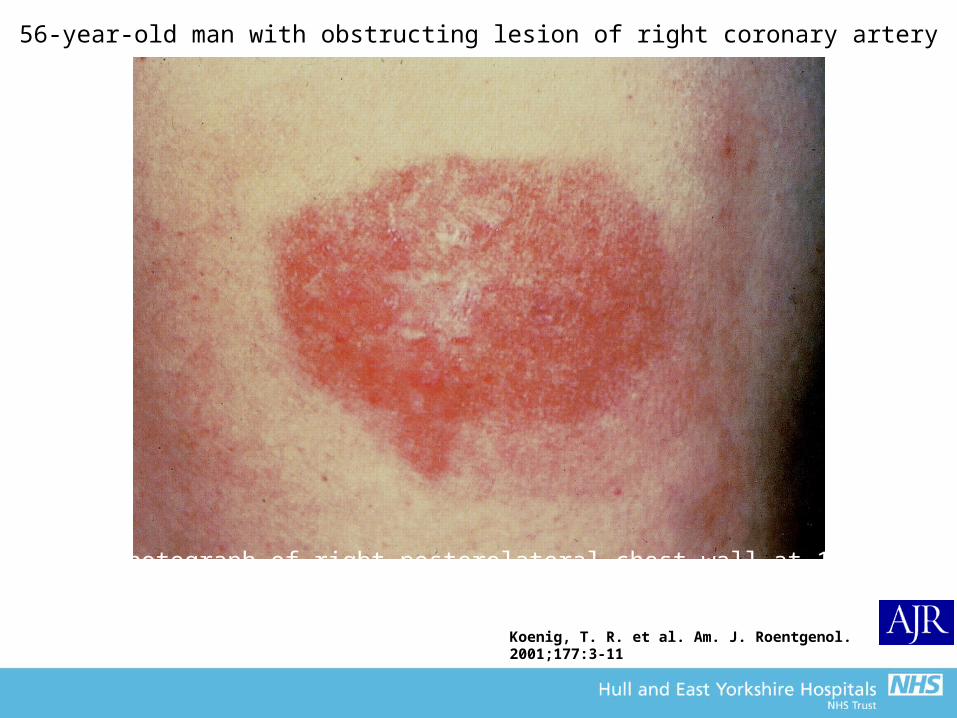
Koenig, T. R. et al. Am. J. Roentgenol. 2001;177:3-11
56-year-old man with obstructing lesion of right coronary artery
Photograph of right posterolateral chest wall at 10 weeks after PTCA
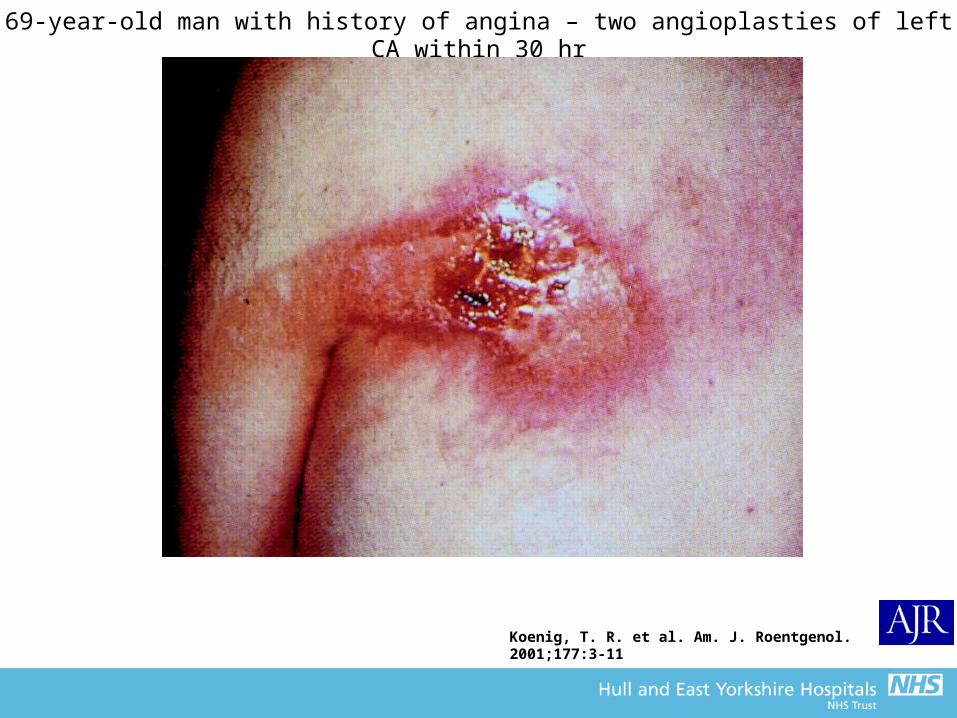
69-year-old man with history of angina – two angioplasties of left CA within 30 hr
1-2 months after last procedure – shows secondary ulceration over left scapula
Koenig, T. R. et al. Am. J. Roentgenol. 2001;177:3-11
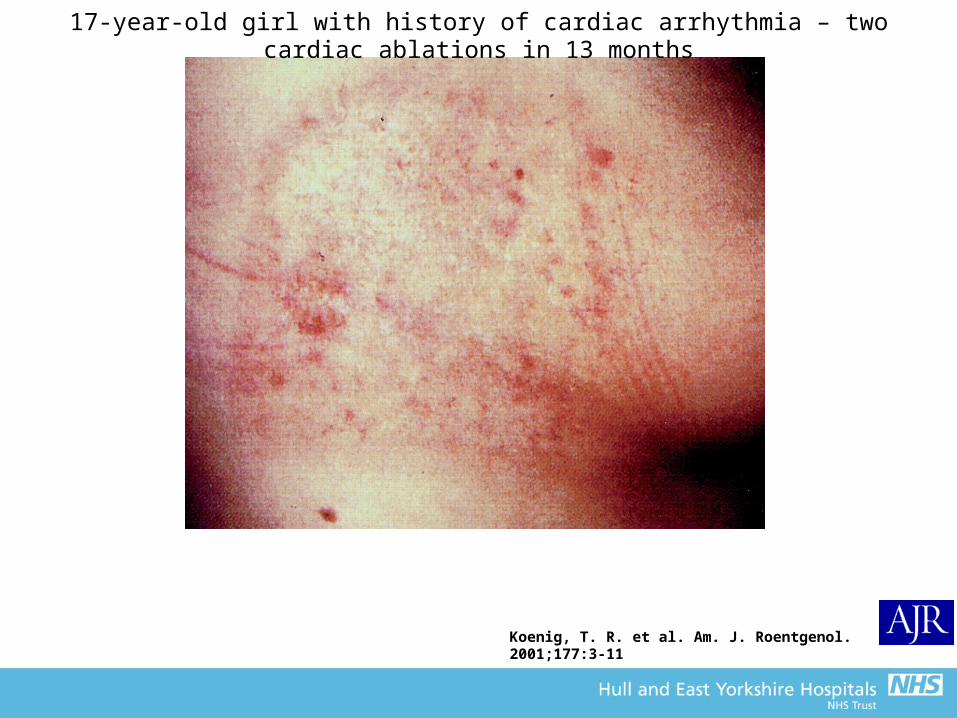
17-year-old girl with history of cardiac arrhythmia – two cardiac ablations in 13 months
2 years after last intervention shows atrophic indurated plaque with skin telangiectasia. Induration resulted in limited movement of right arm, and risk of breast cancer increased.
Koenig, T. R. et al. Am. J. Roentgenol. 2001;177:3-11
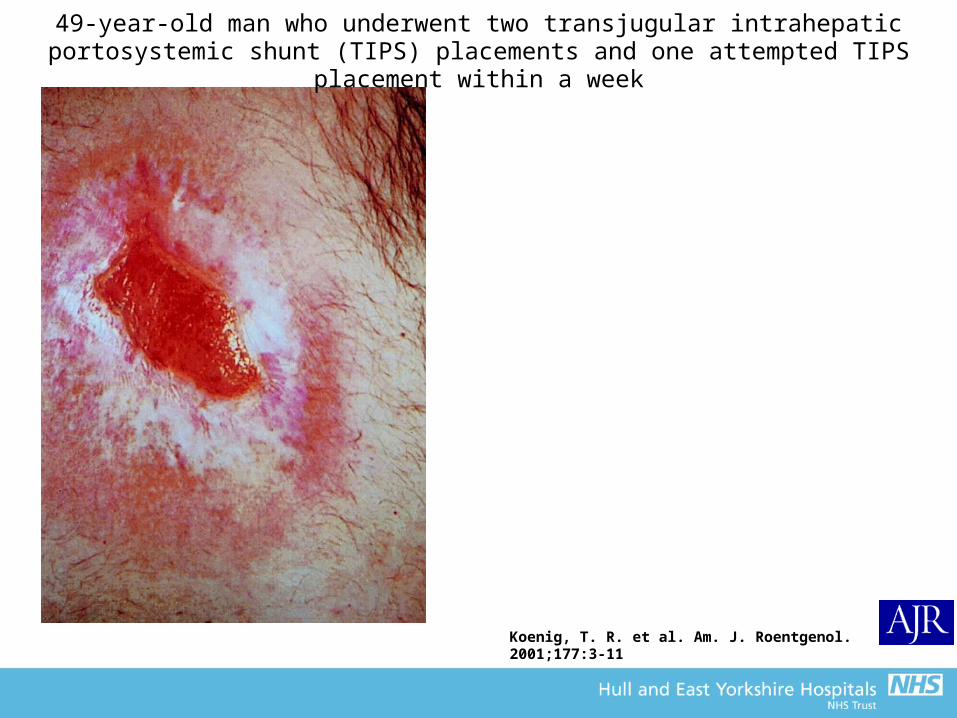
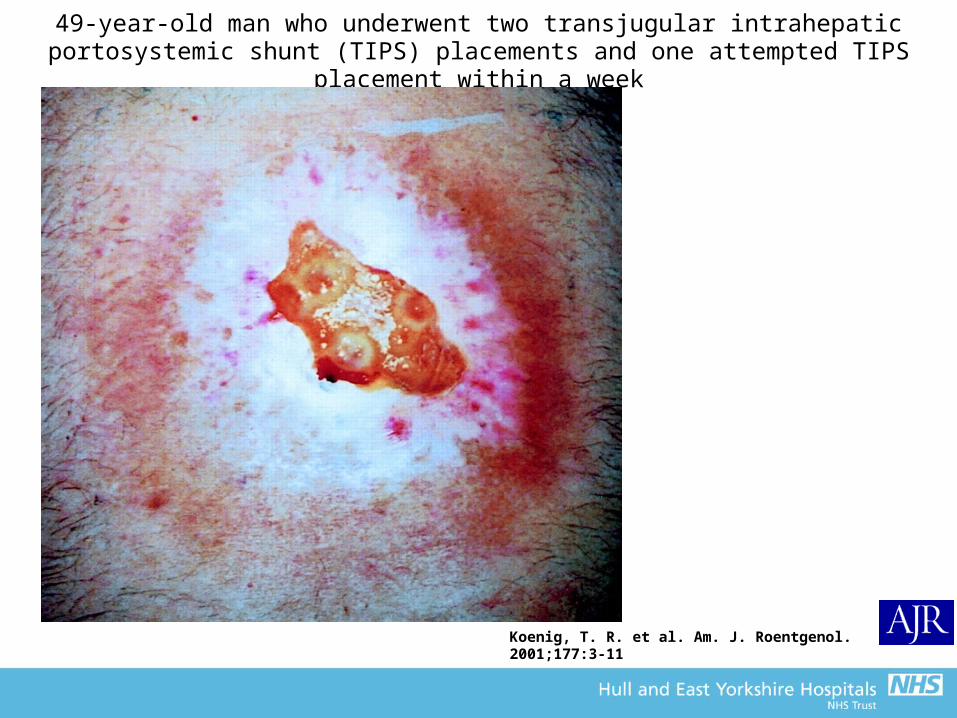
49-year-old man who underwent two transjugular intrahepatic portosystemic shunt (TIPS) placements and one attempted TIPS placement within a week
6 months – secondary ulceration with surrounding rings of de- and hyperpigmentation.
Koenig, T. R. et al. Am. J. Roentgenol. 2001;177:3-11
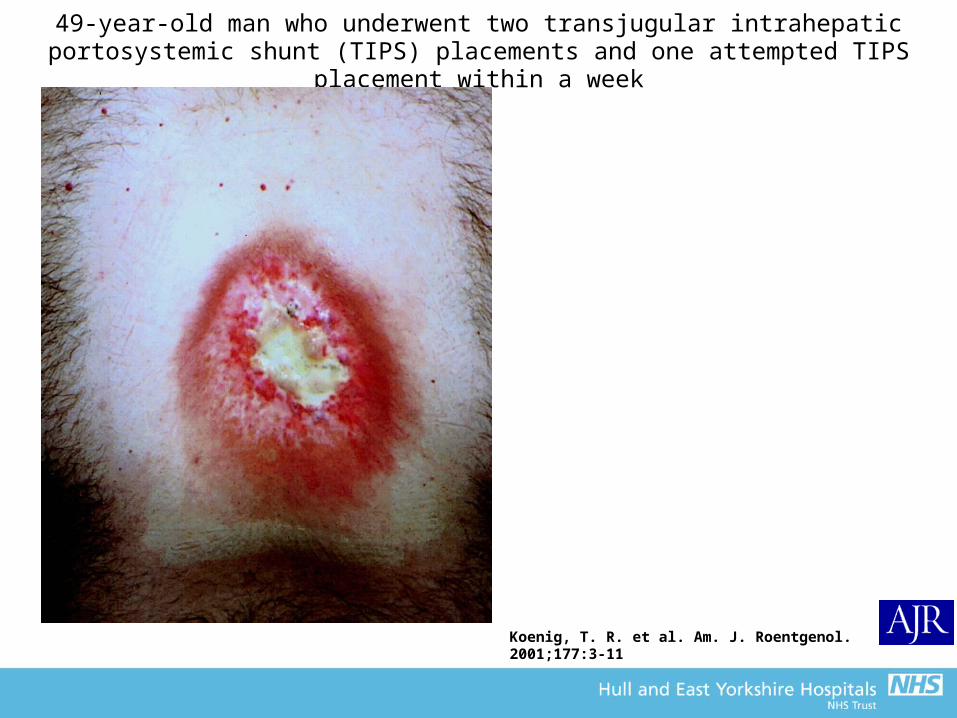
49-year-old man who underwent two transjugular intrahepatic portosystemic shunt (TIPS) placements and one attempted TIPS placement within a week
7.5 months – small blisters developed. Wound is very painful.
Koenig, T. R. et al. Am. J. Roentgenol. 2001;177:3-11
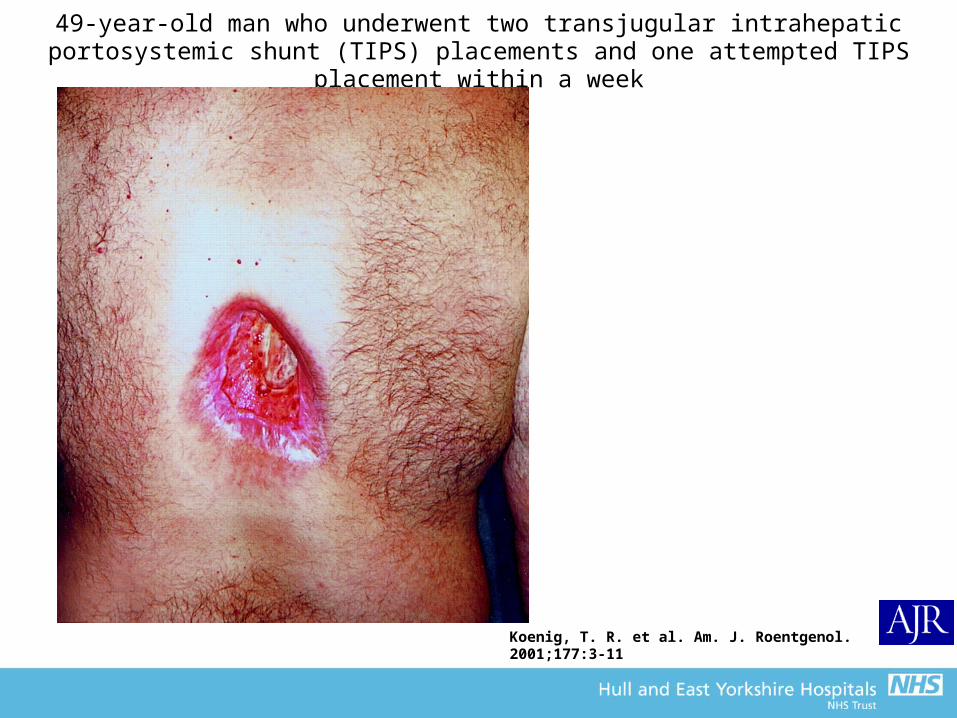
49-year-old man who underwent two transjugular intrahepatic portosystemic shunt (TIPS) placements and one attempted TIPS placement within a week
10 months – wound has progressed in size and depth.
Koenig, T. R. et al. Am. J. Roentgenol. 2001;177:3-11
49-year-old man who underwent two transjugular intrahepatic portosystemic shunt (TIPS) placements and one attempted TIPS placement within a week
22 months – non-healing ulcer with exposure of deep tissues, including spinous process of vertebra.
Koenig, T. R. et al. Am. J. Roentgenol. 2001;177:3-11

49-year-old man who underwent two transjugular intrahepatic portosystemic shunt (TIPS) placements and one attempted TIPS placement within a week
23 months – musculocutaneous skin grafting was performed. Disfigurement is permanent.
Koenig, T. R. et al. Am. J. Roentgenol. 2001;177:3-11
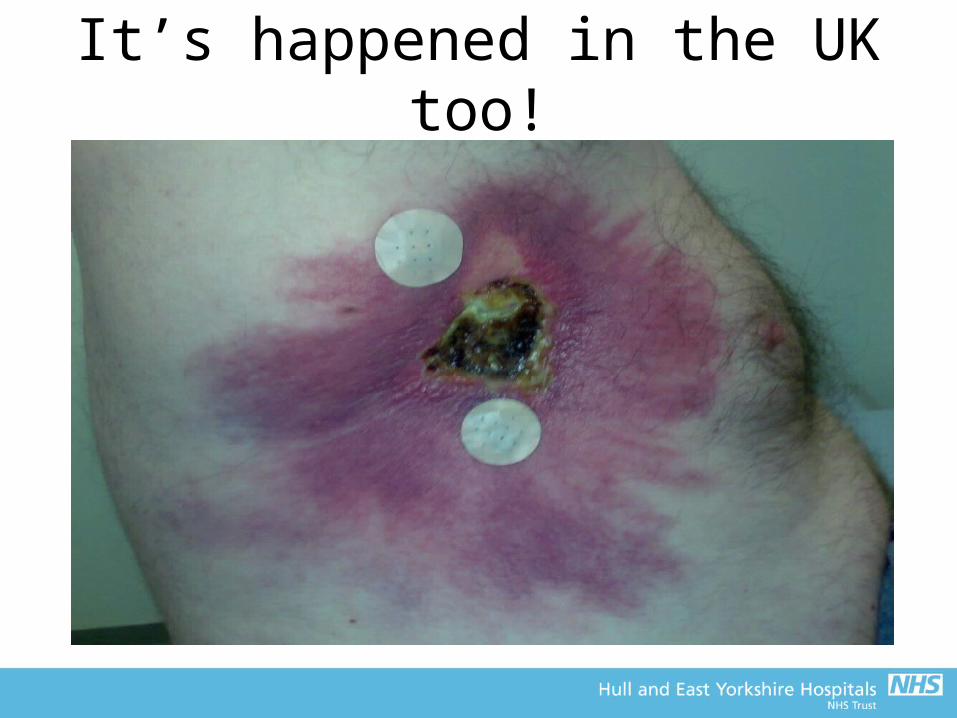
It’s happened in the UK too!
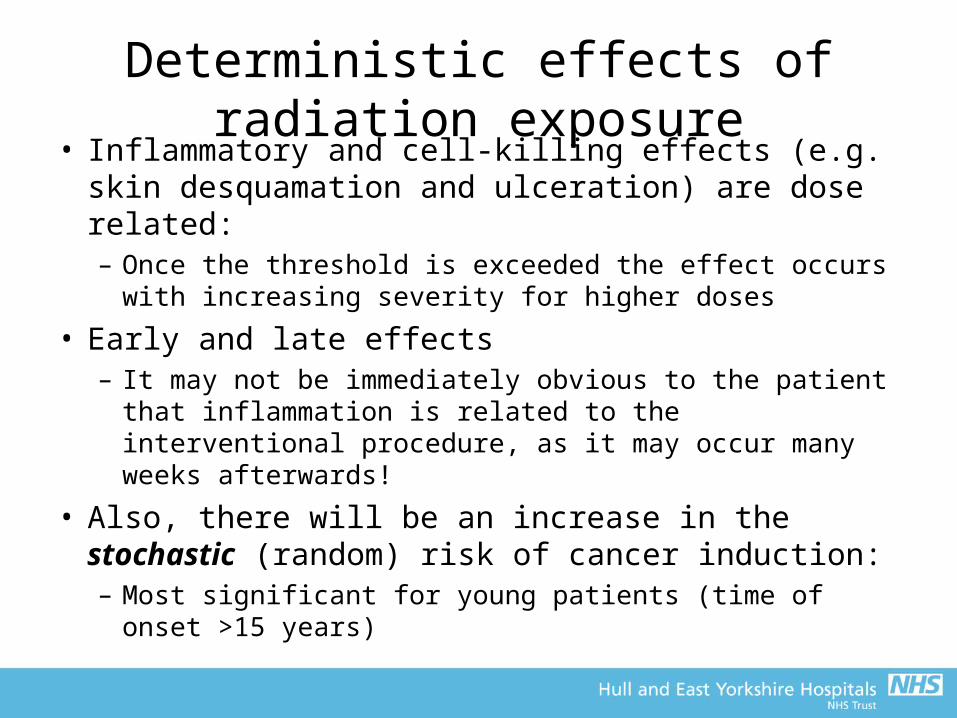
• Inflammatory and cell-killing effects (e.g. skin desquamation and ulceration) are dose related:– Once the threshold is exceeded the effect occurs with
increasing severity for higher doses
• Early and late effects– It may not be immediately obvious to the patient that
inflammation is related to the interventional procedure, as it may occur many weeks afterwards!
• Also, there will be an increase in the stochastic (random) risk of cancer induction:– Most significant for young patients (time of onset >15
years)
Deterministic effects of radiation exposure
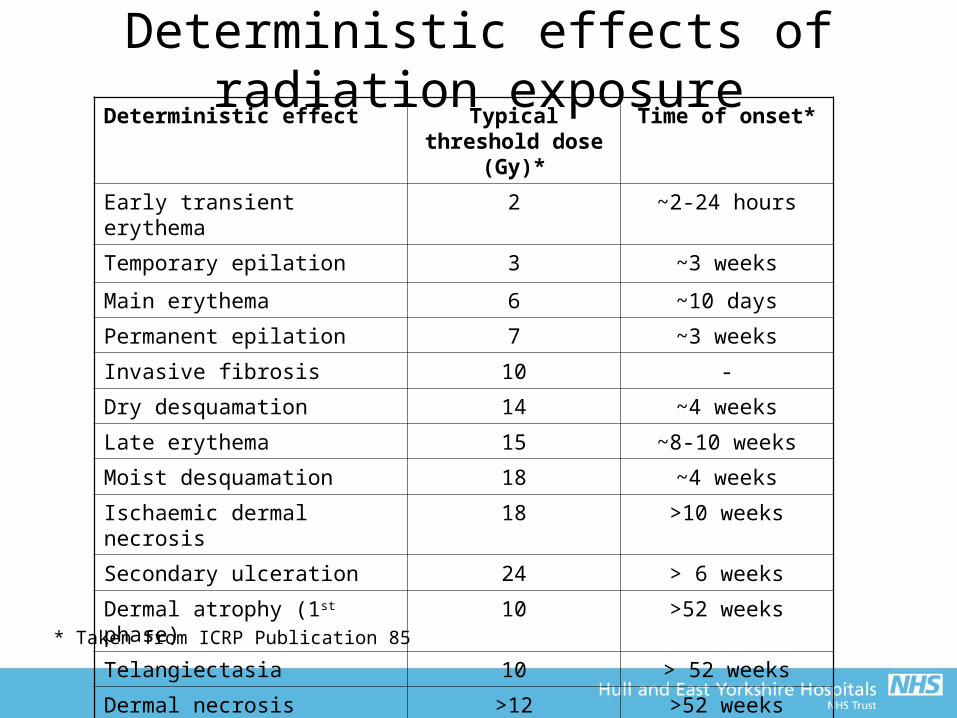
Deterministic effects of radiation exposureDeterministic effect Typical threshold
dose (Gy)*Time of onset*
Early transient erythema 2 ~2-24 hours
Temporary epilation 3 ~3 weeks
Main erythema 6 ~10 days
Permanent epilation 7 ~3 weeks
Invasive fibrosis 10 -
Dry desquamation 14 ~4 weeks
Late erythema 15 ~8-10 weeks
Moist desquamation 18 ~4 weeks
Ischaemic dermal necrosis 18 >10 weeks
Secondary ulceration 24 > 6 weeks
Dermal atrophy (1st phase) 10 >52 weeks
Telangiectasia 10 > 52 weeks
Dermal necrosis (delayed) >12 >52 weeks* Taken from ICRP Publication 85
(Back to fluoro equipment)Recording images
• The live fluoro image is rarely used for diagnosis– Difficult to analyse live images– Relatively poor image quality
• Must have a facility for recording images• Old systems have complex systems to record
the image– Position film into the beam
• Digital systems can store the signal from the detector– Known as fluorography
Recording images
• Simplest case is last image hold– The last frame acquired is left on the monitor after the
X-ray beam is switched off for review– May be sufficient quality for clinical task, so can
permanently store for reporting
• Digital spot images are single shot radiographs taken with high mA to give a low noise image– Higher dose per frame than fluoro– Stored on computer before being sent to PACS for
reporting
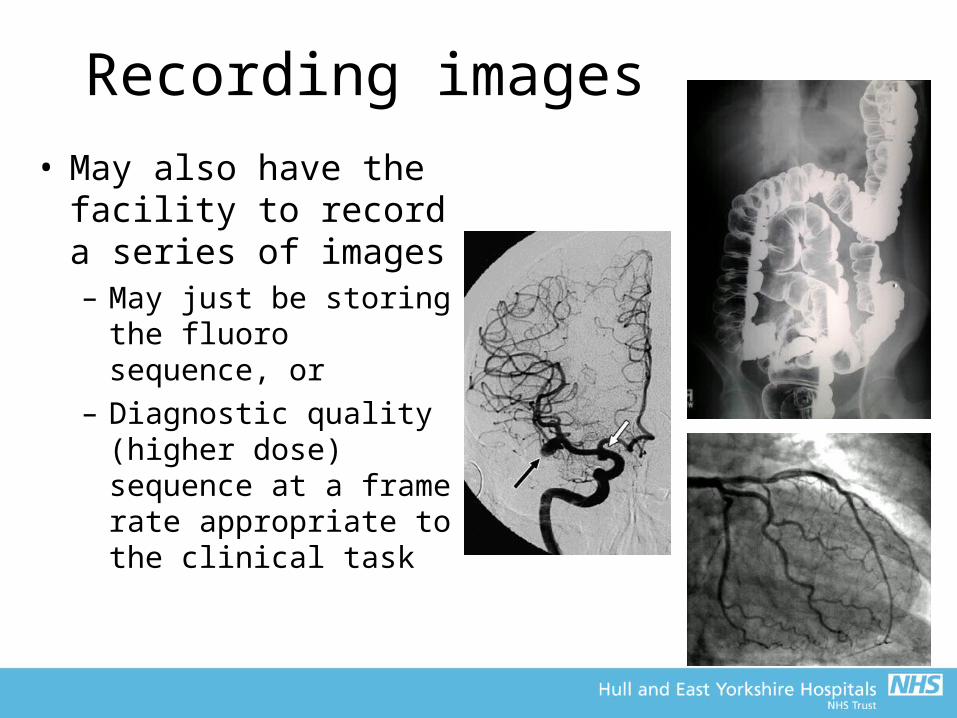
Recording images
• May also have the facility to record a series of images– May just be storing the
fluoro sequence, or– Diagnostic quality
(higher dose) sequence at a frame rate appropriate to the clinical task

Image Quality

Image quality
• Spatial Resolution– In the II, principally limited by spread of light in the
output phosphor– At the output of the II, ~4-5 lp/mm (better for magnified
images)– Resolution degraded by the TV system– CCD camera may have 1024 x 1024 pixels for a 350
mm field size. Hence, theoretical resolution ~1.7 lp/mm– Image on display monitor will be even lower than this;
• ~1.2 lp/mm for full field• ~3 lp/mm for magnified
Image quality• Noise
– Significant feature of fluoro images– Many stages of image formation – prone to noise– Influences contrast resolution– The ‘quantum sink’ (point in the imaging chain with
the fewest number information carriers) corresponds to the initial absorption of X-rays in the phosphor
– Hence, increasing II and camera gain will not improve SNR
– Noise can be reduced by;• Increasing input doses• Frame averaging – smooth by adding successive images at
the expense of temporal resolution

Image quality
• Veiling glare– Scatter effects in the II (mainly light at the output)
reduces contrast – dark regions appear lighter than they should
• Vignetting– The fall-off in brightness at the periphery of the image– Caused by the unequal collection of light at the centre
of the II compared with the light at its periphery– Centre of an II has better resolution, increased
brightness, and less distortion
Image quality• Distortions
– Generally not significant in the context of the whole (complex) imaging system and patient
– Pin-cushion • Magnification towards the edges results in straight
edges appearing curved• Due to divergence of X-ray beam and increased
distance travelled as a result of the curvature of the input screen
– S-distortion• Curvature on straight lines due to external
magnetic fields (e.g. the earth) influencing the electrons path through the II
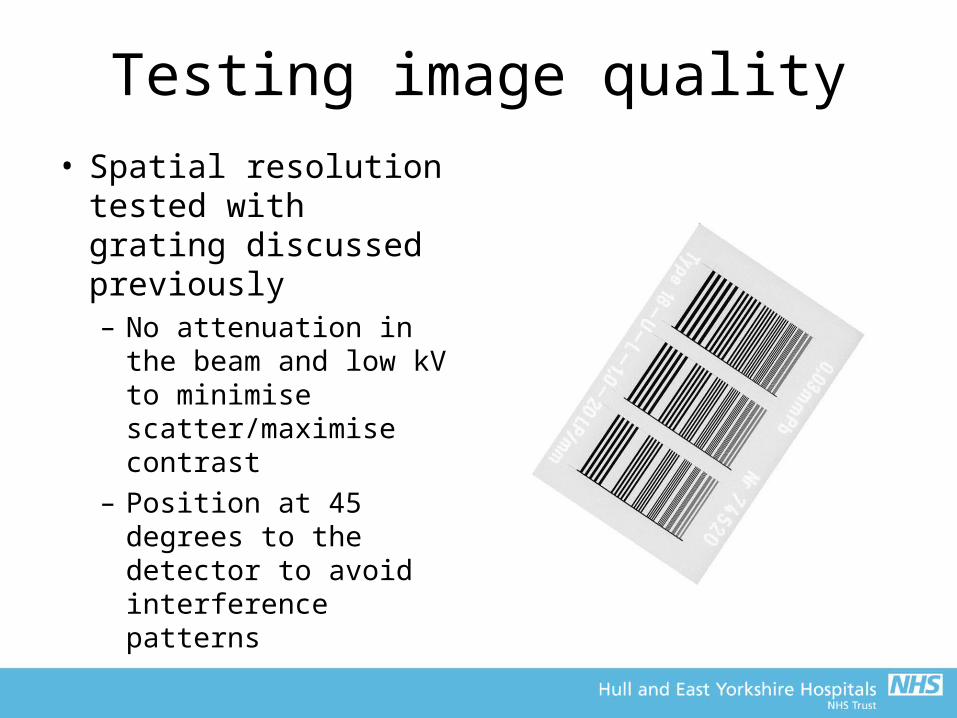
Testing image quality
• Spatial resolution tested with grating discussed previously– No attenuation in the
beam and low kV to minimise scatter/maximise contrast
– Position at 45 degrees to the detector to avoid interference patterns
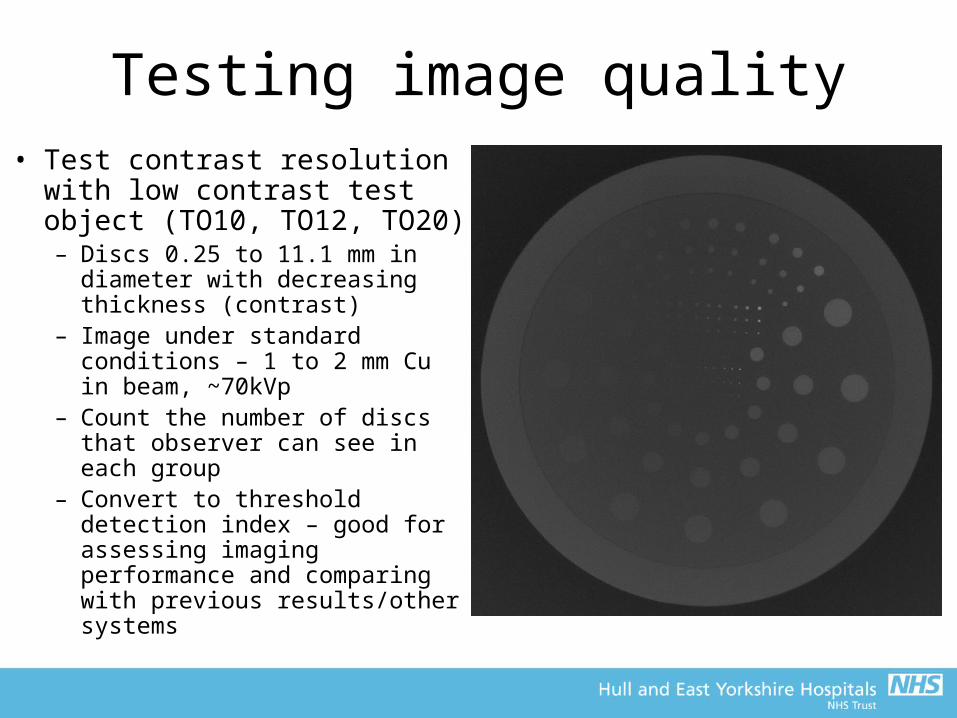
Testing image quality• Test contrast resolution with
low contrast test object (TO10, TO12, TO20)– Discs 0.25 to 11.1 mm in
diameter with decreasing thickness (contrast)
– Image under standard conditions – 1 to 2 mm Cu in beam, ~70kVp
– Count the number of discs that observer can see in each group
– Convert to threshold detection index – good for assessing imaging performance and comparing with previous results/other systems
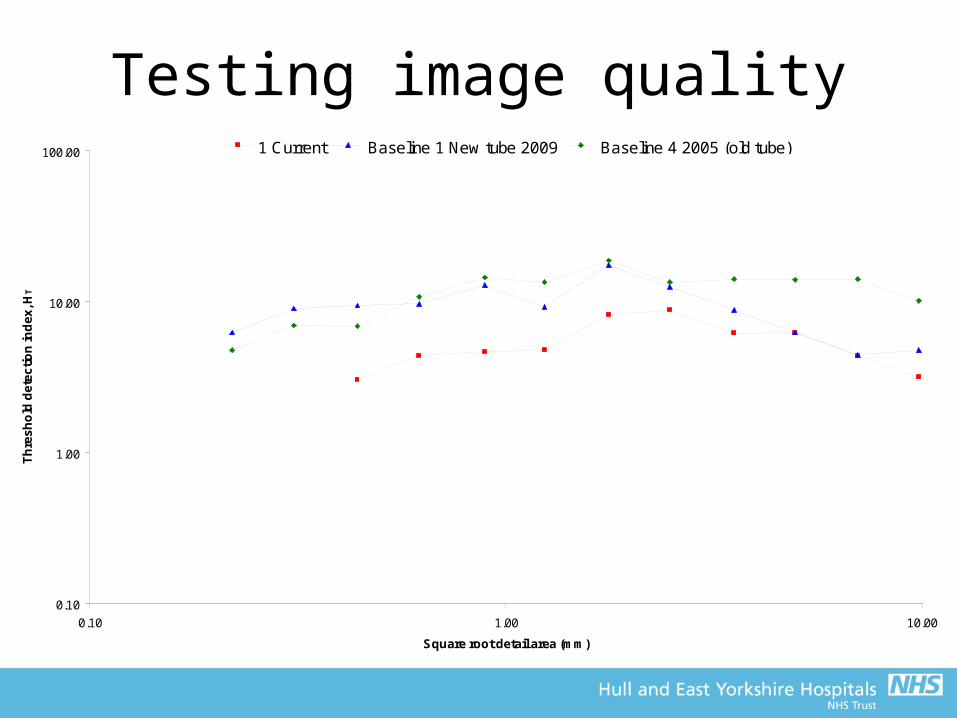
Testing image quality
0.10
1.00
10.00
100.00
0.10 1.00 10.00
Square root detail area (mm)
Th
res
ho
ld d
ete
cti
on
ind
ex
, HT
1 Current Baseline 1 New tube 2009 Baseline 4 2005 (old tube)

Flat Panel Fluoroscopy
Flat Panel Fluoroscopy• As with general radiography, flat panels are now used
on modern fluoroscopy systems– Phosphor coupled to a TFT – Indirect conversion– a-Se/TFT array – Direct conversion flat panels
• High quality dynamic and static image capture• No distortions like the II (as long as set up correctly)• Not able to do genuine magnification
– Resolution fixed by pixel pitch• Use Automatic Exposure Control (AEC) – set level of
exposure required for adequate image– Detector used to control the system– Doses generally (but not always) lower on modern flat panel
systems compared with II
Flat Panel Fluoroscopy• Increased dynamic range
– II has limited contrast ratio ~30:1– Flat panel may use full 14-bit depth
• Superior limiting spatial resolution to II– 3 lp mm-1 compared with 1-1.2 lp mm-1 for II (largest
field size)• Directly acquire the data in digital format• But, more expensive• Can be used for Cone Beam CT (essentially a
very wide multi-slice CT)– Poorer images compared with a ‘proper’ CT scanner

Digital Subtraction Angiography

Digital subtraction angiography (DSA)
• Object is to produce images of contrast filled vessels in isolation from other tissues
• Images of the same region are taken in rapid succession, before and after injection of a contrast medium
• Movement of patient is avoided between imaging sequences
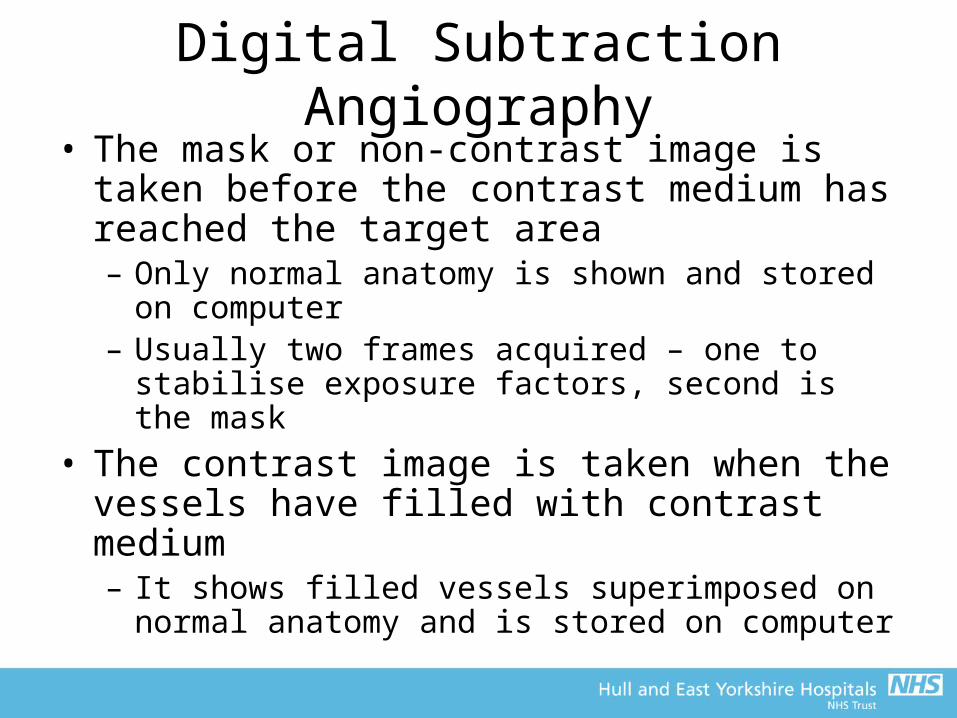
Digital Subtraction Angiography• The mask or non-contrast image is taken before
the contrast medium has reached the target area– Only normal anatomy is shown and stored on
computer– Usually two frames acquired – one to stabilise
exposure factors, second is the mask
• The contrast image is taken when the vessels have filled with contrast medium – It shows filled vessels superimposed on normal
anatomy and is stored on computer
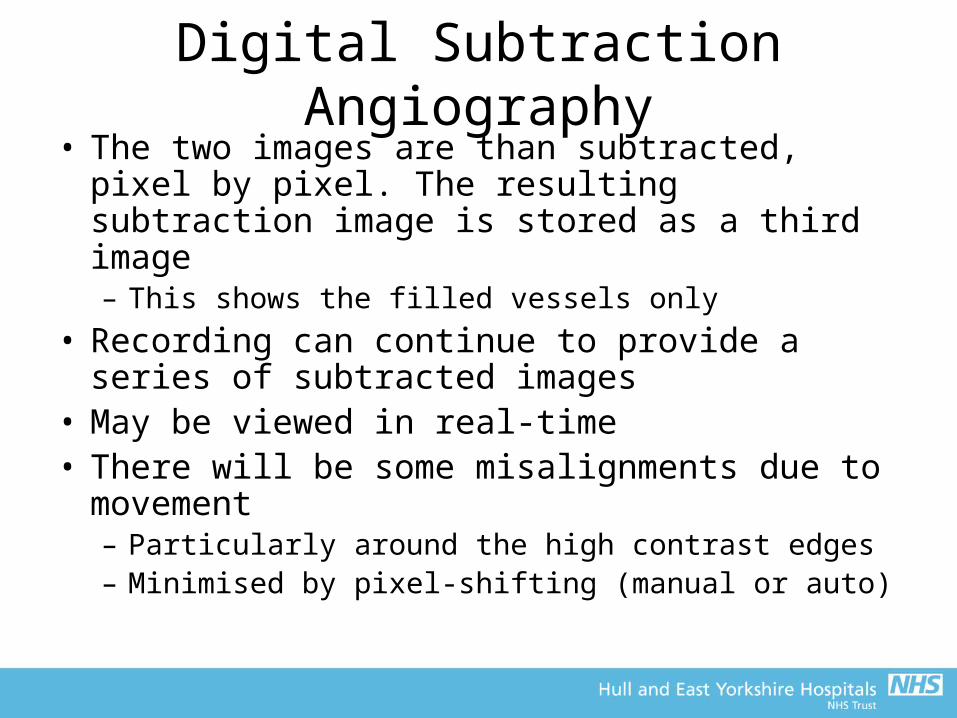
Digital Subtraction Angiography• The two images are than subtracted, pixel by
pixel. The resulting subtraction image is stored as a third image– This shows the filled vessels only
• Recording can continue to provide a series of subtracted images
• May be viewed in real-time• There will be some misalignments due to
movement– Particularly around the high contrast edges– Minimised by pixel-shifting (manual or auto)
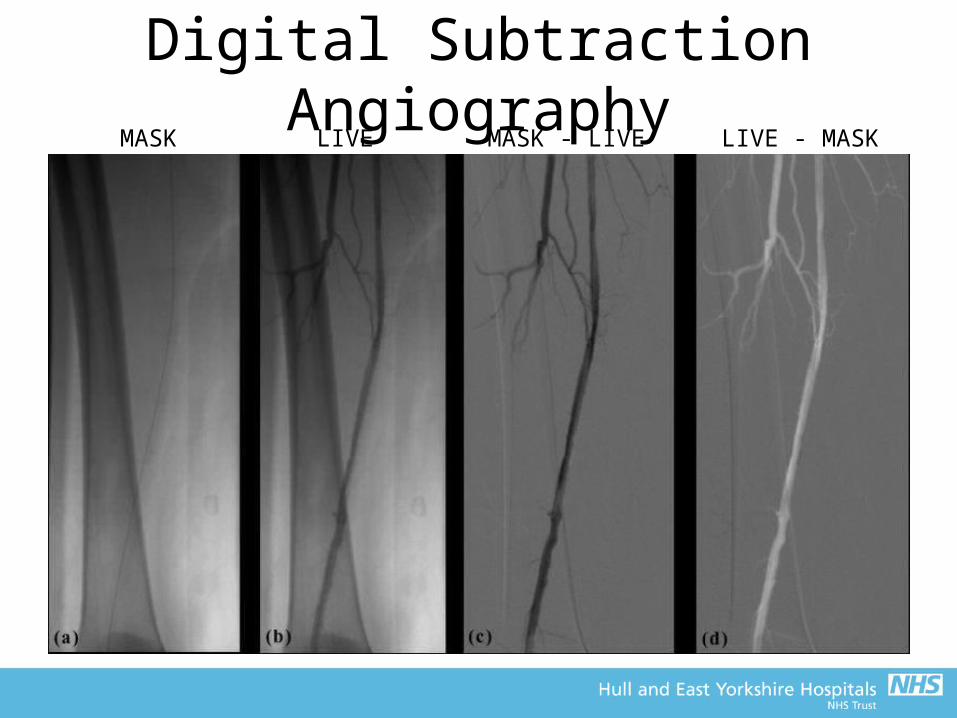
Digital Subtraction AngiographyMASK LIVE MASK - LIVE LIVE - MASK
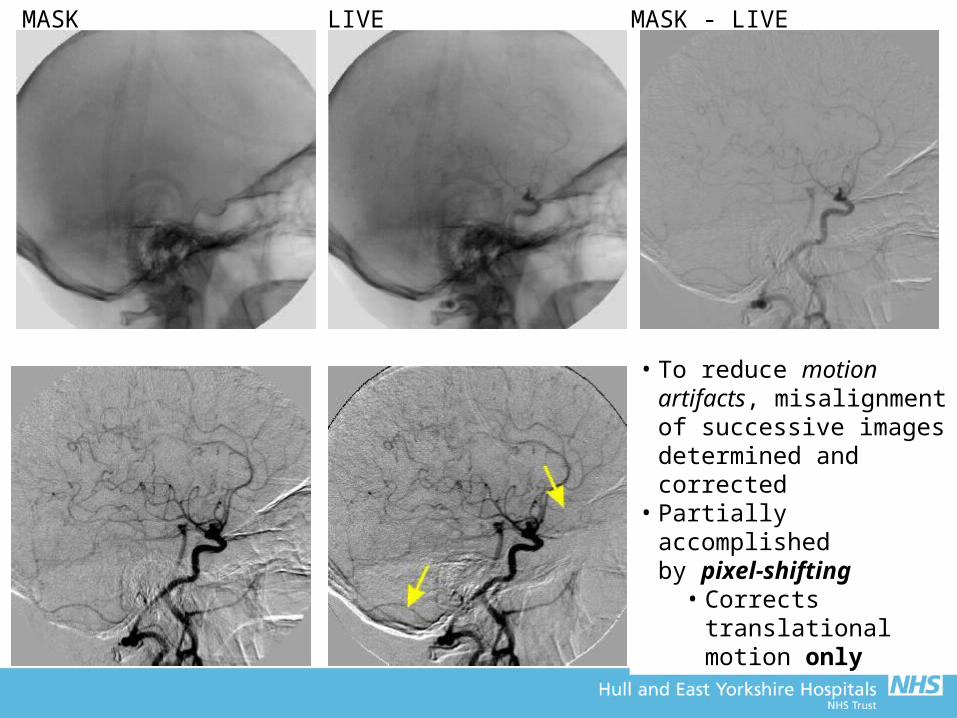
• To reduce motion artifacts, misalignment of successive images determined and corrected
• Partially accomplished by pixel-shifting
• Corrects translational motion only
MASK LIVE MASK - LIVE

Subtraction (or division?)
• Early DSA used linear subtraction of the images• However, due to exponential nature of X-ray
attenuation, this leaves a component of the original image behind
• A bit of maths…
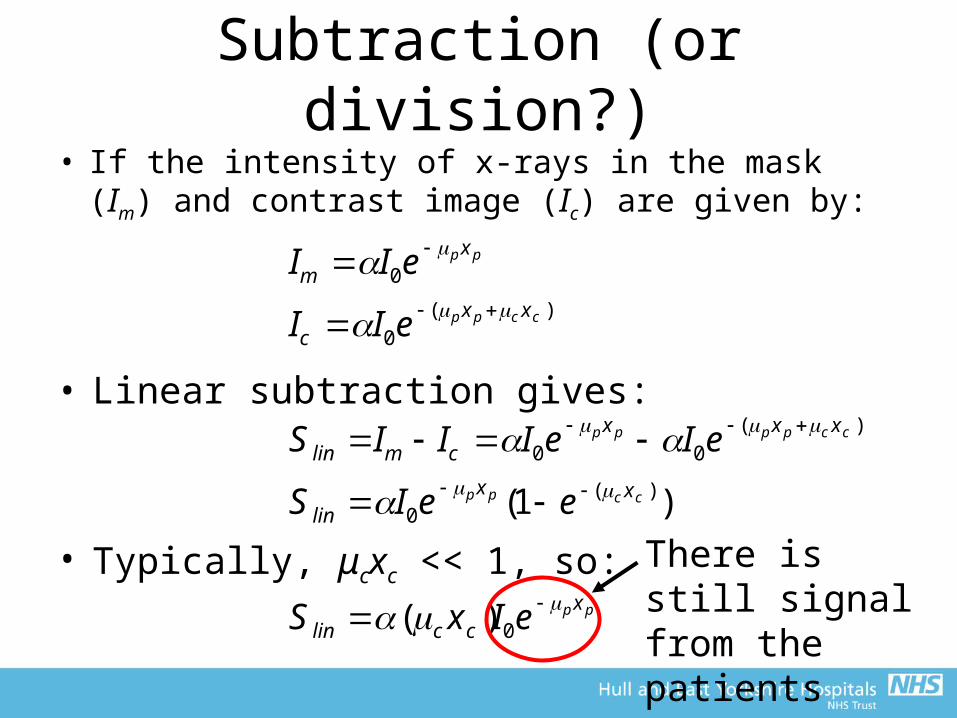
Subtraction (or division?)• If the intensity of x-rays in the mask (Im) and contrast
image (Ic) are given by:
pp
ccpp
ccpppp
ccpp
pp
xcclin
xxlin
xxxcmlin
xxc
xm
eIxS
eeIS
eIeIIIS
eII
eII
0
)(0
)(00
)(0
0
)(
)1(
• Linear subtraction gives:
• Typically, μcxc << 1, so: There is still signal from the patients anatomy!

Subtraction (or division?)• If logarithmic subtraction is performed;
• The subtraction image has no dependence on the initial mask image
• Logarithmic subtraction is mathematically equivalent to division (this is how it is performed in practice), but the name DSA has stuck!
cclin
ccppppccpppplin
xxxcmlin
xS
xxxxxxS
eIeIIIS ccpppp
))(()(
)ln()ln()ln()ln( )(00
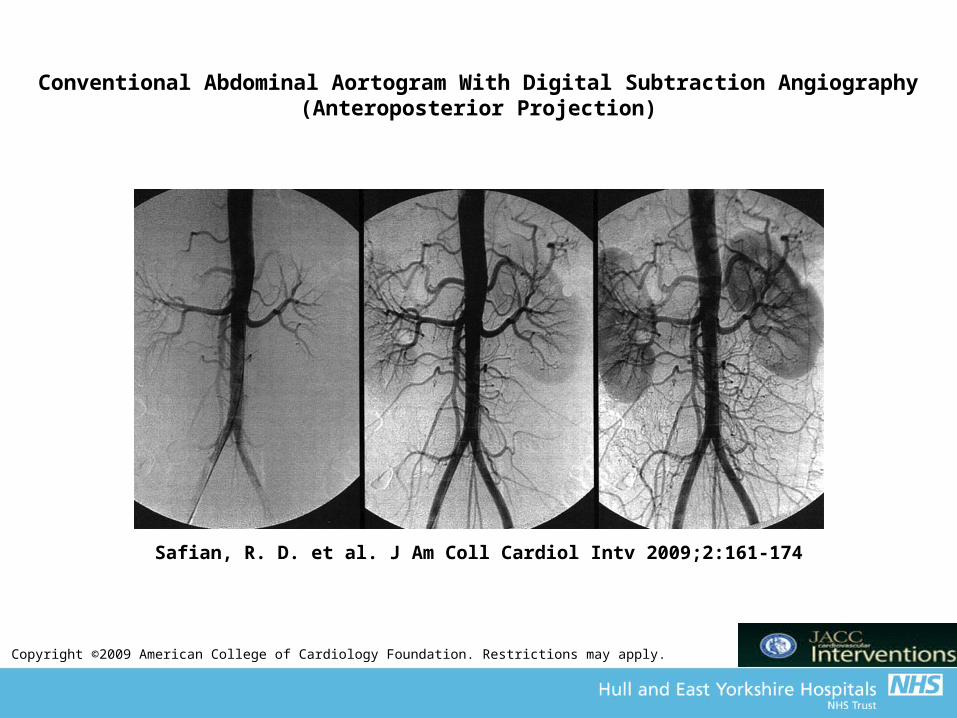
Copyright ©2009 American College of Cardiology Foundation. Restrictions may apply.
Safian, R. D. et al. J Am Coll Cardiol Intv 2009;2:161-174
Conventional Abdominal Aortogram With Digital Subtraction Angiography (Anteroposterior Projection)
DSA and Noise• Quantum noise in the subtraction image is greater
than noise in either the mask or contrast images– Signals subtract but noise reinforces, thus reducing
the SNR• Noise in the final image can be reduced by
obtaining and storing a sequence of such images and summing them pixel by pixel– Random noise tends to average out– Loose temporal resolution
• SNR increases with the square root of the number of images averaged
• Images acquired for subtraction tend to be higher dose to reduce quantum noise as much as possible

‘Large fields of view’• Not always possible to fit region of interest within a
single field of view– e.g. femoral arteries
• To avoid multiple exams and injections, acquire several masks/contrast images along the length using precise movements of the table and stitch together
• But, increased likelihood of motion between images
DSA technical requirements
• DSA generally requires:– A large field image intensifier (or flat panel) with good
contrast resolution– A stable TV system (if applicable)– X ray tube with small focal spot– A high voltage generator capable of giving a large
number of very short exposures in rapid sequence– A large tube current (mA) to reduce quantum noise
down to acceptable levels– Moving table with accurate positioning
Related Documents