FEDERAL E S E R V E BULLETIN MAY 1953 BOARD OF GOVERNORS OF THE FEDERAL RESERVE SYSTEM Digitized for FRASER http://fraser.stlouisfed.org/ Federal Reserve Bank of St. Louis

Welcome message from author
This document is posted to help you gain knowledge. Please leave a comment to let me know what you think about it! Share it to your friends and learn new things together.
Transcript
F E D E R A L E S E R V E
BULLETINMAY 1953
BOARD OF GOVERNORS
OF THE FEDERAL RESERVE SYSTEM
Digitized for FRASER http://fraser.stlouisfed.org/ Federal Reserve Bank of St. Louis

FEDERAL RESERVE BULLETINVOLUME 39 May 1953 NUMBER 5
UNITED STATES POSTWAR INVESTMENTIN LATIN AMERICA
United States long-term investment in theLatin American Republics has been increas-ing since World War II at a rate of about8 per cent a year, and the aggregate amountoutstanding was about 6.5 billion dollars atthe end of 1952. Direct investment—that is,private equity capital in enterprises that areowned or substantially controlled by UnitedStates investors—accounted for about 85 percent of this total, while 9 per cent representedloans by the United States Government, prin-cipally through the Export-Import Bank.The remaining 6 per cent included holdingsof Latin American dollar bonds, other long-term loans, and shares in enterprises whosecontrolling interest is retained abroad.United States investment in the capital andobligations of the International Bank forReconstruction and Development also con-tributed indirectly to additional dollar in-vestment in the area.
Latin America's share of this country'stotal outstanding foreign long-term invest-ment declined from about 25 per cent to 17per cent in the two years 1946-47, whenUnited States Government lending to Europewas extraordinarily large. This ratio hadincreased to about 19 per cent of the totalby the end of 1952.
More than half of the postwar additionsto investment in Latin America by UnitedStates entities and by the International Bank
appears to have been concentrated in Vene-zuela, Brazil, and Mexico. In the area as awhole, most of the increase was used inexpanding the petroleum and manufactur-ing industries. Investment in power andtransportation facilities, largely financed byExport-Import Bank and International Bankloans, accounted for about 10 per cent of thepostwar increase.
UNITED STATES INVESTMENT IN LATIN AMERICABill
1946 1948 1950 1952NOTE.—End of year figures, based on data from U. S. De-
partment of Commerce and IBRD. Annual estimates of privatedirect investment adjusted to the 1950 Census of Direct In-vestment. Figures for 1952 are preliminary.
MAY 1953 445
Digitized for FRASER http://fraser.stlouisfed.org/ Federal Reserve Bank of St. Louis

UNITED STATES POSTWAR INVESTMENT IN LATIN AMERICA
PRIVATE INVESTMENT
In contrast to the decade following WorldWar I, when a large part of United Statesprivate capital movements to Latin Americatook the form of investment in dollar bonds,no new Latin American issues have beenpublicly offered in the United States sinceWorld War II. Moreover, United Statesholdings of outstanding issues declined, prin-cipally through amortization and repatria-tion, from an estimated 470 million dollars(face value) at the end of 1945 to 320 mil-lion at the end of 1951. Since other port-folio holdings also declined, the entire post-war increase in private capital outstandingreflected a growth in direct investment.
Postwar additions to United States directinvestment in Latin America, includingreinvested earnings, ranged from 148 mil-lion dollars in 1946 to 576 million in1949. The largest additions — averaging550 million a year—occurred in the period1947-49 when investment in Venezuela'spetroleum industry was heavy. Increasesin direct investment averaged 350 milliondollars a year in 1950 and 1951 and it appearsthat this rate was at least equaled in 1952.
Earnings retained in Latin America bysubsidiaries of United States companies havefinanced approximately two-fifths of directinvestment undertaken since the war. Anadditional part has been financed from earn-ings of branches of United States companies;however, available data do not distinguishbetween the amount of such investment andthe amount financed by new United Statesprivate capital. Reinvested earnings of sub-sidiaries represented less than a third of ad-ditional investment in the period prior to1950, as compared with over half (pre-liminary data) in 1950 and 1951.
Distribution of direct investment. Anindication of postwar changes in the dis-tribution of United States direct investment
446
in Latin America is provided by the twomost recent censuses of United States for-eign direct investment, for 1943 and 1950.Available data indicate that over 90 per centof additional investment between these twoyears occurred after the war.
Additional funds were invested in allmajor industries in Latin America between1943 and 1950. As the chart shows, thepetroleum and manufacturing industries re-ceived the major share and moved to firstand third place, respectively, in rank basedon total capital outstanding. Transportationand public utilities dropped from first place,with 32 per cent of United States direct in-vestment in 1943, to second place with 22per cent of the total in 1950. Investmentin agriculture and in mining and smelt-ing also declined relatively over the period.
UNITED STATES DIRECT INVESTMENTIN LATIN AMERICA, 1943 AND 1950
BY INDUSTRY 0
PETROLEUM
TRANSPORTATION& PUBLIC UTILITIES
Millions of Dollars
400 800 1200 1600
OTHIR COUNT*IIS
1600400 800 1200Millions of Dollars
NOTE.—Based on census da».a trom U. S. Departments ofCommerce and Treasury. Other countries include the remain-ing 14 Latin American republics.
FEDERAL RESERVE BULLETIN
Digitized for FRASER http://fraser.stlouisfed.org/ Federal Reserve Bank of St. Louis

UNITED STATES POSTWAR INVESTMENT IN LATIN AMERICA
The geographic distribution of direct in-vestment in Latin America also changedsubstantially from 1943 to 1950. Direct in-vestment more than doubled in Brazil, CostaRica, Panama, Uruguay, and Venezuela, andalmost doubled in Peru. It declined, how-ever, in Argentina, Bolivia, Haiti, and Para-guay. Increases occurred in the remainingten republics but they were less than thearea average of 72 per cent.
Factors affecting private investment. Ingeneral, changes in conditions of world de-mand and supply during the postwar periodincreased incentives for additional UnitedStates and other foreign private investmentin Latin America, particularly in the de-velopment of raw materials. Because con-ditions that affect the security and profitabil-ity of foreign investment varied widely,however, countries that seemed to have therequisite natural resources did not neces-sarily experience the largest increases in di-rect foreign investment.
Restraining influences on private invest-ment in Latin America have taken a varietyof forms, ranging from the absence of ade-quate facilities for power, transportation, andcommunications, to strong nationalistic tend-encies that have adversely affected foreign-owned enterprises. Of special significance ina number of countries have been the adverseeffects of inflation, discriminatory exchangerates, and exchange controls. These effectshave been greatest in export industries andin such industries as public utilities whichare subject to price and rate controls.
Exchange controls and discriminatory ex-change practices have affected incentives tonew foreign private investment also by re-stricting earnings transfers and by limitingcertain capital transactions to unfavorableexchange rates. A part of the postwar in-vestment in manufacturing, however, prob-ably resulted from certain types of trade con-
MAY 1953
trols and exchange restrictions that wereintroduced primarily for limiting imports.Such practices apparently induced someUnited States companies to construct facili-ties in Latin America for the local produc-tion of commodities whose importation wasprohibited or held under strict control. Ina few cases, exchange controls have alsotended to increase temporarily the apparentlevel of direct investment in Latin Americaby preventing the remittance of earningsto parent companies in the United States.
Venezuela was noteworthy among theLatin American countries that attracted for-eign private capital and it received over 30per cent of additional United States directinvestment in Latin America between 1943and 1950. Most of this increase went intothe petroleum industry, where the participa-tion of foreign private capital has been offi-cially encouraged since the discovery ofVenezuelan oil in 1918. However, Vene-zuela's official policy toward foreign privatecapital, coupled with monetary and exchangestability and the absence of restrictions oncurrency convertibility, was also reflected inthe growth of United States direct invest-ment in other industries. This growthamounted to more than 100 million dollars,or over 300 per cent, between 1943 and 1950.
Although the combination of profitableinvestment opportunities and a favorableclimate for foreign capital has not existedin other Latin American countries to thesame extent that it has in Venezuela, markedimprovements in investment conditions havetaken place in a number of countries duringrecent years. Colombia and Peru have re-cently enacted petroleum laws that are simi-lar in a number of respects to the Venezuelanlegislation. They also have provided addi-tional inducements to foreign investors pri-marily through the removal of almost allrestrictions on the movements of foreign-
447
Digitized for FRASER http://fraser.stlouisfed.org/ Federal Reserve Bank of St. Louis

UNITED STATES POSTWAR INVESTMENT IN LATIN AMERICA
owned capital. Other countries have pro-vided special inducements to certain typesof investment by offering tax and tariff con-cessions, by granting certain exchange privi-leges, and by relaxing restrictions on thekinds of investment that foreigners canmake. Several countries have also indicatedan interest in promoting wider dissemi-nation in the United States of informationconcerning investment opportunities.
Loans by the International Bank and theExport-Import Bank for the development oftransportation, communications, and powerfacilities may serve to enhance future oppor-tunities for private investors.
UNITED STATES GOVERNMENT INVESTMENT
The flow of capital from the United StatesGovernment to Latin America since thewar has been almost entirely in the formof Export-Import Bank loans. Other credits,related principally to surplus property salesand the sale of merchant ships, have beenrelatively small. In addition, various formsof technical aid have been provided underUnited States Government grants.
The Export-Import Bank has engaged inbroad lending activities in Latin Americaserving such widely different purposes asgeneral economic development, balance ofpayments assistance, and the expansion ofstrategic materials supplies for mutual de-fense. Most of the Bank's lending in thisarea has been undertaken on a project basisand for general developmental purposes.The Bank's loans, which are intended tosupplement private capital, have been madeboth to foreign governments and to privateborrowers, including foreign subsidiaries ofUnited States corporations. Loans to privateborrowers have been made both with andwithout the guarantee of the government ofthe country where the investment is made.
In the seven years ending last December,
448
the Bank authorized loans for Latin Americatotaling 863 million dollars, disbursed 593million under these and earlier authoriza-tions, and received repayments totaling 240million. Although net disbursements variedfrom year to year, they represented a sus-tained capital contribution and showed atendency to attain higher levels toward theend of the period. Since the period of heavyoutlays for European reconstruction prior to1948, Latin America has received nearly halfof the Bank's net disbursements to all areas.As the table shows, undisbursed credits stillavailable to Latin America at the end of1952 totaled 379 million dollars.
Most of the Bank's disbursements in LatinAmerica have been made to Argentina,Brazil, Chile, and Mexico. In Latin Amer-ica as a whole, disbursements have beenutilized primarily for expanding and im-proving transportation and manufacturingfacilities. Most of the funds provided fortransportation were invested in Mexico andBrazil, largely for railway improvements.
LOANS TO LATIN AMERICA BY EXPORT-IMPORT BANK AND
INTERNATIONAL BANK FOR RECONSTRUCTION
AND DEVELOPMENT, 1946-52
[In millions of dollars]
Country
Argentina...BrazilChileColombia. . .CubaMexicoVenezuela...Other Latin
America. .
Total
Export-Import Bank
Au-thor-iza-
tions
130258
765112
22115
100
863
Disburse-ments 1
Gross
9790
1114412
15910
70
593
Net
97366922
— 180
6
44
353
Undis-bursed
balance,Dec. 31,
1952 2
5190
922
697
4
46
379
International Bankfor Reconstructionand Development
Au-thor-iza-
tions
1431755
90
60
365
Grossdis-
burse-ments
961323
48
18
U 9 8
Undis-bursed
balance,Dec. 31,
1952 3
475
32
33
41
157
1 Includes disbursements under loans authorized prior to 1946.2Excludes cancellations and expirations. Includes undisbursed
balance of 5.4 million dollars from loans authorized prior to 1946.3Excludes cancellations of 9.5 million dollars from credits to
Mexico and of 0.1 million from credits to Colombia.4Net disbursements totaled 197 million dollars; repayments of
0.5 million each were made by Chile and Colombia.NOTE.—Derived from Export-Import Bank and IBRD data.
Details may not add to totals because of rounding.
FEDERAL RESERVE BULLETIN
Digitized for FRASER http://fraser.stlouisfed.org/ Federal Reserve Bank of St. Louis

UNITED STATES POSTWAR INVESTMENT IN LATIN AMERICA
The largest disbursements in the field ofmanufacturing were for equipment for theChilean steel industry, while other disburse-ments in this field were made for variousprojects primarily in Mexico and Brazil.Outlays for electric power development weredevoted largely to projects in Mexico.
A number of the Bank's more recentLatin American loans have been made inconnection with the development of sourcesof strategic materials for mutual defense.At the end of 1952, 110 million dollars ofthese credits remained to be utilized. Mostof this amount is destined for developmentof manganese ore deposits in Brazil.
Three of the Bank's postwar loans to LatinAmerica were not of the project type. Onewas a balance of payments credit of 25 mil-lion dollars extended to Chile in 1949 fol-lowing a sharp decline in the price of copper,the country's principal export. The purposeof the loan was to finance general importsof equipment, materials, and services, onorder in the United States, which weredeemed essential for continuation of theChilean economic development program.
In 1950 a loan of 125 million dollars wasgranted to Argentina to liquidate past-duedollar obligations to United States com-mercial creditors. This loan was occasionedprimarily by large postwar Argentine tradedeficits with the United States which wereaccompanied by a severe decline in Argen-tine gold and dollar reserves. Actual dis-bursements totaled 96.5 million dollars. Re-payment is scheduled to begin next year andto be completed in 1963.
In February of this year the Bank ap-proved a 300 million dollar credit to Brazil(not included in the table on page 448)which, like the loan to Argentina, is to beused for liquidating past-due obligations toUnited States exporters. The loan is to berepaid over a period of three years.MAY 1953
INVESTMENT THROUGH THE INTERNATIONAL
BANK FOR RECONSTRUCTION AND
DEVELOPMENT
During the postwar period United Statescapital has also been invested abroad indi-rectly through loans made by the Inter-national Bank for Reconstruction and De-velopment. As a member of the Bank, theUnited States Government has paid in 635million dollars on its subscription to theBank's capital. In addition, private in-vestors in the United States have suppliedmost of the 633 million dollars in loanablefunds which the Bank has obtained throughthe sale of its own and borrowers' obliga-tions on private capital markets.
With the exception of four European re-construction loans, the Bank's lending op-erations have been devoted to basic develop-mental projects in less developed areas.These operations have been noteworthy forthe emphasis placed on evaluating loanprojects in relation to the borrowing coun-try's over-all development requirements. Ac-cording to the Bank's statutes, all loans areguaranteed by the member government inwhose territory the investment is made.
By the end of 1952, the Bank's Latin Amer-ican loan authorizations totaled 365 mil-lion dollars, while disbursements totaled 198million. More than three-fourths of bothauthorizations and disbursements repre-sented loans to Brazil, Mexico, and Colombia.
By far the largest share of the Bank'sLatin American loans has been devoted toelectric power development, as is shown inthe chart on the next page. In this field,which has declined in importance as anattraction for private investors, the Bank'scommitments to the area at the end of 1952totaled 277 million dollars. Over half ofthese commitments have been disbursed,principally to Brazil and Mexico.
The Bank's remaining Latin American449
Digitized for FRASER http://fraser.stlouisfed.org/ Federal Reserve Bank of St. Louis

UNITED STATES POSTWAR INVESTMENT IN LATIN AMERICA
LOAN DISBURSEMENTS OF EXPORT-IMPORT BANKAND IBRD TO LATIN AMERICATOTAL 1946-52, BY INDUSTRY
Millions of Dollars
0 50 100 150 200 250
TRANSPORTATION
MANUFACTURINGA TRADI
AGRICULTURI
MINING ASMILTINO
FURLIC UTILITIES
MTROLEUM
Expert-Import Rank
PQOOQQQQOOOOOOOOOOOOC
50 100 150 200Millions of Dollars
2 5 0
NOTE.—Derived from Export-Import Bank and IBRD data.Excludes disbursements of 120 million dollars under balanceof payments loans to Argentina and Chile, and disbursementsof 29 million for miscellaneous purposes.
loans were made principally for the improve-ment of transportation facilities in Brazil,Colombia, Nicaragua, and Peru. At the endof last year, 47 million dollars remained un-disbursed on such loans. Loans for farmmechanization, irrigation, and other agricul-tural improvements totaled 17 million dol-lars, with 10 million disbursed.
CONCLUSION
The level of United States investment inLatin America has been increasing since1945 at a rate which would double the totalamount in a ten-year period. The nature aswell as the volume of this investment hasbeen such as to contribute materially towardsaccelerating the area's economic develop-ment. Loans by the Export-Import Bankand the International Bank are financing theexpansion of basic facilities that tend to in-crease investment opportunities for bothdomestic and foreign private capital. Thepostwar flow of private United States capital,
moreover, has been almost exclusively in theform of direct investment which is generallyaccompanied by technical and managerialskills.
Opportunities for the profitable invest-ment of private capital in Latin Americahave been affected favorably during the post-war years by developments that tended toincrease world demand for commodities pro-duced in Latin America and to reduce theiravailability from alternative sources. Otherfactors, however, tended to restrain effectivedemand for Latin America's products andto create impediments to foreign private in-vestment. These included currency incon-vertibility and a wide variety of exchangeand trade controls in Latin America and inmost of the nondollar area.
Future prospects for private investmentin Latin America will depend to a consider-able extent on world political developmentsand on the ability of major industrial areasto sustain high levels of employment andoutput. Continued growth in world produc-tion and the relaxation of exchange and traderestrictions would contribute to further in-creases in the demand for Latin America'sproducts. In these circumstances, addi-tional incentives would be offered for invest-ment in industries supplying both the foreignand domestic markets of Latin America.
The extent to which foreign private capi-tal will participate in the area's economicdevelopment will be influenced in large part,however, by Latin American economic andpolitical policies that have a bearing on for-eign investment. Official policies contribut-ing to monetary stability and assuring a wel-come to foreign capital on mutually advan-tageous terms, and the emergence of publicattitudes that support such policies, are gen-erally regarded as effective inducements toforeign private investment.
450 FEDERAL RESERVE BULLETIN
Digitized for FRASER http://fraser.stlouisfed.org/ Federal Reserve Bank of St. Louis

FEDERAL RESERVE BANK RESPONSIBILITIES
It is most fortunate that the Secretary ofthe Treasury could be here on this occasion.The magnitude of the public debt and itsimportance in the economy today make moreimperative than ever a close working rela-tionship between the Treasury and the Fed-eral Reserve System. We are allied in acommon purpose to serve the public interest.I am sure you all know that in performingour respective tasks we work together aspartners in a spirit of mutual understandingand respect.
All who heard or read Secretary Hum-phrey's address at the Associated Press meet-ing in New York will agree, however, that itwould have been far better had your programtonight scheduled him for the address andme for the greetings.
I could perhaps have taken my cue from alate New Englander who carried into theWhite House those sturdy virtues, includingfrugality even in words, for which this partof the country deservedly is noted. I amreliably informed that a group of Amherstmen, attending a conference in Madrid, de-cided one evening, in a spirit of fiesta, toform the Amherst Club of Madrid. It struckthem as a good idea to send a cable to Presi-dent Coolidge informing him of this notableachievement and suggesting that he, as aloyal alumnus, might wish to send greetings.He did. They received in due course a one-word message in reply. It said, "Greetings."
The responsibility for the assignments onthe program is yours. I shall not take ad-vantage of it, however, to detain you with
1 Address of Wm. McC. Martin, Jr., Chairman, Board ofGovernors of the Federal Reserve System, on the occasionof the opening of the new building of the Federal ReserveBank of Boston, Boston, Mass., May 6, 1953.
anything so formidable as the word "ad-dress" suggests. I do want to touch on a fewmatters of concern to the Federal ReserveSystem, particularly the role of the individualFederal Reserve Bank today. This newbuilding which you have opened is a symbol,not simply of growth, but more especially ofthe function and responsibility of the FederalReserve Banks in the nation and in the com-munities they serve directly.
Central banking—or, more accurately, re-serve banking—in the United States hasbeen adapted to the requirements of a freepeople with a minimum of Government in-terference. The genius of the framers of theFederal Reserve Act—as I have emphasizedbefore—lies in the creation of regional banks,knit together by a national governing bodyin Washington rather than in the establish-ment of a central institution with authori-tarian powers. Each Federal Reserve Bankand each branch office is a regional and localinstitution as well as part of a nation-widesystem. Through their boards of directors,the banks are in a position to represent theviews and interests of the particular regionto which they belong and, at the same time,they are the administrators of nation-widebanking and credit policies.
Instead of functioning from the centeroutward, we function through an interde-pendence of all our parts. The vitality ofthe Federal Reserve System is in its members.The health of each member affects the whole,and it is only through the work, and theconviction, and the determination of themembers that the whole has life. Withinthe framework carefully outlined by law,the Federal Reserve Board is charged with
MAY 1953 451
Digitized for FRASER http://fraser.stlouisfed.org/ Federal Reserve Bank of St. Louis
FEDERAL RESERVE BANK RESPONSIBILITIES
the responsibility for formulating nationalcredit policies and supervising their execu-tion. The Federal Reserve System is notperfect, but it is unquestionably the mainbulwark of our private banking system.Without a strong and independent reservebanking system, private banking must in-evitably lose the initiative it now possesses.
It is well always to bear in mind that theFederal Reserve System is a service institu-tion, and that the more than 250 directors ofthe 12 banks and 24 branches, the 20,000officers and others who work in them, as wellas the Board and staff in Washington, areall serving as trustees of the money of allof the people of this vast country, not any onegroup, or faction, or section.
Although the Federal Reserve Banks some-times are referred to as bankers' banks, thatdescribes only a part of their function. Thevarious services which the Federal ReserveBanks perform for the banking community,such as supplying currency, transferringfunds, and collecting checks, are an essentialelement in keeping the mechanics of moderncommercial banking in step with the finan-cial needs of a growing and changing privateenterprise economy. But the overriding pur-pose of this Reserve System is to serve theinterests of the general public in business,industry, labor, agriculture, and all walks oflife.
This institution is the fountainhead ofcredit—of the great bulk of our moneysupply. It is the medium for distributing thepocket money in daily use, but that is ofsubordinate importance. The ebb and flowof pocket money is determined by day-to-day needs of the merchant, the shopper, andall who use cash. Of far greater importanceis the System's responsibility for creating orextinguishing credit. For credit—bankcredit—is the life blood of our economy.
The trusteeship to which I refer is carriedout in the exercise of the System's responsi-bility for influencing the volume, availability,and cost of credit. The purpose is to seethat, so far as Federal Reserve policies are acontrolling factor, the supply and flow ofcredit are neither so large as to induce destruc-tive inflationary forces nor so small as tostifle our great and growing economy. Nowthat is a very great responsibility. By itsvery nature it must be carried out in theinterests of all of the people. And if it isnot so executed then the country would de-mand and deserve a new and faithful trustee-ship over the creation of credit.
Some critics have charged the System withfailing in one of its fundamental purposes—protecting the value of the dollar—because,in the four decades since the System wasfounded, the value of the dollar has been cutmore than in half. The truth of the matteris, of course, that in these years we have hadtwo world wars. We are still in the coldwar. The resultant economic upheavalscould not have been prevented by monetarypolicy alone. And this is not to say thatmonetary policy has always been as timelyor effective as it might have been. Thefact remains that without an appropriateand effective monetary policy there is noadequate safeguard against the distortionsand distress that can be brought about eitherby much too little or much too much money.The ideal would be enough to meet thegrowth needs of the economy, without eitherinflation or deflation.
For most of the postwar period, the aimof monetary policy and action has been toprevent inflation. The war ended with amoney supply which was so excessive in rela-tion to the available supplies of goods andservices as to result in a strong upward pres-sure on prices, and a rising cost of living.
452 FEDERAL RESERVE BULLETIN
Digitized for FRASER http://fraser.stlouisfed.org/ Federal Reserve Bank of St. Louis

FEDERAL RESERVE BANK RESPONSIBILITIES
We had more than a taste of that when theharness of price, wage, and other controls,which temporarily held back the war-createdflood of money, was removed and the tide ofunchecked funds inundated the marketplaces. Following Korea, there was a sharpresurgence of these upward pressures. Thesequite recent experiences should have taughtus, if the long history of monetary excessesin other parts of the world did not, thatthere are no sound substitutes for intelligentfiscal and monetary policies and measures.And it illustrates once more that when aneconomy is running at peak levels of pro-duction and employment, creating moremoney will not create more things to buy.It can only bid up the prices of availablesupplies.
Inflation is a sneak thief. It seems to beputting money into our pockets when in factit is robbing the saver, the pensioner, theretired workman, the aged—those least ableto defend themselves. And when deflationsets in, businessman, banker, worker, sufferalike, as most of us here know from the earlythirties.
All of that is an old story, to most of us,yet there are voices being heard even todaythat seem to say that just a little more infla-tion won't do any harm—or that the priceof even a few ounces of prevention is toohigh. What we are seeking to prevent in theend, of course, is deflation. In these pasttwo years we have had the almost ideal eco-nomic situation—we have had a remarkabledegree of economic stability at record levelsof employment and production. We havenot had another round of inflation. We havenot had anything resembling a deflation.This desirable state of affairs cannot beascribed to monetary policy alone, of course.But I do not believe it would have beenachieved without the monetary policy and
actions of the past two years. I do not thinkit would have been possible had the FederalReserve System let the creation of credit goon unchecked in this period. The transitionto free markets, as I have called it, made pos-sible the adjustment of the money supplyduring this period in the orderly growth ofthe economy, without further inflation orspeculative excesses. And this has been ac-complished despite the diversion of economicresources to the defense program.
All of us here tonight have been affectedin one way or another in this transition.Member banks have not had unrestrainedaccess to Federal Reserve credit by the saleof Government securities at known prices.In many cases they have had to come to theReserve Bank discount windows to borrowreserves—and pay the cost of the borrowing.The officers and directors of the ReserveBanks have had to shoulder again the veryimportant responsibility for these discountoperations. The use of discount facilities hasbeen termed a privilege. It is one of theprivileges of membership in the Federal Re-serve System. It is not an automatic privi-lege, however. The Reserve Banks are au-thorized to extend credit to each memberbank with due regard for the claims anddemands of other member banks, the main-tenance of sound credit conditions, and theaccommodation of commerce, industry, andagriculture.
When a member bank experiences unex-pected drains on its reserves, it may appro-priately apply to a Reserve Bank for credit.As it adjusts its operations to these new con-ditions, the member bank is expected to re-pay these temporary borrowings promptly.Member banks are expected to anticipatenormal seasonal requirements and be ina position to meet them by adjustmentsin liquid assets with a minimum reliance
MAY 1953 453
Digitized for FRASER http://fraser.stlouisfed.org/ Federal Reserve Bank of St. Louis

FEDERAL RESERVE BANK RESPONSIBILITIES
upon borrowing at the Federal Reserve. TheReserve Banks, of course, stand ready tomeet exceptional, or extraordinary needs forfunds by member banks. All of the Re-serve Banks are now authorized in a periodof general stress to lend on any acceptablepaper, not merely on so-called eligible paper.
These, I think, are the appropriate usesof the discount privilege. Clearly they donot contemplate misuse of that privilege forthe purpose of enlarging a bank's capitalbase, or earning a rate differential, or facili-tating speculation of any kind.
The initiative in the determination of dis-count rates is placed by the Federal ReserveAct in the boards of directors of the respec-tive Reserve Banks—and this is a very im-portant responsibility even though final de-termination of discount rates rests with theFederal Reserve Board. Similarly, the re-sponsibility for granting or withholdingloans to individual member banks is alsovested in the directors and officers of theFederal Reserve Banks. They must be thejudges. They are on the ground and are pre-sumed to be familiar with local conditions,as well as the state of the economy nationally.
The Reserve Act, as I have said before,is an ingenious blending of public and privateparticipation in a public institution createdby the Congress to regulate the money sup-ply. The ingenuity is exemplified, I think, inthe composition of the boards of directors ofthe Reserve Banks. They represent a broadcross-section of industrial, business, banking,agricultural, and professional activities, bothlarge and small—and they in turn are calledupon to act in the national interest and notfor the special advantage of any group orfaction or section of the country.
They have a duty, also, to foster a widerunderstanding of the role that monetary
policy should play—what it can and what itcannot accomplish.
The universal desire for orderly, steadyeconomic progress, and a constantly improv-ing standard of living, certainly cannot beachieved without flexibly administered mone-tary policy and action—with restraint oncreation of excessive credit in a boom and apolicy of liberal monetary ease when infla-tionary dangers no longer threaten stability.
Criticism of Federal Reserve policy andperformance has mainly sprung from ascrib-ing to monetary action an omnipotence thatdoes not and would not exist—even if therewere men omniscient enough to devise andexecute monetary policy perfectly. I amnot objecting to criticism—we should and Ithink we do sincerely welcome critical ap-praisal of our performance. But criticalanalysis and comment that can be useful inguiding future action, though it cannot rec-tify past mistakes, has to be well informedand understood.
The Federal Reserve Banks recognize, Iknow, the special responsibility they bear intheir respective areas for gathering economicinformation and making it available. Theyhave a duty to explain what they do, andwhy, in carrying out their part in the trustee-ship over credit. The report on "Steps toMaintain Economic Stability" which was is-sued by the Committee on Economic Stabili-zation of the Board of Directors of this Bankis-a commendable example of informed dis-cussion of economic affairs.
Your task is more than ever an exactingone—but it is an inspiring one. The trustee-ship which this System and its memberbanks share is vital to the preservation ofour system of private enterprise.
The System, I am certain, has made a no-table contribution to the attainment of thesustained economic progress of the past two
454 FEDERAL RESERVE BULLETIN
Digitized for FRASER http://fraser.stlouisfed.org/ Federal Reserve Bank of St. Louis

FEDERAL RESERVE BANK RESPONSIBILITIES
years. It can, I am confident, continue tomake an important contribution in the yearsahead.
That confidence, I deeply feel. I wasasked the other day in Detroit what wouldhappen to us after a few years of a genuinepeace—and I can do no better, in concludingthese remarks tonight, than to give you thereply as I made it then:
"I can only give you my philosophy onthis. To me the most heinous statementthat is made by some people is that warleads to prosperity, or that war is pros-perity. I can't conceive of an economybased on war that can ultimately be
prosperous. We have to go through cer-tain readjustments to have an intelli-gent peacetime economy. We've got tohave our business based on initiative andcompetence and salesmanship—on rawmaterials and products—and not on de-pendence upon spending for war pur-poses. I believe that this country has theflexibility—and the capacity—and thecharacter—because it requires char-acter—to unravel this ball of twine thatwe've wound up, and to do it in a waythat will lead us to a higher, a moreexpansive, and a better standard of livingfor all of the people. I have that faith."
MAY 1953 455
Digitized for FRASER http://fraser.stlouisfed.org/ Federal Reserve Bank of St. Louis

FEDERAL FINANCIAL MEASURES FOR ECONOMIC STABILITY1
Government financial measures are espe-cially appropriate for promoting stable de-velopments in private enterprise economies.For the most part they are impersonal andoperate indirectly through markets by theireffects on incentives to spend. To the extentthat sources of instability are financial, more-over, they deal with basic causes.
The preceding article in this series ex-plored in some detail the relation of creditand monetary action to economic stability.Before considering the functioning of theseveral instruments by which such action iseffected, it is desirable to discuss, briefly andbroadly, credit and monetary measures inrelation to fiscal measures and debt manage-ment, the other financial methods availableto the Federal Government for influencingthe flow of the economy's expenditures.Each of these methods has a special and com-plementary role to play in sustaining orderlyand stable progress.
CREDIT AND MONETARY MEASURES
Credit and monetary actions affect expen-ditures particularly of the private sector ofthe economy. As explained in earlier arti-cles, they exert an influence on the avail-ability and amount of credit, on the cost of
1This is the third of a series of articles considering theoperation of credit and monetary policy in the United States.These articles are based on selected replies submitted earlyin 1952 by the Board of Governors of the Federal ReserveSystem to a questionnaire from the Subcommittee on Gen-eral Credit Control and Debt Management of the Congres-sional Joint Committee on the Economic Report. Thematerial selected has been modified and expanded in orderto bring it up to date and to fill gaps in content resultingfrom the fact that the original material was organized inreply to definite questions.
Preparation of the articles is under the direction of RalphA. Young, Director of the Division of Research and Statistics.
lending and borrowing (both public andprivate), on the volume of saving, on capitalvalues, on the volume of money, and on thevalue of the dollar at home and abroad.
There are three main methods of execut-ing credit and monetary action—discountoperations, open market operations, andchanges in reserve requirements. Thoughthey operate somewhat differently, each in-fluences bank reserve positions and henceaffects the ability and willingness of com-mercial banks to lend. Since the banks area major factor in the credit market, changesin their ability and willingness to lend affectthe whole credit market, that is, the generalavailability, cost, and volume of credit.
Bringing about credit restraint or easethrough these measures has widespread ef-fects on the economy. Their most directimpact is on the amount of spending donewith borrowed funds. There is almost al-ways a fringe of borrowers or potential bor-rowers whose decisions about investmentswith marginal profitability or about con-sumption of marginal usefulness are influ-enced by changes in the availability or costof credit. As lenders become less ableand less willing to lend, they both increasethe rates of interest at which they lend, thuscutting back some of the demand for funds,and raise their standards of creditworthinessapplicable to new borrowing. As lenders be-come more able to lend, they will lend atlower rates of interest and accept higher-riskborrowers. These credit developments havesecondary effects that are reflected in spend-ing and savings activities of all sectors of theeconomy.
A supplementary method of exerting an
456 FEDERAL RESERVE BULLETIN
Digitized for FRASER http://fraser.stlouisfed.org/ Federal Reserve Bank of St. Louis

FEDERAL FINANCIAL MEASURES FOR ECONOMIC STABILITY
influence over credit conditions is the use ofselective instruments which directly affectthe equity or maturity terms of specific typesof loans extended by banks and other lenders.At present only stock market credit may beregulated in this way.
In some periods of expansion, certain creditsectors may not be readily responsive to gen-eral measures of credit and monetary re-straint. Examples of such developments arethe growth of stock market credit in thelate 1920's and expansion of consumer instal-ment credit and mortgage credit after theoutbreak of fighting in Korea. Regulationof stock market credit was authorized in themid-1930's to enable the reserve banking au-thorities to prevent a recurrence of excessivestock speculation financed through credit.Regulation of consumer credit and real es-tate construction credit was authorized on atemporary basis after Korea in order to effectrestraint in these credit areas during an ab-normal period. Regulation of consumercredit had earlier been used to curb personalspending financed by credit during the warperiod and in immediate postwar years.
Credit and monetary measures are indis-pensable to stable progress, but alone theycannot assure that progress. Their effective-ness will be conditioned by Federal fiscalaction and debt management and by variousspecific Government programs. Their ef-fectiveness may also be conditioned by un-predictable and sudden developments andchanges in moods and impulses that affectactivity in the economy.
Credit and monetary action, while power-ful in combating an inflationary upswing, issometimes viewed as being less effective incounteracting a deflationary downswing.This view is largely based on experience ina few depressions which followed majorbooms in which economic activity was seri-
ously distorted. In these instances, shakenconfidence of both lenders and borrowersmilitated against active response to an in-creased availability and supply of credit andmoney and a reduced interest cost of borrow-ing. While expansionary credit and mone-tary policy was essential to economic recov-ery under such circumstances, it was not suf-ficient by itself to achieve it.
The administration of credit and monetarymeasures is a task involving discretion, pa-tience, and judgment. Action must beguided not by a single indicator or simplecombination of indicators but by a balancedassessment of the entire credit and economicsituation in the light of the fullest informa-tion available. Action, moreover, must beadapted promptly to changing conditions,because its full effectiveness on the economywill not be felt until after some time-lag. Tothe extent that promptness is not achieved,credit and monetary policy falls short of itspotential and may even itself be a source ofinstability.
FISCAL MEASURES
Fiscal measures work mainly through themoney collecting and money spending activi-ties of the Federal Government. Theamount, type, and timing of tax collectionsand of Government outlays affect expendi-tures directly and indirectly throughout theeconomy, and these effects will vary withthe size of the Federal budget. Throughthe level of taxes, Government revenues in-fluence directly the amount of private incomeavailable for spending, and because the Gov-ernment buys large amounts of goods andemploys large numbers of workers, its out-lays affect directly demand and supply inspecific markets. Federal fiscal activitiesalso have indirect effects in stimulatingprivate expenditures and in influencing the
MAY 1953 457
Digitized for FRASER http://fraser.stlouisfed.org/ Federal Reserve Bank of St. Louis

FEDERAL FINANCIAL MEASURES FOR ECONOMIC STABILITY
general economic outlook in a fashion simi-lar to the action of credit and monetarypolicy. In addition, fiscal action may shiftthe distribution of income, alter the usesmade of the nation's resources, and have re-pressive or incentive effects on economicproductivity and output.
The influence of fiscal action on economicstability arises chiefly out of a difference be-tween the Government's cash receipts andcash expenditures. The difference causes acash flow of payments between the privatesectors of the economy and the Government.In general, a cash flow from the Governmenthas expansive effects on the economy's over-all expenditures, while a cash inflow has con-tractive effects. These effects induce furtherspending or restriction of spending in theprivate sector.
Various combinations of taxation and Gov-ernment expenditure programs will have dif-ferent effects on total expenditures in theeconomy. For example, increased taxationcombined with reduced Government spend-ing will have contractive effects on the na-tion's spending activities, and hence be ap-propriate to a period of inflationary pressures.On the other hand, reduced taxation com-bined with increased Government expendi-tures will expand the total volume of ex-penditures during a period of recession.This assumes, of course, that specific Gov-ernment expenditure programs are not of thekind that displace or compete with privateeconomic activity, thereby discouragingrather than stimulating business confidence,private investment, and private consump-tion.
To some extent, changes in tax and Gov-ernment expenditure programs come aboutautomatically over the course of businessfluctuations. This built-in flexibility of thebudget tends to counteract swings in private
spending without deliberate action on thepart of the public authorities. For instance,with graduated income taxes the Govern-ment takes a larger part of national incomeat higher than at lower levels, and a changein national income will be quickly reflectedin the tax take under existing pay-as-you-gotax arrangements. At the same time, Gov-ernment expenditures as a result of the socialsecurity and agricultural support programswill tend to be greater in depressed periodsthan in prosperity.
Reliance upon built-in budget flexibility toadapt fiscal policy to severe economic fluctu-ations is unfeasible so that some discretion-ary action through legislative processes mustbe counted on for this purpose. By their verynature, however, the fiscal tools of tax andexpenditure programs are complex, and theyinvolve controversial aspects such as theireffects on the distribution of income, on in-centives to produce and to save, and on indus-trial and regional development. Speedy ac-tion, consequently, is difficult. Much timeis necessarily absorbed in the legislative proc-ess—in the initial formulation of programsand in their consideration and final enact-ment. Execution of both tax and expendi-ture programs requires additional time, al-though to the extent that taxes are paid ona current basis the effect of tax changes isfairly immediate. In a downturn, expendi-ture programs may be hard to get into opera-tion as promptly as needed; in a boom, itmay prove to be impractical or wasteful tobring long-range programs to a halt.
Even if it were possible to get sufficientvariation in fiscal action, it might be imprac-ticable and possibly inadvisable to vary thewhole program of Government expendituresand taxation primarily in accordance withthe evident needs of economic stability. Insome situations, other policies are so impor-
458 FEDERAL RESERVE BULLETIN
Digitized for FRASER http://fraser.stlouisfed.org/ Federal Reserve Bank of St. Louis
FEDERAL FINANCIAL MEASURES FOR ECONOMIC STABILITY
tant as to outweigh considerations of eco-nomic stability in governmental decisions:the conduct of war or the undertaking of amajor defense program are striking examplesof such situations. Many large items in thebudget are directed toward noneconomicobjectives and do not lend themselves tothe flexible treatment required in counter-cyclical fiscal policy. Furthermore, anti-cyclical actions may be in conflict withmeasures based on other important criteria.The tax structure needs to take account long-term investment growth and taxpayer equity.Remedial action based on these criteria is adesirable goal at all times but may not alwaysbe consistent with immediate programsaimed at stability.
Because discretionary fiscal action involvesmany special problems and cannot always betaken speedily, decisions as to its timingusually involve the difficult art of long-termforecasting. On the one hand, any actionwill affect economic activity only after sometime lag, and anticipatory action runs therisk of accentuating rather than amelioratingcyclical fluctuations. On the other hand, thecountercyclical potential of fiscal action isseverely diminished if steps are delayed untilthe economy finds itself in recession or boom.
Different combinations of taxation andGovernment expenditures result in deficitsor surpluses and accordingly involve Treas-ury borrowing or permit repayment of bor-rowing. The amount of the borrowing orrepayment is determined by fiscal action;the manner and kind of borrowing or repay-ment are in the realm of debt management.The extent of the expansive or restrictive im-pact of fiscal measures depends not only onthe relation between taxation and expendi-tures but in part on debt management opera-tions. The effects of fiscal action in attain-ing economic stability are thus related also
to debt management, and the effectivenessof this relationship in turn depends on thefinancial climate created by credit and mone-tary measures.
DEBT MANAGEMENT
As a complementary tool of countercyclicalfinancial policy, debt management now hajgreat importance because of the present sizeof the Federal debt and because of the specialrole such debt plays in the asset structure offinancial institutions. The Federal debt nowamounts to about two-fifths of the economy'stotal debt. It is the only debt that is en-tirely free from credit risk. Short-term Fed-eral debt serves as a principal liquid or operat-ing reserve asset of banks, other financialinstitutions, and business corporations.Longer-term Federal debt functions as amajor investment asset of individuals andsavings institutions and competes with otherinvestment media in absorbing the economy'smoney savings. The types of Governmentsecurities issued thus have a significant effecton the liquidity of the entire economy andon the market for other securities.
Debt management has two major aspects.It involves refunding operations affectingthe maturity arrangement of outstandingdebt. It also involves the expansion or re-tirement of debt in response to the currentcash deficit or surplus of the Government.The maturity composition of the debt hasits most direct tie with credit and monetarypolicy while the changes in the amount ofdebt are most immediately related to fiscalpolicy. Both aspects combine to determinethe composition of the total Governmentdebt at any given time and in this processexert an influence on the attainment of eco-nomic balance.
Management of the Federal debt makes aprimary contribution to economic stability
MAY 1953 459
Digitized for FRASER http://fraser.stlouisfed.org/ Federal Reserve Bank of St. Louis

FEDERAL FINANCIAL MEASURES FOR ECONOMIC STABILITY
by arranging a maturity composition of thatdebt that will support and not impede devel-opment of appropriate credit and monetarypolicy. In general, such a debt distributionwould be one with maturities well spacedover a period of years. This kind of maturitydistribution is also important for adminis-trative reasons in debt management.
There is, of course, constant need for alarge volume of short-term issues to meet thebasic liquidity requirements of banks, finan-cial institutions, business corporations, andothers. In a period of economic slack ordepression this liquidity may be expanded byissuing additional short-term obligations. Inthe subsequent period of expansion the vol-ume of these issues may be reduced some-what by refunding operations or by retire-ments out of surplus.
To change the existing debt structure,however, takes time. Financing decisions ofthe past necessarily impinge heavily on thepresent and the future, and debt manage-ment actions must continually be a com-promise between what may be most appro-priate for the current economic situation andwhat may be appropriate in terms of alonger-run view of economic stability. Thisbalance in judgment relates primarily to thevolume of very short-term securities whichmay be outstanding at any time. Becausethe liquidity of such securities is not readilyinfluenced by credit and monetary measures,the greater the proportion of the debt in theseissues the less responsive the economy willtend to be to restrictive credit and monetaryaction when such measures may be appro-priate.
From the point of view of economic sta-bility, the maturity distribution of outstand-ing debt should always be such that moderatechanges in the level of interest rates will havean important effect on the liquidity positions
of holders, thereby influencing spending andlending decisions. To attain this, a sizableportion of the debt should be spread out overintermediate and long-term maturities sothat when interest rates decline, and themarket prices of these securities thereforerise, liquidity positions of holders will cometo be regarded as more adequate than for-merly. Conversely, when interest rates riseand security prices decline, holders will tendto view these positions as less adequate. Sucha spread maturity distribution would limitthe dependency of debt management on cur-rent interest rates and security market condi-tions and, on the other hand, would increasethe sensitivity of the entire economy to inter-est rate changes.
Within the standards set for debt balance,current debt management can operate toreinforce or offset in part the impact of aFederal deficit or surplus. For example, adeficit in a recession period may be madesomewhat more effective if in its financingthe emphasis is placed on the use of shorter-term obligations. The expansive effects willtend to be greater and will support an ex-pansionary credit and monetary policy to theextent that such issues are absorbed by thebanking system and foster expansion in themoney supply. Conversely, a surplus in aboom period will be more effective as a re-straint on expenditures if it is used to retireshort-term debt rather than to purchase long-term securities in the market. The restrain-ing effects will tend to be increased and willreinforce restrictive credit and monetarypolicy if the repayment of debt reaches theholdings of short-term issues by the bankingsystem, thus affecting bank liquidity posi-tions.
Debt management actions to promote eco-nomic stability through shifts in terms andmaturities of security offerings are limited by
460 FEDERAL RESERVE BULLETIN
Digitized for FRASER http://fraser.stlouisfed.org/ Federal Reserve Bank of St. Louis

FEDERAL FINANCIAL MEASURES FOR ECONOMIC STABILITY
the necessity of meeting existing market con-ditions. Public debt must be handled so thatthe investing community will be receptiveto new issues from refunding operations andwill take additional debt into its portfolio.While public debt differs from private debtinstruments in quality, public debt instru-ments compete with similar securities of pri-vate origin in the market. In short, the debtmust be in such form that it is readily as-similated in the market.
There are other practical problems of debtmanagement to be resolved. Recently, ac-celeration of corporate tax payments hasresulted in a concentration of Treasury re-ceipts in the first half of the year while Gov-ernment outlays are more evenly distributed.This necessitates a seasonal pattern of short-term borrowing and repayment of borrowingeven if the cash budget is in balance.
Debt management must develop its policiesand feel its way not only in response to im-mediate Treasury needs, to security marketdevelopments, and to investor preferences,but also with regard to the cost of servicingthe debt. From both the standpoint ofinterest cost and economic stability thereare many alternative arrangements of agiven debt. Problems of current interestcost must be weighed against the costs tothe Federal budget and the economy ingeneral if debt management decisions areexcessively inflationary or deflationary. Theymust also be weighed against possible futureinterest costs under different economic cir-cumstances. Debt management decisionsthus must consider both the present andfuture, as well as the implications of actionon the effectiveness of other instrumentsfor achieving economic stability.
INTERACTION OF FINANCIAL MEASURES
The combination of credit and monetarymeasures, fiscal measures, and debt manage-
ment that will be most appropriate at anyparticular time will depend on the circum-stances prevailing and on the feasibility ofaction in one field or the other. How theyare interrelated in Government policy can beshown by a brief description of their use inperiods of contraction and inflation.
Periods of contraction. In combating re-cession and deflation, fiscal measures canmake a broad, direct attack by loweringtaxes, increasing Government expenditures,or both, in an effort to cushion or offset thedecline in the total volume of private incomeand expenditures. These fiscal actions willmake for an excess of expenditures over re-ceipts and an expansion of public debt.
Debt management as well as credit andmonetary measures will condition the im-pact of fiscal action. The expansionarypotential will be affected by the manner inwhich the deficits are financed. The effectwill be greatest if the deficit is financed withfunds that would otherwise have been idle orwith new deposits generated by bank invest-ment. The effects of a Federal deficit maybe partly neutralized if it is financed withfunds that might otherwise have found out-let in private consumption or investment. Insummary, fiscal measures by themselves canproduce an increase in total expenditure byan excess of expenditures over tax receipts,and perhaps to some extent by changes in taxand expenditure patterns which take advan-tage of differential tendencies of various sec-tors of the economy to spend for investmentand consumption. The rise in expenditurespromoted by fiscal measures will be fargreater, however, if debt management andcredit and monetary actions are also operat-ing in a way that stimulates total demand.
In depressed periods, credit and monetarymeasures should ease bank reserve positions,making bank credit and other credit cheaper
MAY 1953 461
Digitized for FRASER http://fraser.stlouisfed.org/ Federal Reserve Bank of St. Louis

FEDERAL FINANCIAL MEASURES FOR ECONOMIC STABILITY
and more readily available. Such action willencourage the use of credit and prompt a risein Government security and other capitalvalues, thus increasing the economy's liquid-ity. This kind of policy will also facilitatefinancing of any Federal deficit. If somesubstantial portion of the new securities of-fered are shorter-term obligations, debt man-agement will be functioning at the same timeto increase the liquidity of the economy. Tothe extent that such securities are purchasedby banks there will be an offset to contrac-tion of private bank credit and a consequentstabilizing effect on the volume of money.Along with an expansionary credit and mon-etary policy, this will help to develop a con-dition of banking liquidity favorable to pri-vate bank credit expansion and resumedgrowth in the money supply. Increased li-quidity of lenders generally will also helpto swell the flow of credit.
Expansion periods when inflationarypressures are strong. When inflationarypressures are strong, it is of paramount im-portance that fiscal, credit and monetary, anddebt management policies supplement oneanother in limiting expansion of both publicand private demand. At such times, fiscalpolicy should avoid deficits and aim for sur-pluses in order to restrain expansion of ex-penditures. Credit and monetary policyshould restrict bank reserve positions, mak-ing bank and other credit less readily avail-able and more costly. This will dampen theexpansion of bank credit and the money sup-ply and lower capital values, thus reducinggenerally the liquidity of the economy. Thiskind of action will put a brake on expansionof spending financed by credit and at thesame time operate to increase saving. Debtmanagement policy should be directed at re-ducing the liquidity of the existing debt byrefunding some maturing issues into longer-term obligations and by applying surpluses,
462
when available, to reduce the volume ofshort-term debt. Reduction in liquidity soeffected will exert a retarding influence onthe momentum of spending. Thus thesethree methods of Federal financial policy canwork consistently in an inflationary periodtoward the primary goal of economic sta-bility.
To the extent that any of these instrumentsdoes not work toward combating inflation-ary trends, the burden is made heavier on theothers. Total spending will not decline as aresult of fiscal action if the dollars taxedaway are replaced by dollars created by bankcredit expansion; nor will restrictive creditand monetary policy be fully effective iffiscal or debt management policies are expan-sive. At times in expansion periods it maybe difficult to avoid stimulative fiscal policies,and credit and monetary policy together withdebt management must then carry an extraload.
# # #The combination of credit and monetary
measures, fiscal measures, and debt manage-ment that will be desirable at any particulartime will depend in some degree on thespecial circumstances prevailing and on thefeasibility of action in one field or another.These instruments of Federal financial policyare complementary, but to an extent use ofone may be substituted for use of another.Inappropriate action in one area of policy,however, may overburden the task of theothers and reduce their effectiveness. Thegreatest contribution to economic stabilityfrom Federal financial measures may thusbe achieved when these are used as mutuallyreinforcing instruments of public policy.
Reprints of this article are available uponrequest from the Division of AdministrativeServices, Board of Governors of the FederalReserve System, Washington 25, D. C.
FEDERAL RESERVE BULLETIN
Digitized for FRASER http://fraser.stlouisfed.org/ Federal Reserve Bank of St. Louis
MEMBER BANK EARNINGS, 19521
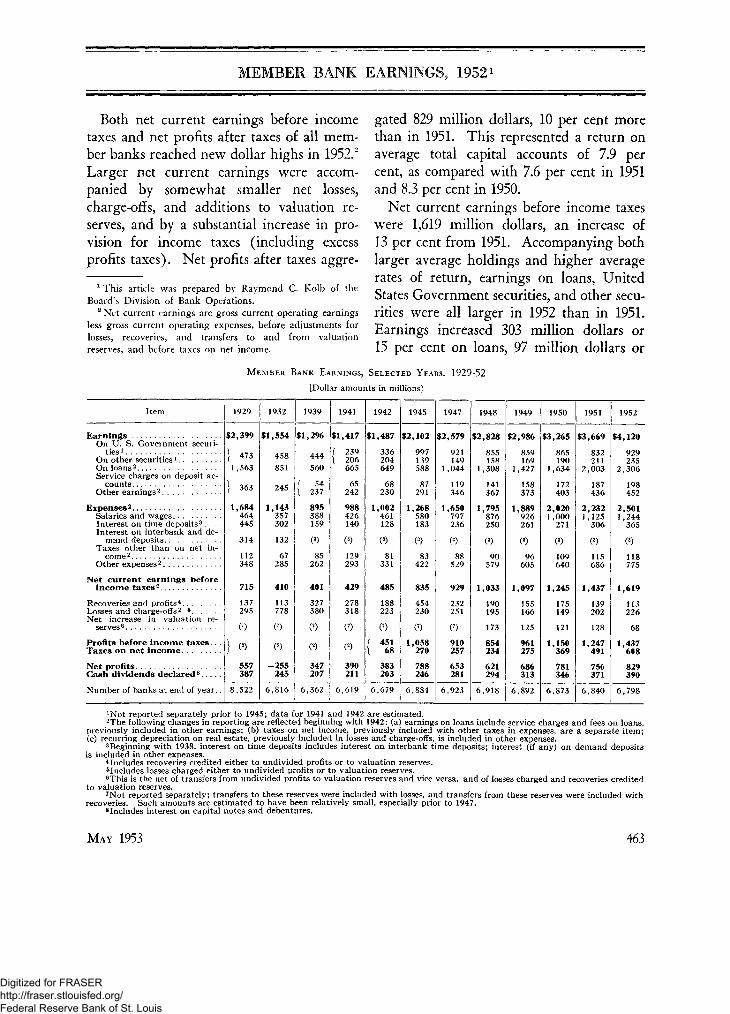
Both net current earnings before incometaxes and net profits after taxes of all mem-ber banks reached new dollar highs in 1952.2
Larger net current earnings were accom-panied by somewhat smaller net losses,charge-offs, and additions to valuation re-serves, and by a substantial increase in pro-vision for income taxes (including excessprofits taxes). Net profits after taxes aggre-
1 This article was prepared by Raymond C. Kolb of theBoard's Division of Bank Operations.
2 Net current earnings are gross current operating earningsless gross current operating expenses, before adjustments forlosses, recoveries, and transfers to and from valuationreserves, and before taxes on net income.
gated 829 million dollars, 10 per cent morethan in 1951. This represented a return onaverage total capital accounts of 7.9 percent, as compared with 7.6 per cent in 1951and 8.3 per cent in 1950.
Net current earnings before income taxeswrere 1,619 million dollars, an increase of13 per cent from 1951. Accompanying bothlarger average holdings and higher averagerates of return, earnings on loans, UnitedStates Government securities, and other secu-rities were all larger in 1952 than in 1951.Earnings increased 303 million dollars or15 per cent on loans, 97 million dollars or
MEMBER BANK EARNINGS, SELECTED YEARS, 1929-52
[Dollar amounts in millions]
I ten 1932 1939 1941 1942 1945 1947
EarningsOn U. S. Government securi-
ties iOn other securities1
On loans2
Service charges on deposit ac-counts
Other earnings2
Expenses2
Salaries and wagesInterest on time deposits3. . . .Interest on interbank and de-
mand depositsTaxes other than on net in-
come2
Other expenses 2
Net current earnings beforeincome taxes 2
Recoveries and profits4
Losses and charge-offs2 6
Net increase in valuation re-serves6
Profits before income taxes. . .Taxes on net income
Net profitsCash dividends declared8
Number of banks at end of year..
$2,399
i 4731 ,563
) 363
1,684464445
112348
715
137295
557387
$1,554
458851
245
1,143357302
67285
410
113778
-255245
$1,296
444560
f 54\ 237
895388159
85262
401
327380
347207
$1,417
239206665
65242
988426140
129293
429
278318
390211
$1,487
336204649
68230
1,002461128
81331
485
188223
45168
383203
$2,102
997139588
87291
1,268580183
83422
835
454230
1,058270
788246
$2,579
921149
1,044
119346
1,650797236
529
929
232251
910257
653281
$2,828
855158
1,308
141367
1,795876250
90579
1,033
190195
173
854234
621294
$2,986
859169
1,427
158373
1,889926261
96605
1,097
155166
125
961275686313
$3,265
865190
1,634
172403
2,0201,000
271
109640
1,245
175149
121
1,150369
781346
$3,669
832211
2,003
187436
2,2321,125
306
115686
1,437
139202
128
1,247491
756371
$4,120
929235
2,306
198452
2,5011,244
365
118775
1,619
113226
1,437608829390
8,522 6,816 6,362 6,619 6,679 6,884 6,923 6,918 6,892 6,873 6,840 6,798
1Not reported separately prior to 1945; data for 1941 and 1942 are estimated.2The following changes in reporting are reflected beginning with 1942: (a) earnings on loans include service charges and fees on loans,
previously included in other earnings; (b) taxes on net income, previously included with other taxes in expenses, are a separate item;(c) recurring depreciation on real estate, previously included in losses and charge-offs, is included in other expenses.
3Beginning with 1938, interest on time deposits includes interest on interbank time deposits; interest (if any) on demand depositsis included in other expenses.
4Includes recoveries credited either to undivided profits or to valuation reserves.5Includes losses charged either to undivided profits or to valuation reserves.6This is the net of transfers from undivided profits to valuation reserves and vice versa, and of losses charged and recoveries credited
to valuation reserves.7Not reported separately; transfers to these reserves were included with losses, and transfers from these reserves were included with
recoveries. Such amounts are estimated to have been relatively small, especially prior to 1947.8Includes interest on capital notes and debentures.
MAY 1953 463
Digitized for FRASER http://fraser.stlouisfed.org/ Federal Reserve Bank of St. Louis
MEMBER BANK EARNINGS, 1952
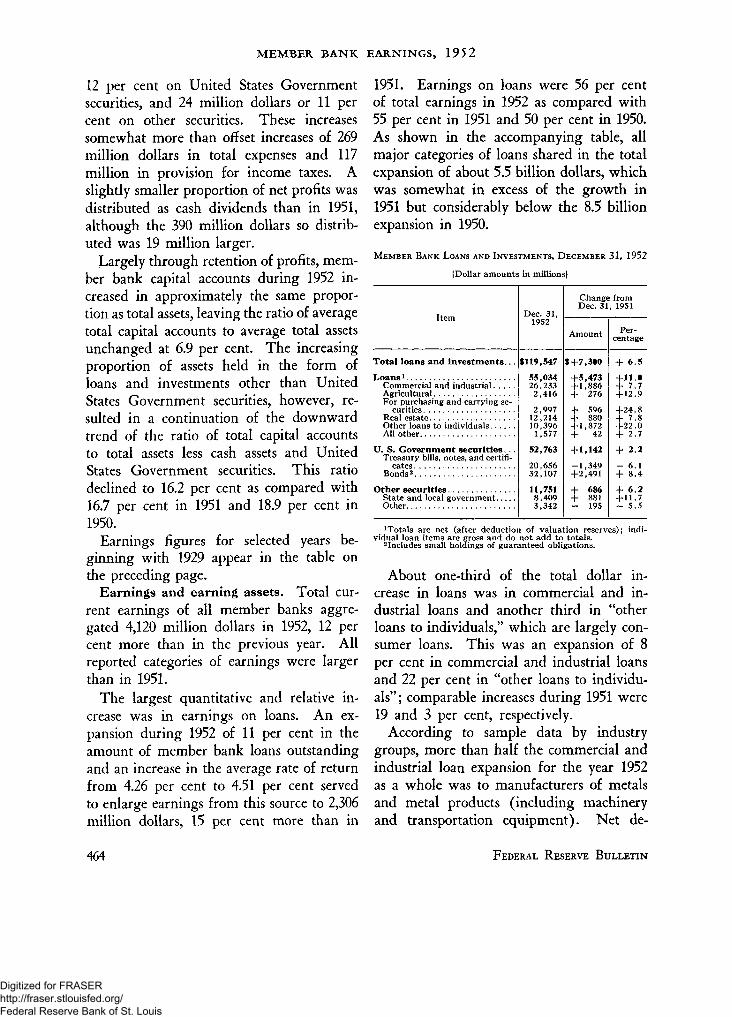
12 per cent on United States Governmentsecurities, and 24 million dollars or 11 percent on other securities. These increasessomewhat more than offset increases of 269million dollars in total expenses and 117million in provision for income taxes. Aslightly smaller proportion of net profits wasdistributed as cash dividends than in 1951,although the 390 million dollars so distrib-uted was 19 million larger.
Largely through retention of profits, mem-ber bank capital accounts during 1952 in-creased in approximately the same propor-tion as total assets, leaving the ratio of averagetotal capital accounts to average total assetsunchanged at 6.9 per cent. The increasingproportion of assets held in the form ofloans and investments other than UnitedStates Government securities, however, re-sulted in a continuation of the downwardtrend of the ratio of total capital accountsto total assets less cash assets and UnitedStates Government securities. This ratiodeclined to 16.2 per cent as compared with16.7 per cent in 1951 and 18.9 per cent in1950.
Earnings figures for selected years be-ginning with 1929 appear in the table onthe preceding page.
Earnings and earning assets. Total cur-rent earnings of all member banks aggre-gated 4,120 million dollars in 1952, 12 percent more than in the previous year. Allreported categories of earnings were largerthan in 1951.
The largest quantitative and relative in-crease was in earnings on loans. An ex-pansion during 1952 of 11 per cent in theamount of member bank loans outstandingand an increase in the average rate of returnfrom 4.26 per cent to 4.51 per cent servedto enlarge earnings from this source to 2,306million dollars, 15 per cent more than in
1951. Earnings on loans were 56 per centof total earnings in 1952 as compared with55 per cent in 1951 and 50 per cent in 1950.As shown in the accompanying table, allmajor categories of loans shared in the totalexpansion of about 5.5 billion dollars, whichwas somewhat in excess of the growth in1951 but considerably below the 8.5 billionexpansion in 1950.
MEMBER BANK LOANS AND INVESTMENTS, DECEMBER 31, 1952
[Dollar amounts in millions]
Item
Total loans and investments...
Loans1
Commercial and industrialAgriculturalFor purchasing and carrying se-
curitiesReal estateOther loans to individualsAll other
U. S. Government securities. .Treasury bills, notes, and certifi-
catesBonds2
Other securitiesState and local governmentOther
Dec. 31,1952
$119,547
55,03426,2332,416
2,99712,21410,3961,577
52,763
20,65632,107
11,7518,4093,342
Change fromDec. 31, 1951
Amount
$+7,300+5,473+ 1,886+ 276
+ 596+ 880+ 1,872+ 42
+1,142
-1,349+2,491
+ 686+ 881- 195
Per-centage
+ 6.5+11.0+ 7.7+ 12.9
+24.8+ 7.8+22.0+ 2.7
+ 2.2- 6.1+ 8.4
+ 6.2+ 11.7- 5.5
1Totals are net (after deduction of valuation reserves); indi-vidual loan items are gross and do not add to totals.2Includes small holdings of guaranteed obligations.
About one-third of the total dollar in-crease in loans was in commercial and in-dustrial loans and another third in "otherloans to individuals," which are largely con-sumer loans. This was an expansion of 8per cent in commercial and industrial loansand 22 per cent in "other loans to individu-als"; comparable increases during 1951 were19 and 3 per cent, respectively.
According to sample data by industrygroups, more than half the commercial andindustrial loan expansion for the year 1952as a whole was to manufacturers of metalsand metal products (including machineryand transportation equipment). Net de-
464 FEDERAL RESERVE BULLETIN
Digitized for FRASER http://fraser.stlouisfed.org/ Federal Reserve Bank of St. Louis
MEMBER BANK EARNINGS, 1952
creases in loans were reported for only threegroups—manufacturers of food, liquor, andtobacco; manufacturers of textiles, apparel,and leather; and the public utility industry(including transportation).
Member bank total holdings of UnitedStates Government securities expanded alittle more than one billion dollars during1952. Holdings of short-term, lower yield-ing bills, certificates, and notes declined by1.3 billion dollars, while holdings of bondswith higher yields increased 2.5 billion.Larger holdings, the shift to higher yieldingbonds, and the generally higher level ofyields all served to advance earnings onUnited States Government securities to 929million dollars, 12 per cent more than in1951. The average rate of return on theseholdings was 1.79 per cent in 1952 as com-pared with 1.66 per cent in 1951. Earningson United States Government securitieswere 23 per cent of all member bank earn-ings in 1952, the same as in 1951.
Earnings on securities other than thoseof the United States Government aggre-gated 235 million dollars in 1952, 24 mil-lion more than in 1951; and the average rateof return increased to 2.03 per cent from1.99 per cent. This modest increase in rateof return reflected the changing compositionof portfolios as well as generally higherlevels of yields in 1952. Holdings of Stateand local government securities, which aretax-exempt and therefore have relatively lowyields, increased 881 million dollars, whileholdings of other securities in this groupdeclined 195 million; these changes wereabout the same as corresponding changesduring 1951.
Expenses. Total current expenses of allmember banks increased to 2,501 milliondollars in 1952, 12 per cent above the pre-vious year. There was no significant change
in the relative importance of the various ex-pense items, all of which were larger in 1952than in 1951. Salaries and wages were thelargest component and accounted for about50 per cent of total expenses. Officers' sal-aries amounted to 408 million dollars, anincrease of 33 million from 1951, and sal-aries and wages of other employees aggre-gated 835 million dollars, an increase of85 million. These increases reflected bothlarger numbers of officers and employeesand increases of about 5 per cent in averagesalaries and wages. Interest paid on timedeposits increased 59 million dollars to 365million, and the average rate of interest paidincreased from 1.02 to 1.13 per cent.
Losses, charge-offs, recoveries, and
profits.3 Losses and charge-offs on loansaggregated 71 million dollars in 1952 andrecoveries on loans aggregated 45 million,about the same amounts as reported for 1951.The resulting net loss of 26 million dollarsfor 1952 was 1.1 per cent of total earningson loans, somewhat less than the 1.3 per centin both 1951 and 1950.
Reflecting lower prices, losses on securitiesincreased to 108 million dollars from the88 million reported for 1951. Recoveries onsecurities were about 15 million dollars ineach year. Profits on securities sold orredeemed aggregated 29 million dollars ascompared with 52 million in 1951 and 82million in 1950.
Valuation reserves. Since the December1947 ruling of the Bureau of Internal Reve-nue pertaining to tax-free additions to re-serves for bad debt losses on loans, trans-fers to and from these reserves and othervaluation reserves on loans and securities
3 In this analysis, losses and charge-offs comprise thosedebited to either undivided profits or valuation reserves, andrecoveries comprise those credited to either of these accounts;transfers between undivided profits and valuation reservesare not included.
MAY 1953 465
Digitized for FRASER http://fraser.stlouisfed.org/ Federal Reserve Bank of St. Louis

MEMBER BANK EARNINGS, 1952
have been important factors affecting bankprofits.
Net transfers from undivided profits tovaluation reserves on loans aggregated 108million dollars in 1952, considerably belowthe 154 million reported in 1951. Thesenet amounts were partly offset by losses andrecoveries carried directly to the reserves andso the increases in loan valuation reservebalances were 81 million dollars in 1952 and124 million in 1951. The smaller increaseduring 1952 resulted primarily from thefact that many banks had already reached,or were rapidly reaching, their permittedceilings on the amounts that may be accumu-lated in the reserve for bad debt losses onloans under the provisions of the InternalRevenue ruling. At the end of 1952, valu-ation reserves on loans were about 1.5 percent of the outstanding volume of loans.
Net transfers from undivided profits tovaluation reserves on securities were 7 mil-lion dollars in 1952, about 10 million dol-lars less than in 1951. After adjustmentsfor losses and recoveries carried directly tothese reserves, there was a net decrease in thesecurity reserve accounts of 13 million dol-lars; in contrast, there was a net increase of4 million in 1951. At the end of 1952, valua-tion reserves on securities were about 1.8 percent of the book value of outstanding securi-ties other than those of the United StatesGovernment and 0.32 per cent of total out-standing securities; comparable percentagesat the end of 1951 were 2.0 and 0.35 re-spectively.
Income taxes. Provision for income taxes(including excess profits taxes) in 1952 ag-gregated 608 million dollars, 24 per centmore than in 1951. From preliminary tabu-lations of data collected by the Federal Re-serve System from a selected sample of in-sured commercial banks, it is estimated that
somewhat fewer banks were subject to ex-cess profits taxes in 1952 than in 1951, butthat the amount of such taxes was aboutthe same in both years. For member banks,the amount of excess profits taxes in 1951was estimated to be about 20 million dollars.Detailed data on excess profit taxes of com-mercial banks in 1950 and 1951 are givenin an article in the June 1952 issue of theFederal Reserve BULLETIN.
A summary of the factors that contributedto the 1952 increase in member bank netprofits appears in the accompanying table.
FACTORS IN HIGHER N E T PROFITS
[In millions of dollars]
Item
Increase in net profits
Factors increasing net profits, totalIncrease in earnings on loansIncrease in earnings on U. S. Government securities.Increase in other earningsSmaller net increase in valuation reserves
Factors decreasing net profits, totalIncrease in expensesIncrease in provision for taxes on incomeDecrease in profits on securities soldIncrease in net losses on securitiesl
Increase in other net losses
Items showing no change from 1951.Net losses on loans1
Changefrom 1951
+ 73
+511303
975160
-43726911723226
includes recoveries credited and losses charged either to un-divided profits or to valuation reserves.
Gash dividends and capital. The dollaramount distributed in the form of cash divi-dends continued its gradual upward trendand amounted to 390 million dollars in 1952,an increase of 19 million from 1951. Becauseof increased profits, however, this distribu-tion was a smaller proportion of net profits—47 per cent as compared with 49 per centin 1951. The yield on average total capitalaccounts was 3.7 per cent, the same as inthe previous two years.
About 53 per cent of net profits, or 439million dollars, was retained by memberbanks to strengthen their capital positions.This amount was supplemented by about
466 FEDERAL RESERVE BULLETIN
Digitized for FRASER http://fraser.stlouisfed.org/ Federal Reserve Bank of St. Louis

MEMBER BANK EARNINGS, 1952
128 million dollars provided through salesof common stock, and offset to the extentof about 25 million dollars net by otherchanges in capital accounts. These otherchanges included the retirement of preferredstock and the effects of mergers and changesin Federal Reserve membership.
Earnings and profits by class of bank.Total earnings, total expenses, net currentearnings before taxes, and net profits aftertaxes were larger in 1952 than in 1951 atall classes of member banks.
As noted above, net profits after taxes ofall member banks in 1952 were 10 per centabove the 1951 level and the return on aver-age capital accounts was 7.9 per cent. Thisrate of return is computed from aggregatedollar amounts for all member banks and istherefore weighted heavily by the experience
of the large banks. The 1952 ratios were7.1 per cent for New York City banks, 8.6per cent for Chicago city banks, and 8.1 percent for both reserve city and country banks.
The largest relative increase in net profitsafter taxes—23 per cent—occurred at centralreserve city banks in New York, and thesmallest—4 per cent—at country banks; theincrease at central reserve city banks in Chi-cago was 18 per cent and at reserve citybanks 8 per cent. While the ratio of netprofits to average total capital accounts wasconsiderably higher than in 1951 at thelargest (central reserve city) banks, therewas no change at reserve city banks and asmall decline at country banks.
Expansion in gross earnings varied from14 per cent at central reserve city banks inNew York to 11 per cent at country banks;
MEMBER BANK EARNINGS, BY CLASS OF BANK, 1952 AND 1951
[Dollar amounts in millions]
ItemTotal
1952 1951
Central reserve city banks
New York
1952 1951
Chicago
1952 1951
Reservecity banks
1952 1951
Countrybanks
1952 1951
EarningsOnU. S. Government securities
On other securitiesOn loansAll other
ExpensesSalaries and wagesInterest on depositsAll other
Net current earnings before income taxe
Recoveries and profits1
Losses and charge-offs 2
Net increase in valuation reserves3
Profits before income taxesTaxes on net income
Net profitsCash dividends declared4
Ratios (per cent):Net current earnings before income taxes t
Average total capital accountsAverage total assets
Net profits to—Average total capital accountsAverage total assets
$4,120929235
2,306650
2,5011,244
365893
1,619
113226
681,437
608
829390
IS.41.06
7.90.55
$3,669832211
2,003623
2,2321,125
306801
1,437
139202128
1,247491
756371
14.41.00
7.60.53
$69113443
378137
371213
18140
321
2525
8313139
17595
13.11.08
7.10.59
$60812737
308136
334196
12126
274
331733
256114
14293
11.50.97
5.90.50
$16949128326
93441434
76
1194
7429
4518
14.50.97
8.60.58
$15145126925
83411230
68
711105517
3816
13.70.91
7.70.51
$1,594344
87915248
974478160337
620
389229
537241
295156
17.11.06
8.10.51
$1,413298
77804235
861429134298
552
599248
471196
275147
16.21.01
8.10.50
$1,66540393
930240
1,063509173381
602
3910127
513199
314122
15.61.07
8.10.56
$1,497362
84822228
954460147347
543
408137
464163
301115
14.91.03
8.20.57
includes recoveries credited either to undivided profits or to valuation reserves.2Includes losses charged either to undivided profits or to valuation reserves.3This is the net of transfers from undivided profits to valuation reserves and vice versa, and of losses charged and recoveries credited
to valuation reserves.4Includes interest on capital notes and debentures.
MAY 1953 467
Digitized for FRASER http://fraser.stlouisfed.org/ Federal Reserve Bank of St. Louis

MEMBER BANK EARNINGS, 1952
it was 12 per cent at central reserve citybanks in Chicago and 13 per cent at reservecity banks. The expansion in earnings onloans varied from more than 20 per cent atcentral reserve city banks to 13 per cent atcountry banks. The central reserve citybanks, however, reported smaller relative in-creases in earnings on United States Gov-ernment securities than either reserve citybanks or country banks.
Total expenses increased within a rangeof 11-13 per cent at the various classes ofbanks. Net current earnings before incometaxes increased 17 per cent at central reservecity banks in New York and about 12 percent at the other classes of banks.
The ratio of average total capital accounts
to average total assets was lower for 1952than for 1951 at central reserve city banksin New York, higher at such banks in Chi-cago, and unchanged at reserve city andcountry banks. The ratio of total capitalaccounts to total assets less cash assets andUnited States Government securities, how-ever, declined at all classes of banks. As in1950 and 1951, this ratio was lowest at re-serve city banks (14.4 per cent) and highestat central reserve city banks in New York(17.5 per cent).
Summary data by class of bank are shownin the table on page 467, and detailed fig-ures of earnings and related items, togetherwith selected ratios, will be found on pages536-547 of this BULLETIN.
468 FEDERAL RESERVE BULLETIN
Digitized for FRASER http://fraser.stlouisfed.org/ Federal Reserve Bank of St. Louis

OWNERSHIP OF DEMAND DEPOSITS1
In the year ending January 31, 1953, thegrowth in privately held demand depositswas the smallest for any year since 1949. Itamounted to 2.5 billion dollars or about 2.5per cent, compared with 7 per cent in eachof the two preceding years. The slackenedgrowth of demand deposits reflected amongother things the general stability of the econ-omy in 1952 and the effects of higher interestrates on the relative attractiveness of demanddeposits as compared with income produc-ing assets. These developments in turn re-flected the credit and monetary policies pur-
1 This article was prepared by Caroline H. Cagle of theBoard's Division of Research and Statistics.
sued by the Federal Reserve System in 1952.The Federal Reserve System's annual sur-
vey of demand deposit ownership revealsthat the percentage increase in demand de-posits was small for each of the two maincategories of holders—businesses and individ-uals—approximately 3 and 1 per cent, re-spectively. Growth was larger among themiscellaneous demand deposit holders,amounting to about 6 per cent in the caseof nonprofit associations. Farmers' demandbalances changed little.
Business deposits. Additions to demanddeposits of nonfinancial businesses in the yearending January 31, 1953 amounted to 1.5
OWNERSHIP OF DEMAND DEPOSITS BY INDIVIDUALS AND BUSINESSES
BILLIONS OF DOLLARS120
BILLIONS OF DOLLARS28
1942 1950 1946 1950
* Includes deposits of trust funds and foreigners.NOTE.—Estimates based on Federal Reserve surveys of deposit ownership. Latest figures are for Jan. 31, 1953.
MAY 1953 469
Digitized for FRASER http://fraser.stlouisfed.org/ Federal Reserve Bank of St. Louis

OWNERSHIP OF DEMAND DEPOSITS
billion dollars, about 3 per cent as comparedwith 8 per cent in 1951 and 7 per cent in1950. The difference in growth was asso-ciated principally with smaller increases formanufacturing and mining and for tradeconcerns.
TABLE 1
OWNERSHIP OF DEMAND DEPOSITS OF INDIVIDUALS,
PARTNERSHIPS, AND CORPORATIONS
[Estimates, dollar amounts in billions]
Type of holder
Domestic businesses—total. .
N on financial businesses—total.
Manufacturing and mining.Public utilitiesTradeOther nonfinancial
Financial businesses—total
Insurance companies.Other financial
Individuals—totals. . .
FarmersOther individuals.
Other holders—total.
Trust fundsNonprofit associations. .Foreigners3
Total. .
AmountoutstandingJan. 31, 1953
57.4
48.1
21.94.5
15.16.6
9.2
3.16.1
33.4
7.226.2
5.7
1.53.60.7
96.5
Change fromJan. 31, 1952
Dollaramount
+1.8+1.5+0.6+0.1+0.3+0.5+0.3
+0.2+0.1+0.4
0)+0.4
+0.2
(0+0.2
(0+2.5
Per-centage
+3.3+3.3
+2.8+3.0+ 1.9+8.6+3.5+6.8+ 1.9
+ 1.3
()+ 1.6
+3.6
~0.2+5.5+2.2+2.6
1Less than 50 million dollars.2Less than 0.05 per cent.3 Excludes foreign banks and governments.NOTE.—Detailed figures may not add to totals because of round-
ing.
Expansion in demand deposits in the re-cent 12-month period amounted to about 3per cent for manufacturing and mining andfor public utility concerns, while the growthfor trade concerns was less than 2 per cent, asshown in Table 1. The largest increase forany major industrial group, nearly 9 per cent,was in demand deposits held by the "othernonfinancial" group, which includes variousservice and construction lines. The relativelylarge expansion for this group may be ex-plained in part by an advanced level of sales
and expenses in late 1952 and early 1953,which called for larger cash balances.
Sharply reduced growth in business de-mand deposits in the recent 12-month period,as compared with the two previous years, isprobably the result of a number of factors.For the year as a whole the increase in busi-ness activity was moderate in contrast withthe pronounced rises during the previoustwo years. This meant that business require-ments for increased working balances wereless pressing, particularly in view of the largeincreases that had occurred in the previousyears. Contributing to this development wasthe substantial decline in farm prices in 1952,which reduced the working capital needs ofthe food processing, packaging, and distribut-ing industries, an important business sector.
Other factors tending to restrain the ex-pansion of business deposits among cor-porations in 1952 as compared with 1950 and1951 may have been the lower level of cor-porate profits and the larger expendituresfor new plant and equipment. These de-velopments may have caused some businessesto draw on available cash balances.
Still another factor in the decisions of busi-ness managements concerning their holdingsof cash balances was the increase in interestrates last year. The rise in yields on short-term investments undoubtedly influencedbusinesses with liquid resources temporarilyin excess of operating needs to keep themfully invested, and the fact that businesseshad to pay somewhat more for borrowedfunds may have caused more careful scrutinyof credit needs and more concern with keep-ing available funds in use.
Growth of 300 million dollars, or about3.5 per cent, in the demand deposits offinancial businesses in the 12 months end-ing January 31, 1953 accompanied a verylarge increase in individual savings. Savings
470 FEDERAL RESERVE BULLETIN
Digitized for FRASER http://fraser.stlouisfed.org/ Federal Reserve Bank of St. Louis

OWNERSHIP OF DEMAND DEPOSITS
and loan associations and credit unions in-creased their demand deposits in line withtheir other assets. For these institutions, aswell as for life insurance companies, thegrowth in total assets was the largest in theirhistory. Last year's increase in demand de-posits for all financial businesses taken asa group, however, was less than half that ineach of the two preceding years, reflecting inpart at least the attraction of higher yieldson investments and the heavy volume ofborrowing from savings institutions.
TABLE 2
OWNERSHIP OF DEMAND DEPOSITS OF CORPORATE AND
NONCORPORATE BUSINESSES
[Estimates, dollar amounts in billions]
Type of holder
Domestic busi-nesses—total..
Nonfinancial—total
Manufacturingand mining. . .
Public utilities. .TradeOther nonfinan-
cial
Financial—total. . .
InsuranceOther financial..
Jan. 31,1953
Cor-porate
43.3
36.2
19.94.38.5
3.6
7.1
2.94.2
Non-cor-
porate
14.0
11.9
2.00.36.6
3.0
2.1
0.21.9
Change fromJan. 31, 1952
Dollaramount
Cor-porate
+ 1.3
+ 1.0
+0.6+0.1+0.1
+0.3
+0.3
+0.2+0.1
Non-cor-
porate
+0.5
+0.5
0)0)
+0.2
+0.2
C1)
0)0)
Percentage
Cor-porate
+3.2
+2,9
+2.9+2.8+0.8
+8.9
+4.4
+6.1+3.2
Non-cor-
porate
+3.7
+4.3
+ 1.8+5.6+3.3
+8.3
+0.6
+ 17.0-0.9
1Less than 50 million dollars.NOTE.—Detailed figures may not add to totals because of round-
ing.
There was little difference in the patternof change in demand deposit holdings as be-tween corporations and unincorporated busi-nesses. Corporate business demand depositsincreased moderately in all groups, as shownby Table 2, and holdings of noncorporatebusinesses also registered increases in all sec-tors except the "other financial" category,which showed a small decline.
Individual deposits. Individuals increasedtheir demand deposits about 400 million dol-lars, or 1 per cent, as compared with 6 percent in each of the two previous years. Therewas also an increase of approximately onebillion dollars in currency, presumablylargely held by individuals. Growth in thetotal of demand deposits and currency heldby individuals was probably between 3 and4 per cent, or approximately proportionateto the increase in consumer spending.
Personal savings were larger in 1952 thanin either of the two previous years, and in-dividuals added considerably to their liquidassets. The major part of the growth was informs of savings on which some income couldbe expected. Time deposits of individualsincreased by about 4 billion dollars, share bal-ances in savings and loan associations by 3billion, and equity in life insurance com-panies by 4 billion. Except for time deposits,which had increased somewhat more in theperiod 1944-46, these were the largest annualincreases on record for these types of savings.Net security purchases by individuals werelikewise substantial in volume, about 4 bil-lion dollars, primarily in the form of cor-porate bonds and stocks.
The small increase in demand deposits ofindividuals in the recent period thus reflectsto a significant extent the attractiveness toindividuals of the increased earnings offeredon savings deposits, savings and loan shares,and other available investments. It may alsoreflect a slackening in the demand for check-ing account funds by individuals for day-to-day operating purposes.
For the country as a whole there was littlechange in farmers' demand balances in the12-month period under review. This develop-ment followed two years of sharp increases,and probably reflected to some extent thefact that farmers about held their own from
MAY 1953 471
Digitized for FRASER http://fraser.stlouisfed.org/ Federal Reserve Bank of St. Louis

OWNERSHIP OF DEMAND DEPOSITS
TABLE 3
PERCENTAGE CHANGES IN DEMAND DEPOSITS OF FARMERSAND OTHER INDIVIDUALS, BY FEDERAL RESERVE DISTRICT
JANUARY 31, 1952 TO JANUARY 31, 1953
Federal Reserve district
BostonNew YorkPhiladelphia
ClevelandRichmondAtlanta
ChicagoSt. LouisMinneapolis
Kansas CityDallasSan Francisco
All districts
Farmers
+2.0+ 1.9+ 1.6+6.4+2.6-3.2
-0.7-1.4-2.2
+6.3-5.7-1 .3
0)
Other individuals
-3.1-4.2+ 1.6+3.4+5.0+6.4- 1 . 1+7.2+ 1.4+4.3+6.8+2.3+ 1.6
1Less than 0.05 per cent.
the standpoint of net income in 1952, whereasin the two preceding years total net farmincome expanded sharply. Farmers' balancesactually declined last year in half of the Fed-
eral Reserve districts, for the most part in theDeep South, the Mississippi Valley, and theFar West, as shown in Table 3.
Miscellaneous deposits. Miscellaneous de-posit holders account for a very small partof the aggregate amount of demand depositsof individuals, partnerships, and corpora-tions. The growth in their holdings in theyear ending January 31, 1953 amounted to200 million dollars, or about 4 per cent.Nonprofit associations accounted for nearlyall of the expansion, with a percentage in-crease from last year of about 6 per cent.This was a lower rate than in 1950 or 1951,perhaps in part because of an expansion inbuilding programs by these organizationsfollowing the lifting of controls over suchconstruction last year. In part the smaller in-crease may also reflect the greater attractive-ness than in former years of the yields onother forms of liquid assets.
TABLE 4
OWNERSHIP OF DEMAND DEPOSITS OF INDIVIDUALS, PARTNERSHIPS, AND CORPORATIONS, SELECTED DATES, 1941-53
[Estimates, in billions of dollars]
Type of holder
Domestic businesses—total
CorporateNoncorporate
Nonfinancial businesses—total
Manufacturing and miningPublic utilitiesTradeOther nonfinancial
Financial businesses—total
Insurance companiesOther financial
Individuals—total
FarmersOther individuals
Other holders—total
Trust fundsNonprofit associationsForeigners—businesses and individ-
uals
Total
Dec. 31,1941
24.8*
20.4
10.03.14 62.7
4 4
1.92.59.6**
3 2
*
*
37.6
Feb. 29,1944
35.9*
31.5
16.33.78 23.4
4 3
1.72.6
17.7
4 213.5
3.6
1 31.5
0.8
57.2
Jan. 31,1945
40.4
30.69.9
35.3
17.53.7
10 33.7
5.2
1.93.3
21.5
5.016.5
4.0
1.41.9
0.7
65.9
Jan. 31,1946
42.9
31.111.9
37.0
16.14.0
12.64.2
5.9
1.84.1
26.4
6 320.1
4.81 62.4
0.8
74.1
Feb. 26,1947
43.8
32.111.7
37.2
16.04.2
12.54.5
6.5
2.1
4.5
28.9
7.221.7
5.2
1.72.7
0.8
77.8
Jan. 30,1948
47.1
35.012.1
39.8
17.34.1
13.44.9
7.4
2.74.7
30.1
7.522.6
5.2
1.62.8
0.7
82.4
Jan. 31,1949
46.6
34.911.7
39.4
17.13.9
13.45.0
7.2
2.54.7
29.1
7.122.0
5.1
1 62.9
0.7
80.8
Jan. 31,1950
47.9
36.111.8
40.2
17.64.0
13 35.3
7.7
2.75.0
29.1
6.822.3
5.0
1 52.9
0.6
82.0
Jan. 31,1951
51.6
39.212.4
43.2
19.54.4
13 95.4
8 4
2.85.6
30.8
7 023.8
5.3
1 63.0
0.6
87.7
Jan. 31,1952 r
55.5
42.013.5
46.6
21.34.4
14 86.1
8 9
3.06.0
33.0
7 225.8
5 5
1 53.4
0.6
94.0
Jan. 31,1953
57.4
43.314.0
48.1
21.94.5
15 16.6
9 2
3.16.1
33.4
7 226.2
5 7
1 53.6
0.7
96.5
r Revised. * Not available.NOTE.—Detailed figures may not add tals because of rounding.
472 FEDERAL RESERVE BULLETIN
Digitized for FRASER http://fraser.stlouisfed.org/ Federal Reserve Bank of St. Louis

OWNERSHIP OF DEMAND DEPOSITS
Size of accounts. Changes in the volumeof business deposits held in various sizes ofaccounts were small in the year ending Janu-ary 31, 1953, as in other recent years. Thepercentage increase was roughly the samein each size of account and thus there waslittle change in the proportion of the totalheld in each account size.
Among individuals, on the other hand, theamount of demand deposits held in thelargest accounts (more than $25,000) de-
clined in 1952, while there was an increase
in the amount held in the smaller accounts
(less than $10,000). There was little change
in accounts of intermediate size ($10,000-
$25,000). The decline in the large accounts
may have been due to a greater sensitivity of
these accounts to the higher interest return
available on investments and to a shift of
funds from these demand accounts to securi-
ties or other forms of investment.
CURRENT EVENTS AND ANNOUNCEMENTS
Publication of the Annual Report of theBoard of Governors
The Thirty-ninth Annual Report of the Boardof Governors of the Federal Reserve System, cover-ing operations for the calendar year 1952, is avail-able for distribution. Copies may be obtained uponrequest from the Division of Administrative Serv-ices, Board of Governors, Washington 25, D. C.
Federal Reserve Meetings
The Conference of Chairmen of the Federal Re-serve Banks met with the Board of Governors inWashington on April 28, 1953.
The Federal Advisory Council held a meeting inWashington on May 17-19, 1953, and met with theBoard of Governors of the Federal Reserve Systemon May 19.
Changes in Board's Staff and OrganizationMr. David B. Hexter, formerly Associate Chief
Counsel in the Office of the Comptroller of theCurrency, was appointed Assistant General Counselin the Board's Legal Division and assumed hisduties on April 27, 1953. Mr. Hexter is a graduateof West Virginia University and the Harvard Uni-versity Law School and had been with the Officeof the Comptroller of the Currency since 1939.
Effective April 29, 1953, the Board of Governorsauthorized the discontinuance of the Office of theSolicitor and the personnel of that Office wastransferred to the Legal Division. Mr. G. How-land Chase, who had been serving as AssistantSolicitor, was appointed to the position of As-sistant General Counsel.
Resignation of Mr. Gidney as President of the FederalReserve Bank of Cleveland and the Appoint-
ment of Mr. Fulton as His Successor
Effective as of the opening of business on April16, 1953, Mr. Ray M. Gidney, who had been servingas President of the Federal Reserve Bank of Cleve-land since November 1, 1944, resigned to acceptappointment as Comptroller of the Currency. In1917, after having been on the staff of the FederalReserve Board for two and one-half years, Mr. Gid-ney joined the staff of the Federal Reserve Bank ofNew York, where he served in various official ca-pacities, including Manager of the Buffalo Branch,Controller of Loans, Deputy Governor, and As-sistant Federal Reserve Agent. He was serving asa Vice President of the Federal Reserve Bank otNew York when he was appointed President of theFederal Reserve Bank of Cleveland.
Mr. W. D. Fulton, who had been serving asFirst Vice President of the Federal Reserve Bankof Cleveland since January 1, 1953, was appointedPresident to succeed Mr. Gidney. Following aboutten years' experience in the commercial banking andaccounting fields and with the Reconstruction Fi-nance Corporation, Mr. Fulton joined the staff ofthe Federal Reserve Bank of Cleveland as an Ex-aminer on May 1, 1933. He subsequently servedas Chief Examiner and Assistant Vice President,and was serving as Vice President in charge ofthe Cincinnati Branch at the time of his appoint-ment as First Vice President.
MAY 1953 473
Digitized for FRASER http://fraser.stlouisfed.org/ Federal Reserve Bank of St. Louis
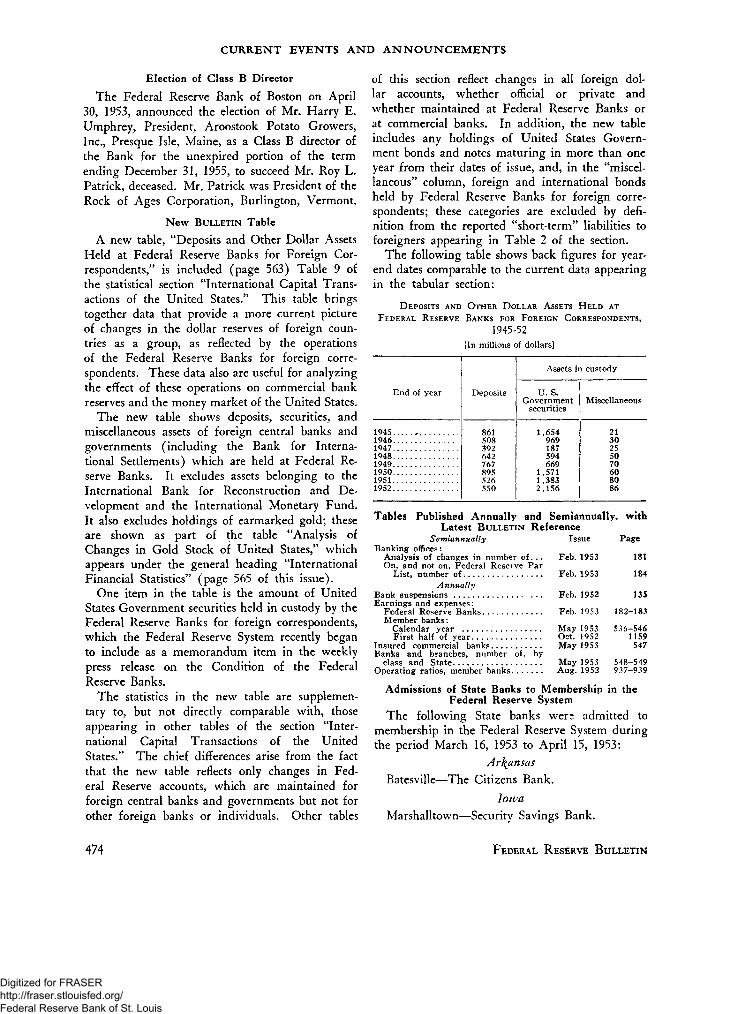
CURRENT EVENTS AND ANNOUNCEMENTS
Election of Class B Director
The Federal Reserve Bank of Boston on April30, 1953, announced the election of Mr. Harry E.Umphrey, President, Aroostook Potato Growers,Inc., Presque Isle, Maine, as a Class B director ofthe Bank for the unexpired portion of the termending December 31, 1955, to succeed Mr. Roy L.Patrick, deceased. Mr. Patrick was President of theRock of Ages Corporation, Burlington, Vermont.
New BULLETIN TableA new table, ''Deposits and Other Dollar Assets
Held at Federal Reserve Banks for Foreign Cor-respondents," is included (page 563) Table 9 ofthe statistical section "International Capital Trans-actions of the United States." This table bringstogether data that provide a more current pictureof changes in the dollar reserves of foreign coun-tries as a group, as reflected by the operationsof the Federal Reserve Banks for foreign corre-spondents. These data also are useful for analyzingthe effect of these operations on commercial bankreserves and the money market of the United States.
The new table shows deposits, securities, andmiscellaneous assets of foreign central banks andgovernments (including the Bank for Interna-tional Settlements) which are held at Federal Re-serve Banks. It excludes assets belonging to theInternational Bank for Reconstruction and De-velopment and the International Monetary Fund.It also excludes holdings of earmarked gold; theseare shown as part of the table "Analysis ofChanges in Gold Stock of United States," whichappears under the general heading "InternationalFinancial Statistics" (page 565 of this issue).
One item in the table is the amount of UnitedStates Government securities held in custody by theFederal Reserve Banks for foreign correspondents,which the Federal Reserve System recently beganto include as a memorandum item in the weeklypress release on the Condition of the FederalReserve Banks.
The statistics in the new table are supplemen-tary to, but not directly comparable with, thoseappearing in other tables of the section "Inter-national Capital Transactions of the UnitedStates." The chief differences arise from the factthat the new table reflects only changes in Fed-eral Reserve accounts, which are maintained forforeign central banks and governments but not forother foreign banks or individuals. Other tables
of this section reflect changes in all foreign dol-lar accounts, whether official or private andwhether maintained at Federal Reserve Banks orat commercial banks. In addition, the new tableincludes any holdings of United States Govern-ment bonds and notes maturing in more than oneyear from their dates of issue, and, in the "miscel-laneous" column, foreign and international bondsheld by Federal Reserve Banks for foreign corre-spondents; these categories are excluded by defi-nition from the reported "short-term" liabilities toforeigners appearing in Table 2 of the section.
The following table shows back figures for year-end dates comparable to the current data appearingin the tabular section:
DEPOSITS AND OTHER DOLLAR ASSETS HELD AT
FEDERAL RESERVE BANKS FOR FOREIGN CORRESPONDENTS,
1945-52[In millions of dollars]
End of year
19451946194719481949195019511952...
Deposits
861508392642767895526550
Assets in custody
U.S.Government
securities
1,654969187594669
1,5711,3832,156
Miscellaneous
2130255070608086
Tables Published Annually and Semiannually, withLatest BULLETIN Reference
Semiannually Issue PageBanking offices:
Analysis of changes in number of. . . Feb. 1953 181On. and not on, Federal Reserve Par
List, number of Feb. 1953 184Annually
Bank suspensions Feb. 1952 135Earnings and expenses:
Federal Reserve Banks Feb. 1953 182-183Member banks:
Calendar year May 1953 536-546First half of year Oct. 1952 1159
Insured commercial banks May 1953 547Banks and branches, number of, by
class and State May 1953 548-549Operating ratios, member banks Aug. 1952 937-939
Admissions of State Banks to Membership in theFederal Reserve System
The following State banks were admitted tomembership in the Federal Reserve System duringthe period March 16, 1953 to April 15, 1953:
ArkansasBatesville—The Citizens Bank.
IowaMarshalltown—Security Savings Bank.
474 FEDERAL RESERVE BULLETIN
Digitized for FRASER http://fraser.stlouisfed.org/ Federal Reserve Bank of St. Louis

NATIONAL SUMMARY OF BUSINESS CONDITIONS[Compiled April 24 and released for publication April 28]
Manufacturing and construction activity rosefurther in March and in April continued at ad-vanced levels. Retail sales remained well above ayear ago, with auto sales up sharply from last yearand most other lines showing substantial gains.The average levels of wholesale and consumer priceschanged little. Demand for bank credit continuedstrong.
INDUSTRIAL PRODUCTION
The Board's index of output at factories andmines increased two points further in March to242 per cent of the 1935-39 average—a level one-tenth higher than a year ago and one-fifth abovemid-1950. In April output has apparently beenmaintained close to this advanced level.
The rise in March reflected largely continuedmarked gains in output of metals and metal prod-ucts. Steel rose to a new record annual rate of119.5 million tons. Owing mainly to recent sharpexpansion in aluminum, nonferrous metals outputwas about 20 per cent above a year ago. Activityin the automobile, aircraft, and machinery indus-tries expanded further, and output of buildingmaterials was maintained in very large volume.While production of most household durable goodsrose in March, television production was cut asbusiness stocks began to accumulate and, in April,output has been curtailed considerably further. Steelproduction also has declined somewhat in Aprilowing to temporary factors.
Output of nondurable goods rose further in
INDUSTRIAL PRODUCTIONPer C e n t , F h y s i c o l V o l u m e , S e a s o n a l l y A d j u s t e d , 1 9 3 5 - 3 9 = 1 0 0
March to about the peak rate of early 1951 as ac-tivity in the chemical, rubber products, and foodindustries continued to expand. Output of mostother nondurable goods was maintained. In thefirst three weeks of April, beef production increasedfurther and, despite a decline in pork production,total meat output was estimated at 12 per cent abovea year ago.
Output of crude petroleum and its productshas been curtailed moderately beginning in March,and coal output has been maintained at relativelylow levels.
CONSTRUCTION
Value of construction contract awards increasedseasonally in March for most major categories.Housing units started increased less than seasonallyto 97,000 from 77,000 in February; a year earlier104,000 were started. Value of new constructionwork for private residential and nonresidential pur-poses increased further in March.
EMPLOYMENT
Seasonally adjusted employment in nonagri-cultural establishments in March continued at therecord level of 49.1 million (revised series) and wasabout 1.5 million above a year ago. Averageweekly earnings at factories advanced to $72.10in March—8 per cent larger than a year ago.Unemployment declined seasonally to 1.7 million,the lowest March level in the postwar period.
PRICES AND TRADE
WHOLESALE PRICES
1949 1950 1951 1952 1953 1949 1950 1951 1952 1953
Federal Reserve indexes. Monthly figures, latest shown arefor April.
Seasonally adjusted series except for prices. Price indexescompiled by Bureau of Labor Statistics. Total retail sales anddisposable personal income, Federal Reserve indexes based onDepartment of Commerce data. Department store trade, Fed-eral Reserve indexes. Monthly figures, latest shown are forMarch.
MAY 1953 475
Digitized for FRASER http://fraser.stlouisfed.org/ Federal Reserve Bank of St. Louis

NATIONAL SUMMARY OF BUSINESS CONDITIONS
DISTRIBUTIONDepartment store sales in March and the first
three weeks of April remained above year-agolevels and close to the level of the two precedingmonths, after allowances for Easter and other sea-sonal influences. In March, seasonally adjustedsales at other retail outlets continued substantiallyhigher than a year ago. Sales of new and usedcars were up sharply from March last year. Stocksat department stores rose less than seasonally inMarch, according to preliminary estimates, andwere only moderately larger than a year ago.
COMMODITY PRICESThe average level of wholesale prices declined
slightly from the latter part of March to the latterpart of April. At the end of March, future pricesfor grains, cotton, wool tops, hides, and rubberdeclined sharply for a day or two in response tointernational developments. Decreases in spotprices were more moderate. While prices of mostof these commodities subsequently firmed, sharpdecreases developed in the markets for nonferrousmetals and steel scrap. Cattle prices changed littlefrom earlier lows despite a resumption of heavymarketings, and hog prices continued to show alarger than seasonal advance.
Consumer prices advanced .2 per cent in Marchwith most groups of goods and services increasingsomewhat, reflecting in part adjustments to theelimination of remaining price controls.
BANK CREDITDemand for bank credit continued strong in
late March and the first half of April although totalloans and investments at banks in leading cities
COMMERCIAL LOANSMIMIER 1ANKS IN HADING CITIESBillions of Dollars
TOTAL OUTSTANDING
SELECTED INDUSTRIESCUMULATIVE CHANGEFROM JUNE 1951
/METALS . FOODS and,-. / ,4 COMMODITY-| V / \ DEALERS
SALES FINANCE
Data reported by over 200 of the largest member banks.Metals include machinery and transportation equipment. Foodsinclude liquor and tobacco. Petroleum includes coal, chemicals,end rubber. Wednesday figures, latest shown are for April 29.
476
declined further as a result of continued large de-clines in holdings of Government securities. Satesfinance companies and trade concerns increasedtheir outstanding bank loans. "Other loans," re-flecting in large part consumer spending, con-tinued to expand substantially at weekly reportingbanks. Bank loans on real estate and investmentsin municipal and corporate securities also rosefurther. Commodity dealers and food processorscontinued to repay seasonal borrowings.
Interest rates charged by commercial banks onshort-term business loans averaged 3.54 per centin the first half of March, as compared with 3.51per cent in the first half of December. Averagerates rose somewhat at banks in the south andwest but showed little change elsewhere.
Member bank reserve positions remained gen-erally tight during the first three weeks of April.Member bank borrowing from the Federal Reserveaveraged around 1J4 billion dollars, and excessreserves around 600 million.
SECURITY MARKETS
Yields on Treasury and other high-grade se-curities advanced further during the first threeweeks of April. Common stock prices declined tolevels prevailing in the first half of November 1952.
On April 8 the Treasury announced a cash offer-ing of 1 billion dollars of 3 J4 per cent bonds of June1978-83 and also offered the bond in exchange forSeries F and G savings bonds maturing in 1953.The Treasury announced that the total of theregular weekly bill issues would be increased about1 billion dollars before the end of June.STOCK MARKET
~ I1950
_ YIELDS
, _
1951
• ^ ^
1952
\
1953
6
4
Prices, SEC index for 265 common stocks on 1935-39 base,converted to 1947-49 base by Federal Reserve. Volume, NewYork Stock Exchange average; daily volume of trading. Yields,Moody's data for 200 common stocks. Prices and volume areweekly, latest shown are for week ending Apr. 25. Yields aremonthly; latest shown are for April.
FEDERAL RESERVE BULLETIN
Digitized for FRASER http://fraser.stlouisfed.org/ Federal Reserve Bank of St. Louis

FINANCIAL, INDUSTRIAL, AND COMMERCIAL STATISTICSUNITED STATES
PAGE
Member bank reserves, Reserve Bank credit, and related items 479-480
Federal Reserve Bank rates; margin requirements; reserve requirements 480-481
Reserves and deposits of member banks 482
Federal Reserve Bank statistics 483-485
Regulation V: guaranteed loans, fees, and rates 485-486
Bank debits and deposit turnover; Postal Savings System 486
Money in circulation 487
Consolidated statement of the monetary system; deposits and currency. . 488
All banks in the United States, by classes 489-491
All commercial banks in the United States, by classes 492-493
Weekly reporting member banks 494-495
Commercial paper and bankers' acceptances 496
Life insurance companies; savings and loan associations 497
Government corporations and credit agencies 498-499
Security prices and brokers' balances 500
Money rates; bank rates on business loans; bond and stock yields 501
Treasury finance 502-507
New security issues 508
Business finance 509-510
Real estate credit statistics 511-513
Statistics on short- and intermediate-term consumer credit 514-516
Business indexes 517-526
Merchandise exports and imports 526
Department store statistics 527-531
Consumers' and wholesale prices 532-533
Gross national product, national income, and personal income 534-535
Member bank earnings, 1952 536-547
Number of banks and branches in operation on December 31, 1952 . . . 548-549
Weekly reporting member banks-revised series, total for all leading cities 550-555
List of tables published in BULLETIN annually orsemiannually, with references for latest data 474
Tables on the following pages include the principal statistics of current significance relating tofinancial and business developments in the United States. The data relating to Federal ReserveBanks, member banks of the Federal Reserve System, and department store trade, and the consumercredit estimates are derived from regular reports made to the Board; index numbers of productionarc compiled by the Board on the basis of material collected by other agencies; figures for goldstock, money in circulation, Treasury finance, and operations of Government credit agencies areobtained from statements of the Treasury; the remaining financial data and other series on businessactivity are obtained largely from other sources. Back figures through 1941 for banking andmonetary tables, together with descriptive text, may be obtained from the Board's publication,Banking and Monetary Statistics; back figures for many other tables may be obtained from earlierBULLETINS.
MAY 1953 477
Digitized for FRASER http://fraser.stlouisfed.org/ Federal Reserve Bank of St. Louis
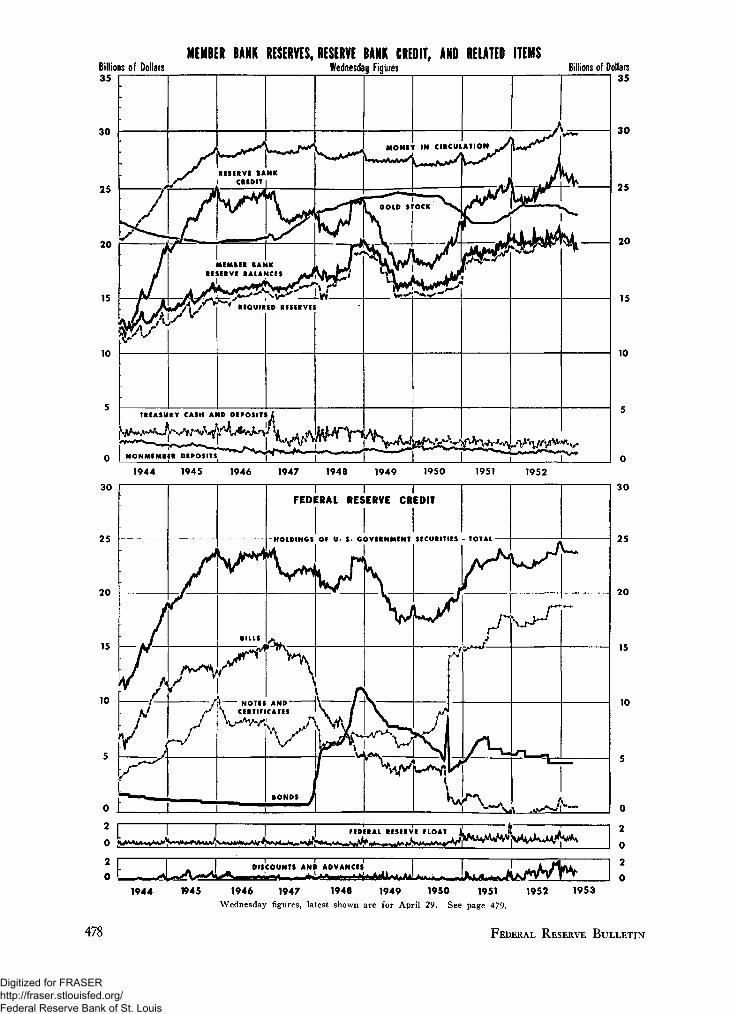
MEMBER BANK RESERVES, RESERVE BANK CREDIT, AND RELATED ITEMSBillions of Dollars Wednesday Figures Billions of Dollars35
/ ' Jf ^\/r \ ^A<fS-^\ L o o l D * T O C K ^ \
TREASURY CASH AND DEPOSITS!
15
10
1944 1945 1946 1947 1948 1949 1950 1951 1952
30
10
I FEDERAL RESERVE FLOAT TT . 4 . . H ~ [ Jl '.
15
10
I I IFEDERAL RESERVE CREDIT
HOLDINGS OF U S GOVERNMENT SECURITIES • TOTAL
o sDISCOUNTS AND ADVANCES
1944 1945 1946 1947 1948 1949 1950 1951 1952 1953
Wednesday figures, latest shown are for April 29. See page 479.
478 FEDERAL RESERVE BULLETIN
Digitized for FRASER http://fraser.stlouisfed.org/ Federal Reserve Bank of St. Louis

MEMBER BANK RESERVES, RESERVE BANK CREDIT, AND RELATED ITEMS
D ate
Wednesday1952
Mar.Mar.Mar.Mar.
Apr.Apr.Apr.Apr.Apr.
MayMayMayMayJuneJuneJuneJane
JulyJulyJulyJulyJuly
Aug.Aug.Aug.Aug.
Sept.Sept.Sept.Sept.
Oct.Oct.Oct.Oct.Oct.
Nov.Nov.Nov.Nov.
Dec.Dec.Dec.Dec.Dec.
5121926
29162 3 . . . .307. . . .14. . . .21284. . . .111825....29. . . .16. . . .2330613202731017. . . .241. . . .815. . . .2 2 . . . .29. . . .
5121926
310. . . .1.7....2431
195JJan. 7Jan.Jan.Jan.
Feb.Feb.Feb.Feb.
Mar.Mar.Mar.Mar.
Apr.Apr.Apr.Apr.Apr.
1421....28
4111825. ...
4. ...111825
1. ...8152229....
End ofmonth1952
Apr. .MayJuneJuly.Aug.Sept.Oct.Nov.Dec.
1Jan..Feb..Mar.Apr..
953
Reserve Bank credit outstanding
U.S. Govt. securities
Total
22,51422,53022,82522,528
22,51422,49422,46722,37222,363
22,32922,31522,28322,273
22,37822,49222,99722,564
22,86922,86022,72322,72622,844
22,97723,05123,03223,092
23,18223,22923,74023,715
23,69423,66323,66323,66323,624
23,52023,56723,56323,761
23,96824,23924,46924,61324,697
24,39124,20524,03423,970
23,98923,92923,89023,853
23,85323,85323,96323,869
23,80623,80623,82123,80623,806
22,36322,27322,90622,85323,14623,69423 57523,82124,697
23,94423,87523,80623,880
Boughtout-right
22,51422,51922,82522,528
22 51422,49422,46722,37222,363
22,32922,31522,28322,273
22,27322,27322,91322,564
22,76422,64522,60522,57622,602
22,89123,03223,03223,055
23,11623,11623,74023,715
23,69423,66323,66323,66323,624
23,49523,49223,50223,612
23,712^^ 78723,91423,99724,034
24,03424,03424,03423,970
23,88823,88823,88823,853
23,85323,85323,96323,869
23,80623,80623,80623,80623,806
23 36322,27322,76422,60223,09223,69423,49523 61224,034
23,88823,85323,80623,806
Heldunder
repur-
agree-ment
......
10521984
1052151181502428619
" " 3 7
66113
257561149256452555616663
357171
101412
"15
"14225154
80209663
5623
' '74
Dis-countsandad-
vances
1
11
1
1111111111
11
111
11
11
11
11
1,
384357126170130167622830676,043671499816926834541307480683974,073,403
843770979897968880313400544,019772,130,171
,663,583,486,615
,591752,022,728156
,336,076862,307
,385329732806
824315009705465908868842837
67695259270318477591895156
735309485014
Float
1
1
1
1
1
1
1
1
11
1
1
1
1
1
981886,260710761726,015766588690774,008648770798,284877801918969871655616727795610661759,191738721698887070'706
528542,140921,188866,543,515967
965881005728770649023743062770202810748709856743581
588922581694747572685020967
796006632649
Allother1
55555555555555555555454544554444444443434444
44444'4|4!4444444443
555545444
4433
[In
Total
2323242323232423232423232324242423242424242424242424242425242425252525252526262626272725
26262526
26252525
25252625
2525252525
232423242524252625
26262425
,883,778,216,413
409!393,109,973,632
,067,764,794,742
,079,128,828,753
,155,465,671,674,907
,440,553,810,603
,816,872,249,857
,963,384,325867[505
,714,696,193,301
,751860,'O39,860,825
,695,166,904,009
,148,912,648,406
,742,941,178,387
023,427549395227
632152551821216747855740825
478194927546
millions of dollars]
Goldstock
2323232323232323232323232323232323232323232323232323232323232323232323232323232323232323
23232323
22222222
22222222
2222222222
232323232323232323,
22,22,22
,290,291,292,291
291,'293,293,295,297
,297,297,298,296
,296,297,297,346
,346,347,348,350,350
,350,344,344,344
,344,344,344,343
,342,341,341340[340
,339,338,337338337337'277186187
137137088036935832722662662611612562563562562562562
298296346350344342339338187
986662563
P22.562
i rens-urycur-rencyout-
stand-ing
44444444444444444444444444444444444444444444
44444444444444444
4444,4,4,4f4J4,
4,4,4,
j>4,
,726,726,729,731
736\i36,737,738,739
,739,739,739,741
,747,750,751,752
,755,754,756,756,761
,763,764,766,768
,774,776780781787,787787790790794794797797803804806809812
814814814815
820820821821
824824826826
827828833834836
739748754762776786795802812
820824829839
Moneyincir-cula-tion
28282828
2828282828
28282828
28282828
2929282828
29292929
29292929
2929292929
29292930
3030303030
30292929
29292929
29292929
2929292929
2828'29,28,29,29,29,30,'30,
29,29,29,
,464,452,361,329
445[526,436,333,460
,523,497,483,710
,842,830,787,814
,180,148988884952041051068129391364292247417545617511540748905842152274370487732433
153884687592
657776654735772780708600754780753722787
464767026978293419644236433
691793754
P29,836
Treas-urycashhold-ings
1111]111111111111111111111111111111111111111
11111111111111111
111111111
111
PI
,296,296,285,282
281!273,288,287,284
,286,293,279,286
,282,284,286,290
,277,264,271,275,286
,279,277,281,276
,285,279,281,274
,287,280,276281,'289
,278,282,292,267
,278280^269,266,270
,280,280,291,298
,331,312,288,291
,295,299,305,306
,304,300,278,279,278
281',274,283,281,269,278,268261^270
,308,284,293,274
Deposits with F. R.Banks other thanmember bank
reserve balances
Treas-uryde-
posits
67063967
2953815208774507495163845585275079
13490383074826052704225267077153476
264523596212618588789505703317719645371665389
62245534374567243139538948833187
286329341509367
450541333638488508770378389
809336222393
For-eign j yjr
posiis
600566547545565562576538518497539572597
608623600595576638700766785727864839849815789821728722723675684655
643639691711
734720729729550
570699622612562558458454512581496511550568574585518
518599548724812707642758550
586511536506
ersits
295275195191211201277271266265257241216216211168218184268288250257255193218235251159177161162249179245236250244258270147316208201455
343364348337326340244211240345381351344343200356401
266495298267345174245298455
508412342416
OtherFed-eralRe-serveac-
counts
787785803804827827825824749747745745745742742794793798799797797724722718721721717715729726882880881878877805805803801800802860863777
776776774775770770835834830829852852869868865864784
749743783723718723805801777
770833850783
Member breserve
19192120191920191920192019
19192120
2020202020
20202019
19202120
2020202020
20202020
2020212119
20202020
20202019
20202020
1919191919
191919202020202119]
20201919
,787,781,038,276
,812,652,218,875,940
,034,953,127,667
,906,978,232,006
,153,413,422,326,409
,260,136,267,797
760,340067,581
,098,239613779449334447738917939868198400950
902660741502
584376318975090212865148305629932476489
940778381323411066616149950
611511322740
bala
Re-quired2
1919191919191919191919191919191919202019191919191919
19191919
1919202019
19192020
2020202020
20202020
19191919
191920,19,
,166,182,627,500
166076225087143071092181217207226736621104008973875829675692652643511549957901762567089128975884906073409371288582531520
309274255095956894979791840821002854
19,51819,47219,560
P19,488P19.457
19,19,19,19,19,19,9,20'20 i
19,19,19,
143187573828576747996354520
997796607
P19,431
nces
Ex-cess 2
621599
1,411776646576993788797963861946450699752
1,49638549405449451580585444615154249791
1,110680336672524651474450541665508568580616869
-570
593386486407628482339184250391863294
-213157372
p-12P32
797591
-192495835319620795
-570
614715
-285P309
P Preliminary.For footnotes see following page.
MAY 1953 479
Digitized for FRASER http://fraser.stlouisfed.org/ Federal Reserve Bank of St. Louis

MEMBER BANK RESERVES, RESERVE BANK CREDIT, AND RELATED ITEMS—Continued[In millions of dollars]
Dateor
period
End ofm o n t h :
1929—June.1933—June.1939—Dec.1941—Dec.1945—Dec..1947—Dec.1948—Dec.1949—Dec..1950—June.
Dec .1951—June.
Dec.1952—June.
Dec ,Averagesof dailyfiguresMonthly:1952—Apr. .
May.June.July..Aug..Sept .Oct. .Nov.Dec
1953—Jan. .Feb..Mar.Apr. ,
Week ending:Feb. 4 . .Feb. 11.
Reserve Bank credit outstanding
U.S. Govt. securities
Total
2161,9982,4842,254
24,26222,55923,33318,88518,33120,77822,98223,80122,90624,697
1481,9982,4842,254
19,41022,55923,33318,88518,33120,72522,93223,60522,76424,034
22,44822,30822,61722,79823,02723,47123,65723,63824,40024,20223,91823,89223,861
23,23,946
Feb. 18. . . .23,944Feb. 25 J23,852
Mar. 4 ^3,871Mar. 11 123,852Mar. 18. . . . 23,923Mar. 25. . . . 23,985
Apr. 1. . . .123,813Apr. 8 |23,878Apr. 15 123,879Apr. 22. . . .23,852Apr. 29 i23,841
Boughtout-right
22,44822,30822,50522,61722,98323,43323,64423,52723,87624,01123,87523,87823,806
959 23 ,88823,88823,88823,852
23,85223,85223,86823,985
Heldunderrepur-chaseagree-ment
23,81323,80623,80623,80623,806
68
4,852
5350
196142663
112181443813
111524191431455
Dis-countsandad-
vances
1,037164
73
24985
223784367531959
156
365573585
1,0921,059
7231,0931,5771,6331,3721,3361,2201,184
1,5821,5011,2861,106
1,1901,4291,318939
1,1581,3661,2541,0571,186
Float
5249194578535541534326
1,3681,0021,184581967
908818936890734856927954
1,2621,008822909843
708684844981
929865
1,085892
747936792
1,006681
Allother1
3
Total
,400,220,593,361
25,09123,18124,09719,49918,70322,21624,04325,00923,55125,825
23,72623,70424,14424,786
4 24,8245 25,0554 25,681' 26,17227,29926,58626,080
4 26,0254 25,892
26,25326,13526,07825,942
4 25,99426,15026,329
4 25,819
25,72126,18425,929
4 25,91925,711
Goldstock
Treas-urycur-
rencyout-
stand-ing
4,0374,031
17,64422,73720,06522,75424,24424,42724,23122,70621,75622,69523,34623,187
23,29323,29723,30823,34823,34623,34323,34023,33823,27623,10122,79722,60622,562
22,97122,86922,77322,713
22,66222,61222,61222,598
22,56222,56222,562|22,56222,562
Moneyin
cir-cula-tion
2,0192,2862,9633,2474,4,5624,4,5984,6074,636 274,6554,709 294,7544,812
,339 28
,589 28
4,737 284,740 28444,765 294,778
,751,756
4,7884,7964,8064,8144,8214,8254,832
4.819 294.820 294,8214,821
4,8234,8244,8254,826 29
4,826 294,8284,8304,8344,835
4,4595,4347,59811,160
,51528,868
,22427,60027,156
,74127,809
,20629,02630,433
,459,557
28,84329,028
,08829,34329,55529,90430,49429,92029,718•29,752
29,782
,680,716
29,73629,690
29,78829,80529,797
,674
,71229,82629,78729,76629,744
Treas-urycashhold-ings
204264
2,4092,2152,2871,3361,325312298293281270
1,2831,270
1,2781,2811,2821,2701,2761,2751,2761,2771,2711,2801,2991,2961,281
1,3141,3141,2971,281
1,2891,2941,2971,300
1,2961,2971,2801,2731,274
Deposits with F. R.Banks other than
member bankreserve balances
Treas-u r yde-
posits
3635
634867977870
1,123821950668317247333389
549553328306501326550591569552500244395
767569401443
394424286
19
156410358396432
For-eignde-
posits
615
397774862392642767
1,158895870526548550
551538601681785766688689745611526530563
580551527483
509551563495
520568551583559
Otherde-
posits
21151256586446569547750273565392363298455
324300242279259231253297290405336378397
383350321334
302368403406
371532357295410
OtherFed-eralRe-
serveac-
counts
374346251291495563590 20,479706771714765746 20,056783777
818745767791
721876803832775800841
868867865854
Member bankreserve balances
Total
2,3562,29211,65312,45015,91517,899
16,56815,93417,68119,020
19,38119,950
19,77719,76720,14020,535
720 20,30620,51420,61120,74421,18020,95820,52020,41620,007
770 20,548770 20,556
I 20,592836 20,409
832 20,365830 20,314839 20,581
! 20,498
854 20,20120,07220,12120,13619,837
Re-quired2
2,3331,8176,4449,365
14,45716,40019,27715,55015,49816,50918,60419,66719,57320,520
19,12719,13919,43119,92619,65719,73619,96320,08720,45720,25119,88219,828
19,98819,90519,90219,828
19,79819,75819,94819,893
19,68819,50519,50019,530
Ex-cess2
23475
5,2093,0851,4581,4991,2021,018
4361,172
416389
-192-570
650628709609649778648657723707638588
560651690581
567556633605
513567621606
r Revised. m1 Includes industrial loans and acceptances purchased, which are shown separately in subsequent tables.2 These figures are estimated.Back figures.—See Banking and Monetary Statistics, Tables 101-103, pp. 369-394; for description, see pp. 360-366 in the same publication.
MAXIMUM RATES ON TIME DEPOSITS[Per cent per annum]
Nov. 1, 1933-Jan. 31, 1935
Savings depositsPostal Savings depositsOther deposits payable:
In 6 months or moreIn 90 days to 6 months. . .In less than 90 days
Feb. 1, 1935-Dec. 31, 1935 Jan. 1, 1936
Effective
NOTE.—Maximum rates that may be paid by member banks asestablished by the Board of Governors under provisions of Regula-tion Q. Under this Regulation the rate payable by a member bankmay not in any event exceed the maximum rate payable by Statebanks or trust companies on like deposits under the laws of the Statein which the member bank is located. Maximum rates that may bepaid by insured nonmember banks as established by the F.D.I.C,effective Feb. 1, 1936, are the same as those in effect for member banks.
MARGIN REQUIREMENTS3
[Per cent of market value]
Prescribed in accordance withSecurities Exchange Act of 1934
Regulation T:For extensions of credit by brokers
and dealers on listed securitiesFor short sales
Regulation U:For loans by banks on stocks
Mar. 30,1949-
Jan. 16,1951
5050
50
Jan. 17,1951-
Feb. 19,1953
7575
75
Effec-tive
Feb. 20,1953
5050
50
1 Regulations T and U limit the amount of credit that may be ex-tended on a security by prescribing a maximum loan value, which is aspecified percentage of its market value at the time of the extension; the"margin requirements" shown in this table are the difference betweenthe market value (100%) and the maximum loan value.
Back figures.—See Banking and Monetary Statistics, Table 145, p. 504,and BULLETIN for March 1946, p. 295, February 1947, p. 162, andFebruary 1953, p. 130.
480 FEDERAL RESERVE BULLETIN
Digitized for FRASER http://fraser.stlouisfed.org/ Federal Reserve Bank of St. Louis
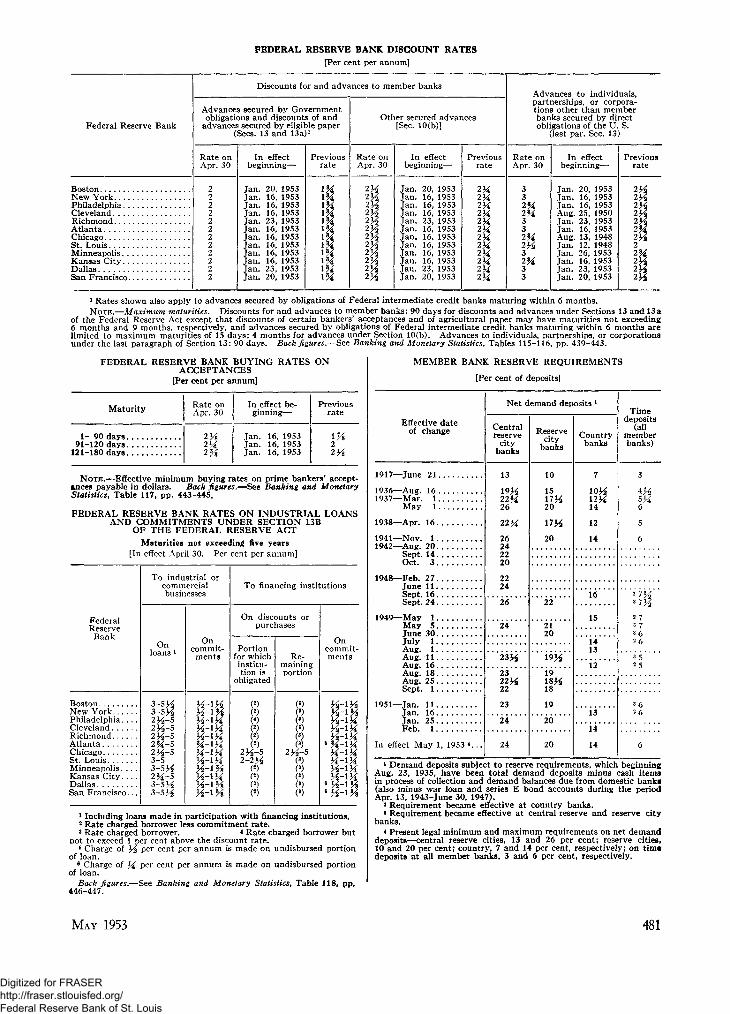
FEDERAL RESERVE BANK DISCOUNT RATES[Per cent per annum]
Federal Reserve Bank
Discounts for and advances to member banks
Advances secured by Governmentobligations and discounts of and
advances secured by eligible paper(Sees. 13 and 13a)1
Rate onApr. 30
In effectbeginning—
Previousrate
Other secured advances[Sec. 10(b)]
Rate onApr. 30
In effectbeginning—
Previousrate
Advances to individuals,partnerships, or corpora-tions other than memberbanks secured by directobligations of the U. S.
(last par. Sec. 13)
Rate onApr. 30
In effectbeginning—
Previousrate
BostonNew York. . .Philadelphia.Cleveland. . .Richmond. . .AtlantaChicagoSt. LouisMinneapolis. .Kansas City.DallasSan Francisco
Jan. 20,Jan. 16,Jan. 16,Jan. 16,Jan. 23,Jan. 16,Jan. 16,Jan. 16,Jan. 16,Jan. 16,Jan. 23,Jan. 20,
195319531953195319531953195319531953195319531953
Jan. 20,Jan. 16,Jan. 16,Jan. 16,Jan. 23,Jan. 16,Jan. 16,Jan. 16,Jan. 16,Jan. 16,Jan. 23,Jan. 20,
195319531953195319531953195319531953195319531953
33
3 4
3
3 2
I*3
Jan. 20,Jan. 16,Jan. 16,Aug. 25,Jan. 23,Jan. 16,Aug. 13,Jan. 12,Jan. 26,Jan. 16,Jan. 23,Jan. 20,
195319531953195019531953194819481953195319531953
1 Rates shown also apply to advances secured by obligations of Federal intermediate credit banks maturing within 6 months.NOTE.—Maximum maturities. Discounts for and advances to member banks: 90 days for discounts and advances under Sections 13 and 13a
of the Federal Reserve Act except that discounts of certain bankers' acceptances and of agricultural paper may have maturities not exceeding6 months and 9 months, respectively, and advances secured by obligations of Federal intermediate credit banks maturing within 6 months arelimited to maximum maturities of 15 days; 4 months for advances under Section 10(b). Advances to individuals, partnerships, or corporationsunder the last paragraph of Section 13: 90 days. Back figures.See Banking and Monetary Statistics, Tables 115-116, pp. 439-443.
FEDERAL RESERVE BANK BUYING RATES ONACCEPTANCES
[Per cent per annum]
Maturity
1- 90 days91-120 days
121-180 days
Rate onApr. 30
2H2M2%
In effect be-ginning—
Jan. 16, 1953Jan. 16, 1953Jan. 16, 1953
Previousrate
IK
2V8
NOTE.—Effective minimum buying rates on prime bankers' accept-ances payable in dollars. Back figures.—See Banking and MonetaryStatistics, Table 117, pp. 443-445.
FEDERAL RESERVE BANK RATES ON INDUSTRIAL LOANSAND COMMITMENTS UNDER SECTION 13B
OF THE FEDERAL RESERVE ACT
Maturities not exceeding five years[In effect April 30. Per cent per annum]
FederalReserve
Bank
BostonNew YorkPhiladelphia. . . .ClevelandRichmondAtlantaChicagoSt. LouisMinneapolis. . . .Kansas City. . . .DallasSan Francisco...
To industrial orcommercialbusinesses
Onloans 1
3 - 5 ^3-53423^-52^-5234-52H-52K-53-53-5342M-53-5343-534
Oncommit-
ments
To financing institutions
On discounts orpurchases
Portionfor whichinstitu-tion is
obligated
()23^-52-234
(2)
Re-mainingportion
00(8)(3)(3)00()
Oncommit-ments
1 Including loans made in participation with financing institutions.2 Rate charged borrower less commitment rate.3 Rate charged borrower. 4 Rate charged borrower but
not to exceed 1 per cent above the discount rate.5 Charge of ^ per cent per annum is made on undisbursed portion
of loan.8 Charge of ^ per cent per annum is made on undisbursed portion
of loan.Back figures.—See Banking and Monetary Statistics, Table 118, pp.
446-447.
MEMBER BANK RESERVE REQUIREMENTS
[Per cent of deposits]
Effective dateof change
1917—June 2 1 . .
1936—Aug. 16 . .1937—Mar. 1. .
May 1. .
1938—Apr. 16. .
1941—Nov. 1. .1942—Aug. 20. .
Sept. 14. .Oct. 3 . .
1948—Feb. 27. .June 1 1 . .Sept. 16. .Sept. 24. .
1949—May 1. .May 5. .June 3 0 . .July 1. .Aug. 1. .Aug. 11. .Aug. 16. .Aug. 18. .Aug. 25. .Sept. 1. .
1951—Jan. 1 1 . .Jan. 16 . .Jan. 25. .Feb. 1. .
In effect May 1, 1953 «
Net demand deposits *
Centralreserve
citybanks
13
22 K
26242220
2224
24
232222
23
24
Reservecity
banks
10
15
20
22
2120
191818
19
20
20
Countrybanks
14
12
14
14
14
Timedeposits
(allmemberbanks)
16
15
1413
12
13
2 7343 734
2 73 73 62 6
2 5
362 6
1 Demand deposits subject to reserve requirements, which beginningAug. 23, 1935, have been total demand deposits minus cash itemsin process of collection and demand balances due from domestic banks(also minus war loan and series E bond accounts during the periodApr. 13, 1943-June 30, 1947).
2 Requirement became effective at country banks.8 Requirement became effective at central reserve and reserve city
banks.* Present legal minimum and maximum requirements on net demand
deposits—central reserve cities, 13 and 26 per cent; reserve cities,10 and 20 per cent; country, 7 and 14 per cent, respectively; on timedeposits at all member banks, 3 and 6 per cent, respectively.
MAY 1953 481
Digitized for FRASER http://fraser.stlouisfed.org/ Federal Reserve Bank of St. Louis
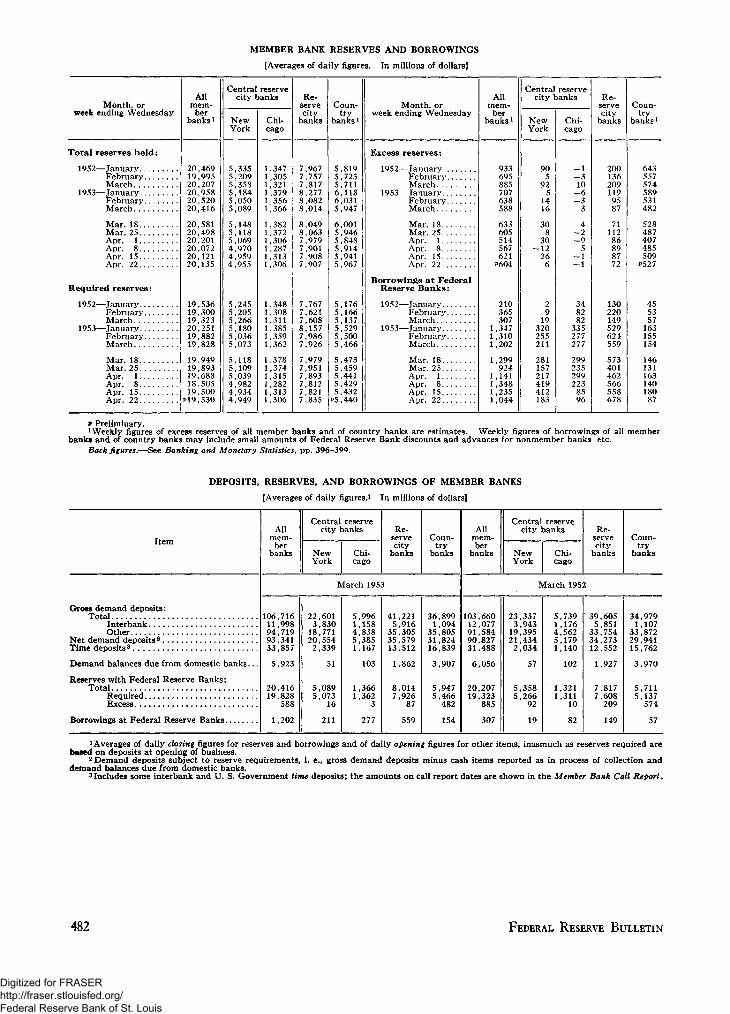
MEMBER BANK RESERVES AND BORROWINGS
[Averages of daily figures. In millions of dollars]
Month, orweek ending Wednesday
Allmem-
berbanks1
20,46919,99520,20720,95820,52020,416
20,58120,49820,20120,07220,12120,135
19,53619,30019,32320,25119,88219,828
19,94919,89319,68818,50519,500
^19,530
Central reservecity banks
NewYork
5,3355,2095,3585,1845,0505,089
5,1485,1185,0694,9704,9594,955
5,2455,2055,2665,1805,0365,073
5,1185,1095,0394,9824,9344,949
Chi-cago
1,3471,3051,3211,3791,3561,366
1,3821,3721,3061,2871,3131,306
1,3481,3081,3111,3851,3591,362
1,3781,3741,3151,2821,3131,306
Re-servecity
banks
7,9677,7577,8178,2778,0828,014
8,0498,0637,9797,9017,9087,907
7,7677,6217,6088,1577,9867,926
7,9797,9517,8937,8127,8217,835
Coun-t r y
banks1
5,8195,7235,7116,1186,0315,947
6,0015,9465,8485,9145,9415,967
5,1765,1665,1375,5295,5005,466
5,4735,4595,4415,4295,432
P 5 , 4 4 0
Month, orweek ending Wednesday
Allmem-
berbanks J
933695885707638588
633605514567621
P604
210365307
1,3471,3101,202
1,299924
1,1411,3481,2351,044
Central reservecity banks
N e wYork
905
925
1416
308
30- 1 2
266
29
19320255211
281157217419412183
Chi-cago
- 1- 310
- 6- 3
3
4- 2- 9
5- 1- 1
348282
335277277
299235299223
8596
Re-servecity
banks
200136209119
9587
71112
86898772
130220149529624559
573401462566558678
Coun-try
banks1
Total reserves held:
1952—JanuaryFebruaryMarch
1953—JanuaryFebruaryMarch
Mar. 18Mar. 25Apr. 1Apr. 8Apr. 15Apr. 22
Required reserves:
1952—JanuaryFebruaryMarch
1953—JanuaryFebruary.. . .March
Mar. 18Mar. 25Apr. 1Apr. 8Apr. 15Apr. 22
Excess reserves:
1952—JanuaryFebruaryMarch
1953—JanuaryFebruaryMarch
Mar. 18Mar. 25Apr. 1Apr. 8Apr. 15Apr. 22
Borrowings at FederalReserve Banks:
1952—JanuaryFebruaryMarch
1953—JanuaryFebruaryMarch
Mar. 18Mar. 25Apr. 1Apr. 8Apr. 15Apr. 22
643557574589531482
528487407485509
P527
455357163155154
146131163140180
P Preliminary.1 Weekly figures of excess reserves of all member banks and of country banks are estimates. Weekly figures of borrowings of all member
banks and of country banks may include small amounts of Federal Reserve Bank discounts and advances for nonmember banks etcBack figures.—See Banking and Monetary Statistics, pp. 396-399.
DEPOSITS, RESERVES, AND BORROWINGS OF MEMBER BANKS
[Averages of daily figures.1 In millions of dollars]
ItemAll
mem-ber
banks
Central reservecity banks
NewYork
Chi-cago
Re-servecity
banks
Coun-try
banks
Allmem-ber
banks
Central reservecity banks
NewYork
Chi-cago
Re-servecity
banks
Coun-try
banks
March 1953 March 1952
Gross demand deposits:Total
InterbankOther
Net demand deposits2
Time deposits3
Demand balances due from domestic banks. . .
Reserves with Federal Reserve Banks:Total
RequiredExcess
Borrowings at Federal Reserve Banks
106,71611,99894,71993,34133,857
5,923
20,41619,828
588
1,202
22,6013,83018,77120,5542,339
51
5,0895,073
16
211
5,9961,1584,8385,3851,167
103
1,3661,362
3
277
41,2215,916
35,30535,57913,512
1,862
8,0147,926
87
559
36,8991,094
35,80531,82416,839
3,907
5,9475,466
482
154
103,66012,07791,58490,82731,488
6,056
20,20719,323
885
307
23,3373,94319,39521,4342,034
57
5,3585,266
92
19
5,7391,1764,5625,1791,140
102
1,3211,311
10
82
39,6055,851
33,75434,27312,552
1,927
7,8177,608209
149
34,9791,107
33,87229,94115,762
3,970
5,7115,137
574
57
1 Averages of daily closing figures for reserves and borrowings and of daily opening figures for other items, inasmuch as reserves required arebased on deposits at opening of business.
2 Demand deposits subject to reserve requirements, i. e., gross demand deposits minus cash items reported as in process of collection anddemand balances due from domestic banks.
3Includes some interbank and U. S. Government time deposits; the amounts on call report dates are shown in the Member Bank Call Report.
482 FEDERAL RESERVE BULLETIN
Digitized for FRASER http://fraser.stlouisfed.org/ Federal Reserve Bank of St. Louis

STATEMENT OF CONDITION OF FEDERAL RESERVE BANKS[In thousands of dollars]
Item
Wednesday figures
1953
Apr. 29 Apr. 22 Apr. 15 Apr. 8 Apr. 1
End of month
1953
Apr. Mar.
1952
Apr.
AssetsGold certificatesRedemption fund for F. R. notes. .
Total gold certificate reserves.
Other cashDiscounts and advances:
For member banksFor nonmember banks, etc..
Industrial loansU. S. Government securities:
Bought outright:BillsCertificates:
SpecialOther
NotesBonds
20,633,099 20752,619
,628,104 20755,339
,628,102758,166
20,614,103747,167
20,619,101748,135
20,633,103750,029
20,619,103748,134
21,412,253693,428
21,385,718
350,094
818,35018,5003,476
514,754
21,383,443
353,330
823,67918,5003,481
514,754
21,386,268
354,121
849,86118,5003,553
514,754
21,361,270 21,367,236 21,383,132
354,872351,456
890,43817,5003,623
514,754
361,138
447,05418,0003,579
514,754
995,10018,5003,460
514,754
21,367,237
370,502
467,23918,0003,653
514,754
22,105,681
363,292
653,26023,000
5,158
4,995,71613,773,6714,521,975
4,995,71613,773,6714,521,975
4,995,71613,773,6714,521,975
4,995,71613,773,6714,521,975
4,995,71613,773,6714,521,975
4,995,71613,773,6714,521,975
4,995,71613,773,6714,521,975
11,659,3065,568,0735,135,823
Total bought outrightHeld under repurchase agreement
23,806,116 23,806,116 23,806,116 23,15,000
806,116 23,806,116 23,806,11674,000
23,806,116 22,363,202
Total U. S. Government securities.
Total loans and securities
23,806,116 23,8 5,116 23,821,116 23,806,116 23,806,116 23,880,116 23,806,116 22,363,202
Due from foreign banksF. R. notes of other Banks.. . .Uncollected cash itemsBank premisesOther assets
24,646,442
23153,769
3,607,19049,561
202,624
24,651,776
23155,017
3,908,99649,667
193,803
24,693,030 24,717,677 24,274,749 24,897,176 24,295,008 23,044,620
23157,787
4,567,18349,647
184,568
23156,921
3,593,34049,546
174,918
23165,933
3,991,22749,351
166,472
23151,350
3,518,03249,533
203,939
23167,011
,766,93649,362
185,864
28155,067
3,326,46644,649
173,052
Total assets. 50,395,421 50,696,055 51,392,627 50,405,151 50,376,129 50,558,057 50,201,943 49,212,855
LiabilitiesFederal Reserve notesDeposits:
Member bank—reserve accounts..U. S. Treasurer—general account.ForeignOther
25,556,131 25,496,728 25,534,398 25,559,767
19,489,367,518401
19,475,694509,139584,652356,368
19,932341574200
076125447039
19,629,310329,018567,943342,565
25,563,004
19,305,354286,484549,963344,124
25,598,279
19,739,784392,741505,675416,499
25,560,203 24,332,276
19,322,123221,631535,610342,009
19 940,266450,418518,184266,349
Total deposits. . 20,776,306 20,925,853 21,047,687 20,868,836 20,485,925
Deferred availability cash itemsOther liabilities and accrued dividends
3,02620
,166,05119,260
3,71118
2,884,52416,775
3,242,86016,350
21,054,699
2,869,18219,391
20,421,373 21,175,217
3,135,16817,734
,738,72717,330
Total liabilities. 49,379,695 49,607,892
Capital AccountsCapital paid inSurplus (Section 7)Surplus (Section 13b)Other capital accounts
257,239584,676
27,543146,268
257,166584,676
27,543218,778
50,311,262
257,072584,67627,543
212,074
49,329,902
257,007584,676
27,543206,023
49,308,139 49,541,551 49,134,478 48,263,550
256,901584,67627,543
198,870
257,254584,676
27,543147,033
256,891584,676
27,543198,355
242,928538,342
27,543140,492
Total liabilities and capital accounts. 50,395,421 50,696,055 51,392,627 50,405,151 50,376,129 50,558,057 50,201,943 49,212,855
Ratio of gold certificate reserves to deposit andF. R. note liabilities combined (per cent). . . .
Contingent liability on acceptances purchasedfor foreign correspondents
Industrial loan commitments
46.2
31,8582,971
46.1
30,4522,940
45.9
30,8952,834
30,3492,818
46.4
29,5892,823
45.8
31,8872,867
46.5
29,4062,756
48.6
8,1186,536
Maturity Distribution of Loans and U. S. Government Securities 1
Discounts and advances—totalWithin 15 days16 days to 90 days91 days to 1 year
Industrial loans—totalWithin 15 days16 days to 90 days91 days to 1 yearOver 1 year to 5 years
U. S. Government securities—totalWithin 15 days16 days to 90 days91 days to 1 yearOver 1 year to 5 yearsOver 5 years to 10 yearsOver 10 years
23
836,850769,78767,025
383,476
7061,1031,507
160806,116 23237,250415,2701
12,450,1756,914,16411,374,400,414,857
842,179805,55136,587
413,481
7121,2851,324160
,806,116 23232,554,419,966
12,450,1756,914,164,374,400,414,857
868,361825,21643,125
203,553684
1,3991,308162
821,116 23285,504382,016
12,450,1756,914,164,374,400,414,857
907,938867,67540,241
223,623412
1,6941,355162
,806,116 23315,504,337,016
13,314,5756,410,550,070,224,358,247
465,054 1427,14537,882
273,579
369904
2,153153
,806,116 23229,200,423,320
13,314,5756,410,550,070,224,358,247
013,600946,73266,830
383,460421
1,1641,722153
880,116 23300,750415,270
12,460,6756,914,164,374,400,414,857
485,239442,45040,8481,9413,653
648556
2,289160
806,116 2275,500
577,02013,314,575
,410,550,070,224,358,247
676,260608,87467,386
5,158865786
2,2771,230
363,202
441,856837,675941,352013,614128,705
1 Beginning Apr. 15, 1953, U. S. Government securities classified according to maturity date. During the period Jan. 3, 1951-Apr. 8, 1953,callable issues classified according to nearest call date. Securities held under repurchase agreement are classified as maturing within 15 days in ac-cordance with maximum maturity of the agreements.
MAY 1953 483
Digitized for FRASER http://fraser.stlouisfed.org/ Federal Reserve Bank of St. Louis

STATEMENT OF CONDITION OF EACH FEDERAL RESERVE BANK ON APRIL 30, 1953
[In thousands of dollars]
Item Total Boston NewYork
Phila-delphia
Cleve-land
Rich-mond Atlanta Chicago St.
LouisMinne-apolis
KansasCity Dallas
SanFran-cisco
Assets
Gold certificates.Redemption fund
for F. R. notes.
Total gold certifi-cate reserves..
Other cashDiscounts and
advances:Secured by
U. S. Govt.securities. . .
OtherIndustrial loans. . JU. S. Government
securities:Bought out-
rightHeld under
repurchaseagreement...
Total loans andsecurities
Due from foreignbanks
F. R. notes ofother Banks...
Uncollected cashitems
Bank premises...Other assets
Total assets
20,633,103
750,029
684,391
62,843
6,877,536
72,761
1,180,460
58,430
1,448,253
82,966
735,725
78,742
627,789 4,280,
62,448
i.lll
126,822
513,812
51,099
307,962
26,195
854,893
40,617
558,919
29,704
2,563,252
57,402
21,383,132354,872
993,37420,226
3,460
23,806,116
74,000
747,23424,967
38,1701,168
6,950,29759,823
139,1555,458
1,238,89023,325
53,1501,3872,939
1,531,21929,192
110,6001,702
24,897,176
50,558,057
Liabilities
F. R. notesDeposits:
Member bk.—reserve accts.
U. S. Treas —gen. acct.. . .
ForeignOther
Total deposits.. .Deferred avail-
ability cashitems
Other liabilitiesand accrueddividends
Total liabilities. .
CapitalAccounts
Capital paid in. .Surplus (Sec. 7). .Surplus (Sec. 13b)Other capital
accounts
Total liabilitiesand capitalaccounts
Reserve ratioContingent lia-
bility on ac-ceptances pur-chased for for-eign corre-spondents
Industrial loancommitments.,
1,658,437 5,228,656
74,000
1,491,192 2,312,359
814,46722,092
82,80092522
1,701,804
690,23731,554
35,2902,396374
4,406,93369,941
192,6152,534
564,91119,549
77,780703
1,515,210 3,478,5241,277,667
334,1577,312
71,950463125
722,224
895,51012,524
103,914789
588,62315,714
28,200833
2,620,65438,879
59,7501,868
945,341 1,149,383 2,325,319
1,697,775 5,447,269 1,548,668 2,424,661 1,785,551
23
151,350
3,518,03249,533
203,939
1
4,017
277,7464,781
14,726
20,264
636,9877,183
43,045
9,812
239,4053,943
12,616
2,771,247 13,164,875 3,076,661 4,330,542
25,598,279 1,572,839 5,647,085 1,819,643
19,739,784
392,741505,675416,4991
808,391
32,46831,409
6,761
6,144,832
89,7362 142,654
348,775
910,806
33,49138,618
2,402
21,054,699
2,869,182
19,391
879,029
254,424
1,099
6,725,997
499,259
5,057
985,317
194,338
1,191
49,541,551
257,254584,676
27,543
147,033
2,707,391
13,79336,462
3,011
10,590
12,877,398
81,291167,503
7,319
31,364
17,47843,578
4,489
10,627
50,558,057 2,771,247 13,164,875 3,076,661
45.8%
31,887
2,867
30.5%
1,944
56.2%
3 9,423
44.2?
2,390
1,295
2
8,160
312,7184,60519,985
1
24,806
270,6004,910
14,635
1,553,270
1
23,675
260,9443,69113,882
3,673,673
3
14,280
575,2816,79629,307
1,356,150
1
7,317
156,3252,94210,653
794,762
1
4,775
94,0731,0426,114
1,050,044
1
6,838
190,5112,2258,763
1,178,416 2,386,937
1
7,529
2
19,877
161,008615
10,210
342,4346,800
20,003
2,937,062 2,577,254 8,776,214 2,117,848 1,242,236 2,166,416 ,962,116 5,435,586
2,359,611 1,776,855
1,516,952
44,76747,371
4,370
1,613,460
261,482
2,456
822,385
31,51425,7452,548
882,192
223,090
1,059
1,379,503
889,437
13,43122,141
1,817
4,914,253
3,175,775
28,18770,5415,095
1,189,790
710,241
34,05919,5667,837
639,732
458,451
23,09312,872
1,913
1,008,006
926,340
25,25419,5665,981
730,884 2,560,078
999,282
15,68023,170
1,234
2,376,892
21,06152,02227,766
926,826
223,669
891
3,279,598
440,021
3,175
771,703
114,400
799
496,329
78,057
601
977,141
140,818
677
1,039,366
144,543
757
2,477,741
295,081
1,629
3,000,489 4,237,009
24,62554,064
1,006
13,838
2,883,196
11,18429,2483,349
10,085
2,530,889 8,637,047
10,89325,803
762
8,907
32,91984,628
1,429
20,191
2,076,692
8,89623,628
521
8,111
1,214,719
5,78515,131
1,073
5,528
2,126,642
9,78621,925
1,137
6,926
1,915,550
12,65925,381
1,307
7,219
5,334,529
27,94557,325
2,140
13,647
4,330,542 2,937,062 2,577,254 8,776,214 2,117,848 1,242,236 2,166,416 1,962,116 5,435,586
38.5%
2,931
749
30.6%
1,593
53
29.9?
1,370
53.8%
4,365
26
28.8% 29.4%
797
45.1%
1,211
744
33.3%
1,434
52.0%
3,218
1 After deducting $16,000 participations of other Federal Reserve Banks.8 After deducting $363,004,000 participations of other Federal Reserve Banks.3 After deducting $22,464,000 participations of other Federal Reserve Banks.
484 FEDERAL RESERVE BULLETIN
Digitized for FRASER http://fraser.stlouisfed.org/ Federal Reserve Bank of St. Louis
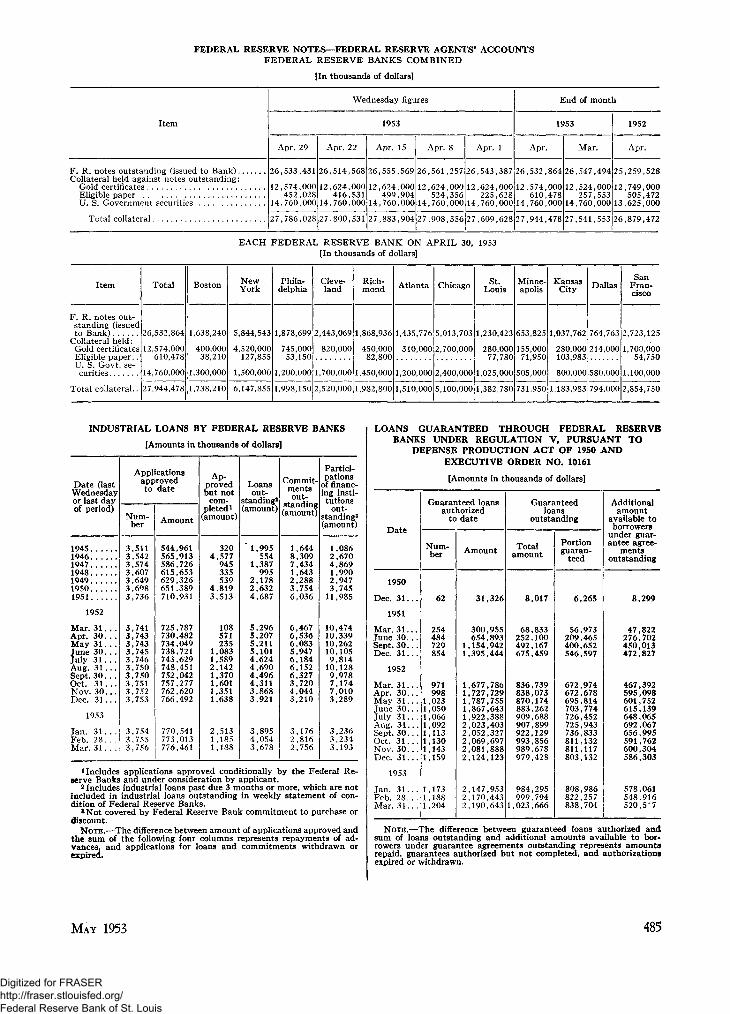
FEDERAL RESERVE NOTES—FEDERAL RESERVE AGENTS' ACCOUNTSFEDERAL RESERVE BANKS COMBINED
[In thousands of dollarsl
Item
Wednesday figures
1953
Apr. 29 Apr. 22 Apr. 15 Apr. 8 Apr. 1
End of month
1953
Apr. Mar.
1952
Apr.
F. R. notes outstanding (issued to Bank)Collateral held against notes outstanding:
Gold certificatesEligible paperU. S. Government securities
Total collateral
26,533,431 26,514,568 26,555,569 26,561,257 26,543,387 26,532 ,864 26,547,494 25,259,528
12,574,000452,028
14,760,000 14
12,624,000416,531,760,000 14
12,624,000499,904,760,000 14
12,624,000524,356,760,000
12,624,000 12225,628
14,760,000 14
,574,000610,478,760,000
12,524,000257,553
14,760,000
12,749,000505,472
13,625,000
27,786,028 27,800,531 27,883,904 27,908,356 27,609,628 27,944,478 27,541,553 26,879,472
EACH FEDERAL RESERVE BANK ON APRIL 30, 1953[In thousands of dollars]
Item Total Boston NewYork
Phila-delphia
Cleve-land
Rich-mond Atlanta Chicago St.
LouisMinne-apolis
KansasCity Dallas
SanFran-cisco
F. R. notes out-standing (issuedto Bank)
Collateral held:Gold certificatesEligible paper..U. S. Govt. se-curities
Total collateral..
26,532,864
12,574,000610,478
14,760,000
1,638,240
400,00038,210
1,300,000
5,844,543
4,520,000127,855
1,500,000
1,878,699 2,443,069
745,00053,150
1,200,000
820,000
1,700,000
1,868,936
450,00082,800
1,450,000
1,435,776 5,013
310,000 2.
,703
700,000
1,230,423 653,825
280,00077,780
155,00071,950
1,200,000 2,400,000 1,025,000 505,000
1,037,762 764,763
280,000 214,000103,983
800,000 580,000
2,723,125
1,700,00054,750
1,100,000
27,944,478 1,738,210 6,147,855 1,998,150 2,520,000 1,982,800 1,510,000 5,100,000 1,382,780 731,950 1,183,983 794,000 2,854,750
INDUSTRIAL LOANS BY FEDERAL RESERVE BANKS
[Amounts in thousands of dollars]
Date (lastWednesdayor last dayof period)
19451946 . . . .19471948194919501951
1952
Mar. 3 1 . . .Apr. 30. . .May 3 1 . . .June 30. . .July 31. . .Aug. 31. . .Sept. 30. . .Oct. 3 1 . . .Nov. 30 . . .Dec. 3 1 . . .
1953
Jan. 3 1 . . .Feb. 28. . .Mar. 3 1 . . .
Applicationsapproved
to
Num-ber
3,5113,5423,5743,6073,6493.6983,736
3,7413,7433,7433,7453,7463,7503,7503,7513,7523,753
3,7543,7553,756
Amount
544,961565,913586,726615,653629,326651,389710,931
725,787730,482734,049738,721743,629748,451752,042757,277762,620766,492
770,541773,013776,461
AP-provedbut not
com-pleted1
(amount)
3204,577
945335539
4.8193,513
108571235
1,0831,589M 4 21,3701,6011,3511,638
2,5131,1851,188
Loansout-
standing2
(amount)
1,995554
1,387995
2,1782,6324,687
5,2965,2075,2115,1014,6244,6904,4964,3113,8683,921
3,8954,0543,678
Commit-
mentsout-
standing(amount)
1,6448,3097,4341,6432,2883.7546,036
6,4676,5366,0835,9476,1846,1526,3273,7204,0443,210
3,1762,8162,756
Partici-pations
of financ-ing insti-tutions
out-standing3
(amount)
1,0862,6704,8691,9902,9473,745
11,985
10,47410,33910,26210,1059,814
10,1289,9787,1747,0103,289
3,2363,2343,193
1 Includes applications approved conditionally by the Federal Re-serve Banks and under consideration by applicant.
2 Includes industrial loans past due 3 months or more, which are notincluded in industrial loans outstanding in weekly statement of con-dition of Federal Reserve Banks.
8 Not covered by Federal Reserve Bank commitment to purchase ordiscount.
NOTE.—The difference between amount of applications approved andthe sum of the following four columns represents repayments of ad-vances, and applications for loans and commitments withdrawn orexpired.
LOANS GUARANTEED THROUGH FEDERAL RESERVEBANKS UNDER REGULATION V, PURSUANT TO
DEFENSE PRODUCTION ACT OF 1950 ANDEXECUTIVE ORDER NO. 10161
[Amounts in thousands of dollars]
UclLC
1950
Dec. 3 1 . . .
1951
Mar.JuneSept.Dec.
3 1 . . .30. . .30 . . .3 1 . . .
1952
Mar.Apr.M a yJuneJulyAug.Sept.Oct.Nov.Dec.
3 1 . . .30 . . .3 1 . . .30 . . .31 . . .3 1 . . .30 . . .31. . .30 . . .3 1 . . .
1953
Jan.Feb.Mar.
3 1 . . .28 . . .3 1 . . .
Guaranteed loansauthorized
to date
Num-ber
62
254484729854
971998
1,0231,0501,0661,0921.1131,1301,1431,159
1,1731,1881,204
Amount
31,326
300,955654,893
1,154,9421,395,444
1,677,7861,727,7291,787,7551,867,6431,922,3882,023,4032,052,3272,069,6972,081,8882,124,123
2,147,9532,170,4432,190,643
Guaranteedloans
outstanding
Totalamount
8,017
68,833252,100492,167675,459
836,739838,073870,174883,262909,688907,899922,129993,856989,678979,428
984,295999,794
1,023,666
Portionguaran-
teed
6
56209400546
672672695703726725736811811803
808822838
,265
,973,465,652,597
,974,678,814,774,452,943,833,132,117,132
,986,257,704
Additionalamount
available toborrowers
under guar-antee agree-
mentsoutstanding
8,299
47,822276,702450,013472,827
467,392595,098601,752615,139648.065692,067656,995591,762600,304586,303
578,061548,916520,5'7
NOTE.—The difference between guaranteed loans authorized andsum of loans outstanding and additional amounts available to bor-rowers under guarantee agreements outstanding represents amountsrepaid, guarantees authorized but not completed, and authorizationsexpired or withdrawn.
MAY 1953 485
Digitized for FRASER http://fraser.stlouisfed.org/ Federal Reserve Bank of St. Louis
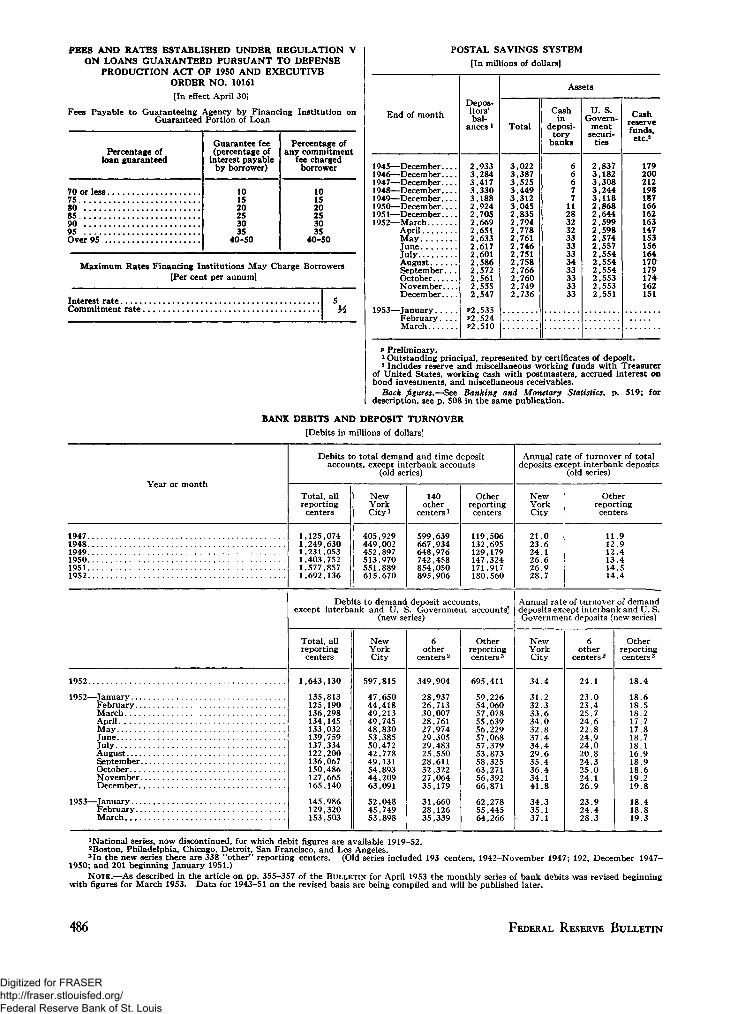
FEES AND RATES ESTABLISHED UNDER REGULATION VON LOANS GUARANTEED PURSUANT TO DEFENSE
PRODUCTION ACT OF 1950 AND EXECUTIVEORDER NO. 10161[In effect April 30]
Fees Payable to Guaranteeing Agency by Financing Institution onGuaranteed Portion of Loan
Percentage ofloan guaranteed
70 or less7580859095Over 95
Guarantee fee(percentage of
interest payableby borrower)
101520253035
40-50
Percentage ofany commitment
fee chargedborrower
101520253035
40-50
Maximum Rates Financing Institutions May Charge Borrowers[Per cent per annuml
Interest rateCommitment rate.
POSTAL SAVINGS SYSTEM[In millions of dollars]
End of month
1945—December1946—December1947—December1948—December1949—December1950—December1951—December1952—March
AprilMayJuneJulyAugustSeptember. . .OctoberNovemberDecember....
1953—JanuaryFebruary.. . .March
Depos-itors'bal-
ances 1
2,9333,2843.4173,3303,1882,9242,7052,6692,6512,6332.6172,6012,5862,5722,5612,5552,547
P2.535P2.524P2.510
Assets
Total
3,0223,3873,5253,4493,3123,0452,8352,7942,7782,7612,7462,7512,7582,7662,7602,7492,736
Cashin
deposi-tory
banks
66677
112832323333333433333333
U. S.Govern-
mentsecuri-
ties
2,8373,1823,3083,2443,1182,8682,6442,5992,5982,5742,5572,5542,5542,5542,5532,5532.551
Cashreservefunds,etc.*
179200212198187166162163147153156164170179174162151
P Preliminary.1 Outstanding principal, represented by certificates of deposit.2 Includes reserve and miscellaneous working funds with Treasurer
of United States, working cash with postmasters, accrued interest onbond investments, and miscellaneous receivables.
Back figures.—See Banking and Monetary Statistics, p. 519; fordescription, see p. 508 in the same publication.
BANK DEBITS AND DEPOSIT TURNOVER[Debits in millions of dollars]
Year or month
Debits to total demand and time depositaccounts, except interbank accounts
(old series)
Total, allreportingcenters
NewYorkCity1
140other
centers1
Otherreportingcenters
Annual rate of turnover of totaldeposits except interbank deposits
(old series)
NewYorkCity
Otherreportingcenters
1947...1948...1949...1950...1951...1952...
,125,074,249.630,231,053,403,752,577,857,692,136
405,929449,002452,897513,970551,889615,670
599,639667,934648,976742,458854,050895,906
119,506132,695129,179147,324171,917180,560
21.023.624.126.626.928.7
11.912.912.413.414.514.4
Debits to demand deposit accounts,except interbank and U. S. Government accounts'
(new series)
Annual rate of turnover of demanddeposits except interbank and U. S.Government deposits (new series)
Total, allreportingcenters
NewYorkCity
6other
centers 2
Otherreportingcenters 3
NewYorkCity
6other
centers 2
Otherreportingcenters 3
1952
1952—JanuaryFebruaryMarchAprilMayJuneJulyAugustSeptemberOctoberNovemberDecember
1953—JanuaryFebruaryMarch
1,643,130
135,813125,190136,298134,145133,032139,759137,334122,200136,067150,486127,665165,140
145,986129,320153,503
597,815
47,65044,41849,21349,74548,83053,38550,47242,77849,13154,89344,20963,091
52,04845,74953,898
349,904
28,93726,71330,00728,76127,97429,30529,48325,55028,61132,32227,06435,179
31,66028,12635,339
695,411
59,22654,06057,07855,63956,22957,06857,37953,87358,32563,27156,39266,871
62,27855,44564,266
34.4
31.232.333.634.032.837.434.429.635.436.434.141.8
34.335.137.1
24.1
23.023.425.724.622.824.924.020.824.325.024.126.9
23.924.428.3
18.4
18.618.518.217.717.818.718.116.918.918.619.219.8
18.418.819.3
1National series, now discontinued, for which debit figures are available 1919-52.2Boston, Philadelphia, Chicago, Detroit, San Francisco, and Los Angeles.3In the new series there are 338 "other" reporting centers. (Old series included 193 centers, 1942-November 1947; 192, December 1947-
1950; and 201 beginning January 1951.)NOTE.—As described in the article on pp. 355-357 of the BULLETIN for April 1953 the monthly series of bank debits was revised beginning
with figures for March 1953. Data for 1943-51 on the revised basis are being compiled and will be published later.
486 FEDERAL RESERVE BULLETIN
Digitized for FRASER http://fraser.stlouisfed.org/ Federal Reserve Bank of St. Louis
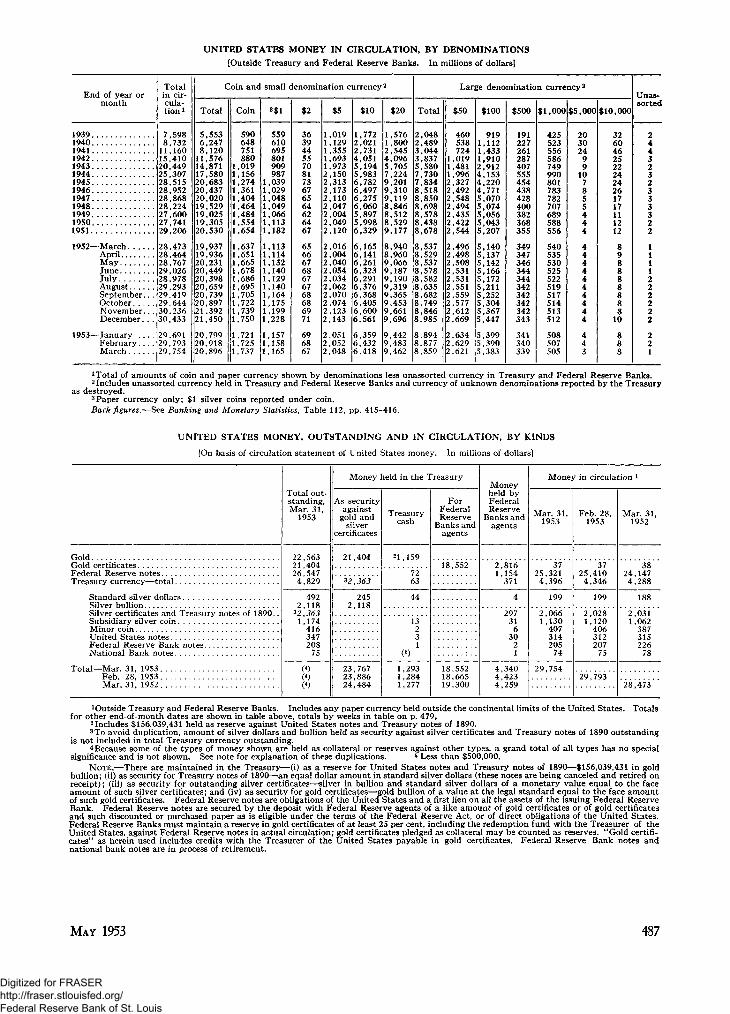
UNITED STATES MONEY IN CIRCULATION, BY DENOMINATIONS
[Outside Treasury and Federal Reserve Banks. In millions of dollars]
End of year ormonth
Totalin cir-cula-tion1
Coin and small denomination currency 2
Total Coin 3$i $2 $5 $10 $20
Large denomination currency2
Total $50 $100 $500 $1,000 $5,000 $10,000
Unas-sorted
1939194019411942194319441945194619471948194919501951
1952—MarchAprilMayJuneJulyAugustSeptember.. .OctoberNovember.. .December. . .
1953—JanuaryFebruaryMarch
7,5988,732
11,16015,41020,44925,30728,51528,95228,86828,22427,60027,74129,206
28,47328,46428,76729,02628,97829,29329,41929,64430,23630,433
29,69129,79329,754
5,5536,2478,120
11,57614,87117,58020,68320,43720,02019,52919,02519,30520.530
19,93719,93620,23120,44920,39820,65920,73920,89721,39221,450
20,79920,91820,896
590648751880
1,0191,1561,2741,3611,4041,4641,4841,5541,654
1,6371,6511,6651,6781,6861,6951,7051,7221,739
,750
,721.725,737
559610695801909987,039,029,048,049,066,113,182
,113.114,132,140,129
1,1401,1641,1751,1991,228
1,1571,1581,165
36394455708173676564626467
65666768676768686971
696867
1,0191,1291,3551,6931,9732,1502,3132,1732,1102,0472,0042,0492,120
016004040054034062070074123
2,143
2.0512,0522,048
1,7722,0212,7314,0515,1945,9836,7826,4976,2756,0605,8975,9986,329
6,1656,1416,2616,3236,2916,3766,3686,4056,6006,561
6,3596,4326,418
1,5761,8002,5454,0965,7057,2249,2019,3109,1198,8468,5128,5299,177
8,9408,9609,0669,1879,1909,3199,3659,4539,6619,696
9,4429,4839,462
2,0482,4893,0443,837
5807,7307,8348,5188,8508,6988,5788,4388,678
8,5378,5298,5378,5788,5828,6358,6828,7498,8468,985
8,8948,8778,859
460538724
1,0191.4811,9962,3272,4922,5482,4942,4352,4222,544
2,4962,498
9191,1121,4331,9102,9124,1534,220
5^0705,0745,0565,0435,207
,508,531,531
2,551559
2,5772,6122,669
2,6342,6292,621
,140,137,142,166
5,1725,2115,2525,3045,3675,447
5,3995,3905,383
191227261287407555454438428400382368355
349347346344344342342342342343
341340339
425523556586749990801783782707689588556
540535530525522519517514513512
508507505
20302499107855444
4444444444
443
32604625222424261717111212
89888888810
1 Total of amounts of coin and paper currency shown by denominations less unassorted currency in Treasury and Federal Reserve Banks.2 Includes unassorted currency held in Treasury and Federal Reserve Banks and currency of unknown denominations reported by the Treasury
as destroyed.3Paper currency only; $1 silver coins reported under coin.Back figures.—See Banking and Monetary Statistics, Table 112, pp. 415-416.
UNITED STATES MONEY, OUTSTANDING AND IN CIRCULATION, BY KINDS
[On basis of circulation statement of United States money. In millions of dollars]
GoldGold certificates. . .Federal Reserve notesTreasury currency—total
Standard silver dollarsSilver bullionSilver certificates and Treasury notes of 1890..Subsidiary silver coinMinor coinUnited States notesFederal Reserve Bank notesNational Bank notes
Total—Mar. 31, 1953Feb. 28, 1953Mar. 31, 1952
Total out-standing,Mar. 31,
1953
22,56321,40426 547
4,829
4922,118
*2,3631,174
416347208
75
(4)(4)(4)
Money held in the Treasury
As securityagainst
gold andsilver
certificates
21,404
*2,363
2452,118
23,76723,88624,484
Treasurycash
21,159
7263
44
13231
(5)
1,2931,2841,277
ForFederalReserve
Banks andagents
18,552
18,55218,66519,300
Moneyheld byFederalReserve
Banks andagents
2,8161,154
371
4
29731
630
21
4,3404,4234,259
Money in circulation *
Mar. 31,1953
3725,3214,396
199
2,0661,130
407314205
74
29,754
Feb. 28,1953
3725,4104,346
199
2,0281,120
406312207
75
29,793
Mar. 31,1952
3824,1474,288
188
2,0311,062
387315226
78
28,473
1 Outside Treasury and Federal Reserve Banks. Includes any paper currency held outside the continental limits of the United States. Totalsfor other end-of-month dates are shown in table above, totals by weeks in table on p. 479.
2Includes $156,039,431 held as reserve against United States notes and Treasury notes of 1890.3To avoid duplication, amount of silver dollars and bullion held as security against silver certificates and Treasury notes of 1890 outstanding
is not included in total Treasury currency outstanding.4 Because some of the types of money shown are held as collateral or reserves against other types, a grand total of all types has no special
significance and is not shown. See note for explanation of these duplications. 5 Less than $500,000.NOTE.—There are maintained in the Treasury—(i) as a reserve for United States notes and Treasury notes of 1890—$156,039,431 in gold
bullion; (ii) as security for Treasury notes of 1890—an equal dollar amount in standard silver dollars (these notes are being canceled and retired onreceipt); (iii) as security for outstanding silver certificates—silver in bullion and standard silver dollars of a monetary value equal to the faceamount of such silver certificates; and (iv) as security for gold certificates—gold bullion of a value at the legal standard equal to the face amountof such gold certificates. Federal Reserve notes are obligations of the United States and a first lien on all the assets of the issuing Federal ReserveBank. Federal Reserve notes are secured by the deposit with Federal Reserve agents of a like amount of gold certificates or of gold certificatesand such discounted or purchased paper as is eligible under the terms of the Federal Reserve Act, or of direct obligations of the United States.Federal Reserve Banks must maintain a reserve in gold certificates of at least 25 per cent, including the redemption fund with the Treasurer of theUnited States, against Federal Reserve notes in actual circulation; gold certificates pledged as collateral may be counted as reserves. "Gold certifi-cates" as herein used includes credits with the Treasurer of the United States payable in gold certificates. Federal Reserve Bank notes andnational bank notes are in process of retirement.
MAY 1953 487
Digitized for FRASER http://fraser.stlouisfed.org/ Federal Reserve Bank of St. Louis
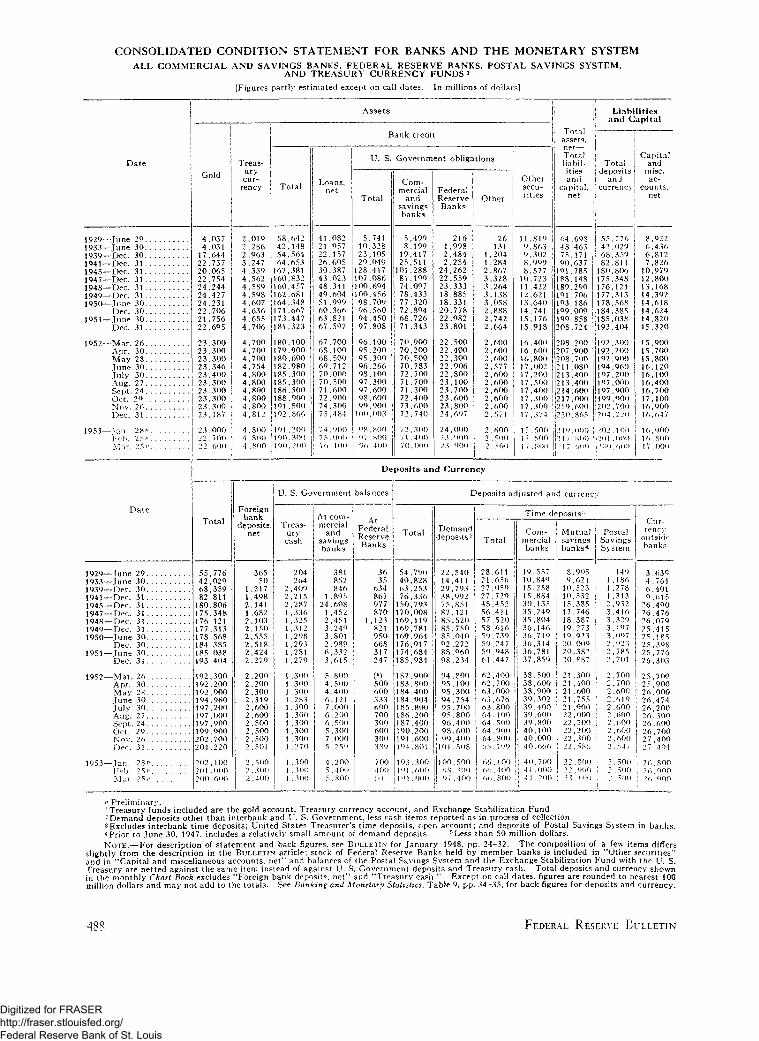
CONSOLIDATED CONDITION STATEMENT FOR BANKS AND THE MONETARY SYSTEMALL COMMERCIAL AND SAVINGS BANKS, FEDERAL RESERVE BANKS, POSTAL SAVINGS SYSTEM,
AND TREASURY CURRENCY FUNDS *[Figures partly estimated except on call dates. In millions of dollars]
Date
1929—June1933—June1939—Dec.1941—Dec.1945—Dec.1947—Dec.1948—Dec.1949—Dec.1950—Tune
Dec.1951—June
Dec.
1052—Mar.Apr.M a yTuneJulyAug.Sept.Oct.Nov.Dec.
1953—Tan.Feb.Mar.
2930303131313131303030 . . . .31
26302830302724292631
2 ,s v9 ^ /»
Date
1929—June1933—June1939—Dec.1941—Dec.1945—Dec.1947—Dec.1948—Dec.1949—Dec.1950—Tune
Dec.1951 —Tune
Dec.
1952—Mar.Apr.M a yTuneJulyAug.SeptOct.Nov.Dec.
1953—Tan.Feb.M a r
293030 . . .313131313130303031
26302830302724292631
2 8 P25 P25 P
44
17222022242424222122
23232323232323232323
23221 1
037031644737065754244427231706756695
300300300346400300300300300187
000700600
Total
55426882
180175176177178184185193
192192192194197197197199202204
202201200
776029359811806348
,121,313,568385
,038,404
,300,200,900,960,200,000,900,900,700,220
,100, 000, 600
Treas-
urycur-
rency
2,0192,2862,9633,2474,3394,5624,5894,5984,6074,6364,6554,706
4,7004,7004,7004,7544,8004,8004,8004,8004,8004,812
4,8004,8004 ,800
Foreignbank
deposits,net
36550
1,2171 .4982,1411,6822,1032,1502.5552,5182,4242,279
2,2002,2002,3002,3192,6002 ,6002,5002,5002,5002,501
2 ,5002 ,3002 ,400
Total
58,64242,14854,56464,653
167,381160,832160,457162,681164,348171,667173,447181,323
180,100179,900180,600182,980185,300185,300186,500188,900191,500192,866
101,200100,300100,200
U. S. Go
Treas-urycash
204264
2,4002,2152,2871,3361 ,3251,3121 ,2081 ,2031 ,2811 ,279
1 ,3001 ,3001 ,3001 ,2831 ,3001 ,3001 ,3001 ,3001 ,3001 ,270
1 ,3001 ,3001 .300
Loans,net
412122263043484951606367
67686869707071727475
747576
082057157605387023341604999366821597
700100500712000500600900300484
0000 0 01 0 0
vernment
At com-mercial
andsavingsbanks
124
1233263
544676657^
4
381852846805608452451
,240801989332
,615
,800,500,400,121,000,200,500,300,000,250
,200,400, 800
Assets
Bank credit
U. S.
Total
5102320
12810710010098969497
96959596089797989 0
1 0 0
OS0 70 6
741328105049417086604456709560450808
1002003002 6 61 0 03 0 06 0 06 0 00 0 00 0 8
SOO. 800,400
Government obligations
Com-mercial
andsavingsbanks
5,4908,199
10,41725,511
101,28881,10074,09778,43377,32072,89468,72671,343
70,90070,20070,50070,78372,70071,70071,30072,40073,60072,740
72,30071 ,4 0070,000
FederalReserveBanks
1 ,2 ,2 ,
24 ,2 2 .2 3 ,18,18,2 0 .22 ,2 3 ,
22222222222323232324
242323
216998484254262559333885331778982801
500400300906800100700600800607
0000 0 00 0 0
Other
1123333222
2222222222
29
Deposits and Currency
balances
HtFederalReserveBanks
1
3635
634867977870
,123821950668317247
( 5 )
5006003336 0 0700300600300380
700400<••)
Total
54,79040,82863,25376,336
150,793170.008169 ,119169,781169,964176,917174,684185,984
182,900183,800184,400184,904185.800186,200187,400190,200191,600104,801
193,3000] ,600
101,000
26131204284867328264138058888742664
6006006005776006006006006005 7 1
6 0 05 0 05 0 0
I
Othersecu-rities
11 ,8199,8639,3028,9098,577
10,72311,42212,62113,64014,74115,17615,918
16,40016,60016,80017,00217,20017,50017,40017,30017,30017,374
17,500 !17,50017,800
Totalassets,
net—Total iliabil- !
it es :and Icapital,
net
64487590,
101.188189101193199199208
208207208211213213214217219220
210217217
608 i465171637785148290706186009858724
9 0 0
9007000804004006000 0 06 0 08 6 5
0 0 08 0 06 D 0
Deposits adjusted and currenc
Demanddeposits2
221429387587858585028898
940595940 595969890
101
1000 807
540411703992851121
,520,750.040.272,960,234
,800,100,300,754,700,800,400,600,400,508
.500,300, 400
Total
282127274856575850505061
62626363636464646465
666 6U(
,611,656,050,720,452,411,520,616,730,247,048,447
,400.700,000,676,800,100,500,000,800,700
, 100,400,800
Time d
Com-mercialbanks
19,55710,84015,25815,88430,13535,24935,80436,14636,71036,31436.78137,850
38,50038,60038,90039,30230,40030,60039,80040,10040,00040,666
40,70041,00041 ,200
eposits:j
Mutualsavingsbanks*
j8Q
10101517181910202020
21212121212222222222
22222.5
,905,621523532
,385,746,387,273,923000
,382,887
,300,400,600,755,900,000,200,200,300,586
, 800,000. 100
Liabilitiesand Capital
Totaldepositsandcurrency
55426882
180175176177178184185193
102192192194197197197199202204
202201i 2 0 0
776029350811806348121313568385038404
300200900960200000900900700220
1 000006 0 0
PostalSavingsSystem
111
• 2
: 333322
i ~2; 222222
• 2
i 22
9
\ 2
1401862783139324 1 63 2 01070 0 70 2 37 8 57 0 1
7 0 0,700,600,610,600, 600\ 600,600,600.54 7
,500,500, 500
Capitaland
misc.ac-counts,
net
8667
1012131414141415
15151516161616171616
161617
922436812826979800168392618624820320
900700800120100400700100900647
000800000
rencyoutsidebanks
346
2626262525252526
25252626262626262727
262626
639761401615
,490,476070415
,185,308,776,303
,700,900.000,474,200,300,600,700,400,404
,800,000, 000
p Preliminary.xTreasury funds included are the gold account, Treasury currency account, and Exchange Stabilization Fund.2Demand deposits other than interbank and U. S. Government, less cash items reported as in process of collection.3Excludes interbank time deposits; United States Treasurer's time deposits, open account; and deposits of Postal Savings System in banks.4 Prior to June 30, 1947, includes a relatively small amount of demand deposits. 5Less than 50 million dollars.
The composition of a few items differsiks is included in "Other securities"ge Stabilization Fund with the U. S.
Treasury are netted against the same item instead of against U. S. Government deposits and Treasury cash. Total deposits and currency shownin the monthly Chart Book excludes "Foreign bank deposits, net" and "Treasury cash." Except on call dates, figures are rounded to nearest 100million dollars and may not add to the totals. See Banking and Monetary Statistics, Table 9, pp. 34-35, for back figures for deposits and currency.
488 FEDERAL RESERVE BULLETIN
Digitized for FRASER http://fraser.stlouisfed.org/ Federal Reserve Bank of St. Louis
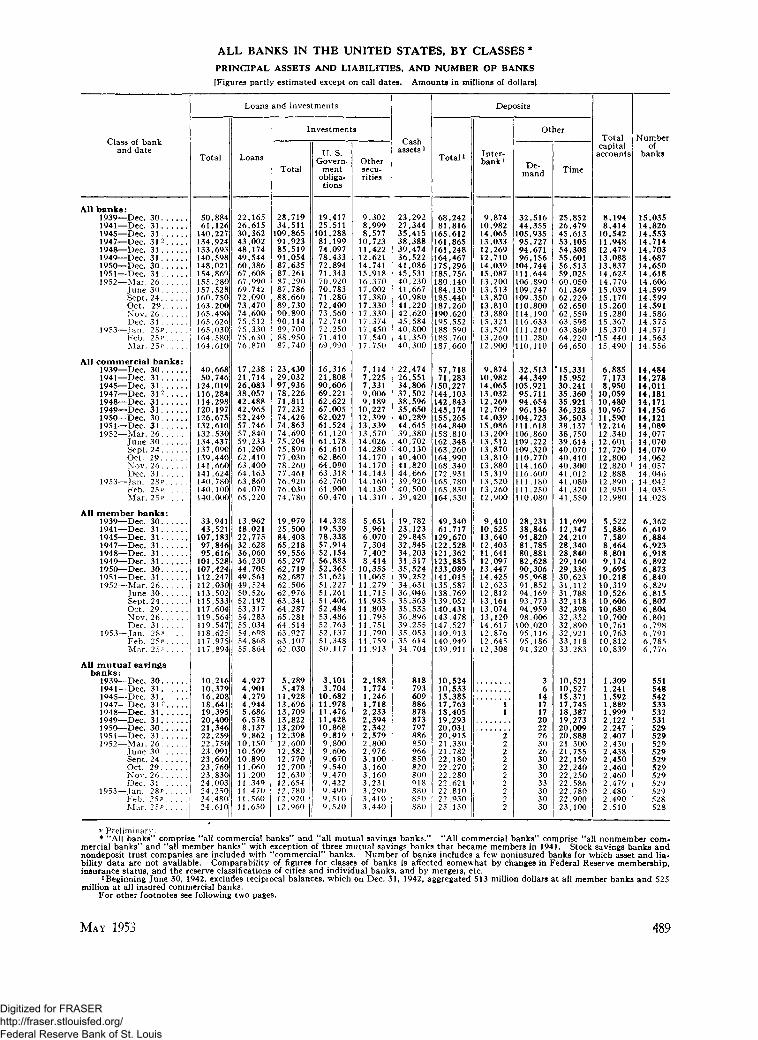
ALL BANKS IN THE UNITED STATES, BY CLASSES *PRINCIPAL ASSETS AND LIABILITIES, AND NUMBER OF BANKS
[Figures partly estimated except on call dates. Amounts in millions of dollars]
Class of bankand date
All banks:1939—Dec. 301941—Dec. 311945—Dec. 311947—Dec. 31 -1948—Dec. 311949—Dec. 311950— Dec. 301951—Dec. 311952—Mar. 26
June 30Sept. 24Oct. 29Nov. 26Dec. 31
1953—Tan. 28?Feb. 25vMar. 25*
All commercial banks:1939—Dec. 301941—Dec. 311945—Dec. 311947—Dec. 31 -1948—Dec. 311949—Dec. 311950—Dec. 301951—Dec. 311952—Mar. 26
June 30Sept. 24Oct. 29Nov. 26Dec. 31
1953—Tan. 2S?Feb. 25PMar. 25v
All member banks:1939—Dec. 301941—Dec. 311945—Dec. 311947—Dec. 31. ,1948—Dec. 311949—Dec. 311950—Dec. 301951— Dec. 311952—Mar. 26
June 30Sept. 24Oct. 29Nov. 26Dec. 31
1953—Tan. 28?Feb. 25P. . . .Mar. 25P
All mutual savingsbanks:
1939—£)ec 30.1941—Dec. 311945—Dec. 311947—Dec. 31 2
1948—Dec. 311949—Dec 3i1950—Dec. 30 . . . .1951—Dec. 311952—Mar. 26
June 30Sept. 24Oct. 29Nov. 26Dec. 31
1953—Tan. 28?Feb. 25PMar. 25v
Total
50,88461,126
140,227134,924133,693140,598148,021154,869155,280157,528160.750163.200165,490165,626165,030164.580164,610
40,66850,746
124,019116,284114,298120,197126,675132,610132,530134.437137,090139,440141,660141,624140,780140,100140,000
33,94143,521
107,18397,84695,616
101,528107,424112,247112,030113.502115,533117,604119,564119,547118,625117,975117,894
10 21610,37916,20818,64119,39520,40021,34622,25922,75023.09123,66023,76023,83024,00324,25024,48024,610
Loans
Loans
22,16526,61530,36243,00248,17449,54460,38667,60867,99069.74272,09073,47074,60075,51275,33075,63076,870
17,23821,71426,08338,05742,48842,96552,24957,74657,84059,23361 ,20062,41063,40064,16363,86064.07065,220
13,96218,02122,77532,62836,06036,23044,70549,56149,52450.52652,19253,31754,28355,03454,69854 .86855,864
4,9274,9014,2794,9445,6866,5788,1379,862
10,15010,50910,89011.06011,20011,34911,47011,56011,650
and investments
Investments
Total
28,71934,511
109,86591,92385,51991,05487,63587,26187,29087,78688,66089,73090,89090,11489,70088.95087,740
23,43029,03297,93678,22671,81177,23274,42674,86374,69075,20475,89077,03078,26077,46176,92076,03074,780
19,97925,50084,40865,21859,55665,29762,71962,68762,50662,97663,34164,28765,28164,51463,92763,10762,030
5,2895,478
11,92813,69613,70913,82213,20912,39812,60012,582t2.77O12,70012,63012,65412,78012,92012,960
U. S.Govern-
mentobliga-tions
19,41725,511
101,28881,19974,09778,43372,89471,34370,92070,78371,28072,40073,56072,74072,25071 .41069,990
16,31621,80890,60669,22162,62267,00562,02761 ,52461,12061.17861,61062,86064,09063,31862,76061,90060,470
14,32819,53978,33857,91452,15456,88352,36551,62151,22751,26151,40652,48453,48652,76352,13751,34850,117
3,1013,704
10,68211,97811,47611,42810,8689.8199,8009.6069,6709,5409,4709,4229,4909,5109,520
Othersecu-rities
9,3028,9998,577
10,72311,42212,62114.74115,91816,37017,00217,38017.33017,33017,37417,45017,54017,750
7,1147,2257,3319,0069,189
10,22712,39913.33913,57014.02614.28014,17014,17014,14314,16014,13014,310
5,6515,9616,0707,3047,4028,414
10,35511.06511,27911,71511,93511,80311,79511 ,75111,79011 ,75911,913
2,1881,7741,2461,7182,2332,3942,3422,5792,8002,9763.1003,1603,1603,2313,2903,4103,440
Cashassets 1
23,29227,34435,41538,38839,47436,52241,08645,53140,23041,66740,98041,22042,62045,58440,80041 ,35040,300
22,47426,55134,80637,50238,59635,65040,28944,64539,38040,70240,13040,40041 ,82044,66639,92040,50039,420
19,78223,12329-84532,84534,20331,31735,52439,25234,63136,04635,36335,53536,89639,25535,05335,61434,704
818793609886878873797886850966850820800918880850880
Deposits
Total i
68,24281,816
165,612161,865161,248164,467175,296185,756180,140184,130185,440187,260190,620195,552188,590188,760187,660
57,71871,283
150,227144,103142,843145,174155,265164,840158,810162,348163,260164,990168,340172,931165,780165,830164,530
49,34061,717
129.670122,528121,362123,885133,089141,015135,587138,769139,052140.431143,478147,527140,913140,949139,911
10,52410,53315,38517,76318,40519,29320,03120,91521,33021.78222,18022,27022,28022,62122,81022,93023,130
Inter-bank i
9,87410,98214,06513,03312,26912,71014,03915,08713,20013,51313,87013,81013,88015,32113,52013,26012,900
9,87410,98214,06513,03212,26912,70914,03915.08613,20013,51213,87013,81013,88015,31913,52013,26012,900
9,41010,52513,64012,40311,64112,09713,44714,42512,62312,81213,16113.07413,12014,61712,87612,64512,308
11
2222222222
Other
De-mand
32,51644,355
105,93595,72794,67196,156
104,744111,644106,890109,247109,350110,800114,190116,633111 ,210111 ,280110,110
32,51344,349
105,92195,71194,65496,136
104.723111.618106,860109,222109,320110,770114,160116,600111 ,180111,250110,080
28,23138,84691.82081,78580,88182,62890,30695,96891,85294,16993,77394,95998,006
100,02095,11695,18694,320
36
141717202226302630303033303030
Time
25,85226,47945.61353,10554,30855,60156,51359,02560,05061,36962,22062,65062,55063,59863,86064,22064,650
"15,33115,95230,24135,36035,92136,32836,50338,13738,75039,61440,07040,41040,30041,01241,08041,32041,550
11,69912,34724,21028,34028,84029,16029,33630,62331,11231.78832,11832,39832,35232,89032,92133,11833,283
10,52110,52715,37117,74518,38719,27320,00920,88821,30021,75522,15022,24022,25022,58622,78022,90023,100
Totalcapital
accounts
8,1948,414
10.54211,94812,47913,08813,83714,62314,77015,03915,17015,26015,28015,36715,37015,44015,490
6,8857,1738,950
10,05910,48010,96711,59012.21612,34012,60112,72012,80012,82012,88812,89012,95012,980
5,5225,8867,5898,4648,8019,1749,695
10,21810,31910,52610,60610,68010,70010,76110,76310,81210,839
1,3091,2411,5921,8891,9992,1222,2472.4072,4302,4382,4502,4602,4602,4792,4802,4902,510
NumberOf
banks
15,03514,82614.55314,71414,70314,68714,65014,61814,60614,59914,59914,59114,58614,57514,57114,56314,556
14,48414,27814,01114,18114,17114,15614,12114,08914,07714,07014,07014,06214,05714,04614,04214,03514,028
6,3626,6196.8846,9236,9186,8926,8736,8406,8296,8156,8076,8046,8016,7986,7916,7856,776
551548542533532531529529529529529529529529529528528
P Preliminary.• "All banks" comprise "all commercial banks" and "all mutual savings banks." "All commercial banks" comprise "all nonmember com-
mercial banks" and "all member banks" with exception of three mutual savings banks that became members in 1941. Stock savings banks andnondeposit trust companies are included with "commercial" banks. Number of banks includes a few noninsured banks for which asset and lia-bility data are not available. Comparability of figures for classes of banks is affected somewhat by changes in Federal Reserve membership,insurance status, and the reserve classifications of cities and individual banks, and by mergers, etc.
1 Beginning June 30, 1942, excludes reciprocal balances, which on Dec. 31, 1942, aggregated 513 million dollars at all member banks and 525million at all insured commercial banks.
For other footnotes see following two pages.
MAY 1953 489
Digitized for FRASER http://fraser.stlouisfed.org/ Federal Reserve Bank of St. Louis

ALL BANKS IN THE UNITED STATES, BY CLASSES •—ContinuedPRINCIPAL ASSETS AND LIABILITIES, AND NUMBER OF BANKS—Continued
[Figures partly estimated except on call dates. Amounts in millions of dollars]
Class of bankand date
Central reserve citymember banks:
New York City:1939—D e c 301941—Dec. 311945—D e c 311947—Dec. 31194g—Dec 311949—Dec. 311950—Dec 301951—Dec. 311952—Mar. 26
June 30 . . . .Sept 24Oct. 29Nov. 26Dec. 31
1953—Jan. 28?Feb. 25 ?Mar. 2 5 P
Chicago:1939—Dec 301941—Dec. 311945—Dec. 311947—Dec. 31194g—Dec. 311949—Dec. 311950—Dec 301951—Dec- 311952—Mar. 26
June 30Sept. 24Oct 29Nov. 26Dec. 3 1 .
1953—Jan. 28?Feb. 25?Mar. 25P
Reserve city memberbanks:
1939—Dec. 301941—Dec. 311945—Dec. 31 . . .1947—Dec 311948—Dec. 311949—Dec. 311950—Dec. 301951—Dec. 311952—Mar. 26.
June 30Sept 24.Oct. 29Nov 26Dec. 31
1953—Jan. 28 PFeb. 25?Mar. 25?
Country memberbanks:
1939—Dec. 301941—Dec. 31 .1945—Dec 311947—Dec. 311948—Dec. 31 . ,1949—Dec. 311950—Dec. 301951—Dec. 311952—Mar. 26
June 30Sept 24Oct. 29Nov. 26Dec. 31
1953—Jan. 28?Feb. 2 5 PMar. 25?
Total
9,33912,89626,14320,39318,75919,58320,61221,37921,13421.71021,24621,28321 69622,13021,23321,04921,185
2,1052,7605,9315,0884,7995,4245,5695,7315,7475,6645,6795,8396,1126,2406,0375,9106,033
12,27215,34740,10836,04035,33238,30140,68542,69442,43543.09144,16345.38146,10445,58345,53345,27145,085
10,22412,51835,00236,32436,72638.21940,55842,44442,71443.03744,44545,10145,65245,59445,82245,74545,591
Loans
Loans
3,2964,0727,3347,1798,0487,5509,729
11,14611,06811,26811,36311,68011,97312,37612,12712.11212,335
569954
1,3331,8011,7831,6182,0832,4682,4092.3802,3992,4442,5922,7482,5942,5692,604
5,3297,1058,514
13,44914,28514,37017,90619.65119,51119.74520,73021,27621,62721,69721,68021,80122,274
4,7685,8905,596
10,19911,94512,69214,98816,29616,53617,13317,70017,91718,09118,21318,29718,38618,651
and investments
Investments
Total
6,0438,823
18,80913,21410,71212,03310,88310,23310,06610,4429,8839,6039,7239,7549,1068,9378,850
1,5361,8064,5983,2873,0163,8063,4873.2643,3383,2843,2803.3953,5203,4933,4433,3413,429
6,9448,243
31,59422,59121,04723,93122,77923,04322,92423.34623,43324,10524,47723,88623,85323,47022,811
5,4566,628
29,40726,12524,78225,52725,57026.14826,17825.90426,74527,18427,56127,38127,52527,35926,940
U.S.Govern-
mentobliga-tions
4,7727,265
17,57411,9729,649
10,7468,9938,1297,9058,2127,6127,5187,6957,6787,0126,8406,717
1,2031,4304.2132,8902,6333,3242,9112,7112,7982,7212,7092,8272,9332,9122,8622,7792,864
5,1946,467
29 55220,19618,59420,95119,08419,19418,93419.12319,11319,76120,12719,62419,54319,16118,439
3,1594,377
26,99922,85721,27821,86221,37721.58721,59021.20621,97222,37822,73122,54922,72022,56822,097
Othersecu-rities
J .2721,5591,2351,2421,0631,287.8902,1042,1612,2312,2712,0852,0282,0762,0942,0972,133
333376385397383482576552540563571568587581581562565
1,7491,7762,0422,3962,4532,9803,6953.8493,9904,2234,3204,3444,3504,2624,3104,3094,372
2,2972,2502,4083,2683,5043,6654,1934.5614,5884.6984,7734,8064,8304,8324,8054,7914,843
Cashassets1
6,7036,6376,4397,2617,7586,9857,9228,5647,6018,1357,2977.2677,8188,4196,9947,2247,227
1 .4461,5661,4891,7391,9321,8502,0342,1961,884I .8992,0842,1192,1202,0102,0832,0981,922
6,7858,518
11,28613,06613,31712,16813,99815,19913,61113.92514,08614,00414,58515,54413,89814,15213,848
4,8486,402
10,63210,77811,19610,31411,57113,29211,53512.08711,89612,14512,37313,28112,07812,14011,707
Deposits
Total 1
14,50917,93230,12125,21624,02423,98325,64626,85925,59026,74525,28825,11126,10827,30924,81724,76924,942
3,3304,0577,0466,4026,2936,8107,1097,4027,0587,0277,1967,2157,3687,6867,1867,2227,122
17,74122,31349,08546,46745,94347,55951,43754,46652,32853,42554,01354,76655,92357,35754,89354,91254,527
13,76217,41543,41844,44345,10245,53448,89752,28850,61151.57152,55553,33954,07955,17554,01754,04653,320
Inter-bank 1
4,2384,2074,6574,4644,2134,1924,6384,8324,3794,6394,5964,3884,4404,9654,4374,3674,292
RRR
1
,035,312,217,064,191,228,307,275,182,239,240,221,350,171,182,133
L6864,4606,4485,6495,4005,7136,4486,9765,8755.9086,2266,2896.278
(r.ooi3,104>,9915,831
598822
1.2231,073
9641,0011,1331,3091,0941.0831,1001,1571,1811,3011,1641 ,1051,052
Other
De-mand
9,53312,91724,22719,30718,13118,13919,28720,34819,46520,31118,97119,01119,88420,50418,60118,58918,773
1,9472,5465,0154,2734,2274,5354,7784,9524,6514.6814,8084 .8124,9815,1324,8434,8724,835
9,43913,04732,87729,39529,15330,18233,34235.21833,99834,76434,86135.42236,60437,09535,49935,55135,298
7,31210,33529,70028.81029,37029,77132,89935.44933,73834.41435,13335,71436,53737,28936,17336,17435,414
Time
736807
1
1,2361,4451,6801,651,722
1,6791,746L.7951,721.712
1,7841,8401,7791,8131,877
495476719913
1,0011,0831,1031,1431,1321,1641,1491,1631,1661,2051,1721,1681,154
4.6164,8069,760
11,42311,39111,66411,64712,27212,45512,75412,92613,05513,04113,26113,29013,37013,398
5.8526,258
12,49414,56014,76814,76214,86515,53015,77916,07516,32216,46816,36116 58516,68016,76716,854
Tota lcapital
accounts
1,5921,6482,1202,2592,3062,3122,3512,4252,4382.4602,4622,4772,4762,5052,5082,5252,520
250288377426444470490513513530531534537541537537539
1,8281,9672,5662,8442,9283,0873,3223,5213,5653,6633,6753,7113,7203,7453,7423,7623,780
1.8511,9822,5252,9343,1233,3053,5323,7603,8033,8733,9383,9583,9673 9703,9763,9884,000
Numberof
banks
3636373735252322222222222222222222
1413121413131313131313131313131313
346351359353335341336321320319319319319319320322322
5,9666,2196,4766,5196,5356,5136,5016,4846,4746,4616,4536,4506,4476 4446,4366,4286,419
2 Beginning with December 31, 1947, the all bank series was revised as announced in November 1947 by the Federal bank supervisory agencies.At that time a net of 115 noninsured nonmember commercial banks with total loans and investments of approximately 110 million dollars wasadded, and 8 banks with total loans and investments of 34 million were transferred from noninsured mutual savings to nonmember commercialbanks.
For other footnotes see preceding and opposite pages
490 FEDERAL RESERVE BULLETIN
Digitized for FRASER http://fraser.stlouisfed.org/ Federal Reserve Bank of St. Louis

ALL BANKS IN THE UNITED STATES, BY CLASSES *—Continued
PRINCIPAL ASSETS AND LIABILITIES, AND NUMBER OF BANKS—Continued
[Amounts in millions of dollars]
Class of bankand date
All insured commercialbanks:
1941—Dec. 311945—Dec 311947—Dec. 311950—Dec. 301951—Dec. 311952—June 30
Dec. 31
National memberbanks:
1941—Dec. 31 . . .1945—Dec. 311947—Dec 311950—Dec. 301951—Dec 31 . . .1952—June 30
Dec. 31
State member banks:1941—Dec. 31194S—Dec. 31 . . . .1947—Dec. 311950—Dec. 301951—Dec. 311952—June 30
Dec. 31
Insured nonmembercommercial banks:
1941—Dec. 311945—Dec. 311947—Dec. 311950—Dec. 301951—Dec. 311952—Tune 30
Dec. 31
Noninsured nonmem-ber commercialbanks:
1941—Dec. 311945—Dec. 311947—Dec. 3V1950—Dec. 30 . . . .1951—Dec. 311952—Tune 30
Dec 31
All nonmember com-mercial banks:
1941—Dec. 311945—Dec. 311947—Dec. 31 2
1950—Dec. 301951—Dec. 311952—Tune 30 . . . .
Dec. 31
Insured mutual savingsbanks:
1941 Dec 311945—Dec. 31.1947—Deci 311950—Dec. 301951—Dec. 311952—Tune 30
Dec. 31
Noninsured mutualsavings banks:
1941 Dec 311945—Dec. 311947—Dec. 31 21950—Dec. 301951—Dec. 311952—Tune 30
Dec. 31
Loans and investments
Total
49,290121.809114,274124,822130,820132,557139,770
27,57169.31265,28072,09075,25576.03680,180
15,95037.87132,56635,33436,99237.46639,367
5,77614,63916,44417,41418,59119.07320,242
1,4572,2112,0091,8531,7891 .8801,854
7,23316,84918,45419.26720,38020.95422,096
1 69310,84612,68315,10116,19016,85717,621
8 6875.3615,9576,2456,0696.2346,382
Loans
21,25925,76537,58351,72357,25658.73063,632
11,72513,92521,42829,18432.31733.05436,004
6 2958 850
11,20015,52117,24317.47219,030
3,2412.9924,9587,0237,7018.2108,605
455318474527490503531
3,6963.3105,4327,5508,1928.7149,136
6423,0813,5606,0867,5238.0438,691
4,2591,1981,3842,0502,3392,4662,658
Investments
Total
28,03196,04376,69173,09973,56473,82776,138
15,84555,38743,85242,90642,93842,98244,176
9 65429.02121,36519,81319,74819.99420,337
2,53511.64711,48610,39110,89010,86311,638
1,0021,8931,5351,3271,2991.3771,322
3,53613,53913,02111,71812,18912.24012,960
1,0507.7659,1239,0158,6688.8148,930
4,4284,1634,5734,1943,7303.7683,724
U. S.Govern-
mentobliga-tions
21,04688,91267,94160,98660,53360,11762,308
12,03951,25038,67435,58735,06334.60435,835
7,50027.08919,24016,77816,55816.65716,928
1,50910.58410,0398,6328,9238.8679,556
7611.6931,2801,040
9911 .0611,010
2,27012,27711,3189,6729,9149.928
10,567
6297.1608,1657,4876,9216.7306,593
3,0753,5223,8133,3802,8972,8762,829
Othersecu-rities
6,9847,1318,750
12,11313,03113.71013,831
3,8064.1375,1787,3207,8758.3788,341
2,1551,9332,1253,0353,1913.3373,409
1,0551.0C31,4481,7591,9671.9962,081
241200255286308317312
1,2661.2621,7032,0402.2752.3122,393
421606958
1,5281,7462.0842,337
1,353641760814833892895
Cashassets »
25,78834,29236,92639,82144,17640,25844,222
14,97720,11422,02423,76325,95123.92826,333
8,1459,731
10,82211,76213,30112.11912,922
2,6684,4484,0834,2994,9264.2154,970
763514576468469443444
3,4314.9624,6594,7675,3954.6585,414
151429675617695756732
642180211180191209187
Deposits
Total *
69,411147.775141,851153,288162,908160,355170,971
39,45884,93982,02389,28194,17392,72098,974
22,25944,73040,50543,80846,84346,04948,553
7,70218,11919,34020,21621,91221.60623,464
1,8722.4522,2511,9761,9321 .9931,960
9,57420,57121,59122,19323,84323,59825,424
1,78910,36312,20714,32015,36816.08116,785
8,7445,0225,5565,7115,5475,7025,836
Inter-bank^
10,65413,88312,67013,74414,77713,10014,990
6,7869,2298,4109,1339,7888,5849,918
3,7394,4113,9934,3154.6374.2274,699
129244266297353289373
329181363294308412329
457425629591661700702
1
222
Other
De-mand
43,059104,01594,300
103,499110.382108.036115,371
24,35059,48654,33560,25163,47762,25566,362
14,49532,33427,44930 05532.49131.91433,658
4,21312,19612,51513,19414,41513,86715,351
1,2911.9051,4111,2241,2351 .1861,229
5,50414,10113,92614,41715,65015.05216,580
121419232330
6233333
- Time
15,69929,87634,88236,04537,74939,21940,610
8,32216,22419,27819,89720 90821,88022,694
4,0257.9869,0629,4389,7159.908
10,196
3,3605.6806,5586,7267,1447.4507,740
253365478458388396402
3,6136,0457,0367,1847,5337.8468,142
1,78910,35112,19214,30115,34316,05616,753
8,7385,0205,5535,7085,5445,6995,833
Totalcapital
accounts
6,8448,6719,734
11,26311,90212,28212,563
3,6404,6445,4096,3136,6536.8797,042
2,2462,9453,0553,3813,5653,6473,719
9591,0831,2711,5701,6861,7571,804
329279325327314320326
L.2881.3621,5961,897L.999?.O772,129
1*4.1,0341,2521,5131,678.700
1,730
.077558637734729738749
Numberof
banks
13,42613 29713,39813,43213,43913,43413,422
5 1175,0175 0054,9584 9394.9254,909
\ . 502
((t
,867,918915
1,901890
,889
S.810S.416S.4786,5626,6026,62?6,627
852714783689650636624
7,6627,1307,2617.2517,2527.2587,251
52192194194202205206
496350339335327324323
For footnotes see preceding two pages.Back figures.—See Banking and Monetary Statistics, Tables 1-7. pp. 16-23; for description, sec pp. 5-15 in the same publication. For revision*
in series prior to June 30, 1947, see BULLETIN for July 1947. pp. 870-871.
MAY 1953 491
Digitized for FRASER http://fraser.stlouisfed.org/ Federal Reserve Bank of St. Louis

ALL COMMERCIAL BANKS IN THE UNITED STATES, BY CLASSES *LOANS AND INVESTMENTS
[In millions of dollars]
Class of bankand
call date
All commercialbanks:3
1947—Dec. 3 1 . . .1950—Dec. 30. . .1951—Dec. 3 1 . . .1952—June 30. . .
Dec. 3 1 . . .
All insured com-mercial banks:
1941—Dec. 3 1 . . .1945—Dec. 31. . .1947—Dec. 3 1 . . .1950—Dec. 30. . .1951—Dec. 3 1 . . .1952—Tune 30. . .
Dec. 3 1 . . .
Member banks,total:
1941—Dec. 3 1 . . .1945—Dec. 31. . .1947—Dec. 3 1 . . .1950—Dec. 30. . .1951—Dec. 3 1 . . .1952—June 3 0 . . .
Dec. 31. . .
New York City:*1941—Dec. 31. . .1945—Dec. 3 1 . . .1947—Dec. 31. . .1950—Dec. 3 0 . . .1951—Dec. 31. . .1952—June 3 0 . . .
Dec. 31. . .
Chicago:*1941—Dec. 31. . .1945—Dec. 3 1 . . .1947—Dec. 31. . .1950—Dec. 3 0 . . .1951—Dec. 31. . .1952—June 30. . .
Dec. 3 1 . . .
Reserve city banks:1941—Dec. 3 1 . . .1945—Dec. 31. . .1947—Dec. 3 1 . . .1950—Dec. 30. . .1951—Dec. 31. . .1952—June 3 0 . . .
Dec. 3 1 . . .
Country banks:1941—Dec. 3 1 . . .1945—Dec. 3 1 . . .1947—Dec. 3 1 . . .1950—Dec. 30. . .1951—Dec. 3 1 . . .1952—June 3 0 . . .
Dec. 31. . .
All nonmemberbanks:3
1947—Dec. 3 1 . . .1950—Dec. 30. . .1951—Dec. 3 1 . . .1952—June 3 0 . . .
Dec. 31. . .
Totalloansand
invest-ments
116,284126,675132,610134,437141,624
49,290121,809114,274124,822130,820132,557139,770
43,521107,18397,846
107,424112,247113,502119,547
12,89626,14320,39320,61221,37921,71022,130
2,7605,9315,0885,5695,7315,6646,240
15,34740,10836,04040,68542,69443,09145,583
12,51835,00236,32440,55842,44443,03745,594
18,45419,26720,38020,95422,096
Loans1
Total1
38,05752,24957,74659,23364,163
21,25925,76537,58351,72357,25658,73063,632
18,02122,77532,62844,70549,56150,52655,034
4,0727,3347,1799,729
11,14611,26812,376
9541,3331,8012,0832,4682,3802,748
7,1058,514
13,44917,90619,65119,74521,697
5,8905,596
10,19914,98816,29617,13318,213
5,4327,5508,1928,7149,136
Com-mer-cial,in-
elud-ing
open-mar-ketpa-per
18,16721,92725,87925,31227,871
9,2149,461
18,01221,77625,74425,17627,739
8,6718,949
16,96220,52124,34723,73226,232
2,8073,0445,3616,3287,8527,6598,680
732760
1,4181,5671,9771,8562,080
3,4563,6617,0888,646
10,1409,756
10,842
1,6761,4843,0963,9804,3774,4624,630
1,2051,4051,5331,5801,639
Agri-cul-tur-al
1,6602,9053,4083,6523,919
1,4501,3141,6102,8233,3213,5623,805
972855
1,0461,8082,1402,2642,416
8
6239
161114
300205225392513519501
659648818
1,4071,6101,7331,901
6141,0961,2681,3881,503
Loans forpurchasingor carryingsecurities
Tobrok-ersanddeal-ers
8301,8021,5812,1132,060
6143,164
8231,7891,5712,1062,050
5943,133
8111,7701,5512,0842,032
4122,453
5451,4211,2191,6191,531
48211
7311094
166239
114427170207203258218
20422333354143
2031302929
Tooth-ers
1,2201,057
980965
1,103
6623,6061,1901,036
960942
1,082
5983,3781,065
927851829966
1691,172
267285262234286
52233
8769636166
1941,503
484386347354422
183471227187178179191
156130130136137
Reales-tate
loans
9,39313,54114,58015,01915,712
4,7734,6779,266
13,38914,45014,88415,572
3,4943,4557,130
10,52211,33411,62812,214
12380
111442514426386
22364665706767
1,5271,4593,1474,4234,6514,7995,099
1,8231,8813,8275,5916,0996,3376,662
2,2663,0243,2523,3973,505
Otherloans
toin-di-
vid-uals2
5,72310,12010,45111,41712,684
Otherloans2
1,0631,5731,6811,6081,718
4,5452,3615,654
10,04910,37811,34012,603
3,61,9004,6628,3148,5249,268
10,396
5i287564930920981
1,136
551
149207180183211
1,5855
1,9693,4983,5183,8054,347
1,5707
1,9793,6793,9064,2994,702
1,0611,8071,9272,1492,288
1,1811,0281,5341,6451,5701,683
921,104
9521,4381,5351,4731,577
4298330460551524539
6402687
10983
120
12404366603572559595
30363229288303308322
111134146135141
Investments
Total
78,22674,42674,86375,20477,461
28,03196,04376,69173,09973,56473,82776,138
25,50084,40865,21862,71962,68762,97664,514
8,82318,80913,21410,88310,23310,4429,754
1,8064,5983,2873,4873,2643,2843,493
8,24331,59422,59122,77923,04323,34623,886
6,62829,40726,12525,57026,14825,90427,381
13,02111,71812,18912,24012,960
U. S. Government obligations
Total
69,22162,02761,52461,17863,318
21,04688,91267,94160,98660,53360,11762,308
19,53978,33857,91452,36551,62151,26152,763
7,26517,57411,9728,9938,1298,2127,678
1,4304,2132,8902,9112,7112,7212,912
6,46729,55220,19619,08419,19419,12319,624
4,37726,99922,85721,37721,58721,20622,549
11,3189,6729,9149,928
10,567
Bills
2,1934,2367,337:6,2417,761
9882,4552,1244,1187,2196,0907,622
9712,2751,9873,6656,3995,4236,565
311477
1,002824
1,1221,0621,079
256133132232334366407
2951,034
3731,2182,5242,0802,387
110630480
1,3902,4181,9142,692
206571939819
1,196
Direct
Certifi-catesof in-debt-ed-ness
7,7891,9697,6577,7985,580
19,0717^5521,9327,5267,6535,494
16[9855,8161,4686,0106,1344,255
3,433640250616692233
1,467235131332371224
6,9822,358
4992,4932,5201,774
5,1022,583
5882,5682,5512,024
1,973501
1,6471,6641,325
Notes
6,03417,03311,40811,24611,878
3,15916,0455,918
16,75611,25611,09911,714
3,00714,2714,815
14,0549,5969,4689,835
1,6233,325
5581,7111,4281,4001,170
153749248700520494607
7515,6531,9015,5363,6403,6563,854
4814,5442,1086,1074,0083,9184,204
1,2192,9791,8121,7782,043
Bonds
53,19138,77835,10135,86738,077
12,79751,32152,33438,16834,51135,25137,456
11,72944,79245,28633,17029,60130,21532,087
3,65210,3379,7716,2064,9605,0585,195
9031,8642,2741,8471,5261,4901,674
4,24815,87815,56011,83010,52810,85111,594
2,92616,71317,68113,28712,58712,81713,625
7,9165,6185,5105,6626,000
Guar-an-teed
1411212522
4,102221411212522
3,8321610
8152119
1,6791
22
1
119
1,1735318
1614
861965554
43643
Obli-ga-tionsof
Statesandpolit-icalsub-
divi-sions
5,2768,1189,1989,84410,188
3,6513,8735,1297,9338,9899,6279,977
3,0903,2544,1996,6407,5288,1258,409
729606638
1,1231,3851,4361,453
182181213335351363384
9561,1261,3422,1842,4582,8322,934
1,2221,3422,0062,9983,3343,4943,639
1,0781,4781,6711,7201,781
Othersecu-rities
3,7294,2814,1414,1823,955
3,3333,2583,6214,1794,0424,0833,854
2,8712,8153,1053,7143,5383,5903,342
830629604767719794623
193204185242201201197
820916
1,0531,5111,3901,3911,328
1,0281,0671,2621,1941,2271,2041,194
625567604592613
* These figures do not include data for banks in possessions of the United States. During 1941 three mutual savings banks became membersof the Federal Reserve System; these banks are included in "member banks" but are not included in "all insured commercial banks" or "all commer-cial banks." Comparability of figures for classes of banks is affected somewhat by changes in Federal Reserve membership, insurance status, andthe reserve classifications of cities and individual banks, and by mergers, etc.
1 Beginning June 30, 1948, figures for various loan items are shown gross (i. e., before deduction of valuation reserves); they do not add to thetotal and are not entirely comparable with prior figures. Total loans continue to be shown net.
For other footnotes, see opposite page.
492 FEDERAL RESERVE BULLETIN
Digitized for FRASER http://fraser.stlouisfed.org/ Federal Reserve Bank of St. Louis

ALL COMMERCIAL BANKS IN THE UNITED STATES, BY CLASSES *—ContinuedRESERVES AND LIABILITIES
[In millions of dollars]
Class of bankand
call date
All commercialbanks:3
1947—Dec. 31. .1950—Dec. 30. .1951—Dec. 31. .1952—June 30. .
Dec. 31. .
All insured com-mercial banks:
1941—Dec. 3 1 . .1945—Dec. 3 1 . .1947—Dec. 31. .1950—Dec. 30. .1951—Dec. 31. .1952—Tune 30. .
Dec. 31 . .
Member banks,total :
1941—Dec. 3 1 . .1945—Dec. 31. .1947—Dec. 3 1 . .1950—Dec. 30. .1951—Dec. 31. .1952—June 30. .
Dec. 31. .
New York City:4-1941—Dec. 31. .1945—Dec. 31. .1947—Dec. 31. .1950—Dec. 30. .1951—Dec. 31. .1952—June 30. .
Dec. 31. .
Chicago:4
1941—Dec. 31. .1945—Dec. 31. .1947—Dec. 31. .1950—Dec. 30. .1951—Dec. 31. .1952—June 30. .
Dec. 31. .
Reserve city banks:1941—Dec. 3 1 . .1945—Dec. 3 1 . .1947—Dec. 3 1 . .1950—Dec. 30. .1951—Dec. 31. .1952—June 30. .
Dec. 31. .
Country banks:1941—Dec. 31. .1945—Dec. 31. .1947—Dec. 31. .1950—Dec. 30. .1951—Dec. 31. .1952—June 30. .
Dec. 31. .
AH nonmemberbanks:3
1947—Dec. 31. .1950—Dec 301951—Dec. 31. .1952—June 30
Dec. 31
Re-serveswith
FederalRe-
serveBanks
17,79617,45819,91119,33119,809
12,39615,81017,79617,45819,91119,33119,809
12,39615,81117,79717,45919,91219,33319,810
5,1054,0154,6394,6935,2465,2665,059
1,021942
1,0701,2161,4071,2591,144
4,0606,3267,0956,8067,5827,3127,788
2,2104,5274,9934,7455,6765,4955,820
Cashin
vault
2,2162,1742,6972,3962,753
1,3581,8292,1452,1452,6652,3652,720
1,0871,4381,6721,6432,0621,8212,081
93111151118159168148
43363030323032
425494562519639551651
526796929976
1,2311,0721,250
544532635575672
Bal-anceswithdo-
mesticbanks5
10,21610,86311,96910,31211,875
8,57011,0759,736
10,46311,5619,935
11,489
6,2467,1176,2706,8687,4636,4707,378
141787078799284
298200175133165135169
2,5902,1742,1252,2062,3562,0832,419
3,2164,6653,9004,4504,8624,1594,706
3,9473,9964,5073,8434,498
De-mand
de-posits
ad-justed6
87,12392,28298,24394,766
101,506
37,84574,72285,75191,09997,04893,652
100,329
33,75464,18473,52878,37083,10080,34785,543
10,76115,06516,65315,89816,43916,07016,288
2,2153,1533,7373,9544,1213,9034,126
11,11722,37225,71427,93829,48928,70330,609
9,66123,59527,42430,58133,05131,67134,519
13,59513,91215,14414,42015,964
Demand deposits
Interbankdeposits
Do-mestic5
11,36212,10213,12311,52113,109
9,82312,56611,23611,95512,96911,28612,948
9,71412,33310,97811,66912,63411,01312,594
3,5953,5353,2363,2073,3853,1933,346
1,0271,2921,1961,1771,2691,1361,308
4,3026,3075,4976,1746,6955,6246,662
7901,1991,0491,1111,2851,0601,278
385432489508516
For-eign
1,4301,4761,4131,3761,465
6731,2481,3791,4421,3811,3391,437
6711,2431,3751,4371,3691,3291,431
6071,1051,2171,1621,1281,0961,154
8202148383937
54110131217192182230
287
10111211
5538444734
U. S.Gov-ern-ment
1,3432,8063,3595,8374,941
1,76123,740
1,3252,7883,3445,7974,912
-1,70922,179
1,1762,5233,1015,4394,567
8666,940
267451858
1,6511,143
1271,552
72174242306343
4918,221
405976
1,1242,0971,814
2255,465
432922876
1,3841,267
167283258397374
Statesand
politicalsubdi-visions
6,7998,0128,4268,8228,910
3,6775,0986,6927,8928,2888,6828,776
3,0664,2405,5046,4006,6666,9897,029
319237290258321305322
233237285284240287242
1,1441,7632,2822,5752,5502,6892,693
1,3702,0042,6473,2823,5543,7083,772
1,2951,6121,7611,8331,881
Certi-fiedandoffi-cers'
checks,etc.
2,5812,9183,1662,7422,956
1,0772,5852,5592,8983,1472,7212,938
1,0092,4502,4012.7242,9612,5552,744
4501,3381,1051,0871,2891,0791,120
34666370665256
286611705852822719791
239435528715783705777
180195205187212
Indi-viduals,partner-
ships,and cor-
pora-tions
84,98790,98696,66691,82299,793
36,54472,59383,72389,92295,60490,83698,746
33,06162,95072,70478,65983,24079,18685,680
11,28215,71217,64617,49017,88017,27517,919
2,1523,1603,8534,2504,4044,0374,491
11,12722,28126,00328,93830,72229,25831,798
8,50021,79725,20327,98030,23428,61631,473
12,28412,32613,42612,63514,113
Time deposits
Inter-bank
240462550614744
1587054
347427475605
1406450
341422469592
61712
268318350465
3165
10430225790
101109
30171712131213
190120128145152
U. S.Gov-ern-mentand
PostalSav-ings
111189278312346
59103111189278312346
5099
105183257288321
'"" io1237435359
23544
203845608590
105
31524582
125141152
67
222425
Statesand
polit-ical
subdi-visions
8661,3841,5361,6241,620
492496826
1,3311,4851,5741,564
418399693
1,1211,2381,3031,303
29201437222129
910111111
243160332631714751739
146219337443491521525
172263298320317
Indi-viduals,partner-
ships,and cor-
pora-tions
34,38334,93036,32337,67939,046
15,14629,27733,94634,52535,98637,33338,700
11,87823,71227,54228,03229,12830,19631,266
7781,2061,4181,6471.6141.7211,752
476719902
1,0891,1281,1501,190
4,5429,563
11,04510,95611,47311,91312,417
6,08212,22414,17714,33914,91415,41315,908
6,8586,9157,2137,5027,800
Bor-row-ings
65903494
188
10215
61823085
181
4208
54792669
165
1953070
520
132
'" 21
425
8
41123
9162425
1211
82623
Capi-talac-
counts
10,05911,59012,21612,60112,888
6,8448,6719,734
11,26311,90212,28212,563
5,8867,5898,4649,695
10,21810,52610,761
1,6482,1202,2592,3512,4252,4602,505
288377426490513530541
1,9672,5662,8443,3223,5213,6633,745
1,9822,5252,9343,5323,7603,8733,970
1,5961,8971,9992,0772,129
2"Other loans to individuals" include, and "Other loans" exclude, single-payment loans of $3,000 and over, which were included with "Otherloans" in BULLETINS for May 1951 through January 1953.
3 Breakdown of loan, investment, and deposit classifications are not available prior to 1947; summary figures for earlier dates appear in thepreceding table.
4Central reserve city banks.5 Beginning June 30, 1942, excludes reciprocal bank balances, which on Dec. 31, 1942, aggregated 513 million dollars at all member banks and
525 million at all insured commercial banks.6Demand deposits other than interbank and U. S. Government, less cash items reported as in process of collection.For other footnotes see preceding page.Back figures—See Banking and Monetary Statistics, Tables 18-45, pp. 72-103 and 108-113.
MAY 1953 493
Digitized for FRASER http://fraser.stlouisfed.org/ Federal Reserve Bank of St. Louis

WEEKLY REPORTING MEMBER BANKS—NEW YORK CITY AND OUTSIDELOANS AND INVESTMENTS
[Monthly data are averages of Wednesday figures. In millions of dollars]
Date or month
Totalloansand
invest-ments
Total-Leading Cities
1952—April
1953—February..MarchApril
1953—Feb. 4. .Feb. 11. .Feb. 1 8 . .Feb. 25. .
Mar. 4 . .Mar. 11. .Mar. 18. .Mar. 25. .
Apr. 1. .Apr. 8. .Apr. 15. .Apr. 22. .Apr. 29. .
New York City
1952—April
1953—February..March . . . .April
1953—Feb. 4 . .Feb. 11. .Feb. 18. .Feb. 25. .
Mar. 4. .Mar. 1 1 . .Mar. 18. .Mar. 25. .
Apr. 1. .Apr. 8. .Apr. 15. .Apr. 22. .Apr. 29. .
OutsideNew York City
1952—April
1953—February..March . . . .April
1953- -Feb. 4. .Feb. 1 1 . .Feb. 18. .Feb. 25. .
Mar. 4. .Mar. 11. .Mar. 18. .Mar. 25. .
Apr. 1. .Apr. 8. .Apr. 15. .Apr. 22. .Apr. 29. .
74,033
77,89077,79976,669
77,95877,87878,01477,711
77,53477,84478,01077,808
76,82776,88276,92576,41276,301
20,842
20,99621,08320,824
20,96820,90;21,08521,025
20,92021,03921,21321,160
21,10520,89720,86220,64720,613
53,191
56,89456,71655,845
56,99056,97356,92956,686
56,61456,80556,79756,648
55,72255,98556,06355,76555,688
Loans1
Total i
35,116
38,73839,19339,512
38,60038,68538,89238,775
38,77038,97339,44139,588
39,64739,50839,59439,37739,43
11,114
12,06.12,19712,380
12,00411,96112,15812,136
12,06612,05312,30512,364
12,49012,32212,41812,33812,332
24,002
26,67326,99627,132
26,59626,72426,73426,639
26,70426,92027,13627,224
27,15727,18627,17627,03927,105
Com-mer-cial,
indus-trial,andagri-cul-tural
21,159
22,92323,20423,229
22,95222,98922,88122,869
22,92223,13923,41823,337
23,26923,29723,28723,15623,133
7,763
8,5528,6538,653
8,5578,5748,5358,543
8,5658,6338,7428,673
8,6478,6988,6798,6258,617
13,396
14,37114,55114,576
14,39514,41514,3^614,326
14,35714,50614,67614,664
14,62214,59914,60814,53114,516
For purchasingor carrying securities
To brokersand dealers
U. S.Govt.
ob-liga-tions
Otherse-
curi-ties
U.S.Govt.
ob-liga-tions
1,478
,551,522,634
,586,605,555,459
,482,589,505,513
,561,703,756,612,540
291
195146154
215218174174
141150133159
162172189131115
894
912967
1,090
929894911913
937955984992
1,0461,0621,1361,1171,086
293
444409390
442493470372
404484388362
353469431364339
To others Realestateloans
Other
cun-ties
677
801793799
810801799795
796791792792
808797807796789
218
236235227
244237233228
231234235238
235231227222221
434
525524535
526523526527
524523526524
543533535532533
5,748
6,1316,1646,197
6,1216,1226,1356,147
6,1566,1676,1596,173
6,1766,1806,2106,2066,214
465
378384384
375374380382
383387386381
379381388389385
5,283
5,7535,7805,813
5,7465,7485,7555,765
5,7735,7805,7735,792
5,7975,7995,8225,8175,829
Loansto
banks
470
550587554
365395731708
569389615776
777459432493611
296
336327348
218208473443
346207334420
519245251330393
174
214260206
147187258265
223182281356
258214181163218
Otherloans
6,141 38,917
7,387 39,15238,606
7,708 37,157
7,369 39,3587,377 39,1937,395 39,1227 ,405 38,936
7,455 38,7647,507 38,871
38,5697,607 38,220
7,665 37,18037,37437,331
723 37,035760 36,864
7,6817,711
1,338
1,6021,6371,672
1,6121,6011,5981,599
,608,639,646,657
,657,685,688,667
1,665
6,0566,095
Investments
Total
9,728
8,9318,8868,444
8,9648,9448,9278,889
8.8548,9868,9088,796
8,6158,5758,4448,3098,281
4,803 29,189
5,785 30,2215,895 29,7206,036 28,713
5,757 30,3945,776 30,2495,797 30,1955,806 30,047
5,847 29,9105,868 29,8855,915 29,6615,950 29,424
6,008 28,5655,996 28,7996,023 28,887
1 28,72628,583
U. S. Government obligations
Total
31,668
31,65631,06729,508
31,88531,72931,53531,478
31,27631,32831,01430,650
29,54729,73629,62229,38429,249
7,570
6,8346,7616,282
6,8806,8716,7936,791
6,7436,8536,7866,661
6,4376,3916,2446,1646,174
24,098
24,82224,30623,226
25,00524,85824,74224,687
24,53324,47524,22823,989
23,11023,34523,37823,22023,075
Bills
3,514
3,2812,9011,726
3,4643,2813,2243,156
3,0103,1442,8552,595
1,7011,8521,8321,6591,583
877
544548247
553513556555
483630578500
298284230189235
2,637
2,7372,3531,479
2,9112,7682,6682,601
2,5272,5142,2772,095
1,4031,5681,6021,4701,348
Cer-tifi-
catesof in-debt-ed-ness
3,689
2,4082,2152,098
2,4962,5672,2992,271
2,2342,2182,2392,169
2,1152,1582,1152,0622,038
651
253192199
277343196197
186185211188
208208215194168
3,038
2,1552,0231,899
2,2192,2242,1032,074
2,0482,0332,0281,981
1,9071,9501,9001,8681,870
Notes
5,955 18,510 7,249
5,929 205,913 20,038 75,808
5,9535,9205,916 205,928 20
5,9345,9255,8955,897
20,098 720,04120,02519,989 7
19,881849 19,877
19,88219,88519,857
5,85055,7935,7785,771
1,380
,077,073,050
,092,070,069,076
,076,072,070,073
,071,068,039,034
1,040
4,575
4,8524,8404,758
4,8614,8504,8474,852
4,8584,8534,8254,824
Bonds2
Othersecu-rities
,038,038
19,876
19,97219,961
,096,123
,4887,5437,555
,570
4,662
7,6337,6387,7097,6517,615
2,158
4,9724,963
4,9984,9664,9274,900
4,860,8314
444,731
13,848
15,07815,09015,090
15,01415,01615,12415,
15,100 515,07515,098 515,089 5
4,7794,7814,7544,744 15,138 54,731
15,02115,04615,122
7,496,539
7,649
7,4737,4647,5877,458
4,960 2,0974,948 2,1254,786 2,162
4,958 2,0844,945 2,073
2,1342,098
2,1112,1332,1222,135
2,1782,184
760 2,200747 2,145
2,107
5,091
5,3995,4145,487
5,3895,3915,453
160 5,360
,3775,410
,433,435
5,4555,4545,509
,50615,126 5,508
1 Figures for various loan items are shown gross (i. e.f before deduction of valuation reserves); they do not add to the total, which is shown net.2 Includes guaranteed obligations.For other footnotes see opposite page.
494 FEDERAL RESERVE BULLETIN
Digitized for FRASER http://fraser.stlouisfed.org/ Federal Reserve Bank of St. Louis

WEEKLY REPORTING MEMBER BANKS—NEW YORK CITY AND OUTSIDE—ContinuedRESERVES AND LIABILITIES
Monthly data are averages of Wednesday figures. In millions of dollars]
Date or month
Re-serveswithFed-eralRe-
serveBanks
14,802
14,91114,96114,289
15,14614,91714,87914,701
14,71114,85015,45214,832
14,03814,32014,57414,26614,247
5,256
4,9815,1124,801
5,1054,9335,0174,870
4,9775,0525,4015,016
4,6994,7994,9014,7784,826
9,546
9,9309,8499,488
10,0419,9849,8629,831
9,7349,798
10,0519,816
9,3399,5219,6739,4889,421
Cashin
vault
876
945931925
902956929992
904953935931
883924916931973
134
147140139
138160137154
139150135136
132139136140150
742
798791786
764796792838
765803800795
751785780791823
Bal-anceswithdo-
mesticbanks
2,449
2,3812,3932,426
2,3072,3212,4872,410
2,3512,3862,5162,318
2,6352,2912,5082,3722,324
68
373880
35344139
37384236
24236434037
2,381
2,3442,3552,346
2,2722,2872,4462,371
2,3142,3482,4742,282
2,3932,2552,4652,3322,287
De-mand
de-positsad-
justed3
52,430
54,13054,11753,228
54,58954,34953,77153,811
53,87654,84154,47953,275
51,80252,72353,54253,89754,176
16,058
15,80715,84115,697
15,91815,80615,82315,681
15,89116,19615,79715,481
15,62415,48215,69515,83415,853
36,372
38,32338,27637,531
38,67138,54337,94838,130
37,98538,64538,68237,794
36,17837,24137,84738,06338,323
Demand deposits,except interbank
Indi-vid-uals,part-ner-
ships,andcor-
pora-tions
53,184
55,26955,36154,325
54,98055,45555,29855,342
54,81956,31756,14354,165
52,78553,75155,71754,76554,608
16,892
16,77716,82716,656
16,68516,73216,86916,822
16,77417,18916,94716,399
16,61216,44816,80316,66616,749
36,292
38,49238,53437,669
38,29538,72338,42938,520
38,04539,12839,19637,766
36,17337,30338,91438,09937,859
Statesand
polit-
sub-divi-sions
3,813
3,8613,6853,946
3,9453,9423,7663,790
3,7903,6283,6653,659
3,8283,7033,9484,0104,241
325
298239328
297301303290
247254235219
248249410355379
3,488
3,5633,4463,618
3,6483,6413,4633,500
3,5433,3743,4303,440
3,5803,4543,5383,6553,862
Certi-fiedandOffi-cers'
checks,etc.
1,616
1,5201,6361,762
1,4581,5891,5501,484
1,5611,4621,7821,740
1,8782,1891,7201,4611,559
802
710758875
653790691705
701652805876
9301,388
800563696
814
810878887
805799859779
860810977864
948801920898863
U. S.Gov-ern-ment
3,282
3,0883,0102,505
2,6842,8463,5143,309
2,7622,0893,0204,170
3,9343,0562,4371,6721,426
1,026
792909637
708744887831
690509
1,1001,338
1,117796576371323
2,256
2,2962,1011,868
1,9762,1022,6272,478
2,0721,5801,9202,832
2,8172,2601,8611,3011,103
Time deposits,except interbank
Indi-vid-uals,part-ner-
ships,andcor-
pora-tions
15,670
16,59416,74016,774
16,55616,57916,60116,641
16,72016,74416,74716,749
16,72616,78516,76616,79416,799
1,566
1,6541,7341,716
1,6451,6421,6531,675
1,7141,7371,7431,743
1,7181,7311,7021,7101,717
14,104
14,94015,00615,058
14,91114,93714,94814,966
15,00615,00715,00415,006
15,00815,05415,06415,08415,082
Statesand
polit-icalsub-divi-sions
770
779773790
775779777783
776773770771
777793786793803
26
313133
30313131
31313132
3231313638
744
748742757
745748746752
745742739739
745762755757765
U. S.Gov-ern-mentand
PostalSav-ings
171
199196192
200198199198
195196195198
195193191191190
49
575855
58575758
57585858
5758535353
122
142138137
142141142140
138138137140
138135138138137
Do-
tic
9,879
10,21410,0909,847
10,25510,16510,42610,011
10,22110,08710,4099,643
10,0929,878
10,1949,6369,436
2,887
2,8892,8762,800
2,8982,8562,9172,883
2,9352,8082,9872,774
2,7952,7722,8762,7822,776
6,992
7,3257,2147,047
7,3577,3097,5097,128
7,2867,2797,4226,869
7,2977,1067,3186,8546,660
11
1
)
:1
1111
11l1
1111l
For-eign
1,265
1,2811,3311,319
1,306L.2661,2711,280
L ,293,365,359,306
,310,328,335,310,315
,048
,037,065,061
,059,031,023,033
,045,095,083,039
,043,069,073,057,063
217
244266258
247235248247
248270276267
267259262253252
Time
430
571589611
571571570572
579586595598
581608616617631
326
444459474
445445443445
450458461465
447471478481493
104
127130137
126126127127
129128134133
134137138136138
Bor-row-ings
763
1,3511,3021,065
1,5041,4151,2231,260
1,1401,4111,4161,241
1,0091,0771,0621,0741,107
316
381341306
438354370362
193329478364
274400394202260
447
970961759
1,0661,061
853898
9471,082
938877
735677668872847
Cap-italac-
counts
Total-Leading Cities
1952—April
1953—FebruaryMarchApril
1953—Feb. 4Feb. 11Feb. 18Feb. 25
Mar. 4Mar. 11Mar. 18Mar. 25
Apr. 1Apr. 8Apr. 15Apr. 22
Apr. 29
New York City
1952—April
1953—FebruaryMarchApril
1953—Feb. 4Feb. 11Feb. 18Feb. 25Mar. 4Mar. 11Mar. 18Mar. 25
Apr. 1Apr. 8Apr. 15Apr. 22
Apr. 29
Outside New York City
1952—April
1953—FebruaryMarchApril
1953—Feb. 4Feb. 11Feb. 18Feb. 25Mar. 4Mar. 11Mar. 18Mar. 25
Apr. 1Apr. 8Apr. 15Apr. 22Apr. 29
7,021
7,2877,3167,349
7,2767,2837,2857,305
7,3117,313
,314,324
,345,348
7,3417,3497,360
2,420
2,4892,4922,500
2,4882,4882,4892,493
2,4952,4912,4912,490
2,5032,5002,5002,5012,497
4,601
4,7984,8244,849
4,7884,7954,7964,812
4,8164,8224,8234,834
4,8424,8484,8414,8484,863
3 Demand deposits other than interbank and U. S. Government, less cash items reported as in process of collection.NOTE.—All figures in this table are on the revised basis. Revised weekly figures beginning Jan. 2, 1952 appear on pp. 550-555 of this BUL-
LETIN.Bank figures.—For description of revision beginning Mar. 4, 1953, see BULLETIN for April 1953, p. 357 and for figures on the revised basis
beginning Jan. 2, 1952, see pp. 550-555 of this BULLETIN. For description of revision beginning July 3, 1946, and for revised figures July 1946-June 1947, see BULLETINS for June and July 1947, pp. 692 and 878-883, respectively. For old series, see Banking and Monetary Statistics, pp.127-227.
MAY 1953 495
Digitized for FRASER http://fraser.stlouisfed.org/ Federal Reserve Bank of St. Louis

CHANGES IN COMMERCIAL AND INDUSTRIAL LOANS OF A SAMPLE OF WEEKLY REPORTING MEMBER BANKSBY INDUSTRY 1
[Net declines, ( —). In millions of dollars]
Period»
1951—April-June. .July-Dec
1952—Jan.-June...July-Dec
Monthly:1952—Dec. . . .
1953—JanF e bM a rApr.
Week ending:1953—Feb. 4
Feb 11Feb! 1 8 . ! ! !Feb. 2 5 . . . .
Mar. 4Mar. 11Mar. 18Mar. 25
Apr. 1Apr. 8 . . . .Apr. 15Apr. 22Apr. 29
Business of borrower
Food,liquor,
andtobacco
- 2 4 3932
- 8 6 8754
68
- 3 2— 142
—62- 2 1 6
- 3 2—39- 3 5—36
- 2 9- 2 6
13- 2 0
- 2 6- 3 9- 3 3- 7 2- 4 6
Manufacturing and
Textiles,apparel,
andleather
116-361
- 7 3- 4 0
- 3 3
66979
- 2 5
13$017
9
123925
2
- 69
- 1 7- 3- 8
Metalsand
metalproducts
(incl.machin-ery andtrans.
equip.)
275873
1,1111
31
9032
19919
1522
- 94
4632
11010
- 1 2- 419
88
mining
Petro-leum,coal,
chemical,and
rubber
48125
176250
46
- 2- 14013
- 3- 1 0
101
107
26- 3
- 615
9- 9
4
Other
60141
7636
- 3 4
- 1 0- 743
_ - 6
- 1
22217
3
- 6- 4
614
Trade(whole-
saleand
retail)
6216
- 1 0 5141
- 8 6
- 5 125
14365
89
— 18
27505313
121618
612
Com-moditydealers
- 4 2 1722
- 6 3 4662
2
- 8 9- 8 2
- 1 2 9- 1 1 7
- 1 6—28- 2 9- 1 0
- 2 8- 2 8- 2 2- 5 1
- 2 3- 2 7- 2 8- 2 3- 1 5
Salesfinancecom-
panies
6330
-217544
406
-106- 1 5
15105
- 2 0— 11
115
3519
4- 4 3
2957
- 111
9
Publicutilities
(incl.trans-porta-tion)
175351
- 2- 5 7
12
25- 5 7
6766
- 1 0— 12- 4 5
10
- 2 9344616
- 25
161532
Con-struc-tion
44- 9 8
1813
- 1 0
- 4
21- 1 2
5- 6
- 677
13
- 1 0- 2- 2- 1
3
Allothertypes
ofbusiness
837
- 2 8191
63
- 4 626
7- 1 8
- 120
8— 1
1010
— 7- 6
- 811
6- 1 5- 1 3
Netchangesclassi-
fied
1862,769
- 5 4 62,494
465
- 2 1 9— 153
421- 1 1 9
- 5 2— 12- 8 1
- 8
50166272
- 6 6
- 5 837
- 8- 8 1
- 9
Comm'l,ind'l,andagr'l
change—total
182,372
-6372,435
332
-379— 142
468- 2 0 4
- 5 937
- 1 0 8- 1 2
53217279
- 8 1
- 6 828
- 1 0- 1 3 1
- 2 3
S a m p l e includes about 215 weekly reporting member banks reporting changes in their larger loans; these banks hold over 90 per cent oftotal commercial and industrial loans of all weekly reporting member banks and nearly 70 per cent of those of all commercial banks.
2 Figures for other than weekly periods are based on weekly changes during period.3 Net change at all banks in weekly reporting series, according to the old series in 1951 and the revised series thereafter. For description of
revisions in the weekly reporting series see BULLETIN for April 1953, p. 357.
COMMERCIAL PAPER AND BANKERS' ACCEPTANCES O U T S T A N D I N G
[In millions of dollars]
End of year or month
1947—December1948—December1949—December1950—December1951—December
1952—MarchAprilMayJuneJulyAugustSeptemberOctoberNovemberDecember
1953—JanuaryFebruaryMarch
Commer-cial
paperout-
standing1
287269257333434
534544510495539550565591575539
504511507
Dollar acceptances outstanding
Totalout-
standing
261259272394490
458422430416450454454449478492
487490468
Held by
Accepting banks
Total
197146128192197
177| 150
155148171169166155172183
159158149
Ownbills
887158
114119
120110121108122113106103114126
111110105
Billsbought
10976707879
57403440495661525857
484844
Others
64112144202293
282272275268279285288294306309
328331319
Based on
Importsinto
UnitedStates
159164184245235
228211197195200212232237233232
225234237
Exportsfrom
UnitedStates
63574987
133
138135136126126119108114123125
120114110
Dollarex-
change
31
223
66
3745737460302939
435739
Goods stored in orshipped between
points in
UnitedStates
2525302855
36221715172024406264
655349
Foreigncountries
11129
3244
51484336343031283132
343232
1 As reported by dealers; includes some finance company paper sold in open market.Back figures.—See Banking and Monetary Statistics, Table 127, pp. 465-467; for description, see p. 427.
496 FEDERAL RESERVE BULLETIN
Digitized for FRASER http://fraser.stlouisfed.org/ Federal Reserve Bank of St. Louis

PRINCIPAL ASSETS OF SAVINGS INSTITUTIONSUNITED STATES LIFE INSURANCE COMPANIES
[In millions of dollars]
Date
End of year:4
1939194019411942 . .194319441945194619471948194919501951
End of month:5
1950—December1951—December
1952—FebruarvMarchAprilMay1 uneTulyAugustSeptemberOctoberNovemberDecember
1953—JanuaryFebruary
Totalassets
29,24330,80232,73134 93137,76641,05444,79748,19151,74355,51259,63064,02068,292
63,68767,983
68,90769,25069,60469,95970,33470,77471,12371,57872,03472,41573,034
73,62173,943
Government securities
Total
7,6978,3599,478
11,85114,99418,75222,54523,57522,00319,08517,81316,06613,670
15,93313,579
13,46913,35213,30613,02012,85312,89412,89812,92912,73112,78012,683
12,86212,844
UnitedStates
5,3735,8576,7969,295
12,53716,53120,58321,62920,02116,74615,29013,45911,011
13,36110,958
10,84110,76510,73710,46310,30910,32410,34710,39910,24410,29710,195
10,32910,287
State andlocal i
2,2532,3872,2862,0451,7731,4291,047
936945
1,1991,3931,5471,737
1,5201,702
1,7161,6951,6941,6971,7061,7481,7521,7361,7281,7281,733
1 ,7741,800
Foreign2
71115396511684792915
1,0101,0371,1401,1301,060
922
1,052919
912892875860838822799794759755755
759757
Business securities
Total
8,4659,178
10,17410,31510,49410,71511,05913,02416,14420,32223,17925,40328,214
25,20928,042
28,55328,90329,18629,59429,89530,19130,31430,47530,97331,14331,404
31,69031,878
Bonds »
7,9298,6249,5739,7079,8429,959
10,06011,77514,75418,89421,46123,30025,988
23,23125,975
26,45626,78527,05927,45627,74528,03928,16528,31528,81928,98629,226
29,47129,644
Stocks
536554601608652756999
1,2491,3901,4281,7182,1032,226
1,9782,067
2,0972,1182,1272,1382,1502,1522,1492,1602,1542,1572 178
2,2192,234
Mort-gages
5,6695,9586,4426,7266,7146,6866,6367,1558,675
10,83312,90616,10219,314
16,10119,291
19,71219,87020,00820,17520,33520,50520,64320,80120,96121,08721 245
21,39621.547
Realestate
2,1342,0601,8781,6631,3521,063
857735860
1,0551,2471,4451,633
1,4281,617
1,6391,6561,6621,6741,6931 7061,7221,7361,7511 7661 868
1,8801,887
Policyloans
3,2483,0912,9192,6832,3732,1341,9621,8941,9372,0572 2402,4132,587
2,3972,575
2,5982,6122,6212,6332,6462 6562,6672,6832,6922 6982 699
2,7182,727
Otherassets
2,0302,1561,8401,6931,8391,7041,7381,8082,1242,1602,2452,5912,874
2,6192,879
2,9362,8572,8212,8632,9122,8222,8792,9542,9262,9413,135
3,0753,060
1 Includes United States and foreign.2 Central government only. •3 Includes International Bank for Reconstruction and Development.4 These represent annual statement asset values, with bonds carried on an amortized basis and stocks at end-of-year market value.6 These represent book value of ledger assets. Adjustments for interest due and accrued and differences between market and book values
are not made on each item separately, but are included in total in "Other assets."Source.—Institute of Life Insurance—end-of-year figures, Life Insurance Fact Book, 1952; end-of-month figures, The Tally of Life Insurance
Statistics and Life Insurance News Data.
ALL SAVINGS AND LOAN ASSOCIATIONS IN THE UNITED STATES[In millions of dollars]
End ofyear
19391940194119421943194419451946194719481949195019511952P.
Assets
Total1
i
5,5975,7336,0496,1506,6047,4588,747
10,20211,68713,02814,62216,84619,16422,700
Mort-gages 2
3,8064,1254,5784,5834,5844,8005,3767,1418,856
10,30511,61613,62215,52018,444
U. S.Govern-
mentobli-
gations
7371
107318853
1,6712,4202,0091,7401,4551,4621,4891,6061,791
Cash
274307344410465413450536560663880951
1,0821,293
Other »
1,124940775612493391356381416501566692866
1,083
Savingscapital
4,1184,3224,6824,9415,4946,3057,3658,5489,753
10,96412,47113,97816,07319,211
End ofquarter
1950—1. . . .23. . . .4
1951—12. .. .34
1952—1. . . .?
3.' '. '. '.4
Assets
Total i
15,09015,88016,29116,846
17,23217,97718,42919,164
19,84820,85321,65622,700
Mort-gages 2
12,01412,69513,29413,622
13,99914,53915,05815,520
16,07316,89117,74018,444
U. S.Govern-
mentobli-
gations
1,4971,5061,4891,489
1,5471,558,577
L,606
1,718,702
1,7821,791
Cash
885913727951
844940852
1,082
1,1001,2121,0461,293
Other 3
597671688692
751849852866
867959999
1,083
Savingscapital
12,92513,42213,41813,978
14,28614,91015,31716,073
16,80117,66118,21019,211
P Preliminary.1 Includes gross mortgages with no deduction for mortgage pledged shares.2 Net of mortgage pledged shares.8 Includes other loans, Federal Home Loan bank stock and other investments, real estate owned and sold on contract, and office building and
fixtures.Source.—Federal Savings and Loan Insurance Corporation.
MAY 1953 497
Digitized for FRASER http://fraser.stlouisfed.org/ Federal Reserve Bank of St. Louis

GOVERNMENT CORPORATIONS AND CREDIT AGENCIES[Based on compilation by United States Treasury Department. In millions of dollars]
SELECTED ASSETS AND LIABILITIES, BY CORPORATION OR AGENCY *
Asset or liability, and agency
Loans, by purpose and agency:
Banks for cooperativesFederal intermediate credit banks . . . .Federal land banks *Federal Farm Mortgage CorporationFarmers Home Administration *
Commodity Credit CorporationOther agencies
To aid home owners, totalFederal National Mortgage Assn.RFC Mortgage Corporation*Home Owners' Loan Corporation 'Reconstruction Finance CorporationOther agencies
To railroads, totalReconstruction Finance CorporationOther agencies
To other industry, totalReconstruction Finance Corporation6
Other agencies
To financing institutions, totalReconstruction Finance CorporationFederal home loan banksOther agencies
Foreign, totalExport-Import BankReconstrucUon Finance Corporation 6
Other agencies'
All other purposes, total .Reconstruction Finance Corporation6
Public Housing Administration *'Other agencies
Less: Reserve for losses
Total loans receivable (net)
Investments:U'. S. Government securities, total . . .
Banks for cooperativesFederal intermediate credit banksProduction credit corporationsFederal land banks *Federal home loan banksFederal Savings and Loan Insurance CorpHome Owners' Loan Corporation ̂Federal Housing Administration. . . .Public Housing Administration *"Reconstruction Finance Corporation 'Federal Deposit Insurance CorporationOther agencies
Investment in international institutions
Other securities, totalReconstruction Finance CorporationProduction credit corporationsOther agencies
Commodities, supplies, and materials, totalCommodity Credit CorporationReconstruction Finance Corporation *Other agencies .
Land, structures, and equipment, totalPublic Housing Administration ^Reconstruction Finance Corporation 6
Tennessee Valley Authority .U S Maritime Commission 2
Other agencies ^
Bonds, notes, and debentures payable (notguaranteed), totalBanks for cooperatives . . . . .Federal intermediate credit banksFederal land banks 8
Commodity Credit CorporationFederal home loan banks
1944
3
1
1
1
((
18
8
6
1
211
16
6
35
1
381189?S7
351641361353
10
?375281
0911?
1
343321
21
191118
73
?1666
13120
2?1225
8)
?3787710 S106
448
387
630433960
144151
IS87
77S
76028
424289
6371
,942,450053438
,237?005767101114?7262
,39524
774818
67
1945
2
1
5
1
211
21
6
371
1
878197
088242604407
999
8967
248S?
1?1
20518
14983
26760
19512
1?6252774
707309786112
438
,290
683434367
145118161
15106
849
89730
321244
5526
,288,034
131122
,01777?91972119S811
,948
,1138
?4S79?
69
1946
2,884232273986149590528120
6
65966
636101
171153
18
19215141
31414
2937
2,2841,249
235800
623232278113
478
6,649
1,873434770
145172
17122
848
1,04520
318
2301594624
1,265463667134
16,924227
2,861727
3,3017,7642,044
1,25233
293756
169
End of year
1947
2,299276336
109558734280
7
5564
486t \
65
147145
3
27224131
4477
4364
5,6731,978
2463,450
714«340
27896
395
9,714
1,685484872
139184
12132
8
1,02021
3,385
1541083511
822448235138
12,600204
35754
3,3056,50i1,793
68969
358
262
1948
1
62
3
11
1
1
3
31
632305476
80575999293
5
768199
16917722
140138
3
31027238
1216
S1S4
102145706
,750
184190794100
368
,692
814434466
774199
12144
8
,0641
,385
1339829
6
62743715732
,060448630793
189
96570
480
415
1949
4
11
1
62
3
12
?
1
3
11
21
36?30?437
60573301
,7299
?11828
?1116824
114112
3
46?473
38
4418
4334
,090,187154
,750
48488
79799
476
,733
047437439
775214
8188
,2051
,385
1078322
2
,549,37614?30
,96235?611830
168
77278
490
204
1950
?
1
11
62
3
13
?
1
3
11
21
1
884345510
45535543898
7
128347
1011735
110108
2
45*400
58
8?48
816
078,226101
,750
13159
366105
185
,228
071434642
199193
244
,3071
,385
8871161
,774,63810828
,945748605886
206
,190110570
560
1951
4
1
?1
62
3
14
1
3
11
31
1
1
1614? 5611
34S1974?78?
6
14?,850
123169
10199
2
488415
74
8148
806
110,296
64,750
77961
609109
173
,422
415143
?49200
285
1,353
1
,385
7866111
,461,174
159
, 358
S94,048
465
,369170674
525
4
1
22
62
3
14
1
3
11
31
1
1
End of quarter
1
239371719
32S9S7*4710
6
363,053
121189
9896
2
473400
73
1978
S89
096,329
61,706
73161
SS7110
173
,422
,422414843
184204
289
1,409
1
,385
665510
,322,012147164
,406,24259?
,105
467
,21414074S
329
1952
2
4,058343866
29594
1,831390
6
2,3872,068
119201
£583
2
464393
72
653( 7 )
653
7,6172,389
5895,170
80161
624116
153
15,913
2,364434943
311209
286
11,421
1
3,385
5343
9
1,3501,023
186142
3,1861 232
2021,170
581
1,228112857
258
3
4 563370822
27606
1,873859
5
2,4372,097
117223
8482
2
480412
67
716( 7 )
715
7 8262,546
585.222
93361
750123
150
16,890
2 371436143
298203
299
1,4231
3,385
5142
8
1,3771,034
194149
3,2121 216
2021,209
586
1,301120864
317
11
7
2
72
5
17
9
1
3
1
1
4
070424673
25S969^0476
6
603,242
115246
8280
2
516457
58
864
736,496
58,182
09550
919126
140
,8?6
421436043
311208
316
,4371
,385
4436
8(7)
,280978172131
173199
,251
590
,330181704
445
For footnotes see following page.
498 FEDERAL RESERVE BULLETIN
Digitized for FRASER http://fraser.stlouisfed.org/ Federal Reserve Bank of St. Louis
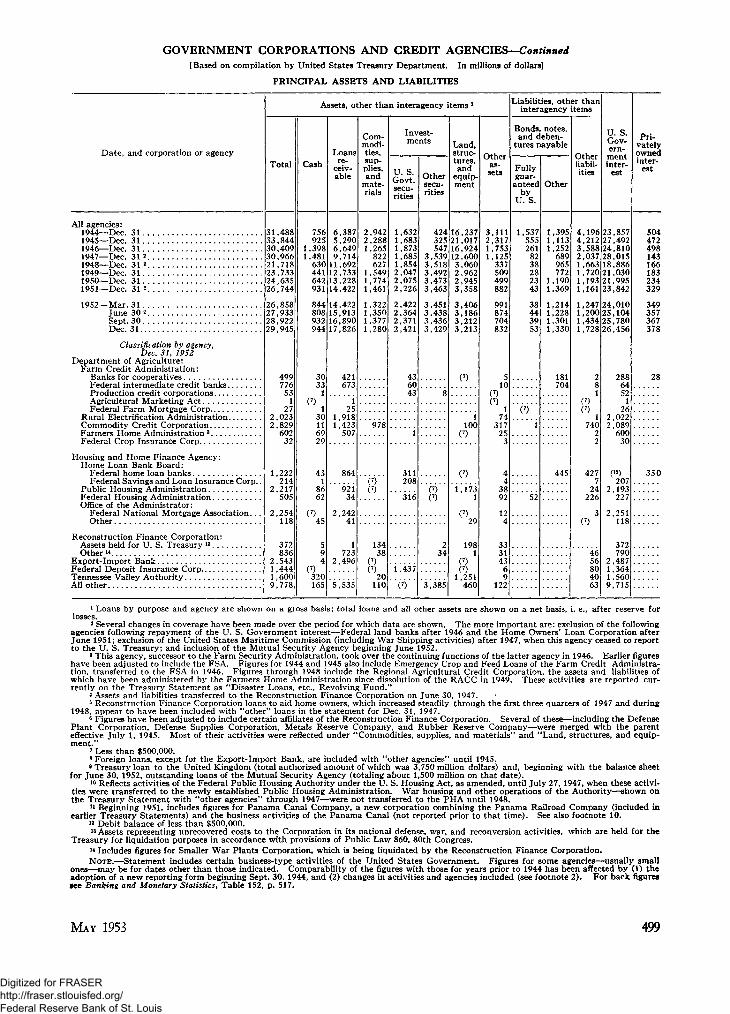
GOVERNMENT CORPORATIONS AND CREDIT AGENCIES—Continued[Based on compilation by United States Treasury Department. In millions of dollars]
PRINCIPAL ASSETS AND LIABILITIES
Date, and corporation or agency
All agencies:1944—Dec. 311945—Dec. 311946—Dec. 311947—Dec 31 2
1948—Dec. 31 2
1949—Dec. 311950—Dec 31 . . .1951—Dec. 31 2
1952—Mar. 31June 30 2
Sept. 30Dec. 31
Classification by agency,Dec. 31, 1952
Department of Agriculture:Farm Credit Administration:
Banks for cooperatives .Federal intermediate credit banksProduction credit corporationsAgricultural Marketing ActFederal Farm Mortgage Corp. .
Rural Electrification AdministrationCommodity Credit CorporationFarmers Home Administration 3 . .Federal Crop Insurance Corp
Housing and Home Finance Agency:Home Loan Bank Board:
Federal home loan banksFederal Savings and Loan Insurance Corp..
Public Housing AdministrationFederal Housing AdministrationOffice of the Administrator:
Federal National Mortgage Association.. .Other
Reconstruction Finance Corporation:Assets held for U. S. Treasury 13 . . . .Other"
Export-Import Bank . . .Federal Deposit Insurance CorpTennessee Valley AuthorityAll other . .
Assets, other than interagency items 1
Total
31,48833,84430,40930,96621,71823,73324,63526,744
26,85827,93328,92229,945
49977653
127
2,0232,829
60232
1,222214
2,217505
2,254118
372836
2,5431,4441,6009,778
Cash
756925
1,3981,481
630441642931
844808932944
3033
1
130116929
431
8662
45
594
(7)320165
Loansre-
ceiv-able
6,3875,2906,6499,714
11,69212,73313,22814,422
14,42215,91316,89017,826
421673
125
1,9181,423
507
864
92134
2,24241
1723
2,496
5,535
Com-modi-ties,sup-plies,and
mate-rials
2,9422,2881,265
822627
1,5491,7741,461
1,3221,3501,3771,280
978
( 7 )
13438
(7)20
110
Invest-ments
U. S.Govt.secu-rities
L ,632,683,873,685.854
2,0472,0752,226
2.422
<•
,364,371,421
436043
1
311208
316
1 ,437
Othersecu-rities
424325547
3,5393,5183,4923,4733,463
3,4513,4383,4363,429
8
w2
34
:i;385
Land,struc-tures,and
equip-ment
16,23721,01716,92412,6003,0602,9622,9453,358
3,4063,1863 2123,213
1100
( 7 )
1,1131
29
1981
(7)1,251
460
Otheras-sets
3,1112,3171,7531,125
337509499882
991874704832
510
174
31725
3
44
3892
124
333143
69
122
Liabilities, other thaninteragency items
Bonds, notes,and deben-
tures payable
Fullyguar-anteed
byU. S.
1,537555261
8238282343
38443953
(7)
1
52
Other
1,3951,1131,252
689965772
1,1901,369
1,2141,2281,3011,330
181704
445
Otherliabil-ities
4,1964,2123,5882.0371,6631,7201,1931,161
1,247L.200L.434.728
281
1740
22
4277
24226
3(7)
4656804063
U. S.Gov-ern-mentinter-
est
23,85727,49224,81028,01518,88621,03021,99523,842
24,01025,10425,78026,456
2886452
126
2,0222,089
60030
(12)
2072,193
227
2,251118
372790
2,4871,3641,5609,715
Pri-vatelyownedinter-
est
504472498143166183234329
349357367378
28
3 5 0
1 Loans by purpose and agency are shown on a gross basis; total loans and all other assets are shown on a net basis, i. e., after reserve for2 Several changes in coverage have been made over the period for which data are shown. The more important are: exclusion of the following
agencies following repayment of the U. S. Government interest—Federal land banks after 1946 and the Home Owners' Loan Corporation afterJune 1951; exclusion of the United States Maritime Commission (including War Shipping activities) after 1947, when this agency ceased to reportto the U. S. Treasury; and inclusion of the Mutual Security Agency beginning June 1952.
3 This agency, successor to the Farm Security Administration, took over the continuing functions of the latter agency in 1946. Earlier figureshave been adjusted to include the FSA. Figures for 1944 and 1945 also include Emergency Crop and Feed Loans of the Farm Credit Administra-tion, transferred to the FSA in 1946. Figures through 1948 include the Regional Agricultural Credit Corporation, the assets and liabilities ofwhich have been administered by the Farmers Home Administration since dissolution of the RACC in 1949. These activities are reported cur-rently on the Treasury Statement as "Disaster Loans, etc., Revolving Fund."
4 Assets and liabilities transferred to the Reconstruction Finance Corporation on June 30, 1947.5 Reconstruction Finance Corporation loans to aid home owners, which increased steadily through the first three quarters of 1947 and during
1948, appear to have been included with "other" loans in the statement for Dec. 31, 1947.6 Figures have been adjusted to include certain affiliates of the Reconstruction Finance Corporation. Several of these—including the Defense
Plant Corporation, Defense Supplies Corporation, Metals Reserve Company, and Rubber Reserve Company—were merged with the parenteffective July 1, 1945. Most of their activities were reflected under "Commodities, supplies, and materials" and "Land, structures, and equip-ment."
7 Less than $500,000.8 Foreign loans, except for the Export-Import Bank, are included with "other agencies" until 1945.9 Treasury loan to the United Kingdom (total authorized amount of which was 3,750 million dollars) and, beginning with the balance sheet
for June 30, 1952, outstanding loans of the Mutual Security Agency (totaling about 1,500 million on that date).10 Reflects activities of the Federal Public Housing Authority under the U. S. Housing Act, as amended, until July 27, 1947, when these activi-
ties were transferred to the newly established Public Housing Administration. War housing and other operations of the Authority—shown onthe Treasury Statement with "other agencies" through 1947—were not transferred to the PHA until 1948.
11 Beginning 1951, includes figures for Panama Canal Company, a new corporation combining the Panama Railroad Company (included inearlier Treasury Statements) and the business activities of the Panama Canal (not reported prior to that time). See also footnote 10.
12 Debit balance of less than $500,000.13 Assets representing unrecovered costs to the Corporation in its national defense, war, and reconversion activities, which are held for the
Treasury for liquidation purposes in accordance with provisions of Public Law 860, 80th Congress.14 Includes figures for Smaller War Plants Corporation, which is being liquidated by the Reconstruction Finance Corporation.NOTE.—Statement includes certain business-type activities of the United States Government. Figures for some agencies—usually small
ones—may be for dates other than those indicated. Comparability of the figures with those for years prior to 1944 has been affected by (1) theadoption of a new reporting form beginning Sept. 30, 1944, and (2) changes in activities and agencies included (see footnote 2). For back figuressee Banking and Monetary Statistics, Table 152, p. 517.
MAY 1953 499
Digitized for FRASER http://fraser.stlouisfed.org/ Federal Reserve Bank of St. Louis
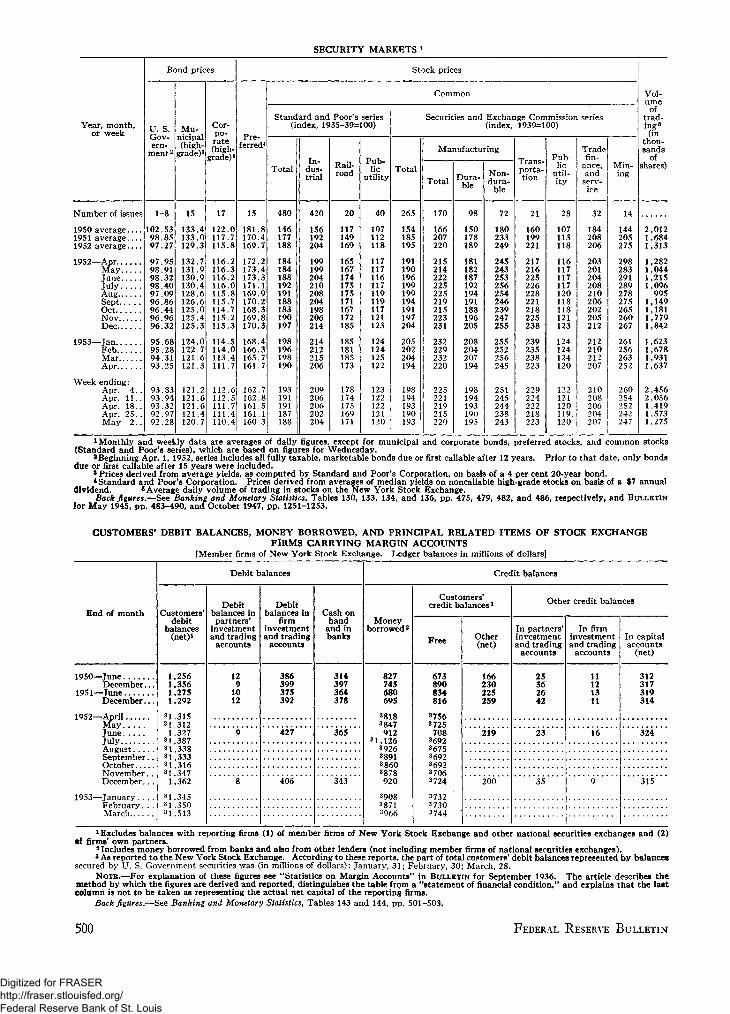
SECURITY MARKETS1
Year, month,or week
Number of issues
1950 average1951 average1952 average
1952—AprMayJuneJulyAug.Sept. . .OctNov. . . .Dec
1953—jan
Feb. .MarApr
Week ending:Apr. 4 . .Apr. 11 . .Apr. 18..Apr. 25..May 2 . .
Bond prices
U. S.Gov-ern-
ment2
1-8
102.5398.8597.27
97 9598.9198.3298.4097 0996 8696.4496 9696.32
95.6895 2894.3193 25
93.8393.9493.3292.9792.28
Mu-nicipal(high-
grade)3
15
133.4133.0129.3
132.7131.9130.9130.4128 6126.6125.0125.4125.3
124.0122.7121.6121 3
121.2121.6121.6121.4120.7
Cor-po-rate(high-
grade)'
17
122.0117.7115.8
116.2116.3116.2116.0115.8115.7114.7115.2115.3
114.5114.0113.4111 7
112.6112.5111.7111.4110.4
Pre-ferred*
15
181.8170.4169.7
172.2173.4173.3171.1169.9170.2168.3169.8170.3
168.4166.3165.7161.7
162.7162.8161.5161.1160.3
Stock prices
Common
Standard and Poor's series(index, 1935-39=100)
Total
480
146177188
184184188192191188183190197
198196198190
193191191187188
In-dus-trial
420
156192204
199199204210208204198206214
214212215206
209206206202204
Rail-road
20
117149169
165167174175175171167172185
185181185173
178174175169171
Pub-lic
utility
40
107112118
117117116117119119117121123
124124125122
123122122121120
Total
265
154185195
191190196199199194191197204
205202204194
198194193190193
Securities and Exchange Commission series(index, 1939=100)
Manufacturing
Total
170
166207220
215214222225225219215223231
232229232220
225221219215220
Dura-ble
98
150178189
181182187192194191188196205
208204207194
198194193190195
Non-dura-
ble
72
180233249
245243253256254246239247255
255252256245
251245244238243
Trans-porta-tion
21
160199221
217216225226228221218225238
239235238223
229224222218223
Pub-lic
util-ity
28
107113118
116117117117120118118121123
124124124120
122121120119120
Tradefin-
ance,and
serv-ice
32
184208206
203201204208210206202205212
212210212207
210208206204207
Min-ing
14
144205275
298283291289278275265260267
261256263252
260254252242247
Vol-ume
oftrad-ing5
(inthou-sands
ofshares)
2,0121,6841,313
1,2821,0441,2151,096
9951,1491,1811,7791,842
1,6231,6781,9311,637
2,4562,0561,4191,5731,275
1 Monthly and weekly data are averages of daily figures, except for municipal and corporate bonds, preferred stocks, and common stocks(Standard and Poor's series), which are based on figures for Wednesday.
2Beginning Apr. 1, 1952, series includes all fully taxable, marketable bonds due or first callable after 12 years. Prior to that date, only bondsdue or first callable after 15 years were included.
3 Prices derived from average yields, as computed by Standard and Poor's Corporation, on basis of a 4 per cent 20-year bond.4 Standard and Poor's Corporation. Prices derived from averages of median yields on noncallable high-grade stocks on basis of a $7 annual
dividend. 6 Average daily volume of trading in stocks on the New York Stock Exchange.Back figures.—See Banking and Monetary Statistics, Tables 130, 133, 134, and 136, pp. 475, 479, 482, and 486, respectively, and BULLETIN
for May 1945, pp. 483-490, and October 1947, pp. 1251-1253.
CUSTOMERS' DEBIT BALANCES, MONEY BORROWED, AND PRINCIPAL RELATED ITEMS OF STOCK EXCHANGEFIRMS CARRYING MARGIN ACCOUNTS
[Member firms of New York Stock Exchange. Ledger balances in millions of dollars]
End of month
1950—JuneDecember...
1951—TuneDecember...
1952—AprilMayJuneJulyAugustSeptember.«OctoberNovember. .December. . .
1953—January... .FebruaryMarch
Debit balances
Customers'debit
balances(net)i
1,2561.3561.2751,292
31 .31531 3121,327
3| ,38731,33831,33331,31631,3471,362
31,34531,35031,513
Debitbalances inpartners'
investmentand trading
accounts
129
1012
9
8
Debitbalances in
firminvestmentand trading
accounts
386399375392
427
406
Cash onhand
and inbanks
314397364378
365
343
Credit balances
Moneyborrowed 2
827745680695
38183847
9123 1,126
3 926389138603878920
390838713 966
Customers'credit balances1
Free
673890834816
37563725
70836923675369236923 7063724
37323 7303 744
Other(net)
166230225259
219
200
Other credit balances
In partners'investmentand trading
accounts
25362642
23
35
In firminvestmentand trading
accounts
111213l i
16
9
In capitalaccounts
(net)
312317319314
324
315
1 Excludes balances with reporting firms (1) of member firms of New York Stock Exchange and other national securities exchanges and (2)•f firms' own partners.
2Includes money borrowed from banks and also from other lenders (not including member firms of national securities exchanges).3 As reported to the New York Stock Exchange. According to these reports, the part of total customers' debit balances represented by balances
secured by U. S. Government securities was (in millions of dollars): January, 31; February, 30; March, 28.NOTE.—For explanation of these figures see "Statistics on Margin Accounts" in BULLETIN for September 1936. The article describes the
method by which the figures are derived and reported, distinguishes the table from a "statement of financial condition," and explains that the lastcolumn is not to be taken as representing the actual net capital of the reporting firms.
Back figures.—See Banking and Monetary Statistics, Tables 143 and 144, pp. 501-503.
500 FEDERAL RESERVE BULLETIN
Digitized for FRASER http://fraser.stlouisfed.org/ Federal Reserve Bank of St. Louis
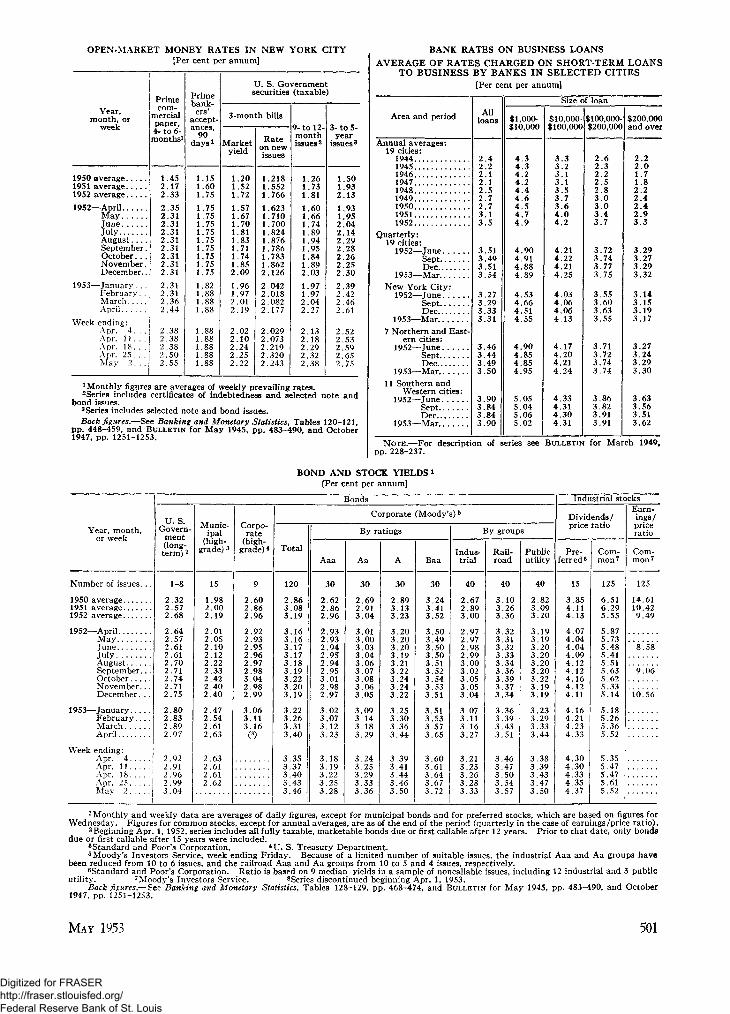
OPEN-MARKET MONEY RATES IN NEW YORK CITY[Per cent per annum]
Year,month, or
week
1950 average1951 average1952 average1952—April
MayJuneJuly. . .August . . . .September.October. . .November.December..
1953—January. . .February..MarchApril
Week ending:Apr. 4 . . .Apr. 11 . . .Apr. 18. . .Apr. 25 . . .Mav 2 . . .
Primecom-
mercialpaper,4- to 6-months1
1.452.172.332.352.312.312 312.312.312.312.312.312.312.312.362.44
2.382.382.382.502.55
Primebank-
ers'accept-ances,
90days1
L 1 5L.60L.75L.75
75L.75L 75L.751.75L.75L.75
.751.821.881.881.88
1.881.881.881.881.88
1J. S. Governmentsecurities
3-month bills
Marketyield
1.201.521.721.571 671.701.811.831.711.741.852.09
1.961.972.012.19
2.022.102.242.252.22
Rateon newissues
1.218L.552L .7661.623!710!700
824I'876L.786L.783.862
2.126
2.0422.0182.0822.177
2.0292.0732.2192.3202.243
(taxable)
9-to 12-monthissues 2
1.261.731.811.601.661^741.891.941.951.841.892.03
1.971.972.042.27
2.132.182.292.322.38
3- to 5-year
issues3
1.501.932.13
1.931J952.042.142.292.282.262.252.30
2.392.422.462.61
2.522.532.592.652.75
1 Monthly figures are averages of weekly prevailing rates.2Series includes certificates of indebtedness and selected note and
bond issues.3Series includes selected note and bond issues.Back figures.—See Banking and Monetary Statistics, Tables 120-121,
pp. 448-459, and BULLETIN for May 1945, pp. 483-490, and October1947, pp. 1251-1253.
BANK RATES ON BUSINESS LOANS
AVERAGE OF RATES CHARGED ON SHORT-TERM LOANSTO BUSINESS BY BANKS IN SELECTED CITIES
[Per cent per annum]
Area and period
Annual averages:19 cities:
194419451946 .194719481949195019511952
Quarterly:19 cities:
1952—JuneSeptDec
1953—MarNew York City:
1952—JuneSeptDec
1953—Mar#
7 Northern and East-ern cities:
1952—JuneSept.Dec
1953—Mar11 Southern and
Western cities:1952—June
Sept. . .Dec
1953—Mar.
Allloans
2.42.22 12.12 52 . 72.73.13 . 5
3.513.493.513.54
3.273.293.333.31
3.463 443.493.50
3.903.843.843.90
Size of loan
$1,000-$10,000
4.34.34 24.24 44 . 64.54.74 . 9
4.904.914.884.89
4.534.664.514.55
4.904.854.854.95
5.055.045.065.02
$10,000-$100,000
3.33.23 . 13.13.53 . 73.64.04 . 2
4.214.224.214.25
4.034.064.064.13
4.174.204.214.24
4.334.314.304.31
$100,000-$200,000
2.62.32 . 22.52 83 . 03.03.43 . 7
3.723.743.773.75
3.553.603.633.55
3.713.723.743.74
3.863.823.913.91
$200,000and over
2.22.01.71.82.22 . 42.42.93.3
3.293.273.293.32
3.143.153.193.17
3.273.243.293.30
3.633.563.513.62
NOTE.—For description of series see BULLETIN for March 1949,pp. 228-237.
BOND AND STOCK YIELDS *[Per cent per annum]
Year, month,or week
Number of issues.. .
1950 average1951 average1952 average
1952—AprilMayJuneJulyAugustSeptember...OctoberNovember.. .December. . .
1953—JanuaryFebruary. . . .MarchApril
Week ending:Apr. 4Apr. 11Apr. 18Apr. 25Mav 2. .
Bonds
U.S.Govern-
ment(long-term) 2
1-8
2.322.572.68
2.642.572.612.612.702.712.742.712.75
2.802.832.892.97
2.922.912.962.993.04
Munic-ipal
(high-grade) 3
15
1.982.002.19
2.012.052.102.122.222.332.422.402.40
2.472.542.612.63
2.632.612.612.62
Corpo-rate
(high-grade) 4
9
2.602.862.96
2.922.932.952.962.972.983.042.982.99
3.063.113.16(8)
Corporate (Moody's)5
Total
120
2.863.083.19
3.163.163.173.173.183.193.223.203.19
3.223.263.313.40
3.353.373.403.433.46
By ratings
Aaa
30
2.622.862.96
2.932.932.942.952.942.953.012.982.97
3.023.073.123.23
3.183.193.223.253.28
Aa
30
2.692.913.04
3.013.003.033.043.063.073.083.063.05
3.093.143.183.29
3.243.253.293.333.36
A
30
2.893.133.23
3.203.203.203.193.213.223.243.243.22
3.253.303.363.44
3.393.413.443.463.50
Baa
30
3.243.413.52
3.503.493.503.503.513.523.543.533.51
3.513.533.573.65
3.603.613.643.673.72
By groups
Indus-trial
40
2.672.893.00
2.972.972.982.993.003.023.053.053.04
3.073.113.163.27
3.213.233.263.283.33
Rail-road
40
3.103.263.36
3.323.313.323.333.343.363.393.373.34
3.363.393.433.51
3.463.473.503.543.57
Publicutility
40
2.823.093.20
3.193.193.203.203.203.203.223.193.19
3.233.293.333.44
3.383.393.433.473.50
Industrial stocks
Dividends/price ratio
Pre-ferred6
15
3.854.114.13
4.074.044.044.094.124.124.164.124.11
4.164.214.234.33
4.304.304.334.354.37
Com-mon7
125
6.516.295.55
5.875.735.485.415.515.635.625 315.14
5.185.265.365.52
5.355.475.475.615.52
Earn-ings/priceratio
Com-mon7
125
14.6110.429.49
"s'.5S
''9.06
10.56
1 Monthly and weekly data are averages of daily figures, except for municipal bonds and for preferred stocks, which are based on figures forWednesday. Figures for common stocks, except for annual averages, are as of the end of the period (quarterly in the case of earnings/price ratio).
2Beginning Apr. 1, 1952, series includes all fully taxable, marketable bonds due or first callable after 12 years. Prior to that date, only bondsdue or first callable after 15 years were included.
3Standard and Poor's Corporation, 4U. S. Treasury Department.5 Moody's Investors Service, week ending Friday. Because of a limited number of suitable issues, the industrial Aaa and Aa groups have
been reduced from 10 to 6 issues, and the railroad Aaa and Aa groups from 10 to 5 and 4 issues, respectively.^Standard and Poor's Corporation. Ratio is based on 9 median yields in a sample of noncallable issues, including 12 industrial and 3 public
utility. 7Moody's Investors Service. 8Series discontinued beginning Apr. 1, 1953.Back figures.—See Banking and Monetary Statistics, Tables 128-129, pp. 468-474, and BULLETIN for May 1945, pp. 483-490, and October
1947, pp. 1251-1253.
MAY 1953 501
Digitized for FRASER http://fraser.stlouisfed.org/ Federal Reserve Bank of St. Louis

TREASURY RECEIPTS, EXPENDITURES, AND RELATED ITEMS
Period
Calendar year:1949195019511952
Fiscal year:19491950 . . . .19511952
Semiannual totals:1949—July-Dec.1950—Jan.-June.
July-Dec..1951—Jan.-June.
July-Dec..1952—Jan.-June.
July-Dec..Monthly:
1952—AprMayJune . . .JulyAug.SeptOct. . . . .NovDec
1953—janFeb. . .MarApr
[On basis of daily statements of United States Treasury unless otherwise noted. In millions of dollarsl
Summary
Budget receipts andexpenditures
Netreceipts
38,12237,83453,48865,52338,24637,04548,14362,129
17,67519,37018,46429,67923,80938,32027,204
4,3233,8099,7963,3164,0506,5853,0994,1516,0035,0615,479
10.5022,849
Ex-pendi-tures
41,714'38,25556,84671,36640,05740,167144,63366,145
20,97419,192
U9.06325,57031,27634,86936,497
6,0165,6596,9306,7425,0186,0706,3835,1617,1245,7375,5956,1876,362
Surplusor
deficit( - )
-3,5921 -422-3,358-5,842-1,811-3,122^.sio
-4 ,017-3 ,300
178» -5994,109
-7 ,4673,451
-9 ,293
-1 ,693-1 ,850
2,865-3 ,426
-968515
-3 ,283-1 ,009-1 ,121
-676-1164,315
-3 ,513
Excess of receiptsor expenditures ( —)
Trustand
otherac-
counts
- 3 6 21 - 3 8
75949
—420121
»295219
- 1 4135
1 - 1 7 3468291
- 7 2121
- 2 2 9343
- 2 9 3- 4 3
6456
- 2 0 7127
- 2 1 8- 1 4 0
404- 2 0 9- 1 5 7
Sales andredemptionsin marketof Govt .agency
obligations
- 1 4 0349
56- 9 0
— 74- 2 2384
- 7 2
21- 4 3392- 864
- 1 3 646
- 6 314
1012671
- 3 4- 4 5
74- 4 6
29- 1 3 3
12- 5 0
Clear-ingac-
count
23487
-106-319
366483
-214—401
142341
-25440
-146-255- 6 4
329- 9 1
-326432
-195-229
316-243-145
401- 2
-135289
Increase ordecrease ( —)during period
Grossdirectpublicdebt
4,331-4232,7117,973
4784,587
-2 ,1353,883
4,360227
-650-1 ,486
4,197-3138,286
2091,613-8003,968
113-5042,2382,513
—4111
182-3 .099
105
Generalfund
balance
471-447
621,770
— 1,4622,0471,839—388
1,209838
-1 ,2853,124
-3 ,0622,674-904
-1 ,44728
1,548957
-973204
-9811,461
-1 ,572-376
335884
-3 ,326
General fund of the Treasury(end of period)
Bal-ance
ingen-eralfund
4,6794,2324,2956,064
3,4705,5177,3576,969
4,6795,5174,2327,3574,2956,9696,064
5,3935,4216,9697,9256,9527.1566,1757,6366.0645,6896,0246.9083,582
Deposits in
F. R.
Avail-able
funds
841690321389
438950338333
841950690338321333389
450569333638496508770396389811351222393
Banks
In proc-ess ofcollec-
tion
94129146176
103143250355
94143129250146355176
195125355184106161174103176350174448180
Specialdepos-itaries
2,5572,3442,6934,368
1,7713,2685,6805,106
2,5573,2682,3445,6802,6935,1064,368
3,7793,6905,1066,0275,1905,2174,1455,9844,3683,3184,3764.9831,859
Othernetas-sets
,187,069,134,132
,159,156.089,175
,187,156,069,089,134,175,132
9691,037
17S1,0761,161
,7701,087
15?,132
1,209,123.255,151
Period
Calendar year:1949195019511952
Fiscal year:1949195019511952
Semiannual totals:1949—July-Dec.1950—Jan.-June..
July-Dec. .1951—Jan.-June..
July-Dec. .1952—Jan.-June..
Ju ly -Dec .Monthly:
1952—AprMayJuneJulyAugSeptOct.NovDec
1953—Jan.FebM a rApr.
Budget expenditures
Total
41,71438,25556,84671,366
40,05740,16744,63366,145
20,97419,19219,06325,57031,27634,86936,497
6,0165,6596,9306,7425,0186,0706,3835,1617,1245,7375,5956.1876,362
Major national security programs
Total2
19.45218,50937,15451,121
19.08417,95025,89146,319
9,2918,6599,850
16,04121,11325,20625,915
4,4994,5414,3574,6953,8144,5184,3733,8764,6404,2164,1684,670
P4,590
Na-tional
de-fense
12,84913,47630,27543,176
12.15812,34619,95539,033
6,3765,9707,505
12,45017,82521,20821,968
3,7713.7883,6833,8842,9714,0083,7233,3024,0813,6323,5013.789
*>3,891
Mili-tary
assist-ance
abroad
2911.5592,975
44884
2,228
" ' 4 4 '247637921
1,3061,669
239228231293352184298266275277316523366
Inter-na-
tionaleco-
nomicaid3
6,0054,0123,5602,652
6.2794,9413,8632.904
2.6212.3201.6922,1701,3891,5141,137
281319352351266133142128117138171181
P129
AtomicEnergyCom-mis-sion
560611
1,2781,813
647524908
1,648
255270341567711937876
162154192140144155160150127158151157167
Inter-eston
debt
5,4825,5805,9836,065
5,3395,7505,6135,859
2,5603,1902,3903,2232,7613,0992,966
350172
1,518320183559572185
1,146235311563372
Vet-erans
Admin-istra-tion «
6,3645.7145,0884,433
6,7896.0435,2884,748
3.0063,0362,6782,6102,4792,2692,164
375355343391354343354345378348339358350
Agri-cul-tureDe-
part-ment5
3,1041,4991,0101,564
2,6562,986
6351,219
1,6521,335
164470540679885
5285
18711712649
192112289357285281
P292
Socialse-
curitypro-
grams4
1,2261,3511,4631,508
1,1101.3751,4151,424
695681670745718706802
14976
148158109116191124104180109
10P261
Hous-ingand
homefi-
nance
-123- 1 7694646
- 5 6-270
460614
- 9 5-175
158302392222424
10037
- 4 241217179
101112
- 8 019
- 3- 3 5
Publicworks
M .575.551,438,573
,519,575,458.515
903673878580858657916
9094
162157148158174140138
897088
*>184
Postofficedef-icit
536643684775
524593624740
209383260364320420355
180
175
180
160
—30125
Trans-fersto
trustac-
counts
1,425961
1,0161,193
9161,383
9721,305
1,226157804168848457737
509980
397946423936720
10158
P\3
Other
2,6732,4642,3152,487
2,1772.781
'2,2762,402
1,5281,2541,2101 ,0661 ,2491,1531,333
170200178292169191245184252213192193
P211
p Preliminary. r Revised.1 Beginning November 1950, investments of wholly owned Government corporations in public debt securities are excluded from budget ex-penditures, and included with other such investments under "Trust and other accounts." Adjustm ents for July-October 1950 investments weremade by the Treasury in the November 1950 and January 1951 figures. 2 Includes the following not shown separately:Maritime activities, special defense production expansion programs, Economic Stabilization Agency, and Federal Civil Defense Administration.3 Consists of foreign economic and technical assistance under the Mutual Security Act, net transactions of the Export-Import Bank, and othernonmilitary foreign aid programs, as well as State Department expenditures. 4 Excludes transfers to trust accounts, which are shown separately.6 Excludes expenditures for forest development of roads and trails, which are included with public works.
502 FEDERAL RESERVE BULLETIN
Digitized for FRASER http://fraser.stlouisfed.org/ Federal Reserve Bank of St. Louis
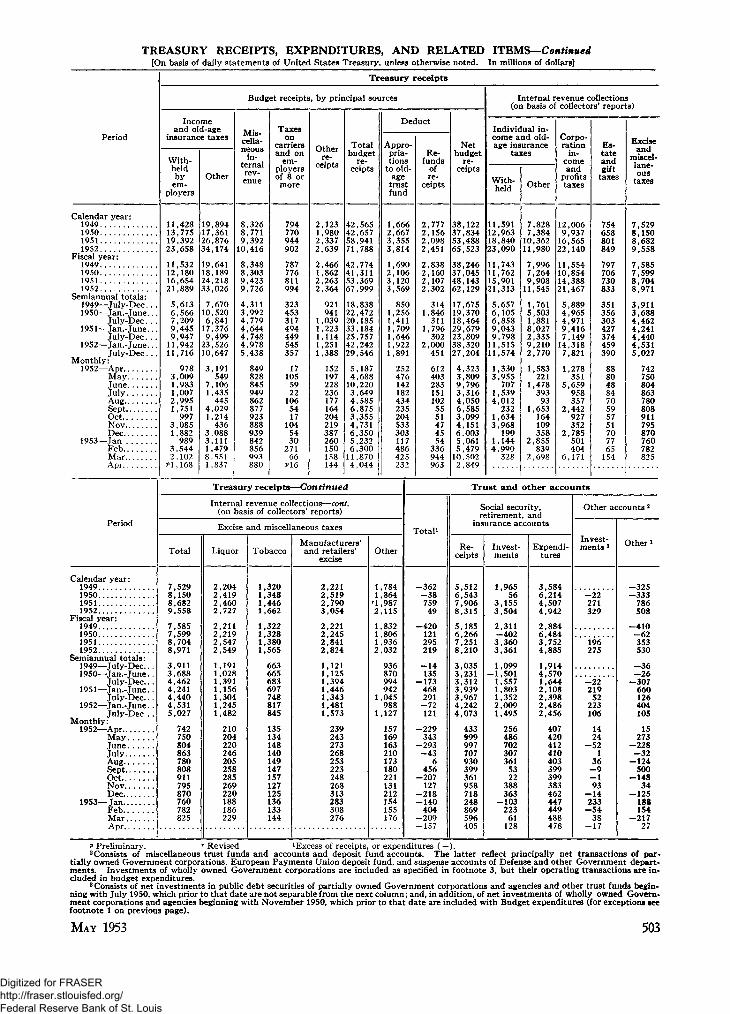
TREASURY RECEIPTS, EXPENDITURES, AND RELATED ITEMS—Continued[On basis of daily statements of United States Treasury, unless otherwise noted. In millions of dollars]
Period
Treasury receipts
Budget receipts, by principal sources
Incomeand old-age
insurance taxes
With-heldbyem-
ployers
Other
Mis-cella-neous
in-ternalrev-enue
Taxeson
carriersand on
em-ployersof 8 ormore
Otherre-
ceipts
Totalbudget
re-ceipts
Deduct
Appro-pria-tions
to old-age
trustfund
Re-funds
ofre-
ceipts
Netbudget
re-ceipts
Internal revenue collections(on basis of collectors' reports)
Individual in-come and old-age insurance
taxes
With-held Other
Corpo-ration
in-comeand
profitstaxes
Es-tateandgift
taxes
Exciseand
miscel-lane-ous
taxes
Calendar year:1949195019511952
Fiscal year:1949195019511952
Semiannual totals:1949—July-Dec. . .1950—Jan.-June...
July-Dec. . .1951—Jan.-June...
July-Dec. . .1952—Jan.-June...
July-Dec. . .Monthly:
1952—AprMayJuneJulyAugSeptOctNovDec
1953—JanFebMarApr
11,42813,77519,39223,658
11,53212,18016,65421,889
5,6136,5667,2099,4459,94711,94211,716
9783,0091,9831,0072,9951,751997
3,0851,882989
3,5442,102Pi,168
19,89417,36126,87634,174
19,64118,18924,21833,026
7,67010,5206,84117,3769,49923,52610,647
3,191549
7,1061,435445
4,0291,214436
3,0883,1111,4798.5511,837
8,3268,7719,39210,416
8,3488,3039,4239,726
4,3113,9924,7794,6444,7484,9785,438
849828845949862877923888939842856903880
794770944902
787776811994
323453317494449545357
1710559221065417
104543027166
2,1231,9802,3372,639
2,4661,8622,2632,364
921941
1,0391,2231,1141,2511,388
152197228236177164204219387260150158144
42,56542,65758,94171,788
42,77441,31153,36967,999
18,83822,47220,18533,18425,75742,24229,546
5,1874,688
10,2203,6494,5856,8753,3554,7316,3505,2326,30011,8704,044
1,6662,6673,3553,814
1,6902,1063,1203,569
850,256,411,709,646,922,891
252476142182434235204533303117486425232
2,7772,1562,0982,451
2,8382,1602,1072,302
3141,846311
1,796302
2,000451
6124032831511025551474554
336944963
38,12237,83453,48865,523
38,24637,04548,14362,129
17,67519,37018,46429,67923,80938,32027,204
4,3233,8099,7963,3164,0506,5853,0994,1516,0035,0615,479
10.5022,849
11,59112,96318,84023,090
11,74311,76215,90121,313
5,6576,1056,8589,0439,79811,51511,574
1,3303,955
7071,5394,012232
1,6343,968
1901,1444,990
328
7,8287,38410,36211,980
7,9967,2649,90811,545
1,7615,5031,8818,0272,3359,2102,770
1,583221
1,47839393
1,653164109358
2,855839
2,698
12,0069,93716,56522,140
11,55410,85414,38821,467
5,8894,9654,9719,4167,14914,3187,821
1,278351
5,659958357
2,442927352
2,785501404
6,171
754658801849
797706730833
351356303427374459390
8880488470595751707765154
7,5298,1508,6829,558
7,5857,5998,7048,971
3,9113,6884,4624,2414,4404,5315,027
742750804863780808911795870760782825
Period
Treasury receipts—Continued
Internal revenue collections—cont.(on basis of collectors' reports)
Excise and miscellaneous taxes
Total Liquor TobaccoManufacturers'and retailers'
exciseOther
Trust and other accounts
Total1
Social security,retirement, and
insurance accounts
Re-ceipts
Invest-ments
Expendi-tures
Other accounts 2
Invest-ments 3 Other »
Calendar year:1949195019511952
Fiscal year:1949195019511952
Semiannual totals:1949—July-Dec...1950—Jan.-June. .
July-Dec.. .1951—Jan.-June. .
July-Dec.. .1952—Jan.-June. .
July-Dec . .Monthly:
1952—AprMayJuneJulyAugSeptOctNovDec
1953—JanFebMarApr
7,5298,1508,6829,558
7,5857,5998,7048,971
3,9113,6884,4624,2414,4404,5315,027
742750804863780808911795870760782825
2,2042,4192,4602,727
2,2112,2192,5472,549
1,1911,0281,3911,1561,3041,2451,482
210204220246205258285269220188186229
,320,348,446,662
,322,328,380,565
663665683697748817845
135134148140149147157127125136133144
2,2212,5192,7903,054
2,2212,2452,8412,824
1,1211,1251,3941,4461,3431,4811,573
239243273268253223248268313283308276
1,7841,8641,9872,115
1,8321,8061,9362,032
936870994942
1,045988
1,127
157169163210173180221131212154155176
-362-3875949
-420121295219
-14135
-173468291-72121
-229343
-293-43
6456
-207127
-218-140404
-209-157
5,5126,5437,9068,315
5,1856,2667,2518,210
3,0353,2313,3123,9393,9674,2424,073
433999997707930399361958718248869596405
1,96556
3,1553,504
2,311-4023,3603,361
1,099-1,501
1,5571,8031,3522,0091,495
2564867023073615322
388363
-10322361128
3,5846,2144,5074,94:2
2,8846,4843,7524,885
1,9144,5701,6442,1082,3982,4862,456
407420412410403399399383462447449488478
-22271329
196275
-22219
52223106
1424
-521
36—9- 193
-14233
-5438
-17
- 3 2 5- 3 3 3
786508
-410-62353530
-36-26
-307660126404105
15273
-228-32
-124500
-14834
-125188154
-21727
P Preliminary. r Revised xExcess of receipts, or expenditures (—).2 Consists of miscellaneous trust funds and accounts and deposit fund accounts. The latter reflect principally net transactions of par-
tially owned Government corporations, European Payments Union deposit fund, and suspense accounts of Defense and other Government depart-ments. Investments of wholly owned Government corporations are included as specified in footnote 3, but their operating transactions are in-cluded in budget expenditures.
3 Consists of net investments in public debt securities of partially owned Government corporations and agencies and other trust funds begin-ning with July 1950, which prior to that date are not separable from the next column; and, in addition, of net investments of wholly owned Govern-ment corporations and agencies beginning with November 1950, which prior to that date are included with Budget expenditures (for exceptions seefootnote 1 on previous page).
MAY 1953 503
Digitized for FRASER http://fraser.stlouisfed.org/ Federal Reserve Bank of St. Louis

TREASURY CASH INCOME, OUTGO, AND BORROWINGDERIVATION OF CASH RECEIPTS FROM AND PAYMENTS TO THE PUBLIC
Period
Cal. yr.—1949195019511952
Fiscal yr.—194919501 9 5 1 . . . .1952
Semiannual totals:1949—July-Dec...1950—Jan.-June..
July-Dec...1951—Jan.-June..
July-Dec...1952—Jan.-June..
July-Dec. .Monthly:
1952—AprMayJuneJulyAugSeptOctNovDec
1953—JanFebMar..Apr
[On basis of daily statements of United States Treasury and Treasury Bulletin.
Cash operating income, other than debt
Net Budgetreceipts
Totalnet
receipts
38,12237,83453,48865,52338,24637,04548,14362,129
17,67519,37018,46429,67923,80938,32027,204
4,3233,8099,7963,3164,0506,5853,0994,1516,0035,0615,479
10,5022,849
Less:Non-cash1
99171222184100120256138
408091
1645877
107
22
3224
2343
7143
32
Plus: Trustacct. receipts
Total
5,9567,0018,5828,7075,7146,6697,7968,807
3,2313,4383,5624,2344,3494,4584,248
4761,0501,026
738959427401975747286920649443
Less:Non-cash2
2,6032,2112,5082,6492,2322,6232,2442,705
1,4461,1781,0331,2101,2981,4061,243
108134801438128111
79127360
65128106
Equals:Cash
operat-ing
income
41,37442,45159,33871,39641,62840,97053,43968,093
19,42021,55120,90032,53726,79941,29330,104
4,6894,7229,9883,5934,8786,8983,4184,9976,3205,2396,267
11,042
In millions of dollars]
Cash operating outgo, other than debt
Budget expenditures
Total
41,71438,25556,84671,36640,05740,16744,63366,145
20,97419,19219,06325,57031,27634,86936,497
6,0165,6596,9306,7425,0186,0706,3835,1617,1245,7375,5956,1876,362
Less: Noncash
Accru-als topublic3
403503567734389436477710
215222281196371338396
395993744246568395823821
Intra-Govt.trans.4
2,5882,3072,6252,8072,1522,7542,3602,837
1,5411,2131,0751,2791,3461,4881,319
11113484445712711286
128409100129107
Plus: Tr. acct.expenditures
Total
4,2106,9234,3974,8253,5116,8813,9454,952
2,1594,7222,2011,7442,6532,2982,527
434197669473556
-73587367617296346758488
Less:Non-cash5
164659028
18313
1384
2105582
8- 432
- 22
- 1 1521
- 23
23821
Plus:
Exch.Stabi-liza-tion
Fund0
102-262
- 2 63898
-207- 1 3
9
55-262
- 1 3- 1 3
2216
- 2 1- 1 4
25
5
- 1 919
Clear-ing ac-count
-234- 8 7106319
-366-483
214401
-142-341
254- 4 0146255
64
-32991
326-432
195229
-316243145
-4012
135-289
Equals:Cash
operat-ing
outgo
42,64241,96958,03472,98040,57643,15545,80467,956
21,29021,86520,10525,70032,33435,62237,357
5,9725,7516,9786,2335,6226,0666,5145,5587,3645,4425,7546,970
Netcash
operat-ing in-come
oroutgo(-)
-1,267482
1,304-1 ,583
1,051-2 ,185
7,635137
-1 ,871-315
7966,839
-5 ,5345,671
-7 ,254
-1 ,283-1 ,029
3,010-2 ,640
-744832
-3 ,097-561
-1 ,044-203
5134,072
1 Represents principally interest paid to Treasury by Government agencies and repayment of capital stock and paid-in surplus by partiallyowned Government corporations.
2Represents principally interest on investments in U. S. Government securities, payroll deductions for Government employees' retirementaccounts, and transfers shown as Budget expenditures.
3 Represents principally excess of interest accruals over payments on savings bonds and Budgetary expenditures involving issuance of Federalsecurities; the latter include mostly armed forces leave bonds and notes issued to the International Bank and Monetary Fund, which are treatedas noncash expenditures at the time of issuance and cash expenditures at the time of redemption.
4 Represents principally noncash items shown under trust account receipts (described in footnote 2); also includes small adjustments fornoncash interest reflected in noncash Budget receipts (see footnote 1) and in noncash trust account expenditures (see footnote 5).
5Represents principally repayments of capital stock and paid-in surplus by partially owned Government corporations, as well as interestreceipts by such corporations on their investments in the public debt (negative entry).
6 Cash transactions between International Monetary Fund and Exchange Stabilization Fund. (See footnote 3.)
DERIVATION OF CASH BORROWING FROM OR REPAYMENT OF BORROWING TO THE PUBLIC
Period
Cal. yr.—1949195019511952
Fiscal yr.—1949195019511952
Semiannual totals:1949—July-Dec1950—Jan.-June. . .
July-Dec.. . .1951—Jan.-June. . .
July-Dec.. . .1952—Jan.-June. . .
July-Dec.. . .Monthly:
1952—AprMayJuneJulyAugSeptOctNovDec
1953—TanFebMarApr
In-crease,or de-crease( - ) , ingross
dir. pub.debt
4,331-4232,7117,973
4784,587
-2,1353,883
4,360227
-650-1,486
4,197-3138,286
2091,613-8003,968
113-5042,2382,513
-4111
182-3,099
105
Plus: Cashissuance ofsecurities of
Federal agencies
Guar-anteed
- 2 5- 61812
- 4 6o
1016
2- 1 0
45
1338
41
- 1 151563
- 6211
Non-guar-
anteed
-115355
37-102
- 2 8- 1 4374
- 8 8
19- 3 3388
- 1 351
-13937
- 6 613
1013766
- 3 4- 5 0
68- 5 0
35-134
11- 5 1
Less: Noncash debt transactions
Net inv.in Fed.sec. by
Govt. agen.& tr. funds
2,15694
3,4183,8332,630-3083,5573,636
1,141- 1 , 4 5 0
1,5442,0141,4042,2321,601
2705106503083974421
481' 349
130170100112
Accruals to public1
Int. on sav.bonds and
Treas. bills
585602718770580574638779
307265337301417361409
416396774449588497844023
Payts. inform of
Fed. sec.
-285163
-125- 7 4
-29368
-149- 7 9
-147219
- 5 6- 9 2- 3 3- 4 5- 2 9
- 2- 41811
- 2 7- 3- 2- 1- 7- 217
- 2 1
Equals:Net cashborrow-ing, orrepayt.( - ) o f
borrow-ing
1,739-929
-1,2423,353
-2,5134,231
-5,795-525
3,0791,152
-2,081-3,714
2,472-2,998
6,351
-1631,057
-1,4633,597-229-6282,1162,022-527-173-178
-3,188
Details of net cash borrowing from orrepayment ( —) of borrowing to the public 2
Directmktable.& conv.issues 3
-2,275-2,649
1,9995,778
-5,351211
-3,9431,639
99112
-2,761-1,184
3,183-1,544
7,322
-162754
-6633,830-192-2592,2001,915-172-199-82
-2,50447
Savingsbonds(issueprice)
1,125751
- 1 , 1 9 1-4062,420
728-467-717
268462292
-758—432-285-121
- 8 1- 9 1- 2 8- 5 4
- 4 6- 7- 8- 51129358
1
Savingsnotes
3,0201,021
-1 ,099-1 ,784
4633,601-657
-1 ,209
2,767834187
-845-255-955- 8 2 9
142412
-859- 1 7 3-111-292- 1 3
62-302
- 9 9- 3 8
-768- 8 3
PostalSav. Sys.
specialissues
15-250-997-113
40-150
-1 ,093-155
- 7 0- 8 0
-170-923
- 7 4- 8 1- 3 2
- 2 4- 1 7- 3 0
- 2
- 1 3- 4
Other*
-14619846
-122- 8 5
-158365
- 8 2
15-176
371- 551
-13411
- 6 26
1042474
- 3 1- 6 4
53- 4 6
21-138
30
1 Differs from "accruals to the public" shown in preceding table, principally because adjustments to Exchange Stabilization Fund are included.2Includes redemptions of tax anticipation bills and savings notes used in payment of taxes.3Most changes in convertible Series B investment bonds, 1975-80, reflect exchanges of, or conversions into, marketable issues and thus cancel
out in this column. An exception was the sale for cash of about 300 million dollars in June 1952.* Includes cash issuance in the market of obligations of Government corporations and agencies and some miscellaneous debt items.
504 FEDERAL RESERVE BULLETIN
Digitized for FRASER http://fraser.stlouisfed.org/ Federal Reserve Bank of St. Louis
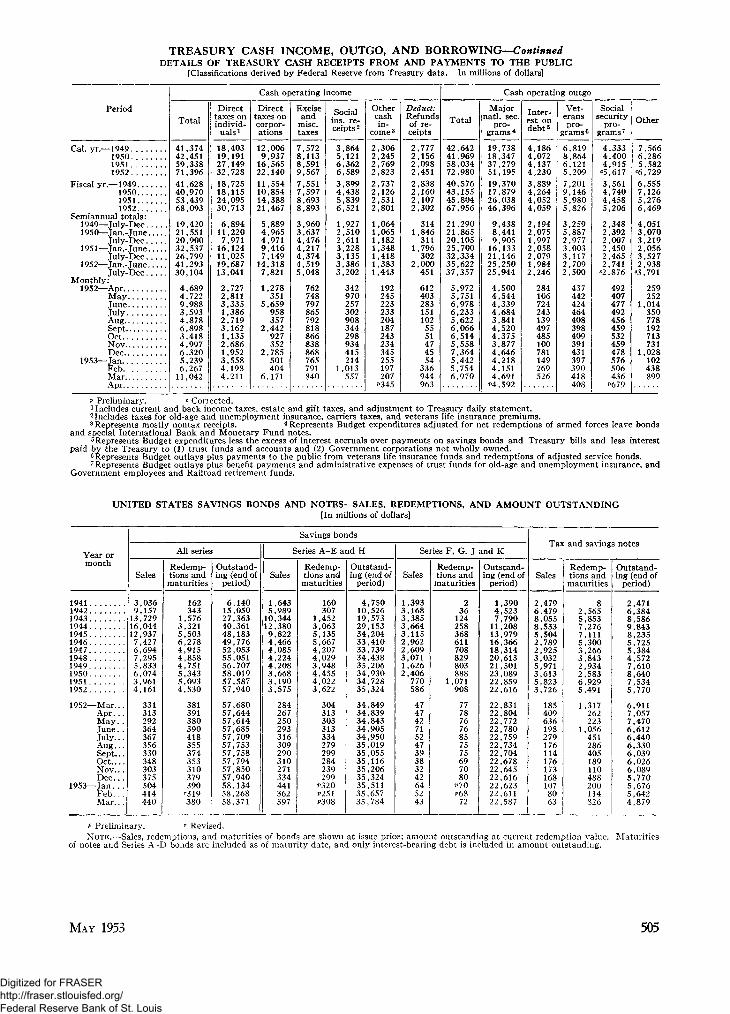
TREASURY CASH INCOME, OUTGO, AND BORROWING—ContinuedDETAILS OF TREASURY CASH RECEIPTS FROM AND PAYMENTS TO THE PUBLIC
[Classifications derived by Federal Reserve from Treasury data. In millions of dollars]
Period
Cai yr.—194919501951 . . .1952
Fiscal yr.—1949195019511952 . .
Semiannual totals:1949—July-Dec1950—Jan.-June
July-Dec . , .1951—Jan.-June
July-Dec1952—Jan.-June
July-DecMonthly:
1952—Apr.MayJune.JulyAugSeptOctNov..Dec
1953—JanFebMarApr
Cash operating income
Total
41,37442,45159,33871,39641,62840,97053,43968,093
19,42021,55120,90032,53726,79941,29330,104
4,6894,7229,9883,5934,8786,8983 4184,9976,3205,2396,267
11,042
Directtaxes onindivid-
uals1
18,40319,19127,14932,72818,72518,11524,09530,713
6,89411,2207,971
16,12411,02519,68713,041
2,7272,8113,3351,3862,7193,1621,1352,6861,9523,5584,1984,211
Directtaxes oncorpor-ations
12,0069,937
16,56522,14011,55410,85414,38821,467
5,8894,9654,9719,4167,149
14,3187,821
1,278351
5,659958357
2,442927352
2,785501404
6,171
Exciseand
misc.taxes
7,5728,1138,5919,5677,5517,5978,6938,893
3,9603,6374,4764,2174,3744,5195,048
762748797865792818866838868765791840
Socialins. re-ceipts2
3,8645,1216,3626,5893,8994,4385,8396,521
1,9272,5102,6113,2283,1353,3863,202
342970257302908344298934415214
1,013557
Othercashin-
come3
2,3062,2452,7692,8232,7372,1262,5312,801
1,0641,0651,1821,3481,4181,3831,443
192245223233204187243234345255197207
P345
Deduct:Refundsof re-ceipts
2,7772,1562,0982,4512,8382,1602,1072,302
3141,846
3111,796
3022,000
451
612403283151102
5551474554
336944963
Cash operating outgo
Total
42,64241,96958,03472,98040,57643,15545,80467,956
21,29021,86520,10525,70032,33435,62237,357
5,9725,7516,9786,2335,6226,0666,5145,5587,3645,4425,7546,970
Majornatl. sec.
pro-grams 4
19,73818,34737,27951,19519,37017,87926,03846,396
9,4388,4419,905
16,13321,14625,25025,944
4,5004,5444,3394,6843,8414,5204,3753,8774,6464,2184,1514,691
P 4 , 5 9 2
Inter-est ondebt5
4,1864,0724,1374,2303,8894,2644,0524,059
2,1942,0751,9972,0582,0791,9842,246
284106724243139497485100781149269526
Vet-eranspro-
grams6
6,8198,8646,1215,2097,2019,1465,9805,826
3,2595,8872,9773,0033,1172,7092,500
437442424464408398409391431397390418408
Socialsecurity
pro-grams 7
4,3334,4004,915
C5,6173,5614,7404,4585,206
2,3482,3922,0072,4502,4652,741
'2,876
492407477492456459532459478576506436
P679
Other
7,5666,2865,582
C6,7296,5557,1265,2766,469
4,0513,0703,2192,0563,5272,938
«3,791
259252
1,014350778192713731
1,028102438899
P Preliminary. c Corrected.1 Includes current and back income taxes, estate and gift taxes, and adjustment to Treasury daily statement.2Includes taxes for old-age and unemployment insurance, carriers taxes, and veterans life insurance premiums.3 Represents mostly nontax receipts. 4 Represents Budget expenditures adjusted for net redemptions of armed forces leave bonds
and special International Bank and Monetary Fund notes.5Represents Budget expenditures less the excess of interest accruals over payments on savings bonds and Treasury bills and less interest
paid by the Treasury to (1) trust funds and accounts and (2) Government corporations not wholly owned.GRepresents Budget outlays plus payments to the public from veterans life insurance funds and redemptions of adjusted service bonds.7 Represents Budget outlays plus benefit payments and administrative expenses of trust funds for old-age and unemployment insurance, and
Government employees and Railroad retirement funds.
UNITED STATES SAVINGS BONDS AND NOTES—SALES, REDEMPTIONS, AND AMOUNT OUTSTANDING[In millions of dollars]
Year ormonth
19411942194319441945 . . . .194619471 9 4 8 . . . .194919501951 . . .1952
1952—Mar . . .A p r . . .May. .June . .July.. .Aug. . .Sept...Oct.. . .Nov.. .Dec . . .
1953—Jan...Feb. . .Mar.. .
Savings bonds
Sales
3,0369,157
13,72916,04412,9377,4276,6947,2955,8336,0743,9614,161
331313292364367356330348303375504414440
All series
Redemp-tions andmaturities
162343
1,5763,3215,5036,2784,9154,8584,7515,3435,0934,530
381391380390418355374353310379390
'319380
Outstand-ing (end of
period)
6,14015,05027,36340,36148,18349,77652,05355,05156,70758,01957,58757,940
57,68057,64457,61457,68557,70957,75357,75857,79457,85057,94058,13458,26858,371
Series A-E and H
Sales
1,6435,989
10,34412,3809,8224,4664,0854,2244,2083,6683,1903,575
284267250293316309290310271334441362397
Redemp-tions andmaturities
160307
1,4523,0635,1355,6674,2074,0293,9484,4554,0223,622
304313303313334279299284239299
P320P251P308
Outstand-ing (end of
period)
4,75010,52619,57329,15334,20433,41033,73934,43835,20634,93034,72835,324
34,84934,83934,84334,90534,95035,01935,05535,11635,20635,32435,51135,65735,784
Series F, G, J
Sales
1,3933,1683,3853,6643,1152,9622,6093,0711,6262,406
770586
47474271524739383242645243
Redemp-tions andmaturities
236
124258368611708829803888
1,071908
77787676857575697080
P 7 0^68
72
and K
Outstand-ing (end of
period)
1,3904,5237,790
11,20813,97916,36618,31420,61321,50123,08922,85922,616
22,83122,80422,77222,78022,75922,73422,70422,67822,64522,61622,62322,61122,587
Tas
Sales
2,4796 4798,0558,5335,5042,7892,9253,0325,9713,6135,8233,726
185409636198279176114176173168107
8063
and saving
Redemp-tions andmaturities
g2 5655,8537,2767,1115,3003,2663,8432,9342,5836,9295,491
1,317262223
1,056451286405189110488200114S26
3 notes
Outstand-ing (end of
period)
2,4716,3848,5869,8438,2355,7255,3844,5727,6108,6407,5345,770
6,9117,0577,4706,6126,4406,3306,0396,0266,0895,7705,6765,6424,879
P Preliminary. r Revised.NOTE.—Sales, redemptions, and maturities of bonds are shown at issue price; amount outstanding at current redemption value. Maturities
of notes and Series A-D bonds are included as of maturity date, and only interest-bearing debt is included in amount outstanding.
MAY 1953 505
Digitized for FRASER http://fraser.stlouisfed.org/ Federal Reserve Bank of St. Louis
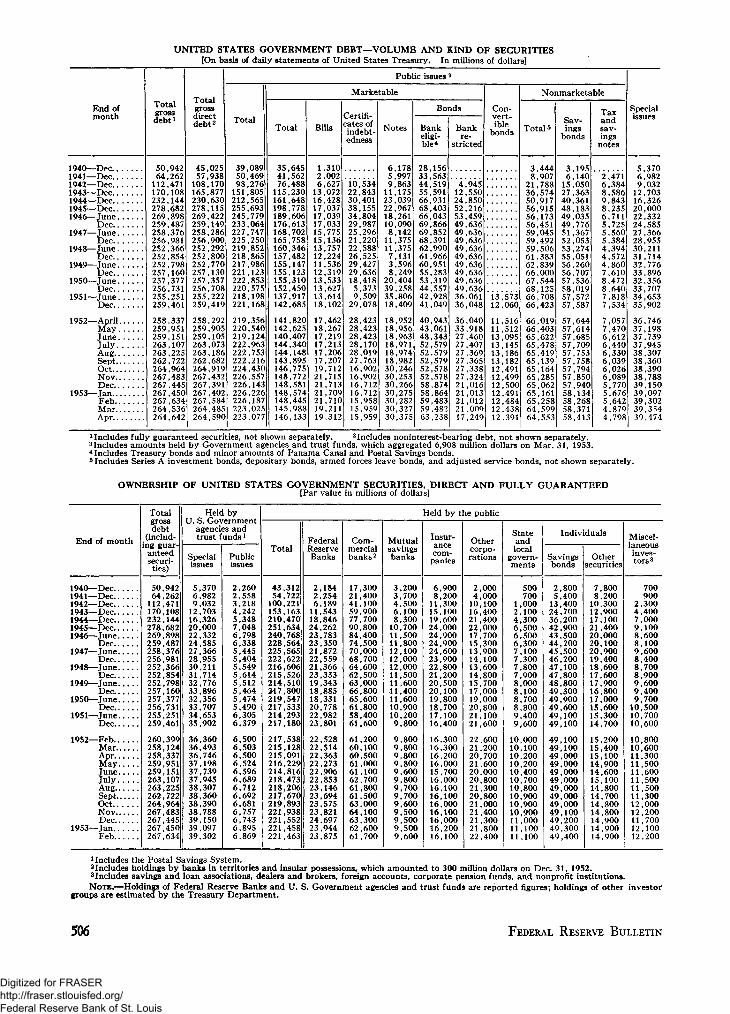
UNITED STATES GOVERNMENT DEBT—VOLUME AND KIND OF SECURITIES[On basis of daily statements of United States Treasury. In millions of dollars]
End ofmonth
1940—Dec1941—Dec1942—Dec.1943—Dec1944—Dec1945—Dec1946—June
Dec. . .1947—ju n e
Dec.194g—ju n e
Dec1949—ju n e
Dec1950—ju n e
Dec1951—ju n e
Dec
1952—AprilMayJune . . .JulyAugSeptOctNovD e c
1953—JanFebMarApr
Totalgrossdebt1
SO64
112170232278?69259?58256
252252?S7257256255?59
?S8259259?63263
264?67267267267264264
,942
,471,108,144,68?898
,487,376,981,366,854,798,160,377,731,251,461
337,951,151107
,225,7??964
,483,445,450,634,536,642
Totalgrossdirectdebt2
4557
108165230?78?69259?58256
252
?57?57256?55?59
?58259?59?63263
264?67267267267264264
0?5938
,170877
,630,1154??
,149?86
,900
,800,770130
,357,708
419
,905,105073
,18668?
,9194 3 ?
,391,402,584,485,590
Total
3 9 ,5 0 ,98,
151,212,255,245,233,227,225,219,218,217,221,222,220,218,221,
219220219222222222224226226226226223223
08946927680S565693779064747?5085?865986
853575198168
3S6540
963753
430557143
187025077
Total
354176
115161198189176168165160157155155155152137142
141142140144144143146148148148148145146
64556?
,488?30
,64877860661370?758346
,482147
310,450917685
8?0,625407340
,148895
,77577?
,581,574,445,988,133
Bills
1
6131617171715151312111?13131318
17181717171719
21
211919
31000?62707?
,42803703903377S
,136757
,224536319533
,627,61410?
46?,267
213,206?07
,71?715
,713,709,710,211,312
Public issues 3
Marketable
Certifi-cates ofindebt-edness
10
303834?9?S
2226?9?91859
? 9
?828?8?828?716161616151515
534843401155804987?96
5885254? 7636418373509078
4? 3,4234? 3170
,0197639 0 ?90?
,712,712,958,959,959
Notes
659
1123
1810
81111738
?0393518
18181818181830303030303030
178997863175039967
09014?375375
,131596?49404
,258806409
9 5 ?,956963971
,97498?
,?46?53
,266,275,282,327,375
Bonds
Bankeligi-ble *
?83344556668666969686?61605553444?41
404348S?525?5?5?5858595963
15656351959193140304386685?391990966951
3195579?8049
943061343579
,579579578578
,874,864,483,482,238
Bankre-
stricted
41?245?534949494949494949493636
3633?7?727?7? 7?721
212117
,945,550,850
459,636,636,636,636,636,636636
,636,636,061,048
040,918,460407
,369365338
,3?4,016,013,012,009,249
Con-vert-ible
bonds
131?
1111131313131?1?1212121212
573060
516512095145
,18618?
4 0 0,500,491,484,438,391
Nonmarketable
Total5
821365056565659SO59616?6667686666
66666565656565656565656464
444,907,788,574,917,915173451
,045492
,506,383,839000
,544,125708
,423
,019,403622
,478,419,139164
,285,062,161,258,599,553
Sav-ings
bonds
615?740484949515?5355565657585757
57575757575757575758585858
,195,140,050,363,361,183035776
,367053
,?74,051,260,707536
,019572
,587
,644,614685
,709,753,758794850
,940,134,268,371,413
Taxandsav-ingsnotes
268986s5544478877
7766666655544
,471,384,586,843,235711
,725560384
,394,572,860610472
,640818
,534
,057,470612
,440,330,039026
,089,770,676,642,879,798
Specialissues
5 3706,9829,032
12,70316,32620,00022,33224,58527,36628 95530,21131,71432,77633,89632 35633,70734 65335,902
36,74637,19837,73937,94538,30738,36038 39038,78839,15039,09739,30239,35439,474
2Includes noninterest-bearing debt, not shown separately.
OWNERSHIP OF UNITED STATES GOVERNMENT SECURITIES, DIRECT AND FULLY GUARANTEED[Par value in millions of dollars]
End of month
1940— Dec1941—Dec1942—Dec..1943—Dec1944—Dec. ,1945—Dec1946—June
Dec1947—June
Dec1948—June
Dec1949—June
Dec1950—June
Dec1951—June
D e c . ..
1952—FebMarAprMayJuneJulyAugSeptOctNovDec,
1953— TanFeb
Totalgrossdebt
(includ-ing guar-anteedsecuri-
ties)
50,94264,262
112,471170,108232,144278,682269,898259,487258,376256,981252,366252,854252,798257,160257,377256,731255,251259,461
260,399258,124258,337259,951259,151263,107263,225262,722264,964267,483267,445267,450267,634
Held by
U. S. GoVcriimcHLagencies andtrust fundsx
Specialissues
5,3706,9829,032
12,70316,32620,00022,33224,58527,36628,95530,21131,71432,77633,89632,35633,70734,65335,902
36,36036,49336,74637,19837,73937,94538,30738,36038,39038,78839,15039,09739,302
Publicissues
2,2602,5583,2184,2425,3487,0486,7986,3385,4455,4045,5495,6145,5125,4645,4745,4906,3056,379
6,5006,5036,5006,5246,5966,6896,7126,6926,6816,7576,7436,8956,869
Held by the public
Total
43,31254,722
100,221153,163210,470251,634240,768228,564225,565222,622216,606215,526214,510247,800219,547217,533214,293217,180
217,538215,128215,091216,229214,816218,473218,206217,670219,893221,938221,552221,458221,463
FederalReserveBanks
2,1842,2546,189
11,54318,84624,26223,78323,35021,87222,55921,36623,33319,34318,88518,33120,77822,98223,801
22,52822,51422,36322,27322,90622,85323,14623,69423,57523,82124,69723,94423,875
Com-mercialbanks2
17,30021,40041,10059,90077,70090,80084,40074,50070,00068,70064,60062,50063,00066,80065,60061,80058,40061,600
61,20060,10060,50061,00061,10062,70061,80061,50063,00064,10063,30062,60061,700
Mutualsavingsbanks
3,2003,7004,5006,1008,300
10,70011,50011,80012,10012,00012,00011,50011,60011,40011,60010,90010,2009,800
9,8009,8009,8009,8009,6009,8009,7009,7009,6009,5009,5009,5009,600
Insur-
ancecom-panies
6,9008,200
11,30015,10019,60024,00024,90024,90024,60023,90022,80021,20020,50020,10019,80018,70017,10016,400
16,30016,30016,20016,00015,70016,00016,10016,10016,00016,10016,00016,20016,100
Othercorpo-rations
2,0004,000
10,10016,40021,40022,00017,70015,30013,90014,10013,60014,80015,70017,00019,00020,80021,10021,600
22,60021,20020,70021,60020,00020,80021,30020,80021,00021,40021,30021,80022,400
Stateandlocal
govern-ments
500700
1,0002,1004,3006,5006,5006,3007,1007,3007,8007,9008,0008,1008,7008,8009,4009,600
10,00010,10010,20010,20010,40010,70010,80010,90010,90010,90011,00011,10011,100
Individuals
Savingsbonds
2,8005,400
13,40024,70036,20042,90043,50044,20045,50046,20047,10047,80048,80049,30049,90049,60049,10049,100
49,10049,10049,00049,00049,00049,00049,00049,00049,00049,10049,20049,30049,400
Othersecurities
7,8008,200
10,30012,90017,10021,40020,00020,10020,90019,40018,60017,60017,90016,80017,00015,60015,30014,700
15,20015,40015,10014,90014,60015,10014,80014,70014,80014,80014,90014,90014,900
Miscel-laneousinves-tors3
700900
2,3004,4007,0009,1008,6008,1009,6008,4008,7008,9009,6009,4009,700
10,50010,70010,600
10,80010,60011,30011,50011,60011,50011,50011,30012,00012,20011,70012,10012,200
1 Includes the Postal Savings System.2Includes holdings by banks in territories and insular possessions, which amounted to 300 million dollars on Dec. 31, 1952.3 Includes savings and loan associations, dealers and brokers, foreign accounts, corporate pension funds, and nonprofit institutions.NOTE.—Holdings of Federal Reserve Banks and U. S. Government agencies and trust funds are reported figures; holdings of other investor
groups are estimated by the Treasury Department.
506 FEDERAL RESERVE BULLETIN
Digitized for FRASER http://fraser.stlouisfed.org/ Federal Reserve Bank of St. Louis

UNITED STATES GOVERNMENT MARKETABLE AND CONVERTIBLE SECURITIESDirect Public Issues Outstanding April 30, 1953
[On basis of daily statements of United States Treasury. In millions of dollars]
Issue and coupon rate Amount Issue and coupon rate Amount Issue and coupon rate Amount j Issue and coupon rate Amount
2,8283,7573,8334,7232,9641,8952,7163,834
7450
12,391
Treasury bills1
May 7, 1953..May 14, 1953..May 21, 1953..May 28, 1953..
June 4, 1953..June 11, 1953..June 18, 1953..June 19, 1953 2.June 25, 1953 . .
Tuly 2, 1953. .July 9, 1953 . .Tuly 16, 1953. .July 23, 1953 . .July 30, 1953. .
1 ,3001,5001,3011,301
1,301
CertificatesJune 1, 1953.Aug. 15, 1953.Feb. 15, 1954.
,202,201, 003
1,201
1 ,2011,4011,4011 ,5011,500
• 2%
Treasury notesDec. 1, 1953. .Mar. 15, 1954. .Mar. 15, 1955. .Dec. 15, 1955. .Apr. 1, 1956. .Oct. 1, 1956. .Apr. 1, 1957. .Oct. 1, 1957. .Apr. 1,1958...
4,9632,8828,114
10,5424,6755,3656,8541,007
55053182426
TreasuryJune 15,Sept. 15,Dec. 15,Dec. 15,Dec. 15,Dec. 15,June 15,Mar. 15,Mar. 15,Sept. 15,Sept. 15,Mar. 15,June 15,Tune 15,Dec. 15,June 15,Dec. 15,Dec. 15,June 15,
bonds1953 a19531953-55 ..1953-544 .
1953-55 5 .1953-54 . .1954-563.1955-603.1956-58..1956-593.1956-59..1957-59..19581958-63 3.19581959-62..1959-62. .1960-653.1962-67. .
. . .2
.. .2
. . .2
. ..22K
. . .22%
• 2V2
2%
2%
7257,986510
5,8251,5018,662681
2,6111,449982
3,822927
4,245919620
5,2803,4671,4852,117
Treasury bonds—Cont.Dec . 15, 1963-68 . . . 2 ^J u n e 15, 1964-69 . . 2 y2Dec . 15, 1964-69 6 . . 2 HM a r . 15, 1 9 6 5 - 7 0 6 . . 2 Y2M a r . 15, 1 9 6 6 - 7 1 6 . . 2 MJ u n e 15, 1967-72 6 . . 2 3^Sept . 15, 1967-72. . . 2 ^Dec . 15, 1967-72 6 . . 2 ^
Postal Savingsbonds 2Y2
Panama Canal Loan.. 3
Convertible bondsInvestment Series BApr. 1, 1975-80. . .2
1Sold on discount basis.3 Partially tax exempt.
See table on Open-Market Money Rates, p. 501.4 Maturity June 15, 1954. Matur i ty June 15, 1955.
2Tax anticipation series.0 Restricted.
SUMMARY DATA FROM TREASURY SURVEY OF OWNERSHIP OF UNITED STATES GOVERNMENT SECURITIES *Marketable and Convertible Direct Public Securities
[Par values in millions of dollars]
End of month
Type of security:Total marketable
and convertible:1950—Dec1951—June
Dec.....'.1952—June
Dec. . . .
1953—JanFeb
Treasury bills:1950—Dec1951—June
Dec1952—June
Dec
1953—JanFeb
Certificates:1950—Dec1951—June
Dec1952—June
Dec
1953—JanFeb
Treasury notes:1950—Dec1951—June
Dec1952—June
Dec
1953—JanFeb
M arketable bonds:8
1950—Dec1951—June
Dec1952—June
Dec
1953—JanFeb
Totalout-
stand-ing
152,450151 490154,745153,502161,081
161,065160,929
13,62713,61418,10217,21921,713
21,70921,710
5,3739,509
29,07828,42316,712
16,71215,958
39,25835,80618,40918,96330,266
30,27530,282
94,19378,98977,09775,80279,890
79,87780,495
U.S.Govt.agen-ciesand
trustfunds
5,3646,1776,2516,4476,613
6,7656,740
3526504186
206167
(2)17496027
2723
101432
16
18IS
5,3193,2153,2432,9083,046
3,0773,093
Fed-eralRe-
serveBanks
20,77822,98223,80122,90624,697
23,94423,875
1,296527596381
1,341
652584
2,3343,194
12,79311,8215,061
4,9964,996
12,52712,4395,0685,568
13,774
13,77413,774
4,6204,1084,1304,4224,522
4,5224,522
Com-mer-cial
banks1
54,88451 67154,30254,03855,828
55,08854,254
3,8883,7506,7735,8287,047
6,5385,831
1,5442,7536,7736,8774,791
4,7994,414
15,83313,70410,46510,43110,955
10,94510,866
33,62031,29830,11930,71032,849
32,62132,959
Mu-tualsav-
banks
10,1439 5049,1238,8438,740
8,8188,843
3312271
103137
156168
73741
12037
68101
136120674249
5153
9,9677,9747,6977,2217,165
7,1977,181
Insurancecompanies
Life
12,73711,13810,2899,6139,514
9,5929,567
391756428504464
483472
1113217
7656
6263
165208
158
65
12,1807,1396,7205,8555,807
5,8615,848
Other
4,1164,1614,3014,2464,711
4,7504,740
8372
10492
119
128117
52174445378317
317314
542478315327486
498497
3,4383,1253,1203,0873,429
3,4483,453
Other
44,42845 85546,67947,41150,979
52,10852,909
7,9018,360
10,08010,26812,518
13,54614,371
1,4343,2218,7619,0926,424
6,4456,049
10,0448,8412,4892,5874,978
4,9845,069
25,04922,12922,06821,60023,072
23,15123,439
End of month
Type of security:Convertible bonds
(InvestmentSeries B):1950—Dec1951—June
Dec1952—June
Dec
1953—JanFeb
Marketable secu-rities, due orcallable:
Within 1 year:1950—Dec1951—June
Dec1952—June
Dec
1953—JanFeb
1-5 years:1950—Dec1951—June
Dec1952—June
Dec
1953—JanFeb
5-10 years:1950—Dec1951—June
Dec1952—June
Dec
1953—JanFeb
After 10 years:1950— Dec1951—June
Dec1952—June
Dec
1953—JanFeb
Totalout-
stand-ing
^ 5 7 312,06013,09512,500
12,49112,484
58,01360,86072,79070,94474,261
74,24773,494
33,37831,02228,67829,43430,196
30,20530,212
17,41116,01211,20613,32117,564
17,56418,184
43,64830,02330,01226,70726,560
26,55726,556
U.S.Govt.agen-ciesandtrustfunds
2^9052,9053,4373,438
3,4383,439
81129155146163
283242
189139155130123
12581
412376309524629
637664
4,6822,6292,7262,2112,259
2,2822,314
Fed-eralRe-
serveBanks
" 2 J 1 41,214
714
16,00313,96215,05713,82215,613
14,86014,792
1,2853,8785,1025,9416,655
6,6556,655
9821,0321,0141,0701,070
1,0701,070
2,5081,3971,4151,3581,358
1,3581,358
Com-mer-cial
banks1
" l66172191185
185184
20,08821,59630,34829,54028,853
28,08426,898
24,53420,85318,60018,35217,822
17,83917,807
7,3296,2752,4423,2746,426
6,4516,845
2,9342,7812,7402,6812,543
2,5292,520
Mu-tualsav-ingsbanks
1,2521,2461,3561,352
1,3461,340
270626532550490
583641
568227142138133
135129
2,1252,0101,9252,0922,052
2,0352,021
7,1805,3895,2764,7074,713
4,7184,713
Insuran cecompani ef
Life
2,9212,9233,1723,179
3,1803,180
6551,206
778638577
615604
398113119123120
121121
906842712
1,0901,127
1,1281,127
10,7786,0565,7584,5894,510
4,5494,536
Other
312318362360
360360
799954
1,2031,1061,204
1,2201,208
744643566567653
669664
1,0421,017
9451,0891,342
1,3481,355
,5311,236,269
1,1221,152
1,154L,151
Other
3,3043,2813,8643,987
3,9833,981
20,11722,38924,71825,14327,361
28,60229,109
5,6615,1683,9934,1834,690
4,6614,753
4,6154,4603,8594,1834,918
4,8955,102
14,03510,53410,82810,03810,024
9,9689,964
* Commercial banks, mutual savings banks, and insurance companies included in the survey account for over 90 per cent of total holdingsby these institutions. Data are complete for Federal agencies and trust funds and Federal Reserve Banks. Figures in column headed "other"are residuals. 1 Includes stock savings banks. 2Less than $500,000.
3 Includes Treasury bonds and minor amounts of Panama Canal and Postal Savings bonds.
MAY 1953 507
Digitized for FRASER http://fraser.stlouisfed.org/ Federal Reserve Bank of St. Louis

NEW SECURITY ISSUES1
[Estimates. In millions of dollars]
Year ormonth Total
Gross proceeds, all issuers2
Noncorporate
U.S.Govern-ment3
Fed-eral
agency4
Stateandmu-nici-pal
Other
Corporate
Total
Bonds
TotalPub-licly
offered
Pri-vatelyplaced
Pre-ferredstock
Com-monstock
Proposed uses of net proceeds,all corporate issuers6
New capital
Total Newmoney7
Mis-cel-
lane-ouspur-poses
Re-tire-ment
ofbankdebt,e t c 8
Re-tire-ment
ofsecur-ities
193819391940
19411942194319441945
19461947194819491950
19511952
1952—Mar..Apr.. .May.June.July..Aug..Sept..Oct..Nov..Dec.
1953—Jan..Feb..Mar..
5,9265,6876,564
15,15735,43844,51856,31054,712
18,68519,94120,25021,11019,893
21,265'26,961
'1,664'2,275'2,527'2,436'6,436'1,168'1,331'2,047'1,108'2,079
'1,783'1,5921,604
2,4802,3322,517
11,46633,84642,81552,42447,353
10,21710,58910,32711,8049,687
9,778r12,577
515722928978
4,898544444531480547
611494503
11513
109
38121
506
357
21630
110459
228
30
1,1081,1281,238
956524435661795
1,1572,3242,6902,9073,532
3,1894,105
145397396624226201428294219389
'392'390405
695024
305
972247
56451156132282
446'237
'19'2154'3824
66254
'86'2
2,1552,1642,677
2,6671,0621,1703,2026,011
6,9006,5777,0786,0526,361
7,741'9,582
'985'907
'1,149'831
'1,304'421'455
'1,157'384'908
'664'706696
2,0441,9792,386
2,389917990
2,6704,855
4,8815,0355,9734,8904,920
5,691'7.649
'764'712'898'635
'1,113'342'372'980'314'731
'497'53651
1,3531,2761,628
1,578506621
1,8923,851
3,0192,8882,9632,4352,360
2,364'3,645
419398544211'786125'159'400126'140
186307153
691703758
811411369778
1,004
1,8622,1473,0102,4552,560
3,326'4,005
'344'314'354'425'327'217'213'581'188'591
'310'229364
8698183
167112124369758
,126761492424631
838'564
'60'59'8584332937'6
'20'58
'51'4762
2587108
1103456163397
891778614736811
1,2121,369
161'137'166112'158'49'46'170'49'119
116123116
903420762
1,040647408753
1,347
3,8895,1156,6515,5584,990
7,120'8,769
'951'870'990'769
'1,237'291'390
'1,052'340'851
'634'66667:
681325569
868474308657
1,080
3,2794,5915,9294,6064,006
6,531'8,223
'922'786'947'735
'1,218'276'367'893'293'780
'603'635630
72619
28352747133
231168234315364
226'174
'21'15'3'4
'10'9'1211'34'43
'6'817
21569174
1441387349134
379356488637620
363'371
'7'68'40'30'10
5'11
'148'13'28
'25'2324
1,2061,6951,854
1,583396789
2,3894,555
2,8681,352
307401
1.271
486'660
'17'21
'139'49'48
'123'57'89'38'46
'21'2812
Year ormonth
Proposed uses of net proceeds, by major groups of corporate issuers
Manufacturing
Totalnet
pro-ceeds
Newcap-ital9
Retire-ments w
Commercial andmiscellaneous
Totalnet
pro-ceeds
New
ital»Retire-ments10
Transportation
Totalnetpro-
ceeds
Newcap-ital"
Retire-ments 10
Public utility
Total
pro-ceeds
Newcap-ital*
Retire-ments 10
Communication
Totalnet
pro-ceeds
New
itsf»Retire-ments 10
Real estateand financial
Totalnet
pro-ceeds
Newcap-ital '
Retire-ments i°
19481949195019511952'
1952—MarchAprilMayJuneJulyAugust... .September.October...November.December.
1953—January...February..March. . . .
2,1801,3911,1753,0664,022
'387'283'631'271'354'127'183'645'164'327
'283148203
2,1261,3471,0262,8463,765
'381'268'581'264'336'93
'136'630'147
'276144194
5444149221257
'5'16'50'7
'18'34'47'15'18'18
'7'39
403338538518536
'54'74'234451'35'16'30'21149
'24'9231
310474462512
'45'71'2244'49'33'14'29'21
'148
'24'8930
748795806490
'99167'16758'82112'39'3045
'115
51'5181
691784609437758
'99167'9923'8227
32
5611
19653
225
35
"851212'23
1418
2,1502,2762,6082.4122 ,'626
'403'259'238'345'233'107'165'347'43
'216
'245'257212
2,0052,0431,9272.3262,539
'401'259'228'343'231'106'165'280'43
'213
'245'254210
144
68285
67
891567395605753
'5'492629
493'21'16'27'48'34
' '47
15
890517314600747
'5'4726
'28493'21'162647
'33
'47
15
587593739515508
20'59'45'72'72'12'27'61'56'56
'47'140142
557558639449448
'19'5835
'68'47'11'20'58'50'55
'47'140141
3035
1006660
'1'10
'4'25
'1'7'3'71
' Revised.1 Estimates of new issues sold for cash in the United States.2Gross proceeds are derived by multiplying p rincipal amounts or number of units by offering price.3 Includes issues guaranteed. * Issues not guaranteed.5Includes foreign government; International Bank; and domestic eleemosynary and other nonprofit.6Estimated net proceeds are equal to estimated gross proceeds less cost of flotation, i. e., compensation to underwriters, agents, etc., and
expenses.7 Includes proceeds for plant andrequipment and working capital.8 Includes proceeds for the retirement of mortgages and bank debt with original maturities of more than one year. Proceeds for retirement
of short-term bank debt are included under the uses for which the bank debt was incurred.9 Includes all issues other than those for retirement of securities.
10Retirement of securities only.Source.—Securities and Exchange Commission.
508 FEDERAL RESERVE BULLETIN
Digitized for FRASER http://fraser.stlouisfed.org/ Federal Reserve Bank of St. Louis
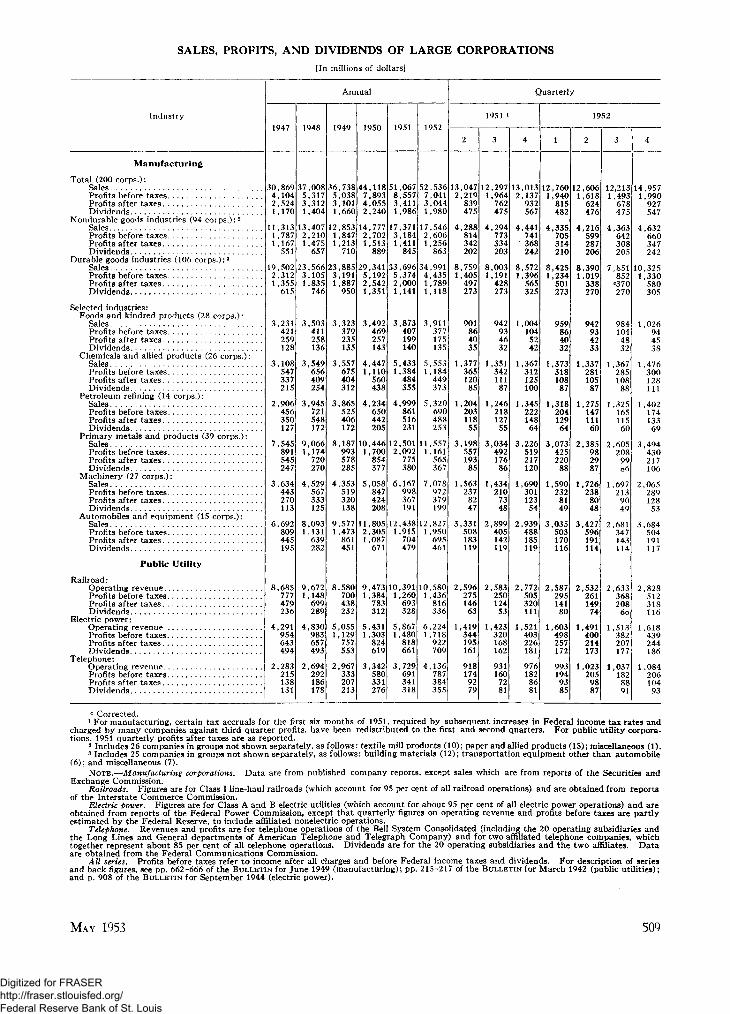
SALES, PROFITS, AND DIVIDENDS OF LARGE CORPORATIONS[In millions of dollars]
Industry
Manufactur ing
Total (200 corps.):SalesProfits before taxes . .Profits after taxesDividends
Nondurable goods industries (94 corps.):2
SalesProfits before taxesProfits after taxesDividends
Durable goods industries (106 corps.):3
SalesProfits before taxesProfits after taxes . . . .Dividends
Selected industries:Foods and kindred products (28 corps.):
SalesProfits before taxes .Profits after taxesDividends
Chemicals and allied products (26 corps.):SalesProfits before taxesProfits after taxesDividends
Petroleum refining (14 corps.):SalesProfits before taxes . . .Profits after taxesDividends . . . . .
Primary metals and products (39 corps.):SalesProfits before taxes . .Profits after taxesDividends . . . . .
Machinery (27 corps.):SalesProfits before taxesProfits after taxesDividends . .
Automobiles and equipment (15 corps.):SalesProfits before taxesProfits after taxes . . .Dividends
Public Utility
Railroad:Operating revenueProfits before taxes .Profits after taxesDividends
Electric power:Operating revenueProfits before taxesProfits after taxes . . .Dividends
Telephone:Operating revenue . . . . .Profits before taxes .Profits after taxesDividends .
Annual
1947
30,8694,1042,5241,170
11,3131,7871,167
551
19,5022.3121,355
615
3 231421259128
3,108547337215
2,906456350127
7,545891545247
3,634443270113
6,692809445195
8,685777479236
4,291954643494
2,283215138131
1948
37,0085,3173,3121,404
13,4072,2101,475
657
23,5663,1051,835
746
3,503411258136
3,549656409254
3,945721548172
9,0661,174
720270
4,529567333125
8,0931,131
639282
9,6721,148
699289
4,830983657493
2,694292186178
1949
36,7385,0383,1011,660
12,8531,8471,213
710
23,8853,1911,887
950
3,323379235135
3,557675404312
3,865525406172
8,187993578285
4,353519320138
9,5771,473
861451
8,580700438252
5,0551,129
757553
2,967333207213
1950
44,1187,8934,0552,240
14,7772,7021,513
889
29,3415,1922,5421,351
3,492469257143
4,4471,110
560438
4,234650442205
10,4461,700
854377
5,058847424208
11,8052,3051,087
671
9,4731,384
783312
5,4311,303
824619
3,342580331276
1951
51,0678,5573,4111,986
17,3713,1841,411
845
33,6965,3742,0001,141
3,873407199140
5,4331,384
484355
4,999861516231
12,5012,092
775380
6,167998367191
12,4381,915
704479
10,3911,260
693328
5,8671,480
818661
3,729691341318
1952
52,5367,0413,0441,980
17,5462,6061,256
863
34,9914,4351,7891,118
3,911377175135
5,5531,184
449373
5,320690488253
11,5571 ,161
565367
7,078972379199
12,8271 ,950
695461
10,5801,436
816336
6,2241,718
922709
4,136787384355
Quarterly
1951 i
2
13,0472,210
839475
4,288814342202
8,7591,405
497273
901864035
1,37736512085
1,20420311855
3,198557193
85
1,563237
8247
3,331508183119
2,59627514663
1,419344195161
9181749279
3
12,2971,964
762475
4,294773334203
8,0031,191
428273
942934632
1,35134211187
1,24621812755
3,034492176
86
1,434210
7348
2,899405142119
2,58325012453
1,423320168162
931160
7281
4
13,0132,137
932567
4,441741368242
8,5721,396
565325
1,004104
5242
1,367312125100
1,34522214864
3,226519217120
1,690301123
54
2,939488185119
2,772505320111
1,521403226181
976182
8681
1952
12,7601 940
815482
4 335705314210
8,4251,234
501273
959864032
1,37331810887
1 31820412964
3 073425220
88
1,5902328149
3,035503170116
2,58729514180
1,603498257172
9931949385
2
12,6061 618
624476
4 216599287206
8,3901,019
338270
942934233
1,33728110587
1 27*514711160
2 385982987
1,726238
8048
3,427596191114
2,53226114974
1 491400214173
1,023205
9887
3
12,2131 493
678475
4 363642308205
7 851852
«37O270
9841044832
1 367285108
88
1 325165115
60
2 605208
990 6
1 697213
9049
2,681347143114
2,633368208
6o
1 513382207177
1 037182
8891
4
14,9571 990
927547
4 632660347242
10 3251,330
580305
1,026944S38
1 476300128111
1 40217413369
3 494430217106
2 06 S289128
53
3,684504191117
2,828512318116
1 618439244186
1 084206104
93
c Corrected.1 For manufacturing, certain tax accruals for the first six months of 1951, required by subsequent increases in Federal income tax rates and
charged by many companies against third quarter profits, have been redistributed to the first and second quarters. For public utility corpora-tions, 1951 quarterly profits after taxes are as reported.
2 Includes 26 companies in groups not shown separately, as follows: textile mill products (10); paper and allied products (15); miscellaneous (1).3 Includes 25 companies in groups not shown separately, as follows: building materials (12); transportation equipment other than automobile
(6); and miscellaneous (7).NOTE.—Manufacturing corporations. Data are from published company reports, except sales which are from reports of the Securities and
Exchange Commission.Railroads. Figures are for Class I line-haul railroads (which account for 95 per cent of all railroad operations) and are obtained from reports
of the Interstate Commerce Commission.Electric power. Figures are for Class A and B electric utilities (which account for about 95 per cent of all electric power operations) and are
obtained from reports of the Federal Power Commission, except that quarterly figures on operating revenue and profits before taxes are partlyestimated by the Federal Reserve, to include affiliated nonelectric operations.
Telephone. Revenues and profits are for telephone operations of the Bell System Consolidated (including the 20 operating subsidiaries andthe Long Lines and General departments of American Telephone and Telegraph Company) and for two affiliated telephone companies, whichtogether represent about 85 per cent of all telephone operations. Dividends are for the 20 operating subsidiaries and the two affiliates. Dataare obtained from the Federal Communications Commission.
All series. Profits before taxes refer to income after all charges and before Federal income taxes and dividends. For description of seriesand back figures, see pp. 662-666 of the BULLETIN for June 1949 (manufacturing); pp. 215-217 of the BULLETIN for March 1942 (public utilities);and p. 908 of the BULLETIN for September 1944 (electric power).
MAY 1953 509
Digitized for FRASER http://fraser.stlouisfed.org/ Federal Reserve Bank of St. Louis

PROFITS, TAXES, AND DIVIDENDS OFUNITED STATES CORPORATIONS
[Quarterly estimates at seasonally adjustedrates. In billions of dollars]
Year orquarter
1939
19411942194319441945
19461947194819491950
19511952
1951—34
1952—1234
1953—1 i . . .
Profitsbeforetaxes
6.5
17.221.125.124.319.7
23.530.533.827.139.6
42.939.7
38.639.5
42.738.237.240.3
42.8
In-cometaxes
1.5
7.811.714.413.511.2
9.611.913.010.818.4
24.2'21.8
21.822.2
'23.4'21.0'20.4'22.1
24.4
Profitsaftertaxes
5.0
9.49.4
10.610.88.5
13.918.520.716.321.2
18.7'17.9
16.917.3
'19.3'17.2'16.8'18.2
18.4
Cashdivi-dends
3.8
4.54.34.54.74.7
5.86.67.37.59.0
9.09.1
9.29.3
8.99.69.39.0
'9.1
annual
Undis-tributedprofits
1.2
4.95.16.26.13.8
8.112.013.58.8
12.3
9.6'8.8
7.78.0
'10.4'7.6'7.5'9.2
'9.3
' Revised.i Preliminary estimates by the Office of the Economic
Adviser to the President.Source.—Department of Commerce.
NET CHANGE IN OUTSTANDING CORPORATE SECURITIES »[Estimates, in millions of dollars]
Year orquarter
1939
19411942194319441945
19461947194819491950
1951'1952
1951—3'...4 ' . . .
1952—1....2 . . . .3 . . . .4 . . . .
All types
Newissues
2,182
2,7931,1511,3333,4246,457
7,1806,8827,5706,7327,224
9,04810,974
1,7532,486
2,4383,0872,4592,990
Retire-ments
2,721
2,8171,4642,1293,8996,846
4,7982,5231,6841,8753,500
2,7722,646
642533
558602716770
Netchange
-539
-24-313-796-475-389
2,3824,3595,8864,8563,724
6,2778,328
1,1101,951
1,8802,4851,7432,220
Bonds and notes
New-issues
1,939
2,391929996
2,6934,924
4,7215,0155,9384,8674,806
5,6837,598
1,0661,449
1,6402,1831,8221,953
Retire-ments
2,550
2,5161,3271,8003,3915,995
3,6252,0111,2841,5832,802
2,1072,293
478405
489513611680
Netchange
-611
-125—398-804-698
-1,071
1,0963,0044,6543,2842,004
3,577'5,304
5871,045
1,1511,6701,2111,272
Stocks
Newissues
243
402222337731
1,533
2,4591,8671,6321,8652,418
3,3653,377
6871,037
798904637
1,038
Retire-ments
171
301137329508851
1,173512400292698
665353
164128
6989
10590
Netchange
72
10185
8223682
L.2861,355L.2321,572L.72O
2,7013,024
522908
729815532948
' Revised.1 Reflects cash transactions only. As compared with data shown on p. 508, new
issues exclude foreign and include investment company offerings, sales of securitiesheld by affiliated companies or RFC, special offerings to employees, and also newstock issues and cash proceeds connected with conversions of bonds into stocks. Re-tirements include the same types of issues, and also securities retired with internalfunds or with proceeds of issues for that purpose shown on p. 508.
Source.—Securities and Exchange Commission.
CURRENT ASSETS AND LIABILITIES OF UNITED STATES CORPORATIONS *[Estimates, in billions of dollars]
End of yearor quarter
1939
19411942194319441945
19461947194819491950.
1951—3.. .4
1952—1234
Networkingcapital
24 5
32.336 342 145 651 6
56.262 168 672.478 4
82 882.5
83.284.585.386.5
Current assets
Total
54 5
72.983 693 897 297 4
108.1123 6133 0133.1156 1
170 3174.4
173.9171.9177.7183.4
Cash
10 8
13.917 621.621 621.7
22.825.025 326 527 4
28 229.6
28.229.529.931.0
U. S. Gov-ernmentsecurities
2 2
4.010 116.420 921.1
15.314.114 816.820 5
21 021.3
20.719.720.221.0
Notes andaccounts
receivableJ
22.1
28.027.326.926.525.9
30.738.342.443.053 9
57.758.8
59.359.163.466.4
Inven-tories
18.0
25.627.327.626.826.3
37.644.648.945.352.6
61.362.6
63.561.561.962.7
Other
1.4
1.41.31.31.42 . 4
1.71.61.61.41.7
2 . 12.1
2.22.12.32.3
Current liabilities
Total
30.0
40.747.351.651.745.8
51.961.564.460.777.787.591.990.787.492.596.9
Notes andaccountspayable *
21.9
26.426 026.326 825.7
31.637.639.437.547.2
52.555.455.353.957.461.4
Federalincome taxliabilities
1.2
7.112.616.615.510.48.5
10.711.59.3
14.8
18.119.717.915.816.216.8
Other
6 . 9
7.28.78 .79 . 49 . 7
11.813.213.514.015.7
16.816.7
17.417.818.918.7
1 Excludes banks and insurance companies.2 Includes amounts due to the U. S. Government.
2 Includes amounts due from the U. S. Government.Source.—Securities and Exchange Commission.
BUSINESS EXPENDITURES ON NEW PLANT AND EQUIPMENT *[Estimates, in millions of dollars]
Year
19391945194619471948 .. .1949195019511952
1953 4
Total
5,5128,692
14,84820 61222,05919,28520,60525,64426 455
26,991
Manu-factur-
ing
1,9433,9836,7908 7039,1347,1497,491
10,85211 994
12,039
Min-ing
326383427691882792707929880
910
Rail-roads
280548583889
1,3191,3521,1111,4741 391
1,294
Trans-pora-tion
otherthanrail
365574923
1 2981 285
8871,2121,4901 363
1,380
Publicutili-ties
520505792
1 5392,5433,1253,3093,6643 838
4,368
Com-muni-
cations
302321817
1,3991,7421,3201,1041,3191,598
Other 2
1,7762,3784,5166,0935,1544,6605,6715,9165,391
7,000
Quarter
1951—34 .
1952—1234
1953—I4
2*
Total
6,5057,173
6,1416,8086,2447,265
6,5416,968
Manu-factur-
ingandmin-ing
2,9793,466
2,8673,3843,0263,596
3,2363,376
Trans-porta-tionincl.rail-
roads
729778
716758591692
639711
Publicutili-ties
9831,055
821928947
1,142
1,0301,199
Allother?
1,8141,874
1,7371,7381,6801,835
1,6361,682
1 Corporate and noncorporate business, excluding agriculture. 2 Includes trade, service, finance, and construction.3 Includes communications, trade, and other. * Anticipated by business.Source.—Department of Commerce and Securities and Exchange Commission.
510 FEDERAL RESERVE BULLETIN
Digitized for FRASER http://fraser.stlouisfed.org/ Federal Reserve Bank of St. Louis

REAL ESTATE CREDIT STATISTICSMORTGAGE DEBT OUTSTANDING, BY TYPE OF PROPERTY MORTGAGED AND TYPE OF MORTGAGE HOLDER
[In billions of dollars]
End of yearor quarter
193919401941 . . .19421943194419451946194719481949195019511952P1951—March
JuneSeptember. . . .December. . . .
1952—March PTunep
September?. . .DecemberP. . .
All properties
Allhold-ers
35 536.537 636.735 334.735 541.648 756.062 572 581.990 675.077.879.981.983 785 988.390.6
Finan-cial
insti-tutions
18 619.520 720.720 220.221 026.031 837.842 951 659.566 953.756.057.859.561 063.065.166.9
Otherholders
SelectedFederalagen-cies
2 . 22 . 12 01.81 41.1
9.65
.61 l1.42 . 02 41.61.71.82.02 22 . 22.32.4
Indi-viduals
andothers
14.714.814.914.213.613.313.615.016.417.618 619.520.421 .219.820.220.320.420.520.820.921.2
Nonfarm
Allhold-ers
28.930.031.230.829.929.730.836.943.950.957 166.775.683.869.171.673.675.677.379.381.683.8
1- to 4-family houses
Total
16.317.318.418.217.817.918.523.128.233.337.545.151.958.246.848.650.351.953.254.856.558.2
Finan-cial
insti-tutions
9 . 310.211.211.511.511.712.216.020.525.028.435.341.246.836.838.439.941.242.343.845.446.8
Otherhold-ers
7 .07.17.2
.6.76 . 36.26.47.07.68 .39 .19 . 8
10.711.310.110.310.510.710 911.011.111.3
Multi-family andcommercial properties 1
Total
12.512.612.912.512.111.812.213.815.717.619 621.623.725.622.223.023.323.724 124.625.125.6
Finan-cial
insti-tutions
7 .87 .88 . 07 .87 . 47.27.58.49 6
10.912 414.015.717.314.515.115.415.716 016.416.917.3
Otherhold-
ers
4 84 . 84 84 . 74 64.64 75.46 16 .77 27 .68 .08 37.77.97.98.08 18 18.28.3
Farm
Allhold-ers
6 66 . 56 46.05 44.94 74.84 95 15 45 86 . 36 86.06.26.36.36 46 66.76.8
Finan-cial
insti-tutions
1 5ss4
i.3
L.579
2 12 32 . 62 82.42.52.62.62 62 72.82.8
Otherholders1
5 15 04 94 54 13.63 43.33 13 23 33 53 . 74 03.53 73.73.73 83 93.94.0
P Preliminary.1 Derived figures, which include negligible amount of farm loans held by savings and loan associations.2 Derived figures, which include debt held by Federal land banks and Farmers Home Administration.NOTE.—Figures for first three quarters of each year, and all figures for December 1952 except those on 1- to 4-family houses and total farm
(preliminary estimates from HLBB and Dept. of Agriculture, respectively), are Federal Reserve estimates. Financial institutions include com-mercial banks (including nondeposit trust companies but not trust departments), mutual savings banks, life insurance companies, and savings andloan associations. Federal agencies include IIOLC, FNMA, and VA (the bulk of the amounts through 1948 held by HOLC, since then by FNMA).Other Federal agencies (amounts small and separate data not readily available currently) are included with "Individuals and others."
Sources.—Federal Deposit Insurance Corporation, Home Loan Bank Board, Institute of Life Insurance, Departments of Agriculture andCommerce, Federal National Mortgage Association, Veterans Administration, Comptroller of the Currency, and Federal Reserve.
MORTGAGE LOANS HELD BY BANKS *[In millions of dollars]
193919401941.19421943.1944.19451946.194719481949.19501951.1952
End of yearor quarter
1951—MarchTiinf
SfntPTnhprDecember
1952—March .JunevSeptemberDecember
Total
4,2664,5784,9064,7464,5214,4304,7727,2349,446
10,89711,64413,66414,73215 867
13,94514 28614,54014,732
14,86015,17615,59015,867
Total
3,6974,0034,3404,2564,0583,9674,2516,5338,623
10,02310,73612,69513,72814,809
12,94513 25513,50013,728
13,83014,11314,53014,809
Commercial bank holdings2
Total
2,6712,9633,2923,3323,2563,2183,3955,1466,9338,0668,676
10,43111,27012,188
10,62510 90411,10011,270
11,35011,60211,97012,188
Nonfarm
Residential3
FHA-in-
sured
3,4213,675
3,421
3,4323,4413,5803,675
VA-guar-
anteed
2,9213,012
2,921
2,9282,9523,0003,012
Con-ven-
tional
45
4
4555
,979501
,929
,990,209,390,501
Other
111
1112727
2222
2222
076040
,0489748077498S6
,387,690957
,060764
,458671
,320
400,458
,480,512,560,621
Farm
11
1111
1111
569S7S566491463463
702873874909968
,0040S8
,0000S1040
,004
,030,063060
,058
Total
4444444445689
11
8999
10101011
8S6859
,812677
,470,305908
,441856806
,705761
,916379
,650VW51S
,916
,203,554, 940,379
Total
4,8074,8294,7844,6014,3954,2814,1844,4154,8285,7736,6688,2189,869
11,306
8,6059,0919,4689,869
10,15610,50610,88011,306
Mutual savings bank holdings
Nonfarm
Residential3
Total
3,8753,9143,8843,7253,5583,4763,3873,5883,9374,7585,5697,0548,5959,875
7,4007,8338,2008,595
8,8439,1459,4859,875
FHA-in-
sured
2,5673,168
2,567
2,7202,8983,0253,168
VA-guar-
anteed
1,7262,237
1,726
1,8151,9172,0692,237
Con-ven-
tional
4,3034,470
4,303
4,3084,3304,3924,470
4
Other
\1111
1\11
1111
932915900876837805797827891015
,099,164774
,431
,205258268
,274
,313,361,394,431
Farm
2930282625242426283437444773
45464747
47486073
1 Includes all banks in the United States and possessions.2 Includes loans held by nondeposit trust companies but excludes holdings of trust departments of commercial banks. March and September
figures, and also December 1952, are Federal Reserve estimates based on data from Member Bank Call Report and from weekly reporting memberbanks. For 1940, figures except for the grand total are Federal Reserve estimates based on data for insured commercial banks.
3 Data not available for all classifications prior to December 1951.4 Through 1946, figures except for the grand total are estimates based on Federal Reserve preliminary tabulation of a revised series of banking
statistics. March and September figures, and also December 1952, are Federal Reserve estimates based in part on data from National Associationof Mutual Savings Banks.
Sources.—All bank series prepared by Federal Deposit Insurance Corporation from data supplied by Federal and State bank supervisoryagencies; Comptroller of the Currency; and Federal Reserve.
MAY 1953 511
Digitized for FRASER http://fraser.stlouisfed.org/ Federal Reserve Bank of St. Louis

REAL ESTATE CREDIT STATISTICS—ContinuedMORTGAGE ACTIVITY OF ALL UNITED STATES LIFE INSURANCE COMPANIES
[In millions of dollars]
Year or month
193919401941194219431944194519461947 . . . .19481949195019511952P . . . . . .
1952—MarchAprilMayJuneJulyAugustSeptemberOctoberNovemberDecember
1953—January . . . .FebruaryMarch?
Loans acquired
Total
898855935976
1,6612,7863,4073,4304,9805,1113,975
328326301344353307303364288390
347327403
Nonfarm
Total
1,4832,5203,1143,1234,6214,7043,600
286292270316325285280337260352
309289353
FHA-insured
4511,2021,3501,5721,051
850
75666380696679796586
787584
VA-guar-anteed
600366131930
1,268450
40453432342912302231
282427
Other
1,4691,5461,6422,1192,3852,300
171181173204222190189228173235
203190242
Farm
178266293307359407375
42343128282223272838
383850
Loans outstanding (end of period)
Total
5,6695 9586,4426 7266,714'6,6866 6367,1558,675
10,83312,90616,10219,31421,275
19,87020,00820,17520,33520,50520,64320,80120,96121,08721,245
21,39621,54721,725
Nonfarm
Total
4,7825 0615,5295 8305,8735,8865,8606,3607,7809,843
11,76814,77517,78719,600
18,30618,42518,57418,71618,87018,99819,14719,29819,41119,560
19,70119,83419.992
FHA-insured
668815
1 0961,2861,4081 3941,2281,3982,3813,4544,5735,2575,700
5,3775,4025,4295,4765,5175,5425,5925,6265,6485,690
5,7255,7515,729
VA-guar-anteed
256844
1,1061,2242,0263,1313,350
3,2453,2723,2903,3043,3213,3343,3263,3333,3403,349
3,3583,3673,445
Other
4,8765,5386,3567,0908,1769,399
10,550
9,6849,7519,8559,936
10,03210,12210,22910,33910,42310,521
10,61810.71610,818
Farm
887897913896841800776795895990
1,1381,3271,5271,675
1,5641,5831,6011,6191,6351,6451,6541,6631,6761,685
1,6951,7131 ,733
p Preliminary.NOTE.—For loans acquired, monthly figures may not add to annual totals, and for loans outstanding, end-of-December figures may differ
from end-of-year figures, because monthly figures represent book value of ledger assets whereas year-end figures represent annual statement assetvalues, and because year-end adjustments are based on more nearly complete data. Prior to 1947, complete data are not available for all classi-fications shown.
Sources.—Institute of Life Insurance—end-of-year figures, Life Insurance Fact Book; end-of-month figures, the Tally of Life Insurance Statisticsand Life Insurance News Data.
MORTGAGE ACTIVITY OF ALL SAVINGS AND LOANASSOCIATIONS[In millions of dollars]
NONFARM MORTGAGE RECORDINGS OF $20,000 OR LESS
[Number in thousands; amounts (except averages) in millions of dollars]
Year ormonth
19391940194119421943194419451946194719481949195019511952
1952-Mar..Apr...May..June.,July..Aug...Sept..Oct...Nov..D e c .
1953-Jan...Feb...Mar..
Loans made, by purpose
Total
9861,2001,3791,0511,1841,4541,9133,5843,8113,6073,6365,2375,2506,617
514549586587596617616659523541
497523639
Newcon-
struc-tion
30139943719010695181616894
1,0461,0831,7671,6572,105
172183198192190200193208163161
147164206
Homepur-chase
340426581574802
1,0641,3582,3572,1281,7101,5592,2462,3572,955
214239252257265279285303243248
222222266
Otherpur-
poses l
345375361287276295374611789851994
1,2241,2361,557
128127136138141138138148117132
128137167
Loans outstanding (end of period)2
Total i
3,8064,1254,5784,5834,5844,8005,3767,1418,856
10,30511,61613,62215,52018,444
16,073
16,891
17̂ 740
18,444
19,105
FHA-in-
sured
563717841864906
874
887
906
924
VA-guar-
anteed
2,3972,5862,9693,1253,398
3,162
3,228
3,341
3,398
3,492
Con-ven-
tional3
Yearor
month
7,3458,3139,812
11,530-14,140
12,037
12^776
13^501
'14,140
19401941194219431944194519461947
14,689
19481949195019511952
1952-Mar..Apr...May..June..July..Aug. .Sept..Oct...Nov..Dec..
1953-Jan...Feb...Mar..
Num-ber
1,2881,4561,6281,3511,2741,4461,6392,4972,5672,5352,4883,0322,8783,028
238250256256268270267285245252
228229264
Amount, by type of lender
Total
3,5074,0314,7323,9433,8614,6065,65010,58911,72911,88211,82816,17916,40518,018
1,3931,4821,5111,5131,5901,5981,5881,7271,4921,553
1,4011,3911,627
Sav-ings &loan
assns.
1,0581,2831,4901,1701,2371,5602,0173,4833,6503,6293,6465,0605,2956,452
494540557564586592593627526540
477503605
Insur-ancecom-
panies
287334404362280257250503847
1,0161,0461,6181,6151,420
118114114108113119118135116126
111110126
Com-mer-cial
banks
8911,0061,166886753878
1,0972,7123,0042,6642,4463,3653,3703,600
293303305317313316342298305
278269316
Mutual
ingsbanks
143170218166152165217548597745750
1,0641,0131,137
71819096105108103117104112
938492
Other
1,1281,2381,4541,3591,4391,7462,0693,3433,6313,8283,9405,0725,1125,409
427454447440469466458506448470
442425488
Aver-age
amountre-
corded(dol-lars)
2,7222,7692,9062,9183,0313,1863,4484,2414,5704,6884,7555,3355,7015,950
5,8605,9215,9075,9095,9375,9165,9436,0516,0856,171
6,1366,0686,153
' Revised.1 Includes loans for repair, additions and alterations, refinancing, etc.2 Prior to 1948, data are not available for classifications shown.8 Excludes shares pledged against mortgage loans.Source.—Home Loan Bank Board.
Source.—Home Loan Bank Board.
512 FEDERAL RESERVE BULLETIN
Digitized for FRASER http://fraser.stlouisfed.org/ Federal Reserve Bank of St. Louis

REAL ESTATE CREDIT STATISTICS—ContinuedGOVERNMENT-UNDERWRITTEN RESIDENTIAL LOANS
Yearor
month
1939194019411942 . . .1943194419451946194719481949 .195019511952
1952—Mar. . .Apr . . . .May. . .June.. .July. ..Aug.. . .Sept. . .Oct . . . .Nov. . .D e c . . .
1953—JanFeb., . .Mar. . .
Total
925991
1,1521,121
934877857
3,0585,0745,2225,2507,4166,834S 830
443487452469458463484526503519
539539504
Total
925991
1,1521,121
934877665756
1,7883,3413,8264,3433,2203,113
207242249273269260267306259293
296265276
[In
FHA-
millions of dollars]
insured
Homemortgages
Newprop-erties
486588728766553484257120477
1,4341,3191,6371,216
969
61616568808194
10897
108
108103103
Ex-istingprop-erties
208175183208210224217302418684892856713974
66697476858291
1038798
1038689
loans
Pro-ject-typemort-gages1
5213142185562013
360609
1,0211,157
584322
19493927313213261723
181520
Prop-ertyim-
prove-mentloans2
179216228126
86114171321534614594694707848
616471
102736669695963
676164
MADE
VA-guaranteed loans3
Total
1922,3023,2861,8811,4243,0733,6142,721
236244203196189203217220243227
243274228
Homemortgages
Newprop-erties
7931,8652,6671,824
164159128124126134142141157155
161184152
1 Monthly figures do not reflect mortgage amendments included in annual
Ex-istingprop-erties
6291,202
942890
72857470636875788571
829075
totals.
Alter-ationand
repair2
3566
.7
.5
.4
.5
.4
.5
.4
.7
.6
.5
.6
.56
2FHA-insured property improvement loans are not ordinarily secured by mortgages; VA-guaranteed alteration and repair loans of $1,000 or lev:or more than that amount must be.
3S need not be secured,3Prior to 1949, data are not available for classifications shown.NOTE.—FHA-insured loans repres snt gross amount of
whereas those
insurance written: VA-guar-anteed loans, gross amount of loans closed. Figures do not take account of principal repay-ments on previously insured or guaranteed loans. For VA-guaranteed loans, amounts bytype are derived from data on number and average amount of loans closed.
Sources.—Federal Housing Administration and Veterans Administration.
MORTGAGE DEBT OUTSTANDINGNONFARM
End ofyear orquarter
193919401941194219431944 . .19451946194719481949 . . .195019511952?
1951—Mar. . .June.. .Sep t . . .Dec
1952—Mar. P. .June*. .Sept.P. .Dec.P. .
cCorrected
1- TOON
4-FAMILY PROPERTIES[In billions of dollars]
Total
16 317.318.418.217.817.918.523 A28.233^337.545.151 958.2
46.948.750.451.9
53.254.856.558.2
Government-underwritten
Total
1.82 . 33.03.14.1
C4.3C6.1C9.312 5̂is!o18.922^925.4
20.021.022.022.9
23.524.024.725.4
P PreliminaryNOTE.—For total
FHA-in-
sured
1.82^33 . 03^74.14^24.1
3 85^36^98 .69.1
10.8
8 .99 .29 . 59 . 7
9 . 910.110.410.8
VA-guar-anteed
c 2C2 AC5 57.2
10^313 214^6
11.111.812.513.2
13.613.914.314.6
Con-ven-
tional
14.515 ]o15.414.513 713^7
C14.2C17 .0cjg 920.822.526.229 032^8
26.927.728.429.0
29.730.831.732.8
debt outstanding, figures forfirst three quarters are Federal Reserve estimates.For conventional, figures are derivec
Sources.—Home Loan Bank Board.ing Administration,Federal Reserve.
Veteran.
1.Federa I Hous-
3 Administration, and
FEDERAL NATIONAL MORTGAGE ASSOCIATION[In millions of dollars]
End of yearor month
19481949195019511952
1952—AprilMayJuneJulyAugustSeptember.. .OctoberNovember. . .December
1953—JanuaryFeb rua ry . . . .MarchApril
Author-ized
fundsun-
com-mitted
528848918661
1,085
1412*4111416
21,3111,2831,2381,1701,1291,085
1,0431,008
934876
Com-mit-
mentsun-dis-
bursed
227824485239323
255264266275299315326322323
321313322326
Mortgage holdings
Total
199828
1,3471,8502,242
2,0832,0752,0682,0642,0682,0972,1542,1992,242
2,2862,3292,3942,448
FHA-in-
sured
188403169204320
239236236237245257272297320
338358395429
VA-guar-
anteed
11425
1,1781,6461,922
1,8441,8391,8321,8271,8231,8401,8821,9021,922
1,9481,9711,9992,019
ACTIVITY
Mort-gagepur-
chases(duringperiod)
198672
1,044677538
39476
1340725665
61538168
Mort-gagesales
(duringperiod)
2046911156
24533463
14
10373
1 During the period from late March through early July, the bulk of these fundswas available only for the purchase of mortgages on defense, disaster, and militarylousing.
2Public Law 531, enacted July 14, 1952, authorized an additional 900 milliondollars for advance commitments to purchase mortgages on defense, disaster, andmilitary housing. Funds remaining from those set aside earlier for this purposethen became available for over-the-counter purchases of other mortgages.
Source.—Federal National Mortgage Association.
FEDERAL
Year or month
19411942194319441945 .194619471948..1949195019511952 .
1952—AprilMayJuneJulyAugustSeptember..OctoberNovember..December. .
1953—JanuaryFebruary. . .MarchApril
HOME LOAN BANK LENDING[In millions of dollars]
Ad-vances
15899
157239278329351360256675423586
2934835856566359
106
16143047
Repay-ments
140190176219213231209280337292433528
362421542528262033
197714632
Advances outstanding(end of period)
Total
219129110131195293436515433816806864
581591653656687715752791864
683627610626
Short-term1
1055469
106176184218257231547508565
353359409416436460491520565
439401391406
Long-term2
11576412519
109217258202269298299
229232244240251255261271300
245226219220
1 Secured or unsecured loans maturing in one year or less.2Secured loans, amortized quarterly, having maturities of
more than one year but not more than ten years.Source.—Home Loan Bank Board.
MAY 1953 513
Digitized for FRASER http://fraser.stlouisfed.org/ Federal Reserve Bank of St. Louis

STATISTICS ON SHORT- AND INTERMEDIATE-TERM CONSUMER CREDITCONSUMER CREDIT, BY MAJOR PARTS
[Estimated amounts outstanding, in millions of dollars]
End of yearor month
1939194019411942
19451946194719481949195019511952
1952—FebruaryMarchAprilMayJuneJulyAugustSeptemberOctoberNovemberDecember
1953—JanuaryFebruary PMarch?
Total
7,2228,3389,1725,983
5,6658,384
11,57014,41117,10420,81321,46825,705
20,64920,60920,94021,70522,44622,75123,03023,41424,05024,52525,705
25,50725,24625,675
Instalment credit
Total
4,5035,5146,0853,166
2,4624,1726,6958,968
11,51614,49014,83718,639
14,55514,55014,73115,30816,03216,46516,72817,04717,57217,92718,639
18,78518,86319,285
Automobilepaper1
1,4972,0712,458
742
455981
1 ,9243,0544,6996,3426,2428,110
6,1146,0906,1866,5396,9747,2007,2727,3887,6397,8668,110
8,2738,4708,783
Otherconsumer
goodspaper1
1,6201,8271,9291,195
8161,2902,1432,8423,4864,3374,2705,301
4,0804,0444,0534,1694,3244,4334,5394,6694,8714,9435,301
5,2565,1335,162
Repairand mod-ernization
loans2
298371376255
182405718843887
1,0061,0901.386
1,0781,0791,0981,1381,1781,2211,2581,3001,3471,3761,386
1,3781,3781,384
Personalloans
1,0881,2451,322
974
1,0091,4961,9102,2292,4442,8053,2353,842
3,2833,3373,3943,4623,5563,6113,6593,6903,7153,7423,842
3,8783,8823,956
Noninstalment credit
Total
2,7192,8243,0872,817
3,2034,2124,8755,4435,5886,3236,6317,066
6,0946,0596,2096,3976,4146,2866,3026,3676,4786,5987,066
6,7226,3836,390
Single-payment
loans
787800845713
7461,122L.356L.445t ,5321,8211,9342,108
L.9791,997',007>,O552,0542,0232,026',033',033',109>,108
2,1292,079>,142
Chargeaccounts
1,4141,4711,6451,444
1,6122,0762,3532,7132,6803,0063,0963,313
2,4902,4102,5352,6592,6612,5732,5792,6422,7762,8263,313
2,9562,6452,575
Servicecredit
518553597660
8451,0141,1661,2851,3761,4961,6011,645
1,6251,6521,6671,6831,6991,6901,6971,6921,6691,6631,645
1,6371,6591,673
P Preliminary.1 Includes all consumer instalment credit extended for the purpose of purchasing automobiles and other consumer goods and secured by the
items purchased, whether held by retail outlets or financial institutions. Includes credit on purchases by individuals of automobiles or otherconsumer goods that may be used in part for business.
2Includes only repair and modernization loans held by financial institutions; such loans held by retail outlets are included in "other consumergoods paper."
NOTE.—Monthly figures for the period December 1939 through 1952 and a general description of the series are shown on pp. 336-54 of theBULLETIN for April 1953; a detailed description of the methods used to derive the estimates may be obtained from Division of Research and Sta-tistics.
INSTALMENT CREDIT, BY HOLDER[Estimated amounts outstanding, in millions of dollars]
End of yearor month
Totalinstal-mentcredit
Financial institutions
TotalCom-
mercialbanks
Salesfinancecom-panies
Creditunions Other
Retail outlets
TotalDepart-
mentstores l
Furni-ture
stores
House-hold
appli-ance
stores
183196206111
173879
127168239207239
192185183186198206210218223225239
232231231
Auto-mobile
dealers2
123167188
53
2847
101159239284255336
247244247262282292295301313324336
343352364
Other
1939194019411942
19451946194719481949195019511952
1952—February.March....AprilMayJuneJulyAugust. . .SeptemberOctober. .NovemberDecember.
1953—January..FebruaryPMarchP . .
4,5035,5146,0853,166
2,4624,1726,6958,96811,51614,49014,83718,639
14,55514,55014,73115,30816,03216,46516,72817,04717,57217,92718,639
18,78518,86319,285
3,0653,9184,4802,176
1,7763,2355,2557,0929,24711,82012,07715,423
11,97612,00212,17712,67913,32413,72513,95014,20314,61414,95515,423
15,66515,87716,337
1,0791,4521,726862
7451,5672,6253,529
,4395,7985,7717,576
5,7695,8085,8996,1446,4586,6546,8076,9677,1897,3527,576
7,6967,8088,062
1,1971,5751,797588
300677
1,3551,9902,9503,7853,7694,833
3,6613,6233,6623,8534,1114,2634,2944,3624,5234,6704,833
4,9305,0315,174
132171198128
102151235334438590635815
637647661688717738759773789798815
818828860
657720759598
629840,040,239,420,647,902,199
,909,924,955,994
2,0382,0702,0902,1012,1132,1352,199
2,2212,2102,241
1,4381,5961,605990
686937
1,4401,8762,2692,6702,7603,216
2,5792,5482,5542,6292,7082,7402,7782,8442,9582,9723,216
3,1202,9862,948
354394320181
131209379470595743920
1,101
864870875902927932951990
1,0421,0191,101
1,068960933
439474496331
240319474604724791760900
711699700726750766782796821839900
865855844
339365395314
270324407516543613618640
565550549553551544540539559565640
612588576
P Preliminary.1 Includes mail-order houses.2Includes only automobile paper; other instalment credit held by automobile dealers is included with "other" retail outlets.
514 FEDERAL RESERVE BULLETIN
Digitized for FRASER http://fraser.stlouisfed.org/ Federal Reserve Bank of St. Louis

STATISTICS ON SHORT- AND INTERMEDIATE-TERM CONSUMER CREDIT—Continued
NONINSTALMENT CREDIT, BY HOLDER
[Estimated amounts outstanding, in millions of dollars]
End of yearor month
1939194019411942
19451946194719481949195019511952. . .
1952-February...MarchAprilMayTuneJulyAugustSeptember..October . . . .November..December. .
1953-January... .February P. .M a r c h ? . . . .
Totalnon-
instal-mentcredit
2,7192,8243,0872,817
3,2034,2124,8755,4435,5886,3236,6317,066
6,0946,0596,2096,3976,4146,2866,3026,3676,4786,5987,066
6,7226,3836,390
Financialinstitutions(single-pay-ment loans)
Com-mer-cial
banks
625636693593
6741,0081,2031,2611,3341,5761,6841,852
1,7421,7581,7691,7771,7981,7921,7921,7931,8011,8211,852
1,8581,8391,882
Other
162164152120
72114153184198245250256
237239238278256231234240232288256
271240260
Retailoutlets(charge
accounts)
De-part-ment
stores l
236251275217
290452532575584641685709
480457471475467418422459499536709
570490479
Other
1,1781,2201,3701,227
1,3221,6241,8212,1382,0962,3652,4112,604
2,0101,9532,0642,1842,1942,1552,1572,1832,2772,2902,604
2,3862,1552,096
Servicecredit
518553597660
845
]
1
1j
1
1,0141,1661,2851,376[,4961,6011,645
1,625,652
L ,667,683,699
1,690,697,692
L.669,663,645
,637,659,673
P Preliminary.includes mail-order houses.
INSTALMENT CREDIT HELD BY SALES FINANCECOMPANIES, BY TYPE OF CREDIT
[Estimated amounts outstanding, in millions of dollars]
End of yearor month
1939194019411942
19451946 x194719481949195019511952
1952—February. . . .MarchAprilMayJuneJulyAugustSeptember. . .OctoberNovemberDecember.. . .
1953—JanuaryFebruary?March?
Totalinstal-mentcredit
1,1971,5751,797
588
300677
1,3551,9902,9503,7853,7694,833
3,6613,6233,6623,8534,1114,2634,2944,3624,5234,6704,833
4,9305,0315,174
Auto-mobilepaper
8781,1871,363
341
164377802
1,3782,4253,2573,1834,072
3,0743,0333,0633,2373,4663,5893,6083,6603,8043,9404,072
4,1594,2604,402
Othercon-
sumergoodspaper
11513616778
2467
185232303313241332
235233232240260281289301312317332
337339342
Repairand
modern-izationloans
148190201117
58141242216
83577082
6665656768707174787982
818079
Per-sonalloans
56626652
5492
126164139158275347
286292302309317323326327329334347
353352351
Preliminary.
INSTALMENT CREDIT HELD BY COMMERCIAL BANKS.BY TYPE OF CREDIT
[Estimated amounts outstanding, in millions of dollars]
End of yearor month
19391940. .19411942.
19451946194719481949195019511952. .
1952-February,MarchAprilMayJuneJulyAugustSeptember..OctoberNovember..December. .
1953-JanuaryFebruary?..March?. . . .
Totalinstal-mentcredit
1,0791,4521,726
862
7451,5672,6253,5294,4395,7985,7717,576
5 7695,8085,8996,1446,4586,6546,8076,9677,1897,3527,576
7,6967,8088,062
Automobilepaper
Pur-chased
237339447149
66169352575R4Q
1,1771,1351,596
1,116,114,136,218,313,364,392,430,485,534,596
,631,662,724
Direct
178276338134
143311539753946
1,2941,3111 653
1,3181,3361,3681,4321,5081,540L.554,567,599,625,653
,684, 736,816
Othercon-
sumergoodspaper
166232309153
114299550794
1 01rt1,4561,3151,813
1,3011,2911,289,331
1,3941,452L ,512L,564,647,709,813
,861,877,949
Repairand
mod-erniza-
tionloans
135165161124
110242437568715834888
1,138
881881899931967
1,0041,0361,0701,1101,1311,138
1,1321,1331,139
Per-sonalloans
363440471302
312546747839913
1,0371,1221 376
1
1,153,186
1,2071,2321,2761,294
,3131.336,348,353,376
,388.400,454
Preliminary.
INSTALMENT CREDIT HELD BY FINANCIAL INSTITU-TIONS OTHER THAN COMMERCIAL BANKS AND SALES
FINANCE COMPANIES, BY TYPE OF CREDIT
[Estimated amounts outstanding, in millions of dollars]
End of yearor month
1939194019411942
19451946194719481949195019511952
1952—February. . . .MarchAprilMayJuneJulyAugustSeptember. . .OctoberNovemberDecember... .
1953—JanuaryFebruary?March?
Totalinstal-
credit
789891957726
731991
1,2751,5731,8582,2372,5373,014
2,5462,5712,6162,6822,7552,8082,8492,8742,9022,9333,014
3,0393,0383,101
Auto-mobilepaper
81102122
65
5477
130189240330358453
359363372390405415423430438443453
456460477
Othercon-
sumergoodspaper
24303627
20346999
137182209276
212216225231244252255261267269276
281283287
Repairand
modern-izationloans
15161414
1422395989
115132166
131133134140143147151156159166166
165165166
Per-sonalloans
669743785620
643858,037,226,392,610,838,119
,844,859
1,8851,9211,9631,9942,0202,0272,0382,0552,119
2,1372,1302,171
P Preliminary.NOTE.—Institutions included are consumer finance companies (oper-
ating primarily under State small-loan laws), credit unions, industrialloan companies, mutual savings banks, savings and loan associations,and other lending institutions holding consumer instalment loans.
MAY 1953 515
Digitized for FRASER http://fraser.stlouisfed.org/ Federal Reserve Bank of St. Louis
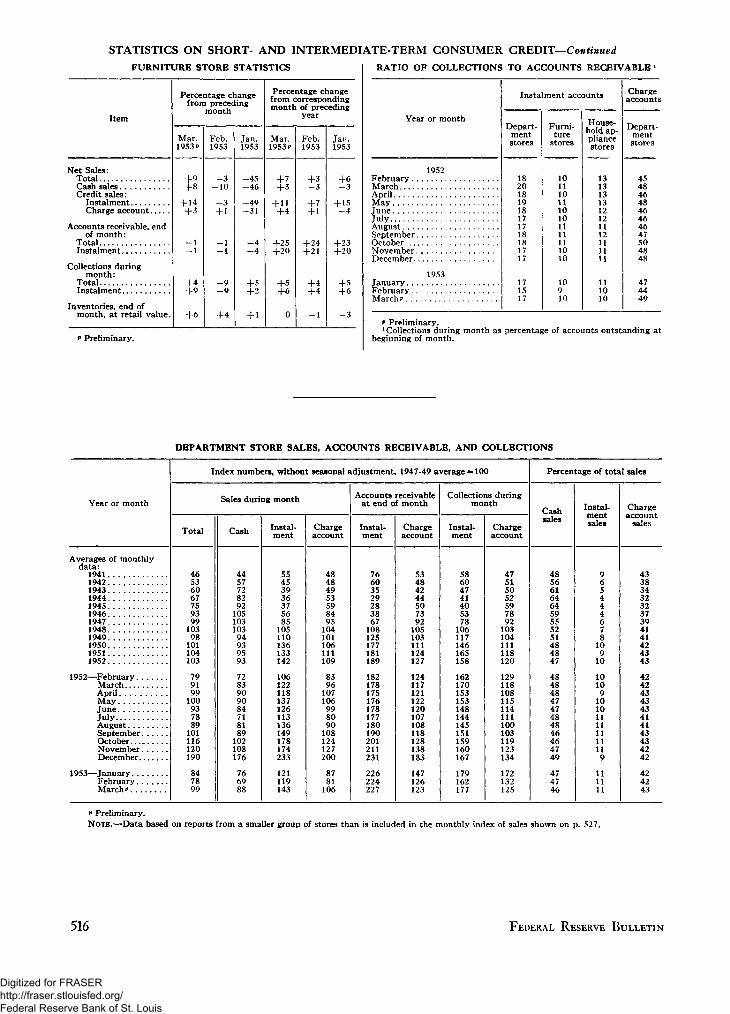
STATISTICS ON SHORT- A N D INTERMEDIATE-TERM CONSUMER CREDIT—Continued
FURNITURE STORE STATISTICS RATIO OF COLLECTIONS TO ACCOUNTS RECEIVABLE *
Item
Net Sales:TotalCash salesCredit sales:
InstalmentCharge account
Accounts receivable, endof month:
TotalInstalment . .
Collections duringmonth:
TotalInstalment
Inventories, end ofmonth, at retail value.
Percentage changefrom preceding
month
Mar.1953?
+9+8
+ 14+3
- 1- 1
+4+9
+6
Feb.1953
- 3-10
- 3+ 1
- 1- 1
- 9- 9
+4
Jan.1953
-45-46
-49-31
- 4- 4
+5+2
+ 1
Percentage changefrom correspondingmonth of preceding
year
Mar.1953P
+7+3
+ 11+4
+25+20
+5+6
0
Feb.1953
+3- 3
+ 7+ 1
+24+21
+4+4
- 1
Jan.1953
+6- 3
+ 15- 4
+23+20
+5+6
- 3
Preliminary.
Year or month
1952FebruaryMarchAprilMayJuneJulyAugustSeptemberOctoberNovemberDecember
1953JanuaryFebruaryMarch?
Instalment accounts
Depart-mentstores
1820181918171718181717
171517
Furni-ture
stores
1011101110101111111010
10910
House-hold ap-pliancestores
1313131312121112111111
111010
Chargeaccounts
Depart-mentstores
4548464846464647504848
474449
P Preliminary.1 Collections during month as percentage of accounts outstanding at
beginning of month.
DEPARTMENT STORE SALES, ACCOUNTS RECEIVABLE, AND COLLECTIONS
Year or month
Index numbers, without seasonal adjustment, 1947-49 average = 100
Sales during month
Total Cash Instal-ment
Chargeaccount
Accounts receivableat end of month
Instal-ment
Chargeaccount
Collections duringmonth
Instal-ment
Chargeaccount
Percentage of total sales
Cashsales
Instal-mentsales
Chargeaccount
sales
Averages of monthlydata:194119421943194419451946194719481949195019511952
1952—February. . . .MarchAprilMayJuneJulyAugustSeptember. . .OctoberNovember. . .December
1953—JanuaryFebruary....March? ,
4653606775939910398101104103
799199100937889101116120190
847899
445772829210510310394939593
7283909084718189102108176
766988
55453936375685105110136133142
106122118137126113136149178174233
121119143
48484953598495104101106111109
8396107106998090108124127200
8781106
76603529283867108125177181189
182178175176178177180190201211231
226224227
53484244507392105103111124127
124117121122120107108118128138183
147126123
58604741405378106117146165158
162170153153148144145151159160167
179162177
47515052597892103104111118120
129118108115114111100103119123134
172132125
485661646459555251484847
4848484747484846464749
474746
96544467810910
10109101011111111119
111111
433834323237394141424343
4242434343414143434242
424243
P Preliminary.NOTE.—Data based on reports from a smaller group of stores than is included in the monthly index of sales shown on p. 527.
516 FEDERAL RESERVE BULLETIN
Digitized for FRASER http://fraser.stlouisfed.org/ Federal Reserve Bank of St. Louis

BUSINESS INDEXES[The terms "adjusted" and "unadjusted" refer to adjustment of monthly figures for seasonal variation]
Year or month
1919192019211922 . . . .19231924 . . . .1925
19261927192819291930
19311932193319341935
19361937193819391940
194119421943 . . . . .19441945 . . . .
19461947194819491950
19511952
1951October
December
1952JanuaryFebruaryMarchAprilMayJuneJulyAugustSeptemberOctoberNovemberDecember
1953JanuaryFebruaryMarch
Industrial production(physical volume)*l
1935-39 = 100
Total
Ad-justed
218219218
221222221216211204193215228230234235
236240
P242"242
Unad-justed
72755873888290
969599
11091
7558697587
103113
89109125
162199239235203
170187192176200
220219
222220217
217218217215211205194218232233235233
232236
P239•'241
Manu-factures
Du-rable
Ad-justed
84935381
10395
107
11410711713298
6741546583
10812278
109139
201279360353274
192220225202237
273280
274277282
282284285277277247230267290300304313
'315322
P327'329
Non-du-
rable
Ad-justed
62605767726976
7983859384
7970798190
10010695
109115
142158176171166
165172177168187
194189
188188185
189190188183181186179191194195197194
195198
*200*198
Min-erals
Ad-justed
71836671988992
10010099
10793
8067768086
99112
97106117
125129132140137
134149155135148
164160
174170163
167167164166140147142156175164171168
164163
P160"160
Constructioncontracts
awarded (value) 2
1947-49=100
Total
Ad-justed
34343043455166
6969736349
3415141720
3032353944
6689372236
8284
102113159
171183
140156166
161156164171168172177207207210196205
190173177
Resi-den-tial
Ad-justed
26182741495775
7371765230
22877
13
2225273743
5449241016
878698
116185
170183
160146145
142163174189186193196193191185178183
173182176
Allother
Ad-justed
39453243424659
6768707062
4120182425
3536404044
74116453050
7983
105111142
172183
127162180
173152157158156158165217218227207219
201167178
Employment and payrolls3
1947-49 -100
Non-agri-cul-turalem-
ploy-ment
Ad-justed
61.662.255.458.764.663.865.5
67.968.268.371.367.0
60 653.753.959.061.6
66.270.666.469.673.6
83.191.296.695 392.1
95.1'99.4
'101.5'99.1
'102.3
'108.0'109.8
'108.4'108.4'108.6
'108.7'109.2'109.1'109.0'109 1'108.6'108.3'109 9'110.8'111.3'111 8'112.0
'112.1'112.4P112 4
Manufacturingproduction workers
Employ-ment
Ad-justed
'104.4'104.4'104.7
'104.7'104.9'104.9'105.2'104 6'102.0'100.6'104 7'106.8'107.8'109 2'110.0
'110.5'111.2Pi l l .8
Unad-justed
68.769.052.858.466.962.164.2
65.564.164.268.359.5
50 242.647.255.158.8
63.970.159.666.271.2
87.9103.9121.4118 1104.0
97.9103.4102.893.8
'99.6
'106.2'105.5
'106.2'105.4'105.4
'104.2'104.7'104.7'104.1'102 9'100.9'98.9
'105 7'109.0'109.6'110 2'110.8
'110.0'111.0Pill .6
Pay-rolls
Unad-justed
31.137.124.025.732.630.432.1
33.032 432 835 028.3
21 514 815 920.423.5
27.232.625.329.934.0
49.372.299 0
102 887 8
81 297.7
105.197.2
'111.7
'129.6'135.3
'130.8'130.3'133.7
'130.9'132.0'132.5'129.1'128 9'127.3'122.2'134 2'143.3'145.7'146 3'150.9
'147.4'149.2e152.0
Freightcarload-
ings*1935-39
= 100
Ad-justed
120129110121142139146
152147148152131
10578828992
107111
89101109
130138137140135
132143138116128
134126
135137133
141136133126122108102125134128134131
134130132129
Depart-ment
sales*(retailvalue)4
1947-49- 1 0 0
Ad-justed
27323030343436
3737373835
3224242729
3335323537
4450566270
9098
10498
105
109110
109113109
109106105103108111105114106115113115
111111
P113'107
Con-sumers'prices3
1947-49-100
Unad-justed
74.085 776.471 672 973 175 0
75 674 273 373 371 4
65 058 455 357 258.7
59 361 460 359 459 9
62 969 774.075 276.9
83 495 5
102 8101.8102.8
111 0113 5
112 1112 8113.1
113.1112.4112.4112.9113 0113.4114.1114 3114.1114.2114 3114.1
113.9113.4113 6
Whole-sale
com-moditvprices3
1947-49= 100
Unad-justed
65 062 062 961 956 1
47 442 142 848 75 2 . 0
52 S56 151 150 151 1
56 864 26 7 . 067 66 8 . 8
78 796 4
104 499.2
103.1
114 8111 6
113 7113 6113.5
113.0112.5112.3111.8111 6111.2111.8112 2111.8111.1110 7109.6
109.9109.6110 1
' Estimated; all estimates are those of the Federal Reserve. P Preliminary. ' Revised.* Average per working day.'For indexes by groups or industries, see pp. 518-521.2Three-month moving average, based on F..W. Dodge Corporation data. A description of the index may be obtained from the Division
of Research and Statistics. For monthly data (dollar value) by groups, see p. 525.3 The unadjusted indexes of employment and payrolls, wholesale commodity prices, and consumers' prices are compiled by or based on data of
the Bureau of Labor Statistics. Nonagricultural employment covers employees only and excludes personnel in the armed forces. The figureson employment and payrolls incorporate revisions to first-quarter 1951 benchmark levels. The consumers' prices index is the revised series, re-flecting beginning January 1953 the inclusion of some new series and revised weights. Prior to January 1953 indexes are based on the "interimadjusted" and "old" indexes converted to the base 1947-49=100.
*For indexes by Federal Reserve districts and for other department store data, see pp. 527-531.Back figures in BULLETIN.—For industrial production, August 1940, pp. 825-882, September 1941, pp. 933-937, and October 1943 DO 958-984;
for department store sales, December 1951, pp. 1490-1515.
MAY 1953 517
Digitized for FRASER http://fraser.stlouisfed.org/ Federal Reserve Bank of St. Louis

INDUSTRIAL PRODUCTION, BY INDUSTRIES(Adjusted for Seasonal Variation)
[Federal Reserve index numoers. 1935-39 average =100]
Industry
Industrial Production—Total
Manufactures— Total
Durable Manufactures
Iron and Steel1
Pig ironSteel
Open hearthElectric
Machinery
Transportation Equipment
Automobiles (including parts) . . .(Aircraft; Railroad Equipment; Shipbuilding— Private
and Government)2
Nonferrous Metals and Products
Smelting and refining(Copper smelting; Lead refining; Zinc smelting;
Aluminum; Magnesium; Tin) a ,Fabricating
(Copper products; Lead shipments; Zinc shipments;Aluminum products; Magnesium products; Tinconsumption) 2
Lumber and Products
LumberFurniture
Stone, Clay, and Glass Products
Glass productsGlass containers
CementClay productsOther stone and clay products 2
Nondurable Manufactures
Textiles and Products
Textile fabricsCotton consumptionRayon deliveriesNylon and silk consumption 2
Wool textilesCarpet wool consumptionApparel wool consumptionWool and worsted yarn
Woolen varnWorsted varn
Leather and Products
Leather tanningCattle hide leathersCalf and kip leathersGoat and kid leathersSheep and lamb leathers
Shoes
Wheat flourCane sugar meltings 2
Manufactured dairy productsButterCheese
1952
Mar.
221
231
285
263
239309225911
359
327
222
218
252
204
158
149175
222
224239244175
188
152
139141288
112123110108103114113
108
8698686972
122
166
103
14271
169133
Apr.
216
225
277
245-
205278196855
354
329
227
218
257
203
152
143170
220
225242238173
183
144
131130280
108117110103
96112109
102
8495726469
114
163
108
14673
181149
M a y
211
224
277
246
208278195867
353
338
231
216
259
199
142
128168
217
227243230168
181
151
137135287
117113123112108116123
105
90105676772
115
160
103
14873
183163
June
204
214
247
140
426639
256
352
339
229
210
247
195
146
134169
222
247269222170
186
154
138133312
11?75
113106124124
103
92106696779
111
166
113
14769
180164
July
193
202
230
139
388336
418
331
287
162
201
242
184
141
128165
214
243266215158
179
147
129111343
10371
120103
97112113
91
819160716698
162
109
14570
176152
Aug.
215
225
267
244
721283202860
336
300
175
213
251
197
149
135175
221
243261231163
191
170
143369
123120139120112131123
116
97110796789
129
164
109
14869
178168
Sept.
228
237
290
270
242319222
1013
354
353
247
225
248
216
155
140183
222
245261227161
194
177
158145377
137148149130121144136
112
97107906588
123
168
108
14871
178166
Oct.
230
242
300
281
247332233
1040
363
371
265
237
251
231
155
138189
224
2412 54231163
195
172
154142361
134140142126117140138
112
103115877793
118
165
109
14673
176155
Nov.
234
245
304
283
244334231
1064
371
376
272
240
251
236
161
146191
221
232242233162
197
176
158149356
137153137127120138141
113
103117848386
120
161
113
14773
191152
Dec.
235
247
313
286
247335238
1022
385
r392
'282
246
258
241
165
149196
••221225254
'160
194
169
152141337
138164130124115136146
107
100112888076
112
108
15285
209155
1953
Jan.
236
249
'315
287
249333235
1029r391r392r282
249
266
242
171
162189
r222
225232257
r168
195
169
151140350
130149129118108
r132r136
116
r116877980
126r164
114
15189
209142
Feb.
240
254
322
290
247337234
1071
396
405
301
259
293
245
175
166192
233
242255279168
198
173
157149
'338
142173140130116148142
119
101114828180
131
165
108
15190
205138
Mar.
P242
P257
P 3 2 7
P297
253348241
1113
P404
P413
P308
P259
P29S
P243
vl73
161P196
v?Vi
P255272273
P200
•P173
148349
P168
P109
15494
209149
P Preliminary. r Revised.1 Methods used in compiling the iron and steel group index have been revised beginning October 1949. A description of the new methodsmay be obtained from the Division of Research and Statistics.2 Series included in total and group indexes but not available for publication separately.3 Because of a reclassification of the basic data used to measure changes in production, the sulphate pulp and sulphite pulp series are no longeravailable separately. Individual indexes through June 1951 are shown in preceding BULLETINS.
518 FEDERAL RESERVE BULLETIN
Digitized for FRASER http://fraser.stlouisfed.org/ Federal Reserve Bank of St. Louis

INDUSTRIAL PRODUCTION, BY INDUSTRIES—Confine(Adjusted for Seasonal Variation)
[Federal Reserve index numbers, 1935-39 average
Industry
Manufactured Food Products—Continued
Meat packing .Pork and lardBeefVeal
Other manufactured foodsProcessed fruits and vegetables . .ConfectioneryOther food products
Alcoholic Beverages
Malt liquorWhiskeyOther distilled spiritsRectified liquors
Tobacco Products . .
CigarsCigarettesOther tobacco products
PaPer and Paper Products
Paper and pulp . . . . . .Pulp
Groundwood pulpSoda pulpSulphate and sulphite pulp8
PaperPaperboardFine paper 2
Printing paperTissue and absorbent paper
NewsprintPanerboard containers (same as Paperboard)
Printing and Publishing
Newsprint consumptionPrinting paper (same as shown under Paper)
= 100]
1952
Mar.
179230141
8185
172150135184
170
V\68
292208
174
109243
59
192
188241117
9 9284180205
189190178131
177
164
iPetroleum and Coal Products 1 ?7tt
Petroleum refining'GasolineFuel oilLubricating oilKeroseneOther petroleum products 2
CokeBv-product cokeBeehive coke
Chemical Products
Pa in t sR a y o nIndus t r ia l chemicalsO t h e r chemical p roduc t s 2 . . . . . .
Rubber Products.. .
Minerals—Total
Fuels
CoalBituminous coalAnthracite
Crude petroleum
Metals
Metals other than gold and silver
(Copper; Lead; Zinc)a
GoldSilver
210227183223
204197420
155269563
242
164
170
111122
68199
125
176
4878
Apr.
165207135
7979
169146128183
157
15462
298205
184
110259
62
185
181228110
95269174202
186186161122
175
164
261
205218177211
166161326
292
152267559
215
166
171
110119
74201
141
205
4777
M a y
146167140
8476
169147130181
150
14951
231214
178
114245
64
182
175221108
92260168207
175162149130
170
166
209
157167124133
165161311
292
151270558
242
140
140
100107
73159
143
207
5175
June
148170137
9978
175161121188
112
16138
185207
189
116264
65
181
176227121
89266168201
182168153134
176
169
211
216228185199
727184
298
307563
246
147
161
96102
74193
65
71
5271
July
147163144109
68
171138117189
162
17619
108224
172
113240
54
160
154195124
68226148182
150174P 4126
157
f 64
219
27 5731174226
676752
299
15737 5565
142
111
849157
190
65
71
5463
Aug.
158180149121
77
171123134190
151
16521
234175
186
111261
68
188
180229132
82267172722
168180148130
165
162
280
231735181230
169168184
302
154354568
242
156
161
931026\
194
131
188
5063
Sept.
170200151125
87
175143136190
155
16026
148263
187
123257
65
192
181220125
83256175233
165187146126
165
166
282
234232179708
177174299
302
155370567
212
175
180
133144
203
149
219
4863
Oct.
169194153131
96
172147131185
162
15428
182325
190
134258
66
203
192233125
89274186246
178206150123
176
173
279
225226182207
179178243
304
158358578
260
164
167
9393OS
203
145
212
4769
Nov.
170196155131
89
167124134184
180
17731
133369
181
124249
57
205
194236108
92280188240
182193161121
175
169
290
233239171225
182179268
308
1*9350595
264
171
177
125135
87202
138
200
4867
Dec.
176202163124
97
'169128150
••183
166
18244
127228
172
98243
59
196
185220112
91258180235
179195151116
168
157
291
729730164241
18<S182312
309
159351598
'272
16S
176
115125
71207
117
166
4666
1953
Jan.
169181175113100
170'140145182
158
17553
160180
179
110249
64
200
191233112
92275185236
185201162119
173
162
r293
230241160250
188183353
^309
160348
'•594
268
164
172
105116
60204
120
170
4667
Feb.
174181188109
97
170141138183
159
16958
130221
194
111276
61
207
107"237118
95'279191245
193201167118
180
167
293
2312361487 2 6
1 «8T83
r3<i4
310
159336597
268
163
170
99109
60205
123
175
4767
Mar .
179187193\\\100
J>172»147
Pi 85
173
17963
191245
194
112277
60
211
201245113
94291194249
193207170121
183
173
t*288
P22SP234
1 8 918.33 9 5
P.?/5
p \ ZRP 3 ^ 4r>604
P276
vl60
P167
96107
51P2O2
nzsP178
For other footnote! see preceding page.NOTE.—For description and back figures see BULLETIN for October 1943, pp. 940-984, September 1941, p j . 878-881 and 933-937, and August
1940, pp. 753-771 and 825-882.
MAY 1953 519
Digitized for FRASER http://fraser.stlouisfed.org/ Federal Reserve Bank of St. Louis
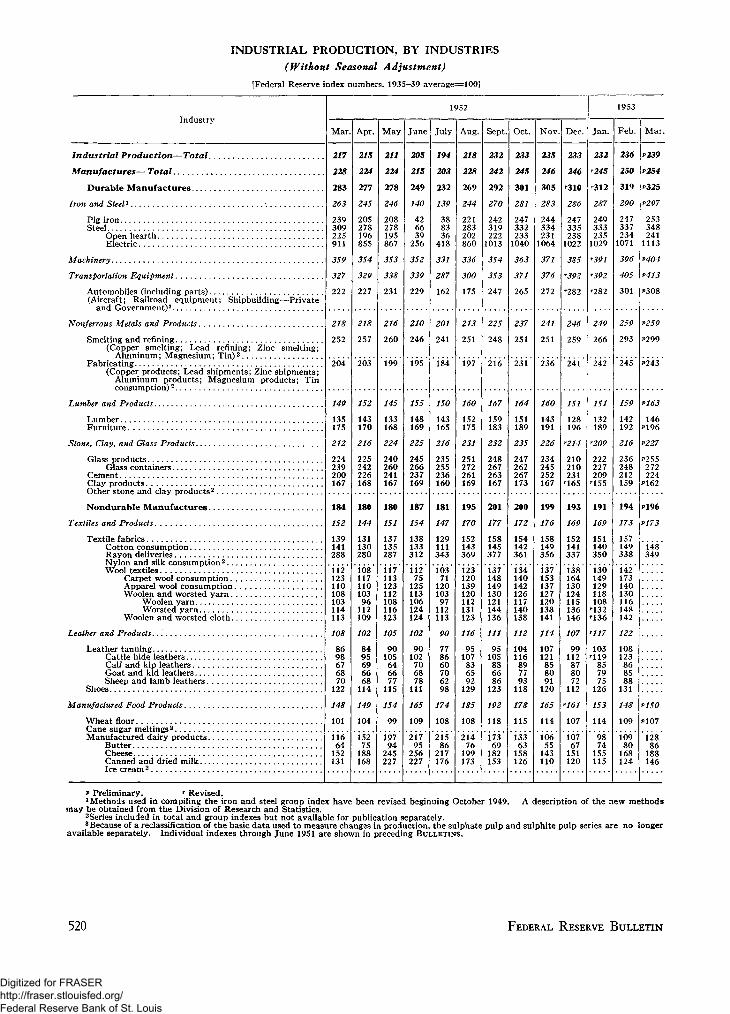
INDUSTRIAL PRODUCTION, BY INDUSTRIES(Without Seasonal Adjustment)
[Federal Reserve index numbers. 1935-39 average=100]
Industry
Industrial Production—Total
Manufactures— Total
Durable Manufactures
I r o n a n d S t e e l 1 . . .
Pig ironSteel
Open hearthElectric
Machinery
Transportation Equipment
Automobiles (including parts)(Aircraft; Railroad equipment; Shipbuilding—Private
and Government)2
Nonferrous Metals and Products
Smelting and refining(Copper smelting; Lead refining; Zinc smelting;
Aluminum; Magnesium; Tin)2 .Fabricating . .
(Copper products; Lead shipments; Zinc shipments;Aluminum products; Magnesium products; Tinconsumption)2
Lumber and Products
LumberFurniture
Stone Clay, and Glass Products
Glass productsGlass containers
Cement . . .Clay productsOther stone and clay products2
Nondurable Manufac tures
Textiles and Products
Textile fabricsCotton consumptionRayon deliveriesNylon and silk consumption2
Wool textilesCarpet wool consumptionApparel wool consumptionWoolen and worsted yarn
Woolen yarnWorsted yarn
Woolen and worsted cloth
Leather and Products
Leather tanning. .Cattle hide leathersCalf and kip leathersGoat and kid leathersSheep and lamb leathers
Shoes
Manufactured Food Products
Wheat flourCane sugar meltings2
Manufactured dairy productsButterCheeseCanned and dried milkIce cream 2
1952
Mar.
217
228
283
263
239309225911
359
327
222
218
252
204
149
135175
212
224239200167
184
152
139141288
112123110108103114113
108
8698676870
122
148
101
11664
152131
Apr.
215
224
277
245
205278196855
354
329
227
218
257
203
152
143170
216
225242226168
180
144
131130280
10811711010396
112109
102
8495696668
114
149
104
15275
188168
M a y
211
224
278
246
208278195867
353
338
231
216
260
199
145
133168
224
240260241167
180
151
137135287
117113123112108116123
105
90105
646677
115
154
99
19794
245227
June
205
215
249
140
426639
256
352
339
229
210
246
195
155
148169
225
245266237169
187
154
138133312
11275
125113106124124
102
90102
706878
111
165
109
21795
256227
July
194
203
232
139
388336
418
331
287
162
201
241
184
150
143165
216
235255236160
181
147
129111343
10371
12010397
112113
90
778660706298
174
108
21586
217176
Aug.
218
228
269
244
221283202860
336
300
175
213
251
197
160
152175
231
251272261169
195
170
152143369
123120139120112131123
116
95107
836592
129
185
108
21476
199173
Sept.
232
242
292
270
242319222
1013
354
353
247
225
248
216
167
159183
232
248267263167
201
177
158145377
137148149130121144136
111
95105
886686
123
192
118
17369
182153
Oct.
233
245
301
281
247332233
1040
363
371
265
237
251
231
164
151189
235
247262267173
200
172
154142361
134140142126117140138
112
104116
897793
118
178
115
13363
158126
Nov.
235
246
305
283
244334231
1064
371
376
272
241
251
236
160
143191
226
234245252167
199
176
158149356
137153137127120138141
114
107121
858091
120
165
114
10655
143110
Dec.
233
246r310
286
247335238
1022
385
'392r282
246
259
241
151
128196
'214
210210231
r165
193
169
152141337
138164130124115136146
107
99112
878072
112
'161
107
10767
151120
1953
Jan.
232
'245
287
249333235
1029
'391
'392
••282
249
266
242
151
132189
'209
222227209
191
169
151140350
130149129118108
r132136
'117
103r119
857975
126
153
114
9874
155115
Feb.
236
250
319
290
247337234
1071
396
405
301
259
293
245
159
142192
216
236248212159
194
173
157149338
142173140130116148142
122
108123
868588
131
148
109
10980
168124
Mar.
P239
P254
P325
P297
253348241
1113
P404
P413
P308
P259
P299
P243
P!63
146P196
P227
272224
P162
P196
P173
148349
P150
P107
12886
188146
P Preliminary. ' Revised.1 Methods used in compiling the iron and steel group index have been revised beginning October 1949. A description of the new methods
may be obtained from the Division of Research and Statistics.2Series included in total and group indexes but not available for publication separately.3 Because of a reclassification of the basic data used to measure changes in production, the sulphate pulp and sulphite pulp series are no longer
available separately. Individual indexes through June 1951 are shown in preceding BULLETINS.
520 FEDERAL RESERVE BULLETIN
Digitized for FRASER http://fraser.stlouisfed.org/ Federal Reserve Bank of St. Louis

INDUSTRIAL PRODUCTION, BY INDUSTRIES—Continued(Without Seasonal Adjustment)
[Federal Reserve index numbers, 1935-39 average=100]
Industry
Manufactured Food Products—Continued
Meat packing .Pork and lardBeef .VealLamb and mutton
Other manufactured foodsProcessed fruits and vegetablesConfectioneryOther food products
A l c o h o l i c B e v e r a g e s . . . . . .
M a l t l i q u o r . . . . . . . .W h i s k e yO t h e r d i s t i l l e d s p i r i t s . . .R e c t i f i e d l i q u o r s
Tobacco Products
CigarsCigarettesOther tobacco products
Paper and Paper Products
Paper and pulpPulp
Groundwood pulpSoda pulp . . . .Sulphate and sulphite pulp 3
Paper. . .PaperboardFine paper2
Printing paperTissue and absorbent paperWrapping paperNewsprint
Paperboard containers (same as Paperboard)
Printing and Publishing
Newsprint consumptionPrinting paper (same as shown under Paper)
Petroleum and Coal Products
Petroleum refining 2
GasolineFuel oilLubricating oilKerosene . .Other petroleum products 2
CokeBy-product cokeBeehive coke
Chemical Products
P a i n t s .R a y o nI n d u s t r i a l c h e m i c a l s . . . . .O t h e r c h e m i c a l p r o d u c t s 2
R u b b e r P r o d u c t s . . . . . . . .
Minerals—Total
Fuels
C o a l . . . .B i t u m i n o u s c o a lA n t h r a c i t e
C r u d e p e t r o l e u m . . . . . . . . .
Metals . . .
Metals other than gold and silver . . . . . . .Iron ore(Copper* Lead* Zinc)2
GoldSilver
1952
M a r
165214128
7683
15382
125176
155
15968
190208
164
109226
59
192
18824212599
284180205
189190178131
180
171
278
210227181227
204197420
298
155269563
242
158
170
11112268
199
90
11894
4380
Apr.
152188127
7877
15189
107175
155
16262
179205
174
11024162
186
18123012195
269174202
186188161124
180
174
261
205218184215
166161326
295
153267559
235
165
171
11011974
201
130
189238
4277
M a y
1471671408878
15496
100
178
158
17051139214
178
114245
64
182
17522211792
260168207
175162149131
174
173
209
157167129134
165161311
291
155270558
242
143
140
10010773
159
159
238348
4474
June
1471701349973
16612489
189
176
20338
115207
197
11627866
182
17722712289
266169201
182171153135
175
168
251
216228185187
727184
296
156307563
246
149
161
9610274
193
74
9041
4868
July
13714414610965
17917996
193
186
22019
115224
179
11325254
159
15319311068
226147182
150167124124
145
141
259
225231172210
676752
295
155325565
225
144
155
849157
190
81
10171
5261
Aug.
13813915011875
195234144194
159
18821
126175
193
11127466
188
18022711682
267172222
168180148129
157
146
280
231235179221
169168184
299
152354568
242
161
161
9310261
194
164
244381
5461
Sept
15415816313893
207279175194
159
16126
202263
198
12327569
191
18121711283
256175233
165187146126
166
168
282
234232179206
177174299
305
153370567
252
180
180
13314488
203
178
265418
5564
Oct.
169183167149100
191190171195
173
14328
472325
197
134268
71
203
19223211689
274186246
178208150123
180
182
279
225226182207
179178243
309
158358578
260
166
167
939395
203
164
241363
5669
N o v
19023016114189
174114158193
163
13631
280369
184
12425459
205
19423711492
280188249
182193161123
183
184
290
233239171231
182179268
313
157350595
264
no177
12513587
202
131
185248
5468
Dec.
20826616311695
r167100151
'187
142
14544140228
159
98224
51
195
18522011391
258179235
179189151114
172
165
291
229239163248
186182312
314
159351598
163
176
11512571
207
84
10883
4865
1953
Jan.
199237178105106
157' 91149174
134
14453
104180
178
110249
63
200
19123311792
275185236
185199162119
168
150
'293
230241155255
188183353
311
157348
r594
268
159
172
10511660
204
10986
4468
Feb.
1661781739698
15589
140174
144
1525883
221
184
111260
59
r207
198238
'12295
'279'192245
193209167118
178
164
293
231236147238
188183
'364
314
157336597
268
158
170
9910960
205
86
11591
4268
Mar.
16617417510498
P154P 8 1
P177
161
16763
124245
183
11225860
211
20124612194
291194249
193207170121
187
180
P288
P225P234
189183395
P319
P158P3 54P604
P276
P155
P167
9610751
P202
90
P120105
For other footnotes see preceding page.NOTE.—For description and back figures see BULLETIN for October 1943, pp. 940-984, September 1941, pp. 878-881 and 933-937, and August
1940, pp. 753-771 and 825-882.
MAY 1953 521
Digitized for FRASER http://fraser.stlouisfed.org/ Federal Reserve Bank of St. Louis

OUTPUT OF MAJOR CONSUMER DURABLE GOODS(Adjusted for Seasonal Variation)
[Federal Reserve index numbers, 1947-49 average =1001
Product group1952
Mar.
104
103
1068010298141
Apr.
103
109
978310682118
May
105
110
998110985115
June
108
114
1014411089136
July
71
47
986111374135
Aug.
84
63
1087611394141
Sept.
121
122
1198111589
205
Oct.
125
125
1249911891
214
Nov.
134
131
13798120114237
Dec.
134
129
13994125115236
1953
Jan.
rl41
134
'149103
r120'123279
Feb.
148
146
150104122126273
Mar.
Total
Passenger automobiles.
Household goods, total .CarpetsFurnitureMajor appliances....Radios and television
148
151
144
125'131226
r Revised.NOTE.—Figures for March are preliminary. For description see BULLETIN for October 1951, pp. 1235-1240. Tables of back data, includ-
ing unadjusted indexes for these series, and indexes for certain component series may be obtained from the Division of Administrative Services,Board of Governors of the Federal Reserve System, Washington 25, D. C.
PRODUCTION WORKER EMPLOYMENT IN MANUFACTURING INDUSTRIES[Unadjusted, estimates of Bureau of Labor Statistics; adjusted. Federal Reserve. In thousands of persons]
Industry group or industry
ADJUSTED FOR SEASONALVARIATION
TotalDurable goods
Primary metal industriesFabricated metal productsMachinery except electricalElectrical machineryTransportation equipment.Lumber and wood products.Furniture and fixturesStone, clav, and glass products. .Instruments and related prod-
uctsMisc. manufacturing industries..Ordnance and accessories
Nondurable goodsTextile-mill productsApparel and other finished tex-
tilesLeather and leather products. . .Food and kindred productsTobacco manufacturesPaper and allied productsPrinting, publishing and allied
industriesChemicals and allied products...Products of petroleum and coal.Rubber products
WITHOUT SEASONAL ADJUSTMENT
TotalDurable goods
Primary Metal IndustriesBlast furnaces, steel works
and rolling millsFabricated Metal ProductsMachinery except Electrical
Metalworking machinery...Electrical Machinery
Electrical apparatus (gen-erating, etc.)
Communication equipment.Transportation Equipment
Motor vehicles and equip-ment
Aircraft and partsLumber and Wood Products
Sawmills and planing mills..Furniture and Fixtures
Household furnitureStone, Clay, and Glass Products. .Instruments and Related ProductsMisc. Manufacturing Industries.Ordnance and Accessories
1952
Mar. Apr. May j June July Aug. Sept. Oct. Nov. Dec
12,9807,4521 ,116
8401,282
7831,276
706302443
224361119
5,5281 ,089
1,055333
1,13695
414
492521185208
12,9517,4841,122
562848
1,295227791
269331
1,276
636439695406305220443225366119
13,014
7,5001,109
8431 ,292
7811 ,300
714302446
225365123
5,5141,079
1,048336
1,13794
413
491521188207
12,8727,4971,109
552847
1,298227781
3271,300
655444703414300218446226363123
M
1271
1
1
51
1
1
1271
1
1
1ay
,942,463116843280784,322653304442
223370126,479,075
,043341,13395
416
492518158208
,726,426,105
549839,286225776
262324,322
660454653396296215442223359126
June
127
1
1
51
1
1
127
1
1
,622,096684818,271783,340718307447
223378127
,526,068
,055344,14598
421
492518176209
,476,065681
153810,277226775
261327,340
663466725435298215447223363127
12,4426,871
653792
1,230|782
1,190744308441
226379126
5,5711,100
1,083343
1,13898
419
495519175201
12,2296,748
643
132768
1,218219755
249324
1,190
515476744439296217434219354126
12,9537,3721,073
8341 ,205
7981,221
740312449
228383129
5,5811,122
1,072346
1 ,11599
427
495513187205
13,0697,33:1,068
530
8211,193
22:78,
253346
1,22
524490759450307225451226375129
13,2167,6161,109862
1,214824
1,355736314453
230387132
5,6001 ,138
1,074347
1 ,11697
427
497509187208
13,4777,6341,109
556 j862
1,208224824
262367
1,355
674474751448316231455230393132
13,3387,7261,110884
1,233843
1,411717316457
233390132
5,6121 ,135
1,066349
1,12598
432
499508189211
13,5607,7741,116
557888
1,227223851
268381
1,411
70150172844032,23745923440813.
13,513j 13,6077,9441 ,126908
|
7,8621,120
8991 .2**
8=;Q1.450
723321459
134
1953
Jan. Feb. j Mar.
8751 ,484
708324453
5,651 5,6631 .135 1,129
1 ,093357
1 ,124102431
500508188213
1,098361
1,127105434
498508188215
13,6347,9161,126
557|903
1,260223872
271398
1,450
735510730433329242461237415134
13,6998,0101,137
561922
1,301226893
275410
1,484
750524704420330243458240404137
13,667
8,0041,134923
1,309!890
1 ,5101687325456
238 240396! 394137 136
5,6631 ,121
1,108358
1 ,128100433
13,7531 13,8308,092 8,160
1.1361935
1.311907
1,555693326454
1,139942
1,315912
1 ,569703333459
239i 242399! 407137| 139
5,661! 5,6701 ,118
1,102355
1,14198
433
499 497511 511188 188217 218
13,6058,0141,140
13,7298,117/, 142
563932
1,309226899
278411
1,510
770531673402330243451241394136
563944
1,318226916
281419
1,555
808538676403333247452240405137
1,122
1,104356
1,12797
435
501520187221
13,8078,1961,145
9511,328
921
1,569
692
' "336
' "459243413139
For footnotes see following page.
522 FEDERAL RESERVE BULLETIN
Digitized for FRASER http://fraser.stlouisfed.org/ Federal Reserve Bank of St. Louis
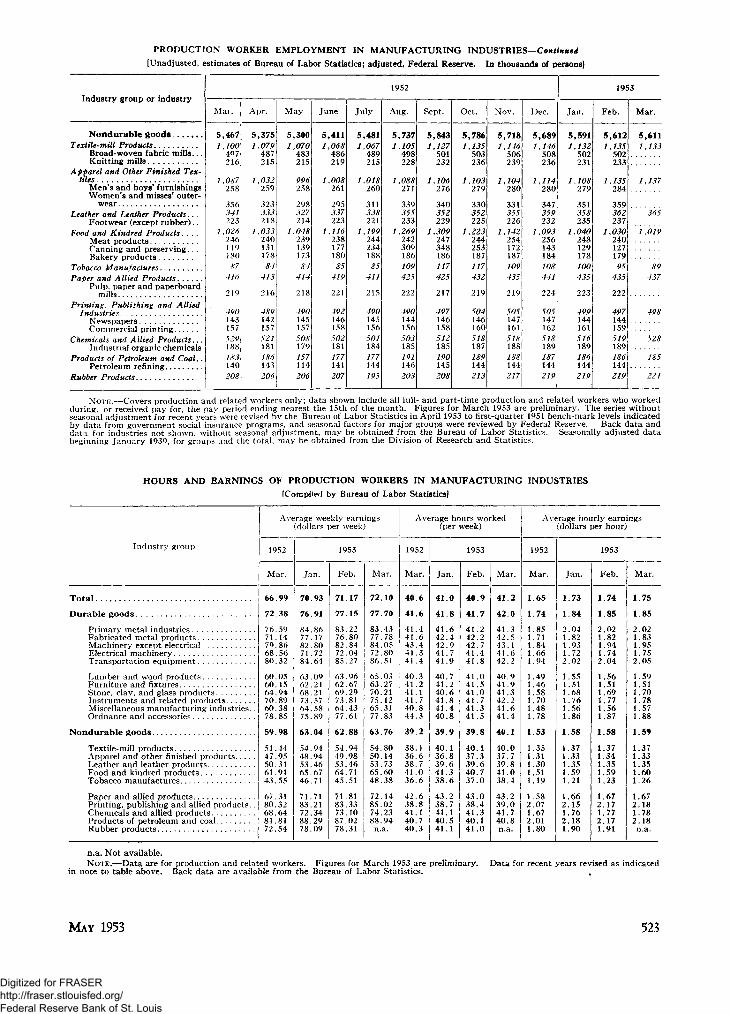
PRODUCTION WORKER EMPLOYMENT IN MANUFACTURING INDUSTRIES—Continued
[Unadjusted, estimates of Bureau of Labor Statistics; adjusted, Federal Reserve. In thousands of persons]
Industry group or industry
Nondurable goodsTextile-mill Products
Broad-woven fabric mills...Knitting mills
Apparel and Other Finished Tex-tiles
Men's and boys' furnishingsWomen's and misses' outer-
wearLeather and Leather Products.. .
Footwear (except rubber)..Food and Kindred Products....
Meat productsCanning and preserving. . .Bakery products
Tobacco ManufacturesPaper and Allied Products
Pulp, paper and paperboardmills
Printing. Publishing and AlliedIndustries
NewspapersCommercial printing
Chemicals and Allied Products...Industrial organic chemicals
Products of Petroleum and Coal..Petroleum refining
Rubber Products
1952
Mar.
5,467/ , 100
497216
1,087258
356341223
1,02624611918087
•116
219
490143157529\188183140208
Apr.
5,3751,079
487215
1,032259
323333218
1,03324013117884\
413
216
489142157521181186143206
M a y
5,3001,070
483215
996258
298327214
1,04823913917384
414
218
490145157508179157114206
June
5,4111,068
486219
1,008261
295337223
1,11623817718085
419
221
492146158502181177141207
July
5,4811,067
489215
1,018260
311338221
1,19924423418885
411
215
490145156501184177144195
Aug.
5,7371,105
498228
1,088271
339355233
1,269242309186109425
222
490144156503185191146203
Sept.
5,8431,127501232
1,106276
340352229
1,309247348186117425
217
497146158512185190145208
Oct.
5,786
1,135503236
1,103279
330352225
1,223244253187117432
219
504146160518187189144213
Nov.
5,7181,146506239
1,104280
331355226
1,142254172187109435
219
505147161518188188144217
Dec.
5,6891,146508236
1,114280
347359232
1,093256143184108441
224
505147162518189187144219
1953
Jan.
5,5911,132502231
1,108279
351358235
1,040248129178100435
223
499144161516189186144219
Feb.
5,6121,135
502233
1,135284
359362237
1,030240127179
l435
222
497144159519l\189J186\144|219\
Mar.
5,6111,133
1,137
365
1,019
89437
498
528
185
by data from government social insurance programs, and seasonal factors for major groups were reviewed by Federal Reserve. Back data anddata for industries not shown, without seasonal adjustment, may be obtained from the Bureau of Labor Statistics. Seasonally adjusted databeginning January 1939, for groups and the total, may be obtained from the Division of Research and Statistics.
HOURS AND EARNINGS OF PRODUCTION WORKERS IN MANUFACTURING INDUSTRIES
(Compiled by Bureau of Labor Statistics]
Industry group
Total
Durable goods.
Primary metal industries. . .Fabricated metal products. .Machinery except electrical.Electrical machineryTransportation equipment. .
Lumber and wood productsFurniture and fixturesStone, clay, and glass productsInstruments and related productsMiscellaneous manufacturing industries.Ordnance and accessories
Nondurable goods
Textile-mill productsApparel and other finished products.. . .Leather and leather productsFood and kindred productsTobacco manufactures
Paper and allied productsPrinting, publishing and allied products.Chemicals and allied productsProducts of petroleum and coalRubber products
Average weekly earnings(dollars per week)
1952
Mar.
66.99
72.38
76.5971.1479.8668.5680.32
60.0560. 1564.9470.8960.3878.85
59.98
51.4447.9550.3161 .9143.55
67.3180.3268.6481.8172.54
Jan.
70.93
76.91
84.8677.1782.8071.7284.64
63.0962.2168.2173.5764.5875.89
63.04
54.9448.9453.4665.6746.71
71.7183.2172.3488.2978.09
1953
Feb.
71.17
77.15
83.2276.8082.8472.0485.27
63.9662.6769.2973.8164.4377.61
62.88
54.9449.9853.4664.7145.51
71.8183.3373.1087.0278.31
Mar.
72.10
77.70
83.4377.7884.0572.8086.51
65.0363.2770.2175. 1265.3177.83
63.76
54.8050.1453.7365.6048.38
72.1485.0274.2388.94n.a.
Average hours worked(per week)
1952
Mar.
40.6
41.6
41.441.643.441.341.4
40.341.241.141.740.844.3
39.2
38.136.638.741.036.6
42.638.841.140.740.3
1953
Jan.
41.0
41.8
41.642.442.941.741.9
40.741.240.641.841.440.8
39.9
40.136.839.641.338.6
43.238.741.140.541.1
Feb.
40.9
41.7
41.242.242.741.441.8
41.041.541.041.741.341.5
39.8
40.137.339.640.737.0
43.038.441.340.141.0
Mar.
41.2
42.0
41.342.543.141.642.2
40.941.941.342.241.641.4
40.1
40.037.739.841.038.4
43.239.041.740.8n.a.
Average hourly earnings(dollars per hour)
1952
Mar.
1.65
1.74
1.851.711.841.661.94
1.491.461.581.701.481.78
1.53
1.351.311.30
.51
.19
1.582.071.672.011.80
1953
Jan.
1.73
1.84
2.041.821.931.722.02
1.551.511.681.761.561.86
1.58
1.371.331.351.591.21
1.662.151.762.181.90
Feb.
1.74
1.85
2.021.821.941.742.04
1.561.511.691.771.561.87
1.58
1.371.341.35
,59.23
11
1.672.171.772.171.91
Mar.
1.75
1.85
2.021.831.951.752.05
1.591.511.701.781.571.88
1.59
1.371.331.351.601.26
1.672.181.782.18n.a.
n.a. Not available.NOTE.—Data are for production and related workers. Figures for March 1953 are preliminary,
in note to table above. Back data are available from the Bureau of Labor Statistics.Data for recent years revised as indicated
MAY 1953 523
Digitized for FRASER http://fraser.stlouisfed.org/ Federal Reserve Bank of St. Louis

EMPLOYMENT IN NONAGRICULTURAL ESTABLISHMENTS BY INDUSTRY DIVISION
[Unadjusted, estimates of Bureau of Labor Statistics adjusted, Federal Reserve. In thousands of persons]
Year or month Total Manufac-turing ing
826852943982918889913872
907893890812777883880867870871
875870864
898890887816784893886871871870
868859855
Contractconstruction
1,1321,6611,9822,1692,1652,3332,5882,572
2,5422,5362,5182,5872,5952,6042,6112,5742,5712,548
2,5222,5572,521
2,3132,4352,5432,6902,7512,8122,7942,7282,6482,497
2,2952,2762,294
Transporta-tion and
publicutilities
3,8724,0234,1224,1413,9493,9774,1664,220
4,2104,1704,1874,1934,1544,2094,2594,3034,2934,281
4,2524,2624,267
4,1744,1494,1844,2254,1984,2584,2814,2964,2864,293
4,2164,2114,230
Trade
7,5228,6029,1969,5199,5139,645
10,01310,251
10,14610,11510,18410,24610,27310,26110,33310,39010,36610,397
10,44610,44110,420
9,94610,12510,06810,14410,10810,11010,29510,44210,65011,218
10,29210,21010,314
Finance
L,394L,586L ,641L ,7111,736L,7961,8611,957
•
1,9211,931L.9401,9521,9671,9801,9861,993L.9931,988
L,993L,9931,997
L ,9211,9411,9501,9721,9972,0001,9761,9731,9731,978
1,9731,9831,997
Service
4,0554,6214,8074,9255,0005,0985,2075,280
5,2575,2665,2705,2815,3025,2995,2855,3035,2925,290
5,2995,3025,304
5,1785,2665,3235,3605,3825,3785,3645,3035,2665,237
5,1935,1965,224
Federal,State, and
localgovernment
5,9675,6075,4565,6145,8375,9926,3736,633
6,6006,5706,5996,6296,6596,6526,6406,6886,7176,712
6,6926,6576,622
6,6276,6306,6296,5876,4566,4276,6166,7046,7427,095
6,6756,6306,650
19451946194719481949195019511952
SEASONALLY ADJUSTED
1952—MarchAprilMayJuneJulyAugustSeptemberOctoberNovemberDecember
1953—JanuaryFebruaryMarch
UNADJUSTED
1952—MarchAprilMayJuneJulyAugustSeptemberOctoberNovemberDecember
1953—JanuaryFebruaryMarch
40,06941,41243,43844,38243,29544,69647,20247,993
47,68047,62447,67047,47147,33648,03948,40648,66448,85748,957
49,00949,10949,113
47,11847,43047,43947,41847,07848,15848,89249,09549,31050,140
48,37948,36748,651
15,30214,46115,29015,32114,17814,96716,08216,209
16,09716,14316,08215,77115,60916,15116,41216,54616,75516,870
16,93017,02717,118
16,06115,99415,85515,62415,40216,28016,68016,77816,87416,952
16,86717,00217,087
NOTE.—Data include all full- and part-time employees who worked during, or received pay for, the pay period ending nearest the 15th of themonth. Proprietors, self-employed persons, domestic servants, unpaid family workers, and members of the armed forces are excluded. March1953 figures are preliminary. The series without seasonal adjustment for recent years were revised by the Bureau of Labor Statistics in April1953 to first-quarter 1951 benchmark levels indicated by data from government social insurance programs, and seasonal factors were reviewedby Federal Reserve. Back unadjusted data are available from the Bureau of Labor Statistics, seasonally adjusted figures beginning January1939 may be obtained from the Division of Research and Statistics.
LABOR FORCE, EMPLOYMENT, AND UNEMPLOYMENT[Bureau of the Census estimates without seasonal adjustment. Thousands of persons
Year or month
19451946 . .194719481949195019511952
1952—April .MayJuneJuly. .AugustSeptemberOctoberNovemberDecember
1953—JanuaryFebruaryMarchApril
Total non-institutionalpopulation
105,370106 370107,458108,482109 623110,780111,924
(2)
112 844112,946113 050113,158113,265113,374113,494
(2)(2)
(2)(2)
Totallaborforce
65,14060,82061,60862,74863,57164,59965,832
(2)
65,26066,29867 88467,64267,41967,16666,566
(2)
(2)(2)
14 years of age and over]
Civilian labor force
Total
53,86057,52060,16861,44262,10563,09962,88462,966
61,74462,77864,39064,17663,95863,69863,14663,64662,921
62,41662,71263,13462,810
Employed 1
Total
52,82055,25058,02759,37858,71059,95761,00561,293
60,13261,17662,57262,23462,35462,26061,86262,22861,509
60,52460,92461,46061,228
In nonagricul-tural industries
44,24046,93049,76151,40550,68452,45053,95154,488
53,72054,21654,40254,63655,39054,71254,58855,45455,812
55,07255,55855,74055,158
Inagriculture
8,5808.3208,2667,9738,0267,5077,0546,805
6,4126,9608,1707,5986,9647,5487,2746,7745,697
5,4525,3665,7206,070
Unem-ployed
1,0402,2702,1422,0643,3953.142
]
,879,673
,612,602,818,942,604,438,284,418
1,412
1,892L ,788,674
1,582
Not in thelabor force
• 40,23045,55045,85045,73346,05146,18146,09246,710
47,58446,64845,16645,51645,84646,20846,92846,55247,394
48,23248,22448,07647,490
includes self-employed, unpaid family, and domestic service workers.2Current data available six months later than for other series when armed forces figures, withheld for reasons of security, are released.NOTE.—Details do not necessarily add to group totals. Information on the labor force status of the population is obtained through inter-
views of households on a sample basis. Data relate to the calendar week that contains the eighth day of the month. Back data are availablefrom the Bureau of the Census.
524 FEDERAL RESERVE BULLETIN
Digitized for FRASER http://fraser.stlouisfed.org/ Federal Reserve Bank of St. Louis

VALUE OF NEW CONSTRUCTION ACTIVITY
[Adjusted for seasonal variation. In millions of dollars]
Year or month
19391940 . .194119421943194419451946194719481949195019511952
1952—AprilMay . .JuneJulyAugustSeptemberOctoberNovemberDecember
1953—JanuaryFebruaryM archApril P . . . . . . .
Total
8,1988,682
11,95714,0758,3015,2595,633
12,00016,68921,67822,78928,74931,02532,329
2,7792,7012,6832,6402,6342,6542,6602,6992,738
2,7682,9142 9792,926
Private
Total
4,3895,0546,2063,4151,9792,1863,2359,638
13,25616,85316,38421,61021,68421,785
1,8571,7981,7731,7841,7891,7941,8121,8461,864
1,8681,9652,0392,006
Resi-dential
2,6802,9853,5101,715
885815
1,1004,0156,3108,5808,267
12,60010,97311,101
953902885896902911942973992
9501,0151 ,0631,002
Business
Total
1,2291,5612,0821,287
759989
1,6724,1954,8965,6935,3225,6807,1837,343
620613612611611608597596602
646672693696
Indus-trial
254442801346156208642
1,6891,7021,397
9721,0622,1172,298
211199189187186182176175172
186195208210
Com-mercial
2923484091553356
2031,132
8561,2531,0271,2881,3711,095
80848484889399
105109
1251341301 2 4 •
Publicutility
683771872786570725827
1,3742,3383,0433,3233,3303,6953,950
329330339340337333322316321
335343355362
Othernon-resi-den-tial
480508614413335382463
1,4282,0502,5802,7953,3303,5283,341
284283276277276275273277270
2722 78283288
Public
Total
3,8093,6285,751
10,6606,3223,0732,3982,3623,4334,8256,4057,1399,341
10,544
922903910856845860848853874
900949940920
Mili-tary
125385
1,6205,0162,550
837690188204158137177
1,0191,346
12012412310910710098
103116
130127132121
High-way
1,3811 3021,066
734446362398895
1,4511,7742,1312,3812,4002,700
246225231222220235228207207
214264255239
Conser-vation
570528500357285163130240394629793881860838
767471676465646365
68687072
Allother
1,7331,4132,5654,5533,0411,7111,1801,0391,3842,2643,3443,7005,0625,660
480480485458454460458480486
488490483488
Preliminary. Source.—Joint estimates of the Departments of Commerce and Labor.
CONSTRUCTION CONTRACTS AWARDED, BY TYPE OF OWNERSHIP AND BY TYPE OF CONSTRUCTION[Figures for 37 States east of the Rocky Mountains, as reported by the F. W. Dodge Corporation. Value of contracts in millions]
Year or month
1945 .194619471948...19491950 ..19511952 . . . . .
1952—MarchAprilM a yJuneJulyAugustSeptemberOctober . .NovemberDecember
1953—January .February . . . . .March
Total
3,2997,4907,7609,430
10,35914,50115,75116,775
1,3211,5981,5641,4891,5111,4392,0291,3211,2491,467
1,0761,0211,348
By type ofownership
Public
1,3111,7542,2963,1073,7184,4096,1226,711
554636558559619501
1,269410491478
450351
Private
1,9885,7355,4646,3236,641
10,0929,629
10,064
767961
1,006930893937760911758990
626671
By type of construction
Resi-dentialbuilding
5633,1423,1543,6084,2396,7416,2056,668
593682754582608628519602528439
460419605
Nonresidential building
Fac-tories
1,0271,317
941840559
1,1422,8832,562
120205
79166140142995113117313
7689
105
Com-mercial
346773785975885
1,208915979
71758074929487
10385
100
87100101
Educa-tional
100221392725824
1,1801,3351,472
11913414612712214587
126117146
106102124
Other
377404597
1,1271,3761,6511,6891,686
15414815818420813993
138143154
13883
120
Publicworksand
publicutilities
8851,6311,8902,1552,4762,5782,7233,408
265354347356341291248238259316
209228293
CONSTRUCTION CONTRACTS AWARDED, BY DISTRICTS[Figures for 37 States east of the Rocky Mountains, as reported by the F. W. Dodge Corporation. Value of contracts, in thousands of dollars]
Month
1952—JanuaryFebruaryMarch
1953—JanuaryFebruaryMarch
Total(11 dis-tricts)
902,091885,206
1,321,254
1,075,8681,021,3101,347,518
Federal Reserve district
Boston
38,40240,64961,959
100,86451,38671,433
NewYork
133,898c169,440220,869
154,306181,532246,228
Phila-delphia
54,38839,81962,868
90,57660,79173,368
Cleve-land
69,22077,168
121,483
96,756100,690158,951
Rich-mond
82,23498,910
132,814
110,437106,229110,018
Atlanta
180,381116,133181,819
117,354159,856127,304
Chicago
114,783126,042190,559
153,509137,100271,977
St.Louis
64,17946,255
102,236
53,31456,65480,265
Minne-apolis
28,94423,50445,015
20,55018.57347,355
KansasCity
59,47257,34260,802
78,87742,62872,775
Dallas
76,19089,944
140,830
99,325105,87187,844
s Corrected.
MAY 1953 525
Digitized for FRASER http://fraser.stlouisfed.org/ Federal Reserve Bank of St. Louis
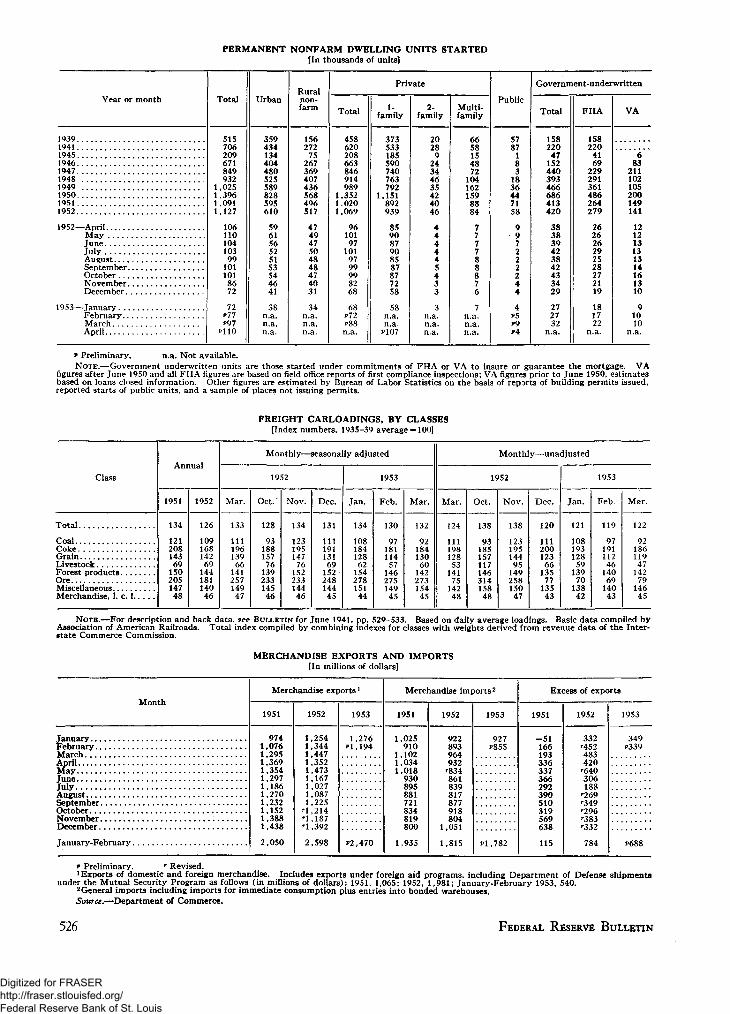
PERMANENT NONFARM DWELLING UNITS STARTED[In thousands of units]
Year or month
19391941L94519461947 .19481949 .19501951 .1952. .
1952—AprilM a yJune . . . .JulyAugustSeptemberOctoberNovember. .December
1953—TanuaryFebruary . . .MarchApril
Total
515706209671849932
1.0251,3961 .0911.127
10611010410399
1011018672
72P77P97
P110
Urban
359434134404480525589828595610
596156525153544641
38n.a.n.a.n.a.
Ruralnon-farm
156272
75267369407436568496517
474947504848474031
34n.a.n.a.n.a.
Private
Total
458620208663846914989
1,3521.0201.069
9610197
1019799998268
68P72P88n.a.
1-family
373533185590740763792
1,151892939
859087908587877258
58n.a.n.a
P107
2-family
20289
24344635424046
444445433
3n.a.n.a.n.a.
Multi-family
6658154872
1041621598884
777788876
7n.a.n an.a.
Public
5787
183
1836447158
997222244
4P5P9? 4
Government-underwritten
Total
158220
47152440393466686413420
383839423842433429
272732
n.a.
FHA
158220
4169
229291361486264279
262626292528272119
181722
n.a.
VA
683
211102105200149141
121213131314161310
91010
n.a.
* Preliminary. n.a. Not available.NOTE.—Government underwritten units are those started under commitments of FHA or VA to insure or guarantee the mortgage. VA
figures after June 1950 and all FHA figures are based on field office reports of first compliance inspections; VA figures prior to June 1950, estimatesbased on loans closed information. Other figures are estimated by Bureau of Labor Statistics on the basis of reports of building permits issued,reported starts of public units, and a sample of places not issuing permits.
FREIGHT CARLOADINGS, BY CLASSES[Index numbers, 1935-39 average =100]
Class
Total
CoalCokeGrainLivestock . . .Forest productsOreMiscellaneousMerchandise, 1. c. 1
Annual
1951
134
12120814369
15020514748
1952
126
10916814269
14418114046
Monthly—seasonally adjusted
1952
Mar.
133
11119613966
14125714947
Oct.'
128
9318815776
13923314546
Nov.
134
12319514776
15223314446
Dec.
131
11119113169
15224814445
1953
Jan.
134
10818412862
15427815144
Feb.
130
9718111457
14627514945
Mar.
132
9218413060
14227315445
Monthly—unadjusted
1952
Mar.
124
11119812853
14175
14248
Oct.
138
9318515711714631415848
Nov.
138
12319514495
14925815047
Dec.
120
11120012366
13577
13543
Jan.
121
10819312859
13970
13842
1953
Feb.
119
9719111246
14069
14043
Mar.
122
9218611947
14279
14645
NOTE.—For description and back data, see BULLETIN for June 1941, pp. 529-533. Based on daily average loadings. Basic data compiled byAssociation of American Railroads. Total index compiled by combining indexes for classes with weights derived from revenue data of the Inter-state Commerce Commission.
MERCHANDISE EXPORTS AND IMPORTS[In millions of dollars]
Month
FebruaryMarchAprilMay
July
OctoberNovember
January-February
Merchandise exports1
1951
974,076,295,369
L.3541,2971,1861,270L ,232L.1521,3881.438
2,050
1952
1.254
rr
,344,447,352
L.473L ,1671,0271,0871,225
,214L 187
.392
2,598
1953
1 ,276Pl,194
P2.470
Merchandise imports2
1951
1,025910
1,1021,0341,018
930895881721834819800
1,935
1952
922893964932
••834861839817877918804
1 051
1,815
1953
927P855
Pl.782
Excess of exports
1951
—51166193336337366292390510319569638
115
1952
332'452483420
••640306188
r269r349r296r383r332
784
1953
349P339
P688
* Preliminary. r Revised.Exports of domestic and foreign merchandise. Includes exports under foreign aid programs, including Department of Defense shipments
under the Mutual Security Program as follows (in millions of dollars): 1951, 1,065; 1952, 1,981; January-February 1953, 540.2 General imports including imports for immediate consumption plus entries into bonded warehouses.Source.—Department of Commerce.
526 FEDERAL RESERVE BULLETIN
Digitized for FRASER http://fraser.stlouisfed.org/ Federal Reserve Bank of St. Louis
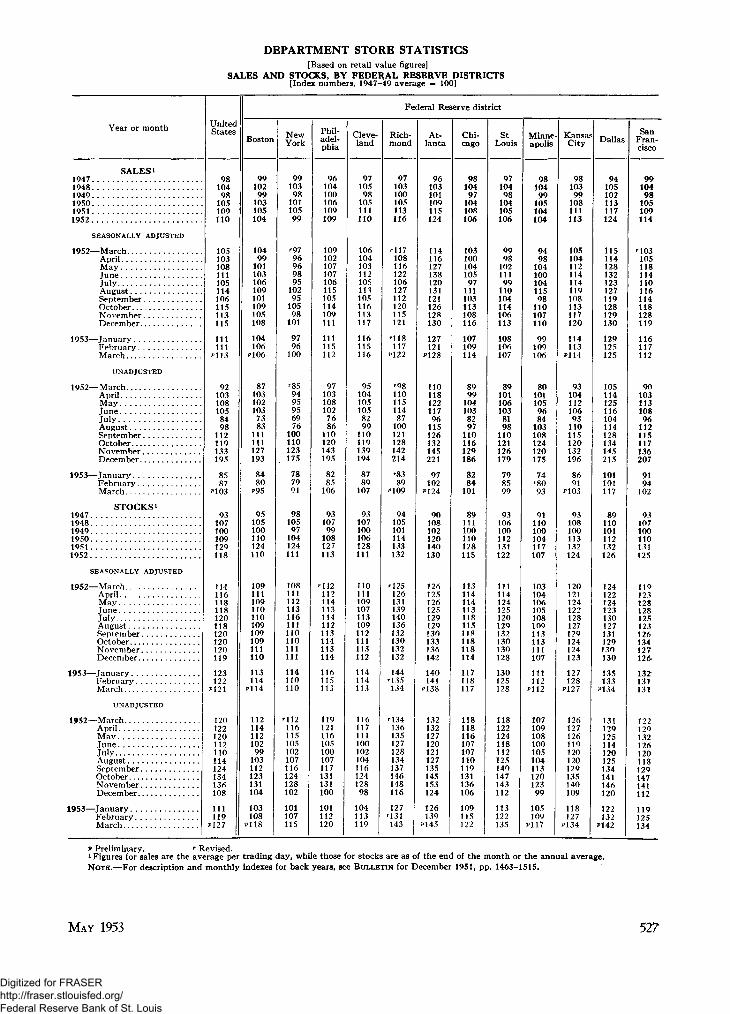
DEPARTMENT STORE STATISTICS[Based on retail value figures]
SALES AND STOCKS, BY FEDERAL RESERVE DISTRICTS[Index numbers, 1947-49 average = 100]
Year or month
SALESi19471948194919501951 . .1952
SEASONALLY ADJUSTED
1952—MarchAprilMavJuneJulvAugustSeptemberOctoberNovemberDecember
1953—TanuaryFebruaryMarch
UNADJUSTED
1952—MarchAprilMayJuneJulyAugustSeptemberOctoberNovemberDecember
1953—JanuaryFebruaryMarch
STOCKS i194719481949195019511952
SEASONALLY ADJUSTED
1952—MarchAprilMayJuneJulyAugustSeptemberOctoberNovember . . .December
1953—JanuaryFebruaryMarch
UNADJUSTED
1952—MarchApril . . .MavJuneJulvAugustSeptemberOctoberNovemberDecember
1953—JanuaryFebruary ....March
UnitedStates
9810498105109110
105103108111105114106115113115
111111
P113
921031081058498112119133195
8587
*>103
93107100109129118
114116118118120118120120120119
123122
P121
120122120112110114124134136108
111119
P127
Federal Reserve district
Boston
9910299103105104
10499101103106109101109105108
104106
P106
871031021037383111111127193
8480P95
95105100110124110
109111109110110109109109111110
113114
P114
11211411210299103112123131104
103108
P118
NewYork
991039810110599
r97969698951029510598101
9796100
'859495956976
100110123175
787991
9810597104124111
108111112113116111110110111111
114110110
'112116115105102107116124128102
101107115
Phil-adel-phia
96104100106109109
109102107107106115105114109111
111115112
971031081027686110120143195
8285106
9310799108127113
'112112114113114112113114113114
116115113
119121116105100107117131131100
101112120
Cleve-land
9710598105111110
106104103112105in105116113117
116115116
951041051058299110119139194
8789107
93107100106128111
noin109107113109112111113112
114114113
11611711110010210411612412898
104113119
Rich-mond
97103100105113116
'117108116122106127112120115121
'118117P122
'9811011511487100121128142214
'8389
P109
94105101114133132
'125126131139140136132130132132
144'135134
'134136135127128134137146148116
127'131143
At-lanta
96103101109115124
114116127138120131121126128130
127121P128
11011812211796115126132145221
97102P124
90108102120140130
126125126125129129130133136142
140141P138
132132127120121127135145153124
126139
P145
Chi-cago
9810497104108106
10310010410597111103113108116
107109114
89991041038297110116129186
8284101
89111100110128115
113114114113118115118118118114
117118117
118118116107107110119131136106
109115122
StLouis
9710498104105106
999810211199110104114106113
108106107
891011061038198110121126179
798599
93106100112131122
111114124125120129132130130128
130125128
118122124118112125140147143112
113122135
Minneapolis
9810499105104104
949810410010411598110107110
99109106
801011059684103108124120175
74'8093
91110100104117107
103104106105108109113113111107
111112
P112
10710910810010510411312012399
105109
*>117
KansaCity
9810399108111113
105104112114114119108113117120
114113
j>114
9310411210693110115120132196
8691
P103
93108100113132124
120121124122128127129124124123
127128
P127
126127126119120120129135140109
118127P134
Dallas
94105102113117124
115114128132123127119128129130
129125125
1051141251161041141?8134145215
101101117
89110101112132126
124122124123130127131129130130
135133P134
131129125114120125134141146120
122132
*>142
SanFran-cisco
9910498105109114
'103105118114110116114118128119
116117112
9010311310896112115117136207
9194102
93107100110131125
119123128128125123126134127126
13213t131
122
PQ132126120118129147141112
119125134
P Preliminary. r Revised.1 Figures for sales are the average per trading day, while those for stocks are as of the end of the month or the annual average.NOTE.—For description and monthly indexes for back years, see BULLETIN for December 1951, pp. 1463-1515.
MAY 1953 527
Digitized for FRASER http://fraser.stlouisfed.org/ Federal Reserve Bank of St. Louis
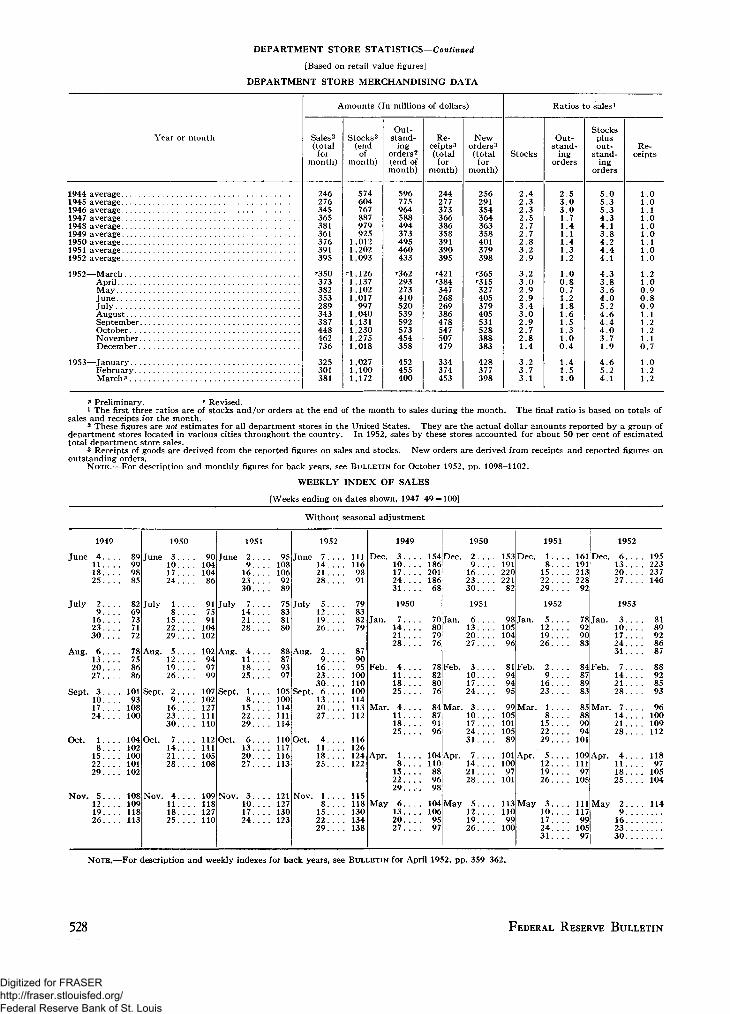
DEPARTMENT STORE STATISTICS—Continued
[Based on retail value figures]
DEPARTMENT STORE MERCHANDISING DATA
Year or month
Amounts (In millions of dollars)
Sales2(totalfor
month)
Stocks2
(endof
month)
Out-stand-ing
orders2(end ofmonth)
596775964588494373495460433
••362293273410520539592573454358
452455400
Re-ceipts3(totalfor
month)
244277373366386358391390395
'421'384347268269386478547507479
334374453
Neworders3
(totalfor
month)
Ratios to sales1
Stocks
Out-stand-
ingorders
Stocksplusout-
stand-ing
orders
Re-ceipts
1944 average1945 average1946 average1947 average1948 average1949 average1950 average1951 average1952 average
1952—MarchAprilMayJuneJulyAugustSeptemberOctoberNovemberDecember
1953—JanuaryFebruaryMarch?
246276345365381361376391395
'350373382353289343387448462736
325301381
574604767887979925
1,0121,2021,093
"1,1261,1371,1021,017997
1,0401,1311,2301,2751,018
1,0271,1001,172
256291354364363358401379398
'365'315327405379405531528388383
428377398
2.42.32.32.52.72.72.83.22.9
3.23.02.92.93.43.02.92.72.81.4
3.23.73.1
2.53.03.01.71.41.11.41.31.2
1.00.80.71.21.81.61.51.31.00.4
1.41.51.0
5.05.35.34.34.13.84.24.44.1
4.33.83.64.05.24.64.44.03.71.9
4.65.24.1
.0
.0
.1
.0
.0
.0
.1
.0
.0
1.21.00.90.80.9
.1
.2
.2
.1
.7
.0
.2
.2
v Preliminary. ' Revised.1 The first three ratios are of stocks and/or orders at the end of the month to sales during the month. The final ratio is based on totals of
sales and receipts for the month.2 These figures are not estimates for all department stores in the United States. They are the actual dollar amounts reported by a group of
department stores located in various cities throughout the country. In 1952, sales by these stores accounted for about 50 per cent of estimatedtotal department store sales.
3 Receipts of goods are derived from the reported figures on sales and stocks. New orders are derived from receipts and reported figures onoutstanding orders.
NOTE.—For description and monthly figures for back years, see BULLETIN for October 1952, pp. 1098-1102.
WEEKLY INDEX OF SALES
[Weeks ending on dates shown, 1947-49 = 100]
Without seasonal adjustment
June
July
Aug.
Sept.
Oct.
Nov.
1949
4. . . .111825
2. . .916 .23... .30
6132027
3. . .
10...17. . . .24
18. . .1522. ..29
5121926 . .
89999885
8269737172
78758686
10193108100
104102100101102
108109118113
June
July
Aug.
Sept.
Oct.
Nov.
1950
3. . .10. . .17. . .24. ..
18. . .1522. . . .29. . . .
5. . .12. ..19. ..26. . .
2. . .9...
16. . .23. ..30. . .
7. . . .14. . .21. ..28. ..
411. ..1825. .
9010410486
917591104102
102949799
107102127111110
112111105108
109118127110
June
July
Aug.
Sept.
Oct.
Nov.
1951
29. ...162330....
714....2128
4
18*. '. '. '.25
1
8....152229
6132027
3101724 . .
951081069289
75838180
88879397
105100114111114
110117116113
1?1127130123
June
July
Aug.
Sept.
Oct.
Nov.
1952
7. ...14....21 ....28
512. ...1926
2Q16.'.'.'.23306132027
4111825
1 . .81522. ...29....
Ill1169891
79838279
879095100110100114113112
116126124122
115118130134138
Dec.
Jan.
Feb.
Mar.
Apr.
May
1949
310....1724....31
1950
7. ...14....2128
4111825
4111825
18152229....
613. ...2027
15418620118668
70807976
78828076
84879196
104110889698
1041069597
Dec.
Jan.
Feb.
Mar.
Apr.
May
1950
2. . . .9. . . .16. . . .23. . . .30
1951
6. . . .13. . . .2027
3. . . .101724. . . .
3101724....31
71421. . . .28
5. . . .12. . . .19....26. . . .
15319122022182
9810510496
81949495
9910510110589
10110097101
11311099100
Dec.
Jan.
Feb.
Mar.
Apr.
May
1951
1. . .8. . .
15. . .22. ..29. ..
1952
5. . . .12....1926. . . .
2. . . .9
16. . .23.
1 ...8152229
51219. ..26
3. . .10. . .17. . .24 .31. ..
16119121322892
78929083
84878983
85889094101
10911197105
1111179910597
Dec.
Jan.
Feb.
Mar.
Apr.
May
1952
6. ...132027. ...
1953
3101724....31
714....2128
7. ...14....2128
4111825
29162330
195223237146
8189928687
88928593
96100109112
11897105104
114
NOTE.—For description and weekly indexes for back years, see BULLETIN for April 1952, pp. 359-362.
528 FEDERAL RESERVE BULLETIN
Digitized for FRASER http://fraser.stlouisfed.org/ Federal Reserve Bank of St. Louis
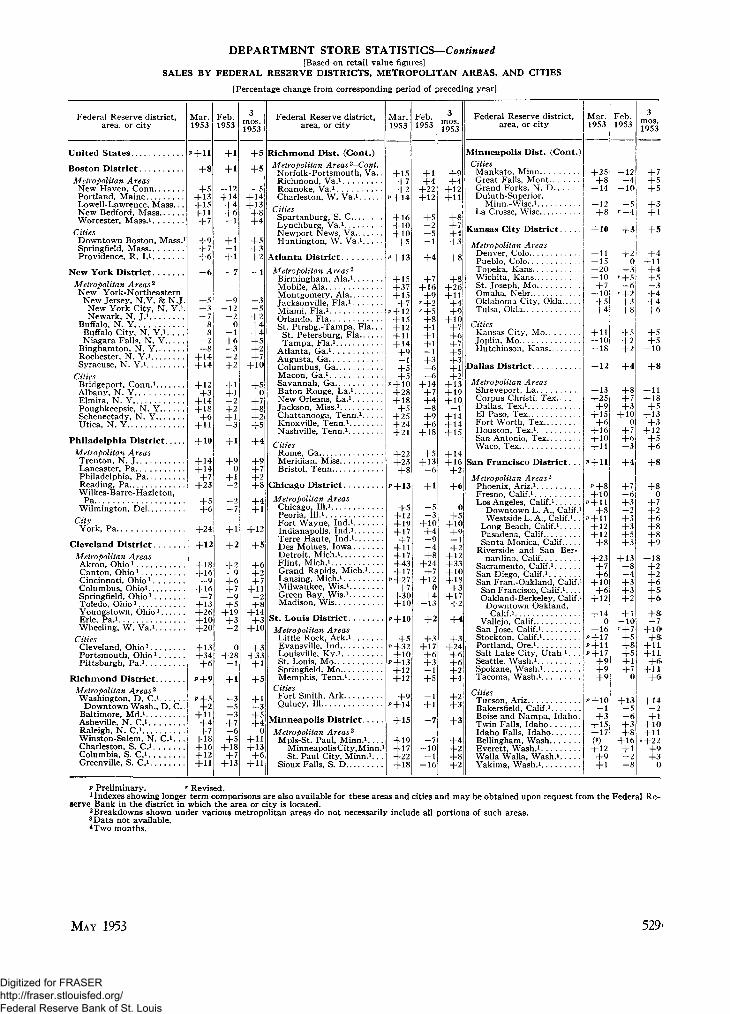
DEPARTMENT STORE STATISTICS—Continued[Based on retail value figures]
SALES BY FEDERAL RESERVE DISTRICTS, METROPOLITAN AREAS, AND CITIES
[Percentage change from corresponding period of preceding year]
Federal Reserve district,area, or city
United States
Boston DistrictMetropolitan AreasNew Haven, ConnPortland, MaineLowell-Lawrence, Mass.. .New Bedford, MassWorcester, Mass.1
CitiesDowntown Boston, Mass.1Springfield, MassProvidence, R. I.1
New York DistrictMetropolitan Areas2
New York-NortheasternNew Jersey, N.Y. & N J .New York City, N. Y.1.Newark, N. J.1
Buffalo, N. YBuffalo City, N. Y.1Niagara Falls, N. Y
Binghamton, N. YRochester, N. Y.iSyracuse, N. Y.1
CitiesBridgeport, Conn.1Albany, N .YElmira, N. YPoughkeepsie, N. YSchenectady, N. YUtica, N. Y
Philadelphia DistrictMetropolitan AreasTrenton, N. JLancaster, PaPhiladelphia, PaReading, PaWilkes-Barre-Hazleton,
PaWilmington, Del
CityYork, Pa
Cleveland DistrictMetropolitan AreasAkron, Ohio1
Canton, Ohio1
Cincinnati, Ohio1
Columbus, Ohio1
Springfield, Ohio1
Toledo, Ohio l
Youngstown, Ohiox
Erie, Pa.1Wheeling, W. Va.1
CitiesCleveland, Ohio *Portsmouth, Ohio1
Pittsburgh, Pa.1
Richmond DistrictMetropolitan Areas2
Washington, D. C.1Downtown Wash., D. C
Baltimore, Md.1
Asheville, N. C.iRaleigh, N. C.1Winston-Salem, N. C.1. . .Charleston, S. C.1Columbia, S. C.1Greenville, S. C.1
Mar.1953
p+11
+8
+5+ 13+ 15+ 11+7
+9+7+6
+6
+5+3+ 7+8+8+2+8
+ 14+ 14
+ 12+3
+ 14+ 18+6
+ 11+ 10
+ 14+ 14+7
+23
+5+6
+24
+ 12
+ 18+ 16+9
+ 16+7
+ 13+26+ 10+20
+ 13+34+6
P + 9
++2
+ 11+4+7
+ 18+ 16+ 12+ 11
Feb.1953
+ 1
+ 1
- 1 2+ 14+4+6
+ 1
+ 1
- 7
- 9- 1 2
- 20
- 1+6- 2
+2
+ 1+ 1+2+ 1- 3
+ 1
+90
+ 1
+ 1+2
+2- 9+6+7—9+5
+ 19+3
3mos.1953
+5
+5
+12+ 13+8+4
+5+3+2
- 1
+4+ 1
+ 12
+5
+6+2+7
+ 11+8
+ 14+3
+ 10
0+28
- 1
+ 1
- 3- 5- 3
+7- 6+5
+ 18
+ 13
+ 3+33+ 1+5
+ 1- 3+5+4
0+ 11+ 13
+ 6+ 11
Federal Reserve district,area, or city
Richmond Dist. (Cont.)Metropolitan Areas2-Cont.
Norfolk-Portsmouth, Va..Richmond, Va.1Roanoke, Va.1Charleston, W. Va.1
CitiesSpartanburg, S. CLynchburg, Va.1Newport News, VaHuntington, W. Va.1
Atlanta District
Metropolitan Areas2
Birmingham, Ala.1Mobile, AlaMontgomery, AlaJacksonville, Fla.1
Miami, Fla.1
Orlando, FlaSt. Ptrsbg.-Tampa, Fla.. .St. Petersburg, FlaTampa, Fla.1
Atlanta, Ga.1Augusta, GaColumbus, GaMacon, Ga.1Savannah, GaBaton Rouge, La.1New Orleans, La.1Jackson, Miss.1Chattanooga, Tenn.1
Knoxville, Tenn.1
Nashville, Tenn.1
CitiesRome, GaMeridian, MissBristol, Tenn
2
—5+2+4+4+5+2+7+ 10
+50
+7+8+21+5
+4
+9+7+2+8 Chicago District. . .
Metropolitan AreasChicago, 111.1Peoria, 111.1Fort Wayne, Ind.1
Indianapolis, Ind.1
Terre Haute, Ind-1
Des Moines, IowaDetroit, Mich.1Flint, Mich.1Grand Rapids, Mich.1.. . .Lansing, Mich.1Milwaukee, Wis.1Green Bay, Wis.1Madison, Wis
St. Louis DistrictMetropolitan AreasLittle Rock, Ark.1Evansville, IndLouisville, Ky.1St. Louis, MoSpringfield, MoMemphis, Tenn.1
CitiesFort Smith, ArkQuincy, 111
Minneapolis DistrictMetropolitan Areas2
Mpls-St. Paul, Minn.1Minneapolis City, Minn.1St. Paul City, Minn.1.. .
Sioux Falls, S. D
Mar.1953
+ 15+7+2
P + 1 4
+ 16+ 10+ 10+5
P + 1 3
+ 15+37+ 15+7
P + 1 2+ 15+ 12+ 11+ 14+9- 1+5+5
+ 10+28+ 18+5
+25+24+21
+22+23+8
+ 13
+5+ 12+ 19+ 17+7
+ 11+ 17+43+ 17
P + 2 7+7
+30+ 10
P + 10
+5P + 3 2
+ 10P + 1 3
+ 12+ 12
+9++ 15
+ 19+ 17+22+ 18
Feb.1953
+ 1+4
+22+ 12
+5- 2- 5- 1
+4
+ 7+ 16+9
r+2' +5+8+ 1+ 1+ 1
+3- 6—6
+ 14+ 7+4
+9+6
+ 18
+5+ 13
- 6+ 1
- 5- 3
+ 10+4- 9
^+8
+24+7
+1l+4-13
+2
+3+ 17+6+3- 1+5
- 1
+ 1- 7
- 7-10- 1
-16
mos.1953
+9+4
+ 12+ l
+ 7+4+3
+8
+8+26+ 11+4+9
+ 10+7+6+7+5+3+ 1+2
+ 13+ 19!
Minneapolis Dist. (Cont.)CitiesMankato, MinnGreat Falls, MontGrand Forks, N. DDuluth-Superior,
Minn.-Wise.1La Crosse, Wise
Kansas City District
Metropolitan AreasDenver, ColoPueblo, ColoTopeka, KansWichita, KansSt. Joseph, MoOmaha, NebrOklahoma City, OklaTulsa, Okla
- 1+ 14+14;+ 1.5
+ 14+ 16!+2
+6
0+5
+ 10+9+2
+ 12+33+ 10+ 18+3
+ 17+2
+4
+3+24+6+6+2+4
+2+3+3
+4+2+8+2
Federal Reserve district,area, or city
CitiesKansas City, MoJoplin, MoHutchinson, Kans
Dallas District
Metropolitan AreasShreveport, LaCorpus Christi, Tex.. .Dallas, Tex.1.El Paso, TexFort Worth, TexHouston, Tex.1San Antonio, Tex.. . .Waco, Tex
San Francisco District. . .
Metropolitan Areas2
Phoenix, Ariz.1Fresno, Calif.1Los Angeles, Calif.1
Downtown L. A., Calif.1WestsideL.A., Calif.i..
Long Beach, Calif.1Pasadena, CalifSanta Monica, Calif
Riverside and San Ber-nardino, Calif
Sacramento, Calif.1San Diego, Calif.1San Fran.-Oakland, Calif.1San Francisco, Calif.1Oakland-Berkeley, Calif.iDowntown Oakland,Calif.1
Vallejo, CalifSan Jose, Calif.1Stockton, Calif.1Portland, Ore.1Salt Lake City, Utah i. . .Seattle, Wash.1Spokane, Wash.1Tacoma, Wash.1
CitiesTucson, ArizBakersfield, Calif.1Boise and Nampa, Idaho.Twin Falls, IdahoIdaho Falls, IdahoBellingham, WashEverett, Wash.1Walla Walla, Wash.1Yakima, Wash.1
Mar.1953
+25+8
+ 14+ 12
+ 8
+ 10
+ 11+ 15+20+ 10+ 7
+ 10+5+4
+ 11+ 10+ 18+ 12
+ 13+25
+9+ 15
+6+ 16+ 10+ 11
P + 1 1
P + 8
+ 10P+11
+8p + 11
+ 12+ 12+8
+23+7+6
+ 10+6
+ 12+ 14
0+ 16
P+17P + 11P + 1 7
+9+9+9
P + 1 0- 1+3
+ 15+ 17(3)+ 12+9+ 1
Feb.1953
- 1 2- 4
- 1 0
c
r _ 4
+3
+20
- 3r+5
—6r+2+3+8
+5+2+2
+4
+8+ 7+3
+ 100
+ 7+6- 3
+4
+ 7- 6+3- 2+3+3+5+5
+ 13- 8- 4+3+3+2+ 1
- 1 0r+7+5+8+5+ 1+7
0
+ 13—5- 6+3+8
+ 16+ 1- 2- 8
1953
+ 7+5+5
+3+ 1
+5
+4+ 11+4+5- 3+4+4+6
+5+5
+ 10
+8
+ 11+ 18+5
+ 13+3
+ 12+5+6
+8
+80
+ 7+2+6+8+8+9
+ 18+2+2+6+5+6.
+1O+s
+11+111+6
+ 111+
+ 14+ 1
+ 10+ 11
J+22+9+3
0
p Preliminary. r Revised.1 Indexes showing longer term comparisons are also available for these areas and cities and may be obtained upon request from the Federal Re-
serve Bank in the district in which the area or city is located.2 Breakdowns shown under various metropolitan areas do not necessarily include all portions of such areas.3 Data not available.4Two months.
MAY 1953 529-
Digitized for FRASER http://fraser.stlouisfed.org/ Federal Reserve Bank of St. Louis

DEPARTMENT STORE STATISTICS—ContinuedSALES AND STOCKS BY MAJOR DEPARTMENTS
[Based on retail value figures]
Department
GRAND TOTAL—entire store3
MAIN STORE—total
Piece goods and household textiles
Piece goodsSilks, velvets, and syntheticsWoolen yard goodsCotton yard goods
Household textilesLinens and towelsDomestics—muslins, sheetingsBlankets, comforters, and spreads
Small wares
Laces, trimmings, embroideries, and ribbons... .NotionsToilet articles, drug sundries
Silverware and jewelrySilverware and clocks4
Costume jewelry4
Fine jewelry and watches4
Art needlework
Books and stationeryBooks and magazinesStationery
Women's and misses1 apparel and accessories.
Women's and misses' ready-to-wear accessories. .Neckwear and scarfsHandkerchiefsMillineryWomen's and children's glovesCorsets and brassieresWomen's and children's hosiery
Underwear, slips, and negligeesKnit underwearSilk and muslin underwear, and slipsNegligees, robes, and lounging apparel
Infants' wearHandbags, and small leather goods
Women's and children's shoesChildren's shoes4
Women's shoes4
Women's and misses' ready-to-wear apparel. . . .Women's and misses' coats and suits
Coats4
Suits4
Juniors' and girls' wearJuniors' coats, suits, and dressesGirls' wear
Women's and misses' dressesInexpensive dresses4
Better dresses4
Blouses, skirts, and sportswearAprons, housedresses, and uniformsFurs
Men's and boy's wear
Men's clothingMen's furnishings and hatsBoy's wearMen's and boy's shoes and slippers
Num-ber ofstoresreport-
ing
362
362
325
300207178196
315286262251
348
201245331
32522228991
238
284134247
359
358318283167332347349
352251300272
339341
251223231
357348238229
328287326
351275284
349300269
341
275323315208
Percentagechange from a
year ago
Salesduringperiod
Feb.1953
0
0
-3
s
-11+5-1
-2-2-4
-6-5+2
-2-9+5-6
-3
+5+3+7
+2+ 7-1-2—4+6-2
+2+4
+2+4+4+ 1+4
+ 1+ 10
+3
+4+2+ 7
-3-2-3
+4+3-15
+3
+2+3+7+5
Twomonths1953
-7-12+4-4
20
-5
+ 1-5-4+2
0-5+5+ 1
-3
++5+8
+ 1+2+9-3-1-3+6
0+2-1+20
+3+4+4+4
+ 10
+2+4+2+5
-2-2-2
+5+3-10
+2
-1+2+5+4
Stocks(end ofmonth)
Feb.1953
+3
+3
+2
-1-3-7+6
+4-3+38+9
+4
+7+6+4
03+3+
+ 13+8+ 13
+8
+9+ 10
3+ 13+ 14+9+7+ 12+3+6
+ 13+9
+ 10+ 13+9
+7+7+8+3
+ 11+6+ 15+2+5
+9+8+4
+3
-4+4+ 14+ 10
Ratio ofstocks tosales1
February
1953
3.9
4.1
4.7
3.83.84.03.7
5.35.66.15.4
4.3
4.74.83.8
5.88.53.210.7
4.4
3.42.63.8
3.4
4.02.74.01.75.33.62.8
3.73.84.02.7
3.93.4
6.67.66.4
2.82.42.22.7
3.12.43.9
2.31.92.7
3.12.45.2
5.9
6.45.26.17.4
3.8
4.0
4.4
3.73.54.63.4
5.05.74.35.0
4.1
4.14.33.8
5.78.03.310.0
4.2
3.12.43.5
3.2
2.64.01.45.23.42.5
3.53.43.92.6
3.63.2
6.26.86.1
2.62.32.02.7
2.92.33.6
2.21.72.7
3.02.34.3
5.9
6.75.25.87.0
Index numberswithout seasonal adjustment,
1941 average monthly sales = 100 2
Sales duringperiod
1953
Feb. Jan.
166
147
188158187215
127121138123
156
161172143
147
186173180
169
163243109144104238123
155198135152
218138
176
176204
195195205
163
20916978
131
137126134136
183
276
182150196218
323294473239
167
158201158
138
188
189182185
178
16221491114105276118
158221140155
222120
195245
177195167
220201124
154
200128127157
1952
Feb.
166
152
198176178218
129124144122
156
172181139
147
151
177168169
167
160226110146109224126
152190134151
214133
170
175202
187191192
168
20116492
127
135122125130
Stocks at endof month
1953
Feb. Jan
684
687
723603755797
667681844662
671
754822549
837
643
627448680
574
653644429244556863344
574746536410
858464
1,161
492495
605464806
380
653411409
771
871652817
1,004
650
692
702578813768
672740662711
661
670792560
808
626
639487694
522
588530413175483810317
537706521428
768401
1,043
450442
514415658
344
601392428
710
800620683910
1952
Feb.
667
684
744616810754
649709613607
644
712777528
846
632
557414602
534
599591440220559760316
538655522383
766426
1,065
463467
543435698
376
600380398
750
908627713915
For footnotes see following page.
530 FEDERAL RESERVE BULLETIN'
Digitized for FRASER http://fraser.stlouisfed.org/ Federal Reserve Bank of St. Louis

DEPARTMENT STORE STATISTICS—ContinuedSALES AND STOCKS BY MAJOR DEPARTMENTS—Continued
[Based on retail value figures]
Department
IIomefurnishin£sFurniture and bedding
Mattresses, springs, and studio beds4
Upholstered and other furniture4
Domestic floor coveringsRugs and carpets4
Linoleum 4
Draperies, curtains, and upholsteryLamps and shadesChina and glasswareMajor household applicancesHousewares (including small appliances)Gift shop4 '
Radios, phonographs, television, records, etc.4
Radios, phonographs, television4
Records, sheet music, and instruments4 . . . .
Miscellaneous merchandise departments. .
Toys, games, sporting goods, camerasTONS and gamesSporting goods and cameras
Luggage
Candy4
BASEMENT STORE total
Domestics and blankets1
Women's and misses' ready-to-wear
Intimate apparel4
Hosiery 4
Underwear, corsets and brassieres4
Coats and suits4
Dresses4
Blouses, skirts, and sportswear4
Girls' wear4
Infants' wear4
Aprons, housedresses, uniforms4
Men's and boy's wear
Men's wear4
Men's clothing4
Men's furnishings4
Boy's wear4
Homef urnishings
Shoes
NONMERCHANDISE— total4
Barber and beauty shop4
Num-ber ofstores
report-ing
326
253184190
28216387
307257259237269189
230173120
330
309252153
280189
200
139
192
165125123178
,| 177. 156.1 1.27. ! 126
.; in
. i 165
.1 152
. ! 105
. ! 122j
. ; 123
.1 107!
J 114
. 187
.! 83
Percentagechange from a
year ago
Salesduringperiod
Feb.1953
Twomonths
1953
Stocks(end of I Februarymonth)!
Feb. ! 1953 1952
++5 :
- 1
- i-24
- 3 !A •
- 1 !— 2 i
- 6 i- 1 0 !+4 |
- 4 i
+6+4
_2- 2
- 3
- 2
- 3
- 1- 3+ 1
+2+8+ 1
- 1 0
- 1- 2- 1
+ 7
- 1 0
- 3
- 1
- 6
- 1
+2
+
- 3 I- 2 !
"17 I
u!- 5 '
it!- 6— 7— 7
2
- 2 i 4.4
+ 1+6+2— 5- 3- 7
3.6 !2.04.1
5.25.25.2
+4+6+3
- 2 1- 1+8
5 .34 . 48 .03 . 64 . 76 .4
4.5
3.62.04.0
5.35.2
Index numberswithout seasonal adjustment,
1941 average monthly sales = 100 2
Sales duringperiod
Feb.
- 9 1 3.2-14 2.8
0 4.8
+4 3.9
+ 10 !+6 I
+ 11 i
+6+ 13+ 1
8.79 .28 .1
- 4 I
- 3 !I
- 4 '!
- 3 i
il- 1 0+ 2
- 1 1
- 1
- 2- 1- 2
+4
- 9
- 1
- 1
- 5
-MI+ 18 |
5.81.3
196
232
174
Jan.
203 198
230
179 ! 176
Stocks at endof month
1953
Feb.
880
894
+ 5 | 3 . 2
+ 9 I 3 . 7
+ 9 I 2.4+ 2+5+6+ 7+ 2 !
+ 14 !+24 i+ 16 |+ 11+6+4+2+5
+ 12
- 5
+5
2.82.33.02.1 i1.6 |2.43.3 !3.42.4
4.0
3.83.73.8
4.4
3.7
5.6
4.2
5.04.07.44.74.75.9
3.32.95.0 j
3.6
8.78.48.6
5.41.1 |
2 . 9 ji
3 . 3 |
2.2
2.82.22.81.91.42.22.93.02.0
3.8
3.63.63.6
4.3
3.4
5.2
161165149174215
147
886892
143
149
152
151
149
112
' " j '160 i169 '151 i198 i218 i
148
683482
161
165
158
166172158
153
836586
146
153
860728
1,199618
1,020
Jan.
856
807707
1 ,160606960
579
770619745
641
730543629
828 850
1952
Feb.
902
843
472
157 381
160
143
129
150
165
115
600
550
621
425
836698
1,177797
1,024
563
712545717
787
452
334 353
521
530
552
572
582
596
xThe ratio of stocks to sales is obtained by dividing stocks at the end of the month by sales during the month and hence indicates the numberof months' supply on hand at the end of the month in terms of sales for that month.
2The 1941 average of monthly sales for each department is used as a base in computing the sales index for that department. The stocksindex is derived by applying to the sales index for each month the corresponding stocks-sales ratio. For description and monthly indexes ofsales and stocks by department groups for back years, see BULLETIN for August 1946, pp. 856-858. The titles of the tables on pp. 857 and 858were reversed.
3For movements of total department store sales and stocks, see the indexes for the United States on p. 530.4 Index numbers of sales and stocks for this department are not available for publication separately; the department, however, is included
in group and total indexes.5Data not available.NOTE.—Based on reports from a group of large department stores located in various cities throughout the country. In 1952, sales and stocks
at these stores accounted for almost 50 per cent of estimated total department store sales and stocks. Not all stores report data for all of thedepartments shown; consequently, the sample for the individual departments is not so comprehensive as that for the total.
MAY 1953 531
Digitized for FRASER http://fraser.stlouisfed.org/ Federal Reserve Bank of St. Louis

PRICES
CONSUMERS' PRICES[Bureau of Labor Statistics index for city wage-earner and clerical-worker families. 1947-49 =100]
Year ormonth
1929 .
1933.. . .
19411942194319441945.. .19461947.19481949195019511952
1952—Mar. . .April...May. . .June.. .July . . .Aug.. . .Sept . . .Oct . . . .Nov. . .D e c . . .
1953—Jan....Feb . . . .Mar....
Allitems
73.3
55.3
62.969.774.075.276.983.495.5
102.8101.8102.8111.0113.5
112.4112.9113.0113.4114.1114.3114.1114.2114.3114.1
113.9113.4113.6
Foods
65.6
41.6
52.261.368.367.468.979.095.9
104.1100.0101.2112.6114.6
112.7113.9114.3114.6116.3116.6115.4115.0115.0113.8
113.1111.5111.7
Housing
Total
95.0101.7103.3106.1112.4114.6
114.0114.0114.0114.0114.4114.6114.8115.2115.7116.4
116.4116.6116.8
Rent
117 4
83 6
88 490 490 390 690 991 494.4
100.7105.0108.8113.1117.9
116.7116.9117.4117.6117.9118.2118.3118.8119.5120.7
121.1121.5121.7
Othershelter*
Gasandelec-
tricity
97.6100.0102.5102.7103.1104.5
103.8103.9104.1104.3104.2105.0105.0105.0105.4105.6
105.9106.1106.5
Solidfuelsand
fuel oil
88.8104.4106.8110.5116.4118.7
117.7117.3115.6115.8115.6119.0119.6121.1121.6123.2
123.3123.3124.4
House-furn-ish-ings
97.2103.299.6
100.3111.2108.5
109.4108.7108.3107.7107.6107.6108.1107.9108.0108.2
107.7108.0108.0
House-hold
opera-tion
97.2102.6100.1101.2109.0111.8
111.0111.0111.2111.2111.8111.9112.1112.8113.3113.4
113.4113.5114.0
Ap-parel
60 3
45 9
55 664.967 872.676 383.797.1
103.599.498.1
106.9105.8
106.4106.0105.8105.6105.3105.1105.8105.6105.2105.1
104.6104.6104.7
Trans-porta-tion
90.6100.9108.5111.3118.4126.2
124.4124.8125.1126.3126.8127.0127.7128.4128.9128.9
129.3129.1129.3
Med-icalcare
94.9100.9104.1106.0111.1117.3
115.7115.9116.1117.8118.0118.1118.8118.9118.9119.3
119.4119.3119.5
Per-sonalcare
97.6101.3101.1101.1110.5111.8
111.0111.3111.6111.7111.9112.1112.1112.3112.4112.5
112.4112.5112.4
Read-ingand
recrea-tion
95.5100.4104.1103.4106.5107.0
106.3106.2106.2106.8107.0107.0107.3107.6107.4108.0
107.8107.5107.7
Othergoodsand
serv-ices
96.1100.5103.4105.2109.7115.4
114.8115.2115.8115.7116.0115.9115.9115.8115.8115.9
115.9115.8117.5
1 Indexes for January 1953 and subsequent months will be published later.NOTE.—Revised indexes, reflecting beginning January 1953 the inclusion of new series (i. e. home purchases and used autombiles) and revised
weights. Prior to January 1953 indexes are based on the "interim adjusted" and "old" indexes, converted to the base 1947-49 =100.Source.—Bureau of Labor Statistics, Department of Labor.
WHOLESALE PRICES, BY GROUPS OF COMMODITIES[Index numbers of the Bureau of Labor Statistics, 1947-49 =100]
Year ormonth
194719481949195010.511952
1952MarchAprilMayJuneJulyAu cms tSeptemberOctoberNovember . . . .
1953JanuaryFebruaryM!arch
Allcom-modi-
ties
96 4104.499.2
103.1114.8111.6
112.3111.8111.6111.2111.8112.2111.8111.1110 7109.6
109 9109.6110.1
Farmprod-ucts
100 0107.392.897.5
113.4107.0
108.2108.7107.9107.2110.2109.9106.6104.9103 699.2
99 697.9
100.0
Proc-essedfoods
98 2106.195 799.8
111 .4108.8
109.2108.0108.6108 5110.0110.5110.3108.5107 7104.3
105 5105.2105.0
Total
95 3103.4101.3105.0115.9113.2
113.8113.3113.0112.6112.5113.0113.2113.0112.8112.9
113 1113.1113.4
Tex-tile
prod-uctsandap-
parel
100.1104.495.599.2
110.699.8
100.699.999.399.098.999.199.599.298.698.2
98.898.597.6
Hides,skins,and
leatherprod-ucts
101.0102.196.9
104.6120.397.2
98.094.194.795.996.296.596.596.797.699.0
97.398.098.1
Other
Fuel,power,
andlight-
ingma-
terials
90.9107.1101.9103.0106.7106.6
107.4106.3106.0105.9106.0105.8106.2106.6106.7107.2
107.8108.1108.5
commodities
Chem-icalsand
alliedprod-ucts
101.4103.894.896.3
110.0104.5
105.4104.8104.3104.3104.2104.0104.0103.9103.5103.3
103.6103.6104.2
Rub-berand
prod-ucts
99.0102.198.9
120.5148.0134.0
142.0140.6140.4133.4130.0127.8126.3126.0126.4127.7
127.3126.2125.7
Lum-berand
woodprod-ucts
93.7107.299.2
113.9123.9120.3
120.5120.9120.7119.9120.2120.5120.4120.2119.7119.7
120.5121.1121.7
Pulp,paper,
andalliedprod-ucts
98.6102.998.5
100.9119.6116.5
117.7117.4116.9116.7115.3115.6115.6115.5115.5115.9
115.8'115.3115.2
Metalsand
metalprod-ucts
91.3103.9104.8110.3122.8123.0
122.6122.5121.8121.1121.9124.1124.6124.1123.9124.0
124.0••124.6125.5
Ma-chin-eryandmo-tive
prod-ucts
92.5100.9106.6108.6119.0121.5
121.8121.6121.6121.3121.4121.4121.5121.3121.4121.4
121.5121.6121.7
Furni-tureand
otherhouse-hold
dura-bles
95.6101.4103.1105.3114.1112.0
111.9112.1111.7111.6111.6111.5112.0112.0112.1112.3
112.7'112.9113.1
Non-me-
tallicmin-
er als—struc-tural
93.9101.7104.4106.9113.6113.6
112.9112.8112.9113.8113.8113.8113.8114.4114.5114.6
114 6114.6114.9
To-baccomanu-fac-turesand
bottledbev-erages
98 0100.4101.6102.4108.1110.6
110.8110.8110.8110.8110.8110.8110.8110.8110 8110.8
112 2rlH 9114.8
Mis-cella-neous
100.8103.196.196.6
104.9108.3
109.2109.5108.4108.1105.5108.9108.3108.4105.7105.1
103 0101.2101.7
r Revised.Source.—Bureau of Labor Statistics, Department of Labor.Back figures.—See BULLETIN for March 1952, pp. 311-313.
532 FEDERAL RESERVE BULLETIN
Digitized for FRASER http://fraser.stlouisfed.org/ Federal Reserve Bank of St. Louis

PRICES—Con tinnedWHOLESALE PRICES, BY GROUPS OF COMMODITIES—Continued
[Index numbers of the Bureau of Labor Statistics 1947-49 =100]
Subgroup
Farm Products:
Fresh and dried produceGrainsLivestock and poultryPlant and animal fibersFluid milkEggsHay and seedsOther farm products
Processed Foods:
Cereal and bakery productsMeats, poultry, and fishDairy products and ice creamCanned, frozen fruits, and vegeta-
blesSugar and confectioneryPackaged beverage materialsOther processed foods
Textile Products and Apparel:
Cotton productsWool productsSynthetic textilesSilk productsApparelOther textile products
Hides, Skins, and Leather Products:
Hides and skinsLeatherFootwearOther leather products
Fuel, Power, and Lighting Materials:
CoalCokeGasElectricityPetroleum and products
Chemicals and Allied Products:
Industrial chemicalsPaint and paint materialsDrugs, Pharmaceuticals, cosmetics.Fats and oils, inedibleMixed fertilizersFertilizer materialsOther chemicals and products
Rubber and Products:
Crude rubberTires and tubesOther rubber products
Lumber and Wood Products:
LumberMillworkPlywood
Pulp, Paper, and Allied Products:
WoodpulpWastepaperPaperPaperboard
Annual
1951 1952
97.299.3
116.9143.9104.8108.0102.7138.5
106.9116.7107.7
105.5106.4161.3123.0
111.5144.697.0
128.8103.8141.6
119.0124.7121.6112.3
108.4124.0100.798.1
110.5
120.7108.995.688.8
107.3106.3108.4
215.1133.9130.9
123.6130.1115.1
114.4188.3119.1131.8
120.398.2
102.4115.1109.695.998.3
136.7
106.9108.3113.6
105.0109.2162.2119.0
98.5113.088.9
133.7100.0101.7
63.089.4
112.4100.8
108.7124.7103.798.9
109.3
115.2107.392.550.0
109.3110.6103.3
157.8129.8126.7
120.5127.0105.0
111.570.1
124.0127.4
1953
Feb. Mar.
-•102.293.191.2
102.7'103.0
89.194.9
134.5
107.698.2
110.9
a 05.5p108.0161.9114.4
'96.1111.588.3
141.499.983.5
66.591.9
112.1'99.0
115.9131.8109.5100.7107.9
113.1105.991.452.7
110.8112.7102.9
129.4126.3124.3
120.3131.9110.9
108.883.8
124.9123.5
105.994.791.7
104.6101.8100.697.5
142.5
108.994.4
109.7
105.1109.6168.9120.9
93.1112.087.9
141.499.982.2
65.293.5
112.199.1
114.8131.8109.5100.7109.0
113.9106.091.659.0
110.7112.8102.9
126.6126.3124.3
120.9131.9112.0
108.883.8
124.9123.4
Subgroup
Pulp, Paper and Allied Products-Continued
Converted paper and paperboard. .Building paper and board
Metals and Metal Products:
Iron and steelNonferrous metalsMetal containersHardwarePlumbing equipmentHeating equipmentFabricated structural metal prod-
uctsFabricated nonstructural metal
products
Machinery and Motive Products:
Agricultural machinery and equip-ment
Construction machinery and equip-ment
Metal working machineryGeneral purpose machinery and
equipmentMiscellaneous machineryElectrical machinery and equip-
mentMotor vehicles
Furniture and Other Household Dura-bles:
Household furnitureCommercial furnitureFloor coveringHousehold appliancesRadioTelevisionOther household durable goods . . . .
Nonmetallic Minerals—Structural:
Flat glassConcrete ingredientsConcrete productsStructural clay productsGypsum productsPrepared asphalt roofingOther nonmetallic minerals
Tobacco Manufactures and BottledBeverages:
CigarettesCigarsOther tobacco productsAlcoholic beveragesNonalcoholic beverages
Miscellaneous:
Toys, sporting goods, small arms. .Manufactured animal feedsNotions and accessoriesJewelry, watches, photo equipmentOther miscellaneous
Annual
1951
117.0113.4
123.2124.2121.1125.8122.5114.6
117.5
125.4
120.1
123.6125.8
123.5119.4
121.9112.9
116.4124.5137.8107.993.779.6
117.3
114.0113.0112.3121.4117.4104.8111.0
105.8100.6108.4106.5119.7
116.2100.5101.3101.1120.6
1952
113.8115.5
124.7123.5122.0125.4117 A113.8
115.1
124.9
121.6
125.4128.5
122.6119.4
120.3119.6
113.0123.0122.8107.394.075.5
118.8
114.3113.0112.5122.0117.7102.9112.3
106.5100.1116.6110.7119.7
113.5108.093.8
101.0120.8
19
Feb.
'•111.5118.2
'127.5124.4125.3125.9
'114.3113.9
113.9
126.7
121.8
'126.2'129.0
122.0120.1
119.7119.9
'113.4123.2124.1107.4'95.5'75.6
'121.7
114.4113.1112.8124.0117.7106.0115.3
112.0102.9120.3
'110.1'119.8
112.894.492.9
101.0121.2
Mar.
111.3118.2
127.7131.5125.3126.2114.3113.9
113.6
122.0
126.9129.1
122.1120.3
119.7120.0
113.7123.2124.1107.895.575.6
121.8
114.4113.8112.8124.1118.3106.0115.3
124.0102.9122.4110.0119.8
112.995.094.3
101.7121.0
'Revised.Source.—Bureau of Labor Statistics, Department of Labor.Back figures.—See BULLETIN for March 1952, pp. 311-313.
MAY 1953 533
Digitized for FRASER http://fraser.stlouisfed.org/ Federal Reserve Bank of St. Louis

GROSS NATIONAL PRODUCT, NATIONAL INCOME, AND PERSONAL INCOME[Kstimates of the Department of Commerce. In billions ot dollarsi
RELATION OF GROSS NATIONAL PRODUCT, NATIONAL INCOME, PERSONAL INCOME, AND SAVING
Gross national product . . .
Less: Capital consumption allowances. .Indirect business tax and related
liabilitiesBusiness transfer paymentsStatistical discrepancy
Plus: Subsidies less current surplus ofgovernment enterprises
Equals: National income . .
Less: Corporate profits and inventoryvaluation adjustment
Contributions for social insurance. .Excess of wage accruals over
disbursementsPlus: Government transfer payments. . .
Net interest paid by government. .DividendsBusiness transfer payments
Equals: Personal Income . .
Less: Personal tax and related payments. .FederalState and local
Equals: Disposable personal income.
Less: Personal consumption expenditures
Equals: Personal saving
Annual totals
1929
103.8
8.8
7 06
— l
- . 1
87.4
10.3.2
0.9
1.05.8
6
85 1
2.61.31 4
82.5
78.8
3 7
1933
55.8
7.2
7.17
1.2
0)39.6
- 2 . 0.3
.01.51.22.1
7
46 6
1.5.5
1 0
45.2
46.3
— 1 2
1941
126.4
9.3
11.35
1.6
.1
103.8
14.62.8
02.61.34.5
5
95 3
3.32 01.3
92.0
32.3
9 8
1947
233.3
14.8
18.77
.3
- . 1
198.7
24.75.7
.011.14.46.6
7
191.0
21.519.61 9
169.5
165.6
3 9
1948
259.0
17.6
20.47
- 3 . 2
.0
223.5
31.75.2
.010.54.57.2
.7
209.5
21.119.02.1
188.4
177.9
10 5
1949
258.2
19.4
21.6g2
.0
216.3
29.25.7
011.64.67.5
8
205 9
18.616.22 5
187.2
180.6
6 7
1950
284.2
21.5
23 88
— .7
.4
239.2
34.86.9
014.34.79.0
8
226 3
20.818.12 7
205.5
194.3
11 2
1951
329.2
24.6
25 39
1.4
.5
277.6
41.68.2
011.54.99.0
9
254 1
29.126 13 0
225 0
208.0
17 0
1952
'346.1
28.1
27.29
r —.2
.1
290.4
40.58.5
— .111.95.09.1
.9
268.3
34.030.7
3.3
234.3
216.3
18 0
Seasonally adjusted annualby quarters
1952
1
339.7
2 6 . 7
26.39
-1 .6
.5
288.0
42.78.5
111.75.08.9
9
263 0
33.530.4
3 2
229.5
213.2
16 3
2
342.6
27.7
26.8. 9
1.8
.2
285.6
39.98.4
.011.65.09.6
. 9
264.4
33.630.43.2
230.8
214.9
15 9
3
343.0
28.3
27.3.9
— 1.3
- . 2
287.7
37.8S.6
— 412 05.09.3
.9
268 9
34.130.8
3 3
234.8
215 0
19 8
4
••359.0
29.C
28.2.9
r . l
.0
300.2
41.58.8
.012.25.09.0
.9
277.0
34.631.33.3
242.5
222.0
20. ?
rates
1953
1
361.0
30.4
28.4. 9
n.a.
.1
n.a .
n.a.9.0
.012.85.09.1
.9
281.3
35.732.3
3 4
245.6
226.2
19.5
NATIONAL INCOME, BY DISTRIBUTIVE SHARES
National income
Compensation of employeesWages and salaries2
PrivateMilitaryGovernment civilian
Supplements to wages and salaries...
Proprietors* and rental income 3 . . .Business and professionalFarmRental income of persons
Corporate profits and inventoryvaluation adjustment
Corporate profits before taxCorporate profits tax l iabi l i ty . . . .Corporate profits after tax
Inventory valuation adjustment
Net interest
Annual totals
1929
87.4
50.850.245.2
.34.6
.6
19.78.35.75.8
10.39.81.48.4
.5
6.5
1933
39.6
29.328.823.7
.34.9
.5
7.22.92.32.0
- 2 . 0.2.5
- . 4- 2 . 1
5.0
103.8
64.361.751.51.98.32.6
20.89.66.94.3
14.617 .279.4
- 2 . 6
4.1
198.7
128.0122.1104.8
4.113.25.9
42.419.815.67.1
24.730.511.918
- 5
3.5
1948
223.5
140.2134.4115.7
4.014.75.8
47.322.117.77.5
31.733.813.020.7
- 2 . 1
4.3
1949
216.3
139.9133.4113.0
4.216.16.6
42 .121.612.87.7
29.227.110.816.32.1
5.0
1950
239.2
153.4145.6123.4
5.017.27.8
45.223.713.38.2
34.839.618.421.2
- 4 . 8
5.8
1951
277.6
178.9169.9141.2
8.620.19.0
50.626.215.68.9
41.642.924.218.7
- 1 . 3
6.4
1952
290.4
190.4181.1148.7n.a.n.a.
9.2
52.527.615.29.6
40.539.7
'21.81 7 . 9
7.0
Seasonally adjusted annual ratesby quarters
1952
288.0
186.5177.4145.810.021.79.0
52 .127.315.49.4
42.742.7
'23 A'19.3- . 1
6.7
285.6
186.9177.8145.610.221.99.2
51.927.614.89.5
39.938.2
'21.017.2
1.7
6.9
287.7
190.3181.0148.3
10.422.49.3
52.527.515.29.8
37.837.2
'20.416.8
.6
7.1
300 2
197.*)188.2155.?n.a.n.a.
9.0
53.628.215.510.C
41.54o.:i
r 2 2 . 11 8 2
1.2
7.2
1953
n.a .
201.6191 .8-158.7
n.a..n.a.9.8
53.628.614.9-10.1
n .a .n.a.
n.a.- . 57.4
n.a. Not available. r Revised.1Less than 50 million dollars.2 Includes employee contributions to social insurance funds.8Includes noncorporate inventory valuation adjustment.NOTE.—Details may not add to totals because of rounding.Source.—Department of Commerce.
534 FEDERAL RESERVE BULLETIN
Digitized for FRASER http://fraser.stlouisfed.org/ Federal Reserve Bank of St. Louis

GROSS NATIONAL PRODUCT, NATIONAL INCOME, AND PERSONAL INCOME—Continued[Estimates of the Department of Commerce. In billions of dollars]
GROSS NATIONAL PRODUCT OR EXPENDITURE
Annual totals
1929 1933 1941 1947 1948 1950 1951 1952
Seasonally adjusted annual ratesby quarters
1952
1
339
213.25
11870.
50 .23.11 .12.2 5 .
- •
2 .
74 .51.4 6 .
5 .
2 3 .
7
2200
0707761
2
4242
42
2
342.6
214.926.4
117.870.8
49.323.611.012.625.7
.1- . 8
.4
78.054.950.3
5 .1
.423.0
3
343.0
215.024.2
118.971.9
51.723.010.912.225.0
3 . 73 . 0
- 1 . 6
77.954.849.6
5 .6
.423.1
1953
Gross national product
Personal consumptionexpenditures
Durable goodsNondurable goodsServices
Gross private domesticinvestment
New construction l
Residential, nonfarmOther
Producers' durable equipmentChange in business inventories. . . .
Nonfarm only
Net foreign investment
Government purchases ofgoods and services
FederalNational securityOtherLess: Government sales 2
State and local
103.8
78.89.4
37.731.7
15.87.3.64.26.41.61.8
.8
8.51.3
1.3
(s)7.2
55.8
46.33.5
22.320.6
1.31.1
.5
.71.8
-1.6-1.3
.2
8.02.0
2.0
5.9
126.4
82.39.8
44.028.5
18.36.83.53.37.73.93.4
1.1
24.716.913.83.2
(3)7.8
233.3
165.621.495.149.1
30.213.96.37.6
17.1- . 81.4
8.9
28.615.813.33.81.3
12.8
259.0
177.922.9
100.954.1
42.717.78.69
19.95.03.7
1.9
36.621.016.15.6
.615.6
258.2
180.623.899.257.5
3317.28.39.0
18-2-1.6
.5
43.625.419.36.6
.418.2
284.2
194.329.2
102.862.4
50.322.912.610.322.0
5.54.6
- 2 .3
41.922.2183.9
329.2
208.027.1
113.567.3
58.523.311.012 324.910.39.4
.2
62.640.937.1
4.2.4
21.7
'346.1
216.325.8
119.071.5
52.123.511.112.425.53.12.4
77.854.449.2
5.6.4
23.4
'359.
222.027.3
121.473.3
57.323 V11 612 025.6
8.17.5
' - . 9
80.656.650.4
6.5.3
24.0
361.0
226.229.8
121.774.6
54.425.212.213.027.5
1.71.1
-2 .0
82.457.551.26.5
.325.0-
PERSONAL INCOME[Seasonally adjusted monthly totals at annual rates]
Year or month
192919331941194719481949195019511952 .
1952 -MarchAprilM a yJuneJuly.AugustSeptember... .OctoberNovember. . . .December
1953—JanuaryFebruaryMarch?
Per-sonal
income
85 146.695.3
191.0209.5205.9226.3254.1268.4
261 9262.5264.5266.7263.9269.6273.8276.1275.8280.0
280.6280.9282.5
Wages and salaries
Totalreceipts4
50 028.760.9
119.9132.1131.2142.7166.5177.9
173 9173.4174.6175.8173.9179.0181.9184.0184.4186.4
186.5188.2189.6
Wage and s<
Totaldis-
burse-ments
50 228.861.7
122.0134.3133.4145.6169.9181.4
177 3176.7177 9179.3177.4182 5185.3187.5187.9189.9
190.3191.8193.2
Com-modityproduc-ing in-
dustries
21 59 . 8
27.554.360.256.963.574.979.1
77 776.976.777.274.078.781.682.983.585.2
85.286.287.1
ilary disbursements
Distrib-utiveindus-tries
15 58 .8
16.335.138.838.941.345.948.5
47 047.047.748.549.349.449.349.949.650.0
50.150.350.4
Serviceindus-tries
8 .25 . 17.8
15.316.617.218.620.321.3
20.821.021.321.321.521.521.621.821.921.9
22.122.222.5
Gov-ern-ment
5 05.2
10.217.218.720.422.228.732.4
31 831.832.232.332.632.932.832.932.932.8
32.933.133.2
Otherlabor
income5
.5
.4
.62.42 . 83 . 13 . 84 . 24 . 5
4 . 34 . 44 . 44 . 54 . 54 . 54.54.64.64.7
4.74.74.7
Pro-prietors'
andrental
income6
19 77.2
20.842.447.342.145.250.652.5
50.751.251.752.852.251.853.453.552.954.6
54.653.353.0
Divi-dendsandper-
sonalinterestincome
13.38.29.9
14.516.017.119.520.421.1
21.021.521.521.421.321.421.421.321.321.2
21.421.521.7
Trans-fer
pay-ments7
1.52 . 13.1
11.811.312.415.112.412.7
12.412.312.612.512.413.112.913.012.813.4
13.613.413.8
Lesspersonalcontri-butions
forsocialinsur-ance8
.1
.2
.82.12 . 22 . 22 . 93 . 43.8
3 . 83 . 63 . 63 . 83 . 93 .73.73.83.73.8
4.03 83.9
Non-agricul-
turalincome9
76.843.086.1
170.8187.1188.7208.5233.6248.0
242.7242.9244.9245.9243.4249.4253.0255.4255.7258.8
259.5261. 1262.8
p Preliminary. r Revised.1 Includes construction expenditures for crude petroleum and natural gas drilling.
2 Consists of sales abroad and domestic sales of surplus consumption goods and materials.3 (.ess than 50 million dollars.4 Total wage and salary receipts, as included in "Personal income," is equal to total disbursements less employee contributions to social insur-
ance. Such contributions are not available by industries.5 Include? compensation for injuries, employer contributions to private pension and welfare funds, and other payments.6 Includes business and professional income, farm income, and rental income of unincorporated enterprise; also a noncorporate inventory
valuation adjustment.7 Includes government social insurance benefits, direct relief, mustering out pay, veterans' readjustment allowances and other payments, as
well as consumer bad debts and other business transfers.8 Prior to 1952 includes employee contributions only; beginning January 1952, includes also contributions to the old-age and survivors' insurance
program of the self-employed to whom coverage was extended under the Social Security Act Amendments of 1950. Personal contributions arenot included in personal income.
9 Includes personal income exclusive of net income of unincorporated farm enterprise, farm wages, agricultural net rents, agricultural netinterest, and net dividends paid by agricultural corporations.
NOTB.—Details may not add to totals because of rounding.Source.—Department of Commerce.
MAY 1953 535.
Digitized for FRASER http://fraser.stlouisfed.org/ Federal Reserve Bank of St. Louis
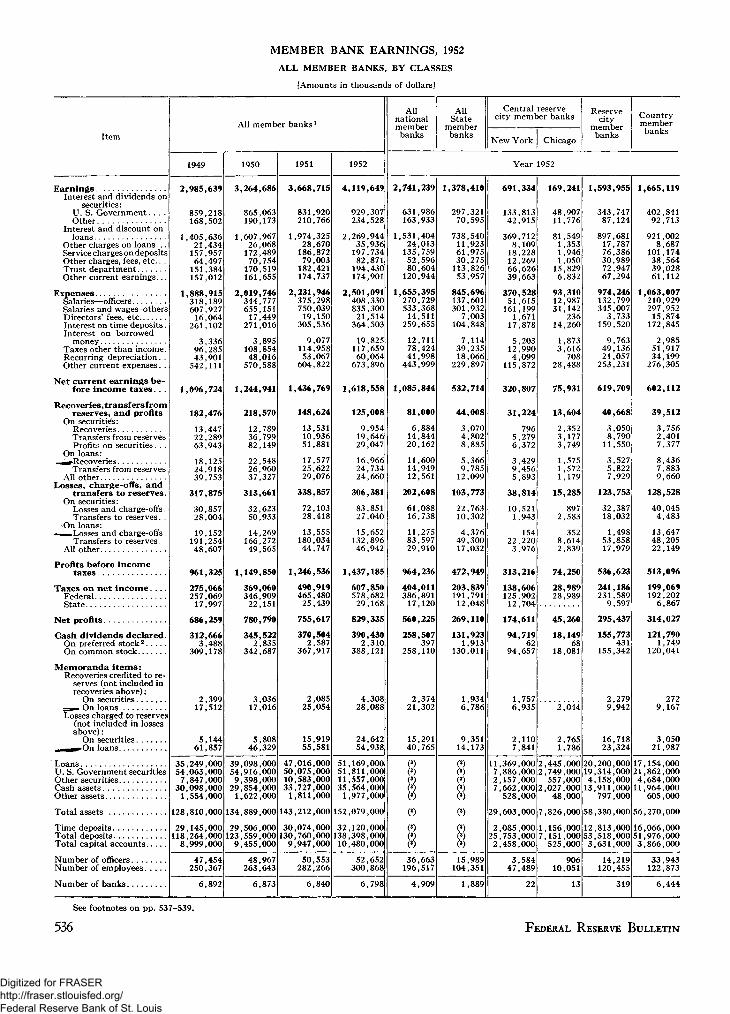
MEMBER BANK EARNINGS, 1952ALL MEMBER BANKS, BY CLASSES
[Amounts in thousands of dollars]
Item
All member banks l
1949 1950 1951 1952
Allnationalmemberbanks
AllState
memberbanks
Central reservecity member banks
New York Chicago
Reservecity
memberbanks
Countrymemberbanks
Year 1952
EarningsInterest and dividends on
securities:U. S. Government. . . .Other
Interest and discount onloans
Other charges on loans...Service charges on depositsOther charges, fees, etc.. .Trust departmentOther current earnings...
ExpensesSalaries—officersSalaries and wages-othersDirectors' fees, etc . . .Interest on time deposits.Interest on borrowed
moneyTaxes other than income.Recurring depreciation. .Other current expenses. .
Net current earnings be-fore income taxes. . .
Recoveries, transfers fromreserves, and profits.
On securities:RecoveriesTransfers from reservesProfits on securities. . .
On loans:« ^ r Recoveries
Transfers from reservesAll other
Losses, charge-offs, andtransfers to reserves.
On securities:Losses and charge-offs.Transfers to reserves. .
On loans:-^—Losses and charge-offs.
Transfers to reserves. .All other
Profits before incometaxes
Taxes on net i n c o m e . . . .FederalState
Net profits
Cash dividends declared.On preferred stock2
On common stock
Memoranda items:Recoveries credited to re-
serves (not included inrecoveries above):
On securitiessap. On loansLosses charged to reserves
(not included in lossesabove):
On securities^ M ^ O n loans
LoansU. S. Government securitiesOther securitiesCash assetsOther assets
Total assets
Time depositsTotal depositsTotal capital accounts
Number of officersNumber of employees
Number of banks
2,985,639
859,218168,502
1,405,63621,434157,95764,497151,384157,012
1,888,915318,189607,92716,064
261,102
3,33696,28543,901542,111
1,096,724
182,476
13,44722,28963,943
18,12524,91839,753
317,875
30,85728,004
19,152191,25448,607
961,325
275,066257,06917,997
686,259
312,6663,488
309,178
2,39917,512
5,14461,857
3,264,686
865,063190,173
1,607,96726,068172,48970,754170,519161,655
2,019,746344,777655,15117,449
271,016
3,895108,85448,016570,588
1,244,941
218,570
12,78936,79982,149
22,54826,96037,327
313,661
32,62350,933
14,269166,27249,565
1,149,850
369,060346,90922,151
780,790
345,5222,835
342,687
3,03617,016
5,80846,329
3,668,715
831,920210,766
1,974,32528,670186,87279,003182,421174,737
2,231,946375,298750,03919,150
305,536
9,077114,95853,067604,822
1,436,769
148,624
13,53110,93651,881
17,57725,62229,076
338,857
72,10328,418
13,555180,03444,747
1,246,536
490,919465,48025,439
755,617
370,5042,587
367,917
2,08525,054
15,91955,581
4,119,649
929,307234,528
2,269,94435,936197,73482,871194,430174,901
2,501,091408,330835,30021,514
364,503
19,825117,65960,064673,896
1,618,558
125,008
9,95419,64629,047
16,96624,73424,660
306,381
83,85127,040
15,652132,89646,942
1,437,185
607,850578,68229,168
829,335
390,4302,310
388,121
4,30828,088
24,64254,938
2,741,239
631,986163,933
1,531,40424,013135,75952,59680,604120,944
1,655,395270,729533,36814,511
259,655
12,71178,42441,998
443,999
1,085,844
81,000
6,88414,84420,162
11,60014,94912,561
202,608
61,08816,738
11,27583,59729,910
964,236
404,011386,89117,120
560,225
258,507397
258,110
2,37421,302
15,29140,765
35,249,00054,063,0007,847,000
30,098,0001,554,000
128,810,000
29,145,000118,264,0008,999,000
39,098,00054,916,0009,398,000
29,854,0001,622,000
134,889,000
29,506,000123,559,0009,455,000
47,016,00050,075,00010,583,00033,727,0001,811,000
143,212,000
30,074,000130,760,0009,947,000
51,169,00051,811,00011,557,00035,564,0001,977,000
152,079,000
32,120,000138,398,00010,480,000
47,454250,367
48,967263,643
50,553282,266
52,652300,868
36,663196,517
6,892 6,873 6,840 6,798 4,909
1,378,410
297,32170,595
738,54011,92361,97530,275113,82653,957
845,696137,601301,9327,003
104,848
7,11439,23518,066
229,897
532,714
44,008
3,0704,8028,885
5,3669,78512,099
103,773
22,76310,302
4,37649,30017,032
472,949
203,839191,79112,048
269,110
131,9231,913
130,011
1,9346,786
9,35114,173
()
815,989
104,351
1,889
691,334
133,81342,915
369,7128,10918,22812,26966,62639,663
370,52851,615161,1991,671
17,878
5,20312,9904,099
115,872
320,807
31,224
7965,2796,372
3,4299,4565,893
38,814
10,5211,943
15422,2203,976
313,216
138,606125,90212,704
174,611
94,71962
94,657
1,7576,935
2,1107,841
11,369,000 27,886,000 22,157,0007,662,000 2528,000
2,085,00025,753,000 72,458,000
3,58447,489
22
169,241
48,90711,776
81,5491,3531,9461,05015,8296,832
93,31012,98731,142
23614,260
1,8733,616
70828,488
75,931
13,604
2,3523,1773,749
1,5751,5721,179
15,285
8972,583
3528,6142,839
74,250
28,98928,989
45,260
18,14968
18,081
2,044
2,7651,786
445,000 20749,000557,000027,00048,000
1,156,000,151,000 53525,000
90610,051
13
1,593,955
343,74787,124
897,68117,78776,38630,98972,94767,294
974,246132,799345,0073,733
159,520
9,76349,13621,057253,231
619,709
40,668
3,0508,79011,550
3,5275,8227,929
123,753
32,38718,032
1,49853,85817,979
536,623
241,186231,5899,597
295,437
155,773431
155,342
2,2799,942
16,71823,324
,200,00019,314,000 214,158,00013,911,000
797,000
29,603,000 7,826,000 58,380,000 56,270,000
12,813,000,518,000 51
3,631,000
319
1,665,119
402,84192,713
921,0028,687
101,17438,56439,02861,112
1,063,007210,929297,95215,874172,845
2,98551,91734,199276,305
602,112
39,512
3,7562,4017,377
8,4367,8839,660
128,528
40,0454,483
13,64748,20522,149
513,096
199,069192,2026,867
314,027
121,7901,749
120,041
2729,167
3,05021,987
17,154,000,862,000
4,684,00011,964,000
605,000
16,066,000,976,000
3,866,000
33,943122,873
6,444
See footnotes on pp. 537-539.
536 FEDERAL RESERVE BULLETIN
Digitized for FRASER http://fraser.stlouisfed.org/ Federal Reserve Bank of St. Louis
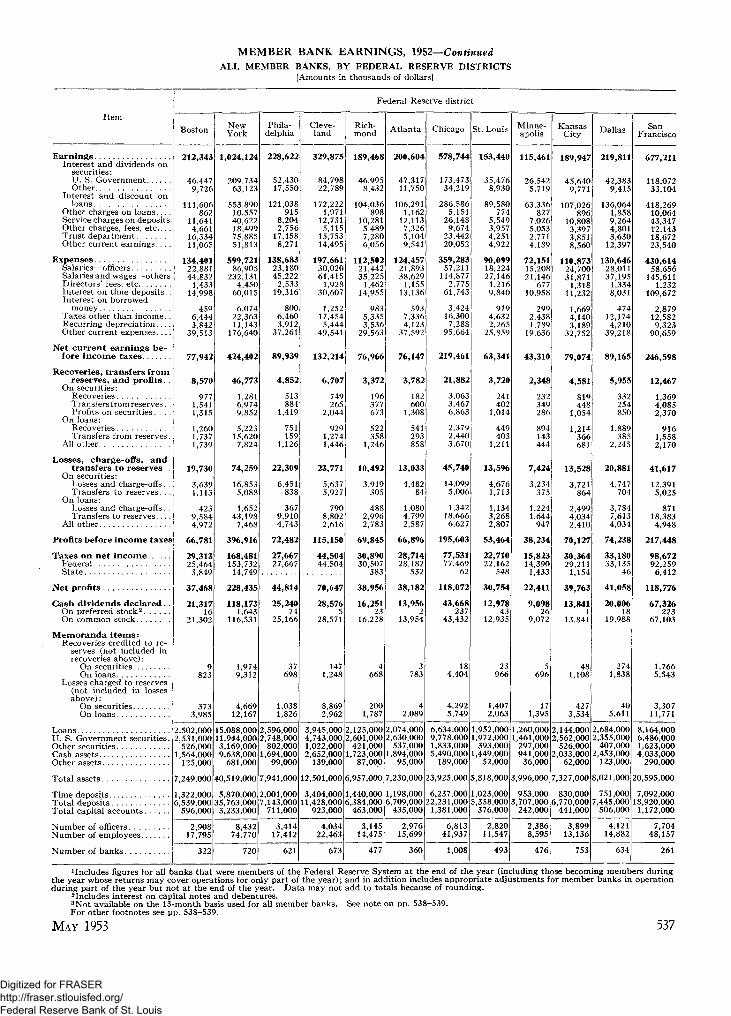
MEMBER BANK EARNINGS, 1952—ContinuedALL MEMBER BANKS, BY FEDERAL RESERVE DISTRICTS
[Amounts in thousands of dollars]
Item
EarningsInterest and dividends on
securities:U. S. GovernmentOther
Interest and discount onloans
Other charges on loans. . . .Service charges on deposits.Other charges, fees, etc.. . .Trust departmentOther current earnings. . . .
ExpensesSalaries—officersSalaries and wages—othersDirectors' fees, etcInterest on time deposits. .Interest on borrowed
moneyTaxes other than income. .Recurring depreciation. . . .Other current expenses....
Net current earnings be-fore income taxes
Recoveries, transfers fromreserves, and profits. .
On securities:RecoveriesTransfers from reserves. .Profits on securit ies. . . .
On loans:RecoveriesTransfers from reserves.
All other
Losses, charge-offs, andtransfers to reserves. .
On securities:Losses and charge-offs. .Transfers to reserves. . .
On loans:Losses and charge-offs. .Transfers to reserves....
All other
Profits before income taxes
Taxes on net incomeFederalState
Net profits
Cash dividends declared . .On preferred stock2
On common stock
Memoranda items:Recoveries credited to re-
serves (not included inrecoveries above):
On securitiesOn loans
Losses charged to reserves(not included in lossesabove):
On securitiesOn loans
LoansU. S. Government securities.Other securitiesCash assetsOther assets
Total assets
Time depositsTotal depositsTotal capital accounts
Number of officersNumber of employees
Number of banks
Federal Reserve district
Boston
212,343
46,4479,726
111,606862
11,6414,661
16,33411,065
134 40122^88144,832
1,43314,998
4596,4443,842
39,513
77,942
8,570
9771,5411,315
1,2601,7371,739
19,730
3,6391,113
4239,5844,972
66,781
29,31325,4643,849
37,468
21,31716
21,302
9823
3733,985
2,502,0002,531,000
526 0001,564,000
125,000
7,249,000
1,322,0006 539 000
596,000
2 90817,795
322
NewYork
1,024,124
209,73463,123
553,89010,55740,62218,49975,88551,813
599,72186^905
232,1314,450
60,015
6,07422,36311,143
176,640
424,402
46,773
1,2816,9749,852
5,22315,6207,824
74,259
16,8535,088
1,65243,198
7,468
396,916
168,481153,73214,749
228,435
118,1731,643
116,531
1,9749,312
4,66912,167
15,088,00011,944,0003,169,0009,638,000
681,000
40,519,000
5,870,00035,763,0003,233,000
8,43274,770
720
Phila-delphia
228,622
52,43017,550
121,038915
8,2042,756
17,4588,271
138,68323,18045,222
2,53319,316
8006,4603,912
37,261
89,939
4,852
513884
1,419
751159
1,126
22,309
6,451838
3679,9104,743
72,482
27,66727,667
44,814
25,24074
25,166
37698
1,0381,826
2,596,0002,748,000
802,0001,694,000
99,000
7,941,000
2,001,0007,143,000
711,000
3,41417,412
621
Cleve-land
329,875
84,79822,789
172,2221,971
12,7315,115
15,75314,495
197,66130,02061,415
1,92830,607
1,25217,4545,444
49,541
132,214
6,707
749265
2,044
9291,2741,446
23,771
5,6375,927
7908,8022,616
115,150
44,50444,504
70,647
28,5765
28,571
1471,248
8,8692,962
3,945,0004,743,0001,022,0002,652,000
139,000
12,501,000
3,404,00011,428,000
923,000
4,03422,463
673
Rich-mond
189,468
46,9958,432
104,036898
10,2815,4897,2806,056
112,50221,44235,225
1,46214,955
9835,3353,536
29,563
76,966
3,372
196377673
522358
1,246
10,492
3,919305
4882,9962,783
69,845
30,89030,507
383
38,956
16,25123
16,228
4668
2001,787
2,125,0002,601,000
421,0001,723,000
87,000
6,957,000
1,440,0006,384,000
463,000
3,14514,475
477
Atlanta
200,604
47,31711,750
106,2911,162
12,1137,3265,1049,541
124,4572L89338,629
1,15513,136
5937,3364,123
37,592
76,147
3,782
182600
1,308
541293858
13,033
4,48284
1,0804,7992,587
66,896
28,71428,182
532
38,182
13,9562
13,954
3783
42,089
2,074,0002,630,000
537,0001,894,000
95,000
7,230,000
1,198,0006,709,000
435,000
2,97615,699
360
Chicago
578,744
173,47334,219
286,5865,151
26,1489,674
23,44220,052
359,28357,211
114,8772,775
61,743
3,42416,3007,288
95,664
219,461
21,882
3,0633,4676,863
2,3792,4403,670
45,740
14,0995,006
1,34218,6666,62 7
195,603
77,53177,469
62
118,072
43,668237
43,432
184,404
4,2925,749
6,634,0009,778,0001,833,0005,490,000
189,000
23,925,000
6,237,00022,231,000
1,381,000
6,81341,937
1,008
St. Louis
153,440
35,4768,930
89,580774
5,5493,9574,2514,922
90,09918,22427,146
1,2169,840
9194,6322,265
25,859
63,341
3,720
241402
1,014
449403
1,211
13,596
4,6761,713
1,1343,2682,807
53,464
22,71022,162
548
30,754
12,97843
12,935
23966
1,4072,063
1,952,0001,972,000
393,0001,449,000
52,000
5,818,000
1,023,0005,358,000
376,000
2,82011,547
493
Minne-apolis
115,461
26,5425,719
63,336827
7,0265,0532,7714,189
72 15115^20821,146
67710,958
2992,4381,789
19,636
43,310
2,348
232349286
894143444
7,424
3,234375
1,2241,644
947
38,234
15,82314,390
1,433
22,411
9,09826
9,072
5696
171,395
1,260,0001,461,000
297,000941,000
36,000
3,996,000
953,0003,707,000
242,000
2,3868,595
476
KansasCity
189,947
45,6409,771
107,026896
10,8083,3973,8518,560
110,87324,70031,871
1,31811,232
1,6694,1403,189
32,752
79,074
4,581
819448
1,054
1,214366681
13,528
3,721864
2,4994,0342,410
70,127
30,36429,211
1,154
39,763
13,8411
13,841
481,108
4273,534
2,144,0002,562,000
526,0002,033,000
62,000
7,327,000
830,0006,770,000
441,000
3,89913,136
753
Dallas
219,811
42,3839,415
136,0641,8589,2644,8013,630
12,397
130,64628^01137,195
1,3348,031
47412,1744,210
39,218
89,165
5,955
332254850
1,889385
2,245
20,881
4,747704
3,7847,6134,034
74,238
33,18033,135
46
41,058
20,00618
19,988
2741,838
405,611
2,684,0002,355,000
407,0002,453,000
123,000
8,021,000
751,0007,445,000
506,000
4,12114,882
634
SanFrancisco
677,211
118,07233,104
418,26910,06443,34712,14318,67223,540
430,61458,656
145,6111,232
109,672
2,87912,5829,323
90,659
246,598
12,467
1,3694,0852,370
9161,5582,170
41,617
12,3915,025
87118,3834,948
217,448
98,67292,259
6,412
118,776
67,326223
67,103
1,7665,543
3,30711,771
8,164,0006,486,0001,623,0004,033,000
290,000
20,595,000
7,092,00018,920,0001,172,000
7,70448,157
261
1 Includes figures for all banks that were members of the Federal Reserve System at the end of the year (including those becoming members duringthe year whose returns may cover operations for only part of the year); and in addition includes appropriate adjustments for member banks in operationduring part of the year but not at the end of the year. Data may not add to totals because of rounding.
includes interest on capital notes and debentures.3 Not available on the 13-month basis used for all member banks. See note on pp. 538-539.For other footnotes see pp. 538-539.
MAY 1953 537
Digitized for FRASER http://fraser.stlouisfed.org/ Federal Reserve Bank of St. Louis

MEMBER BANK EARNINGS, 1952—Continued
RESERVE CITY MEMBER BANKS,* BY FEDERAL RESERVE DISTRICTS
[Amounts in thousands of dollars]
Item
Federal Reserve district
Boston
Earnings I 73,801Interest and dividends on
securities:U. S. Government 14,606Other 3,040
Interest and discount on loans. 38,341Other charges on loans 423Service charges on deposits. . . 2,170Other charges, fees, etc 2,531Trust department 7,999Other current earnings 4,693
Expenses 42,220Salaries—officers 7,038Salaries and wages—others. . . 16,164Directors' fees, etc 153Interest on time deposits 1,633Interest on borrowed money.. 219Taxes other than income 2,021Recurring depreciation 1,062Other current expenses 13,929
Net current earnings beforeincome taxes ; 31,582
Recoveries, transfers from |reserves, and profits j 4,804On securities: j
Recoveries \ 815Transfers from reserves. . . .! 861Profits on securities ! 685
On loans:Recoveries 739Transfers from reserves. . . . i 1,125
All other 580
Losses, charge-offs, andtransfers to reserves 8,494
On securities:Losses and charge-offs 516Transfers to reserves 820
On loans:Losses and charge-offs 34Transfers to reserves 5,939
All other 1,184
Profits before income taxes. 27,892
Taxes on net income | 13,120Federal 10,988State I 2,132
Net profits
Cash dividends declaredOn preferred stock 2
On common stockMemoranda items:
Recoveries credited to re-serves (not included inrecoveries above):
On securitiesOn loans
Losses charged to reserves(not included in lossesabove):
On securitiesOn loans
LoansU. S. Government securities. . . .Other securitiesCash assetsOther assets
Total assets
Time depositsTotal depositsTotal capital accounts
Number of officersNumber of employees
Number of banks
14,772
9,659
' 9,659
130
1,957
1,024,000809,000152,000624,000
64,000
2,673,000
186,0002,360,000
243,000
6865,985
NewYork
41,681
7,5842,513
23,795465
2,771738
1,1102,705
29,7903,541
10,28?177
5,660127940580
8,483
11,891
3,620
8711,144
861,283
238
6,523
2001,538
124,318
456
8,988
3,4733,117
356
5,515
3,540147
3,393
23309
1,011371
536,000417,000112,000326,000
20,000
1,412,000
332,0001,297,000
95,000
3663,737
Phila-delphia
88,859
15,2606,783
47,925469
2,391829
11,6883,513
52,7697,755
22,381325
1,925523
2,338786
16,736
36,090
2,021
98863781
85
194
10,695
1,936681
125,5282,538
27,416
11,4961 1,496
15,920
11,702
11,702
36342
899913
1,170,000824,000296,000815,000
42,000
3,146,000
238,0002,823,000
264,000
6787,611
Cleve-land
186,440
46,14813,70495,350
1,4835,6922,649
12,9368,477
108,65013,35738,911
37314,027
1,1109,8822,737
28,251
77,790
3,899
40823
1,285
396987800
15,092
1,9805,468
2925,9141,438
66,597
26,87726,877
39,720
17,680
17,680
140705
8,6811,822
2,452,0002,660,000
567,0001,693,000
93,000
7,464,000
1,610,0006,786,000
550,000
1,16013,059
25
Rich-mond
79,266
20,8503,444
39,443424
4,4212,9624,8662,857
46,1258,0?4
17,150373
3,555650
2,4981,106
12,768
33,142
1,664
31377420
194209434
4,775
1,514185
311,5821,463
30,031
14,05013,860
190
15,981
7,418
7,418
4169
200673
937,0001,193,000
171,000833,000
43,000
3,176,000
461,0002,914,000
195,000
8106,68:
31
Atlanta
84,497
19,7665,015
44,636857
3,7053,2272,9304,361
52,5537,475
17,292276
5,156494
3,8391,399
16,622
31,944
2,052
35514890
222128263
5,040
1,62325
72,473
912
28,956
12,88512,722
164
16,071
6,283
6,283
833
979,0001,103,000
206,000894,000
45,000
3,227,000
454,0002,988,000
181,000
7966,698
21
Chicago
172,594
58,1429,383
80,9942,39c;
10,7373,4403,25?4,251
114,05313,80842,493
50719,1161,0245,5092,302
29,296
58,541
4,103
78116
2,080
228211
1,389
13,355
5,7691,875
674,4311,213
49,288
20,51720,503
14
28,771
10,99570
10,925
1,413
1,2241,935
1,857,0003,360,000
553,0001,780,000
64,000
7,614,000
2,180,0007,158,000
361,000
1,30815,216
74
St. Louis
75,195
15,0394,276
45,735451
1,8451,8703,5752,406
42,2586,648
14,969217
3,565794
2,036759
13,270
32,937
2,294
87298764
89133924
8,277
3.0961,518
3361,4441,883
26,954
13,58213,151
431
13,372
7,289
7,289
603
1,266942
1,140,000851,000166,000806,000
27,000
2,991,000
351,0002,730,000
191,000
6866,099
20
Minne-apolis
38,067
7,3082,019
22,105303
1,487939
2,2731,632
23,3723,4559,443
792,466
239480436
6,775
14,695
1,034
120250106
3697
182
1,841
1,02035
251394141
13,887
5,8345,165
669
8,053
3,41521
3,394
160
381
510,000418,000111,000406,000
13,000
1,457,000
173,0001,339,000
89,000
333,355
KansasCity
96,532
24,9435,393
52,173435
3,8461,1323,1615,451
55,7548,343
18,375308
5,6151,4982,0791,616
17,920
40,779
2,498
337423899
249266323
6,654
1,922725
3102,704
993
36,622
17,52816,886
642
19,094
6,73!
' 6,732
48358
4101,876
1,221,0001,419,000
295,0001,202,000
44,000
4,180,000
427,0003,843,000
236,000
9457,237
50
Dallas
99,917
18,7153,127
61,6861,3991,8842,0642,9498,093
57,5128,933
17,053216
4,517320
7,0431,603
17,825
42,405
2,059
164120464
337
974
8,392
2,737465
393,3461,805
36,072
18,19718,197
17,875
11,395
Yl',395
267685
1,73
1,474,0001,021,000
133,0001,188,000
80,000
3,897,000
408,0003,586,000
255,000
8086,504
30
SanFrancisco
557,107
95,38928,425
345,4998,683
35,4378,608
16,20918,856
349,19144,423
120,492728
92,2852,766
10,4706,671
71,357
207,916
10,622
8784,0742,033
5351,4741,629
34,617
10,0744,698
10615,7853,954
183,921
83,62778,6284,999
100,294
59,666193
59,473
1,7574,847
3,0239,885
6,901,0005,240,0001,397,0003,345,000
261,000
17,143,000
5,994,00015,693,000
971,000
5,63938,272
27
* Not including central reserve city banks.NOTE.—The figures of assets, deposits, and capital accounts are averages of the amounts reported for the call dates at the beginning, middle, and
end of each year, plus the last-Wednesday-of-the-month figures for the 10 intervening months. The number of officers, employees, and banks are as ofthe end of the year. Cash assets are comprised of cash, balances with other banks (including reserves balances), aiii casli (continued on following page)
For other footnotes see pp. 537-539.
538 FEDERAL RESERVE BULLETIN
Digitized for FRASER http://fraser.stlouisfed.org/ Federal Reserve Bank of St. Louis

MEMBER BANK EARNINGS, 1952—ContinuedCOUNTRY MEMBER BANKS, BY FEDERAL RESERVE DISTRICTS
[Amounts in thousands of dollars]
Item
EarningsInterest and dividends on
securities:U. S. GovernmentOther
Interest and discount on loansOther charges on loans.Service charges on deposits. . . ,Other charges, fees, etcTrust departmentOther current earnings
ExpensesSalaries—officersSalaries and wages—othersDirectors' fees, etcInterest on time depositsInterest on borrowed money. . .Taxes other than incomeRecurring depreciationOther current expenses
Net current earnings beforeincome taxes
Recoveries, transfers from re-serves, and profits
On securities:RecoveriesTransfers from reservesProfits on securities
On loans:RecoveriesTransfer? from reserves
All other
Losses, char&e-offs, and trans-fers to reserves
On securities:Losses and charge-offsTransfers to reserves
On loans:Losses and charge-offsTransfers to reserves
All other
Profits before income taxes. . .
Taxes on net incomeFederalState
Net profits
Cash dividends declared.On preferred stock -On common stock
Federal Reserve district
Boston
Memoranda i tems :Recoveries credited to reserves
("not included in recoveriesabove):
On securitiesOn loans
Losses charged to reserves (notincluded in losses above):
On securitiesOn loans
LoansU. S. Government securitiesOther securitiesCash assetsOther assets
Total assets
Time depositsTotal depositsTotal capital accounts
Number of officers. . . .Number of employees.
Number of banks
138,541
31,8416,686
73,266440
9,4712,1308,3356,372
92,18115,84328,668
1,28013,365
2404,4222,780
25,584
46,360
3,766
162680631
522612
1,159
11,236
3,123293
3893,6453,787
38,890
16,19314,476
1,717
22,696
11,65816
11,643
9693
3732,028
2,22211,810
312
NewYork
291,109
68,33817,695
160,3831,983
19,6235,4928,1499,445
199,40431,74960,650
2,60236,477
7458,4336,463
52,285
91,705
11,929
485824
2,337
1,7094,8811,694
28,922
6,1321,607
1,48516,6613,037
74,712
26,40324,714
1,689
48,310
19,9141,434
18,480
1952,068
1,5483,956
1,136,000 3,453,0004.179,000 8
353,000
4,48223,544
687
Phila-delphia
139,763
37,17010,76773,113
4465,8131,9275,7704,758
85,91415,42522,841
2,20817,391
2764,1223,126
20,525
53,849
2,831
41621
638
666159932
11,614
4,515157
3554,3822,205
45,065
16,17216,172
28,894
13,53974
13,464
355
138913
1,478,000 3,182,000 1,427,000 1,494,0001,723,000 3,641,000 1,924,000 2,083,000
374,000 899,000 507,000 455,000940,000 1,649,000 880,000 959,000
61,000 132,000 58,000 46,000
4,576,000 9,504,000 4,794,000 5,037,000 3
1,763,000,320,000447,000
2,7369,801
610
Cleve-land
143,435
38,6519,085
76,872488
7,0392,4662,8176,018
89,01116,66322,503
1,55516,579
1427,5722,707
21,289
54,424
2,808
341242758
533287646
8,679
3,657459
2,8881,178
48,553
17,62617,626
30,927
10,8975
10,891
7544
1891,140
Rich-mond
110,202
26,1454,987
64,593475
5,8602,5272,4153,200
66,37813,41918,0751,089
11,399333
2,8382,430
16,795
43,824
1,708
166
" "253
328149811
5,718
2,405121
4571,4141,321
39,814
16,84016,647
193
22,974
8,83323
8,810
1,794,000642,000373,000
713,000 4,320,000 4,642,000 3,470,000680,000
2,8749,404
648
1,113
1,187,0001,408,000
250,000891,00044,000
2,3357,793
Atlanta
116,107
27,5516,735
61,655305
8,4084,1002,1745,180
71,90414,41821,337
8787,980
993,4972,724
20,970
44,203
1,730
14686
418
320164595
7,993
2,86059
1,0732,3261,676
37,941
15,82915,460
369
22,112
7,6732
7,671
3559
11,256
Chicago
49,000
3,721,000254,000
2,1809,001
339
236,909
66,42513,059
124,0441,403
13,4655,1834,3618,969
151,91930,416,41,242
2,03228,368
5287,1754,278
37,880
84,990
4,176
632174
1,035
576656
1,102
17,101
7,433549
9235,6212,575
72,065
28,02427,977
47
44,041
14,52499
14,426
18948
3032,027
1,095,000 2,332,0001,527,000 3,669,000
332,0001,000,000
723,0001,684,000
78,000
1,781,000 4,003,000 8,485,000 2,827,000 2
979,000 744,000 2,901,000,470,000269,000
7,921,000495,000
4,59916,670
St. Louis
78,245
20,4374,655
43,845324
3,7042,087677
2,517
47,84211,57612,176
9996,275125
2,5961,506
12,588
30,404
1,426
154104250
360270288
5,319
1,580195
7971,823924
26,510
9,1289,011117
17,382
5,68943
5,646
22364
1411,121
812,0001,121,000227,000642,00025,000
672,000,628,000185,000
2,1345,448
473
Minne-apolis
77,395
19,2343,699
41,231524
5,5394,114497
2,557
48,77911,75311,703
5988,492
601,9581,353
12,861
28,616
1,314
11299180
525136262
5,582
2,214340
9731,250805
24,347
9,9909,226764
14,358
5,6835
5,678
2536
171,014
750,0001,043,000 1186,000536,00023,000
2,628,000 2,368,000
,539,000
780,000,368,000153,000
2,0495,240
467
KansasCity
93,415
20,6984,378
54,853461
6,9622,265690
3,108
55,11916,35713,4961,0105,617172
2,0611,57314,833
38,296
2,083
48225155
96499
358
6,874
1,799139
2,1891,3301,418
33,505
12,83612,324
512
20,669
7,1101
7,109
751
161,659
,144,000 1232,000831,00017,000
3,147,000 4
403,000927,000205,000
2,9545,899
703
Dallas
119,894
23,6686,28874,378
4597,3802,737681
4,305
73,13419,07820,1421,1173,514154
5,1302,607
21,392
46,760
SanFrancisco
120,105
22,6844,67972,7701,3817,9103,5352.46S4,684
81,42314,23325,119
50417,387
1132,1122,65119,303
38,682
3,896i 1,846
168134386
1,552385|
1.27OJ
49111
337
38184541
12,490 i 7,001
2,010|239
3,744!4,2672,229
38,167
14,98414,938
46
23,183
8,61118
8,593
1,154
403,874
924,000 1,209,0001,334,000274,000
1,264,00043,000
,125,000
343,000,859,000251,000
2,927,000 3,859,000 3,227,000
3,3138,378
604
2,317327
7642,598994
33,527
15,04513,6311,414
18,482
7,66030
7,630
9696
2841,886
1,263,0001,246,000226,000688,00029,000
3,452,000
1,098,000227,000201,000
2,0659,885
234
NOTF.—-(cont.)—items in process of collection. Total capital accounts are comprised of the aggregate book value of capital stock, capital notes anddebentures, surplus, undivided profits, reserves for contingencies, and other capital reserves.
- For other footnotes see pp. 537-538.
MAY 1953 539
Digitized for FRASER http://fraser.stlouisfed.org/ Federal Reserve Bank of St. Louis

MEMBER BANK EARNINGS BY SIZE OF BANK, 1952ALL MEMBER BANKS
[Amounts in thousands of dollars]
Item Total1
Size group—total deposits (in thousands of dollars)
1,000 andunder
1,000-2,000
2,000-5,000
5,000-10,000
10,000-25,000
25,000-50,000
50,000-100,000
Over100,000
EarningsInterest and dividends on se-
curities:U. S. GovernmentOther
Interest and discount on loans.Other charges on loansService charges on deposits. . . .Other charges, fees, etcTrust departmentOther current earnings
ExpensesSalaries—officersSalaries and wages—others. . . .Directors' fees, etcInterest on time depositsInterest on borrowed money.. .Taxes other than incomeRecurring depreciationOther current expenses
Net current earnings beforeincome taxes
Recoveries, transfers from re-serves, and profits
On securities:RecoveriesTransfers from reservesProfits on securities
On loans:RecoveriesTransfers from reserves
All other
Losses, charge-offs, and trans-fers to reserves
On securities:Losses and charge-offsTransfers to reserves
On loans:Losses and charge-offsTransfers to reserves
All other
Profits before income taxes. . .
Taxes on net incomeFederalState
Net profits
Cash dividends declaredOn preferred stock 2
On common stock
Memoranda items:Recoveries credited to reserves
(not included in recoveriesabove):
On securitiesOn loans
Losses charged to reserves (notincluded in losses above):
On securitiesOn loans
LoansU. S. Government securitiesOther securitiesCash assetsOther assets
Total assets
Time depositsTotal depositsTotal capital accounts
Number of officersNumber of employees
Number of banks
4,107,397
927,150234,121
2,265,63335,848197,04282,658190,336174,611
2,492,201406,577832,55921,409
363,63719,821
117,35659,898670,945
1,615,196
124,346
9,85919,54729,000
16,91724,71624,306
305,374
83,35427,040
15,515132,63246,833
1,434,168
606,363577,28629,077
827,805
389,6302,246
387,384
4,29828,067
24,64254,847
55,023,83952,739,86611,749,20139,243,2982,022,755
160,778,959
33,477,771147,497,69310,743,835
52,511300,332
10,105
2,027426
6,56232514330
1213
6,5582,5328701888386
312184
1,628
3,547
326
20
23
247828
677
701
4966943
3,197
81878334
2,379
8413
838
19
51
55,799
12,9782,480
34,155132
2,9901,828
361,200
35,06111,9835,7431,0375,377
601,6931,0318,136
20,738
1,205
78691
77148211
3,298
41881
1,484801514
18,646
4,9864,746241
13,659
4,5938
4,585
3212
4570
239,245
58,54313,133
140,322777
13,7886,389671
5,622
150,51441,12731,0624,08326,227
1847,2974,927
35,608
88,731
4,444
279179530
1,940392
1,124
15,439
3,859291
3,9164,4472,927
77,735
23,51022,639
871
54,226
18,51389
18,424
101,198
722,954
283,641
69,68017,534159,0571,59318,3617, 1*782,4257,812
180,16639,90944,6183,63532,011
2408,8635,977
44,915
103,474
5,878
1,170344
1,014
1,564421
1,365
21,270
6,963568
2,9347,0133,791
88,082
31,56630,5131,053
56,517
20,078105
19,974
631,790
1384,316
415,009
101,72024,430
224,7642,669
29,0348,9598,64914,784
269,48249,58577,1483,672
46,266560
12,8279,05770,367
145,527
8,226
950441
1 ,681
1,821881
2,453
30,145
10,1921,150
2,51511,0095,279
123,608
49,45447,8441,610
74,154
28,454238
28,216
482,367
5446,027
314,314
75,44818,847
166,6552,119
20,6546,53710,09313,961
203,69034,70564,3301,873
29,930817
9,8056,073
56,158
110,624
6,578
364631
1,450
9631,2511,919
23,618
9,033691
1,0098,6294,257
93,583
39,04738,106
941
54,536
21,99665
21,932
731,560
5233,591
322,113
75,79515,550175,7442,44917,9156,34013,26015,059
207,02032,99968,1501,552
28,2451,0539,6656,04759,310
115,093
9,252
1,0971,1801,867
8982,3161,894
26,618
8,1282,080
90611,2034,301
97,727
43,51342,0191,494
54,214
22,048508
21,540
181,569
1,7815,289
2,467,173
530,958141,721
1,358,37326,07893,78745,098155,200115,958
1,439,710193,739540,6405,368
194,74416,90266,89426,602
394,822
1,027,463
88,436
5,90116,76622,344
8,71419,39915,313
184,310
44,69122,180
2,25589,46125,723
931,590
413,470390,63622,834
518,120
273,1081,232
271,876
4,08319,352
21,58032,049
104,679106,65117,87684,8602,217
316.283
71,444282,43933,199
589,472688,318107,322457,53112,245
1,854,888
483,0701,684,514164,630
2,560,6163,183,256637,592
1,974,05567,188
8,422,707
2,394,6827,750,628648,337
2,976,3183,858,162914,475
2,269,53291,427
10,109,914
3,076,8529,360,742
705,397
4,407,2065,713,4001,296,3503,355,735
168,345
14,941,036
4,540,48713,872,459
970,450
3,537,9474,291,4721,003,5332,757,369
137,895
11,728,216
3,018,13710,917,469
718,452
3,843,9174,458,772846,325
3,042,156,607
37,003,68430,439,8356,925,728
709 25,301,5071,386,831
12,348,330
2,647,26011,529,146
706,010
101,057,585
17,245,83992,100,2966,797,360
860656
3,1023,238
8,54114,788
6,75719,018
6,94831,622
4,18625,679
3,81126,563
18,306178,768
6,777 370 1,111 2,359 1,337 913 319 165 203
t o t a l s are for all banks that submitted reports covering the entire year, except three trust companies having no deposits.2Includes interest on capital notes and debentures.NOTE.—The figures for assets, deposits, capital accounts, number of officers and employees, and number of banks are as of the end of the year.
See note on preceding page regarding the composition of cash assets and totad capital accounts.
540 FEDERAL RESERVE BULLETIN
Digitized for FRASER http://fraser.stlouisfed.org/ Federal Reserve Bank of St. Louis

MEMBER BANK EARNINGS BY SIZE OF BANK, 1952—ContinuedNATIONAL BANKS
[Amounts in thousands of dollars]
Item Total1
Size group—total deposits (in thousands of dollars)
1,000 andunder
1,000-2,000
2,000-5,000
5,000-10,000
10,000-25,000
25,000-50,000
50,000-100,000
Over100,000
EarningsInterest and dividends on se-
curities:U. S. GovernmentOther
Interest and discount on loans. .Other charges on loansService charges on depositsOther charges, fees, etcTrust departmentOther current earnings
ExpensesSalaries—officersSalaries and wages—othersDirectors' fees, etcInterest on time depositsInterest on borrowed money.. . .Taxes other than incomeRecurring depreciationOther current expenses
Net current earnings beforeincome taxes
Recoveries, transfers from re-serves, and profits
On securities:RecoveriesTransfers from reservesProfits on securities
On loans:RecoveriesTransfers from reserves
All other
Losses, charge-offs, and trans-fers to reserves
On securities:Losses and charge-offsTransfers to reserves
On loans:Losses and charge-offsTransfers to reserves
All other
Profits before I n c o m e t a x e s . . . .
T a x e s o n n e t i n c o m eFederalState
Net profits
Cash dividends declaredOn preferred stockOn common stock
Memoranda items:Recoveries credited to reserves
(not included in recoveriesabove):
On securitiesOn loans
Losses charged to reserves (notincluded in losses above):
On securitiesOn loans
LoansU. S. Government securitiesOther securitiesCash assetsOther assets
Total assets
Time depositsTotal depositsTotal capital accounts
Number of officersNumber of employeesNumber of banks
2,735,758
630,863163,657
1,528,18423,935135,29052,42480,584120,821
1,651,704270,050532,28414,441
259,14412,70778,29541,889442,894
1,084,054
80,547
6,88014,74520,131
11,56014,93112,300
201,776
60,67216,738
11,21383,33529,818
962,825
403,192386,09717,095
559,633
258,238397
257,841
2,36421,281
15,29140,674
35,996,19835,825,2198,340,509
26,323,1731,316,057
107,801,156
22,994,67298,948,2807,038,275
36,629196,419
7,390
1,524328
4,75322
383217
163
4,7571,8376441436004
214128
1,187
2,633
234
16
16
177520
428
59
3033630
2,439
61458628
1,825
6441
643
16
38,041
8,9641,740
23,06695
2,0291,280
18849
23,9298,0533,990
7263,669
471,077718
5,649
14,112
886
481
74
57440149
2,318
30960
1,080478391
12,680
3,3903,208
182
9,290
3,3204
3,316
146
38 401
176,863
44,37310,310102,099
57710,1174,601480
4,306
111,23830,19123,0263,08619,393
1305,3533,744
26,315
65,625
3,425
230125456
1,549199866
11,490
3,049198
2,8693,1702,204
57,560
17,27516,574
701
40,285
14,36266
14,296
2916
202,246
209,193
52,76313,191115,7441,156
13,5755,3901,4515,923
131,95029,14232,8712,712
22,916194
6,4994,42833,188
77,243
4,553
1,085303834
1,173187971
15,689
5,609406
2,3114,6092,754
66,107
23,24022,446
794
42,867
15,27670
15,206
531,465
743,192
302,655
77,11618,218162,5781,376
20,9426,1655,72510,535
194,91236,21355,4382,671
32,929385
9,3746,68051,222
107,743
5,867
720388
1,088
1,303586
1,782
8,005745
2,0767,0133,791
91,980
36,66235,4221,240
55,318
21,03190
20,941
391,779
2664,342
74,68979,39613,69961,2421,607
230,633
50,603204,95525,316
395,720469,97772,337
309,7008,626
1,256,360
319,0671,135,382116,759
1,852,7802,386,826491,320
1,461,88950,848
6,243,663
1,750,3835,731,546495,482
2,159,6682,910,365674,946
1,700,76966,814
7,512,562
2,209,4666,951,014531,342
3,163,7324,318,263979,259
2,524,506121,074
11,106,834
3,246,19310,325,769
713,103
628498
2,0962,239
6,31810,994
4,97914,017
5,14922,818
4,894 268 745 1,733 999 682
209,577
54,07312,746107,5921,22413,9434,2245,51310,262
134,90623,06642,1921,22019,718
5506,4994,08237,579
74,671
4,328
304189
1,054
722724
1,335
21,630 15,959
6,548298
8615,2413,011
63,040
25,71325,153
560
37,327
14,78911
14,778
451,152
2262,300
200,551
50,12510,131
107,3451,40911,4003,9646,4499,728
127,30420,78741,333
95816,306
7066,1753,74937,290
73,247
4,594
564683
1,322
643341
1,041
14,425
5,277650
7275,2422,529
63,416
28,39227,631
761
35,024
14,15057
14,093
1,078
5473,131
1,591,488
341,92596,993
905,00718,07662,90126,58360,94879,055
922,708120,761332,7902,925
143,61310,69143,10418,360
250,464
668,780
56,660
3,91313,05615,287
5,41912,8496,136
119,837
31,81614,381
98657,54615,108
605,603
267,906255,07712,829
337,697
174,66698
174,568
2,22514,729
14,15825,024
2,295,9303,079,412691,953
1,964,96593,773
8,126,033
1,995,1737,585,749483,951
2,379,5822,952,659556,717
2,120,73795,631
23,674,09719,628,3214,860,27816,179,365
877,684
8,105,326 65,219,745
1,591,6537,575,431460,083
11,832,13459,438,4344,212,239
2,79216,969
2,39916,127
12,268112,757
221 109 137
See footnotes on preceding page.
MAY 1953 541
Digitized for FRASER http://fraser.stlouisfed.org/ Federal Reserve Bank of St. Louis
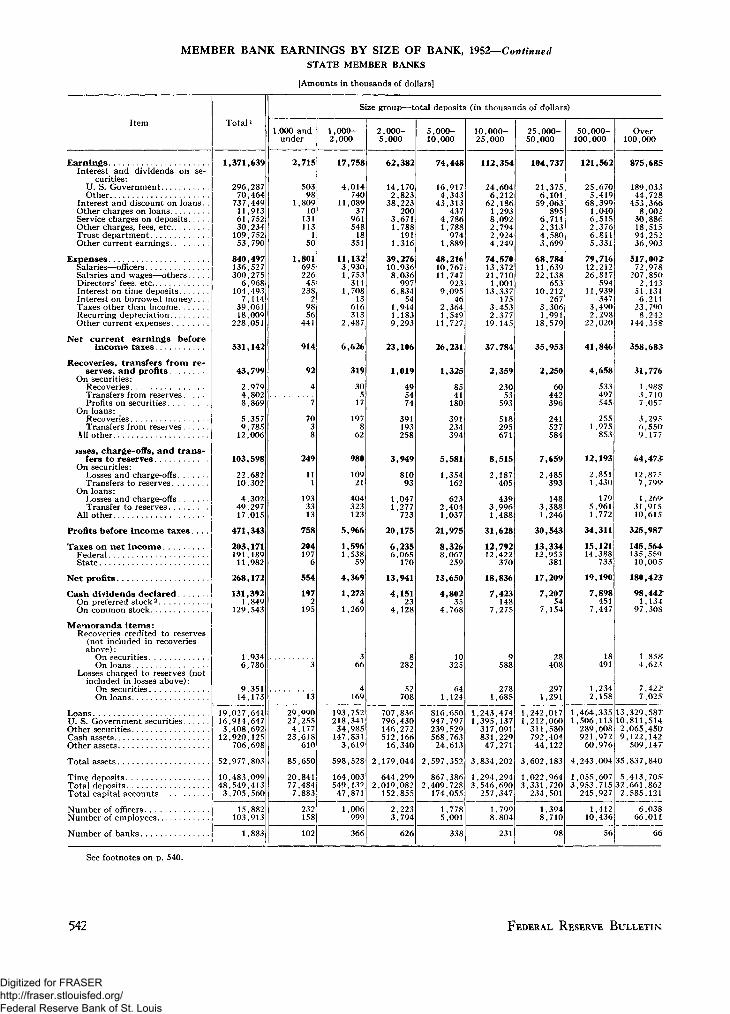
MEMBER BANK EARNINGS BY SIZE OF BANK, 1952—ContinuedSTATE MEMBER BANKS
[Amounts in thousands of dollars]
Item Total i
Size group—total deposits (in thousands of dollars)
1,000 andunder
1,000-2,000
2,000-5,000
5,000-10,000
10,000-25,000
25,000-50,000
50,000-100,000
Over100,000
EarningsInterest and dividends on se-
curities:U. S. GovernmentOther
Interest and discount on loans.Other charges on loansService charges on depositsOther charges, fees, etcTrust departmentOther current earnings
ExpensesSalaries—officersSalaries and wages—others... .Directors' fees, etcInterest on time depositsInterest on borrowed money.. .Taxes other than incomeRecurring depreciationOther current expenses
Net current earnings beforeincome taxes
Recoveries, transfers from re-serves, and profits
On securities:RecoveriesTransfers from reservesProfits on securities
On loans:RecoveriesTransfers from reserves
Ml other
>sses, charge-offs, and trans-fers to reserves
On securities:Losses and charge-offsTransfers to reserves
On loans:Losses and charge-offsTransfer to reserves
All other
Profits before income taxes. . .
Taxes on net income.FederalState
Net profits
Cash dividends declaredOn preferred stock2
On common stock
Memoranda items:Recoveries credited to reserves
(not included in recoveriesabove):
On securitiesOn loans
Losses charged to reserves (notincluded in losses above):
On securitiesOn loans
LoansU. S. Government securities.Other securitiesCash assetsOther assets
Total assets.
Time depositsTotal depositsTotal capital accounts
Number of officersNumber of employees...Number of banks
1,371,639
296,28770,464
737,44911,91361,75230,234109,75253,790
840,497136,527300,2756,968
104,4937,114
39,06118,009
228,051
531,142
43,799
2,9794,8028,869
5,3579,78512,006
103,598
22,68210,302
4,30249,29717,015
471,343
203,171191,18911,982
268,172
131,3921,849
129,543
1,9346,786
9,35114,173
19,027,64116,914,6473,408,69212,920,125
706,698
52,977,803
10,483,09948,549,4133,705,560
15,882103,913
2,715
50398
1,80910
131113
50
1,80169522645
2382
9856
441
914
92
4
7
249
11
1933313
758
2041976
554
1972
195
13
17,758
4,014740
11,08937
96154818
351
11,1323,9301,753311
1,70813
616313
2,487
6,626
319
30517
1978
62
980
10921
404323123
5,966
1,5961,538
59
4,369
1,2734
1,269
4169
62,382
14,1702,823
38,223200
3,6711,788
1911,316
39,27610,9368,036
9976,834
541 ,9441,1839,293
23,106
1,019
495474
391193258
3,949
81093
1,0471,277
723
20,175
6,2356,065
170
13,941
4,15123
4,128
282
52708
74,448
16,9174,343
43,313437
4,7861,788974
1,889
48,21610,76711,747
9239,095
462,3641 ,549
11,727
26,231
1,325
8541180
391234394
5,581
1,354162
6232,4041,037
21,975
8,3268,067259
13,650
4,80235
4,768
10325
641,124
112,354
24,6046,21262,1861,2938,0922,7942,9244,249
74,57013,37221,7101,001
13,337175
3,4532,37719,145
37,784
2,359
23053
593
518295671
8,515
2,187405
4393,9961,488
31,628
12,79212,422
370
18,836
7,423148
7,275
9588
2781,685
104,737
21,3756,10159,063
8956,7112,3134,5803,699
68,78411,63922,138
65310,212
2673,3061,991
18,579
35,953
2,250
60442396
241527584
7,659
2,485393
1483,3881,246
30,543
13,33412,953
381
17,209
7,20754
7,154
28408
2971,291
121,562
25,6705,419
68,3991,0406,5152,3766,8115,331
79,71612,21226,817
59411,939
3473,4902,298
22,020
41,846
4,658
533497545
2551,975853
12,193
2,8511,430
1795,9611,772
34,311
15,12114,388
733
19,190
7,898451
7,447
18491
1,2342,158
29,99027,2554,17723,618
610
85,650
20,84177,4847,883
193,752218,34134,985147,8313,619
598,528
164,003549,13947,871
707,836796,430146,272512,16616,340
2,179,044
644,2992,019,082
152,855
816,650947,797239,529568,76324,613
2,597,352
867,3862,409,728
174,055
1,243,4741,395,137317,091831,22947,271
3,834,202
1,294,2943,546,690
257,347
1,242,0171,212,060311,580792,40444,122
3,602,183
1,022,9643,331,720
234,501
1,464,3351,506,113289,608921,97260,976
4,243,004
1,055,6073,953,715 32
245,927
232158
1,006999
2,2233,794
1,7785,001
1,7998,804
1,3948,710
1,41210,436
1,883 366 338 98 56
875,685
189,03344,728453,3668,002
30,88618,51594,25236,903
517,00272,978
207,8502,443
51,1316,211
23,7908,242
144,358
358,683
31,776
1,9883,71O>7,057
3,2956,550'9,177
64,473
12,8757 ,799-
1,269*31,91510,615
325,987
145,564135,55910,005
180,423
98,4421,134
97,308
1 ,858-4,623
7,422'7,025
13,329,58710,811,5142,065,4509,122,142
509,147
35,837,84O;
5,413,705,661,862
2,585,121
6,03866,011
66
See footnotes on p. 540.
542 FEDERAL RESERVE BULLETIN
Digitized for FRASER http://fraser.stlouisfed.org/ Federal Reserve Bank of St. Louis
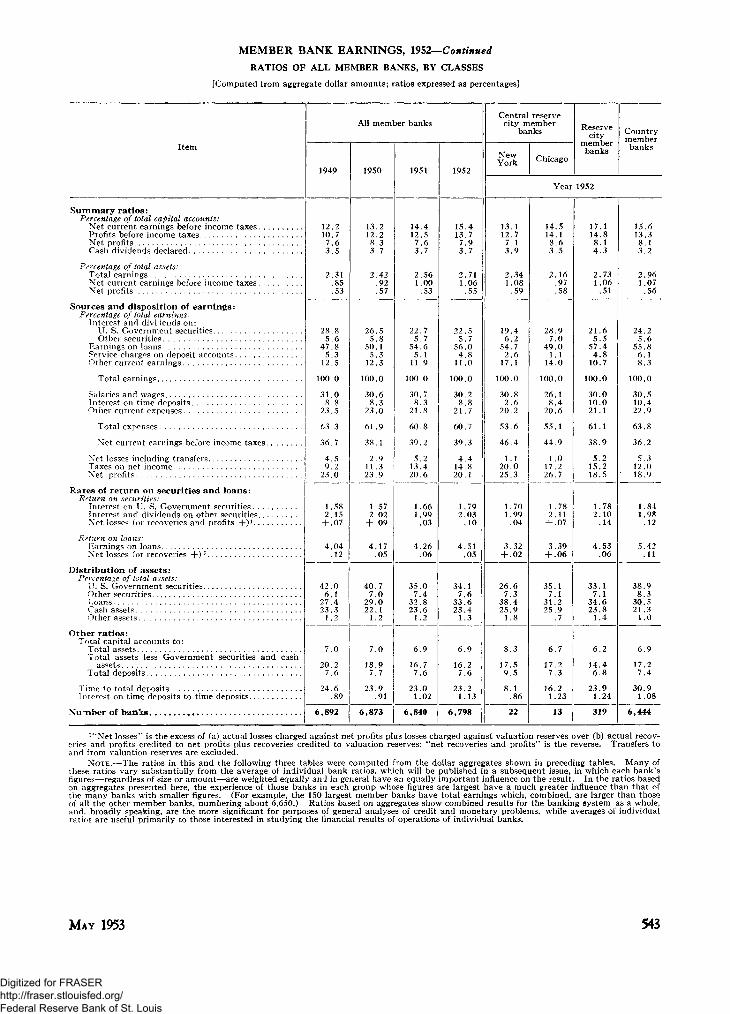
MEMBER BANK EARNINGS, 1952—Continued
RATIOS OF ALL MEMBER BANKS, BY CLASSES
[Computed from aggregate dollar amounts; ratios expressed as percentages]
Item
All member banks
1949 1950 1951 1952
Central reservecity member
banks
NewYork Chicago
Reservecity
memberbanks
Countrymemberbanks
Year 1952
Summary ratios:Percentage of total capital accounts:
Net current earnings before income taxes.Profits before income taxesNet profitsCash dividends declared
Percentage of total assets:Total earningsNet current earnings before income taxes.Net profits
Sources and disposition of earnings:Percentage of total earnings:
Interest and dividends on:U. S. Government securitiesOther securities
Earnings on loansService charges on deposit accounts. .Of her current earnings
3 . 5
.31
.85
.53
2.42.92.57
14.412.57.63.7
2.561.00
.53
15.413.77.93.7
2.711.06
.55
Total earnings
Salaries and wagesInterest on time depositsOther current expenses
Total expenses
Net current earnings before income taxes.
Net losses including transfersTaxes on net incomeNet profits
Rates of return on securities and loans:R'turn on securities:
Interest on U. S. Government securities. .Interest and dividends on other securities.Net losses for recoveries and profits +)1 . .
Return on loans:Earnings on loansNet losses (or recoveries + ) '
Distribution of assets:Percentage of total assets:
IT. S. Government securities..Other securitiesLoansCash assetsOther assets
Other ratios:Total capita] accounts to:
Total assetsTotal assets less Government securities and cash
assetsTotal deposits ,
Time to total depositsInterest on time deposits to time deposits
28.85.6
47.85.3
12.5
100.0
31.08.8
23.5
63.3
36.7
4.59.2
23.0
26.55.8
50.15.3
12.3
100.0
30.68.3
23.0
61.9
38.12.9
11.323.9
22.75 .7
54.65.1
11.9
100.0
30.78.3
21.8
60.8
39.25.2
13.420.6
22.55.7
56.04.8
11.0
100.0
30.28.8
21.7
60.7
39.34.4
14.820.1
1.582.15
+ .07
4.04.12
42.06.1
27.423.3
1.2
1.572.02
+ .09
4.17.05
7.0
20.27.6
24.6.89
40.77.0
29.022.1
1.2
7.0
18.97.7
23.9.91
Number of banks I 6,892 6,873
1.661.99
.03
4.26.06
1.792.03
.10
4.51.05
35.07.4
32.823.6
1.2
6 . 9
16.77.6
23.01.02
34.17.6
33.623.4
1.3
6 . 9
16.27.6
23.21.13
19.46.2
54.72.6
17.1
100.0
30.82.6
20.2
53.6
1.120.025.3
1.701.99
.04
3.32+ .02
6,840 I 6,798
26.67.3
38.425.9
1.8
8 .3
17.59.5
8.1.86
22
14.514.18.63.5
2.16.97.58
28.97.0
49.01.1
14.0
100.0
26.18.4
20.6
55.1
44.91.0
17.226.7
1.782 .11
+ .07
3.39+ .06
35.17.1
31.225.9
.7
6.7
17.27.3
16.21.23
13
17.114.88.14.3
2.731.06
.51
21.65.5
57.44.8
10.7
100.0
30.010.021.1
61.1
38.9
5.215.218.5
.53
.06
33.17.1
34.623.8
1.4
6 .2
14.46.8
23.91.24
319
15.613.38.13.2
2.961.07
.56
24.25.6
55.86.18.3
100.0
,84,98,12
5.42.11
38.98.3
30.521.3
1.0
17.27.4
30.91.08
6,444
!"Net losses" is the excess of (a) actual losses charged against net profits plus losses charged against valuation reserves over (b) actual recov-eries and profits credited to net profits plus recoveries credited to valuation reserves; "net recoveries and profits" is the reverse. Transfers toand from valuation reserves are excluded.
NOTE.—The ratios in this and the following three tables were computed from the dollar aggregates shown in preceding tables. Many ofthese ratios vary substantially from the average of individual bank ratios, which will be published in a subsequent issue, in which each bank'sfigures—regardless of size or amount—are weighted equally and in general have an equally important influence on the result. In the ratios basedon aggregates presented here, the experience of those banks in each group whose figures are largest have a much greater influence than that ofthe many banks with smaller figures. (For example, the 150 largest member banks have total earnings which, combined, are larger than thoseof all the other member banks, numbering about 6,650.) Ratios based on aggregates show combined results for the banking system as a whole,and. broadly speaking, are the more significant for purposes of general analyses of credit and monetary problems, while averages of individualratios are useful primarily to those interested in studying the financial results of operations of individual banks.
MAY 1953 543
Digitized for FRASER http://fraser.stlouisfed.org/ Federal Reserve Bank of St. Louis

MEMBER BANK EARNINGS, 1952—ContinuedRATIOS OF ALL MEMBER BANKS, BY FEDERAL RESERVE DISTRICTS
[Computed from aggregate dollar amounts; ratios expressed as percentages]
Item
Federal Reserve district
Boston NewYork
Phila-del-phia
Cleve-land
Rich-mond
At-lanta
Chi-cago
St.Louis
Min-neap-olis
Kan-sas
CityDallas
SanFran-cisco
Summary ratios:Percentage of total capital accounts:
Net current earnings before incometaxes
Profits before income taxesNet profitsCash dividends declared
Percentage of total assets:Total earningsNet current earnings before income
taxesNet profits
Sources and disposition of earnings:Percentage of total earnings:
Interest and dividends on:U. S. Government securitiesOther securities
Earnings on loansService charges on deposit accountsOther current earnings
Total earnings
Salaries and wagesInterest on time depositsOther current expenses
Total expenses
Net current earnings before in-come taxes
Net losses including transfersTaxes on net incomeNet profits
Rates of returns on securities andloans:
Return on securities:Interest on U. S. Government
securitiesInterest and dividends on other
securitiesNet losses1
Return on loans:Earnings on loansNet losses12
Distribution of assets:Percentage of total assets:
U. S. Government securitiesOther securitiesLoansCash assetsOther assets
Other ratios:Total capital accounts to:
Total assetsTotal assets less Government securi-
ities and cash assetsTotal deposits
Time to total depositsInterest on time deposits to time
deposits
Number of banks
13.111.26.33.6
2.93
1.08.52
13.112.37.13.7
2.53
1.05.56
12.610.26.33.5
2 .8
1.13.56
14.312.57.73.1
2.64
1.06.57
16.615.18.43.5
2.72
1.11.56
17.515.48.83.2
2.77
1.05.53
15.914.28.53.2
2.42
.92
.49
16.814.28.23.5
2.64
1.09.53
17.915.89.33.8
2.89
1.08.56
17.915.99.03.1
2.59
1.08.54
17.614.78.14.0
2.74
1.11.51
21.018.610.15.7
3.29
1.20.58
21.94.6
53.05.5
15.0
100.0
31.97.1
24.3
63.3
36.7
5.313.817.6
20.56.2
55.14.0
14.2
100.0
31.25.9
21.5
58.6
41.4
2.716.4
22.97.7
53.33.6
12.5
100.0
29.98.5
22.3
60.7
39.3
7.612.119.6
25.76.9
52.83.9
10.7
100.0
27.79.3
22.9
59.9
40.1
5.213.521.4
24.84.5
55.45.49.9
100.0
29.97.9
21.6
59.4
40.6
3.716.320.6
23.65.9
53.66.0
10.9
100.0
30.26.6
25.3
62.1
37.9
4.614.319.0
30.05.9
50.44.59.2
100.0
29.710.721.7
62.1
37.9
4.113.420.4
23.15.8
58.93.68.6
100.0
29.66.4
22.7
58.7
41.3
6.514.820.0
23.04.9
55.66.1
10.4
100.0
31.59.5
21.5
62.5
37.5
4.413.719.4
24.05.2
56.85.78.3
100.0
29.85.9
22.7
58.4
41.6
4.716.020.9
19.34.3
62.74.29.5
100.0
29.73.6
26.1
59.4
40.6
6.815.118.7
17.44.9
63.36.48.0
100.0
30.216.217.2
63.6
36.4
4.314.617.5
1.84
1.85.06
4.50.09
1.76
1.99.06
3.74.0
1.91
2.19.16
4.70.03
1.79
2.23.20
4.42.04
1.81
2.00.11
4.94.05
1.80
2.19.09
5.18.09
1.77
1.87.07
4.40.0
1.80
2.27.20
4.63.09
1.82
1.93.16
5.09.08
1.78
1.86.07
5.03.17
1.80
2.31.12
5.14.21
1.82
2.04.13
5.25.08
34.97.3
34.521.6
1.7
29.57.8
37.223.8
1.7
34.610.132.721.3
1.3
37.98.2
31.621.2
1.1
37.46.1
30.524.8
1.2
36.47.4
28.726.2
1.3
40.97.7
27.722.9
33.96.8
33.624.9
.8
36.67.4
31.523.6
.9
35.07.2
29.327.7
29.35.1
33.530.6
1.5
31.57.9
39.619.61.4
8.2
18.99.1
20.2
1.13
8.0
17.19.0
16.4
1.02
9 . 0
20.310.0
28.0
.97
7.4
18.18.1
29.8
.90
6.7
17.67.3
22.6
1.04
6.0
16.16.5
17.9
1.10
5.8
16.06.2
28.1
.99
6 . 5
15.77.0
19.1
.96
6 . 1
15.26.5
25.7
1.15
6.0
16.16.5
12.3
1.35
6.3
15.76.8
10.1
1.07
5.7
11.66.2
37.5
1.55
322 720 621 673 477 360 1,008 493 476 753 634 261
1"Net losses" is the excess of (a) actual losses charged against net profits plus losses charged against valuation reserves over (b) actual re-coveries and profits credited to net profits plus recoveries credited to valuation reserves. Transfers to and from valuation reserves are excluded.
2Ratios of less than .005 are shown as .0.
544 FEDERAL RESERVE BULLETIN
Digitized for FRASER http://fraser.stlouisfed.org/ Federal Reserve Bank of St. Louis
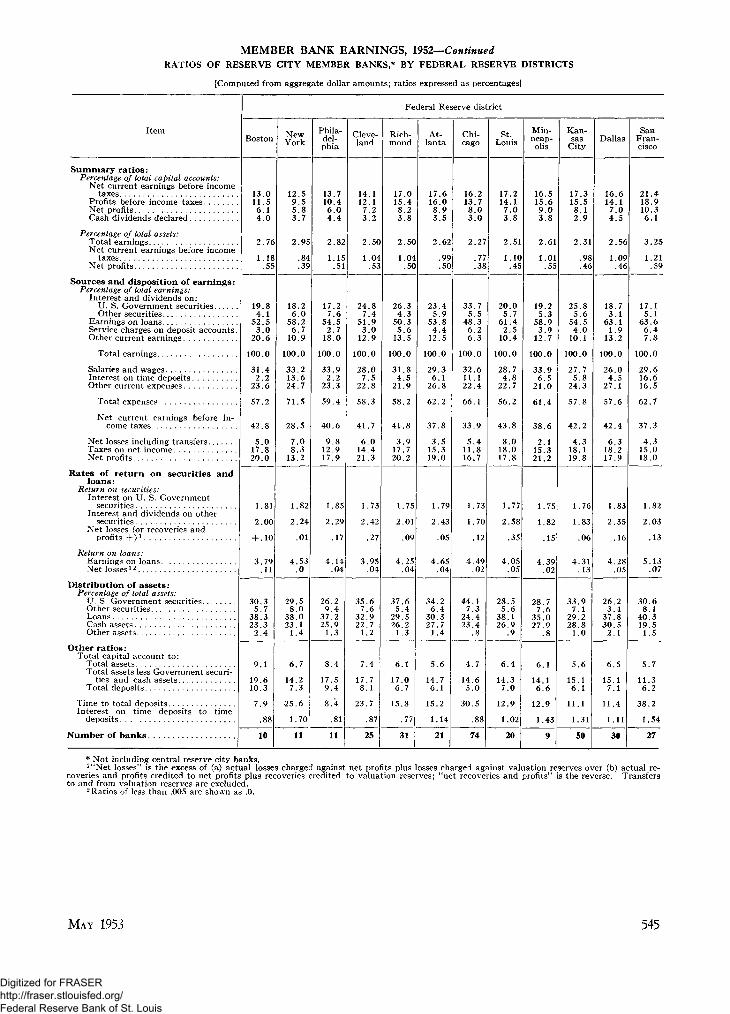
MEMBER BANK EARNINGS, 1952—ContinuedRATIOS OF RESERVE CITY MEMBER BANKS,* BY FEDERAL RESERVE DISTRICTS
[Computed from aggregate dollar amounts; ratios expressed as percentages]
Item
Federal Reserve district
Boston NewYork
Phila-del-phia
Cleve-land
Rich-mond
At-lanta
Chi-cago
St.Louis
Min-neap-olis
Kan-sas
CityDallas
SaaFran-cisco
Summary ratios:Percentage of total capital accounts:
Net current earnings before incometaxes
Profits before income taxesNet profitsCash dividends declared
Percentage of total assets:Total earningsNet current earnings before income
taxesNet profits
Sources and disposition of earnings:Percentage of total earnings:
Interest and dividends on:U. S. Government securitiesOther securities
Earnings on loansService charges on deposit accountsOther current earnings
Total earnings...
Salaries and wagesInterest on time depositsOther current expenses
Total expenses
Net current earnings before in-come taxes
Net losses including transfersTaxes on net incomeNet profits
Rates of return on securities andloans:
Return on securities:Interest on U. S. Government
securitiesInterest and dividends on other
securitiesNet losses (or recoveries and
profits +) i
Return on loans:Earnings on loansNet losses12
Distribution of assets:Percentage of total assets:
U. S. Government securitiesOther securitiesLoansCash assetsOther assets
Other ratios:Total capital account to:
Total assetsTotal assets less Government securi-
ties and cash assetsTotal deposits
Time to total depositsInterest on time deposits to time
deposits
Number of banks
13.011.56.14.0
2.76
1.18.55
12.59.55.83.7
2.95
.84
.39
13.710.46.04.4
2.82
1.15.51
14.112.17.23.2
2.50
1.04.53
17.015.48.23.8
2.50
1.04.50
17.616.08.93.5
2.62
.99
.50
16.213.78.03.0
2.2
.7
.38
17.214.17.03.8
2.51
1.10.45
16.515.69.03.8
2.61
1.01.55
17.315.58.12.9
2.31
.98
.46
16.614.17.04.5
2.56
1.09.46
19.84.1
52.53.0
20.6
100.0
31.42.2
23.6
57.2
42.8
5.017.820.0
18.26.0
58.26.7
10.9
100.0
33.213.624.7
71.5
28.5
7.08.3
13.2
17.27.6
54.52.7
18.0
100.0
33.92.2
23.3
59.4
40.6
9.812.917.9
24.87.4
51.93.0
12.9
100.0
28.07.5
22.8
58.3
41.7
6.014.421.3
26.34.3
50.35.6
13.5
100.0
31.84.5
21.9
58.2
41.8
3.917.720.2
23.45.9
53.84.4
12.5
100.0
29.36.1
26.8
37.8
3.515.319.0
33.75.5
48.36.26.3
100.0
32.611.122.4
66.1
33.9
5.411.816.7
20.05.7
61.42.5
10.4
100.0
28.74.8
22.7
56.2
43.8
8.018.017.8
19.25.3
58.93.9
12.7
100.0
33.96.5
21.0
61.4
38.6
2.115.321.2
25.85.6
54.54.0
10.1
100.0
27.75.8
24.3
42.2
4.318.119.8
18.73.1
63.11.9
13.2
100.0
26.04.5
27.1
57.6
42.4
6.318.217.9
1.81
2.00
+ .10
3.79.11
1.82
2.24
.01
4.53.0
1.85
2.29
.17
4.14.04
1.73
2.42
.27
3.95.04
1.75
2.01
.09
4.25.04
1.79
2.43
.05
4.65.04
1.73
1.70
.12
4.49.02
1.77
2.58
.35
4.05.05
1.75
1.82
.15
4.39.02
1.76
1.83
.06
4.31.13
1.83
2.35
.16
4.28.05
30.35.7
38.323.32.4
29.58.0
38.023.1
1.4
26.29.4
37.225.9
1.3
35.67.6
32.922.7
1.2
37.65.4
29.526.2
1.3
34.26.4
30.327.7
1.4
44.17.3
24.423.4
28.55.6
38.126.9
.9
28.77.6
35.027.9
33.97.1
29.228.8
1.0
26.23.4
37.830.5
2.1
9 . 1
19.610.3
7 .9
6 .7
14.27.3
25.6
1.701
8.4
17.59.4
8.4
.81
17.78.1
23.7
.87
17.06.7
15.8
.77
5 .6
14.76.1
15.2
1.14
4.7
14.65.0
30.5
6 . 4
14.37.0
12.9
1.02
14.16.6
12.9
1.43
5 . 6
15.16.1
11.1
1.31
6 . 5
15.17.1
11.4
1.11
10 11 11 25 31 21 74 20 50 30
21.418.910.36.1
3.25
1.21.59
17.15.1
63.66.47.8
100.0
29.616.616.5
62.7
37.3
4.315.018.0
1.82
2.03
.13
5.13.07
30.68.1
40.319.51.5
5 .7
11.36.2
38.2
1.54
27
* Not including central reserve city banks.1"Net losses" is the exce:cess of (a) actual losses charged against net profits plus losses charged against valuation reserves over (b) actual re-
coveries and profits credited to net profits plus recoveries credited to valuation reserves; "net recoveries and profits" is the reverse. Transfersto and from valuation reserves are excluded.
2 Ratios of less than .005 are shown as .0.
MAY 1953 545
Digitized for FRASER http://fraser.stlouisfed.org/ Federal Reserve Bank of St. Louis

MEMBER BANK EARNINGS, 1952—ContinuedRATIOS OF COUNTRY MEMBER BANKS, BY FEDERAL RESERVE DISTRICTS
[Computed from aggregate dollar amounts; ratios expressed as percentages]
Item
Federal Reserve district
Boston NewYork
Phila-del-phia
Cleve-land
Rich-mond
At-lanta
Chi-cago
St.Louis
Min-neap-olis
Kan-sas
CityDallas
SanFran-
Summary ratios:Percentage of total capital accounts:
Net current earnings before incometaxes
Profits before income taxesNet profitsCash dividends declared
Percentage of total assets:Total earningsNet current earnings before income
taxesNet profits
Sources and disposition of earnings:Percentage of total earnings:
Interest and dividends on:U. S. Government securitiesOther securities
Earnings on loansService charge on deposit accounts .Other current earnings
Total earnings
Salaries and wagesInterest on time depositsOther current expenses
Total expenses
Net current earnings before in-come taxes
Net losses including transfersTaxes on net incomeNet profits
Rates of return on securities andloans:
Return on securities:Interest on U. S. Government
securitiesInterest and dividends on other
securitiesNet lossesl
Return on loans:Earnings on loansNet lossesl
Distribution of assets:Percentage of total assets:
IT. S. Government securitiesOther securitiesLoansCash assetsOther assets
Other ratios:Total capital account to:
Total assetsTotal assets less Government securi-
ties and cash assetsTotal deposits
Time to total depositsInterest on time deposits to time
deposits
Number of banks
13.111.06.43.3
3.03
1.01.50
23.04.8
53.26.8
12.2
100.0
32.19.6
24.8
66.5
33.5
5.411.716.4
1.85
1.79.13
4.99.08
37.78.2
32.320.5
1.3
7.7
18.58.4
27.2
1.18
312
13.511.07.12.9
3.06
.96
.51
23.56.1
55.86.77.9
100.0
31.812.524.2
68.5
31.5
5.89.1
16.6
1.88
1.97.10
5.10.05
38.39.5
33.517.41.3
7.2
16.17.8
39.6
1.06
687
12.010.16.53.0
2.92
1.12.60
26.67.7
52.64.28.9
100.0
27.412.421.7
61.5
38.5
6.311.520.7
1.93
2.12.15
5.15.02
40.110.629.818.31.2
9.3
22.510.3
40.8
.99
610
14.613.08.32.9
2.85
1.08.61
27.06.3
53.94.97.9
100.0
27.311.623.2
62.1
37.9
4.112.221 .6
1.86
2.00.11
5.18.04
41.49.0
29.719.0
.9
7.4
18.78.0
38.6
.92
648
16.314.88.53.3
2.91
1.16.61
23.74.5
59.15.37.4
100.0
28.610.321.3
60.2
39.8
3.715.320.8
1.86
1.99.12
5.48.06
37.26.6
31.423.6
1.2
7.1
18.27.8
28.2
1.16
446
17.414.98.73.0
2.90
1.10.55
23.75.8
53.47.29.9
100.0
30.86.9
24.2
61.9
38.1
5.413.719.0
2.03.12
5.66.13
38.18.3
27.425.0
1.2
17.214.68.92.9
2.79
1.00.52
16.414.39.43.1
1.08.61
28.05.5
53.05.77.8
100.0
30.212.021.9
64.1
35.9
5.511.818.6
1.81
1.81.14
5.38.06
6.3
17.26.8
20.0
1.07
43.28.5
27.519.9
.9
5.8
15.86.2
36.6
.98
26.16.0
56.44.76.8
100.0
30.38.0
22.8
61.1
5.011.722.2
1.82
2.05.10
5.44.15
39.78.0
28.722.7
.9
6 . 5
17.47.0
25.6
.93
18.715.99.43.7
3.05
1.13.57
24.94.8
53.97.29.2
100.0
30.311.021.7
63.0
37.0
5.512.918.6
18.716.310.13.5
1.22.66
22.14.7
59.27.56.5
18.615.29.23.4
2.91
1 .13.56;
19.75.3
62.46.26.4
19.216.79.23.8
1.12.54
18.93.9
61 .76.68.9
100.0 100.0 100.0
339 921 473
1.84
1.99.16
5.57.23
41.17.3
29.621.1
.9
6.0
15.96.5
32.9
1.09
32.0 i6.0 !
21.0 !
59.0 !
5.113.822.1
1.89.09
5.99.13
36.37.4
29.426.4
.5
6.5
3 2 . 72 .9
2 5 . 4
32 . cS14.520.5
39.0 . 32.2
1.2 i 4 .312.5 12.519.3 ; 15.4
2 29i.09'
1.82
2.07.12
6.19; 5.87.41; .12
467
17.57.0
13.8
1.39
703
I
32.36.6
29.330.7
1.1
16.46.5
8.9 I
1.02
604
36.16.5
36.619.9
.9
13.26.2
34.0
1.58
234
1"Net losses" is the excess of (a) actual losses charged against net profits plus losses charged against valuation reserves over (b) actual re-coveries and profits credited to net profits plus recoveries credited to valuation reserves. Transfers to and from valuation reserves are excluded
546 FEDERAL RESERVE BULLETIN
Digitized for FRASER http://fraser.stlouisfed.org/ Federal Reserve Bank of St. Louis

BANK EARNINGS, 1952INSURED COMMERCIAL BANKS IN THE UNITED STATES AND POSSESSIONS, 1949-1952
[Amounts in thousands of dollars]
All insured commercial banks1
1951
Banks not members ofFederal Reserve System
1950 1951
EarningsInterest and dividends on securities:
U. S. GovernmentOther
Interest and discount on loansOther charges on loansService charges on depositsOther charges, fees, etcTrust departmentOther current earnings
ExpensesSalaries—officersSalaries and wages—othersDirectors' fees, etcInterest on time depositsInterest on borrowed moneyTaxes other than incomeRecurring depreciationOther current expenses
Net current earnings before incometaxes
Recoveries, transfers from reserves,and profits
On securities:RecoveriesTransfers from reservesProfits on securities
On loans:RecoveriesTransfers from reserves
All other
Losses, charge-offs, and transfers toreserves
On securities:Losses and charge-offsTransfers to reserves
On loans:Losses and charge-offsTransfers to reserves
All other
Profits before income taxes
Taxes on net incomeFederalState
Net profits
Cash dividends declaredOn preferred stock 2
On common stock
Memoranda itemsRecoveries credited to reserves (not in-
cluded in recoveries above):On securitiesOn loans
Losses charged to reserves (not includedin losses above):
On securitiesOn loans
LoansU. S. Government securitiesOther securitiesCash assetsOther assets
Total assets
3,606,879
1,013,515201,691
1 733,690' 26,090194,01395,420160,430182,030
2 283,727'410,685700,06522,608
328,0103,582
113,56953,988
651,219
1,323,153
213,187
16,41226,67273,196
23,14228,22045,546
379,824
38,67133,044
29,064221,16757,878
1,156,514
325,148304,57220,576
831,364
354,1445,093
349,052
2,60019,645
6,10472,978
3,930,696
1,015,456225,425
1,976,10031,724212,272104,602180,674184,445
2,444,534446,043755,68124,745
343,0404,296
128,10159,469
683,159
1,486,164
245,461
14,71838,63990,469
28,50629,97143,157
366,932
38,72154,518
23,030191,24859,414
1,364,690
427,776402,58225,194
936,915
391,2494,333
386,916
3,56520,385
6,32456,250
Time depositsTotal depositsTotal capital accounts.
Number of officersNumber of employees.
Number of banks
41 670,87963,080,7399 387,984
35 683,8291,742,647
151,566,078
35,902,235139,764,39410,421,106
46,250,27263,846,83011,043,34236,006,4231,840,027
158,986,894
36,446,656146,269,29411,007,396
69,439296,308
71,566312,324
13,436 13,446
4,395,411
983,662249,495
2,390,10634,595230,507116,140192,313198,593
2,701 313486,300864,51927,343
385,3449,667
135,59065,845726,707
1,694,100
169,233
15,29212,28556,563
22,59528,45334,046
395,687
83,75631,680
21,215204,20254,836
1,467,645
559,475530,81028,664
908,175
418,8603,876
414,984
2 ,36328,477
17,72564,735
54,533,22159,711,92212,554,63240,373,2732,034,346
169,207,394
37,271,294155,460,46511,615,767
73,806334,961
4,931,688
1 ,099,059276,993
2 742,10042,295244,696121,868204,967199,713
3,028,575530,035965,19730,871458,05920,921139,29074,953
809,252
1,903,112
144,146
11,191?0,49233,806
2?,00427,33029,324
362,444
97,51?29,531
23,637154 51057,253
,684,813
604,883667,27732,606
989,931
441,9713.67S
438,298
4.35^13),508J
25,59864,607
59 999,74361'065,05913 567,46947 O5?,K082,223,391
179,803,463
39,817,653165 031.49512.270,913
76 7=^!358,325\
621,695
154,55233,220
328,2074,65836,05730,9299,04925,024
395,16992,55392,1736,54667,100
24617,29610,091109,165
226,527
30,726
2,9684,3839,263
5,0173,3025,794
61,966
7,8225,041
9,91229,9199,272
195,285
50,08247,5032,579
145,201
41,4781,605
39,874
2012,133
96011,123
666,514
150,66235,283
368,3205,65839,78333,85510,15722,797
425,210101,325100,568
7,29872,266
40119,25911,456
112,636
727,242
152,00538,759
416,015'5,927;
43,635,37,145;9,895j
23,862;
469,835;lll,065J114,526*
8,197180,076!
590|20,645iI2,78li
121 ,956;
26,89l! 20,621;
6,092,2039,035,3411,541,4863,705,187
182,596
6.708,04519,038,2571,423,677
21,99645,959
13,4551 13,439; 6,547
1 ,9301,840!8,32l|
5,9583,0115,830
53,301
6,0983,585
8,76224,9809,875
214,894
58,71655,67313,043
156,179
45,7271 ,498
44,229
529,3,369
5169,921
1 ,761;1,350:4,683;
5,O18;
2,841>4,970'
11.655.:3,262.
7,660;24,16810,097
68,55665,330:
3,225'
6,723,4198,855,3151,678,7763,934,637!
201,885
6,853,26219,725,7891,545,040
22,61048,696
6,576
48,356;l,289i
47,067!
2 78'3,423i
1 ,8069,154;
812,634
170,02342,498
472,4296,36146,96239,00310,53924,820
528,002121,770129,9489,36293,8661,096
21,64514,892
135,426
241,306] 257,409 284,631
19,139
1,237846
4,759
5,0382 ,5964,665
56,840 56,065
13,6622,491
7,98521,61410,312
221,189 247,704
87,03383,5953,438
152,638 160,672
51,5411,365
50,177
473,420
9569,669
7,494,950 8,299,1778,691,2591,885,8304,368,648
215,804
9,194,6382,053,3204,771,055
237,903
20,556,813 21 ,394,032 22,656,491 24,556,093
7,023,832 7,575,491•0,864,285 22,613,7281,650,644 1,770,932
23,263!52,7131
24,11357,475
6,618 6,644
1 Excludes three mutual savings banks, State bank members of the Federal Reserve System, which are included in member bank figures oneding pages.preceding pages.
2Includes interest on capital notes and debentures.T fi f
2Includes interest on capital notes and debentures.NOTE.—The figures of assets, deposits, and capital accounts are averages of the amounts reported for call dates at the beginning, middle, and
end of each year. The number of officers, employees, and banks are as of the end of each year.
MAY 1953 547
Digitized for FRASER http://fraser.stlouisfed.org/ Federal Reserve Bank of St. Louis

NUMBER OF BANKS AND BRANCHES IN OPERATION ON DECEMBER 31, 1952
State
United States
AlabamaArizona.ArkansasCaliforniaColorado
ConnecticutDelawareDist. of ColFloridaGeorgia. . . .
IdahoIllinoisIndianaIowaKansas. .
Kentucky .LouisianaMaineMaryland .Massachusetts
MichiganMinnesotaMississippiMissouriMontana. .
NebraskaNevada..New Hampshire .New TerseyNew Mexico
New YorkNorth CarolinaNorth DakotaOhioOklahoma
OregonPennsylvaniaRhode IslandSouth Carolina . .South Dakota
TennesseeTexasUtahVermontVirginia . .
Washington. . .West VirginiaWisconsinWyoming. . . . . .
All banks by class of bank
Total
14,575
22914
230199160
1843719
213403
40894485665609
38016796
165368
429680202598109
4178
109335
51
734226153654385
69947
21149170
297919
5574
315
121182557
52
Commercial banks
Total
214 046
22914
230199160
1123519
213403
40894
2481665609
38016764
156180
429679202598109
417g
75312
51
604226153651385
68940
13149170
297919
67315
117182
255352
Memberbanks
Na-tional
4,909
713
539277
48119
6452
1238612497
174
91373259
114
77178247738
1245
51200
26
3634640
238198
19607
62535
74444
1037
133
35749524
Statemem-ber
21,889
242
162717
1536
1114
9125
2H36441
20126
1425
15028
710045
1611
678
16292
17925
1099
28
28
10137
211
71
1635
27215
Nonmemberbanks
In-sured
6,627
1348
1557054
32204
134275
18372235448259
251117
178134
185458168399
26
22926
4117
70170104227153
37217
2101107
206296
2428
111
6369
38013
Non-in-
sured
624
1
1012
171
462
1111056
135
181927
17153
22
48
174
91779
2173
15
742
1
348
Mutual sav-ings banks
In-sured
2206
41
23
86
1
23
130
3
175
7
4
23
Non-in-
sured
323
681
1
243
188
34
3
1
All
Total
1,483
48
1952
1
299
151
17
9
65121
2743273590
702
38
243
6613
186731566
1386102027
33
89
59
18
90
banks maintaining branches or additional offices(except banking facilities), by class of bank1
Commercial banks
Total
1,359
48
1952
1
238
151
17
9
65121
2743263053
702
38
242
6013
127731566
1382
82027
33
88
59
17
90
Memberbanks
Na-tional
385
321
19
11
8
7
5
20
41274
22
1422
221
294
5215
24
346
284
11
13
2110
4
Statemem-
ber
237
11
12
634
5
2
5
5646
18
17
1
i21
516
19
21621
2
4. . . . . .
2
3
Nonmemberbanks
In-sured
708
41819
1
64314
2
39118
1825101912
36
35
1
109
22511523
8172
1123
20
35
27
5
82
Non-in-
sured
29
1
2
1
1
13
511
3
i
21
32
1
Mutual sav-ings banks
In-sured
78
1
5
6
59
41
1
1
Non-in-
sured
46
51
1
37
1
1
• 1 Some State laws make a distinction between "branches" and certain other types of "additional offices." The table, however, covers allbranches of additional offices within the meaning of Section 5155 U. S. R. S., which defines the term "branch" as "any branch bank, branch office,branch agency, additional office, or any branch place of business . . . at which deposits are received, or checks paid, or money lent." In addi-tion the last column on the second page of the table shows the number of "banking facilities" at military and other Government establishmentsprovided through arrangements made by the Treasury Department with banks designated as depositaries and financial agents of the Government.
These tables are similar to those appearing in previous years (see May 1952 BULLETIN, pp. 567-568), except that the number of banks thathave no additional offices, other than "banking facilities" at military and other Government establishments provided through arrangements madeby the Treasury Department, are excluded from the number of banks maintaining branches or additional offices; these "banking facilities" areshown in the last column of the table on p. 549, but are not included elsewhere. Branches that have been designated by the Treasury Depart-ment as "banking facilities" are included in the number of branches, but are not included in the number of "banking facilities."
Back figures.—See Banking and Monetary Statistics, Table 1, pp. 16-17, and Tables 73-79, pp. 297-311, for data through 1941 (descriptivetext, pp. 14 and 294-295) and BULLETINS for subsequent data, the latest of which appeared in May 1952, pp. 567-568.
2The figures for member (commercial) banks and those for mutual savings (noncommercial) banks both include one mutual savings bankin Indiana and two in Wisconsin. The total for "All banks," however, includes such banks only once; and they are not included in the total for"Commercial banks."
3These facilities are operated by 133 banks, 72 of which have no other type of branch or additional office.4 Each bank is reported once only—according to the widest area in which it operates branches or additional offices.NOTE.—All of the branches and additional offices are located in the same States as their parent banks except that one national bank in New
Jersey has a branch in Pennsylvania, one national bank in California has two branches in Washington and one in Oregon, and one noninsured(unincorporated) bank in New York has one branch in Massachusetts and one in Pennsylvania. In the table these branches are shown accordingto their own location, rather than that of the parent bank.
548 FEDERAL RESERVE BULLETIN
Digitized for FRASER http://fraser.stlouisfed.org/ Federal Reserve Bank of St. Louis
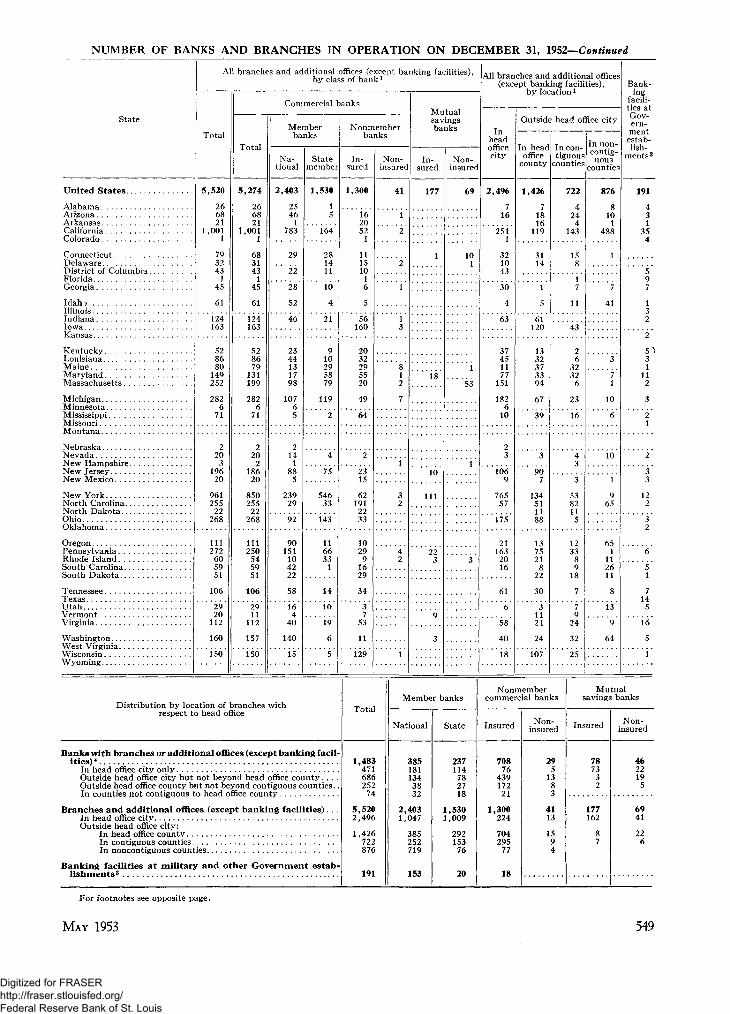
NUMBER OF BANKS AND BRANCHES IN OPERATION ON
State
United States
Alabama . . . . . .ArizonaArkansasCaliforniaColorado
ConnecticutDelawareDistrict of ColumbiaFloridaGeorgia
IdahoIllinoisIndianaIowaKansas
KentuckyLouisianaMaineMarylandMassachusetts
MichiganMinnesotaMississippiMissouriMontana
NebraskaNevadaNew HampshireNew JerseyNew Mexico
New YorkNorth CarolinaNorth DakotaOhioOklahoma
OregonPennsylvaniaRhode Island .South CarolinaSouth Dakota
TennesseeTexasUtahVermontVirginia
WashingtonWest VirginiaWisconsinWyoming
DECEMBER 31, 1952—Continued
All branches and additional offices (except banking facilities),by class of bank1
Total
5,520
266821
1,0011
793243
145
61
124163
528680
149252
2826
71
220
3196
20
961255
22268
111272605951
106
2920
112
160
150
Commercial banks
Total
5,274
266821
1,0011
683143
145
61
124163
528679
131199
2826
71
220
2186
20
850255
22268
111250545951
106
2911
112
157
150
Memberbanks
Na-tional
2,403
2546
1783
29
22
28
52
46
2344131798
10765
214
188
5
23929
92
90151
104222
58
164
40
140
15
Statemember
1,530
15
164
281411
10
4
21
910295879
119
2
4
' " 75
54633
143
116633
1
14
10• • • • —
6
5
Nonmemberbanks
In-sured
1,300
162052
1
111510
16
5
56160
2032295520
49
64
2
2315
62191
2233
10299
1629
34
37
53
11
129
Non-insured
41
1
2
2
1
13
812
7
1
32
42
1
Mutualsavingsbanks
In-sured
177
18
10
111
223
9
3
Non-insured
69
101
i' " " 53'
1
3
All branches and additional offices(except banking facilities),
by location1
headofficecity
2,496
716
2511
3?1043
30
4
63
37451177
151
1826
10
23
1069
76557
175
211632016
61
6
58
40
18
Outside
In headoffice
county
1,426
71816
119
3114
1
5
61120
1332373394
67
39
3
907
134511188
137521
822
30
31121
24
107
» head office city
In con-tiguous
counties
722
4244
143
1 s>8
17
1 1
43
26
3232
6
23
16
43
3
S38211
5
1233
89
18
7
79
24
32
25
In non-contig-uous
counties
876
g101
488
1
7
41
3
71
10
6
10
1
965
651
112611
8
13
9*
64
Bank-ing
facili-ties atGov-ern-
estab-lish-
ments3
191
431
354
597
132
2
5 131
112
3
21
2
33
122
32
6
51
714
5
16
5
1
Distribution by location of branches withrespect to head office Total
Member banks
National State
Nonmembercommercial banks
Insured Non-insured
Mutualsavings banks
Insured Non-insured
Banks with branches or additional offices (except banking facil-ities)*
In head office city onlyOutside head office city but not beyond head office county. . .Outside head office county but not beyond contiguous counties.In counties not contiguous to head office county
Branches and additional offices (except banking facilities). .In head office cityOutside head office city:
In head office countyIn contiguous countiesIn noncontiguous counties
Banking facilities at military and other Government estab-l ishments3
1,483471686252
74
5,5202,496
1,426722876
191
3851811343832
2,4031,047
385252719
153
237114782718
1,5301,009
29215376
20
70876
43917221
1,300224
704295
77
18
295
13
41131594
787332
4622195
177162
694122
6
For footnotes see opposite page.
MAY 1953 549
Digitized for FRASER http://fraser.stlouisfed.org/ Federal Reserve Bank of St. Louis

WEEKLY REPORTING MEMBER BANKS—REVISED SERIES, TOTAL FOR ALL LEADING CITIES *LOANS AND INVESTMENTS
[In millions of dollars]
Date
Totalloansand
invest-ments
Loans1
Total i
Com-mer-cial,
indus-trial,andagri-cul-tural
For purchasingor carrying securities
To brokersand dealers
U. S.Govt.
ob-liga-tions
Otherse-
curi-ties
To others
U.S.Govt.
ob-liga-tions
Otherse-
curi-ties
Realestateloans
Loansto
banksOtherloans
Investments
Total
U. S. Government obligations
Total Bills
Cer-tifi-
catesof in-debt-ed-ness
Notes Bonds2
Othersecu-rities
1952—Jan. 2.Jan. 9.Jan. 16.Jan. 23.Jan. 30.
Feb. 6.Feb. 13.Feb. 20.Feb. 27.
Mar. 5.Mar. 12.Mar. 19.Mar. 26.
75,13174,64575,14174,51674,946
74,68274,59874,41874,449
74,33974,56174,84474,659
Apr. 2.Apr. 9.Apr. 16..Apr. 23.Apr. 30.
May 7.May 14.May 21.May 28.
June 4.June 11.June 18.June 25.
July 2.July 9.July 16.July 23.July 30.
Aug. 6.Aug. 13.Aug. 20.Aug. 27.
Sept. 3.Sept. 10.Sept. 17.Sept. 24.
Oct. 1.Oct. 8.Oct. 15.Oct. 22.Oct. 29.
Nov. 5.Nov. 12.Nov. 19.Nov. 26.
Dec. 3.Dec. 10.Dec. 17.Dec. 24.Dec. 31.
1953—Jan. 7.Tan. 14.Jan. 21.Jan. 28.
Feb. 4.Feb. 11.Feb. 18.Feb. 25.
74,02473,84474,02974,00474,265
74,09574,15774,29074,774
74,65774,882175,928(76,344
78,44877,67677,59677,14977,078
76,60576,53476,28876,440
76,13076,25076,96076,488
76,72378,34978,60677,90977,954
77,99577,97178,08179,447
79,24879,33879,97779,80379,486
79,09578,95578,72878,313
77,95877,87878,01477,711
35,51635,17535,48734,91735,103
34,85634,91034,98635,049
35,10535,18235,33035,066
35,16535,10035,05335,12035,142
35,03035,11635,06535,235
35,00935,05935,64135,949
36,86536,25236,14735,83335,716
35,93635,91935,82535,976
36,08736,32336,90736,697
37,08137,21337,69337,41637,639
37,79438,12138,31638,465
38,45238,69339,16839,30339,104
38,89538,76538,79038,687
38,60038,68538,89238,775
21,58821,43321,60521,44921,320
21,27121,30721,31121,322
21,32421,40421,64221,537
21,34521,22121,22121,04420,966
20,89220,87420,80020,697
20,59120,68720,94620,955
20,73820,75020,80820,79920,756
20,83420,90020,97821,108
21,20021,41921,69221,782
21,85421,99022,23622,33322,457
22,67022,91123,04323,058
23,13023,32123,42323,49423,390
23,15923,18823,08723,011
22,95222,98922,88122,869
31317812986109
108140258179
185241238166
207 1266 131511476 1539 1
597561457656
571536560724
1,3861,039813730626
383317260282
246266234164
184274294259271
379395368508
431422480552709
468283257331
408426351287
!
,034949,031883867
984915897905
904940972971
,078,069,110,166,165
,118,136,185,238
,283,185,227,306
,421,343,316,316,373
,525,456,243,221
,225,207,230,145
,238,281,300,206,173
,153,187,194,200
,181,197,226,232,293
271179195212
178179204172
121114113108108
106107103104
105105105104
11910710710697
95979896
9695105106
226217215200157
149140135137
139133136135
132130129118116
116112110112
110113116126153
137132136134
132135134134
573571568565565
563565567563
562565564565
567566572573572
572572572571
567564557559
574570571571571
578574654655
662656646649
646645650649635
632631632629
624626644653654
657659663665
678666665661
5,7335,7375,7445,7505,745
5,7355,7475,7365,729
5,7195,7205,7235,730
.,735
.,7365,7565,7585,753
5,7565,7655,7605,771
5,7685,7785,7875,806
5,8125,8225,8255,8395,850
5,8605,8825,8905,897
5,9115,9465,9535,963
5,9775,9866,0066,0206,032
6,0356,0616,0786,078
6,0816,0856,0736,0966,095
6,0946,1066,1046,120
6,1216,1226,1356,147
565636731521823
538579556691
770645518398
542555404409441
382482505465
383422623632
762584672425396
598635642622
589869
827678802550621
430446
433423633518151
450538625480
365395731708
6,132 39,6156,103 39,4706,111 39,6546,103 39,5996,114 39,843
6,101 39,8266,100 39,6886,109 39,4326,106 39,400
6,090 39,2346,11639,379
39,51439,593
6,1236,153
6,130 38,8596,137 38,7446,125 38,9766,144 38,8846,166 39,123
6,175 39,0656,186 39,0416,246 39,2256,299 39,539
6,308 39,6486,350 39,8236,395 40,2876,420 40,395
6,5076,488 416,4916,5176,552
41,583,424
41,44941,31641,362
6,574 406,580 40
,669,615
6,589 40,4636,621 40,464
6,656 40,0436,675 39,9276,715 40,0536,733 39,791
6,789 39,6426,798 41,136847 40,913852 40,493
40,3156,904
6,951 40,2016,950 39,850
39,76540,982
6,9656,993
7,039 40,7967,082 40,645
40,80940,500
7,253 40,382
7,260 40,2007,281 40,1907,324 39,938
39,626
7,1517,201
7,335
7,369 39,3587,377 39,1937,395 39,1227,405 38,936
32,68232,54132,75632,64932,900
32.83332,65132,43132,357
32,17332,31232,41632,420
31,60431,45431,690,31,67131,917
31,84531,85432,03532,174
32,35932,50432,85032,934
34,04433,82033,86233,71933,726
33,04032,95132,80832,683
32,36832,22332,36032,127
32,01833,53433,31532,89332,819
32,74532,48032,32133,517
33,42033,29033,39633,09132,967
32,84132,74032,45332,143
31,88531,72931,53531,478
4,1934,1484,2964,1694,393
4,3024,1083,9053,920
3,8224,0184,1954,152
3,4653,3413,5783,4943,688
3,4773,4453,5323,601
3,7383,9074,0724,111
3,7893,4723,5403,4193,366
2,8922,8402,8102,753
2,6252,5302,8302,632
2,5684,1584,0493,7143,681
3,6223,4283,3904,574
4,5454,4954,5684,3364,163
4,1524,0823,9253,710
3,4643,2813,2243,156
3,6513,6133,6633,7143,760
3,8123,8573,9023,868
3,7623,7443,7733,783
3,6753,6363,6753,7093,752
3,8013,7793,7933,796
3,7633,7563,7663,723
3,9543,9043,8553,7993,763
3,5483,5123,4243,403
3,2683,2083,1263,121
2,6662,5842,5432,4742,482
2,4632,4682,4902,467
2,4882,4702,4742,4532,467
2,4522,4822,4742,458
2,4962,5672,2992,271
6,0236,0226,0206,0166,003
6,0036,0066,0036,008
6,0096,0105,9805,977
5,9725,9655,9515,9545,930
5,9605,9675,9835,978
5,9986,0035,9925,998
6,0026,0136,0176,0176,022
18,815 6,93318,758 6,92918,777 6,89818,750 6,95018,744 6,943
,716 618,18,680 718,62118,561
,993,037
7,0017,043
18,580 7,06118,540 7,06718,468 7,09818,508 7,173
18,49218,51218,486 718,514 718,547
7,2557,290
,286,213
7,206
18,60718,66318,72718,799 7
7,2207,1877,190,365
18,860 718,19,02019,102
,289,319
7,4377,461
20,299 720,43120,450 720,48420,575
,5397,604,587
7,5977,636
6,0226,026 206,0316,042
578 720,,571
20,54320,485
,6297,6647,6557,781
6,040 206,0436,0155,991
,43520,44220,389 720,383
7,6757,704,693
7,664
6,380 206,4056,386 206,369 20,336 76,313 20,343
,40420,387
,337
7,6247,6027,598,600
7,496
6,349 206,264 20,320 76,159 206,176 20,300 7
7,456,370
7,444,465
,128 20,259,089 20,236,058 20,296
6,6,6,6,072 20,230 76,044 20,293
7,3767,3557,413
,4097,415
6,0256,014 205,999 205,975
20,212,162,055
20,000 7
7,3597,4507,485,483
5,9535,9205,916 20,096 75,928 20,123
19,97219,961
7,4737,464,587
7,458
*For description of the revision see BULLETIN for April 1953, p. 357.1 Figures for various loan items are shown gross (i. e., before deduction of valuation reserves); they do not add to the total, which is shown net.2 Includes guaranteed obligations.
550 FEDERAL RESERVE BULLETIN
Digitized for FRASER http://fraser.stlouisfed.org/ Federal Reserve Bank of St. Louis

WEEKLY REPORTING MEMBER BANKS—REVISED SERIES, TOTAL FOR ALL LEADING CITIES *—Cont.RESERVES AND LIABILITIES
[In millions of dollars]
Date
Re-serveswithFed-eralRe-
serveBanks
Cashin
vault
Bal-anceswithdo-
mesticbanks
De-mand
de-posits
ad-justed
Demand deposits,except interbank
Indi-vid-uals,part-ner-
ships,andcor-
pora-tions
Statesand
polit-icalsub-divi-sions
Certi-fiedandOffi-cers'
checksetc.
u. s.Gov-ern-ment
Time deposits,except interbank
Indi-vid-uals,part-ner-
ships,andcor-
pora-tions
Statesand
polit-icalsub-divi-sions
U. S.Gov-ern-mentand
Posta'Sav-ings
Interbankdeposits
Demand
Do-mes-tic
For-eign
Time
Bor-row-ings
Cap-italac-
counts
1952—Jan. 2Jan. 9Jan. 16Jan. 23Jan. 30
Feb. 6Feb. 13Feb. 20Feb. 27
Mar. 5Mar. 12Mar. 19Mar. 26
Apr. 2Apr. 9Apr. 16Apr. 23Apr. 30
May 7May 14May 21May 28
June 4June 11June 18June 25
July 2July 9July 16July 23July 30
Aug. 6Aug. 13Aug. 20Aug. 27
Sept. 3Sept. 10Sept. 17. . . .Sept. 24
Oct. 1Oct. 8Oct. 1 5 . . . .Oct. 22Oct. 29
Nov. 5Nov. 12Nov. 19Nov. 26
Dec. 3Dec. 10Dec. 17Dec. 24Dec. 31
1953—Jan. 7Jan. 14Jan. 21Jan. 28
Feb. 4Feb. 11Feb. 18Feb. 25
15,04315,07815,16615,42814,935
14,93514,96214,90914,655
14,66014,68715,72215,147
14,64414,55215,06"14,84814,901
14,93614,85915,10614,770
14,84814,83815,95914,959
15,0415,14015,21515,15715,309
15,01.14,89.15,09;14,68;
14,57815,02215,61015,312
14,85014,91715,19515,40715,171
14,99815,06715,29315,595
15,55315,49115,6765,792
14,549
5,3535,1115,2255,110
5,1464,9174,8794,701
1,002991925920926
86896'90994-
852920896905
83989688689586.
870931884960
951,01296399
9209939495978
909964924979
938995926953
896930956948
1,001
9281,044969986
9871,0841,084966
1,013
1,0181,017953978
902956929992
2,9632,6742,8012,6982,415
2,3292,5192,4022,392
2,3762,4992,7872,726
2,6922,3982,5412,29;2,320
2,2862,4752,3332,334
2,3402,3992,57:2,388
2,5652,4362,5182,3482,280
2,3812,4832,3712,286
2,3462,3982,7552,685
2,4242,4102,7262,4352,369
2,4412,5792,5532,392
2,4142,3952,6182,5243,079
2,4452,6062,5442,344
2,3072,3212,4872,410
54,09854,42955,27755,32755,041
54,22053,81153,26953,387
53,32954,11453,70:52,615
51,85651,88352,52352,86353,026
56,27155,07957,02055,95955,504
54,37.55,9954,16.54,33.
53,93155,61054,83253,17
52,40952,28;
54,26253,35453,608
599 52,48953,92653,47053,840
52,52,66252,88153,565
53,21653,90554,6353,575
52,40952,45152,70753,16653,479
52,57152,54452,46853,116
52,98253,63453,93252,990
53,02452,88053,36853,94854,314
53,76054,04253,95654,688
55,12555,86656,56655,44855,373
55,21155,60255,73855,546
54,58954,34953,77153,811
53,91355,06956,03953,975
53,50953,14354,62053,87453,87
52,86754,05653,39653,838
53,94154,92356,09854,042
54,52653,91057,20355,60555,508
55,63357,10055,81056,306
56,17157,22218,57657,44658,264
!6,035!7,471J7.10816,112
14,98015,45515,29815,342
3,6323,4993,5443,5903,747
3,7773,7093,5833,651
3,5383,45'3,42;3,581
3,7633,6403,7193,8204,123
4,0653,9573,9194,06
3,8543,6433,6153,85
3,7493,6973,4893,5383,750
3,7723,5103,4973,512
3,6093,4973,4073,386
3,5683,4273,3393,4863,614
3,7363,5813,5293,604
3,6103,5073,5123,5793,798
3,6893,6253,7353,894
3,9453,9423,7663,790
2,121,3881,5251,3901,371
1,3681,5721,5901,386
1,4611,5851,5241,536
1,5491,431,5321,8781,686
1,4511,38:1,7731,754
1,5381,3892,0672,004
2,0831,6231,4961,5641,689
1,3161,3481,4111,280
1,4641,3351,7841,422
2,0021,6141,7531,4681,401
1,6131,7421,7001,706
1,7391,7031,7861,6742,123
,578,747,568,431
,458,589550
,484
2,2571,6311,2691,3681,671
2,1332,3342,8812,585
15,40415,45115,41215,4215,429
15,46615,48615,48615,528
1,977 15,5781,708 15,6563,616 15,6594,491 15,664
3,7153,3813,1692,92"3,221
2,7352,9573,4742,945
2,7312,2833,23.4,465
6,9956,1875,6915,2554,860
4,7124,5224,6344,130
3,1862,8393,6754,533
3,6014,7374,4733,7393,487
3,1002,9663,3794,751
3,8363,0073,1093,5443,567
2,7442,2142,2272,362
2,6842,8463,5143,309
15,64115,66015,66915,67715,700
15,72815,72615,76615,813
15,84215,86715,89215,939
15,94715,93415,92815,95115,947
15,97315,97315,96515,984
16,01216,04616,06616,108
16,14416,21216,22016,24916,266
16,34216,32716,27216,295
16,28916,32416,38516,44016,569
16,53216,49716,51716,528
16,55616,57916,60116,641
I
716725725727733
745746762766
76:763761764
769771770768772
768784782785
779775775767
768770781783784
778777772771
770772764764
761752744742743
747748754751
756756764764763
756766767770
775779777783
162164156
166
166169169
171170170170
169170172171172
17317117517
174176175178
179179182182186
183189189190
190188193192
190191191191189
194195195
195196201
202197201
11,83111,21211,39310,97910,220
10,32'10,28810,029,899
10,16010,21510,70410,182
10,42210,04610,1769,3779,373
9,7499,9439,4599,219
9,6669,811
10,3029,680
10,32210,31010,2489,7329,541
10,09910,3509,9639,693
10,19710,58711,21410,565
10,47810,80511,53810,76810,338
10,79211,04310,99910,352
10,64310,65511,19411,03811,693
11,19711,35311,02210,158
200 10,255198199198
10,16510,42610,011
1,3481,2931,2921,2741,261
1,2401,2191,2411,229
1,2461,2401,24^1,253
1,2511,2831,26:1,2691,26.
1,2421,2221,2821,301
1,2931,2611,2601,282
1,2651,2751,2461,2451,321
1,3411,3591,3131,289
1,3471,3251,2921,318
1,3401,3441,3521,3591,366
1,3371,3571,3281,335
1,3411,3451,3631,3701,410
1,3571,3281,3271,314
1,3061,2661,2711,280
41341415411417
416414416415
418420421424
43843.427424428
428430432441
448460463460
472474477478475
461468473482
487496494499
510515525526537
542560581581
580584581577586
583582580579
571571570572
500658706450825
6541,088911959
1,035902485355
465571851
1,059872
1,210954799
1,021
1,0951,0621,059717
1,0251,1041,4361,2161,499
1,2021,1061,2811,139
1,2541,166892709
1,0711,3761,2291,3451,405
1,7181,6181,6341,632
1,6261,7561,2961,824145
1,5391,3081,2401,426
1,5041,4151,2231,260
6,9236,9316,9216,9266,944
6,9586,9666,9506,969
6,9766,9776,9806,992
7,0097,0167,0137,0187,050
7,0727,0657,0637,079
7,0907,0897,0877,094
7,1087,0997,0837,0977,104
7,1257,1237,1207,127
152147142148
7,177188181185
7,203
7,2247,2257,2077,217
7,2387,2207,2227,2347,258
7,2587,2317,2317,259
7,2767,2837,2857,305
*}For description of the revision see BULLETIN for April 1953, p. 357.1 Demand deposits other than interbank and U. S. Government, less cash items reported as in process of collection.
MAY 1953 551
Digitized for FRASER http://fraser.stlouisfed.org/ Federal Reserve Bank of St. Louis
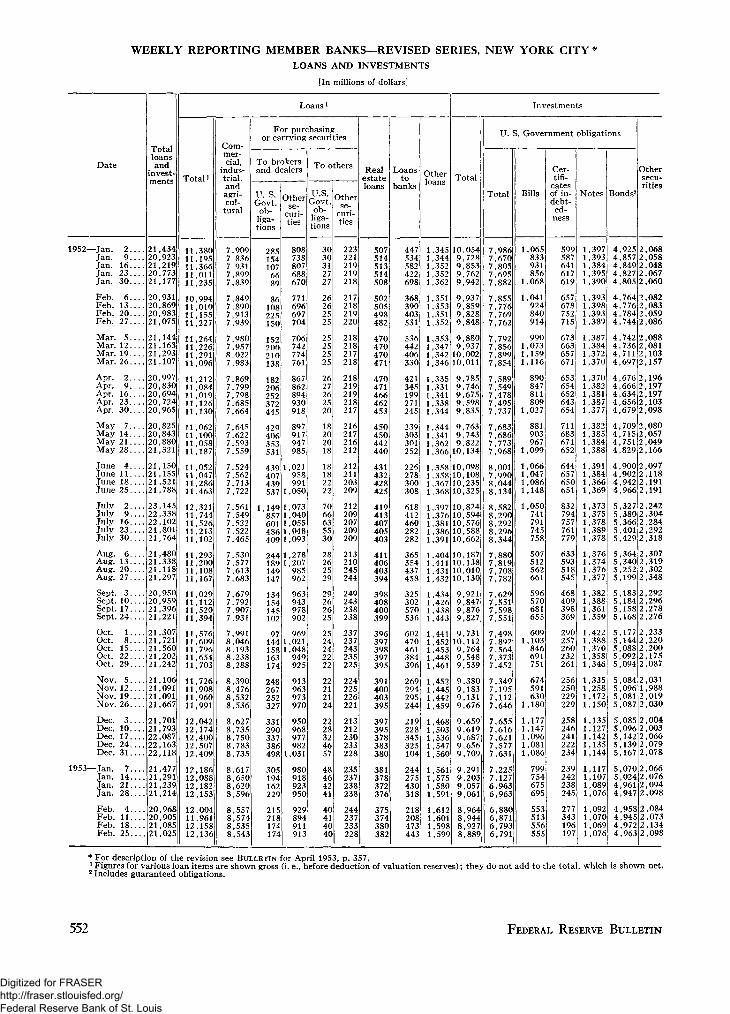
WEEKLY REPORTING MEMBER BANKS—REVISED SERIES, NEW YORK CITY *LOANS AND INVESTMENTS
[In millions of dollars]
Date
1952—Jan. 2 . . . .Jan. 9 . . . .Jan . 16Jan . 2 3 . . . .Jan . 30
Feb. 6 . . . .Feb. 1 3 . . . .Feb. 2 0 . . . .Feb. 2 7 . . . .
Mar. 5 . . . .Mar. 1 2 . . . .Mar. 1 9 . . . .Mar. 26
Apr. 2 . . . .Apr. 9 . . . .Apr. 1 6 . . . .Apr. 2 3 . . . .Apr. 3 0 . . . .
May 7 . . . .May 14May 21May 2 8 . . . .
June 4June 11June 1 8 . . . .June 25
July 2 . . . .July 9 . . . .July 1 6 . . . .July 2 3 . . . .July 3 0 . . . .
Aug. 6Aug. 1 3 . . . .Aug. 2 0 . . . .Aug. 2 7 . . . .
Sept. 3 . . . .Sept. 1 0 . . . .Sept. 1 7 . . . .Sept. 2 4 . . . .
Oct. 1Oct. 8 . . . .Oct. 1 5 . . . .Oct. 22Oct. 2 9 . . . .
Nov. 5 . . . .Nov. 12Nov. 19 . . . .Nov. 2 6 . . . .
Dec. 3 . . . .Dec. 10 . . . .Dec. 1 7 . . . .Dec. 2 4 . . . .Dec. 3 1 . . . .
1953—Jan. 7 . . . .Jan. 14 . . . .Jan. 21Jan. 2 8 . . . .
Feb. 4 . . . .Feb. 1 1 . . . .Feb. 18Feb. 2 5 . . . .
Totalloansand
ments
21,43420,92321,21920,77321,177
20,93120,86920,98321,075
21,14421,16321,29321,107
20,99720,83020,69420,72420,965
20,82520,84320,88021,321
21,15021,15521,52121,788
23,14522,33822,10221,80121,764.
21,48021,33821,11821,297
20,95020,95921,39621,221
21,30721,72121,56021,20221,242
21,10621,09121,09121,667
21,70121,79322,08722,16322,118
21,47721,29121,23921,214
20,96820,90521,08521,025
Loansx
Total i
11,38011,19511,36611,01111,235
10,99411,01011,15511,227
11,26411,22611,29111,096
11,21211,08411,01911,12611,130
11,06211,10011,05811,187
11,05211,04711,28611,463
12,32111,74411,52611,21311,102
11,29311,20011,10811,167
11,02911,11211,52011,394
11,57611,60911,79611,65411,703
11,72611,90811,96011,991
12,04212,17412,40012,50712,409
12,18612,08812,18212,153
12,00411,96112,15812,136
Com-mer-cial,
indus-trial,andagri-cul-
tural
7,9097,8367,9317,8997,839
7,8497,8907,9137,939
7,9807,9578,0227,983
7,8697,7997,7987,6857,664
7,6457,6227,5937,559
7,5247,5627,7137,722
7,5617,5497,5227,5227,465
7,5307,5777,6137,683
7,6797,7927,9077,931
7,9918,0468,1938,2388,288
8,3908,4768,5328,536
8,6278,7358,7508,7838,735
8,6178,6508,6208,596
8,5578,5748,5358,543
For purchasingor carrying securities
To brokersand dealers
U. S.Govt.
ob-liga-tions
285154107
6689
86108225150
152200210138
182206252372445
429406353531
439407439537
1,149857601486409
244189149147
134154145102
97144158163174
248267252327
331290337386498
305194162229
215218174174
Otherse-
ties
808738807688670
771696697704
706742774761
867862894930918
897917947985
1,021958991
1,050
1,0731,0401,0551 ,0481,093
1,2781,207
985962
963943978902
9691,0211,048
949925
913963973970
950968977982
1,031
980918923950
929894911913
To others
U.S.Govt.
ob-liga-tions
3030312727
26262525
25252525
2627262520
18202018
18182222
7066635530
28262529
29262625
2524242222
22212124
2228324657
48464241
40414040
Otherse-
curi-ties
223221219219218
217218219220
218218217218
218219219218217
216217216212
212211203209
212209207209209
213210245244
249243238238
237237243235225
224225226221
213212230233228
235237238238
244237233228
Realestateloans
507514513514508
502505498482
470470470471
470471466462453
450450442440
431432428425
419413407405403
411406403394
398408400399
396397398397395
391400403395
397395378383380
381378372376
375374380382
Loansto
banks
447534582422698
368390403531
536442406330
421345199271245
239303301252
226278300308
618412460282282
365354437458
325302570536
602470461384396
269294295244
219228345325104
244275430318
218208473443
Otherloans
1,3451,3441,3521,3521,362
1,351,353
1,3511,352
1,3531,347
,3421,346
1,3351,3311,3411,3381,344
1,3441,341,362
1,366
1,358,358
1,3671,368
1,3971,3761,3811,3861,391
1,4041,4111,4311,432
1,4341,4261,4381,443
1,4411,4521,4531,4481,461
1,4521,4451,4421,459
1,4681,5031,5361,5471,560
1,5611,5751,5801,591
1,6121,6011,5981,599
Total
10,0549,7289,8539,7629,942
9,9379,8599,8289,848
9,8809,937
10,00210,011
9,7859,7469,6759,5989,835
9,7639,7439,822
10,134
10,09810,10810,23510,325
10,82410,59410,57610,58810,662
10,18710,13810,01010,130
9,9219,8479,8769,827
9,73110,1129,7649,5489,539
9,3809,1839,1319,676
9,6599,6199,6879,6569,709
9,2919,2039,0579,061
8,9648,9448,9278,889
Investments
U. S. Government obligations
Total
7,9867,6707,8057,6957,882
7,8557,7767,7697,762
7,7927,8567,8997,854
7,5897,5497,4787,4957,737
7,6837,6867,7737,968
8,0017,9908,0448,134
8,5828,2908,2928,2968,344
7,8807,8197,7087,782
7,6297,5517,5987,551
7,4987,8927,5647,3737,452
7,3497,1957,1127,646
7,6557,6167,6217,5777,631
7,2257,1276,9636,963
6,8806,8716,7936,791
Bills
1,065833931856
1,068
1,041924840914
9901,0731,1591,116
890847811809
1,027
881903967
1,099
1,0661,0471,0861,148
1,050741791745758
507512562661
596570681655
6091,103
846691751
674591630
1,180
1,1771,1471,0961,0811,086
799754675695
553513556555
Cer-tifi-
catesof in-debt-
ed-ness
599587641617619
657678752715
673663657671
653654652643654
711683671652
644657650651
832794757761779
633593518545
468409398369
290257260232261
256250229229
258246241222234
239242238245
277343196197
Notes
1,3971,3931,3841,3951,390
1,3931,3981,3931,389
L ,387L,3841,3721,370
1,3701,3821,3811,3871,377
1,3821,3851,3841,388
1,3911,3841,3661,369
1,3731,3751,3781,3891,378
1,3761,3741,3761,377
1,3821,3881,3611,359
1,4221,3881,3701,3581,346
1,3351,2581,1721,150
1,1351,1271,1421,1351,144
1,1171,1071,0891,076
1,0921,0701,0691,076
Bonds2
4,9254,8574,8494,8274,805
4,7644,7764,7844,744
4,7424,7364,7114,697
4,6764,6664,6344,6564,679
4,7094,7154,7514,829
4,9004,9024,9424,966
5,3275,3805,3665,4015,429
5,3645,3405,2525,199
5,1835,1845,1585,168
5,1775,1445,0885,0925,094
5,0845,0965,0815,087
5,0855,0965,1425,1395,167
5,0705,0244,9614,947
4,9584,9454,9724,963
Othersecu-rities
2,0682,0582,0482,0672,060
2,0822,0832,0592,086
2,0882,0812,1032,157
2,1962,1972,1972,1032,098
2,0802,0572,0492,166
2,0972,1182,1912,191
2,2422,3042,2842,2922,318
2,3072,3192,3022,348
2,2922,2962,2782,2762,2332,2202,2002,1752,087
2,0311,9882,0192,030
2,0042,0032,0662,0792,078
2,0662,0762,0942,098
2,0842,0732,1342,098
* For description of the revision see BULLETIN for April 1953, p. 357.1 Figures for various loan items are shown gross (i. e., before deduction of valuation reserves); they do not add to the total, which is shown net.2 Includes guaranteed obligations.
552 FEDERAL RESERVE BULLETIN
Digitized for FRASER http://fraser.stlouisfed.org/ Federal Reserve Bank of St. Louis

WEEKLY REPORTING MEMBER BANKS—REVISED SERIES, NEW YORK CITY*—ContinuedRESERVES AND LIABILITIES
[In millions of dollars!
Date
Re-serveswithFed-eralRe-
serveBanks
Cashin
vault
Bal-anceswithdo-
mesticbanks
De-mand
de-posits
ad-justed
Demand deposits,except interbank
Indi-vid-uals,part-ner-
ships,andcor-
pora-tions
Statesand
polit-icalsub-divi-sions
Certi-fiedandOffi-cers'
checksetc.
u. s.Gov-ern-ment
Time deposits,except interbank
Indi-vid-uals,part-ner-
ships,andcor-
pora-tions
Statesand
polit-icalsub-divi-sions
U. S.Gov-ern-mentand
PostalSav-ings
Interbankdeposits
Demand
Do-mes-tic
For-eign
Time
Bor-row-ings
Cap-ital
1952—Jan. 2.Jan. 9.Jan. 16.Jan. 23.Jan. 30.
Feb. 6.Feb. 13.Feb. 20.Feb. 27.
Mar. 5.Mar. 12.Mar. 19.Mar. 26.
Apr. 2Apr. 9Apr. 16Apr. 23Apr. 30
May 7May 14May 21May 28
June 4June 11June 18June 25
July 2July 9July 16July 23July 30
Aug. 6Aug. 13Aug. 20Aug. 27
Sept. 3Sept. 10Sept. 17Sept. 24
Oct. 1Oct. 8Oct. 15Oct. 22Oct. 29
5,29
Nov.Nov.Nov.
Dec.Dec.Dec.Dec.Dec.
1953—Jan.Jan.Jan.Jan.
Feb.Feb.Feb.Feb.
12 .1926
31017 . . . .2431 .
7142128 . .
4111825
5,3055,1195,6035,357
5,2895,2895,3535,275
5,2055,1755,7275,631
5,0785,0465,4265,3815,350
5,365,3625,5015,394
5,4715,2645,9705,376
5,1385,455,4465,4705,56
5,2765,165,2705,051
5,0855,2105,4195,45
5,1015,1635,2195,3525,179
5,2665,1605,2425,363
5,4645,2995,4335,2805,060
5,1355,0515,0965,079
5,1054,9335,0174,870
15715:139136142
13 =15514.145
13114:132139
130141134135129
135142131169
19621518200
18819178179184
16817/16.117/
169184147148
139150148145154
154173153175
163192195168150
155158140148
138160137154
48504.4938
31343835
36415178
2003138353
30384235
35333941
335363533
3134036
3.3.5448
4349514344
35404345
4037444558
36474539
35344139
16,4516,53216,72416,98216,946
16,59616,30316,26916,516
16,61616,69416,45416,089
16,07915,78515,92216,22116,284
16,10316,06316,23616,597
16,42116,58917,18516,555
15,90115,80915,80916,08216,162
15,59515,50115,60616,047
15,77415,95016,30515,866
15,76415,70515,64715,99916,014
15,71615,77315,83616,074
16,31416,54716,99516,33216,353
16,15416,19716,23416,347
15,91815,80615,82315,681
17,80117,21417,78617,7217,753
17,19017,57417,12617,359
17,30517,71817,36016,831
16,86716,45016,99116,97317,178
16,61216,94417,00017,266
17,15917,45918,13117,260
16,92216,55816,82016,78616,963
16,23116,41016,41116,692
16,57516,75717,34816,634
16,88016,38317,24616,92716,848
16,70217,09316,76917,117
17,19217,49618,04917,38818,002
17,00617,16017,18717,094
16,68516,73216,86916,822
326252279292318
29534'270287
253238210261
304319300314389
3733530:40'
291266235251
230294264294318
29626.250293
273257281258
314336337396398
449387360345
305279306314321
268274280325
297301303290
1,146611687581624
608797806592
685795646716
680669719
1,082862
698613
1,034986
741621
1,1401,134
1,174811701783912
557598614544
622536874589
1,075740869676628
795885800826
842870857807
1,109
681817678623
653790691705
837580378405557
752857
1,046907
668542
1,4261,707
1,2431,050950878
1,008
9101,1321,2371,007
944749816
1,516
3,1272,7862,4942,2412,023
1,9031,7771,6991,490
1,121956
1,0741,544
1,2151,7171,5271,2641,181
1,049989
1,0261,659
1,3181,002869
1,1581,142
840635606631
708744887831
1,5201,5121,4741,4771,478
1,4861,4921,4861,494
1,4891,5771,5951,600
,580,562,558,555,574
,565,568,588,628
,613,624,639,648
,625,601,581,592,584
,573, 560,553
1,551
1,5601,5691,5671,582
1,5681,5881,5701,5751,574
1,6211,6121,5971,642
1,6281,6411,6771,6811,699
1,6461,6281,6341,645
1,6451,6421,6531,675
2221232326
27272727
27282828
227282424
25252525
25222222
2122232223
24242424
25282727
2729292929
30303030
3131313131
29292729
30313131
3,3883,1463,2273,1523,014
2,9362,9462,9102,856
2,9272,9253,1373,022
3,0042,9472,9322,7422,811
2,8022,8272,7552,750
2,7622,7683,0452,879
3,1252,9732,9332,8042,777
2,8612,9072,7912,697
2,8402,9033,2243,152
3,0913,0143,1562,9912,850
2,9773,0533,0212,908
2,9572,9243,0483,0283,341
3,0743,0953,0592,909
2,8562,9172,883
1,1201,0721,0571,0541,042
1,0221,0131,0321,025
1,0431,0361,0401,042
1,0291,0691,0421,0511,050
1,0241,0131,0721,095
1,0781,0441,0371,062
1,0481,0441,0141,0171,076
1,0951,1041,0581,032
1,0901,0761,0391,056
1,0901 ,0911,1021,1081,119
1,0811,1021,0681,070
1,0891,0981,1191,1181,143
1,0911,0721,0671,064
1,0591,0311,0231,033
316317318314315
315314315315
318320319324
334329324321323
324324326335
340348350347
360358360361358
347353358367
373379380383
391396402404414
420436453455
456460457454462
461458456456
445445443445
20619526769245
150275320274
30231813964
69243485434350
536338216402
608471535285
221381495299518
504456454319
448504315170
340444425266351
587403440344
504564461751130
410321333302
438354370362
2,3972,3992,4012,4022,398
2,4132,4092,4102,409
2,4122,4102,4112,409
2,4172,4182,4182,4192,428
2,4292,4292,4292,424
2,4272,4262,4222,420
2,4342,4362,4342,4352,433
2,4462,4422,4432,442
2,4452,4422,4382,432
2,4472,4482,4482,4452,446
2,4582,4582.4482,446
2,4592,4452,4432,4602,477
2,4762,4762,4762,477
2,488,488,489
2,493
* For description of the revised series see BULLETIN for April 1953, p. 357.demand deposits other than interbank and U. S. Government, less cash items reported as in process of collection.
MAY 1953 553
Digitized for FRASER http://fraser.stlouisfed.org/ Federal Reserve Bank of St. Louis
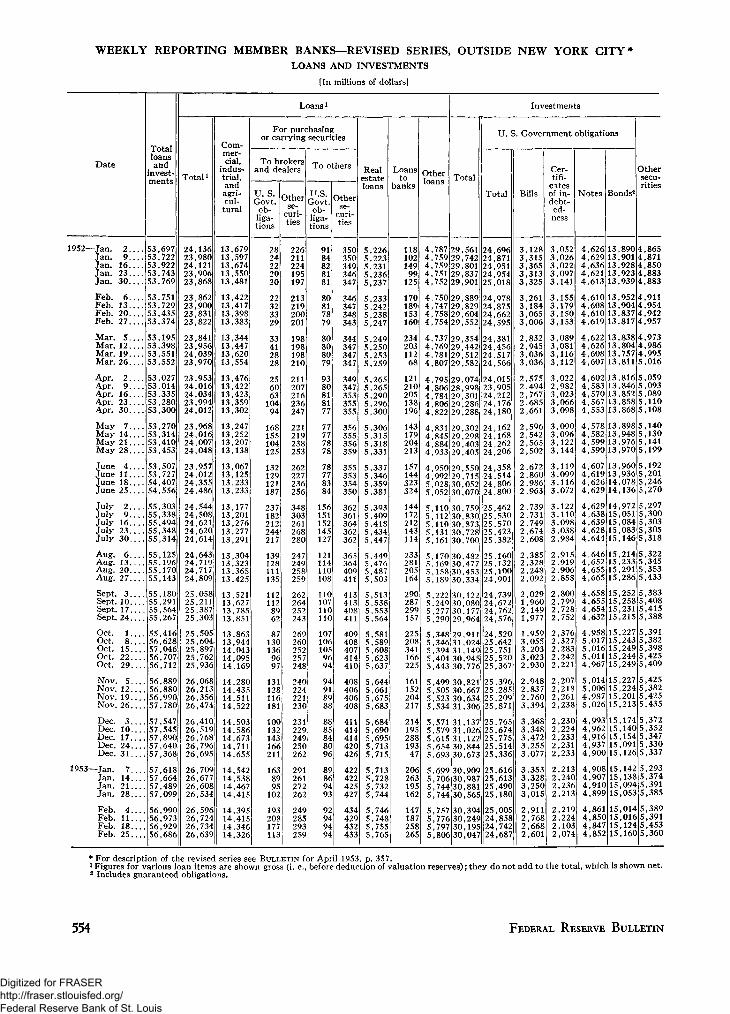
WEEKLY REPORTING MEMBER BANKS—REVISED SERIES, OUTSIDE NEW YORK CITY*LOANS AND INVESTMENTS
[In millions of dollars]
Date
1952—Jan.Jan.Jan.Jan.Jan.
Feb.Feb.Feb.Feb.
Mar.Mar.Mar.Mar.
Apr.Apr.Apr.Apr.Apr.
MayMayMayMay
JuneJuneJuneJune
JulyJulyJulyJulyJuly
Aug.Aug.Aug.Aug.
2 . . . .9
1 6 . . . .2 3 . . . .3 0 . . . .
6 . . . .1 3 . . . .2 0 . . . .2 7 . . . .
5 . . . .121 9 . . . .2 6 . . . .
2 . . . .9 . . . .
1 6 . . . .2 3 . . . .3 0 . . . .
71 4 . . . .2 1 . . . .2 8 . . . .
4 . . . .1 1 . . . .1 8 . . . .2 5 . . . .
29 . . . .
1623....3 0 . . . .
6 . . . .132 0 . . . .27
Sept. 3 . . . .Sept. 10Sept. 1 7 . . . .Sept. 24
Oct.Oct.Oct.Oct.Oct.
Nov.Nov.Nov.Nov.
Dec.Dec.Dec.Dec.Dec.
1953—Jan.Jan.Jan.Jan.
Feb.Feb.Feb.Feb.
1 . . . .8
1 5 . . . .222 9 . . . .
5 . . . .1 2 . . . .1 9 . . . .2 6 . . . .
3 . . . .1 0 . . .1 7 . . . .2 4 . . . .3 1 . . . .
1....142 1 . . . .2 8 . . . .
4 . . . .111 8 . . . .2 5 . . . .
TV1 Ota.iloansand
invest-ments
53,53535353
53535353
53535353
5353535353
53535353
53535454
5555555555
55555555
55555555
5556575656
56565657
5757575757
57575757
56565656
697722922743769
751729435374
195398551552
027014335280300
270314410453
507727407556
303338494348314
125196170143
180291
,564,267
,416,628,046,707,712
,889,880,990,780
,547,545,890,640,368
,618,664,489,099
,990,973,929,686
TotaP
24,23,24,23,23,
23,23,23,23,
232324,23,
2324242324
23242424
23242424
2424242424
24242424
25252525
2525252525
26262626
2626262626
26262626
26262626
136980121906868
862900831822
841956039970
953016034994012
968016007048
957012355486
544508621620614
643719717809
058211387303
505604
,897,762,936
,068,213356
,474
,410,519768
,796695
,709,677,608,534
,596,724,734,639
Com-mer-cial,
indus-trial,andagri-cul-tural
13,1313,1313
13131313
13131313
1313131313
13131313
13131313
1313131313
13131313
13131313
1313141414
14141414
1414141414
14141414
14141414
679597674550481
422417398383
344447620554
476422423359302
247252207138
067125233233
177201276277291
304323365425
521627785851
,863,944,043,095,169
,280,435,511,522
,503,586,673,711,655
,542,538,467,415
,395,415,346,326
Loans*
For purchasingor carrying securities
To brokersand dealers
U. S.Govt.
ob-liga-tions
2824222020
22323329
33412828
256063
10494
168155104125
132129121187
237182212244217
139128111135
1121128962
871301369697
131128116181
100132143166211
1638995
102
193208177113
Otherse-
curi-ties
226211224195197
213219200201
198198198210
211207216236247
221219238253
262227236256
348303261268280
247249258259
262264252243
269260252257248
240224221230
231229249250262
291261272262
249285293259
To others
U.S.Govt.
ob-liga-tions
9184828181
80817879
80808079
9380818177
77777878
78778384
156151152145127
121114110108
110107110110
1071061059694
94918988
8885848096
89869493
92949494
Otherse-
curi-ties
350350349346347
346347348343
344347347347
349347353355355
356355356359
355353354350
362361364362362
365364409411
413413408411
409408407414410
408406406408
411414414420426
422422425427
434429432433
Realestateloans
55555
5555
5555
55555
5555
5555
55555
5555
5555
55555
5555
55555
5555
5555
,226,223,231,236,237
,233,242,238,247
,249,250,253,259
,265,265,290,296,300
,306,315,318,331
,337,346,359,381
,393,409,418,434,447
,449,476,487,503
,513,538,553,564
,581,589,608,623,637
,644,661,675,683
,684,690,695,713,715
,713,728,732,744
,746,748,755,765
Loansto
banks
11810214999
125
170189153160
23420311268
121210205138196
143179204213
157144323324
144172212143114
233281205164
290287299157
225208341166225
161152204217
21419528819347
206263195162
147187258265
Otherloans
4,7874,7594,7594,7514,752
4,7504,7474,7584,754
4,7374,7694,7814,807
4,7954,8064,7844,8064,822
4,8314,8454,8844,933
4,9504,9925,0285,052
5,1105,1125.1105,1315,161
5,1705,1695 1585,189
5,2225,2495,2775,290
5,3485,3465,3945,4045,443
5,4995,5055,5235,534
5,5715,5795,6155,6545,693
5,6995,7065,7445,744
5,7575,7765,7975,806
Total
29,29,29,29,29,
29,29,29,29,
29,29,29,29,
2928,292929
29292929
29293030
3030303030
30303030
30303029
2931313030
30303031
3131313030
30303030
30303030
561742801837901
889i829604|552
354442512582
074|998j301286|288:
302298!403405
550715052070
759830873728700
482477453334
122080177964
911024149945776
821667634306
137026
,122,844,673
909,987,881,565
,394,249,195,047
Investments
U. S. Government obligations
Total
24,24,24,24,25,
24,24,24,24,
24,24,24,24
24,23242424
24242424
24242424
2525252525
25252524
24242424
2425252525
25252525
2525252525
25252525
25242424
696871951954018
978875662595
381456!517566
015905212176180
162168262206
358514806800
462530570423382
160132100901
739672762576
520642751520367
396285209871
765674775514
,336
616,613,490,180
,005,858,742,687
Bills
33333
3333
2233
22222
2222
2222
22222
2222
2121
13332
2223
33333
3333
2222
,128,315,365,313,325
,261,184,065,006
,832,945,036,036
,575,494,767,685,661
,596,542,565,502
,672,860,986,963
,739,731,749,674,608
,385,328,248,092
,029,960,149,977
,959,055,203,023,930
,948,837,760,394
,368,348,472,255,077
,353,328,250,015
,911,768,668,601
Cer-tifi-
catesof in-debt-ed-ness
33333
3333
3333
32333
3333
3333
33332
2222
2222
22222
2222
22222
2222
2222
,052,026,022,097,141
,155,179,150,153
,089,081,116,112
,022,982,023,066,098
,090,096,122,144
,119,099,116,072
,122,110,098,038,984
,915,919,906,858
,800,799,728,752
,376,327,283,242,221
,207,218,261,238
,230,224,233,231,233
,213,240,236,213
,219,224,103,074
Notes
4,6264,6294,6364,6214,613
4,6104,6084,6104,619
4,6224,6264,6084,607
4,6024,5834,5704,5674,553
4,5784,5824,5994,590
4,6074,6194,6264,629
4,6294,6384,6394,6284,644
4,6464,6524,6554,665
4,6584,6554,6544,632
4,9585.0175,0165,0114,967
5,0145,0064,9875,026
4,9934,9624,9164,9374,900
4,9084,9074,9104,899
4,8614,8504,8474,852
Bonds2
13,89013,90113,92813,92313,939
13,95213,90413,83713,817
13,83813,80413,75713,811
13,81613,84613,85213,85813,868
13,89813,94813,97613,970
13,96013,93614,07814,136
14,97215,05115,08415,08315,146
15,21415,23315,29115,286
15,25215,25815,23115,215
15,22715,24315,24915,24415,249
15,22715,22415,20115,213
15,17415,14015,15415,09115,126
15,14215,13815,09415,053
15,01415,01615,12415,160
Othersecu-rities
4,8654,8714,8504,8834,883
4,9114,9544,9424,957
4,9734,9864,9955,016
5,0595,0935,0895,1105,108
5,1405,1305,1415,199
5,1925,2015,2465,270
5,2975,3005,3035,3055,318
5,3225,3455,3535,4335,3835,4085,4155,388
5,3915,3825,3985,4255,409
5,4255,3825,4255,435
5,3725,3525,3475,3305,337
5,2935,3745,3915,385
5,3895,3915,4535,360
* For description of the revised series see BULLETIN for April 1953, p. 357. .1 Figures for various loan items are shown gross (i. e., before deduction of valuation reserves); they do not add to the total, which is shown net.2 Includes guaranteed obligations.
554 FEDERAL RESERVE BULLETIN
Digitized for FRASER http://fraser.stlouisfed.org/ Federal Reserve Bank of St. Louis

WEEKLY REPORTING MEMBER BANKS—REVISED SERIES, OUTSIDE NEW YORK CITY *—ContinuedRESERVES AND LIABILITIES
[In millions of dollars]
Date
Re-serveswithFed-eralRe-
serveBanks
Cashin
vault
Bal-anceswithdo-
mesticbanks
De-mand
de-posits
ad-justed1
Demand deposits,except interbank
Indi-vid-uals,part-ner-
ships,andcor-
pora-tions
Statesand
polit-icalsub-divi-sions
Certi-fiedandOffi-cers'
checksetc.
u. s.Gov-ern-ment
Time deposits,except interbank
Indi-vid-uals,part-ner-
ships,andcor-
pora-tions
Statesand
polit-icalsub-divi-sions
U. S.Gov-ern-mentand
PostalSav-ings
Interbankdeposits
Demand
Do-mes-tic
For-eign
Time
Bor-row-ings
Cap-italac-
counts
1952—Jan. 2Jan. 9Jan. 16Jan. 2 3 . . . .Jan. 30
Feb. 6Feb. 13Feb. 20Feb. 2 7 . . . .
Mar. 5 . . . .Mar. 12Mar. 19Mar. 26
Apr. 2Apr. 9Apr. 16Apr. 23Apr. 30
May 7May 14May 21May 28
June 4. . . .June 11June 1 8 . . . .June 2 5 . . . .
July 2 . . . .July 9July 16July 23July 30
Aug. 6 . . . .Aug. 13Aug. 20Aug. 27
Sept. 3Sept. 10Sept. 17Sept. 24
Oct. 1Oct. 8Oct. 15Oct. 22Oct. 29
Nov. 5Nov. 12Nov. 19Nov. 26
Dec. 3Dec. 10Dec. 17Dec. 24Dec. 31
1953—Jan. 7Jan. 14Jan. 21Jan. 28
Feb. 4Feb. 11Feb. 18Feb. 25
9,7529,773
10,049,8259,578
9,6469,67.9,5569,384
9,4559,5129,999,516
9,5669,5069,6419,469,551
9,5699,4979,6059,376
9,3779,5749,9899,583
9,9099,6889,7699,6879,742
9,7379,7339,8239,632
9,4939,81210,1919,855
9,7499,7549,976
10,0559,992
9,7329,90710,05110,232
10,08910,19210,24310,5129,489
10,21810,06010,12910,031
10,0419,9849,8629,831
845839786784784
733809764799
721778764766
709755752760736
735789753791
761797776797
732796764776794
741787761802
769811779805
757780808803847
774871816811
824892889798863
863859813830
764796792838
2,912,6242,7582,6492,377
2,2982,4852,3642,35^
2,3402,4582,7362,648
2,49:2,362,5032,25^2,283
2,2562,432,2912,299
2,30.2,3662,5332,347
2,5282,4012,4822,3132,247
2,3502,4462,3312,250
2,3132,3632,7012,637
2,3812,3612,6752,3922,325
2,4062,5392,5102,347
2,3742,3582,5742,4793,021
2,4092,5592,4992,305
2,2722,2872,4462,371
37,64137,8938,55338,34538,095
37,62437,50837,00036,871
36,71337,42037,24836,526
35,77736,09836,60136,64236,742
36,49636,59936,64536,968
36,79537,31637,45237,020
36,50836,64236,89837,08437,317
36,97637,04336,86237,069
38,47037,86539,23438,23:37,751
37,18338,42337,03736,976
36,62637,89:37,47236,346
35,54235,8337,27136,38136,430
35,8736,98236,47036,574
36,75437,61037,90836,715
36,58736,58537,80037,08836,916
36,63637,64636,98537,146
37,208 3737,68437,62737,124
,36638,16638,75037,408
37,37,17537,72137,94938,300 38
,64637,52739,95738,678
,660
38,931269 40,007
39,04139,189
38,04438,38,12038,614
38,97939,72640,527
116 40,058020 40,262
38,81139,31939,57139,39,
39,05739,40539,50439,199
38,67138,54337,94838,130
39,02940,31139,92139,018
8,2958,72318,4298,520
3,3063,2473,2653,2983,429
3,4823,36:3,3133,364
3,28.3,2213,2123,320
3,4593,3213,4193,5063,734
3,6883,6223,6123,660
3,5633,3773,3803,606
3,5193,4033,2253,2443,432
3,4763,2473,2473,219
3,3363,2403,1263,128
3,2543,0913,0023,0903,216
3,2873,1943,1693,259
3,3053,2283,2063,2653,477
3,4213,3513,4553,569
3,6483,6413,4633,500
97877783880974
760775784794
776790878820
869768813796824
753769739768
797768927870
909812795781777
759750797736
842799910833
927874884792773
818857900880
897833929867
1,014
897930890808
805799859779
1,4201,051891963
1,114
1,3811,4771,8351,678
1,3091,1662,1902,784
2,4722,3312,2192,0442,213
1,8251,8252,2371,938
1,7871,5342,4172,949
3,8683,4013,1973,0142,837
2,8092,7452,9352,640
2,0651,8832,6012,989
2,3863,0202,9462,4752,306
2,0511,9772,3533,092
2,5182,0052,2402,3862,425
1,9041,5791,6211,731
1,9762,1022,6272,478
13,88413,93913,93813,95013,951
13,98013,99414,00014,034
14,08914,07914,06414,064
14,06114,09814,11114,12214,126
14,16314,15814,17814,185
14,22914,24314,25314,291
14,32214,33314,34714,35914,363
14,40014,41314,41214,433
14,45214,47714,49914,526
14,57614,62414,65014,67414,692
14,72114,71514,67514,653
14,66114,68314,70814,75914,870
14,88614,86914,88314,883
14,91114,93714,94814,966
694704702704707
718719735739
735735733736
74:74474:744748
74375975760
754753753745
747748758761761
754753748747
745744737737
734723715713714
717718724721
725725733733732
727737740741
745748746752
11911911111811
118119121121
12312:12:122
12112112312:123
12412126126
12512412312J
126126128127131
129134134
135133137136
135136137137136
137139139139
140139139140142
142143140143
142141142140
8,4438,0668,1667,8277,206
7,3917,34:7,117,043
7,2337,2907,567,160
7,4187,0997,2446,6356,56:
6,947,1166,7046,469
6,9047,0437,2576,801
7,1977,3377,3156,9286,764
7,2387,4437,1726,996
7,3577,6847,9907,413
7,3877,7918,3827,7777,488
7,8157,9907,9787,444
7,6867,7318,1468,0108,352
8,1238,2587,9637,249
7,3577,3097,5097,128
228221235220219
218206209204
20320420'211
22:214220218213
218209210206
215217223220
217231232228245
246255255257
257249253262
250253250251247
256255260265
252247244252267
266256260250
247235248247
97959797102
101100101100
100100102100
104104103103105
104106106106
108112113113
112116117117117
114115115115
114117114116
119119123122123
122124128126
124124124123124
124124123
126126127127
294463439381580
504813591685
733584346291
39632836662522
674616583619
487591524432
804723941917981
698650827820
806662577539
731932804,079,054
,131,215,194,288
,122,192835
1,07315
1,129987907
1,124
1,0661,061853898
4,5264,5324,5204,5244,546
4,5454,5574,5404,560
4,5644,5674,5694,583
592598
4,5954,5994,622
4,6434,6364,6344,655
4,6634,6634,6654,674
4,6744,6634,6494,6624,671
4,6794,6814,6774,685
4,7074,7054,7044,716
4,7304,7404,7334,7404,757
4,7664,7674,7594,771
4,7794,7754,7794,7744,781
782755
4,7554,782
,788,795796
4,812
* For description of the revised series see BULLETIN for April 1953, page 357.1 Demand deposits other than interbank and U. S. Government, less cash items reported as in process of collection.
MAY 1953 555
Digitized for FRASER http://fraser.stlouisfed.org/ Federal Reserve Bank of St. Louis

PAGE
International capital transactions of the United States 558-563
Gold production 563
Reported gold reserves of central banks and governments 564
Gold movements; gold stock of the United States 565
International Monetary Fund and Bank 566
Central Banks 566-570
Money rates in foreign countries 571
Commercial banks 572
Foreign exchange rates 573
Price movements in principal countries:
Wholesale prices 574
Consumers' price indexes 575
Security prices 575
Tables on the following pages include the principal available statistics of current significance relatingto gold, international capital transactions of the United States, and financial developments abroad.The data are compiled for the most part from regularly published sources such as central and com-mercial bank statements and official statistical bulletins, some data are reported to the Board directly.Figures on international capital transactions of the United States are collected by the Federal ReserveBanks from banks, bankers, brokers, and dealers in the United States in accordance with the TreasuryRegulation of November 12, 1934. Back figures for all except price tables, together with descriptivetext, may be obtained from the Board's publication, Banking and Monetary Statistics.
MAY 1953 557
Digitized for FRASER http://fraser.stlouisfed.org/ Federal Reserve Bank of St. Louis
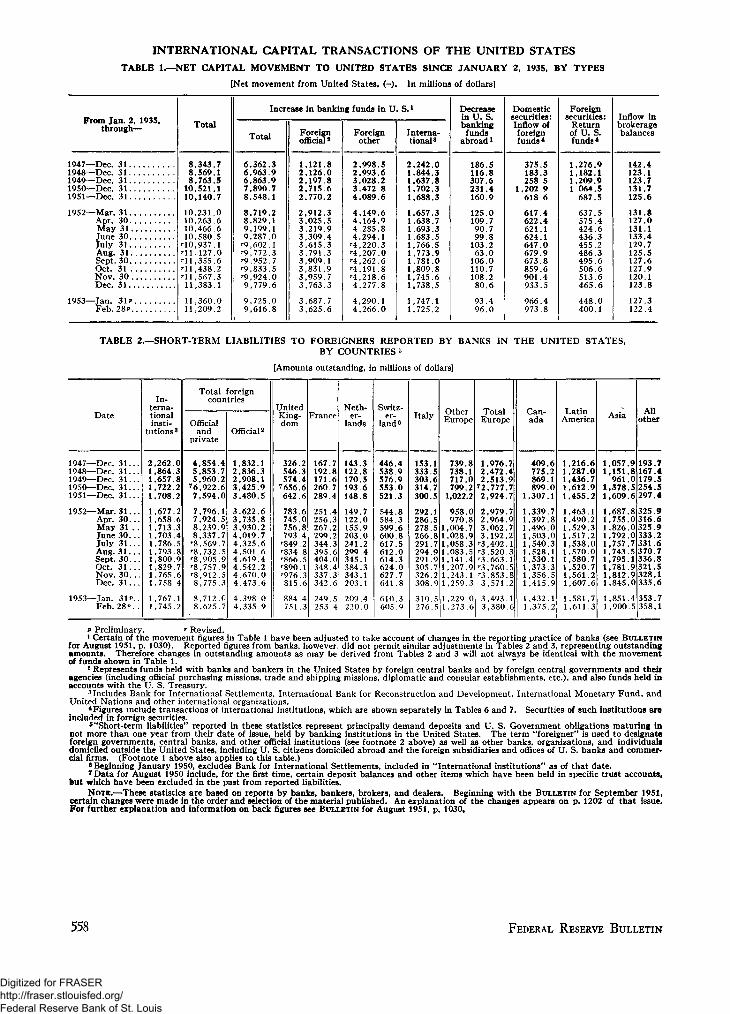
INTERNATIONAL CAPITAL TRANSACTIONS OF THE UNITED STATESTABLE 1.—NET CAPITAL MOVEMENT TO UNITED STATES SINCE JANUARY 2, 1935, BY TYPES
[Net movement from United States, (-). In millions of dollars]
From Jan. 2, 1935,through—
1947—Dec. 311948—Dec. 311949—Dec. 311950—Dec. 311951—Dec. 31
1952—Mar. 31Apr. 30May 31June 30July 31Aug. 31Sept. 30Oct. 31Nov. 30Dec. 31
1953—Jan. 31*Feb. 28P
Total
8,343.78,569.18,763.5
10,521.110,140.7
10,231.010,263.610,466.610,580.5
'•10,937.1'11,127.0'•11,355.6»-ll,438.2'11,567.311,383.1
11,360.011,209.2
Increase in banking funds in U. S.l
Total
6,362.36,963.96,863.97,890 78,548.1
8,719.28,829.19,199.19,287.0
'9,602.1'•9,772.3'9,952.7'9,833.5'9,924.09,779.6
9,725.09,616.8
Foreignofficials
1.121.82,126.02,197.82.715.62.770.2
2,912.33,025.53,219.93,309.43,615.33,791 .33,909.13,831.93,959.73,763.3
3,687.73,625.6
Foreignother
2,998.52,993.63,028.23.472 84,089.6
4,149.64,164.94.285.84,294.1
'4,220.3'4,207.0'4,262.6'4,191.8'4,218.64,277.8
4,290.14,266.0
Interna-tional3
2,242.01,844.31,637.8L.702.31,688.3
1,657.31,638.71,693.31.683.51,766.51,773.91.781.01,809.8L,745.61,738.5
1,747.11,725.2
Decreasein U. S.banking
fundsabroad1
186.5116.8307.6231.4160.9
125.0109.790.799.8
103.263.0
106.0110.7108.280.6
93.496.0
Domesticsecurities:Inflow offoreignfunds 4
375.5183.3258 5
1.202 9618 6
617.4622.4621.1624.1647.0679.9673.8859.6901.4933.5
966.4973.8
Foreignsecurities:
Returnof U. S.funds *
1,276.91,182.11,209.91 064.5
687.5
637.5575.4424.6436.3455.2486.3495.6506.6513.6465.6
448.0400.1
Inflow inbrokeragebalances
142.4123.1123.7131.7125.6
131.8127.0131.1133.4129.7125.5127.6127.9120.1123.8
127.3122.4
TABLE 2.—SHORT-TERM LIABILITIES TO FOREIGNERS REPORTED BY BANKS IN THE UNITED STATES,BY COUNTRIES 5
[Amounts outstanding, in millions of dollars]
Date
1947—Dec. 3 1 . . .1948—Dec. 3 1 . . .1949—Dec. 3 1 . . .1950—Dec. 3 1 . . .1951—Dec. 3 1 . . .
1952—Mar. 3 1 . . .Apr. 30 . . .May 31 . .June 3 0 . . .July 3 1 . . .Aug. 3 1 . . .Sept. 3 0 . . .Oct. 3 1 . . .N o v . 3 0 . . .Dec. 3 1 . . .
1953—Jan. 31 P . .F e b . 2 8 P . .
In-terna-tionalinsti-
tutions3
2,262.0,864.3,657.8,722.2,708.2
,677.2,658.6,713.3
U703.4L.786.5L.793.8L,800.91,829.7,765.6
L,758 4
,767.1L,745.2
Tota breigncountries
Officialand
private
455
767
7788
' 8' 8' 8' 8' 88
88
,854.,853.,960.,922.,594.
,796.,924.,239,337,569,732,905,757,912,775
,712,625
47260
1597759953
07
Official2
1,8322,8362,9083,4253.480
3,6223,7353,9304,0194,3254,5014,6194,5424,6704,473
4,398
.1
.3
.1
.9
.5
.6
.8
.2
.7
.6
.6
.4
.2
.0
.6
.04,335.9
UnitedKing-dom
326546574
7656642
783745756793
'849'834'866'890'976815
884751
23466
6084285136
4.3
France
167192171260289
251256267
.7
.8
.67
.4
.4
.3
.2299.2344395404348337342
249253
.3
.6
.0
.4
.3
.6
.5
.4
Neth-er-
lands
143.122.
38
170.5193148.
149122155203
68
7090
241.2299345384343203
209220
413
1
40
Switz-er-
land6
446.4538.9576.9553 0521.3
544.8584.3599.6600.8617.5612.0614.3624.0627.7641.8
610.3605.9
Italy
153.333.303.314.300.
292.286.278.
15675
155
266.8291.294291305326308
310276
799729
55
OtherEurope
739738717799
8102
1,022.2
958970
1,0041,0281,0581,0831,1411,2071,2431,259
1 ,2291,273
0879354913
0.6
TotalEurope
1,976.72,472.42,513.9
72,777.72,924.7
2,979.72,964.93,062.73,192.2
'3,402.1'3,520.3'3,663.1'3,760.5'3,853 .83,571.2
3,493.13,380.6
1
1111111111
11
Can-ada
409.6775.2869.1899.0
,307.1
,339.7,397.8,496.0,503.0,540.3,528.1,530.1,373.3,356.5,415.9
,432.1,375.2
LatinAmerica
1,2161,2871,4361.612,455
1,463
60792
11,490.21,529L ,5171,538
320
1,570.0L.5801,5201,5611,607
1,5811,611
772
.6
7.3
Asia
11,057.91,151.8
961.0,378.5
1,609.6
1,687.8L,755.01,826.0L,792.01,757.7L,743.51,795.1L.781.91,812.91,845.0
1,851.41,900.5
Allother
193.7167.4179.5254.5297.4
325.9316.6325.9333.2331.6370.7336.8321.5328.1335.6
353.7358.1
P Preliminary. ' Revised.1 Certain of the movement figures in Table 1 have been adjusted to take account of changes in the reporting practice of banks (see BULLETIN
for August 1951, p. 1030). Reported figures from banks, however, did not permit similar adjustments in Tables 2 and 3, representing outstandingAmounts. Therefore changes in outstanding amounts as may be derived from Tables 2 and 3 will not always be identical with the movementof funds shown in Table 1.
2 Represents funds held with banks and bankers in the United States by foreign central banks and by foreign central governments and theiragencies (including official purchasing missions, trade and shipping missions, diplomatic and consular establishments, etc.), and also funds held inaccounts with the U. S. Treasury.
3Includes Bank for International Settlements, International Bank for Reconstruction and Development, International Monetary Fund, andUnited Nations and other international organizations.
4Figures include transactions of international institutions, which are shown separately in Tables 6 and 7. Securities of such institutions areincluded in foreign securities.
6UShort-term liabilities" reported in these statistics represent principally demand deposits and U. S. Government obligations maturing innot more than one year from their date of issue, held by banking institutions in the United States. The term "foreigner" is used to designateforeign governments, central banks, and other official institutions (see footnote 2 above) as well as other banks, organizations, and individual!domiciled outside the United States, including U. S. citizens domiciled abroad and the foreign subsidiaries and offices of U. S. banks and commer-cial firms. (Footnote 1 above also applies to this table.)
6 Beginning January 1950, excludes Bank for International Settlements, included in "International institutions" as of that date.7 Data for August 1950 include, for the first time, certain deposit balances and other items which have been held in specific trust accounts,
but which have been excluded in the past from reported liabilities.NOTE.—These statistics are based on reports by banks, bankers, brokers, and dealers. Beginning with the BULLETIN for September 1951,
certain changes were made in the order and selection of the material published. An explanation of the changes appears on p. 1202 of that issue.For further explanation and information on back figures see BULLETIN for August 1951, p. 1030,
558 FEDERAL RESERVE BULLETIN
Digitized for FRASER http://fraser.stlouisfed.org/ Federal Reserve Bank of St. Louis
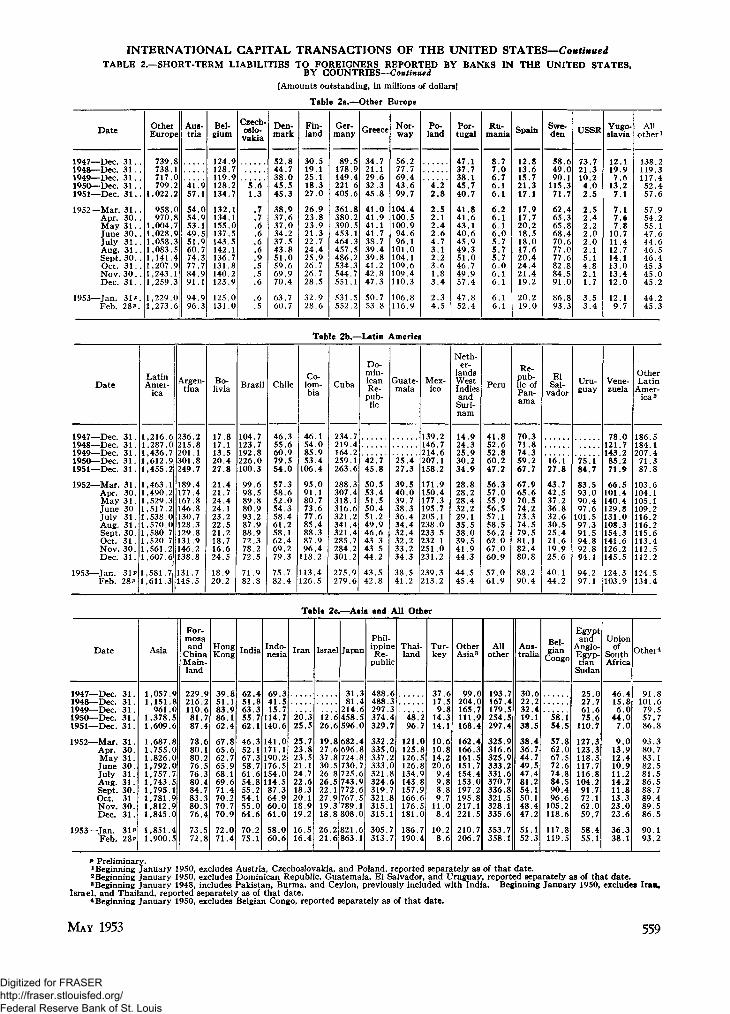
INTERNATIONAL CAPITAL TRANSACTIONS OF THE UNITED STATES—ContinuedTABLE 2.—SHORT-TERM LIABILITIES TO FOREIGNERS REPORTED BY BANKS IN THE UNITED STATES,
BY COUNTRIES—Continued
[Amounts outstanding, in millions of dollars]
Table 2a.—Other Europe
Date
1947—Dec. 3 1 . .194g—Dec> 3i1949—Dec. 3 1 . .1950— Dec. 3 1 . .1951—Dec. 3 1 . .
1952—Mar. 3 1 . .Apr. 30. .May 3 1 . .June 30..July 3 1 . .Aug. 3 1 . .Sept. 30. .Oct. 3 1 . .Nov. 30 . .Dec. 31. .
1953—Jan. 31 P.Feb. 28?.
OtherEurope
739.8738.1717.0799.2
1,022.2
958.0970.8
1,004.71,028.91,058.31,083.51,141.41,207.91,243 11,259.3
1,229.01,273.6
Aus-tria
41.957.1
54.054.953.149.551.960.774.377.784 991.1
94.996.3
Bel-gium
124.9128.7119.9128.2134.7
132.1134.1155.0137.5143.5142.1136.7131.8140 2123.9
125.0131.0
Czech-oslo-vakia
5.61.3
.7
.7
.6
.6
.6
.6
.9
.55
.6
.6
.5
Den-mark
52.844.738.045.545.3
38.937.637.034.237.543.851.059.669 970.4
63.760.7
Fin-land
30.519.125.118.327.0
26.923.823.921.322.724.425.926.726.728.5
32.928.6
Ger-many
89.5178.9149.4221 6405.6
361.8380.2390.5453.1464.3457.5486.2534.3544 7551.1
531.5552.2
Greece
34.721.129.632.345.8
41.041.941.141.738.739.439.841.242.847.3
50.753.8
Nor-way
56.277.769.443.699.7
104.4100.5100.994.696.1
101.0104.1109.6109 4110.3
106.8116.9
Po-land
"4.2"2 . 8
2 . 52 . 12 . 42 . 64 . 73 . 12 .23 . 61.83 . 4
2 . 34 . 5
Por-tugal
47.137.738.145.740.7
41.841.643.140.645.949.351.046.749 957.4
47.852.4
Ru-mania
8 .77 . 06 . 76 .16 . 1
6 .26 .16 . 16 . 05 .75 .75 .76 . 06 16 . 1
6 . 16 .1
Spain
12.813.615.721.317.1
17.917.720.218.518.017.620.424.421 A19.2
20.219.0
Swe-den
58.649.090.1
115.371.7
62.465.365.868.470.677.077.682.884 591.0
86.893.3
USSR
73.721 310.24 . 02 . 5
2 . 52 . 42 .22 . 02 . 02 . 15 .14 . 82 11.7
3 . 53 . 4
Yugo-slavia
12.119.9
7 .613.2
7 .1
7 .17 . *7 .8
10.711.412.714.113.011 412.0
12.19 .7
AHother1
138.2119 3117.452.457.6
57.954.255.147.644.646.546.445.345.045.2
44.245.3
Date
1947—Dec.1948—Dec.1949—Dec.1950—Dec.1951—Dec.
1952—Mar.Apr.M a yJuneJulyAug.Sept.Oct.Nov.Dec.
1953—Jan.Feb.
3 1 .3 1 .3 1 .3 1 .3 1 .
3 1 .3 0 .3 1 .303 1 .3 1 .3 0 .3 1 .3 0 .3 1 .
31?2 8 P
LatinAmer-
ica
1,216.61,287.01,436.71,612.91,455.2
1,463.11,490.21,529.31,517.21,538.01,570.01,580.71,520.71,561 .21,607.6
1,581.71,611.3
Argen-tina
236 .2215.8201301249
189177167146130128129131146138
131145
.1
.8
.7
.4
.4
.8
.8
.7
.3
.8
.9
.2
.8
.7
.5
Bo-livia
1717132027
21212424232221181624
1820
.8
.1
.5
.4
.8
.4
.7
.4
.1
.2
.5
.2
.7
.6
.5
.9
.2
Brazil
104123192226
7780
100.3
99.6988980938788727872
7182
589299325
98
Chile
4655607954
57585254586158626979
7582
.3
.6
.9
.5
.0
.3
.6
.0
.3
.4
.2
.1
.4
.2
.3
.7
.4
Table 2b.—Latin
Co-lom-bia
46548553
106
959180737785888796
118
113126
10944
0176643942
45
Cuba
234219
74
164.2259263
288307318316321341321285284301
275279
16
3416244722
96
Do-min-icanRe-pub-lic
42.7'45.8
50.553.451.550.451.249.946.643.343.544.2
43.542.8
4meric«
Guate-mala
2527
39403938363432323334
3841
.4
.3
.5
.0
.7
.3
.4
.4
.4
.2
.2
.3
.5
.2
1
Mex-ico
139.2146.7214.6207.1158.2
171.9150.4177.3195.7205.1238.0233.5232 A251.0231.2
239.3213.2
Neth-er-
landsWestIndiesandSuri-n a m
14.924.325.930.234.9
28.828.228.432.229.135.538.039.541.944.3
44.545.4
Peru
4152526047
565755
.8
.6
.8
.2
.2
.3
.0
.956.5575856626760
5761
.1
.5
.2
.0
.0
.9
.0
.9
Re-pub-lic ofPan-ama
7071745967
6765
38327
96
70.574737479818280
8890
2355148
24
ElSal-
vador
1627
43423736323025211925
4044
1.8
.7
.5
.2
.8
.6
.5
.4
.6
.9
.6
.1
.2
Uru-guay
75! 184.7
83.593.090.497.6
101.597.391.594.892.894.1
94.297.1
Vene-zuela
78.0121.7143.285.271.9
66.5101.4140.4129.8131.0108.3154.3141.6126.2145.5
124.3103.9
OtherLatin
Amer-ica 2
186.5184.1207.4
71.387.8
103.6104.1105.1109.2116.2116.2115.6113.4112.5112.2
124.5134.4
Date
1947—Dec.1948—Dec.1949—Dec.1950— Dec.1951—Dec.
1952—Mar.Apr.M a yJuneJulyAug.Sept.Oct.Nov.Dec.
1953—Jan.Feb.
3 1 .3 1 .3 1 .3 1 .3 1 .
3 1 .3 0 .3 1 .3 0 .3 1 .3 1 .3 0 .313 0 .3 1 .
3 1 *
28*
Asia
1,057.91,151.8
961.01,378.51,609.6
1,687.81,755.01,826.0,792.0
L,757.7,743.5
1,795.1,781.9,812.9,845.0
1,851.41,900.5
For-mosaand
ChinaMain-land
229.9216.2110.681.787.4
78.680.180.276.576.380.484.783.380.376.4
73.572.8
HongKong
39.851.183.986.162.4
67.865.662.765.968.169.671.470.270.770.9
72.071.4
India
62.451.863.355.762.1
46.352.167.358.761.654.855.254.155.064.6
70.275.1
Indo-nesia
694115
114140
141171
.3
.5
.7
.7
.6
.0
.1190.217615411487646061
5860
.5
.0
.5
.3
.9
.0
.0
.0
.6
fable :
Iran
2025
25232321242218201819
1616
'.3.5
.7
.8
.5
.1
.7
.6
.3
.1
.9
.2
.5
.4
Isra
1226
1927373026
2c.—Asia and All Other
el
*66
86858
26.522 127.91918
2621
38
26
Japan
3181
214458596
682696724730725743
.3
.4
.6
.5
.0
.4
.8
.8
.7
.6
.9772.6767789808
821863
.5
.1
.0
.6
.1
Phil-ippineRe-
public
488.6488.3297.3374.4329.7
332.2335.0337.2333.0321.8324.6319.7321.8315.1315.1
305.7313.7
Thai-land
4896
27
121.0125126126134143157166176181
186190
858989650
74
Tur-key
37179
1414
10101420
9989
118
108
.6
.5
.8
.3
.1
.6
.8
.2
.6
.4
.8
.8
.7
.0
.4
.2
.6
OtherAsia3
9 9 .204.165.111.168.
162.166.161.151.154.153.197.195.217.221.
210.206.
00794
4357402815
77
Allother
193.7167.4179.5254.5297.4
325.9316.6325.9333.2331.6370.7336.8321.5328.1335.6
353.7358.1
Aus-tralia
30.622.232.419.138.5
38.436.744.749.547.481.254.150.148.447.2
51.152.3
Bel-gian
Congo
"58.154.5
57.862.067.572.674.884.590.496.6
105.2118.6
117.8119.5
Egyptand
Anglo-Egyp-tian
Sudan
25.027.761.675.6
110.7
127.3123.3118.3117.7116.8104.291.772.162.059.7
58.455.1
Unionof
SouthAfrica
46156
447
9
48000
013.91210111411132323
3638
49228306
31
Other4
91.8101.679.557.786.8
93.380.783.182.581.586.588.789.489.586.5
90.193.2
P Preliminary.1 Beginning January 1950, excludes Austria, Czechoslovakia, and Poland, reported separately as of that date.2 Beginning January 1950, excludes Dominican Republic, Guatemala, El Salvador, and Uruguay, reported separately as of that date.3 Beginning January 1948, includes Pakistan, Burma, and Ceylon, previously included with India. Beginning January 1950, excludes Iran,
Israel, and Thailand, reported separately as of that date.* Beginning January 1950, excludes Belgian Congo, reported separately as of that date.
MAY 1953 559
Digitized for FRASER http://fraser.stlouisfed.org/ Federal Reserve Bank of St. Louis

INTERNATIONAL CAPITAL TRANSACTIONS OF THE UNITED STATES—ContinuedTABLE 3.—SHORT-TERM CLAIMS ON FOREIGNERS REPORTED BY BANKS IN THE UNITED STATES,
BY COUNTRIES»[Amounts outstanding, in millions of dollars]
Date Total
948.91,018.7
827.9898.0968.4
1,004.41,019.71,038.71,029.61,026.21,066.31,023.41,018.71,021.11,048.7
1,036.01,033.3
UnitedKing-dom
29.224.537.2
105.735.0
35.433.542.036.230.932.226.835.833.830.3
32.535.3
France
23.4119.051.831.410.1
13.213.811.611.711.6
9 . 29 . 39 . 47 . 6
31.9
28.68 . 8
Neth-er-
lands
49.151.4
5 . 23 . 45 . 0
5 . 73 . 43 . 33 . 13 . 83 . 32 . 62 . 74 . 44 . 4
6 . 46 .2
Switz-er-
land
7 . 06 . 93 . 88 .7
11.2
11.68 . 67 . 39 . 88 . 09 . 88 . 48 . 09 . 27 .1
13.513.1
Italy
21.115.822.620.710.3
21.523.524.930.428.624.619.616.417.217.8
22.920.2
OtherEurope
118.9106.398.567.1
111.2
89.681.179.168.867.266.575.179.082.781.9
78.472.9
TotalEurope
248.6323.8219.2237.0182.8
176.9163.9168.2160.2150.0145.7141.8151.4154.8173.4
182.4156.6
Can-ada
27.539.837.6
125.892.0
72.176.469.551.445.153.358.373.773.862.3
56.357.5
LatinAmer-
ica
514.3516.6411.1378.8489.3
570.2601.1652.2669.6700.1715.2658.3638.6641.8662.0
647.5676.6
Asia
127.0118.8139.796.3
162.4
149.5144.8117.4118.0105.2128.4141.6132.8127.9128.6
125.9124.0
Allother
31.519.720.460.041.9
35.733.531.530.425.823.723.422.222.822.4
24.118.7
1947—Dec. 31...1948—Dec. 31...1949—Dec. 31...1950—Dec. 31...1951—Dec. 31...
1952—Mar. 3 1 . . .Apr. 3 0 . . .M a y 3 1 . . .June 3 0 . . .July 3 1 . . .Aug. 3 1 . . .Sept. 3 0 . . .Oct. 3 1 . . .N o v . 3 0 . . .Dec . 3 1 . . .
1953—Jan . 31 P . .Feb. 2 8 P . .
Table 3a.—Other Europe
Date
1947—Dec# 31 . . . .1948—DeCt 311949—Dec 311950—Dec. 311951—Dec. 31
1952—Mar 31Apr. 30May 31June 30July 31Aug 31Sept. 30Oct 31Nov. 30Dec. 31
1953—Tan 31 PFeb 28P
OtherEurope
118 9106.398 567.1
111.2
89.681.179.168.867.266.575.179.082.781.9
78.472.9
Aus-tria
.2(»)
.1(8)
(«)(8)
A1.01.0
.8
.3
.2
Bel-gium
15.021.419.321.539.6
28.721.317.613.912.911.511.813.217.716.2
16.215.9
Den-mark
2.2.6.4
3.24 . 8
4.64.33.93.53.62.23.52.83.32 . 1
3.54.3
Fin-land
8.03.48.22.23 . 1
2.71.83.42.92.82.22.83.84 05 . 6
5.14.4
Ger-many
30.530.530.025 428.3
27.727.226.923.223.725.727.528.025 426.8
24.127.3
Greece
10.61.2
.7
.2
.2
.1
.1
.1
.1
.2
.2
.2
.2
.2
.2
.2
.1
Nor-way
9.28.47.41 42 5
1.51.82.01.61.81.82.01.71.81.9
1.71.7
Por-tugal
1 1.7.558
1.21.0
.8
.8
.7
.6
.6
.5
.6
.5
.5
.6
Spain
.92.97.01.6
18.8
13.512.614.614.314.312.513.512.611.811.2
9.45.7
Swe-den
5.41.42.36 95 4
4.23.63.22.73.11.92.23.33.02 . 5
2.62.2
Yugo-slavia
(«)6.0(«)
3.9
.72.42.72.3
.53.47.38.07.98 . 6
7.83.9
Allother 2
35.929.822.64 04 0
4.44.93 83.63 64.43 73.85 85 4
7.06.6
Table 3b.—Latin America
Date
1947—Dec.1948—Dec.1949—Dec.1950—Dec.1951—Dec.
1952—Mar.Apr.MayJuneJulyAug.Sept.Oct.Nov.Dec.
1953—Jan.Feb.
3131. .31. .3 1 . .3 1 . .
31 . .30. .31 . .30. .31 . .3 1 . .30. .31 . .30. .31 . .
31P.2 8 P .
LatinAmer-
ica
514516411378
3.6.1.8
489.3
570601652669700715658638641662
647676
.2
.1
.2
.6
.1
.2
.3
.6
.8
.0
.5
.6
Argen-tina
65.272.453.645.9
7 . 6
8 . 67 .87 .48 .27 .27 .68 . 68 .19 . 38 .2
7 . 47 .2
Bo-livia
2 . 02 .72 . 38.77 .5
8 .18 . 69 . 78 . 48 .76 . 86 .26 .26 . 05 . 8
6 . 510.7
Brazil
165.8165.4136.978.0
185.0
234.9272.2320.7358.3392.6403.9374.7356.2354.5356.4
353.2383.1
Chile
27.815.215.56 . 8
24.8
29.329.127.526.127.023.021.618.320.526.423.419.3
Co-lom-bia
323221
661
42.543
33313435343432343641
3636
7
8530521907
48
Cuba
10883272732
56545551525133363032
2330
.6
.1
.5
.6
.3
.6
.7
.9
.8
.5
.6
.6
.1
.6
.5
.5
.7
Do-min-icanRe-
pub-lic
"i!91.8
2 . 12 . 92 . 42 . 21.91.81.81.61.71.6
1.82 . 3
Guate-mala
"23
4434332334
44
.6
.8
.2
.1
.7
.1
.7
.2
.8
.2
.5
.2
.4
.9
Mex-ico
5273737090
1019490
.2
.8
.0
.6
.6
.1
.4
.878.0719192889088
9494
.2
.7
.0
.4
.3
.6
.2
.6
Neth-er-
landsWest
IndiesandSuri-nam
1 l.5.3.3.2
.2
.3
.1L.2
.2L.IL.2
.2L.3L.3
L.41.9
Peru
445
1111
11101110101010111314
1517
.3
.4
.80
.8
.5
.3
.6
.9
.9
.7
.3
.7
.2
.8
.7
.2
Re-pub-lic ofPan-ama
44533
36
76310
98
6 . 05633446
85
93
.37425
.7
.0
ElSal-
vador
*69
76555
85
55343
5 . 35799
86
1101
57
Uru-guay
" 810
19242730322520
.5
.1
.9
.9
.5
.1
.7
.614.31214
149
.9
.3
.0
.2
Venezuela
1526254941
3332343232323133
.3
. 0
.6
.4
.7
.1
.2
.2
.1
.4
.4
.7
.135.636
3433
.7
.2
. 0
OtherLatinAmer-ica 4
34 534^ 743.114.614.5
15.113.713.811.512.513.012.413.913.213.7
14.314.1
p Preliminary.1 See footnote 1, p 558.2 Beginning January 1950, excludes Austria, reported separately as of that date.3 Less than $50,000.4 Beginning January 1950, excludes Dominican Republic, Guatemala, El Salvador, and Uruguay, reported separately as of that date.
560 FEDERAL RESERVE BULLETIN
Digitized for FRASER http://fraser.stlouisfed.org/ Federal Reserve Bank of St. Louis
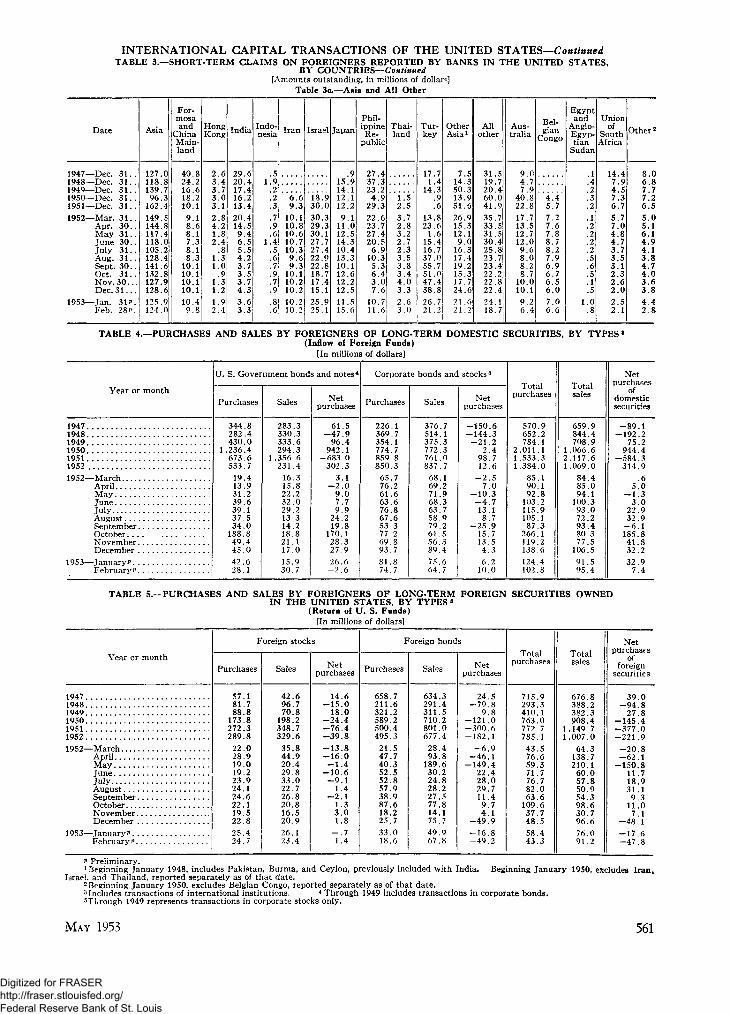
INTERNATIONAL CAPITAL TRANSACTIONS OF THE UNITED STATES—ContinuedTABLE 3.—SHORT-TERM CLAIMS ON FOREIGNERS REPORTED BY BANKS IN THE UNITED STATES,
BY COUNTRIES—Continued[Amounts outstanding, in millions of dollars]
Table 3c—Asia and All Other
Date
1947—Dec. 3 1 . .1948—Dec. 3 1 . .1949—i)ec< 3i1950—Dec. 3 1 . .1951—Dec. 3 1 . .1952—Mar. 3 1 . .
Apr. 30..May 3 1 . .June 30..July 3 1 . .Aug. 31. .Sept. 30..Oct. 3 1 . .Nov. 30.. .Dec 31
1953—Jan. 31 P.Feb. 28P.
Asia
127.0118.8139 796.3
162.4149.5144.8117.4118.0105.2128.4141.6132.8127.9128 6125.9124.0
For-mosaand
ChinaMain-land
40.824.216 618.210.19 .18 .68.17 .38.18 .3
10.110.110.110 110.49 . 8
HongKong
2 . 63 . 43 73 . 03 . 1
2 . 84 . 21.82 . 4
.81.31.0
.91.31 21.92 .4
India
29.620.417.416.213.420.414.59 . 46 .55 .54 . 23 .73 . 53 . 74 33 . 63 3
Indo-nesia
.51.9
.2
.2
.3
.7
.9
.61.4
.5
.6
.7
.9
.7
.9
.8
.6
Iran
6 .69 . 3
10.110.810.610.710.39 .69 . 3
10.110.210 210.210.2
Israel
18.930.030.329.330.127.727.422.922.818,717.415 125.925.1
Japan
.915.914 112.112.29 . 1
11.012.514.310.413.310.112.612.212 511.515.6
Phil-ippineRe-
public
27.437.323 2
4 . 929.322.623.727.420.5
6 . 910.3
5 .36 .43 . 07 6
10.711.6
Thai-land
1.52 . 5
3 .72 . 83 .22 . 72 . 33 .53 . 83 . 44 . 03 32 . 63 . 0
Tur-key
17.71.4
14.3.9.6
13.823.6
1.615.416.737.055.751.047.438 826.721.2
OtherAsia1
7.514.350.313.951.626.915.312.19 . 0
16.317.419.215.317.724 621.621 ?
Allother
31.519.720 460.041.935.733.531.530.425.823.723.422.222.822 424.118.7
Aus-tralia
9 . 04 . 77 9
40.822.817.713.512.712.09 . 68 .08.28.7
10.010 19.26 .4
Bel-gian
Congo
4 . 45 .7
7.27 .67 .88.78.27 .96 .96 .76 .56 07 .06 6
Egyptand
Anglo-Egyp-tian
Sudan
.1
.42
.3
.2
.1
.2
.2
.2
.2
.5
.6
.5
.1
.5
1.0.8
Unionof
SouthAfrica
14.47 .94 . 57 .36 .7
5 .77 . 04 . 84 . 73 .73 . 53 . 12 . 32 . 62 . 0
2 . 52 . 1
Other 2
8 .06 . 87 .77 .26 . 5
5 . 05 .16 .14 . 94 . 13 . 84 . 74 . 03 . 63 . 8
4 . 42 . 8
TABLE 4.—PURCHASES AND SALES BY FOREIGNERS OF LONG-TERM DOMESTIC SECURITIES, BY TYPES«(Inflow of Foreign Funds)
[In millions of dollars]
Year or month
1947194819491950 .1951195219«;2—March
AprilMay ,JuneJulyAugustSeptemberOctober .NovemberDecember
1953—January*February?
U. S. Government bonds and notes4
Purchases
344.8282.4430.0
1,236.4673.6533.7
19.413.931.239.639.137 534.0
188.849.445.042.628.1
Sales
283.3330.3333.6294.3
1,356.6231.4
16.315.822.232.029.213 314.218.821.117.015.930.7
Netpurchases
61.5-47 .9
96.4942.1
-683 0302.3
3.1- 2 . 0
9 . 07 .79 . 9
24.219.8
170.128.327.926.6- 2 . 6
Corporate bonds and
Purchases
226.1369.7354.1774.7859 8850.365.776.261.663.676.867.653.377.269.893.781.874.7
Sales
376.7514.1375.3772.3761 .0837.768.169.271.968 363.758 979.261.556.389.475.664.7
stocks 5
Netpurchases
— 150 6-144.3-21 .2
2 . 498 712 6
- 2 . 57 0
-10 .3—4 713.18 7
-25 .915.713.54.36.2
10.0
Totalpurchases
570 9652.2784.1
2,011.11,533 .31,384.0
85.190 192.8
103 2115.9105 187.3
266.1119.2138.6124.4102.8
Totalsales
659 9844.4708.9
1,066.62,117.61,069.0
84.485.094.1
100 393.072 293.480 377.5
106.591.595.4
Netpurchases
ofdomesticsecurities
—89 1— 192 2
75.2944 4
-584.3314 9
.65 0
— 1 33 0
22 932 9
—6 1185.841 832.2
32.97.4
TABLE 5.—PURCHASES AND SALES BY FOREIGNERS OF LONG-TERM FOREIGN SECURITIES OWNEDIN THE UNITED STATES, BY TYPES *
(Return of U. S. Funds)[In millions of dollars]
Year or month
Foreign stocks
Purchases Sales Netpurchases
Foreign bonds
Purchases Sales Netpurchases
Totalpurchases
Totalsales
Netpurchases
offoreign
securities
1947194819491950195119521952—March
AprilMayJuneJulyAugust. . .SeptemberOctober...NovemberDecember
1953—January P.FebruaryP.
57.181.788.8
173.8272.3289.822.028.919.019.223.924.124.622.119.522.8
25.424.7
42.696.770.8
198.2348.7329.635.844.920.429.833.022.726.820.816.520.926.123.4
14.6-15 .0
18.0-24.4-76.4-39 .8-13 .8-16 .0- 1 . 4
-10 .6- 9 . 1
1.4- 2 . 1
1.33.01.8
- . 71.4
658.7211.6321.2589.2500.4495.321.547.740.352.552.857.938.987.618.225.7
33.018.6
634.3291.4311.5710.2801 .0677.4
28.493.8
189.630.224.828.227.577.814.175.749.967.8
24.5-79 .8
9.8-121.0-300.6-182.1
- 6 . 9-46 .1
-149.422.428.029.711.49.74.1
-49 .9-16 .8-49.2
715.9293.3410.1763.0772.7785.143.576.659.371.776.782.063.6
109.637.748.558.443.3
676.8388.2382.3908.4149.7
1,007.064.3
138.7210.160.057.850.954.398.630.796.676.091.2
39.0-94 .8
27.8-145.4-377.0-221.9-20 .8-62 .1
-150.811.718.931.19.3
11.07.1
-48 .1-17 .6-47 .8
P Preliminary.1 Beginning January 1948, includes Pakistan, Burma, and Ceylon, previously included with India. Beginning January 1950, excludes Iran*
Israel, and Thailand, reported separately as of that date.2 Beginning January 1950, excludes Belgian Congo, reported separately as of that date.3 Includes transactions of international institutions. 4 Through 1949 includes transactions in corporate bonds.5Through 1949 represents transactions in corporate stocks only.
MAY 1953 561
Digitized for FRASER http://fraser.stlouisfed.org/ Federal Reserve Bank of St. Louis

INTERNATIONAL CAPITAL TRANSACTIONS OF THE UNITED STATES—ContinuedTABLE 6.—DOMESTIC SECURITIES: NET PURCHASES BY FOREIGNERS OF LONG-TERM UNITED STATES SECURITIES,
BY COUNTRIES(Inflow of Foreign Funds)
[Net sales, ( - ) . In millions of dollars]
Year ormonth
194719481949195019511952
1952—Mar....Apr. . . .M a y . . .June. . .July. . .AugSept. . . .O c t . . . .Nov . . . .Dec. . . .
1953—Jan.p. .Feb.P. .
Inter-national
insti-tutions
74.57 6
87.0121.2
— 15.914.7
.8
.8
.3
.6
.4
.9
.911.3
.9
.9
25.510.5
Total
—163.6—199.8
— 11.8823 2
-568 .4300.2
- . 24 . 2
— 1.62 . 4
22.532.0
- 7 . 0174.540.931.3
7 .4- 3 . 1
UnitedKing-dom
—8.99 1
20.964 021.470.4
2 . 3.4
1.32 . 47 .27 . 0
- 6 . 938.9
1.811.4
4 . 88 . 8
France
-50 .2—82.8—6.8197.8
6!o5.5
.4- . 60)
1.6.6.7
- 1 . 2.1.5
1.2
1.3- . 4
Nether-lands
—98.2—79.3—25.5
—6.3—22.2—21.9
- 2 . 3- 2 . 6- 2 . 1- 3 . 0- 1 . 4
- . 5- . 3
- 2 . 7- . 6
- 2 . 2
- 2 . 1- 1 . 3
Switzer-land
13.0—40.0
44.219.045.950.7
2 . 41
- l ! 9.7
13.76 . 98 . 35 . 45 . 34 . 5
13.46 .7
Italy
—17.1( i )
1.5— . 71.9
.5
- . 2.1.1
- . 2.3.4.1.2
- . 1- . 3
0).1
OtherEurope
—14.12 . 62 . 2
73.8—43.8
6 .2
- 1 . 2- . 6
.71.2
.9
.6— .43 . 93 . 3
- 1 . 2
2 . 0- 7 . 7
TotalEurope
-175.5—190.4
36.5347.5
9i2111 .4
1.4- 3 . 3— 1.9
2 . 621.315.1
545.910.213.4
19.46 .2
Canada
3 . 27.5
—49 !o458.2
—595.5191.6
- 2 . 73 . 6
.74 . 46 . 8
15.7- 2 . 3126.127.216.3
- 1 0 . 3- 1 0 . 3
LatinAmer-
ica
—3.510.2
2 . 530.113.94 . 7
2 . 94 . 1
- . 4- 4 . 8
1.5.9
- 4 . 11.13 . 4
.1
- 1 . 1.3
Asia
10.0—23.3
—2.1—15.3
4 . 8- 9 . 5
- 2 . 10)
.2- . 2
- 7 . 30)
.21.2
- . 11 .0
. 3
.1
Allother
2 . 2—3.9
.22 7
— .71.9
. 3- . 2- . 2
. 5
.2
.3- . 3
.1
.2
.5
— .9.7
TABLE 6a.—DOMESTIC SECURITIES: NET PURCHASES BY FOREIGNERS OF LONG-TERM UNITED STATES SECURITIESOther Europe; Latin America; and Asia
Year ormonth
194719481949195019511952
1952—Mar. . .AprMay . .June .July. . .Aug... .Sept.. .Oct. . . .Nov. . .Dec. . .
1953—Jan. P . .Feb. P . .
OtherEurope
- 1 4 . 12.62.2
73.8- 4 3 . 8
6.2
- 1 . 2- . 6
.71.2
.9
.6- . 43.93.3
- 1 . 2
2.0- 7 . 7
Aus-tria *
18.4- 1 1 . 9
.4
0)0)0)
0)0)0)0)
80)- . 2
Bel-gium
- . 92.61.6
12.65.7
- . 5
- . 1.8.2.4
- . 8.4
- . 1— .2
.6- 1 . 5
.9- . 1
Nor-way
- 4 . 1- . 3— .936.7
- 3 8 . 16.0
.1- . 10)
0)0)3^23.1
— .1
.9- 6 . 8
Allother
—9.2.3
1.46.0
.5
.3
- 1 . 3- 1 . 3
.5
.61.8
.2- . 2
.9- . 3
.5
.2- . 6
LatinAmer-
ica
- 3 . 510.22.5
30.113.94.7
2.94.1
- . 4- 4 . 8
1.5.9
- 4 . 11.13.4
.1
- 1 . 1.3
Co-lom-bia
.3
.21.2
- 1 . 2.5
- . 8
.6
.4- 1 . 1
1.1.3
- . 1- 1 . 3- . 2
.4- . 1
- 1 . 3- . 3
Cuba
- . 9- . 8
- 1 . 024.66.1
.2
.5
.8- . 1— .4- . 21.3
- . 1- . 30)
- 1 . 6
0).8
Mex-ico
2 . 52.9
.3
.52.52.6
l!- . 4.8
.7
.8
.1
.31.1
.4— .2
Re-public
ofPan-ama
- 6 . 9- 4 . 7
4.2.1.8
- 6 . 5
2.01.4
.4- 5 . 9
- . 3- 2 . 3- 3 . 1
.82.3
.4
- . 6.3
Uru-guay*
- 5 . 02.62.7
- . 1.5
- . 2.3.5
1.2- . 8- . 30)0)
.4
OtherLatin
Amer-ica
1.512.6
- 2 . 111.1
1.56.6
— .11.71.3
.4
i . i.6.4
0).1
Asia
10.0- 2 3 . 3- 2 . 1
- 1 5 . 34.8
- 9 . 5
- 2 . 10)
.2— .2
- 7 . 30)
l.*2— .11.0
.3
.1
For-mosaand
ChinaMain-land
- 3 . 2- 2 2 . 7- 7 . 2- 3 . 0
- . 2- . 3
- . 2.2
K- ! i— .i
.20)
Indo-nesia
- 1 . 3- . 1
.2- . 3
.3- . 1
80)0)0)0)0)0)0)
C1)
Philip-pineRe-
pub-lic
7.0.4.5.9
- 2 . 1- 1 1 . 4
- 1 . 60)
- i ! o-7.5
0)
0)0)
OtherAsia
7.5- . 94.4
- 1 3 . 06.82.3
— 4- . 1
.1
.8
.6( 1 ) .2
1.1.1
1.1
. 1
.1
TABLE 7.—FOREIGN SECURITIES: NET PURCHASES BY FOREIGNERS OF LONG-TERM FOREIGN SECURITIES OWNEDIN THE UNITED STATES, BY COUNTRIES
(Return of U. S. Funds)[Net sales, ( - ) . In millions of dollars]
Year ormonth
194719481949195019511952
1952—Mar....Apr. . . .M a y . . .June...July. . .Aug. . . .Sept. .OctNov . . . .Dec . . . .
1953—Jan.P. .Feb.P ..
Inter-national
insti-tutions
-249.3( i )
-16.0-3.6
-152.7-118 1
-4.40)
- 5 0 . 7- . 80)- . 6
- 5 8 . 8- . 8- . 7
0)- 1 . 3
Total
288.3- 9 4 . 9
43.8-141 .8-224 .3-103 .9
- 1 6 . 4- 6 2 . 2
-100.112.518.931.79.3
69.87.9
- 4 7 . 4
- 1 7 . 6- 4 6 . 6
UnitedKing-dom
- 2 . 0- 9 . 9
- 1 3 . 5- 6 . 1- 2 . 0- 4 . 4
- . 5.1
- 1 . 1- 1 . 6- 1 . 1- 1 . 0
1.34.0
- . 7- 1 . 1
- . 3.3
France
- 3 . 1- 4 . 3
.4- 1 . 3- 4 . 1
4 . 9
.2
.5
.5
.9- . 31.01.2
.1- . 1- . 4
.3
.3
Nether-lands
- 2 9 . 9- 5 . 3
- . 1- 4 . 7
2 . 8- 1 2 . 8
.5
.6- . 2
- 3 . 9- 6 . 7- 2 . 9
- . 7- . 2- . 1- . 2
- 1 . 51.4
Switzer*land
- 1 4 . 9- 3 5 . 4
19.117.214.28 .7
.41.71.0
- . 2- 1 . 6
2.1- . 51.8
.4
.7
2.11.1
Italy
- . 3.1.4.5
1.21.2
- . 20)— .2
.4- . 3
.11.0
0)
.4
.1
OtherEurope
15.611.424.6
7 .816.418.2
2.8.4
2.16.1
- . 4.2.6
3.9.7.3
.7
.5
TotalEurope
- 3 4 . 4- 4 3 . 4
30.813.428.515.9
3.13.32.31.2
- 9 . 6- 1 . 0
2.010.6
.3- . 5
1.73.8
Canada
205.2-102 .2—10.6
-190 .0—258.6-141 .0
- 1 0 . 5- 7 1 . 2
-101 .511.221.428.3
6.539.8
8.8- 4 6 . 0
- 1 6 . 7- 4 7 . 0
LatinAmer-
ica
89.240.720.229.833.825.3
1.51.01.92.5
0)1.1
.613.1
.22.3
1.11.9
Asia
.51.6
.81.0
—36.0—10.0
- 5 . 0- 4 . 1- 3 . 0- 2 . 7
6.72.7
.46.7
- 1 . 6- 3 . 9
- 4 . 1- 2 . 6
Allother
27.88 42 . 63 . 97 96 0
- 5 . 58.8
.1
.4
.2
.6_ 2- . 3
.2
.7
.4- 2 . 6
9 Preliminary.» Less than $50,000.
1 Not available until 1950.
562 FEDERAL RESERVE BULLETIN
Digitized for FRASER http://fraser.stlouisfed.org/ Federal Reserve Bank of St. Louis

INTERNATIONAL CAPITAL TRANSACTIONS OF THE UNITED STATES—Continued
TABLE 8.—INFLOW IN BROKERAGE BALANCES, BYCOUNTRIES
(The Net Effect of Increases in Foreign Brokerage Balances in U. S.and of Decreases in Balances Held by Brokers and Dealers inU. S. with Brokers and Dealers Abroad)
[In millions of dollars]
Year or month
194719481949195019511952
1952—MarchAprilMayJuneJulyAugustSeptember. . .OctoberNovember. . .December.. . .
1953—JanuaryPFebruary P . . .
Total
- 1 1 . 3- 1 9 . 3
.68 .0
- 6 . 1- 1 . 8
1.2- 4 . 8
4 . 12 . 3
- 3 . 7- 4 . 1
2 . 0.3
- 7 . 83 . 7
3 .52 - 4 . 8
Europe
- 9 . 3- 2 0 . 8
1.03 . 0
-3.3- 1 . 6
(l)- 2 . 9
2 . 62 .2
—2 1- 3 . 3- 1 . 8
.9- 3 . 2
1.5
.3- 4 . 7
Canada
- 2 . 0.1.9
- 3 . 02 . 8
- 1 . 0
1.81.4
- 1 . 5- . 3
.3
.6
.6- 1 . 8- 1 . 20)
2 . 01.1
LatinAmer-
ica
- . 61.2
- 1 . 34.4
- 5 . 01.0
.1-2.6
2.1.5
- 2 . 0.4
1.9.2
- 2 . 42.1
.7- 1 . 0
Asiaand allother
.5
.30)
3 . 5— 6- . 2
.8- . 10)
- 1 . 81.31.0
- 1 . 0.1
.42
P Preliminary.1 Less than $50,000.2 Amounts outstanding (in millions of dollars): foreign brokerage
balances in U. S., 83.0; U. S. brokerage balances abroad, 37.4.
TABLE 9.—DEPOSITS AND OTHER DOLLAR ASSETS HELDAT FEDERAL RESERVE BANKS FOR FOREIGN
CORRESPONDENTS *
[In millions of dollars]
Date
1950—Dec. 311951—Dec. 31
1952—Apr. 30May 31June 30July 31Aug. 31Sept. 30Oct. 31Nov. 30Dec. 31
1953—Jan. 31Feb. 28Mar. 31Apr. 30
May 6May 13
Deposits
895526
518599548724812707642758550
586511536506
517618
Assets in custody
U. S. Gov-ernment
securities 2
,571,383
,663,691,757,972
2,1162,2362,3012,2252,156
2,1822,1702,2462,425
2,4332,407
Miscel-laneous 3
6080
505051545565808486
85899097
9798
1 Represents dollar assets belonging to foreign monetary authoritiesand the Bank for International Settlements. Excludes assets held forthe International Bank for Reconstruction and Development andInternational Monetary Fund and earmarked gold. See footnote 5,p. 565, for total gold under earmark at Federal Reserve Banks forforeign and international accounts.
2U. S. Treasury bills, certificates of indebtedness, notes and/orbonds.
3Includes bankers' acceptances, commercial paper, foreign andinternational bonds.
NOTE.—For explanation of table and for back figures see p. 474 ofthis BULLETIN.
GOLD PRODUCTIONOUTSIDE USSR
[In millions of dollars]
Year ormonth
194719481949195019511952
1952—February..MarchApril . : . . . .May
JulyAugust . . .
OctoberNovember.
1953—January.. . .February
Estimatedworld
productionoutsideUSSR*
766 5798 0833 0857.5840 0
Production reported monthly
Totalreportedmonthly
705.5728.1753.2777.1758.3
61.063.363.366.263.267.365.866.4
Africa
SouthAfrica
$1392.0405.5409.7408.2403.1413.7
32.234.433.835.534.135.534.934.735 434.334.6
34.732 4
Rho-desia
18.318.018.517.917.017.4
L.4L.3
S.4
L.464•>
1.51.4
L.4
WestAfrica2
rains of i19.323.423.124.122 923.8
1.91.92.02.01.91.82.02 .12 . 12 . 12 . 1
2.12.1
BelgianCongo2
lold 9/1010 811 112.912.012.313.7
.2
?.2
L 2119
' ?
North and South America
UnitedStates3
fine: i. e75.870.967.380.166.367.8
4.84.65.05.15.56.46.56 .26 86 . 05 . 9
4.54.3
Can-ada
., an oun107.5123.5144.2155.4153.7156.5
12.312.812.712.812.613.113.013.414 113.613.7
13.012.3
Mex-ico
ce of fine
16.312.914.214.313.8
1.41.4
.92.1
.81.41.01.4
Colom-bia
gold =$313.411.712.613.315.114 8
1.4L.21 6L.5
9.3
01 1
31.8
1.4
Chile
5.5.95 76.36 76 1
45454
.66
.65
Nica-ragua 4
7 .47 .87 78.0R 88 9
7.778
.8
.77
.8788
.77
Other
Austra-lia
32.831.231.330.431.3
2.62.52.82.72.93.22 42 . 83 62 9
India2
6 . 16 . 55.76.77 . 98 .5
.7
.7
.7
.7
.7
.7
.7
.88
.7
.7
.6
.6
Gold production in USSR: No regular government statistics on gold production in USSR are available, but data of percentage changes irregu-larly given out by officials of the gold mining industry, together with certain direct figures for past years, afford a basis for estimating annualproduction as follows: 1934, 135 million dollars; 1935, 158 million; 1936, 187 million; 1937, 185 million; and 1938, 180 million.
1 Estimates of United States Bureau of Mines.2 Reported by American Bureau of Metal Statistics.3Yearly figures through 1951 are estimates of United States Mint. Figures for 1952 and 1953 are estimates of American Bureau of Metal
Statistics.4Gold exports reported by the National Bank of Nicaragua, which states that they represent approximately 90 per cent of total production.NOTE.—For explanation of table and sources, see BULLETIN for June 1948, p. 731, and Banking and Monetary Statistics, p. 524. For annual
estimates compiled by the United States Mint for these and other countries in the period 1910-1941, see Banking and Monetary Statistics, pp.542-543; for figures subsequent to 1941 see BULLETIN for April 1953, p. 427.
MAY 1953 563
Digitized for FRASER http://fraser.stlouisfed.org/ Federal Reserve Bank of St. Louis

REPORTED GOLD RESERVES OF CENTRAL BANKS AND GOVERNMENTS[In millions of dollars]
End ofmonth
1947—Dec1948—Dec1949—Dec1950—Dec1951—Dec
1952—AprMay. . . .June....JulyAugSeptOctN o vDec
1953—JanFebMar.. ..
End ofmonth
1947—Dec1948—Dec1949—Dec1950—Dec1951— Dec
1952—AprM a y . . . .June... .July. . . .AugSeptOctNov.. . .Dec
1953 j a n
FebMar
End ofmonth
1947—Dec1948—Dec1949—Dec1950—Dec1951— Dec...-..
1952—AorM a y . . . .JuneJulyAugSeptOctNov.. . .Dec
1953—JanFebMar
Estimatedtotal world
(excl.USSR)*
34,55034,93035,41035,820
'35,960
36,120
r36,210
P36.280
Egypt
53535397
174
174174174174174174174174174
174174174
Portu-gal
310236178192265
274274274274274277282285286
297298305
United States
Treasury
22,75424,24424,42722,70622,695
23 29723,29623,34623,35023 34423,34223 33923 33723,186
22 98622,66222,563
France3
548548523523548
548548548548558558558568573
573573573
El Sal-vador
1515172326
263030303029292929
292929
Total2
22,86824,39924,56322.82022,873
23 45023,50223,53323 53623 52823,52523 52123 50423,252
23 07922 75122,649
Guate-mala
2727272727
272727272727272727
2727
SouthAfrica
762183128197190
164161148151159158159159170
165173
Argen-tina
322143216216268
268268268268268268268268
India
274256247247247
247247247247247247247247247
247247247
Spain
111111
856151
515151515151515151
515252
Bel-gium
597624698587621
638650669735735718713711706
709701702
Iran
142140140140138
138138138138138138138138138
138138
Sweden
105817090
152
214210213206202202190185184
195194194
Bolivia
2323232323
232323232522262321
Italy
5896
256256333
346346346346346346346346346
Switz-er-
land
1,356,387,504,470,452
1,4131,410,408,408,404,404,406
1,4071,411
1,417,417
1,418
Brazil
354317317317317
317317317317317317317317317
317317317
Java
M80
178209280
280280280280280280280255235
218208208
Thai-land
3434
118118113
113113113113113113113113113
113113
Canada
294408496590850
877886893887883892885887896
900904911
Mexico
1004252
208208
185117
70717287
104105144
Turkey
170162154150151
150153150150150146143143143
143144144
Chile
4543404045
454242414142424242
424242
Nether-lands
231166195311316
342344344350323326326394544
P567P597P605
UnitedKing-dom
2,0791,8561,688*,30CJ.335
1,6621,6781,6851,7161,6721,6851,7671,8951,846
1,9782.10352,166
Co-lombia
83515274
NewZealand
2323272932
323333333333333333
333333
Uru-guay
175164178236221
211211211211211211205205207
207207
Cuba
279289299271311
321321318304294280280254214
214
Nor-way
7252515050
505050505050505050
555555
Vene-zuela
215323373373373
373373373373373373373373373
373373373
Den-mark
3232323131
313131313131313131
313131
Pakis-tan
14272727
383838383838383838
383838
Inter-nationalMone-taryFund
1,3561,436L.451,495
1,530
L.5321,535L ,537,537,681,683,691
1,6921,692
1,692
Ecua-dor
2021211922
222222222323232323
232323
Peru
2020283146
464646464646464646
4646
Bank forInter-
nationalSettle-ments
303668
167115
151154154166181183187191196
215214233
p Preliminary. r Revised.1 Includes reported gold holdings of central banks and governments and international institutions, unpublished holdings of various central
banks and governments, estimated holdings of British Exchange Equalization Account based on figures shown below under United Kingdom,and estimated official holdings of countries from which no reports are received.
2 Includes gold in Exchange Stabilization Fund. Gold in active portion of this Fund is not included in regular statistics on gold stock (Treasurygold) used in the Federal Reserve statement "Member Bank Reserves, Reserve Bank Credit, and Related Items" or in the Treasury statement"United States Money, Outstanding and in Circulation, by Kinds."
3 Represents gold holdings of Bank of France (holdings of French Exchange Stabilization Fund are not included).4 Figure as of Mar. 31.5 Exchange Equalization Account holdings of gold, U. S. and Canadian dollars, as reported by British Government. (Gold reserves of Bank
of England have remained unchanged at 1 million dollars since 1939, when Bank's holdings were transferred to Exchange Equalization Account.)NOTE.—For description of figures, including details regarding special internal gold transfers affecting the reported data, see Banking and
Monetary Statistics, pp. 524-535; for back figures through 1941 see Table 160, p. 526 and pp. 544-555, in the same publication and for those subse-quent to 1941 see BULLETIN for January 1953, p. 74; April 1951, p. 464; February 1950, p. 252; and November 1947, p. 1433. For revised backfigures for Argentina and Canada, see BULLETIN for January 1949, p. 86, and February 1949, p. 196, respectively.
564 FEDERAL RESERVE BULLETIN
Digitized for FRASER http://fraser.stlouisfed.org/ Federal Reserve Bank of St. Louis

NET GOLD PURCHASES BY THE UNITED STATES, BY COUNTRIES
[Negative figures indicate net sales by the United States]
(In millions of dollars at $35 per fiae troy ounce)
Year or quarter
19451946194719481949195019511952
1949
Jan -MarApr.-June . .July-SeptOct.-Dec
1950
Jan -M!ar.
July-SeptOct.-Dec
1951
Jan.-Mar..Apr.-JuneJuly-SeptOct.-Dec
1952
Jan -MarApr.-JuneTuly-SeptOct.-Dec
Total
—452 9721.3
2,864.41,510.0
193 3-1 ,725 .2
75 2393.7
68 8173.9101.5
- 1 5 1 . 0
—201 3—30.4
—731.0—762 4
-876 .3- 5 5 . 6291 4715.7
557 3105.7- 1 . 3
-268 .0
UnitedKingdom
— .2406.9734.3446 3
-1 ,020 .0469.9440.0
162.4283.9
—80 0
—580.0—360.0
—400.0- 8 0 . 0320.0629.9
520 0
- 8 0 . 0
Bel-gium
31 114.2
222.869.8
—41 0- 5 5 . 0— 10.3—3.8
— 12 5- 3 1 . 0
2.5
—35 0- 2 0 . 0
— 12.32 . 0
20.2
- 2 4 . 0
France
278 5
264.615.8
-84.8-20 0
-28.5-56.3
-91.7
71.7
Neth-er-
lands
130.840.7
—23 5-79.8-4 .5
-100.0
10 4
-33.9
—79.8
—4.5
-100.0
Portu-gal
-47 9-10.0116.063.014 0
-15.0-34.9- 5 . 0
10 5
3 . 5
-15.0
-10.0-15.0- 5 . 0- 5 . 0
- 5 . 0
Swe-den
80.2238.0
3.0
-22.9-32.0
- 3 . 0-16.0- 4 . 0
-15.0
- 1 7 6
Switz-er-
land
—86 8-29 .9
10.0- 5 . 6
—40 0- 3 8 . 0- 1 5 . 0
22.5
—5 0—10 0- 2 0 . 0- 5 . 0
— 13 0
—25.0
- 1 5 . 0
22 5
OtherEurope1
—7 427.386.65.8
2_i59 9- 6 8 . 0—60.1—29.3
— 13 7— 11.2
2 -119 .1-15 .9
— 12 4— 11.9
3 . 4—47.1
—44.3—11.2
—3 5— 1.1
— 10 1
-19 .3
Canada
36 8337.9311.2
3 4-100.0
— 10.07.2
3 4
— 100 0
-10 .0
6 9. 3
Argen-tina
—224.9153.2727.5114.1
—49 9
-20 .0
-49 .9
—49 9
-20 .0
Cuba
—85.0-30 .0-65 .0-10 .0— 10 0
28.2-20 .0
-10 .0
8.220 0
—20 0
Mexico
—23.836.945.461.6
— 16 1-118.2-60 .2
87.7
2 37.9
—11.3- 1 5 . 0
- 1 5 . 8
- 4 0 . 5—61 9
— 124 464 1
11 3101.4
- 2 5 . 0
NET GOLD PURCHASES BY THE UNITED STATES,BY COUNTRIES—Continued
[Negative figures indicate net sales by the United States]
(In millions of dollars at $35 per fine troy ounce)
Year orquarter
19451946194719481949195019511952
1949
Jan -M!ar.Apr.-JuneJuly-Sept,Oct.-Dec
1950
Jan.-MarApr.-June .July-SeptOct.-Dec
1951
Jan.-MarApr.-JuneTulv-SeDtOct -Dec. . .
1952
Jan.-MarAnr -TuneTulv-SeDt.Oct -Dec
Uru-guay
- 3 7 . 9- 4 . 925.110 7
- 1 4 . 4—64 8
22 214.9
3.6- 1 6 . 5
— 1.0
- 1 2 . 0—2 0
- 2 3 . 9- 2 6 . 9
- 5 0 . 915.028.030 1
10.0
4 8
Vene-zuela
- 7 3 . 1—9.2- 3 . 7
-108.0- 5 0 . 0
— .9
-50.6
— .9
OtherLatinAmer-
ica
- 2 7 . 825.079.113.4
- 7 . 5— 17.2— 17.2- 2 5 . 1
3 63 .7
- 2 . 9- 1 1 . 9
— 10.4— .9— .1
- 5 . 9
-11.7- 5 . 0
3.5- 4 . 0
-17.6-7 .4—2.0
2 . 0
Asiaand
Oceania
3-188.313.7
1.0- 4 . 1
-52.1-35 4
5—50.1- 4 . 8
—2.3-6 .6-2 .2
—41.0
.21.0
-13.9-22.8
-18.8-2 .4- 3 . 9
-25.0
-3 .2-2 .4
.4
. 3
Unionof
SouthAfrica
94.3256.0498.6195.713.152.111.5
72 055.648.119.9
3 . 99 .2
12.720.319.2
4.37.2
Allother
3.722.911.9
6 . 9-1 .6
4 -47 .24-84.0
- 2 . 0
.1
.1- 2 . 0
.2
-26.9- 2 . 8
-14.7- 2 . 8
-28.0-25.0-31.0
— .1- 1 . 9
1 Includes Bank for International Settlements.2 Includes sale of 114.3 million dollars of gold to Italy.3 Includes sales of 185.3 million dollars of gold to China.4Includes sales of gold to Egypt as follows: 1950, 44.8 million
dollars; and 1951, 76.0 million.5 Includes sales of 45.0 million dollars of gold to Indonesia.
ANALYSIS OF CHANGES IN GOLD STOCK OF
UNITED STATES
[In millions of dollars]
Period
19421943194419451946194719481949195019511952
1952—Apr...May. .June..July...Aug.. .Sept...Oct....Nov...Dec...
1953—Tan. . .Feb. . .Mar.. .Apr.. .
Gold stock atend of period
Treas-ury
22,72621,93820,61920,06520,52922,75424,24424,42722,70622,69523,186
23,29723,29623,34623,35023,34423,34223,33923,33723,186
22,98622,66222,563
P22,562
Total 1
22,73921,98120,63120,08320,70622,86824,39924,56322,82022,87323,252
23,45023,50223,53323,53623,52823,52523,52123,50423,252
23,07922,75122,649
P22.639
Increasein total
goldstock
-23.0-757.9
-1,349.8-547.8
623.132,162.11,530.4
164.6-1,743.3
52.7378.9
22.051.930.53.8
- 8 . 0- 2 . 8-4 .4
-16.9-252.6
-172.8-327.5-102.5P - 1 0 . 1
Netgold im-port orexport
315.768.9
-845.4-106.3
311.51,866.31,680.4
686.5-371.3-549.0
684.3
96.627.236.624.53.1
33.383.5
.38.1
-2.2-2.0
r«)(4)
Ear-marked
gold: de-creaseor in-crease( - )
-458.4-803.6-459.8-356.7
465.4210.0
-159.2-495.7
-1,352.4617.6
-304.8
-75.427.119.3
-31.4—32.6-13.8-92.4-29.0
-263.2
-171.7-324.1-106.55 -16 .8
Domes-tic goldproduc-tion2
125.448.335.832.051.275.870.967.380.166.367.8
5.05.15.56.46.56.26.86.05.9
4.54.35.2
P Preliminary.xSee footnote 2 on opposite page.2Yearly figures through 1951 are estimates of United States Mint.
Figures for 1952 and 1953 are estimates of American Bureau of MetalStatistics.
3 Change includes transfer of 687.5 million dollars gold subscrip-tion to International Monetary Fund.
4 Not yet available.5 Gold held under earmark at the Federal Reserve Banks for foreign
account, including gold held for the account of international institu-tions, amounted to 5,932.2 million dollars on Apr. 30, 1953. Goldunder earmark is not included in the gold stock of the United States.
NOTE.—For back figures and description of statistics, see Bankingand Monetary Statistics, Table 156, pp. 536-538, and pp. 522-523.
MAY 1953 565
Digitized for FRASER http://fraser.stlouisfed.org/ Federal Reserve Bank of St. Louis

INTERNATIONAL MONETARY FUND AND INTERNATIONAL BANKFOR RECONSTRUCTION AND DEVELOPMENT
(End-of-month figures. In millions of dollars]
International Fund
GoldCurrencies (balances with depositories
and securities payable on demand):United StatesOther
Unpaid balance of member subscriptions,Other assetsMember subscriptionsAccumulated net income
Net currency purchased1
(Cumulative—millions of dollars)
Australian poundsBelgian francsBrazilian cruzeirosChilean pesosCzechoslovakian koruny.Danish kronerEgyptian poundsFinnish markkaaFrench francaIndian rupeesIranian rialsNetherlands guilders....Turkish lirasPounds sterlingYugoslav dinarsAllother
Total.
1953
Jan.
1,692
1,2884,3951,354
18,737
- 8
1952
Oct.
1,691
1,2934,3901,354
18,737
- 7
July
1,537
1,3194,420
8691
8,154- 7
1953
Mar.
50.011.437.5
6.010.2
- 5 . 5.5
125.0100.0
8.848.110.0
300.09.0
- 1 . 6
Feb.
50.011.418.8
6.010.2
- 5 . 54
125.0100.0
8.848.110.0
300.09.0
- 1 . 6
Jan.
50.011.437.5
1.86.0
10.2- 5 . 5
4125.0100.0
8.848.110.0
300.09.0
- 1 . 6
711.4 694.5 715.0 771.7
Jan.
1,531
1,3224,408
8831
8,152-7
1952
Mar.
20.011.4
103.05.46.010.2-5.5
125.0100.08.875.25.0
300.09.0
-1.7
International Bank
GoldCurrencies (balances with depositories
and securities payable on demand):United States ,Other
Investment securities (U. S. Govt. obli-gations)
Calls on subscriptions to capital stock a . .Loans (ind. undisbursed portions and
incl. obligations sold under Bank'sguarantee) ,
Other assetsBonds outstandingLiability on obligations sold under guar-
anteeLoans—undisbursedOther liabilitiesGeneral reserveSpecial reserveCapital2
1953
Mar.
31,033
4463
1,44517
556
66404
97135
1,807
1952
Dec. Sept. Mar.
101.040
4954
1,40913
568
66423
96632
1,807
131,035
4724
1,33015
496
59407
76330
1,807
5940
4904
1,18614
450
41372
55526
1,691
iAs of Mar. 31, 1953, the Fund had sold 870.2 million U. S. dollars;in addition, the Fund sold to the Netherlands 1.5 million poundssterling in May 1947 and 30.0 million Belgian francs in May 1948, soldto Norway 200 million Belgian francs in June and July 1948, and soldto Brazil 10 million pounds sterling in January 1951. Repurchasesamounted to 204.2 million dollars. Currencies the net transactions inwhich amount to less than one million are reported under "All other."
2 Excludes uncalled portions of capital subscriptions, amounting to7,229 million dollars as of Mar. 31, 1953, of which 2,540 million repre-sents the subscription of the United States.
CENTRAL BANKS
Bank of England
(Figures in millions ofpounds sterling)
1943—Dec. 291944—Dec. 271945—Dec 261946—Dec. 251947—Dec 31194g—Dec. 291949—Dec. 28 .1950—Dec 271951—Dec. 26
1952—Apr. 30May 28June 25July 30Aug. 27Sept. 24 . . .Oct. 29Nov 26Dec. 31
1953—Jan. 28Feb. 25Mar. 25
Assets of issuedepartment
Gold*
.2
.22
.2
.2
.2
.4
.4
.4
.4
.4
.4
.4
.4
.4
.4
.4
.4
.4
.4
.4
Otherassets2
1.100.01,250.01,400 01,450.0L,450.0L,325.01,350.01,375.01,450.0
1,450.01,450.0L,500.01,550.01,500.01,500.01,500.01,500.0L.575.0
41,500.01,500.0
41,550.0
Assets of bankingdepartment
Notesandcoin
12.513.520.723.4
100.836.133.719.214.1
41.939.759.836.843.057.857.740.551.3
52.937.363.3
Dis-counts
and ad-vances
2 . 55.18.4
13.615.216.714.829.218.2
27.411.921.221.6
7 .25 . 29 . 39 . 9
11.2
6 . 57 .16 .2
Securi-ties
307.9317.4327.0327.6331.3401.1489.6384.0389.2
306.1319.6309.6319.7324.4333.5324.8357.6371.2
343.2389.9359.0
Notecircula-tion3
1.088.71,238.6L.379.91,428.21,349.71,293.1L.321.91,357.71,437.9
1,410.01,412.21,442.1L.515.11,459.01,444.11,444.21,461.41,525.5
1,448.9L.464.71,488.8
Liabilities of banking department
Deposits
Bankers'
234.3260.7274.5278.9315.1314.5299.2313.5299.8
273.0270.0275.7262.0252.4275.7271.6275.4302.8
274.5292.6288.3
Public
10.35.25.3
10.318.611.711.615.413.4
10.710.110.610.416.011.113.515.410.0
11.59 . 8
14.6
ECA
17.497.9
. 4
.6
.5
.513.618.223.024.222.226.624.3
32.244.632.0
Other
60.452.358 557.395.592.1
111.285.089.8
73.472.672.569.264.867.066.772.678.5
66.168.875.0
Otherliabili-
ties andcapital
17.917.817.818.118.118.118.118.118.1
17.818.018.118.318.418.517.818.018.1
18.318.418.5
2On June 9, 1945, the official buying price of the Bank of England for gold was increased from 168 shillings to 172 shillings and threepenceper fine ounce, and on Sept. 19, 1949, it was raised to 248 shillings. For details regarding previous changes in the buying price of gold and forinternal gold transfers during 1939, see BULLETIN for March 1950, p. 388, footnotes 1 and 4.
2Securities and silver coin held as cover for fiduciary issue, the amount of which is also shown by this figure.3Notes issued less amounts held in banking department.4Fiduciary issue decreased by 50 million pounds on Jan. 7 and 25 million on Jan. 14, and increased by 50 million on Mar. 25. For details
on previous changes, see BULLETIN for February 1953, p. 194.NOTE.—For back figures, see Banking and Monetary Statistics, Table 164, pp. 638-640; for description of statistics, see pp. 560-561 in same
publication.
566 FEDERAL RESERVE BULLETIN
Digitized for FRASER http://fraser.stlouisfed.org/ Federal Reserve Bank of St. Louis

CENTRAL BANKS—Continued
Bank of Canada
(Figures in millions ofCanadian dollars)
Assets
Gold
Sterlingand United
Statesdollars
Dominion and provin-cial government
securities
Short-term1 Other
Otherassets
Liabilities
Notecirculation2
Deposits
Charteredbanks
Dominiongovern-
mentOther
Otherliabilities
andcapital3
1940—Dec. 31.1941—Dec. 31.1942—Dec. 31.1943—Dec. 31.1944—Dec. 30.1945—Dec. 31.1946—Dec. 31.1947—Dec. 31.1948—Dec. 31.1949—Dec. 31.1950—Dec. 30.1951—Dec. 31.
1952- -Apr. 30.May 31.June 30.July 31.Aug. 29.Sept. 30.Oct. 31.Nov. 29.Dec. 31.
1953—Jan. 31.Feb. 28.Mar. 31.
38.4200.9
.5
.6172.3156.81.02.0.4
74.1111.4117.8
72.378.343.863.074.973.542.867.677.1
64.372.065.5
448.4391.8807.2787.6906.9
,157.3,197.4,022.0,233.7,781.4,229.3,141.8
,191.5,203.6,251.3,280.0,303.2,263.7
1,286.71,214.31,459.8
1,351.21,411.91,371.0
127.3216.7209.2472.8573.9688.3708.2858.5779.1227.8712.5
1,049.3
874.7824.6817.8843.9852.9870.9896.1957.3767.2
803.0817.5810.9
12.433.531.347.334.329.542.143.745.442.5
297.1135.2
84.073.876.171.269.770.8
103.472.377.3
82.388.879 A
359.9496.0693.6874.4
1,036.01,129.11,186.21,211.41,289.11,307.41,367.41,464.2
1,411.81,417.41,441.81,458.31,464.41,476.51,485.61,498.81,561.2
1,479.61,472.81,493.4
217.7232.0259.9340.2401.7521.2565.5536.2547.3541.7578.6619.0
645.7579.4578.0595.5614.7588.2668.8607.3626.6
603.1668.0601.1
10.973.851.620.512.9
153.360.568.898.130.724.794.9
14.321.926.851.652.030.718.815.016.2
40.588.660.6
9.56.0
19.117.827.729.893.867.581.0
126.9207.166.1
41.744.648.541.647.449.456.065.144.5
47.651.466.5
28.535.124.055.4
209.1198.542.742.443.1
119.2172.6200.0
109.0117.193.9
111.2122.1134.099.8
125.2132.9
130.1109.3105.1
Bank of France
(Figures inmillions of francs)
Assets
GoldsForeign
ex-change
Domestic bills
Openmarket6 Special Other
Advances toGovernment6
Current Other
Otherassets 6
Liabilities
Notecircula-
tion
Deposits7
Govern-ment
9841 517
770578748
12,048765733806
1,1687029
843936551383251027
565510
ECA
1510
6
9
810
3
,058,587
341,645730816
,039539
,392,887897
730,479498
Other
27,20225 27229,93533,13737,85557,75563,46882,479
171 783158,973161,720166,226
156,326171,350143,900121,411137,403129,755158,275139,480137,727
128,731146,509128,788
Otherliabil-itiesand
capital
1940—Dec. 26.1941—Dec. 31.1942—Dec. 31.1943—Dec. 30.1944—Dec. 28.1945—Dec. 27.1946—Dec. 26.1947—Dec. 31.1948—Dec. 30.1949—Dec. 29.1950—Dec. 28.1951—Dec. 27.
1952- -Apr. 30.May 29.June 26.July 31.Aug. 28.Sept. 25.Oct. 30.Nov. 27.Dec. 31.
1953—Jan. 29.Feb. 26.Mar. 26.
84,61684,59884,59884,59875,151
129,81794,81765,22565,22562,274
182,785191,447
191,447191,447191,447191,447194,943194,943194,943198,439200,187
200,187200,187200,187
42383737426871230
61,943162,01728,320
13,63415,80816,99120,07723,43527,61328,81530,41331,068
16,04016,50216,734
7,8026,8128,4209,51812,17017,98037,61867,39597,447137,689136,947234,923
273,149274,111254,301258,560257,589270,264283,717274,454274,003
262,363263,286252,386
66112
1692948
3033,135
648,57728,54834,08131,956
22,98426,12821,87111,77914,40431,78448,08952,22557,042
55,68148,65841,544
3,6464,5175,3687,54318,59225,54876,254117,826238,576335,727393,054741,267
799,004841,897831,044835,599854,081812,416872,793851,545937,459
915,903929,291911,458
63,90069,50068,25064,40015,850
67,900147,400150,900157,900158,900160,000
171,100169,000168,000167,800168,600166,300171,100172,000172,000
175,000185,300199,400
112,317182,507250,965366,973475,447445,447480,447558,039558,039560,990481,039481,039
500,982479,982479,982479,982479,982479,982479,982479,982479,982
501,982504,982504,982
18,57117,42416,99016,60120,89224,73433,13359,02457,622112,658212,822190,830 1
139,747118,726110,501184,957169,852171,274161,989154,146159,727
124,578121,445122,995
218,383270,144382,774500,386572,510570,006721,865920,831987,621,278,211,560,561,841,608
,925,615,900,526,885,929,984,549,969,553,962,270,024,943,006,873,123,514
,065,210,067,257
2,051,991
844,986868,474821,318815,5967,0784,0877,21310,94216,20619,37724,23441,332
29,67938,53943,54143,36946,87861,93049,79255,95449,305
57,00852,35068,399
Securities maturing in two years or less.2Includes notes held by the chartered banks, which constitute an important part of their reserves.3 Beginning November 1944, includes a certain amount of sterling and United States dollars.*On May 1, 1940, gold transferred to Foreign Exchange Control Board in return for short-term Government securities (see BULLETIN for
July 1940, pp. 677-678).6For details on devaluations and other changes in the gold holdings of the Bank of France, see BULLETIN for September 1951, p. 1211; Sep-
tember 1950, pp. 1132 and 1261; June 1949, p. 747; May 1948, p. 601; May 1940, pp. 406-407; January 1939, p. 29; September 1937, p. 853;and November 1936, pp. 878-880.
6For explanation of these items, see BULLETIN for January 1950, p. 117, footnote 6.7 Beginning January 1950, when the Bank of France modified the form of presentation of its statement, the figures under this heading are
not strictly comparable with those shown for earlier dates.8Includes the following amounts (in millions of francs) for account of the Central Administration of the Reichskreditkassen: 1940, 41,400;
1941, 64,580; 1942, 16,857; 1943, 10,724.NOTE.—For back figures on Bank of Canada and Bank of France, see Banking and Monetary Statistics, Tables 166 and 165, pp. 644-645
and pp. 641-643, respectively; for description of statistics, see pp. 562-564 in same publication. For last available report from the Reichsbank(February 1945), see BULLETIN for December 1946, p. 1424.
MAY 1953 567
Digitized for FRASER http://fraser.stlouisfed.org/ Federal Reserve Bank of St. Louis

CENTRAL BANKS—Continued
Central Bank(Figures as of last report
date of month)
1953
Mar. Feb. Jan.
1952
Mar.
Central Bank(Figures as of last report
date of month)
1953
Mar. Feb. Jan.
1952
Mar.
Central Bank of the ArgentineRepublic (millions of pesos):
Gold reported separatelyOther gold and foreign exchange.Government securitiesRediscounts and loans to banki..Other assetsCurrency circulationDeposits—NationalizedOther sight obligationsOther liabilities and capital
Commonwealth Bank of Aus-tralia (thousands of pounds):
Gold and foreign exchangeChecks and bills of other banks..Securities (incl. Government and
Treasury bills)Other assetsNote circulationDeposits of Trading Banks:
SpecialOther
Other liabilities and capitalAustrian National Bank (millions
of schillings):GoldForeign exchangeLoans and discountsClaim against GovernmentOther assetsNote circulationDeposits—Banks
OtherBlocked
National Bank of Belgium(millions of francs):
Gold*Foreign claims and balances (net)Loans and discountsConsolidated Government debt..Government securitiesOther assets.Note circulationDeposits—Demand
ECAOther liabilities and capital
Central Bank of Bolivia—Mone-tary dept. (millions of bolivianos):
Gold at home and abroad2
Foreign exchange (net)Loans and discountsGovernment securitiesOther assetsNote circulationDepositsOther liabilities and capital
Central Bank of Ceylon (thousandsof rupees):
Foreign exchangeAdvances to GovernmentGovernment securities -Other assetsCurrency in circulationDeposits—Government
BanksOther liabilities and capital
Central Bank of Chile (millionsof pesos):
GoldForeign exchange (net)Net claim on Int'l. Fund4
Discounts for member banks. . . .Loans to GovernmentOther loans and discountsOther assetsNote circulationDeposits—Bank
OtherOther liabilities and capital
Bank of the Republic of Colombia(thousands of pesos):
Gold and foreign exchangeNet claim on Int'l. Fund4
Paid-in capital—Int'l. Bank
1,196262
2,32649,648
24721,25628,545
6963,184
1,117138
2,12348,913
20121,00927,547
7743,162
421,838 403,745 381,5766,893 5,322 6,275
377,285 377,810 411116,142322,918 318,918 321
,53061,637
,168
239,09554,439305,706 302,150 295
216,09556,107
187,59556,715
,541
1002,4896,3022,512
428,770
350342
1,984
35,07815,2385,606
34,6607,8373,99795,8432,799
2203,553
1002,4226,3422,403
418,818
316292
1,884
35,06916,1266,070
34,7237,6784,06496,6023,269
2093,650
1002,2396,3252,405
418,777
385259
1,689
35,44816,2726,823
34,7236,3863,80696,3012,1111,3193,729
(Dec.1952)=1,39632,7461,8402,196
5376,4811,419815
360,699 395,142 40591,100107,4862,508
394,5183,033
127,12037,122
,600,331,010
818500840500 147
,35289,00080,7453,349
185,5987,013,997
37,838
1,326356387
1,8494,0599,6223,00413,4473,457
4353,264
1,248161332
1,7084,0598,2802,69912,4882,635
4222,941
334,457 31824,3731,434
,49524,3746,582
1,24784
2772,1364,0597,4472,82712,2192,409
5422,906
299,18524,3737,164
814806
2,10843,441
32717,18426,564
8962,851
321,4756,513
598,898111,271297,471
434,17030,219276,297
98667
6,4243,335
418,222
314293
1,736
31,18724,7855,795
34,7638,0073,663
93,1381,5531,24112,267
1,370746
1,3501,843261
4,157748666
600,69222,9643,5263,809
402,51423,197161,64143,638
1,215270107
1,935670
6,7193,1408,8612,435
3202,440
243,88524,3717,132
Bank of the Republic of Colom-bia—Cont.
Loans and discountsGovernment loans and securities.Other assetsNote circulationDepositsOther liabilities and capital
Central Bank of Costa Rica(thousands of colones):
GoldForeign exchangeNet claim on Int'l. Fund*Loans and discountsSecuritiesOther assetsNote circulationDemand depositsOther liabilities and capital
National Bank of Cuba(thousands of pesos):
GoldForeign exchange (net)Foreign exchange (Stabilization
Fund)SilverNet claim on Int'l. Fund*Loans and discountsCredits to GovernmentOther assetsNote circulationDepositsOther liabilities and capital
National Bank of Czechoslovakia 5
National Bank of Denmark(millions of kroner):
GoldForeign exchangeContributions to Int'l. Bank . . . .Loans and discountsSecuritiesGovt. compensation account. . . .Other assetsNote circulationDeposits—Government
OtherOther liabilities and capital
Central Bank of the DominicanRepublic (thousands of dollars):
Foreign exchange (net)Net claim on Int'l. Fund *Paid-in capital—Int'l. BankLoans and discountsGovernment securitiesOther assetsNote circulationDemand depositsOther liabilities and capital
Central Bank of Ecuador(thousands of sucres):
GoldsForeign exchange (net)6
Net claim on Int'l. Fund*Credits—Government
OtherOther assetsNote circulationDemand deposits—Private banks
OtherOther liabilities and capital
National Bank of Egypt (thou-ands of pounds):
Gold/Foreign exchangeForeign and Egyptian
Government securitiesLoans and discountsAdvances to GovernmentOther assetsNote circulationDeposits—Government
OtherOther liabilities and capital
36917582
53338272
11111
7.684
24,1416421
627566795702066484
511153031848819403683730352
,956 365384,176,54788,197
537,959392,280 34468,912
,286174,75982,176
538,879,151
69,914
511301031314125968865559826
69775
69736
11,51187,0097,031
84,0517,125
23,360132,54767,08620,454
213,74858,276
135,47133,38012,51150,48946,91843,248411,899170,86611,275
69780
338.220,18,
275,162,162,550,178225,224
118446,310185,889,443,401171
07660425043798689657587036494
102442
3,314355
1,8491,4811,514
175
12,07617,2181,250
431,0169,8482,198
33,5158,6501,485
98443
3,347178
1,8631,5221,344
186
12,07618,8741,250
431,2177,1542,23633,9557,4231,472
966 338560 233
18757635940
636 205387
880 338,818230,23118,757
235,939 224,333153,079155,425544,911189,847180,013
210,347 205,873
148,151536174
851757
466365589448875
310,10,
60,55319,513
2.191
76128
8
756 3231244499
349429889163 20
383940372175661177658440
60,55320,817
299,01219,0923,3615,803
200,57480,510107,56219,993
265,349155,495119,421457,435297,39260,827
11,51186,1887,031
61,9137,619
24,409115,84464,18618,641
320,56465,299
120,94840,35112,51116,37912,27727,294409,770198,0267,826
6941211
100328
3,872219
1,6881,8211,357
146
12,06620,2271,250
41220
6,895720
29,9129,7361,771
335,96553,75818,758
236,060181,719178,322472,219145,923139,047247,392
60,55318,456
311,80227,224
2,873190,04497,443112,47820,943
* Latest month available.*On Aug. 17, 1950, gold reserve revalued from .0202765 to .0177734 grams of fine gold per franc.2It is understood that, beginning June 1950, gold reserves have been revalued at a rate of 60 bolivianos per dollar.3 Represents chiefly bills secured by stocks of mined tin not yet sold in world markets.4This figure represents the amount of the bank's subscription to the Fund less the bank's local currency liability to the Fund. Until such time
as thr Fund engages in operations in this currency, the "net claim" will equal the country's gold contribution,5For last available report (March 1950), see BULLETIN for September 1950, p. 1262.6 In December 1950/gold and foreign exchange holdings revalued from 13.50 to 15.00 sucres per dollar.7 Beginning April 1951, gold previously held in Issue Department revalued from 7.4375 grams of fine gold to 2.55187 grams of fine gold per Egyp-
tian pound.NOTE.—For details relating to individual items in certain bank statements, see BULLETIN for January 1953, p. 78; January 1952, p. 102; January
1951, p. 112; and January 1950, p. 118.
568 FEDERAL RESERVE BULLETIN
Digitized for FRASER http://fraser.stlouisfed.org/ Federal Reserve Bank of St. Louis
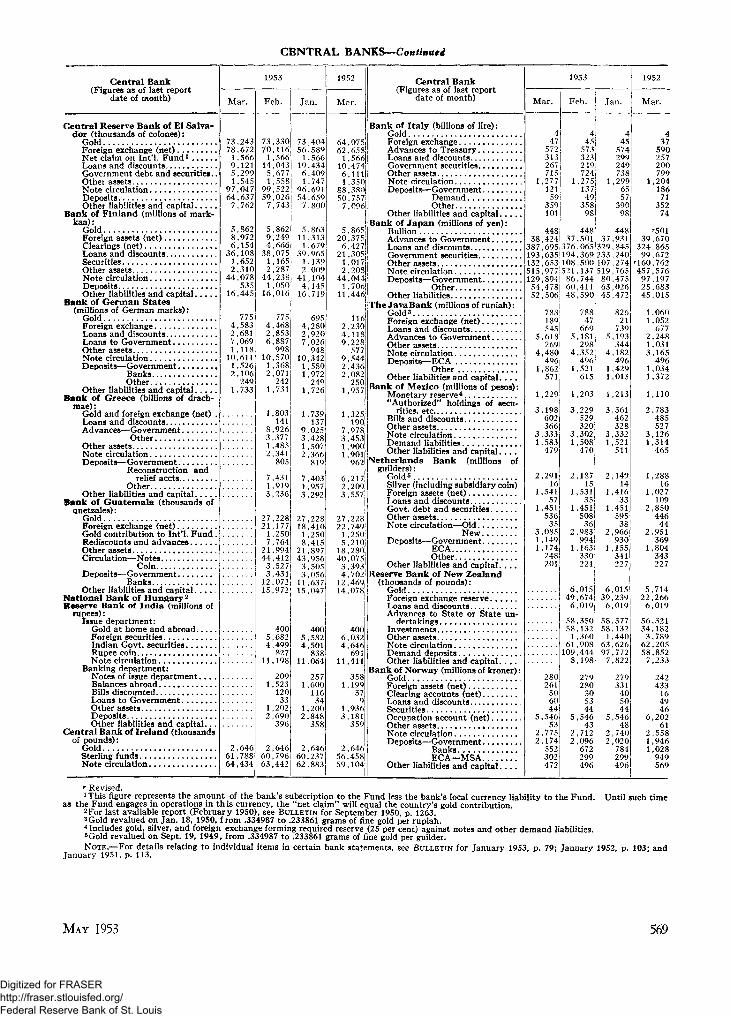
CENTRAL BANKS—Continued
Central Bank(Figures as of last report
date of month)
Central Reserve Bank of El Salva-dor (thousands of colones):
GoldForeign exchange (net)Net claim on Int'l. Fund1
Loans and discounts .• ;••-Government debt and securities..Other assetsNote circulationDepositsOther liabilities and capital
Bank of Finland (millions of mark-kaa):
GoldForeign assets (net)Clearings (net)Loans and discountsSecuritiesOther assetsNote circulationDepositsOther liabilities and capital
Bank of German States(millions of German marks):
GoldForeign exchangeLoans and discountsLoans to GovernmentOther assetsNote circulationDeposits—Government
BanksOther
Other liabilities and capitalBank of Greece (billions of drach-
mae):Gold and foreign exchange (net) .Loans and discountsAdvances—Government
OtherOther assetsNote circulationDeposits—Government
Reconstruction andrelief accts
OtherOther liabilities and capital
Bank of Guatemala (thousands ofquetzales):
GoldForeign exchange (net)Gold contribution to Int'l. Fund .Rediscounts and advancesOther assetsCirculation—Notes
CoinDeposits—Government
BanksOther liabilities and capital
National Bank of Hungary 2
Reserve Bank of India (millions ofrupees):
Issue department:Gold at home and abroadForeign securitiesIndian Govt. securitiesRupee coinNote circulation
Banking department:Notes of issue depar tment . . . .Balances abroadBills discountedLoans to GovernmentOther assetsDepositsOther liabilities and capital . . .
Central Bank of Ireland (thousandsof pounds):
GoldSterling fundsNote circulation
1953
Mar.
73,24378,6721,5669,1215,2991,545
97,04764,6377,762
5,8628,9726,154
36,1081,6522,310
44,078535
16,445
Feb. Jan.
73,33070,116
1,56614,0435,6771,558|
99,522159.0261
7,743!
5,8629,2494,6661
38,075j1,1652,287
44,238i1,050
16,016I
7754,5832,6817,0691,118
10,6111,5262,106
2491,733
2,64661,78864,434
7754,4682 ,8536,887
99810,570
1,3682,071
2421,731
1,803141
8,9263,3771,4852,341
805
7,4311,9193,236
I
73,40456,5891,566
19,4346,4091.747
96,69154,6597,800
5,86311,3131,679
39,9651,1392,009
41,1044,14516,719
6954,2802,9207,026948
10,3421,5801,972249
1,726
1,739137
9,0253,4281,5072,366
819
7,4031,9573,292
27,22821,177
1,2507,764!
21,994144,4121
3.52 7J3,431j
12,072115,972!
4 0015,6821
27,22818,410
1,2508,415
21,89743,956
3,5053,056
11,63715,047
1952
82711,1981
2091,523
12033
1,2022,690
396
2,64660,79663,442
4005,5824,501
83811,064
2571,600
11634
1,2002,848
358
2 ,64660,23762,883
Mar.
, 075!, 658,566,474,111,350,380,757i, 096
,865;,375!,427,305, 0 1 .,2081,044,706|,446;
Central Bank(Figures as of last report
date of month)
116!,230,118,228!577
, 544, 436,082250|
1,957!
j
,325190
,978,453,900,901962
,217,209,557
228!7491250210280075393702469|078!
400,032,646691
,411
358, 199!
379
,936,181359
646458!104;
nk of Italy (billions of lire):GoldForeign exchange ,Advances to Treasury ,Loans and discounts ,Government securities ,Other assets ,Note circulationDeposits—Government
DemandOther ,
Other liabilities and capitalBank of J apan (millions of yen):
BullionAdvances to GovernmentLoans and discountsGovernment securitiesOther assetsNote circulationDeposits—Government
OtherOther liabilities
The Java Bank (millions of rupiah):Gold3Foreign exchange (net)Loans and discountsAdvances to GovernmentOther assetsNote circulationDeposits—ECA
OtherOther liabilities and capital
Bank of Mexico (millions of pesos):Monetary reserve4
"Authorized" holdings of secu-rities, etc
Bills and discountsOther assetsNote circulationDemand liabilitiesOther liabilities and capital
Netherlands Bank (millions ofguilders):
Gold6 .Silver (including subsidiary coin)Foreign assets (net)Loans and discountsGovt. debt and securitiesOther assetsNote circulation—Old
NewDeposits—Government
ECAOther
Other liabilities and cap i t a l . . . .Reserve Bank of New Zealand
(thousands of pounds):GoldForeign exchange reserveLoans and discountsAdvances to State or State un-
dertakingsInvestmentsOther assetsNote circulationDemand depositsOther liabilities and capital
Bank of Norway (millions of kroner):GoldForeign assets (net)Clearing accounts (net)Loans and discountsSecuritiesOccupation account (net)Other assetsNote circulationDeposits—Government
BanksECA—MSA
Other liabilities and c a p i t a l . . . .
1953
Mar. Feb. Jan.
447
572313;267715
4i45!
573i323!249!724!
1,277 1,27512V 137
49358i
59 i359101
448!38,424i 37
387,695|376193,6351194132,6531108515,9771521129,894| 8654,478 6052,506| 48
98i
448,501
445
574299249738
1,2996557i
39098!
1952
Mar.
44837,931
.065 329,845,3691233,240,5OO|lO7,274,1371519,765.744! 80,475,4111 63,026,590 45,472
189!545|
5,618j269!
4,480496
1,862571
1,229
3,198602366!
3,3331,583
479
2,29116
1,54157
1.451536
353,0851,1491,174
248201
788'47 i
669!5,181
2984,352
4961l,52li
615|
82621
7395,193
3444,182
4961,4291,015
l ,203J 1,213
3,229;529320
3,3021,508
470
2,18715
1,531
1,451I508
362,983
994!1,163!
330;221|
6,01549,674
6,019
3,361462328
3,3321,521
511
437
590257200799
1,20418671
35274
'50139,670
324,86599,672
-•160,762457,576
97,19725,68345,015
1,0601,052
6772,2481,0313,165
4961 ,0341,372
1,110
2,783485527
3,1261,314
465
2,149!14
1,41633
1,451595
382,966
9301,155
341227
6,01539,239
6,019
58,350j 58,37758,132i 58,132
1,360! 1,44061,9081 63,626
109,444 97,7728,198 7,822
280261
3060144
5,54653
2,7752,174
552302472
279280
305344!
5,54643
2,7122,096j
672299496
279331
405044
,54648
,740,020784299496
1,28816
1,027109
2,850446
442,951
3691,804
343227
5,71422,266
6,019
56,32134,182
3,78962,20558,852
7,233
242433
164946
6,20261
2,5581,9461,028
949569
r Revised.1 This figure represents the amount of the bank's subscription to the Fund less the bank's local currency liability to the Fund. Until such time
as the Fund engages in operations in this currency, the "net claim" will equal the country's gold contribution.2For last available report (February 1950), see BULLETIN for September 1950, p. 1263.3Gold revalued on Jan. 18, 1950, from .334987 to .233861 grams of fine gold per rupiah.4 Includes gold, silver, and foreign exchange forming required reserve (25 per cent) against notes and other demand liabilities.6Gold revalued on Sept. 19, 1949, from .334987 to .233861 grams of fine gold per guilder.NOTE.—For details relating to individual items in certain bank statements, see BULLETIN for January 1953, p. 79; January 1952, p. 103; and
January 1951, p. 113.
MAY 1953 569
Digitized for FRASER http://fraser.stlouisfed.org/ Federal Reserve Bank of St. Louis

CENTRAL BANKS—Continued
Central Bank(Figures as of last report
date of month)
1953
Mar. Feb. Jan.
1952
Mar.
Central Bank(Figures as of last report
date of month)
1953
Mar. Feb. Jan.
1952
Mar.
State Bank of Pakistan (millions ofrupees):
Issue department:Gold at home and abroad...Sterling securitiesPakistan Goyt. securities. .Goyt. of India securities. . .India currencyRupee coinNotes in circulation
Banking department:Notes of issue department..Bills discountedLoans to GovernmentOther assetsDepositsOther liabilities and capital..
Central Bank of Paraguay(thousands of guaranies):
GoldForeign exchange (net)Net claim on Int'l. Fund1
Paid-in capital—Int'l. BankLoans and discounts •.-.•••Government loans and securities.Other assetsNote and coin issueDeposits—Government
OtherOther liabilities and capital
Central Reserve Bank of Peru(millions of soles):
Gold and foreign exchange 2 . . . .Net claim on Int'l. Fund *Contribution to Tnt'l. BankLoans and discounts to banks. . .Loans to GovernmentOther assetsNote circulationDepositsOther liabilities and capital . . . .
Central Bank of the Philippines(thousands of pesos):
GoldForeign exchangeNet claim on Int'l. Fund *LoansDomestic securitiesOther assetsNote circulationDemand depositsOther liabilities and capital
Bank of Portugal (millions ofescudos):
GoldForeign exchange (net)Loans and discountsAdvances to GovernmentOther assetsNote circulationDemand deposits—Government..
ECAOther
Other liabilities and capitalSouth African Reserve Bank
(thousands of pounds):Gold3
Foreign billsOther bills and loansOther assetsNote circulationDepositsOther liabilities and capital
Bank of Spain (millions of pesetas):GoldSilverGovernment loans and securities.Other loans and discounts
81418
1,144126300
662,087
486
43519501115
81416
,146126300
67,053
83
81416
1,146126300
662,038
98
23525522108
518505112
,138,580
11,032,176
1,13866,765
11-1 ,02090,176
643 316,535165,155
757 366,29658,997
123,12390,347
686294128
53267
2317941171
,370404257
563672
314912168,353421253
184532954235148571229139
552 18,552988 432,807
29,50454,140235,233148,279561,631
299 219,305137,579
504140142842417
451
1,
570359
15,80122,423
,157,896,186,626,468,178,219
570366,810,227
4,55311,583
928,425499
9,1061,690
96,1632,020
58,43762,88814,80437,99887,49866,63919,991
563369
15,57624,762
811,01771512630066
2,214
91103
76386592
647212
214788263
1,206383345
14,980471,86429,50441,473239,681148,306568,727243,327133,753
4,44811,748
6461,421579
8,9381,543
526,2072,103
59,77869,75118,15333,60282,67676,31722,292
55;378
15,76'20,20:
Bank of Spain—Cont.Other assetsNote circulationDeposits—Government
OtherOther liabilities and capital
Bank of Sweden (millions of kronor):GoldForeign assets (net)Net claim on Int'l. Fund1
Paid-in capital—Int'l. BankSwedish Govt. securitiet and ad-
vances to National Debt Office4
Other domestic bills and advancesOther assetsNote circulationDemand deposits—Government..
OtherOther liabilities and capital
Swiss National Bank (millions offrancs):
GoldForeign exchangeLoans and discountsOther assetsNote circulationOther sight liabilitiesOther liabilities and capital
Central Bank of the Republic ofTurkey (millions of pounds):
GoldForeign exchange and foreign
clearingsLoans and discountsSecuritiesOther assets..Note circulationDeposits—Gold
OtherOther liabilities and capital
Bank of the Republic of Uruguay(thousands of pesos):
GoldSilverPaid-in capital—Int'l. BankAdvances to State and Govern-
ment bodiesOther loans and discountsOther assetsNote circulationDeposits—Government
OtherOther liabilities and capital
Central Bank of Venezuela (mil-lions of bolivares):
GoldForeign exchange (net)Other assetsNote circulationDepositsOther liabilities and capital
Bank for International Settle-ments (thousands of Swiss goldfrancs):
Gold in barsCash on hand and with banks. . .Sight funds at interestRediscountable bills and accept-
ances (at cost)Time funds at interestSundry bills and investments. . . .Funds invested in GermanyOther assetsDemand deposits (gold)Short-term deposits:
Central banks—Own account..Other
Long-term deposits: SpecialOther liabilities and capital
29,89037,303
1,8144,128
25,798
4291,241
12913
2,404322734
4,311343
53563
5,911467225
764,8061,677
196
402
2061,691
26112
1,239153765280
29,53337,033
2,4404,604
25,429
4281,320
12912
2,665294717
4,365371286542
5,905464219
704,7871,672
199
402
212,709
26124
,272153791258
31,72937,140
2,2504,544
29,066
4291,313
12912
2,666301729
4,350525192514
,907469224
67,784,686197
1,1417198
955266
88
,14110294
971269
97
402
1511,760
26136
1,240172801262
(Nov.)*310,763
9,358314
130,018357,441500,928370,836
93,116315,113529,757
1,14113292
976274115
712,617 656,518 65750,748
7,57157,35510,699
,02962,167
7,480
216,548 213,287 26745,557
227,165297,201
1,316476,315 463,460 501
39,536232,297,201
1,425
,01578,467
606 290,229297,201
1,386,011
518,40160,783
228,909 228,909 228274,314 273,880 273
476,330 61266,047
,11245,506
,909,436
26,47535,599
2,4542,346
22,976
4721,328
8811
2,439279851
3,919866
84598
5,920246234
764,5911,692
193
419
1341,464
2793
1,136153657191
321,1199,650
313
157,620343,998426,435365,300
81,052303,566509,218
1,141- 2 2
90866264
79
438,45391,161
3,857
155,46117,864
233,434297,201
1,628305,025
359,26876,357
228,909269,500
* Latest month available.JThis figure represents the amount of the bank's subscription to the Fund less the bank's local currency liability to the Fund. Until such time
as the Fund engages in operations in this currency, the "net claim" will equal the country's gold contribution.2In November 1949, part of the gold and foreign exchange holdings of the bank were revalued.3On Dec. 31, 1949, gold revalued from 172 to 248 shillings per fine ounce.4 Includes small amount of non-Government bonds.NOTE.—For details relating to individual items in certain bank •tatements, see BULLETIN for January 1953, p. 80; and January 1950, p. 120.
570 FEDERAL RESERVE BULLETIN
Digitized for FRASER http://fraser.stlouisfed.org/ Federal Reserve Bank of St. Louis

MONEY RATES IN FOREIGN COUNTRIESDISCOUNT RATES OF CENTRAL BANKS
[Per cent per annum]
Dateeffective
In effect Dec. 31,1946
Jan. 10, 1947 .
Aug. 27Oct. 9June 28, 1948. .Sept. 6Oct. 1May 27, 1949July 14Oct. 6June 8, 1950. .Sept. 11Sept. 26Oct. 27Dec. 1Apr. 17, 1951..July 5Sept. 13Oct. 11Nov. 8Nov. 9Jan. 22, 1952..Mar. 12May 29 ,Aug. 1Aug. 21Dec. 18Jan. 8, 1953 . .In effect Mar. 31,
1953
Central bank of—
UnitedKing-dom
2
2K
4
4
France
if2K&3
3H&4
2K
3
4
4
Ger-many
3 *
15
*4HM
1 5
15
14
14
Bel-gium
3
3\i.
3
3
Neth-er-
lands
3
4
3
3
Swe-den
2H
3
3
Switz-er-
land
IK
IK
Centralbank of—
ArgentinaAustriaBelgiumBolivia
CanadaChileColombiaCosta Rica
DenmarkEcuadorEgyptEl Salvador...
FinlandFrance
GreeceIndia
RateMar.31
536
2
44
5103 3
41412
Dateeffective
Mar. 1, 1936Mar. 26, 1953Dec. 18, 1952Sept. 30, 1950
Oct. 17, 1950June 13, 1935July 18, 1933Feb. 1, 1950
Nov. 2, 1950May 13, 1948July 1, 1952Mar. 22, 1950
Dec. 16, 1951Nov. 9, 1951Jan. 8, 1953July 12, 1948Nov. 15, 1951Mar. 25, 1952
Centralbank of—
ItalyJapanJavaMexico
Netherlands..New Zealand.NorwayPakistan. . . .
PeruPortugal. . . .South Africa.Spain
SwedenSwitzerland..TurkeyUnited King-
domUSSR
xRate established for the Land Central banks.NOTE.—Changes since Mar. 31: Netherlands—Apr.
cent.
RateMar.31
45.843
3
3
6
I"4
\ H
44
Dateeffective
Apr. 6, 1950Oct. 1, 1951Apr. 1, 1946June 4, 1942
Aug. 1, 1952July 26, 1941Jan. 9, 1946July 1, 1948
Nov. 13, 1947Jan. 12, 1944Mar. 27, 1952Mar. 18, 1949
Dec. 1, 1950Nov. 26, 1936Feb. 26, 1951
Mar. 12, 1952July 1, 1936
7, from 3 to 2}£ per
OPEN-MARKET RATES
[Per cent per annum]
Month
Canada
Treasurybills
3 months
United Kingdom
Bankers'acceptances3 months
Treasurybills
3 months
Day-to-day
money
Bankers*allowance
on deposits
France
Day-to-day
money
Netherlands
Treasurybills
3 months
Day-to-day
money
Sweden
Loansup to
3 months
Switzer-land
Privatediscount
rate
1943—February. ,1944—February. .1945—February. ,1946—February. .1947—February. .1948—February. .1949—February. .1950—February. ,1951—February. .1952—February. .
1952—MarchAprilMayJuneJulyAugust. . . .September.October....November.December..
1953—January...February..
.51
.39
.37
.36
.40
.41
.42
.51
.73
.91
.94
.98
.02
.08
.11
.10
.14
.19
.211.35
1.351.47
1.031.031.03
.53
.53
.56
.56
.69
.691.50
2.483.003.003.003.003.003.003.003.003.00
3.003.00
1.001.001.00
.51
.51
.50
.52
.52
.51
.99
2.012.352.372.432.462.462.492.432.382.41
2.392.42
1.101.131.00
.63
.63
.63
.63
.63
.631.00
1.822.252.252.252.252.252.252.252.252.25
2.252.25
.50
.50
.50
.50
.50
.50
.50
.50
.50
.75
1.572.002.002.002.002.002.002.002.002.00
2.002.00
1.651.691.601.361.392.002.082.402.423.93
3.513.653.773.663.843.774.003.983.983.93
3.974.10
1.181.721.381.391.541.551.17
1.3840
1.251.201.05
.85
.85
.84
.87
.92
.83
.81
1.001.46
.78
.901.501.001.00
1.001.00
.90
.75
.75
.58
.62
.50
.54
.58
.54
.50
25,25.25.25.25.50.63.50.50.50
.50
.50
.50
.50
.50
.50
.50
.50
.50
.50
.50
.50
NOTE.—For monthly figures on money rates in these and other foreign countries through 1941, see Banking and Monetary Statistics, Table 172.pp. 656-661, and for description of statistics see pp. 571-572 in same publication.
MAY 1953 571
Digitized for FRASER http://fraser.stlouisfed.org/ Federal Reserve Bank of St. Louis

COMMERCIAL BANKS
United Kingdom 1
(11 London clearingbanks. Figures inmillions of pounds
sterling)
Assets
Cashreserves
Money atcall and
shortnotice
Bills dis-counted
Treasurydeposit
receipts2 Securities Loans tocustomers
Otherassets
Liabilities
Deposits
Total Demand Time
Otherliabilities
andcapital
1947—December.1948—December.1949—December.t.050—December,1951—December
1952—AprilMayJuneJulyAugustSeptemberOctober...NovemberDecember.
1953—January...February.,March
502502532540531
501491504501510503498503549
498491497
480485571592598
512518537535516530500516529
515456472
793741
1,1091,408972
883936,064,139,239,295,122,142,248
,204,046,024
1,2881,397793456102
,483,478,512,528,965
,934,932,917
1,9171,9181,9212,1422,1382,148
2,1482,1302,122
,219,396,534,660,950
,967,901,875,834,765,758,759,755,764
,764,783
1,811
567621579735867
821713726696638662676655748
659649641
5,9356,2006,2026,3686,333
5,9945,9036,0646,0636,0486,1266,1676,1836,460
6,2596,0296,053
3,9624,1594,1614,2624,290
3,9523,8403,9093,9033,8783,9103,9483,9494,232
4,0253,8363,873
1,9722,0412,0412,1062,042
2,0422,0632,1552,1592,1702,2162,2192,2342,228
2.2342,1922,179
396420427550651
623587559558537543530526528
52S525515
Assets Liabilities
Canada
(10 chartered banks.End of month figures
in millions ofCanadian dollars)
Entirely in Canada
Cash
1947—December.1948-—December.1949—December.1950—December.1951—December.
1952—MarchAprilMayJuneJulyAugust. . .SeptemberOctober...NovemberDecember.
1953—January..February.
731749765824907
880897785813847828843879827916
835877
Securityloans
105101133134107
97140132138145147135130121155
135141
Otherloans anddiscounts
1,9992,1482,2712,7763,028
2,9492,9603,0123,0483,0533,0483,0933,2123,3503,289
3,2933,301
Securityloans
abroadand netdue fromforeignbanks
106144146171227
202236255328279260250278308326
308330
Securities
3,8744,2684,3454,2863,876
4,0954,0684,1004,0674,1344,1394,2024,1474,0063,955
3,9814,042
Otherassets Notes3
,159,169,058,304,464
,390,370,350,453,278,306,383,396,424,516
1,3211,342
181614
Deposits payable in Canadaexcluding interbank deposits
Total
6,4127,0277,2277.8287,896
7,9797,9877,9798,1208,0798,0758,1918,3198,2918,421
8,1888,310
Demand
2,6712,9702,7943,2703.284
3,2313,2303,2103,3283,2433,2053,2903,4183,3763,497
3.2443,301
Time
3,7404,0574,4334.5584.612
4,7484,7574,7694,7924.8364,8704,9014,9014,9164,924
4,9455,008
Otherliabilities
andcapital
,544,537,477,667,714
,634,685,655,727,658,652,716,722,746,736
.684,724
France
(4 large banks. Endof month figures inmillions of francs)
Assets
Cashreserves
Due frombanks
Bills dis-counted Loans Other
assets
Liabilities
Deposits
Total Demand Time
Ownaccept-ances
Otherliabilities
andcapital
1947—December..1948—December..1949—December..1950—December..1951—December.
1952—February..March. . . .AprilMayJuneJulyAugustSeptember.October. . .November.December?
1953—January.. .
22,59045,39740,93748,13160,215
50,66248,66945,64648,83250,43645,99946,38348,27945,37547,70951,147
47,150
19,37835,63342,31152,93372,559
73,86875,14872,94775,53372,81870,09069,71567,88667,84668,64668,269
69,200
219,386354,245426,690527.525627,648
538,245555,883556,151618,190554,963560,877624,623584,558595,383666,402636,427
642,991
86,875126,246129,501135,289165,696
183,504174,048180,550172,693193,942196,665177,289183,491185,930163,992169,508
174,912
27,40934,03029,84331.61438,114
38,31040,21941,47443,09344,46345,99043,31844,41547,72151,88261,909
33,586
341,547552,221627,266749.928906,911
827,946834,482831,729891,422848,354846,689890,582855,024863,250914,021896,076
907,691
338.090545,538619,204731.310879,767
796,396802,481800,944861,703819,030817,569860,668824.874831,713882,233864,033
873,232
3,4576,6838,06218,61827,145
31,55132,00230,78629,71929,32429,12029,91530,15031,53631,78932,043
34,459
25,17530,63826,355?8.24833,774
30,41428,95328,48227,02525,52923,81119,22117,81018,29220,22224,957
27,216
8,91612,69115,66217,31623,547
26,22730,53136,55639,89342,73849,12151,52555,79460,71364,38866,225
32,932
p Preliminary.iThis table represents aggregates of figures reported by individual banks. Data are compiled on the third Wednesday of each month, except
in June and December when the statements give end-of-month data.2 Represent six-month loans to the Treasury with a yield of % per cent after October 1945.3 In January 1950, the Bank of Canada assumed responsibility for these notes.NOTE.—For details concerning data in earlier years, see BULLETIN for April 1952, p. 466; for back figures and figures on German com-
mercial banks, see Banking and Monetary Statistics, Tables 168-171, pp. 648-655, and for description of statistics see pp. 566-571 in same pub-lication.
572 FEDERAL RESERVE BULLETIN
Digitized for FRASER http://fraser.stlouisfed.org/ Federal Reserve Bank of St. Louis
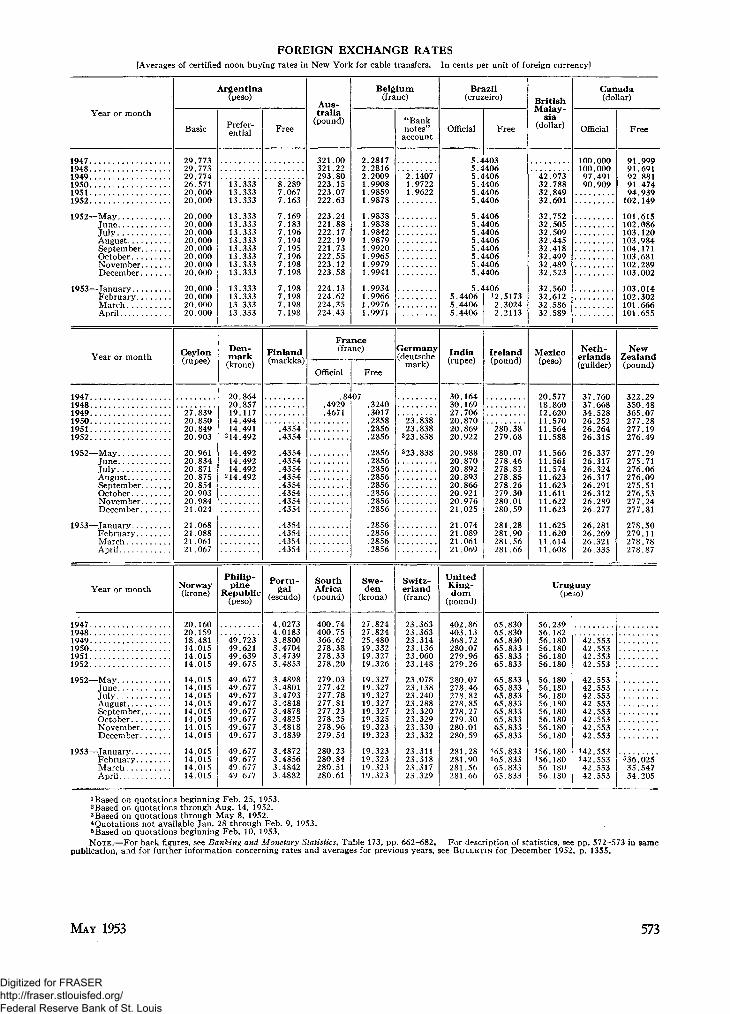
FOREIGN EXCHANGE RATES[Averages of certified noon buying rates in New York for cable transfers. In cents per unit of foreign currency]
Year or month
19471948 . .1949195019511952
1952—MayJuneJuly .AugustSeptemberOctoberNo vem berDecember . . .
1953—January .FebruaryMarchApril
Year or month
19471948 .1949195019511952
1952—MayJuneJuly-AugustSeptemberOctoberNovemberDecember
1953—JanuaryFebruaryMarchApril
Year or month
1947 .19481949 . . . . .195019511952 . .
1952—MayJ u n e . . .JulyAugustSeptemberOctoberNovemberDecember
1953—January . . . .FebruaryMarchApril
Basic
29 77329 77329 77426.57120.00020.000
20.00020.00020 00020.00020 00020.00020.00020.000
20 00020.00020.00020.000
Ceylon(rupee)
27.83920 85020.84920.903
20.96120 83420 87120.87520 85420.90320 98421 024
21.06821 08821.06121.067
Norway(krone)
20 16020.15918 48114 01514.01514.015
14.01514 01514.01514.01514.01514.01514 01514.015
14.01514.01514.01514.015
Argentina(peso)
Prefer-ential
13.33313.33313.333
13.33313.33313.33313.33313 33313.33313.33313.333
13.33313.33313.33313.333
Den-mark(krone)
20 86420.85719.11714 49414.491
214.492
14.49214.49214 492
214.492
Philip-pine
Republic(peso)
49.72349 62149.63949.675
49.67749.67749.67749.67749.67749.67749.67749.677
49.67749.67749.67749.677
Free
8.2897.0677.163
7.1697.1837.1967.1947.1957.1967.1987.198
7.1987.1987.1987.198
Finland(markka)
.4354
.4354
.4354
.43544354
.4354
.4354
.4354
.43544354
. 4354
.4354
.4354
. 4354
Portu-gal
(escudo)
4.02734.01833.88003.47043.47393.4853
3.48983.48013.47933.48483.48783.48253.48183.4839
3.48723.48563.48423.4882
Aus-tralia
(pound)
321 00321.22293.80223.15223.07222.63
223.24221.88222.17222.19221.73222.55223.12223.58
224.13224.62224.35224.43
Belgium(franc)
2 28172.28162.2009L.9908L.9859L.9878
L.9838L.9838L.9842L.9879L.9920.9965.9979
L.9941
L9934L.99661.99761.9971
France(franc)
Official
84.4929.4671
SouthAfrica(pound)
400.74400.75366.62278.38278.33278.20
279.03277.42277.78277.81277.23278.25278.96279.54
280.23280.84280.51280.61
Free
07.3240.3017.2858.2856.2856
.2856
.28562856
.2856
.2856
.2856
.28562856
.2856
.2856
.2856
.2856
Swe-den
(krona)
27.82427.82425.48019.33219.32719.326
19.32719.32719.32719.32719.32719.32519.32319.323
19.32319.32319.32319.323
"Banknotes"
account
2 14071.97221.9622
Germany(deutsche
mark)
23.83823.838
323.838
323.838
Switz-erland(franc)
23 36323.36323.31423 13623.06023.148
23.07823 13823.24023.28823.32023.32923 33023.332
23 31123.31823.31723.329
Brazil(cruzeiro)
Official Free
5 44035.44065 44065.44065.44065.4406
5.44065.44065.44065.44065.44065.44065.44065.4406
5.44065.44065.44065.4406
India(rupee)
30 16430.16927.70620.87020.86920.922
20.98820 87020 89220.89320 86620.92120 97621 025
21.07421.08921.06121.069
UnitedKing-dom
(pound)
402 86403.13368 72280 07279.96279.26
280.07278 46278.82278 85278.27279.30280 01280.59
281 28281.90281.56281.66
!2.51732.30242.2113
Ireland(pound)
280.38279.68
280.07278 46278 82278.85278 26279.30280 01280 59
281.28281.90281.56281.66
British
sia(dollar)
42 97332.78832.84932.601
32.75232.50532 50932.44532 41832.49932.48932 523
32 56032.61232.58632.589
Mexico(peso)
20 57718 86012.62011 57011.56411.588
11.56611 56111 57411.62311 62311.61111 62211 623
11.62511.62011.61411.608
Canada(dollar)
Official
100 000100.00097 49190.909
Neth-erlands(guilder)
37 76037 66834.52826 25226 26426.315
26.33726 31726 32426.31726 29126.31226 28926 277
26.28126.26926.32126.335
Free
91 99991 69192 88191 47494.939
102 149
101 615102.086103 120103.984104 171103 681102.289103 002
103 014102.302101.666101.655
NewZealand(pound)
322 29350 48365 07277 28277 19276 49
277.29275 71276 06276.09275 51276.53277 24277 81
278.50279.11278.78278.87
Uruguay(peso)
65 83065.83065 83065 83365 83365.833
65 83365 83365.83365 83365.83365.83365 83365.833
465 833465.83365.83365.833
56 23956.18256 18056 18056.18056.180
56 18056 18056.18056 18056.18056.18056 18056.180
456 180456.18056.18056.180
42 55342 55342 55342.553
42 55342 55342.55342 55342.55342 55342 55342.553
442 553442.55342.55342.553
536.02535.54734.205
1 Based on quotations beginning Feb. 25, 1953.2Based on quotations through Aug. 14, 1952.3Based on quotations through May 8, 1952.4Quotations not available Jan. 28 through Feb. 9, 1953.5Based on quotations beginning Feb. 10, 1953.NOTE.—For back figures, see Banking and Monetary Statistics, Table 173, pp. 662-682. For description of statistics, see pp. 572-573 in same
publication, and for further information concerning rates and averages for previous years, see BULLETIN for December 1952, p. 1355.
MAY 1953 573
Digitized for FRASER http://fraser.stlouisfed.org/ Federal Reserve Bank of St. Louis
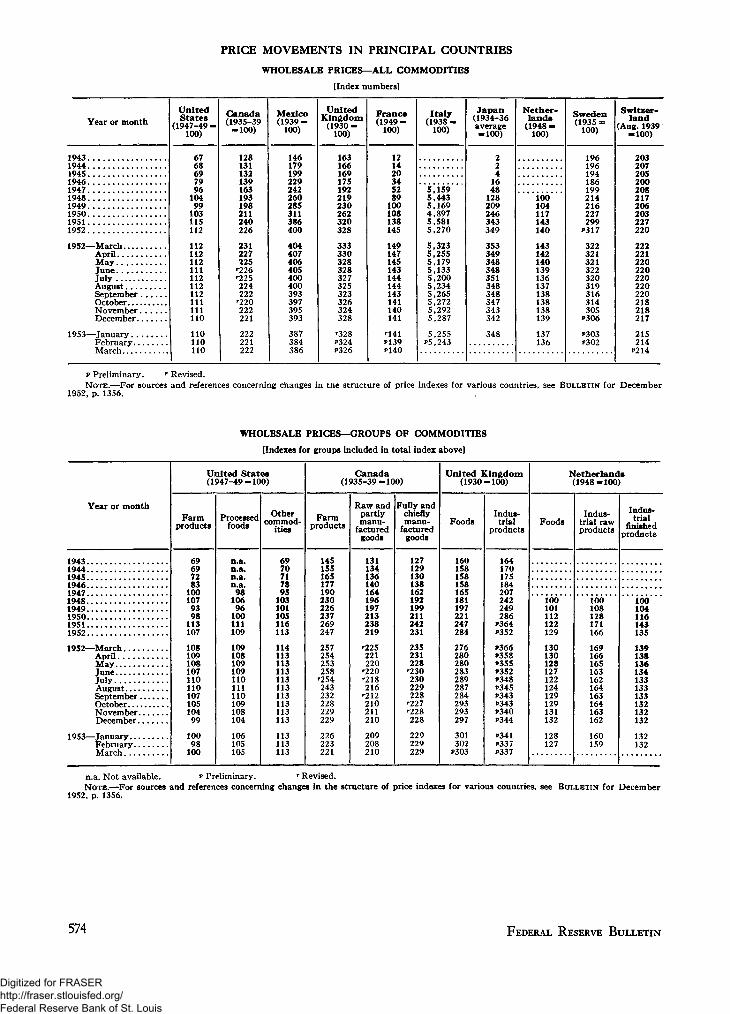
PRICE MOVEMENTS IN PRINCIPAL COUNTRIES
WHOLESALE PRICES—ALL COMMODITIES
[Index numbers]
Year or month
19431944 . .19451946194719481949195019511952
1952—MarchAprilMayJuneTulvAugustSeptemberOctober
Decem ber
1953—JanuaryFebruaryMarch
UnitedStates
(1947-49 =100)
6768697996
10499
103115112
112112112111112112112111111110
110110110
Canada(1935-39
= 100)
128131132139163193198211240226
231227225
r 226••225224222
'220222221
222221222
Mexico(1939 =
100)
146179199229242260285311386400
404407406405400400393397395393
387384386
UnitedKingdom
(1930 -100)
163166169175192219230262320328
333330328328327325323326324328
••328J>324P326
France(1949 =
100)
121420345289
100108138145
149147145143144144143141140141
••141P139P140
Italy(1938 -
100)
5,1595,4435,1694,8975,5815,270
5,3235,2555,1795,1335.2005,2345,2655,2725,2925,287
5,255P 5 , 2 4 3
Japan(1934-36average= 100)
224
1648
128209246343349
353349348348351348348347343342
348
Nether-lands
(1948 -100)
100104117143140
143142140139136137138138138139
137136
Sweden(1935 =
100)
196196194186199214216227299
*317
322321321322320319316314305
P306
P303P302
Switzer-land
(Aug. 1939= 100)
203207205200208217206203227220
222221220220220220220218218217
215214
P214
p Preliminary. r Revised.NOTE.—For sources and references concerning changes in tne structure of price indexes for various countries, see BULLETIN for December
1952, p. 1356.
WHOLESALE PRICES—GROUPS OF COMMODITIES
[Indexes for groups included in total index above]
Year or month
1943194419451946194719481949195019511952
1952—MarchAprilMayJuneJuly
SeptemberOctoberNovemberDecember
March
United States(1947-49=100)
Farmproducts
69697283
100107
9398
113107
108109108107110110107105104
99
10098
100
Processedfoods
n.a.n.a.n.a.n.a.
98106
96100111109
109108109109110111110109108104
106105105
Othercommod-
ities
6970717895
103101105116113
114113113113113113113113113113
113113113
Canada(1935-39=100)
Farmproducts
145155165177190230226237269247
257254253258
••254243232228229229
226223221
Raw andpartlymanu-
facturedgoods
131134136140164196197213238219
••225221220
'220••218216
'212210211210
209208210
Fully andchieflymanu-
facturedgoods
127129130138162192199211242231
235231228
'230230229228
••227'228228
229229229
United Kingdom(1930=100)
Foods
160158158158165181197221247284
276280280283289287284293293297
301302
P303
Indus-trial
products
164170175184207242249286
»364*352
»366»358»355J»352P348P345P343P343P340P344
J'341P337P337
Netherlands(1948=100)
Foods
100101112122129
130130128127122124129129131132
128127
Indus-trial rawproducts
100108128171166
169166165163162164163164163162
160159
Indus-trial
finishedproducts
100104116143135
139138136134133133133132132132
132132
n.a. Not available. » Preliminary. r Revised.NOTE.—For sources and references concerning changes in the structure of price indexes for various countries, see BULLETIN for December
1952, p. 1356.
574 FEDERAL RESERVE BULLETIN
Digitized for FRASER http://fraser.stlouisfed.org/ Federal Reserve Bank of St. Louis

PRICE MOVEMENTS IN PRINCIPAL COUNTRIES—Continued
CONSUMERS' PRICE INDEXES
Year or month
1945 . . . . . .19461947 .19481949195019511952.
1952—MarchAprilM a yJuneTulvAugustSeptemberOctoberNovemberDecember
1953—JanuaryFebruaryMarch . . .
All items
UnitedStates
(1947-49= 100)1
778396
103102103111114
112113113113114114114114114114
114113114
Can-ada(1949= 100)
75788597
100103114116
117117116116116116116116116116
116116115
UnitedKing-dom(Jan.
15, 1952= 100)
7782848695
103
101102102104104103103104104105
104105
France(1949= 100)
22355790
100111130145
148147145143143145146145144145
146146
P145
Nether-lands(1949= 100)
100109119120
120120119119120119120120119120
120120120
Switz-er-
land(Aug.
1939 =100)
153152158163162159167171
171170171171171171172171171171
170170
P169
Food
UnitedStates
(1947-49= 100) i
697996
104100101113115
113114114115116117115115115114
113112112
Can-ada
(1949= 100)
100103117117
118117116116116116116115116114
114113112
UnitedKing-dom(Jan.
15, 1952= 100)
6772768291
105
101104104109108107106108108109
109110
France(1949= 100)
21365792
100111128141
144142139137136140142141140141
141142
P141
Nether-l a n d s
( 1 9 4 9= 1 0 0 )
1 0 01 1 11 2 11 2 3
1 2 41 2 51 2 41 2 41 2 31 2 01 2 31 2 31 2 21 2 2
1 2 3124
S w i t z -e r -
l a n d( A u g .
1939 =»100)
164160170176174176181184
182182183184185185186186
184183
P P r e l i m i n a r y .1 T h e s e s e r i e s a r e t h e r e v i s e d i n d e x e s , r e f l e c t i n g , b e g i n n i n g J a n u a r y 1 9 5 3 , t h e i n c l u s i o n o f s o m e n e w s e r i e s a n d r e v i s e d w e i g h t s . P r i o r t o J a n -
u a r y 1 9 5 3 i n d e x e s a r e b a s e d o n t h e " i n t e r i m a d j u s t e d " a n d " o l d " i n d e x e s , c o n v e r t e d t o t h e b a s e 1 9 4 7 - 4 9 = 1 0 0 .N O T E . — F o r s o u r c e s a n d r e f e r e n c e s c o n c e r n i n g c h a n g e s i n t h e s t r u c t u r e o f p r i c e i n d e x e s f o r v a r i o u s c o u n t r i e s ( e x c e p t t h e U n i t e d S t a t e s ) , s e e
B U L L E T I N f o r D e c e m b e r 1 9 5 2 , p . 1 3 5 7 .
S E C U R I T Y P R I C E S[ I n d e x n u m b e r s e x c e p t a s o t h e r w i s e s p e c i f i e d ]
Y e a r o r m o n t h
Number of issues . . .
1 9 4 61 9 4 71 9 4 8 .1 9 4 91 9 5 0 .1 9 5 1
1 9 5 2
1 9 5 2 — A p r i lM a y
J u n eJ u l yA u g u s tS e p t e m b e r . . .O c t o b e rN o v e m b e r . . .D e c e m b e r
1 9 5 3 — J a n u a r yF e b r u a r y . . . .
M a r c h
B o n d s
U n i t e dS t a t e s
( h i g hg r a d e )
17
1 2 3 . 41 2 2 . 11 1 8 . 31 2 1 . 01 2 2 . 01 1 7 . 71 1 5 . 8
1 1 6 . 21 1 6 . 31 1 6 . 21 1 6 . 01 1 5 . 81 1 5 . 71 1 4 . 71 1 5 . 21 1 5 . 3
1 1 4 . 51 1 4 . 01 1 3 . 4
C a n a d a( 1 9 3 5 - 3 9
= 1 0 0 )
1 1 7 . 21 1 8 . 51 0 5 . 01 0 7 . 61 0 9 . 6
9 5 . 78 6 . 1
8 6 . 78 8 . 88 7 . 78 5 . 38 4 . 08 3 . 68 4 . 38 4 . 98 4 . 7
8 4 . 58 4 . 28 4 . 1
U n i t e dK i n g d o m
( D e c e m b e r1 9 2 1 = 1 0 0 )
87
1 3 2 . 11 3 0 . 81 2 9 . 91 2 6 . 51 2 1 . 21 1 7 . 61 0 8 . 3
1 0 8 . 51 0 8 . 61 0 5 . 81 0 5 . 81 0 6 . 31 1 0 . 01 0 9 . 01 0 8 . 31 0 9 . 0
1 0 9 . 11 0 9 . 71 1 0 . 5
F r a n c e( 1 9 4 9 =
1 0 0 )
60
1 3 1 . 51 2 0 . 01 0 6 . 41 0 0 . 0
9 9 . 81 0 1 . 41 1 1 . 1
1 0 5 . 31 1 0 . 71 1 3 . 91 1 4 . 41 1 4 . 81 1 6 . 91 1 5 . 51 1 5 . 01 1 4 . 6
1 1 4 . 31 1 2 . 7
N e t h e r -l a n d s
14
109. G105.6107.11 0 6 . 81 0 6 . 7
8 7 . 08 5 . 6
8 3 . 98 4 . 58 5 . 28 5 . 48 7 . 68 7 . 18 7 . 68 9 . 99 1 . 6
9 3 . 69 6 . 39 5 . 8
C o m m o n s t o c k s
U n i t e dS t a t e s
( 1 9 3 5 - 3 9= 1 0 0 )
480
1 3 9 . 91 2 3 . 01 2 4 . 41 2 1 . 41 4 6 . 41 7 6 . 51 8 7 . 7
1 8 3 . 61 8 3 . 71 8 7 . 61 9 2 . 11 9 1 . 11 8 8 . 21 8 3 . 41 8 9 . 81 9 7 . 0
1 9 7 . 61 9 5 . 91 9 8 . 0
C a n a d a( 1 9 3 5 - 3 9
= 1 0 0 )
103
1 1 5 . 71 0 6 . 01 1 2 . 51 0 9 . 41 3 1 . 61 6 8 . 31 7 3 . 1
1 7 5 . 81 6 9 . 01 7 1 . 61 7 4 . 91 7 6 . 01 7 1 . 61 6 3 . 61 6 7 . 31 6 8 . 4
1 7 2 . 31 6 9 . 01 7 0 . 0
U n i t e dK i n g d o m
( 1 9 2 6 = 1 0 0 )
278
9 6 . 29 4 . 69 2 . 08 7 . 69 0 . 09 7 19 1 . 1
9 1 . 69 2 . 08 9 . 68 9 . 98 9 . 99 1 . 29 0 . 38 9 . 99 1 . 0
9 2 . 09 2 . 09 3 . 2
F r a n c e( 1 9 4 9 = 1 0 0 )
295
1 0 09 0
1 1 21 4 3
1 4 41 3 61 4 21 4 51 4 61 4 71 4 21 4 11 4 1
1 5 11 5 3
N e t h e r -l a n d s
27
1 9 52 3 32 4 02 1 92 1 72 1 51 9 2
1 8 51 8 51 8 41 9 01 9 01 9 21 9 11 9 41 9 6
2 0 12 0 72 0 6
N O T B . — F o r s o u r c e s a n d r e f e r e n c e s c o n c e r n i n g c h a n g e s i n t h e s t r u c t u r e o f p r i c e i n d e x e s f o r v a r i o u s c o u n t r i e s , s e e B U L L E T I N f o r D e c e m b e r1 9 5 2 , p . 1 3 5 7 .
MAY 1953 575
Digitized for FRASER http://fraser.stlouisfed.org/ Federal Reserve Bank of St. Louis
M . S. SZYMCZAKR. M. EVANS
BOARD OF GOVERNORSOF THE FEDERAL RESERVE SYSTEM
W M . M C C . MARTIN, JR., Chairman
JAMES K. VARDAMAN, JR.
A. L. MILLS, JR.
J. L. ROBERTSON
ELLIOTT THURSTON, Assistant to the Board WINFIELD W. RIEFLER, Assistant to the ChairmanWOODLIEF THOMAS, Economic Adviser to the Board
ALFRED K. CHERRY, Legislative Counsel
OFFICE OF THE SECRETARYS. R. CARPENTER, SecretaryMERRITT SHERMAN, Assistant SecretaryKENNETH A. KENYON, Assistant Secretary
LEGAL DIVISIONGEORGE B. VEST, General CounselFREDERIC SOLOMON, Assistant General CounselHOWARD H. HACKLEY, Assistant General CounselDAVID B. HEXTER, Assistant General CounselG. HOWLAND CHASE, Assistant General Counsel
DIVISION OF RESEARCH AND STATISTICSRALPH A. YOUNG, Director
FRANK R. GARFIELD, Adviser on Economic ResearchKENNETH B. WILLIAMS, Assistant DirectorSUSAN S. BURR, Assistant DirectorGUY E. NOYES, Assistant DirectorC. RICHARD YOUNGDAHL, Assistant Director
DIVISION OF INTERNATIONAL FINANCEARTHUR W. MARGET, Director
LEWIS N. DEMBITZ, Assistant Director
DIVISION OF EXAMINATIONSGEORGE S. SLOAN, Director
C. C. HOSTRUP, Assistant DirectorFRED A. NELSON, Assistant DirectorARTHUR H. LANG, Chief Federal Reserve ExaminerROBERT C. MASTERS, Assistant DirectorGLENN M. GOODMAN, Assistant DirectorHENRY BENNER, Assistant Director
DIVISION OF BANK OPERATIONSROBERT F. LEONARD, Director
J. E. HORBETT, Assistant DirectorLOWELL MYRICK, Assistant Director
DIVISION OF PERSONNEL ADMINISTRATIONDWIGHT L. ALLEN, Director
H. FRANKLIN SPRECHER, JR., Assistant Director
DIVISION OF ADMINISTRATIVE SERVICESLISTON P. BETHEA, Director
JOSEPH E. KELLEHER, Assistant DirectorEDWIN J. JOHNSON, Assistant Director
OFFICE OF DEFENSE LOANSGARDNER L. BOOTHE, II, Administrator
FEDERAL OPENMARKET COMMITTEE
WM. MCC. MARTIN, JR., ChairmanALLAN SPROUL, Vice Chairman
J. A. ERICKSON O. S. POWELLR. M. EVANS J. L. ROBERTSONDELOS C. JOHNS M. S. SZYMCZAKA. L. MILLS, JR. JAMES K. VARDAMAN, JR.
WINFIELD W. RIEFLER, Secretary
ELLIOTT THURSTON, Assistant SecretaryGEORGE B. VEST, General CounselFREDERIC SOLOMON, Assistant General CounselWOODLIEF THOMAS, Economist
W M , J. ABBOTT, JR., Associate EconomistJ. MARVIN PETERSON, Associate EconomistH. V. ROELSE, Associate EconomistDONALD S. THOMPSON, Associate EconomistRALPH A. YOUNG, Associate EconomistROBERT G. ROUSE, Manager of System Open
Market Account
576
FEDERALADVISORY COUNCIL
ERNEST CLAYTON, BOSTON DISTRICT
HENRY C. ALEXANDER, N E W YORK DISTRICT
GEOFFREY S. SMITH, PHILADELPHIA DISTRICT
GEORGE GUND,
ROBERT V. FLEMING,
Vice President
PAUL M. DAVIS,
EDWARD E. BROWN,
President
V. J. ALEXANDER,
JOSEPH F . RINGLAND,
CLEVELAND DISTRICT
RICHMOND DISTRICT
ATLANTA DISTRICT
CHICAGO DISTRICT
ST. LOUIS DISTRICT
MINNEAPOLIS DISTRICT
CHARLES J. CHANDLER, KANSAS CITY DISTRICT
D E W I T T T . RAY, DALLAS DISTRICT
JOHN M. WALLACE, SAN FRANCISCO DISTRICT
HERBERT V. PROCHNOW, Secretary
FEDERAL RESERVE BULLETIN
Digitized for FRASER http://fraser.stlouisfed.org/ Federal Reserve Bank of St. Louis
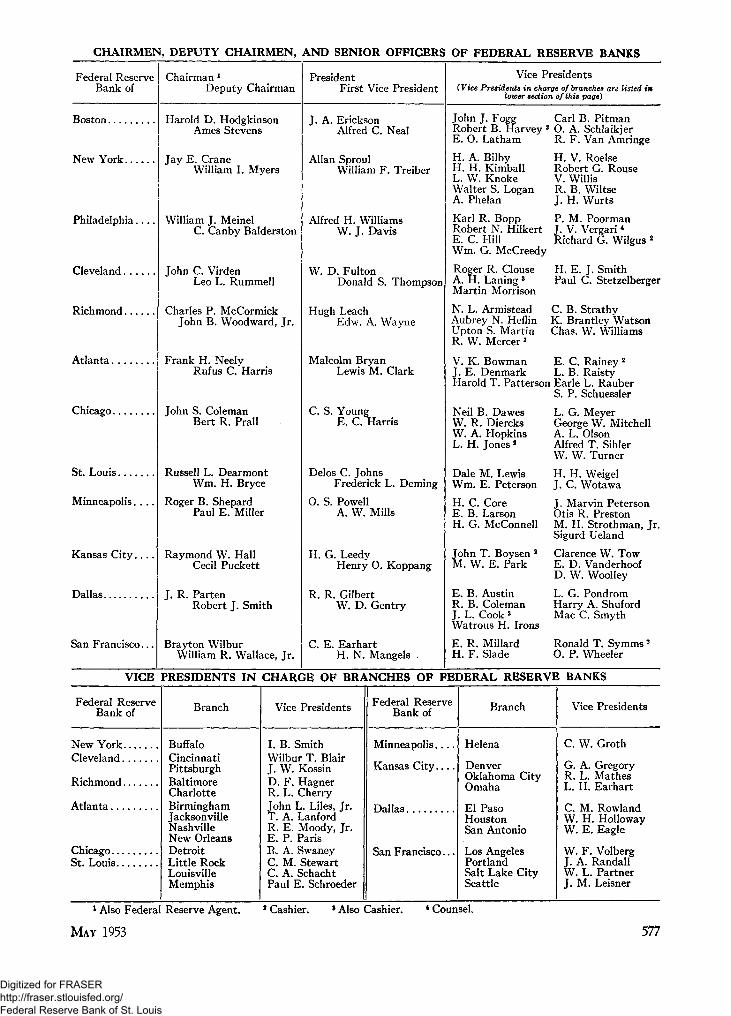
CHAIRMEN, DEPUTY CHAIRMEN, AND SENIOR OFFICERS OF FEDERAL RESERVE BANKS
Federal ReserveBank of
Chairman 1
Deputy ChairmanPresident
First Vice PresidentVice Presidents
(Vice Presidents in charge of branches are listed inlower section of this page)
Boston....
New York.
Philadelphia...
Cleveland.
Richmond.
Atlanta.
Chicago.
St. Louis
Minneapolis. . .
Kansas City. . .
Dallas
San Francisco..
Harold D. HodgkinsonAmes Stevens
Jay E. CraneWilliam I. Myers
William J. MeinelC. Canby Balderston
John C. VirdenLeo L. Rummell
Charles P. McCormickJohn B. Woodward, Jr.
Frank H. NeelyRufus C. Harris
John S. ColemanBert R. Prall
Russell L. DearmontWm. H. Bryce
Roger B. ShepardPaul E. Miller
Raymond W. HallCecil Puckett
J. R. PartenRobert J. Smith
Brayton WilburWilliam R. Wallace, Jr.
J. A. EricksonAlfred C. Neal
Allan SproulWilliam F. Treiber
Alfred H. WilliamsW. J. Davis
W. D. FultonDonald S. Thompson
Hugh LeachEdw. A. Wayne
Malcolm BryanLewis M. Clark
C. S. YoungE. C. Harris
Delos C. JohnsFrederick L. Deming
O. S. PowellA. W. Mills
H. G. LeedyHenry O. Koppang
R. R. GilbertW. D. Gentry
C. E. EarhartH. N. Mangels
John J. Fog Carl B. PitmanJ ogg.obert B. Harvey 3 O. A. Schlaikjer
E. O. Latham R. F. Van Amringe
H. A. BilbyH. H. KimballL. W. KnokeWalter S. LoganA. Phelan
Karl R. BoppRobert N. HilkertE. C. HillWm. G. McCreedy
Roger R. ClouseA. H. Laning 3
Martin Morrison
N. L. ArmisteadAubrey N. HeflinUpton S. MartinR. W. Mercer 3
H. V. RoelseRobert G. RouseV. WillisR. B. WiltseJ. H. Wurts
P. M. PoormanJ. V. Vergari *Richard G. Wilgus 2
H. E. J. SmithPaul C. Stetzelberger
C. B. StrathyK. Brantley WatsonChas. W. Williams
V. K. Bowman E. C. Rainey 2
J. E. Denmark L. B. RaistyHarold T. Patterson Earle L. Rauber
S. P. Schuessler
Neil B. DawesW. R. DiercksW. A. HopkinsL. H. Jones *
Dale M. LewisWm. E. Peterson
H. C. CoreE. B. LarsonH. G. McConnell
John T. Boysen 2
M. W. E. Park
E. B. AustinR. B. ColemanJ. L. Cook 3
Watrous H. Irons
E. R. MillardH. F. Slade
L. G. MeyerGeorge W. MitchellA. L. OlsonAlfred T. SihlerW. W. Turner
H. H. WeigelJ. C. Wotawa
J. Marvin PetersonOtis R. PrestonM. H. Strothman, Jr.Sigurd Ueland
Clarence W. TowE. D. VanderhoofD. W. Woolley
L. G. PondromHarry A. ShufordMac C. Smyth
Ronald T. Symms2
O. P. Wheeler
VICE
Federal ReserveBank of
New YorkCleveland
Richmond
Atlanta
ChicagoSt. Louis
PRESIDENTS IN
Branch
BuffaloCincinnatiPittsburghBaltimoreCharlotteBirminghamJacksonvilleNashvilleNew OrleansDetroitLittle RockLouisvilleMemphis
CHARGE OF BRANCHES OF FEDERAL RESERVE BANKS
Vice Presidents
I. B. SmithWilbur T. BlairJ. W. KossinD. F. HagnerR. L. CherryJohn L. Liles, Jr.T. A. LanfordR. E. Moody, Jr.E. P. ParisR. A. SwaneyC. M. StewartC. A. SchachtPaul E. Schroeder
Federal ReserveBank of
Minneapolis....
Kansas City. . . .
Dallas
San Francisco...
Branch
Helena
DenverOklahoma CityOmaha
El PasoHoustonSan Antonio
Los AngelesPortlandSalt Lake CitySeattle
Vice Presidents
C. W. Groth
G. A. GregoryR. L. MathesL. H. Earhart
C. M. RowlandW. H. HollowayW. E. Eagle
W. F. VolbergJ. A. RandallW. L. PartnerJ. M. Leisner
1 Also Federal Reserve Agent.
MAY 1953
1 Cashier. »Also Cashier. 4 Counsel.
577
Digitized for FRASER http://fraser.stlouisfed.org/ Federal Reserve Bank of St. Louis
FEDERAL RESERVE BOARD PUBLICATIONS :
The material listed below may be obtained fromthe Division of Administrative Services, Board ofGovernors of the Federal Reserve System, Wash-ington 25, D. C. Where a charge is indicated,remittance should be made payable to the orderof the Board of Governors of the Federal ReserveSystem.
ANNUAL REPORT of the Board of Governors of theFederal Reserve System. Issued each year.Available without charge upon request.
FEDERAL RESERVE BULLETIN. Issued monthly. Sub-scription price in the United States and its pos-sessions, Bolivia, Canada, Chile, Colombia, CostaRica, Cuba, Dominican Republic, Ecuador,Guatemala, Haiti, Republic of Honduras, Mexico,Nicaragua, Panama, Paraguay, Peru, El Salvador,Uruguay, and Venezuela is $2.00 per annum or20 cents per copy; elsewhere $2.60 per annum or25 cents per copy. Group subscriptions in theUnited States for 10 or more copies to one ad-dress, 15 cents per copy per month, or $1.50 for12 months.
FEDERAL RESERVE CHARTS ON BANK CREDIT, MONEYRATES, and BUSINESS. Issued monthly. $6.00per annum including edition of historical supple-ment (listed below) available when subscriptionis entered or renewed. 60 cents per copy; inquantities of 10 or more copies of a particularissue for single shipment, 50 cents each. (Do-mestic rates)
HISTORICAL SUPPLEMENT TO FEDERAL RESERVECHARTS ON BANK CREDIT, MONEY RATES, ANDBUSINESS. Issued semiannually, usually Apriland September. Annual subscription to monthlychart book includes one issue of supplement.Single copies, 60 cents each; in quantities of 10or more copies for single shipment, 50 cents each.(Domestic rates)
1 A more complete list, including periodic releases and re-prints, appeared on pp. 1360-63 of the December 1952BULLETIN.
THE FEDERAL RESERVE SYSTEM—ITS PURPOSES ANDFUNCTIONS. November 1947; reprinted April1953. 125 pages.
BANKING STUDIES. Comprising 17 papers on bank-ing and monetary subjects by members of theBoard's staff. August 1941; reprinted October1952. 496 pages. Paper cover. $1.00 per copy;in quantities of 10 or more copies for single ship-ment, 75 cents each.
BANKING AND MONETARY STATISTICS. Statistics ofbanking, monetary, and other financial develop-ments. November 1943. 979 pages. $1.50 percopy. No charge for individual sections (un-bound).
A STATISTICAL STUDY OF REGULATION V LOANS.September 1950. 74 pages. 25 cents per copy;in quantities of 10 or more copies for single ship-ment, 15 cents each.
THE DEVELOPMENT OF BANK DEBITS AND CLEARINGSAND THEIR USE IN ECONOMIC ANALYSIS. Janu-ary 1952. 175 pages. 25 cents per copy; inquantities of 10 or more copies for single ship-ment, 15 cents each.
THE FEDERAL RESERVE ACT, as amended to Novem-ber 1, 1946, with an Appendix containing pro-visions of certain other statutes affecting theFederal Reserve System. 372 pages. 50 cents perpaper-bound copy; $1.00 per cloth-bound copy.
COMPILATION OF FEDERAL AND STATE LAWS RELAT-ING TO BRANCH BANKING WITHIN THE UNITEDSTATES. (July 1, 1951.) December 1951. 33 pages.
RULES OF ORGANIZATION AND RULES OF PROCEDURE—Board of Governors of the Federal ReserveSystem (with Amendments). September 1946.31 pages.
REGULATIONS OF THE BOARD OF GOVERNORS OF THEFEDERAL RESERVE SYSTEM. Individual regulationswith amendments.
578 FEDERAL RESERVE BULLETIN
Digitized for FRASER http://fraser.stlouisfed.org/ Federal Reserve Bank of St. Louis
FEDERAL RESERVE BOARD PUBLICATIONS
REPRINTS(From Federal Reserve Bulletin unless preceded by an asterisk)MEASUREMENT OF CONSUMER CREDIT. November
1950. 9 pages.* T H E TREASURY—CENTRAL BANK RELATIONSHIP IN
FOREIGN COUNTRIES—PROCEDURES AND TECH-
NIQUES. November 1950. April 1951. 19 pages.TRENDS IN INTERNATIONAL TRADE AND PAYMENTS.
April 1951. 14 pages.HOUSE PURCHASES IN THE FIVE MONTHS FOLLOWING
THE INTRODUCTION OF REAL ESTATE CREDIT REGU-
LATION. July 1951. 23 pages.SAVING IN THE DEFENSE ECONOMY. September
1951. 5 pages.N E W INDEX OF OUTPUT OF MAJOR CONSUMER
DURABLE GOODS. October 1951. 6 pages.
CREDIT AND SALES REPORTED BY REGULATION W
REGISTRANTS. October 1951. 12 pages.VOLUNTARY ACTION TO HELP CURB INFLATION.
November 1951. 9 pages.REVISED INDEXES OF DEPARTMENT STORE SALES AND
STOCKS. December 1951. 53 pages.ECONOMIC PROBLEMS FACING POST-TREATY JAPAN.
January 1952. 11 pages.T H E SECOND ARMAMENT BUDGET. February 1952.
9 pages.MONEY AND CREDIT IN 1951. February 1952. 9
pages.RECENT CHANGES IN GERMANY'S FOREIGN TRADE
BALANCE. March 1952. 7 pages.1952 SURVEY OF CONSUMER FINANCES—From April,
July, August, and September issues of BULLETIN.67 pages. (Also, similar surveys for earlier yearsfrom 1946, 1947, 1948, 1949, 1950, and 1951BULLETINS.)
BANKING IN THE SOVIET UNION. April 1952. 8
pages.REVISED WEEKLY INDEX OF DEPARTMENT STORE
SALES. April 1952. 4 pages.STATEMENT BY CHAIRMAN OF THE BOARD OF GOV-
ERNORS BEFORE SUBCOMMITTEE ON GENERAL
CREDIT CONTROL AND DEBT MANAGEMENT, MARCH
11, 1952. April 1952. 4 pages.CHANGES IN INSTALMENT CREDIT TERMS. May 1952.
6 pages.EXCESS PROFITS TAXES OF COMMERCIAL BANKS.
June 1952. 18 pages.
REAL ESTATE LOANS OF REGISTRANTS UNDER REGU-
LATION X. June 1952. 18 pages.
RETAIL CREDIT SURVEY—1951. From June 1952BULLETIN with supplementary information for9 separate trades. (Also, Retail Credit Surveys—1943, 1944, 1945, 1946, 1947, 1948, and 1949from the June 1944, May 1945, June 1946, July1947, July 1948, June 1949, and June 1950BULLETINS with supplementary information.)
ESTIMATED LIQUID ASSET HOLDINGS OF INDIVIDUALS
AND BUSINESSES. July 1952. 2 pages.
PROBLEMS OF TRADE EQUILIBRIUM. October 1952.
9 pages.
REVISED SERIES ON DEPARTMENT STORE SALES,
STOCKS, AND ORDERS. October 1952. 5 pages.
RECENT CREDIT EXPANSION. December 1952. 7
pages.
RECENT CENTRAL BANKING DEVELOPMENTS IN
SOUTHEAST ASIA. December 1952. 9 pages.
CREDIT AND MONETARY REVIEW FOR 1952. February
1953. 7 pages.
T H E MONETARY SYSTEM OF THE UNITED STATES.
February 1953. 16 pages.
INFLUENCE OF CREDIT AND MONETARY MEASURES ON
ECONOMIC STABILITY. March 1953. 16 pages.
FEDERAL FINANCIAL MEASURES FOR ECONOMIC STA-
BILITY. May 1953. 7 pages.
INTERNATIONAL FLOW OF GOLD AND DOLLARS, 1952.
March 1953. 8 pages. (Also similar articlefrom March 1952 BULLETIN.)
SELECTED PRELIMINARY FINDINGS OF THE 1953
SURVEY OF CONSUMER FINANCES. March 1953.
2 pages.REVISION OF CONSUMER CREDIT STATISTICS. April
1953. 19 pages.^DETAILED DESCRIPTION OF SOURCES AND METHODS
USED IN REVISION OF SHORT- AND INTERMEDIATE-
TERM CONSUMER CREDIT STATISTICS (supplemen-
tary details for item listed above), April 1953.25 pages.
T H E TRANSITION TO FREE MARKETS. April 1953.
6 pages.FEDERAL RESERVE BANK RESPONSIBILITIES. May
1953. 5 pages.FEDERAL FINANCIAL MEASURES FOR ECONOMIC STA-
BILITY. May 1953. 7 pages.
MAY 1953 579
Digitized for FRASER http://fraser.stlouisfed.org/ Federal Reserve Bank of St. Louis
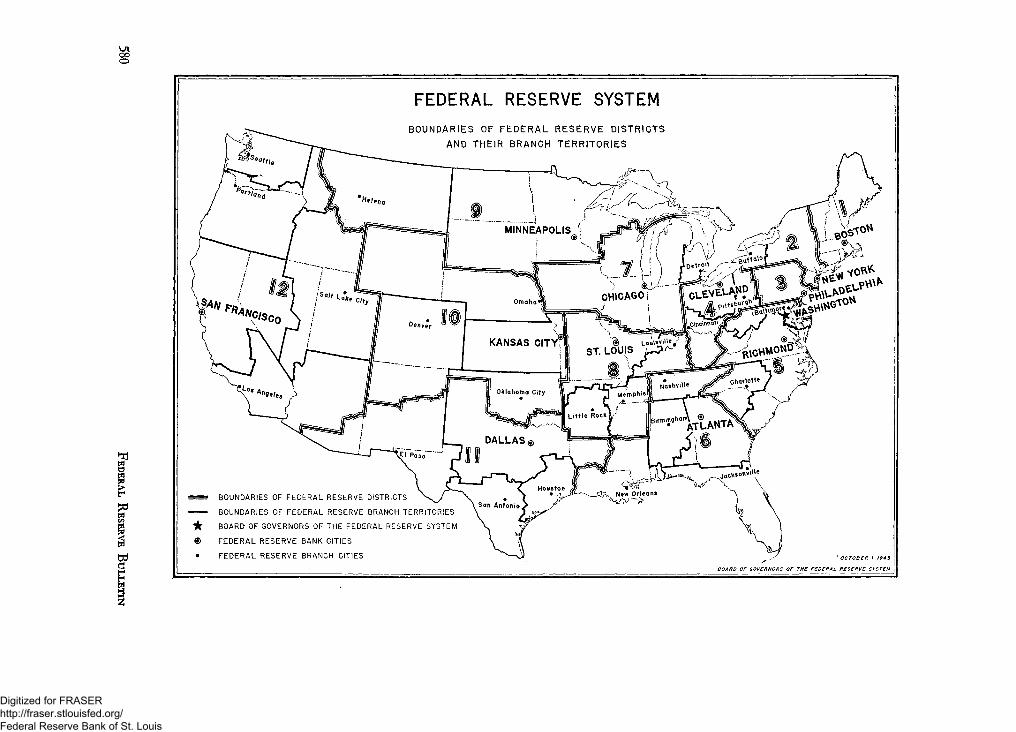
o
I3
FEDERAL RESERVE SYSTEM
BOUNDARIES OF FEDERAL RESERVE DISTRICTSAND THEIR BRANCH TERRITORIES
= BOUNDARIES OF FEDERAL RESERVE DISTRICTS
BOUNDARIES OF FEDERAL RESERVE BRANCH TERRITORIES
if BOARD OF GOVERNORS OF THE FEDERAL RESERVE SYSTEM
® FEDERAL RESERVE BANK CITIES
• FEDERAL RESERVE BRANCH CITIES
Digitized for FRASER http://fraser.stlouisfed.org/ Federal Reserve Bank of St. Louis