Report by the Comptroller and Auditor General Department for Work & Pensions and HM Revenue & Customs Fraud and error stocktake HC 267 SESSION 2015-16 21 JULY 2015

Welcome message from author
This document is posted to help you gain knowledge. Please leave a comment to let me know what you think about it! Share it to your friends and learn new things together.
Transcript

8/16/2019 Fraud-and-error-stocktake.pdf
http://slidepdf.com/reader/full/fraud-and-error-stocktakepdf 1/47

8/16/2019 Fraud-and-error-stocktake.pdf
http://slidepdf.com/reader/full/fraud-and-error-stocktakepdf 2/47
Our vision is to help the nation spend wisely.
Our public audit perspective helps Parliament holdgovernment to account and improve public services.
The National Audit Office scrutinises public spending for Parliament and is independent
of government. The Comptroller and Auditor General (C&AG), Sir Amyas Morse KCB,
is an Officer of the House of Commons and leads the NAO, which employs some
810 people. The C&AG certifies the accounts of all government departments and
many other public sector bodies. He has statutory authority to examine and report
to Parliament on whether departments and the bodies they fund have used their
resources efficiently, effectively, and with economy. Our studies evaluate the value formoney of public spending, nationally and locally. Our recommendations and reports
on good practice help government improve public services, and our work led to
audited savings of £1.15 billion in 2014.

8/16/2019 Fraud-and-error-stocktake.pdf
http://slidepdf.com/reader/full/fraud-and-error-stocktakepdf 3/47
Report by the Comptroller and Auditor General
Ordered by the House of Commons
to be printed on 21 July 2015
This report has been prepared under Section 6 of the
National Audit Act 1983 for presentation to the House of
Commons in accordance with Section 9 of the Act
Sir Amyas Morse KCB
Comptroller and Auditor General
National Audit Office
16 July 2015
HC 267 | £10.00
Department for Work & Pensions andHM Revenue & Customs
Fraud and error stocktake

8/16/2019 Fraud-and-error-stocktake.pdf
http://slidepdf.com/reader/full/fraud-and-error-stocktakepdf 4/47
This report provides an overview of progress in reducingfraud and error in benefits and tax credits, and howdepartments are responding to emerging opportunities.
© National Audit Office 2015
The material featured in this document is subject toNational Audit Office (NAO) copyright. The material
may be copied or reproduced for non-commercial
purposes only, namely reproduction for research,
private study or for limited internal circulation within
an organisation for the purpose of review.
Copying for non-commercial purposes is subject
to the material being accompanied by a sufficient
acknowledgement, reproduced accurately, and not
being used in a misleading context. To reproduce
NAO copyright material for any other use, you must
contact [email protected]. Please tell us who
you are, the organisation you represent (if any) andhow and why you wish to use our material. Please
include your full contact details: name, address,
telephone number and email.
Please note that the material featured in this
document may not be reproduced for commercial
gain without the NAO’s express and direct
permission and that the NAO reserves its right to
pursue copyright infringement proceedings against
individuals or companies who reproduce material for
commercial gain without our permission.
Links to external websites were valid at the time of
publication of this report. The National Audit Office
is not responsible for the future validity of the links.
10762 07/15 NAO

8/16/2019 Fraud-and-error-stocktake.pdf
http://slidepdf.com/reader/full/fraud-and-error-stocktakepdf 5/47
The National Audit Office study team
consisted of:
Richard Baynham, Hayley Lewis,
Ian Hart, Ana Antunes Loureiro,
Charlotte Orr, Kaysey Stanfield and
Sarah Stephenson, under the direction
of Max Tse.
This report can be found on the
National Audit Office website at
www.nao.org.uk
For further information about the
National Audit Office please contact:
National Audit Office
Press Office
157–197 Buckingham Palace Road
Victoria
London
SW1W 9SP
Tel: 020 7798 7400
Enquiries: www.nao.org.uk/contact-us
Website: www.nao.org.uk
Twitter: @NAOorguk
Contents
Key facts 4
Summary 5
Part OneSystemic issues 11
Part Two
Progress in reducing fraud and error 15
Part Three
Shaping the future to tackle
fraud and error 24
Appendix One
Our audit approach 38
Appendix TwoOur evidence base 40
Appendix Three
Factors affecting fraud and error 42

8/16/2019 Fraud-and-error-stocktake.pdf
http://slidepdf.com/reader/full/fraud-and-error-stocktakepdf 6/47
4 Key facts Fraud and error stocktake
Key facts
£193bnspending in 2013-14 on benefits
and tax credits
£4.6bnoverall fraud and error
overpayments on benefits
and tax credits, 2013-14
£1.6bnoverall underpayments on
benefits and tax credits, 2013-14
Department for
Work & Pensions
HM Revenue
& Customs
Spending on benefits and
tax credits, 2013-14
£164 billion £29 billion
Total overpayments due to
fraud and error, 2013-14
£3.3 billion
2.0%
£1.3 billion
4.4%
Total underpayments due
to fraud and error, 2013-14
£1.4 billion
0.9%
£0.2 billion
0.6%
Target for overpayments due to
fraud and error in March 2015
1.7% 5.5%
Latest fraud and error rate 1.9% (preliminary
figures, 2014-15)
4.4% (2013-14)

8/16/2019 Fraud-and-error-stocktake.pdf
http://slidepdf.com/reader/full/fraud-and-error-stocktakepdf 7/47
Fraud and error stocktake Summary 5
Summary
1 Benefits and tax credits support about 20 million households across the UK.
In 2013-14 government departments paid out £193 billion to support a wide range
of claimants including pensioners, working people, jobseekers and disabled people.
Almost everyone in the UK gets a state pension, benefit or tax credit at some point
in their lives.
2 HM Revenue & Customs (HMRC) manages tax credits. The Department for
Work & Pensions (DWP) manages most remaining benefits and state pensions. Local
authorities are also responsible for the day-to-day administration of Housing Benefit.
DWP is replacing tax credits and four working-age benefits with Universal Credit.
3 The level of fraud and error is a persistent concern in benefits and tax credits.
The Committee of Public Accounts has repeatedly called for departments to tackle
fraud and error more effectively, and to target initiatives at the biggest sources of loss.
It has highlighted the scale of losses that could otherwise have been spent on other
government objectives. Overpayments increase costs to taxpayers and reduce publicresources available for other purposes. Underpayments mean households are not
getting the support they are entitled to.
4 This report provides an overview of progress in reducing fraud and error in benefits
and tax credits, and how departments are responding to emerging opportunities.1
We draw on our extensive work with departments in annual audits of their accounts
and value-for-money reports, which examine individual benefits in more detail.
We consider:
• systemic issues in how departments manage fraud and error (Part One);
• progress in reducing fraud and error since 2010 (Part Two); and
• shaping the future to tackle fraud and error (Part Three).
Fraud and error can be reduced by more efficient administration, reframing the rules
with a view to ‘designing out’ the circumstances when it can arise, or obtaining better
information on claimants’ circumstances in order to prevent overpayments from
occurring. We examine progress in this area in our section on ‘shaping the future’.
1 Our assessment of HMRC excludes its management of Child Benefit.

8/16/2019 Fraud-and-error-stocktake.pdf
http://slidepdf.com/reader/full/fraud-and-error-stocktakepdf 8/47
6 Summary Fraud and error stocktake
Defining fraud and error – a note on presentation
5 Departments define and measure fraud and error differently. These technical
differences can be confusing. In this report we try to avoid excessive terminology.
For example, we cite departments’ central estimates of fraud and error rather than the
ranges in published statistics. For readers who require more detail, we are publishing
a companion report, A primer on fraud and error , which describes how departments
define and measure fraud and error.
6 In this report we refer to gross fraud and error, which government has used to
monitor departments’ performance. This does not account for subsequent recoveries,
for example when departments get back overpayments made to claimants. DWP
has started to publish overpayments net of recoveries as a measure of overall losses
to taxpayers. In our Primer on fraud and error we consider the different ways net
overpayments can be measured.
Key findings
Systemic issues
7 Fraud and error in benefits and tax credits is a significant and long-standing
problem. The Comptroller & Auditor General has given qualified opinions on DWP’s
accounts since 1988-89 and on HMRC’s accounts since 2003-04 because of the levels offraud and error in benefits and tax credits. In 2013-14, DWP and HMRC overpaid claimants
by £4.6 billion because of fraud and error, and underpaid claimants by £1.6 billion.
In March 2015 the government restated that the level of fraud and error in the benefits
and tax credits system remains unacceptably high (paragraphs 1.3 to 1.5).
8 We have identified four systemic issues which departments need to continue
to address. These are: establishing clear strategies and governance; designing controls
into the way departments work; implementing controls and interventions effectively; and
measuring and evaluating performance (paragraphs 1.6 to 1.17).
Recent progress
9 DWP and HMRC set out a joint approach to reducing fraud and error.
In October 2010 the departments published a joint strategy to tackle fraud and error in
benefits and tax credits, which set out to build upon previous initiatives. Government
planned to reduce annual overpayments by one-quarter by March 2015, or around
£1.4 billion. In some cases, the departments identified a common approach and
overlapping areas of work, such as the introduction of a single fraud investigation
service. The departments have otherwise pursued their own programmes and targets
to reduce fraud and error (paragraphs 2.2 to 2.5).

8/16/2019 Fraud-and-error-stocktake.pdf
http://slidepdf.com/reader/full/fraud-and-error-stocktakepdf 9/47
Fraud and error stocktake Summary 7
10 The departments have made progress in reducing headline rates of fraudand error, particularly in tax credits. HMRC reduced fraud and error overpayments
in tax credits from 8.1% in 2010-11 to 4.4% in 2013-14. Overpayments of DWP benefits
fell from 2.1% to 2.0% between 2010-11 and 2013-14. Preliminary estimates for 2014-15
show a rate of 1.9% (paragraphs 2.6 to 2.8).
11 HMRC’s recent reduction in fraud and error is encouraging and it is
conducting further analysis to fully understand the reasons for all of the reductions.
In June 2015, HMRC revised its 2012-13 estimate of fraud and error overpayments from
7.0% to 5.3%. HMRC’s latest estimate for 2013-14 confirms that the downward trend from
2010-11 has continued. This decline suggests that HMRC’s initiatives to tackle specific
fraud and error risks have had an impact. For example, it has worked with credit referenceagencies to address the ‘undeclared partners’ risk. HMRC has not yet had time to assess
reasons for all of the reductions more fully and is planning to conduct further analysis
(paragraphs 2.9 to 2.11).
12 The composition of DWP benefits has helped to bring down headline rates
of fraud and error. DWP’s fraud and error estimates include the State Pension, which
is large (£87 billion in 2014-15) and has a low rate of overpayments (at 0.2%). Over the
past five years the share of the State Pension has increased from 46% to 51% of benefit
spending. This effect – and other changes to the mix of benefits – has helped to bring
down the headline rate of DWP overpayments by around 0.2%. In DWP’s view, other
factors, such as the rising number of in-work claimants, has increased overpaymentsand made tackling fraud and error more difficult (paragraphs 2.12 to 2.15).
13 Based on current estimates HMRC will meet its spending review target
for fraud and error, while DWP is not on track. DWP set a target to reduce fraud
and error in 2014-15 to 1.7% of benefit spending. HMRC aimed to reduce losses to
5.5% of tax credit spending by March 2015. HMRC has already reduced losses below
this level, and will meet its target if it sustains or improves the current rate of fraud and
error. The final results will be available in June 2016. DWP’s preliminary estimates show
that overpayments fell to 1.9% in 2014-15. DWP’s final estimates will be published in
November 2015, and could show further reductions given the uncertainty in estimates
and its recent initiatives. In DWP’s view, it is not possible to know whether or not it is ontrack to meet its target (paragraphs 2.16 and 2.17).
14 Over the past five years, initiatives to reduce fraud and error have focused
primarily on correcting claims rather than preventing errors. DWP estimates
that its projects to identify and correct overpayments have saved £1.5 billion over the
2010 Spending Review period, £0.4 billion more than initially forecast. In contrast,
projects to prevent errors will save £0.9 billion less than originally expected. Similarly,
HMRC’s detect and correct activities accounted for almost 80% of losses prevented
in 2014-15. It is unclear whether a continued emphasis on detection will deliver
sustainable long-term reductions in fraud and error (paragraphs 2.18 to 2.23).

8/16/2019 Fraud-and-error-stocktake.pdf
http://slidepdf.com/reader/full/fraud-and-error-stocktakepdf 10/47
8 Summary Fraud and error stocktake
15 Departments’ estimates of savings from their fraud and error activitiesdo not translate directly into sustained reductions in the overall level of fraud
and error overpayments. DWP estimates its projects saved £2 billion over the
2010 Spending Review period. HMRC estimates £3.2 billion of losses prevented. In both
cases, departments initially assumed that identifying and correcting claims would lead to
reductions in the level of fraud and error. But departments’ measures of savings from their
fraud and error activities do not translate directly in the headline rate of overpayments.
This can work both ways: recently HMRC’s fraud and error rate has fallen by significantly
more than its estimated savings from its activities (paragraphs 2.24 to 2.27).
Shaping the future
16 Departments have implemented some major changes that should help to
reduce fraud and error in the future. DWP expects the introduction of Universal Credit
to reduce fraud and error by £0.5 billion each year when fully rolled out, by removing
some types of overpayments created by existing systems. It also expects wider changes
to welfare reform, such as the introduction of state pension reforms to reduce losses.
In addition, both departments are refining and extending their approaches to preventing
and detecting overpayments in legacy benefits and tax credits:
• DWP has introduced new initiatives which it estimates will save £2.9 billion in fraud
and error up to 2021-22 from legacy benefits.
• HMRC has started a project with a private sector partner to increase the number of
compliance interventions and made changes to scheme rules to require claimants
to provide additional information to support their claim. It expects the project to
increase its capacity to save £423 million over the next three years and its policy
changes to save £471 million over the next five years. HMRC is also introducing
digital accounts to improve its interaction with claimants.
• Both departments have strengthened sanctions for punishing fraudsters.
This has been supported by introducing the single fraud investigation service,
and communication campaigns to raise claimants’ awareness of their obligations
and potential sanctions (paragraphs 3.2 and 3.23).
17 These new opportunities will make it easier to reduce some types of fraud
and error, but significant risks will still remain. In 2013-14, DWP and HMRC estimated
that £1.4 billion of fraud and error was caused by incorrect assessments of claimants’
income. Departments are now using the real-time information system to detect income
changes in existing benefits and will use this in Universal Credit. HMRC expects this
to save £410 million over the next two years, and DWP expects it to save £356 million
between 2015-16 and 2020-21. Departments will, though, continue to face the risk of
significant losses on legacy benefits over the next five years and need to develop their
approaches for other major risk areas, such as the ‘undeclared partner risk’ which was
the cause of £823 million of fraud and error in 2013-14 (paragraphs 3.2 to 3.4 and 3.17).

8/16/2019 Fraud-and-error-stocktake.pdf
http://slidepdf.com/reader/full/fraud-and-error-stocktakepdf 11/47
Fraud and error stocktake Summary 9
18 For the next five years both departments will have to manage fraud and errorin a long and complicated transition period to Universal Credit. Departments will
need to manage fraud and error in legacy benefits and tax credits, and develop controls
within Universal Credit. DWP and HMRC will find it difficult to assess their performance in
reducing fraud and error against a changing baseline for individual benefits and Universal
Credit, as claimants transfer between benefits and departments (paragraphs 3.5 to 3.10).
19 Both departments have strengthened governance over fraud and error
initiatives. In 2013 we looked at HMRC’s management of fraud and error in tax
credits and identified clear lines of accountability and an effective process for
managing resources. DWP has more recently reorganised its management of fraud
and error. In 2014 it brought together fraud and error work that was spread across thedepartment. DWP is now developing a long-term fraud and error strategy, supported
by benefit-specific strategies. It is still working on activity plans and new accountability
arrangements for each major benefit (paragraphs 3.11 to 3.14).
20 Departments have improved their understanding of the causes of fraud
and error and are increasingly aiming for prevention in scheme design. Both
departments are seeking to make better use of data to make decisions and increase
their focus on preventing overpayments from occurring. They are factoring fraud
and error considerations into the design of schemes and processes. Despite these
developments, departments still need to manage the tension between fast and efficient
processing and accuracy, and to balance these competing demands by creating theright incentives for operational staff (paragraphs 3.15 to 3.22).
21 Departments will need to strengthen how they monitor performance as there
will still be significant levels of fraud and error during and after the introduction
of Universal Credit. DWP currently estimates there will still be around £5.8 billion
fraud and error overpayments across benefits and tax credits in 2020-21. Departments
need to assess what is achievable, and the barriers to reducing fraud and error further.
They will also need to develop new performance frameworks to monitor their progress,
including the impact of initiatives to prevent fraud and error (paragraphs 3.14, 3.23 to 3.26)
Conclusion
22 For more than 25 years we have highlighted concerns about fraud and error, and
departments’ limited inroads into the problem. The government continues to lose large
amounts of money through overpayments, reducing the money available for other purposes.
And many vulnerable people get less support than they are entitled to. Until recently,
departments had not made significant improvements due to an inconsistent and tactical
approach to tackling losses.

8/16/2019 Fraud-and-error-stocktake.pdf
http://slidepdf.com/reader/full/fraud-and-error-stocktakepdf 12/47
10 Summary Fraud and error stocktake
23 HMRC’s success in reducing fraud and error is encouraging and suggests that itsinitiatives and a more structured approach are tackling overpayments effectively. But
the analysis needed to fully understand all of the changes is not yet complete. Based
on its preliminary estimates, DWP has made less progress and is not on track to meet
its commitments to reduce fraud and error to target levels for March 2015. Departments
will need to show they can track the impact of initiatives through to outcomes if they are
to achieve sustained and continuing reductions in fraud and error.
24 There are many reasons to be optimistic about opportunities to reduce fraud and
error, in particular through the use of real-time information and introduction of Universal
Credit. Real-time information has made it much easier to deal with changes in claimants’
earnings. However, the full impact is still uncertain and it will be several years beforeUniversal Credit is fully rolled-out. Departments need to build on recent efforts to
develop more integrated and systematic responses to preventing fraud and error.
Recommendations
25 Departments must continue to address the four systemic issues we have
identified in past work by continuing to build on and learn from the best practice in each
department. To do this, they should:
a Develop and maintain strategies and activity plans for individual benefits to
target major areas of fraud and error. Departments should disaggregate majorrisks and show that interventions target the most significant losses and risks for
each benefit. They should consider end-to-end processes for benefits, especially
Universal Credit, and set out planned improvements over the next five years against
clear baselines.
b Design fraud and error responses into core processes and better use
information from across government. Departments should explicitly consider
fraud and error in the design of new benefits and processes, and improve access
to data in processes for checking claims.
c Strengthen controls to prevent fraud and error. Departments should ensure
that operational staff have adequate incentives to improve quality and not only
to process claims efficiently. They should strengthen feedback loops between
corrective initiatives and day-to-day controls.
d Improve assessments of root causes and the impact of initiatives.
Departments should extend risk analysis to provide a more granular assessment
of root causes and claimant behaviours. They should establish consistent methods
for evaluating the impact of new initiatives and improve their understanding of fraud
and error in benefits they do not measure or publish each year.

8/16/2019 Fraud-and-error-stocktake.pdf
http://slidepdf.com/reader/full/fraud-and-error-stocktakepdf 13/47
Fraud and error stocktake Part One 11
Part One
Systemic issues
1.1 The Department for Work & Pensions (DWP) and HM Revenue & Customs
(HMRC) are responsible for administering a complicated system of benefits and taxcredits. HMRC paid out £29 billion in tax credits to 4.7 million claimants in 2013-14.
DWP administers most remaining benefits and paid out £164 billion in 2013-14 to
18 million claimants. Departments have to balance several objectives with the need
to manage costs and reduce fraud and error.
1.2 The level of fraud and error in benefits and tax credits is a long-standing problem.
Over the past 25 years we have examined fraud and error as part of our annual audits
of government accounts and value-for-money reports. In this Part we draw on our
previous work to identify systemic issues in the way departments have managed fraud
and error. We acknowledge that in many cases departments have responded to our earlier
recommendations, and we discuss their recent fraud and error initiatives in Part Three.
A significant and long-standing problem
1.3 Fraud and error has various causes, including: the difficulty of administering
means-tested benefits; and the complexity of benefits, which can cause confusion and
genuine error. Fraud and error can occur when a claimant submits a new claim or, more
often, when they delay or fail to report changes to their circumstances.
1.4 In 2013-14, DWP and HMRC overpaid claimants by £4.6 billion because of fraud
and error, and underpaid claimants by £1.6 billion. Overpayments increase costs to
taxpayers, because departments need to recover debts, and reduce government’sresources available for other purposes. Underpayments mean households are not
getting the support they are entitled to.
1.5 In March 2015 government restated that levels of fraud, error and debt in the
benefits and tax credits system are unacceptably high.2 The Comptroller and Auditor
General has issued qualified opinions on DWP’s accounts since 1988-89, and on
HMRC’s accounts since 2003-04, because of the levels of fraud and error in benefits
and tax credits. The Committee of Public Accounts has repeatedly called for DWP
and HMRC to tackle fraud and error more effectively. It has highlighted the losses that
government could otherwise have spent on other objectives.
2 HM Government, Tackling Fraud, Error and Debt in the benefits and tax credits system , March 2015.

8/16/2019 Fraud-and-error-stocktake.pdf
http://slidepdf.com/reader/full/fraud-and-error-stocktakepdf 14/47
12 Part One Fraud and error stocktake
1.6 Our previous work has highlighted four systemic issues in managing fraudand error: establishing clear strategies and governance; designing controls into the
way departments work; implementing controls and interventions effectively; and
measuring and evaluating performance.
Establishing clear strategies and governance
1.7 Fraud and error can affect all benefits, and arise at many different stages of a
claim. Overpayments arise if departments get initial eligibility assessments wrong or
are unaware of changes in claimants’ circumstances. So departments need to have a
strategy to manage individual benefits, address risks, prioritise interventions and identify
ways to make long-term improvements.
1.8 Departments have struggled to set out comprehensive responses to fraud and
error and align interventions to major areas of risk. For example, our 2011 report
Reducing losses in the benefits system caused by customers’ mistakes found that
DWP had shown less commitment to tackling claimant error than official error, despite
claimant error accounting for a much larger share of losses.3 Our 2013 report Tackling
tax credits error and fraud found HMRC had made progress in some areas to reduce
losses but not in two risk categories, which accounted for £1 billion.4
1.9 There are barriers that departments face in setting out more targeted approaches.
These include not understanding changes in the causes of losses and – in some cases– not adapting their interventions accordingly. Another barrier is unclear governance
and responsibilities. Our 2014 report on Housing Benefit fraud and error concluded that
DWP had not established sufficiently clear responsibilities for tackling fraud and error.5
Designing controls into the way departments work
1.10 Departments need to balance a range of competing objectives when designing
benefits and administrative processes. They should identify and resolve trade-offs with
other objectives, and build controls against fraud and error into the way processes and
rules are designed.
3 Comptroller and Auditor General, Reducing losses in the benefits system caused by customers’ mistakes,
Session 2010-11, HC 704, National Audit Office, January 2011.
4 Comptroller and Auditor General, Tackling tax credits error and fraud , Session 2012-13, HC 891, National Audi t Office,
February 2013.
5 Comptroller and Auditor General, Housing Benefit fraud and error , Session 2014-15, HC 720, National Audit Office,
October 2014.
8/16/2019 Fraud-and-error-stocktake.pdf
http://slidepdf.com/reader/full/fraud-and-error-stocktakepdf 15/47
Fraud and error stocktake Part One 13
1.11 In practice, departments sometimes failed to identify fraud and error risks. The introduction of tax credits in 2003 is a clear example of how the design of a scheme
can lead to unanticipated outcomes, and build in a long-term problem for managing
fraud and error. HMRC initially adopted a ‘pay now, check later’ approach which,
coupled with a low volume of post-payment compliance checks, meant there was a
misalignment between controls and risks. And our 2014 report on Housing Benefit fraud
and error recommended that DWP should improve incentives for local authorities to
prevent and identify fraud and error, and align these incentives with its own aims.6
1.12 Departments will understandably concentrate on core policy objectives when
introducing new schemes, as these often present complex legislative and operational
challenges. In order to ensure that fraud and error is not an afterthought, it is importantthat departments consider how scheme rules affect fraud and error, that trade-offs are
assessed explicitly and controls are designed into schemes from the start.
Implementing controls and interventions effectively
1.13 Even after benefits have been implemented, departments have considerable scope
to improve (or weaken) controls against fraud and error. The administration of benefits
and tax credits involves complicated processes and front-line staff are under competing
pressures to process claims quickly as well as accurately. The detailed steps for making
and updating claims – and the quality of advice available – can also affect how well
claimants understand requirements.
1.14 A risk in managing fraud and error is that incentives to process claims quickly and
efficiently can outweigh incentives to improve accuracy. For example, in our financial
audit of DWP’s benefits we raised concerns that managers in local processing offices
gave greater weight to productivity targets than accuracy targets, and that compliance
with accuracy checks can be weak.
1.15 Because information about processing times and efficiency is often more timely,
and more easily monitored, departments need to pay particular care to ensuring that
steps to improve accuracy are actually observed in practice.
Measuring and evaluating performance
1.16 Over time, departments have improved their measurement and reporting of fraud
and error. This has helped to identify long-term trends in performance and emerging
risks. In order to tackle fraud and error effectively departments must continue to
identify root causes (as well as the effects) of fraud and error, and track the impact of
interventions. This includes a disaggregated view of risks and why claimants make
mistakes, and an assessment of the effectiveness of processing controls and initiatives
for each risk type.
6 See footnote 5.

8/16/2019 Fraud-and-error-stocktake.pdf
http://slidepdf.com/reader/full/fraud-and-error-stocktakepdf 16/47
14 Part One Fraud and error stocktake
1.17 In the past, departments have struggled to assess the impacts of initiatives toreduce fraud and error. Our report on tax credits showed that HMRC overestimated the
impact of its initiatives to reduce losses and did not have a clear understanding of the
relationship with the overall level of fraud and error.7 Our report also recommended that
HMRC strengthen its assessments of different causes of fraud and error. Our recent
work with DWP on individual benefits also highlighted the need to assess the strength
of departmental controls and initiatives by each risk type.
Main steps in managing fraud and error
1.18 Based on these systemic issues we have identified a series of critical factors for
departments in managing fraud and error (Figure 1 ). Part Three looks ahead at howdepartments are addressing these issues.
7 See footnote 4.
Figure 1
Tackling fraud and error – critical factors
a Set out long-term performance aspirations, supported by appropriate operational targets and ongoingreview of the environment.
b Develop clear strategies and target interventions at major areas of loss based on an assessment of thecauses of losses and the impact of different activities to prevent, detect or disrupt fraud and error.
c Establish governance arrangements within and across departments for managing fraud and error.
d Design scheme rules and information requirements giving full consideration to fraud and error risks,and the trade-offs with other departmental priorities.
e Build preventative controls in operational processes and systems.
f Operate controls and interventions effectively.
g Refine controls and interventions in response to improving information about risks and impact.
h Continuously monitor performance in reducing fraud and error and the impact of interventions, consideringthe need to refresh strategies.
i Set clear baselines and benchmarks for evaluating performance and the impact of interventionson fraud and error.
j Establish robust external reporting and audit arrangements.
Source: National Audit Office
Establishing
clear
strategies and
governance
Designing
controls
into the way
departments
work
Implementing
controls and
interventions
effectively
Measuring
and evaluating
performance
8/16/2019 Fraud-and-error-stocktake.pdf
http://slidepdf.com/reader/full/fraud-and-error-stocktakepdf 17/47
Fraud and error stocktake Part Two 15
Part Two
Progress in reducing fraud and error
2.1 During the last five years both the Department for Work & Pensions (DWP) and
HM Revenue & Customs (HMRC) have introduced many initiatives to reduce fraud anderror. In this Part we review departments’ performance in reducing fraud and error,
based on published statistics and their estimates of savings from these activities.
Starting to integrate strategies
2.2 In October 2010 DWP and HMRC published a joint strategy to reduce fraud and
error.8 The strategy set out actions in each department to reduce overpayments, as well
as joint initiatives such as the single fraud investigation service project. Both departments
drew on existing and new initiatives to design a range of fraud and error activities.
2.3 The joint strategy set a target to reduce overpayments by £1.4 billion by 2014-15,a reduction of around one-quarter. To help achieve this, government planned to invest
an extra £425 million over the period.9 The strategy identified a further £400 million in
possible annual savings from HMRC introducing real-time information for claimants who
are paid through pay-as-you-earn tax schemes (Figure 2 overleaf).
2.4 Departments set targets to reduce fraud and error and reassessed whether these
were achievable:
• In 2010 DWP set a target to reduce fraud and error overpayments to 1.7% of
benefit expenditure by 2014-15. In 2012 and 2013 it reassessed and reaffirmed
the target.
• In 2008 HMRC had set a target to reduce tax credits fraud and error overpayments
from 8.9% to 5% by March 2011. It estimated that this would achieve the £600 million
annual saving in 2014-15, as set in the 2010 strategy. In June 2012 HMRC’s
performance measurement indicated it had not hit the 5% target. The following
year it reassessed what was achievable, and replaced its target with an aim to
reduce fraud and error overpayments towards 5.5% by the end of 2014-15.
2.5 The departments did not set targets for reducing underpayments.
8 Department for Work & Pensions and HM Revenue & Customs, Tackling fraud and error in the benefit and tax credits
systems, October 2010.
9 HMRC was not able to draw on this additional funding. Figure 5 on page 21 shows that DWP invested £273million of
the available funding over the period.

8/16/2019 Fraud-and-error-stocktake.pdf
http://slidepdf.com/reader/full/fraud-and-error-stocktakepdf 18/47
16 Part Two Fraud and error stocktake
Recent reductions in headline rates of fraud and error
2.6 Recent progress in reducing fraud and error is mixed (Figure 3 ). HMRC reduced
tax credits fraud and error overpayments from 8.1% in 2010-11 to 4.4% in 2013-14. It has
achieved a statistically significant reduction over this period. Underpayments declined
from 0.8% to 0.6% over the same period.
2.7 Overpayments in DWP benefits have not decreased significantly, but fell from
2.1% in 2010-11 to 1.9% in preliminary figures for 2014-15. Underpayments rose slightly from
0.7% to 0.9%. The overall fraud and error rate masks significant changes in individual
benefits. For example, overpayments of Jobseeker’s Allowance fell from 6.1% to 4.8%
between 2010-11 and 2014-15. Overpayments of Housing Benefit rose from 4.2% to
5.7% over the same period.10
2.8 Within headline rates, there have been individual examples of success in reducing
fraud and error. For example, in 2008 the Comptroller and Auditor General removed the
qualification on the regularity of state pension expenditure, and he decided not to issue
a qualified opinion on the regularity of the 2012-13 Social Fund account after DWP made
sustained reductions in the level of error.
HMRC’s recent estimates show significant reductions
2.9 Until recently HMRC expected fraud and error to remain stable compared to
2011-12. It originally estimated that fraud and error overpayments for 2012-13 were
7.0%, and expected a small increase in 2013-14 due to changes in tax credit rules.11
10 In 2014-15 DWP introduced changes to the way it measured Housing Benefit fraud and error. Using the previous
method, overpayments rose from 4.6% in 2010-11 to 6.1% in 2014-15.
11 HMRC reduced the amount by which a claimant’s income could increase before the level of tax credits paid was
affected. It assumed that this would reduce overall spending on tax credits, but may also increase fraud and error.
Figure 2Joint fraud and error strategy, October 2010
DWP and HMRC aimed to reduce fraud and error overpayments by £1.4 billion
DWP
(£m)
HMRC
(£m)
Total
(£m)
Annual saving by 2014-15 800 600 1,400
Further potential annual saving fromreal-time information
100 300 400
Notes
1 Department for Work & Pensions savings by 2014-15 include £200 million from Universal Credit.
2 Further savings from real-time information depended on successful implementation.
Source: Department for Work & Pensions and HM Revenue & Customs, Tackling fraud and error in the benefit and
tax credits systems, October 2010

8/16/2019 Fraud-and-error-stocktake.pdf
http://slidepdf.com/reader/full/fraud-and-error-stocktakepdf 19/47
Fraud and error stocktake Part Two 17
Figure 3Fraud and error overpayments
Error and fraud (%)
DWP benefits
Overpayment (£bn) 2.9 3.3 3.1 3.2 3.4 3.3 3.2
Total expenditure (£bn) 135.7 148.0 153.4 159.2 166.6 164.0 168.1
Overpayment (%) 2.2 2.2 2.1 2.0 2.0 2.0 1.9
Tax credits
Overpayment (£bn) 2.1 2.1 2.3 2.1 1.5 1.3 Data not available
Total expenditure (£bn) 24.7 27.5 28.5 29.2 29.1 28.8 Data not available
Overpayment (%) 8.9 7.8 8.1 7.3 5.3 4.4 Data not available
Total
Overpayment (£bn) 5.0 5.4 5.5 5.5 4.9 4.6 Data not available
Total expenditure (£bn) 160.4 175.5 181.9 188.4 195.7 192.8 Data not available
Overpayment (%) 3.1 3.1 3.0 2.9 2.5 2.4 Data not available
Notes
1 Excluding State Pension fraud and error overpayments are:
DWP: 2008-09 – 3.9%; 2009-10 – 4.0%; 2010-11 – 3.7%; 2011-12 – 3.7%; 2012-13 – 3.8%; 2013-14 – 3.9%; 2014-15 – 3.7%.
Aggregate: 2008-09 – 5.0%; 2009-10 – 4.9%; 2010-11 – 4.7%; 2011-12 – 4.5%; 2012-13 – 4.2%; 2013-14 – 4.1%.
2 DWP figures for 2014-15 are based on Fraud and error in the benefit system: preliminary 2014/15 estimates first release, 14 May 2015
(www.gov.uk/government/statistics/fraud-and-error-in-the-benefit-system-financial-year-201415-preliminar y-estimates). It expects to
publish fina l estimates for 2014-15 in November 2015.
3 In 2014-15 DWP changed the way it measured Housing Benefit fraud and error to bring it in line with other benefits. DWP has recalculated prior years’ figures
from 2010-11 onwards. The change means that each year the level of overpayments is slightly lower, although this is not always apparent because of rounding.
The overpayment figures using the origina l method are: 2010-11 – £3.2 billion (2.1%); 2011-12 – £3.4 billion (2.1%); 2012-13 – £3.5 billion (2.1%); 2013-14 –
£3.4 billion (2.1%); 2014-15 – £3.3 billion (1.9%). Figures for 2008-09 and 2009-10 use the old method for calculating Housing Benefit fraud and error.
4 When comparing DWP’s performance against its 1.7% target, it is more appropriate to use the original method for calculating overpayments so that
performance is assessed on a like-for-like basis.
5 For a description of the methods used by DWP and HMRC to estimate the value of fraud and error, see National Audit Office, Understanding fraud
and error in benefits and tax credi ts: a primer , July 2015.
6 The range bars show the confidence intervals for each year’s estimate.
7 Figures do not sum due to rounding.
Source: National Audit Office analysis of National Statistics
0
2
4
6
8
10
HMRC
DWP
HMRC’s fraud and error rate has fallen significantly
2008-09 2009-10 2010-11 2011-12 2012-13 2013-14 2014-15
(preliminary)

8/16/2019 Fraud-and-error-stocktake.pdf
http://slidepdf.com/reader/full/fraud-and-error-stocktakepdf 20/47
18 Part Two Fraud and error stocktake
2.10 In June 2015 HMRC released estimates showing a significant decline in fraud anderror. It revised the 2012-13 estimates from 7.0% to 5.3%, a reduction of £490 million.
It also released 2013-14 estimates, showing the fraud and error rate had continued to
fall to 4.4%, which is the lowest level since tax credits were introduced.
2.11 HMRC has not yet had time to assess the reasons for the reductions more fully and
is planning to conduct further detailed analysis. Based on its initial examination:
• HMRC believes that the increasing number of compliance checks over this period,
particularly in its work with credit reference agencies to tackle undeclared partner
risk, have helped to reduce fraud and error. It plans to do more analysis to better
understand the link between initiatives and outcomes;
• HMRC assesses that around half of its revision of 2012-13 estimates was because
losses for undeclared partners had previously been overstated. Some awards that
HMRC initially assessed as incorrect were overturned or amended on appeal; and
• HMRC understands the reasons for the revision of losses for the income risk
which was partly caused by its misclassification of losses between years. It has
not established a full understanding of the reasons for the remainder of the revision
by risk type, including a £90 million reduction in losses due to work and hours.
Composition effects helped to reduce headline rates in DWP
2.12 There are several wider factors that are likely to have af fected fraud and
error, such as:
• Delays to the roll-out of Universal Credit. The 2010 joint strategy estimated that
Universal Credit would reduce overpayments of DWP benefits by £200 million by
2014-15. Delays to roll-out could have hindered DWP from meeting its fraud and
error target, although the impact is uncertain because DWP introduced additional
initiatives into legacy benefits it had not initially planned.
• Reduced income disregards for tax credits. In 2013-14, the government
reduced income disregards, increasing the likelihood of claimants being overpaid
because of unreported changes in income.12 Changing the level of the disregard
may reduce overall spending on benefits while increasing fraud and error.
• Changing claimant types. In our report on Housing Benefit fraud and error we
noted that the increase in in-work claimants – with more variable incomes – might
have contributed to increases in claimant error.13
12 The income disregard is the amount a claimant’s income can increase during the course of the year without affecting
their tax credit entitlement. The disregard was reduced from £10,000 to £5,000 from April 2013.
13 Comptroller and Auditor General, Housing Benefit fraud and error , Session 2014-15, HC 720, National Audit Office,
October 2014.
8/16/2019 Fraud-and-error-stocktake.pdf
http://slidepdf.com/reader/full/fraud-and-error-stocktakepdf 21/47
Fraud and error stocktake Part Two 19
2.13 DWP’s headline rates of fraud and error have benefited from changes in thecomposition of benefits. DWP’s fraud and error rate includes the State Pension, which
has a low rate of overpayments (0.2%). Over the past five years the share of benefit
spending on State Pension has increased relative to working-age benefits, rising from
46% (£70 billion) of spending in 2010-11 to 51% (£87 billion) in 2014-15. This effect has
pulled down the overall rate of overpayments by around 0.2% in 2014-15.
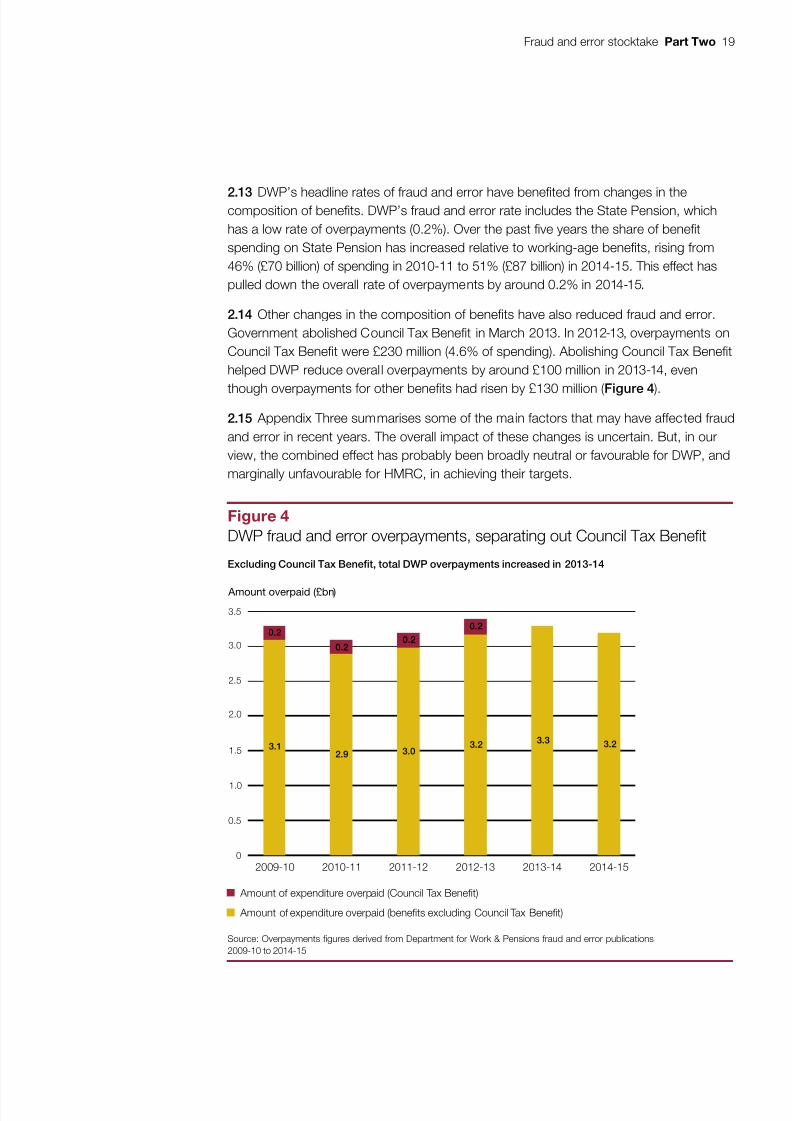
2.14 Other changes in the composition of benefits have also reduced fraud and error.
Government abolished Council Tax Benefit in March 2013. In 2012-13, overpayments on
Council Tax Benefit were £230 million (4.6% of spending). Abolishing Council Tax Benefit
helped DWP reduce overal l overpayments by around £100 million in 2013-14, even
though overpayments for other benefits had risen by £130 million (Figure 4 ).
2.15 Appendix Three summarises some of the main factors that may have affected fraud
and error in recent years. The overall impact of these changes is uncertain. But, in our
view, the combined effect has probably been broadly neutral or favourable for DWP, and
marginally unfavourable for HMRC, in achieving their targets.
Figure 4
DWP fraud and error overpayments, separating out Council Tax Benefit
Amount overpaid (£bn)
Excluding Council Tax Benefit, total DWP overpayments increased in 2013-14
Amount of expenditure overpaid (Council Tax Benefit)
Amount of expenditure overpaid (benefits excluding Council Tax Benefit)
Source: Overpayments figures derived from Department for Work & Pensions fraud and error publications
2009-10 to 2014-15
0.5
1.0
1.5
2.0
2.5
3.0
3.5
0
2009-10 2010-11 2011-12 2012-13 2013-14 2014-15
0.2
3.12.9
0.20.2
3.03.2
3.3 3.2
0.2
8/16/2019 Fraud-and-error-stocktake.pdf
http://slidepdf.com/reader/full/fraud-and-error-stocktakepdf 22/47
20 Part Two Fraud and error stocktake
Mixed performance against 2010 Spending Review commitments
2.16 HMRC has already reduced fraud and error below its aim to reduce losses towards
5.5% by the end of 2014-15. It estimates that fraud and error overpayments were 5.3%
in 2012-13 and fell further to 4.4% in 2013-14. If HMRC sustains the fraud and error rate
at current levels it will meet its target. Due to the lag in measuring fraud and error, the
final results for 2014-15 will be available in June 2016.
2.17 DWP will publish final results for 2014-15 in November 2015. Its preliminary
estimates show that overpayments were 1.9% compared with its target of 1.7%.
Given the uncertainty in estimates and its recent initiatives to reduce fraud and error, it
is possible that estimates for 2014-15 will fall further. However, based on its preliminary
results, DWP is not on track to meet its target. In DWP’s view, it is not possible to know
whether or not it is on track.14
Reliance on correction rather than prevention and design
2.18 The 2010 joint strategy set out to better prevent fraud and error, as well as improve
detection, correction and punishment.15 The departments developed initiatives to identify
higher-risk claims before paying claimants, and to use data better in getting claims right.
For example, each year HMRC targets around 140,000 high-risk tax credits claims when
it is renewing them.
2.19 Sometimes the departments have redesigned benefit rules or processes to control
fraud and error. HMRC redesigned Child Tax Credit rules to require claimants to provide
more information to confirm their entitlement; for example, claimants now need to
confirm each year whether children aged over 16 remain in full-time education.
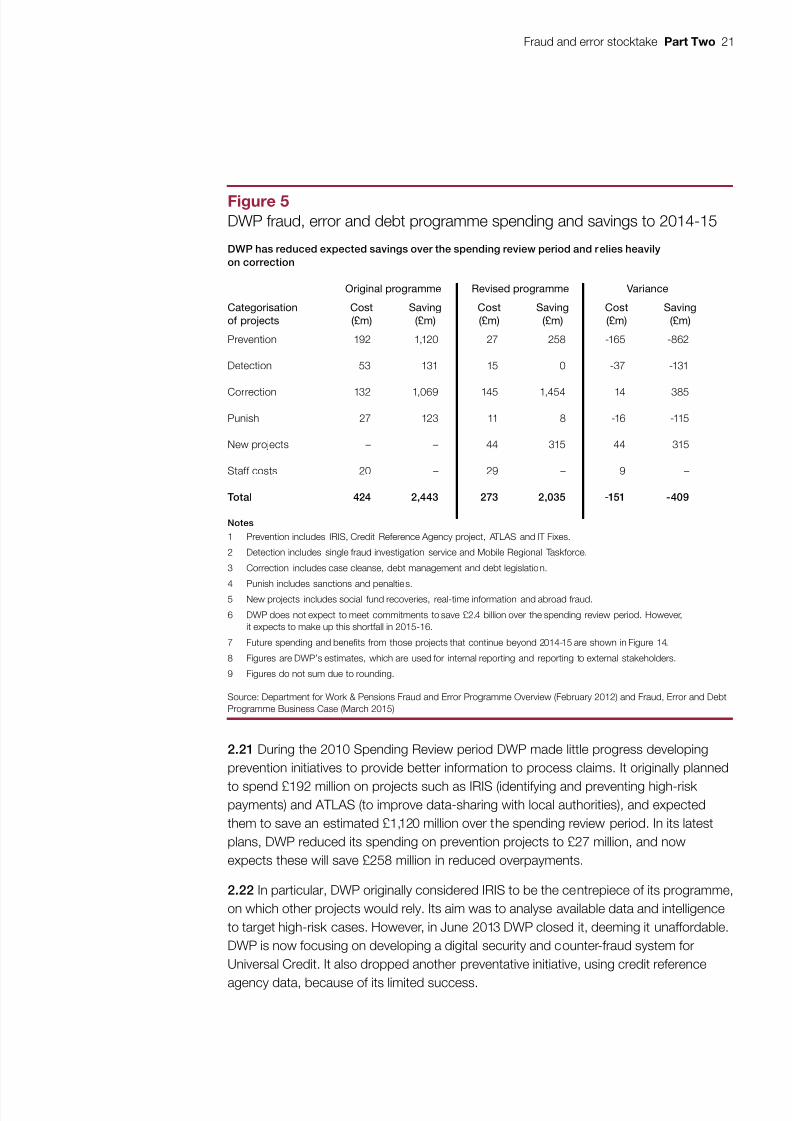
2.20 But DWP has shifted substantially away from the original 2010 strategy due to
limited progress in delivering initiatives to prevent fraud and error. Most benefits of
DWP’s fraud, error and debt programme to 2014-15 came from corrective work, such
as ‘case cleanse’ work to target errors from altered claimant circumstances (Figure 5 ).
DWP estimates that corrective activities saved £1,454 million (71% of total savings) by
March 2015. It is unclear whether this approach will deliver long-term reductions in the
level of fraud and error.
14 DWP said in June 2015: “Achievement of an MVFE level of 1.7% at end 2014-15 remains challenging, but we are
conscious that a number of initiatives (notably the RTI bulk match and FERIS) were not implemented until the second
half of 2014-15 and therefore have yet to be reflected in the data. This is a statistical estimate and by definition there is
inherent uncertainty around the outturn.”
15 The strategy focused on preventing fraud and error from entering the welfare system. It can do this in a number of ways:
simplifying rules and improving claimants’ awareness; increasing the obligation for claimants to report information;
changing the frequency of engagement with claimants; and improving access to information at the point of processing
claims. Where departments could not stop fraud and error entering the welfare system, they seek to identify and stop
overpayments as soon as possible.
8/16/2019 Fraud-and-error-stocktake.pdf
http://slidepdf.com/reader/full/fraud-and-error-stocktakepdf 23/47
Fraud and error stocktake Part Two 21
2.21 During the 2010 Spending Review period DWP made little progress developing
prevention initiatives to provide better information to process claims. It originally planned
to spend £192 million on projects such as IRIS (identifying and preventing high-riskpayments) and ATLAS (to improve data-sharing with local authorities), and expected
them to save an estimated £1,120 million over the spending review period. In its latest
plans, DWP reduced its spending on prevention projects to £27 million, and now
expects these will save £258 million in reduced overpayments.
2.22 In particular, DWP originally considered IRIS to be the centrepiece of its programme,
on which other projects would rely. Its aim was to analyse available data and intelligence
to target high-risk cases. However, in June 2013 DWP closed it, deeming it unaffordable.
DWP is now focusing on developing a digital security and counter-fraud system for
Universal Credit. It also dropped another preventative initiative, using credit reference
agency data, because of its limited success.
Figure 5DWP fraud, error and debt programme spending and savings to 2014-15
DWP has reduced expected savings over the spending review period and relies heavily
on correction
Original programme Revised programme Variance
Categorisation
of projects
Cost
(£m)
Saving
(£m)
Cost
(£m)
Saving
(£m)
Cost
(£m)
Saving
(£m)
Prevention 192 1,120 27 258 -165 -862
Detection 53 131 15 0 -37 -131
Correction 132 1,069 145 1,454 14 385
Punish 27 123 11 8 -16 -115
New projects – – 44 315 44 315
Staff costs 20 – 29 – 9 –
Total 424 2,443 273 2,035 -151 -409
Notes
1 Prevention includes IRIS, Credit Reference Agency project, ATLAS and IT Fixes.
2 Detection includes single fraud investigation service and Mobile Regional Taskforce.
3 Correction includes case cleanse, debt management and debt legislation.
4 Punish includes sanctions and penalties.
5 New projects includes social fund recoveries, real-time information and abroad fraud.
6 DWP does not expect to meet commitments to save £2.4 billion over the spending review period. However,
it expects to make up this shortfall in 2015-16.
7 Future spending and benefits from those projects that continue beyond 2014-15 are shown in Figure 14.
8 Figures are DWP’s estimates, which are used for internal reporting and reporting to external stakeholders.
9 Figures do not sum due to rounding.
Source: Department for Work & Pensions Fraud and Error Programme Overview (February 2012) and Fraud, Error and Debt
Programme Business Case (March 2015)

8/16/2019 Fraud-and-error-stocktake.pdf
http://slidepdf.com/reader/full/fraud-and-error-stocktakepdf 24/47
22 Part Two Fraud and error stocktake
2.23 Similarly, HMRC has concentrated its efforts on detecting and correcting fraudand error. In 2014-15 it used 61 activities, of which 44 sought to detect and correct
existing overpayments (Figure 6 ). Its detection activities accounted for 59% (1.3 million)
of claims examined, and 79% (£370 million) of losses prevented. HMRC has sought to
strengthen its prevention activities. Our 2013 report found that it was improving the way
it assessed new claims before they enter the tax credits system, identifying claims with
a higher risk of error.16
Reductions in fraud and error do not align with detection
of past overpayments
2.24 Both departments have identified large savings (or losses prevented) as a result
of individual projects. HMRC identified net losses prevented of £3.2 billion from all its
compliance activities between 2010-11 and 2014-15. It uses these measures to monitor
its performance in-year. DWP estimates its fraud and error projects saved £2 billion over
the same period. DWP does not monitor savings from its wider fraud and error activities,such as processing benefit claims.
2.25 Initiatives have not always reduced estimates of overall fraud and error as expected.
There are several possible explanations for this. One possibility is that the underlying
risks of fraud and error have changed and that new initiatives have offset an increase
that would otherwise have occurred. Another is that initiatives have simply been less
effective than expected or may take longer to achieve noticeable reductions.
16 Comptroller and Auditor General, Tackling tax credits error and fraud , Session 2012-13, HC 891, National Audi t Office,
February 2013.
Figure 6
HMRC fraud and error interventions during 2014-15
HMRC’s activities are mainly focused on detecting fraud and error
Number of activities Claims examined Net losses prevented
(£m)
Detect/correct 44 1,254,000 370
Prevent 13 868,000 98
Other 4 7,000 <1
Total 61 2,129,000 469
Note
1 HMRC forecasts that total net losses prevented for 2014-15 will be £715 million. The figure will be finalised in
August 2015.
Source: National Audit Office analysis of HMRC activity reports as of March 2015

8/16/2019 Fraud-and-error-stocktake.pdf
http://slidepdf.com/reader/full/fraud-and-error-stocktakepdf 25/47
Fraud and error stocktake Part Two 23
2.26 Departments have not been able to draw clear links between estimated savings(or losses prevented) and rates of fraud and error in order to test the impact of their
initiatives. For example, although DWP did not expect that all savings identified from
projects would result in a drop in the headline rate of fraud and error, it acknowledges
that savings did not correspond with a drop in the rate until the provisional 2014-15
statistics. Given lags in the measurement of fraud and error and a range of external
factors, it is inherently difficult to produce accurate estimates of savings.
2.27 Departments have refined their measures of savings in response to recent experience.
For example, HMRC removed deterrent effects from its estimates in 2013 after it found that
fraud and error was not falling as fast as expected. Nonetheless, departments’ estimates of
savings (or losses prevented) are not yet a reliable measure of the impact on fraud and errorrates. For example, recently HMRC’s fraud and error rate has fallen by significantly more
than its estimated savings from its activities.
Increasing involvement of the centre of government
2.28 The Fraud Error and Debt Taskforce was established by the coalition government
as a strategic decision-making body for all fraud and error, debt and grant efficiency
initiatives across government. The Taskforce was chaired by the Minister for Cabinet
Office and comprised ministers and senior officials from government departments.
It also brought together expertise from the private sector and public sector.
2.29 In July 2013 the centre’s Fraud, Error and Debt team carried out an in-depth review
of the departments’ actions against the strategy, because of government concerns that
insufficient progress had been made. The Taskforce assessed the results of this review,
and created a sub-group in December 2013 to support departments and scrutinise
fraud and error in the benefits and tax credits systems. The Taskforce then held regular
meetings with accounting officers to discuss progress. In July 2014 DWP agreed to the
Taskforce’s request to develop a plan for meeting its 1.7% target.
2.30 In 2015 the Taskforce was replaced by the Fraud, Error and Debt Steering Group,
which comprises senior officials from HM Treasury, the Cabinet Office, HMRC and DWP.
The Steering Group meets regularly to monitor departments’ progress and considerways to further reduce loss and increase debt recovery.
8/16/2019 Fraud-and-error-stocktake.pdf
http://slidepdf.com/reader/full/fraud-and-error-stocktakepdf 26/47
24 Part Three Fraud and error stocktake
Part Three
Shaping the future to tackle fraud and error
3.1 Departments manage benefits and tax credits in an evolving environment. In this
Part we look ahead at the opportunities over the next five years and challenges that thedepartments face in establishing a baseline to assess their performance. To understand
how departments are preparing for future developments, we also consider their recent
initiatives and emerging plans to address the four systemic issues identified in Part One.
Significant new opportunities
3.2 Departments’ ability to manage fraud and error is likely to be helped significantly by
changes to the design of benefits and improved access to data. These include:
• The introduction of Universal Credit. The Department for Work & Pensions (DWP)
expects that Universal Credit will reduce annual fraud and error overpayments byaround £0.5 billion (Figure 7 ). For example, policy changes should design out some
current sources of error, such as incorrectly recording the details of other benefits in
the calculation of a passported benefit such as Housing Benefit.
• Changes to the welfare system. DWP expects that welfare reform will reduce
fraud and error. For example, the government is introducing state pension reforms,
which will reduce reliance on Pension Credit.
• Using real-time information beyond Universal Credit. In 2013-14, DWP and
HM Revenue & Customs (HMRC) estimated that £1.4 billion of fraud and error was
caused by incorrect assessments of claimants’ income. HMRC expects that using
real-time information to check claimants’ earnings will save £410 million on tax creditsover the next two years. DWP expects the use of real-time information wil l save
£356 million between 2015-16 and 2020-21.
• Improving the use of other sources of data. Both departments have longer-term
plans to improve their use of data. DWP is building an analysis and intelligence
hub to improve analytical capability using a wider range of data sources. DWP
is building the hub for Universal Credit and is considering how this could be
used more widely in legacy benefits. HMRC is increasingly using its tax evasion
technology to assess tax credits risks. It is also developing a new enterprise data
hub, which will bring its data together to improve analysis and intelligence-sharing.
• Introducing digital accounts. Departments also plan to introduce digital accounts
on tax credits and Universal Credit, enabling them to interact more frequently with
claimants and make their responsibilities clearer.

8/16/2019 Fraud-and-error-stocktake.pdf
http://slidepdf.com/reader/full/fraud-and-error-stocktakepdf 27/47
Fraud and error stocktake Part Three 25
Figure 7 The impact of Universal Credit on fraud and error
DWP expects Universal Credit to reduce fraud and error overpayments by £0.5 billion
each year once fully rolled-out
Estimated annual savings
(£bn)
Reacting to changes in income 1.0
Abolishing the ‘income changes disregard’ 0.9
No run-ons when people change from out-of-work to in-work 0.1
Designing out in-year tax credits overpayments 0.6
IT – using RTI to report PAYE earnings 0.4
More frequent reporting requirements on claimants 0.2
Designing out fraud and error 0.8
IT – using RTI to report PAYE earnings 0.2
Policy changes 0.5
More frequent reporting requirements on claimants 0.1
Designing in fraud and error -0.3
Increased errors due to abolishing income changes disregard -0.1
Failure of in-work claimants to report capital amounts -0.2
Total 2.1
Notes
1 In-year overpayments occur for tax credits as a result of the way entitlements are determined in advance without
knowing claimants’ income for certain. These overpayments are corrected at the end of the year, and are not
counted as fraud and error.
2 Run-ons occur in: tax credits, which HMRC continues to pay for four weeks after a claimant goes out-of-work; and
Housing Benefit, where DWP continues to pay out-of-work entitlement for four weeks after a claimant moves into work.
3 Policy changes consist of: no longer paying out in-work benefit based on the number of hours worked; childcare no
longer asking for average childcare costs; no disability premiums; different rules for paying back underpayments;
and no incorrect amount of one benefit being taken into account in another benefit.
4 More frequent reporting requirements consist of: child-care costs; self-employed earnings; and no more losses due
to tax credit ‘terminations’.
5 Figures are quoted in 2010-11 prices. They are DWP’s estimates which are used for internal reporting and reporting to
external stakeholders. Figures are DWP’s best estimate as at December 2014. DWP expects to revise the figures as
better information becomes available, for example, to reflect HMRC’s latest estimates of tax credits fraud and error.
Source: National Audit Office analysis of Department for Work & Pensions assessment of Universal Credit Fraud
and Error Savings
Not classedas affecting
fraud and error
Classedas affectingfraud and error
8/16/2019 Fraud-and-error-stocktake.pdf
http://slidepdf.com/reader/full/fraud-and-error-stocktakepdf 28/47
26 Part Three Fraud and error stocktake
3.3 As DWP introduces new processes for administering Universal Credit it will alsohave opportunities to design in more effective operational controls, tackling any new
sources of fraud and error that arise or are identified through better risk analysis. Staff
from both DWP and HMRC with knowledge of fraud and error issues have been involved
with teams designing new systems for Universal Credit, and have helped develop policy
and delivery proposals.
3.4 Although the most significant developments are likely to help in reducing fraud
and error, there are some offsetting factors. Increasing the frequency of re-assessing
entitlement may reduce government spending overall, but with the effect of reclassifying
currently allowed payments as fraud and error. For example, DWP expects that removing
the income disregard used in tax credits (for in-year changes in income) will reduceoverall spending but also slightly increase opportunities for error.
Challenges establishing baselines during transition
3.5 Departments face a long transition to managing fraud and error in Universal Credit.
The migration of claimants is expected to take until at least 2020-21, leaving significant
scope for losses in legacy benefits and tax credits in the interim. There will also continue
to be several large benefits outside Universal Credit, including Personal Independence
Payment, Pension Credit and Child Benefit.
3.6 During the transition period DWP and HMRC will increasingly need to take across-departmental view of fraud and error to understand performance. DWP has
developed projections of the overall rate of fraud and error across benefits and
tax credits. It currently estimates that overall fraud and error will fall from 2.8% of
expenditure in 2013-14 to 2.5% in 2020-21 (Figure 8).
3.7 One of the challenges for establishing a clear baseline is the treatment of in-year
overpayments in tax credits. These in-year overpayments arise from the way tax credits
entitlements are set at the beginning of the year and then finalised later, and they do not
count as fraud and error. DWP intends to include in-year overpayments in a combined
baseline for fraud and error. This shows that the combined total of overpayments and
fraud and error will fall from 4% in 2013-14 to 2.6% in 2020-21. Universal Credit willeliminate these in-year overpayments. DWP will need to be clear about how both types
of overpayment are performing against forecasts.
3.8 The challenge now for HMRC is to sustain the recent reductions in levels of tax
credits fraud and error during the transition to Universal Credit. HMRC believes that the
transition may well limit its scope to develop business cases for further investment in
significant policy or system changes to reduce fraud and error. It says it will continue
to explore options.

8/16/2019 Fraud-and-error-stocktake.pdf
http://slidepdf.com/reader/full/fraud-and-error-stocktakepdf 29/47

8/16/2019 Fraud-and-error-stocktake.pdf
http://slidepdf.com/reader/full/fraud-and-error-stocktakepdf 30/47
28 Part Three Fraud and error stocktake
New strategies and strengthened governance
3.11 In the face of an uncertain and evolving environment, the departments will
need to exploit emerging opportunities and anticipate risks while also maintaining
pressure on existing efforts to reduce fraud and error. The strategies will provide the
basis for departments to make informed decisions on the allocation of resources.
Where changes have to be made, departments need well-established governance
and decision-making arrangements.
3.12 Departments continue to develop strategies for managing fraud and error. DWP is
developing an overall fraud and error strategy up to 2020. In March 2015, it approved
benefit-specific strategies for Pension Credit and Housing Benefit, and plans new
strategies for other legacy benefits by September 2015. The strategies identify major
loss areas, recognise the need to prevent overpayments and set out how DWP will
coordinate its response across the department. Since 2009 HMRC has had a clear
strategy for managing fraud and error, and is continuing to assess its performance
against existing plans until i t publishes its 2014-15 results in summer 2016.
3.13 Departments have also strengthened governance and responsibilities for fraud and
error (Figure 9 ). HMRC has clear lines of accountability for managing its fraud and error
activities and a well-established approach to assigning resources to different activities.
DWP has reorganised responsibilities over the past two years. This includes creating the
new operational service to manage its fraud and error activities, and strengthening the
link between policy, strategy, analytical and operational teams. It has also introduced
clearer oversight of fraud and error activities in Housing Benefit and Pension Credit.
3.14 In April 2015 DWP estimated that fraud and error overpayments will still be
£5.8 billion in 2020-21. As departments develop their strategies they will need to show
that they are targeting major areas of loss. Departments are now tackling income-related
overpayments using real-time information. They will also need to develop effective
approaches in other major risk areas to deliver sustained reductions in fraud and error.
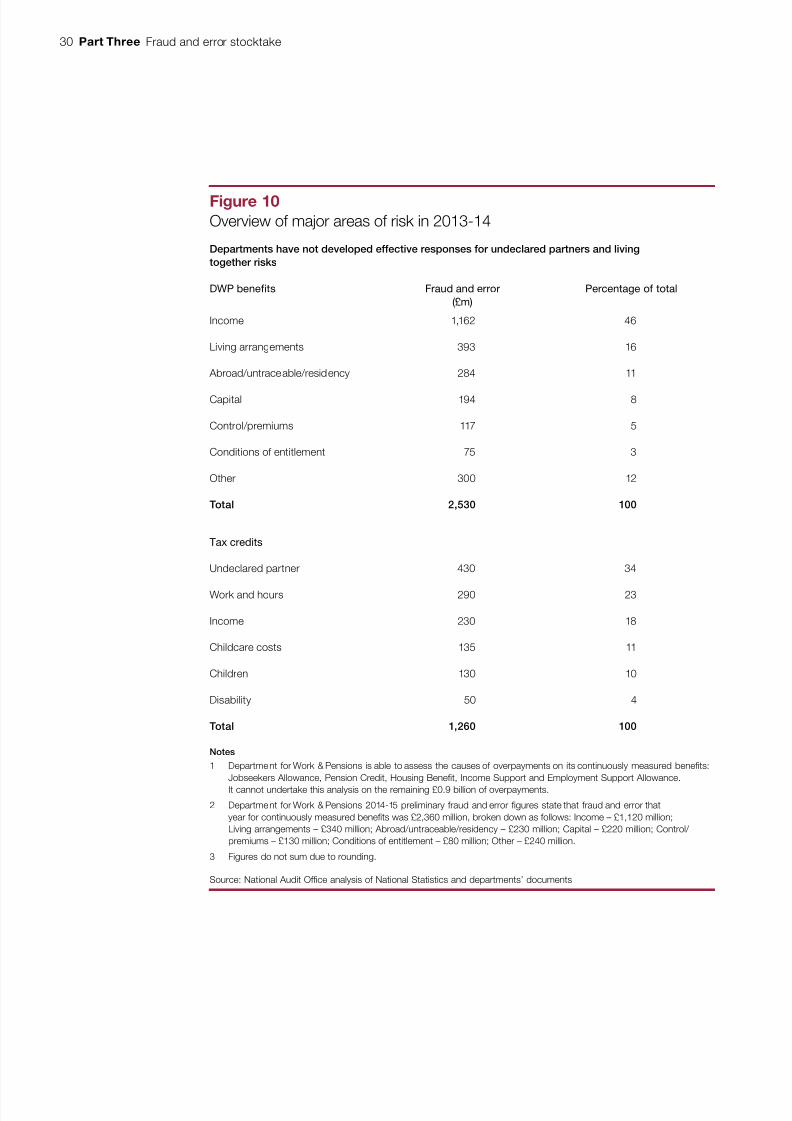
For example, £823 million of fraud and error overpayments were due to undeclared
partner/living arrangements risks in 2013-14 (Figure 10 on page 30).
8/16/2019 Fraud-and-error-stocktake.pdf
http://slidepdf.com/reader/full/fraud-and-error-stocktakepdf 31/47
Fraud and error stocktake Part Three 29
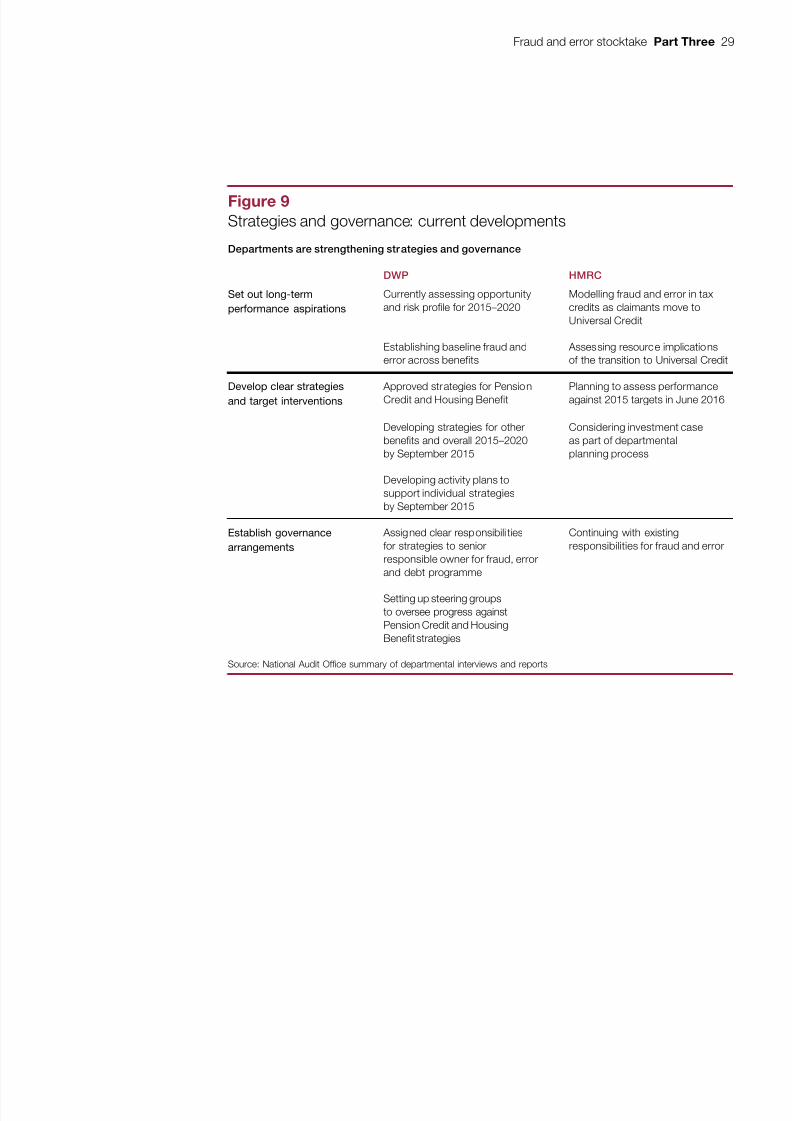
Figure 9Strategies and governance: current developments
Departments are strengthening strategies and governance
DWP HMRC
Set out long-term
performance aspirations
Currently assessing opportunityand risk profile for 2015–2020
Modelling fraud and error in taxcredits as claimants move toUniversal Credit
Establishing baseline fraud anderror across benefits
Assessing resource implicationsof the transition to Universal Credit
Develop clear strategies
and target interventions
Approved strategies for PensionCredit and Housing Benefit
Planning to assess performanceagainst 2015 targets in June 2016
Developing strategies for otherbenefits and overall 2015–2020by September 2015
Considering investment caseas part of departmentalplanning process
Developing activity plans tosupport individual strategiesby September 2015
Establish governance
arrangements
Assigned clear responsibili tiesfor strategies to seniorresponsible owner for fraud, errorand debt programme
Continuing with existingresponsibilities for fraud and error
Setting up steering groupsto oversee progress againstPension Credit and HousingBenefit strategies
Source: National Audit Office summary of departmental interviews and reports
8/16/2019 Fraud-and-error-stocktake.pdf
http://slidepdf.com/reader/full/fraud-and-error-stocktakepdf 32/47
30 Part Three Fraud and error stocktake
Figure 10Overview of major areas of risk in 2013-14
Departments have not developed effective responses for undeclared partners and living
together risks
DWP benefits Fraud and error
(£m)
Percentage of total
Income 1,162 46
Living arrangements 393 16
Abroad/untraceable/residency 284 11
Capital 194 8
Control/premiums 117 5
Conditions of entitlement 75 3
Other 300 12
Total 2,530 100
Tax credits
Undeclared partner 430 34
Work and hours 290 23
Income 230 18
Childcare costs 135 11
Children 130 10
Disability 50 4
Total 1,260 100
Notes
1 Department for Work & Pensions is able to assess the causes of overpayments on its continuously measured benefits:
Jobseekers Allowance, Pension Credit, Housing Benefit, Income Support and Employment Support Allowance.
It cannot undertake this analysis on the remaining £0.9 billion of overpayments.
2 Department for Work & Pensions 2014-15 preliminary fraud and error figures state that fraud and error that
year for continuously measured benefits was £2,360 million, broken down as follows: Income – £1,120 million;
Living arrangements – £340 million; Abroad/untraceable/residency – £230 million; Capital – £220 million; Control/
premiums – £130 million; Conditions of entitlement – £80 million; Other – £240 million.
3 Figures do not sum due to rounding.
Source: National Audit Office analysis of National Statistics and departments’ documents

8/16/2019 Fraud-and-error-stocktake.pdf
http://slidepdf.com/reader/full/fraud-and-error-stocktakepdf 33/47
Fraud and error stocktake Part Three 31
Increasingly aiming for prevention in design
3.15 In Part Two we highlighted the dependence of departments on initiatives to detect
and correct fraud and error, rather than preventing overpayments from arising. Detection
activities will always play a role, but long-term improvements will only be possible if
departments find ways to embed effective responses to fraud and error into the way
benefits are designed and administered. Preventing fraud and error from occurring
eliminates the problems of managing large levels of debt, reduces the cost and difficulty
of recovering overpayments, and lessens claimants’ hardship.
3.16 Both departments have recognised the impact that scheme rules can have on fraud
and error and, increasingly, are factoring in fraud and error when considering scheme
design (Figure 11 overleaf). In addition to Universal Credit, departments have considered
fraud and error in:
• reporting requirements for tax credits. HMRC now requires claimants to report
whether their children aged between 16 and 19 remain in full-time education,
and to provide regular updates if they are reporting high childcare costs. It is also
intending to strengthen conditions of entitlement for self-employed claimants,
including investigating where it believes there is a risk of fraud, and to change
rules to recover more overpayments. In March 2015 HMRC estimated that these
changes would save up to £471 million over five years;
• strengthening conditionality, sanctions and penalties. While DWP has primarilyreformed conditions and sanctions to encourage people into work, it has also
identified reductions in fraud and error from having more clearly defined rules.
In addition, DWP has strengthened the sanctions it can impose on fraudsters,
including raising the levels of penalties and increasing the amount it can take from
benefits to recover fraudulent payments. In a complementary measure, it has
launched two communication campaigns to raise claimants’ awareness of their
obligations and of the detection and punishment for fraud; and
• wider efforts to reduce spending. In some cases departments have had to
consider increases in fraud and error rate as a trade-off for making savings overall.
For example, DWP expects the removal of the assessed income period for PensionCredit, and the more frequent re-assessment of claims for Personal Independence
Payment, to reduce spending overall. But in both cases fraud and error could
increase because fewer changes in circumstances are disregarded.

8/16/2019 Fraud-and-error-stocktake.pdf
http://slidepdf.com/reader/full/fraud-and-error-stocktakepdf 34/47
32 Part Three Fraud and error stocktake
3.17 In addition to scheme rules, departments need to consider how to build controlsinto day-to-day processes. In particular, they need to use data effectively to prevent
fraud and error occurring – by strengthening decision-making at the point of processing
claims and improving their identification of high-risk claims. Real-time information
is a valuable tool and departments are exploring new ways to use it effectively in
administering new claims.
3.18 Both departments have also devoted significant resources to improving their
analysis and use of data. HMRC undertakes an annual assessment of where fraud and
error enters the tax credits system and what errors customers make in different risk
groups. It has introduced annual exercises to check claims with the highest risk of error.
DWP has strengthened its fraud and error analytical team after recognising it couldmake better use of the high-quality analysis the team had been producing. It is also
negotiating with data suppliers to acquire access to new data sets.
3.19 Overall, the departments have recognised the value of using data more effectively
in designing and administering schemes, but there is still some way to go to exploiting
these opportunities fully. Past initiatives to improve the use of data have often achieved
more limited benefits than expected and have had to introduce data-sharing around
– rather than instead of – existing processes. For example, in our report on Housing
Benefit fraud and error in 2014 we found that DWP’s attempts to improve data-sharing
with local authorities were valuable but achieved under half the savings expected.17
17 Comptroller and Auditor General, Housing Benefit fraud and error , Session 2014-15, HC 720, National Audit Office,
October 2014.
Figure 11Designing controls: current developments
Departments are increasingly factoring fraud and error into their scheme design
DWP HMRC
Design scheme rules and
information requirements
Designing out some types of fraudand error in Universal Credit
Changed reporting requirementsfor claimants with children infull-time education and withhigh childcare costs
Embedding fraud and error expertsin policy and delivery design teamsfor Universal Credit
Introducing new tests forself-employed claimants
Build controls into
operational processes
Evaluating impact ofcommunication campaigns
Introduced risk profiling – checking130,000 claims with a high risk ofunreported changes and 140,000high-risk renewals each year
Planning to make RTI data availableto operators processing new claims,starting with Pension Credit inautumn 2015
Piloting new risk tools for changesreported by claimants
Source: National Audit Office summary of departmental interviews and reports

8/16/2019 Fraud-and-error-stocktake.pdf
http://slidepdf.com/reader/full/fraud-and-error-stocktakepdf 35/47
Fraud and error stocktake Part Three 33
Improving incentives but some way to go to embed controls
3.20 One of the systemic challenges for departments is in embedding controls against
fraud and error in the way front-line staff process claims (Figure 12 overleaf). Data and
systems can help to some extent but departments continue to rely heavily on people
to take calls, process payments and check claimant details. The effectiveness of core
operations in managing fraud and error will depend not just on the existence of processes
to check accuracy, but also on the incentives people have to adhere to those processes
and improve performance.
3.21 The departments have introduced some changes to strengthen incentives to
reduce fraud and error, for example:
• adding positive incentives. In our report on Housing Benefit fraud and error we
identified a misalignment between DWP and local authority incentives to prevent
and detect fraud and error. DWP has introduced additional incentive payments,
which nearly all authorities have taken up;18
• introducing stronger monitoring of quality. DWP has introduced a new quality
framework for processing claims with dedicated teams assessing performance
in individual benefit centres. These teams provide a counter-weight to the strong
operational focus on speed of processing; and
•increasing resources for routine checks. HMRC has begun a project with aprivate sector partner, using a payment-by-results contract, to increase its capacity
and significantly increase the number of checks. The contract began in autumn 2014
and is due to run until August 2017. It expects the project to cost £56 million and
deliver lifetime savings of £423 million.19
3.22 Despite these developments, departments still need to manage the tension between
fast and efficient processing and accuracy, and to balance these competing demands
by creating the right incentives for operational staff. Accuracy is less straightforward to
measure and track, and operational teams are continually striving to improve speed of
processing. For example, DWP sets targets to process claims promptly for most benefits
and HMRC cancels some additional checks on new claims to meet processing targets.Building upon recent developments, departments need to ensure sufficient attention to
quality measures, and resource accuracy teams appropriately.
18 See footnote 17.
19 HMRC originally expected to save £1.1 billion but has revised estimates, partly in response to delays to the
start of the programme resulting from problems with the contractor’s systems.

8/16/2019 Fraud-and-error-stocktake.pdf
http://slidepdf.com/reader/full/fraud-and-error-stocktakepdf 36/47
34 Part Three Fraud and error stocktake
Figure 12Implementation: current developments
Operational incentives to target accuracy continue to be relatively weak
DWP HMRC
Operate controls and
interventions effectively
Introduced quality assuranceframework in 2014 to targetbroader measures of quality(not just accuracy)
Interactive guidance for call centreoperators, although not always used
Pre-payment risking for smallnumbers of Pension Credit claims
Use pre-payment risking for new claims;although some checks cancelled tomeet processing targets
Flexible risk-based verification bylocal authorities for Housing Benefit
Call handling and claims processingtargets continue to be most visibleperformance management measures
Refine controls
and interventions
Limited updates to IT systemsdue to planned introduction ofUniversal Credit
Limited updates to IT systems due toplanned introduction of Universal Credit
Quality project to improveconsistency of scripts in call centres
New project to increase the numberof high-risk claims being checked
Additional incentives for localauthorities to detect fraud anderror in Housing Benefit
Source: National Audit Office summary of departmental interviews and reports
8/16/2019 Fraud-and-error-stocktake.pdf
http://slidepdf.com/reader/full/fraud-and-error-stocktakepdf 37/47
Fraud and error stocktake Part Three 35
Many initiatives but challenges in assessing performance
3.23 Looking ahead, both departments recognise the importance of tackling fraud and
error over the next five years. DWP has introduced a number of new initiatives spanning
prevention, detection and correction of claims, which will deliver future benefits. Between
2015-16 and 2021-22 DWP plans to invest a further £545 mill ion in projects tackling
fraud and error. It estimates that its projects will generate savings of £2,941 million over
the same period, including £509 million from ATLAS and £64 million from strengthened
sanctions it can impose on fraudsters. Figure 13 overleaf summarises DWP’s major
initiatives it will invest in from April 2015 onwards.
3.24 Departments are continuing to improve their understanding of the reasons for fraud
and error. They need to develop and embed their assessments of the root causes for
different risk types, analysing their performance and establishing what is achievable.
Departments should seek to develop a better understanding of residual losses and the
barriers to these being reduced.
3.25 Departments will continue to face problems in measuring the impact of their
initiatives. It is inherently difficult to ascribe a direct cause and effect of interventions
on fraud and error rates, because of the impact of other factors, such as changes
in claimants’ behaviours and the wider economic situation. Without clear tracking of
performance and links to outcomes it will be difficult for them to assess performance
robustly. There is a risk that effective measures are not recognised or that ineffective
measures are expanded, so increasing costs. In particular, it is difficult to assess the
impact of preventative measures unless there are clear baselines against which to
assess performance.
3.26 Departments are improving their approaches to measuring performance
(Figure 14 on page 37). To evaluate the impact of more preventative measures,
departments will need to use modelling better, and use a set of measures to evaluate
effectiveness. Over the longer term, departments must measure the impact of
preventative projects against reductions in gross overpayments.

8/16/2019 Fraud-and-error-stocktake.pdf
http://slidepdf.com/reader/full/fraud-and-error-stocktakepdf 38/47
36 Part Three Fraud and error stocktake
Figure 13Forecast costs and savings from DWP’s fraud, error and debtprogramme, 2015-16 to 2021-22
DWP forecasts that its fraud, error and debt programme will continue to deliver savings,
with increased amounts coming from prevention and detection projects
Categorisation
of projects
Projects Estimated cost
(£m)
Estimated saving
(£m)
Prevention Total 44 504
Referral and case management
Business Architecture Frameworkand Services model
IT Fixes
ATLAS
Detection Total 317 575
Single fraud investigation service
Correction Total 60 909
Debt Transformation Programme
Case cleanse
Punish Total 40 64
Sanctions and penalties
New projects Total 76 888
Social Fund recoveries
Abroad fraud
Real-time information
Housing Benefit reductions
Staff costs Total 8 –
Total 545 2,941
Notes
1 Following the introduction of the single fraud investigation service, DWP will reduce the level of grant funding to
local authorities by £234 million. As a result, the estimated net cost of detection projects between 2015-16 and
2021-22 is £83 mi llion.
2 Figures are DWP’s estimates, which are used for internal reporting and reporting to external stakeholders.
3 Figures do not sum due to rounding.
Source: National Audit Office analysis of departmental papers

8/16/2019 Fraud-and-error-stocktake.pdf
http://slidepdf.com/reader/full/fraud-and-error-stocktakepdf 39/47
Fraud and error stocktake Part Three 37
Figure 14Measurement: current developments
Tracking and assessing initiatives will continue to be dif ficult
DWP HMRC
Continuously
monitor performance
Developing a new fraud and errordashboard to provide informationon performance
Planning to introduce a newframework for measuring performance
Set clear baselines
and benchmarks
Adjusted Housing Benefit fraudand error methodology
Reassessing link between lossesprevented measure and level offraud and error
Developing models to assessimpact of interventions onfraud and error
Establish robust
external reporting
Continued reporting to HM Treasuryand Cabinet Office through newFraud Error and Debt Steering Group
Continued reporting to HM Treasuryand Cabinet Office through new FraudError and Debt Steering Group
Note
1 When comparing DWP’s performance against its 1.7% target, it is more appropriate to use the original method for
calculating overpayments so that performance is assessed on a like-for-like basis.
Source: National Audit Office

8/16/2019 Fraud-and-error-stocktake.pdf
http://slidepdf.com/reader/full/fraud-and-error-stocktakepdf 40/47
38 Appendix One Fraud and error stocktake
Appendix One
Our audit approach
1 This report reviewed developments in how the Department for Work & Pensions
(DWP) and HM Revenue & Customs (HMRC) have addressed fraud and error in thebenefits and tax credit system. We considered systemic issues in the way departments
manage fraud and error; reviewed recent progress in addressing these issues; and looked
ahead at emerging opportunities and challenges for the two departments. Our audit
approach is summarised in Figure 15. Our evidence base is described in Appendix Two.

8/16/2019 Fraud-and-error-stocktake.pdf
http://slidepdf.com/reader/full/fraud-and-error-stocktakepdf 41/47
Fraud and error stocktake Appendix One 39
Figure 15Our audit approach
The objective of
government
How this will
be achieved
Our study
Our evaluative
criteria
Our evidence
(see Appendix Twofor details)
Our conclusions
We assessed the departments’ progress in tackling fraud and error by:
• reviewing departmental documents;
• interviewing key staff at the departments and other stakeholders;
• undertaking site visits; and
• reviewing the results of internal and external challenges.
Departments havea clear strategy andeffective governancearrangements.
Departments haveimplemented activitiesto tackle fraud anderror effectively.
Departments haveconsidered how totackle fraud and error intheir design of schemes.
Government’s objective is that the administration of welfare payments is fair and not open to fraud orunnecessary waste.
In October 2010 DWP and HMRC published a joint strategy to tackle fraud and error in benefits and tax creditsthrough reducing overpayments by one-quarter (around £1.4 billion) by March 2015. The departments’ approachbased the strategy around 5 key elements: prevent, detect, correct, punish and deter.
Our study identified four systemic issues that the departments need to address to tackle fraud and error; revieweddepartments progress over the 2010 Spending Review period in addressing these issues; and looked ahead atemerging challenges and opportunities the departments face.
For more than 25 years we have highlighted concerns about fraud and error, and departments’ limited inroads intothe problem. The government continues to lose large amounts of money through overpayments, reducing the money
available for other purposes. And many vulnerable people get less support than they are entitled to. Until recently,departments had not made significant improvements due to an inconsistent and tactical approach to tackling losses.HMRC’s success in reducing fraud and error is encouraging and suggests that its initiatives and a more structuredapproach are tackling overpayments effectively. But the analysis needed to fully understand all of the changes isnot yet complete. Based on its preliminary estimates, DWP has made less progress and is not on track to meet itscommitments to reduce fraud and error to target levels for March 2015. Departments will need to show they can trackthe impact of initiatives through to outcomes if they are to achieve sustained and continuing reductions in fraud anderror. There are many reasons to be optimistic about opportunities to reduce fraud and error, in particular throughthe use of real-time information and introduction of Universal Credit. Real-time information has made it much easierto deal with changes in claimants’ earnings. However, the full impact is still uncertain and it will be several yearsbefore Universal Credit is fully rolled-out. Departments need to build on recent efforts to develop more integratedand systematic responses to preventing fraud and error.
Departments measureand evaluate theirperformance.
8/16/2019 Fraud-and-error-stocktake.pdf
http://slidepdf.com/reader/full/fraud-and-error-stocktakepdf 42/47
40 Appendix Two Fraud and error stocktake
Appendix Two
Our evidence base
1 We completed our stocktake of how the Department for Work & Pensions (DWP) and
HM Revenue & Customs (HMRC) have addressed fraud and error in the benefits and taxcredit system after analysing the evidence we collected between February and June 2015.
2 We used an evaluative framework to consider how effective the departments
have been in reducing fraud and error. Drawing on our past work, we compared the
departments’ progress against their respective plans. We reviewed departmental
documents and correspondence with central government to assess the cost of work
so far, what this spending has produced in terms of savings and its impact on the
overall rate of fraud and error.
3 We identified systemic issues by:
• using our fraud and error benchmarking model to identify the core elementsof an effective control system for managing fraud and error; and
• reviewing our back catalogue of value-for-money, financial audit and fraud
and error benchmarking work to identify how the departments have performed
against these issues.
4 We assessed progress over the 2010 Spending Review period by:
• reviewing departmental documents to understand how they have managed fraud
and error over the 2010 Spending Review period, and how this has developed;
• interviewing departmental officials to understand departments’ approaches andhow this has evolved;
• visiting departments’ operational offices to understand how fraud and error
initiatives are operating in practice;
• reviewing published fraud and error results to understand the types of errors and
risks, when these enter the system, and how this has changed over time;

8/16/2019 Fraud-and-error-stocktake.pdf
http://slidepdf.com/reader/full/fraud-and-error-stocktakepdf 43/47
Fraud and error stocktake Appendix Two 41
•reviewing departments’ fraud and error analytics to understand the causes of fraudand error and the effectiveness of interventions;
• reviewing a sample of projects, to understand how these have performed
compared to departments’ expectations;
• reviewing how departments have measured the impact of losses prevented
on the rate of fraud and error; and
• interviewing external stakeholders to understand their assessment of the
departments’ progress in tackling fraud and error.
5 We identified challenges and opportunities departments need to face by:
• interviewing senior staff about preparations up to 2020;
• reviewing documents relating to the development of Universal Credit to identify
the impact this will have; and
• reviewing documents to establish departments’ strategies for managing legacy
benefits up to when they are superseded by Universal Credit.
6 Our assessment excludes HMRC’s management of Child Benefit. HMRC does
not publish the estimated level of fraud and error overpayments. It developed a new
methodology for 2014-15 and we will monitor HMRC’s performance in tackling fraud
and error in future years.
7 In 2014-15 DWP introduced changes to the way it measured Housing Benefit
fraud and error, bringing its approach into line with other benefits. We have presented
fraud and error figures using the revised methodology, ensuring a consistent basis for
comparisons across years. We have also included footnotes to show the fraud and error
rates using the previous methodology, to allow the reader to compare back to previous
national statistics and National Audit Office publications.
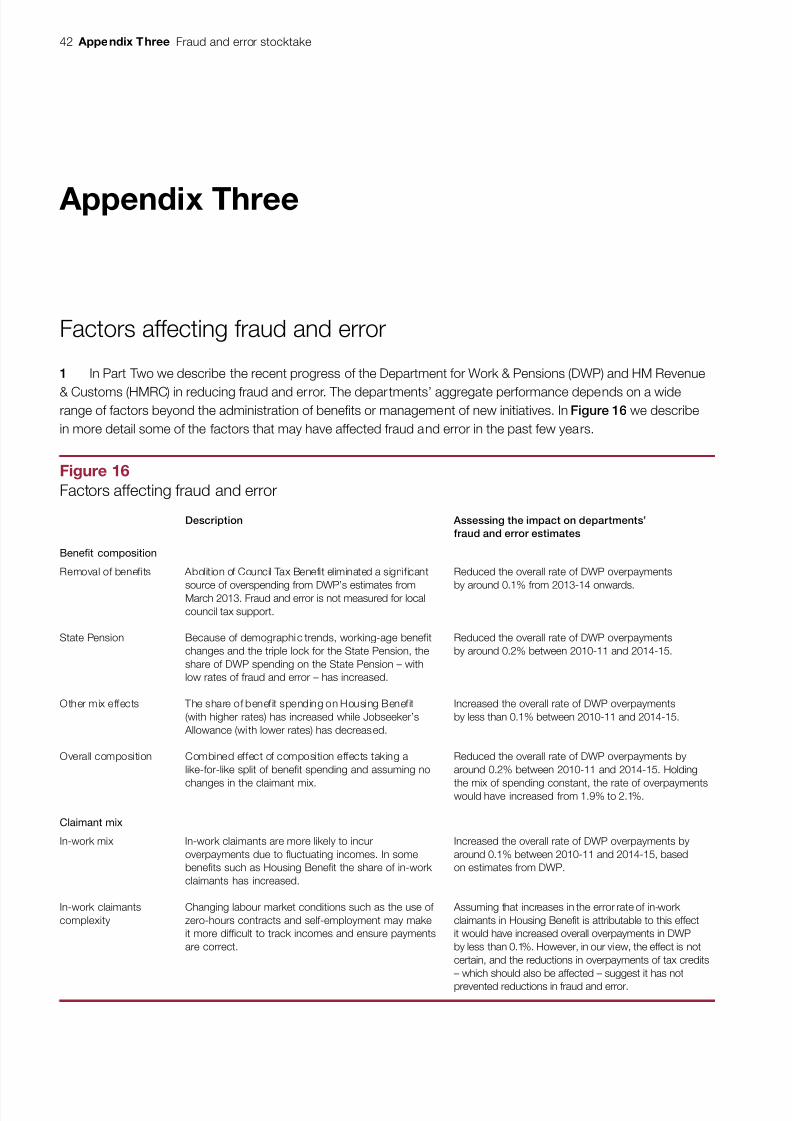
8/16/2019 Fraud-and-error-stocktake.pdf
http://slidepdf.com/reader/full/fraud-and-error-stocktakepdf 44/47

8/16/2019 Fraud-and-error-stocktake.pdf
http://slidepdf.com/reader/full/fraud-and-error-stocktakepdf 45/47
Fraud and error stocktake Appendix Three 43
Figure 16 Continued Factors affecting fraud and error
Description Assessing the impact on departments’
fraud and error estimates
Programme dependencies
Universal Credit DWP expected to ro ll out Universal Credit byOctober 2013. Delays to roll-out have delayedexpected savings of £200 million in fraud anderror overpayments.
Assuming that Universa l Credit does reduceoverpayments in DWP benefits of £200 million,this would have increased overall overpayments by0.1% in 2014-15. However, the ef fect is uncerta in.
Policy changes
Tax credit disregards HMRC reduced dis regards on changes in income in2013-14. By reducing disregards the level of fraud anderror is likely to increase (as more changes in incomerequire changes to entitlement).
This is likely to increase HMRC fraud and error from2013-14 although the scale of the effect is not known.
Measurement changes
Housing Benef it In 2014-15 DWP introduced changes to the way itmeasured Housing Benefit fraud and error, bringing itsapproach into line with other benefits.
Reduced the overall rate of overpayments in DWPbenefits in 2014-15 by around 0.1% although due torounding the rate of overpayments was 1.9% underboth methods. When comparing with existing targetswe use the old methodology in order to ensure alike-for-like basis for comparison.
Source: National Audit Office analysis of published statistics and departments’ own analysis

8/16/2019 Fraud-and-error-stocktake.pdf
http://slidepdf.com/reader/full/fraud-and-error-stocktakepdf 46/47
This report has been printed on Evolution
Digital Satin and contains material sourced
from responsibly managed and sustainable
forests certified in accordance with the FSC
(Forest Stewardship Council).
The wood pulp is totally recyclable and
acid-free. Our printers also have full ISO 14001
environmental accreditation, which ensuresthat they have effective procedures in place to
manage waste and practices that may affect
the environment.

8/16/2019 Fraud-and-error-stocktake.pdf
http://slidepdf.com/reader/full/fraud-and-error-stocktakepdf 47/47
£10.00
ISBN 978-1-904219-97-2
Related Documents