FRANKLIN TEMPLETON INVESTMENT FUNDS société d’investissement à capital variable June 30, 2021 AUDITED ANNUAL REPORT R.C.S. B35177

Welcome message from author
This document is posted to help you gain knowledge. Please leave a comment to let me know what you think about it! Share it to your friends and learn new things together.
Transcript
FRANKLIN TEMPLETON INVESTMENT FUNDSsociété d’investissement à capital variableJune 30, 2021
AUDITED ANNUAL REPORT
R.C.S. B35177

FRANKLIN TEMPLETON INVESTMENT FUNDSsociété d’investissement à capital variable
AUDITED ANNUAL REPORTFor the year ended June 30, 2021
This report shall not constitute an offer or a solicitation of an offer to buy shares of Franklin Templeton Investment Funds (the “Company”). Subscriptions are to be made on the basis of the current prospectus and its addendum as the case may be, where available the relevant Key Investor Information Documents (“KIIDs”), a copy of the latest available audited annual report and, if published thereafter, the latest unaudited semi-annual report.The auditor’s report refers only to the full English version of the Annual Report and not to any translated versions.

www.franklintempleton.lu AUDITED ANNUAL REPORT 5
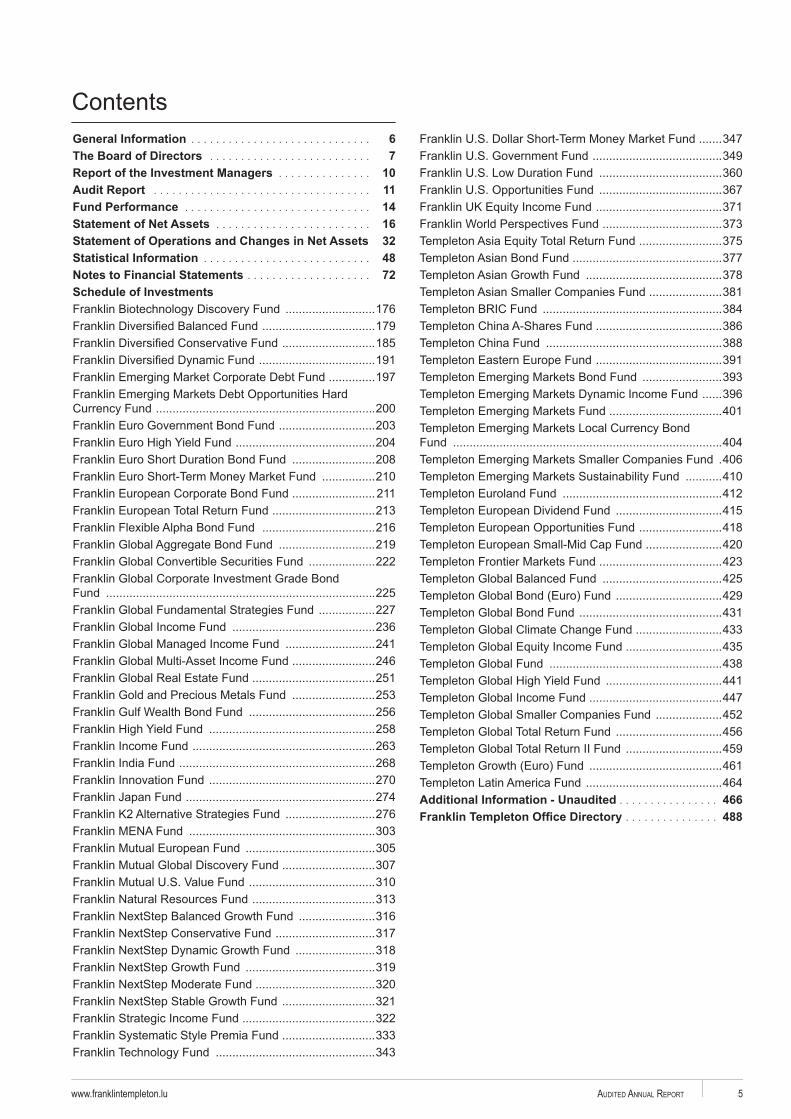
General Information . . . . . . . . . . . . . . . . . . . . . . . . . . . . . 6The Board of Directors . . . . . . . . . . . . . . . . . . . . . . . . . . 7Report of the Investment Managers . . . . . . . . . . . . . . . 10Audit Report . . . . . . . . . . . . . . . . . . . . . . . . . . . . . . . . . . . 11Fund Performance . . . . . . . . . . . . . . . . . . . . . . . . . . . . . . 14Statement of Net Assets . . . . . . . . . . . . . . . . . . . . . . . . . 16Statement of Operations and Changes in Net Assets 32Statistical Information . . . . . . . . . . . . . . . . . . . . . . . . . . . 48Notes to Financial Statements . . . . . . . . . . . . . . . . . . . . 72Schedule of InvestmentsFranklin Biotechnology Discovery Fund .......................... .176
................................. .179 ........................... .185
.................................. .191............. .197
................................................................. .200 ............................ .203
......................................... .204Franklin Euro Short Duration Bond Fund ........................ .208
............... .210........................ .211
.............................. .213 ................................. .216
............................ .219 ................... .222
Fund ................................................................................ .225 ................ .227
.......................................... .236 .......................... .241
........................ .246.................................... .251
........................ .253Franklin Gulf Wealth Bond Fund ..................................... .256
................................................. .258 ...................................................... .263
.......................................................... .268 ................................................. .270
........................................................ .274 .......................... .276
....................................................... .303 ...................................... .305
........................... .307 ..................................... .310 .................................... .313
...................... .316 ............................. .317
....................... .318 ...................................... .319
................................... .320 ........................... .321
....................................... .322........................... .333
Franklin Technology Fund ............................................... .343
...... .347 ...................................... .349 .................................... .360 .................................... .367 ..................................... .371
................................... .373 ........................ .375
............................................ .377 ........................................ .378
..................... .381 ..................................................... .384
..................................... .386 .................................................... .388
..................................... .391 ....................... .393
..... .396................................. .401
Fund ................................................................................ .404 .406
.......... .410 ............................................... .412
............................... .415 ........................ .418
...................... .420.................................... .423 ................................... .425
............................... .429 .......................................... .431
......................... .433............................ .435
................................................... .438 .................................. .441
....................................... .447 ................... .452
............................... .456 ............................ .459
....................................... .461 ........................................ .464
Additional Information - Unaudited . . . . . . . . . . . . . . . . 466 . . . . . . . . . . . . . . . 488
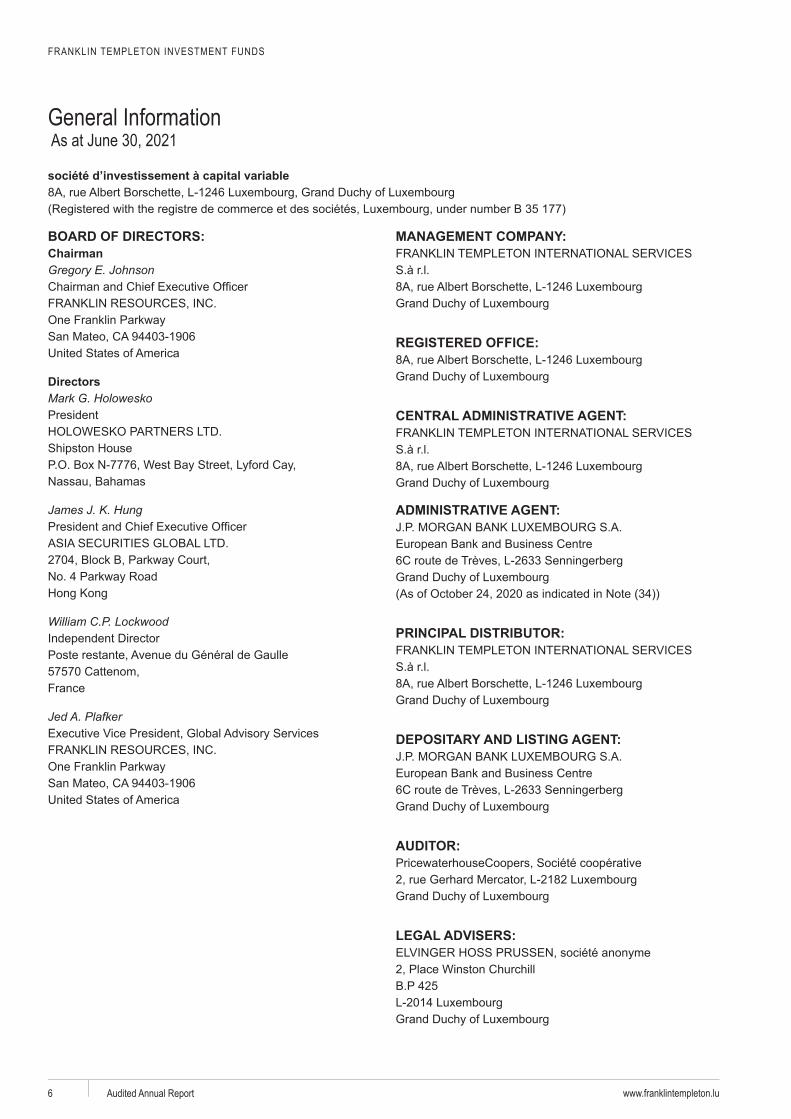
FRANKLIN TEMPLETON INVESTMENT FUNDS
General Information As at June 30, 2021
www.franklintempleton.luAudited Annual Report6
société d’investissement à capital variable
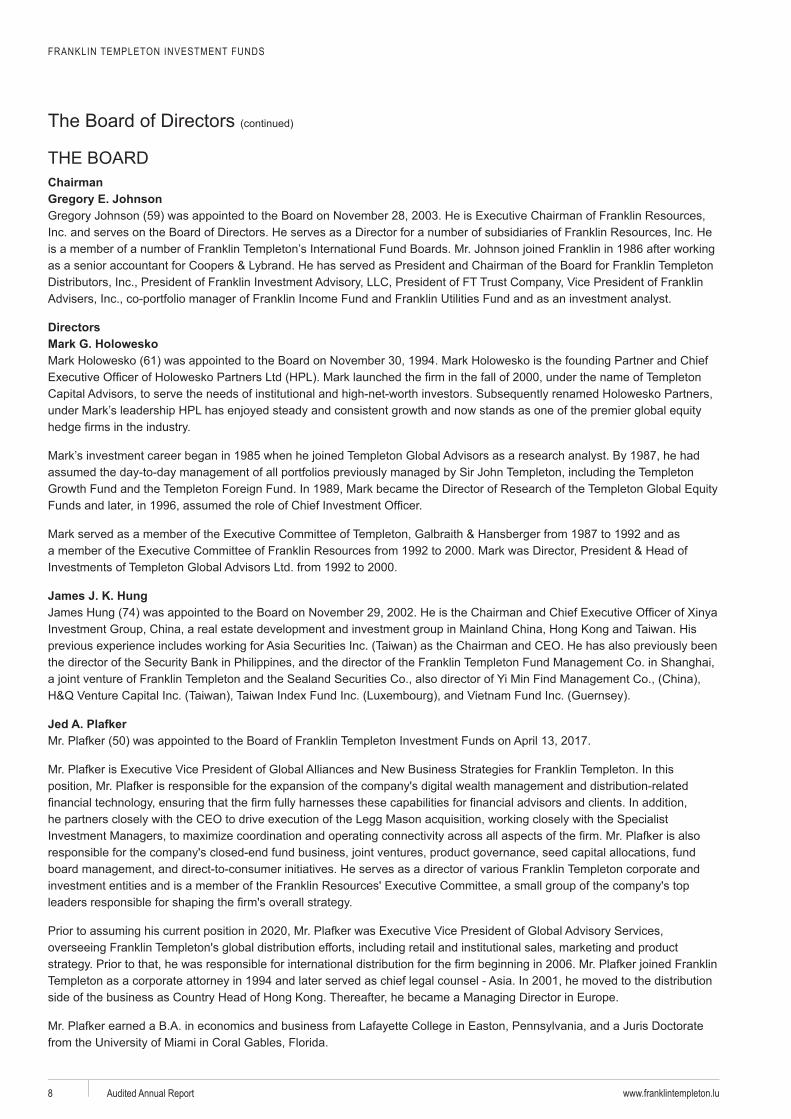
BOARD OF DIRECTORS:Chairman Gregory E. Johnson
DirectorsMark G. HoloweskoPresident
James J. K. Hung
William C.P. Lockwood
France
Jed A. Plafker
MANAGEMENT COMPANY:
S.à r.l.
REGISTERED OFFICE:
CENTRAL ADMINISTRATIVE AGENT:
S.à r.l.
ADMINISTRATIVE AGENT:
PRINCIPAL DISTRIBUTOR:
S.à r.l.
DEPOSITARY AND LISTING AGENT:
AUDITOR:
LEGAL ADVISERS:
B.P 425
FRANKLIN TEMPLETON INVESTMENT FUNDS
www.franklintempleton.lu Audited Annual Report 7
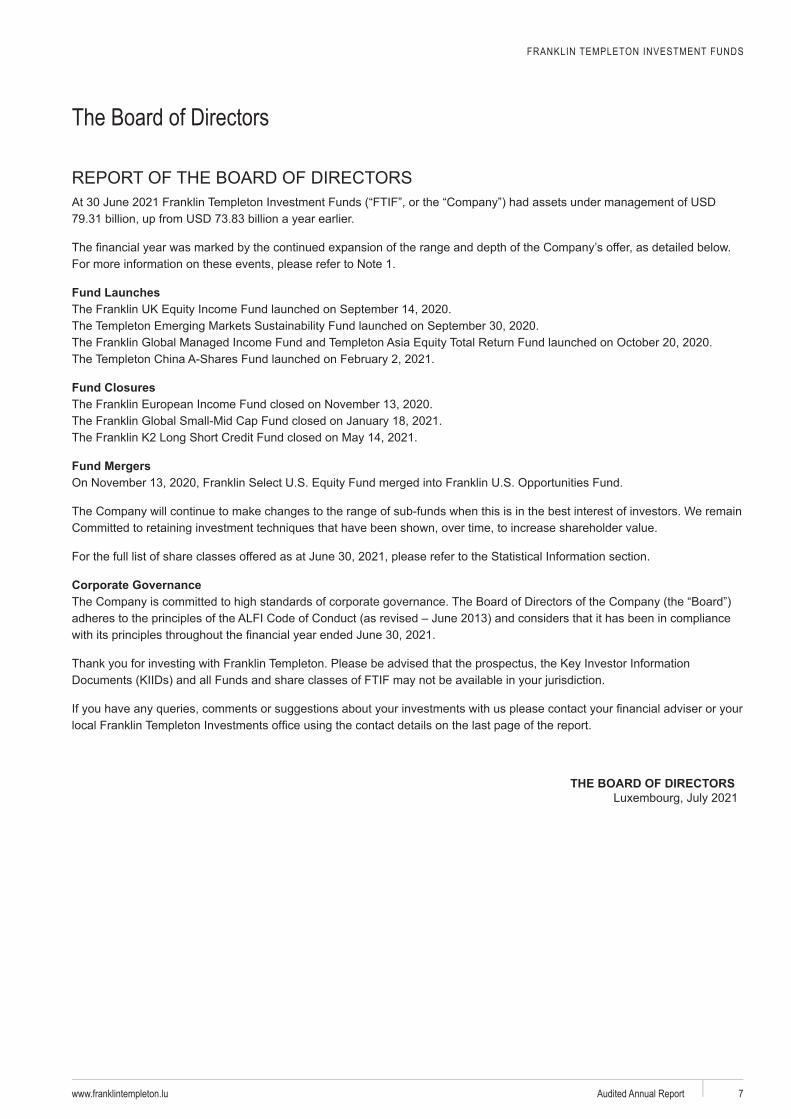
The Board of Directors
Fund Launches
Fund Closures
Fund Mergers
Corporate Governance
THE BOARD OF DIRECTORS
FRANKLIN TEMPLETON INVESTMENT FUNDS
www.franklintempleton.luAudited Annual Report8
The Board of Directors
Chairman
Directors
FRANKLIN TEMPLETON INVESTMENT FUNDS
www.franklintempleton.lu Audited Annual Report 9
The Board of Directors
FRANKLIN TEMPLETON INVESTMENT FUNDS
www.franklintempleton.luAudited Annual Report10
Report of the Investment ManagersYear to June 30, 2021
THE INVESTMENT MANAGERS
The information stated in this report represents historical data and is not an indication of future results.
PricewaterhouseCoopers, Société coopérative, 2 rue Gerhard Mercator, B.P. 1443, L-1014 LuxembourgT : +352 494848 1, F : +352 494848 2900, www.pwc.lu Cabinet de révision agréé. Expert-comptable (autorisation gouvernementale n°10028256)R.C.S. Luxembourg B 65 477 - TVA LU25482518
Audit report
To the Shareholders ofFranklin Templeton Investment Funds
Our opinion
In our opinion, the accompanying financial statements give a true and fair view of the financial position of Franklin Templeton Investment Funds (the “Fund”) and of each of its sub-funds as at 30 June 2021, and of the results of their operations and changes in their net assets for the year then ended in accordance with Luxembourg legal and regulatory requirements relating to the preparation and presentation of the financial statements.
What we have audited
The Fund’s financial statements comprise:
• the statement of net assets as at 30 June 2021;• the schedule of investments as at 30 June 2021;• the statement of operations and changes in net assets for the year then ended; and• the notes to the financial statements, which include a summary of significant accounting policies.
Basis for opinion
We conducted our audit in accordance with the Law of 23 July 2016 on the audit profession (Law of 23 July 2016) and with International Standards on Auditing (ISAs) as adopted for Luxembourg by the “Commission de Surveillance du Secteur Financier” (CSSF). Our responsibilities under the Law of 23 July 2016 and ISAs as adopted for Luxembourg by the CSSF are further described in the “Responsibilities of the “Réviseur d’entreprises agréé” for the audit of the financial statements” section of our report.
We believe that the audit evidence we have obtained is sufficient and appropriate to provide a basis for our opinion.
We are independent of the Fund in accordance with the International Code of Ethics for Professional Accountants, including International Independence Standards, issued by the International Ethics Standards Board for Accountants (IESBA Code) as adopted for Luxembourg by the CSSF together with the ethical requirements that are relevant to our audit of the financial statements. We have fulfilled our other ethical responsibilities under those ethical requirements.
Other information
The Board of Directors is responsible for the other information. The other information comprises the information stated in the annual report but does not include the financial statements and our audit report thereon.
Our opinion on the financial statements does not cover the other information and we do not express any form of assurance conclusion thereon.
12
In connection with our audit of the financial statements, our responsibility is to read the other information identified above and, in doing so, consider whether the other information is materially inconsistent with the financial statements or our knowledge obtained in the audit, or otherwise appears to be materially misstated. If, based on the work we have performed, we conclude that there is a material misstatement of this other information, we are required to report that fact. We have nothing to report in this regard.
Responsibilities of the Board of Directors for the financial statements
The Board of Directors is responsible for the preparation and fair presentation of the financial statements in accordance with Luxembourg legal and regulatory requirements relating to the preparation and presentation of the financial statements, and for such internal control as the Board of Directors determines is necessary to enable the preparation of financial statements that are free from material misstatement, whether due to fraud or error.
In preparing the financial statements, the Board of Directors is responsible for assessing the Fund’s and each of its sub-funds' ability to continue as a going concern, disclosing, as applicable, matters related to going concern and using the going concern basis of accounting unless the Board of Directors either intends to liquidate the Fund or close any of its sub-funds or to cease operations, or has no realistic alternative but to do so.
Responsibilities of the “Réviseur d’entreprises agréé” for the audit of the financial statements
The objectives of our audit are to obtain reasonable assurance about whether the financial statements as a whole are free from material misstatement, whether due to fraud or error, and to issue an audit report that includes our opinion. Reasonable assurance is a high level of assurance, but is not a guarantee that an audit conducted in accordance with the Law of 23 July 2016 and with ISAs as adopted for Luxembourg by the CSSF will always detect a material misstatement when it exists. Misstatements can arise from fraud or error and are considered material if, individually or in the aggregate, they could reasonably be expected to influence the economic decisions of users taken on the basis of these financial statements.
As part of an audit in accordance with the Law of 23 July 2016 and with ISAs as adopted for Luxembourg by the CSSF, we exercise professional judgment and maintain professional scepticism throughout the audit. We also:
• identify and assess the risks of material misstatement of the financial statements, whether due to fraud or error, design and perform audit procedures responsive to those risks, and obtain audit evidence that is sufficient and appropriate to provide a basis for our opinion. The risk of not detecting a material misstatement resulting from fraud is higher than for one resulting from error, as fraud may involve collusion, forgery, intentional omissions, misrepresentations, or the override of internal control;
• obtain an understanding of internal control relevant to the audit in order to design audit procedures that are appropriate in the circumstances, but not for the purpose of expressing an opinion on the effectiveness of the Fund’s internal control;
• evaluate the appropriateness of accounting policies used and the reasonableness of accounting estimates and related disclosures made by the Board of Directors;
13
• conclude on the appropriateness of the Board of Directors’ use of the going concern basis of accounting and, based on the audit evidence obtained, whether a material uncertainty exists related to events or conditions that may cast significant doubt on the Fund’s or any of its sub-funds' ability to continue as a going concern. If we conclude that a material uncertainty exists, we are required to draw attention in our audit report to the related disclosures in the financial statements or, if such disclosures are inadequate, to modify our opinion. Our conclusions are based on the audit evidence obtained up to the date of our audit report. However, future events or conditions may cause the Fund or any of its sub-funds (except for Franklin Templeton Investment Funds - Franklin Euro Short-Term Money Market Fund where a decision to liquidate exists) to cease to continue as a going concern;
• evaluate the overall presentation, structure and content of the financial statements, including the disclosures, and whether the financial statements represent the underlying transactions and events in a manner that achieves fair presentation.
We communicate with those charged with governance regarding, among other matters, the planned scope and timing of the audit and significant audit findings, including any significant deficiencies in internal control that we identify during our audit.
PricewaterhouseCoopers, Société coopérativeRepresented by@esig
@esigSteven Libby
Luxembourg, 8 October 2021
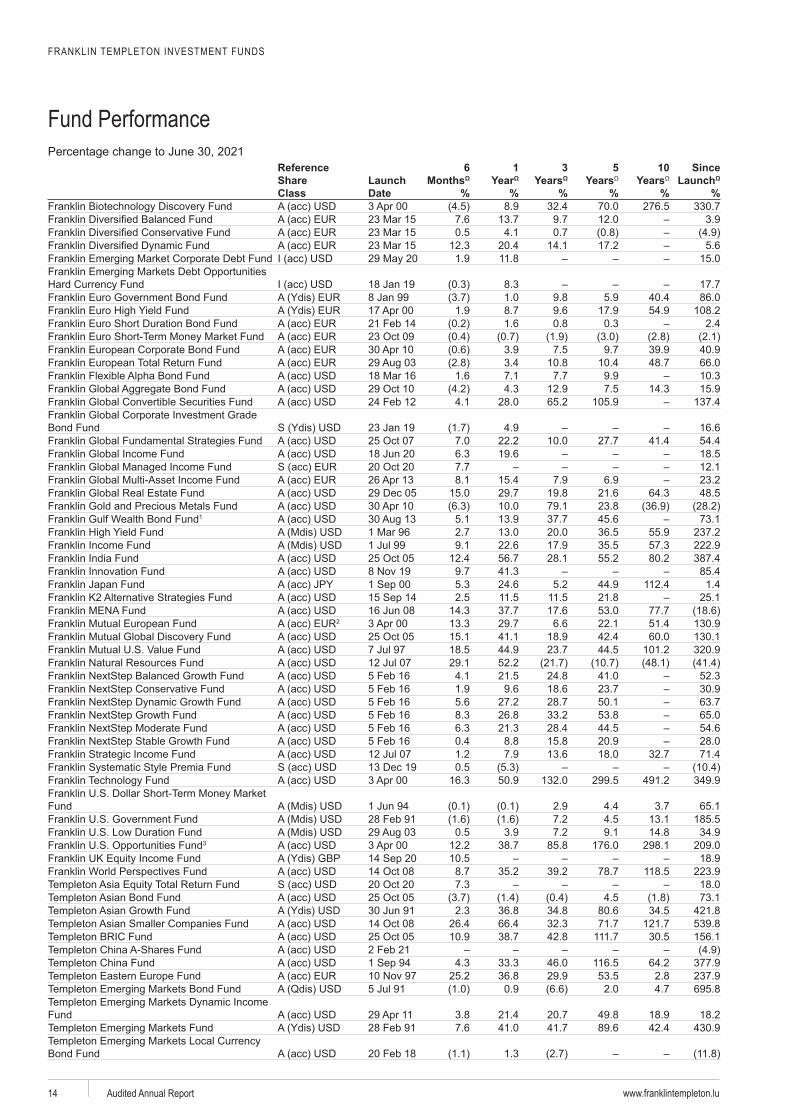
Fund Performance
FRANKLIN TEMPLETON INVESTMENT FUNDS
www.franklintempleton.luAudited Annual Report14
Reference Share Class
Launch Date
6 Months
%
1 Year
%
3 Years
%
5 Years
%
10 Years
%
Since Launch
%Franklin Biotechnology Discovery Fund acc 8.9 32.4 70.0 276.5 330.7
acc 7.6 13.7 9.7 12.0 3.9acc 0.5 4.1 0.7acc 12.3 20.4 14.1 17.2 5.6
acc 1.9 11.8 15.0
acc 18 Jan 19 8.3 17.78 Jan 99 1.0 9.8 5.9 40.4 86.0
1.9 8.7 9.6 17.9 54.9 108.2Franklin Euro Short Duration Bond Fund acc 1.6 0.8 0.3 2.4
accacc 3.9 7.5 9.7 39.9 40.9acc 3.4 10.8 10.4 48.7 66.0acc 1.6 7.1 7.7 9.9 10.3acc 4.3 12.9 7.5 14.3 15.9acc 4.1 28.0 65.2 105.9 137.4
Bond Fund 23 Jan 19 4.9 16.6acc 7.0 22.2 10.0 27.7 41.4 54.4acc 18 Jun 20 6.3 19.6 18.5acc 7.7 12.1acc 8.1 15.4 7.9 6.9 23.2acc 29 Dec 05 15.0 29.7 19.8 21.6 64.3 48.5acc 10.0 79.1 23.8
Franklin Gulf Wealth Bond Fund1 acc 5.1 13.9 37.7 45.6 73.12.7 13.0 20.0 36.5 55.9 237.2
1 Jul 99 9.1 22.6 17.9 35.5 57.3 222.9acc 12.4 56.7 28.1 55.2 80.2 387.4acc 9.7 41.3 85.4acc 5.3 24.6 5.2 44.9 112.4 1.4acc 2.5 11.5 11.5 21.8 25.1acc 16 Jun 08 14.3 37.7 17.6 53.0 77.7acc 2 13.3 29.7 6.6 22.1 51.4 130.9acc 15.1 41.1 18.9 42.4 60.0 130.1acc 7 Jul 97 18.5 44.9 23.7 44.5 101.2 320.9acc 12 Jul 07 29.1 52.2
Franklin acc 4.1 21.5 24.8 41.0 52.3Franklin acc 1.9 9.6 18.6 23.7 30.9Franklin acc 5.6 27.2 28.7 50.1 63.7Franklin acc 8.3 26.8 33.2 53.8 65.0Franklin acc 6.3 21.3 28.4 44.5 54.6Franklin acc 0.4 8.8 15.8 20.9 28.0
acc 12 Jul 07 1.2 7.9 13.6 18.0 32.7 71.4 Fund acc 13 Dec 19 0.5
Franklin Technology Fund acc 16.3 50.9 132.0 299.5 491.2 349.9
Fund 1 Jun 94 2.9 4.4 3.7 65.17.2 4.5 13.1 185.5
0.5 3.9 7.2 9.1 14.8 34.93 acc 12.2 38.7 85.8 176.0 298.1 209.0
10.5 18.9acc 8.7 35.2 39.2 78.7 118.5 223.9acc 7.3 18.0acc 4.5 73.1
30 Jun 91 2.3 36.8 34.8 80.6 34.5 421.8acc 26.4 66.4 32.3 71.7 121.7 539.8acc 10.9 38.7 42.8 111.7 30.5 156.1accacc 4.3 33.3 46.0 116.5 64.2 377.9acc 25.2 36.8 29.9 53.5 2.8 237.9
5 Jul 91 0.9 2.0 4.7 695.8
Fund acc 3.8 21.4 20.7 49.8 18.9 18.27.6 41.0 41.7 89.6 42.4 430.9
Bond Fund acc 1.3
www.franklintempleton.lu Audited Annual Report 15
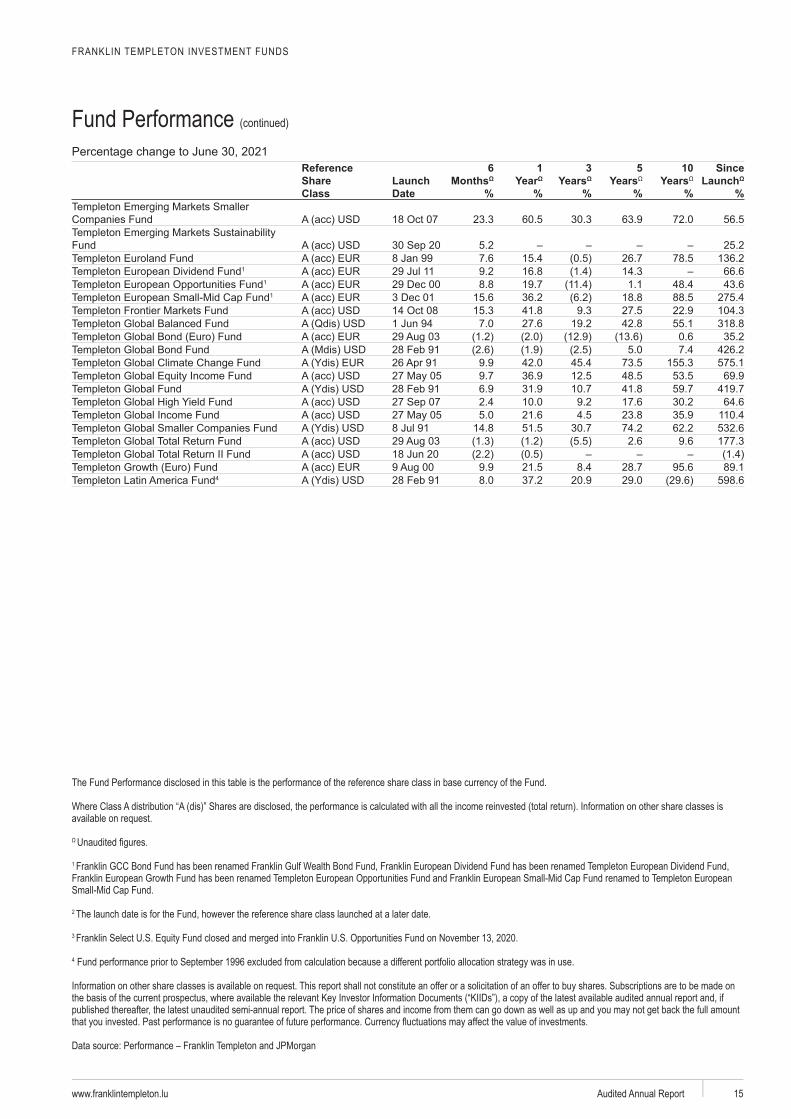
Fund Performance (continued)
FRANKLIN TEMPLETON INVESTMENT FUNDS
Reference Share Class
Launch Date
6 Months
%
1 Year
%
3 Years
%
5 Years
%
10 Years
%
Since Launch
%
acc 23.3 60.5 30.3 63.9 72.0 56.5
Fund acc 5.2 25.2acc 8 Jan 99 7.6 15.4 26.7 78.5 136.2
1 acc 29 Jul 11 9.2 16.8 14.3 66.61 acc 29 Dec 00 8.8 19.7 1.1 48.4 43.6
1 acc 3 Dec 01 15.6 36.2 18.8 88.5 275.4acc 15.3 41.8 9.3 27.5 22.9 104.3
1 Jun 94 7.0 27.6 19.2 42.8 55.1 318.8acc 0.6 35.2
5.0 7.4 426.29.9 42.0 45.4 73.5 155.3 575.1
acc 9.7 36.9 12.5 48.5 53.5 69.96.9 31.9 10.7 41.8 59.7 419.7
acc 2.4 10.0 9.2 17.6 30.2 64.6acc 5.0 21.6 4.5 23.8 35.9 110.4
8 Jul 91 14.8 51.5 30.7 74.2 62.2 532.6acc 2.6 9.6 177.3acc 18 Jun 20acc 9.9 21.5 8.4 28.7 95.6 89.1
4 8.0 37.2 20.9 29.0 598.6
The Fund Performance disclosed in this table is the performance of the reference share class in base currency of the Fund.
Where Class A distribution “A (dis)” Shares are disclosed, the performance is calculated with all the income reinvested (total return). Information on other share classes is available on request.
1 Franklin GCC Bond Fund has been renamed Franklin Gulf Wealth Bond Fund, Franklin European Dividend Fund has been renamed Templeton European Dividend Fund, Franklin European Growth Fund has been renamed Templeton European Opportunities Fund and Franklin European Small-Mid Cap Fund renamed to Templeton European Small-Mid Cap Fund.
2 The launch date is for the Fund, however the reference share class launched at a later date.
3 Franklin Select U.S. Equity Fund closed and merged into Franklin U.S. Opportunities Fund on November 13, 2020.
4 Fund performance prior to September 1996 excluded from calculation because a different portfolio allocation strategy was in use.
Information on other share classes is available on request. This report shall not constitute an offer or a solicitation of an offer to buy shares. Subscriptions are to be made on the basis of the current prospectus, where available the relevant Key Investor Information Documents (“KIIDs”), a copy of the latest available audited annual report and, if published thereafter, the latest unaudited semi-annual report. The price of shares and income from them can go down as well as up and you may not get back the full amount
Data source: Performance – Franklin Templeton and JPMorgan
FRANKLIN TEMPLETON INVESTMENT FUNDS
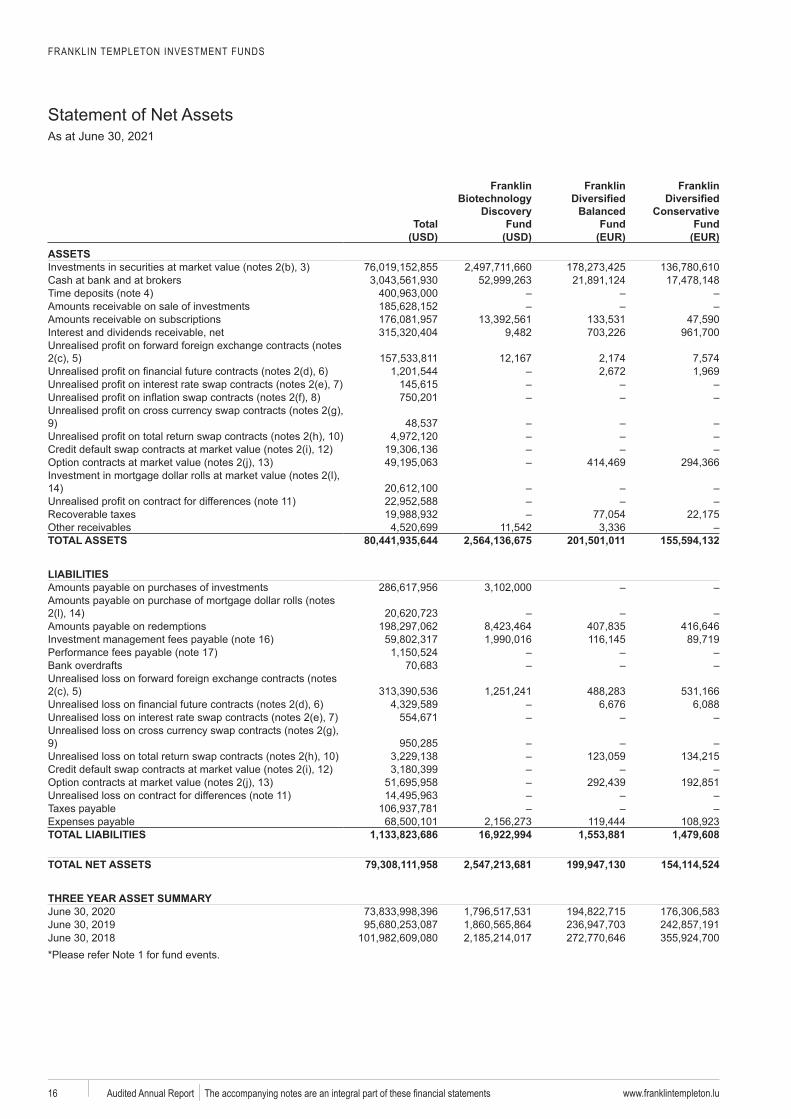
Statement of Net AssetsAs at June 30, 2021
www.franklintempleton.luAudited Annual Report 16
Total
Franklin
Fund
Franklin
Balanced Fund
Franklin
Conservative Fund
(USD) (USD) (EUR) (EUR)ASSETS
3
4
2 56
78
910
1213
1411
TOTAL ASSETS 80,441,935,644 2,564,136,675 201,501,011 155,594,132
LIABILITIES
2 14
1617
Bank overdrafts
2 56
7
910
1213
11
TOTAL LIABILITIES 1,133,823,686 16,922,994 1,553,881 1,479,608
TOTAL NET ASSETS 79,308,111,958 2,547,213,681 199,947,130 154,114,524
THREE YEAR ASSET SUMMARY
FRANKLIN TEMPLETON INVESTMENT FUNDS
Statement of Net AssetsAs at June 30, 2021
www.franklintempleton.lu Audited Annual Report 17
Franklin
Franklin Emerging
Market Corporate Debt Fund
Franklin Emerging
Markets Debt Opportunities
Fund
Franklin Euro Government
Bond Fund
Franklin Euro High Yield
Fund
Franklin Euro Short Duration
Bond Fund
Franklin Euro Short-Term
Fund(EUR) (USD) (USD) (EUR) (EUR) (EUR) (EUR)
356
52 307149,945,916 25,125,246 366,115,468 114,931,749 423,777,248 97,456,234 35,580,491
145
829,880 22,255 7,482,917 150,101 6,869,828 363,189 15,743
149,116,036 25,102,991 358,632,551 114,781,648 416,907,420 97,093,045 35,564,748
–
FRANKLIN TEMPLETON INVESTMENT FUNDS
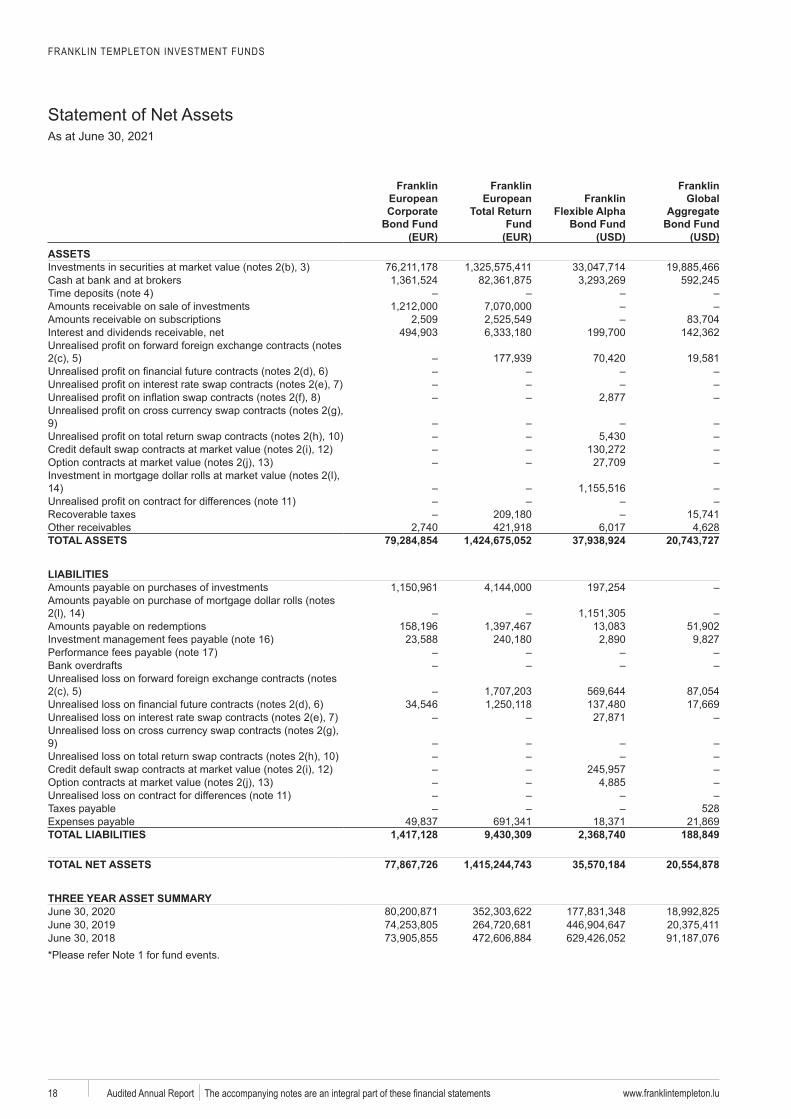
Statement of Net AssetsAs at June 30, 2021
www.franklintempleton.luAudited Annual Report 18
Franklin European Corporate
Bond Fund
Franklin European
Total Return Fund
Franklin Flexible Alpha
Bond Fund
Franklin Global
Aggregate Bond Fund
(EUR) (EUR) (USD) (USD)ASSETS
3
4
2 56
78
910
1213
1411
TOTAL ASSETS 79,284,854 1,424,675,052 37,938,924 20,743,727
LIABILITIES
2 14
1617
Bank overdrafts
2 56
7
910
1213
11528
TOTAL LIABILITIES 1,417,128 9,430,309 2,368,740 188,849
TOTAL NET ASSETS 77,867,726 1,415,244,743 35,570,184 20,554,878
THREE YEAR ASSET SUMMARY
FRANKLIN TEMPLETON INVESTMENT FUNDS
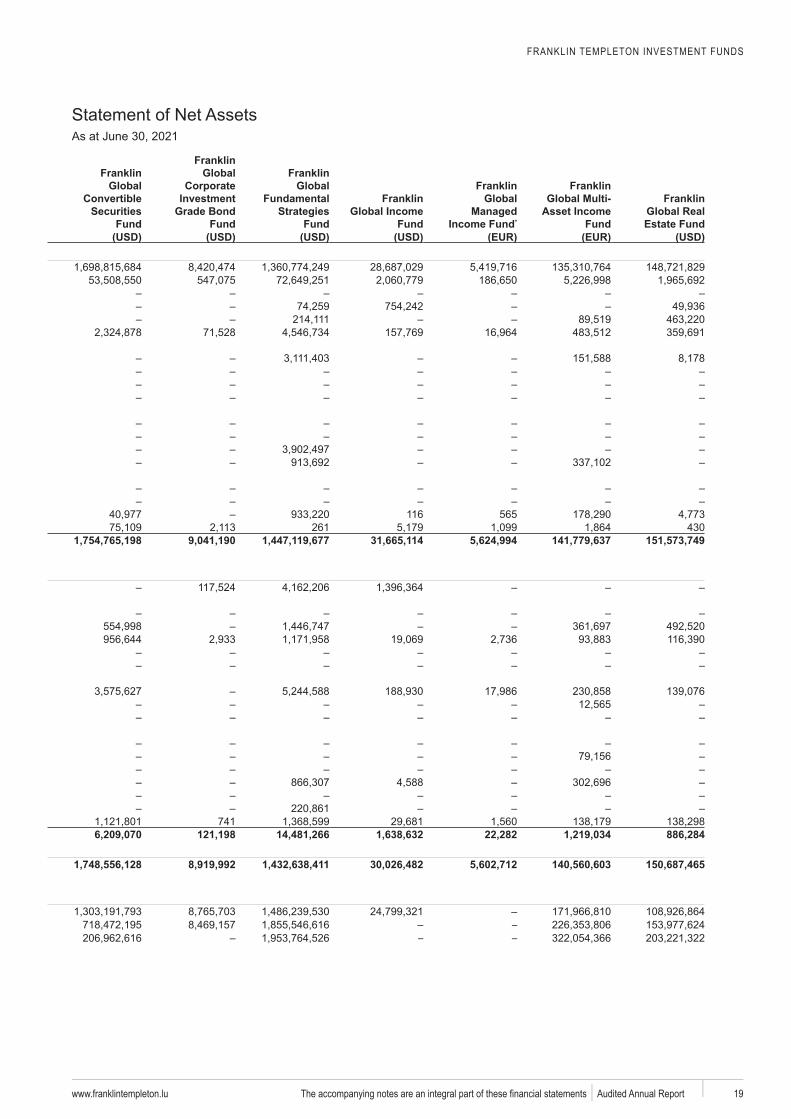
Statement of Net AssetsAs at June 30, 2021
www.franklintempleton.lu Audited Annual Report 19
Franklin Global
Convertible Securities
Fund
Franklin Global
Corporate Investment
Grade Bond Fund
Franklin Global
Fundamental Strategies
Fund
Franklin Global Income
Fund
Franklin Global
Managed Income Fund*
Franklin Global Multi-
Asset Income Fund
Franklin Global Real Estate Fund
(USD) (USD) (USD) (USD) (EUR) (EUR) (USD)
116 565261 430
1,754,765,198 9,041,190 1,447,119,677 31,665,114 5,624,994 141,779,637 151,573,749
7416,209,070 121,198 14,481,266 1,638,632 22,282 1,219,034 886,284
1,748,556,128 8,919,992 1,432,638,411 30,026,482 5,602,712 140,560,603 150,687,465
–– –
FRANKLIN TEMPLETON INVESTMENT FUNDS
Statement of Net AssetsAs at June 30, 2021
www.franklintempleton.luAudited Annual Report 20
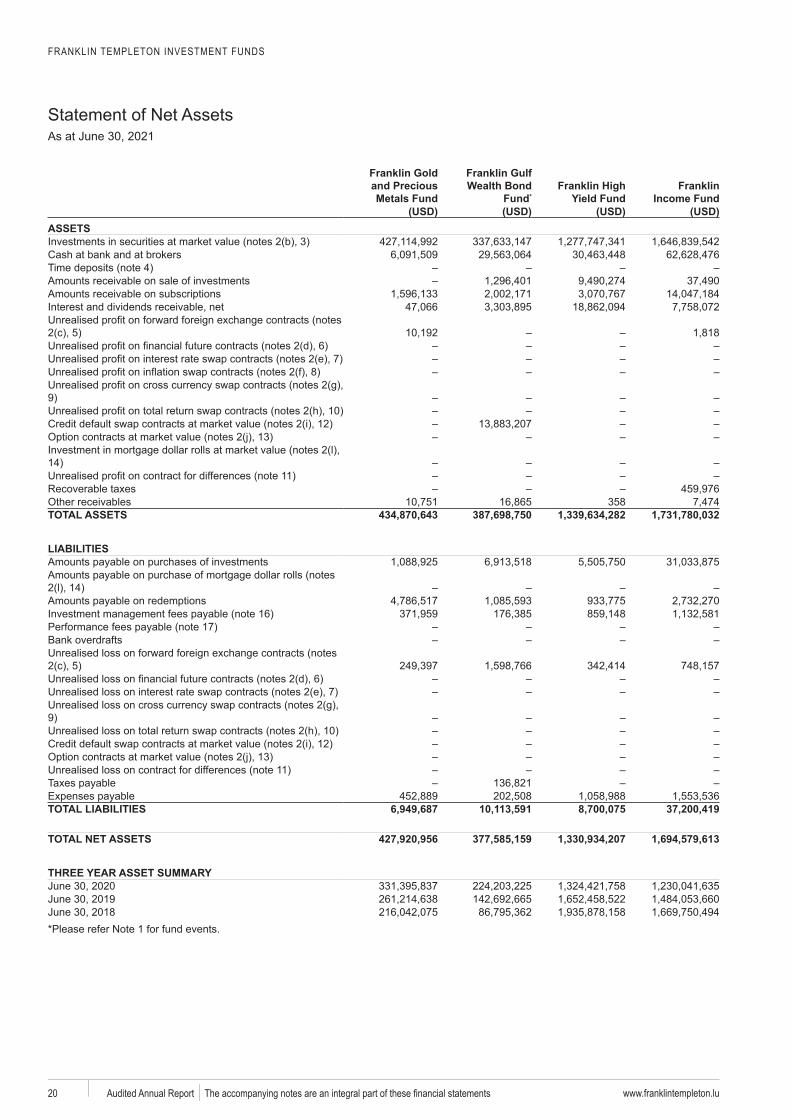
Franklin Gold and Precious Metals Fund
Franklin Gulf Wealth Bond
Fund*Franklin High
Yield FundFranklin
Income Fund (USD) (USD) (USD) (USD)
ASSETS3
4
2 56
78
910
1213
1411
358TOTAL ASSETS 434,870,643 387,698,750 1,339,634,282 1,731,780,032
LIABILITIES
2 14
1617
Bank overdrafts
2 56
7
910
1213
11
TOTAL LIABILITIES 6,949,687 10,113,591 8,700,075 37,200,419
TOTAL NET ASSETS 427,920,956 377,585,159 1,330,934,207 1,694,579,613
THREE YEAR ASSET SUMMARY
FRANKLIN TEMPLETON INVESTMENT FUNDS
Statement of Net AssetsAs at June 30, 2021
www.franklintempleton.lu Audited Annual Report 21
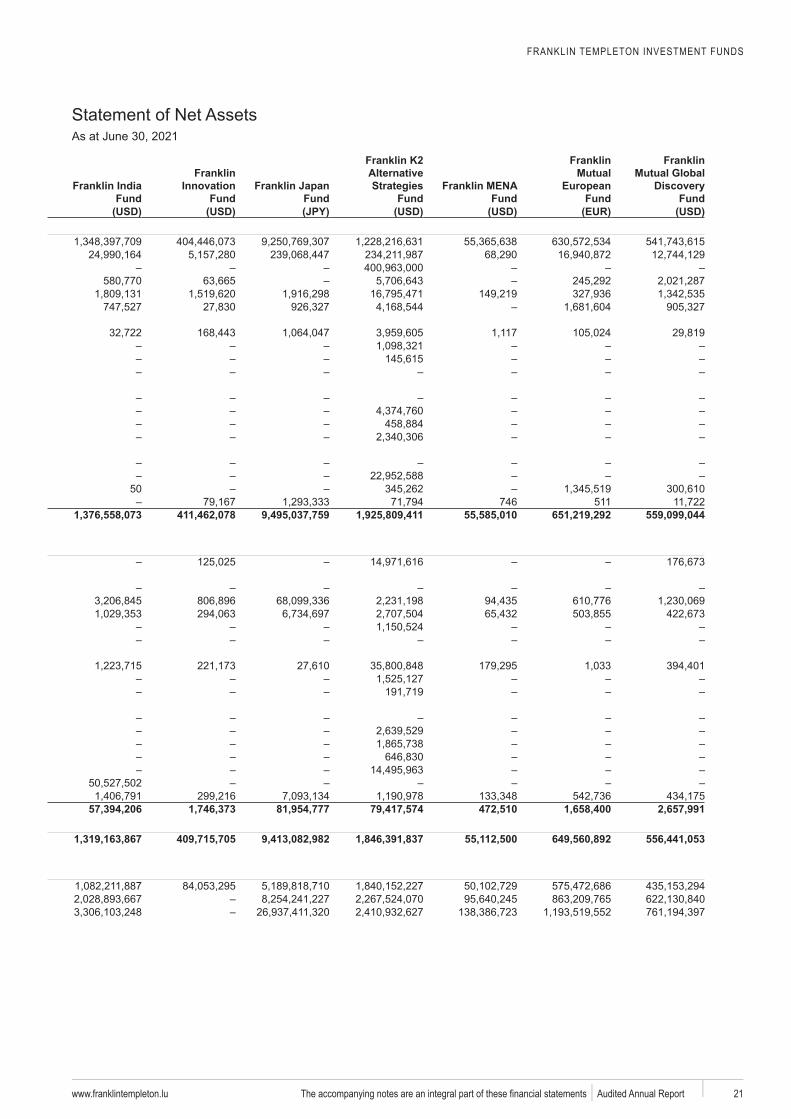
Franklin India Fund
Franklin Innovation
Fund Fund
Alternative Strategies
FundFranklin MENA
Fund
Franklin Mutual
European Fund
Franklin Mutual Global
Fund(USD) (USD) (USD) (USD) (EUR) (USD)
50746 511
1,376,558,073 411,462,078 9,495,037,759 1,925,809,411 55,585,010 651,219,292 559,099,044
57,394,206 1,746,373 81,954,777 79,417,574 472,510 1,658,400 2,657,991
1,319,163,867 409,715,705 9,413,082,982 1,846,391,837 55,112,500 649,560,892 556,441,053
FRANKLIN TEMPLETON INVESTMENT FUNDS
Statement of Net AssetsAs at June 30, 2021
www.franklintempleton.luAudited Annual Report 22
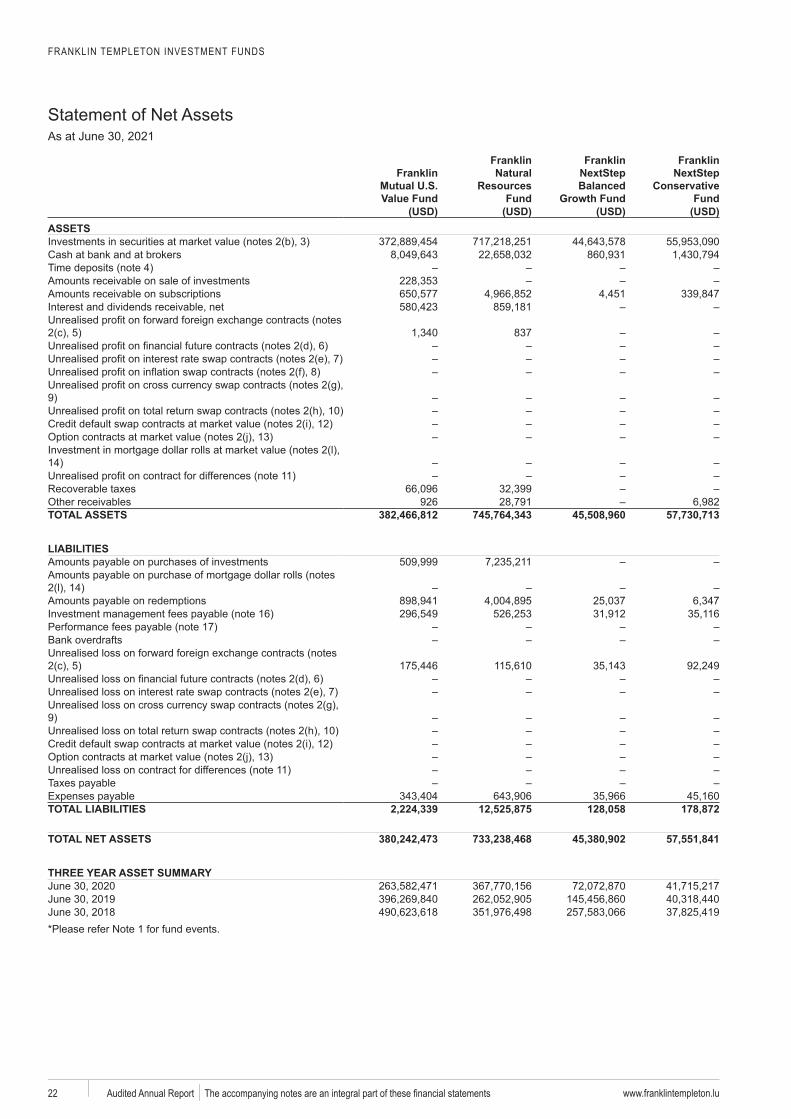
Franklin
Value Fund
Franklin Natural
Resources Fund
Franklin NextStep Balanced
Franklin NextStep
Conservative Fund
(USD) (USD) (USD) (USD)ASSETS
3
4
2 5 8376
78
910
1213
1411
926TOTAL ASSETS 382,466,812 745,764,343 45,508,960 57,730,713
LIABILITIES
2 14
1617
Bank overdrafts
2 56
7
910
1213
11
TOTAL LIABILITIES 2,224,339 12,525,875 128,058 178,872
TOTAL NET ASSETS 380,242,473 733,238,468 45,380,902 57,551,841
THREE YEAR ASSET SUMMARY
FRANKLIN TEMPLETON INVESTMENT FUNDS
Statement of Net AssetsAs at June 30, 2021
www.franklintempleton.lu Audited Annual Report 23
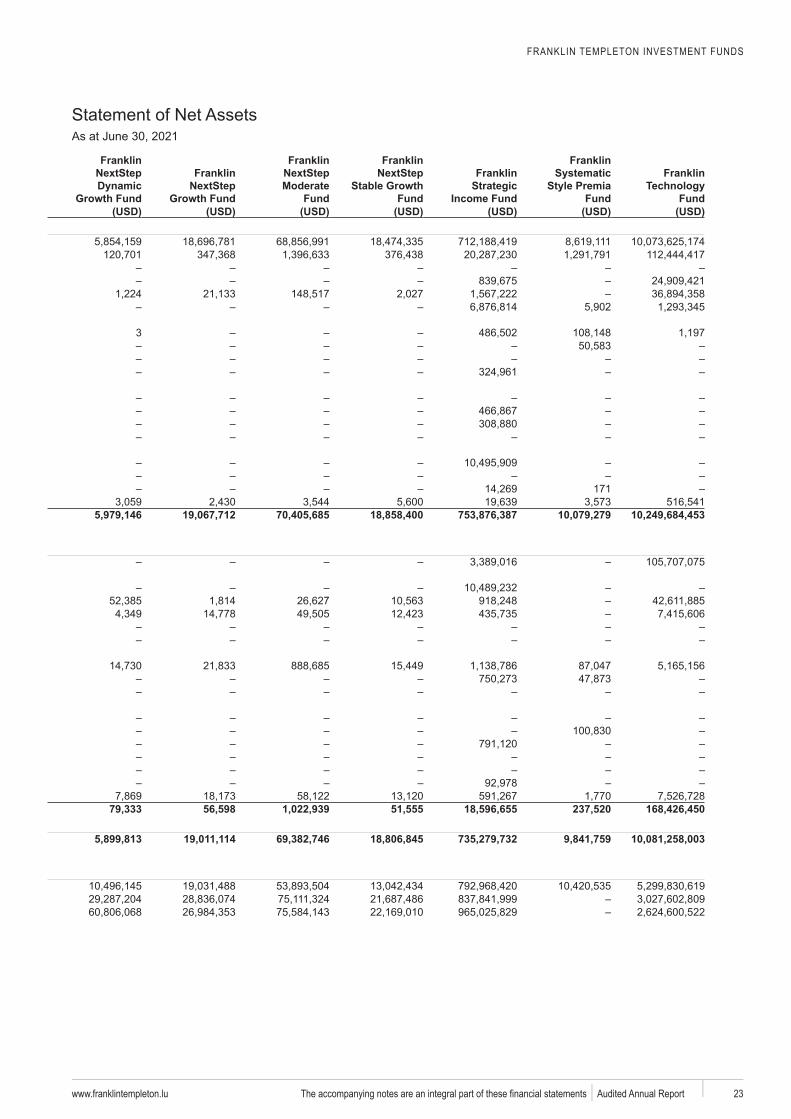
Franklin NextStep Franklin
NextStep
Franklin NextStep Moderate
Fund
Franklin NextStep
Fund
Franklin Strategic
Income Fund
Franklin
Premia Fund
Franklin
Fund(USD) (USD) (USD) (USD) (USD) (USD) (USD)
3
171
5,979,146 19,067,712 70,405,685 18,858,400 753,876,387 10,079,279 10,249,684,453
79,333 56,598 1,022,939 51,555 18,596,655 237,520 168,426,450
5,899,813 19,011,114 69,382,746 18,806,845 735,279,732 9,841,759 10,081,258,003
FRANKLIN TEMPLETON INVESTMENT FUNDS
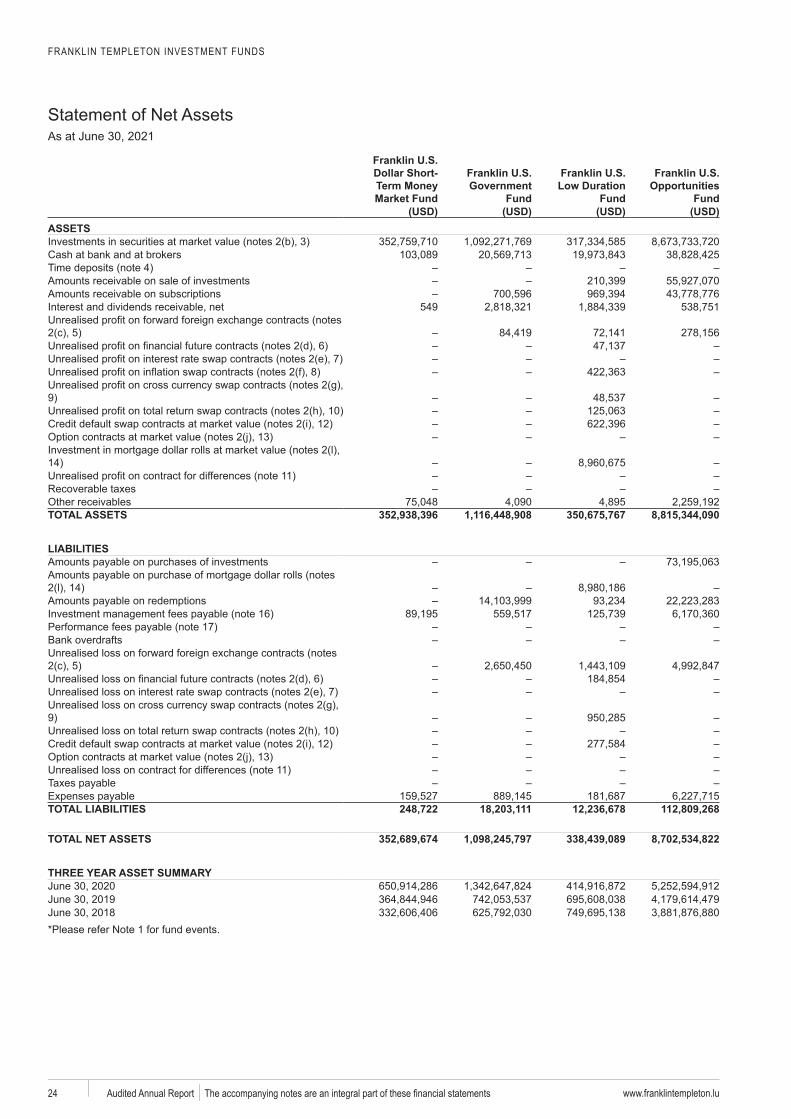
Statement of Net AssetsAs at June 30, 2021
www.franklintempleton.luAudited Annual Report 24
Dollar Short-
Market FundGovernment
Fund FundOpportunities
Fund (USD) (USD) (USD) (USD)
ASSETS3
4
549
2 56
78
910
1213
1411
TOTAL ASSETS 352,938,396 1,116,448,908 350,675,767 8,815,344,090
LIABILITIES
2 14
1617
Bank overdrafts
2 56
7
910
1213
11
TOTAL LIABILITIES 248,722 18,203,111 12,236,678 112,809,268
TOTAL NET ASSETS 352,689,674 1,098,245,797 338,439,089 8,702,534,822
THREE YEAR ASSET SUMMARY
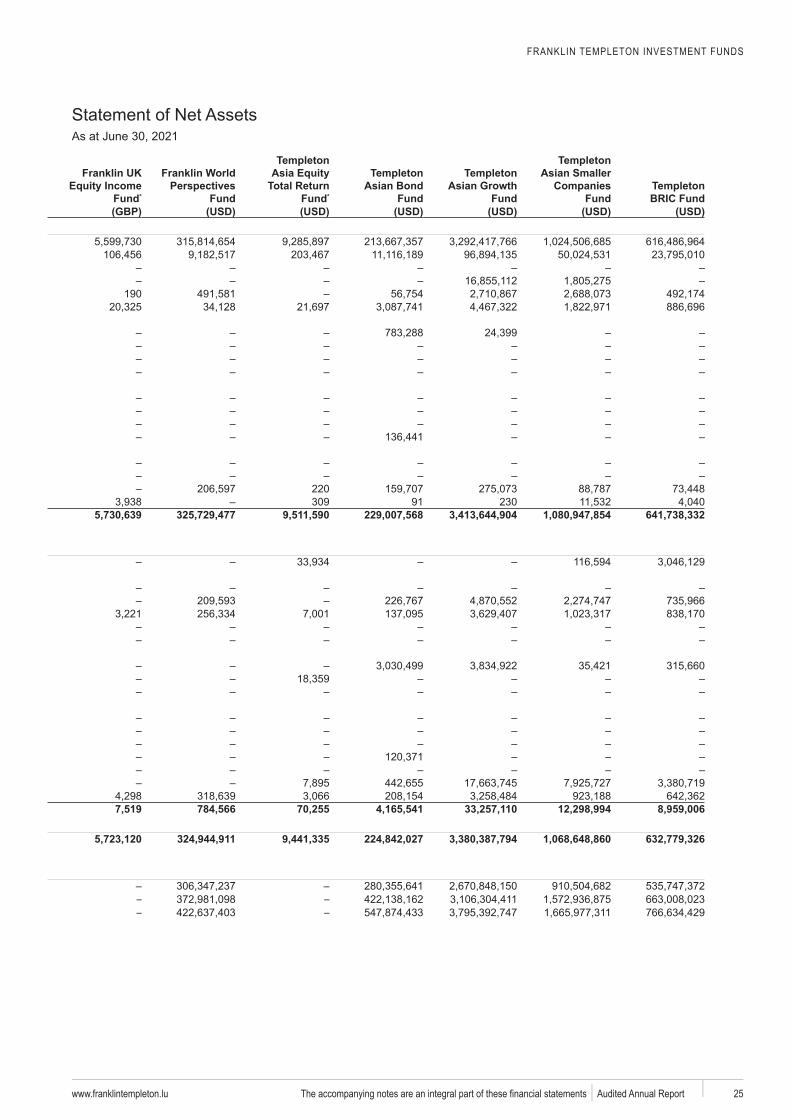
FRANKLIN TEMPLETON INVESTMENT FUNDS
Statement of Net AssetsAs at June 30, 2021
www.franklintempleton.lu Audited Annual Report 25
Fund*
Franklin World Perspectives
Fund
Templeton
Total Return Fund*
Templeton Asian Bond
Fund
Templeton
Fund
Templeton Asian Smaller
Companies Fund
Templeton BRIC Fund
(GBP) (USD) (USD) (USD) (USD) (USD) (USD)
190
220309 91 230
5,730,639 325,729,477 9,511,590 229,007,568 3,413,644,904 1,080,947,854 641,738,332
7,519 784,566 70,255 4,165,541 33,257,110 12,298,994 8,959,006
5,723,120 324,944,911 9,441,335 224,842,027 3,380,387,794 1,068,648,860 632,779,326
– –– –
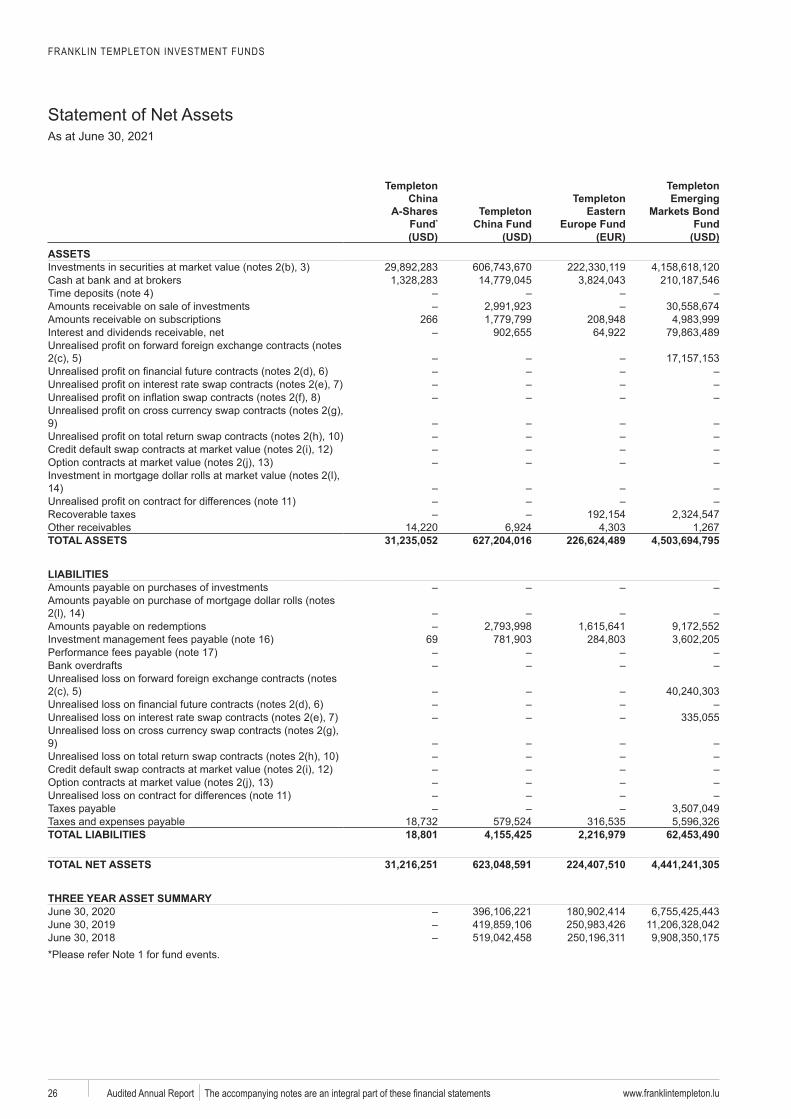
FRANKLIN TEMPLETON INVESTMENT FUNDS
Statement of Net AssetsAs at June 30, 2021
www.franklintempleton.luAudited Annual Report 26
Templeton China
A-Shares Fund*
Templeton China Fund
Templeton Eastern
Europe Fund
Templeton Emerging
Markets Bond Fund
(USD) (USD) (EUR) (USD)ASSETS
3
4
266
2 56
78
910
1213
1411
TOTAL ASSETS 31,235,052 627,204,016 226,624,489 4,503,694,795
LIABILITIES
2 14
16 6917
Bank overdrafts
2 56
7
910
1213
11
TOTAL LIABILITIES 18,801 4,155,425 2,216,979 62,453,490
TOTAL NET ASSETS 31,216,251 623,048,591 224,407,510 4,441,241,305
THREE YEAR ASSET SUMMARY
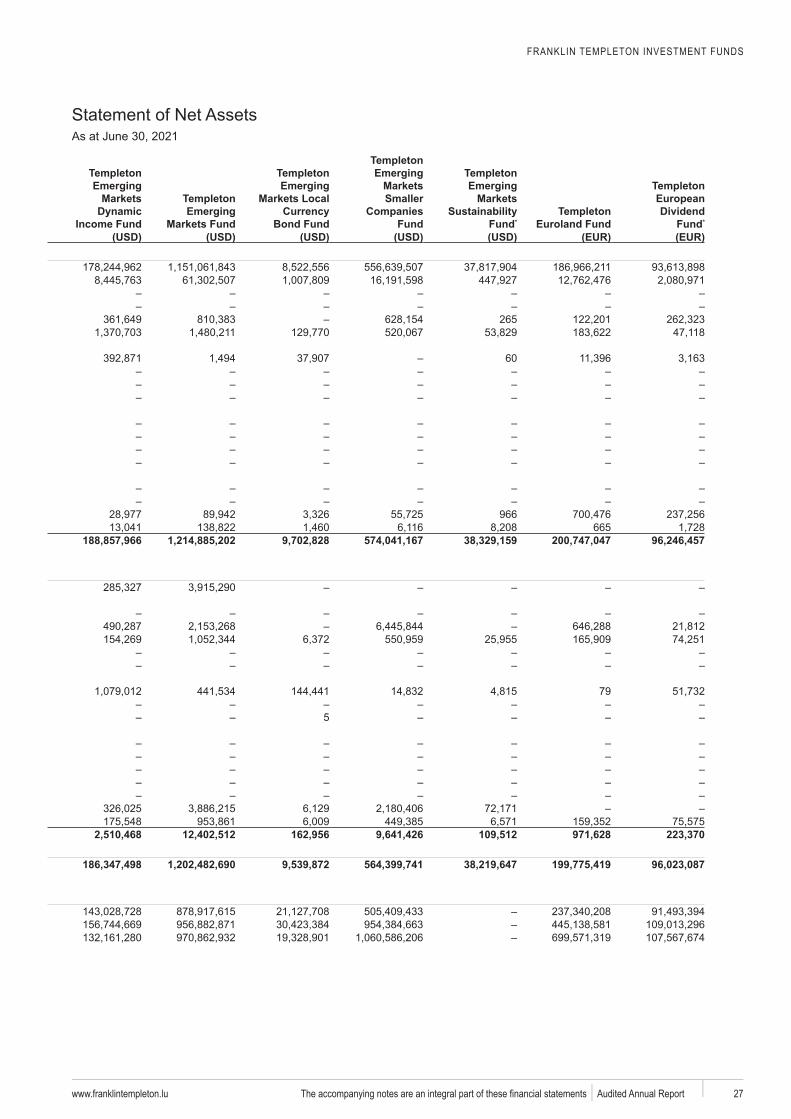
FRANKLIN TEMPLETON INVESTMENT FUNDS
Statement of Net AssetsAs at June 30, 2021
www.franklintempleton.lu Audited Annual Report 27
Templeton Emerging
Markets
Income Fund
Templeton Emerging
Markets Fund
Templeton Emerging
Markets Local
Bond Fund
Templeton Emerging
Markets Smaller
Companies Fund
Templeton Emerging
Markets
Fund*Templeton
Euroland Fund
Templeton European Dividend
Fund*
(USD) (USD) (USD) (USD) (USD) (EUR) (EUR)
265
60
966665
188,857,966 1,214,885,202 9,702,828 574,041,167 38,329,159 200,747,047 96,246,457
79
5
2,510,468 12,402,512 162,956 9,641,426 109,512 971,628 223,370
186,347,498 1,202,482,690 9,539,872 564,399,741 38,219,647 199,775,419 96,023,087
FRANKLIN TEMPLETON INVESTMENT FUNDS
Statement of Net AssetsAs at June 30, 2021
www.franklintempleton.luAudited Annual Report 28
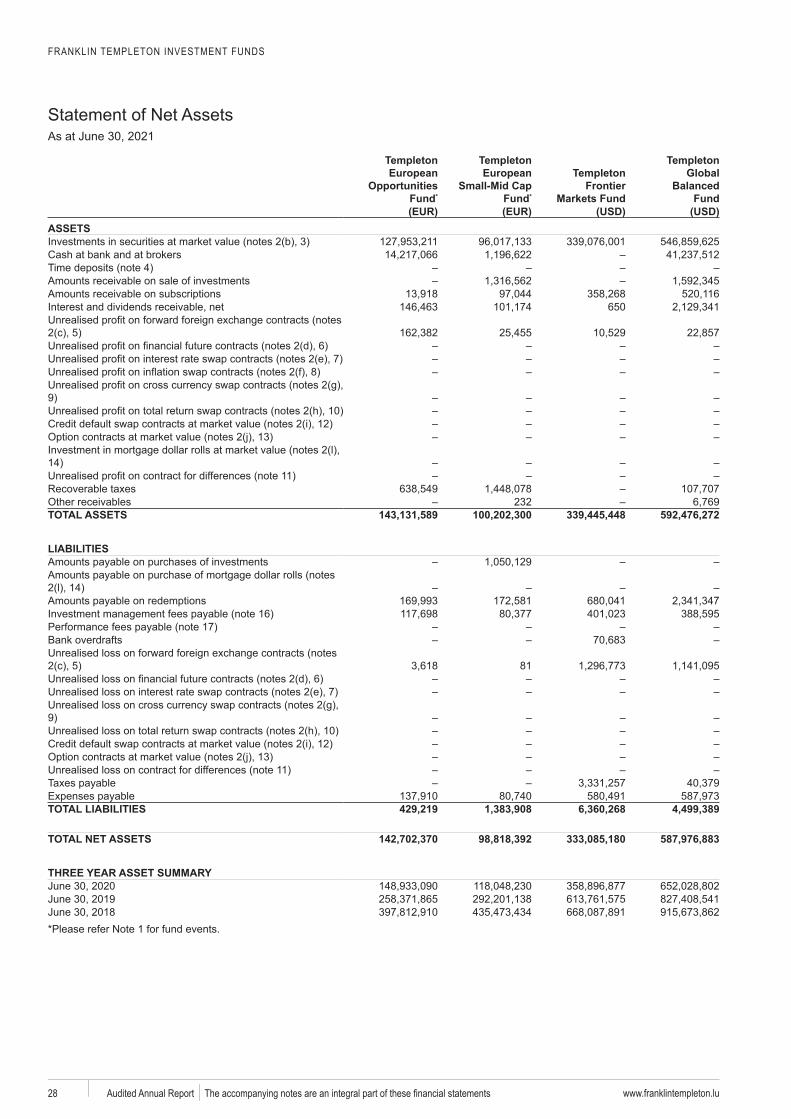
Templeton European
Opportunities Fund*
Templeton European
Small-Mid Cap Fund*
Templeton Frontier
Markets Fund
Templeton Global
Balanced Fund
(EUR) (EUR) (USD) (USD)ASSETS
3
4
650
2 56
78
910
1213
1411
232TOTAL ASSETS 143,131,589 100,202,300 339,445,448 592,476,272
LIABILITIES
2 14
1617
Bank overdrafts
2 5 816
7
910
1213
11
TOTAL LIABILITIES 429,219 1,383,908 6,360,268 4,499,389
TOTAL NET ASSETS 142,702,370 98,818,392 333,085,180 587,976,883
THREE YEAR ASSET SUMMARY
FRANKLIN TEMPLETON INVESTMENT FUNDS
Statement of Net AssetsAs at June 30, 2021
www.franklintempleton.lu Audited Annual Report 29
Templeton Global Bond (Euro) Fund
Templeton Global Bond
Fund
Templeton Global Climate
Change Fund
Templeton
Income FundTempleton
Global Fund
Templeton Global High Yield Fund
Templeton Global Income
Fund(EUR) (USD) (EUR) (USD) (USD) (USD) (USD)
88079,454,760 6,241,350,222 907,294,206 78,280,503 849,477,976 112,448,358 339,106,173
14 324
21
2,161,121 136,680,370 2,627,615 294,138 2,263,473 1,251,657 4,578,691
77,293,639 6,104,669,852 904,666,591 77,986,365 847,214,503 111,196,701 334,527,482
FRANKLIN TEMPLETON INVESTMENT FUNDS
Statement of Net AssetsAs at June 30, 2021
www.franklintempleton.luAudited Annual Report 30
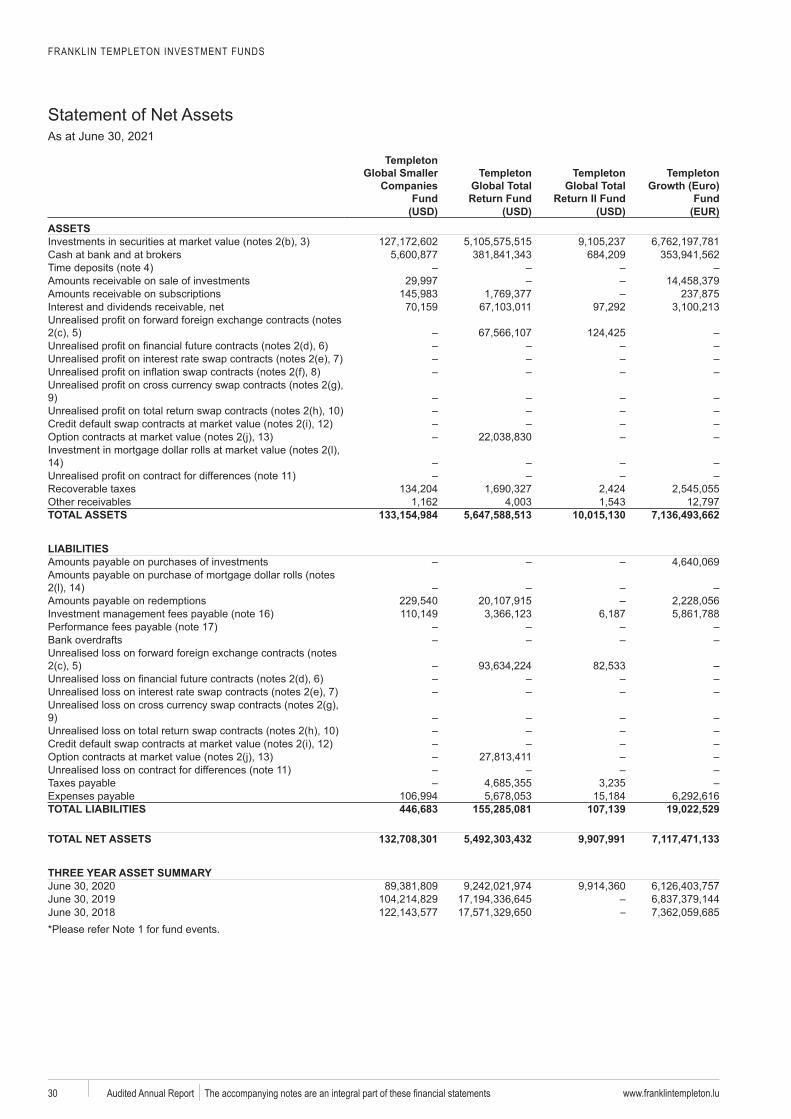
Templeton Global Smaller
Companies Fund
Templeton Global Total Return Fund
Templeton Global Total
Return II Fund
Templeton
Fund (USD) (USD) (USD) (EUR)
ASSETS3
4
2 56
78
910
1213
1411
TOTAL ASSETS 133,154,984 5,647,588,513 10,015,130 7,136,493,662
LIABILITIES
2 14
1617
Bank overdrafts
2 56
7
910
1213
11
TOTAL LIABILITIES 446,683 155,285,081 107,139 19,022,529
TOTAL NET ASSETS 132,708,301 5,492,303,432 9,907,991 7,117,471,133
THREE YEAR ASSET SUMMARY
–
FRANKLIN TEMPLETON INVESTMENT FUNDS
Statement of Net AssetsAs at June 30, 2021
www.franklintempleton.lu Audited Annual Report 31
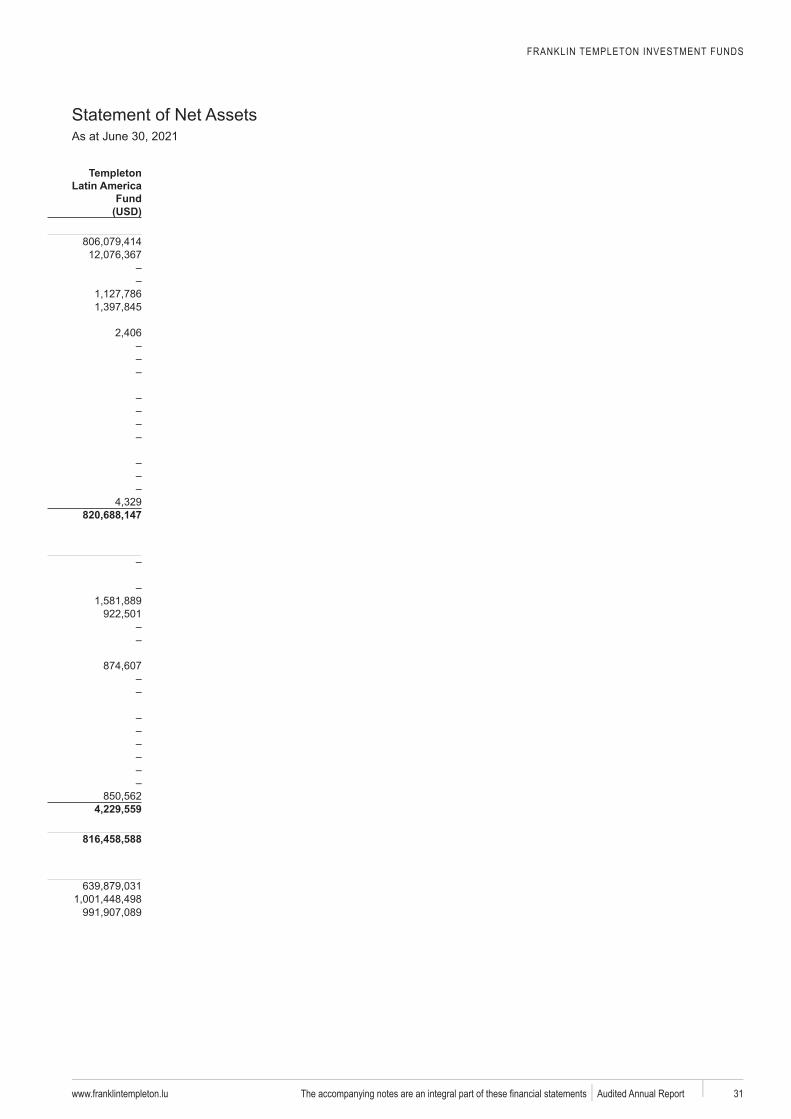
Templeton Latin America
Fund(USD)
820,688,147
4,229,559
816,458,588
FRANKLIN TEMPLETON INVESTMENT FUNDS
Statement of Operations and Changes in Net AssetsFor the year ended June 30, 2021
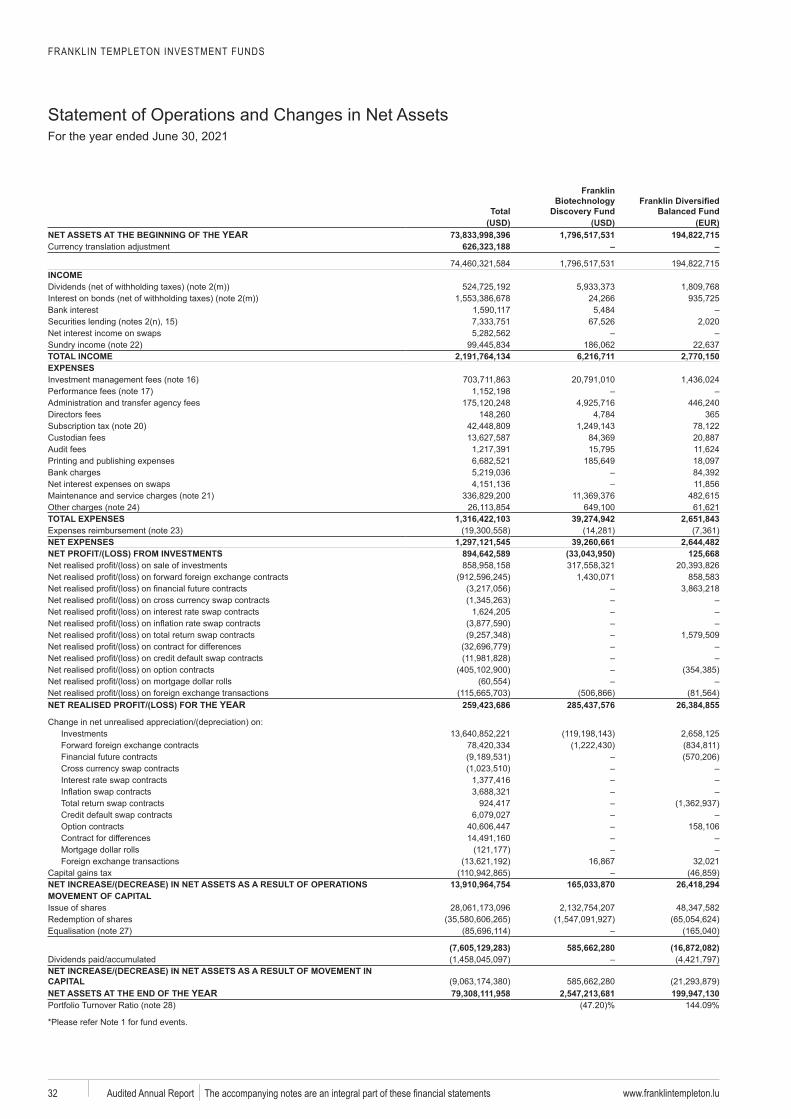
www.franklintempleton.luAudited Annual Report 32
Total
Franklin
Balanced Fund (USD) (USD) (EUR)NET ASSETS AT THE BEGINNING OF THE YEAR 73,833,998,396 1,796,517,531 194,822,715
626,323,188 – –
INCOME
Bank interest15
TOTAL INCOME 2,191,764,134 6,216,711 2,770,150EXPENSES
1617
Directors fees 36520
Bank charges
2124
TOTAL EXPENSES 1,316,422,103 39,274,942 2,651,84323
NET EXPENSES 1,297,121,545 39,260,661 2,644,482NET PROFIT/(LOSS) FROM INVESTMENTS 894,642,589 (33,043,950) 125,668
realisedrealisedrealisedrealisedrealisedrealisedrealisedrealisedrealisedrealisedrealisedrealised
NET REALISED PROFIT/(LOSS) FOR THE YEAR 259,423,686 285,437,576 26,384,855
unrealised
Financial future contracts
Foreign exchange transactions
NET INCREASE/(DECREASE) IN NET ASSETS AS A RESULT OF OPERATIONS 13,910,964,754 165,033,870 26,418,294MOVEMENT OF CAPITAL
(7,605,129,283) 585,662,280 (16,872,082)
NET INCREASE/(DECREASE) IN NET ASSETS AS A RESULT OF MOVEMENT IN CAPITALNET ASSETS AT THE END OF THE YEAR 79,308,111,958 2,547,213,681 199,947,130
28
FRANKLIN TEMPLETON INVESTMENT FUNDS
Statement of Operations and Changes in Net AssetsFor the year ended June 30, 2021
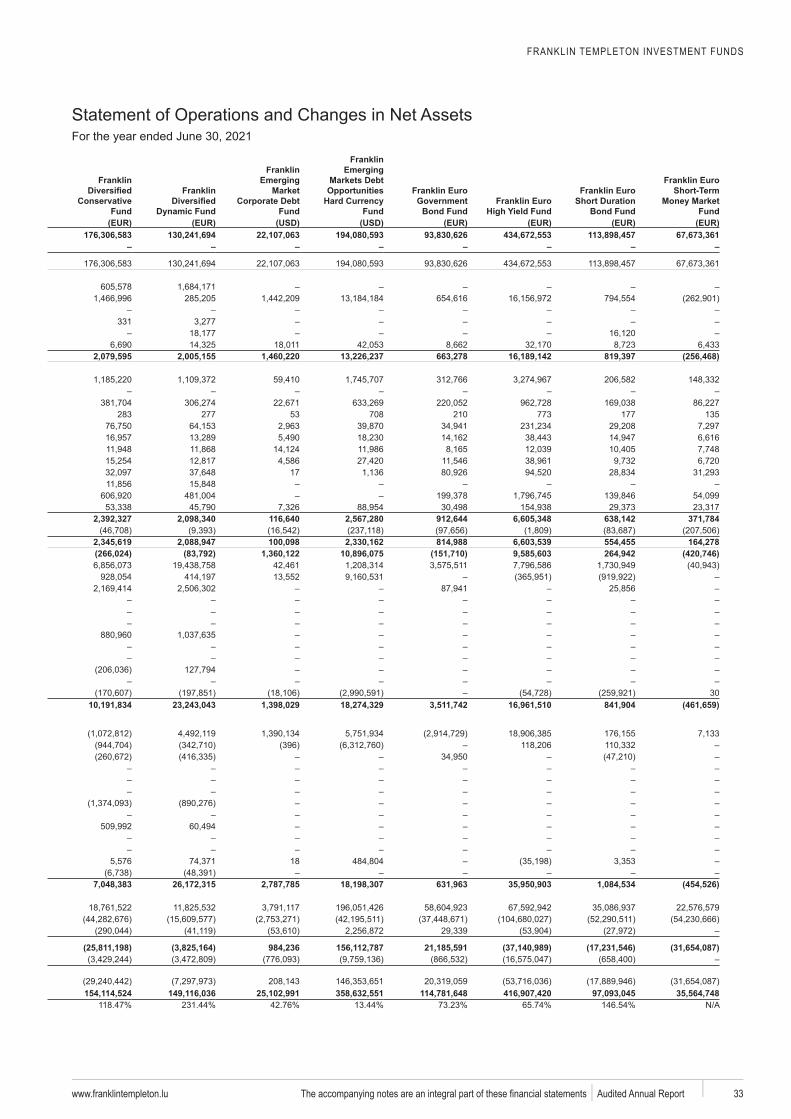
www.franklintempleton.lu Audited Annual Report 33
Franklin
Conservative Fund
Franklin
Franklin Emerging
Market Corporate Debt
Fund
Franklin Emerging
Markets Debt Opportunities
Fund
Franklin Euro Government
Bond FundFranklin Euro
High Yield Fund
Franklin Euro Short Duration
Bond Fund
Franklin Euro Short-Term
Fund(EUR) (EUR) (USD) (USD) (EUR) (EUR) (EUR) (EUR)
176,306,583 130,241,694 22,107,063 194,080,593 93,830,626 434,672,553 113,898,457 67,673,361– – – – – – – –
331
2,079,595 2,005,155 1,460,220 13,226,237 663,278 16,189,142 819,397 (256,468)
283 277 53 708 210 773 177 135
17
2,392,327 2,098,340 116,640 2,567,280 912,644 6,605,348 638,142 371,784
2,345,619 2,088,947 100,098 2,330,162 814,988 6,603,539 554,455 164,278(266,024) (83,792) 1,360,122 10,896,075 (151,710) 9,585,603 264,942 (420,746)
3010,191,834 23,243,043 1,398,029 18,274,329 3,511,742 16,961,510 841,904 (461,659)
18
7,048,383 26,172,315 2,787,785 18,198,307 631,963 35,950,903 1,084,534 (454,526)
(25,811,198) (3,825,164) 984,236 156,112,787 21,185,591 (37,140,989) (17,231,546) (31,654,087)
154,114,524 149,116,036 25,102,991 358,632,551 114,781,648 416,907,420 97,093,045 35,564,748
FRANKLIN TEMPLETON INVESTMENT FUNDS
Statement of Operations and Changes in Net AssetsFor the year ended June 30, 2021
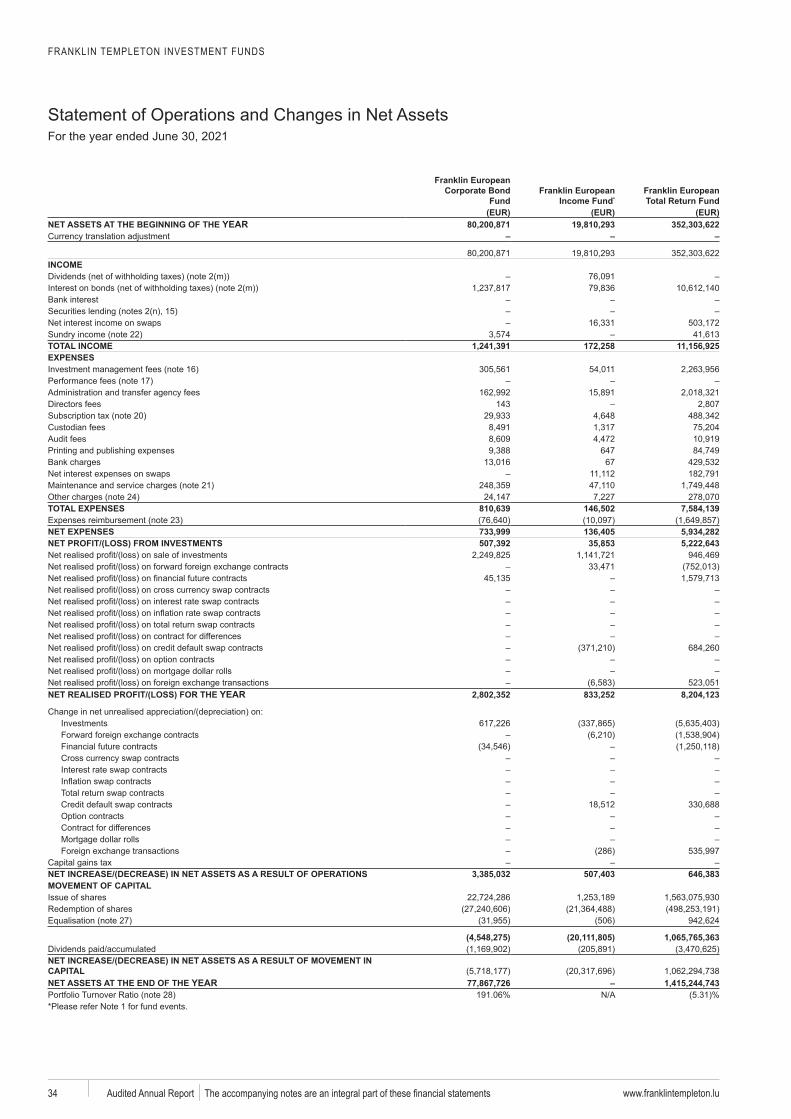
www.franklintempleton.luAudited Annual Report 34
Franklin European Corporate Bond
FundFranklin European
Income Fund*Franklin European Total Return Fund
(EUR) (EUR) (EUR)NET ASSETS AT THE BEGINNING OF THE YEAR 80,200,871 19,810,293 352,303,622
– – –
INCOME
Bank interest15
TOTAL INCOME 1,241,391 172,258 11,156,925EXPENSES
1617
Directors fees 14320
647Bank charges 67
2124
TOTAL EXPENSES 810,639 146,502 7,584,13923
NET EXPENSES 733,999 136,405 5,934,282NET PROFIT/(LOSS) FROM INVESTMENTS 507,392 35,853 5,222,643
realisedrealisedrealisedrealisedrealisedrealisedrealisedrealisedrealisedrealisedrealisedrealised
NET REALISED PROFIT/(LOSS) FOR THE YEAR 2,802,352 833,252 8,204,123
unrealised
Financial future contracts
Foreign exchange transactions
NET INCREASE/(DECREASE) IN NET ASSETS AS A RESULT OF OPERATIONS 3,385,032 507,403 646,383MOVEMENT OF CAPITAL
(4,548,275) (20,111,805) 1,065,765,363
NET INCREASE/(DECREASE) IN NET ASSETS AS A RESULT OF MOVEMENT IN CAPITALNET ASSETS AT THE END OF THE YEAR 77,867,726 – 1,415,244,743
28
FRANKLIN TEMPLETON INVESTMENT FUNDS
Statement of Operations and Changes in Net AssetsFor the year ended June 30, 2021
www.franklintempleton.lu Audited Annual Report 35
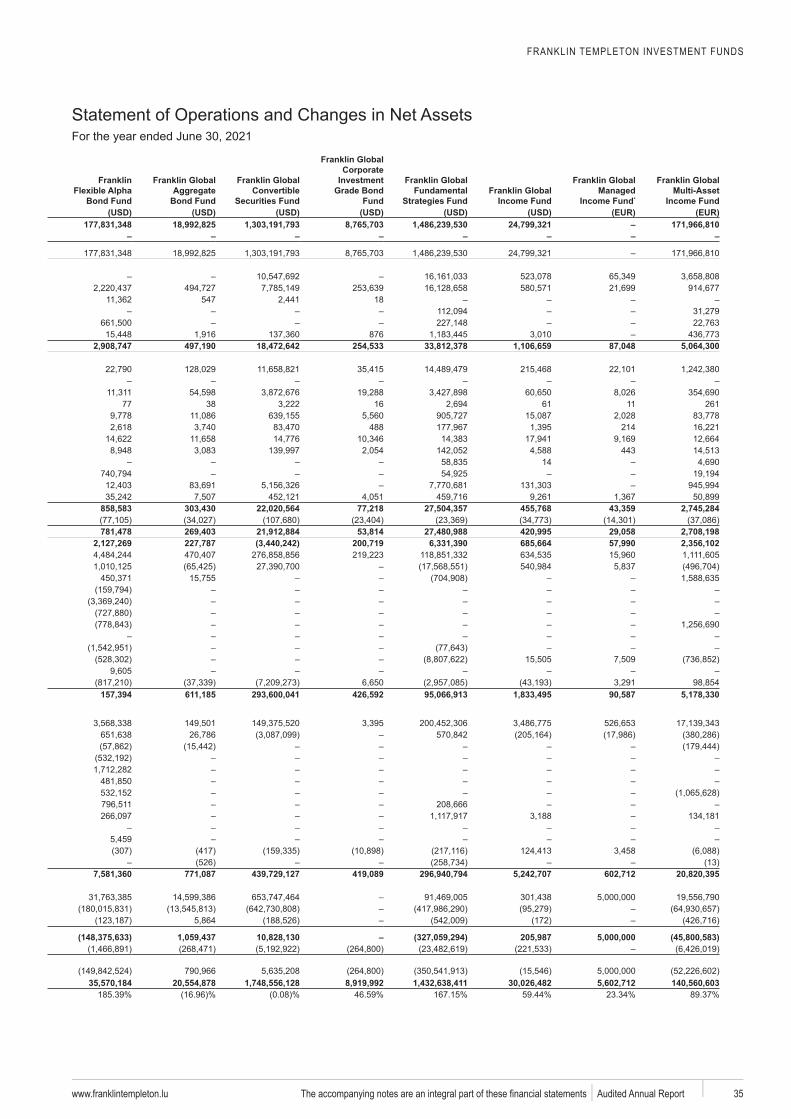
Franklin Flexible Alpha
Bond Fund
Franklin Global Aggregate
Bond Fund
Franklin Global Convertible
Securities Fund
Franklin Global Corporate
Investment Grade Bond
Fund
Franklin Global Fundamental
Strategies FundFranklin Global
Income Fund
Franklin Global Managed
Income Fund*
Franklin Global Multi-Asset
Income Fund(USD) (USD) (USD) (USD) (USD) (USD) (EUR) (EUR)
177,831,348 18,992,825 1,303,191,793 8,765,703 1,486,239,530 24,799,321 – 171,966,810– – – – – – – –
547 18
8762,908,747 497,190 18,472,642 254,533 33,812,378 1,106,659 87,048 5,064,300
77 38 16 61 11 261
488 214
44314
858,583 303,430 22,020,564 77,218 27,504,357 455,768 43,359 2,745,284
781,478 269,403 21,912,884 53,814 27,480,988 420,995 29,058 2,708,1982,127,269 227,787 (3,440,242) 200,719 6,331,390 685,664 57,990 2,356,102
157,394 611,185 293,600,041 426,592 95,066,913 1,833,495 90,587 5,178,330
7,581,360 771,087 439,729,127 419,089 296,940,794 5,242,707 602,712 20,820,395
(148,375,633) 1,059,437 10,828,130 – (327,059,294) 205,987 5,000,000 (45,800,583)
35,570,184 20,554,878 1,748,556,128 8,919,992 1,432,638,411 30,026,482 5,602,712 140,560,603
FRANKLIN TEMPLETON INVESTMENT FUNDS
Statement of Operations and Changes in Net AssetsFor the year ended June 30, 2021
www.franklintempleton.luAudited Annual Report 36
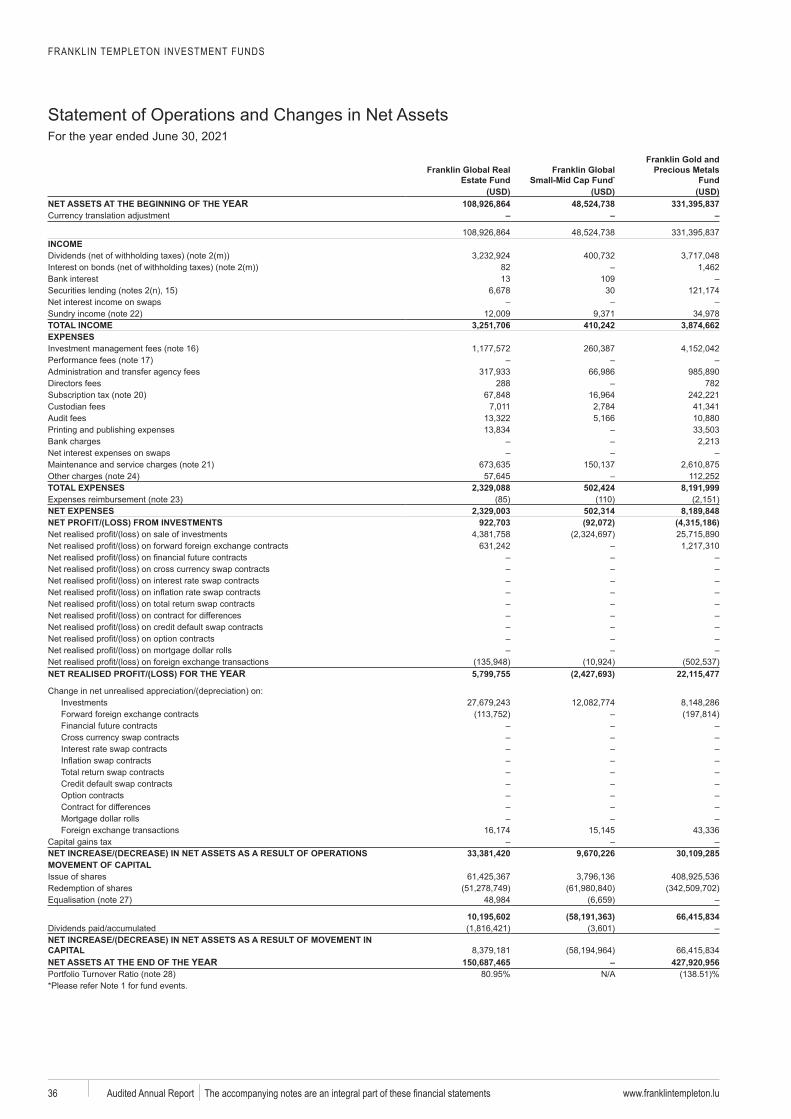
Franklin Global Real Estate Fund
Franklin Global Small-Mid Cap Fund*
Franklin Gold and Precious Metals
Fund (USD) (USD) (USD)NET ASSETS AT THE BEGINNING OF THE YEAR 108,926,864 48,524,738 331,395,837
– – –
INCOME
82Bank interest 13 109
15 30
TOTAL INCOME 3,251,706 410,242 3,874,662EXPENSES
1617
Directors fees 288 78220
Bank charges
2124
TOTAL EXPENSES 2,329,088 502,424 8,191,99923
NET EXPENSES 2,329,003 502,314 8,189,848NET PROFIT/(LOSS) FROM INVESTMENTS 922,703 (92,072) (4,315,186)
realisedrealisedrealisedrealisedrealisedrealisedrealisedrealisedrealisedrealisedrealisedrealised
NET REALISED PROFIT/(LOSS) FOR THE YEAR 5,799,755 (2,427,693) 22,115,477
unrealised
Financial future contracts
Foreign exchange transactions
NET INCREASE/(DECREASE) IN NET ASSETS AS A RESULT OF OPERATIONS 33,381,420 9,670,226 30,109,285MOVEMENT OF CAPITAL
10,195,602 (58,191,363) 66,415,834
NET INCREASE/(DECREASE) IN NET ASSETS AS A RESULT OF MOVEMENT IN CAPITALNET ASSETS AT THE END OF THE YEAR 150,687,465 – 427,920,956
28
FRANKLIN TEMPLETON INVESTMENT FUNDS
Statement of Operations and Changes in Net AssetsFor the year ended June 30, 2021
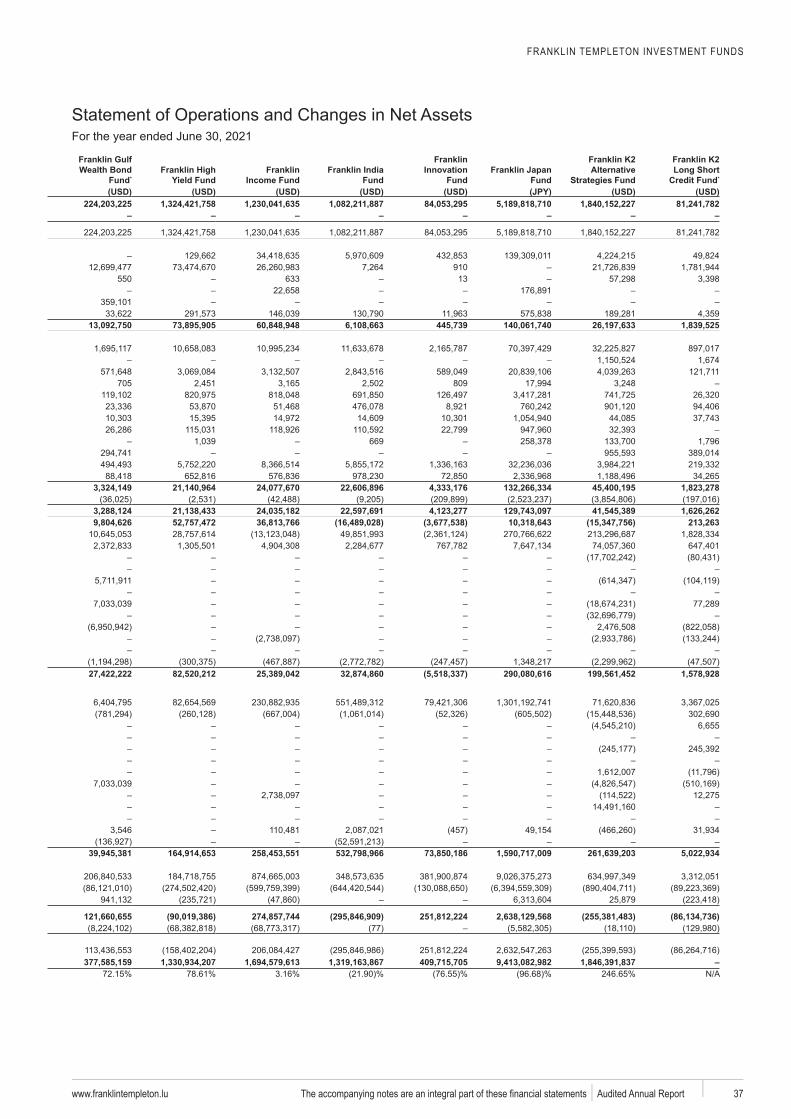
www.franklintempleton.lu Audited Annual Report 37
Franklin Gulf Wealth Bond
Fund*Franklin High
Yield FundFranklin
Income FundFranklin India
Fund
Franklin Innovation
Fund FundAlternative
Strategies FundLong Short
Credit Fund*
(USD) (USD) (USD) (USD) (USD) (USD) (USD)224,203,225 1,324,421,758 1,230,041,635 1,082,211,887 84,053,295 5,189,818,710 1,840,152,227 81,241,782
– – – – – – – –
910550 633 13
13,092,750 73,895,905 60,848,948 6,108,663 445,739 140,061,740 26,197,633 1,839,525
705 809
669
3,324,149 21,140,964 24,077,670 22,606,896 4,333,176 132,266,334 45,400,195 1,823,278
3,288,124 21,138,433 24,035,182 22,597,691 4,123,277 129,743,097 41,545,389 1,626,2629,804,626 52,757,472 36,813,766 (16,489,028) (3,677,538) 10,318,643 (15,347,756) 213,263
27,422,222 82,520,212 25,389,042 32,874,860 (5,518,337) 290,080,616 199,561,452 1,578,928
39,945,381 164,914,653 258,453,551 532,798,966 73,850,186 1,590,717,009 261,639,203 5,022,934
121,660,655 (90,019,386) 274,857,744 (295,846,909) 251,812,224 2,638,129,568 (255,381,483) (86,134,736)
377,585,159 1,330,934,207 1,694,579,613 1,319,163,867 409,715,705 9,413,082,982 1,846,391,837 –
FRANKLIN TEMPLETON INVESTMENT FUNDS
Statement of Operations and Changes in Net AssetsFor the year ended June 30, 2021
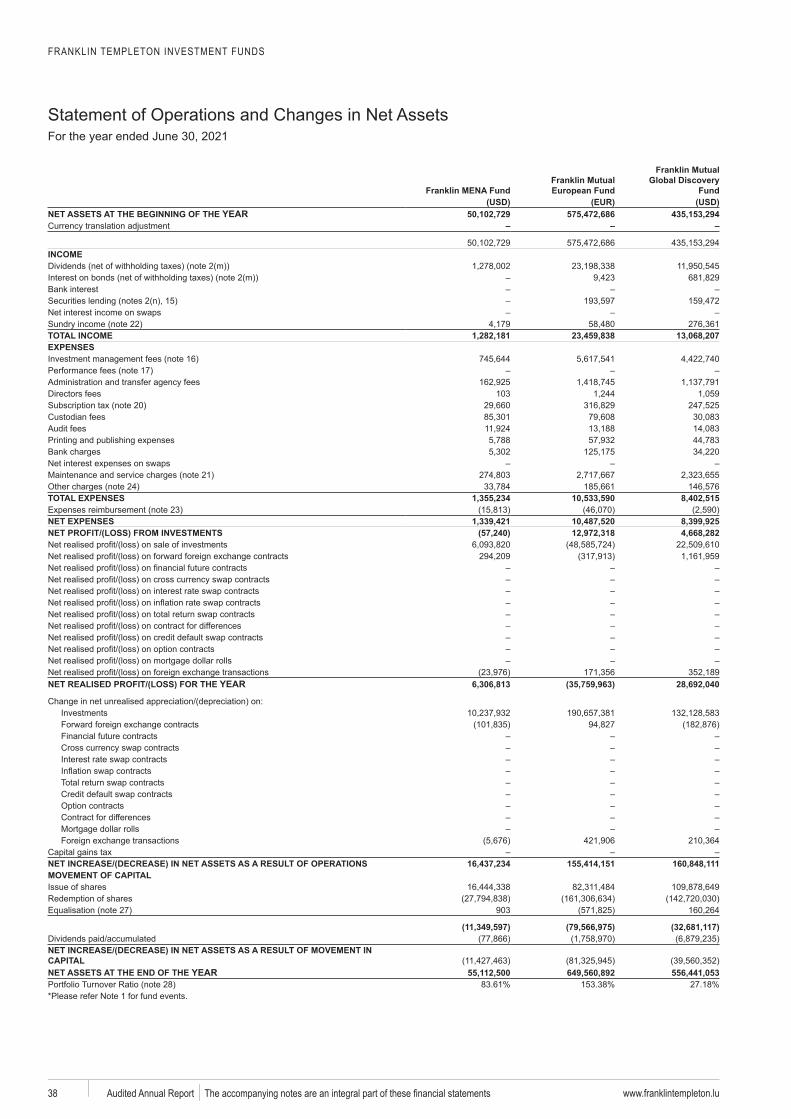
www.franklintempleton.luAudited Annual Report 38
Franklin MENA FundFranklin Mutual European Fund
Franklin Mutual
Fund (USD) (EUR) (USD)NET ASSETS AT THE BEGINNING OF THE YEAR 50,102,729 575,472,686 435,153,294
– – –
INCOME
Bank interest15
TOTAL INCOME 1,282,181 23,459,838 13,068,207EXPENSES
1617
Directors fees 10320
Bank charges
2124
TOTAL EXPENSES 1,355,234 10,533,590 8,402,51523
NET EXPENSES 1,339,421 10,487,520 8,399,925NET PROFIT/(LOSS) FROM INVESTMENTS (57,240) 12,972,318 4,668,282
realisedrealisedrealisedrealisedrealisedrealisedrealisedrealisedrealisedrealisedrealisedrealised
NET REALISED PROFIT/(LOSS) FOR THE YEAR 6,306,813 (35,759,963) 28,692,040
unrealised
Financial future contracts
Foreign exchange transactions
NET INCREASE/(DECREASE) IN NET ASSETS AS A RESULT OF OPERATIONS 16,437,234 155,414,151 160,848,111MOVEMENT OF CAPITAL
903
(11,349,597) (79,566,975) (32,681,117)
NET INCREASE/(DECREASE) IN NET ASSETS AS A RESULT OF MOVEMENT IN CAPITALNET ASSETS AT THE END OF THE YEAR 55,112,500 649,560,892 556,441,053
28
FRANKLIN TEMPLETON INVESTMENT FUNDS
Statement of Operations and Changes in Net AssetsFor the year ended June 30, 2021
www.franklintempleton.lu Audited Annual Report 39
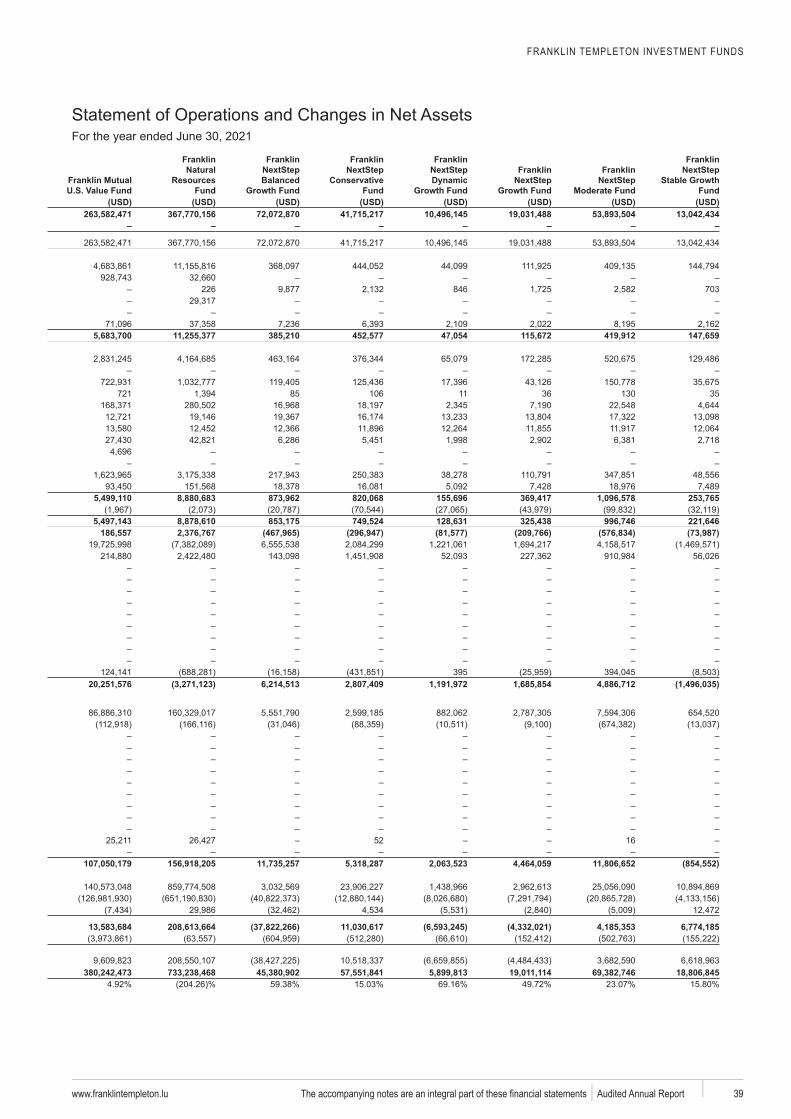
Franklin Mutual
Franklin Natural
Resources Fund
Franklin NextStep Balanced
Franklin NextStep
Conservative Fund
Franklin NextStep Franklin
NextStep Franklin
NextStep Moderate Fund
Franklin NextStep
Fund(USD) (USD) (USD) (USD) (USD) (USD) (USD) (USD)
263,582,471 367,770,156 72,072,870 41,715,217 10,496,145 19,031,488 53,893,504 13,042,434– – – – – – – –
226 846 703
5,683,700 11,255,377 385,210 452,577 47,054 115,672 419,912 147,659
721 85 106 11 36 130 35
5,499,110 8,880,683 873,962 820,068 155,696 369,417 1,096,578 253,765
5,497,143 8,878,610 853,175 749,524 128,631 325,438 996,746 221,646186,557 2,376,767 (467,965) (296,947) (81,577) (209,766) (576,834) (73,987)
39520,251,576 (3,271,123) 6,214,513 2,807,409 1,191,972 1,685,854 4,886,712 (1,496,035)
52 16
107,050,179 156,918,205 11,735,257 5,318,287 2,063,523 4,464,059 11,806,652 (854,552)
13,583,684 208,613,664 (37,822,266) 11,030,617 (6,593,245) (4,332,021) 4,185,353 6,774,185
380,242,473 733,238,468 45,380,902 57,551,841 5,899,813 19,011,114 69,382,746 18,806,845
FRANKLIN TEMPLETON INVESTMENT FUNDS
Statement of Operations and Changes in Net AssetsFor the year ended June 30, 2021
www.franklintempleton.luAudited Annual Report 40
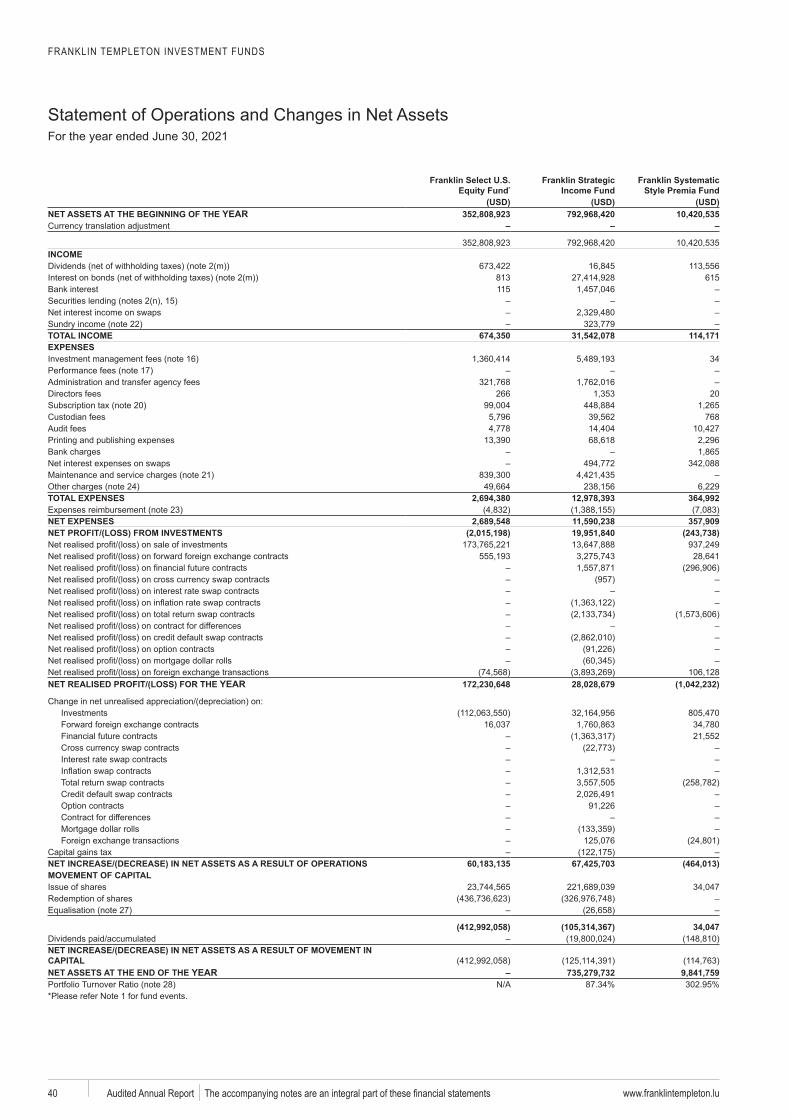
*Franklin Strategic
Income Fund Premia Fund (USD) (USD) (USD)NET ASSETS AT THE BEGINNING OF THE YEAR 352,808,923 792,968,420 10,420,535
– – –
INCOME
813 615Bank interest 115
15
TOTAL INCOME 674,350 31,542,078 114,171EXPENSES
16 3417
Directors fees 266 2020
768
Bank charges
2124
TOTAL EXPENSES 2,694,380 12,978,393 364,99223
NET EXPENSES 2,689,548 11,590,238 357,909NET PROFIT/(LOSS) FROM INVESTMENTS (2,015,198) 19,951,840 (243,738)
realisedrealisedrealisedrealisedrealisedrealisedrealisedrealisedrealisedrealisedrealisedrealised
NET REALISED PROFIT/(LOSS) FOR THE YEAR 172,230,648 28,028,679 (1,042,232)
unrealised
Financial future contracts
Foreign exchange transactions
NET INCREASE/(DECREASE) IN NET ASSETS AS A RESULT OF OPERATIONS 60,183,135 67,425,703 (464,013)MOVEMENT OF CAPITAL
(412,992,058) (105,314,367) 34,047
NET INCREASE/(DECREASE) IN NET ASSETS AS A RESULT OF MOVEMENT IN CAPITALNET ASSETS AT THE END OF THE YEAR – 735,279,732 9,841,759
28
FRANKLIN TEMPLETON INVESTMENT FUNDS
Statement of Operations and Changes in Net AssetsFor the year ended June 30, 2021
www.franklintempleton.lu Audited Annual Report 41
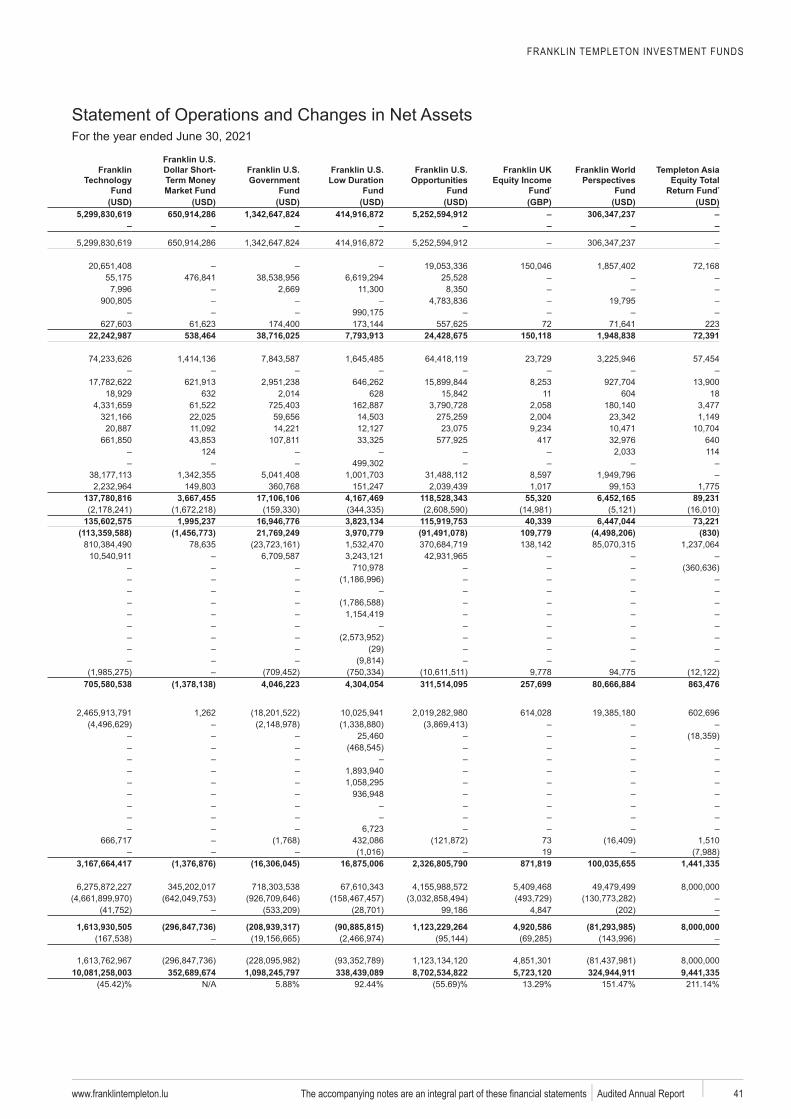
Franklin
Fund
Dollar Short-
Market FundGovernment
Fund FundOpportunities
Fund Fund*
Franklin World Perspectives
Fund
Templeton Asia
Return Fund*
(USD) (USD) (USD) (USD) (USD) (GBP) (USD) (USD)5,299,830,619 650,914,286 1,342,647,824 414,916,872 5,252,594,912 – 306,347,237 –
– – – – – – – –
72 22322,242,987 538,464 38,716,025 7,793,913 24,428,675 150,118 1,948,838 72,391
632 628 11 604 18
417 640124 114
137,780,816 3,667,455 17,106,106 4,167,469 118,528,343 55,320 6,452,165 89,231
135,602,575 1,995,237 16,946,776 3,823,134 115,919,753 40,339 6,447,044 73,221(113,359,588) (1,456,773) 21,769,249 3,970,779 (91,491,078) 109,779 (4,498,206) (830)
705,580,538 (1,378,138) 4,046,223 4,304,054 311,514,095 257,699 80,666,884 863,476
7319
3,167,664,417 (1,376,876) (16,306,045) 16,875,006 2,326,805,790 871,819 100,035,655 1,441,335
1,613,930,505 (296,847,736) (208,939,317) (90,885,815) 1,123,229,264 4,920,586 (81,293,985) 8,000,000
10,081,258,003 352,689,674 1,098,245,797 338,439,089 8,702,534,822 5,723,120 324,944,911 9,441,335
FRANKLIN TEMPLETON INVESTMENT FUNDS
Statement of Operations and Changes in Net AssetsFor the year ended June 30, 2021
www.franklintempleton.luAudited Annual Report 42
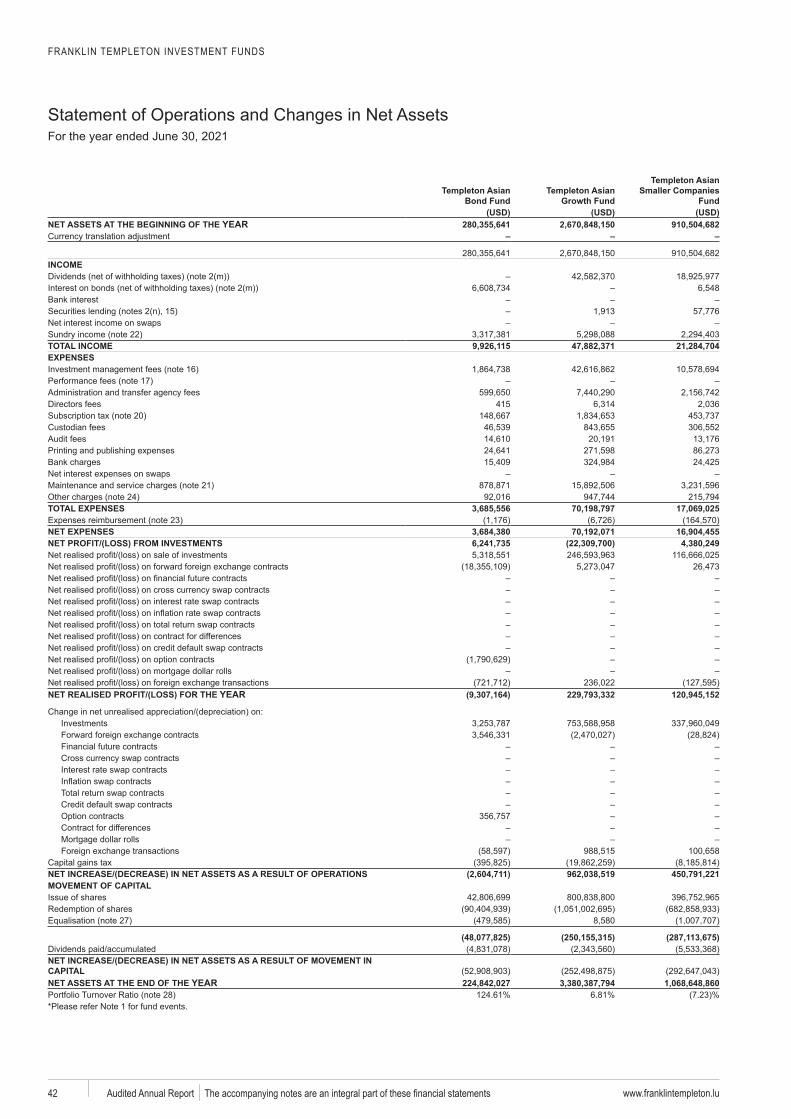
Templeton Asian Bond Fund
Templeton Asian Templeton Asian
Smaller Companies Fund
(USD) (USD) (USD)NET ASSETS AT THE BEGINNING OF THE YEAR 280,355,641 2,670,848,150 910,504,682
– – –
INCOME
Bank interest15
TOTAL INCOME 9,926,115 47,882,371 21,284,704EXPENSES
1617
Directors fees 41520
Bank charges
2124
TOTAL EXPENSES 3,685,556 70,198,797 17,069,02523
NET EXPENSES 3,684,380 70,192,071 16,904,455NET PROFIT/(LOSS) FROM INVESTMENTS 6,241,735 (22,309,700) 4,380,249
realisedrealisedrealisedrealisedrealisedrealisedrealisedrealisedrealisedrealisedrealisedrealised
NET REALISED PROFIT/(LOSS) FOR THE YEAR (9,307,164) 229,793,332 120,945,152
unrealised
Financial future contracts
Foreign exchange transactions
NET INCREASE/(DECREASE) IN NET ASSETS AS A RESULT OF OPERATIONS (2,604,711) 962,038,519 450,791,221MOVEMENT OF CAPITAL
(48,077,825) (250,155,315) (287,113,675)
NET INCREASE/(DECREASE) IN NET ASSETS AS A RESULT OF MOVEMENT IN CAPITALNET ASSETS AT THE END OF THE YEAR 224,842,027 3,380,387,794 1,068,648,860
28
FRANKLIN TEMPLETON INVESTMENT FUNDS
Statement of Operations and Changes in Net AssetsFor the year ended June 30, 2021
www.franklintempleton.lu Audited Annual Report 43
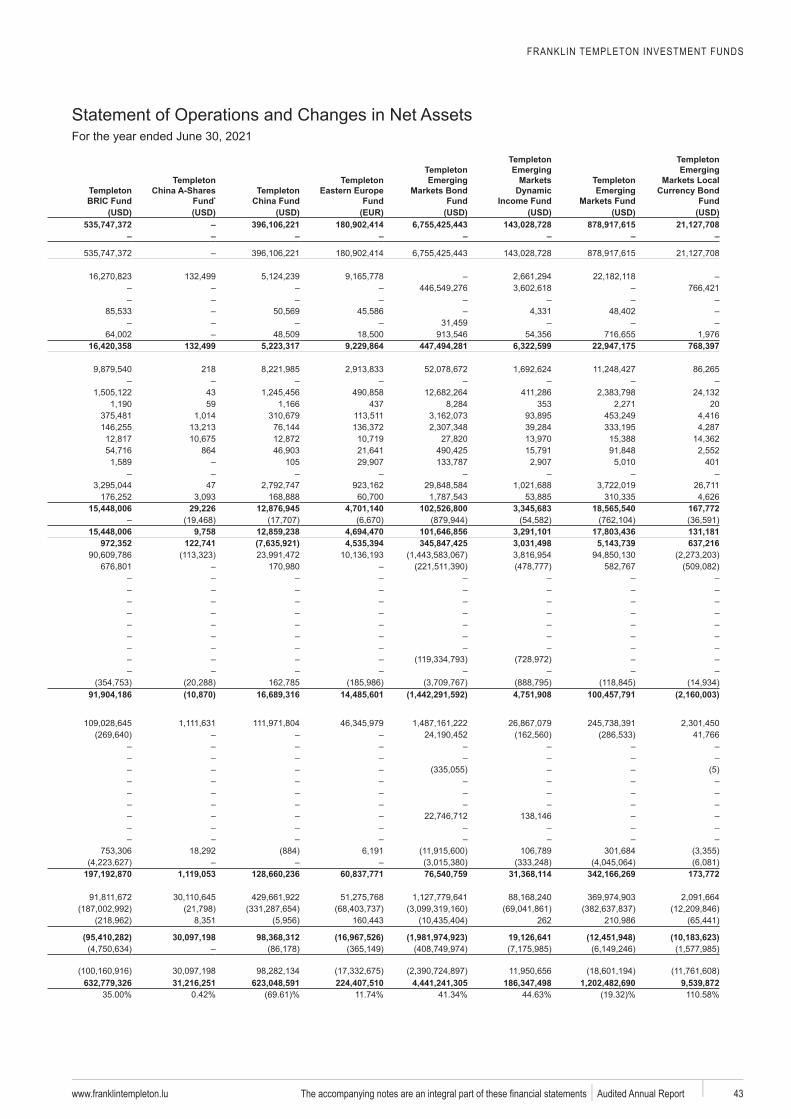
Templeton BRIC Fund
Templeton China A-Shares
Fund*Templeton
China Fund
Templeton Eastern Europe
Fund
Templeton Emerging
Markets Bond Fund
Templeton Emerging
Markets
Income Fund
Templeton Emerging
Markets Fund
Templeton Emerging
Markets Local
Fund(USD) (USD) (USD) (EUR) (USD) (USD) (USD) (USD)
535,747,372 – 396,106,221 180,902,414 6,755,425,443 143,028,728 878,917,615 21,127,708– – – – – – – –
16,420,358 132,499 5,223,317 9,229,864 447,494,281 6,322,599 22,947,175 768,397
218
4359 437 353 20
864105 401
47
15,448,006 29,226 12,876,945 4,701,140 102,526,800 3,345,683 18,565,540 167,772
15,448,006 9,758 12,859,238 4,694,470 101,646,856 3,291,101 17,803,436 131,181972,352 122,741 (7,635,921) 4,535,394 345,847,425 3,031,498 5,143,739 637,216
91,904,186 (10,870) 16,689,316 14,485,601 (1,442,291,592) 4,751,908 100,457,791 (2,160,003)
197,192,870 1,119,053 128,660,236 60,837,771 76,540,759 31,368,114 342,166,269 173,772
262
(95,410,282) 30,097,198 98,368,312 (16,967,526) (1,981,974,923) 19,126,641 (12,451,948) (10,183,623)
632,779,326 31,216,251 623,048,591 224,407,510 4,441,241,305 186,347,498 1,202,482,690 9,539,872
FRANKLIN TEMPLETON INVESTMENT FUNDS
Statement of Operations and Changes in Net AssetsFor the year ended June 30, 2021
www.franklintempleton.luAudited Annual Report 44
Templeton Emerging Markets Smaller
Companies Fund
Templeton Emerging Markets
*Templeton Euroland
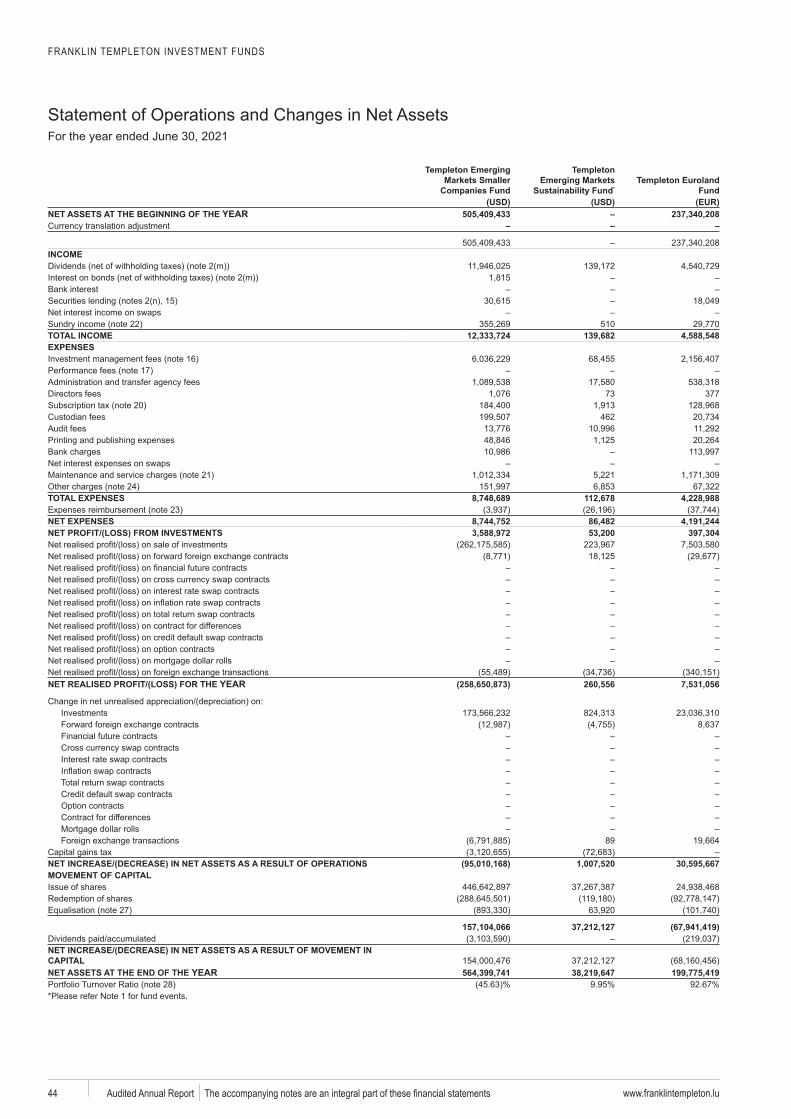
Fund (USD) (USD) (EUR)NET ASSETS AT THE BEGINNING OF THE YEAR 505,409,433 – 237,340,208
– – –
INCOME
Bank interest15
510TOTAL INCOME 12,333,724 139,682 4,588,548EXPENSES
1617
Directors fees 73 37720
462
Bank charges
2124
TOTAL EXPENSES 8,748,689 112,678 4,228,98823
NET EXPENSES 8,744,752 86,482 4,191,244NET PROFIT/(LOSS) FROM INVESTMENTS 3,588,972 53,200 397,304
realisedrealisedrealisedrealisedrealisedrealisedrealisedrealisedrealisedrealisedrealisedrealised
NET REALISED PROFIT/(LOSS) FOR THE YEAR (258,650,873) 260,556 7,531,056
unrealised
Financial future contracts
Foreign exchange transactions 89
NET INCREASE/(DECREASE) IN NET ASSETS AS A RESULT OF OPERATIONS (95,010,168) 1,007,520 30,595,667MOVEMENT OF CAPITAL
157,104,066 37,212,127 (67,941,419)
NET INCREASE/(DECREASE) IN NET ASSETS AS A RESULT OF MOVEMENT IN CAPITALNET ASSETS AT THE END OF THE YEAR 564,399,741 38,219,647 199,775,419
28
FRANKLIN TEMPLETON INVESTMENT FUNDS
Statement of Operations and Changes in Net AssetsFor the year ended June 30, 2021
www.franklintempleton.lu Audited Annual Report 45
Templeton European
Dividend Fund*
Templeton European
Opportunities Fund*
Templeton European
Small-Mid Cap Fund*
Templeton Frontier
Markets Fund
Templeton Global
Balanced Fund
Templeton Global Bond (Euro) Fund
Templeton Global Bond
Fund
Templeton Global Climate
Change Fund(EUR) (EUR) (EUR) (USD) (USD) (EUR) (USD) (EUR)
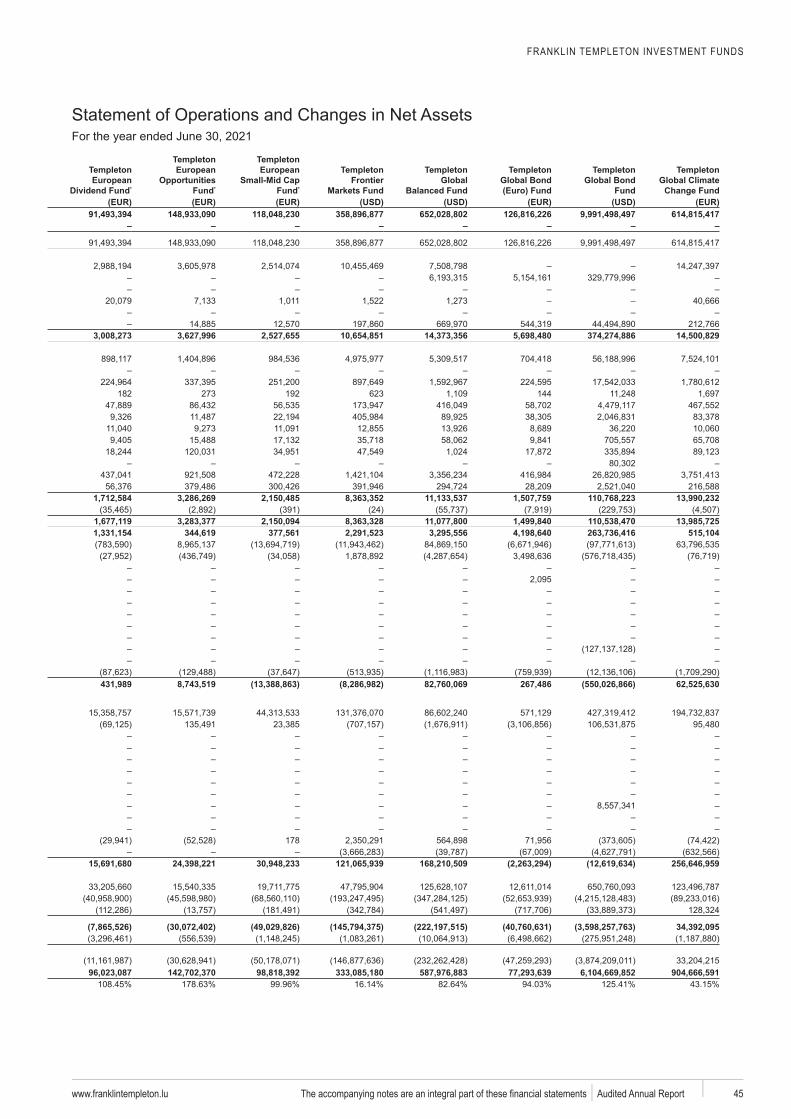
91,493,394 148,933,090 118,048,230 358,896,877 652,028,802 126,816,226 9,991,498,497 614,815,417– – – – – – – –
3,008,273 3,627,996 2,527,655 10,654,851 14,373,356 5,698,480 374,274,886 14,500,829
182 273 192 623 144
1,712,584 3,286,269 2,150,485 8,363,352 11,133,537 1,507,759 110,768,223 13,990,232
1,677,119 3,283,377 2,150,094 8,363,328 11,077,800 1,499,840 110,538,470 13,985,7251,331,154 344,619 377,561 2,291,523 3,295,556 4,198,640 263,736,416 515,104
431,989 8,743,519 (13,388,863) (8,286,982) 82,760,069 267,486 (550,026,866) 62,525,630
178
15,691,680 24,398,221 30,948,233 121,065,939 168,210,509 (2,263,294) (12,619,634) 256,646,959
(7,865,526) (30,072,402) (49,029,826) (145,794,375) (222,197,515) (40,760,631) (3,598,257,763) 34,392,095
96,023,087 142,702,370 98,818,392 333,085,180 587,976,883 77,293,639 6,104,669,852 904,666,591
FRANKLIN TEMPLETON INVESTMENT FUNDS
Statement of Operations and Changes in Net AssetsFor the year ended June 30, 2021
www.franklintempleton.luAudited Annual Report 46
Templeton Global Templeton Global Fund
Templeton Global High Yield Fund
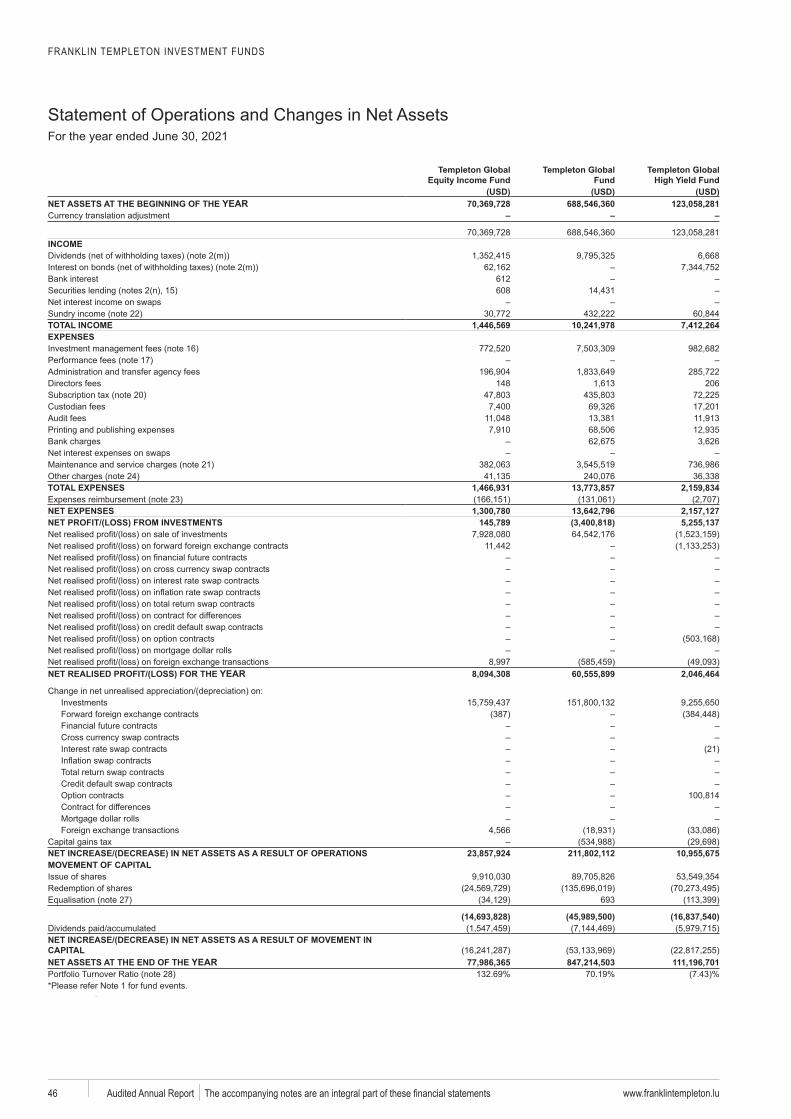
(USD) (USD) (USD)NET ASSETS AT THE BEGINNING OF THE YEAR 70,369,728 688,546,360 123,058,281
– – –
INCOME
Bank interest 61215 608
TOTAL INCOME 1,446,569 10,241,978 7,412,264EXPENSES
1617
Directors fees 148 20620
Bank charges
2124
TOTAL EXPENSES 1,466,931 13,773,857 2,159,83423
NET EXPENSES 1,300,780 13,642,796 2,157,127NET PROFIT/(LOSS) FROM INVESTMENTS 145,789 (3,400,818) 5,255,137
realisedrealisedrealisedrealisedrealisedrealisedrealisedrealisedrealisedrealisedrealisedrealised
NET REALISED PROFIT/(LOSS) FOR THE YEAR 8,094,308 60,555,899 2,046,464
unrealised
Financial future contracts
Foreign exchange transactions
NET INCREASE/(DECREASE) IN NET ASSETS AS A RESULT OF OPERATIONS 23,857,924 211,802,112 10,955,675MOVEMENT OF CAPITAL
693
(14,693,828) (45,989,500) (16,837,540)
NET INCREASE/(DECREASE) IN NET ASSETS AS A RESULT OF MOVEMENT IN CAPITALNET ASSETS AT THE END OF THE YEAR 77,986,365 847,214,503 111,196,701
28
‘ p;/
FRANKLIN TEMPLETON INVESTMENT FUNDS
Statement of Operations and Changes in Net AssetsFor the year ended June 30, 2021
www.franklintempleton.lu Audited Annual Report 47
Templeton Global Income Fund
Templeton Global Smaller Companies
FundTempleton Global Total Return Fund
Templeton Global Total Return II Fund (Euro) Fund
Templeton Latin America Fund
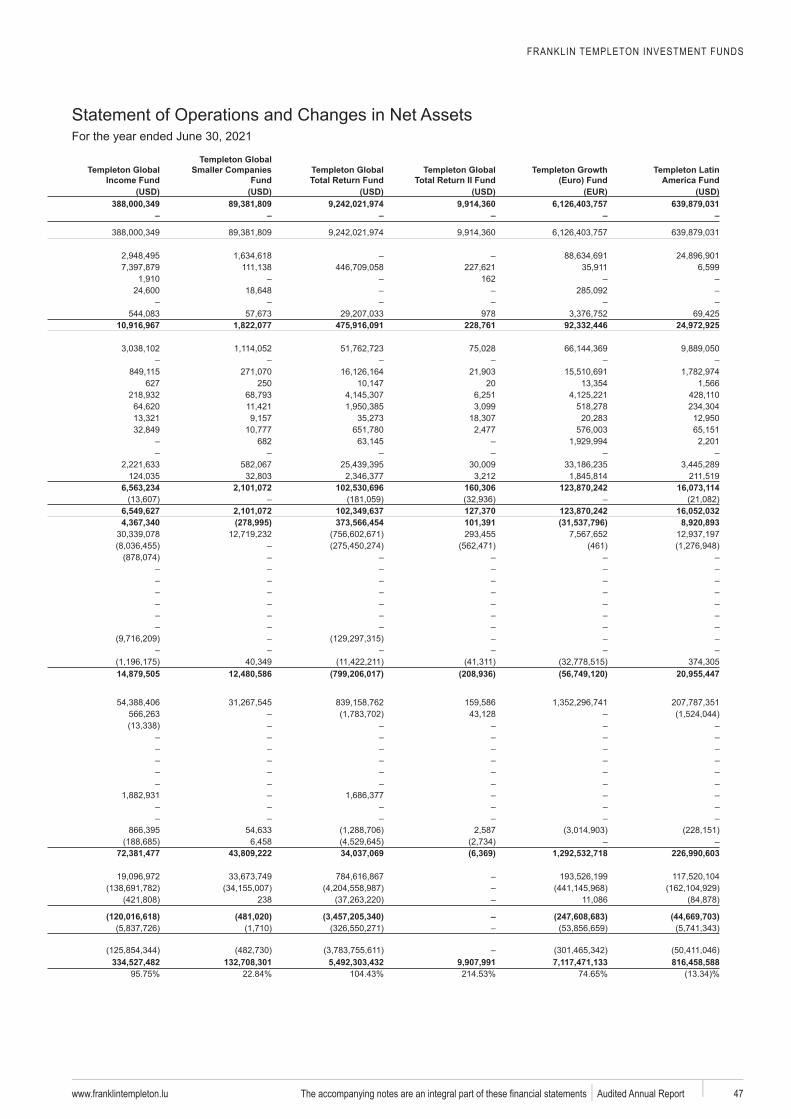
(USD) (USD) (USD) (USD) (EUR) (USD)388,000,349 89,381,809 9,242,021,974 9,914,360 6,126,403,757 639,879,031
– – – – – –
162
97810,916,967 1,822,077 475,916,091 228,761 92,332,446 24,972,925
627 250 20
682
6,563,234 2,101,072 102,530,696 160,306 123,870,242 16,073,114
6,549,627 2,101,072 102,349,637 127,370 123,870,242 16,052,0324,367,340 (278,995) 373,566,454 101,391 (31,537,796) 8,920,893
14,879,505 12,480,586 (799,206,017) (208,936) (56,749,120) 20,955,447
72,381,477 43,809,222 34,037,069 (6,369) 1,292,532,718 226,990,603
238
(120,016,618) (481,020) (3,457,205,340) – (247,608,683) (44,669,703)
334,527,482 132,708,301 5,492,303,432 9,907,991 7,117,471,133 816,458,588
FRANKLIN TEMPLETON INVESTMENT FUNDS
Statistical Information
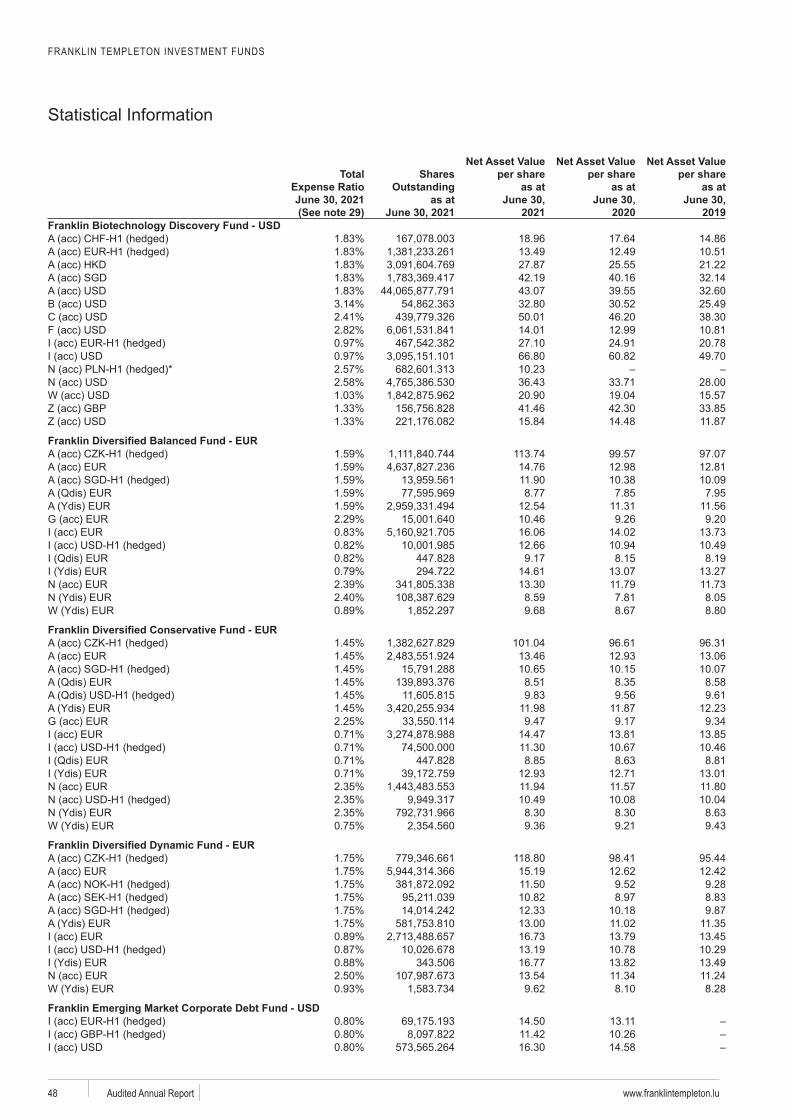
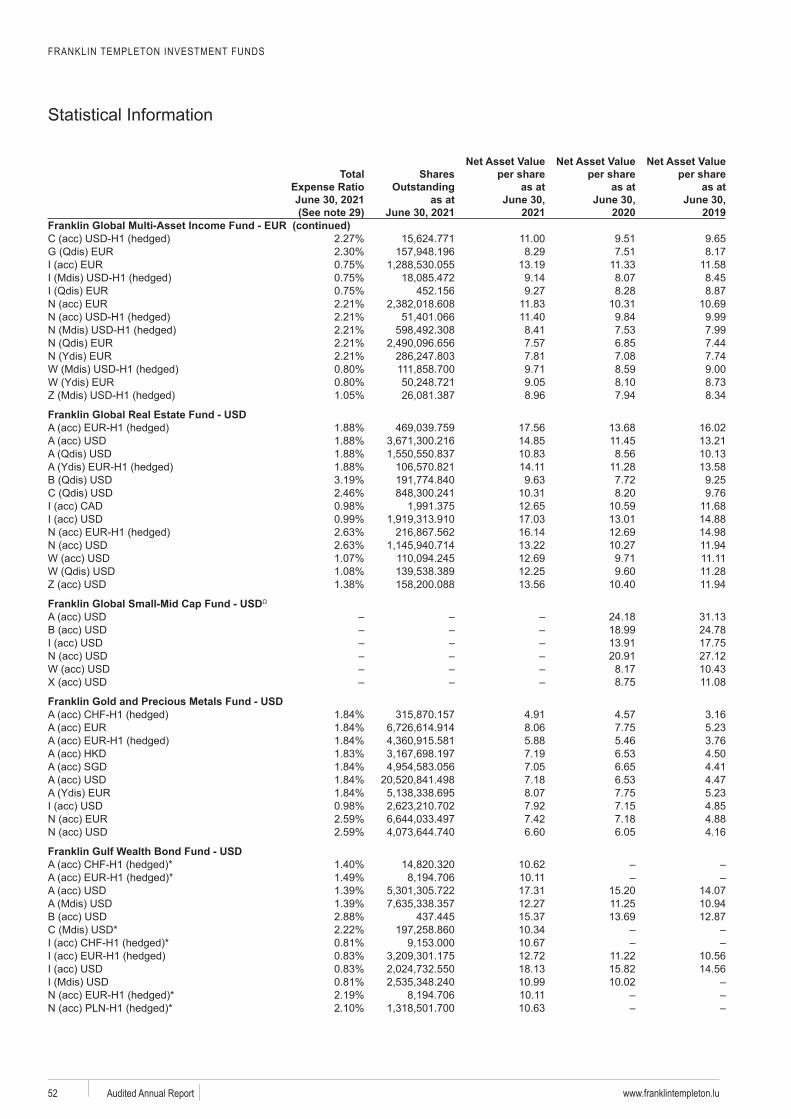
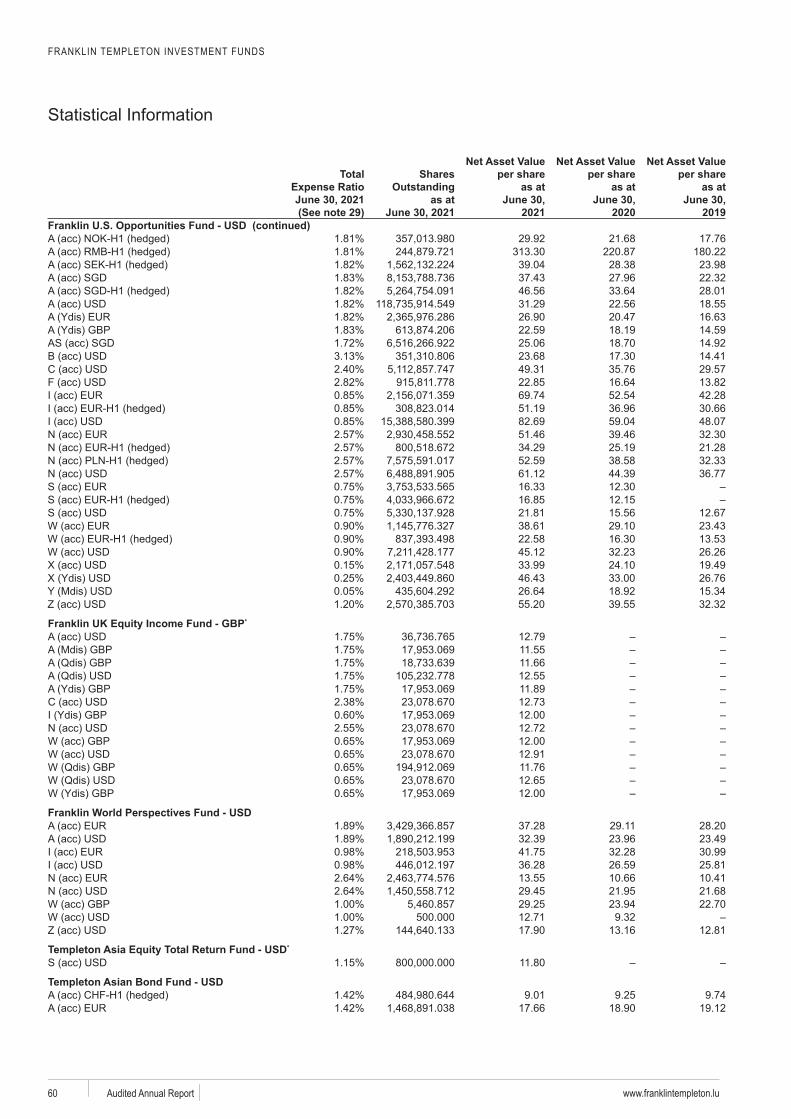
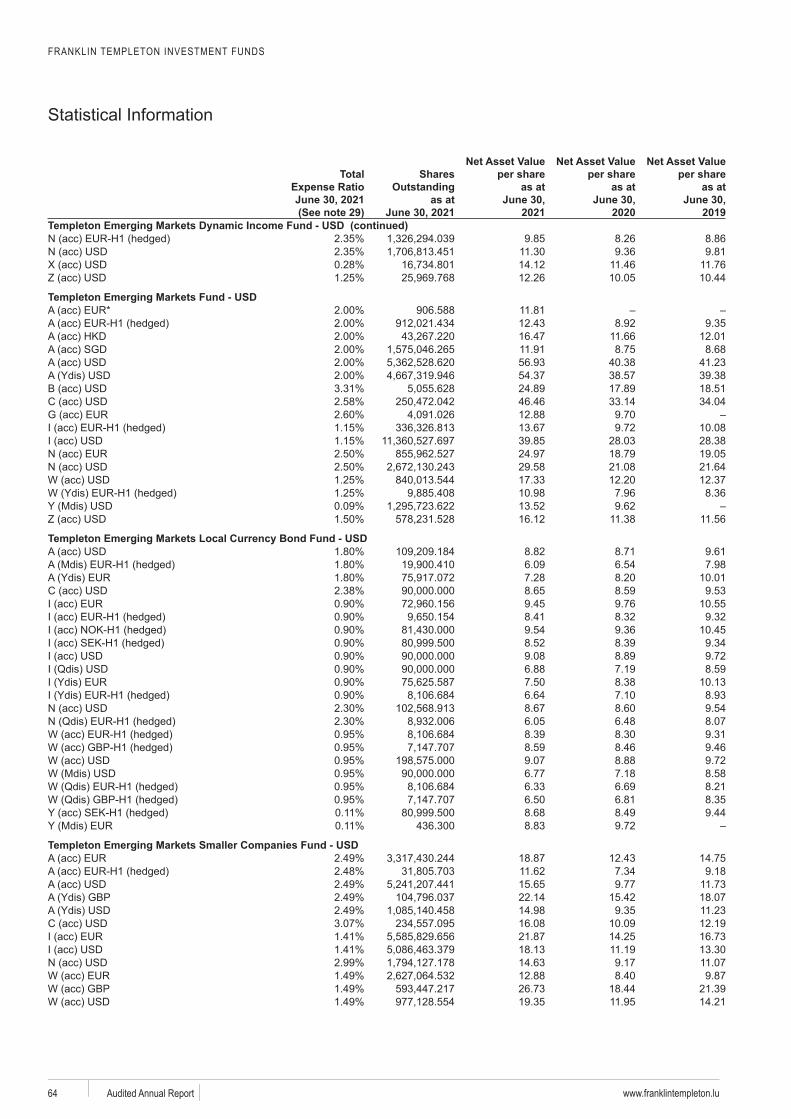
www.franklintempleton.luAudited Annual Report 48
Total Expense Ratio
(See note 29)
Shares Outstanding
as at 2021
Net Asset Value per share
as at
2021
Net Asset Value per share
as at
2020
Net Asset Value per share
as at
2019 - USD
18.96 17.64 14.8613.49 12.49 10.5127.87 25.55 21.2242.19 40.16 32.1443.07 39.55 32.6032.80 30.52 25.4950.01 46.20 38.3014.01 12.99 10.8127.10 24.91 20.7866.80 60.82 49.7010.2336.43 33.71 28.0020.90 19.04 15.5741.46 42.30 33.8515.84 14.48 11.87
- EUR 113.74 99.57 97.0714.76 12.98 12.8111.90 10.38 10.098.77 7.85 7.95
12.54 11.31 11.5610.46 9.26 9.2016.06 14.02 13.7312.66 10.94 10.49
447.828 9.17 8.15 8.19294.722 14.61 13.07 13.27
13.30 11.79 11.738.59 7.81 8.059.68 8.67 8.80
- EUR 101.04 96.61 96.3113.46 12.93 13.0610.65 10.15 10.078.51 8.35 8.589.83 9.56 9.61
11.98 11.87 12.239.47 9.17 9.34
14.47 13.81 13.8511.30 10.67 10.46
447.828 8.85 8.63 8.8112.93 12.71 13.0111.94 11.57 11.8010.49 10.08 10.048.30 8.30 8.639.36 9.21 9.43
- EUR 118.80 98.41 95.4415.19 12.62 12.4211.50 9.52 9.2810.82 8.97 8.8312.33 10.18 9.8713.00 11.02 11.3516.73 13.79 13.4513.19 10.78 10.29
343.506 16.77 13.82 13.4913.54 11.34 11.249.62 8.10 8.28
Franklin Emerging Market Corporate Debt Fund - USD 14.50 13.1111.42 10.2616.30 14.58
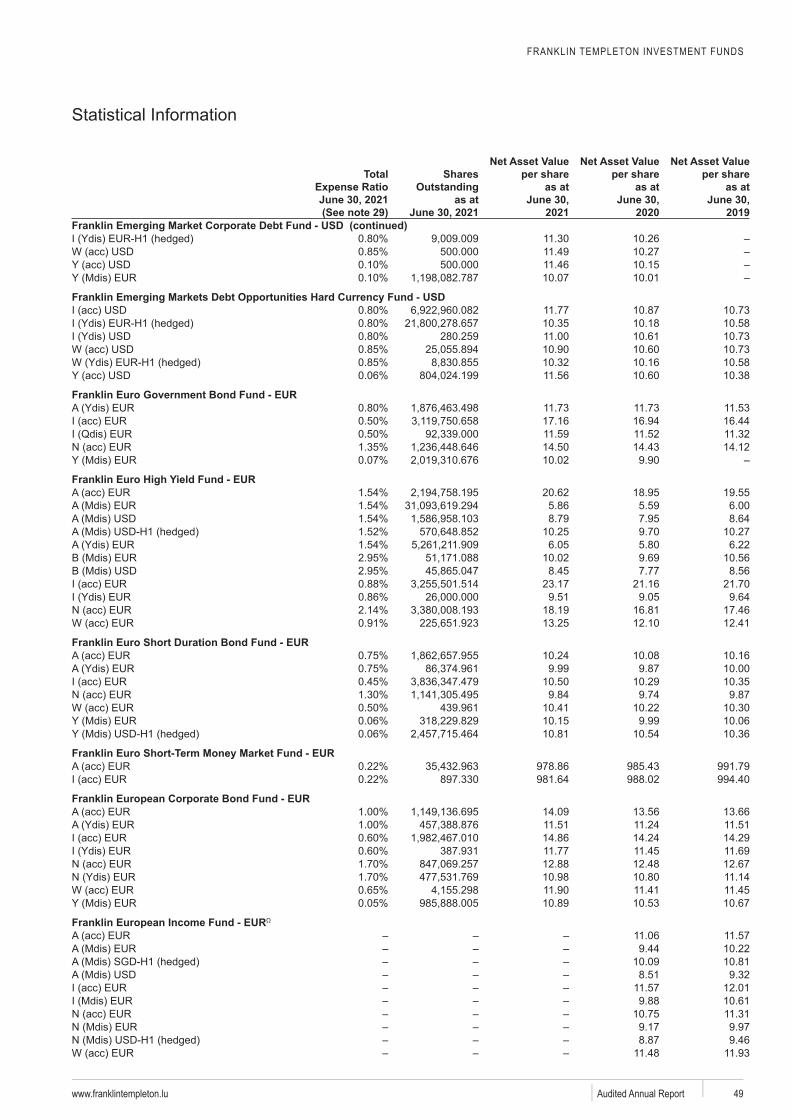
FRANKLIN TEMPLETON INVESTMENT FUNDS
Statistical Information
www.franklintempleton.lu Audited Annual Report 49
Total Expense Ratio
(See note 29)
Shares Outstanding
as at
Net Asset Value per share
as at
2021
Net Asset Value per share
as at
2020
Net Asset Value per share
as at
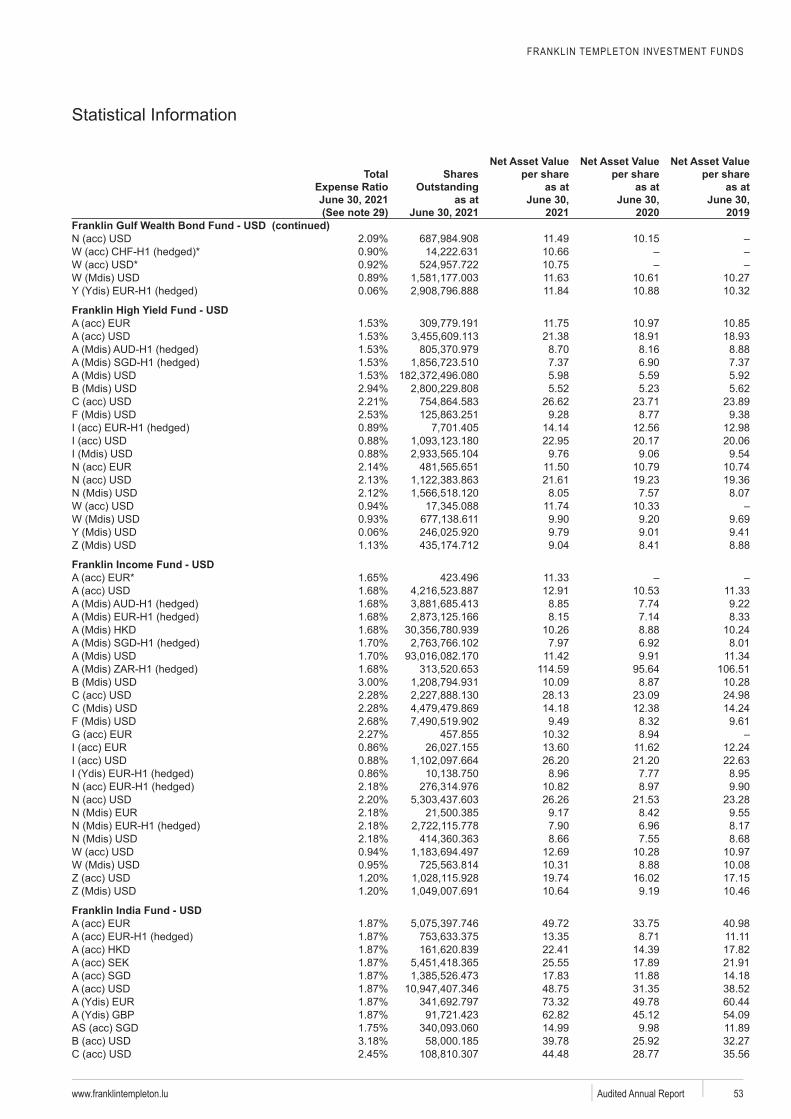
2019Franklin Emerging Market Corporate Debt Fund - USD (continued)
11.30 10.26500.000 11.49 10.27500.000 11.46 10.15
10.07 10.01
- USD 11.77 10.87 10.7310.35 10.18 10.58
280.259 11.00 10.61 10.7310.90 10.60 10.7310.32 10.16 10.5811.56 10.60 10.38
Franklin Euro Government Bond Fund - EUR 11.73 11.73 11.5317.16 16.94 16.4411.59 11.52 11.3214.50 14.43 14.1210.02 9.90
Franklin Euro High Yield Fund - EUR 20.62 18.95 19.555.86 5.59 6.008.79 7.95 8.64
10.25 9.70 10.276.05 5.80 6.22
10.02 9.69 10.568.45 7.77 8.56
23.17 21.16 21.709.51 9.05 9.64
18.19 16.81 17.4613.25 12.10 12.41
Franklin Euro Short Duration Bond Fund - EUR 10.24 10.08 10.169.99 9.87 10.00
10.50 10.29 10.359.84 9.74 9.87
439.961 10.41 10.22 10.3010.15 9.99 10.0610.81 10.54 10.36
- EUR 978.86 985.43 991.79
897.330 981.64 988.02 994.40
Franklin European Corporate Bond Fund - EUR 14.09 13.56 13.6611.51 11.24 11.5114.86 14.24 14.29
387.931 11.77 11.45 11.6912.88 12.48 12.6710.98 10.80 11.1411.90 11.41 11.4510.89 10.53 10.67
Franklin European Income Fund - EUR 11.06 11.579.44 10.22
10.09 10.818.51 9.32
11.57 12.019.88 10.61
10.75 11.319.17 9.978.87 9.46
11.48 11.93
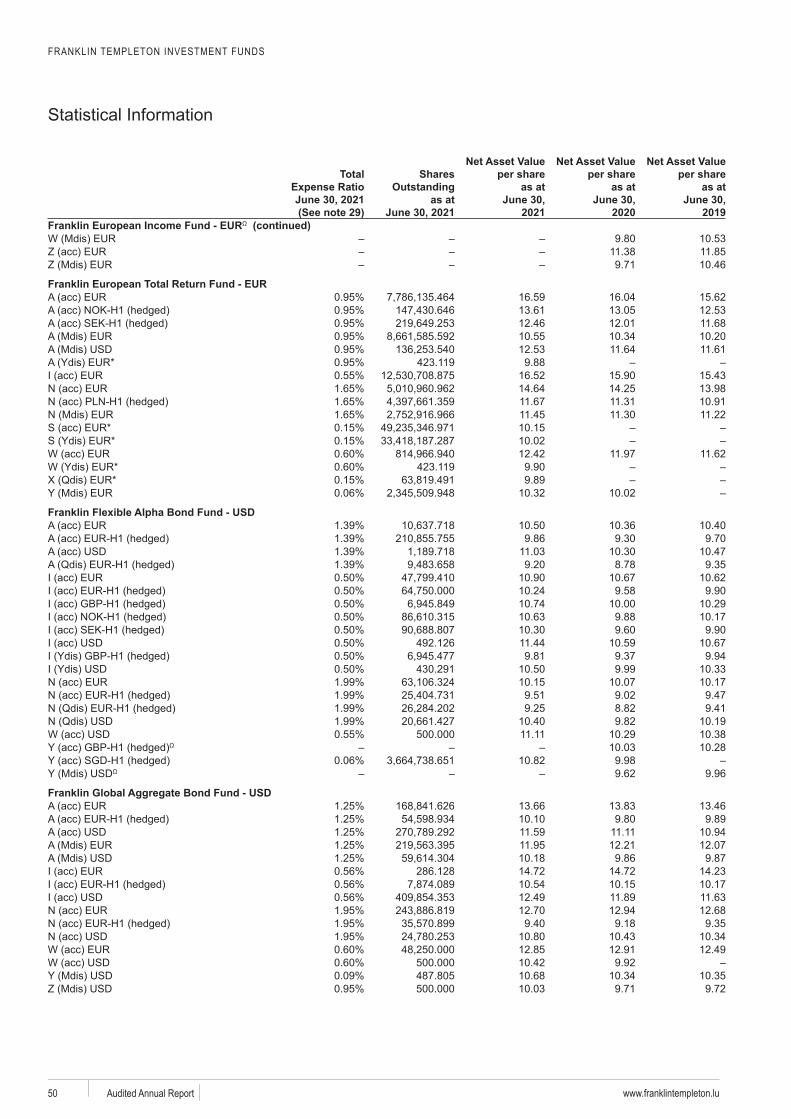
FRANKLIN TEMPLETON INVESTMENT FUNDS
Statistical Information
www.franklintempleton.luAudited Annual Report 50
Total Expense Ratio
(See note 29)
Shares Outstanding
as at
Net Asset Value per share
as at
2021
Net Asset Value per share
as at
2020
Net Asset Value per share
as at
2019Franklin European Income Fund - EUR (continued)
9.80 10.5311.38 11.859.71 10.46
Franklin European Total Return Fund - EUR 16.59 16.04 15.6213.61 13.05 12.5312.46 12.01 11.6810.55 10.34 10.2012.53 11.64 11.61
423.119 9.8816.52 15.90 15.4314.64 14.25 13.9811.67 11.31 10.9111.45 11.30 11.2210.1510.0212.42 11.97 11.62
423.119 9.909.89
10.32 10.02
Franklin Flexible Alpha Bond Fund - USD 10.50 10.36 10.409.86 9.30 9.70
11.03 10.30 10.479.20 8.78 9.35
10.90 10.67 10.6210.24 9.58 9.9010.74 10.00 10.2910.63 9.88 10.1710.30 9.60 9.90
492.126 11.44 10.59 10.679.81 9.37 9.94
430.291 10.50 9.99 10.3310.15 10.07 10.179.51 9.02 9.479.25 8.82 9.41
10.40 9.82 10.19500.000 11.11 10.29 10.38
10.03 10.2810.82 9.98
9.62 9.96
Franklin Global Aggregate Bond Fund - USD 13.66 13.83 13.4610.10 9.80 9.8911.59 11.11 10.9411.95 12.21 12.0710.18 9.86 9.87
286.128 14.72 14.72 14.2310.54 10.15 10.1712.49 11.89 11.6312.70 12.94 12.689.40 9.18 9.35
10.80 10.43 10.3412.85 12.91 12.49
500.000 10.42 9.92487.805 10.68 10.34 10.35500.000 10.03 9.71 9.72
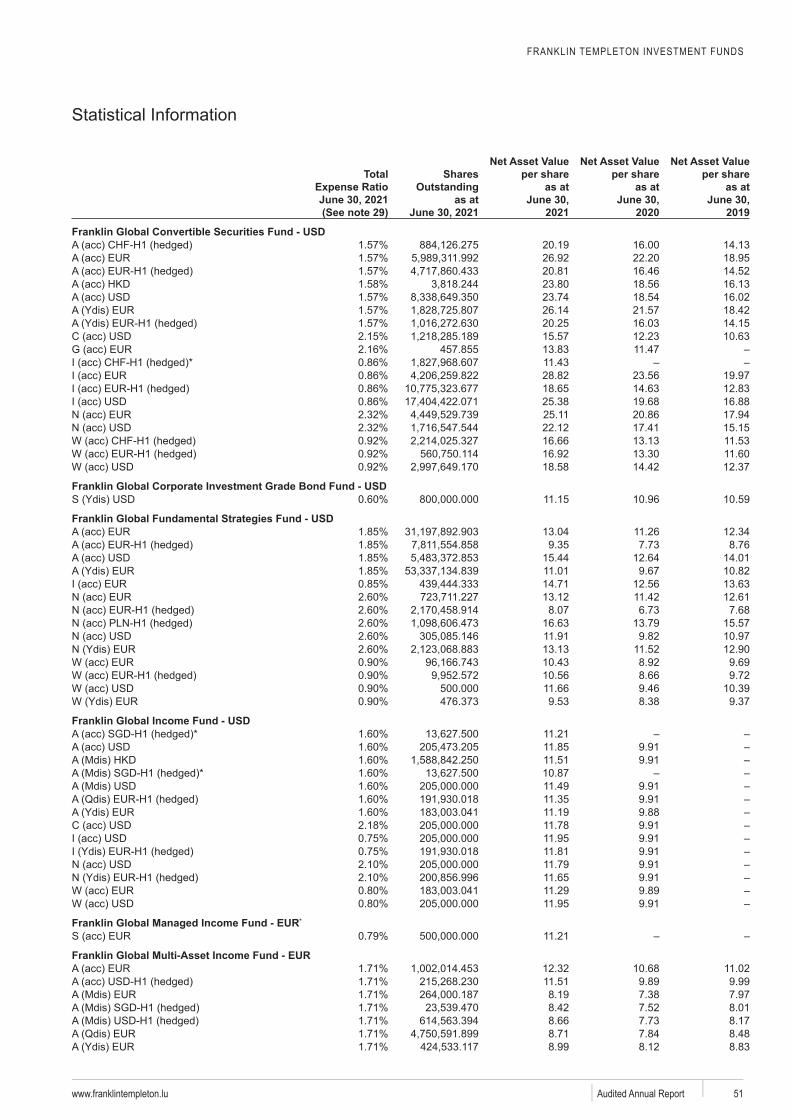
FRANKLIN TEMPLETON INVESTMENT FUNDS
Statistical Information
www.franklintempleton.lu Audited Annual Report 51
Total Expense Ratio
(See note 29)
Shares Outstanding
as at
Net Asset Value per share
as at
2021
Net Asset Value per share
as at
2020
Net Asset Value per share
as at
2019
Franklin Global Convertible Securities Fund - USD 20.19 16.00 14.1326.92 22.20 18.9520.81 16.46 14.5223.80 18.56 16.1323.74 18.54 16.0226.14 21.57 18.4220.25 16.03 14.1515.57 12.23 10.63
457.855 13.83 11.4711.4328.82 23.56 19.9718.65 14.63 12.8325.38 19.68 16.8825.11 20.86 17.9422.12 17.41 15.1516.66 13.13 11.5316.92 13.30 11.6018.58 14.42 12.37
Franklin Global Corporate Investment Grade Bond Fund - USD 11.15 10.96 10.59
Franklin Global Fundamental Strategies Fund - USD 13.04 11.26 12.349.35 7.73 8.76
15.44 12.64 14.0111.01 9.67 10.8214.71 12.56 13.6313.12 11.42 12.61
8.07 6.73 7.6816.63 13.79 15.5711.91 9.82 10.9713.13 11.52 12.9010.43 8.92 9.6910.56 8.66 9.72
500.000 11.66 9.46 10.39476.373 9.53 8.38 9.37
Franklin Global Income Fund - USD 11.2111.85 9.9111.51 9.9110.8711.49 9.9111.35 9.9111.19 9.8811.78 9.9111.95 9.9111.81 9.9111.79 9.9111.65 9.9111.29 9.8911.95 9.91
Franklin Global Managed Income Fund - EUR* 11.21
Franklin Global Multi-Asset Income Fund - EUR 12.32 10.68 11.0211.51 9.89 9.998.19 7.38 7.978.42 7.52 8.018.66 7.73 8.178.71 7.84 8.488.99 8.12 8.83
FRANKLIN TEMPLETON INVESTMENT FUNDS
Statistical Information
www.franklintempleton.luAudited Annual Report 52
Total Expense Ratio
(See note 29)
Shares Outstanding
as at
Net Asset Value per share
as at
2021
Net Asset Value per share
as at
2020
Net Asset Value per share
as at
2019Franklin Global Multi-Asset Income Fund - EUR (continued)
11.00 9.51 9.658.29 7.51 8.17
13.19 11.33 11.589.14 8.07 8.45
452.156 9.27 8.28 8.8711.83 10.31 10.6911.40 9.84 9.998.41 7.53 7.997.57 6.85 7.447.81 7.08 7.749.71 8.59 9.009.05 8.10 8.738.96 7.94 8.34
Franklin Global Real Estate Fund - USD 17.56 13.68 16.0214.85 11.45 13.2110.83 8.56 10.1314.11 11.28 13.589.63 7.72 9.25
10.31 8.20 9.7612.65 10.59 11.6817.03 13.01 14.8816.14 12.69 14.9813.22 10.27 11.9412.69 9.71 11.1112.25 9.60 11.2813.56 10.40 11.94
Franklin Global Small-Mid Cap Fund - USD 24.18 31.1318.99 24.7813.91 17.7520.91 27.128.17 10.438.75 11.08
Franklin Gold and Precious Metals Fund - USD 4.91 4.57 3.168.06 7.75 5.235.88 5.46 3.767.19 6.53 4.507.05 6.65 4.417.18 6.53 4.478.07 7.75 5.237.92 7.15 4.857.42 7.18 4.886.60 6.05 4.16
Franklin Gulf Wealth Bond Fund - USD 10.6210.1117.31 15.20 14.0712.27 11.25 10.94
437.445 15.37 13.69 12.8710.3410.6712.72 11.22 10.5618.13 15.82 14.5610.99 10.0210.1110.63
FRANKLIN TEMPLETON INVESTMENT FUNDS
Statistical Information
www.franklintempleton.lu Audited Annual Report 53
Total Expense Ratio
(See note 29)
Shares Outstanding
as at
Net Asset Value per share
as at
2021
Net Asset Value per share
as at
2020
Net Asset Value per share
as at
2019Franklin Gulf Wealth Bond Fund - USD (continued)
11.49 10.1510.6610.7511.63 10.61 10.2711.84 10.88 10.32
Franklin High Yield Fund - USD 11.75 10.97 10.8521.38 18.91 18.938.70 8.16 8.887.37 6.90 7.375.98 5.59 5.925.52 5.23 5.62
26.62 23.71 23.899.28 8.77 9.38
14.14 12.56 12.9822.95 20.17 20.069.76 9.06 9.54
11.50 10.79 10.7421.61 19.23 19.368.05 7.57 8.07
11.74 10.339.90 9.20 9.699.79 9.01 9.419.04 8.41 8.88
Franklin Income Fund - USD 423.496 11.33
12.91 10.53 11.338.85 7.74 9.228.15 7.14 8.33
10.26 8.88 10.247.97 6.92 8.01
11.42 9.91 11.34114.59 95.64 106.5110.09 8.87 10.2828.13 23.09 24.9814.18 12.38 14.249.49 8.32 9.61
457.855 10.32 8.9413.60 11.62 12.2426.20 21.20 22.638.96 7.77 8.95
10.82 8.97 9.9026.26 21.53 23.289.17 8.42 9.557.90 6.96 8.178.66 7.55 8.68
12.69 10.28 10.9710.31 8.88 10.0819.74 16.02 17.1510.64 9.19 10.46
Franklin India Fund - USD 49.72 33.75 40.9813.35 8.71 11.1122.41 14.39 17.8225.55 17.89 21.9117.83 11.88 14.1848.75 31.35 38.5273.32 49.78 60.4462.82 45.12 54.0914.99 9.98 11.8939.78 25.92 32.2744.48 28.77 35.56
FRANKLIN TEMPLETON INVESTMENT FUNDS
Statistical Information
www.franklintempleton.luAudited Annual Report 54
Total Expense Ratio
(See note 29)
Shares Outstanding
as at
Net Asset Value per share
as at
2021
Net Asset Value per share
as at
2020
Net Asset Value per share
as at
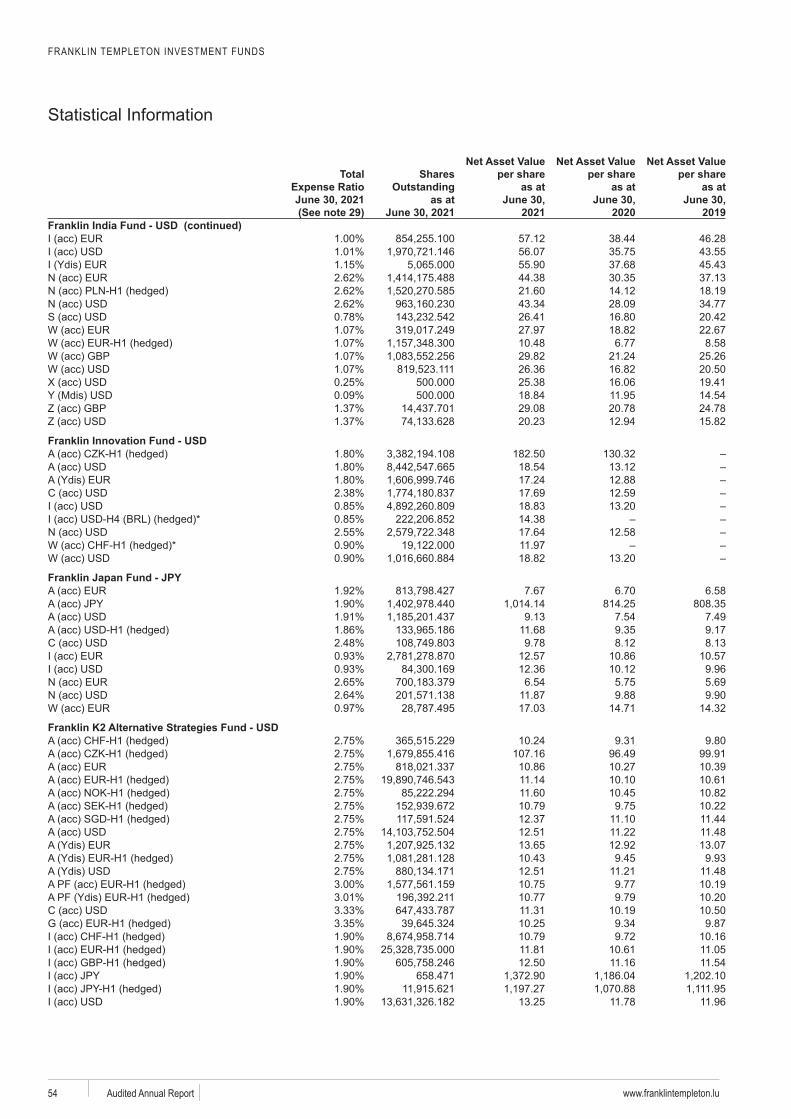
2019Franklin India Fund - USD (continued)
57.12 38.44 46.2856.07 35.75 43.5555.90 37.68 45.4344.38 30.35 37.1321.60 14.12 18.1943.34 28.09 34.7726.41 16.80 20.4227.97 18.82 22.6710.48 6.77 8.5829.82 21.24 25.2626.36 16.82 20.50
500.000 25.38 16.06 19.41500.000 18.84 11.95 14.54
29.08 20.78 24.7820.23 12.94 15.82
Franklin Innovation Fund - USD 182.50 130.32
18.54 13.1217.24 12.8817.69 12.5918.83 13.2014.3817.64 12.5811.9718.82 13.20
- 7.67 6.70 6.58
814.25 808.359.13 7.54 7.49
11.68 9.35 9.179.78 8.12 8.13
12.57 10.86 10.5712.36 10.12 9.966.54 5.75 5.69
11.87 9.88 9.9017.03 14.71 14.32
- USD 10.24 9.31 9.80
107.16 96.49 99.9110.86 10.27 10.3911.14 10.10 10.6111.60 10.45 10.8210.79 9.75 10.2212.37 11.10 11.4412.51 11.22 11.4813.65 12.92 13.0710.43 9.45 9.9312.51 11.21 11.4810.75 9.77 10.1910.77 9.79 10.2011.31 10.19 10.5010.25 9.34 9.8710.79 9.72 10.1611.81 10.61 11.0512.50 11.16 11.54
658.471
13.25 11.78 11.96
FRANKLIN TEMPLETON INVESTMENT FUNDS
Statistical Information
www.franklintempleton.lu Audited Annual Report 55
Total Expense Ratio
(See note 29)
Shares Outstanding
as at
Net Asset Value per share
as at
2021
Net Asset Value per share
as at
2020
Net Asset Value per share
as at
2019
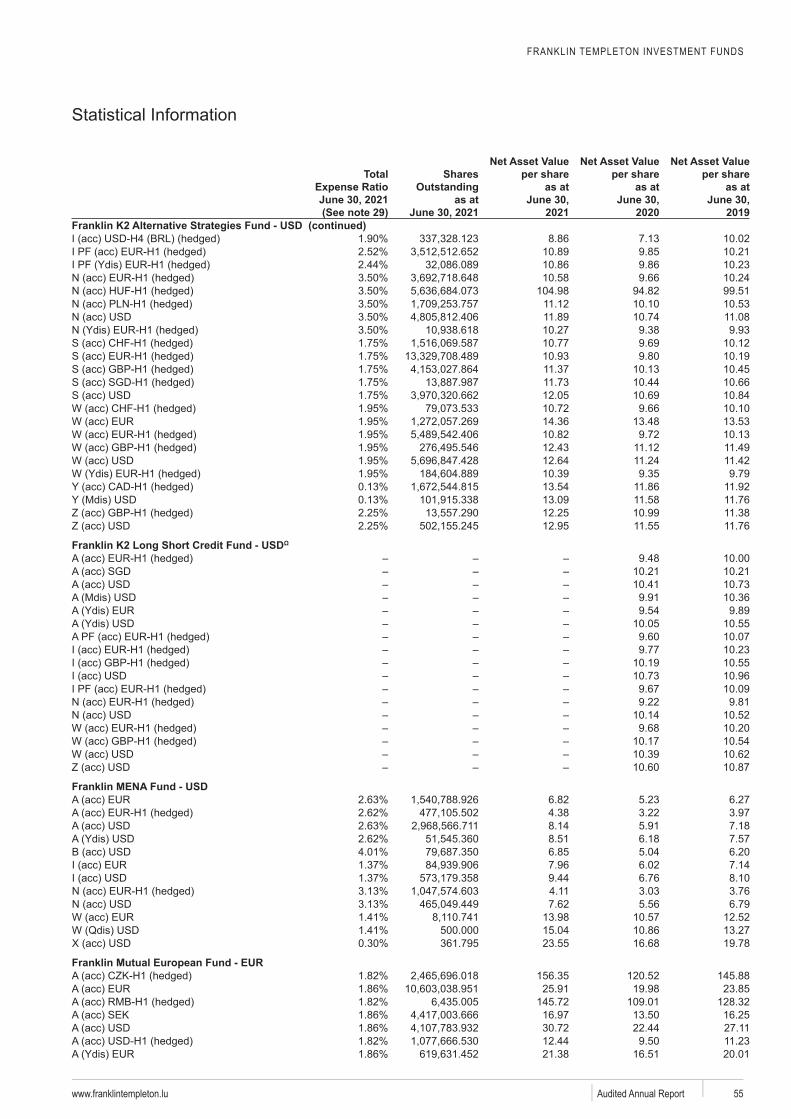
8.86 7.13 10.0210.89 9.85 10.2110.86 9.86 10.2310.58 9.66 10.24
104.98 94.82 99.5111.12 10.10 10.5311.89 10.74 11.0810.27 9.38 9.9310.77 9.69 10.1210.93 9.80 10.1911.37 10.13 10.4511.73 10.44 10.6612.05 10.69 10.8410.72 9.66 10.1014.36 13.48 13.5310.82 9.72 10.1312.43 11.12 11.4912.64 11.24 11.4210.39 9.35 9.7913.54 11.86 11.9213.09 11.58 11.7612.25 10.99 11.3812.95 11.55 11.76
- USD 9.48 10.00
10.21 10.2110.41 10.739.91 10.369.54 9.89
10.05 10.559.60 10.079.77 10.23
10.19 10.5510.73 10.969.67 10.099.22 9.81
10.14 10.529.68 10.20
10.17 10.5410.39 10.6210.60 10.87
Franklin MENA Fund - USD 6.82 5.23 6.274.38 3.22 3.978.14 5.91 7.188.51 6.18 7.576.85 5.04 6.207.96 6.02 7.149.44 6.76 8.104.11 3.03 3.767.62 5.56 6.79
13.98 10.57 12.52500.000 15.04 10.86 13.27361.795 23.55 16.68 19.78
Franklin Mutual European Fund - EUR156.35 120.52 145.8825.91 19.98 23.85
145.72 109.01 128.3216.97 13.50 16.2530.72 22.44 27.1112.44 9.50 11.2321.38 16.51 20.01
FRANKLIN TEMPLETON INVESTMENT FUNDS
Statistical Information
www.franklintempleton.luAudited Annual Report 56
Total Expense Ratio
(See note 29)
Shares Outstanding
as at
Net Asset Value per share
as at
2021
Net Asset Value per share
as at
2020
Net Asset Value per share
as at
2019Franklin Mutual European Fund - EUR (continued)
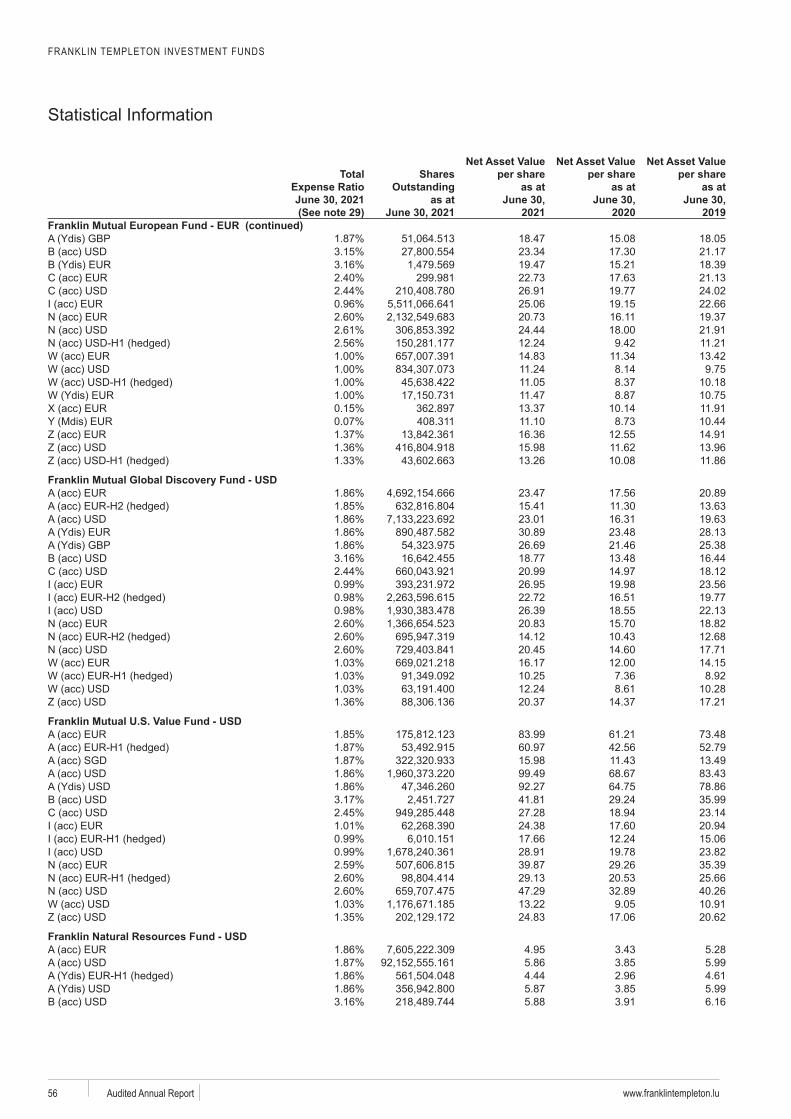
18.47 15.08 18.0523.34 17.30 21.1719.47 15.21 18.39
299.981 22.73 17.63 21.1326.91 19.77 24.0225.06 19.15 22.6620.73 16.11 19.3724.44 18.00 21.9112.24 9.42 11.2114.83 11.34 13.4211.24 8.14 9.7511.05 8.37 10.1811.47 8.87 10.75
362.897 13.37 10.14 11.91408.311 11.10 8.73 10.44
16.36 12.55 14.9115.98 11.62 13.9613.26 10.08 11.86
- USD 23.47 17.56 20.8915.41 11.30 13.6323.01 16.31 19.6330.89 23.48 28.1326.69 21.46 25.3818.77 13.48 16.4420.99 14.97 18.1226.95 19.98 23.5622.72 16.51 19.7726.39 18.55 22.1320.83 15.70 18.8214.12 10.43 12.6820.45 14.60 17.7116.17 12.00 14.1510.25 7.36 8.9212.24 8.61 10.2820.37 14.37 17.21
- USD 83.99 61.21 73.4860.97 42.56 52.7915.98 11.43 13.4999.49 68.67 83.4392.27 64.75 78.8641.81 29.24 35.9927.28 18.94 23.1424.38 17.60 20.9417.66 12.24 15.0628.91 19.78 23.8239.87 29.26 35.3929.13 20.53 25.6647.29 32.89 40.2613.22 9.05 10.9124.83 17.06 20.62
Franklin Natural Resources Fund - USD 4.95 3.43 5.285.86 3.85 5.994.44 2.96 4.615.87 3.85 5.995.88 3.91 6.16
FRANKLIN TEMPLETON INVESTMENT FUNDS
Statistical Information
www.franklintempleton.lu Audited Annual Report 57
Total Expense Ratio
(See note 29)
Shares Outstanding
as at
Net Asset Value per share
as at
2021
Net Asset Value per share
as at
2020
Net Asset Value per share
as at
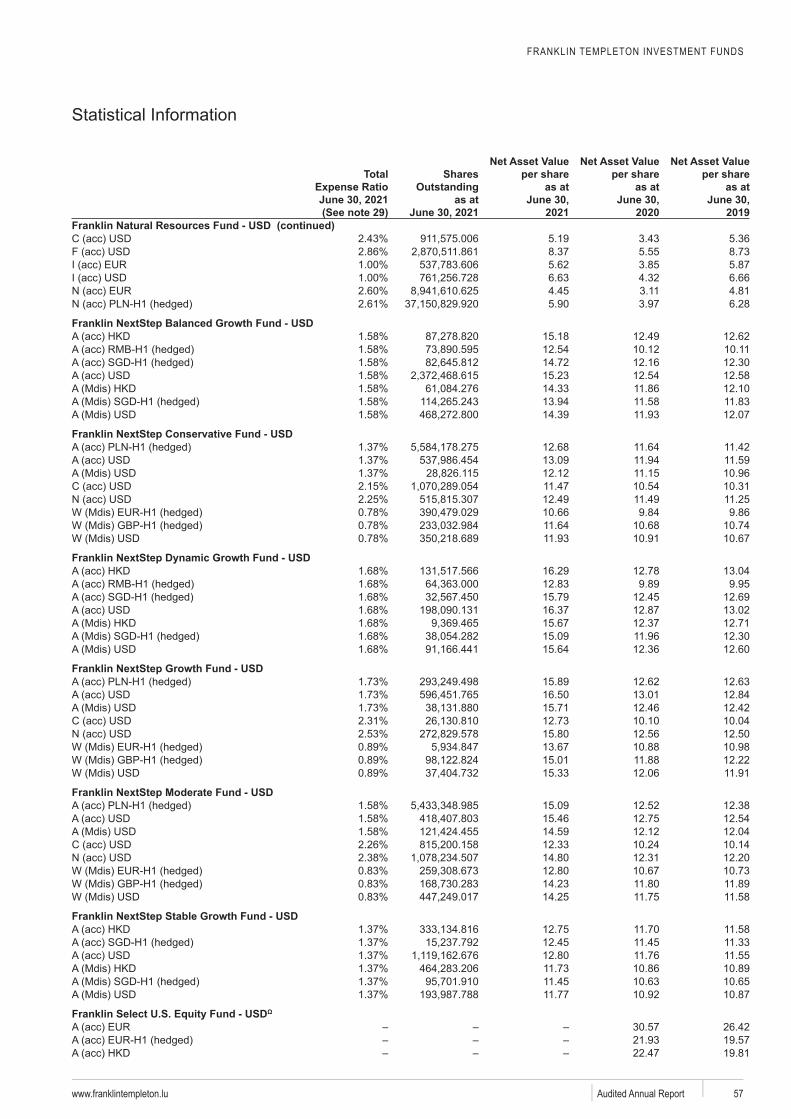
2019Franklin Natural Resources Fund - USD (continued)
5.19 3.43 5.368.37 5.55 8.735.62 3.85 5.876.63 4.32 6.664.45 3.11 4.815.90 3.97 6.28
- USD 15.18 12.49 12.6212.54 10.12 10.1114.72 12.16 12.3015.23 12.54 12.5814.33 11.86 12.1013.94 11.58 11.8314.39 11.93 12.07
Franklin NextStep Conservative Fund - USD 12.68 11.64 11.4213.09 11.94 11.5912.12 11.15 10.9611.47 10.54 10.3112.49 11.49 11.2510.66 9.84 9.8611.64 10.68 10.7411.93 10.91 10.67
- USD 16.29 12.78 13.0412.83 9.89 9.9515.79 12.45 12.6916.37 12.87 13.0215.67 12.37 12.7115.09 11.96 12.3015.64 12.36 12.60
- USD 15.89 12.62 12.6316.50 13.01 12.8415.71 12.46 12.4212.73 10.10 10.0415.80 12.56 12.5013.67 10.88 10.9815.01 11.88 12.2215.33 12.06 11.91
Franklin NextStep Moderate Fund - USD 15.09 12.52 12.3815.46 12.75 12.5414.59 12.12 12.0412.33 10.24 10.1414.80 12.31 12.2012.80 10.67 10.7314.23 11.80 11.8914.25 11.75 11.58
- USD 12.75 11.70 11.5812.45 11.45 11.3312.80 11.76 11.5511.73 10.86 10.8911.45 10.63 10.6511.77 10.92 10.87
- USD 30.57 26.4221.93 19.5722.47 19.81
FRANKLIN TEMPLETON INVESTMENT FUNDS
Statistical Information
www.franklintempleton.luAudited Annual Report 58
Total Expense Ratio
(See note 29)
Shares Outstanding
as at
Net Asset Value per share
as at
2021
Net Asset Value per share
as at
2020
Net Asset Value per share
as at
2019 (continued)
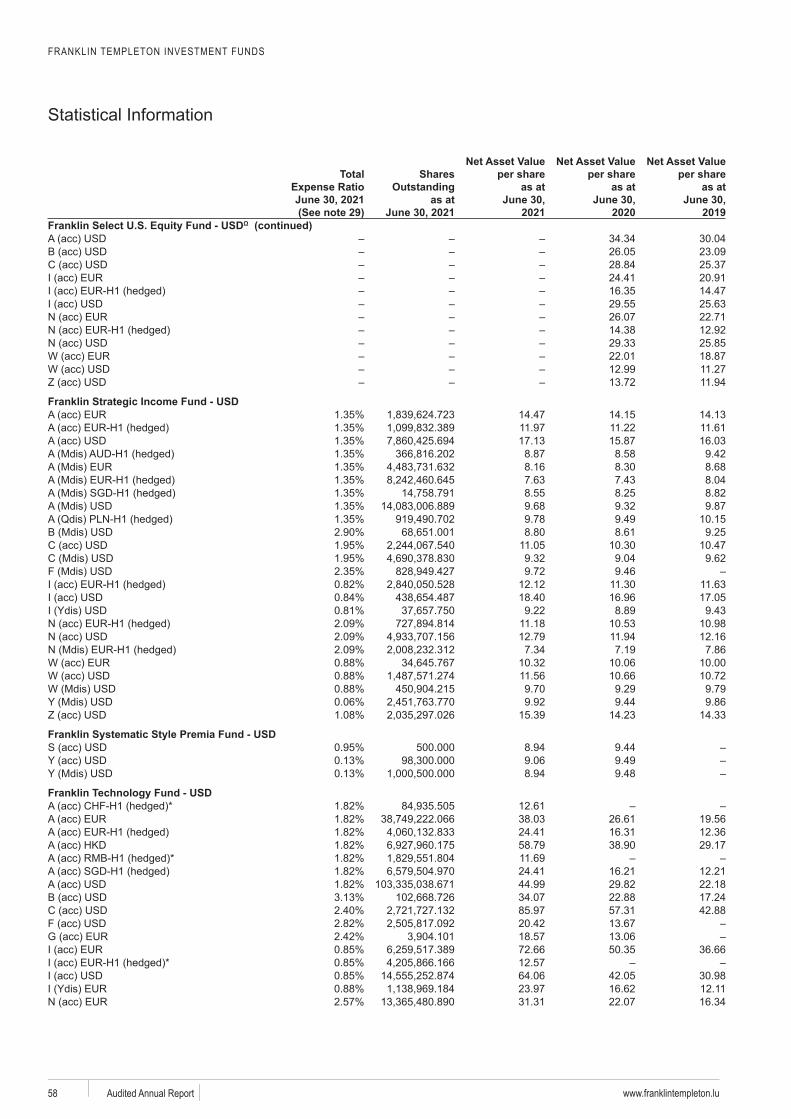
34.34 30.0426.05 23.0928.84 25.3724.41 20.9116.35 14.4729.55 25.6326.07 22.7114.38 12.9229.33 25.8522.01 18.8712.99 11.2713.72 11.94
Franklin Strategic Income Fund - USD 14.47 14.15 14.1311.97 11.22 11.6117.13 15.87 16.038.87 8.58 9.428.16 8.30 8.687.63 7.43 8.048.55 8.25 8.829.68 9.32 9.879.78 9.49 10.158.80 8.61 9.25
11.05 10.30 10.479.32 9.04 9.629.72 9.46
12.12 11.30 11.6318.40 16.96 17.059.22 8.89 9.43
11.18 10.53 10.9812.79 11.94 12.16
7.34 7.19 7.8610.32 10.06 10.0011.56 10.66 10.729.70 9.29 9.799.92 9.44 9.86
15.39 14.23 14.33
- USD 500.000 8.94 9.44
9.06 9.498.94 9.48
- USD 12.6138.03 26.61 19.5624.41 16.31 12.3658.79 38.90 29.1711.6924.41 16.21 12.2144.99 29.82 22.1834.07 22.88 17.2485.97 57.31 42.8820.42 13.6718.57 13.0672.66 50.35 36.6612.5764.06 42.05 30.9823.97 16.62 12.1131.31 22.07 16.34
FRANKLIN TEMPLETON INVESTMENT FUNDS
Statistical Information
www.franklintempleton.lu Audited Annual Report 59
Total Expense Ratio
(See note 29)
Shares Outstanding
as at
Net Asset Value per share
as at
2021
Net Asset Value per share
as at
2020
Net Asset Value per share
as at
2019
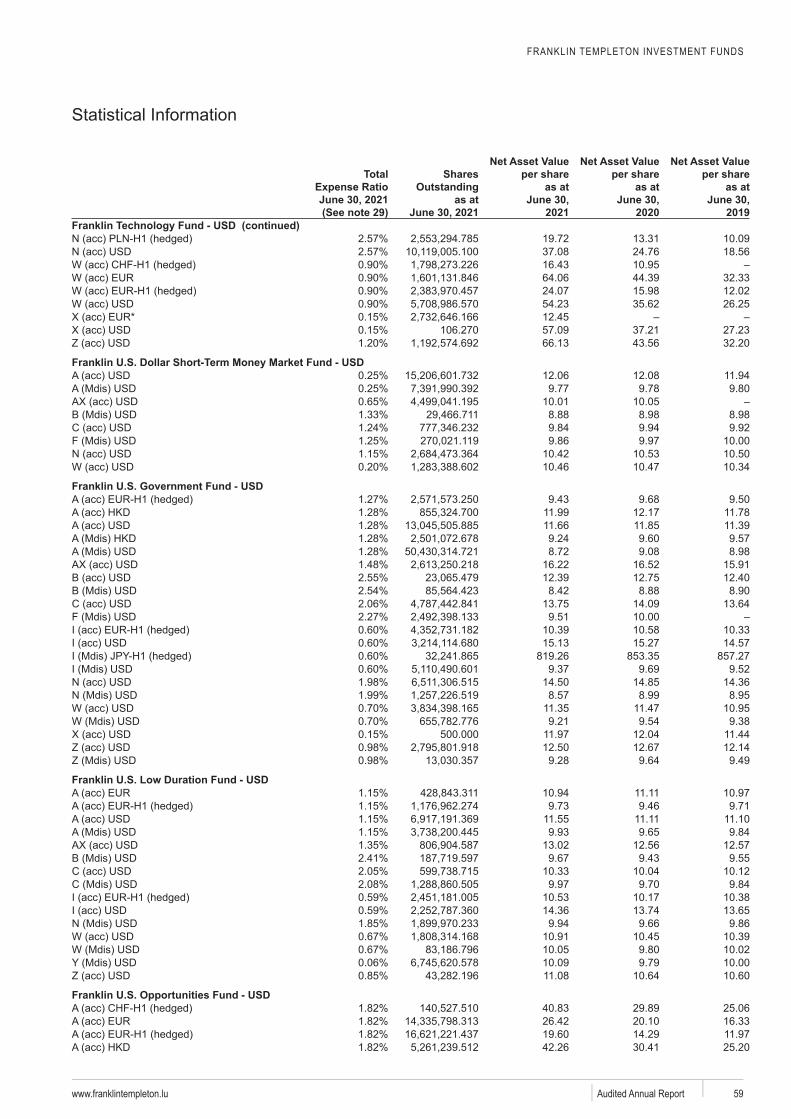
19.72 13.31 10.0937.08 24.76 18.5616.43 10.9564.06 44.39 32.3324.07 15.98 12.0254.23 35.62 26.2512.45
106.270 57.09 37.21 27.2366.13 43.56 32.20
- USD 12.06 12.08 11.949.77 9.78 9.80
10.01 10.058.88 8.98 8.989.84 9.94 9.929.86 9.97 10.00
10.42 10.53 10.5010.46 10.47 10.34
- USD 9.43 9.68 9.50
11.99 12.17 11.7811.66 11.85 11.399.24 9.60 9.578.72 9.08 8.98
16.22 16.52 15.9112.39 12.75 12.408.42 8.88 8.90
13.75 14.09 13.649.51 10.00
10.39 10.58 10.3315.13 15.27 14.57
819.26 853.35 857.279.37 9.69 9.52
14.50 14.85 14.368.57 8.99 8.95
11.35 11.47 10.959.21 9.54 9.38
500.000 11.97 12.04 11.4412.50 12.67 12.149.28 9.64 9.49
- USD 10.94 11.11 10.979.73 9.46 9.71
11.55 11.11 11.109.93 9.65 9.84
13.02 12.56 12.579.67 9.43 9.55
10.33 10.04 10.129.97 9.70 9.84
10.53 10.17 10.3814.36 13.74 13.659.94 9.66 9.86
10.91 10.45 10.3910.05 9.80 10.0210.09 9.79 10.0011.08 10.64 10.60
- USD 40.83 29.89 25.0626.42 20.10 16.3319.60 14.29 11.9742.26 30.41 25.20
FRANKLIN TEMPLETON INVESTMENT FUNDS
Statistical Information
www.franklintempleton.luAudited Annual Report 60
Total Expense Ratio
(See note 29)
Shares Outstanding
as at
Net Asset Value per share
as at
2021
Net Asset Value per share
as at
2020
Net Asset Value per share
as at
2019
29.92 21.68 17.76313.30 220.87 180.2239.04 28.38 23.9837.43 27.96 22.3246.56 33.64 28.0131.29 22.56 18.5526.90 20.47 16.6322.59 18.19 14.5925.06 18.70 14.9223.68 17.30 14.4149.31 35.76 29.5722.85 16.64 13.8269.74 52.54 42.2851.19 36.96 30.6682.69 59.04 48.0751.46 39.46 32.3034.29 25.19 21.2852.59 38.58 32.3361.12 44.39 36.7716.33 12.3016.85 12.1521.81 15.56 12.6738.61 29.10 23.4322.58 16.30 13.5345.12 32.23 26.2633.99 24.10 19.4946.43 33.00 26.7626.64 18.92 15.3455.20 39.55 32.32
- GBP* 12.7911.5511.6612.5511.8912.7312.0012.7212.0012.9111.7612.6512.00
Franklin World Perspectives Fund - USD 37.28 29.11 28.2032.39 23.96 23.4941.75 32.28 30.9936.28 26.59 25.8113.55 10.66 10.4129.45 21.95 21.6829.25 23.94 22.70
500.000 12.71 9.3217.90 13.16 12.81
- USD* 11.80
Templeton Asian Bond Fund - USD 9.01 9.25 9.74
17.66 18.90 19.12
FRANKLIN TEMPLETON INVESTMENT FUNDS
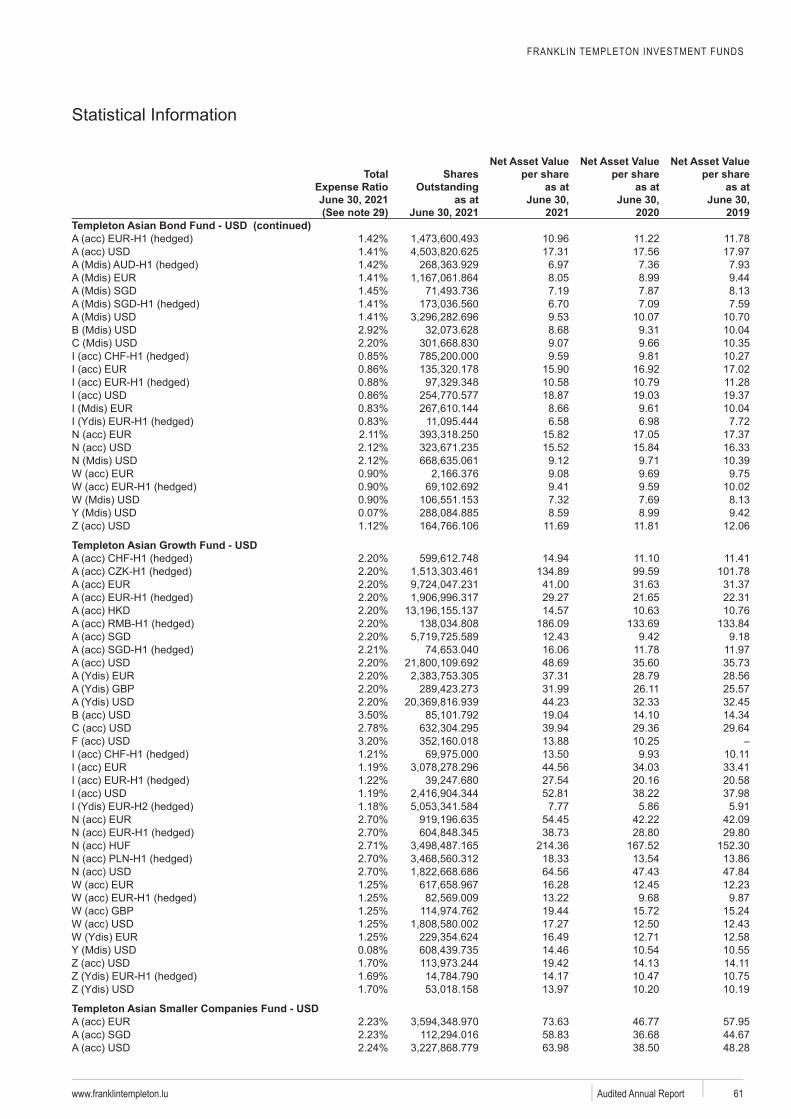
Statistical Information
www.franklintempleton.lu Audited Annual Report 61
Total Expense Ratio
(See note 29)
Shares Outstanding
as at
Net Asset Value per share
as at
2021
Net Asset Value per share
as at
2020
Net Asset Value per share
as at
2019Templeton Asian Bond Fund - USD (continued)
10.96 11.22 11.7817.31 17.56 17.976.97 7.36 7.938.05 8.99 9.447.19 7.87 8.136.70 7.09 7.599.53 10.07 10.708.68 9.31 10.049.07 9.66 10.359.59 9.81 10.27
15.90 16.92 17.0210.58 10.79 11.2818.87 19.03 19.378.66 9.61 10.046.58 6.98 7.72
15.82 17.05 17.3715.52 15.84 16.339.12 9.71 10.399.08 9.69 9.759.41 9.59 10.027.32 7.69 8.138.59 8.99 9.42
11.69 11.81 12.06
- USD 14.94 11.10 11.41
134.89 99.59 101.7841.00 31.63 31.3729.27 21.65 22.3114.57 10.63 10.76
186.09 133.69 133.8412.43 9.42 9.1816.06 11.78 11.9748.69 35.60 35.7337.31 28.79 28.5631.99 26.11 25.5744.23 32.33 32.4519.04 14.10 14.3439.94 29.36 29.6413.88 10.2513.50 9.93 10.1144.56 34.03 33.4127.54 20.16 20.5852.81 38.22 37.987.77 5.86 5.91
54.45 42.22 42.0938.73 28.80 29.80
214.36 167.52 152.3018.33 13.54 13.8664.56 47.43 47.8416.28 12.45 12.2313.22 9.68 9.8719.44 15.72 15.2417.27 12.50 12.4316.49 12.71 12.5814.46 10.54 10.5519.42 14.13 14.1114.17 10.47 10.7513.97 10.20 10.19
Templeton Asian Smaller Companies Fund - USD 73.63 46.77 57.9558.83 36.68 44.6763.98 38.50 48.28
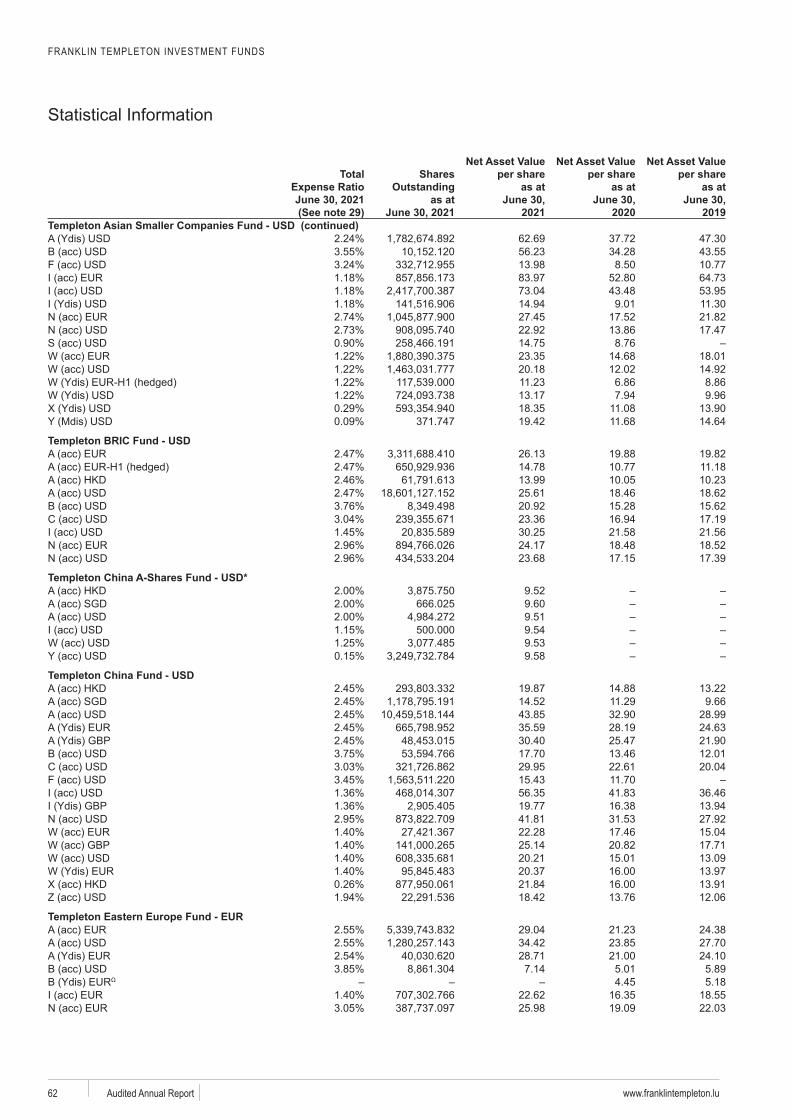
FRANKLIN TEMPLETON INVESTMENT FUNDS
Statistical Information
www.franklintempleton.luAudited Annual Report 62
Total Expense Ratio
(See note 29)
Shares Outstanding
as at
Net Asset Value per share
as at
2021
Net Asset Value per share
as at
2020
Net Asset Value per share
as at
2019Templeton Asian Smaller Companies Fund - USD (continued)
62.69 37.72 47.3056.23 34.28 43.5513.98 8.50 10.7783.97 52.80 64.7373.04 43.48 53.9514.94 9.01 11.3027.45 17.52 21.8222.92 13.86 17.4714.75 8.7623.35 14.68 18.0120.18 12.02 14.9211.23 6.86 8.8613.17 7.94 9.9618.35 11.08 13.90
371.747 19.42 11.68 14.64
Templeton BRIC Fund - USD 26.13 19.88 19.8214.78 10.77 11.1813.99 10.05 10.2325.61 18.46 18.6220.92 15.28 15.6223.36 16.94 17.1930.25 21.58 21.5624.17 18.48 18.5223.68 17.15 17.39
Templeton China A-Shares Fund - USD* 9.52
666.025 9.609.51
500.000 9.549.539.58
Templeton China Fund - USD 19.87 14.88 13.2214.52 11.29 9.6643.85 32.90 28.9935.59 28.19 24.6330.40 25.47 21.9017.70 13.46 12.0129.95 22.61 20.0415.43 11.7056.35 41.83 36.4619.77 16.38 13.9441.81 31.53 27.9222.28 17.46 15.0425.14 20.82 17.7120.21 15.01 13.0920.37 16.00 13.9721.84 16.00 13.9118.42 13.76 12.06
Templeton Eastern Europe Fund - EUR 29.04 21.23 24.3834.42 23.85 27.7028.71 21.00 24.107.14 5.01 5.89
4.45 5.1822.62 16.35 18.5525.98 19.09 22.03
FRANKLIN TEMPLETON INVESTMENT FUNDS
Statistical Information
www.franklintempleton.lu Audited Annual Report 63
Total Expense Ratio
(See note 29)
Shares Outstanding
as at
Net Asset Value per share
as at
2021
Net Asset Value per share
as at
2020
Net Asset Value per share
as at
2019Templeton Eastern Europe Fund - EUR (continued)
14.08 10.19 11.5812.62 9.02 10.13
Templeton Emerging Markets Bond Fund - USD 10.12 10.15 11.879.18 9.19 10.72
10.98 10.93 12.6810.08 10.07 11.7912.46 12.35 14.0185.24 92.014.83 5.21 6.615.13 5.50 6.884.53 4.87 6.115.63 6.05 7.51
71.96 73.96 89.278.28 9.36 11.586.11 7.31 8.939.76 10.45 13.084.51 4.96 6.485.19 5.66 7.118.16 8.85 11.23
25.22 25.14 28.695.81 6.31 7.91
457.855 7.62 8.709.74 9.68 11.20
11.35 11.26 13.008.92 8.81 10.23
25.19 24.71 27.765.05 5.36 6.827.70 8.56 10.614.74 5.19 6.71
30.70 30.58 34.875.03 5.44 6.785.45 5.90 7.55
500.000 10.70 10.48 11.778.88 8.81 10.19
10.17 9.98 11.226.09 6.83 8.365.75 6.81 8.245.23 5.56 7.064.96 5.26 6.536.31 6.87 8.88
500.000 9.01 8.77 9.786.60 6.94 8.46
13.01 12.81 14.445.06 5.41 6.67
- USD14.76 12.85 13.2510.34 8.62 9.2011.82 9.74 10.179.14 7.91 8.899.45 8.09 9.129.25 8.01 8.93
10.7410.738.33 7.13 7.97
10.75 9.75 10.817.44 6.47 7.43
11.19 9.26 9.7410.87 9.5311.62 9.7516.12 13.90 14.2110.65 8.80 9.32
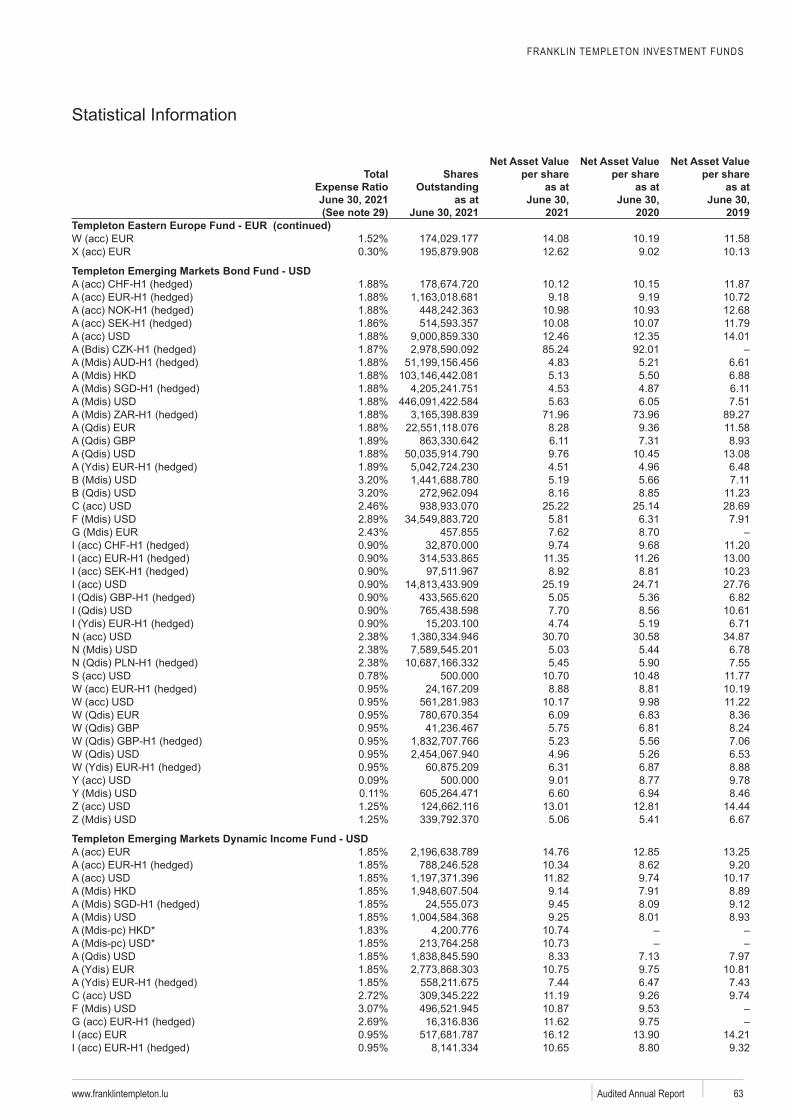
FRANKLIN TEMPLETON INVESTMENT FUNDS
Statistical Information
www.franklintempleton.luAudited Annual Report 64
Total Expense Ratio
(See note 29)
Shares Outstanding
as at
Net Asset Value per share
as at
2021
Net Asset Value per share
as at
2020
Net Asset Value per share
as at
2019
9.85 8.26 8.8611.30 9.36 9.8114.12 11.46 11.7612.26 10.05 10.44
Templeton Emerging Markets Fund - USD 906.588 11.81
12.43 8.92 9.3516.47 11.66 12.0111.91 8.75 8.6856.93 40.38 41.2354.37 38.57 39.3824.89 17.89 18.5146.46 33.14 34.0412.88 9.7013.67 9.72 10.0839.85 28.03 28.3824.97 18.79 19.0529.58 21.08 21.6417.33 12.20 12.3710.98 7.96 8.3613.52 9.6216.12 11.38 11.56
- USD 8.82 8.71 9.616.09 6.54 7.987.28 8.20 10.018.65 8.59 9.539.45 9.76 10.558.41 8.32 9.329.54 9.36 10.458.52 8.39 9.349.08 8.89 9.726.88 7.19 8.597.50 8.38 10.136.64 7.10 8.938.67 8.60 9.546.05 6.48 8.078.39 8.30 9.318.59 8.46 9.469.07 8.88 9.726.77 7.18 8.586.33 6.69 8.216.50 6.81 8.358.68 8.49 9.44
436.300 8.83 9.72
Templeton Emerging Markets Smaller Companies Fund - USD 18.87 12.43 14.7511.62 7.34 9.1815.65 9.77 11.7322.14 15.42 18.0714.98 9.35 11.2316.08 10.09 12.1921.87 14.25 16.7318.13 11.19 13.3014.63 9.17 11.0712.88 8.40 9.8726.73 18.44 21.3919.35 11.95 14.21
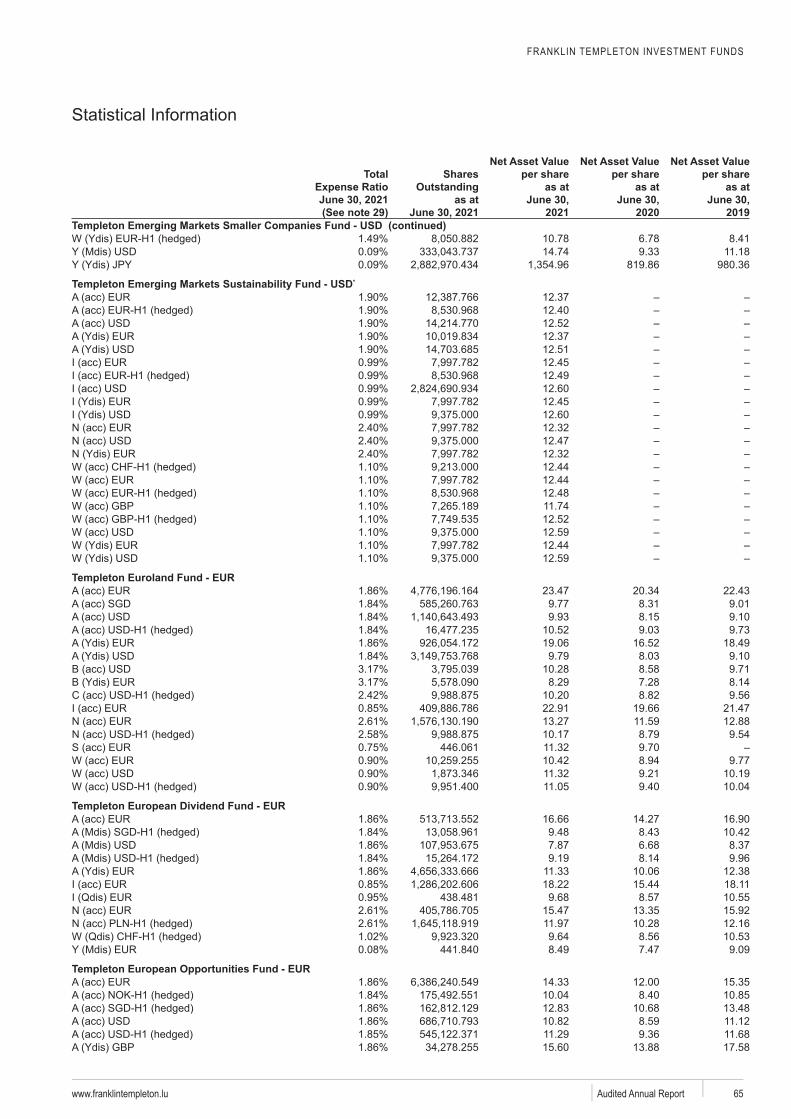
FRANKLIN TEMPLETON INVESTMENT FUNDS
Statistical Information
www.franklintempleton.lu Audited Annual Report 65
Total Expense Ratio
(See note 29)
Shares Outstanding
as at
Net Asset Value per share
as at
2021
Net Asset Value per share
as at
2020
Net Asset Value per share
as at
2019Templeton Emerging Markets Smaller Companies Fund - USD (continued)
10.78 6.78 8.4114.74 9.33 11.18
819.86 980.36
- USD* 12.3712.4012.5212.3712.5112.4512.4912.6012.4512.6012.3212.4712.3212.4412.4412.4811.7412.5212.5912.4412.59
Templeton Euroland Fund - EUR 23.47 20.34 22.439.77 8.31 9.019.93 8.15 9.10
10.52 9.03 9.7319.06 16.52 18.499.79 8.03 9.10
10.28 8.58 9.718.29 7.28 8.14
10.20 8.82 9.5622.91 19.66 21.4713.27 11.59 12.8810.17 8.79 9.54
446.061 11.32 9.7010.42 8.94 9.7711.32 9.21 10.1911.05 9.40 10.04
Templeton European Dividend Fund - EUR 16.66 14.27 16.909.48 8.43 10.427.87 6.68 8.379.19 8.14 9.96
11.33 10.06 12.3818.22 15.44 18.11
438.481 9.68 8.57 10.5515.47 13.35 15.9211.97 10.28 12.169.64 8.56 10.53
441.840 8.49 7.47 9.09
Templeton European Opportunities Fund - EUR 14.33 12.00 15.3510.04 8.40 10.8512.83 10.68 13.4810.82 8.59 11.1211.29 9.36 11.6815.60 13.88 17.58
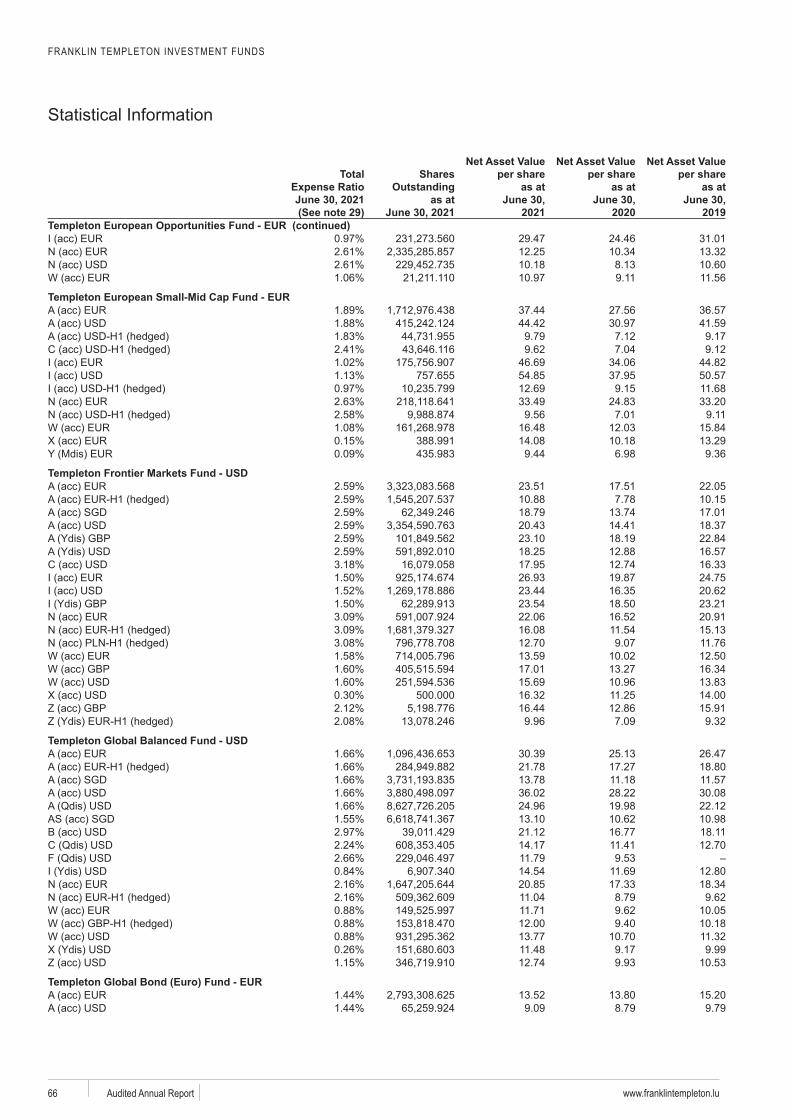
FRANKLIN TEMPLETON INVESTMENT FUNDS
Statistical Information
www.franklintempleton.luAudited Annual Report 66
Total Expense Ratio
(See note 29)
Shares Outstanding
as at
Net Asset Value per share
as at
2021
Net Asset Value per share
as at
2020
Net Asset Value per share
as at
2019Templeton European Opportunities Fund - EUR (continued)
29.47 24.46 31.0112.25 10.34 13.3210.18 8.13 10.6010.97 9.11 11.56
Templeton European Small-Mid Cap Fund - EUR 37.44 27.56 36.5744.42 30.97 41.599.79 7.12 9.179.62 7.04 9.12
46.69 34.06 44.82757.655 54.85 37.95 50.57
12.69 9.15 11.6833.49 24.83 33.209.56 7.01 9.11
16.48 12.03 15.84388.991 14.08 10.18 13.29435.983 9.44 6.98 9.36
Templeton Frontier Markets Fund - USD 23.51 17.51 22.0510.88 7.78 10.1518.79 13.74 17.0120.43 14.41 18.3723.10 18.19 22.8418.25 12.88 16.5717.95 12.74 16.3326.93 19.87 24.7523.44 16.35 20.6223.54 18.50 23.2122.06 16.52 20.9116.08 11.54 15.1312.70 9.07 11.7613.59 10.02 12.5017.01 13.27 16.3415.69 10.96 13.83
500.000 16.32 11.25 14.0016.44 12.86 15.919.96 7.09 9.32
Templeton Global Balanced Fund - USD 30.39 25.13 26.4721.78 17.27 18.8013.78 11.18 11.5736.02 28.22 30.0824.96 19.98 22.1213.10 10.62 10.9821.12 16.77 18.1114.17 11.41 12.7011.79 9.5314.54 11.69 12.8020.85 17.33 18.3411.04 8.79 9.6211.71 9.62 10.0512.00 9.40 10.1813.77 10.70 11.3211.48 9.17 9.9912.74 9.93 10.53
Templeton Global Bond (Euro) Fund - EUR 13.52 13.80 15.209.09 8.79 9.79
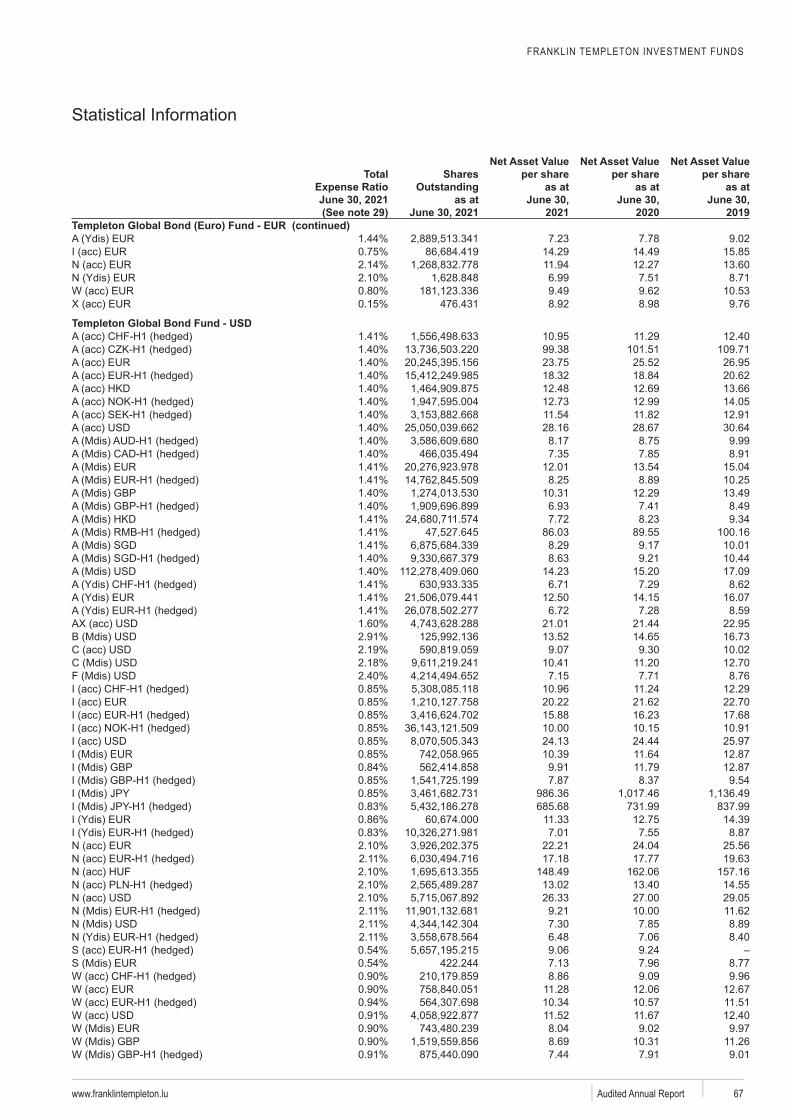
FRANKLIN TEMPLETON INVESTMENT FUNDS
Statistical Information
www.franklintempleton.lu Audited Annual Report 67
Total Expense Ratio
(See note 29)
Shares Outstanding
as at
Net Asset Value per share
as at
2021
Net Asset Value per share
as at
2020
Net Asset Value per share
as at
2019Templeton Global Bond (Euro) Fund - EUR (continued)
7.23 7.78 9.0214.29 14.49 15.8511.94 12.27 13.606.99 7.51 8.719.49 9.62 10.53
476.431 8.92 8.98 9.76
Templeton Global Bond Fund - USD 10.95 11.29 12.4099.38 101.51 109.7123.75 25.52 26.9518.32 18.84 20.6212.48 12.69 13.6612.73 12.99 14.0511.54 11.82 12.9128.16 28.67 30.648.17 8.75 9.997.35 7.85 8.91
12.01 13.54 15.048.25 8.89 10.25
10.31 12.29 13.496.93 7.41 8.497.72 8.23 9.34
86.03 89.55 100.168.29 9.17 10.018.63 9.21 10.44
14.23 15.20 17.096.71 7.29 8.62
12.50 14.15 16.076.72 7.28 8.59
21.01 21.44 22.9513.52 14.65 16.739.07 9.30 10.02
10.41 11.20 12.707.15 7.71 8.76
10.96 11.24 12.2920.22 21.62 22.7015.88 16.23 17.6810.00 10.15 10.9124.13 24.44 25.9710.39 11.64 12.879.91 11.79 12.877.87 8.37 9.54
986.36685.68 731.99 837.99
11.33 12.75 14.397.01 7.55 8.87
22.21 24.04 25.5617.18 17.77 19.63
148.49 162.06 157.1613.02 13.40 14.5526.33 27.00 29.059.21 10.00 11.627.30 7.85 8.896.48 7.06 8.409.06 9.24
422.244 7.13 7.96 8.778.86 9.09 9.96
11.28 12.06 12.6710.34 10.57 11.5111.52 11.67 12.408.04 9.02 9.978.69 10.31 11.267.44 7.91 9.01
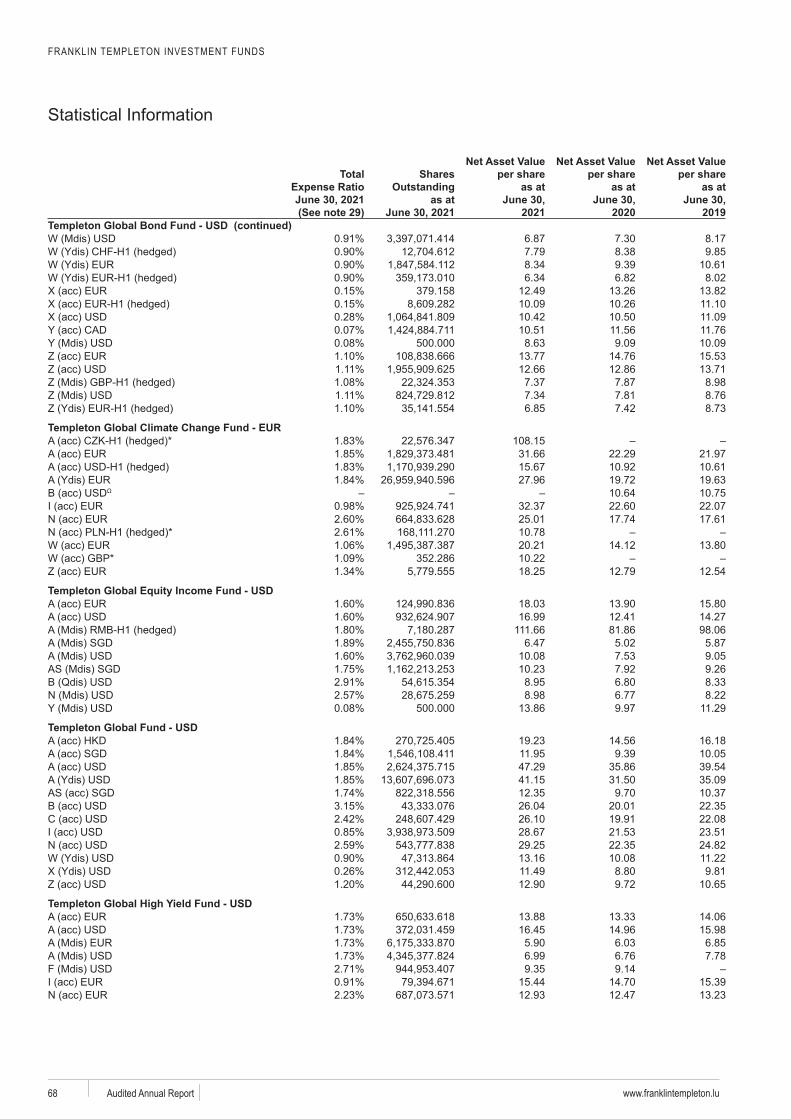
FRANKLIN TEMPLETON INVESTMENT FUNDS
Statistical Information
www.franklintempleton.luAudited Annual Report 68
Total Expense Ratio
(See note 29)
Shares Outstanding
as at
Net Asset Value per share
as at
2021
Net Asset Value per share
as at
2020
Net Asset Value per share
as at
2019Templeton Global Bond Fund - USD (continued)
6.87 7.30 8.177.79 8.38 9.858.34 9.39 10.616.34 6.82 8.02
379.158 12.49 13.26 13.8210.09 10.26 11.1010.42 10.50 11.0910.51 11.56 11.76
500.000 8.63 9.09 10.0913.77 14.76 15.5312.66 12.86 13.717.37 7.87 8.987.34 7.81 8.766.85 7.42 8.73
Templeton Global Climate Change Fund - EUR 108.15
31.66 22.29 21.9715.67 10.92 10.6127.96 19.72 19.63
10.64 10.7532.37 22.60 22.0725.01 17.74 17.61
2.61 10.7820.21 14.12 13.80
352.286 10.2218.25 12.79 12.54
- USD 18.03 13.90 15.8016.99 12.41 14.27
111.66 81.86 98.066.47 5.02 5.87
10.08 7.53 9.0510.23 7.92 9.268.95 6.80 8.338.98 6.77 8.22
500.000 13.86 9.97 11.29
Templeton Global Fund - USD 19.23 14.56 16.1811.95 9.39 10.0547.29 35.86 39.5441.15 31.50 35.0912.35 9.70 10.3726.04 20.01 22.3526.10 19.91 22.0828.67 21.53 23.5129.25 22.35 24.8213.16 10.08 11.2211.49 8.80 9.8112.90 9.72 10.65
Templeton Global High Yield Fund - USD 13.88 13.33 14.0616.45 14.96 15.985.90 6.03 6.856.99 6.76 7.789.35 9.14
15.44 14.70 15.3912.93 12.47 13.23
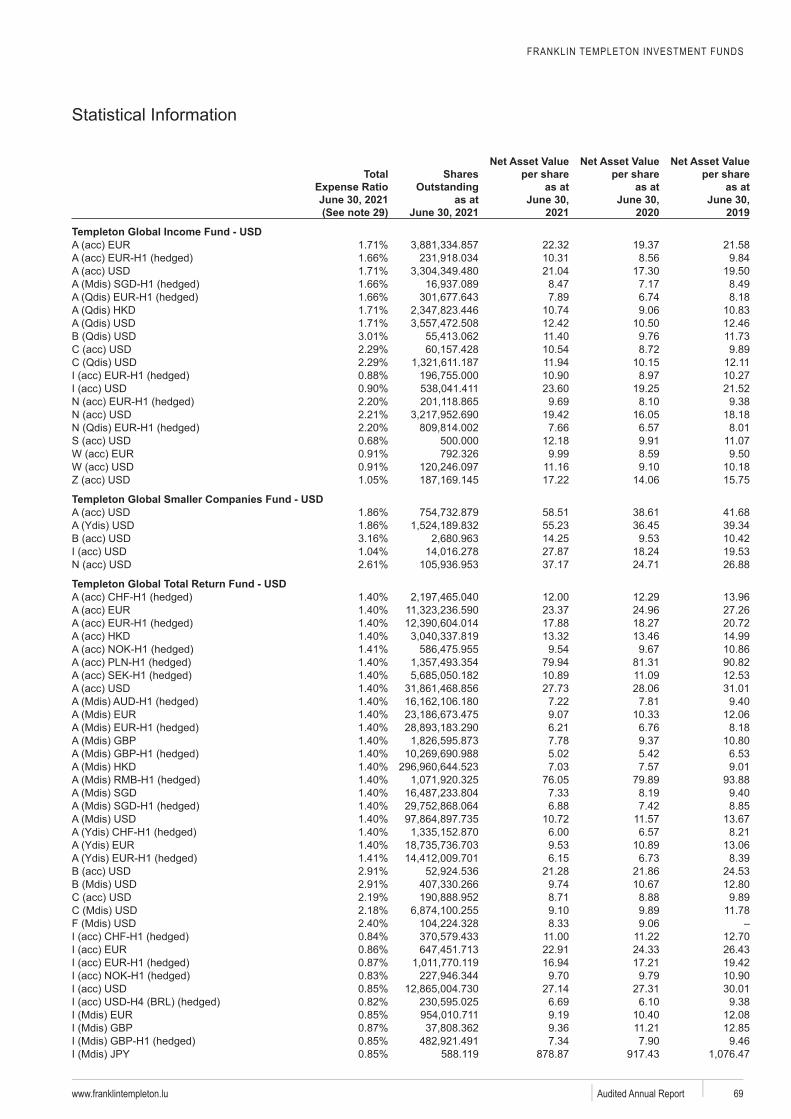
FRANKLIN TEMPLETON INVESTMENT FUNDS
Statistical Information
www.franklintempleton.lu Audited Annual Report 69
Total Expense Ratio
(See note 29)
Shares Outstanding
as at
Net Asset Value per share
as at
2021
Net Asset Value per share
as at
2020
Net Asset Value per share
as at
2019
Templeton Global Income Fund - USD 22.32 19.37 21.5810.31 8.56 9.8421.04 17.30 19.508.47 7.17 8.497.89 6.74 8.18
10.74 9.06 10.8312.42 10.50 12.4611.40 9.76 11.7310.54 8.72 9.8911.94 10.15 12.1110.90 8.97 10.2723.60 19.25 21.529.69 8.10 9.38
19.42 16.05 18.187.66 6.57 8.01
500.000 12.18 9.91 11.07792.326 9.99 8.59 9.50
11.16 9.10 10.1817.22 14.06 15.75
Templeton Global Smaller Companies Fund - USD 58.51 38.61 41.6855.23 36.45 39.3414.25 9.53 10.4227.87 18.24 19.5337.17 24.71 26.88
Templeton Global Total Return Fund - USD 12.00 12.29 13.9623.37 24.96 27.2617.88 18.27 20.7213.32 13.46 14.999.54 9.67 10.86
79.94 81.31 90.8210.89 11.09 12.5327.73 28.06 31.017.22 7.81 9.409.07 10.33 12.066.21 6.76 8.187.78 9.37 10.805.02 5.42 6.537.03 7.57 9.01
76.05 79.89 93.887.33 8.19 9.406.88 7.42 8.85
10.72 11.57 13.676.00 6.57 8.219.53 10.89 13.066.15 6.73 8.39
21.28 21.86 24.539.74 10.67 12.808.71 8.88 9.899.10 9.89 11.788.33 9.06
11.00 11.22 12.7022.91 24.33 26.4316.94 17.21 19.429.70 9.79 10.90
27.14 27.31 30.016.69 6.10 9.389.19 10.40 12.089.36 11.21 12.857.34 7.90 9.46
588.119 878.87 917.43
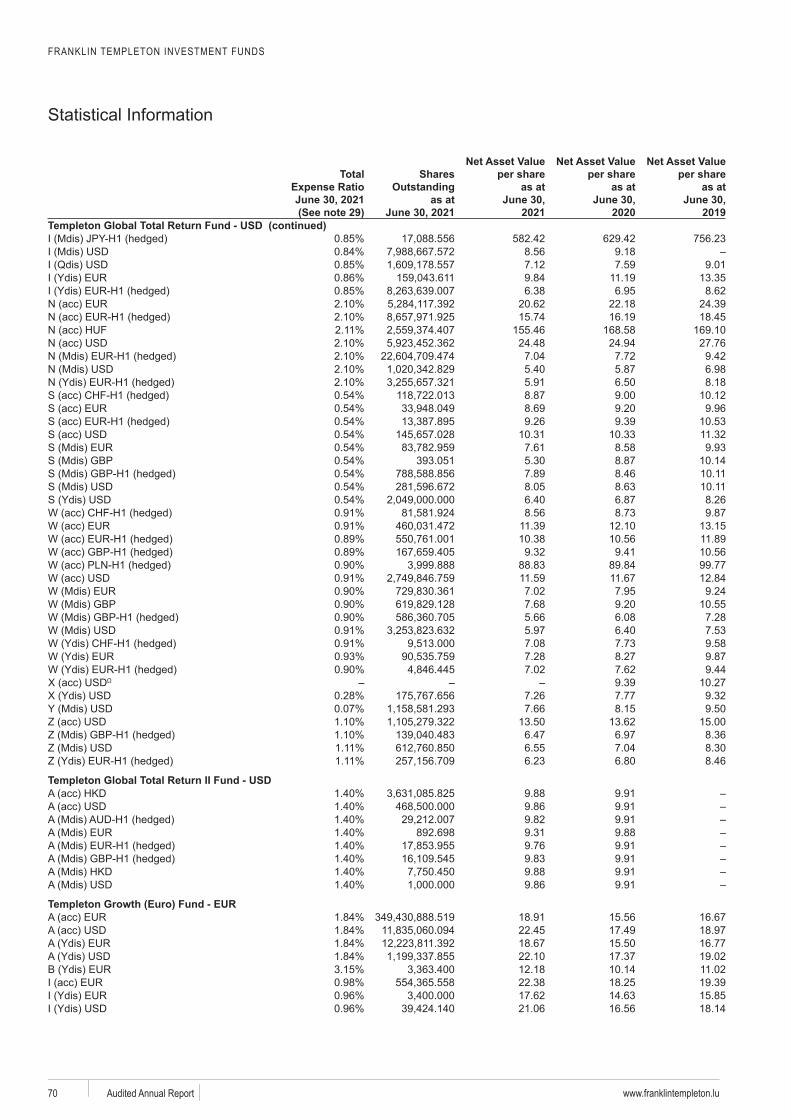
FRANKLIN TEMPLETON INVESTMENT FUNDS
Statistical Information
www.franklintempleton.luAudited Annual Report 70
Total Expense Ratio
(See note 29)
Shares Outstanding
as at
Net Asset Value per share
as at
2021
Net Asset Value per share
as at
2020
Net Asset Value per share
as at
2019Templeton Global Total Return Fund - USD (continued)
582.42 629.42 756.238.56 9.187.12 7.59 9.019.84 11.19 13.356.38 6.95 8.62
20.62 22.18 24.3915.74 16.19 18.45
155.46 168.58 169.1024.48 24.94 27.767.04 7.72 9.425.40 5.87 6.985.91 6.50 8.188.87 9.00 10.128.69 9.20 9.969.26 9.39 10.53
10.31 10.33 11.327.61 8.58 9.93
393.051 5.30 8.87 10.147.89 8.46 10.118.05 8.63 10.116.40 6.87 8.268.56 8.73 9.87
11.39 12.10 13.1510.38 10.56 11.899.32 9.41 10.56
88.83 89.84 99.7711.59 11.67 12.847.02 7.95 9.247.68 9.20 10.555.66 6.08 7.285.97 6.40 7.537.08 7.73 9.587.28 8.27 9.877.02 7.62 9.44
9.39 10.277.26 7.77 9.327.66 8.15 9.50
13.50 13.62 15.006.47 6.97 8.366.55 7.04 8.306.23 6.80 8.46
Templeton Global Total Return II Fund - USD 9.88 9.919.86 9.919.82 9.91
892.698 9.31 9.889.76 9.919.83 9.919.88 9.919.86 9.91
- EUR 18.91 15.56 16.6722.45 17.49 18.9718.67 15.50 16.7722.10 17.37 19.0212.18 10.14 11.0222.38 18.25 19.3917.62 14.63 15.8521.06 16.56 18.14
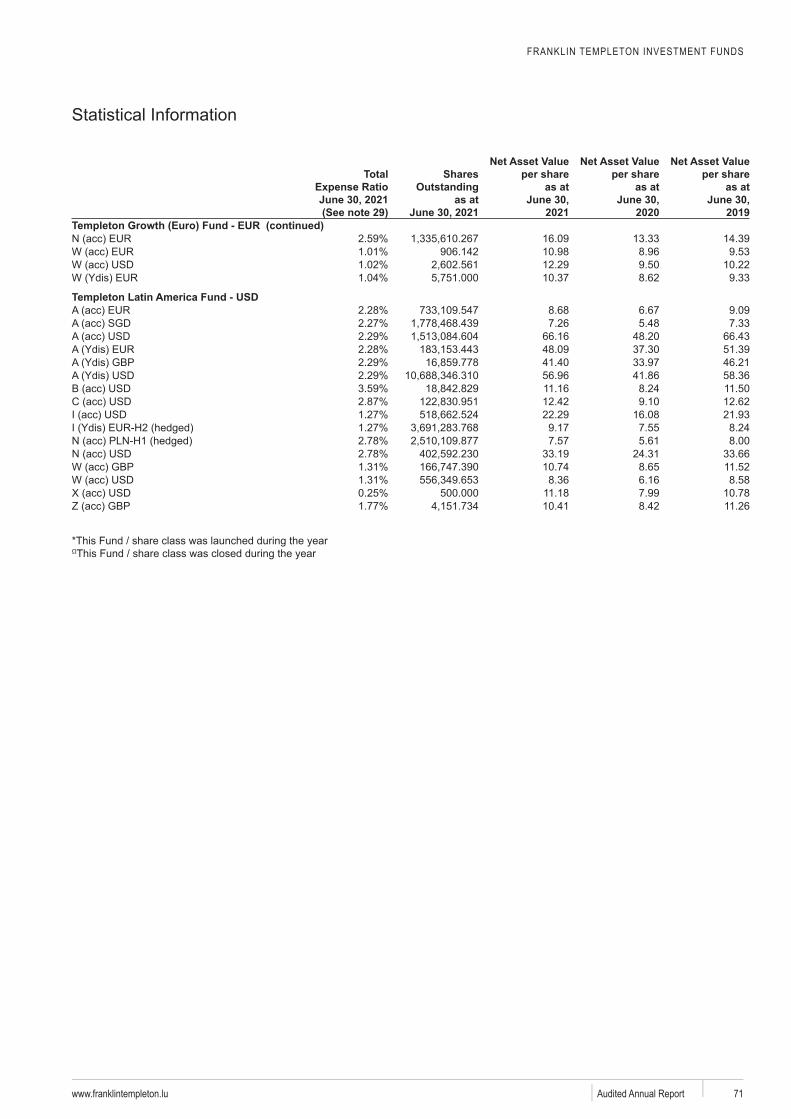
FRANKLIN TEMPLETON INVESTMENT FUNDS
Statistical Information
www.franklintempleton.lu Audited Annual Report 71
Total Expense Ratio
(See note 29)
Shares Outstanding
as at
Net Asset Value per share
as at
2021
Net Asset Value per share
as at
2020
Net Asset Value per share
as at
2019
16.09 13.33 14.39906.142 10.98 8.96 9.53
12.29 9.50 10.2210.37 8.62 9.33
Templeton Latin America Fund - USD 8.68 6.67 9.097.26 5.48 7.33
66.16 48.20 66.4348.09 37.30 51.3941.40 33.97 46.2156.96 41.86 58.3611.16 8.24 11.5012.42 9.10 12.6222.29 16.08 21.939.17 7.55 8.247.57 5.61 8.00
33.19 24.31 33.6610.74 8.65 11.528.36 6.16 8.58
500.000 11.18 7.99 10.7810.41 8.42 11.26
year
FRANKLIN TEMPLETON INVESTMENT FUNDS
Notes to Financial StatementsFor the year ended June 30, 2021
www.franklintempleton.luAudited Annual Report72
Fund launches
Fund name changes
Fund closures
invested at closure.
Fund merger
•
•
•
FRANKLIN TEMPLETON INVESTMENT FUNDSNOTES TO FINANCIAL STATEMENTS
www.franklintempleton.lu Audited Annual Report 73
•
•
•
•
•
•
•
•
•
•
•
•
Funds’ changes:
(a) General
(b) Investment in securities
(continued)
FRANKLIN TEMPLETON INVESTMENT FUNDSNOTES TO FINANCIAL STATEMENTS
www.franklintempleton.luAudited Annual Report74
(d) Financial future contracts
(b) Investment in securities
FRANKLIN TEMPLETON INVESTMENT FUNDSNOTES TO FINANCIAL STATEMENTS
www.franklintempleton.lu Audited Annual Report 75
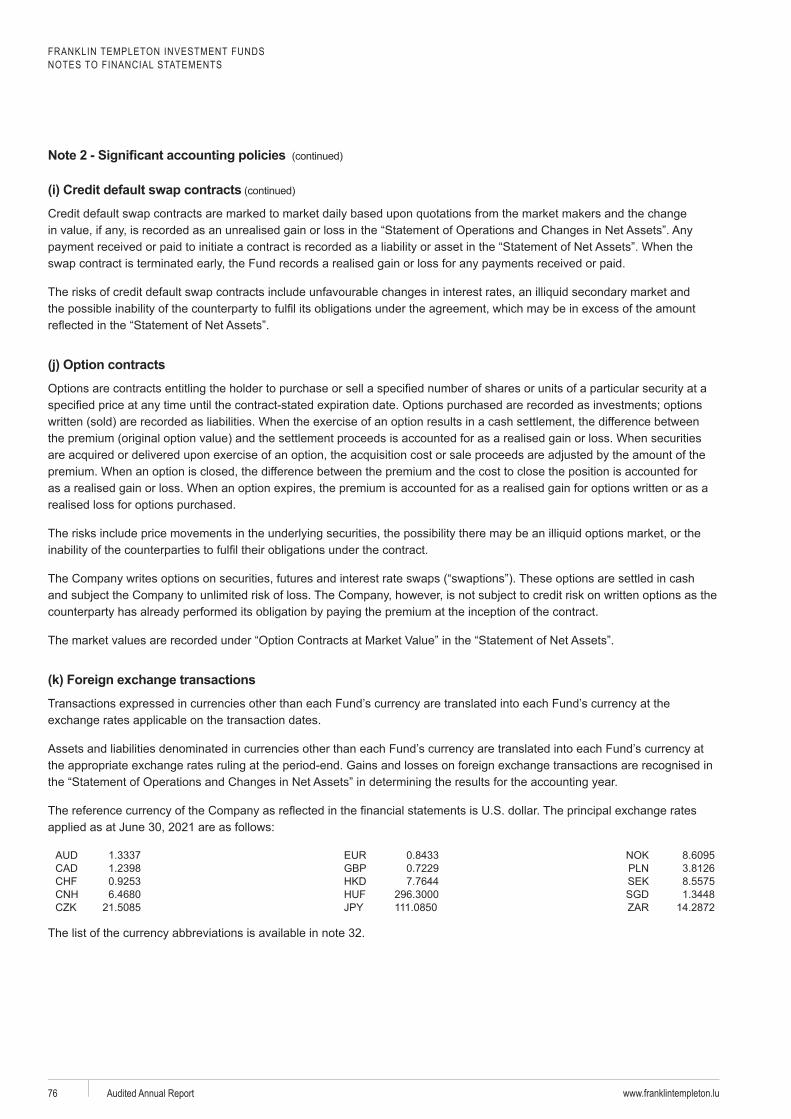
FRANKLIN TEMPLETON INVESTMENT FUNDSNOTES TO FINANCIAL STATEMENTS
www.franklintempleton.luAudited Annual Report76
(j) Option contracts
(k) Foreign exchange transactions
1.3337 0.8433 8.6095 1.2398 GBP 0.7229 3.8126 0.9253 7.7644 SEK 8.5575 6.4680 296.3000 SGD 1.344821.5085 111.0850 14.2872
FRANKLIN TEMPLETON INVESTMENT FUNDSNOTES TO FINANCIAL STATEMENTS
www.franklintempleton.lu Audited Annual Report 77
(l) Mortgage dollar rolls
(m) Income
(n) Securities lending
(o) Formation expenses
FRANKLIN TEMPLETON INVESTMENT FUNDSNOTES TO FINANCIAL STATEMENTS
www.franklintempleton.luAudited Annual Report78
Fund.
Franklin Euro Short Duration Bond Fund
FRANKLIN TEMPLETON INVESTMENT FUNDSNOTES TO FINANCIAL STATEMENTS
www.franklintempleton.lu Audited Annual Report 79
Franklin Gulf Wealth Bond Fund
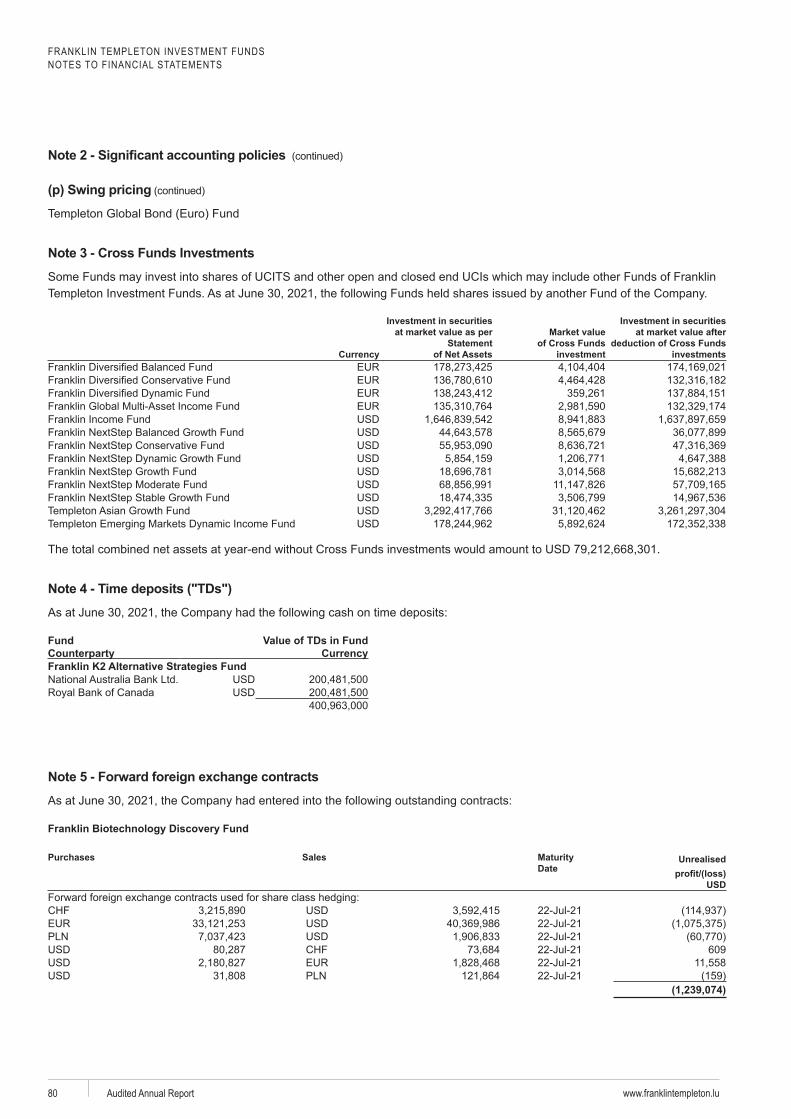
FRANKLIN TEMPLETON INVESTMENT FUNDSNOTES TO FINANCIAL STATEMENTS
www.franklintempleton.luAudited Annual Report80
Note 3 - Cross Funds Investments
Investment in securities at market value as per
Statement of Net Assets
Market value of Cross Funds
investment
Investment in securities at market value after
deduction of Cross Funds investments
Franklin Franklin Franklin Franklin Franklin Franklin
Note 4 - Time deposits ("TDs")
Fund Value of TDs in Fund
Purchases Sales Date
Unrealised
USD
22-Jul-2122-Jul-2122-Jul-2122-Jul-21 60922-Jul-2122-Jul-21
(1,239,074)
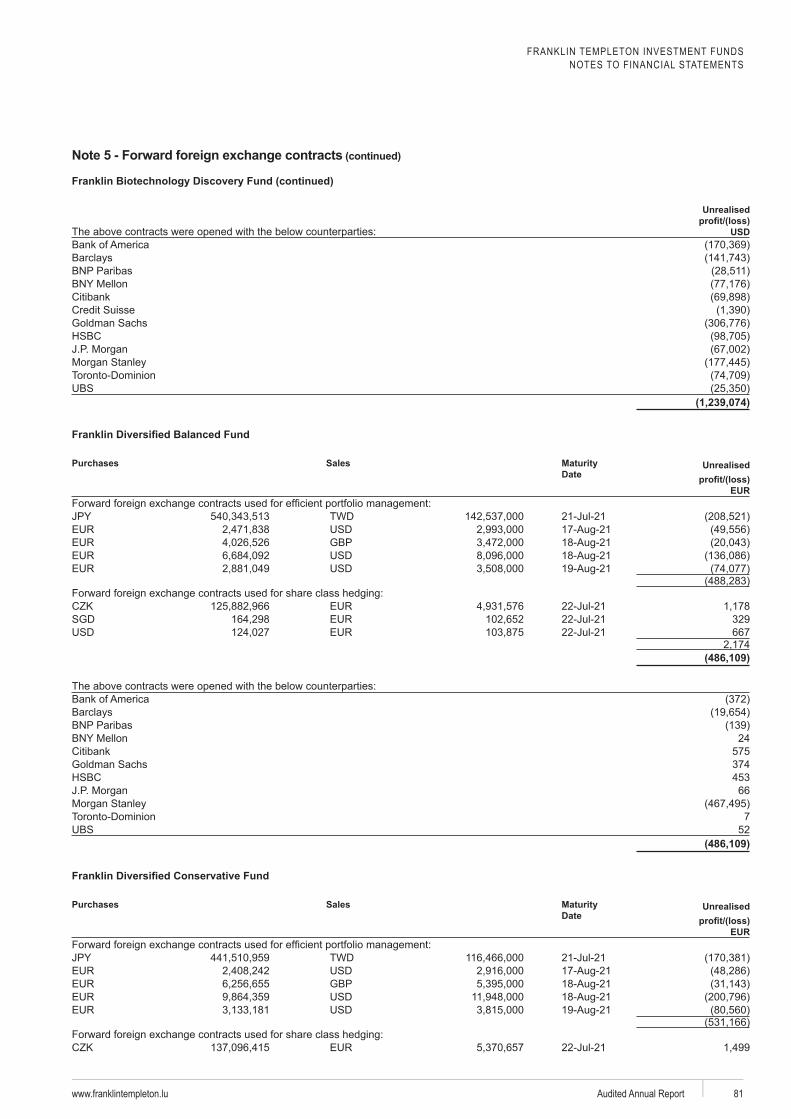
FRANKLIN TEMPLETON INVESTMENT FUNDSNOTES TO FINANCIAL STATEMENTS
www.franklintempleton.lu Audited Annual Report 81
Unrealised
USD
Barclays
(1,239,074)
Purchases Sales Date
Unrealised
EUR
TWD 21-Jul-21
GBP
0
22-Jul-21SGD 22-Jul-21 329
22-Jul-21 667
(486,109)
Barclays
2457537445366
752
(486,109)
Purchases Sales Date
Unrealised
EUR
TWD 21-Jul-21
GBP
0
22-Jul-21
(continued)
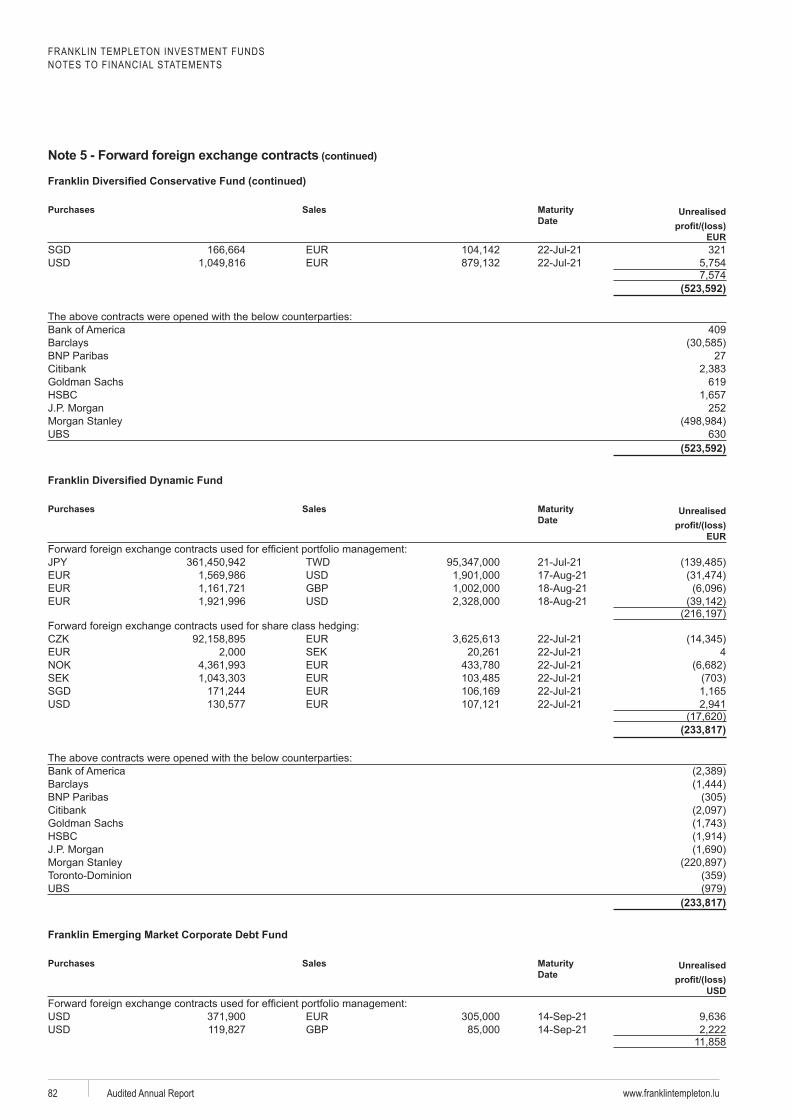
FRANKLIN TEMPLETON INVESTMENT FUNDSNOTES TO FINANCIAL STATEMENTS
www.franklintempleton.luAudited Annual Report82
Purchases
Sales Date
Unrealised
EURSGD 22-Jul-21 321
22-Jul-21
(523,592)
409Barclays
27
619
252
630(523,592)
Purchases Sales Date
Unrealised
EUR
TWD 21-Jul-21
GBP
0
22-Jul-21SEK 22-Jul-21 4
22-Jul-21SEK 22-Jul-21SGD 22-Jul-21
22-Jul-21
(233,817)
Barclays
(233,817)
Franklin Emerging Market Corporate Debt Fund
Purchases Sales Date
Unrealised
USD
GBP0
(continued)
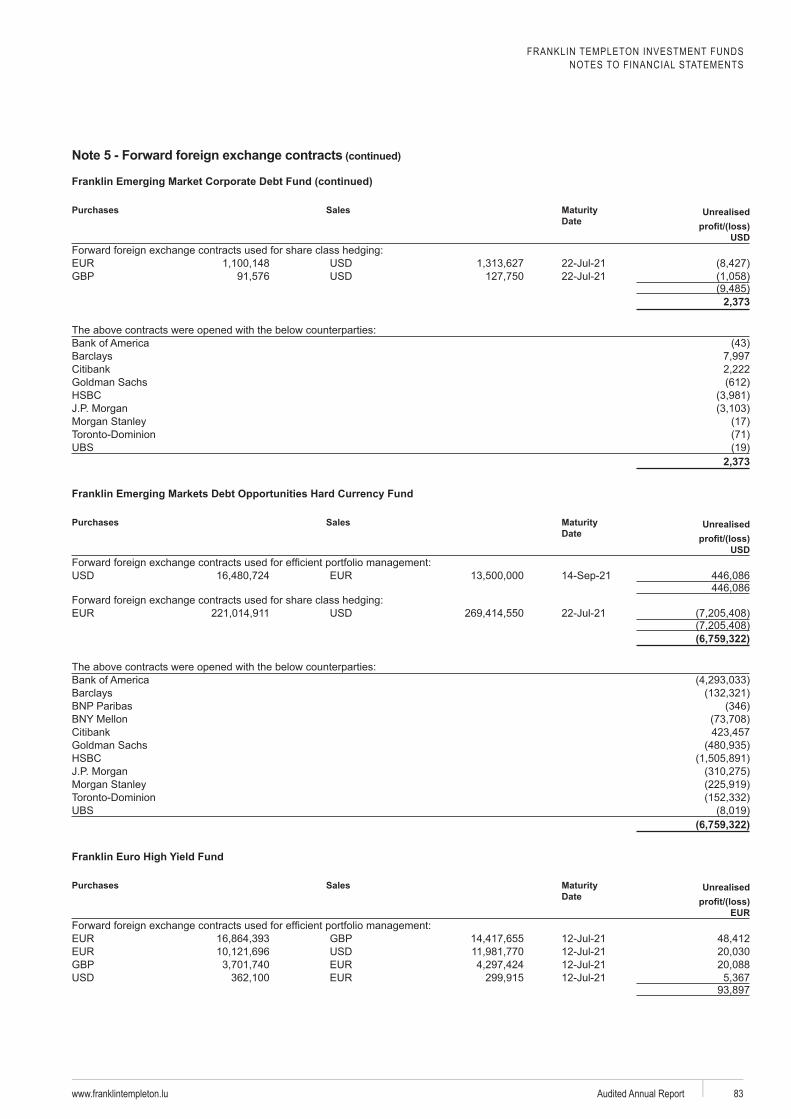
FRANKLIN TEMPLETON INVESTMENT FUNDSNOTES TO FINANCIAL STATEMENTS
www.franklintempleton.lu Audited Annual Report 83
Franklin Emerging Market Corporate Debt Fund (continued)
Purchases
Sales Date
Unrealised
USD
22-Jul-21GBP 22-Jul-21
2,373
Barclays
2,373
Purchases Sales Date
Unrealised
USD
0
22-Jul-21
(6,759,322)
Barclays
(6,759,322)
Franklin Euro High Yield Fund
Purchases Sales Date
Unrealised
EUR
GBP 12-Jul-2112-Jul-21
GBP 12-Jul-2112-Jul-21
0
(continued)
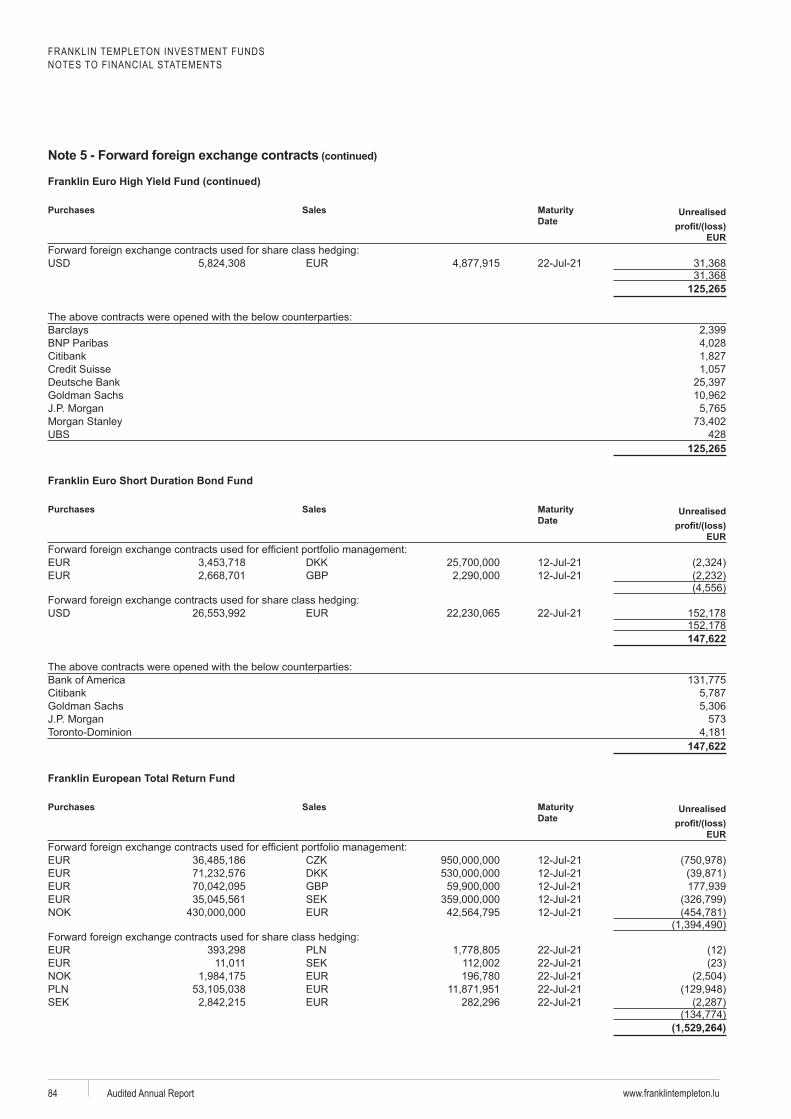
FRANKLIN TEMPLETON INVESTMENT FUNDSNOTES TO FINANCIAL STATEMENTS
www.franklintempleton.luAudited Annual Report84
Franklin Euro High Yield Fund (continued)
Purchases
Sales Date
Unrealised
EUR
22-Jul-21
125,265
Barclays
Deutsche Bank
428125,265
Franklin Euro Short Duration Bond Fund
Purchases Sales Date
Unrealised
EUR
DKK 12-Jul-21GBP 12-Jul-21
0
22-Jul-21
147,622
573
147,622
Franklin European Total Return Fund
Purchases Sales Date
Unrealised
EUR
12-Jul-21DKK 12-Jul-21GBP 12-Jul-21SEK 12-Jul-21
12-Jul-210
22-Jul-21SEK 22-Jul-21
22-Jul-2122-Jul-21
SEK 22-Jul-21
(1,529,264)
(continued)
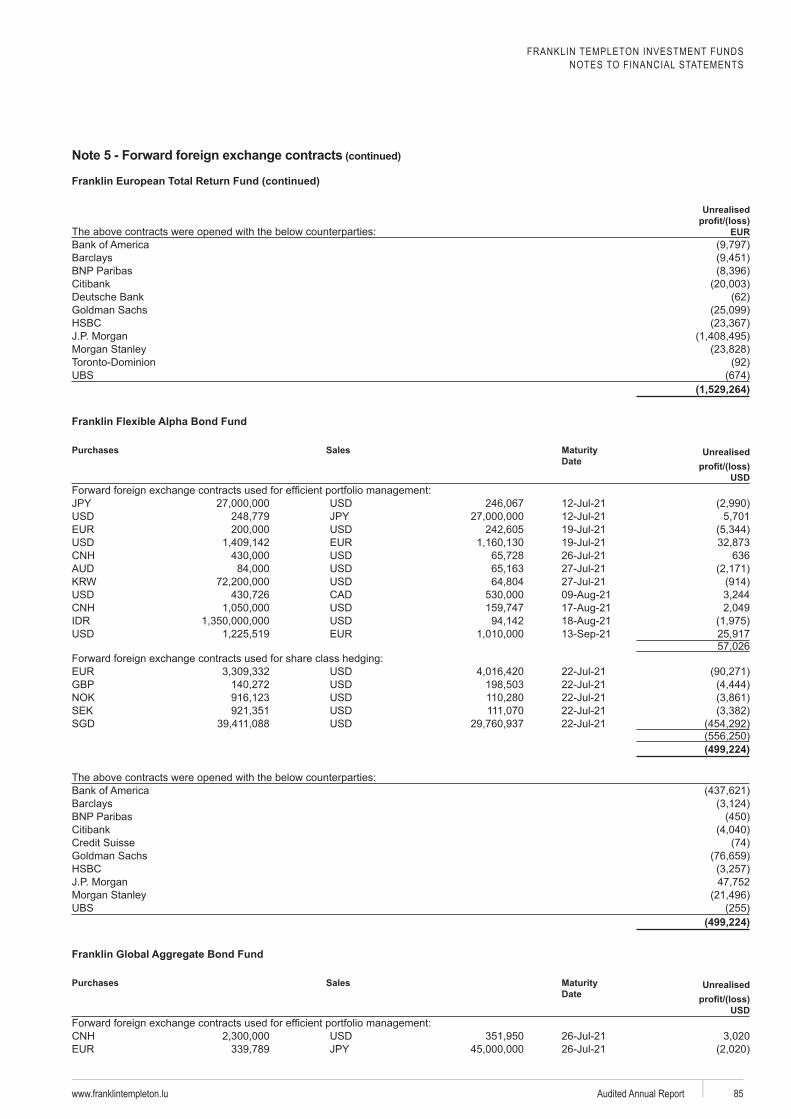
FRANKLIN TEMPLETON INVESTMENT FUNDSNOTES TO FINANCIAL STATEMENTS
www.franklintempleton.lu Audited Annual Report 85
Franklin European Total Return Fund (continued)
Unrealised
EUR
Barclays
Deutsche Bank
(1,529,264)
Franklin Flexible Alpha Bond Fund
Purchases Sales Date
Unrealised
USD
12-Jul-2112-Jul-2119-Jul-2119-Jul-2126-Jul-21 63627-Jul-2127-Jul-21
0
22-Jul-21GBP 22-Jul-21
22-Jul-21SEK 22-Jul-21SGD 22-Jul-21
(499,224)
Barclays
(499,224)
Franklin Global Aggregate Bond Fund
Purchases Sales Date
Unrealised
USD
26-Jul-2126-Jul-21
(continued)
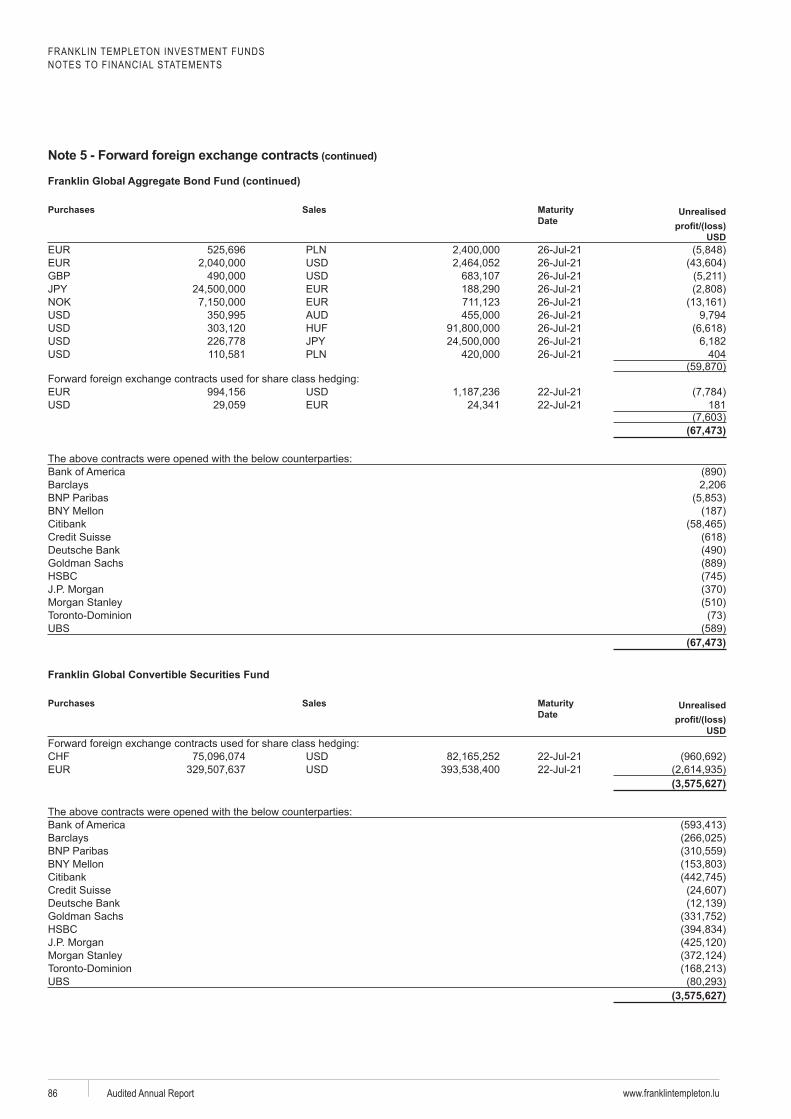
FRANKLIN TEMPLETON INVESTMENT FUNDSNOTES TO FINANCIAL STATEMENTS
www.franklintempleton.luAudited Annual Report86
Franklin Global Aggregate Bond Fund (continued)
Purchases
Sales Date
Unrealised
USD26-Jul-2126-Jul-21
GBP 26-Jul-2126-Jul-2126-Jul-2126-Jul-2126-Jul-2126-Jul-2126-Jul-21 404
0
22-Jul-2122-Jul-21 181
(67,473)
Barclays
Deutsche Bank
(67,473)
Franklin Global Convertible Securities Fund
Purchases Sales Date
Unrealised
USD
22-Jul-2122-Jul-21
(3,575,627)
Barclays
Deutsche Bank
(3,575,627)
(continued)
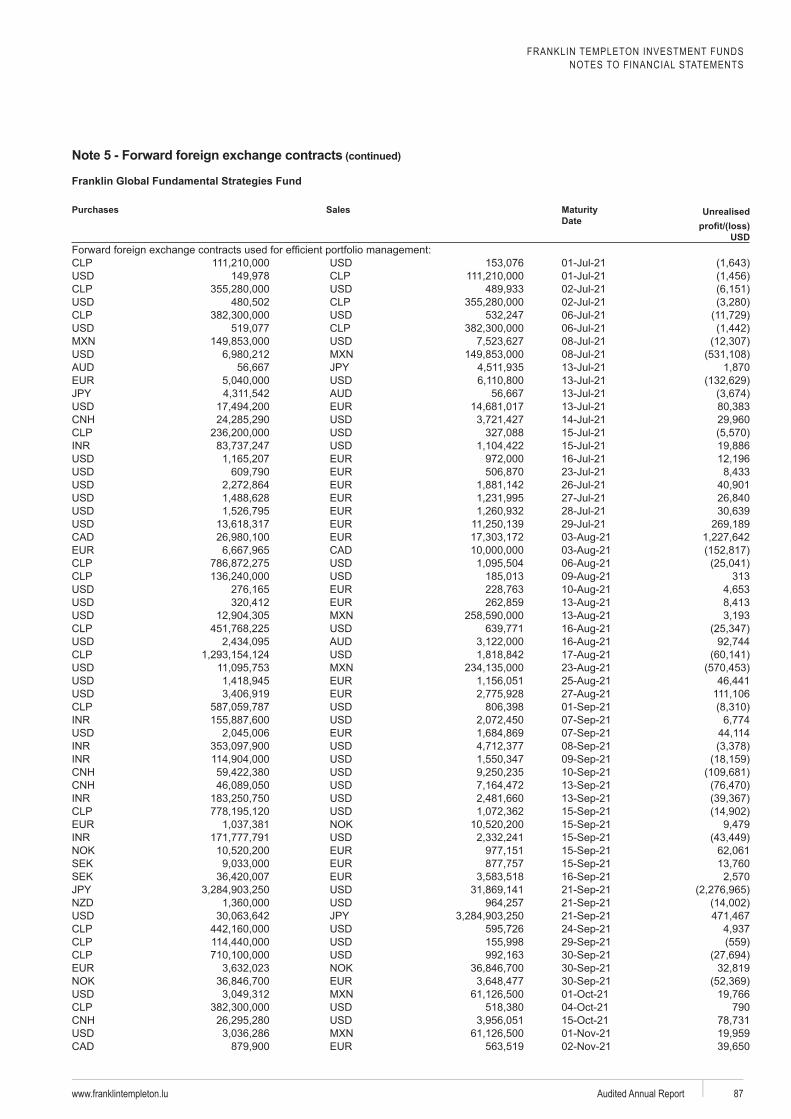
FRANKLIN TEMPLETON INVESTMENT FUNDSNOTES TO FINANCIAL STATEMENTS
www.franklintempleton.lu Audited Annual Report 87
Franklin Global Fundamental Strategies Fund
Purchases Sales Date
Unrealised
USD
01-Jul-2101-Jul-2102-Jul-2102-Jul-2106-Jul-2106-Jul-2108-Jul-2108-Jul-2113-Jul-2113-Jul-2113-Jul-2113-Jul-2114-Jul-2115-Jul-2115-Jul-2116-Jul-2123-Jul-2126-Jul-2127-Jul-2128-Jul-2129-Jul-21
313
SEKSEK
790
(continued)
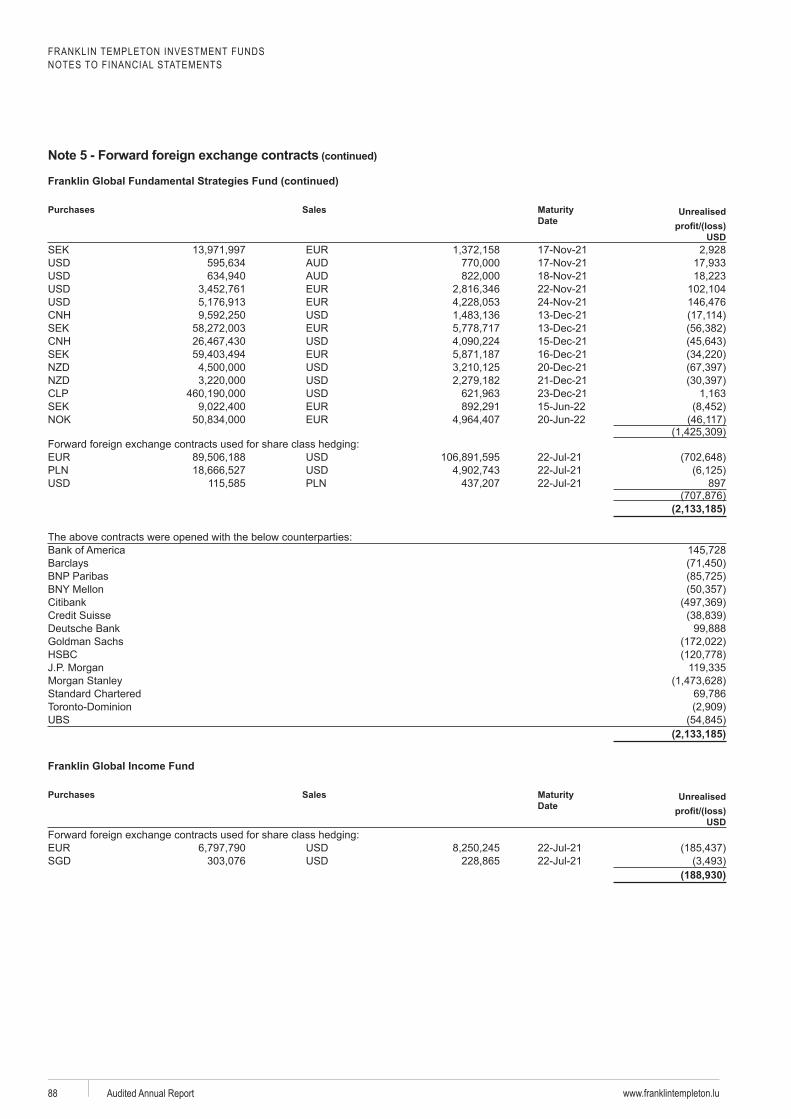
FRANKLIN TEMPLETON INVESTMENT FUNDSNOTES TO FINANCIAL STATEMENTS
www.franklintempleton.luAudited Annual Report88
Franklin Global Fundamental Strategies Fund (continued)
Purchases
Sales Date
Unrealised
USDSEK
13-Dec-21SEK 13-Dec-21
15-Dec-21SEK 16-Dec-21
20-Dec-2121-Dec-2123-Dec-21
SEK 15-Jun-2220-Jun-22
0
22-Jul-2122-Jul-2122-Jul-21 897
(2,133,185)
Barclays
Deutsche Bank
(2,133,185)
Franklin Global Income Fund
Purchases Sales Date
Unrealised
USD
22-Jul-21SGD 22-Jul-21
(188,930)
(continued)
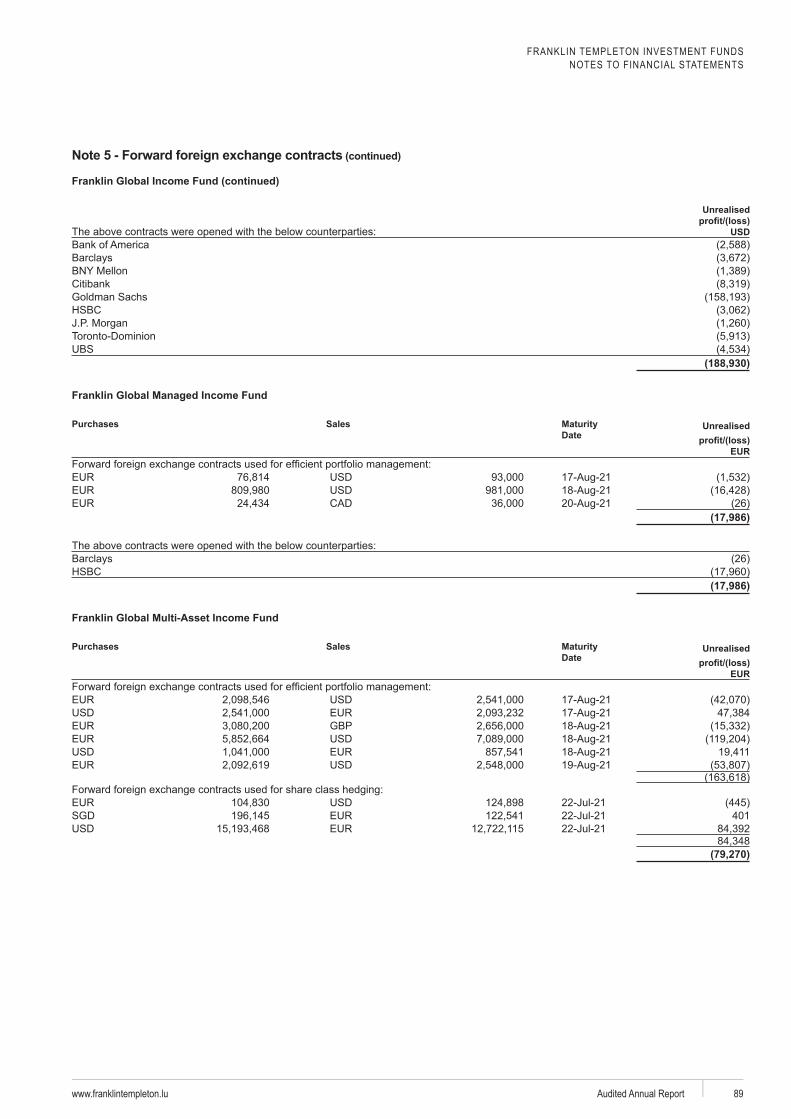
FRANKLIN TEMPLETON INVESTMENT FUNDSNOTES TO FINANCIAL STATEMENTS
www.franklintempleton.lu Audited Annual Report 89
Franklin Global Income Fund (continued)
Unrealised
USD
Barclays
(188,930)
Franklin Global Managed Income Fund
Purchases Sales Date
Unrealised
EUR
(17,986)
Barclays
(17,986)
Franklin Global Multi-Asset Income Fund
Purchases Sales Date
Unrealised
EUR
GBP
0
22-Jul-21SGD 22-Jul-21 401
22-Jul-21
(79,270)
(continued)
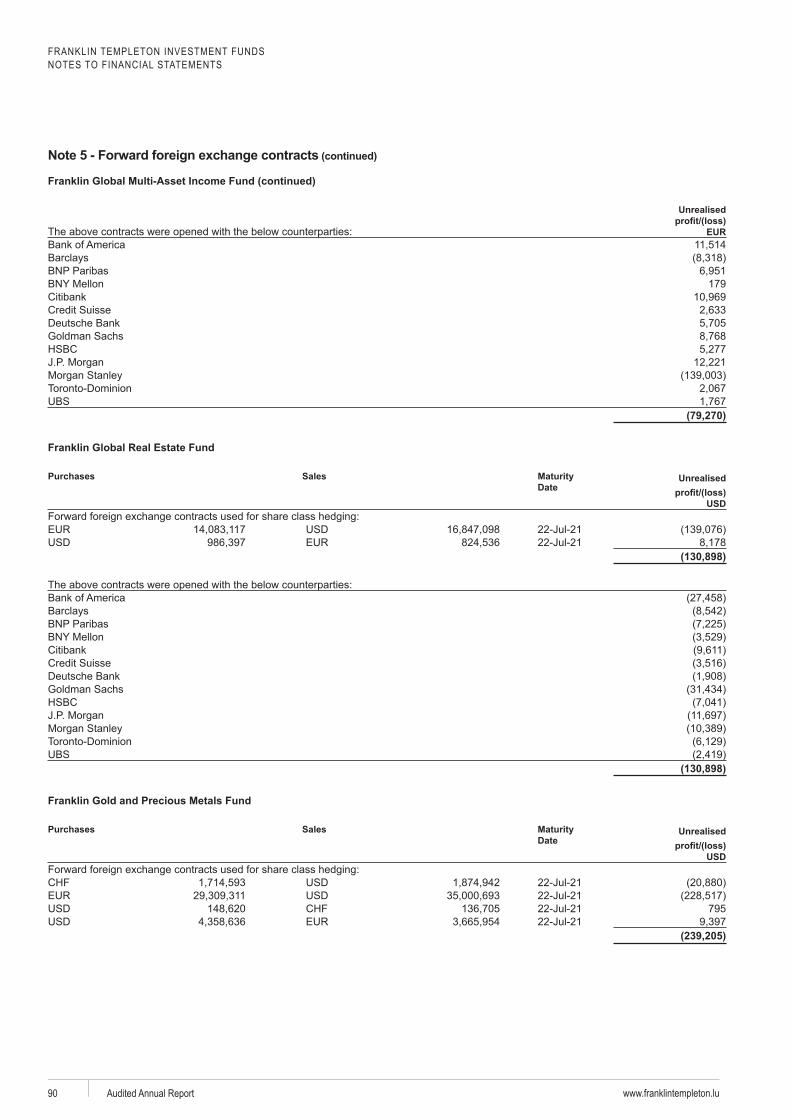
FRANKLIN TEMPLETON INVESTMENT FUNDSNOTES TO FINANCIAL STATEMENTS
www.franklintempleton.luAudited Annual Report90
Franklin Global Multi-Asset Income Fund (continued)
Unrealised
EUR
Barclays
179
Deutsche Bank
(79,270)
Franklin Global Real Estate Fund
Purchases Sales Date
Unrealised
USD
22-Jul-2122-Jul-21
(130,898)
Barclays
Deutsche Bank
(130,898)
Franklin Gold and Precious Metals Fund
Purchases Sales Date
Unrealised
USD
22-Jul-2122-Jul-2122-Jul-21 79522-Jul-21
(239,205)
(continued)
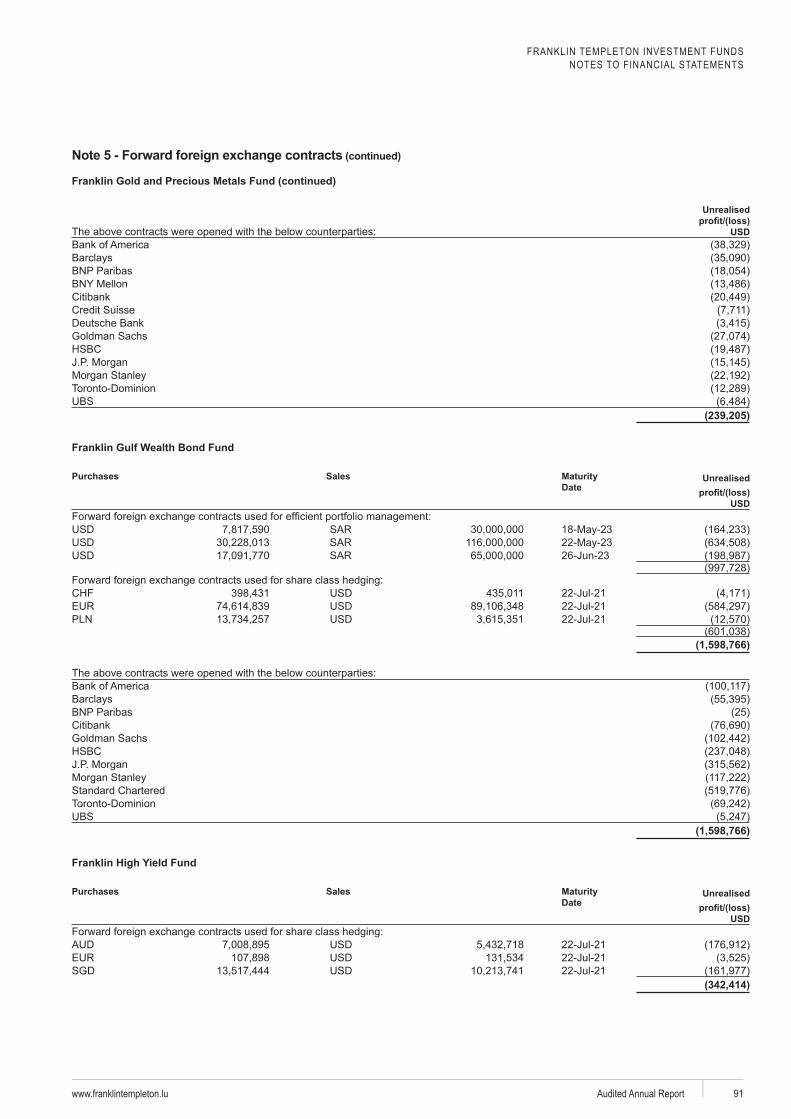
FRANKLIN TEMPLETON INVESTMENT FUNDSNOTES TO FINANCIAL STATEMENTS
www.franklintempleton.lu Audited Annual Report 91
Franklin Gold and Precious Metals Fund (continued)
Unrealised
USD
Barclays
Deutsche Bank
(239,205)
Franklin Gulf Wealth Bond Fund
Purchases Sales Date
Unrealised
USD
26-Jun-230
22-Jul-2122-Jul-2122-Jul-21
(1,598,766)
Barclays
(1,598,766)
Franklin High Yield Fund
Purchases Sales Date
Unrealised
USD
22-Jul-2122-Jul-21
SGD 22-Jul-21(342,414)
(continued)
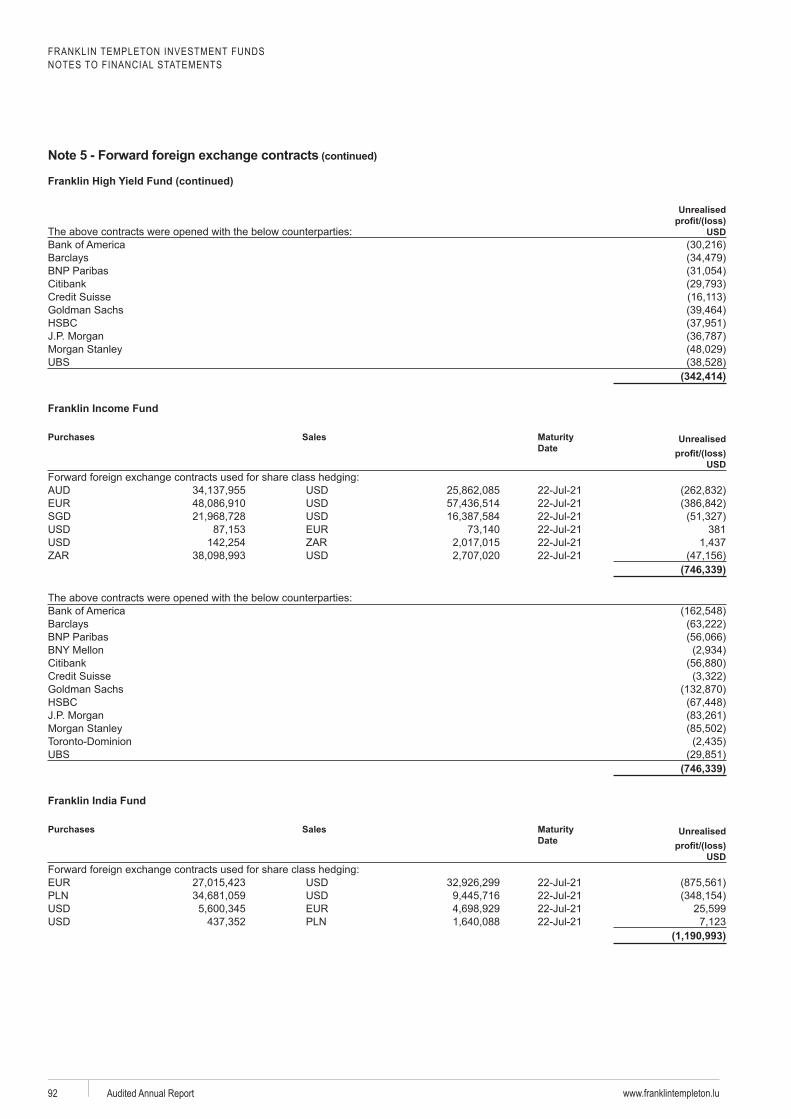
FRANKLIN TEMPLETON INVESTMENT FUNDSNOTES TO FINANCIAL STATEMENTS
www.franklintempleton.luAudited Annual Report92
Franklin High Yield Fund (continued)
Unrealised
USD
Barclays
(342,414)
Franklin Income Fund
Purchases Sales Date
Unrealised
USD
22-Jul-2122-Jul-21
SGD 22-Jul-2122-Jul-21 38122-Jul-2122-Jul-21
(746,339)
Barclays
(746,339)
Franklin India Fund
Purchases Sales Date
Unrealised
USD
22-Jul-2122-Jul-2122-Jul-2122-Jul-21
(1,190,993)
(continued)
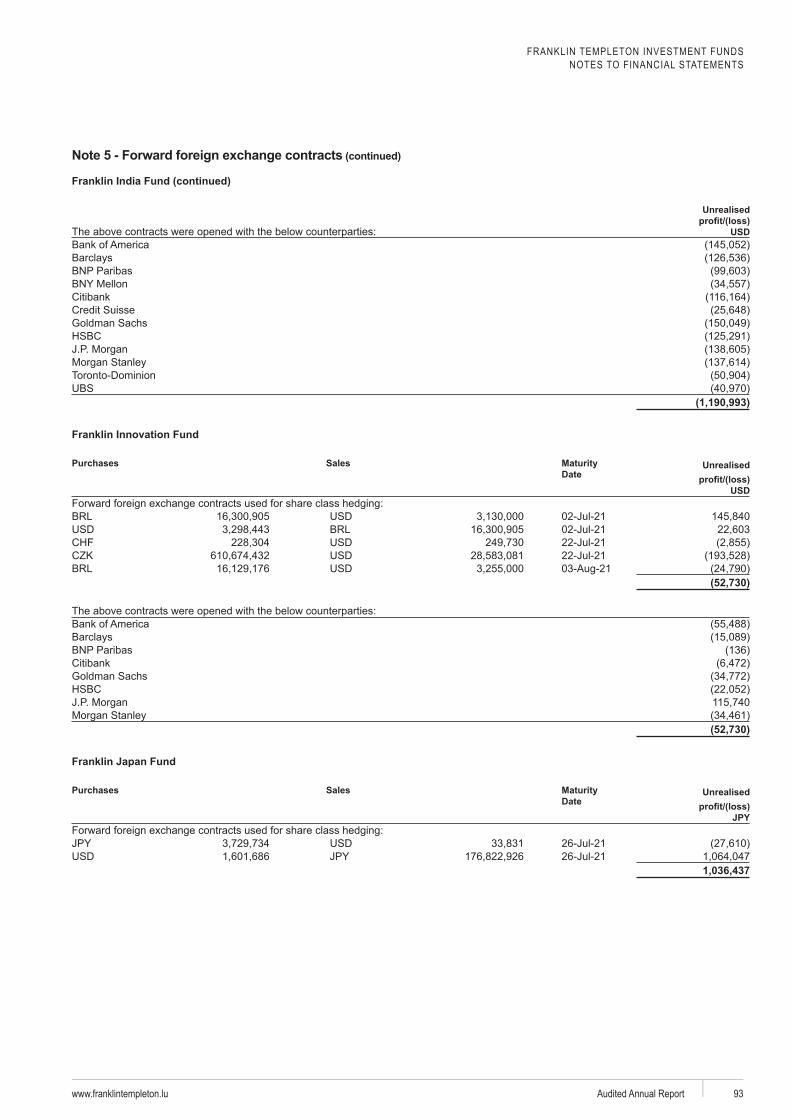
FRANKLIN TEMPLETON INVESTMENT FUNDSNOTES TO FINANCIAL STATEMENTS
www.franklintempleton.lu Audited Annual Report 93
Franklin India Fund (continued)
Unrealised
USD
Barclays
(1,190,993)
Franklin Innovation Fund
Purchases Sales Date
Unrealised
USD
02-Jul-2102-Jul-2122-Jul-2122-Jul-21
(52,730)
Barclays
(52,730)
Purchases Sales Date
Unrealised
26-Jul-2126-Jul-21
1,036,437
(continued)
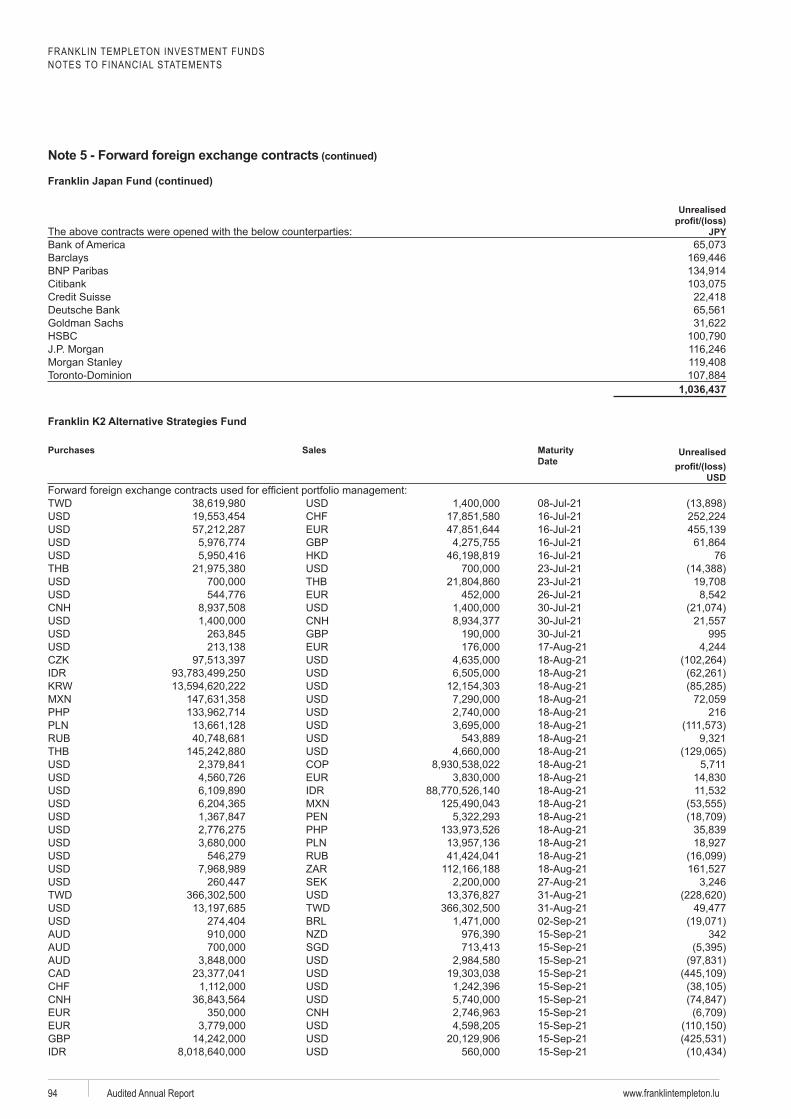
FRANKLIN TEMPLETON INVESTMENT FUNDSNOTES TO FINANCIAL STATEMENTS
www.franklintempleton.luAudited Annual Report94
Unrealised
Barclays
Deutsche Bank
1,036,437
Purchases Sales Date
Unrealised
USD
TWD 08-Jul-2116-Jul-2116-Jul-21
GBP 16-Jul-2116-Jul-21 7623-Jul-2123-Jul-2126-Jul-2130-Jul-2130-Jul-21
GBP 30-Jul-21 995
216
SEKTWD
TWD
342SGD
GBP
(continued)
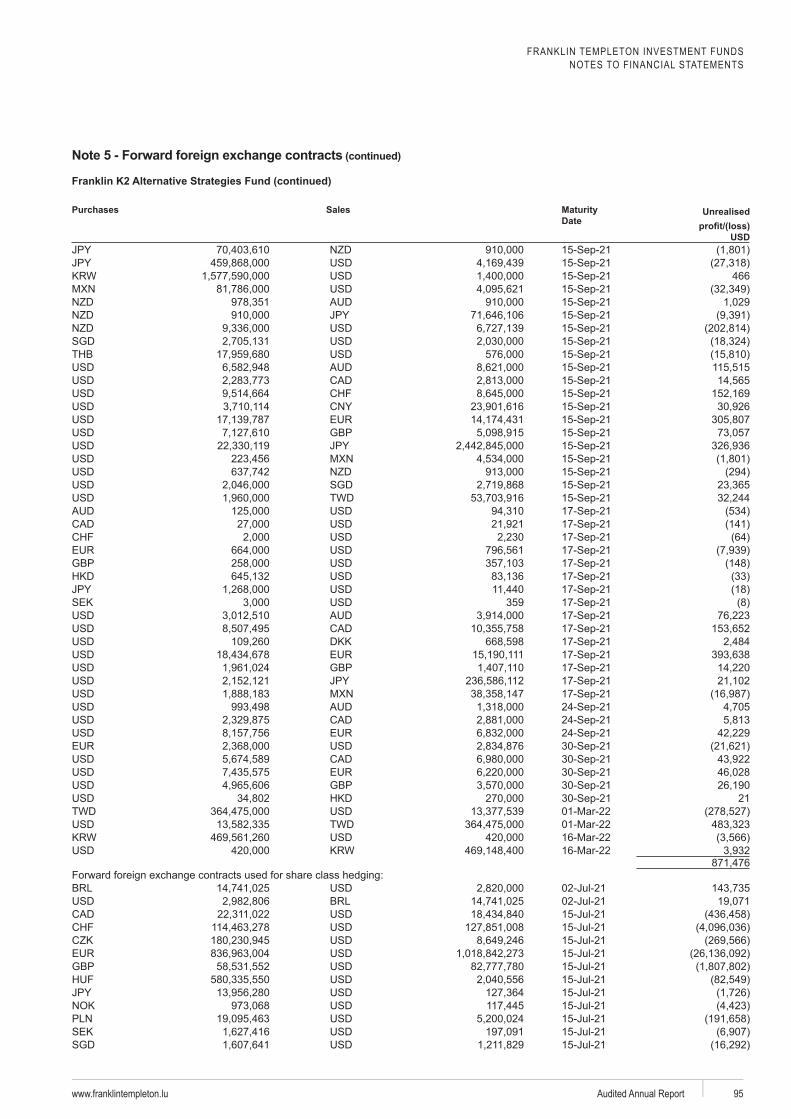
FRANKLIN TEMPLETON INVESTMENT FUNDSNOTES TO FINANCIAL STATEMENTS
www.franklintempleton.lu Audited Annual Report 95
Purchases
Sales Date
Unrealised
USD
466
SGD
GBP
SGDTWD
GBP
SEK 359
DKK
GBP
GBP21
TWDTWD
0
02-Jul-2102-Jul-2115-Jul-2115-Jul-2115-Jul-2115-Jul-21
GBP 15-Jul-2115-Jul-2115-Jul-2115-Jul-2115-Jul-21
SEK 15-Jul-21SGD 15-Jul-21
(continued)
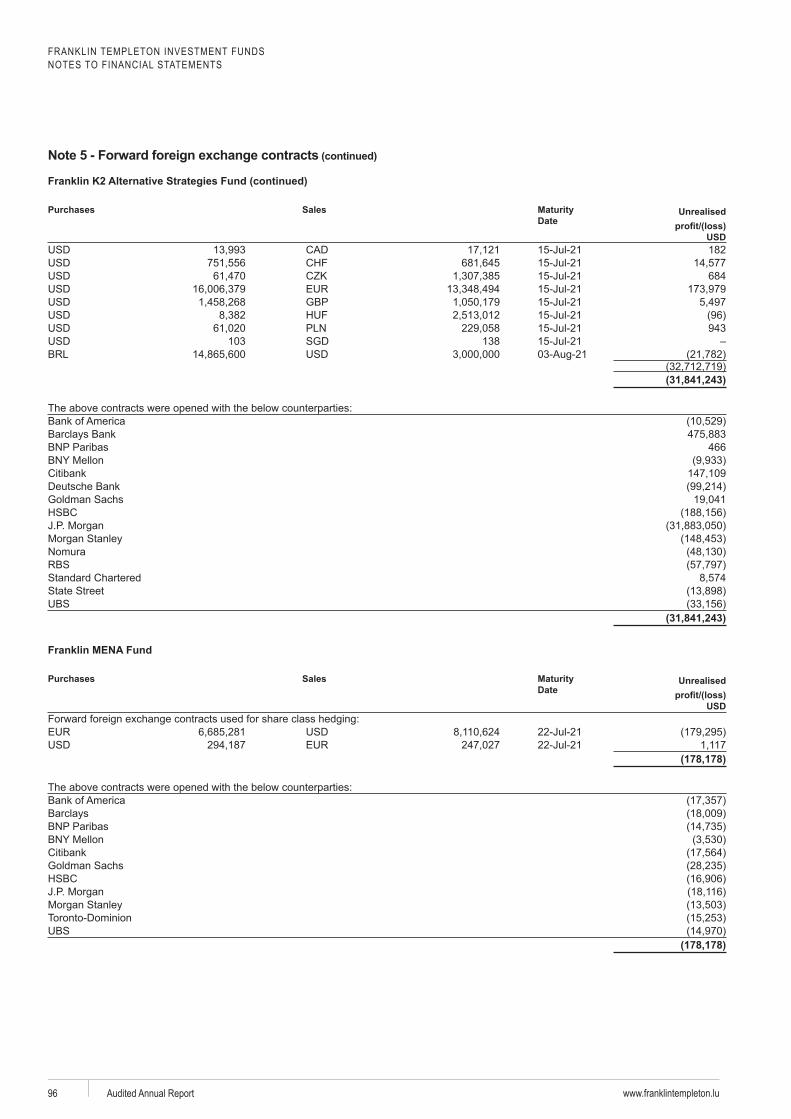
FRANKLIN TEMPLETON INVESTMENT FUNDSNOTES TO FINANCIAL STATEMENTS
www.franklintempleton.luAudited Annual Report96
Purchases
Sales Date
Unrealised
USD15-Jul-21 18215-Jul-2115-Jul-21 68415-Jul-21
GBP 15-Jul-2115-Jul-2115-Jul-21 943
103 SGD 138 15-Jul-21
(31,841,243)
Barclays Bank 466
Deutsche Bank
State Street
(31,841,243)
Franklin MENA Fund
Purchases Sales Date
Unrealised
USD
22-Jul-2122-Jul-21
(178,178)
Barclays
(178,178)
(continued)
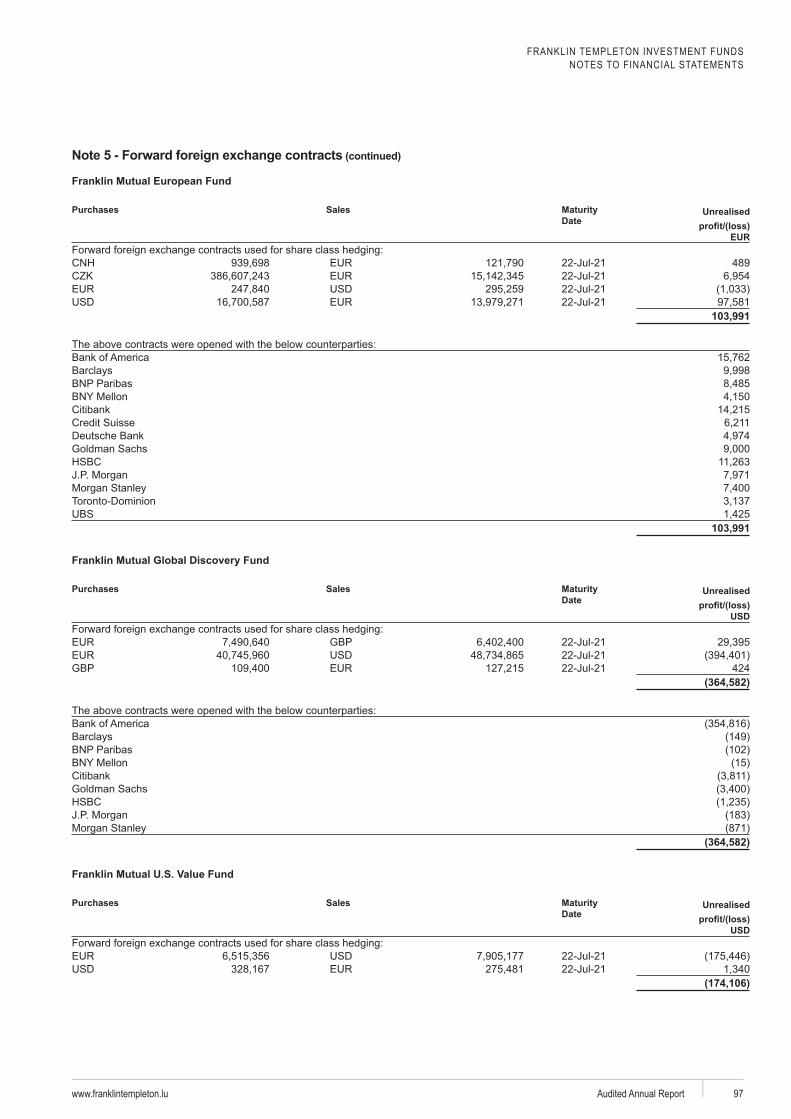
FRANKLIN TEMPLETON INVESTMENT FUNDSNOTES TO FINANCIAL STATEMENTS
www.franklintempleton.lu Audited Annual Report 97
Franklin Mutual European Fund
Purchases Sales Date
Unrealised
EUR
22-Jul-21 48922-Jul-2122-Jul-2122-Jul-21
103,991
Barclays
Deutsche Bank
103,991
Purchases Sales Date
Unrealised
USD
GBP 22-Jul-2122-Jul-21
GBP 22-Jul-21 424(364,582)
Barclays
(364,582)
Purchases Sales Date
Unrealised
USD
22-Jul-2122-Jul-21
(174,106)
(continued)
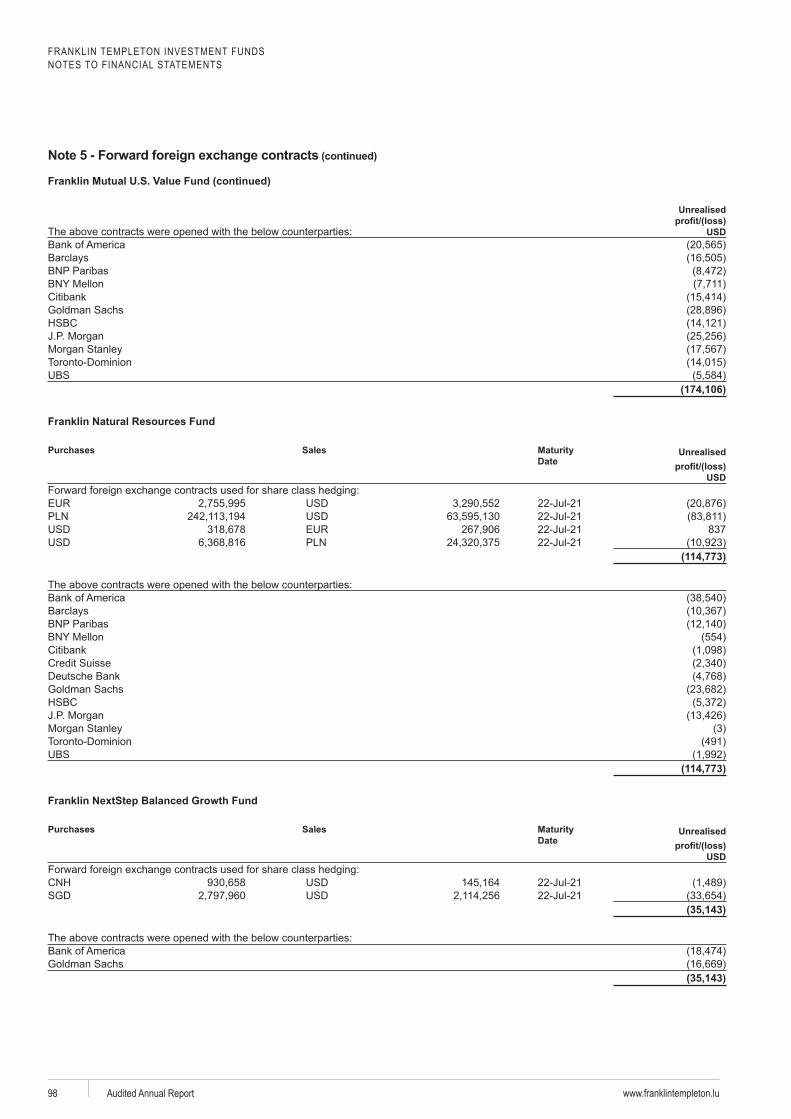
FRANKLIN TEMPLETON INVESTMENT FUNDSNOTES TO FINANCIAL STATEMENTS
www.franklintempleton.luAudited Annual Report98
Unrealised
USD
Barclays
(174,106)
Franklin Natural Resources Fund
Purchases Sales Date
Unrealised
USD
22-Jul-2122-Jul-2122-Jul-21 83722-Jul-21
(114,773)
Barclays
Deutsche Bank
(114,773)
Franklin NextStep
Purchases Sales Date
Unrealised
USD
22-Jul-21SGD 22-Jul-21
(35,143)
(35,143)
(continued)
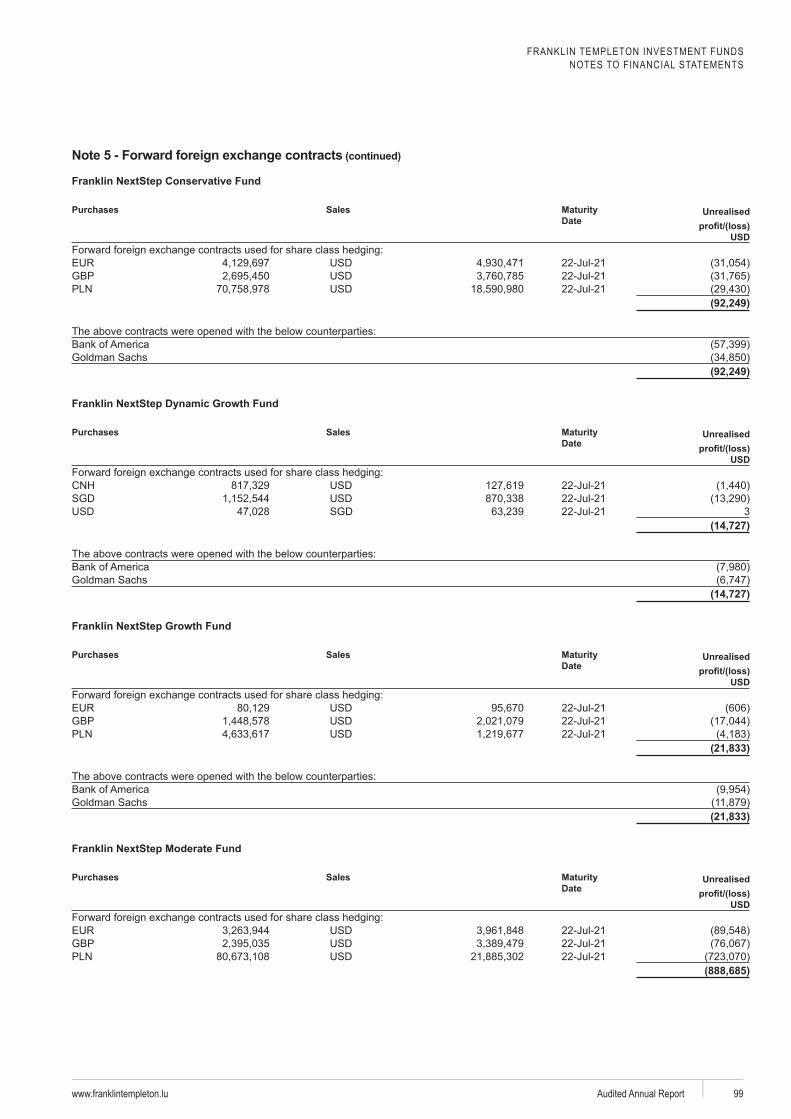
FRANKLIN TEMPLETON INVESTMENT FUNDSNOTES TO FINANCIAL STATEMENTS
www.franklintempleton.lu Audited Annual Report 99
Franklin NextStep Conservative Fund
Purchases Sales Date
Unrealised
USD
22-Jul-21GBP 22-Jul-21
22-Jul-21(92,249)
(92,249)
Franklin NextStep
Purchases Sales Date
Unrealised
USD
22-Jul-21SGD 22-Jul-21
SGD 22-Jul-21 3(14,727)
(14,727)
Franklin NextStep
Purchases Sales Date
Unrealised
USD
22-Jul-21GBP 22-Jul-21
22-Jul-21(21,833)
(21,833)
Franklin NextStep Moderate Fund
Purchases Sales Date
Unrealised
USD
22-Jul-21GBP 22-Jul-21
22-Jul-21(888,685)
(continued)
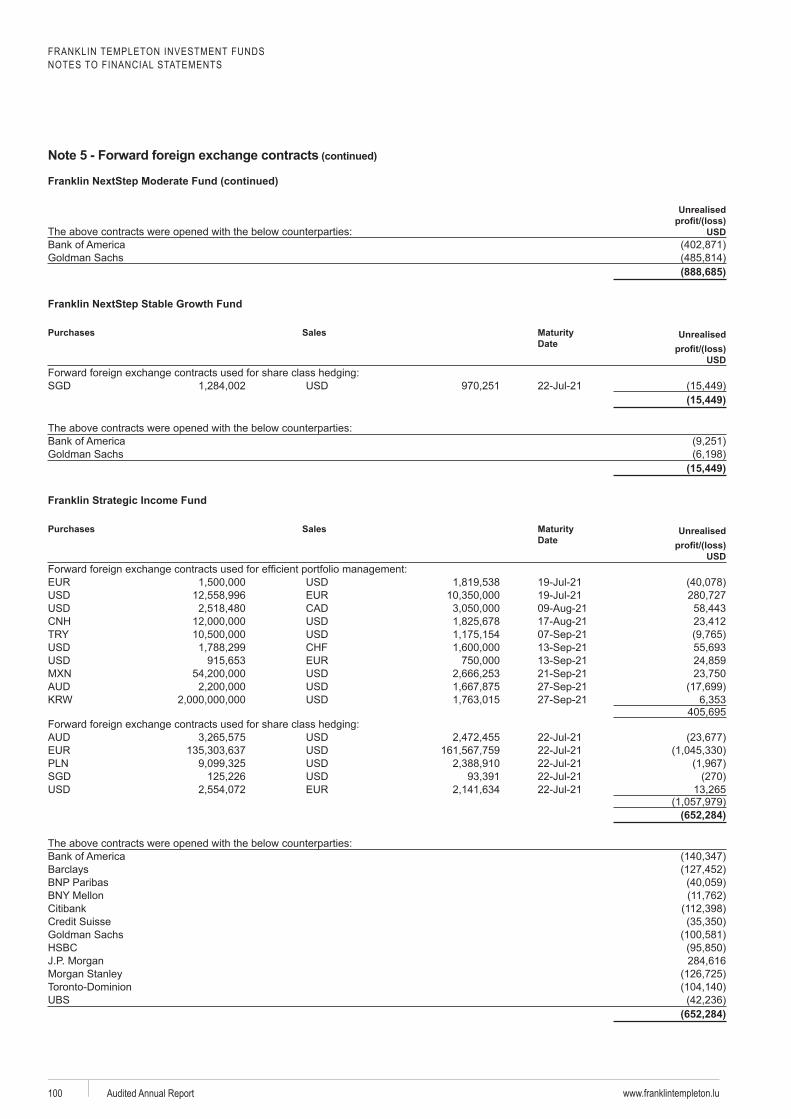
FRANKLIN TEMPLETON INVESTMENT FUNDSNOTES TO FINANCIAL STATEMENTS
www.franklintempleton.luAudited Annual Report100
Franklin NextStep Moderate Fund (continued)
Unrealised
USD
(888,685)
Franklin NextStep
Purchases Sales Date
Unrealised
USD
SGD 22-Jul-21(15,449)
(15,449)
Franklin Strategic Income Fund
Purchases Sales Date
Unrealised
USD
19-Jul-2119-Jul-21
0
22-Jul-2122-Jul-2122-Jul-21
SGD 22-Jul-2122-Jul-21
(652,284)
Barclays
(652,284)
(continued)
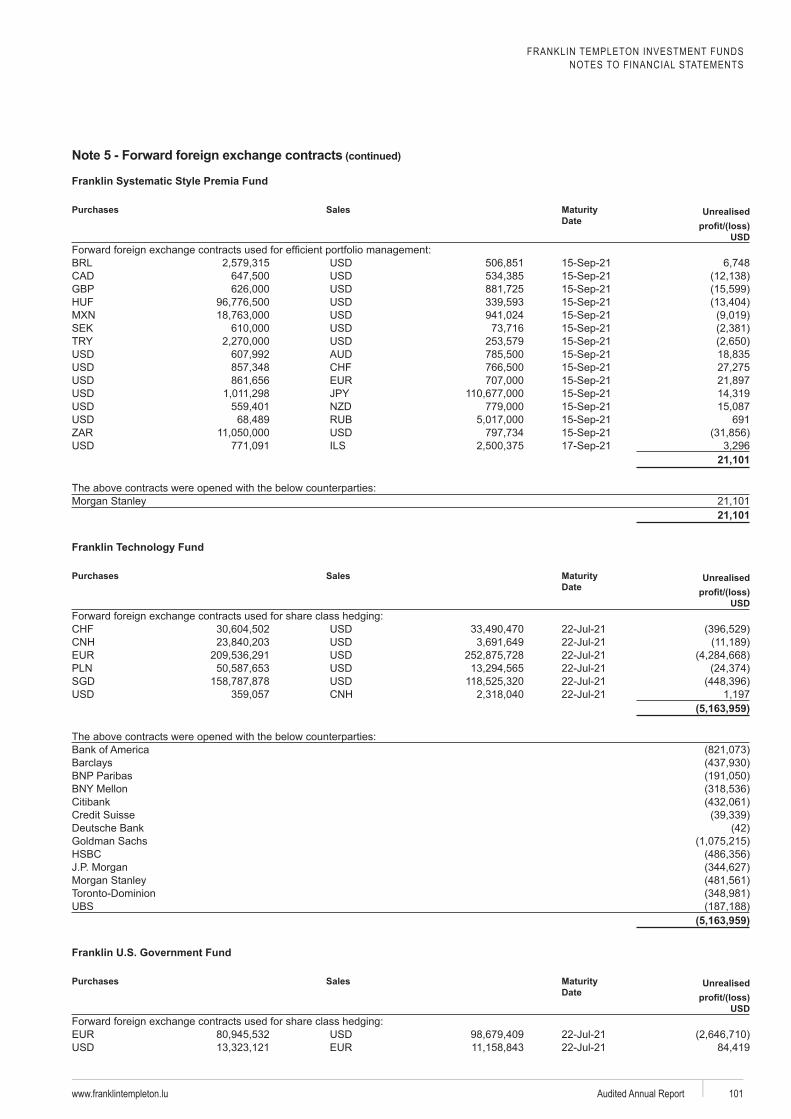
FRANKLIN TEMPLETON INVESTMENT FUNDSNOTES TO FINANCIAL STATEMENTS
www.franklintempleton.lu Audited Annual Report 101
Premia Fund
Purchases Sales Date
Unrealised
USD
GBP
SEK
691
21,101
21,101
Purchases Sales Date
Unrealised
USD
22-Jul-2122-Jul-2122-Jul-2122-Jul-21
SGD 22-Jul-2122-Jul-21
(5,163,959)
Barclays
Deutsche Bank
(5,163,959)
Purchases Sales Date
Unrealised
USD
22-Jul-2122-Jul-21
(continued)
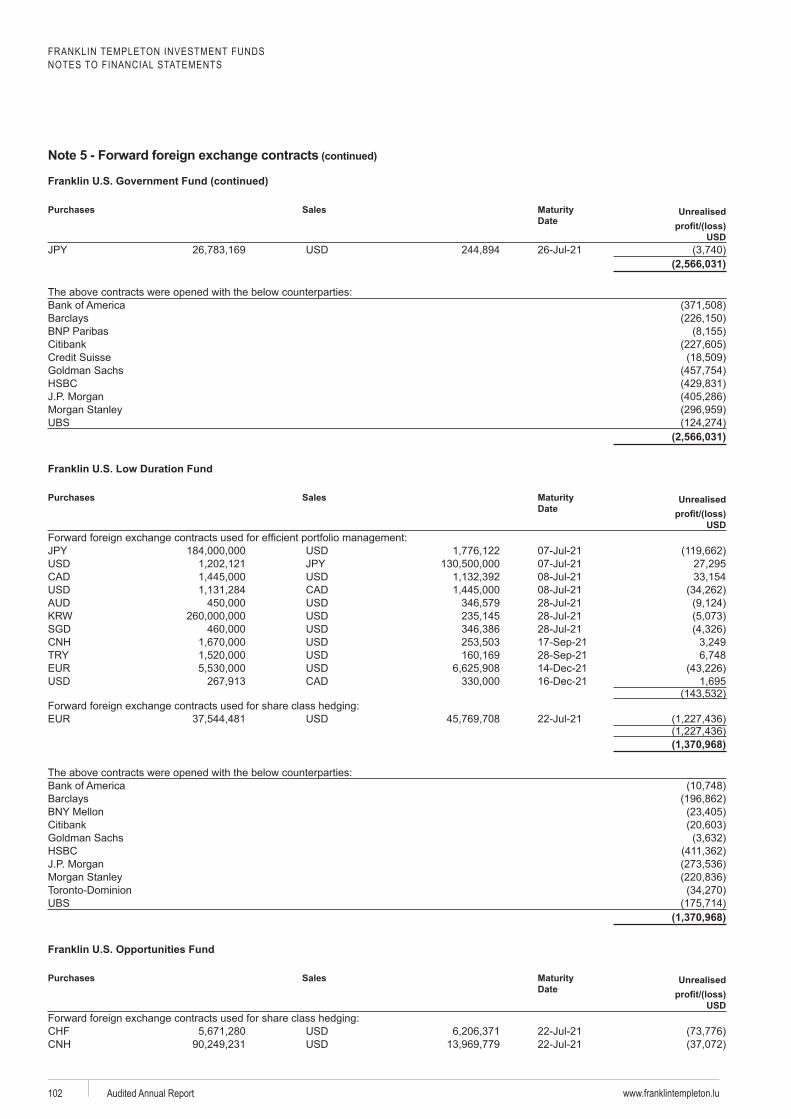
FRANKLIN TEMPLETON INVESTMENT FUNDSNOTES TO FINANCIAL STATEMENTS
www.franklintempleton.luAudited Annual Report102
Purchases
Sales Date
Unrealised
USD26-Jul-21
(2,566,031)
Barclays
(2,566,031)
Purchases Sales Date
Unrealised
USD
07-Jul-2107-Jul-2108-Jul-2108-Jul-2128-Jul-2128-Jul-21
SGD 28-Jul-21
14-Dec-2116-Dec-21
0
22-Jul-21
(1,370,968)
Barclays
(1,370,968)
Purchases Sales Date
Unrealised
USD
22-Jul-2122-Jul-21
(continued)
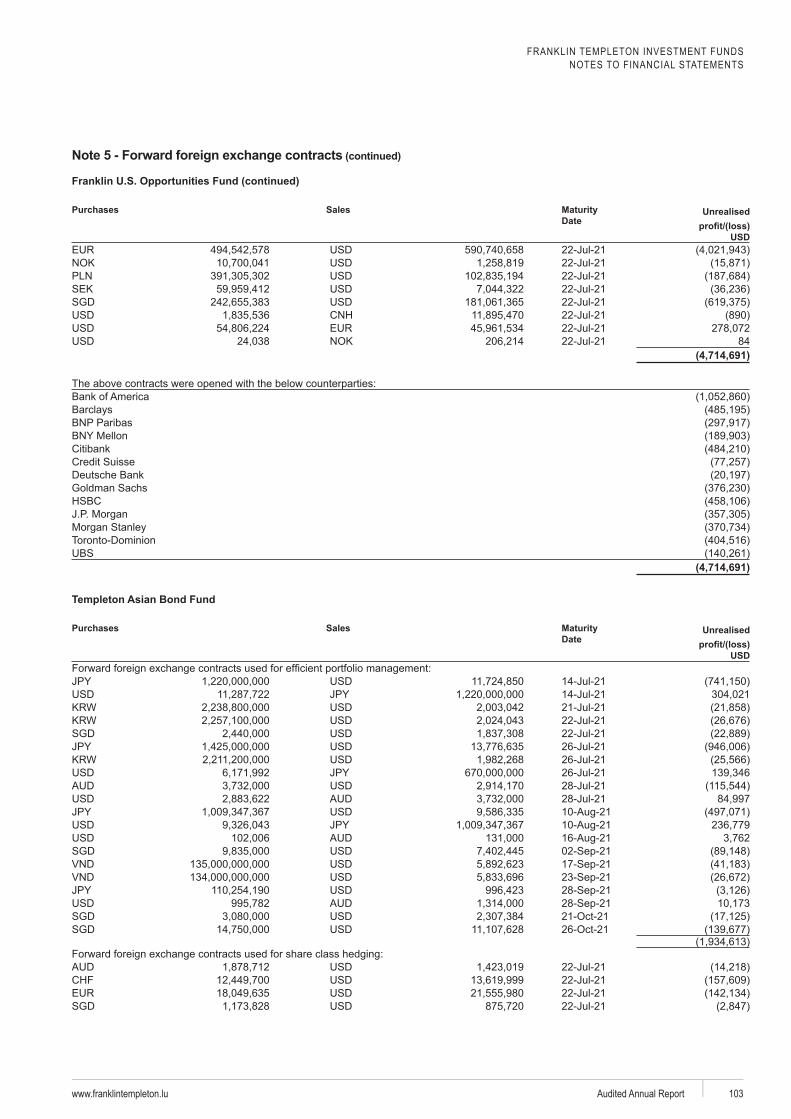
FRANKLIN TEMPLETON INVESTMENT FUNDSNOTES TO FINANCIAL STATEMENTS
www.franklintempleton.lu Audited Annual Report 103
Purchases
Sales Date
Unrealised
USD22-Jul-2122-Jul-2122-Jul-21
SEK 22-Jul-21SGD 22-Jul-21
22-Jul-2122-Jul-2122-Jul-21 84
(4,714,691)
Barclays
Deutsche Bank
(4,714,691)
Templeton Asian Bond Fund
Purchases Sales Date
Unrealised
USD
14-Jul-2114-Jul-2121-Jul-2122-Jul-21
SGD 22-Jul-2126-Jul-2126-Jul-2126-Jul-2128-Jul-2128-Jul-21
SGD
SGDSGD0
22-Jul-2122-Jul-2122-Jul-21
SGD 22-Jul-21
(continued)
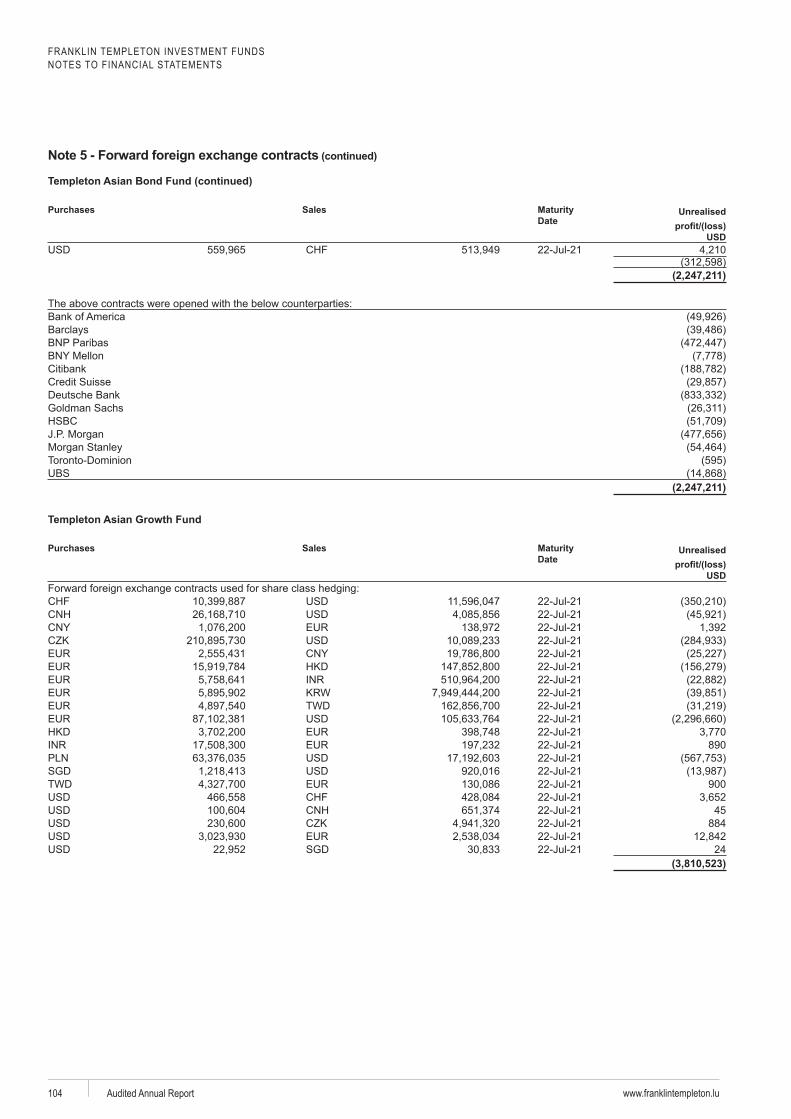
FRANKLIN TEMPLETON INVESTMENT FUNDSNOTES TO FINANCIAL STATEMENTS
www.franklintempleton.luAudited Annual Report104
Templeton Asian Bond Fund (continued)
Purchases
Sales Date
Unrealised
USD22-Jul-21
(2,247,211)
Barclays
Deutsche Bank
(2,247,211)
Purchases Sales Date
Unrealised
USD
22-Jul-2122-Jul-2122-Jul-2122-Jul-2122-Jul-2122-Jul-2122-Jul-2122-Jul-21
TWD 22-Jul-2122-Jul-2122-Jul-2122-Jul-21 89022-Jul-21
SGD 22-Jul-21TWD 22-Jul-21 900
22-Jul-2122-Jul-21 4522-Jul-21 88422-Jul-21
SGD 22-Jul-21 24(3,810,523)
(continued)
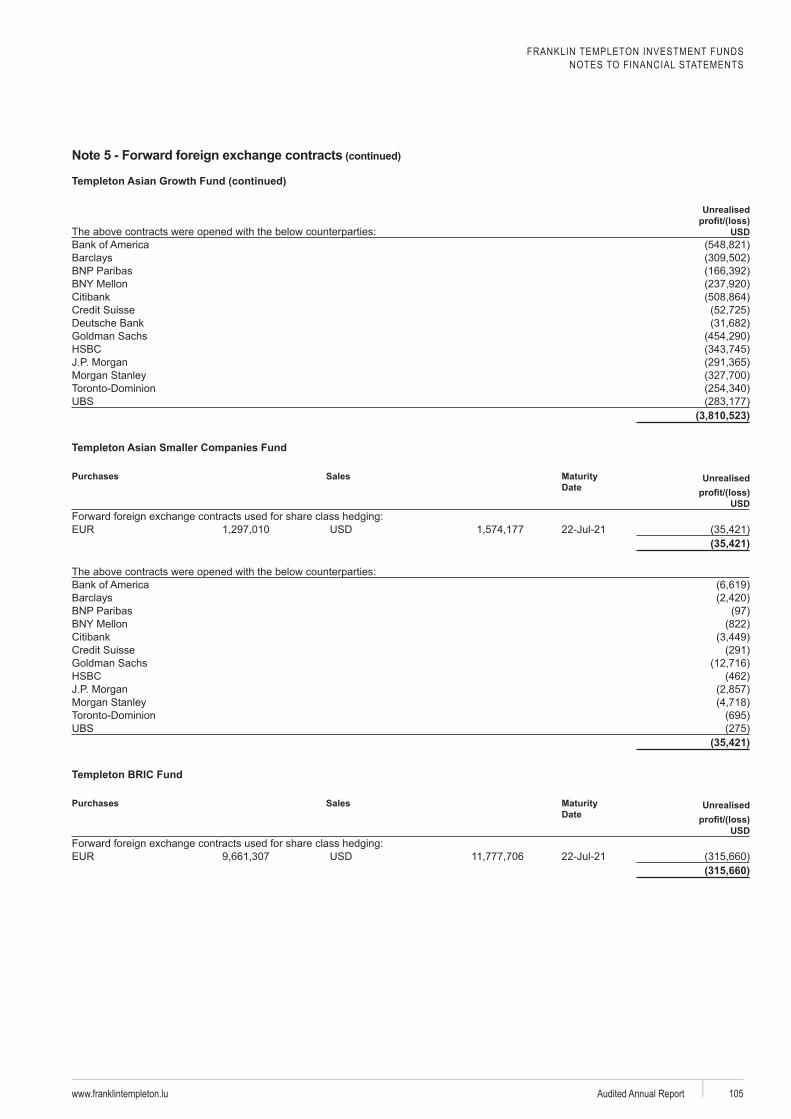
FRANKLIN TEMPLETON INVESTMENT FUNDSNOTES TO FINANCIAL STATEMENTS
www.franklintempleton.lu Audited Annual Report 105
Unrealised
USD
Barclays
Deutsche Bank
(3,810,523)
Templeton Asian Smaller Companies Fund
Purchases Sales Date
Unrealised
USD
22-Jul-21(35,421)
Barclays
(35,421)
Templeton BRIC Fund
Purchases Sales Date
Unrealised
USD
22-Jul-21(315,660)
(continued)
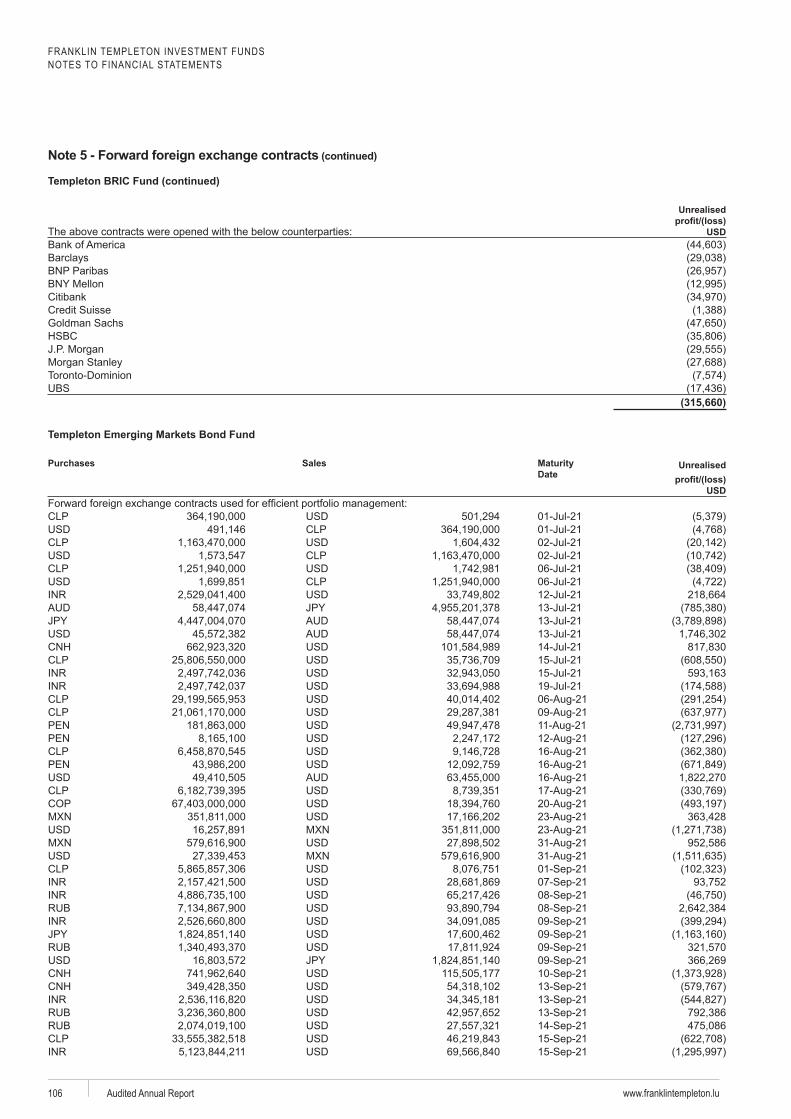
FRANKLIN TEMPLETON INVESTMENT FUNDSNOTES TO FINANCIAL STATEMENTS
www.franklintempleton.luAudited Annual Report106
Templeton BRIC Fund (continued)
Unrealised
USD
Barclays
(315,660)
Templeton Emerging Markets Bond Fund
Purchases Sales Date
Unrealised
USD
01-Jul-2101-Jul-2102-Jul-2102-Jul-2106-Jul-2106-Jul-2112-Jul-2113-Jul-2113-Jul-2113-Jul-2114-Jul-2115-Jul-2115-Jul-2119-Jul-21
(continued)
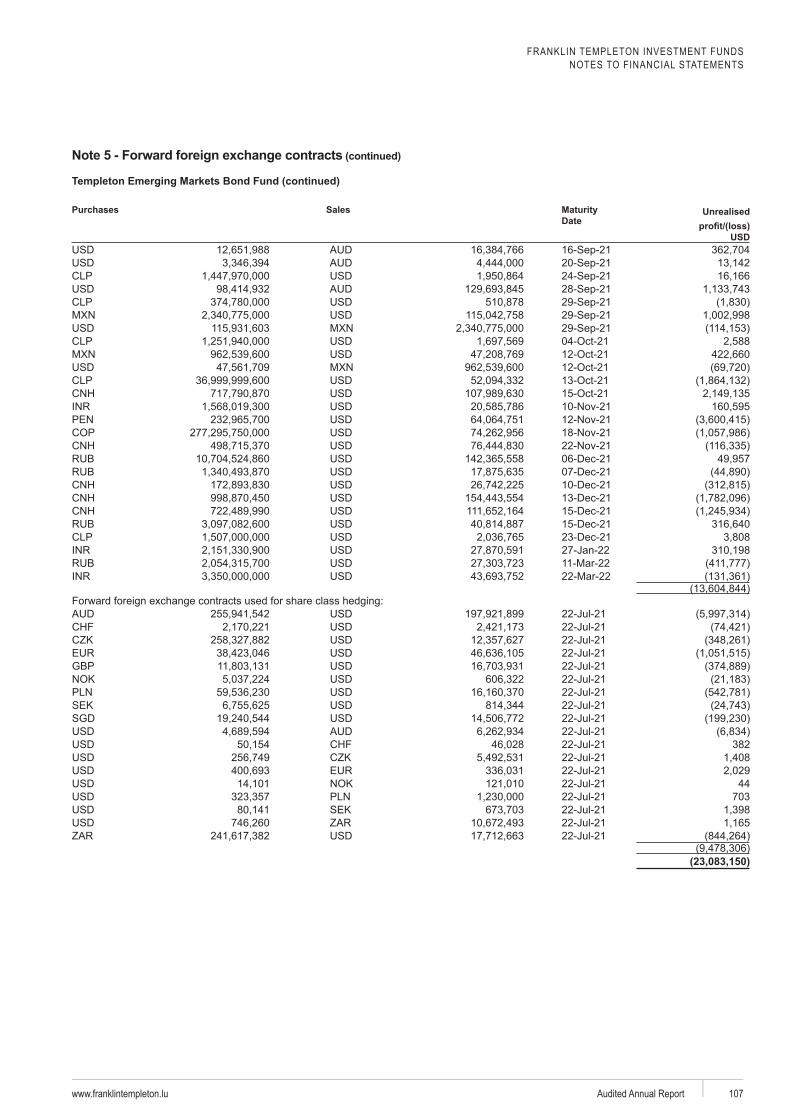
FRANKLIN TEMPLETON INVESTMENT FUNDSNOTES TO FINANCIAL STATEMENTS
www.franklintempleton.lu Audited Annual Report 107
Templeton Emerging Markets Bond Fund (continued)
Purchases
Sales Date
Unrealised
USD
06-Dec-2107-Dec-2110-Dec-2113-Dec-2115-Dec-2115-Dec-2123-Dec-2127-Jan-22
0
22-Jul-2122-Jul-2122-Jul-2122-Jul-21
GBP 22-Jul-2122-Jul-2122-Jul-21
SEK 22-Jul-21SGD 22-Jul-21
22-Jul-2122-Jul-21 38222-Jul-2122-Jul-2122-Jul-21 4422-Jul-21 703
SEK 22-Jul-2122-Jul-2122-Jul-21
(23,083,150)
(continued)
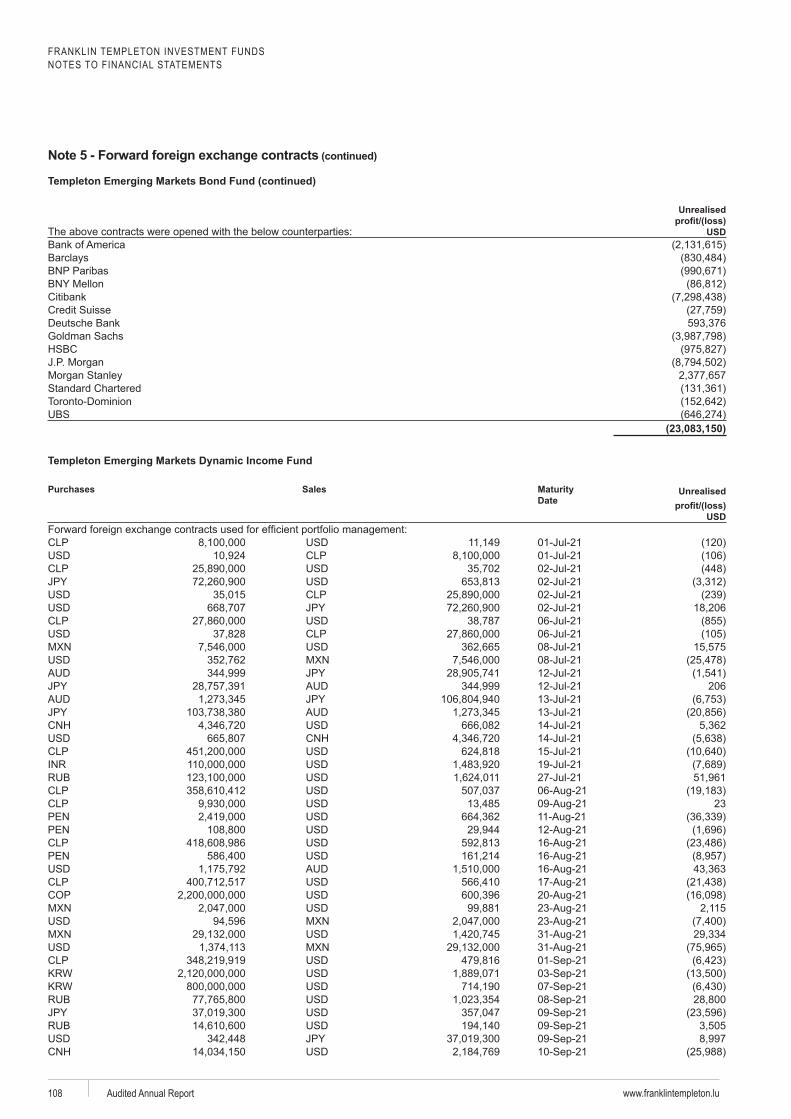
FRANKLIN TEMPLETON INVESTMENT FUNDSNOTES TO FINANCIAL STATEMENTS
www.franklintempleton.luAudited Annual Report108
Templeton Emerging Markets Bond Fund (continued)
Unrealised
USD
Barclays
Deutsche Bank
(23,083,150)
Purchases Sales Date
Unrealised
USD
01-Jul-2101-Jul-2102-Jul-2102-Jul-2102-Jul-2102-Jul-2106-Jul-2106-Jul-2108-Jul-2108-Jul-2112-Jul-2112-Jul-21 20613-Jul-2113-Jul-2114-Jul-2114-Jul-2115-Jul-2119-Jul-2127-Jul-21
23
(continued)
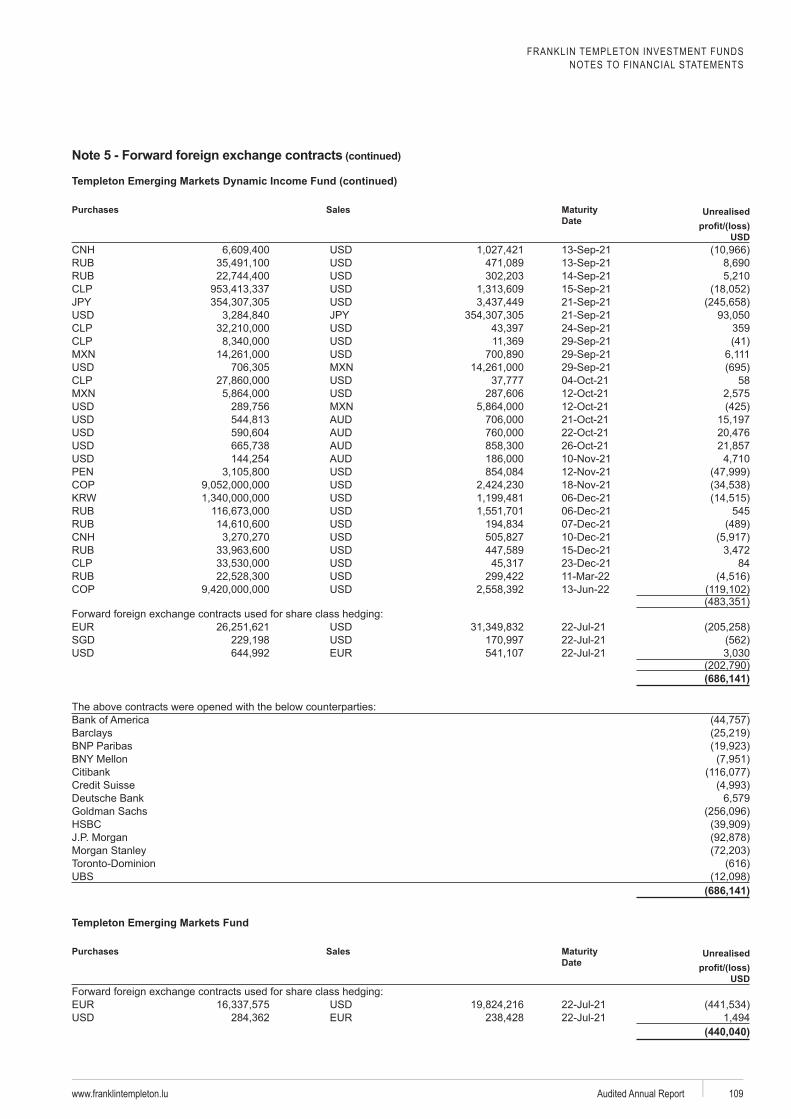
FRANKLIN TEMPLETON INVESTMENT FUNDSNOTES TO FINANCIAL STATEMENTS
www.franklintempleton.lu Audited Annual Report 109
Purchases
Sales Date
Unrealised
USD
359
58
06-Dec-2106-Dec-21 54507-Dec-2110-Dec-2115-Dec-2123-Dec-21 84
13-Jun-220
22-Jul-21SGD 22-Jul-21
22-Jul-21
(686,141)
Barclays
Deutsche Bank
(686,141)
Templeton Emerging Markets Fund
Purchases Sales Date
Unrealised
USD
22-Jul-2122-Jul-21
(440,040)
(continued)
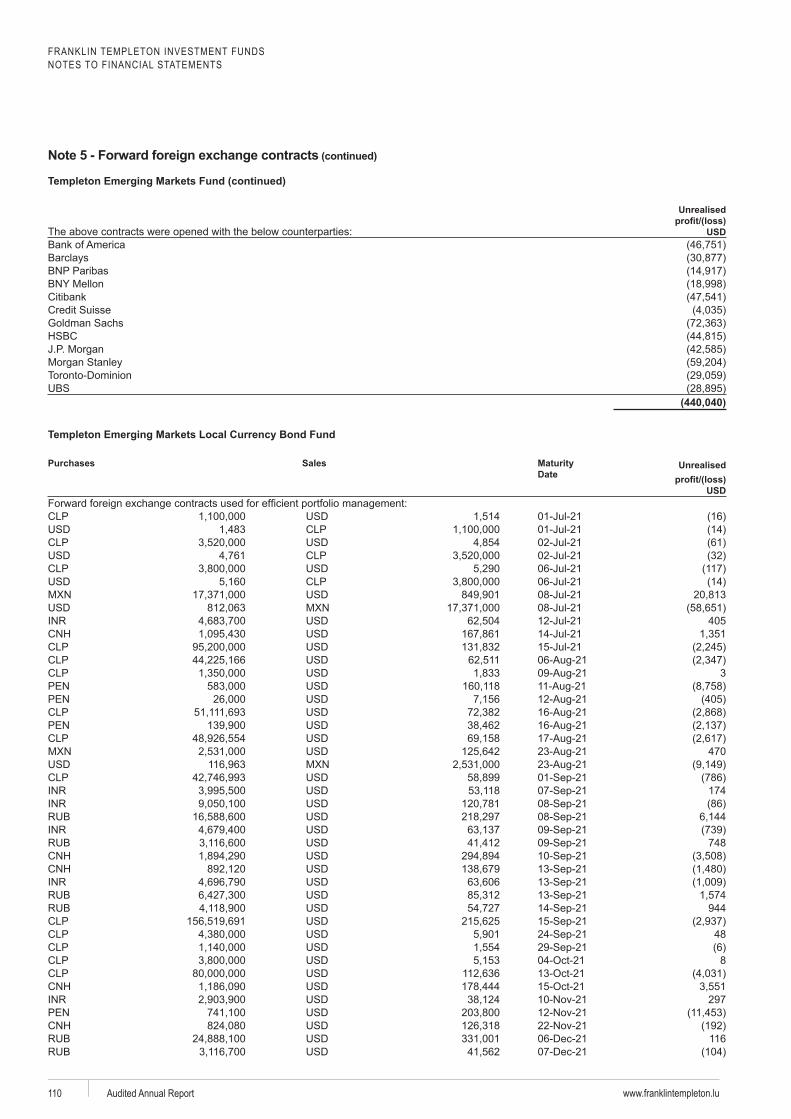
FRANKLIN TEMPLETON INVESTMENT FUNDSNOTES TO FINANCIAL STATEMENTS
www.franklintempleton.luAudited Annual Report110
Templeton Emerging Markets Fund (continued)
Unrealised
USD
Barclays
(440,040)
Purchases Sales Date
Unrealised
USD
01-Jul-2101-Jul-2102-Jul-2102-Jul-2106-Jul-2106-Jul-2108-Jul-2108-Jul-2112-Jul-21 40514-Jul-2115-Jul-21
3
470
174
748
944
48
8
297
06-Dec-21 11607-Dec-21
(continued)
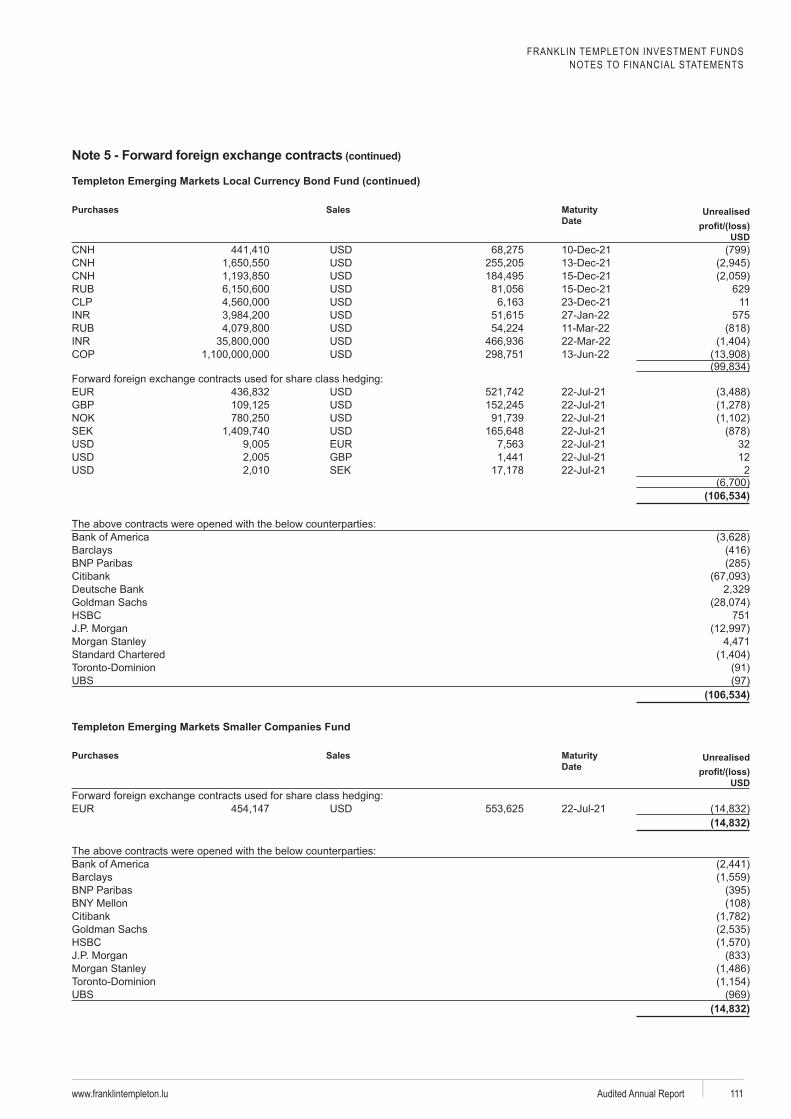
FRANKLIN TEMPLETON INVESTMENT FUNDSNOTES TO FINANCIAL STATEMENTS
www.franklintempleton.lu Audited Annual Report 111
Purchases
Sales Date
Unrealised
USD10-Dec-2113-Dec-2115-Dec-2115-Dec-21 62923-Dec-21 1127-Jan-22 575
13-Jun-220
22-Jul-21GBP 22-Jul-21
22-Jul-21SEK 22-Jul-21
22-Jul-21 32GBP 22-Jul-21 12SEK 22-Jul-21 2
(106,534)
Barclays
Deutsche Bank
751
(106,534)
Templeton Emerging Markets Smaller Companies Fund
Purchases Sales Date
Unrealised
USD
22-Jul-21(14,832)
Barclays
(14,832)
(continued)
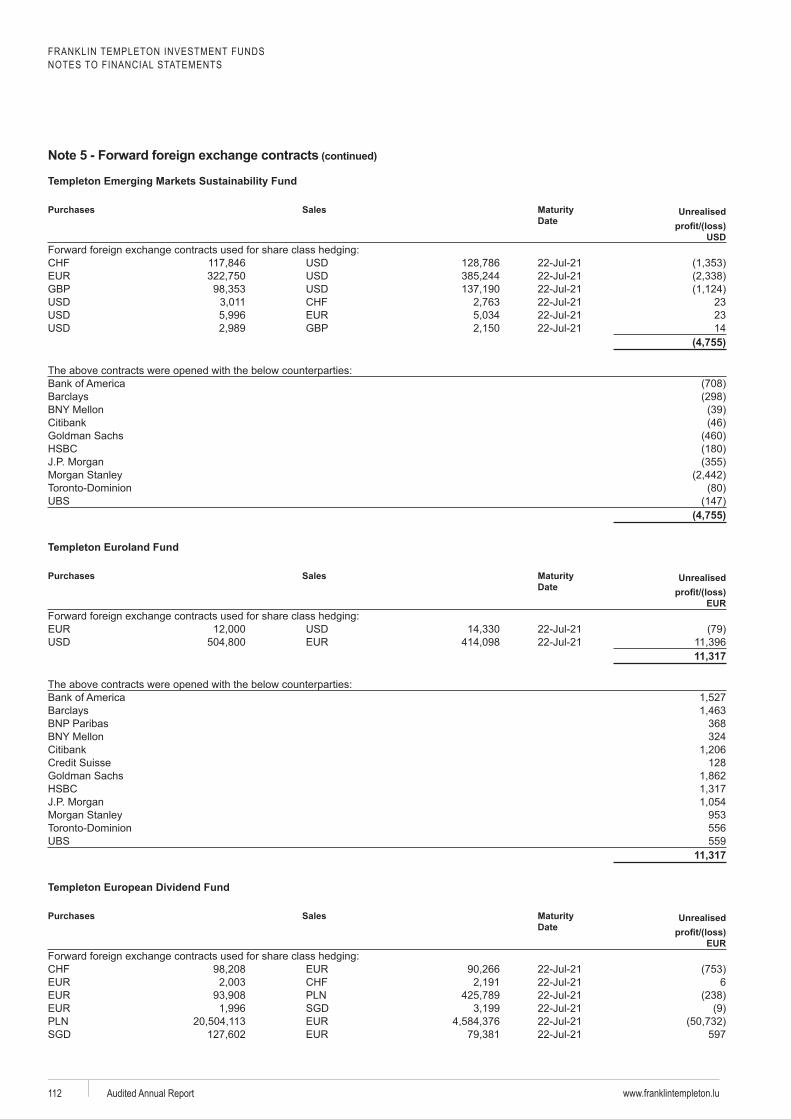
FRANKLIN TEMPLETON INVESTMENT FUNDSNOTES TO FINANCIAL STATEMENTS
www.franklintempleton.luAudited Annual Report112
Purchases Sales Date
Unrealised
USD
22-Jul-2122-Jul-21
GBP 22-Jul-2122-Jul-21 2322-Jul-21 23
GBP 22-Jul-21 14(4,755)
Barclays
(4,755)
Templeton Euroland Fund
Purchases Sales Date
Unrealised
EUR
22-Jul-2122-Jul-21
11,317
Barclays 368324
128
953556559
11,317
Templeton European Dividend Fund
Purchases Sales Date
Unrealised
EUR
22-Jul-2122-Jul-21 622-Jul-21
SGD 22-Jul-2122-Jul-21
SGD 22-Jul-21 597
(continued)
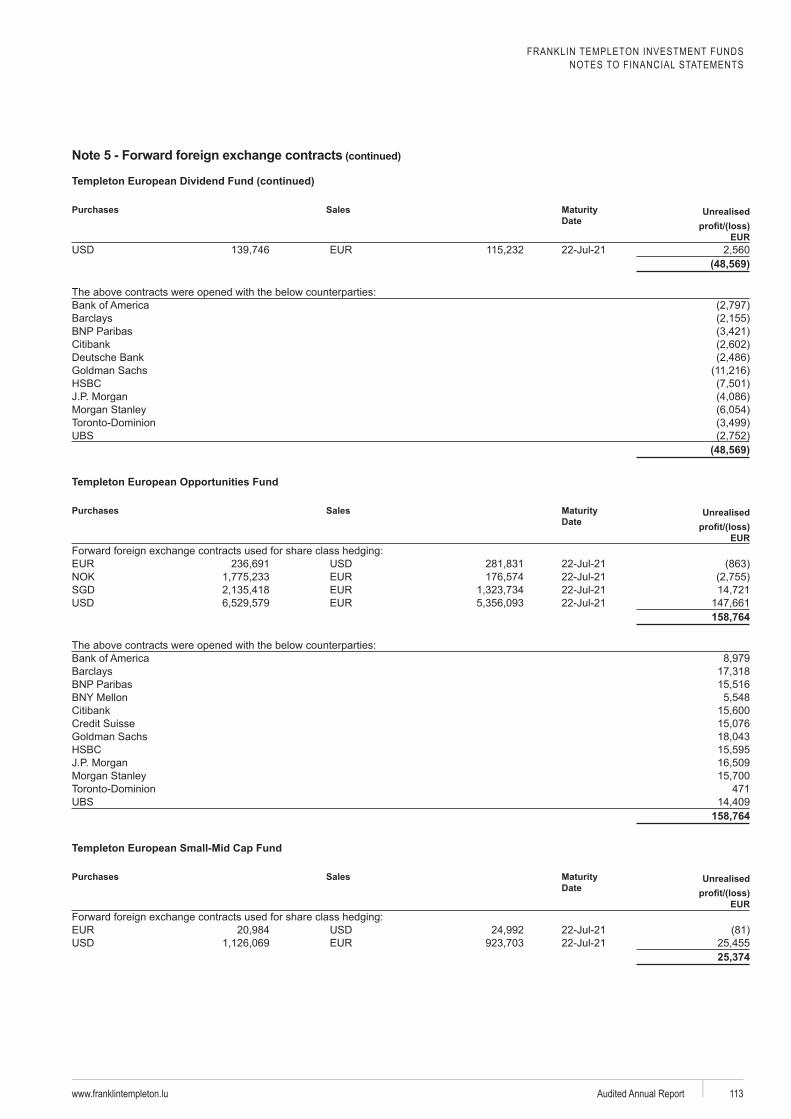
FRANKLIN TEMPLETON INVESTMENT FUNDSNOTES TO FINANCIAL STATEMENTS
www.franklintempleton.lu Audited Annual Report 113
Templeton European Dividend Fund (continued)
Purchases
Sales Date
Unrealised
EUR22-Jul-21
(48,569)
Barclays
Deutsche Bank
(48,569)
Templeton European Opportunities Fund
Purchases Sales Date
Unrealised
EUR
22-Jul-2122-Jul-21
SGD 22-Jul-2122-Jul-21
158,764
Barclays
471
158,764
Templeton European Small-Mid Cap Fund
Purchases Sales Date
Unrealised
EUR
22-Jul-2122-Jul-21
25,374
(continued)
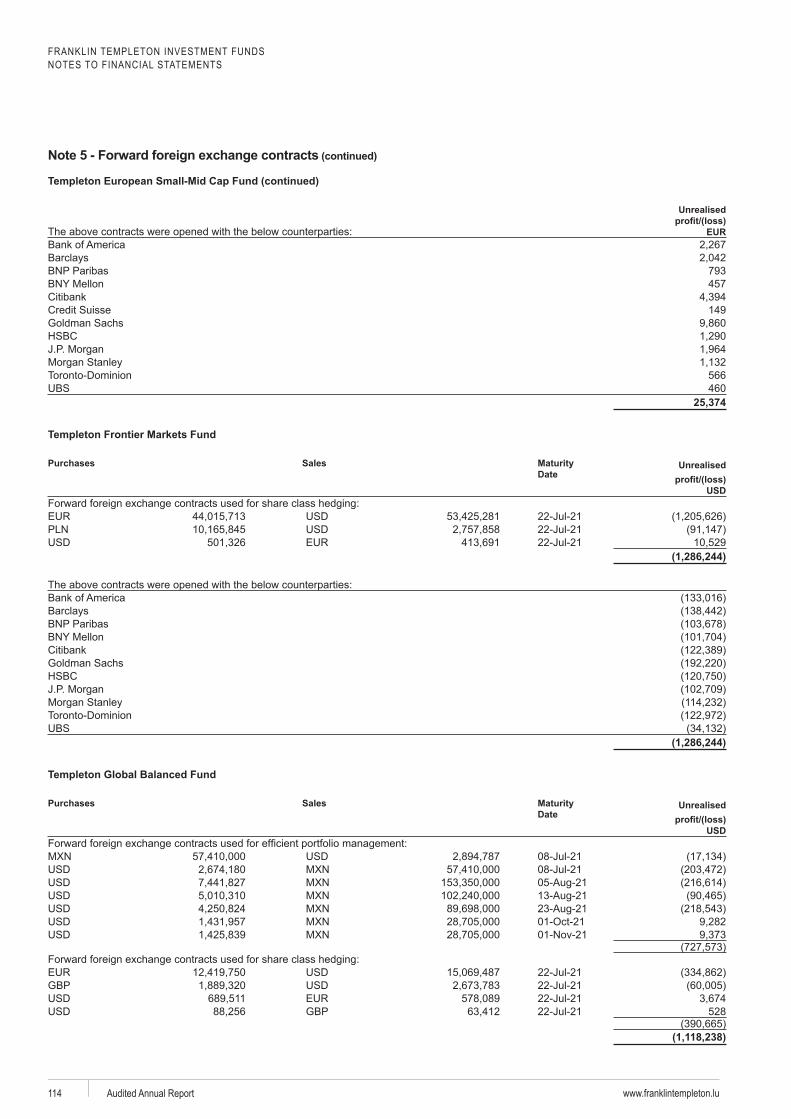
FRANKLIN TEMPLETON INVESTMENT FUNDSNOTES TO FINANCIAL STATEMENTS
www.franklintempleton.luAudited Annual Report114
Templeton European Small-Mid Cap Fund (continued)
Unrealised
EUR
Barclays 793457
149
566460
25,374
Templeton Frontier Markets Fund
Purchases Sales Date
Unrealised
USD
22-Jul-2122-Jul-2122-Jul-21
(1,286,244)
Barclays
(1,286,244)
Templeton Global Balanced Fund
Purchases Sales Date
Unrealised
USD
08-Jul-2108-Jul-21
0
22-Jul-21GBP 22-Jul-21
22-Jul-21GBP 22-Jul-21 528
(1,118,238)
(continued)
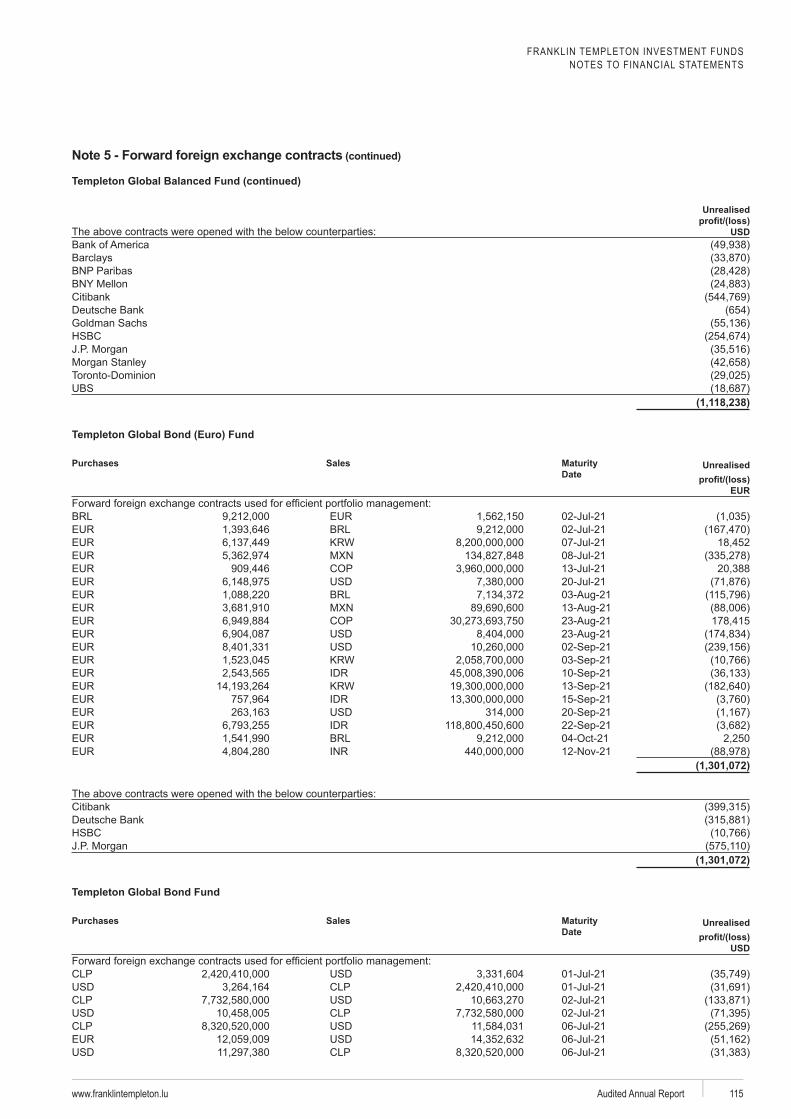
FRANKLIN TEMPLETON INVESTMENT FUNDSNOTES TO FINANCIAL STATEMENTS
www.franklintempleton.lu Audited Annual Report 115
Templeton Global Balanced Fund (continued)
Unrealised
USD
Barclays
Deutsche Bank
(1,118,238)
Templeton Global Bond (Euro) Fund
Purchases Sales Date
Unrealised
EUR
02-Jul-2102-Jul-2107-Jul-2108-Jul-2113-Jul-2120-Jul-21
(1,301,072)
Deutsche Bank
(1,301,072)
Templeton Global Bond Fund
Purchases Sales Date
Unrealised
USD
01-Jul-2101-Jul-2102-Jul-2102-Jul-2106-Jul-2106-Jul-2106-Jul-21
(continued)
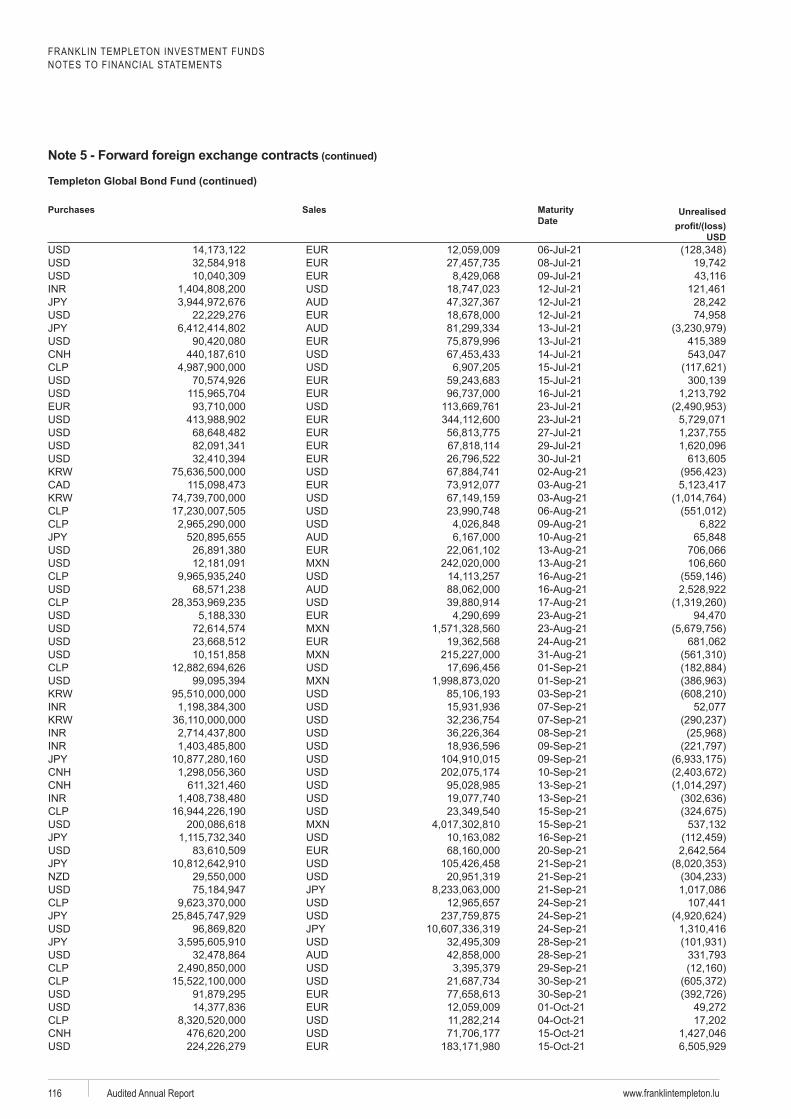
FRANKLIN TEMPLETON INVESTMENT FUNDSNOTES TO FINANCIAL STATEMENTS
www.franklintempleton.luAudited Annual Report116
Templeton Global Bond Fund (continued)
Purchases
Sales Date
Unrealised
USD06-Jul-2108-Jul-2109-Jul-2112-Jul-2112-Jul-2112-Jul-2113-Jul-2113-Jul-2114-Jul-2115-Jul-2115-Jul-2116-Jul-2123-Jul-2123-Jul-2127-Jul-2129-Jul-2130-Jul-21
(continued)
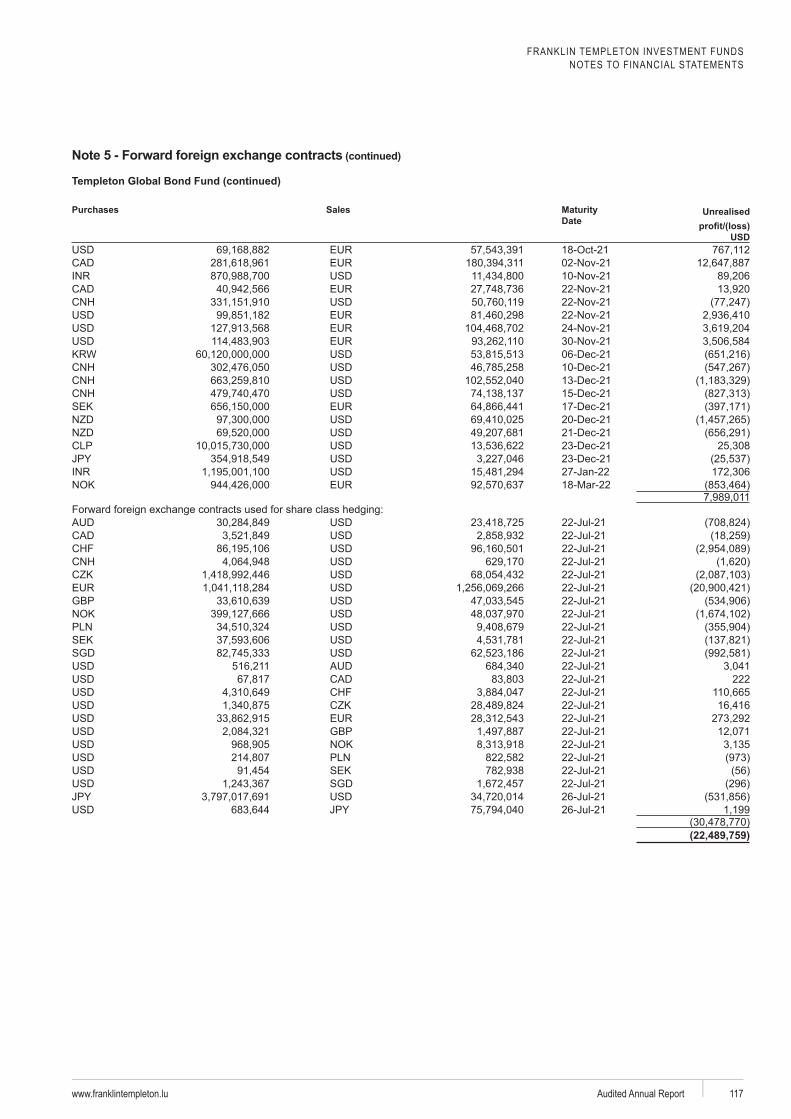
FRANKLIN TEMPLETON INVESTMENT FUNDSNOTES TO FINANCIAL STATEMENTS
www.franklintempleton.lu Audited Annual Report 117
Templeton Global Bond Fund (continued)
Purchases
Sales Date
Unrealised
USD
06-Dec-2110-Dec-2113-Dec-2115-Dec-21
SEK 17-Dec-2120-Dec-2121-Dec-2123-Dec-2123-Dec-2127-Jan-22
0
22-Jul-2122-Jul-2122-Jul-2122-Jul-2122-Jul-2122-Jul-21
GBP 22-Jul-2122-Jul-2122-Jul-21
SEK 22-Jul-21SGD 22-Jul-21
22-Jul-2122-Jul-21 22222-Jul-2122-Jul-2122-Jul-21
GBP 22-Jul-2122-Jul-2122-Jul-21
SEK 22-Jul-21SGD 22-Jul-21
26-Jul-2126-Jul-21
(22,489,759)
(continued)
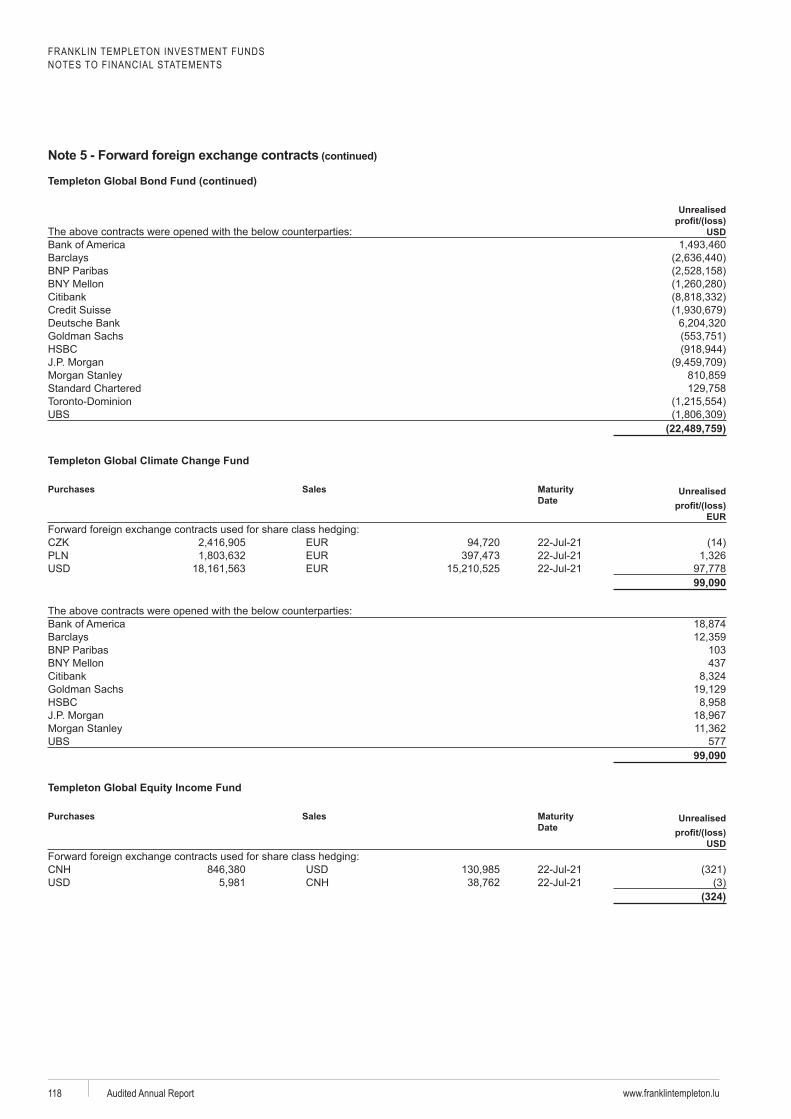
FRANKLIN TEMPLETON INVESTMENT FUNDSNOTES TO FINANCIAL STATEMENTS
www.franklintempleton.luAudited Annual Report118
Templeton Global Bond Fund (continued)
Unrealised
USD
Barclays
Deutsche Bank
(22,489,759)
Templeton Global Climate Change Fund
Purchases Sales Date
Unrealised
EUR
22-Jul-2122-Jul-2122-Jul-21
99,090
Barclays 103437
57799,090
Purchases Sales Date
Unrealised
USD
22-Jul-2122-Jul-21
(324)
(continued)
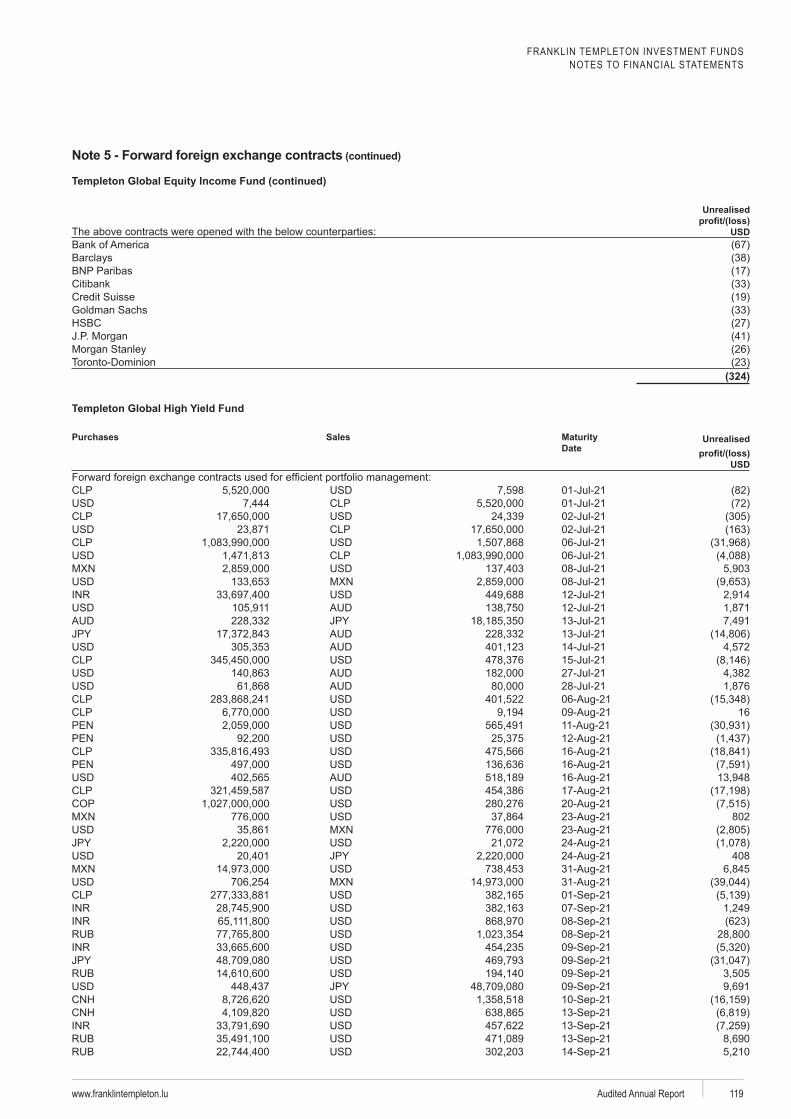
FRANKLIN TEMPLETON INVESTMENT FUNDSNOTES TO FINANCIAL STATEMENTS
www.franklintempleton.lu Audited Annual Report 119
Unrealised
USD
Barclays
(324)
Templeton Global High Yield Fund
Purchases Sales Date
Unrealised
USD
01-Jul-2101-Jul-2102-Jul-2102-Jul-2106-Jul-2106-Jul-2108-Jul-2108-Jul-2112-Jul-2112-Jul-2113-Jul-2113-Jul-2114-Jul-2115-Jul-2127-Jul-2128-Jul-21
16
802
408
(continued)
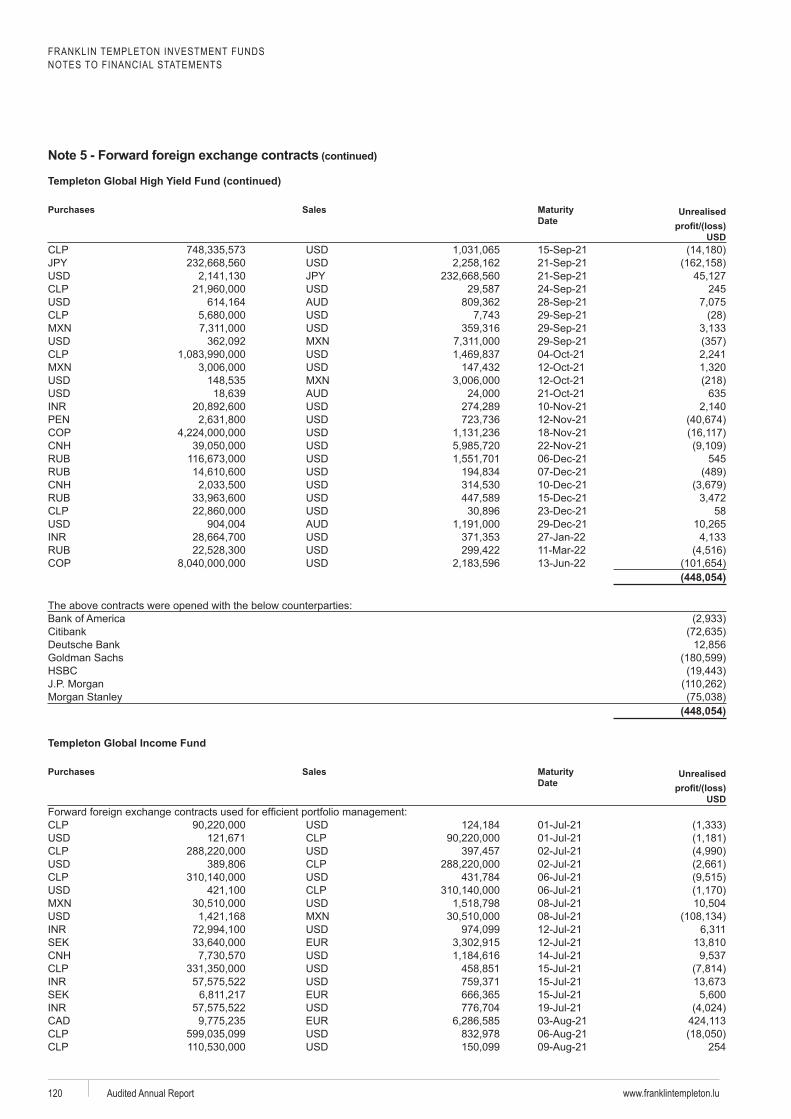
FRANKLIN TEMPLETON INVESTMENT FUNDSNOTES TO FINANCIAL STATEMENTS
www.franklintempleton.luAudited Annual Report120
Templeton Global High Yield Fund (continued)
Purchases
Sales Date
Unrealised
USD
245
635
06-Dec-21 54507-Dec-2110-Dec-2115-Dec-2123-Dec-21 5829-Dec-2127-Jan-22
13-Jun-22(448,054)
Deutsche Bank
(448,054)
Templeton Global Income Fund
Purchases Sales Date
Unrealised
USD
01-Jul-2101-Jul-2102-Jul-2102-Jul-2106-Jul-2106-Jul-2108-Jul-2108-Jul-2112-Jul-21
SEK 12-Jul-2114-Jul-2115-Jul-2115-Jul-21
SEK 15-Jul-2119-Jul-21
254
(continued)
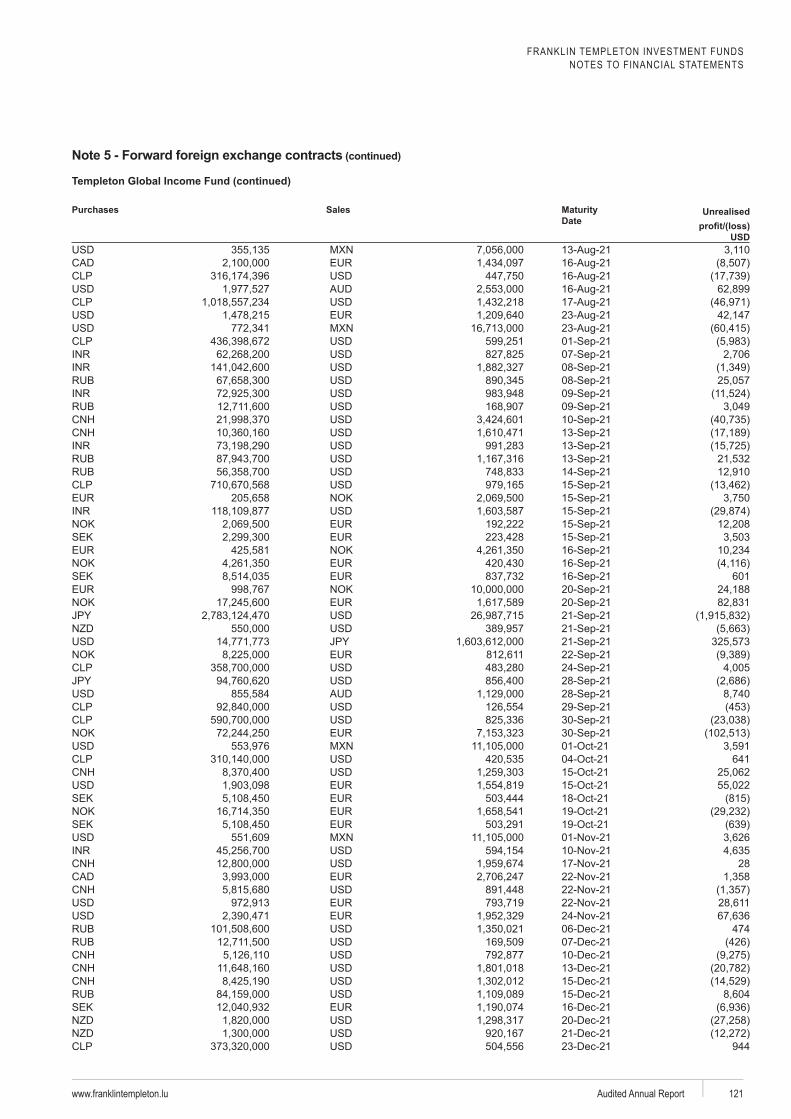
FRANKLIN TEMPLETON INVESTMENT FUNDSNOTES TO FINANCIAL STATEMENTS
www.franklintempleton.lu Audited Annual Report 121
Templeton Global Income Fund (continued)
Purchases
Sales Date
Unrealised
USD
SEK
SEK 601
641
SEK
SEK
28
06-Dec-21 47407-Dec-2110-Dec-2113-Dec-2115-Dec-2115-Dec-21
SEK 16-Dec-2120-Dec-2121-Dec-2123-Dec-21 944
(continued)
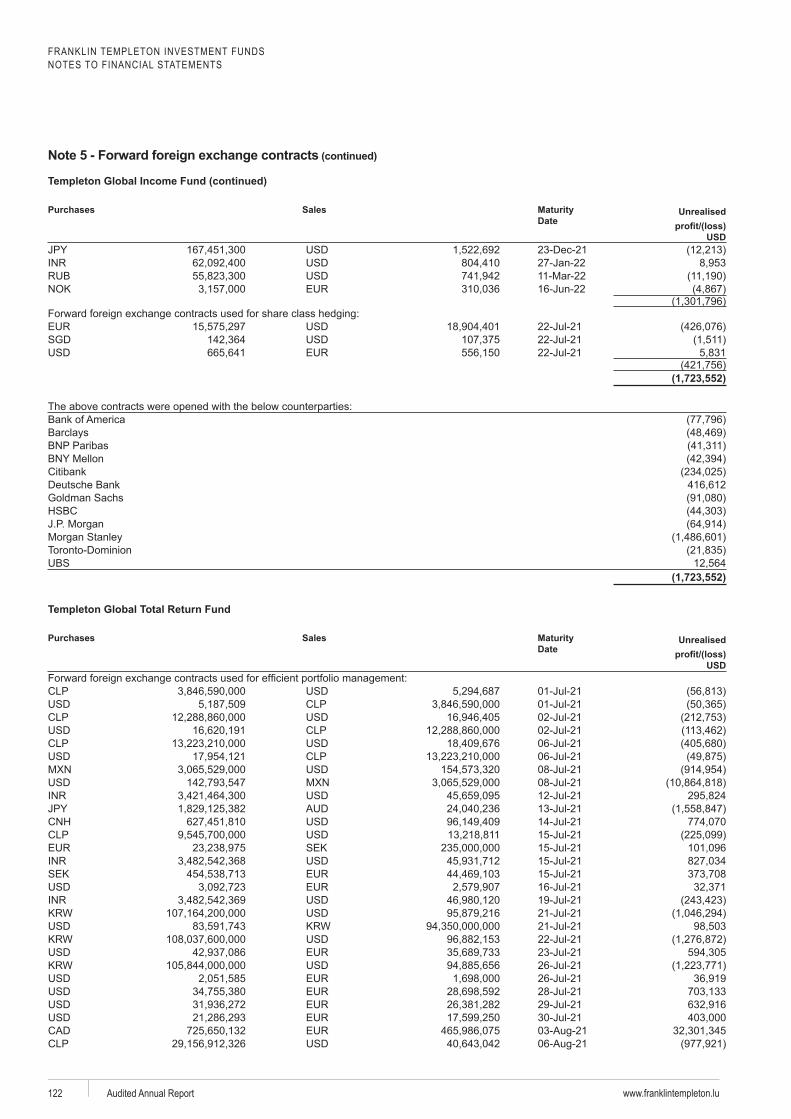
FRANKLIN TEMPLETON INVESTMENT FUNDSNOTES TO FINANCIAL STATEMENTS
www.franklintempleton.luAudited Annual Report122
Templeton Global Income Fund (continued)
Purchases
Sales Date
Unrealised
USD23-Dec-2127-Jan-22
16-Jun-220
22-Jul-21SGD 22-Jul-21
22-Jul-21
(1,723,552)
Barclays
Deutsche Bank
(1,723,552)
Templeton Global Total Return Fund
Purchases Sales Date
Unrealised
USD
01-Jul-2101-Jul-2102-Jul-2102-Jul-2106-Jul-2106-Jul-2108-Jul-2108-Jul-2112-Jul-2113-Jul-2114-Jul-2115-Jul-21
SEK 15-Jul-2115-Jul-21
SEK 15-Jul-2116-Jul-2119-Jul-2121-Jul-2121-Jul-2122-Jul-2123-Jul-2126-Jul-2126-Jul-2128-Jul-2129-Jul-2130-Jul-21
(continued)
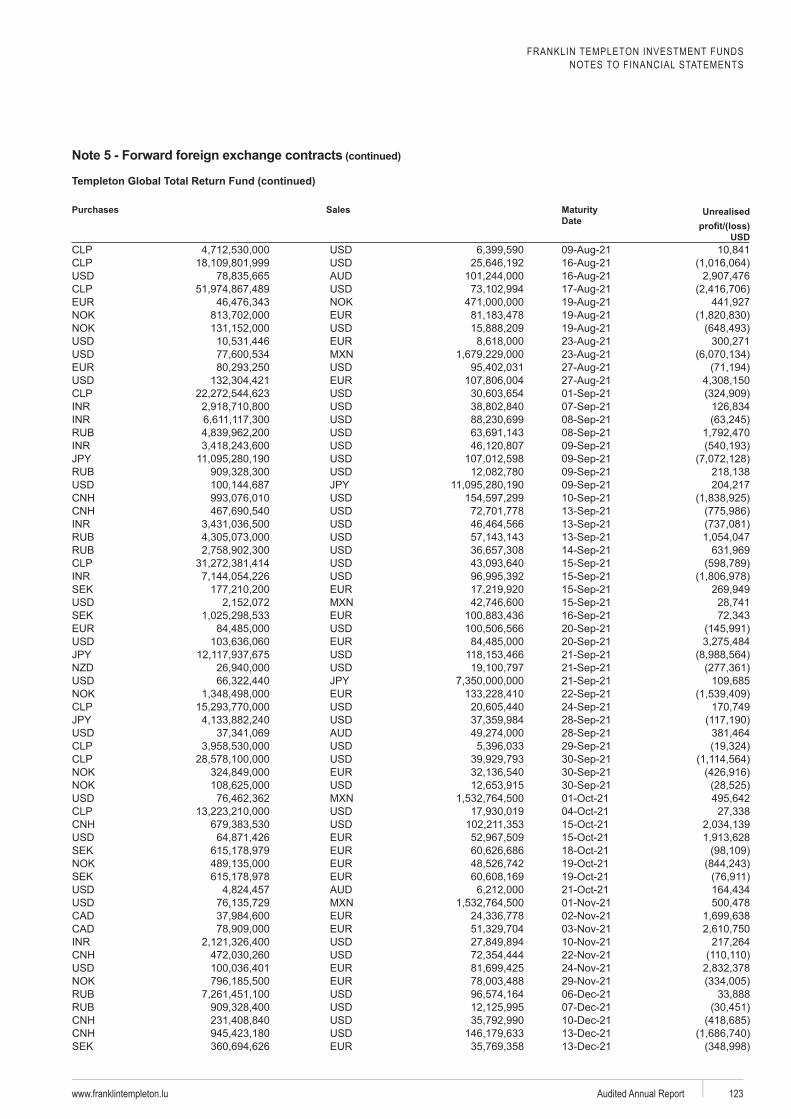
FRANKLIN TEMPLETON INVESTMENT FUNDSNOTES TO FINANCIAL STATEMENTS
www.franklintempleton.lu Audited Annual Report 123
Templeton Global Total Return Fund (continued)
Purchases
Sales Date
Unrealised
USD
SEK
SEK
SEK
SEK
06-Dec-2107-Dec-2110-Dec-2113-Dec-21
SEK 13-Dec-21
(continued)
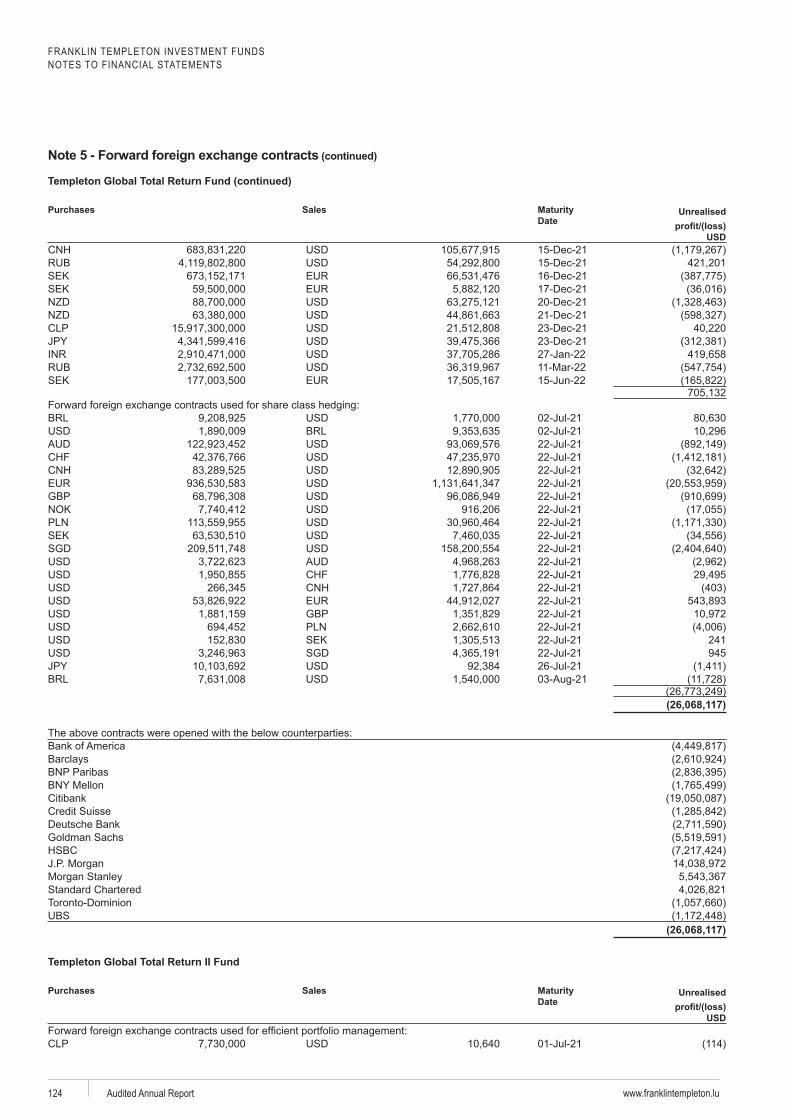
FRANKLIN TEMPLETON INVESTMENT FUNDSNOTES TO FINANCIAL STATEMENTS
www.franklintempleton.luAudited Annual Report124
Templeton Global Total Return Fund (continued)
Purchases
Sales Date
Unrealised
USD15-Dec-2115-Dec-21
SEK 16-Dec-21SEK 17-Dec-21
20-Dec-2121-Dec-2123-Dec-2123-Dec-2127-Jan-22
SEK 15-Jun-220
02-Jul-2102-Jul-2122-Jul-2122-Jul-2122-Jul-2122-Jul-21
GBP 22-Jul-2122-Jul-2122-Jul-21
SEK 22-Jul-21SGD 22-Jul-21
22-Jul-2122-Jul-2122-Jul-2122-Jul-21
GBP 22-Jul-2122-Jul-21
SEK 22-Jul-21 241SGD 22-Jul-21 945
26-Jul-21
(26,068,117)
Barclays
Deutsche Bank
(26,068,117)
Templeton Global Total Return II Fund
Purchases Sales Date
Unrealised
USD
01-Jul-21
(continued)
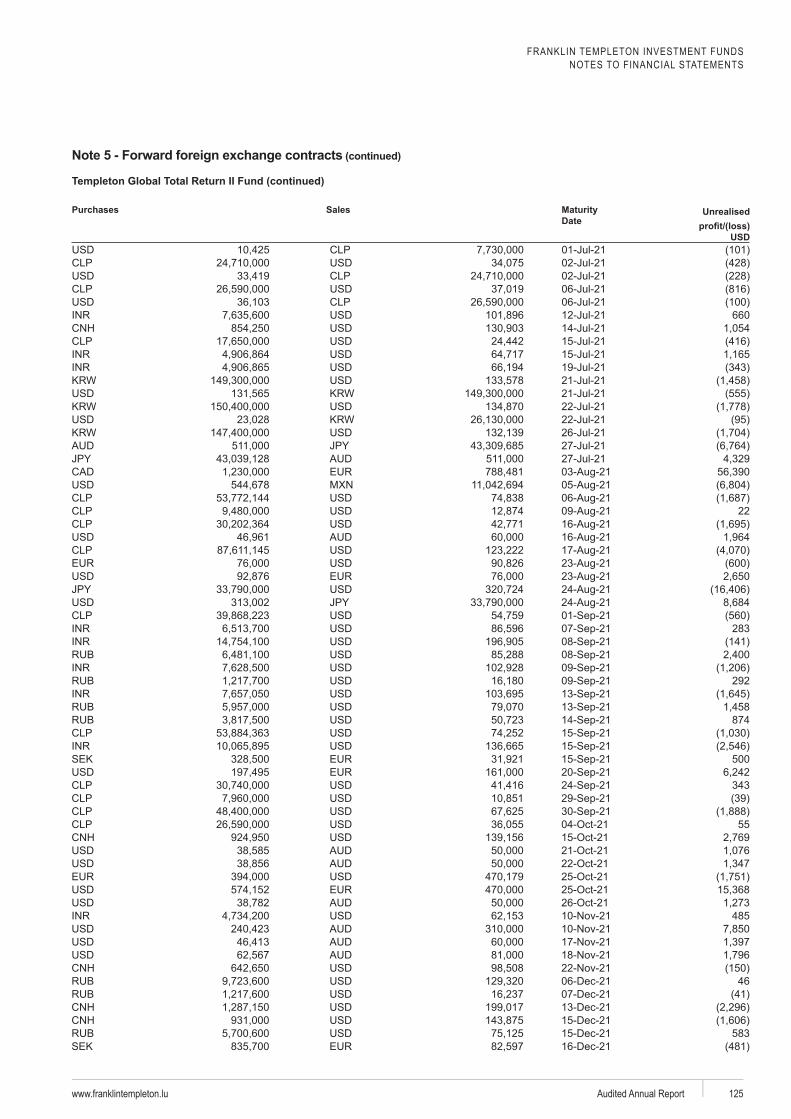
FRANKLIN TEMPLETON INVESTMENT FUNDSNOTES TO FINANCIAL STATEMENTS
www.franklintempleton.lu Audited Annual Report 125
Templeton Global Total Return II Fund (continued)
Purchases
Sales Date
Unrealised
USD01-Jul-2102-Jul-2102-Jul-2106-Jul-2106-Jul-2112-Jul-21 66014-Jul-2115-Jul-2115-Jul-2119-Jul-2121-Jul-2121-Jul-2122-Jul-2122-Jul-2126-Jul-2127-Jul-2127-Jul-21
22
283
292
874
SEK 500
343
55
485
06-Dec-21 4607-Dec-2113-Dec-2115-Dec-2115-Dec-21 583
SEK 16-Dec-21
(continued)
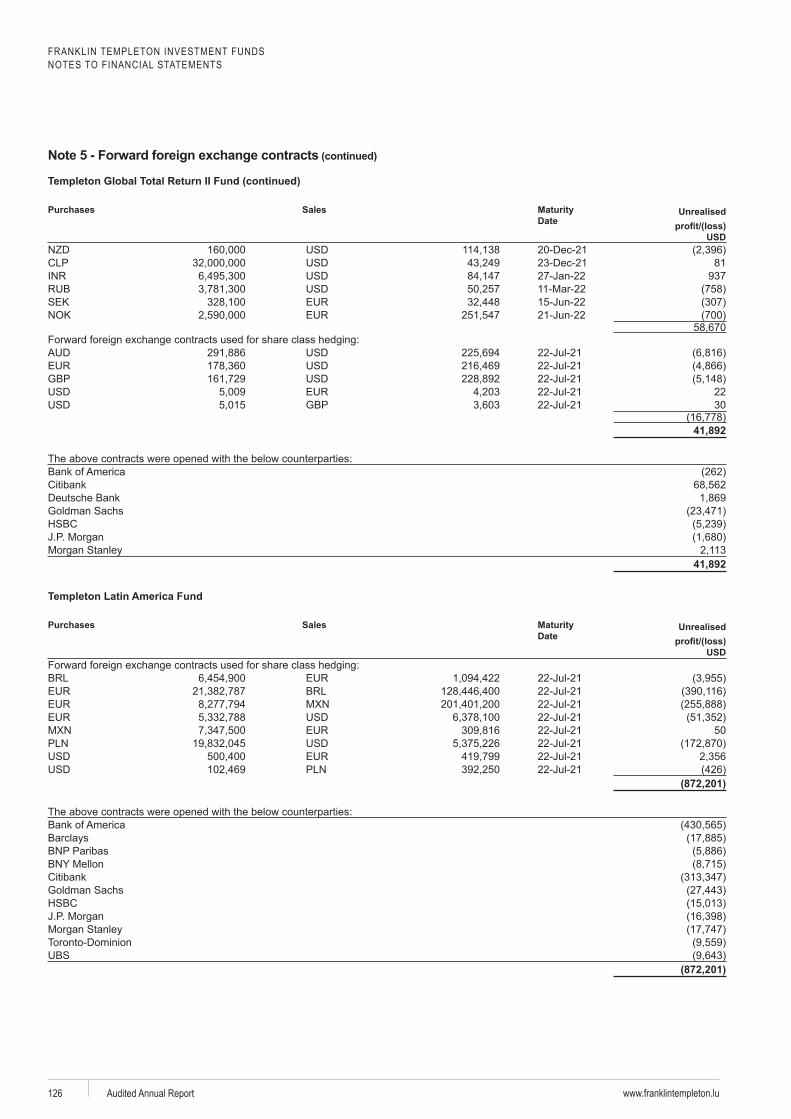
FRANKLIN TEMPLETON INVESTMENT FUNDSNOTES TO FINANCIAL STATEMENTS
www.franklintempleton.luAudited Annual Report126
Templeton Global Total Return II Fund (continued)
Purchases
Sales Date
Unrealised
USD20-Dec-2123-Dec-21 8127-Jan-22 937
SEK 15-Jun-2221-Jun-22
0
22-Jul-2122-Jul-21
GBP 22-Jul-2122-Jul-21 22
GBP 22-Jul-21 30
41,892
Deutsche Bank
41,892
Templeton Latin America Fund
Purchases Sales Date
Unrealised
USD
22-Jul-2122-Jul-2122-Jul-2122-Jul-2122-Jul-21 5022-Jul-2122-Jul-2122-Jul-21
(872,201)
Barclays
(872,201)
(continued)
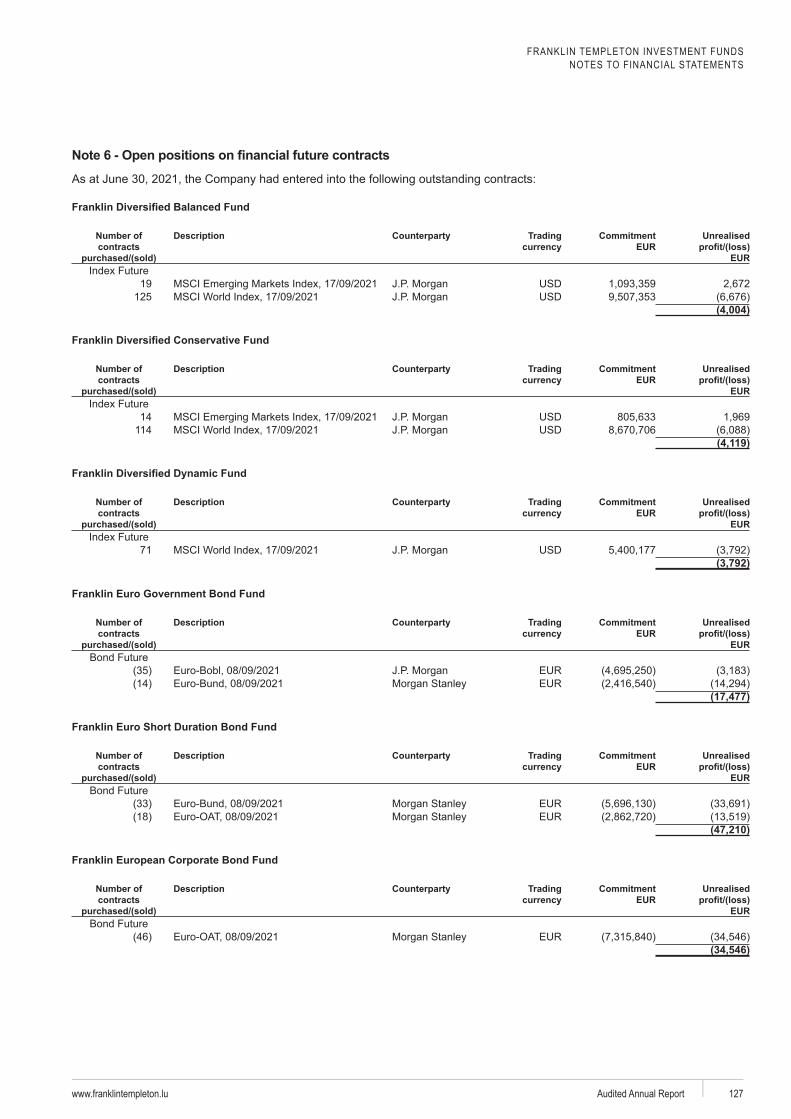
FRANKLIN TEMPLETON INVESTMENT FUNDSNOTES TO FINANCIAL STATEMENTS
www.franklintempleton.lu Audited Annual Report 127
Number of contracts
purchased/(sold)
Description Trading Commitment EUR
Unrealised
EUR
19 125
(4,004)
Number of contracts
purchased/(sold)
Description Trading Commitment EUR
Unrealised
EUR
14 114
(4,119)
Number of contracts
purchased/(sold)
Description Trading Commitment EUR
Unrealised
EUR
71(3,792)
Franklin Euro Government Bond Fund
Number of contracts
purchased/(sold)
Description Trading Commitment EUR
Unrealised
EURBond Future
Euro-
(17,477)
Franklin Euro Short Duration Bond Fund
Number of contracts
purchased/(sold)
Description Trading Commitment EUR
Unrealised
EURBond Future
(47,210)
Franklin European Corporate Bond Fund
Number of contracts
purchased/(sold)
Description Trading Commitment EUR
Unrealised
EURBond Future
(34,546)
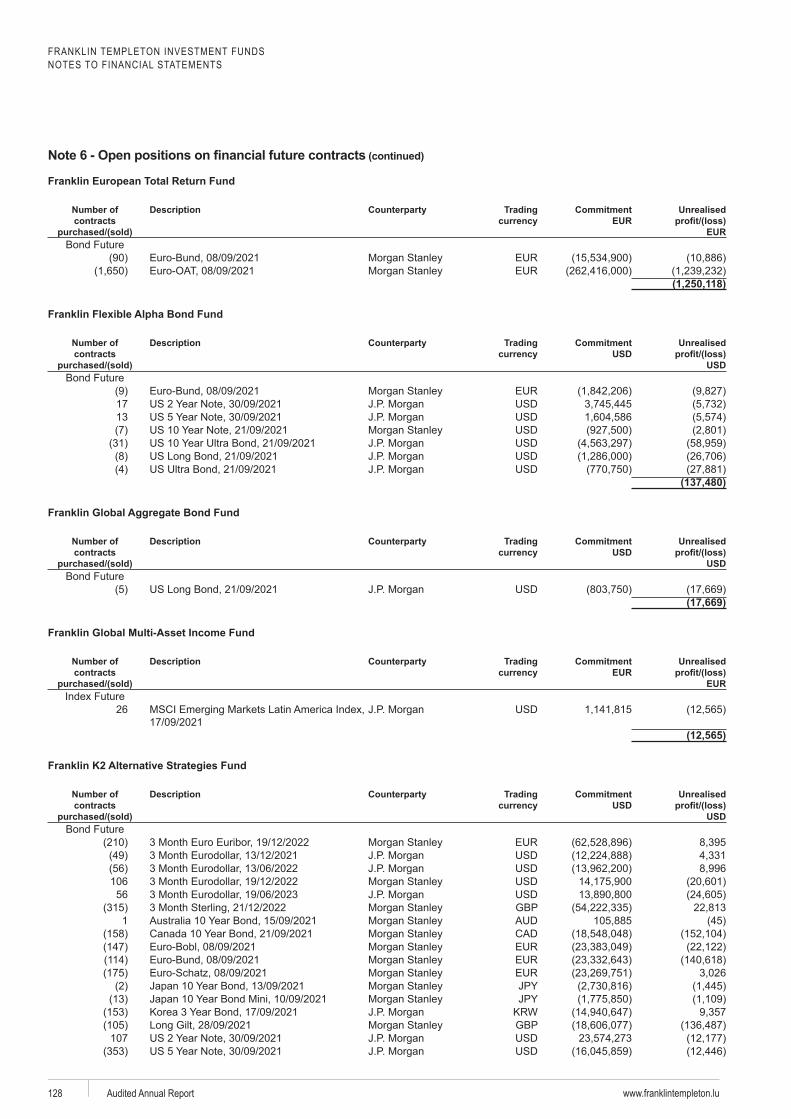
FRANKLIN TEMPLETON INVESTMENT FUNDSNOTES TO FINANCIAL STATEMENTS
www.franklintempleton.luAudited Annual Report128
Franklin European Total Return Fund
Number of contracts
purchased/(sold)
Description Trading Commitment EUR
Unrealised
EURBond Future
(1,250,118)
Franklin Flexible Alpha Bond Fund
Number of contracts
purchased/(sold)
Description Trading Commitment USD
Unrealised
USDBond Future
17 13
(137,480)
Franklin Global Aggregate Bond Fund
Number of contracts
purchased/(sold)
Description Trading Commitment USD
Unrealised
USDBond Future
(17,669)
Franklin Global Multi-Asset Income Fund
Number of contracts
purchased/(sold)
Description Trading Commitment EUR
Unrealised
EUR
26
(12,565)
Number of contracts
purchased/(sold)
Description Trading Commitment USD
Unrealised
USDBond Future
106 56 GBP 1 Euro- GBP 107
(continued)
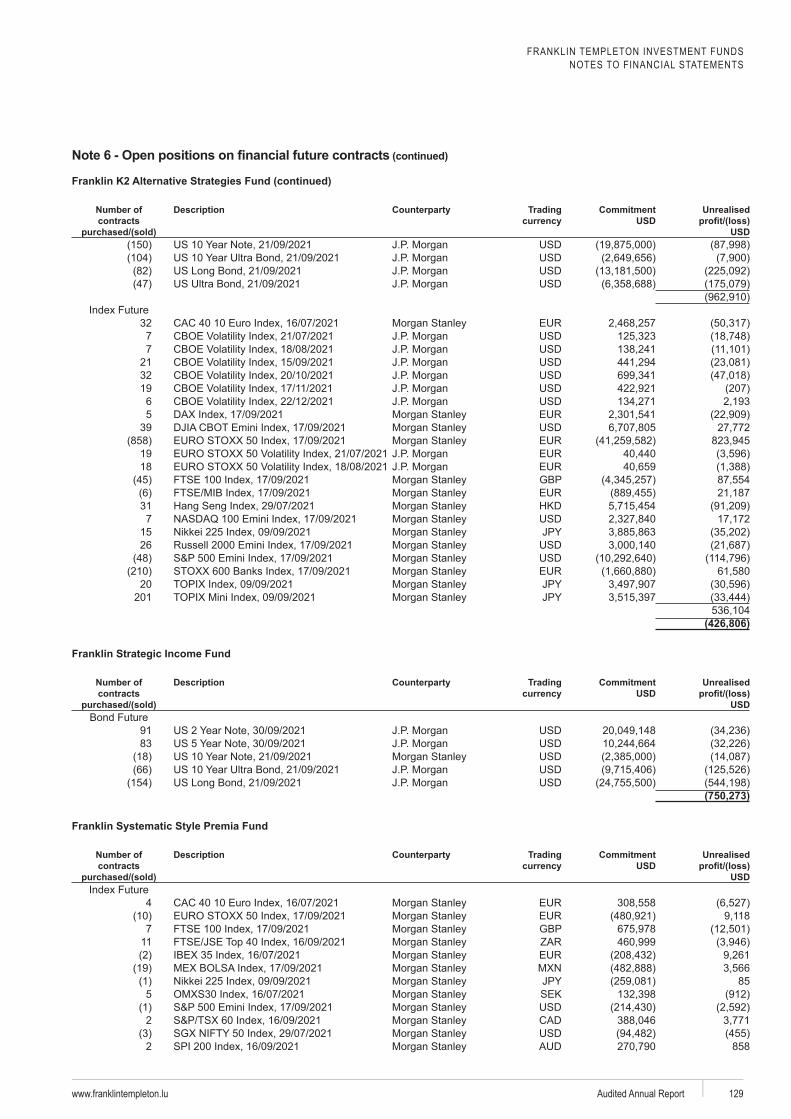
FRANKLIN TEMPLETON INVESTMENT FUNDSNOTES TO FINANCIAL STATEMENTS
www.franklintempleton.lu Audited Annual Report 129
Number of contracts
purchased/(sold)
Description Trading Commitment USD
Unrealised
USD
32 7 7 21 32 19 6 5 39 19 18 GBP 31 7 15 26 20 201
(426,806)
Franklin Strategic Income Fund
Number of contracts
purchased/(sold)
Description Trading Commitment USD
Unrealised
USDBond Future
91 83
(750,273)
Premia Fund
Number of contracts
purchased/(sold)
Description Trading Commitment USD
Unrealised
USD
4 7 GBP 11 85 5 SEK 2 2 858
(continued)
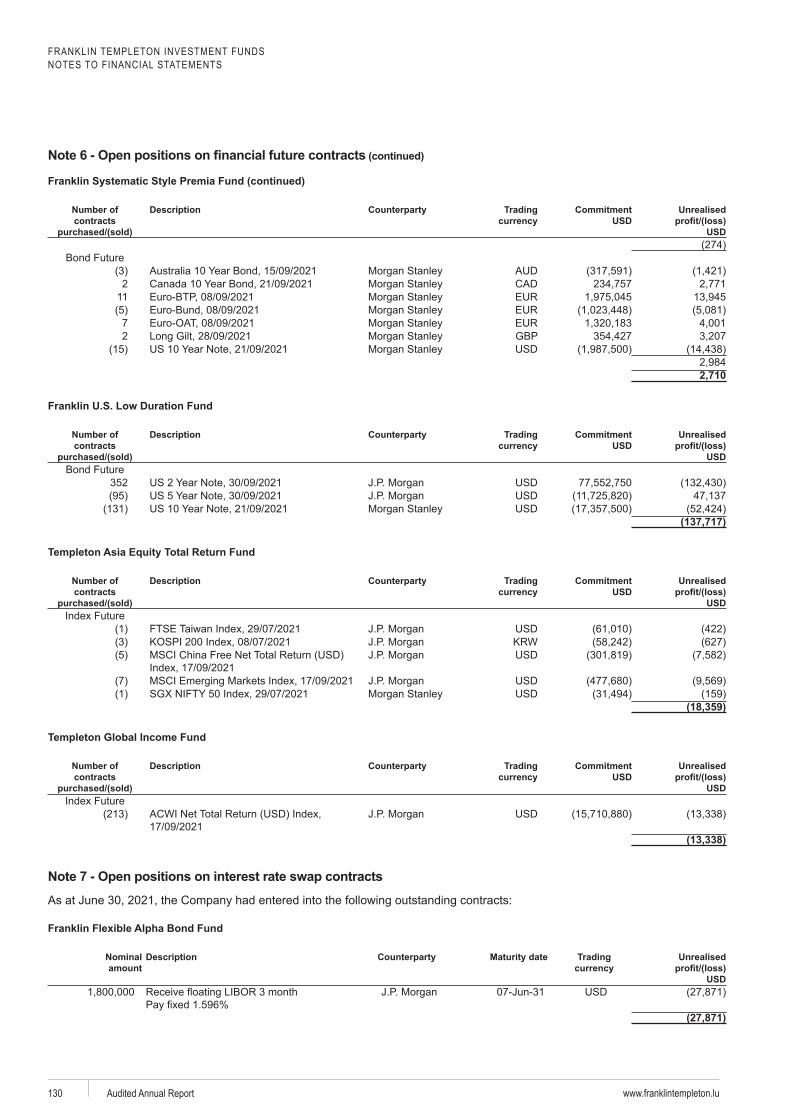
FRANKLIN TEMPLETON INVESTMENT FUNDSNOTES TO FINANCIAL STATEMENTS
www.franklintempleton.luAudited Annual Report130
Number of contracts
purchased/(sold)
Description Trading Commitment USD
Unrealised
USD
Bond Future 2 11 7 2 GBP
2,710
Number of contracts
purchased/(sold)
Description Trading Commitment USD
Unrealised
USDBond Future
352
(137,717)
Number of contracts
purchased/(sold)
Description Trading Commitment USD
Unrealised
USD
(18,359)
Templeton Global Income Fund
Number of contracts
purchased/(sold)
Description Trading Commitment USD
Unrealised
USD
(13,338)
Franklin Flexible Alpha Bond Fund
Nominal amount
Description date Trading c
Unrealised /(loss)
USD 07-Jun-31
(27,871)
(continued)
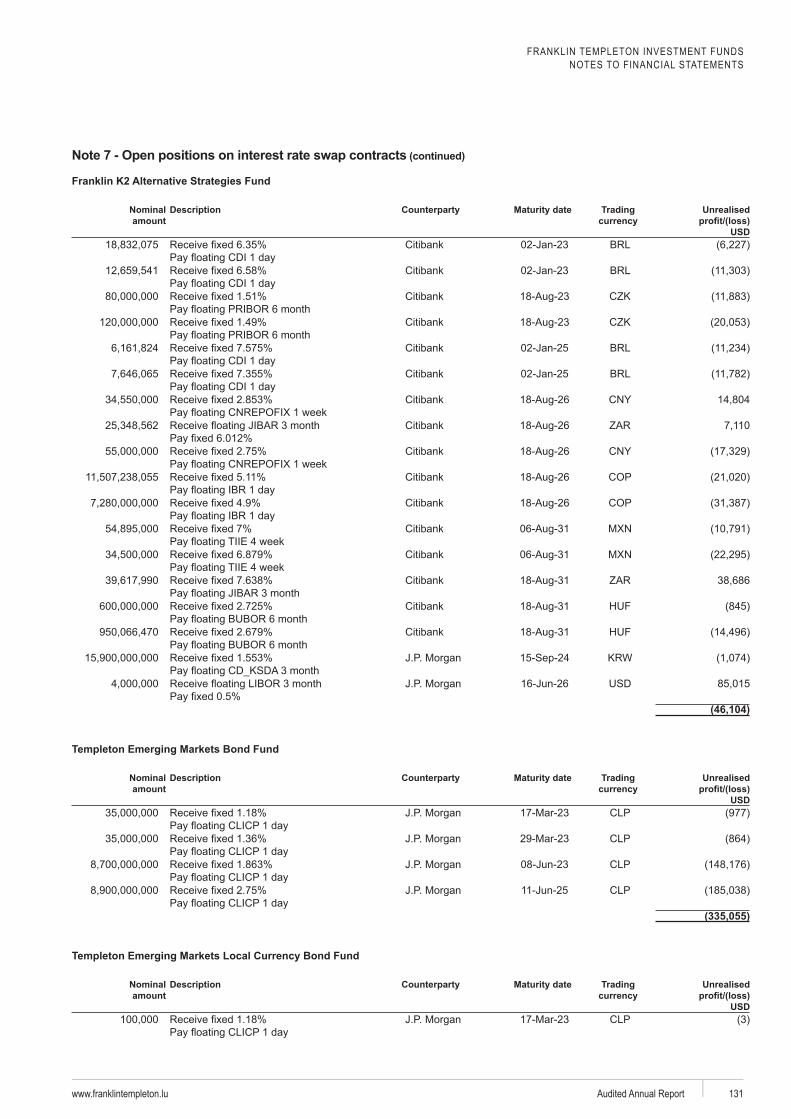
FRANKLIN TEMPLETON INVESTMENT FUNDSNOTES TO FINANCIAL STATEMENTS
www.franklintempleton.lu Audited Annual Report 131
Nominal amount
Description date Trading c
Unrealised /(loss)
USD 02-Jan-23
02-Jan-23
02-Jan-25
02-Jan-25
16-Jun-26
(46,104)
Templeton Emerging Markets Bond Fund
Nominal amount
Description date Trading c
Unrealised /(loss)
USD
08-Jun-23
11-Jun-25
(335,055)
Nominal amount
Description date Trading c
Unrealised /(loss)
USD
(continued)
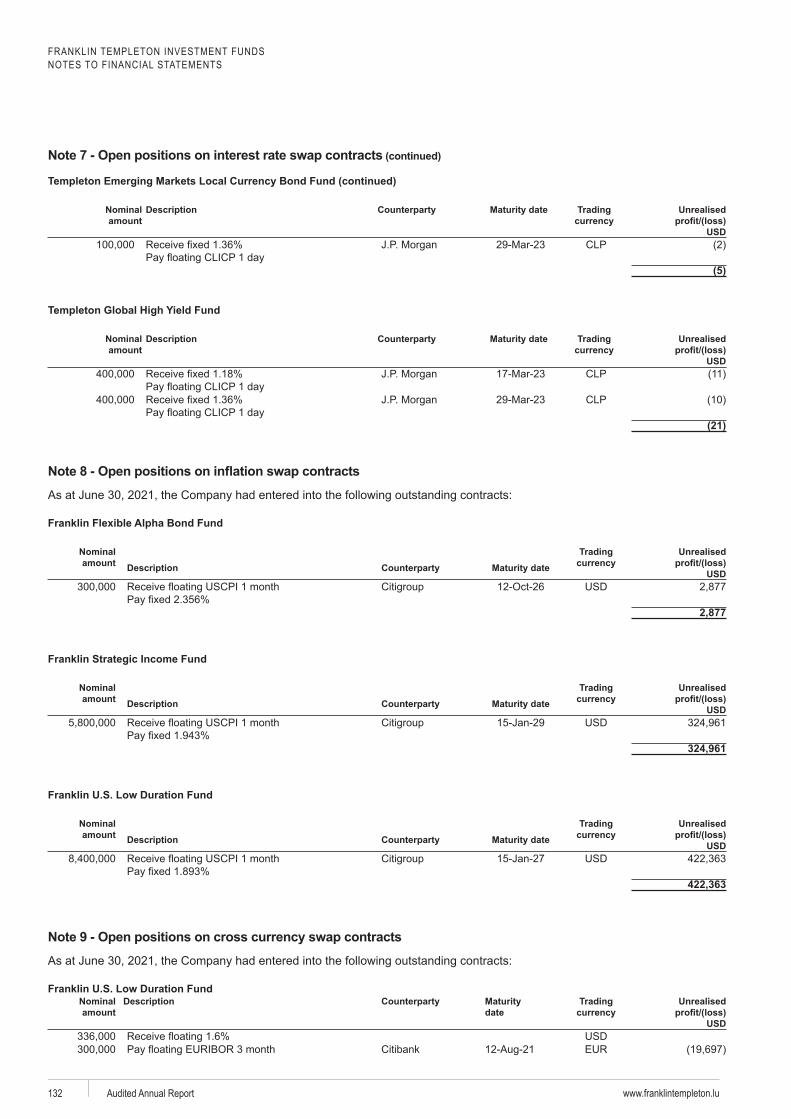
FRANKLIN TEMPLETON INVESTMENT FUNDSNOTES TO FINANCIAL STATEMENTS
www.franklintempleton.luAudited Annual Report132
Nominal amount
Description Trading Unrealised
USD
(5)
Templeton Global High Yield Fund
Nominal amount
Description date Trading c
Unrealised /(loss)
USD
(21)
Franklin Flexible Alpha Bond Fund
Nominal amount Description date
Trading Unrealised
USD
Net Unrealised 2,877
Franklin Strategic Income Fund
Nominal amount Description date
Trading Unrealised
USD 15-Jan-29
Net Unrealised 324,961
Nominal amount Description date
Trading Unrealised
USD 15-Jan-27
Net Unrealised 422,363
Nominal amount
Description date
Trading Unrealised
USD
(continued)
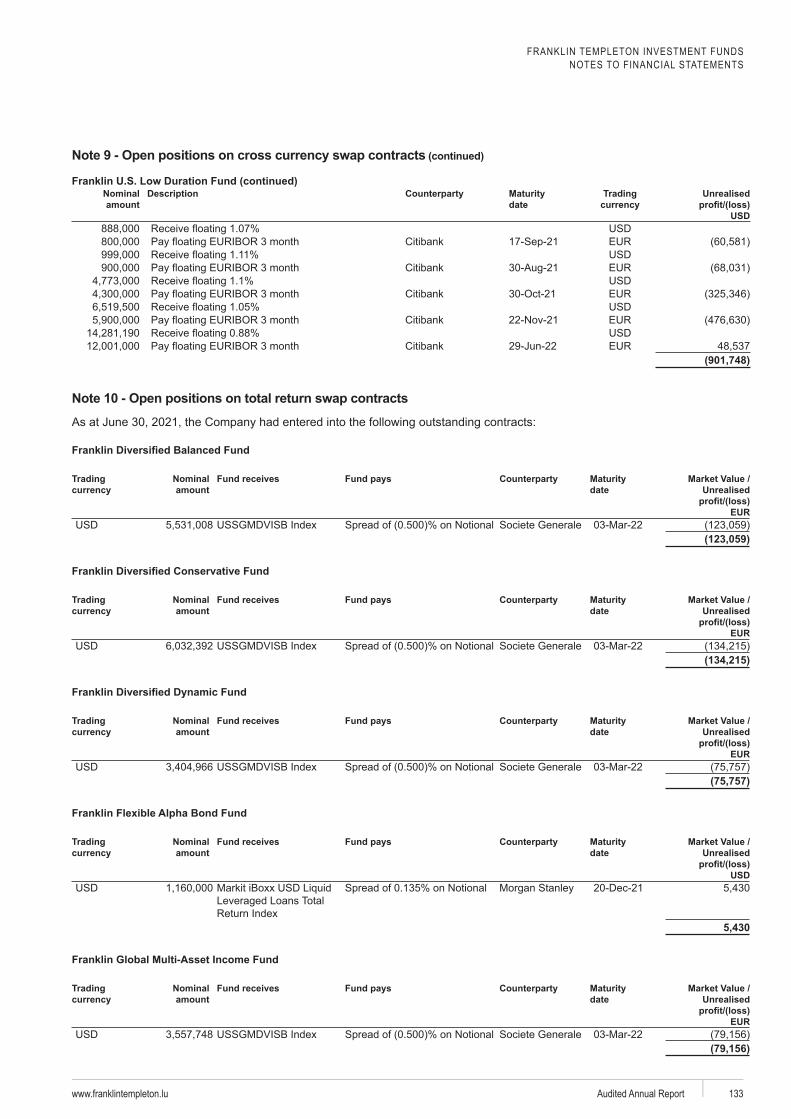
FRANKLIN TEMPLETON INVESTMENT FUNDSNOTES TO FINANCIAL STATEMENTS
www.franklintempleton.lu Audited Annual Report 133
Nominal amount
Description date
Trading Unrealised
USD
29-Jun-22(901,748)
Trading Nominal amount
Fund receives date
Market Value / Unrealised
EUR
Societe Generale (123,059)
Trading Nominal amount
Fund receives date
Market Value / Unrealised
EUR
Societe Generale (134,215)
Trading Nominal amount
Fund receives date
Market Value / Unrealised
EUR
Societe Generale (75,757)
Franklin Flexible Alpha Bond Fund
Trading Nominal amount
Fund receives date
Market Value / Unrealised
USD
iBoxx 20-Dec-21
5,430
Franklin Global Multi-Asset Income Fund
Trading Nominal amount
Fund receives date
Market Value / Unrealised
EUR
Societe Generale (79,156)
(continued)
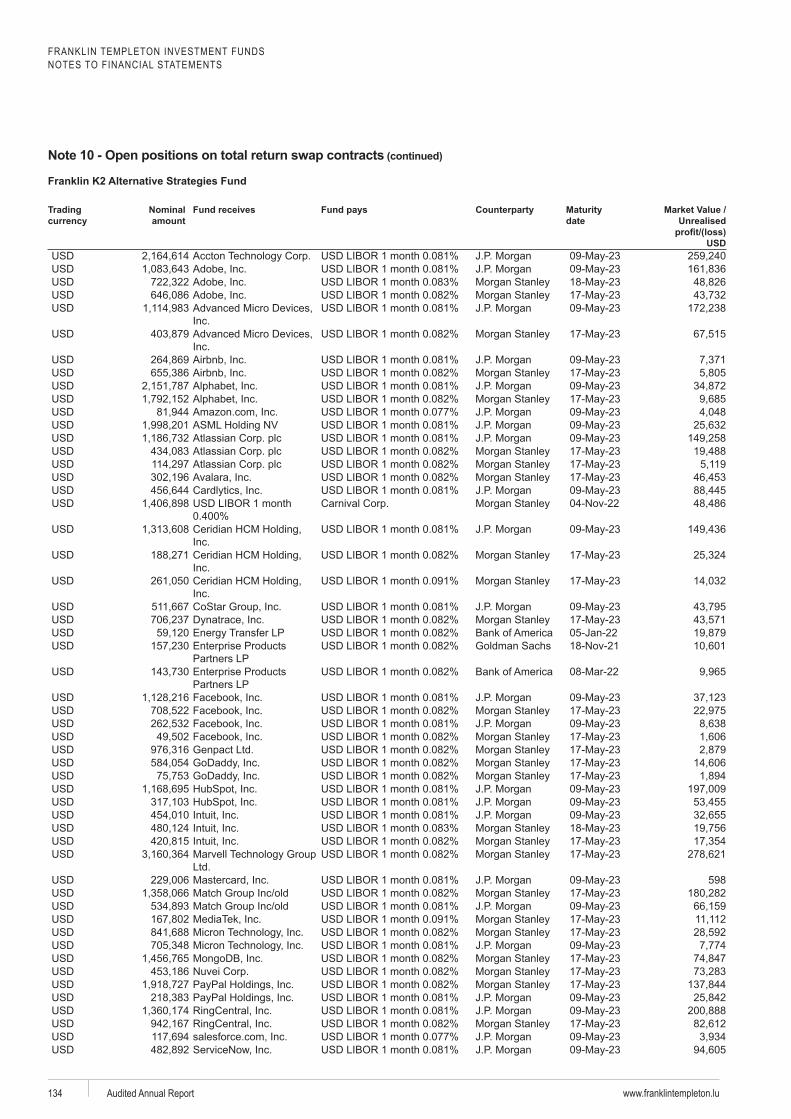
FRANKLIN TEMPLETON INVESTMENT FUNDSNOTES TO FINANCIAL STATEMENTS
www.franklintempleton.luAudited Annual Report134
Trading Nominal amount
Fund receives date
Market Value / Unrealised
USD
Dynatrace05-Jan-22
GoDaddyGoDaddy
598
(continued)
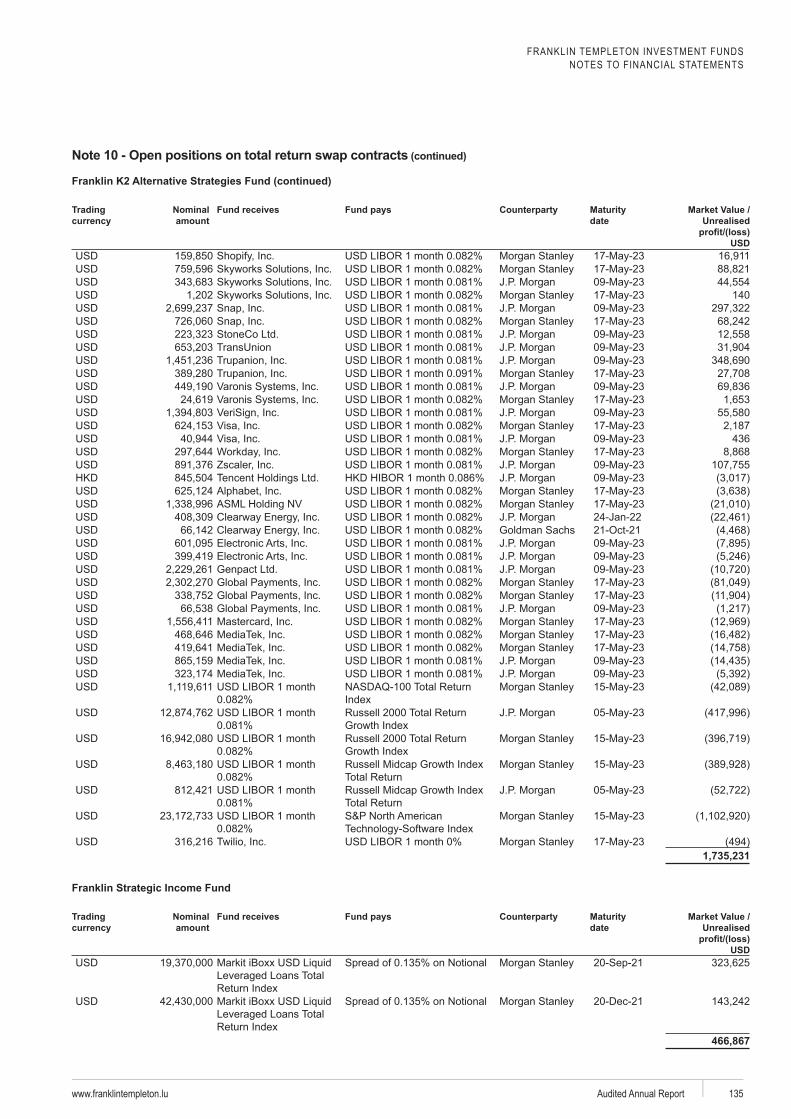
FRANKLIN TEMPLETON INVESTMENT FUNDSNOTES TO FINANCIAL STATEMENTS
www.franklintempleton.lu Audited Annual Report 135
Trading Nominal
amountFund receives
dateMarket Value /
Unrealised
USD
140
436
ZscalerTencent
24-Jan-22
1,735,231
Franklin Strategic Income Fund
Trading Nominal amount
Fund receives date
Market Value / Unrealised
USD
iBoxx
iBoxx 20-Dec-21
466,867
(continued)
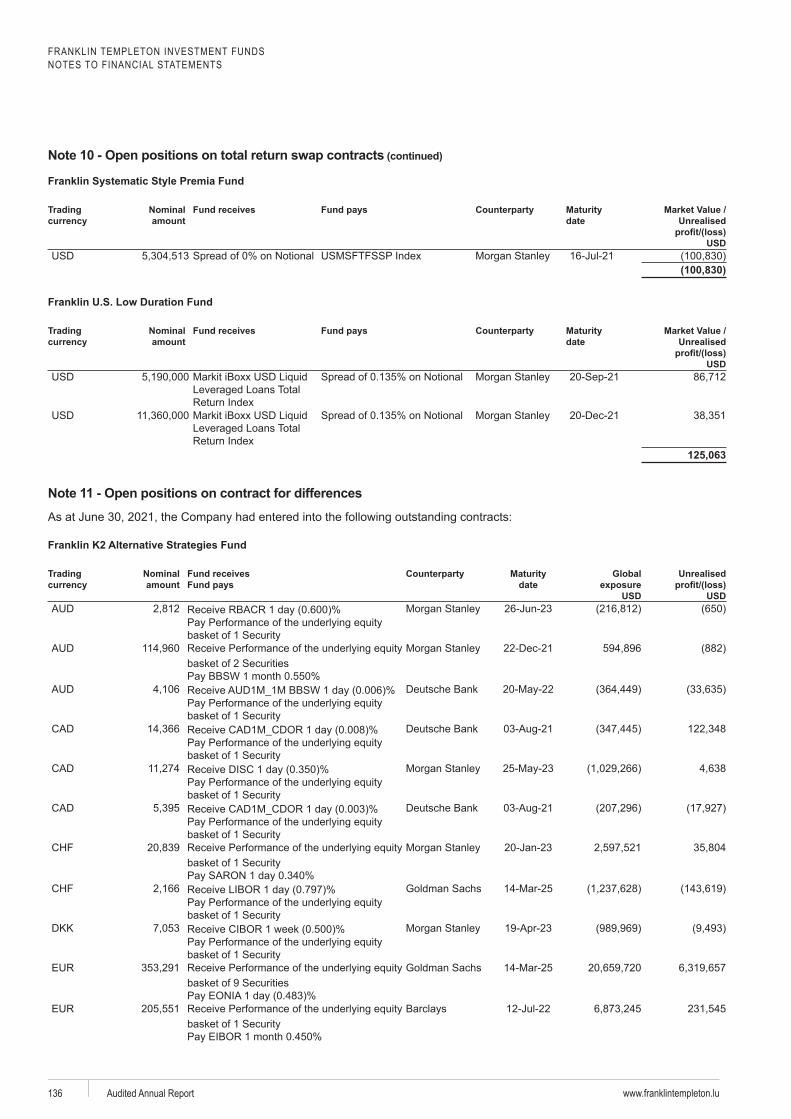
FRANKLIN TEMPLETON INVESTMENT FUNDSNOTES TO FINANCIAL STATEMENTS
www.franklintempleton.luAudited Annual Report136
Premia Fund
Trading Nominal amount
Fund receives date
Market Value / Unrealised
USD
16-Jul-21(100,830)
Trading Nominal amount
Fund receives date
Market Value / Unrealised
USD
iBoxx
iBoxx 20-Dec-21
125,063
Note 11 - Open positions on contract for differences
Trading Nominal amount
Fund receives date
Global exposure
USD
Unrealised
USD 26-Jun-23
22-Dec-21
Deutsche Bank
Deutsche Bank
Deutsche Bank
20-Jan-23
DKK
Barclays 12-Jul-22
(continued)
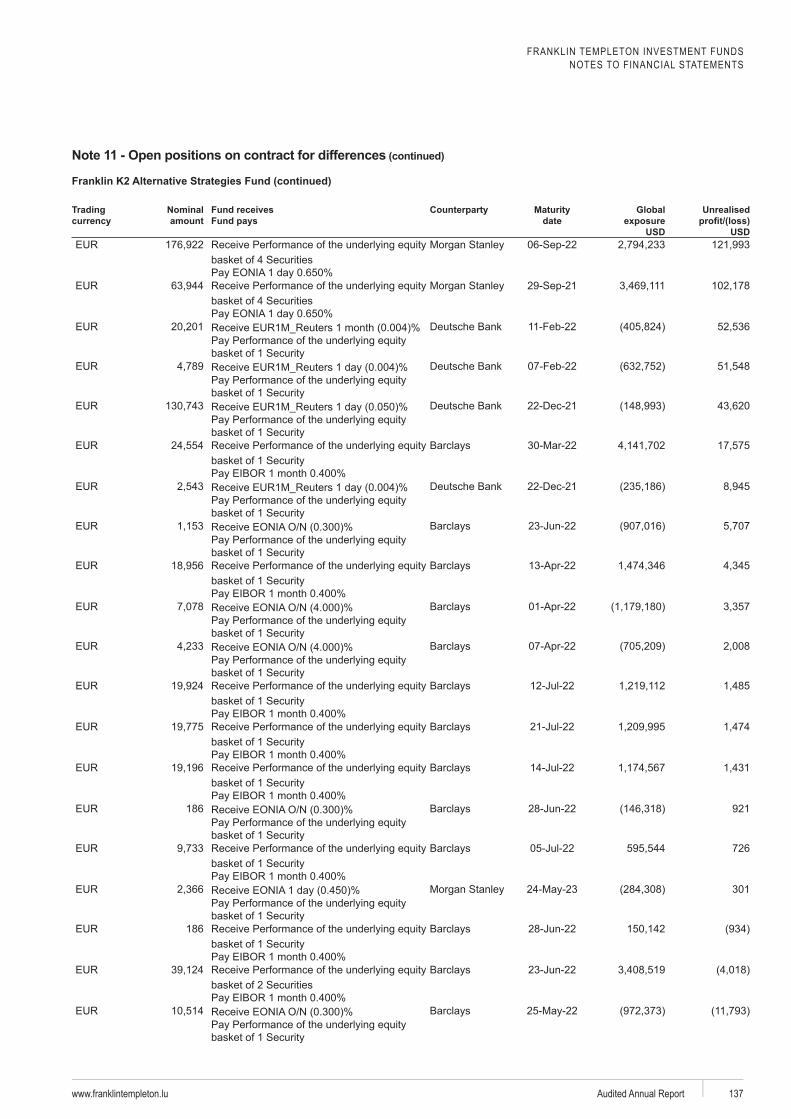
FRANKLIN TEMPLETON INVESTMENT FUNDSNOTES TO FINANCIAL STATEMENTS
www.franklintempleton.lu Audited Annual Report 137
Trading Nominal
amountFund receives
dateGlobal
exposure USD
Unrealised
USD
Deutsche Bank
Deutsche Bank
Deutsche Bank 22-Dec-21
Barclays
Deutsche Bank 22-Dec-21
Barclays 23-Jun-22
Barclays
Barclays
Barclays
Barclays 12-Jul-22
Barclays 21-Jul-22
Barclays 14-Jul-22
186 Barclays 28-Jun-22 921
Barclays 05-Jul-22 726
301
186
Barclays 28-Jun-22
Barclays 23-Jun-22
Barclays
Note 11 - Open positions on contract for differences (continued)
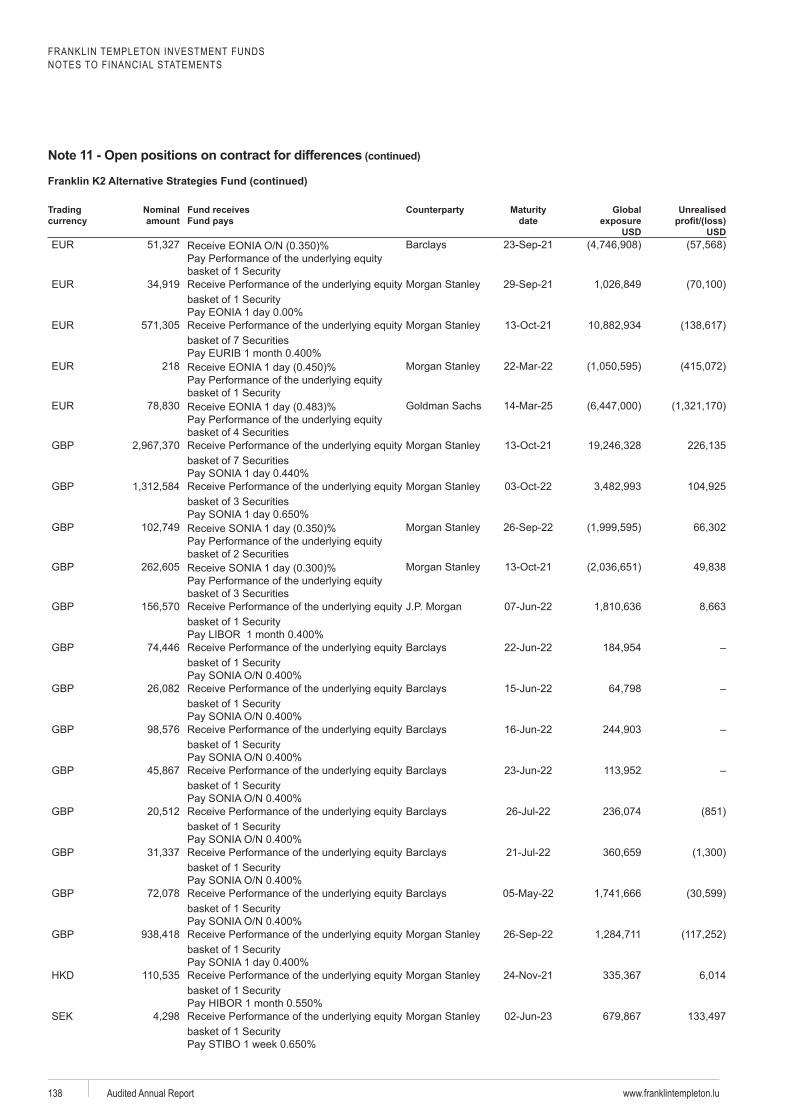
FRANKLIN TEMPLETON INVESTMENT FUNDSNOTES TO FINANCIAL STATEMENTS
www.franklintempleton.luAudited Annual Report138
Trading Nominal
amountFund receives
dateGlobal
exposure USD
Unrealised
USD Barclays
218
GBP
GBP
GBP
GBP
GBP
07-Jun-22
GBP
Barclays 22-Jun-22
GBP
Barclays 15-Jun-22
GBP
Barclays 16-Jun-22
GBP
Barclays 23-Jun-22
GBP
Barclays 26-Jul-22
GBP
Barclays 21-Jul-22
GBP
Barclays
GBP
SEK
02-Jun-23
Note 11 - Open positions on contract for differences (continued)
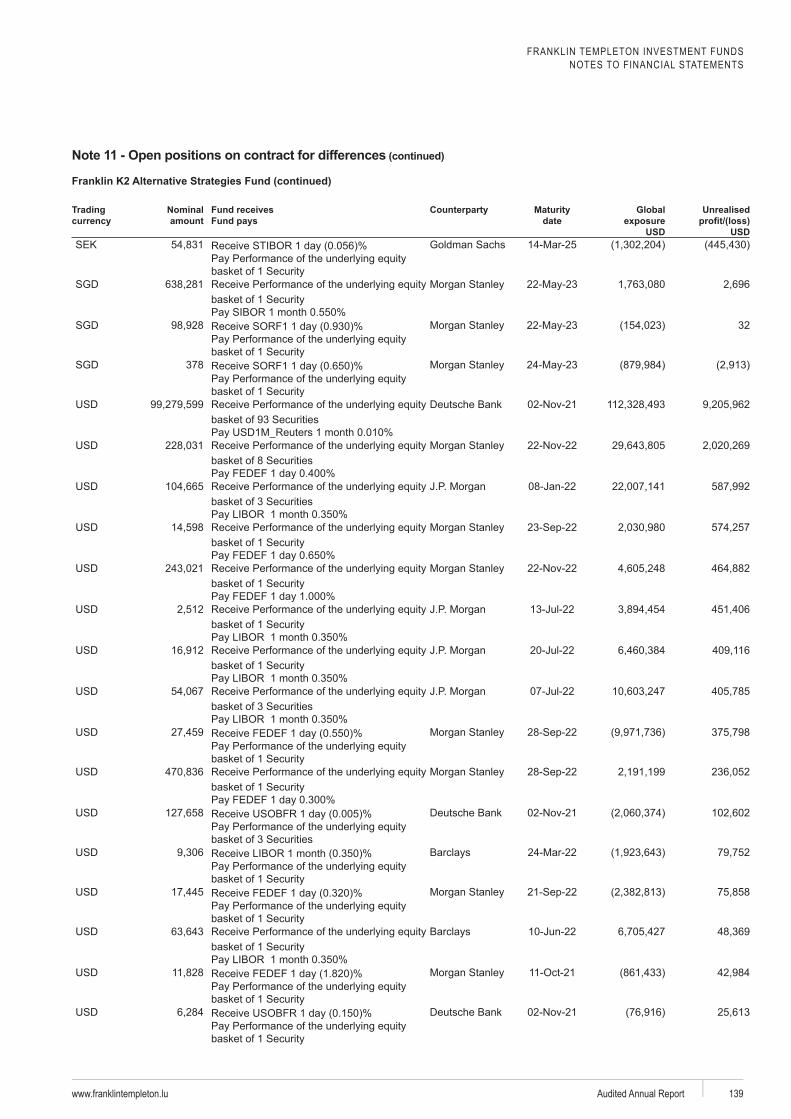
FRANKLIN TEMPLETON INVESTMENT FUNDSNOTES TO FINANCIAL STATEMENTS
www.franklintempleton.lu Audited Annual Report 139
Trading Nominal
amountFund receives
dateGlobal
exposure USD
Unrealised
USDSEK
SGD
SGD 32
SGD 378
Deutsche Bank
08-Jan-22
13-Jul-22
20-Jul-22
07-Jul-22
Deutsche Bank
Barclays
Barclays 10-Jun-22
Deutsche Bank
Note 11 - Open positions on contract for differences (continued)
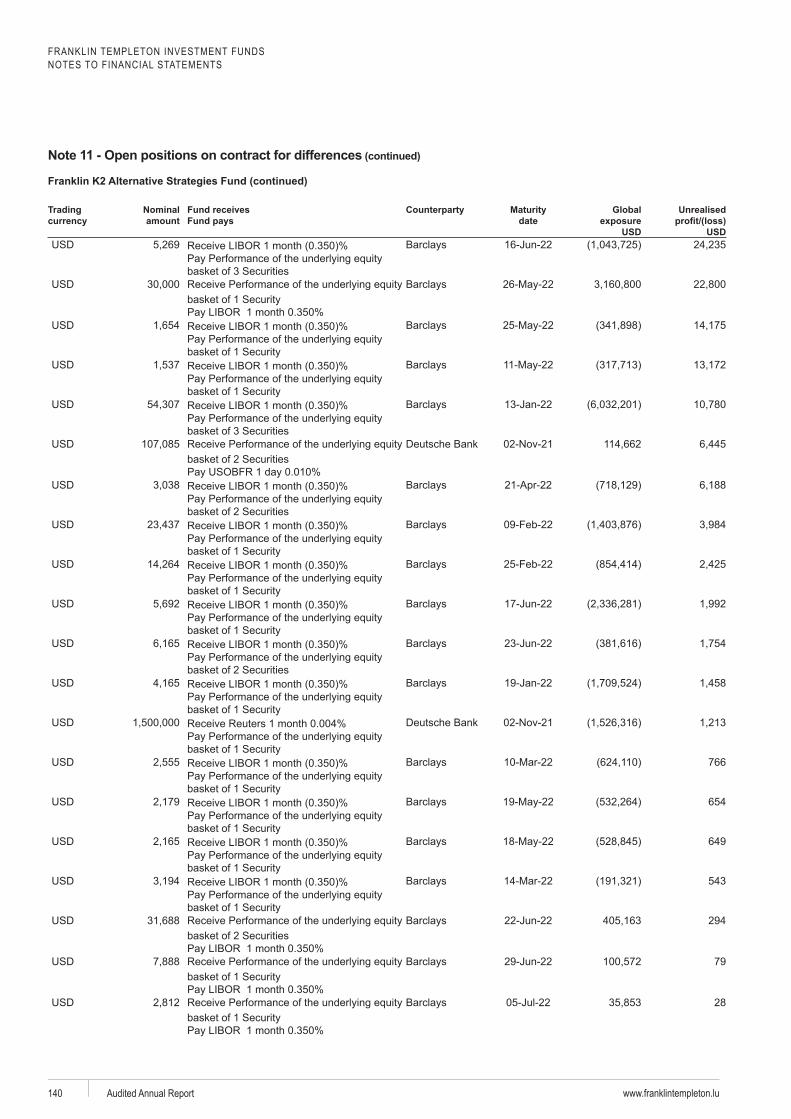
FRANKLIN TEMPLETON INVESTMENT FUNDSNOTES TO FINANCIAL STATEMENTS
www.franklintempleton.luAudited Annual Report140
Trading Nominal
amountFund receives
dateGlobal
exposure USD
Unrealised
USD Barclays 16-Jun-22
Barclays
Barclays
Barclays
Barclays 13-Jan-22
Deutsche Bank
Barclays
Barclays
Barclays
Barclays 17-Jun-22
Barclays 23-Jun-22
Barclays 19-Jan-22
Deutsche Bank
Barclays 766
Barclays 654
Barclays 649
Barclays 543
Barclays 22-Jun-22 294
Barclays 29-Jun-22 79
Barclays 05-Jul-22 28
Note 11 - Open positions on contract for differences (continued)
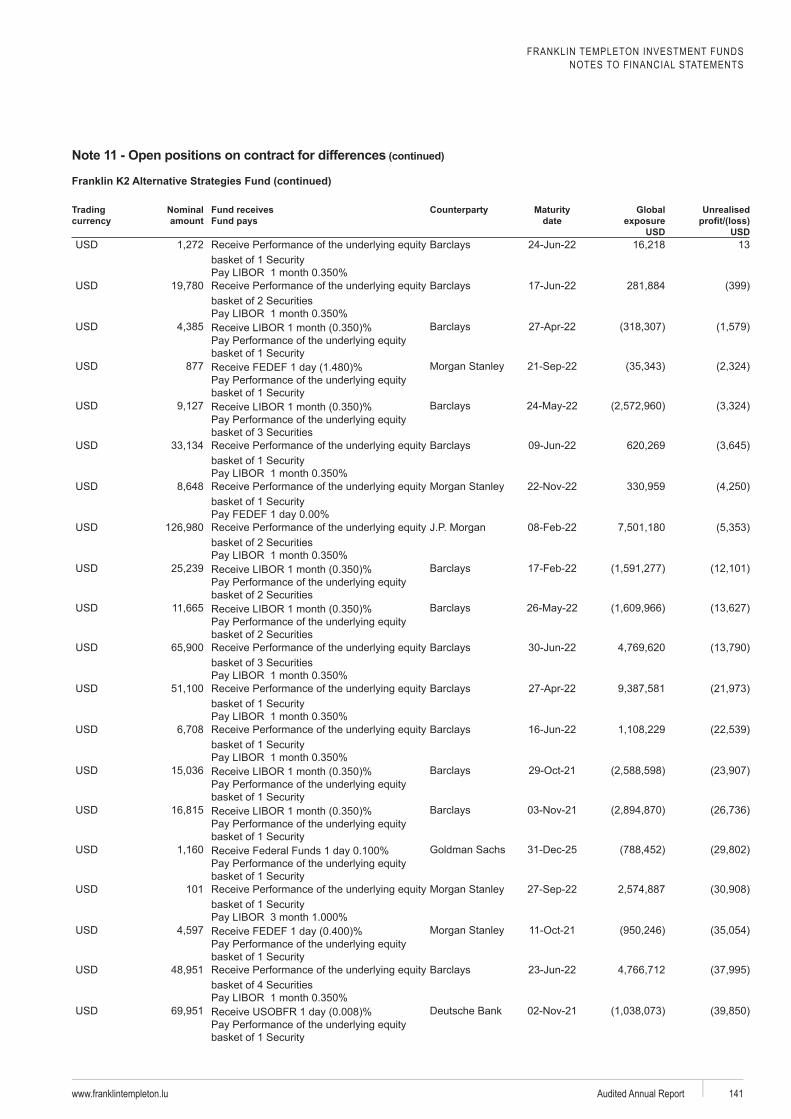
FRANKLIN TEMPLETON INVESTMENT FUNDSNOTES TO FINANCIAL STATEMENTS
www.franklintempleton.lu Audited Annual Report 141
Trading Nominal
amountFund receives
dateGlobal
exposure USD
Unrealised
USD
Barclays 24-Jun-22 13
Barclays 17-Jun-22
Barclays
877
Barclays
Barclays 09-Jun-22
Barclays
Barclays
Barclays 30-Jun-22
Barclays
Barclays 16-Jun-22
Barclays
Barclays
31-Dec-25
101
Barclays 23-Jun-22
Deutsche Bank
Note 11 - Open positions on contract for differences (continued)
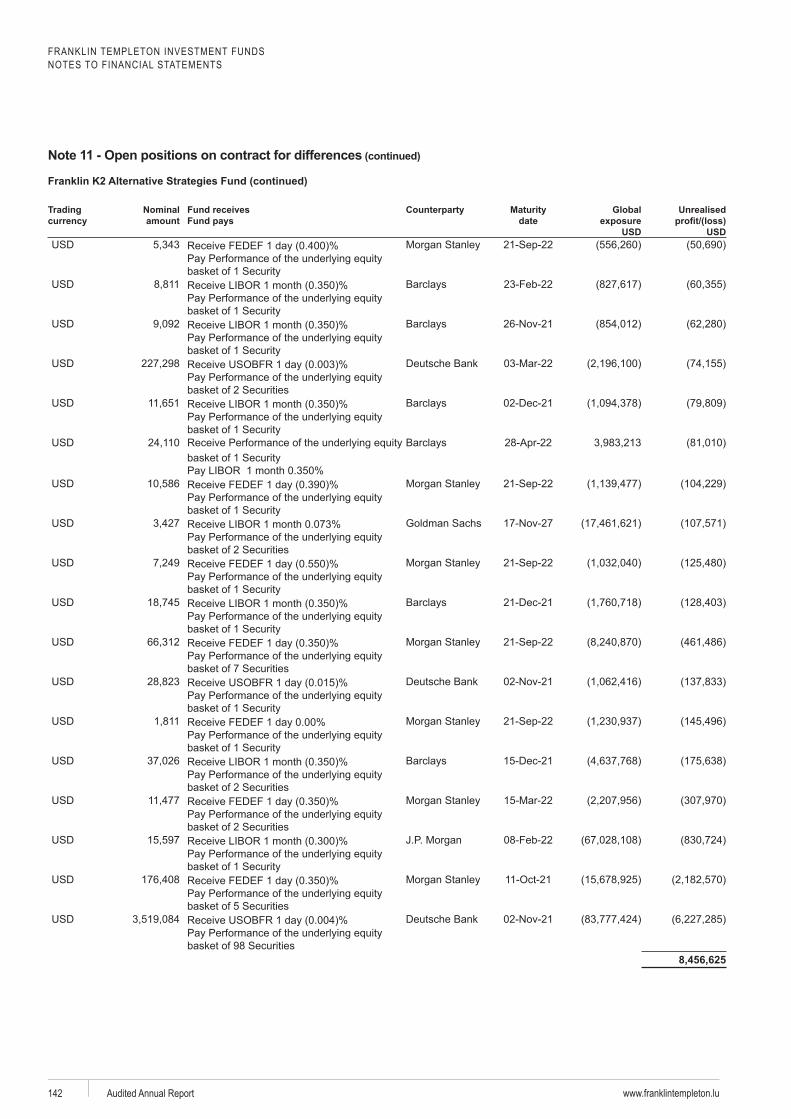
FRANKLIN TEMPLETON INVESTMENT FUNDSNOTES TO FINANCIAL STATEMENTS
www.franklintempleton.luAudited Annual Report142
Trading Nominal
amountFund receives
dateGlobal
exposure USD
Unrealised
USD
Barclays
Barclays
Deutsche Bank
Barclays 02-Dec-21
Barclays
Barclays 21-Dec-21
Deutsche Bank
Barclays 15-Dec-21
Deutsche Bank
8,456,625
Note 11 - Open positions on contract for differences (continued)
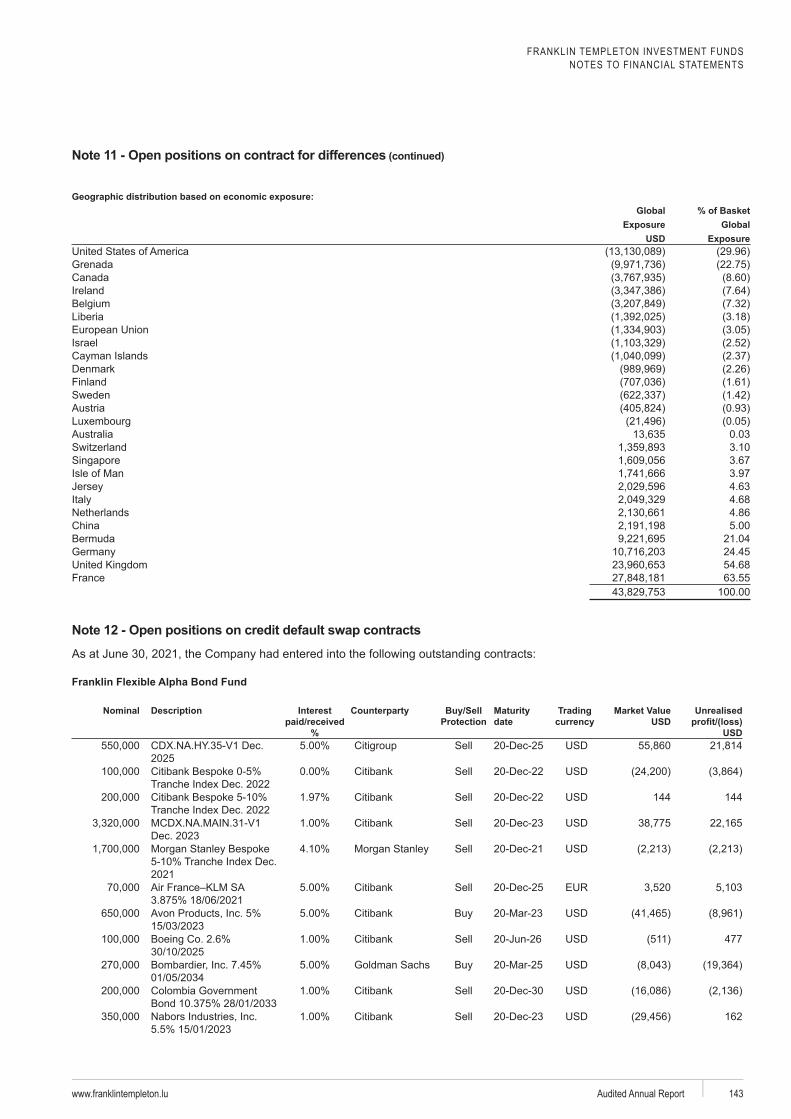
FRANKLIN TEMPLETON INVESTMENT FUNDSNOTES TO FINANCIAL STATEMENTS
www.franklintempleton.lu Audited Annual Report 143
Geographic distribution based on economic exposure:Global % of Basket
Exposure GlobalUSD Exposure
Grenada
Finland
0.033.103.673.97
Jersey 4.634.684.865.00
21.0424.4554.68
France 63.55100.00
Franklin Flexible Alpha Bond Fund
Nominal Description Interest paid/received
%
Protection
date
Trading Market Value USD
Unrealised /(loss)
USD
2025 Sell 20-Dec-25
Sell 20-Dec-22
Sell 20-Dec-22 144 144
Dec. 2023 Sell 20-Dec-23
2021
Sell 20-Dec-21
Sell 20-Dec-25
Buy
Sell 20-Jun-26 477
Buy
Sell 20-Dec-30
Sell 20-Dec-23 162
Note 11 - Open positions on contract for differences (continued)
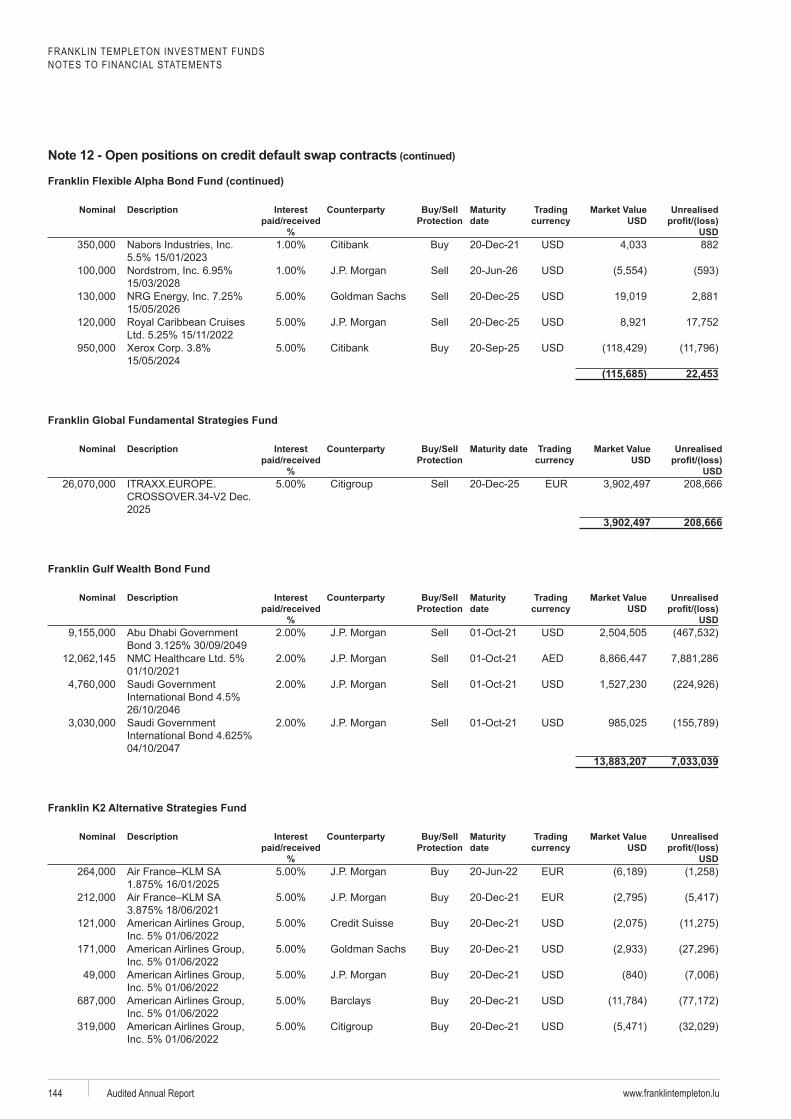
FRANKLIN TEMPLETON INVESTMENT FUNDSNOTES TO FINANCIAL STATEMENTS
www.franklintempleton.luAudited Annual Report144
Franklin Flexible Alpha Bond Fund (continued)
Nominal Description Interest paid/received
%Protection
date
Trading Market Value USD
Unrealised
USDBuy 20-Dec-21 882
Sell 20-Jun-26
Sell 20-Dec-25
Sell 20-Dec-25
Buy
(115,685) 22,453
Franklin Global Fundamental Strategies Fund
Nominal Description Interest paid/received
%
Protection
Trading Market Value USD
Unrealised /(loss)
USD
2025
Sell 20-Dec-25
3,902,497 208,666
Franklin Gulf Wealth Bond Fund
Nominal Description Interest paid/received
%
Protection
date
Trading Market Value USD
Unrealised /(loss)
USDSell
Sell
Sell
Sell
13,883,207 7,033,039
Nominal Description Interest paid/received
%
Protection
date
Trading Market Value USD
Unrealised /(loss)
USDBuy 20-Jun-22
Buy 20-Dec-21
Buy 20-Dec-21
Buy 20-Dec-21
Buy 20-Dec-21
Barclays Buy 20-Dec-21
Buy 20-Dec-21
(continued)
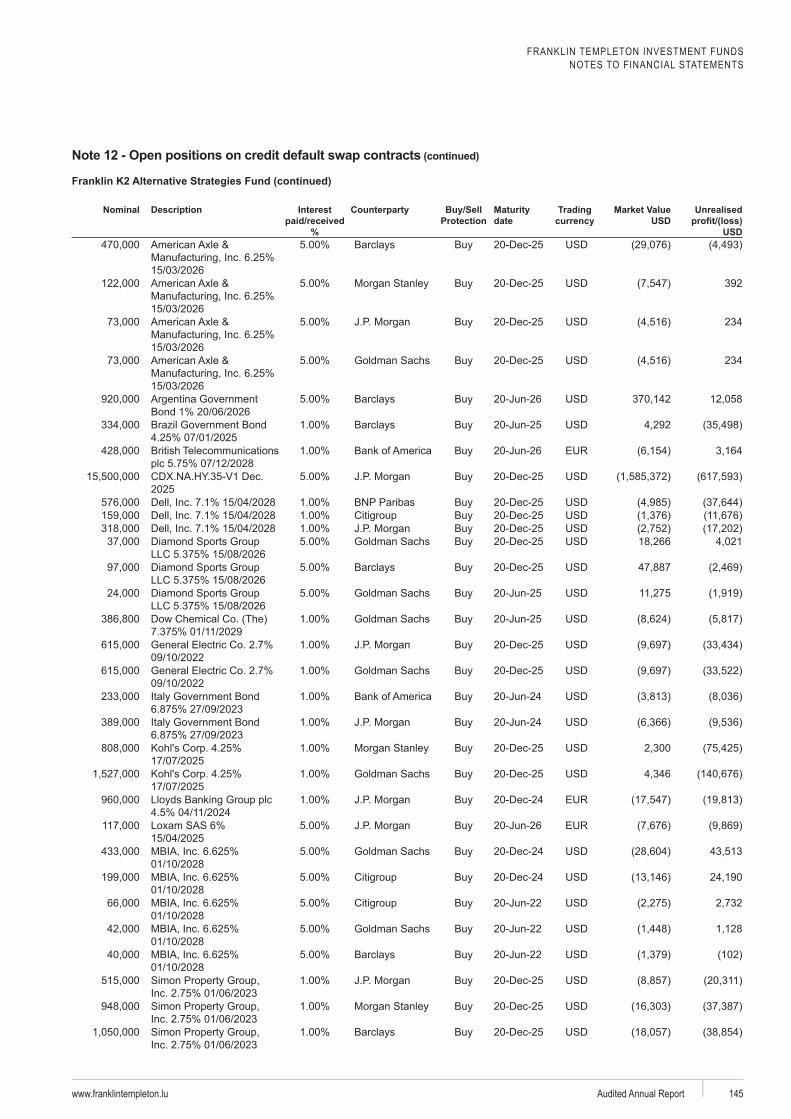
FRANKLIN TEMPLETON INVESTMENT FUNDSNOTES TO FINANCIAL STATEMENTS
www.franklintempleton.lu Audited Annual Report 145
Nominal Description Interest
paid/received %
Protection
dateTrading Market Value
USDUnrealised
USD
Barclays Buy 20-Dec-25
Buy 20-Dec-25 392
Buy 20-Dec-25 234
Buy 20-Dec-25 234
Barclays Buy 20-Jun-26
Barclays Buy 20-Jun-25
Buy 20-Jun-26
2025 Buy 20-Dec-25
Buy 20-Dec-25Buy 20-Dec-25Buy 20-Dec-25Buy 20-Dec-25
Barclays Buy 20-Dec-25
Buy 20-Jun-25
Buy 20-Jun-25
Buy 20-Dec-25
Buy 20-Dec-25
Buy 20-Jun-24
Buy 20-Jun-24
Buy 20-Dec-25
Buy 20-Dec-25
Buy 20-Dec-24
Buy 20-Jun-26
Buy 20-Dec-24
Buy 20-Dec-24
Buy 20-Jun-22
Buy 20-Jun-22
Barclays Buy 20-Jun-22
Buy 20-Dec-25
Buy 20-Dec-25
Barclays Buy 20-Dec-25
(continued)
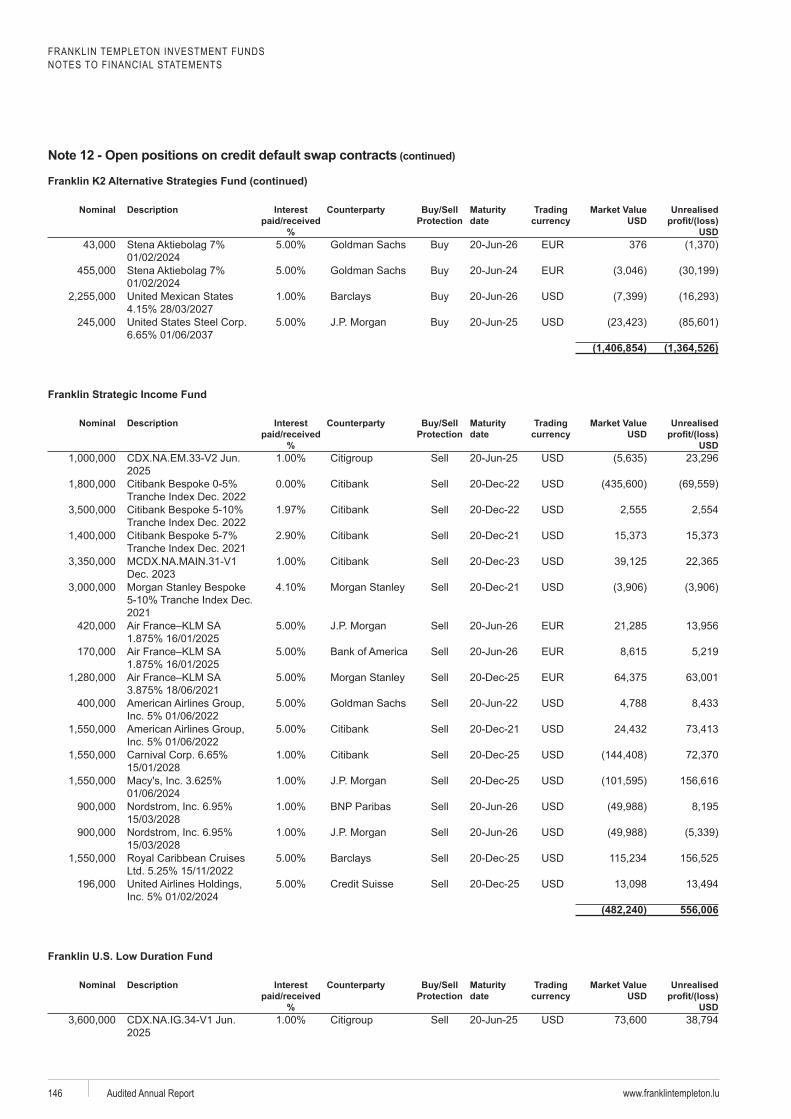
FRANKLIN TEMPLETON INVESTMENT FUNDSNOTES TO FINANCIAL STATEMENTS
www.franklintempleton.luAudited Annual Report146
Nominal Description Interest
paid/received %
Protection
dateTrading Market Value
USDUnrealised
USD
Stena Buy 20-Jun-26 376
Stena Buy 20-Jun-24
Barclays Buy 20-Jun-26
Buy 20-Jun-25
(1,406,854) (1,364,526)
Franklin Strategic Income Fund
Nominal Description Interest paid/received
%
Protection
date
Trading Market Value USD
Unrealised /(loss)
USD
2025 Sell 20-Jun-25
Sell 20-Dec-22
Sell 20-Dec-22
Sell 20-Dec-21
Dec. 2023 Sell 20-Dec-23
2021
Sell 20-Dec-21
Sell 20-Jun-26
Sell 20-Jun-26
Sell 20-Dec-25
Sell 20-Jun-22
Sell 20-Dec-21
Sell 20-Dec-25
Sell 20-Dec-25
Sell 20-Jun-26
Sell 20-Jun-26
Barclays Sell 20-Dec-25
Sell 20-Dec-25
(482,240) 556,006
Nominal Description Interest paid/received
%
Protection
date
Trading Market Value USD
Unrealised /(loss)
USD
2025 Sell 20-Jun-25
(continued)
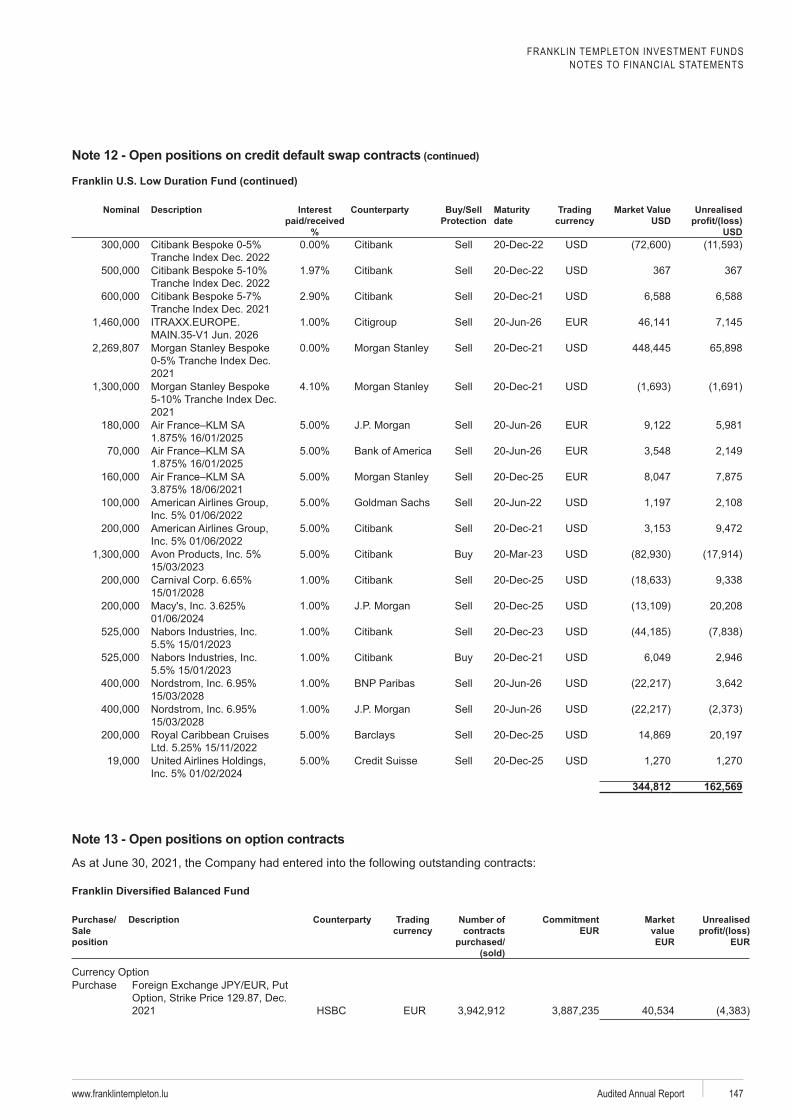
FRANKLIN TEMPLETON INVESTMENT FUNDSNOTES TO FINANCIAL STATEMENTS
www.franklintempleton.lu Audited Annual Report 147
Nominal Description Interest
paid/received %
Protection
dateTrading Market Value
USDUnrealised
USD
Sell 20-Dec-22
Sell 20-Dec-22 367 367
Sell 20-Dec-21
Sell 20-Jun-26
2021
Sell 20-Dec-21
2021
Sell 20-Dec-21
Sell 20-Jun-26
Sell 20-Jun-26
Sell 20-Dec-25
Sell 20-Jun-22
Sell 20-Dec-21
Buy
Sell 20-Dec-25
Sell 20-Dec-25
Sell 20-Dec-23
Buy 20-Dec-21
Sell 20-Jun-26
Sell 20-Jun-26
Barclays Sell 20-Dec-25
Sell 20-Dec-25
344,812 162,569
Note 13 - Open positions on option contracts
Purchase/ Sale position
Description Trading Number of contracts
purchased/ (sold)
Commitment EUR
Market value EUR
Unrealised
EUR
Purchase
2021
(continued)
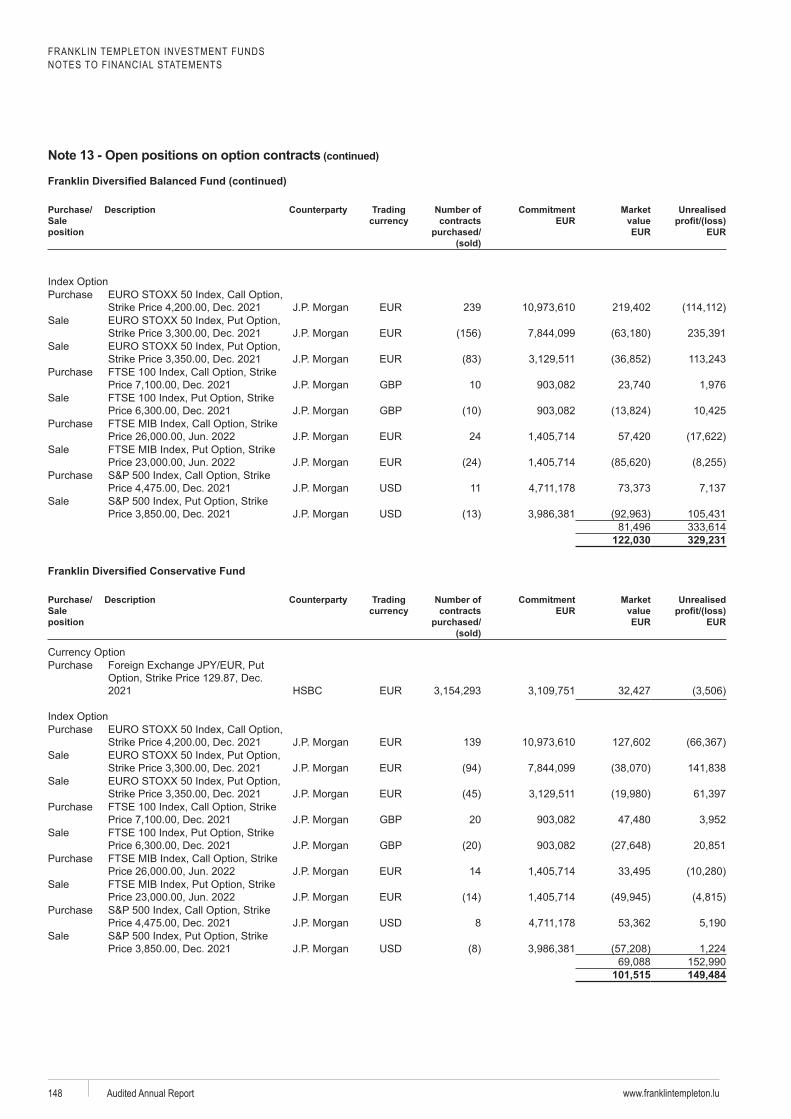
FRANKLIN TEMPLETON INVESTMENT FUNDSNOTES TO FINANCIAL STATEMENTS
www.franklintempleton.luAudited Annual Report148
Purchase/ Sale position
Description Trading Number of contracts
purchased/ (sold)
Commitment EUR
Market value EUR
Unrealised
EUR
Purchase239
Sale
Sale
PurchaseGBP 10
SaleGBP
Purchase24
Sale
Purchase11
Sale
122,030 329,231
Purchase/ Sale position
Description Trading Number of contracts
purchased/ (sold)
Commitment EUR
Market value EUR
Unrealised
EUR
Purchase
2021
Purchase139
Sale
Sale
PurchaseGBP 20
SaleGBP
Purchase14
Sale
Purchase8
Sale
101,515 149,484
Note 13 - Open positions on option contracts (continued)
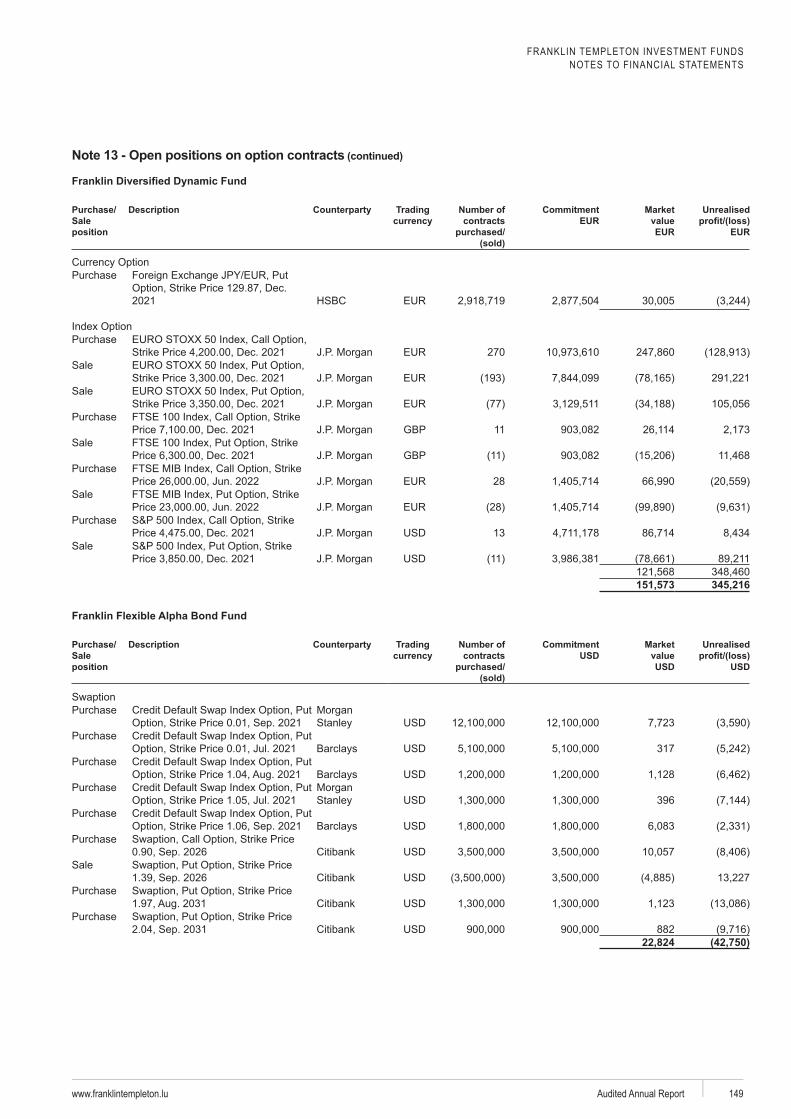
FRANKLIN TEMPLETON INVESTMENT FUNDSNOTES TO FINANCIAL STATEMENTS
www.franklintempleton.lu Audited Annual Report 149
Purchase/ Sale position
Description Trading Number of contracts
purchased/ (sold)
Commitment EUR
Market value EUR
Unrealised
EUR
Purchase
2021
Purchase270
Sale
Sale
PurchaseGBP 11
SaleGBP
Purchase28
Sale
Purchase13
Sale
151,573 345,216
Franklin Flexible Alpha Bond Fund
Purchase/ Sale position
Description Trading Number of contracts
purchased/ (sold)
Commitment USD
Market value USD
Unrealised
USD
PurchaseStanley
PurchaseBarclays 317
PurchaseBarclays
PurchaseStanley 396
PurchaseBarclays
Purchase
Sale
Purchase
Purchase882
22,824 (42,750)
Note 13 - Open positions on option contracts (continued)
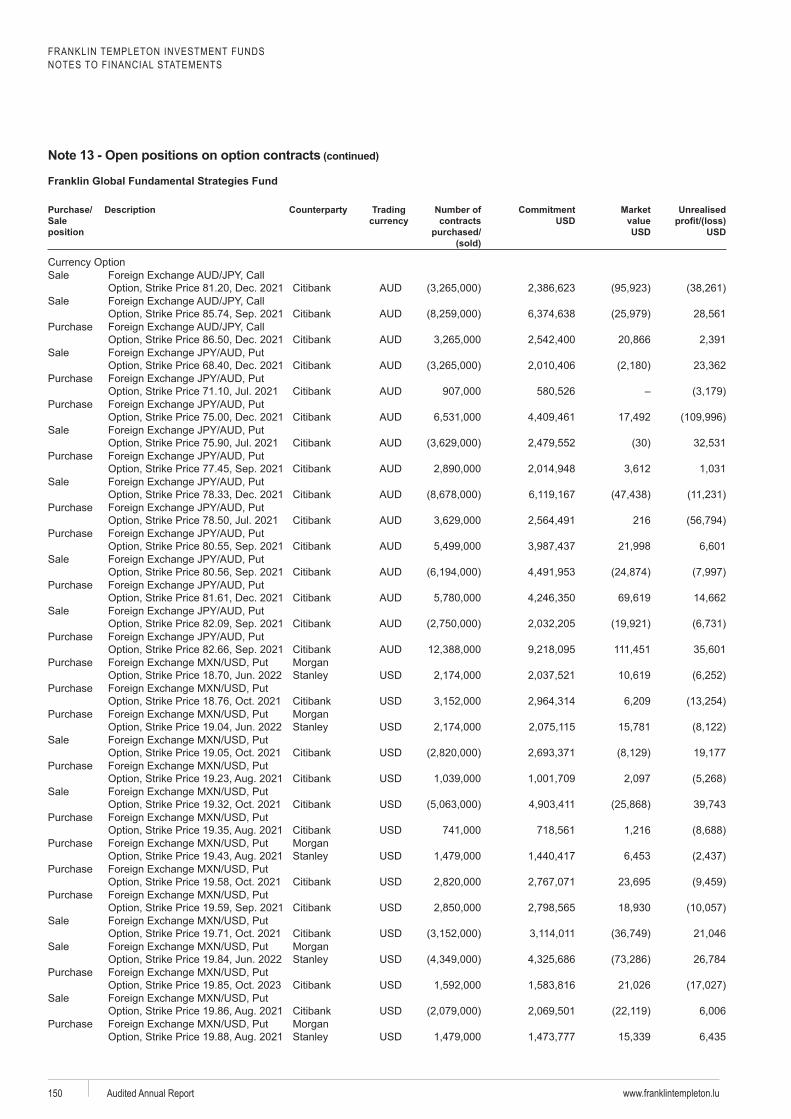
FRANKLIN TEMPLETON INVESTMENT FUNDSNOTES TO FINANCIAL STATEMENTS
www.franklintempleton.luAudited Annual Report150
Franklin Global Fundamental Strategies Fund
Purchase/ Sale position
Description Trading Number of contracts
purchased/ (sold)
Commitment USD
Market value USD
Unrealised
USD
Sale
Sale
Purchase
Sale
Purchase
Purchase
Sale
Purchase
Sale
Purchase216
Purchase
Sale
Purchase
Sale
Purchase
PurchaseStanley
Purchase
PurchaseStanley
Sale
Purchase
Sale
Purchase
PurchaseStanley
Purchase
Purchase
Sale
SaleStanley
Purchase
Sale
PurchaseStanley
Note 13 - Open positions on option contracts (continued)
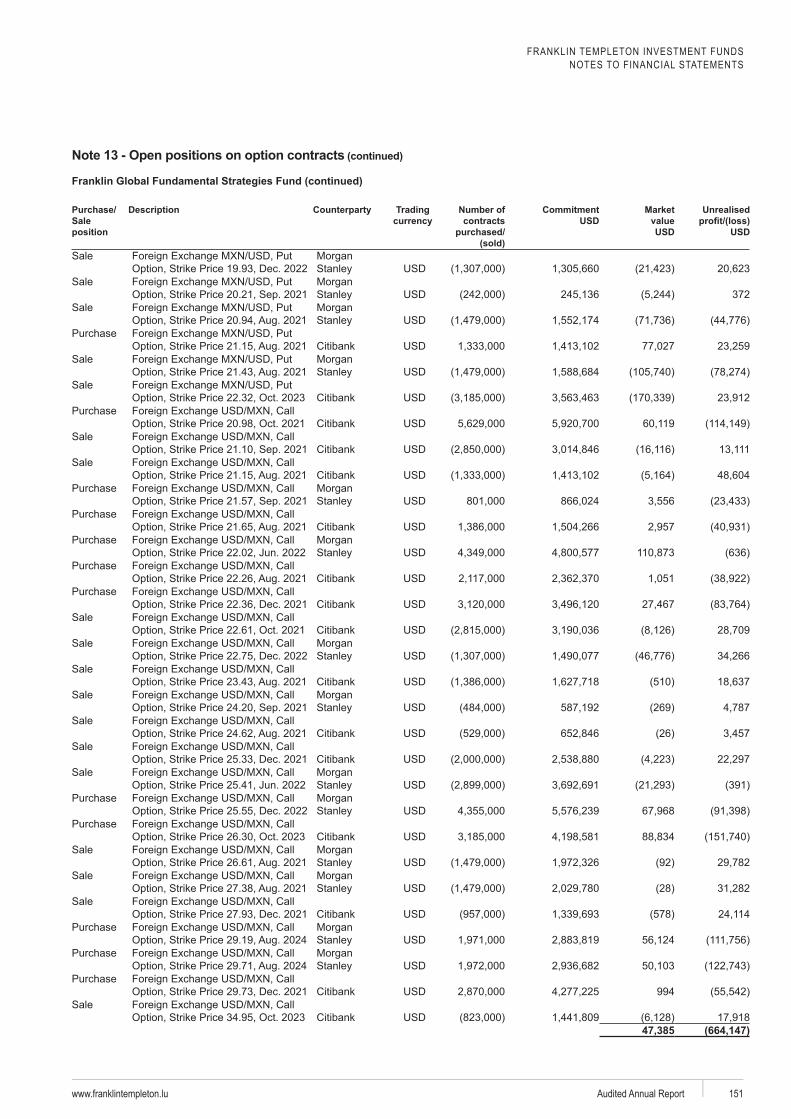
FRANKLIN TEMPLETON INVESTMENT FUNDSNOTES TO FINANCIAL STATEMENTS
www.franklintempleton.lu Audited Annual Report 151
Franklin Global Fundamental Strategies Fund (continued)
Purchase/ Sale position
Description Trading Number of contracts
purchased/ (sold)
Commitment USD
Market value USD
Unrealised
USD
SaleStanley
SaleStanley 372
SaleStanley
Purchase
SaleStanley
Sale
Purchase
Sale
Sale
PurchaseStanley
Purchase
PurchaseStanley
Purchase
Purchase
Sale
SaleStanley
Sale
SaleStanley
Sale
Sale
SaleStanley
PurchaseStanley
Purchase
SaleStanley
SaleStanley
Sale
PurchaseStanley
PurchaseStanley
Purchase994
Sale
47,385 (664,147)
Note 13 - Open positions on option contracts (continued)
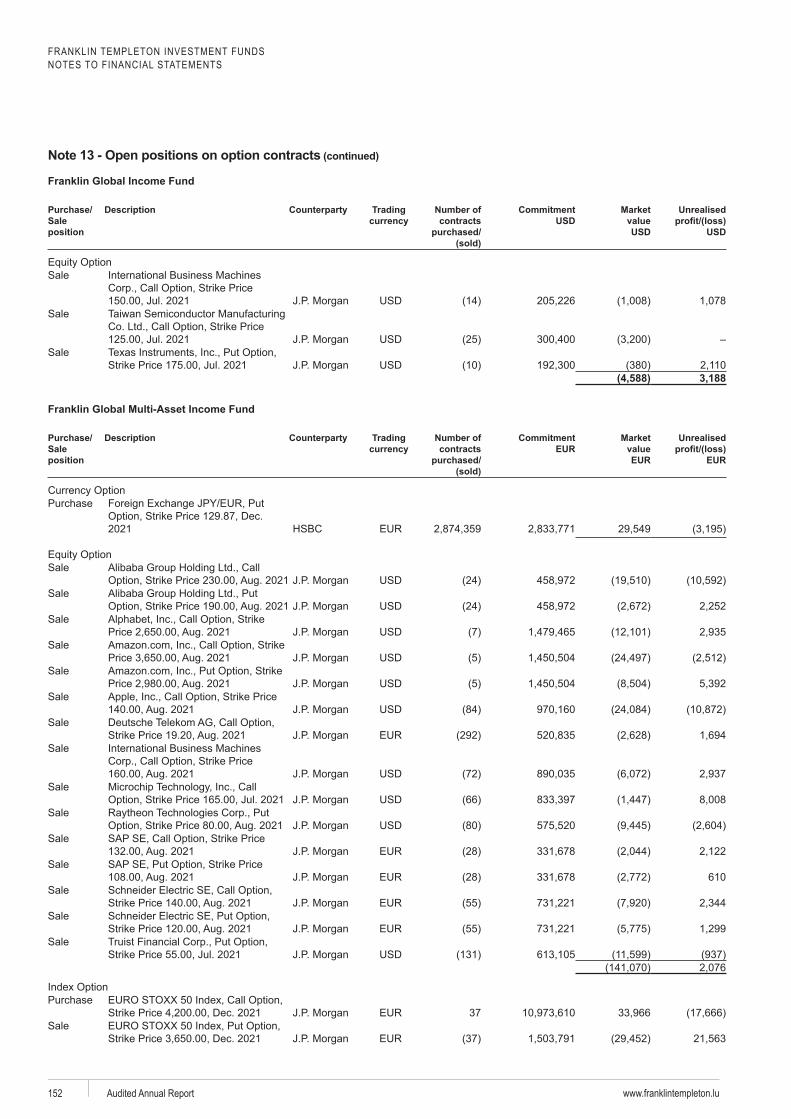
FRANKLIN TEMPLETON INVESTMENT FUNDSNOTES TO FINANCIAL STATEMENTS
www.franklintempleton.luAudited Annual Report152
Franklin Global Income Fund
Purchase/ Sale position
Description Trading Number of contracts
purchased/ (sold)
Commitment USD
Market value USD
Unrealised
USD
Sale
Sale
Sale
(4,588) 3,188
Franklin Global Multi-Asset Income Fund
Purchase/ Sale position
Description Trading Number of contracts
purchased/ (sold)
Commitment EUR
Market value EUR
Unrealised
EUR
Purchase
2021
Sale
Sale
Sale
Sale
Sale
Sale
Sale
Sale
Sale
Sale
Sale
Sale610
Sale
Sale
Sale Truist
Purchase37
Sale
Note 13 - Open positions on option contracts (continued)
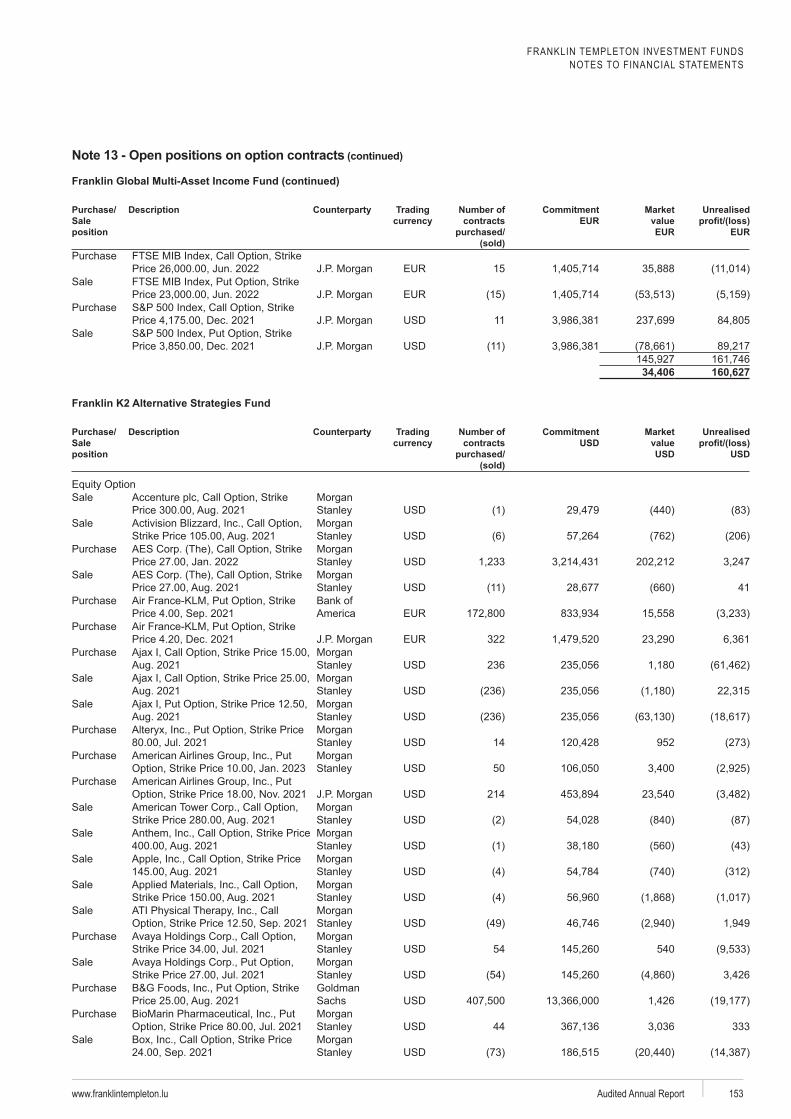
FRANKLIN TEMPLETON INVESTMENT FUNDSNOTES TO FINANCIAL STATEMENTS
www.franklintempleton.lu Audited Annual Report 153
Franklin Global Multi-Asset Income Fund (continued)
Purchase/ Sale position
Description Trading Number of contracts
purchased/ (sold)
Commitment EUR
Market value EUR
Unrealised
EUR
Purchase15
Sale
Purchase11
Sale
34,406 160,627
Purchase/ Sale position
Description Trading Number of contracts
purchased/ (sold)
Commitment USD
Market value USD
Unrealised
USD
SaleStanley
SaleStanley
PurchaseStanley
SaleStanley 41
Purchase Bank of
Purchase322
PurchaseStanley 236
SaleStanley
SaleStanley
PurchaseStanley 14 952
PurchaseStanley 50
Purchase214
SaleStanley
SaleStanley
SaleStanley
SaleStanley
SaleStanley
PurchaseStanley 54 540
SaleStanley
PurchaseSachs
PurchaseStanley 44 333
SaleStanley
Note 13 - Open positions on option contracts (continued)
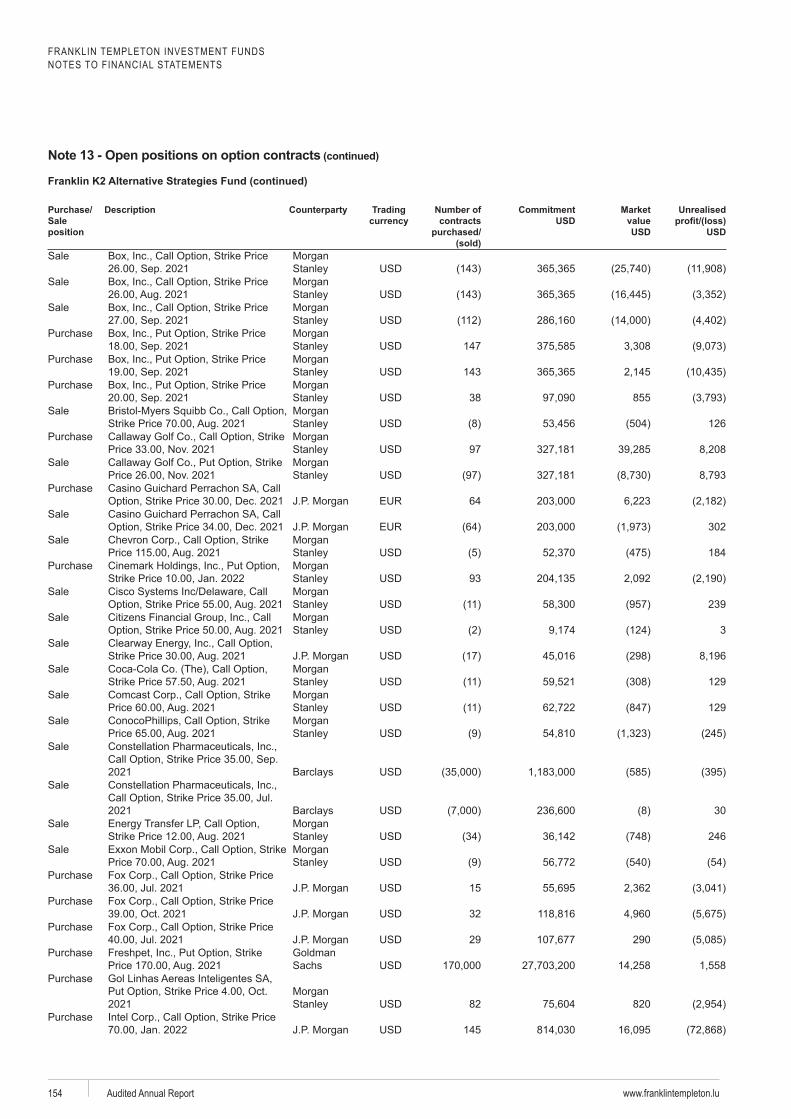
FRANKLIN TEMPLETON INVESTMENT FUNDSNOTES TO FINANCIAL STATEMENTS
www.franklintempleton.luAudited Annual Report154
Purchase/ Sale position
Description Trading Number of contracts
purchased/ (sold)
Commitment USD
Market value USD
Unrealised
USD
SaleStanley
SaleStanley
SaleStanley
PurchaseStanley 147
PurchaseStanley 143
PurchaseStanley 38 855
SaleStanley 126
PurchaseStanley 97
SaleStanley
Purchase Guichard Perrachon64
Sale Guichard Perrachon302
SaleStanley 184
PurchaseStanley 93
SaleStanley 239
SaleStanley 3
Sale
SaleStanley 129
SaleStanley 129
SaleStanley
Sale
2021 Barclays Sale
2021 Barclays 30Sale
Stanley 246Sale
Stanley Purchase
15Purchase
32Purchase
29 290Purchase
Sachs Purchase Gol
2021 Stanley 82 820Purchase
145
Note 13 - Open positions on option contracts (continued)
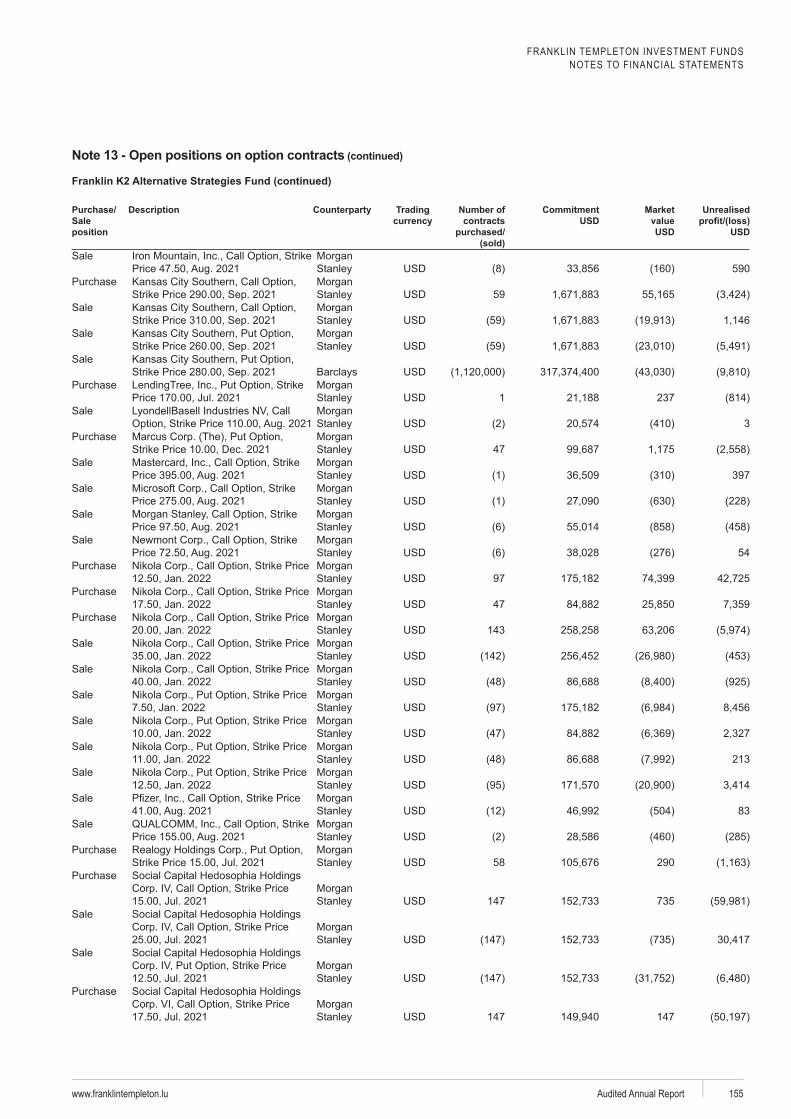
FRANKLIN TEMPLETON INVESTMENT FUNDSNOTES TO FINANCIAL STATEMENTS
www.franklintempleton.lu Audited Annual Report 155
Purchase/ Sale position
Description Trading Number of contracts
purchased/ (sold)
Commitment USD
Market value USD
Unrealised
USD
SaleStanley 590
PurchaseStanley 59
SaleStanley
SaleStanley
SaleBarclays
PurchaseStanley 1 237
SaleStanley 3
PurchaseStanley 47
SaleStanley 397
SaleStanley
SaleStanley
SaleStanley 54
PurchaseStanley 97
PurchaseStanley 47
PurchaseStanley 143
SaleStanley
SaleStanley
SaleStanley
SaleStanley
SaleStanley 213
SaleStanley
SaleStanley 83
SaleStanley
PurchaseStanley 58 290
Purchase
Stanley 147 735Sale
Stanley Sale
Stanley Purchase
Stanley 147 147
Note 13 - Open positions on option contracts (continued)
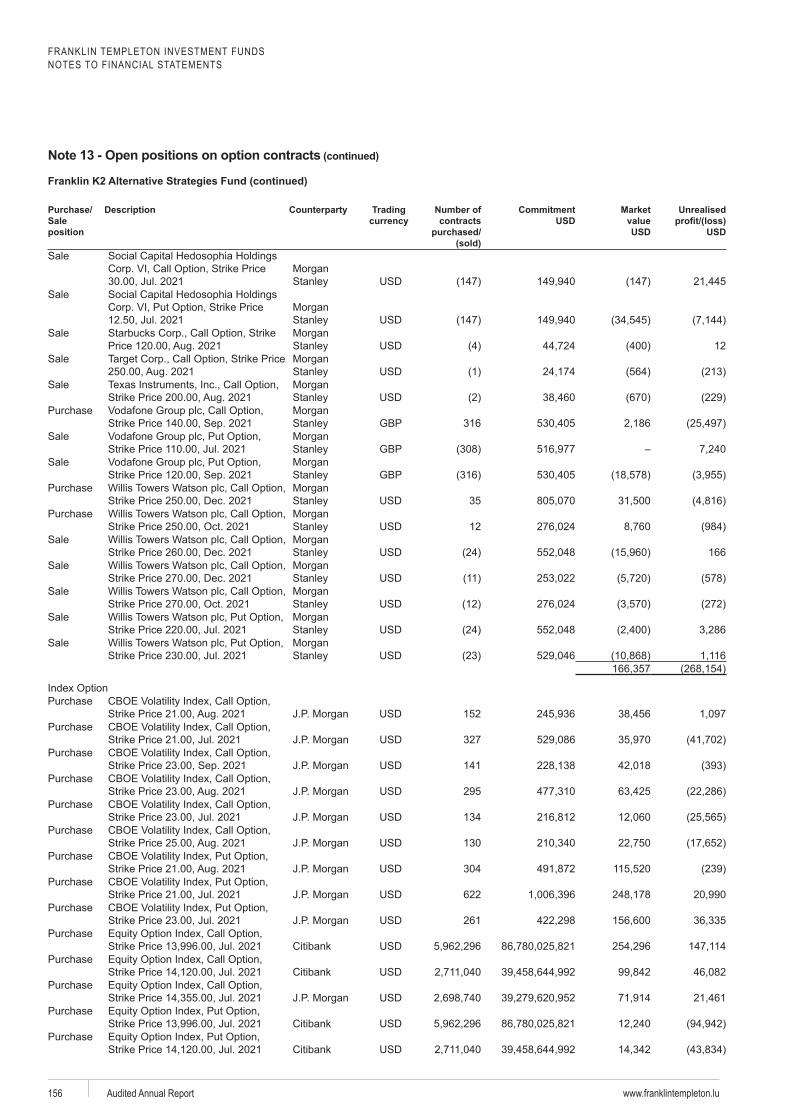
FRANKLIN TEMPLETON INVESTMENT FUNDSNOTES TO FINANCIAL STATEMENTS
www.franklintempleton.luAudited Annual Report156
Purchase/ Sale position
Description Trading Number of contracts
purchased/ (sold)
Commitment USD
Market value USD
Unrealised
USD
Sale
Stanley Sale
Stanley Sale
Stanley 12Sale
Stanley Sale
Stanley Purchase
Stanley GBP 316Sale
Stanley GBPSale
Stanley GBPPurchase
Stanley 35Purchase
Stanley 12Sale
Stanley 166Sale
Stanley Sale
Stanley Sale
Stanley Sale
Stanley
Purchase152
Purchase327
Purchase141
Purchase295
Purchase134
Purchase130
Purchase304
Purchase622
Purchase261
Purchase
Purchase
Purchase
Purchase
Purchase
Note 13 - Open positions on option contracts (continued)
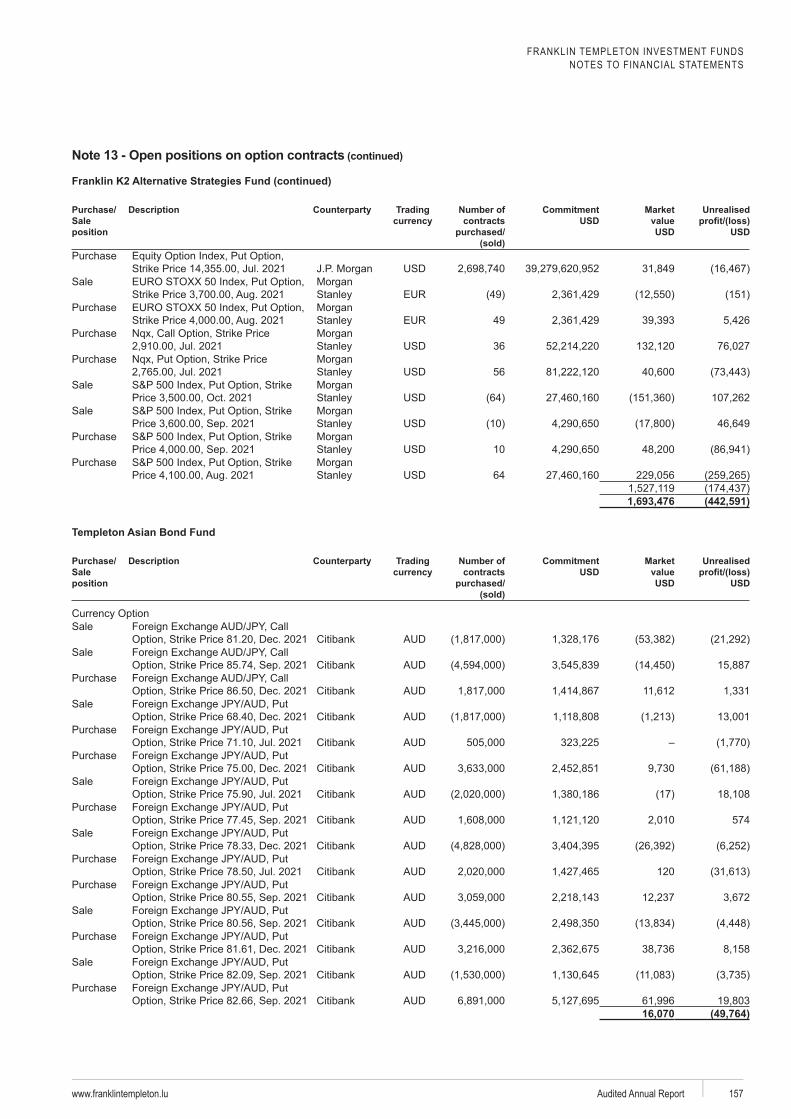
FRANKLIN TEMPLETON INVESTMENT FUNDSNOTES TO FINANCIAL STATEMENTS
www.franklintempleton.lu Audited Annual Report 157
Purchase/ Sale position
Description Trading Number of contracts
purchased/ (sold)
Commitment USD
Market value USD
Unrealised
USD
Purchase
SaleStanley
PurchaseStanley 49
PurchaseStanley 36
PurchaseStanley 56
SaleStanley
SaleStanley
PurchaseStanley 10
PurchaseStanley 64
1,693,476 (442,591)
Templeton Asian Bond Fund
Purchase/ Sale position
Description Trading Number of contracts
purchased/ (sold)
Commitment USD
Market value USD
Unrealised
USD
Sale
Sale
Purchase
Sale
Purchase
Purchase
Sale
Purchase574
Sale
Purchase120
Purchase
Sale
Purchase
Sale
Purchase
16,070 (49,764)
Note 13 - Open positions on option contracts (continued)
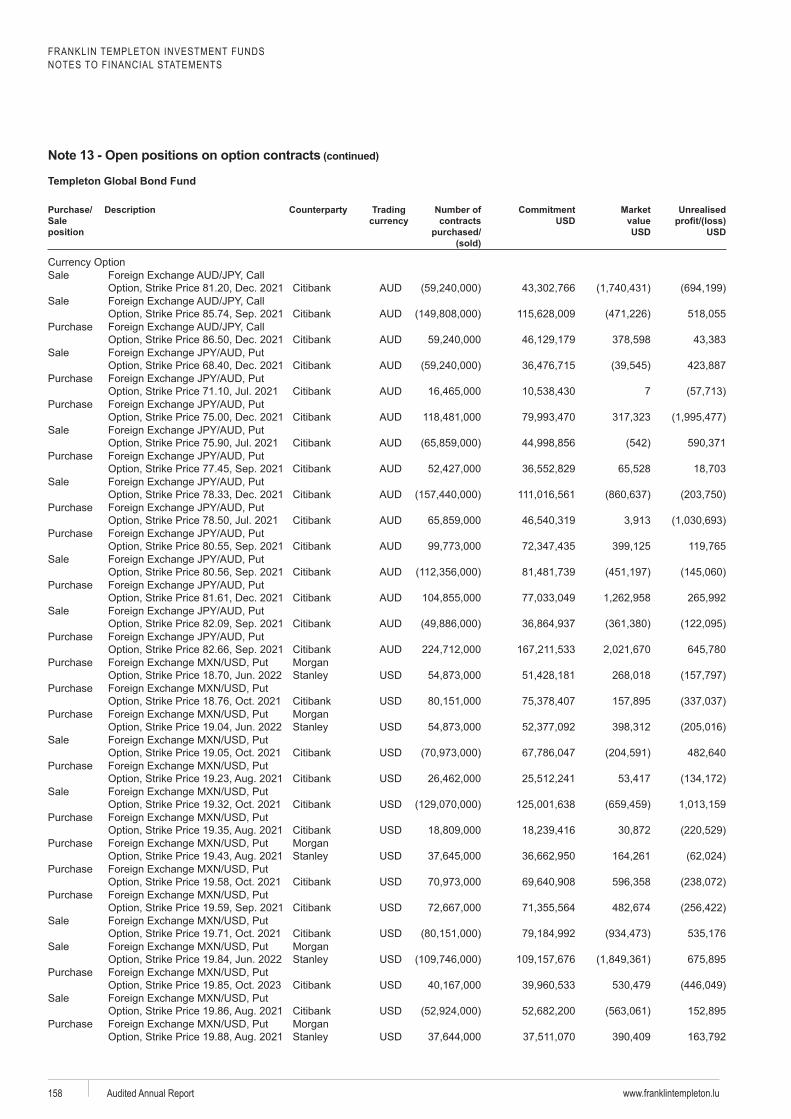
FRANKLIN TEMPLETON INVESTMENT FUNDSNOTES TO FINANCIAL STATEMENTS
www.franklintempleton.luAudited Annual Report158
Templeton Global Bond Fund
Purchase/ Sale position
Description Trading Number of contracts
purchased/ (sold)
Commitment USD
Market value USD
Unrealised
USD
Sale
Sale
Purchase
Sale
Purchase7
Purchase
Sale
Purchase
Sale
Purchase
Purchase
Sale
Purchase
Sale
Purchase
PurchaseStanley
Purchase
PurchaseStanley
Sale
Purchase
Sale
Purchase
PurchaseStanley
Purchase
Purchase
Sale
SaleStanley
Purchase
Sale
PurchaseStanley
Note 13 - Open positions on option contracts (continued)
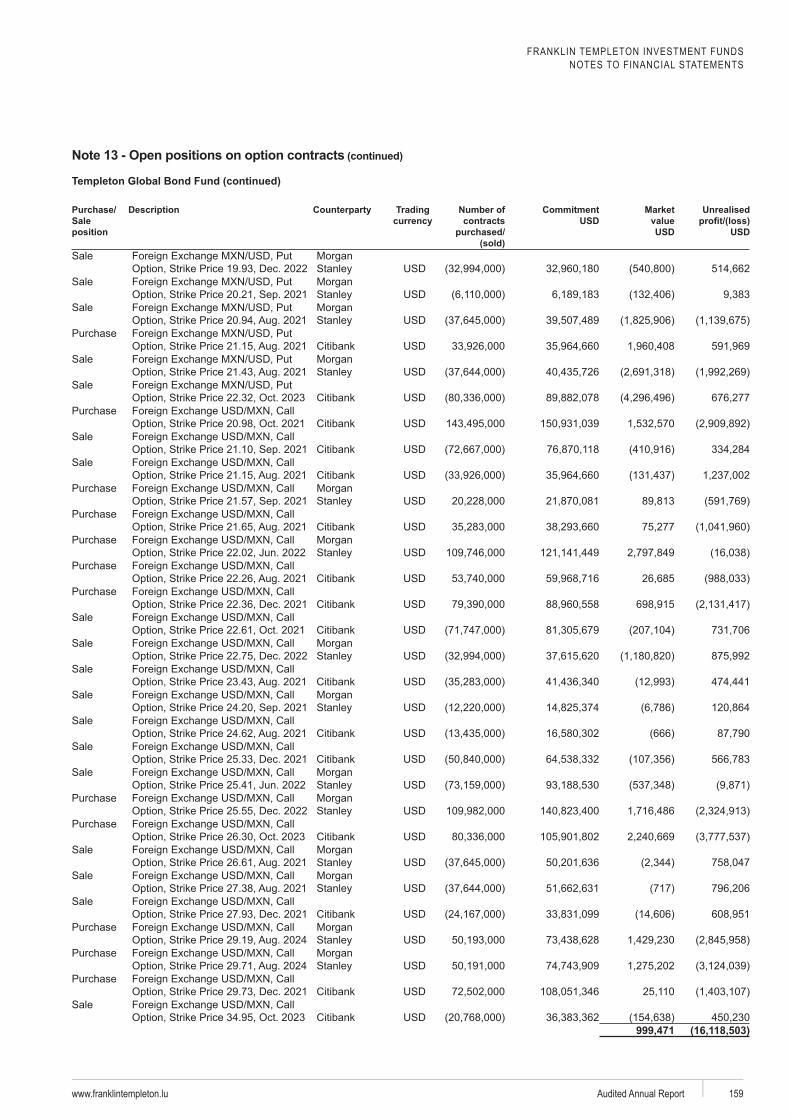
FRANKLIN TEMPLETON INVESTMENT FUNDSNOTES TO FINANCIAL STATEMENTS
www.franklintempleton.lu Audited Annual Report 159
Templeton Global Bond Fund (continued)
Purchase/ Sale position
Description Trading Number of contracts
purchased/ (sold)
Commitment USD
Market value USD
Unrealised
USD
SaleStanley
SaleStanley
SaleStanley
Purchase
SaleStanley
Sale
Purchase
Sale
Sale
PurchaseStanley
Purchase
PurchaseStanley
Purchase
Purchase
Sale
SaleStanley
Sale
SaleStanley
Sale
Sale
SaleStanley
PurchaseStanley
Purchase
SaleStanley
SaleStanley
Sale
PurchaseStanley
PurchaseStanley
Purchase
Sale
999,471 (16,118,503)
Note 13 - Open positions on option contracts (continued)
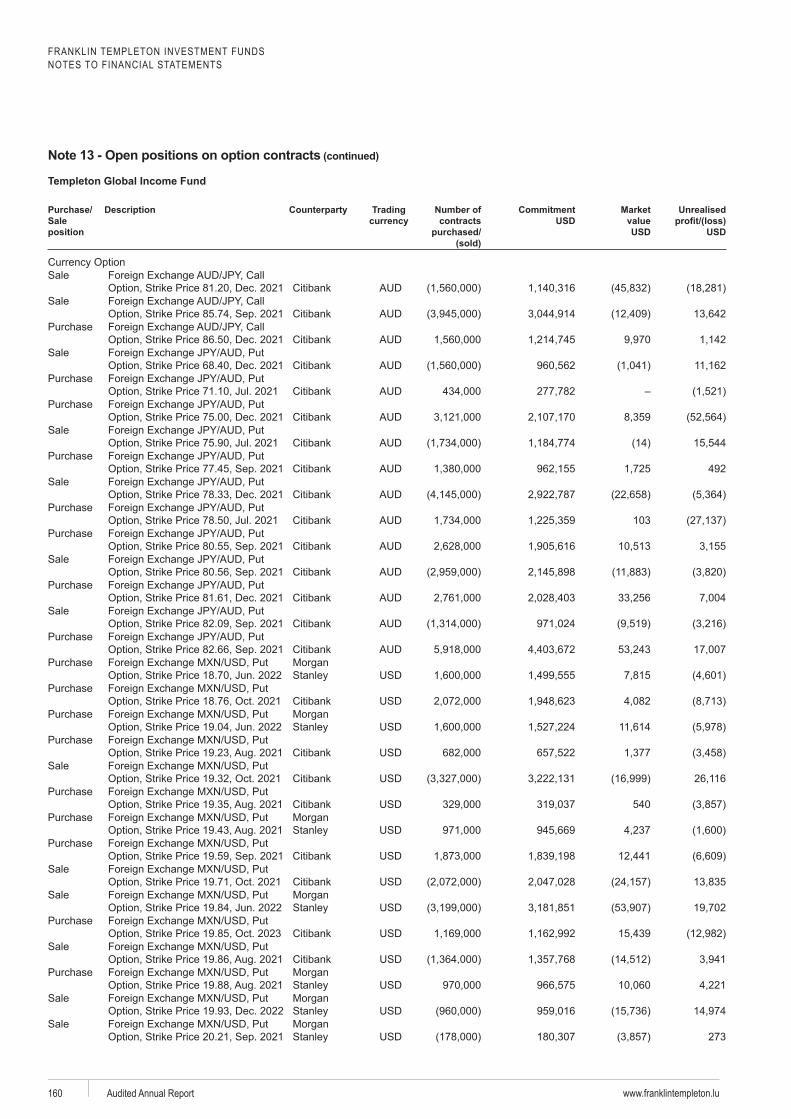
FRANKLIN TEMPLETON INVESTMENT FUNDSNOTES TO FINANCIAL STATEMENTS
www.franklintempleton.luAudited Annual Report160
Templeton Global Income Fund
Purchase/ Sale position
Description Trading Number of contracts
purchased/ (sold)
Commitment USD
Market value USD
Unrealised
USD
Sale
Sale
Purchase
Sale
Purchase
Purchase
Sale
Purchase492
Sale
Purchase103
Purchase
Sale
Purchase
Sale
Purchase
PurchaseStanley
Purchase
PurchaseStanley
Purchase
Sale
Purchase540
PurchaseStanley
Purchase
Sale
SaleStanley
Purchase
Sale
PurchaseStanley
SaleStanley
SaleStanley 273
Note 13 - Open positions on option contracts (continued)
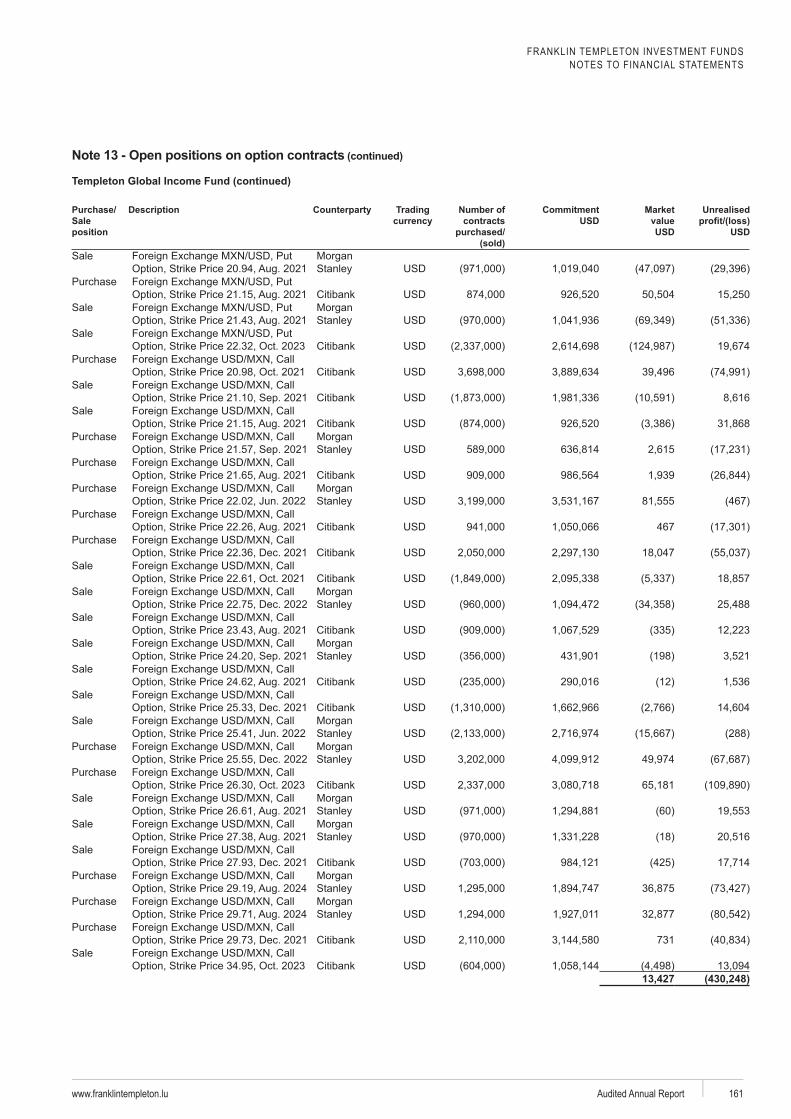
FRANKLIN TEMPLETON INVESTMENT FUNDSNOTES TO FINANCIAL STATEMENTS
www.franklintempleton.lu Audited Annual Report 161
Templeton Global Income Fund (continued)
Purchase/ Sale position
Description Trading Number of contracts
purchased/ (sold)
Commitment USD
Market value USD
Unrealised
USD
SaleStanley
Purchase
SaleStanley
Sale
Purchase
Sale
Sale
PurchaseStanley
Purchase
PurchaseStanley
Purchase467
Purchase
Sale
SaleStanley
Sale
SaleStanley
Sale
Sale
SaleStanley
PurchaseStanley
Purchase
SaleStanley
SaleStanley
Sale
PurchaseStanley
PurchaseStanley
Purchase731
Sale
13,427 (430,248)
Note 13 - Open positions on option contracts (continued)
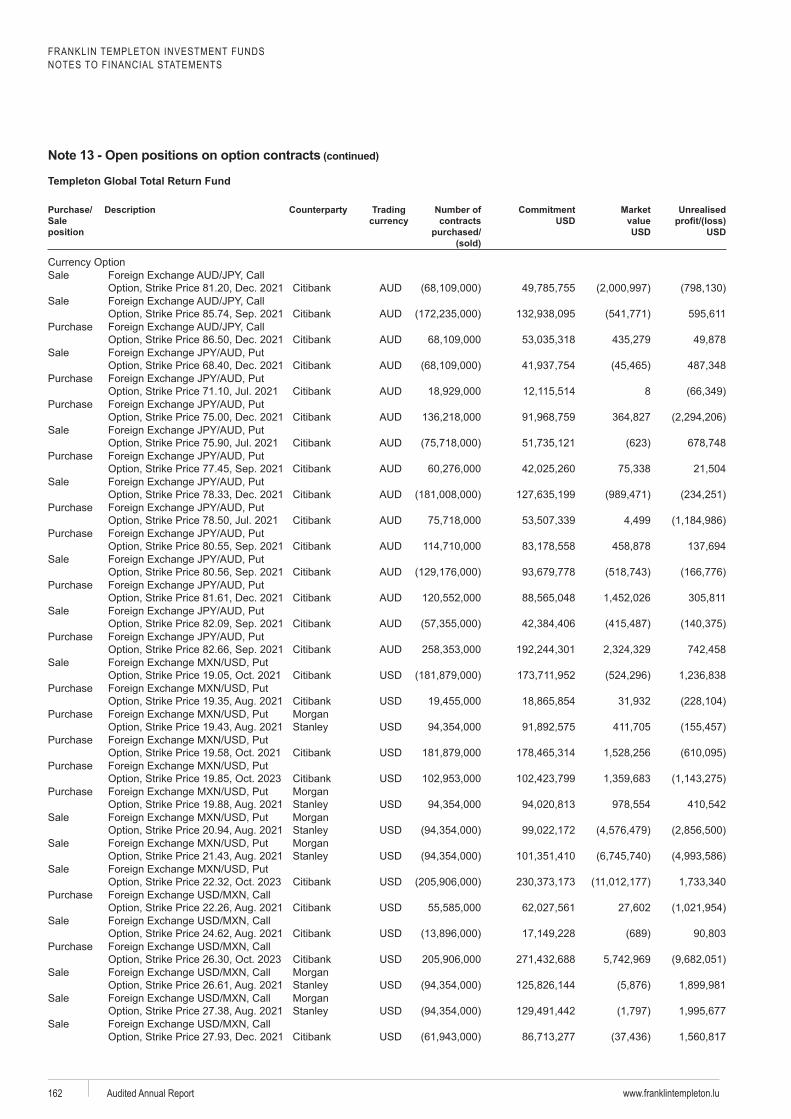
FRANKLIN TEMPLETON INVESTMENT FUNDSNOTES TO FINANCIAL STATEMENTS
www.franklintempleton.luAudited Annual Report162
Templeton Global Total Return Fund
Purchase/ Sale position
Description Trading Number of contracts
purchased/ (sold)
Commitment USD
Market value USD
Unrealised
USD
Sale
Sale
Purchase
Sale
Purchase8
Purchase
Sale
Purchase
Sale
Purchase
Purchase
Sale
Purchase
Sale
Purchase
Sale
Purchase
PurchaseStanley
Purchase
Purchase
PurchaseStanley
SaleStanley
SaleStanley
Sale
Purchase
Sale
Purchase
SaleStanley
SaleStanley
Sale
Note 13 - Open positions on option contracts (continued)
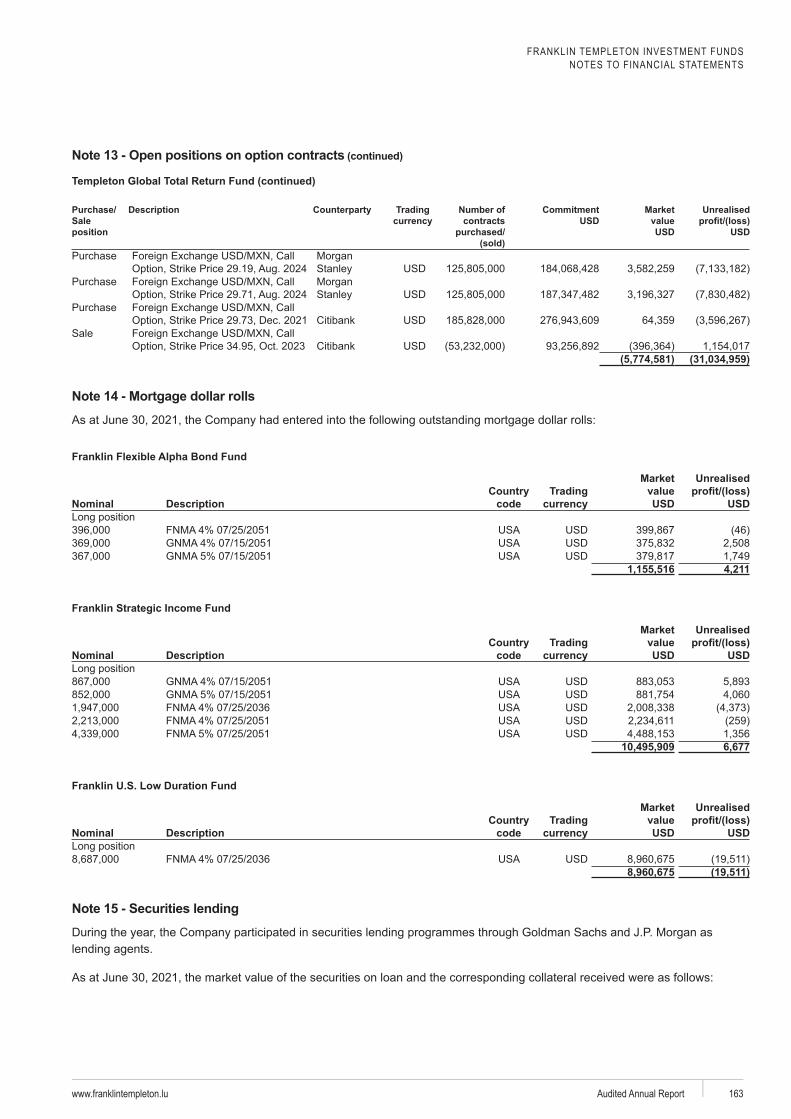
FRANKLIN TEMPLETON INVESTMENT FUNDSNOTES TO FINANCIAL STATEMENTS
www.franklintempleton.lu Audited Annual Report 163
Templeton Global Total Return Fund (continued)
Purchase/ Sale position
Description Trading Number of contracts
purchased/ (sold)
Commitment USD
Market value USD
Unrealised
USD
PurchaseStanley
PurchaseStanley
Purchase
Sale
(5,774,581) (31,034,959)
Note 14 - Mortgage dollar rolls
Franklin Flexible Alpha Bond Fund
Nominal Description
codeTrading
Market value USD
Unrealised
USD
1,155,516 4,211
Franklin Strategic Income Fund
Nominal Description
codeTrading
Market value USD
Unrealised
USD
10,495,909 6,677
Nominal Description
codeTrading
Market value USD
Unrealised
USD
8,960,675 (19,511)
Note 15 - Securities lending
lending agents.
Note 13 - Open positions on option contracts (continued)
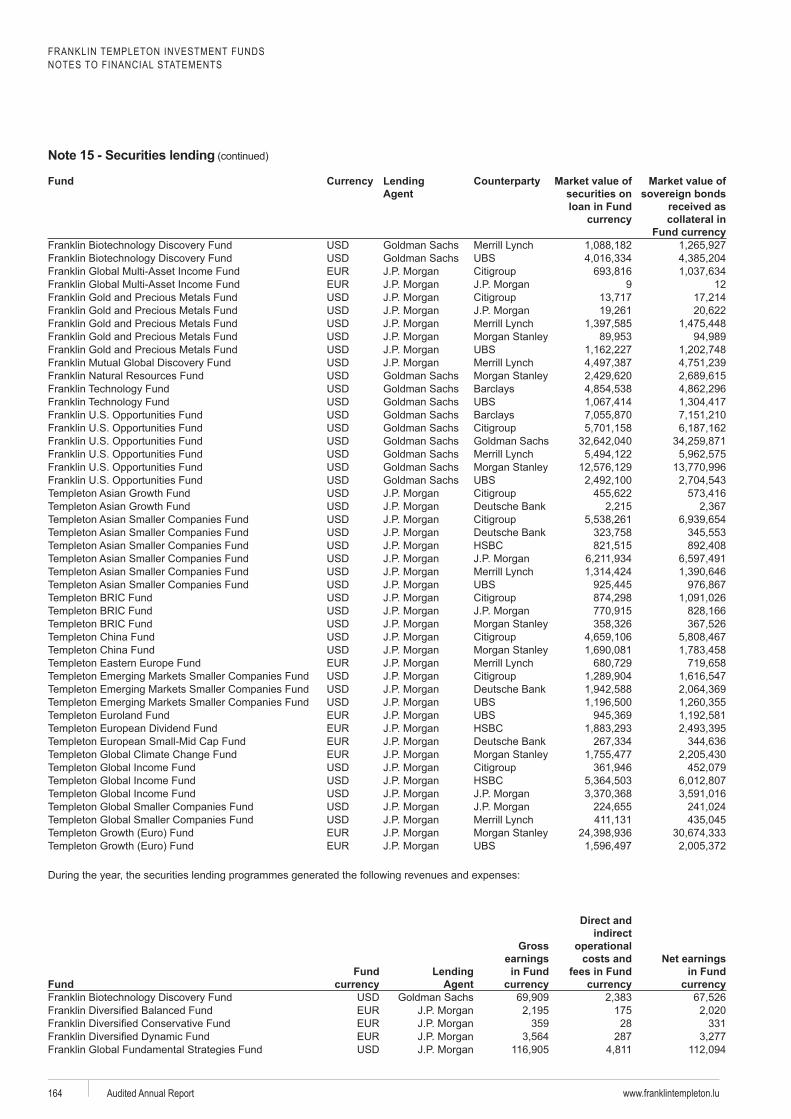
FRANKLIN TEMPLETON INVESTMENT FUNDSNOTES TO FINANCIAL STATEMENTS
www.franklintempleton.luAudited Annual Report164
Fund Lending Agent
Market value of securities on loan in Fund
Market value of sovereign bonds
received as collateral in
Franklin Biotechnology Discovery FundFranklin Biotechnology Discovery Fund
9 12
Franklin Technology Fund BarclaysFranklin Technology Fund
Barclays
Deutsche Bank
Deutsche Bank
Deutsche Bank
Deutsche Bank
FundFund Lending
Agent
Gross earnings
in Fund
Direct and indirect
operational costs and
fees in Fund Net earnings
in Fund
Franklin Biotechnology Discovery Fund175
359 28 331287
Note 15 - Securities lending
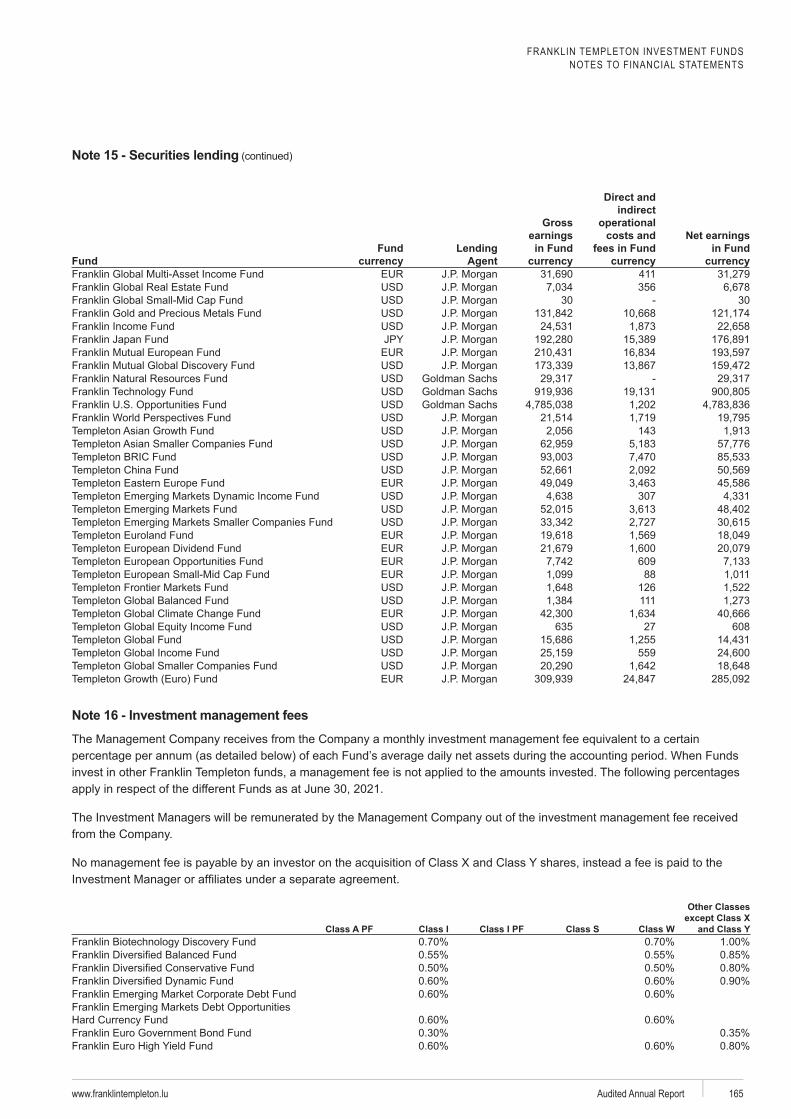
FRANKLIN TEMPLETON INVESTMENT FUNDSNOTES TO FINANCIAL STATEMENTS
www.franklintempleton.lu Audited Annual Report 165
FundFund Lending
Agent
Gross earnings
in Fund
Direct and indirect
operational costs and
fees in Fund Net earnings
in Fund
411356
30 - 30
-Franklin Technology Fund
143
307
60988
126111
635 27 608
559
Note 16 - Investment management fees
Class A PF Class I Class I PF Class S Class W
Other Classes except Class X
and Class YFranklin Biotechnology Discovery Fund
Note 15 - Securities lending
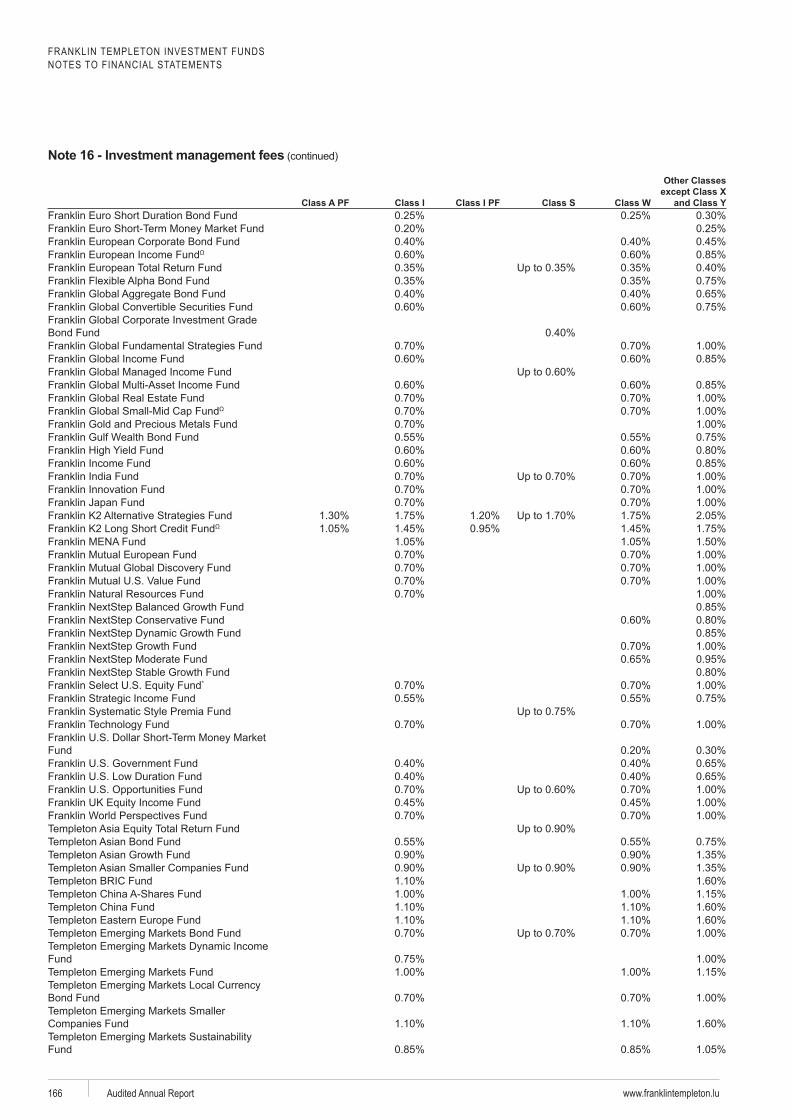
FRANKLIN TEMPLETON INVESTMENT FUNDSNOTES TO FINANCIAL STATEMENTS
www.franklintempleton.luAudited Annual Report166
Class A PF Class I Class I PF Class S Class W
Other Classes except Class X
and Class YFranklin Euro Short Duration Bond Fund
Fund
Bond Fund
Fund
Franklin Gulf Wealth Bond Fund
Fund
Franklin Franklin Franklin Franklin Franklin Franklin
*
FundFranklin Technology Fund
Fund
Fund
Bond Fund
Fund
Note 16 - Investment management fees
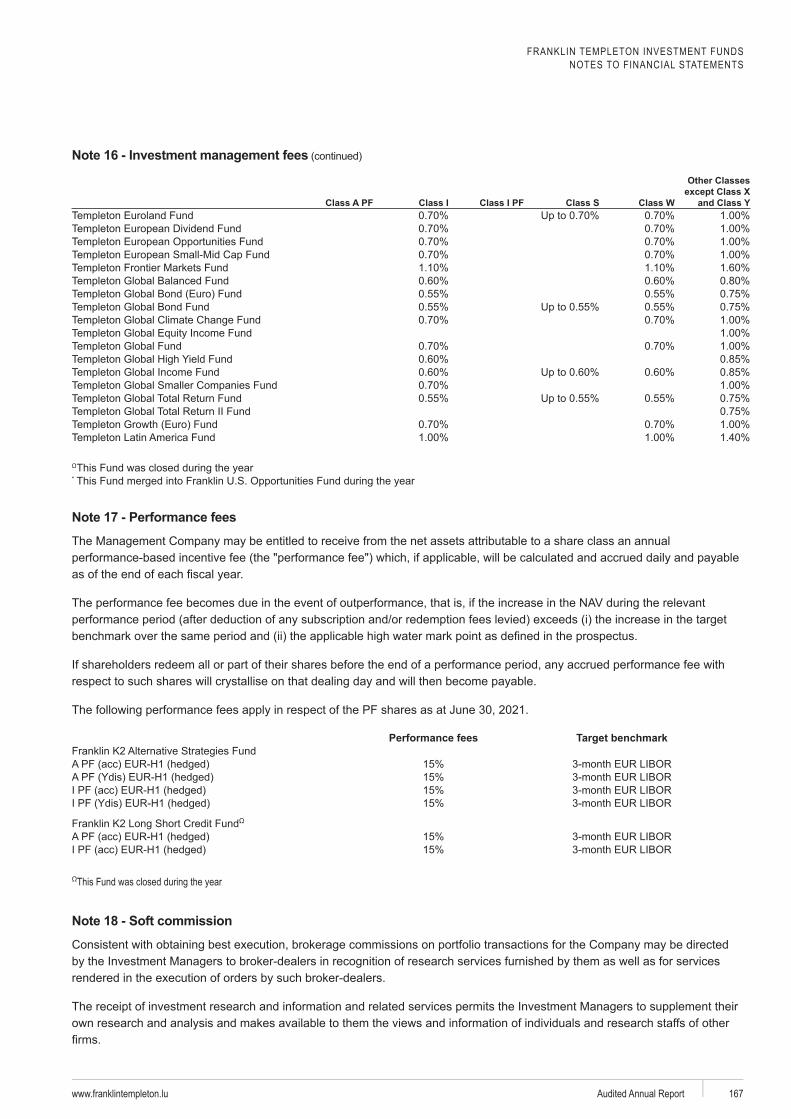
FRANKLIN TEMPLETON INVESTMENT FUNDSNOTES TO FINANCIAL STATEMENTS
www.franklintempleton.lu Audited Annual Report 167
Class A PF Class I Class I PF Class S Class W
Other Classes except Class X
and Class Y
*
Note 17 - Performance fees
Performance fees Target benchmark
acc
acc
Fundacc
acc
This Fund was closed during the year
Note 18 - Soft commission
Note 16 - Investment management fees
FRANKLIN TEMPLETON INVESTMENT FUNDSNOTES TO FINANCIAL STATEMENTS
www.franklintempleton.luAudited Annual Report168
condition.
Note 20 - Taxation
Note 21 - Share classes
Note 18 - Soft commission
FRANKLIN TEMPLETON INVESTMENT FUNDSNOTES TO FINANCIAL STATEMENTS
www.franklintempleton.lu Audited Annual Report 169
Note 21 - Share classes
FRANKLIN TEMPLETON INVESTMENT FUNDSNOTES TO FINANCIAL STATEMENTS
www.franklintempleton.luAudited Annual Report170
Bdis
acc
Dollar Short-
Market Fund
Templeton Asian Bond
Fund
Templeton
Fund
Templeton Asian Smaller
Companies Fund
(USD) (USD) (USD) (USD)
105Grand total
Templeton Global Bond
Fund(USD)
Grand total
Note 21 - Share classes
FRANKLIN TEMPLETON INVESTMENT FUNDSNOTES TO FINANCIAL STATEMENTS
www.franklintempleton.lu Audited Annual Report 171
Note 23 - Expenses reimbursement
Note 24 - Other Charges
Templeton China A-Shares
Fund
Templeton European
Opportunities Fund
Templeton European
Small-Mid Cap Fund
(USD) (EUR) (EUR)
213
Paying agent fees195
Tax fees 46Grand total
Note 25 - Statement of changes in the investment portfolio
Note 26 - Transaction costs
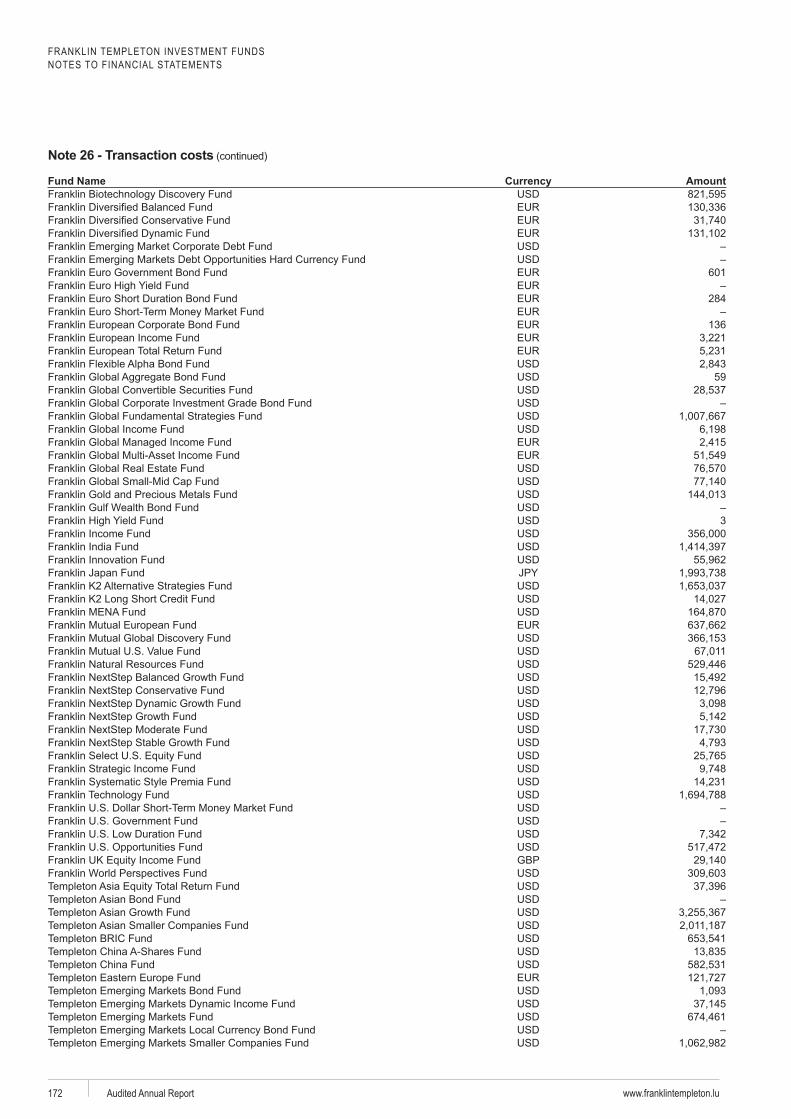
FRANKLIN TEMPLETON INVESTMENT FUNDSNOTES TO FINANCIAL STATEMENTS
www.franklintempleton.luAudited Annual Report172
Fund Name AmountFranklin Biotechnology Discovery Fund
601
Franklin Euro Short Duration Bond Fund 284
136
59
Franklin Gulf Wealth Bond Fund3
Franklin Franklin Franklin Franklin Franklin Franklin
FundFranklin Technology Fund
GBP
Note 26 - Transaction costs
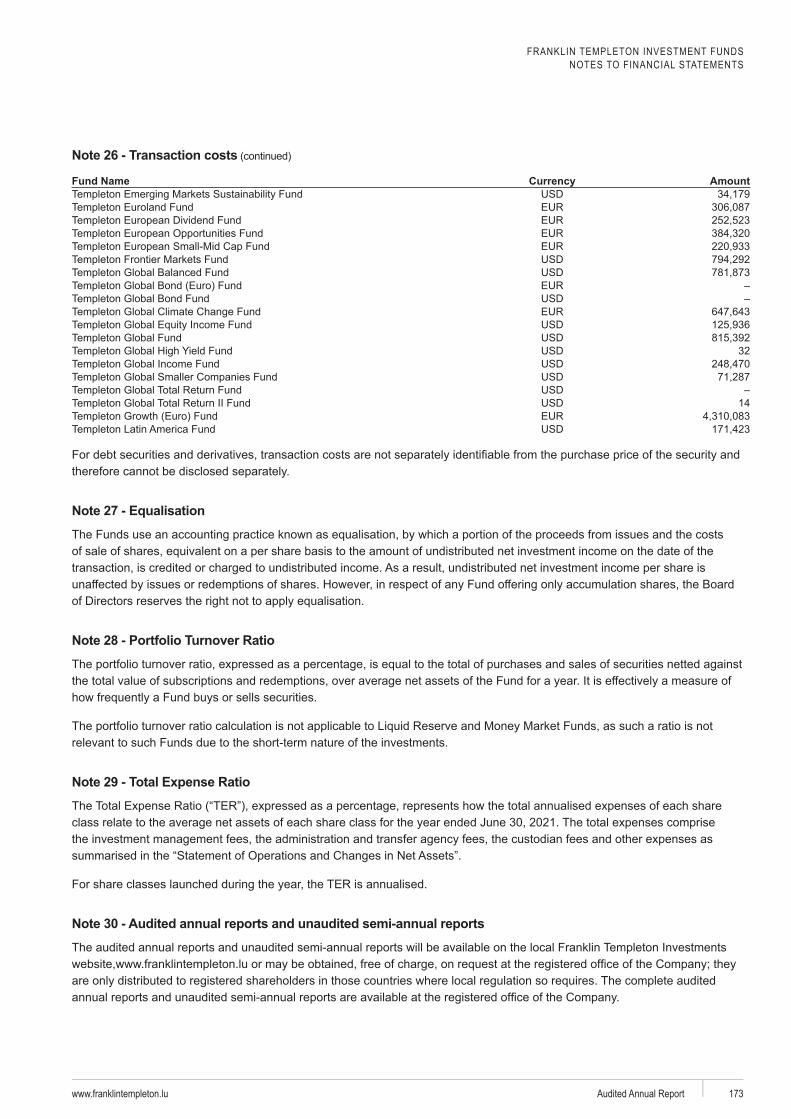
FRANKLIN TEMPLETON INVESTMENT FUNDSNOTES TO FINANCIAL STATEMENTS
www.franklintempleton.lu Audited Annual Report 173
Fund Name Amount
32
14
Note 27 - Equalisation
Note 28 - Portfolio Turnover Ratio
Note 29 - Total Expense Ratio
Note 30 - Audited annual reports and unaudited semi-annual reports
Note 26 - Transaction costs
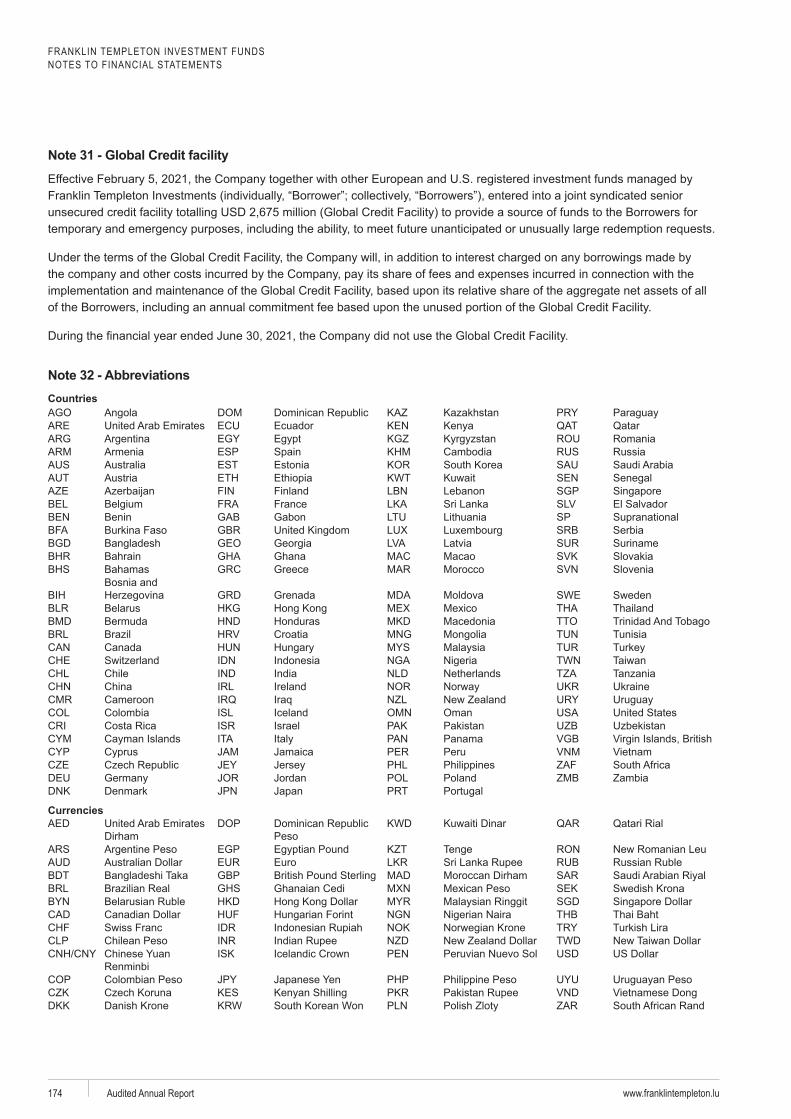
FRANKLIN TEMPLETON INVESTMENT FUNDSNOTES TO FINANCIAL STATEMENTS
www.franklintempleton.luAudited Annual Report174
Note 32 - AbbreviationsCountries
ParaguayEcuador Kenya
KGZESPEST Estonia South Korea
KWT SenegalFinland SGPFrance El Salvador
Benin SPBurkina Faso
BGD Bangladesh GeorgiaBahrain Ghana Slovakia
Greece SloveniaBosnia and
Grenada SWEBelarus Thailand
TunisiaTurkey
Pakistan
PeruJerseyJordan Poland
Portugal
Currencies
PesoKWD
EGP KZT TengeEuro
BDT Bangladeshi Taka GBP British Pound SterlingSEKSGD
Thai Baht
TWD
KES Kenyan ShillingDKK Danish Krone South Korean Won Polish Zloty
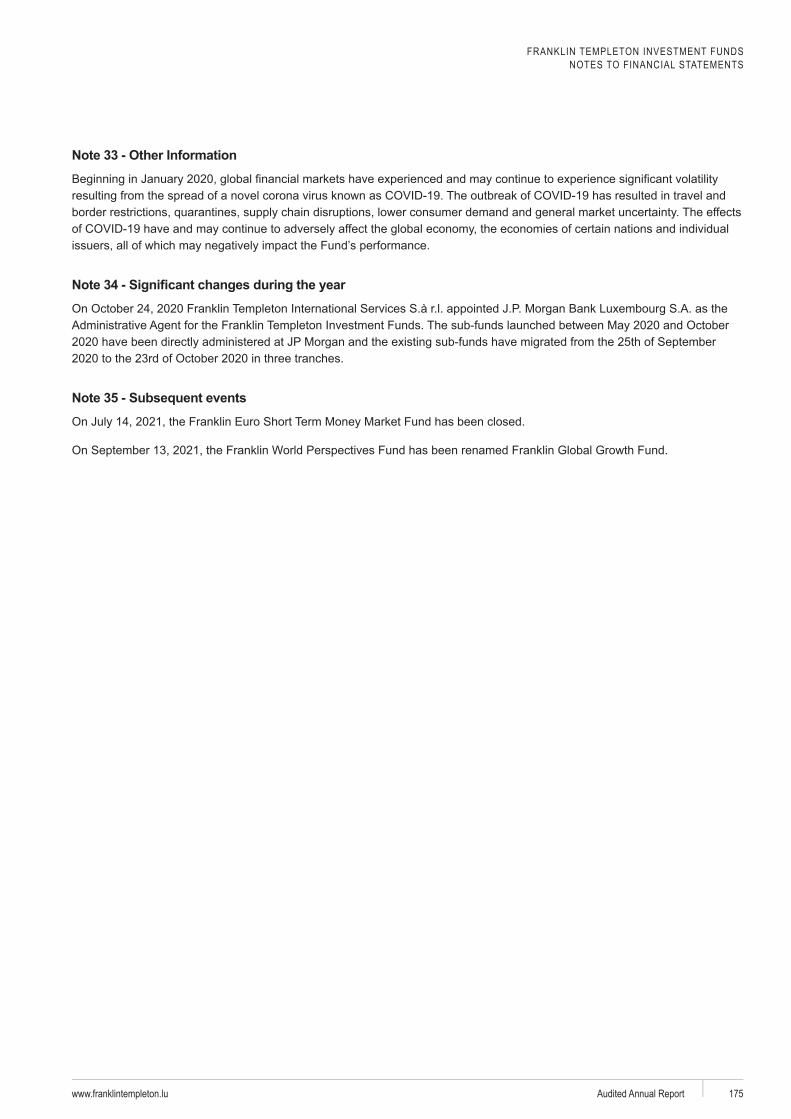
FRANKLIN TEMPLETON INVESTMENT FUNDSNOTES TO FINANCIAL STATEMENTS
www.franklintempleton.lu Audited Annual Report 175
Note 33 - Other Information
Note 35 - Subsequent events
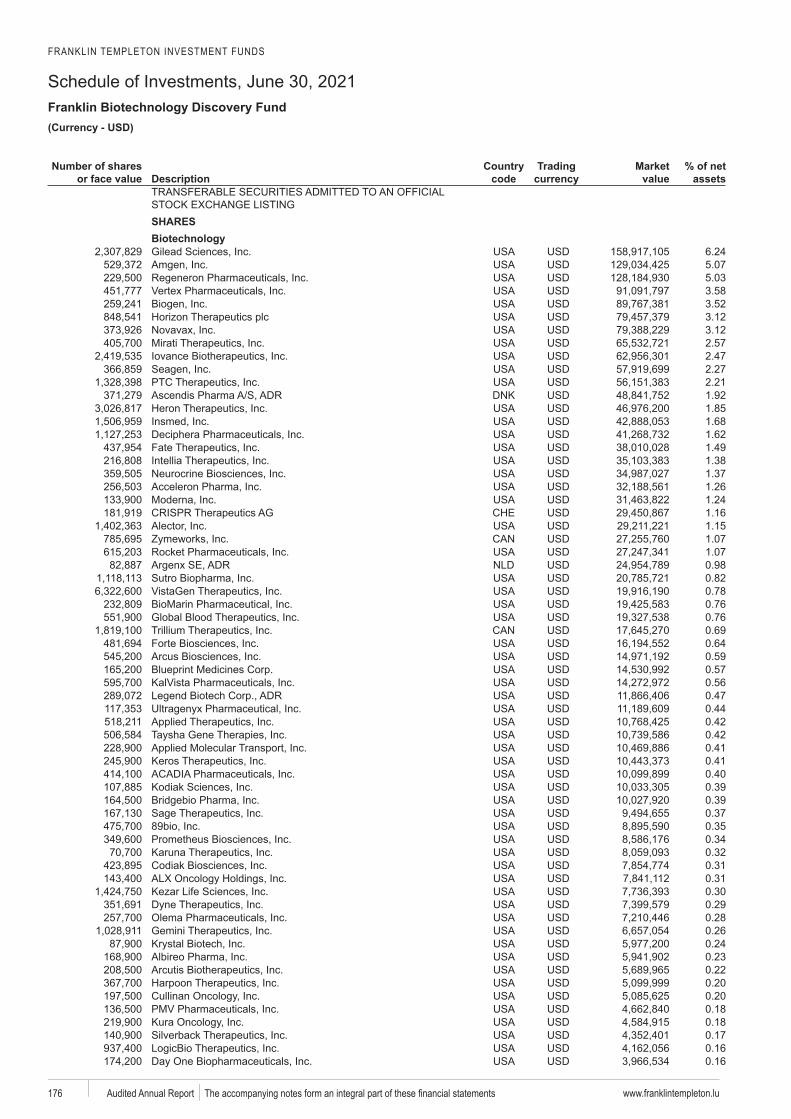
FRANKLIN TEMPLETON INVESTMENT FUNDS
Schedule of Investments, June 30, 2021Franklin Biotechnology Discovery Fund
www.franklintempleton.lu176 Audited Annual Report
USD)
Number of shares or face value Description
code
Trading Market value
% of net assets
SHARES
6.245.075.033.583.523.123.122.57
2.47Seagen 2.27
2.211.921.851.681.621.491.381.371.261.241.161.151.071.070.98
Sutro 0.820.780.760.760.690.640.590.570.560.470.440.42
Taysha 0.420.41
Keros 0.410.400.390.390.370.350.34
Karuna 0.320.310.310.300.290.280.260.240.23
0.220.200.200.180.180.170.160.16
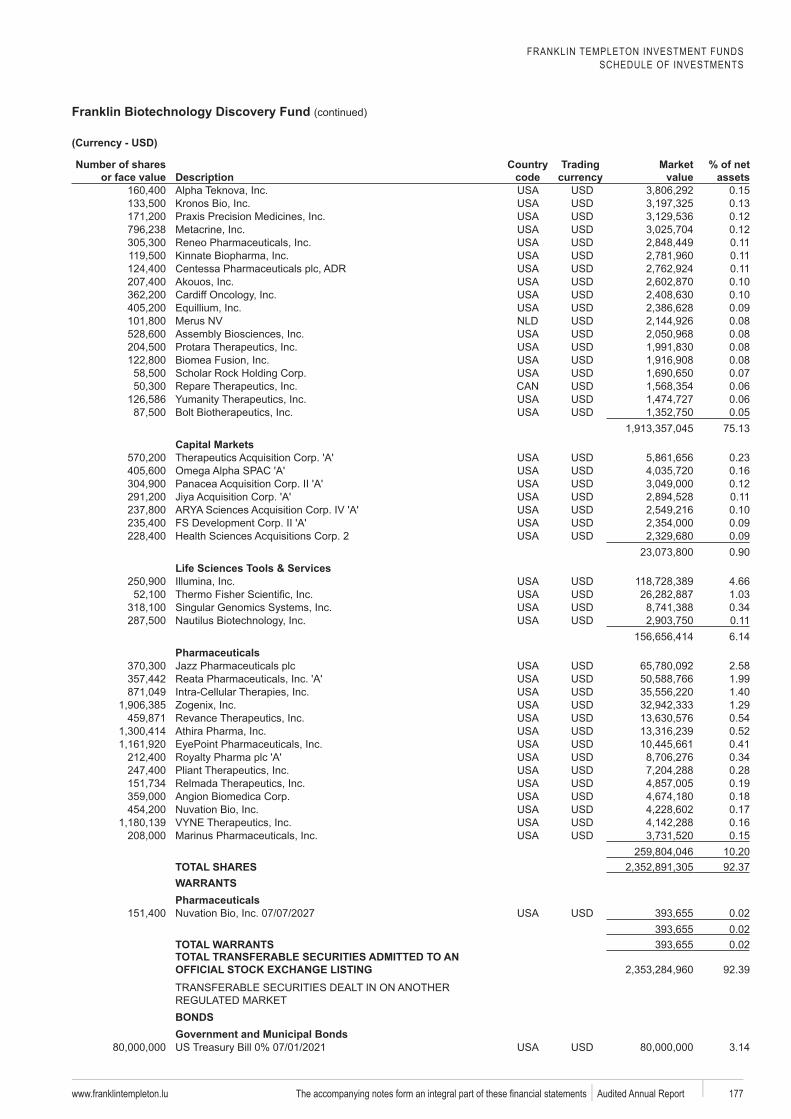
FRANKLIN TEMPLETON INVESTMENT FUNDSSCHEDULE OF INVESTMENTS
Franklin Biotechnology Discovery Fund (continued)
www.franklintempleton.lu 177 Audited Annual Report
Number of shares or face value Description
code
Trading Market value
% of net assets
Teknova 0.150.130.120.120.11
Kinnate 0.110.110.100.100.090.080.08
Protara 0.080.080.070.060.06
Bolt 0.0575.13
Capital Markets0.230.160.12
Jiya 0.110.100.090.090.90
Life Sciences Tools & Services4.661.030.340.116.14
Pharmaceuticals2.581.991.40
Zogenix 1.290.540.52
EyePoint 0.410.340.280.19
0.180.170.160.15
10.20TOTAL SHARES 92.37WARRANTSPharmaceuticals
0.020.02
TOTAL WARRANTS 0.02TOTAL TRANSFERABLE SECURITIES ADMITTED TO AN
92.39
BONDSGovernment and Municipal Bonds
3.14
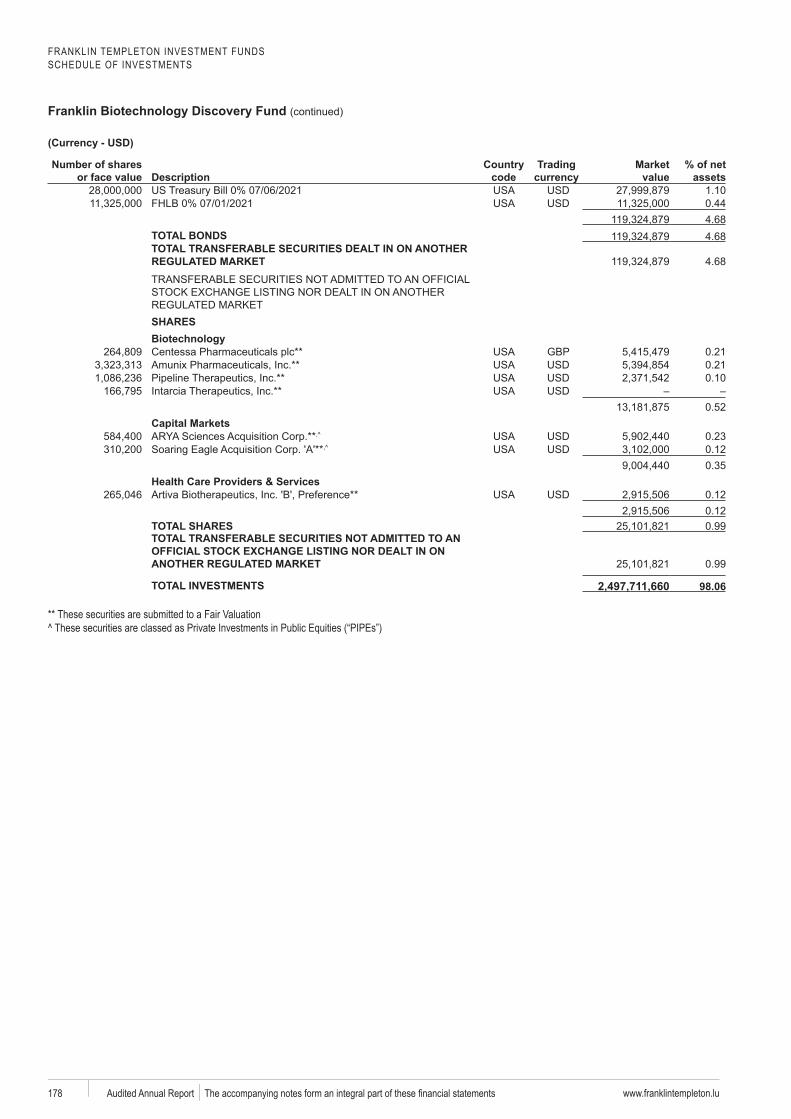
FRANKLIN TEMPLETON INVESTMENT FUNDSSCHEDULE OF INVESTMENTS
Franklin Biotechnology Discovery Fund (continued)
www.franklintempleton.lu178 Audited Annual Report
Number of shares or face value Description
code
Trading Market value
% of net assets
1.100.444.68
TOTAL BONDS 4.68TOTAL TRANSFERABLE SECURITIES DEALT IN ON ANOTHER
4.68
SHARES
GBP 0.210.210.10
0.52Capital Markets
0.230.120.35
Health Care Providers & Services 0.12
0.12TOTAL SHARES 0.99TOTAL TRANSFERABLE SECURITIES NOT ADMITTED TO AN
0.99
TOTAL INVESTMENTS 2,497,711,660 ** These securities are submitted to a Fair Valuation^ These securities are classed as Private Investments in Public Equities (“PIPEs”)

FRANKLIN TEMPLETON INVESTMENT FUNDS
Schedule of Investments, June 30, 2021
www.franklintempleton.lu 179 Audited Annual Report
EUR)
Number of shares or face value Description
code
Trading Market value
% of net assets
SHARESAerospace & Defense
0.520.52
Air Freight & Logistics0.280.28
Automobiles0.440.370.81
Banks1.000.670.53
ESP 0.520.310.290.260.233.81
Beverages0.380.370.281.03
0.680.220.90
Capital Markets0.700.540.111.35
Chemicals0.310.200.51
Communications Equipment0.250.25
0.260.26
Electric UtilitiesESP 0.43
0.350.220.130.111.24
Electrical Equipment0.380.38
Electronic Equipment, Instruments & Components0.290.29

FRANKLIN TEMPLETON INVESTMENT FUNDSSCHEDULE OF INVESTMENTS
(continued)
www.franklintempleton.lu180 Audited Annual Report
Number of shares or face value Description
code
Trading Market value
% of net assets
Entertainment0.370.290.160.82
0.360.250.61
Food & Staples Retailing0.520.52
Food Products0.570.350.92
Health Care Equipment & Supplies0.390.120.51
Health Care Providers & Services0.680.371.05
Hotels, Restaurants & Leisure0.240.24
Household Durables0.430.43
Household Products0.610.61
Industrial Conglomerates0.470.360.341.17
Insurance0.570.370.350.330.211.83
Interactive Media & Services1.090.610.410.212.32
Internet & Direct Marketing Retail719 1.04
0.380.251.67
IT Services0.470.420.41
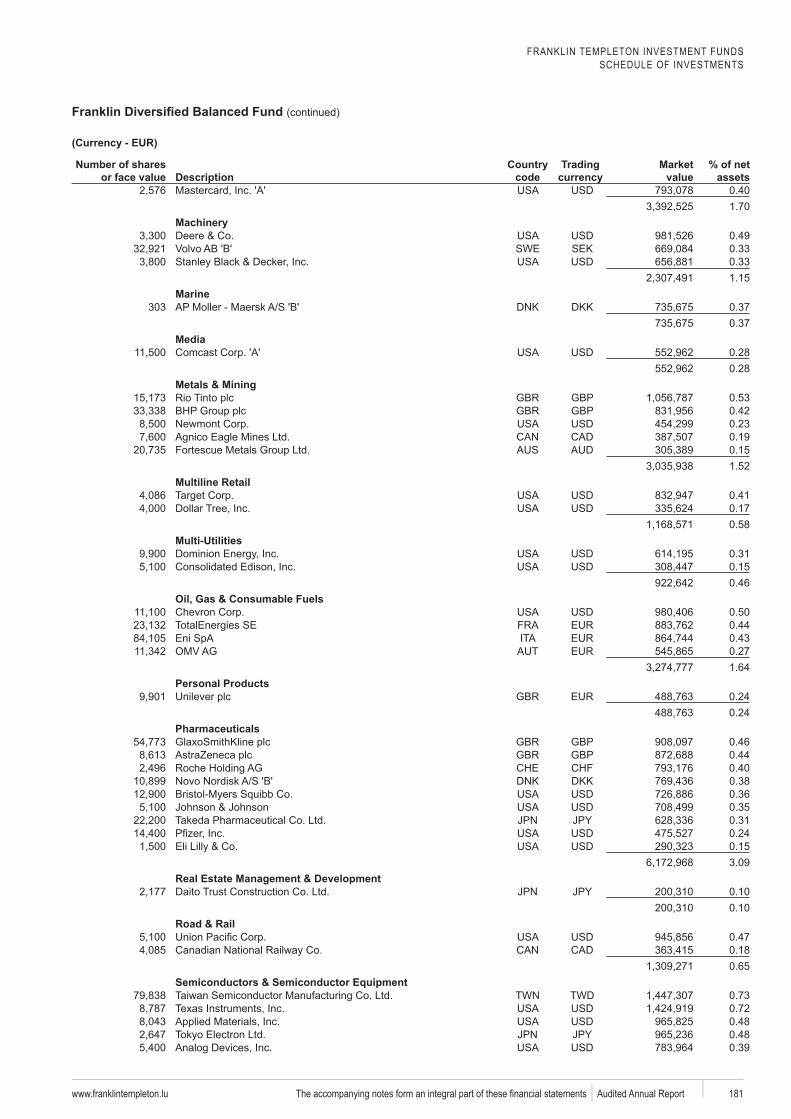
FRANKLIN TEMPLETON INVESTMENT FUNDSSCHEDULE OF INVESTMENTS
(continued)
www.franklintempleton.lu 181 Audited Annual Report
Number of shares or face value Description
code
Trading Market value
% of net assets
0.401.70
0.49SWE SEK 0.33
0.331.15
Marine303 DKK 0.37
0.37Media
0.280.28
Metals & MiningGBP 0.53GBP 0.42
0.230.190.151.52
Multiline Retail0.410.170.58
Multi-Utilities0.310.150.46
Oil, Gas & Consumable Fuels0.50
TotalEnergies SE 0.440.430.271.64
Personal Products0.240.24
PharmaceuticalsGBP 0.46GBP 0.44
0.40DKK 0.38
0.360.350.310.240.153.09
Real Estate Management & Development0.100.10
Road & Rail0.470.180.65
Semiconductors & Semiconductor EquipmentTWD 0.73
0.720.480.480.39
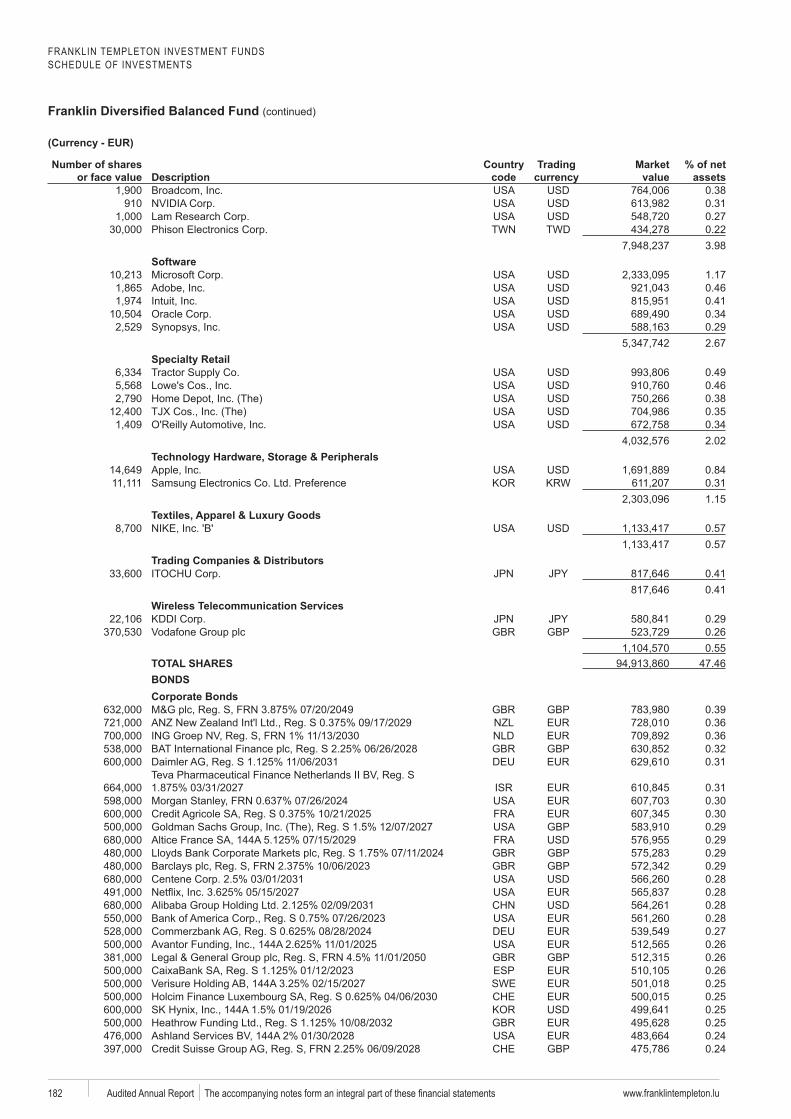
FRANKLIN TEMPLETON INVESTMENT FUNDSSCHEDULE OF INVESTMENTS
(continued)
www.franklintempleton.lu182 Audited Annual Report
Number of shares or face value Description
code
Trading Market value
% of net assets
0.38910 0.31
0.27TWD 0.22
3.98
1.170.460.410.340.292.67
0.490.460.380.350.342.02
0.840.311.15
0.570.57
Trading Companies & Distributors0.410.41
Wireless Telecommunication Services0.29
GBP 0.260.55
TOTAL SHARES 47.46BONDSCorporate Bonds
GBP 0.390.360.36
GBP 0.320.31
0.310.300.30
GBP 0.290.29
GBP 0.29GBP 0.29
0.280.280.280.280.270.26
GBP 0.26ESP 0.26SWE 0.25
0.250.250.250.24
GBP 0.24
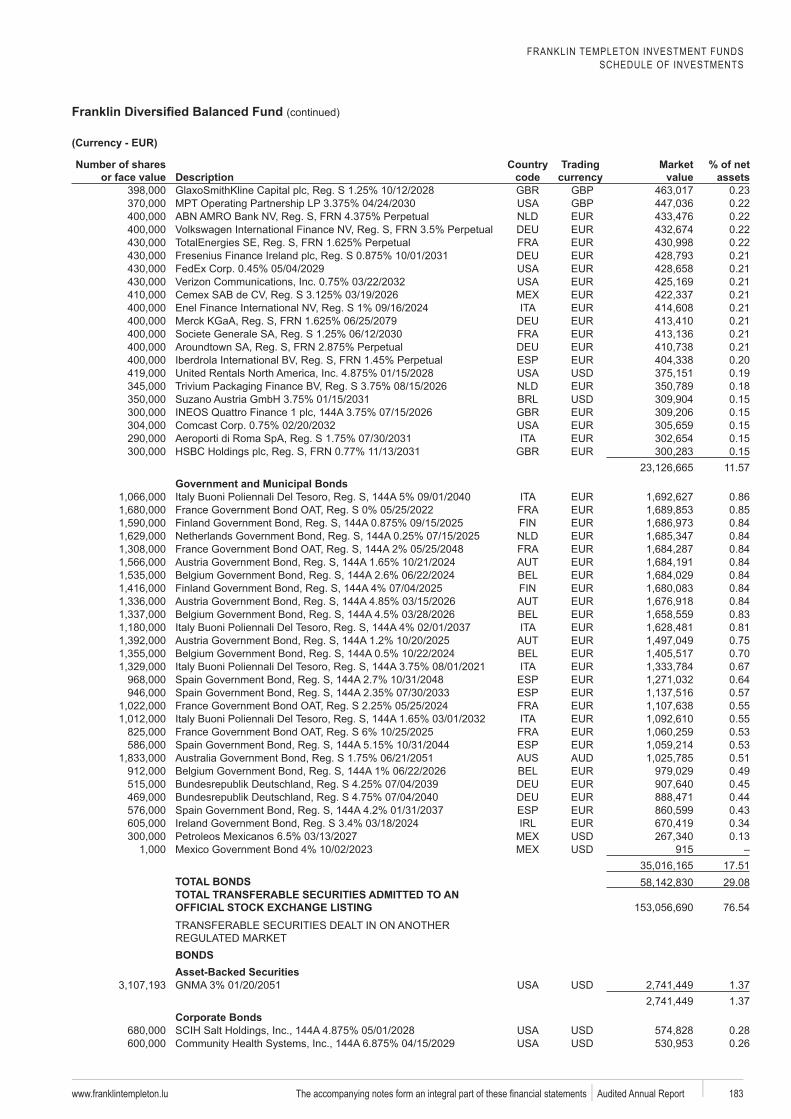
FRANKLIN TEMPLETON INVESTMENT FUNDSSCHEDULE OF INVESTMENTS
(continued)
www.franklintempleton.lu 183 Audited Annual Report
Number of shares or face value Description
code
Trading Market value
% of net assets
GBP 0.23GBP 0.22
0.220.220.220.210.210.210.210.210.210.210.21
ESP 0.200.190.180.150.150.150.150.15
11.57Government and Municipal Bonds
0.860.850.840.840.840.840.840.840.840.830.810.750.700.67
ESP 0.64ESP 0.57
0.550.550.53
ESP 0.530.510.490.450.44
ESP 0.430.340.13
91517.51
TOTAL BONDS 29.08TOTAL TRANSFERABLE SECURITIES ADMITTED TO AN
76.54
BONDSAsset-Backed Securities
1.371.37
Corporate Bonds0.280.26
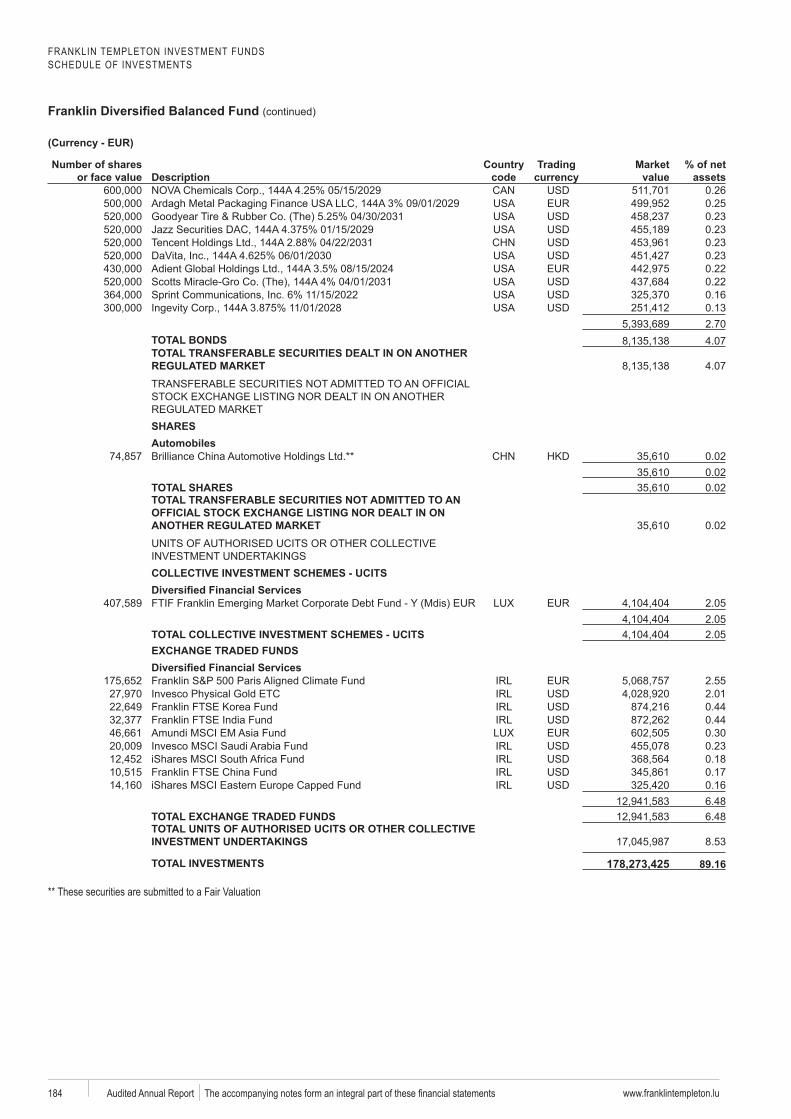
FRANKLIN TEMPLETON INVESTMENT FUNDSSCHEDULE OF INVESTMENTS
(continued)
www.franklintempleton.lu184 Audited Annual Report
Number of shares or face value Description
code
Trading Market value
% of net assets
0.260.250.230.230.230.230.220.220.160.132.70
TOTAL BONDS 4.07TOTAL TRANSFERABLE SECURITIES DEALT IN ON ANOTHER
4.07
SHARESAutomobiles
0.020.02
TOTAL SHARES 0.02TOTAL TRANSFERABLE SECURITIES NOT ADMITTED TO AN
0.02
COLLECTIVE INVESTMENT SCHEMES - UCITS
2.052.05
TOTAL COLLECTIVE INVESTMENT SCHEMES - UCITS 2.05EXCHANGE TRADED FUNDS
2.552.01
Franklin FTSE Korea Fund 0.440.440.300.230.180.170.166.48
TOTAL EXCHANGE TRADED FUNDS 6.48TOTAL UNITS OF AUTHORISED UCITS OR OTHER COLLECTIVE
8.53
TOTAL INVESTMENTS 178,273,425a
** These securities are submitted to a Fair Valuation
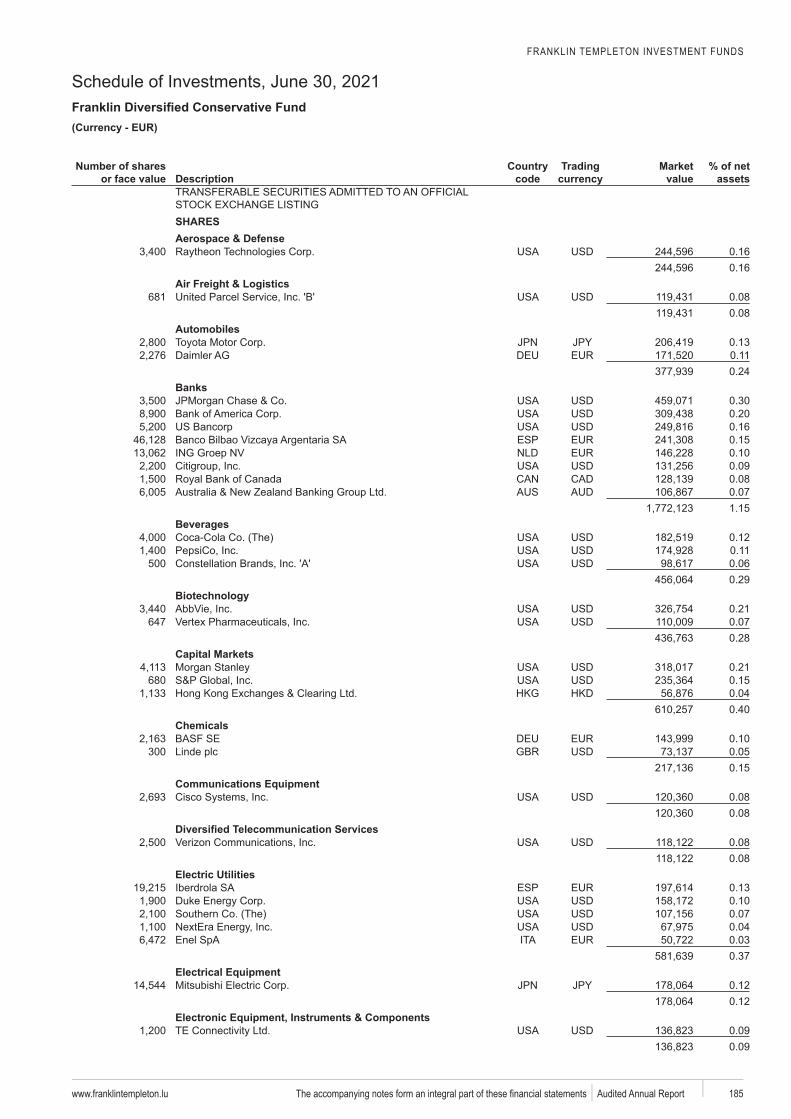
FRANKLIN TEMPLETON INVESTMENT FUNDS
Schedule of Investments, June 30, 2021
www.franklintempleton.lu 185 Audited Annual Report
EUR)
Number of shares or face value Description
code
Trading Market value
% of net assets
SHARESAerospace & Defense
0.160.16
Air Freight & Logistics681 0.08
0.08Automobiles
0.130.110.24
Banks0.300.200.16
ESP 0.150.100.090.080.071.15
Beverages0.120.11
500 0.060.29
0.21647 0.07
0.28Capital Markets
0.21680 0.15
0.040.40
Chemicals0.10
300 0.050.15
Communications Equipment0.080.08
0.080.08
Electric UtilitiesESP 0.13
0.100.070.04
Enel 0.030.37
Electrical Equipment0.120.12
Electronic Equipment, Instruments & Components0.090.09
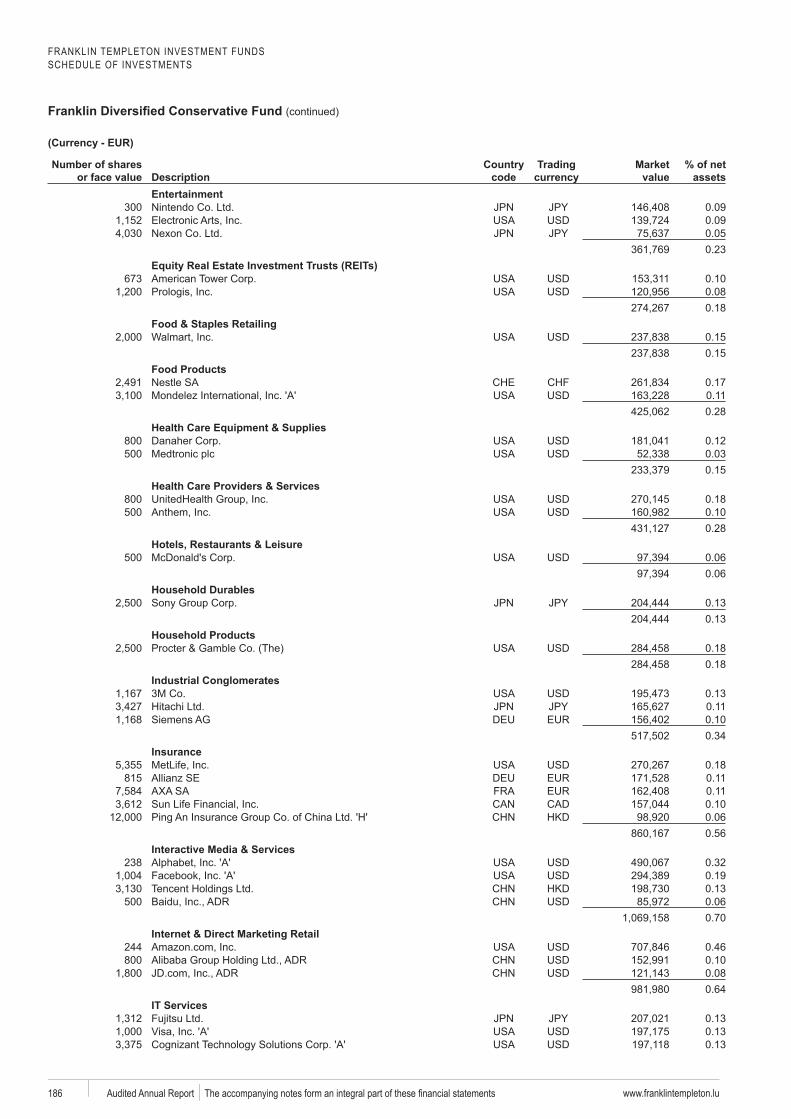
FRANKLIN TEMPLETON INVESTMENT FUNDSSCHEDULE OF INVESTMENTS
(continued)
www.franklintempleton.lu186 Audited Annual Report
Number of shares or face value Description
code
Trading Market value
% of net assets
Entertainment300 0.09
0.090.050.23
673 0.100.080.18
Food & Staples Retailing0.150.15
Food Products0.170.110.28
Health Care Equipment & Supplies800 0.12500 0.03
0.15Health Care Providers & Services
800 0.18500 0.10
0.28Hotels, Restaurants & Leisure
500 0.060.06
Household Durables0.130.13
Household Products0.180.18
Industrial Conglomerates0.130.110.100.34
Insurance0.18
815 0.110.110.100.060.56
Interactive Media & Services238 0.32
0.19Tencent 0.13
500 0.060.70
Internet & Direct Marketing Retail244 0.46800 0.10
0.080.64
IT Services0.130.130.13

FRANKLIN TEMPLETON INVESTMENT FUNDSSCHEDULE OF INVESTMENTS
(continued)
www.franklintempleton.lu 187 Audited Annual Report
Number of shares or face value Description
code
Trading Market value
% of net assets
500 0.100.49
700 0.14SWE SEK 0.10
800 0.090.33
Marine71 DKK 0.11
0.11Media
0.080.08
Metals & MiningGBP 0.16GBP 0.12
0.070.060.050.46
Multiline Retail0.130.060.19
Multi-Utilities0.100.050.15
Oil, Gas & Consumable Fuels0.15
TotalEnergies SE 0.13Eni 0.13
0.080.49
Personal Products0.070.07
PharmaceuticalsGBP 0.14GBP 0.13
584 0.12DKK 0.12
0.110.100.100.07
300 0.040.93
Real Estate Management & Development505 0.03
0.03Road & Rail
0.13935 0.06
0.19Semiconductors & Semiconductor Equipment
TWD 0.220.21
665 0.160.150.12
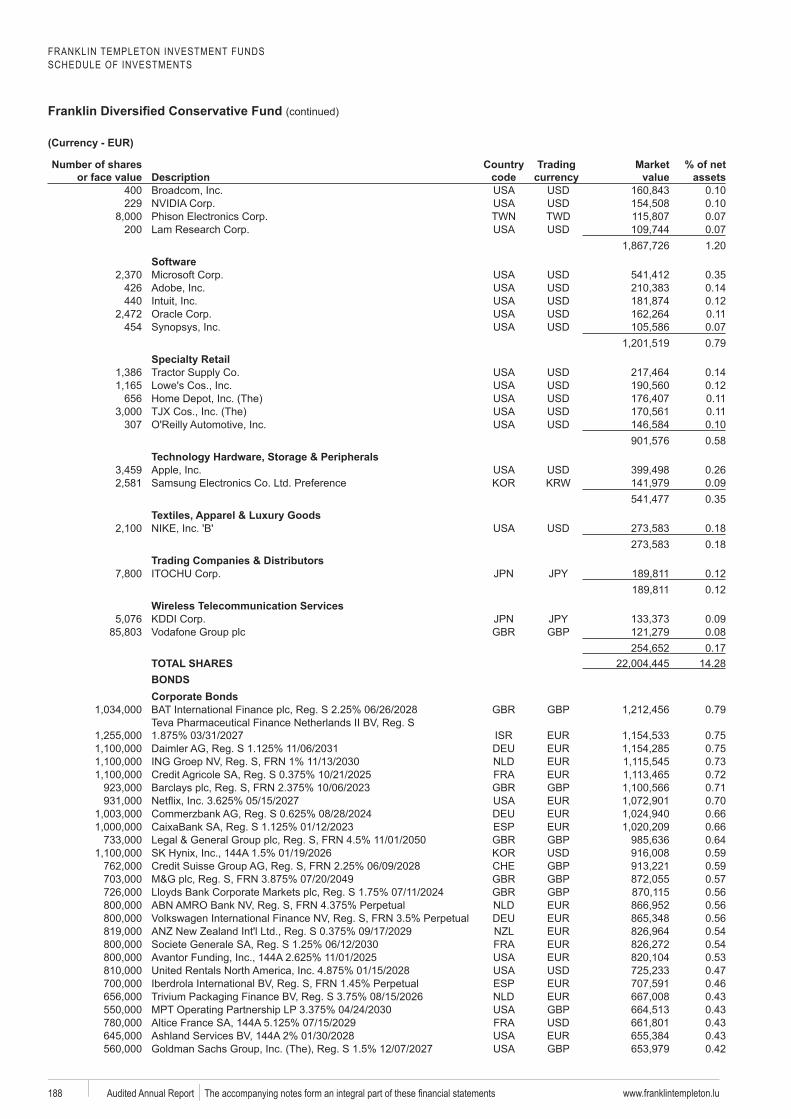
FRANKLIN TEMPLETON INVESTMENT FUNDSSCHEDULE OF INVESTMENTS
(continued)
www.franklintempleton.lu188 Audited Annual Report
Number of shares or face value Description
code
Trading Market value
% of net assets
400 0.10229 0.10
Phison TWD 0.07200 0.07
1.20
0.35426 0.14440 0.12
0.11454 0.07
0.79
0.140.12
656 0.110.11
307 0.100.58
0.260.090.35
0.180.18
Trading Companies & Distributors0.120.12
Wireless Telecommunication Services0.09
GBP 0.080.17
TOTAL SHARES 14.28BONDSCorporate Bonds
GBP 0.79Teva
0.750.750.730.72
GBP 0.710.700.66
ESP 0.66GBP 0.64
0.59GBP 0.59GBP 0.57GBP 0.56
0.560.560.54
Societe Generale 0.540.530.47
ESP 0.460.43
GBP 0.430.430.43
GBP 0.42
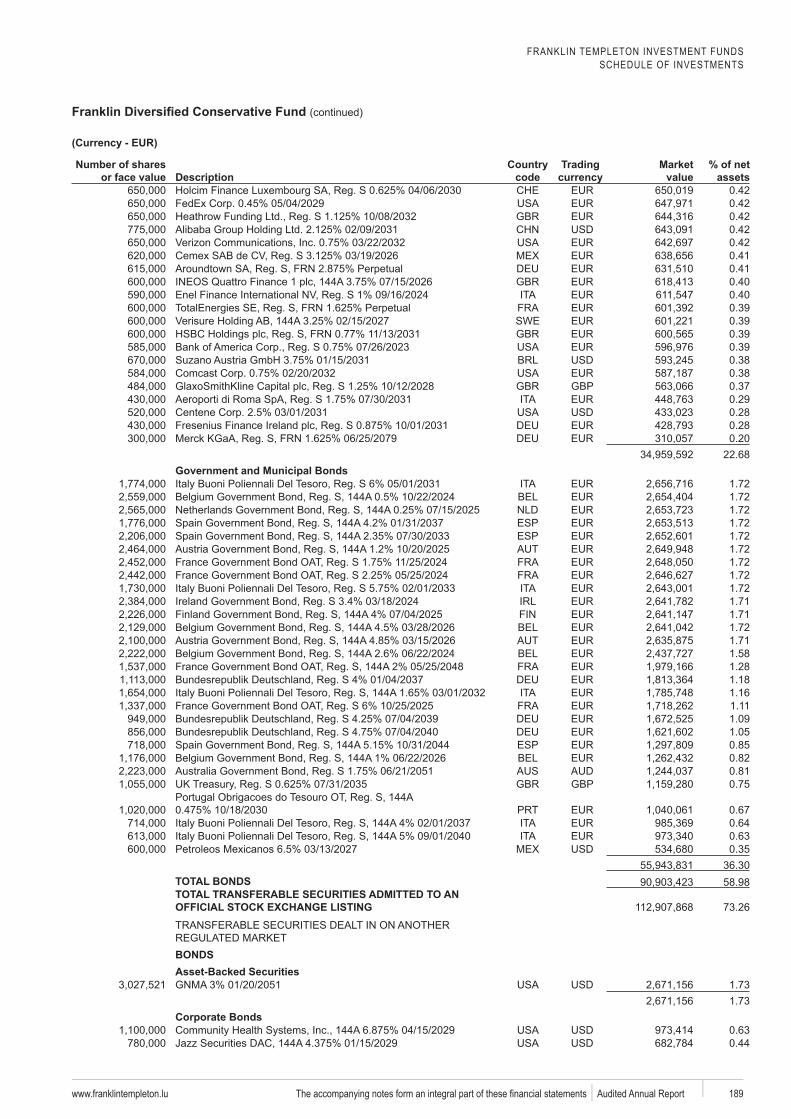
FRANKLIN TEMPLETON INVESTMENT FUNDSSCHEDULE OF INVESTMENTS
(continued)
www.franklintempleton.lu 189 Audited Annual Report
Number of shares or face value Description
code
Trading Market value
% of net assets
0.420.420.420.420.420.410.410.400.40
TotalEnergies 0.39SWE 0.39
0.390.390.380.38
GBP 0.370.290.280.280.20
22.68Government and Municipal Bonds
Buoni Poliennali 1.721.721.72
ESP 1.72ESP 1.72
1.721.721.72
Buoni Poliennali 1.721.711.711.721.711.581.281.18
Buoni Poliennali 1.161.111.091.05
ESP 0.850.820.81
GBP 0.75Portugal do Tesouro
0.67Buoni Poliennali 0.64Buoni Poliennali 0.63
Petroleos 0.3536.30
TOTAL BONDS 58.98TOTAL TRANSFERABLE SECURITIES ADMITTED TO AN
73.26
BONDSAsset-Backed Securities
1.731.73
Corporate Bonds0.630.44
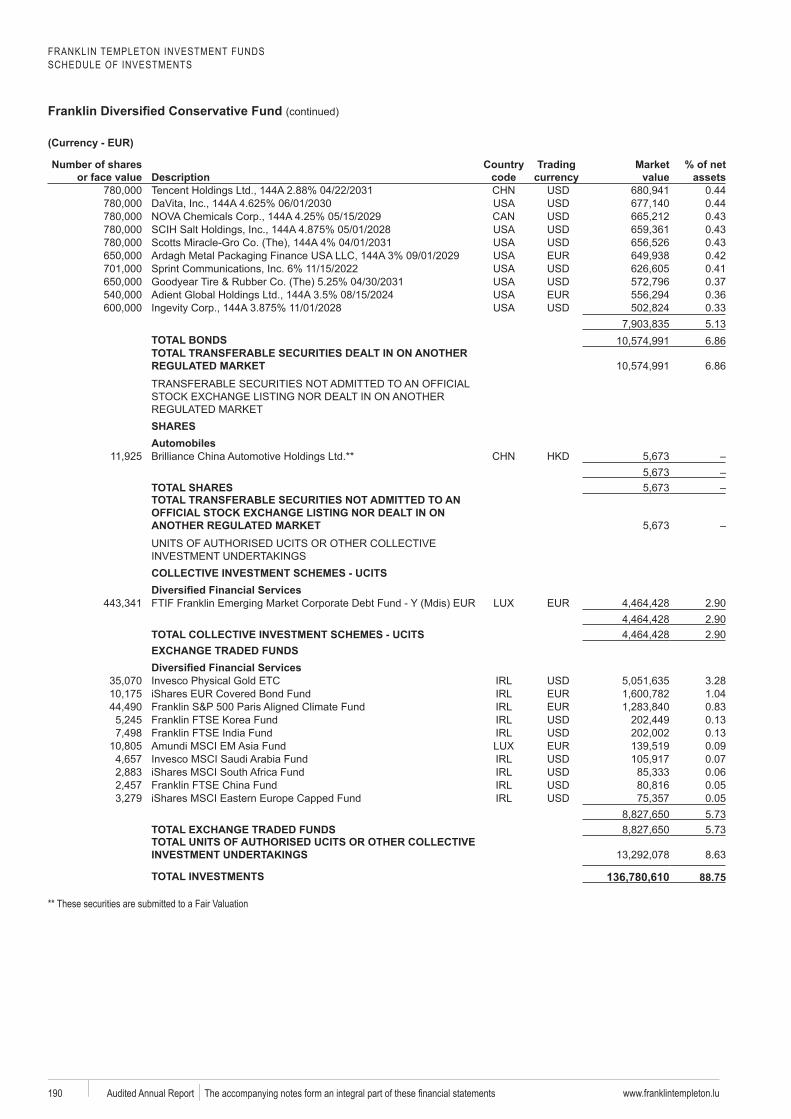
FRANKLIN TEMPLETON INVESTMENT FUNDSSCHEDULE OF INVESTMENTS
(continued)
www.franklintempleton.lu190 Audited Annual Report
Number of shares or face value Description
code
Trading Market value
% of net assets
Tencent 0.440.440.430.43
Gro 0.430.420.410.370.360.335.13
TOTAL BONDS 6.86TOTAL TRANSFERABLE SECURITIES DEALT IN ON ANOTHER
6.86
SHARESAutomobiles
TOTAL SHARESTOTAL TRANSFERABLE SECURITIES NOT ADMITTED TO AN
COLLECTIVE INVESTMENT SCHEMES - UCITS
2.902.90
TOTAL COLLECTIVE INVESTMENT SCHEMES - UCITS 2.90EXCHANGE TRADED FUNDS
3.28iShares 1.04
0.83Franklin FTSE Korea Fund 0.13
0.130.090.07
iShares 0.060.05
iShares 0.055.73
TOTAL EXCHANGE TRADED FUNDS 5.73TOTAL UNITS OF AUTHORISED UCITS OR OTHER COLLECTIVE
8.63
TOTAL INVESTMENTS 136,780,610a** These securities are submitted to a Fair Valuation
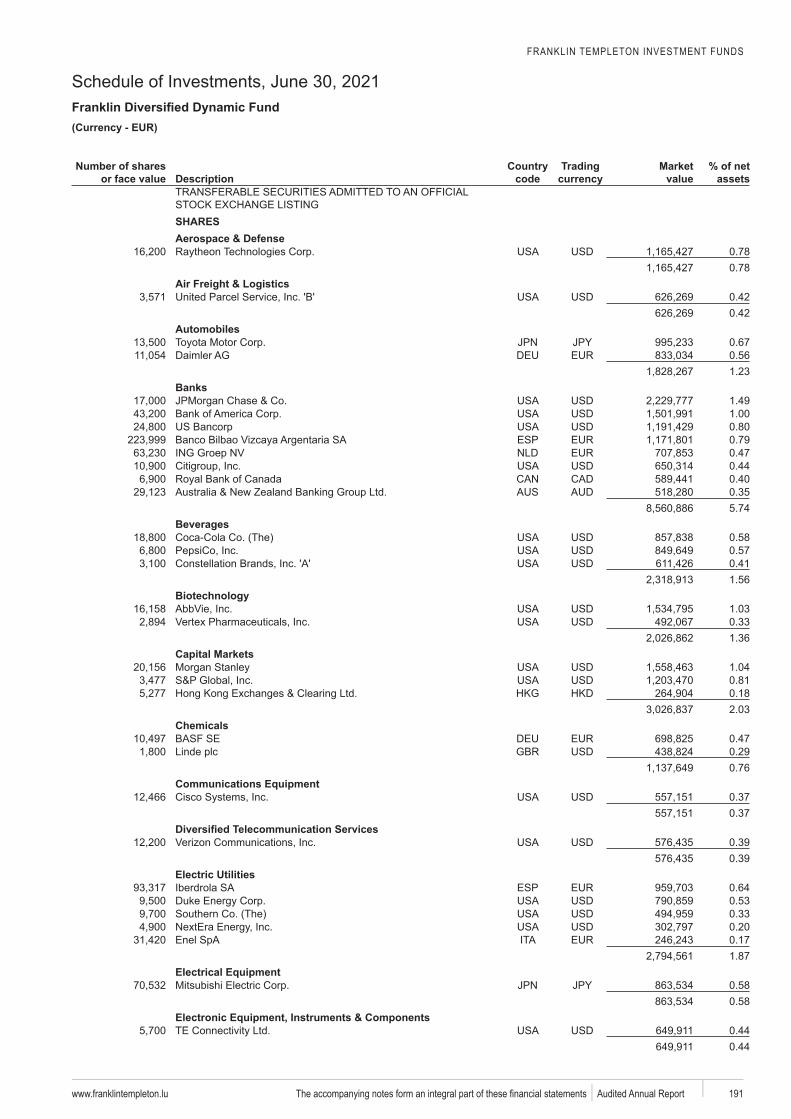
FRANKLIN TEMPLETON INVESTMENT FUNDS
Schedule of Investments, June 30, 2021
www.franklintempleton.lu 191 Audited Annual Report
EUR)
Number of shares or face value Description
code
Trading Market value
% of net assets
SHARESAerospace & Defense
0.780.78
Air Freight & Logistics0.420.42
Automobiles0.670.561.23
Banks1.491.000.80
ESP 0.790.470.440.400.355.74
Beverages0.580.570.411.56
1.030.331.36
Capital Markets1.040.810.182.03
Chemicals0.470.290.76
Communications Equipment0.370.37
0.390.39
Electric UtilitiesESP 0.64
0.530.330.200.171.87
Electrical Equipment0.580.58
Electronic Equipment, Instruments & Components0.440.44
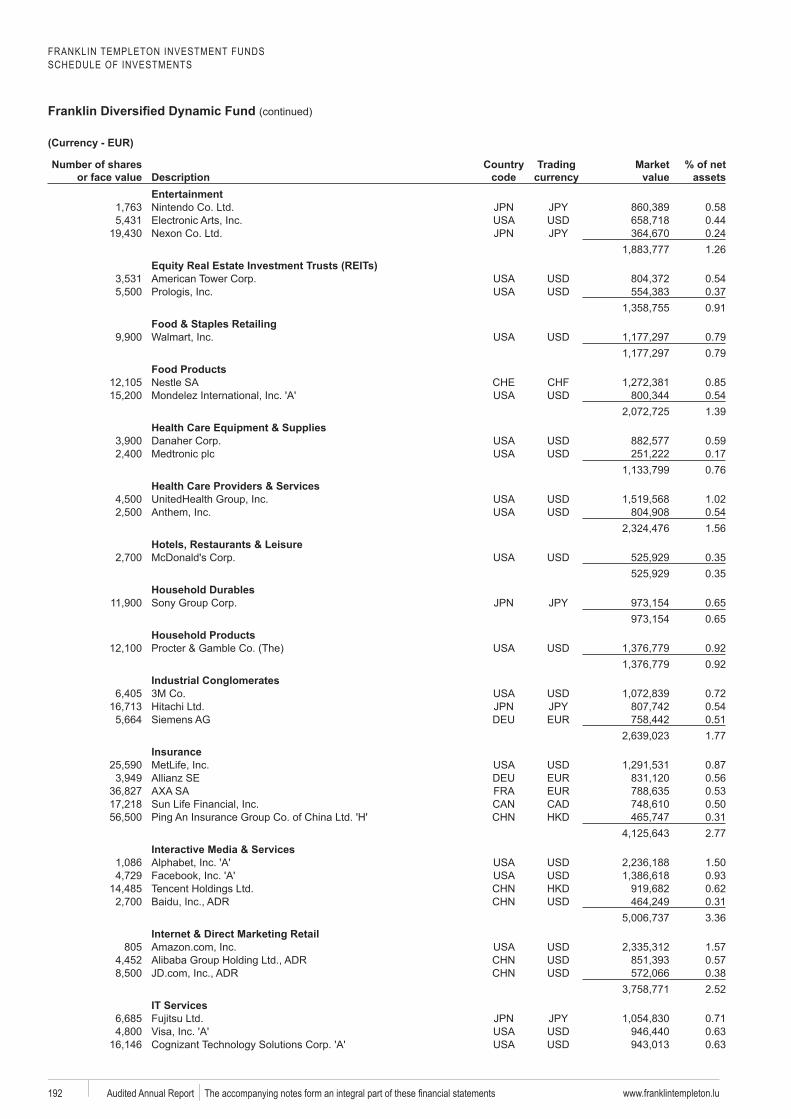
FRANKLIN TEMPLETON INVESTMENT FUNDSSCHEDULE OF INVESTMENTS
(continued)
www.franklintempleton.lu192 Audited Annual Report
Number of shares or face value Description
code
Trading Market value
% of net assets
Entertainment0.580.440.241.26
0.540.370.91
Food & Staples Retailing0.790.79
Food Products0.850.541.39
Health Care Equipment & Supplies0.590.170.76
Health Care Providers & Services1.020.541.56
Hotels, Restaurants & Leisure0.350.35
Household Durables0.650.65
Household Products0.920.92
Industrial Conglomerates0.720.540.511.77
Insurance0.870.560.530.500.312.77
Interactive Media & Services1.500.930.620.313.36
Internet & Direct Marketing Retail805 1.57
0.570.382.52
IT Services0.710.630.63
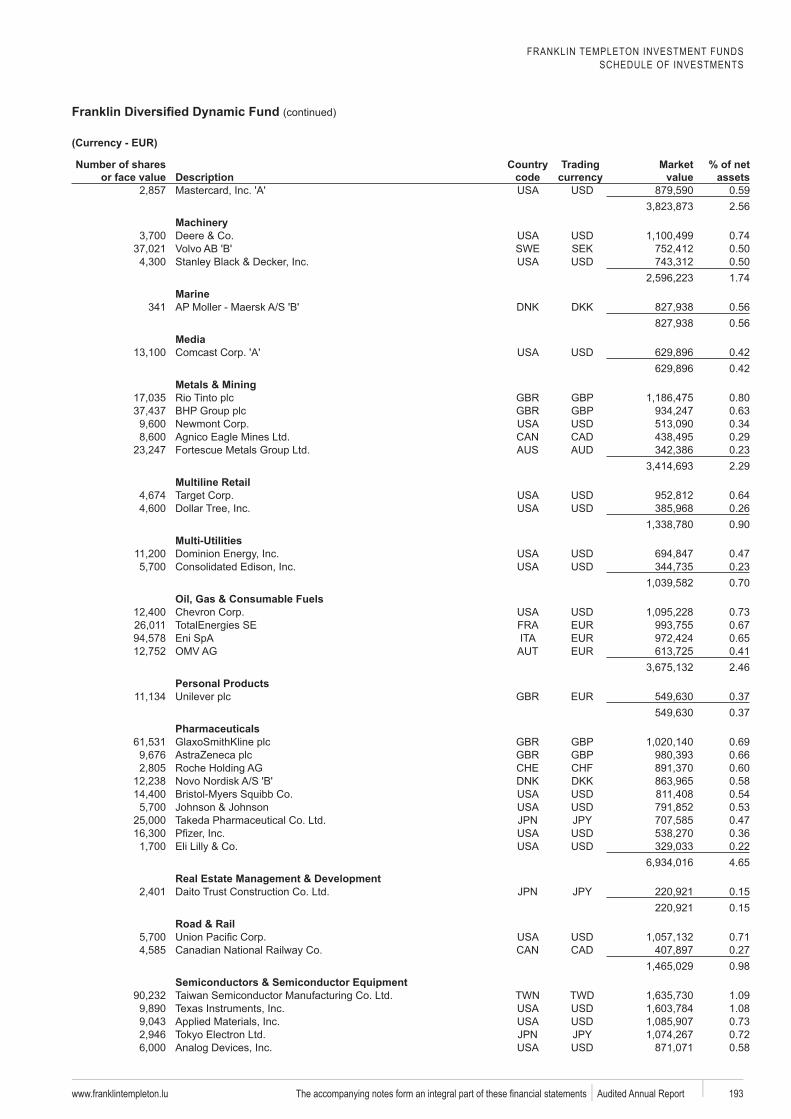
FRANKLIN TEMPLETON INVESTMENT FUNDSSCHEDULE OF INVESTMENTS
(continued)
www.franklintempleton.lu 193 Audited Annual Report
Number of shares or face value Description
code
Trading Market value
% of net assets
0.592.56
0.74SWE SEK 0.50
0.501.74
Marine341 DKK 0.56
0.56Media
0.420.42
Metals & MiningGBP 0.80GBP 0.63
0.340.290.232.29
Multiline Retail0.640.260.90
Multi-Utilities0.470.230.70
Oil, Gas & Consumable Fuels0.73
TotalEnergies SE 0.670.650.412.46
Personal Products0.370.37
PharmaceuticalsGBP 0.69GBP 0.66
0.60DKK 0.58
0.540.530.470.360.224.65
Real Estate Management & Development0.150.15
Road & Rail0.710.270.98
Semiconductors & Semiconductor EquipmentTWD 1.09
1.080.730.720.58

FRANKLIN TEMPLETON INVESTMENT FUNDSSCHEDULE OF INVESTMENTS
(continued)
www.franklintempleton.lu194 Audited Annual Report
Number of shares or face value Description
code
Trading Market value
% of net assets
0.570.520.40
TWD 0.336.02
1.740.680.620.520.433.99
0.750.690.560.540.533.07
1.270.461.73
0.860.86
Trading Companies & Distributors0.620.62
Wireless Telecommunication Services0.44
GBP 0.390.83
TOTAL SHARES 71.44BONDSCorporate Bonds
GBP 0.170.14
0.140.150.150.140.140.140.14
SWE 0.130.13
GBP 0.110.110.110.11
GBP 0.110.10
GBP 0.090.09
GBP 0.090.080.08
GBP 0.080.08
GBP 0.080.08
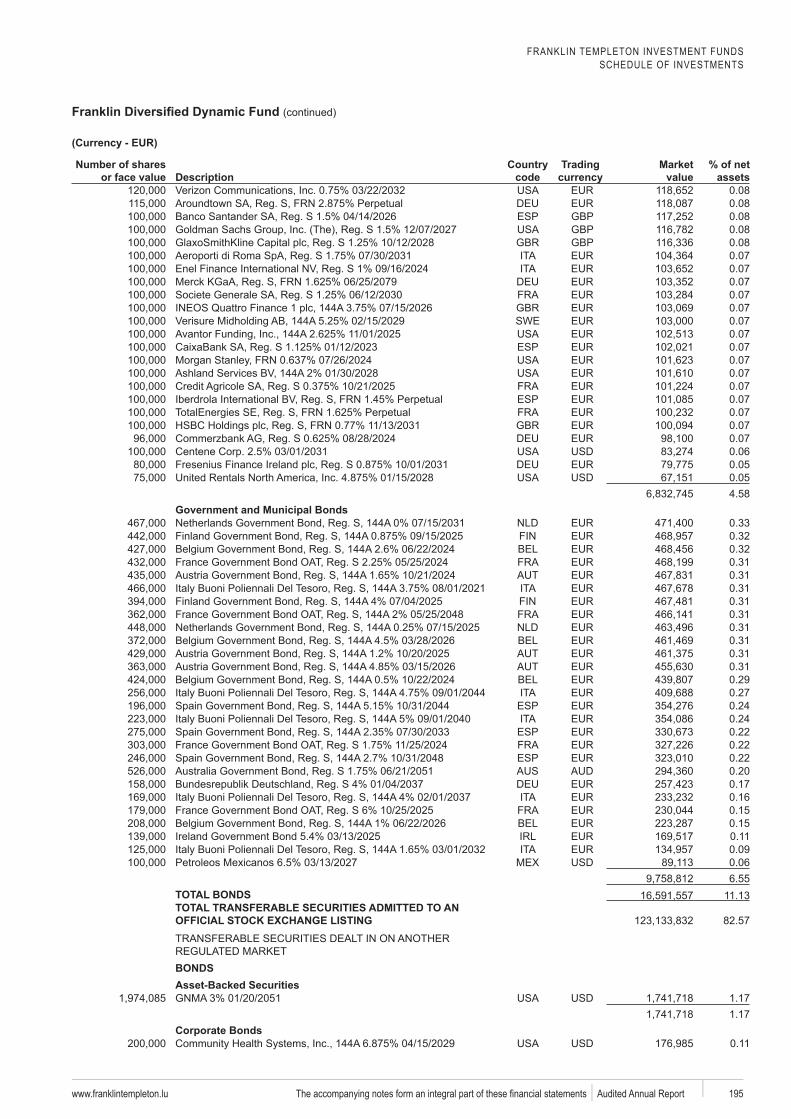
FRANKLIN TEMPLETON INVESTMENT FUNDSSCHEDULE OF INVESTMENTS
(continued)
www.franklintempleton.lu 195 Audited Annual Report
Number of shares or face value Description
code
Trading Market value
% of net assets
0.080.08
ESP GBP 0.08GBP 0.08GBP 0.08
0.070.070.070.070.07
SWE 0.070.07
ESP 0.070.070.070.07
ESP 0.070.070.070.070.060.050.054.58
Government and Municipal Bonds0.330.320.320.310.310.310.310.310.310.310.310.310.290.27
ESP 0.240.24
ESP 0.220.22
ESP 0.220.200.170.160.150.150.110.090.066.55
TOTAL BONDS 11.13TOTAL TRANSFERABLE SECURITIES ADMITTED TO AN
82.57
BONDSAsset-Backed Securities
1.171.17
Corporate Bonds0.11
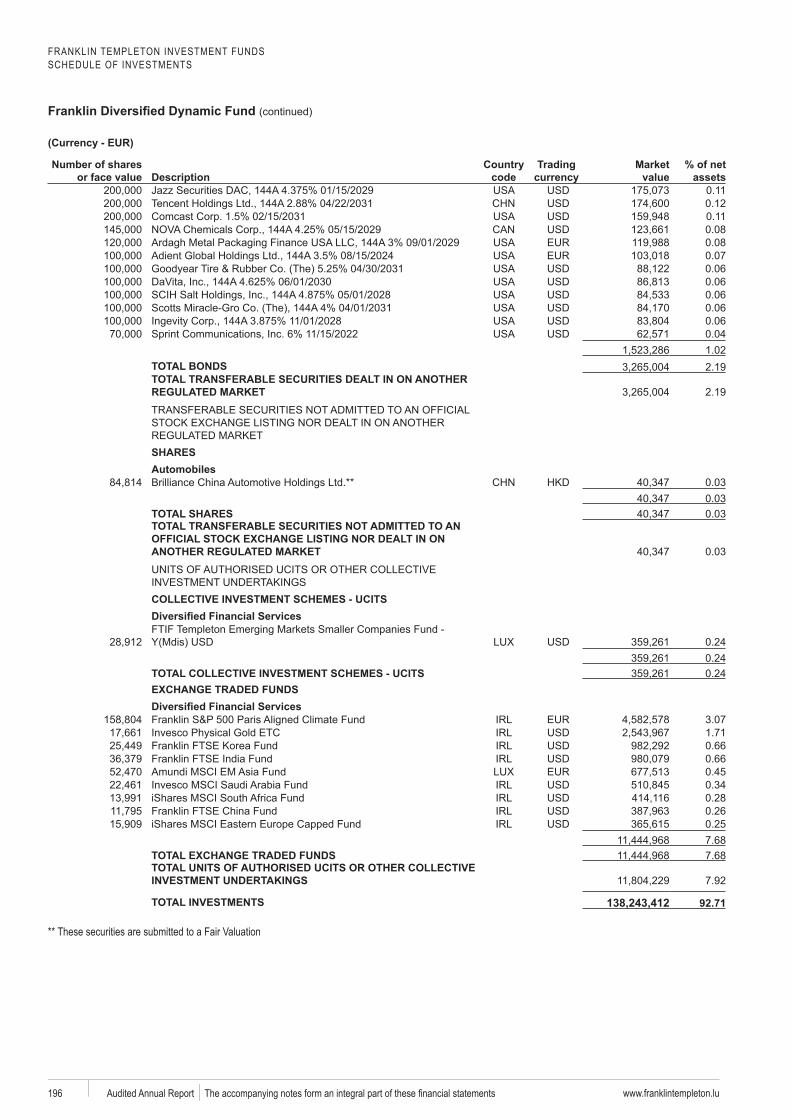
FRANKLIN TEMPLETON INVESTMENT FUNDSSCHEDULE OF INVESTMENTS
(continued)
www.franklintempleton.lu196 Audited Annual Report
Number of shares or face value Description
code
Trading Market value
% of net assets
0.110.120.110.080.080.070.060.060.060.060.060.041.02
TOTAL BONDS 2.19TOTAL TRANSFERABLE SECURITIES DEALT IN ON ANOTHER
2.19
SHARESAutomobiles
0.030.03
TOTAL SHARES 0.03TOTAL TRANSFERABLE SECURITIES NOT ADMITTED TO AN
0.03
COLLECTIVE INVESTMENT SCHEMES - UCITS
0.240.24
TOTAL COLLECTIVE INVESTMENT SCHEMES - UCITS 0.24EXCHANGE TRADED FUNDS
3.071.71
Franklin FTSE Korea Fund 0.660.660.450.340.280.260.257.68
TOTAL EXCHANGE TRADED FUNDS 7.68TOTAL UNITS OF AUTHORISED UCITS OR OTHER COLLECTIVE
7.92
TOTAL INVESTMENTS 138,243,412a
** These securities are submitted to a Fair Valuation
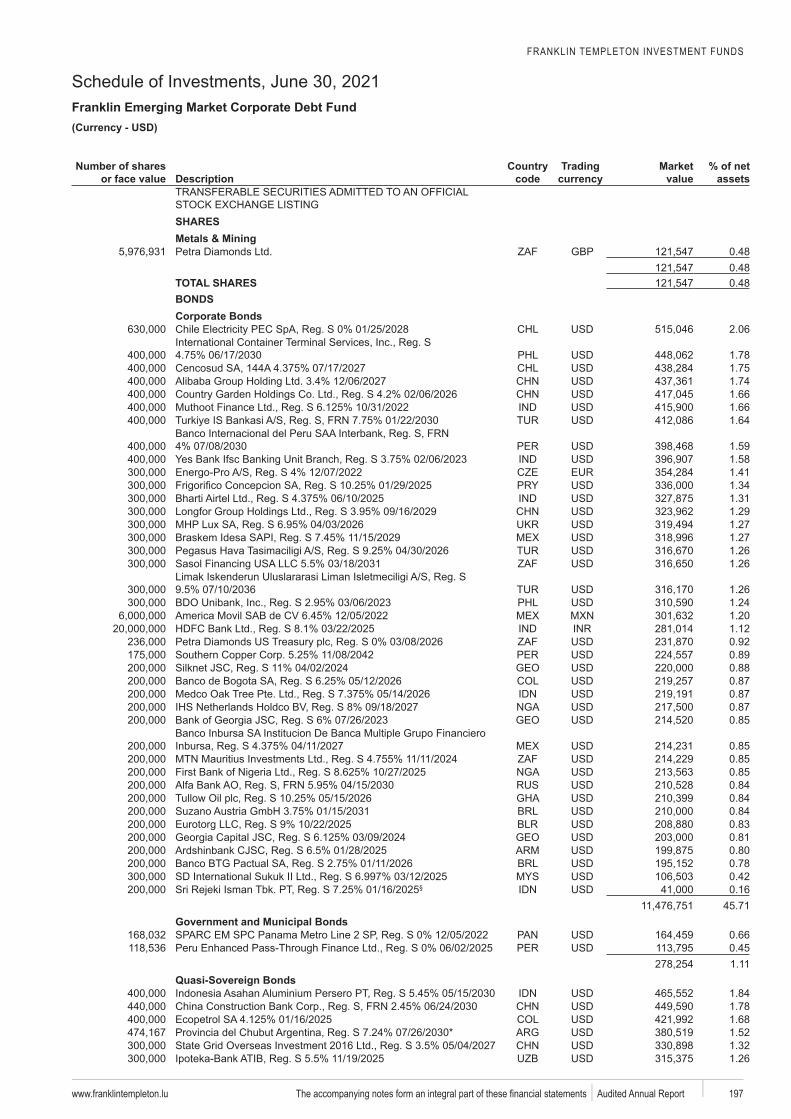
FRANKLIN TEMPLETON INVESTMENT FUNDS
Schedule of Investments, June 30, 2021Franklin Emerging Market Corporate Debt Fund
www.franklintempleton.lu 197 Audited Annual Report
USD)
Number of shares or face value Description
code
Trading Market value
% of net assets
SHARESMetals & Mining
GBP 0.480.48
TOTAL SHARES 0.48BONDSCorporate Bonds
2.06
1.781.751.741.661.66
Turkiye Bankasi 1.64Banco
1.591.58
Energo 1.411.341.311.291.27
1.27Pegasus 1.26
1.26
1.261.241.201.120.920.89
Silknet 0.880.870.870.870.85
Banco Financiero 0.850.850.850.840.840.84
Eurotorg 0.830.810.80
Banco BTG Pactual 0.78Sukuk 0.42
Sri § 0.1645.71
Government and Municipal Bonds0.660.451.11
Quasi-Sovereign Bonds Persero 1.84
1.781.68
Provincia 1.521.321.26
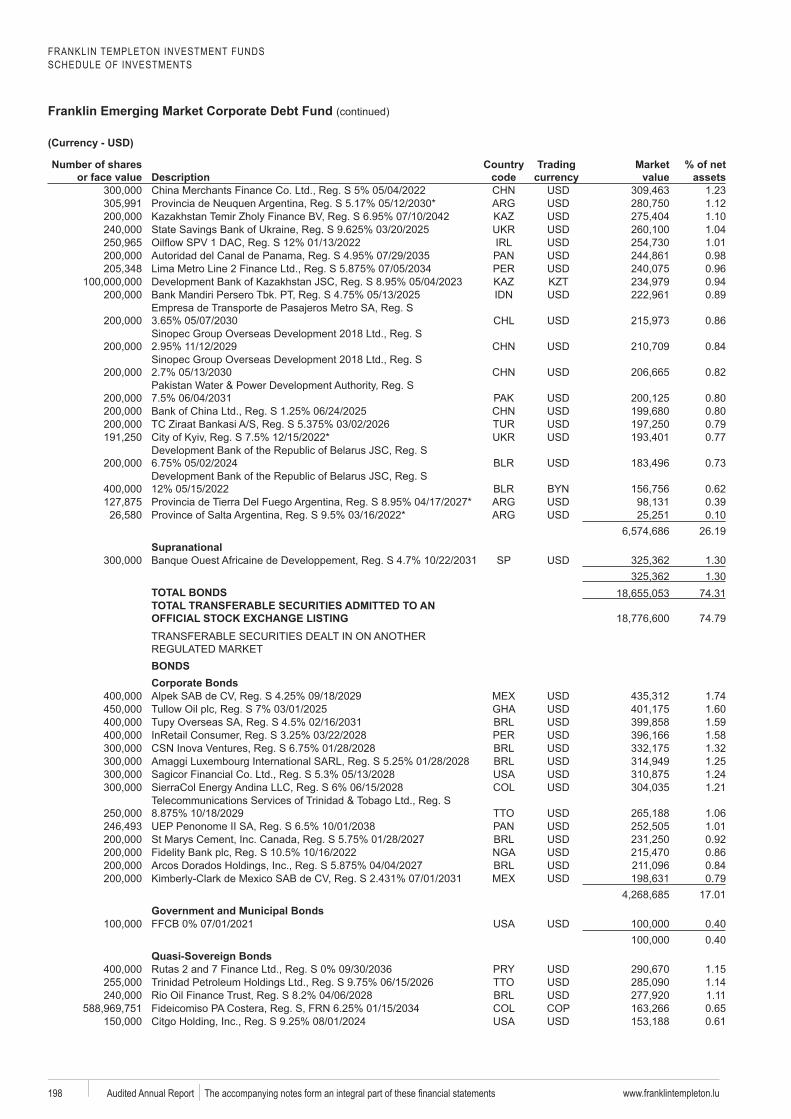
FRANKLIN TEMPLETON INVESTMENT FUNDSSCHEDULE OF INVESTMENTS
Franklin Emerging Market Corporate Debt Fund (continued)
www.franklintempleton.lu198 Audited Annual Report
Number of shares or face value Description
code
Trading Market value
% of net assets
1.23Provincia de 1.12
Zholy 1.101.041.010.980.96
KZT 0.94Bank Persero 0.89
de de 0.86
0.84
0.82
0.800.80
Ziraat Bankasi 0.790.77
0.73
0.62Provincia 0.39
0.1026.19
Supranational de SP 1.30
1.30TOTAL BONDS 74.31TOTAL TRANSFERABLE SECURITIES ADMITTED TO AN
74.79
BONDSCorporate Bonds
1.741.601.591.581.321.25
Sagicor 1.24 Energy 1.21
1.061.01
St 0.920.860.840.79
17.01Government and Municipal Bonds
0.400.40
Quasi-Sovereign Bonds1.151.141.110.650.61
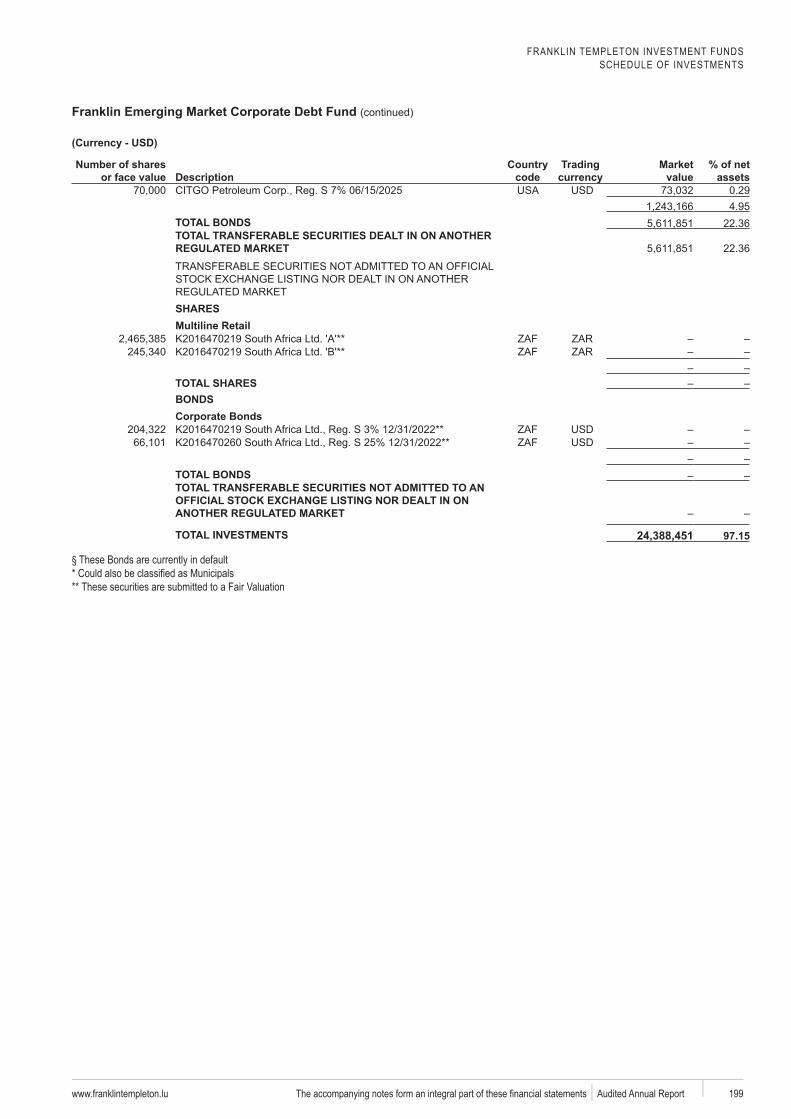
FRANKLIN TEMPLETON INVESTMENT FUNDSSCHEDULE OF INVESTMENTS
Franklin Emerging Market Corporate Debt Fund (continued)
www.franklintempleton.lu 199 Audited Annual Report
Number of shares or face value Description
code
Trading Market value
% of net assets
0.294.95
TOTAL BONDS 22.36TOTAL TRANSFERABLE SECURITIES DEALT IN ON ANOTHER
22.36
SHARESMultiline Retail
TOTAL SHARESBONDSCorporate Bonds
TOTAL BONDSTOTAL TRANSFERABLE SECURITIES NOT ADMITTED TO AN
TOTAL INVESTMENTS 24,388,451ds§ These Bonds are currently in default
** These securities are submitted to a Fair Valuation
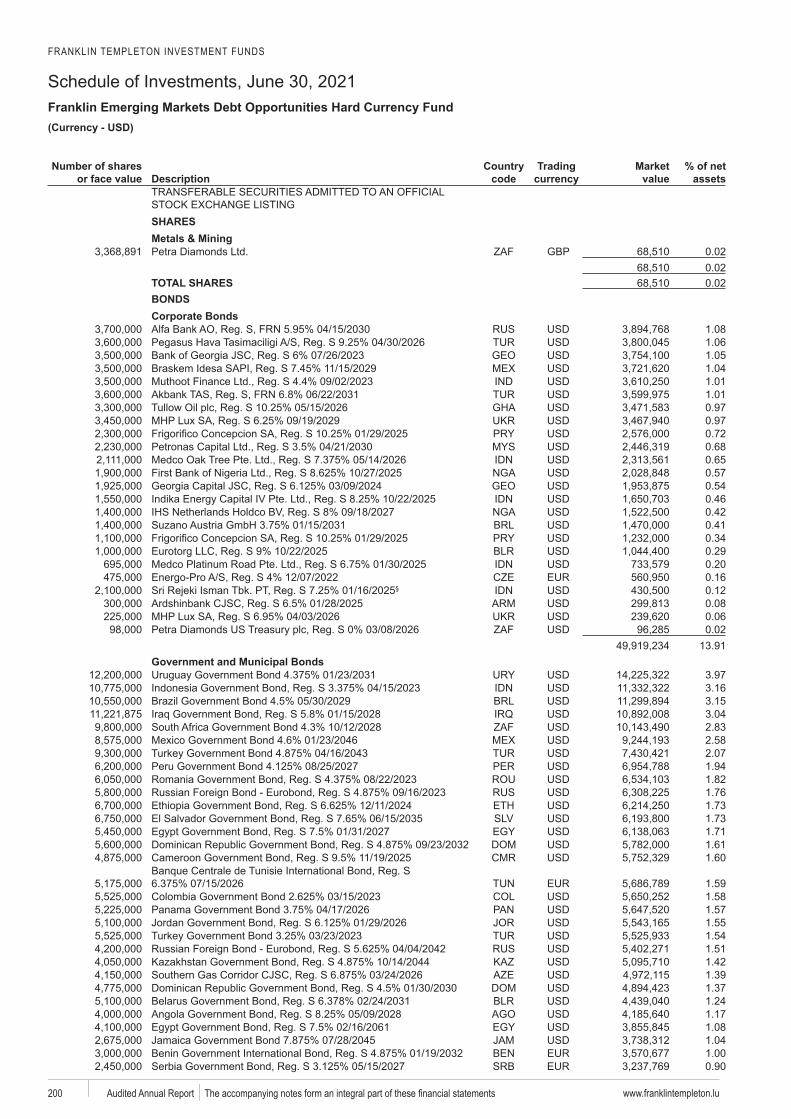
FRANKLIN TEMPLETON INVESTMENT FUNDS
Schedule of Investments, June 30, 2021Franklin Emerging Markets Debt Opportunities Hard Currency Fund
www.franklintempleton.lu200 Audited Annual Report
USD)
Number of shares or face value Description
code
Trading Market value
% of net assets
SHARESMetals & Mining
GBP 0.020.02
TOTAL SHARES 0.02BONDSCorporate Bonds
1.08Pegasus 1.06
1.05 1.04
1.011.010.970.970.720.680.650.570.540.460.420.410.34
Eurotorg 0.290.20
Energo 0.16Sri § 0.12
0.080.060.02
13.91Government and Municipal Bonds
3.973.163.153.042.832.582.071.941.821.761.731.731.711.611.60
Tunisie1.591.581.571.551.541.511.421.391.371.241.171.081.041.000.90
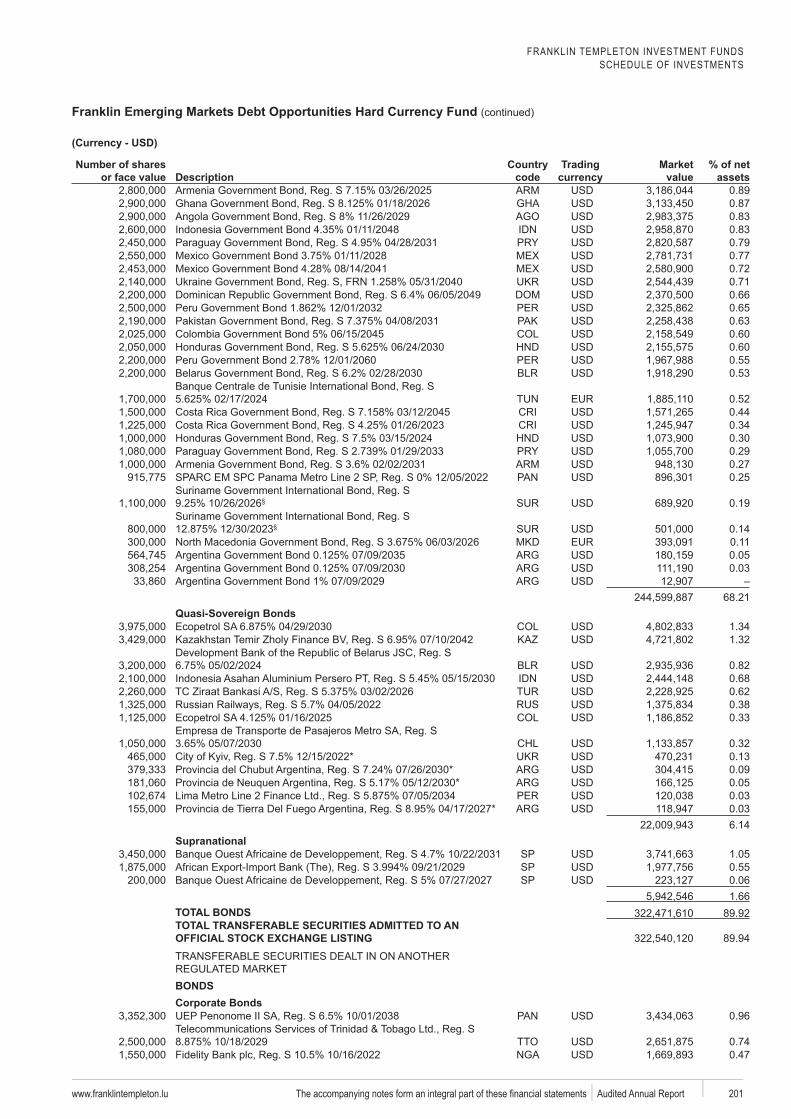
FRANKLIN TEMPLETON INVESTMENT FUNDSSCHEDULE OF INVESTMENTS
Franklin Emerging Markets Debt Opportunities Hard Currency Fund (continued)
www.franklintempleton.lu 201 Audited Annual Report
Number of shares or face value Description
code
Trading Market value
% of net assets
0.890.870.830.830.790.770.720.710.660.650.630.600.600.550.53
Tunisie0.520.440.340.300.290.270.25
§ 0.19
§ 0.140.110.050.03
68.21Quasi-Sovereign Bonds
1.34 Zholy 1.32
0.82 Persero 0.68
Ziraat Bankasi 0.620.380.33
de de 0.320.13
Provincia 0.09Provincia de 0.05
0.03Provincia 0.03
6.14Supranational
de SP 1.05SP 0.55
de SP 0.061.66
TOTAL BONDS 89.92TOTAL TRANSFERABLE SECURITIES ADMITTED TO AN
89.94
BONDSCorporate Bonds
0.96
0.740.47
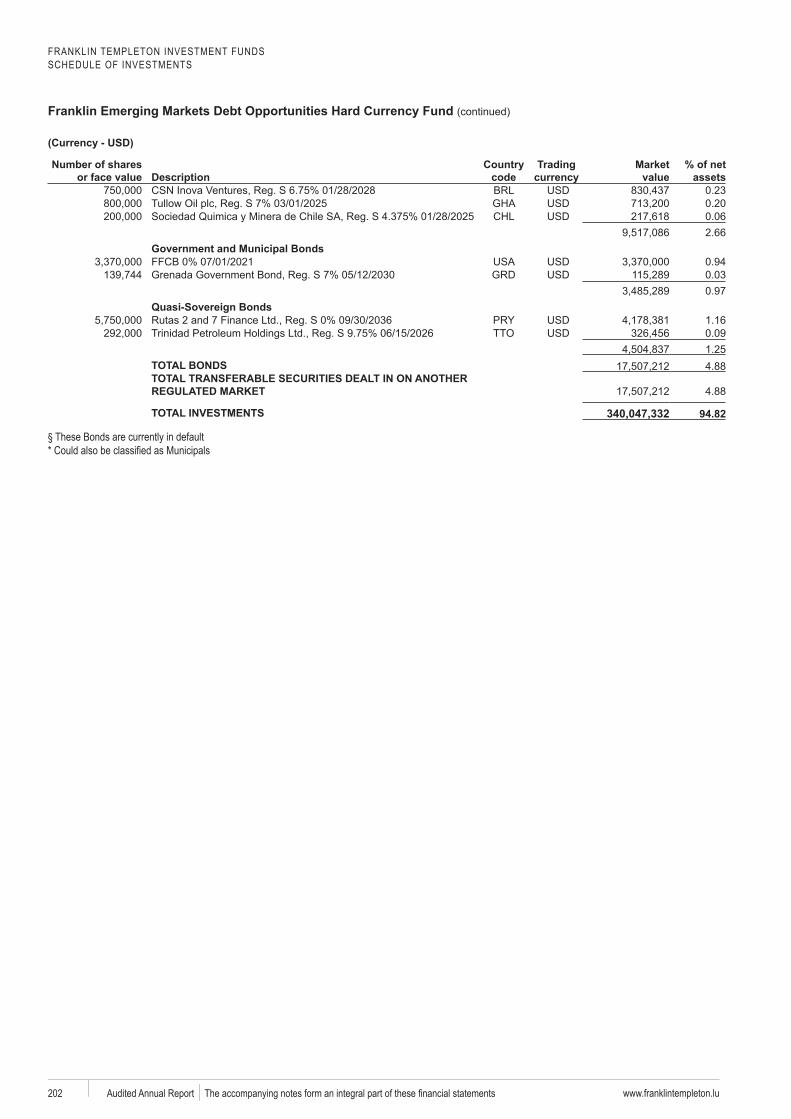
FRANKLIN TEMPLETON INVESTMENT FUNDSSCHEDULE OF INVESTMENTS
Franklin Emerging Markets Debt Opportunities Hard Currency Fund (continued)
www.franklintempleton.lu202 Audited Annual Report
Number of shares or face value Description
code
Trading Market value
% of net assets
0.230.20
Sociedad y 0.062.66
Government and Municipal Bonds0.940.030.97
Quasi-Sovereign Bonds1.160.091.25
TOTAL BONDS 4.88TOTAL TRANSFERABLE SECURITIES DEALT IN ON ANOTHER
4.88
TOTAL INVESTMENTS 340,047,332as§ These Bonds are currently in default
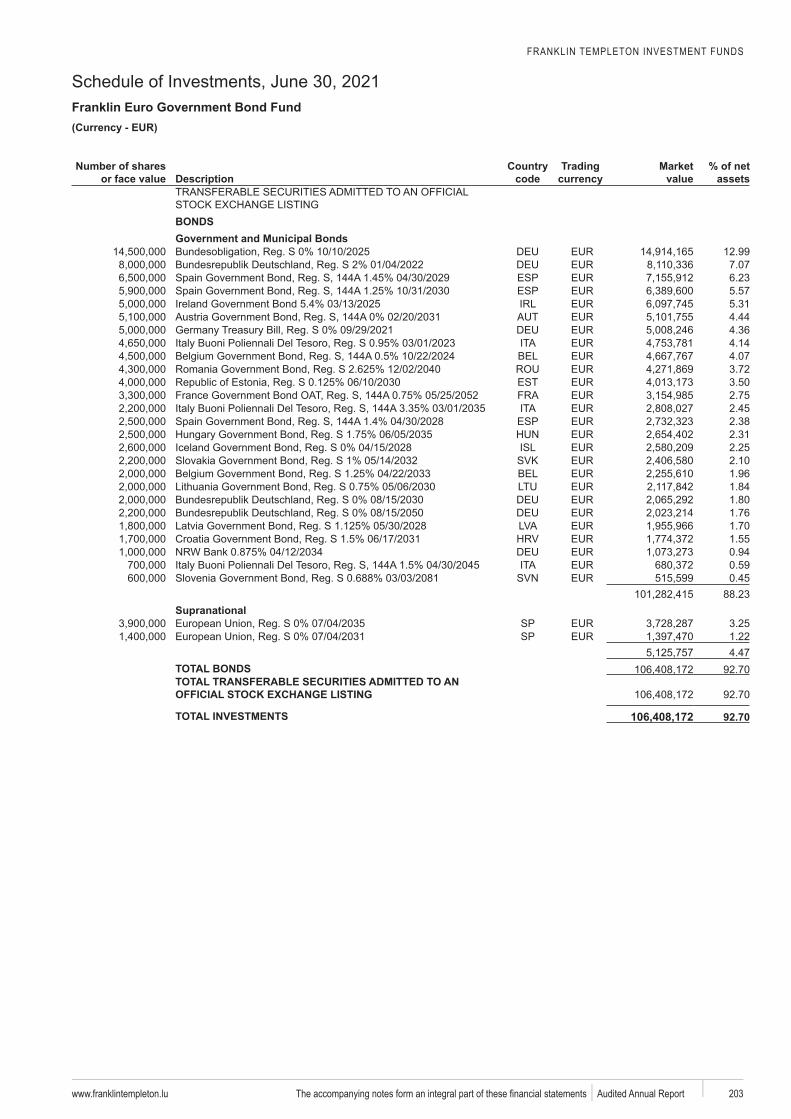
FRANKLIN TEMPLETON INVESTMENT FUNDS
Schedule of Investments, June 30, 2021Franklin Euro Government Bond Fund
www.franklintempleton.lu 203 Audited Annual Report
EUR)
Number of shares or face value Description
code
Trading Market value
% of net assets
BONDSGovernment and Municipal Bonds
12.997.07
ESP 6.23ESP 5.57
5.314.444.36
Buoni Poliennali 4.144.073.72
EST 3.502.75
Buoni Poliennali 2.45ESP 2.38
2.312.252.101.961.841.801.761.701.550.94
Buoni Poliennali 0.590.45
88.23Supranational
SP 3.25SP 1.22
4.47TOTAL BONDS 92.70TOTAL TRANSFERABLE SECURITIES ADMITTED TO AN
92.70
TOTAL INVESTMENTS 106,408,172
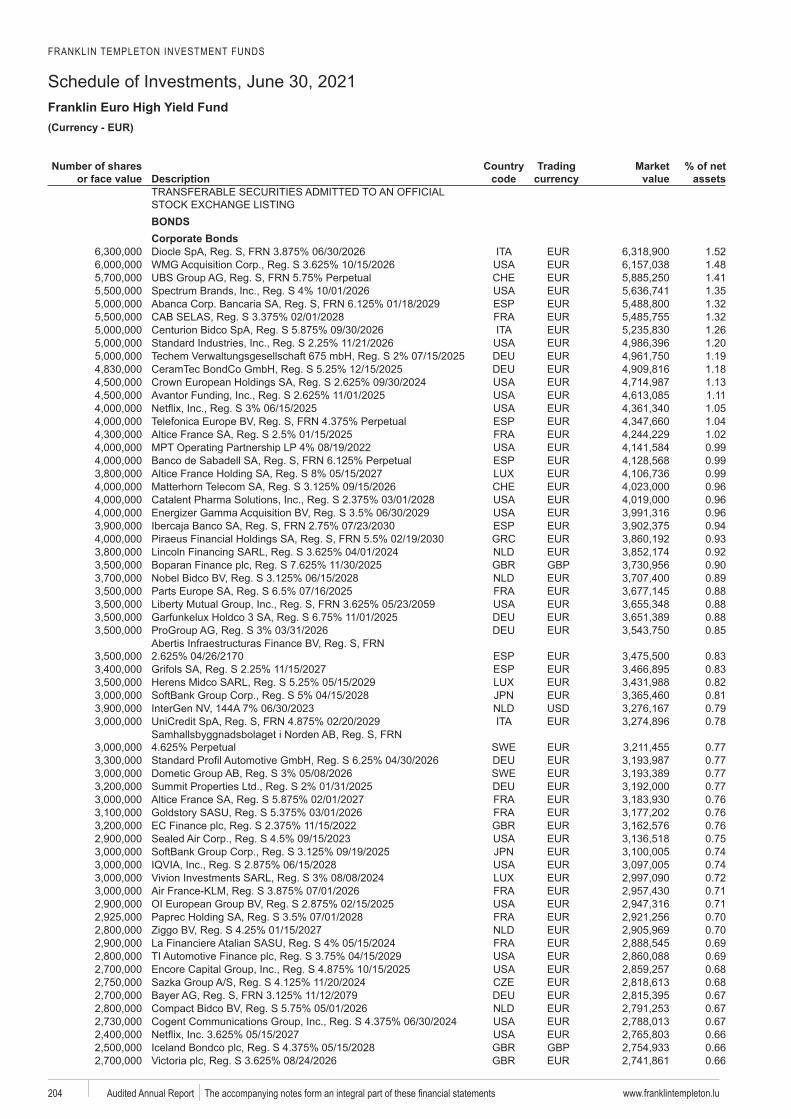
FRANKLIN TEMPLETON INVESTMENT FUNDS
Schedule of Investments, June 30, 2021Franklin Euro High Yield Fund
www.franklintempleton.lu204 Audited Annual Report
EUR)
Number of shares or face value Description
code
Trading Market value
% of net assets
BONDSCorporate Bonds
1.521.481.411.35
ESP 1.321.321.261.201.191.181.131.111.05
ESP 1.041.020.99
ESP 0.990.990.960.960.96
ESP 0.940.930.92
GBP 0.900.890.880.880.880.85
ESP 0.83ESP 0.83
0.820.810.790.78
SWE 0.770.77
SWE 0.770.770.760.760.760.750.740.740.720.710.710.700.700.690.690.680.680.670.670.670.66
GBP 0.660.66
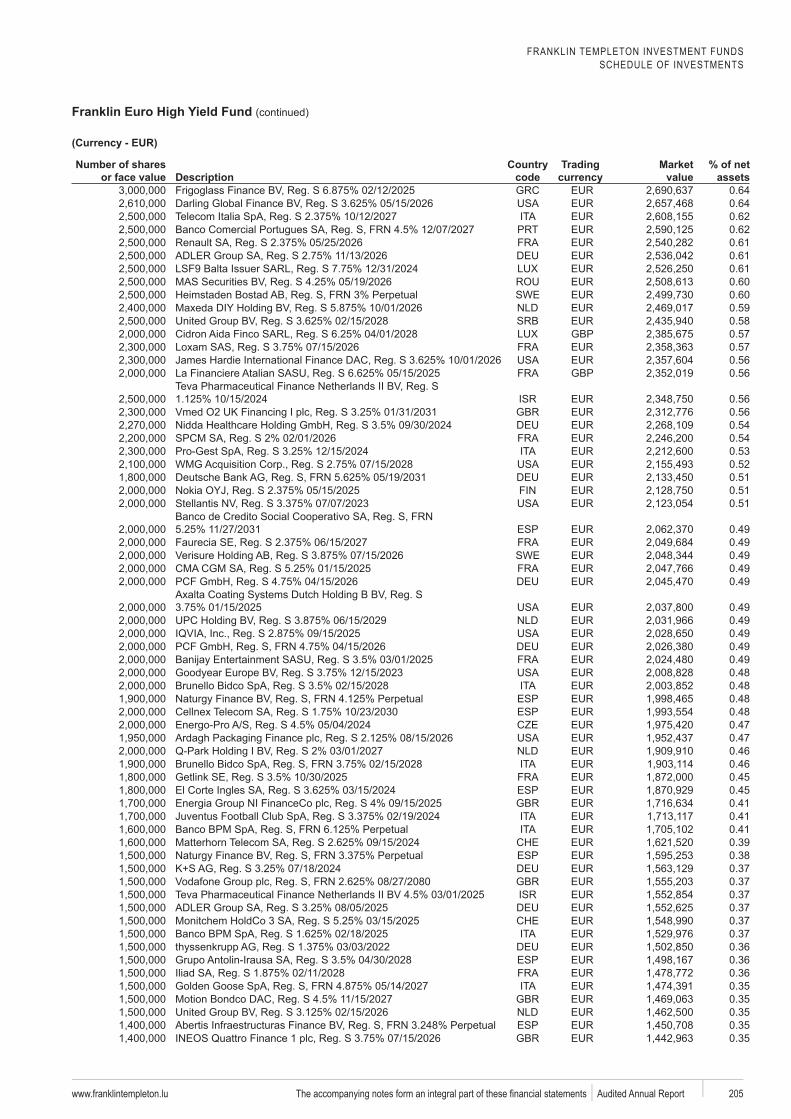
FRANKLIN TEMPLETON INVESTMENT FUNDSSCHEDULE OF INVESTMENTS
Franklin Euro High Yield Fund (continued)
www.franklintempleton.lu 205 Audited Annual Report
Number of shares or face value Description
code
Trading Market value
% of net assets
0.640.640.620.620.610.610.610.60
SWE 0.600.590.58
GBP 0.570.570.56
GBP 0.56
0.560.560.540.540.530.520.510.510.51
ESP 0.490.49
SWE 0.490.490.49
0.490.490.490.490.490.480.48
ESP 0.48ESP 0.48
0.470.470.460.460.45
ESP 0.450.410.410.410.39
ESP 0.380.370.370.370.370.370.370.36
ESP 0.360.360.350.350.35
ESP 0.350.35
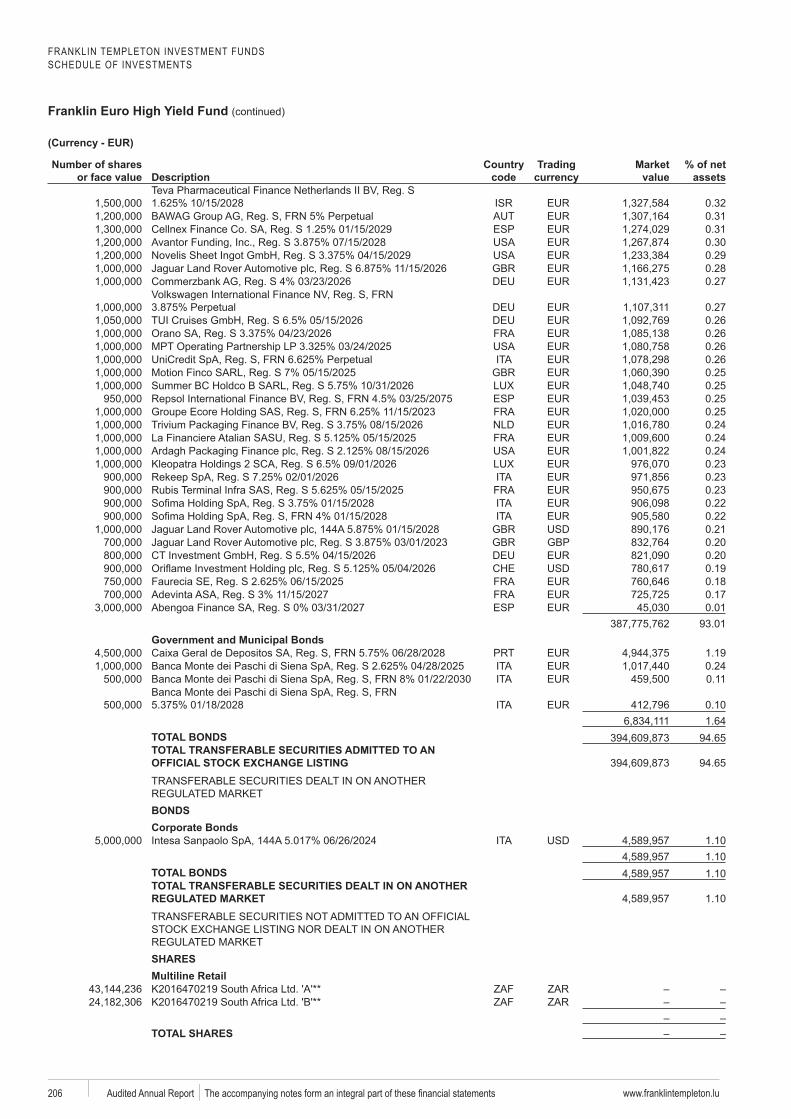
FRANKLIN TEMPLETON INVESTMENT FUNDSSCHEDULE OF INVESTMENTS
Franklin Euro High Yield Fund (continued)
www.franklintempleton.lu206 Audited Annual Report
Number of shares or face value Description
code
Trading Market value
% of net assets
0.320.31
ESP 0.310.300.290.280.27
0.270.260.260.260.260.250.25
ESP 0.250.250.240.240.240.230.230.230.220.220.21
GBP 0.200.200.190.180.17
ESP 0.0193.01
Government and Municipal Bonds1.190.240.11
0.101.64
TOTAL BONDS 94.65TOTAL TRANSFERABLE SECURITIES ADMITTED TO AN
94.65
BONDSCorporate Bonds
1.101.10
TOTAL BONDS 1.10TOTAL TRANSFERABLE SECURITIES DEALT IN ON ANOTHER
1.10
SHARESMultiline Retail
TOTAL SHARES
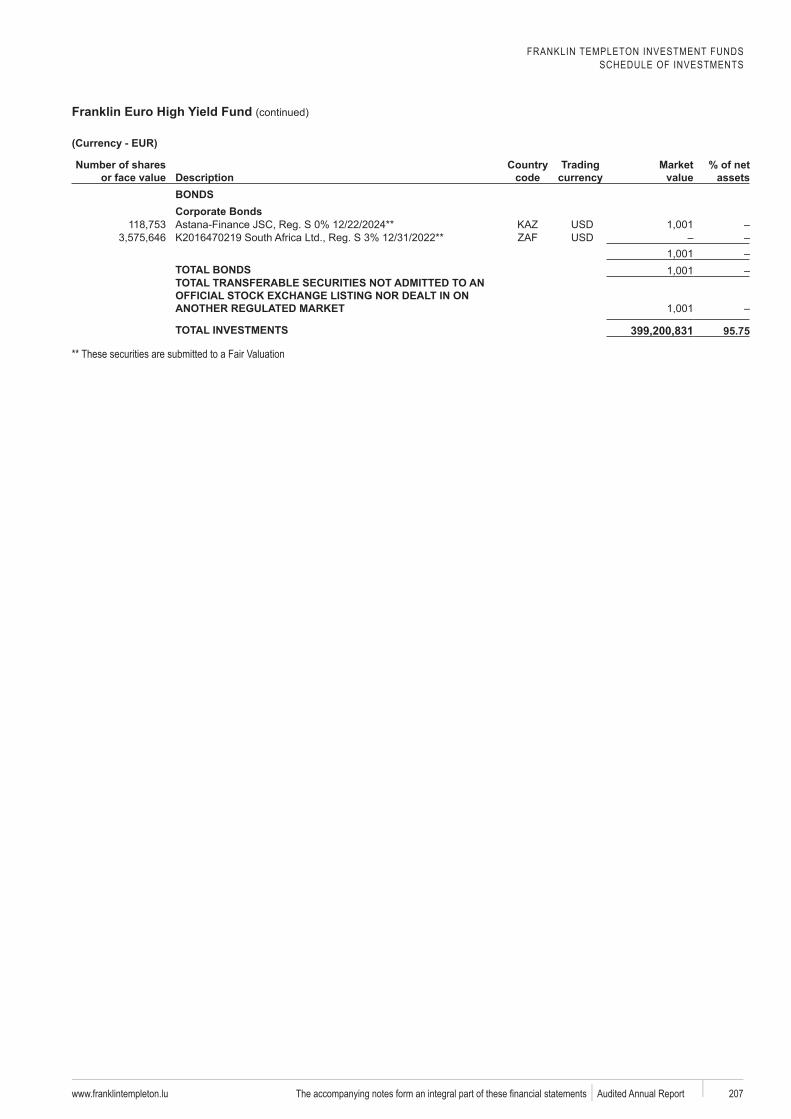
FRANKLIN TEMPLETON INVESTMENT FUNDSSCHEDULE OF INVESTMENTS
Franklin Euro High Yield Fund (continued)
www.franklintempleton.lu 207 Audited Annual Report
Number of shares or face value Description
code
Trading Market value
% of net assets
BONDSCorporate Bonds
TOTAL BONDSTOTAL TRANSFERABLE SECURITIES NOT ADMITTED TO AN
TOTAL INVESTMENTS 399,200,831a** These securities are submitted to a Fair Valuation
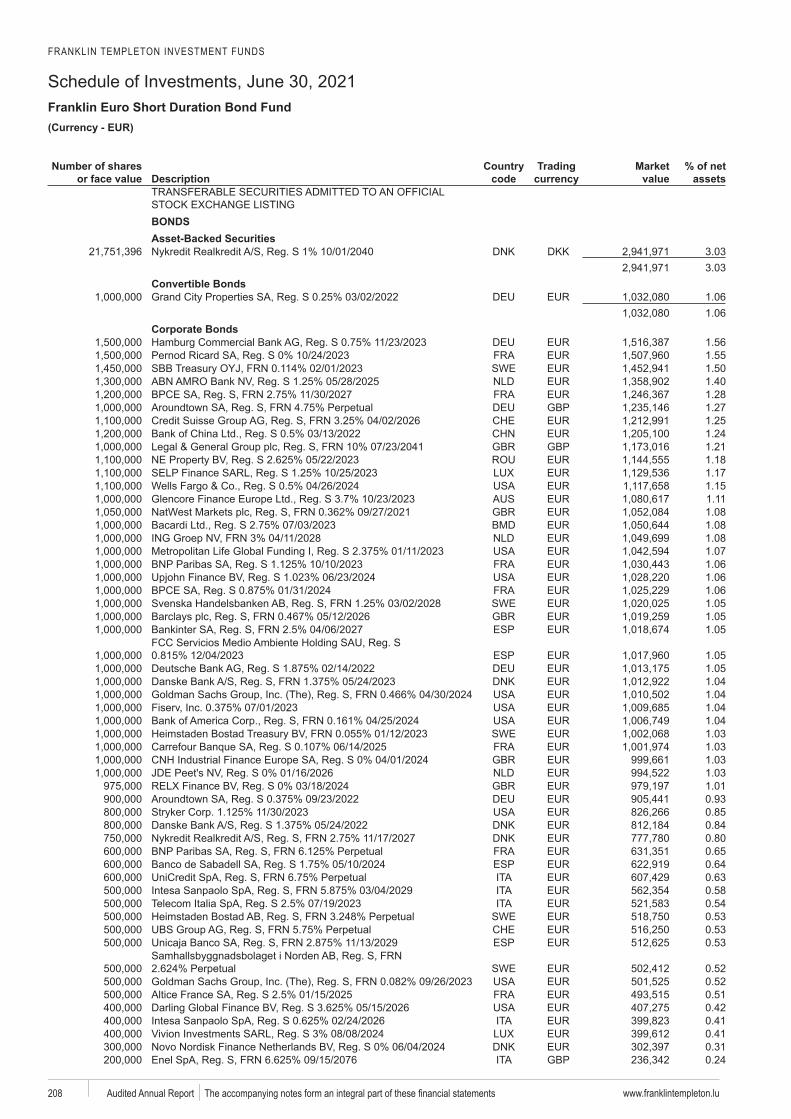
FRANKLIN TEMPLETON INVESTMENT FUNDS
Schedule of Investments, June 30, 2021Franklin Euro Short Duration Bond Fund
www.franklintempleton.lu208 Audited Annual Report
EUR)
Number of shares or face value Description
code
Trading Market value
% of net assets
BONDSAsset-Backed Securities
DKK 3.033.03
Convertible Bonds1.061.06
Corporate Bonds1.561.55
SWE 1.501.401.28
GBP 1.271.251.24
GBP 1.211.181.171.151.111.081.081.081.071.061.061.06
SWE 1.051.05
ESP 1.05
ESP 1.051.051.041.041.041.04
SWE 1.031.031.031.031.010.930.850.840.800.65
ESP 0.640.630.580.54
SWE 0.530.53
ESP 0.53
SWE 0.520.520.510.420.410.410.31
GBP 0.24
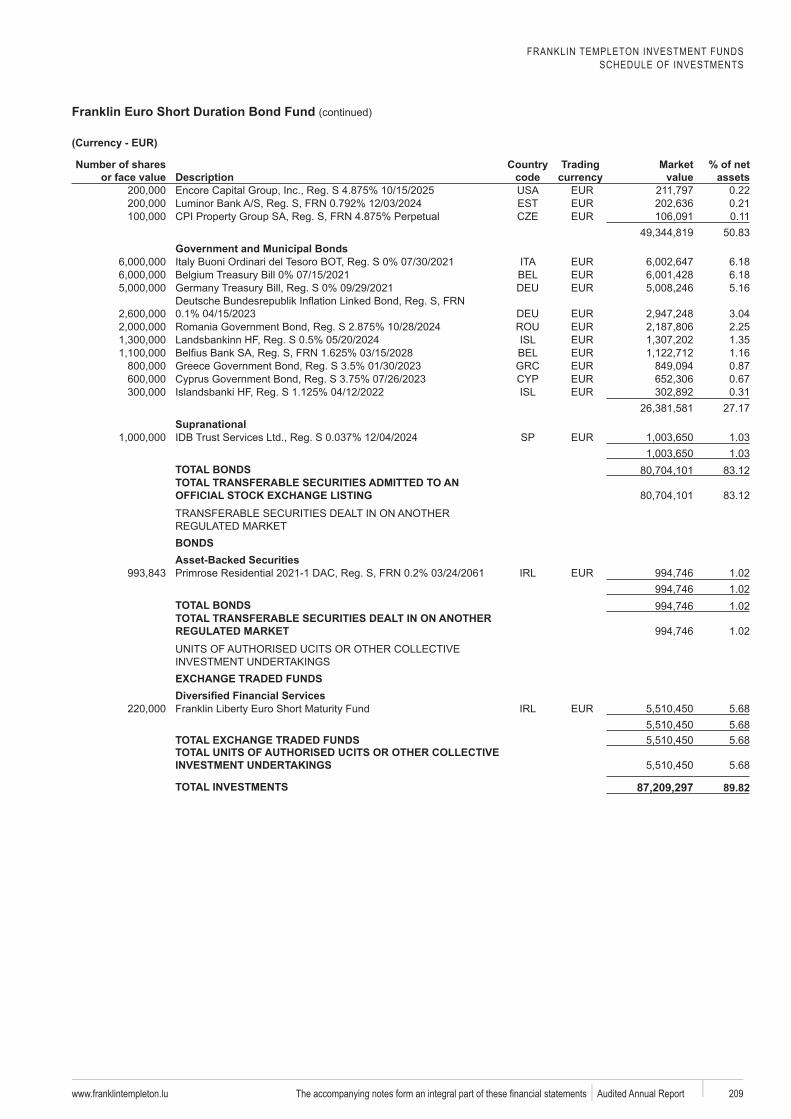
FRANKLIN TEMPLETON INVESTMENT FUNDSSCHEDULE OF INVESTMENTS
Franklin Euro Short Duration Bond Fund (continued)
www.franklintempleton.lu 209 Audited Annual Report
Number of shares or face value Description
code
Trading Market value
% of net assets
0.22EST 0.21
0.1150.83
Government and Municipal Bonds6.186.185.16
3.042.251.351.160.870.670.31
27.17Supranational
SP 1.031.03
TOTAL BONDS 83.12TOTAL TRANSFERABLE SECURITIES ADMITTED TO AN
83.12
BONDSAsset-Backed Securities
1.021.02
TOTAL BONDS 1.02TOTAL TRANSFERABLE SECURITIES DEALT IN ON ANOTHER
1.02
EXCHANGE TRADED FUNDS
5.685.68
TOTAL EXCHANGE TRADED FUNDS 5.68TOTAL UNITS OF AUTHORISED UCITS OR OTHER COLLECTIVE
5.68
TOTAL INVESTMENTS 87,209,297
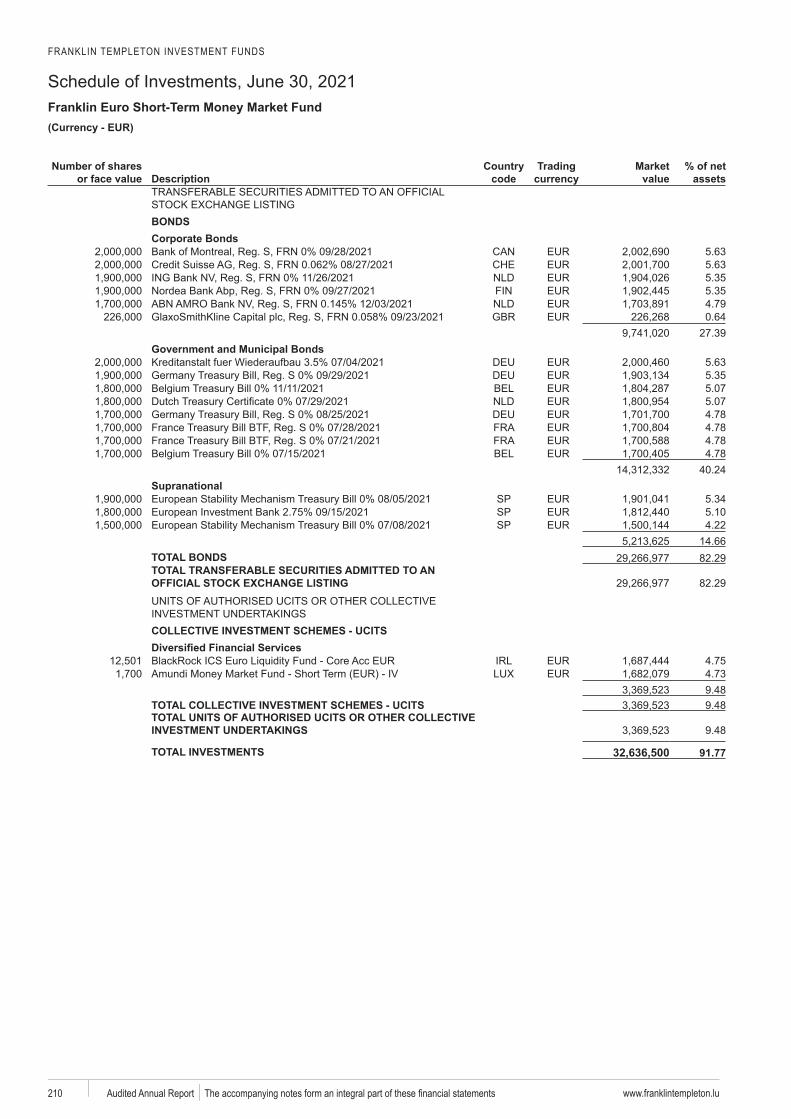
FRANKLIN TEMPLETON INVESTMENT FUNDS
Schedule of Investments, June 30, 2021Franklin Euro Short-Term Money Market Fund
www.franklintempleton.lu210 Audited Annual Report
EUR)
Number of shares or face value Description
code
Trading Market value
% of net assets
BONDSCorporate Bonds
5.635.635.35
Bank 5.354.790.64
27.39Government and Municipal BondsKreditanstalt fuer 5.63
5.355.075.074.784.784.784.78
40.24Supranational
SP 5.34SP 5.10SP 4.22
14.66TOTAL BONDS 82.29TOTAL TRANSFERABLE SECURITIES ADMITTED TO AN
82.29
COLLECTIVE INVESTMENT SCHEMES - UCITS
4.754.739.48
TOTAL COLLECTIVE INVESTMENT SCHEMES - UCITS 9.48TOTAL UNITS OF AUTHORISED UCITS OR OTHER COLLECTIVE
9.48
TOTAL INVESTMENTS 32,636,500
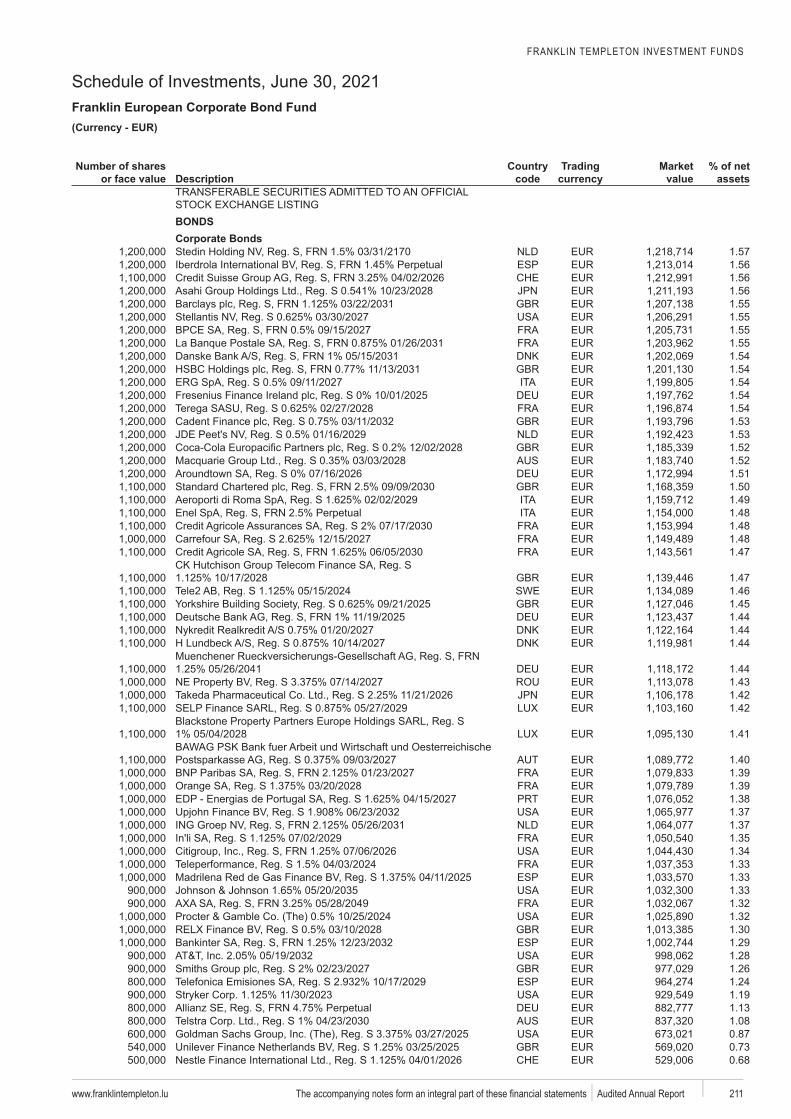
FRANKLIN TEMPLETON INVESTMENT FUNDS
Schedule of Investments, June 30, 2021Franklin European Corporate Bond Fund
www.franklintempleton.lu 211 Audited Annual Report
EUR)
Number of shares or face value Description
code
Trading Market value
% of net assets
BONDSCorporate Bonds
1.57ESP 1.56
1.561.561.551.551.551.551.541.541.541.541.541.531.531.521.521.511.501.491.481.481.481.47
1.47SWE 1.46
1.451.441.441.44
1.441.431.421.42
1.41
1.401.391.391.381.371.371.351.341.33
ESP 1.331.331.321.321.30
ESP 1.291.281.26
ESP 1.241.191.131.080.870.730.68
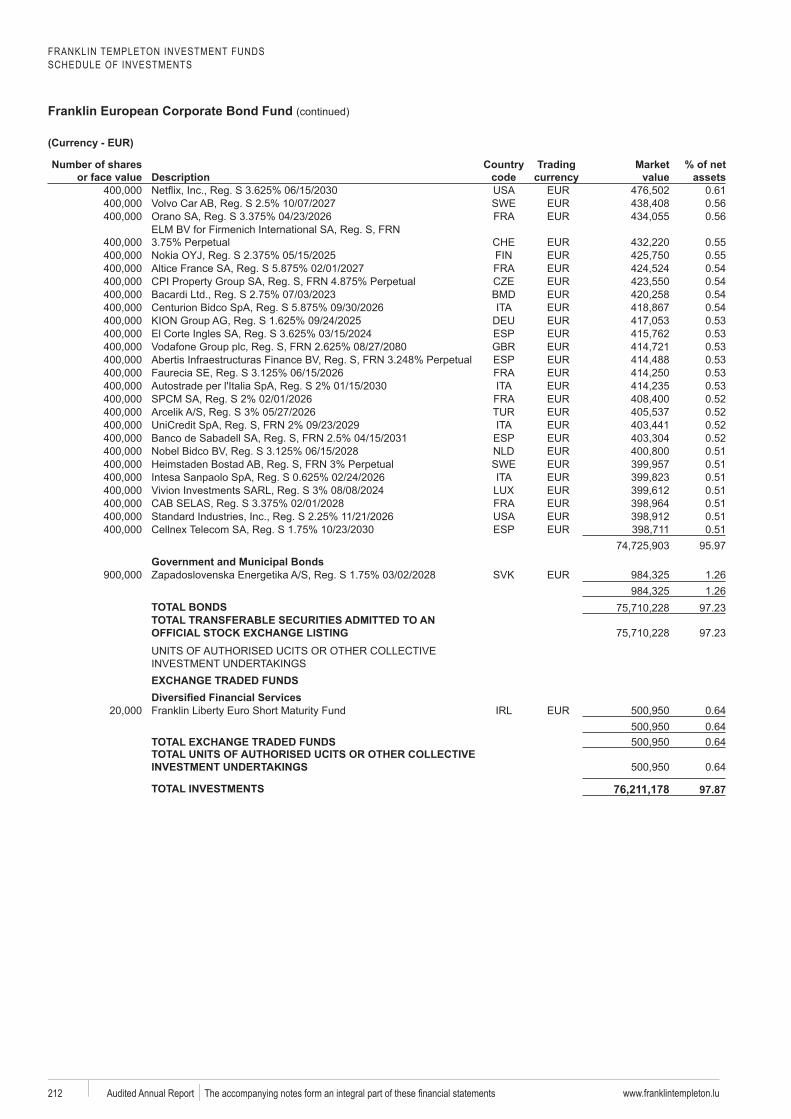
FRANKLIN TEMPLETON INVESTMENT FUNDSSCHEDULE OF INVESTMENTS
Franklin European Corporate Bond Fund (continued)
www.franklintempleton.lu212 Audited Annual Report
Number of shares or face value Description
code
Trading Market value
% of net assets
0.61SWE 0.56
0.56
0.550.550.540.540.540.540.53
ESP 0.530.53
ESP 0.530.530.530.520.520.52
ESP 0.520.51
SWE 0.510.510.510.510.51
ESP 0.5195.97
Government and Municipal Bonds1.261.26
TOTAL BONDS 97.23TOTAL TRANSFERABLE SECURITIES ADMITTED TO AN
97.23
EXCHANGE TRADED FUNDS
0.640.64
TOTAL EXCHANGE TRADED FUNDS 0.64TOTAL UNITS OF AUTHORISED UCITS OR OTHER COLLECTIVE
0.64
TOTAL INVESTMENTS 76,211,178
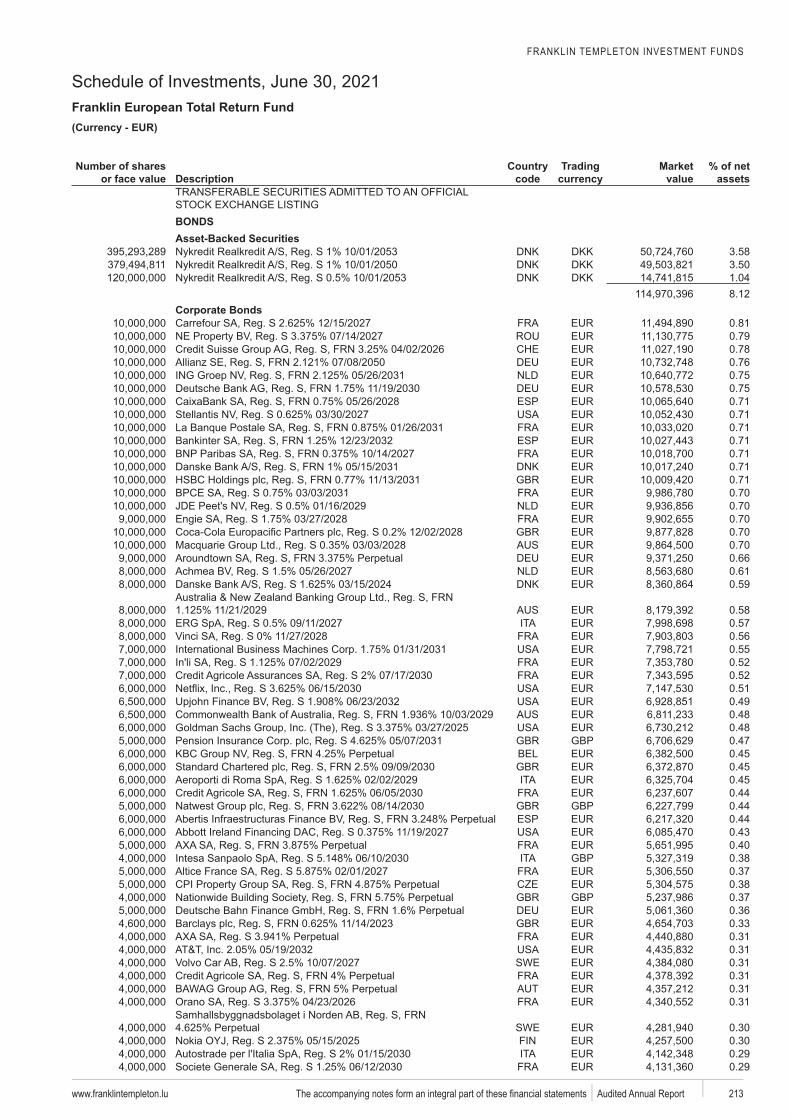
FRANKLIN TEMPLETON INVESTMENT FUNDS
Schedule of Investments, June 30, 2021Franklin European Total Return Fund
www.franklintempleton.lu 213 Audited Annual Report
EUR)
Number of shares or face value Description
code
Trading Market value
% of net assets
BONDSAsset-Backed Securities
DKK 3.58DKK 3.50DKK 1.04
8.12Corporate Bonds
0.810.790.780.760.750.75
ESP 0.710.710.71
ESP 0.710.710.710.710.700.700.700.700.700.660.610.59
0.580.570.560.550.520.520.510.490.480.48
GBP 0.470.450.450.450.44
GBP 0.44ESP 0.44
0.430.40
GBP 0.380.370.38
GBP 0.370.360.330.310.31
SWE 0.310.310.310.31
SWE 0.300.300.290.29
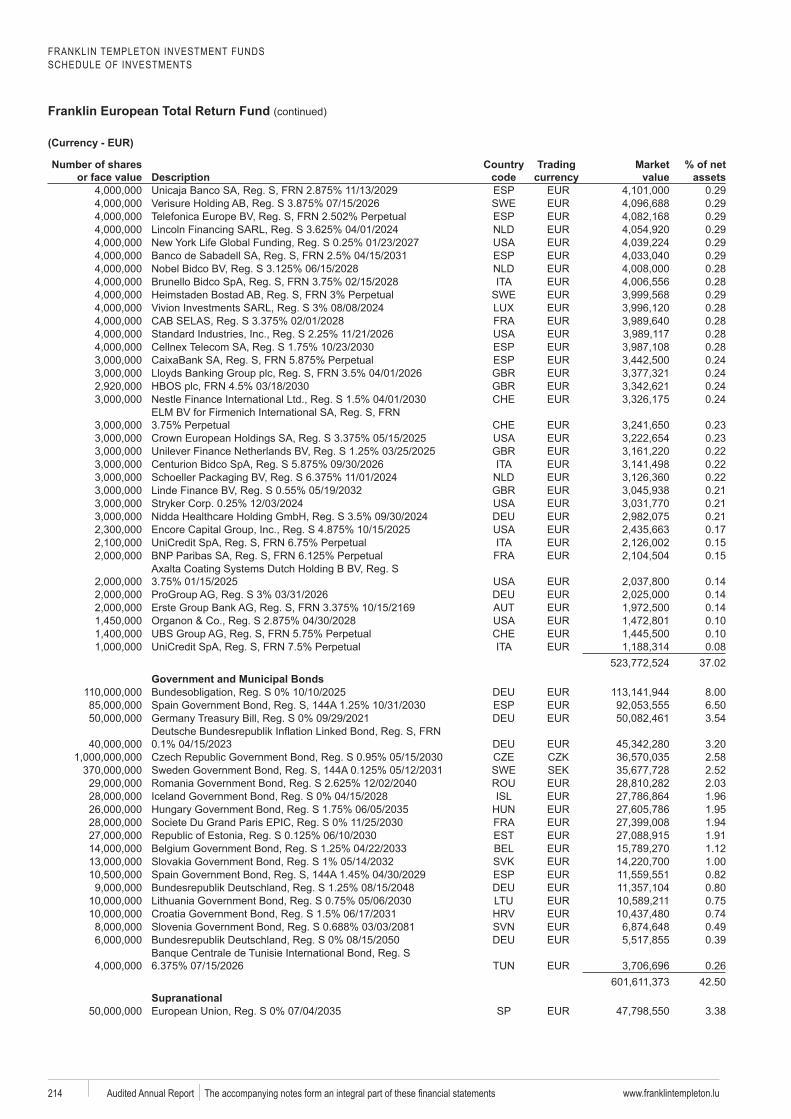
FRANKLIN TEMPLETON INVESTMENT FUNDSSCHEDULE OF INVESTMENTS
Franklin European Total Return Fund (continued)
www.franklintempleton.lu214 Audited Annual Report
Number of shares or face value Description
code
Trading Market value
% of net assets
ESP 0.29SWE 0.29ESP 0.29
0.290.29
ESP 0.290.280.28
SWE 0.290.280.280.28
ESP 0.28ESP 0.24
0.240.240.24
0.230.230.220.220.220.210.210.210.170.150.15
0.140.140.140.100.100.08
37.02Government and Municipal Bonds
8.00ESP 6.50
3.54
3.202.58
SWE SEK 2.522.031.961.951.94
EST 1.911.121.00
ESP 0.820.800.750.740.490.39
0.2642.50
SupranationalSP 3.38

FRANKLIN TEMPLETON INVESTMENT FUNDSSCHEDULE OF INVESTMENTS
Franklin European Total Return Fund (continued)
www.franklintempleton.lu 215 Audited Annual Report
Number of shares or face value Description
code
Trading Market value
% of net assets
SP 1.124.50
TOTAL BONDS 92.14TOTAL TRANSFERABLE SECURITIES ADMITTED TO AN
92.14
EXCHANGE TRADED FUNDS
1.150.371.52
TOTAL EXCHANGE TRADED FUNDS 1.52TOTAL UNITS OF AUTHORISED UCITS OR OTHER COLLECTIVE
1.52
TOTAL INVESTMENTS 1,325,575,411
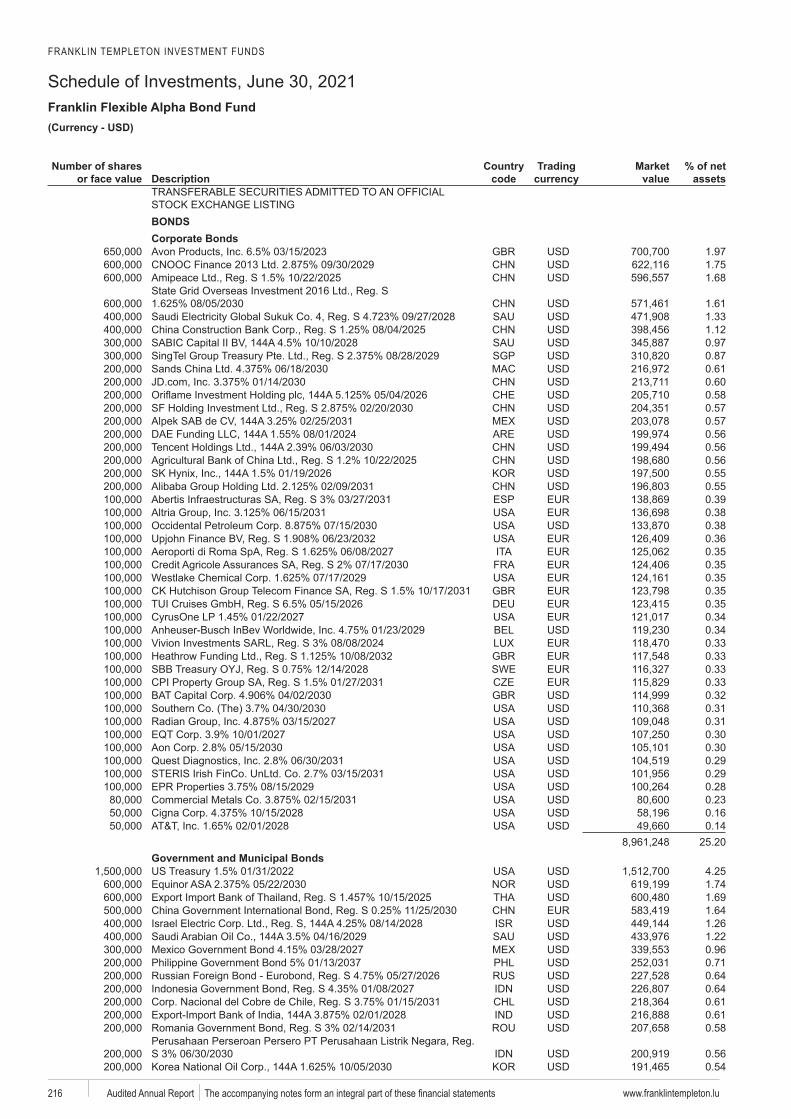
FRANKLIN TEMPLETON INVESTMENT FUNDS
Schedule of Investments, June 30, 2021Franklin Flexible Alpha Bond Fund
www.franklintempleton.lu216 Audited Annual Report
USD)
Number of shares or face value Description
code
Trading Market value
% of net assets
BONDSCorporate Bonds
1.971.751.68
1.611.331.120.97
SGP 0.870.610.600.580.570.570.560.560.560.550.55
ESP 0.390.380.380.360.350.350.350.350.350.340.340.330.33
SWE 0.330.330.320.310.310.300.300.290.290.280.230.160.14
25.20Government and Municipal Bonds
4.251.741.691.641.261.220.960.710.640.640.610.610.58
0.560.54
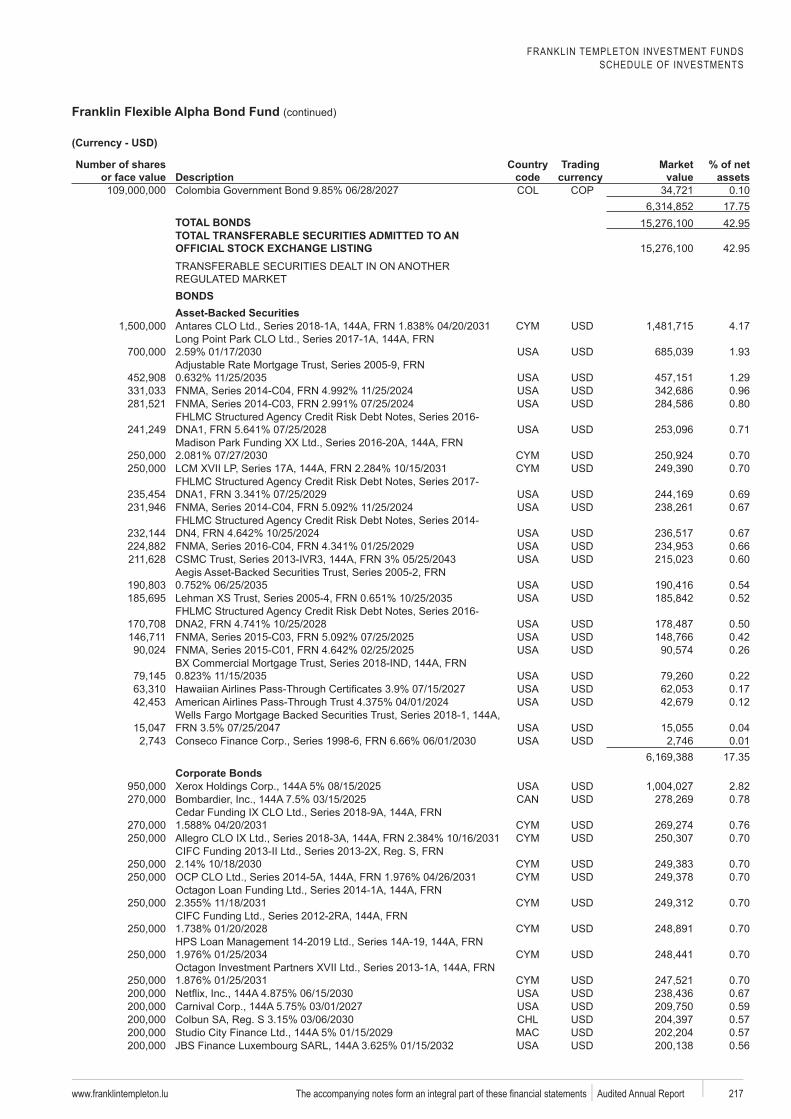
FRANKLIN TEMPLETON INVESTMENT FUNDSSCHEDULE OF INVESTMENTS
Franklin Flexible Alpha Bond Fund (continued)
www.franklintempleton.lu 217 Audited Annual Report
Number of shares or face value Description
code
Trading Market value
% of net assets
0.1017.75
TOTAL BONDS 42.95TOTAL TRANSFERABLE SECURITIES ADMITTED TO AN
42.95
BONDSAsset-Backed Securities
4.17
1.93
1.290.960.80
0.71
0.700.70
0.690.67
0.670.660.60
0.540.52
0.500.420.26
0.220.170.12
0.040.01
17.35Corporate Bonds
2.820.78
0.760.70
0.700.70
0.70
0.70
0.70
0.700.670.590.570.570.56
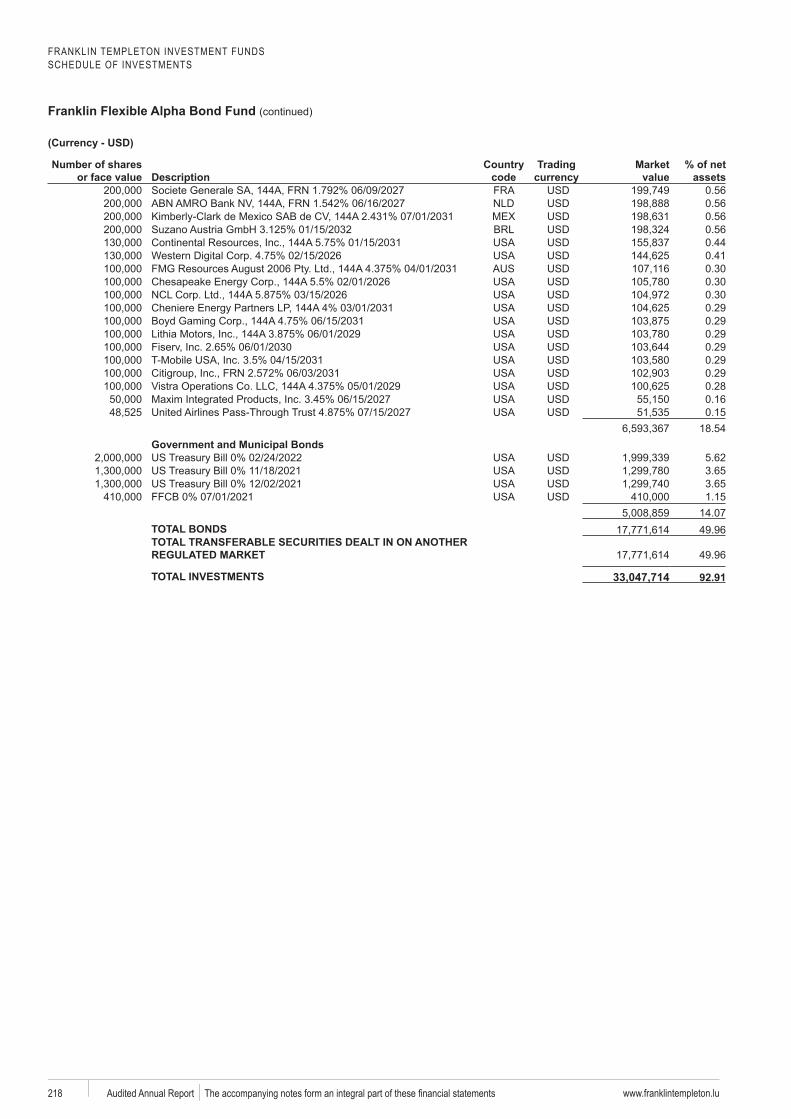
FRANKLIN TEMPLETON INVESTMENT FUNDSSCHEDULE OF INVESTMENTS
Franklin Flexible Alpha Bond Fund (continued)
www.franklintempleton.lu218 Audited Annual Report
Number of shares or face value Description
code
Trading Market value
% of net assets
0.560.560.560.560.440.410.300.300.300.290.290.290.290.290.290.280.160.15
18.54Government and Municipal Bonds
5.623.653.651.15
14.07TOTAL BONDS 49.96TOTAL TRANSFERABLE SECURITIES DEALT IN ON ANOTHER
49.96
TOTAL INVESTMENTS 33,047,714
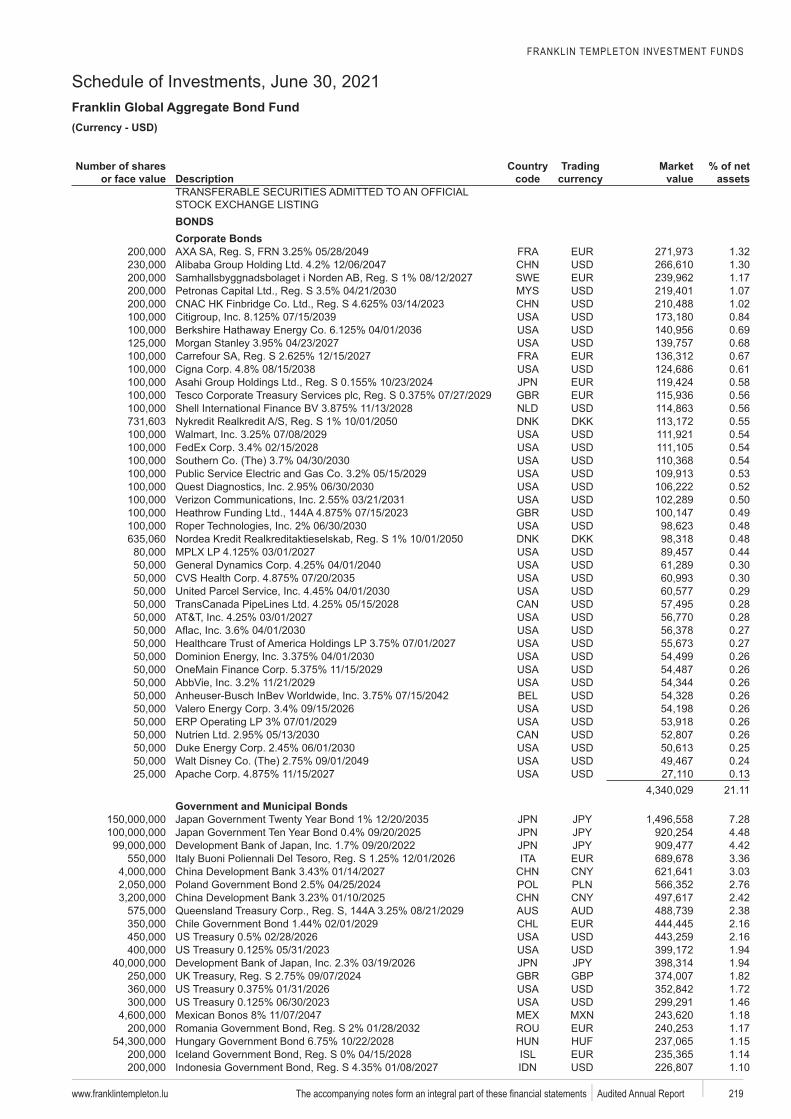
FRANKLIN TEMPLETON INVESTMENT FUNDS
Schedule of Investments, June 30, 2021Franklin Global Aggregate Bond Fund
www.franklintempleton.lu 219 Audited Annual Report
USD)
Number of shares or face value Description
code
Trading Market value
% of net assets
BONDSCorporate Bonds
1.321.30
SWE 1.171.071.020.840.690.680.670.610.580.560.56
DKK 0.550.540.540.540.530.520.500.490.48
DKK 0.480.440.300.300.290.280.280.270.270.260.260.260.260.260.260.260.250.240.13
21.11Government and Municipal Bonds
7.284.484.423.363.032.762.422.382.162.161.941.94
GBP 1.821.721.461.181.171.151.141.10
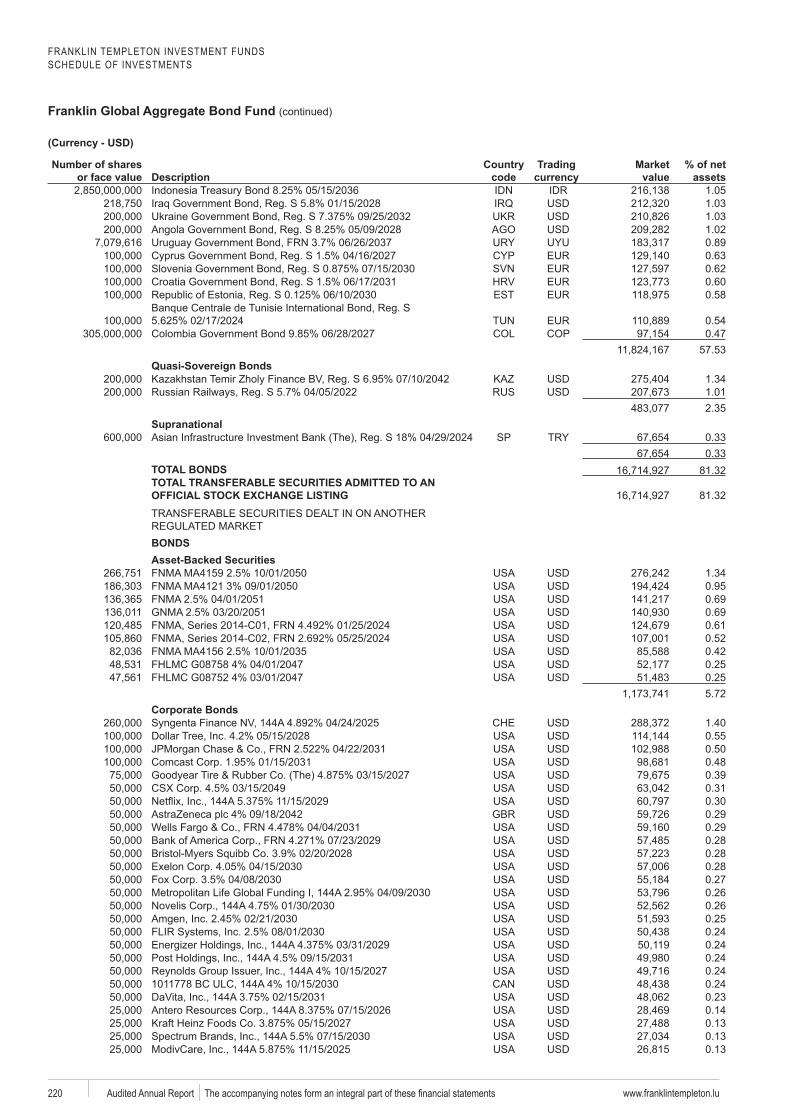
FRANKLIN TEMPLETON INVESTMENT FUNDSSCHEDULE OF INVESTMENTS
Franklin Global Aggregate Bond Fund (continued)
www.franklintempleton.lu220 Audited Annual Report
Number of shares or face value Description
code
Trading Market value
% of net assets
1.051.031.031.020.890.630.620.60
EST 0.58
0.540.47
57.53Quasi-Sovereign Bonds
1.341.012.35
SupranationalSP 0.33
0.33TOTAL BONDS 81.32TOTAL TRANSFERABLE SECURITIES ADMITTED TO AN
81.32
BONDSAsset-Backed Securities
1.340.950.690.690.610.520.420.250.255.72
Corporate Bonds1.400.550.500.480.390.310.300.290.290.280.280.280.270.260.260.250.240.240.240.240.240.230.140.130.130.13
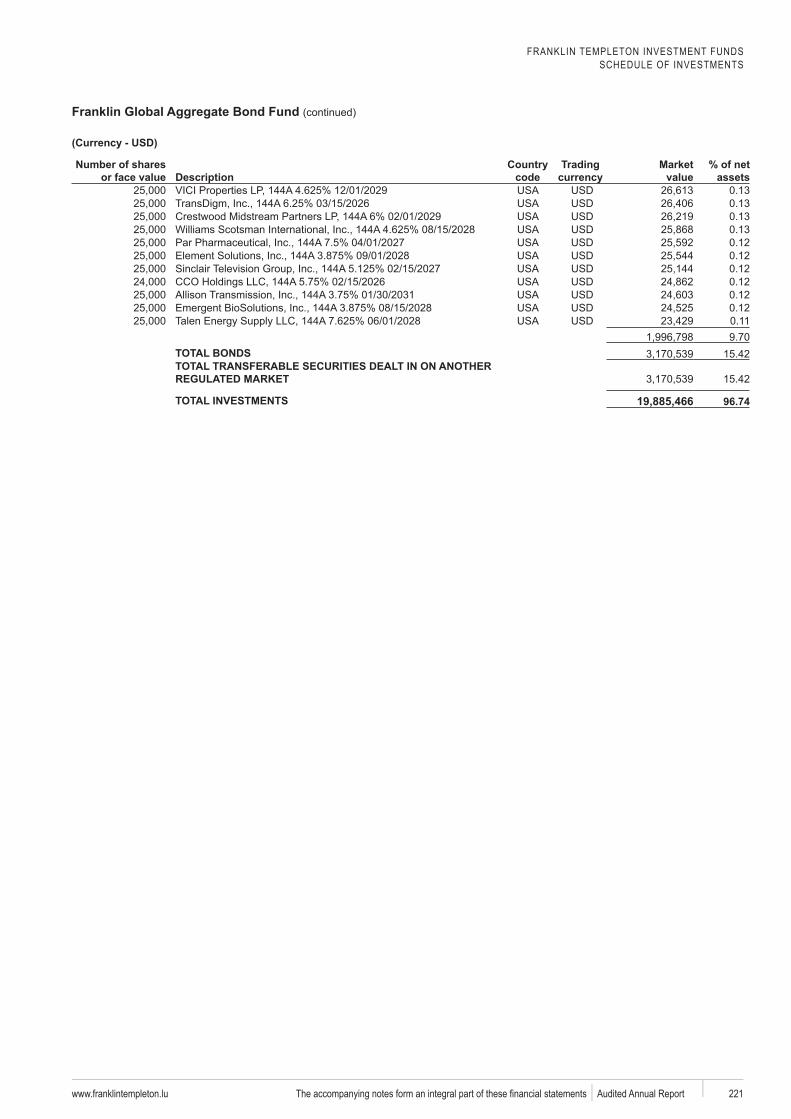
FRANKLIN TEMPLETON INVESTMENT FUNDSSCHEDULE OF INVESTMENTS
Franklin Global Aggregate Bond Fund (continued)
www.franklintempleton.lu 221 Audited Annual Report
Number of shares or face value Description
code
Trading Market value
% of net assets
0.130.130.130.130.120.120.120.120.120.120.119.70
TOTAL BONDS 15.42TOTAL TRANSFERABLE SECURITIES DEALT IN ON ANOTHER
15.42
TOTAL INVESTMENTS 19,885,466
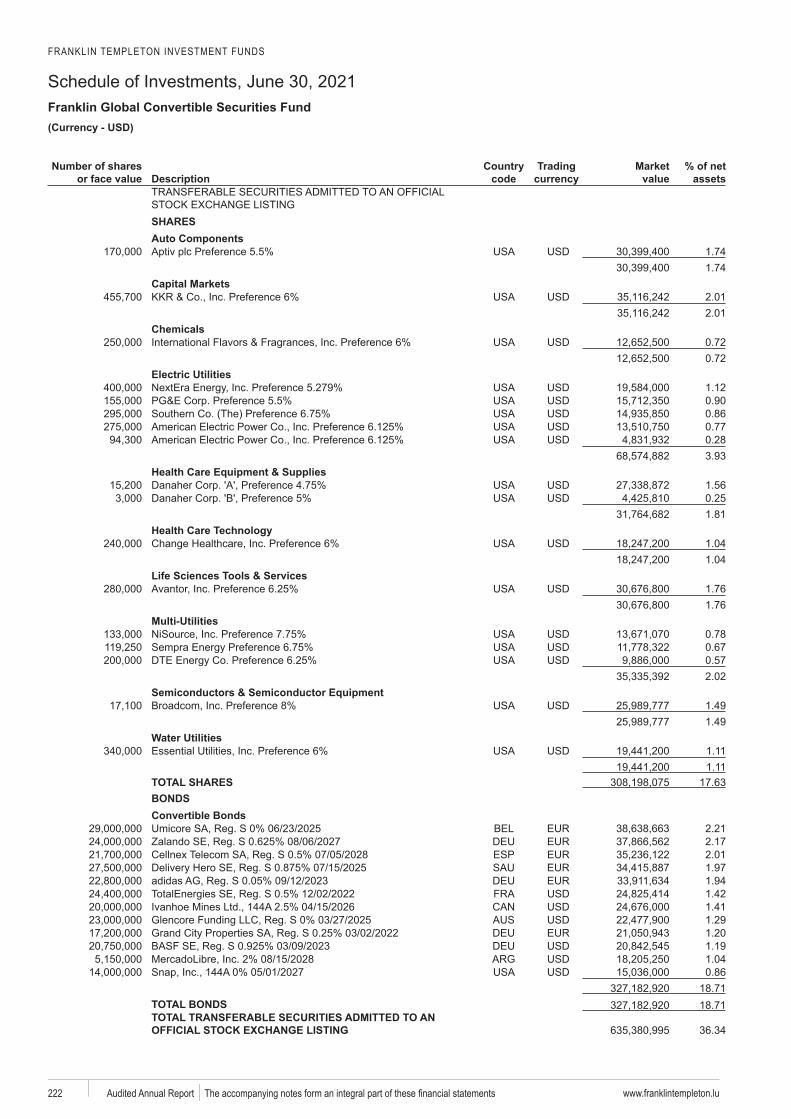
FRANKLIN TEMPLETON INVESTMENT FUNDS
Schedule of Investments, June 30, 2021Franklin Global Convertible Securities Fund
www.franklintempleton.lu222 Audited Annual Report
USD)
Number of shares or face value Description
code
Trading Market value
% of net assets
SHARESAuto Components
1.741.74
Capital Markets2.012.01
Chemicals0.720.72
Electric Utilities1.120.900.860.770.283.93
Health Care Equipment & Supplies1.560.251.81
1.041.04
Life Sciences Tools & Services1.761.76
Multi-Utilities0.780.670.572.02
Semiconductors & Semiconductor Equipment1.491.49
Water Utilities1.111.11
TOTAL SHARES 17.63BONDSConvertible Bonds
2.21Zalando 2.17
ESP 2.011.97
adidas 1.94TotalEnergies 1.42
1.411.291.201.191.040.86
18.71TOTAL BONDS 18.71TOTAL TRANSFERABLE SECURITIES ADMITTED TO AN
36.34
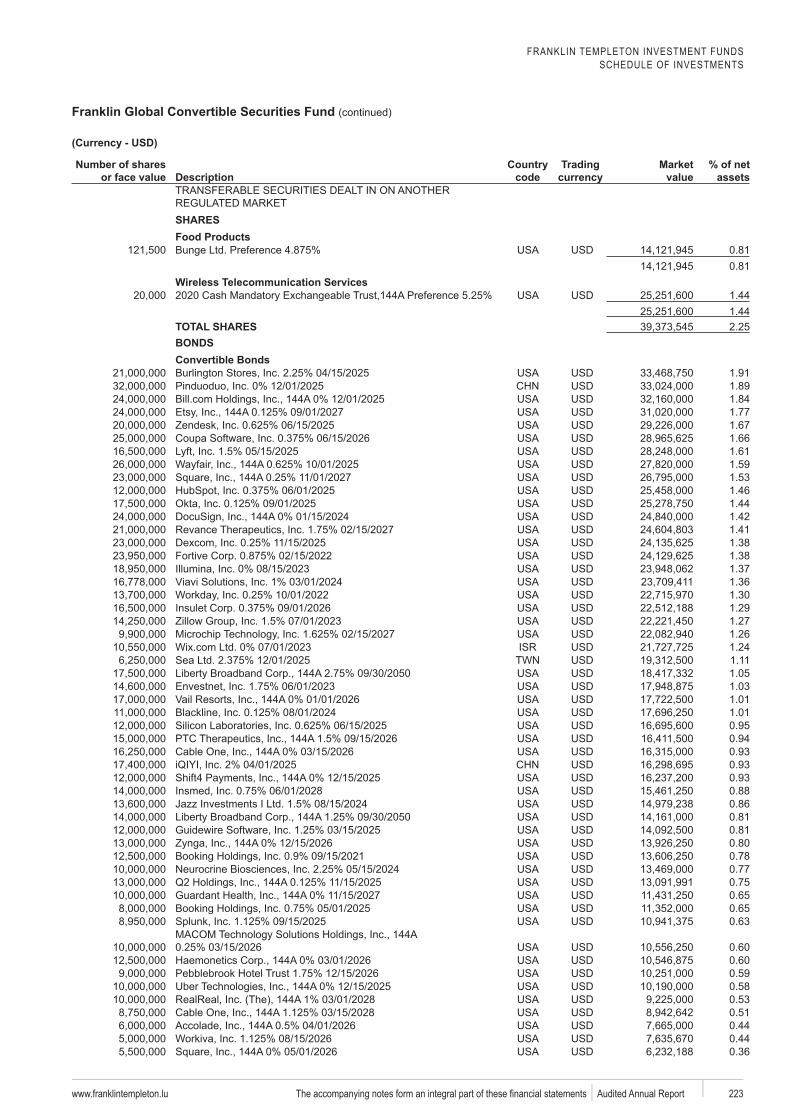
FRANKLIN TEMPLETON INVESTMENT FUNDSSCHEDULE OF INVESTMENTS
Franklin Global Convertible Securities Fund (continued)
www.franklintempleton.lu 223 Audited Annual Report
Number of shares or face value Description
code
Trading Market value
% of net assets
SHARESFood Products
0.810.81
Wireless Telecommunication Services1.441.44
TOTAL SHARES 2.25BONDSConvertible Bonds
1.91Pinduoduo 1.89
1.841.77
Zendesk 1.671.661.611.591.531.461.441.421.411.38
Fortive 1.381.371.361.301.291.271.261.241.111.05
Envestnet 1.031.011.010.950.940.930.930.930.880.860.810.810.800.780.770.750.650.650.63
0.600.600.590.580.530.510.44
Workiva 0.440.36
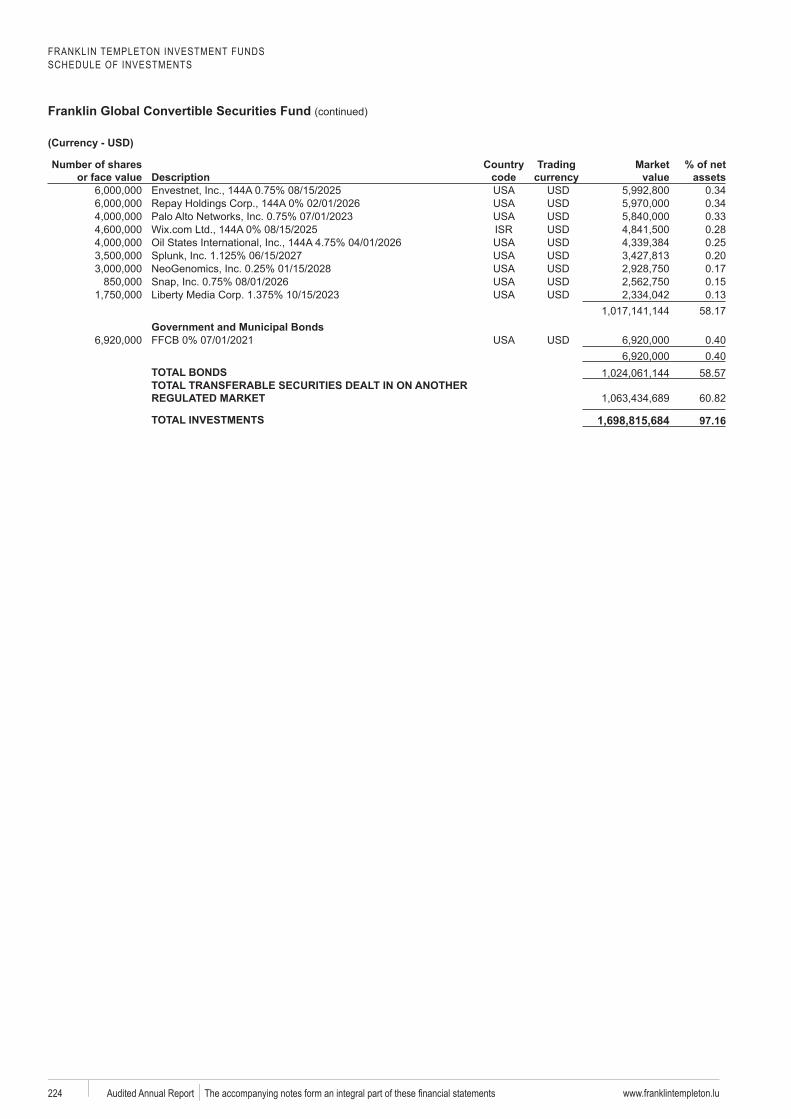
FRANKLIN TEMPLETON INVESTMENT FUNDSSCHEDULE OF INVESTMENTS
Franklin Global Convertible Securities Fund (continued)
www.franklintempleton.lu224 Audited Annual Report
Number of shares or face value Description
code
Trading Market value
% of net assets
Envestnet 0.340.340.330.280.250.200.170.150.13
58.17Government and Municipal Bonds
0.400.40
TOTAL BONDS 58.57TOTAL TRANSFERABLE SECURITIES DEALT IN ON ANOTHER
60.82
TOTAL INVESTMENTS 1,698,815,684
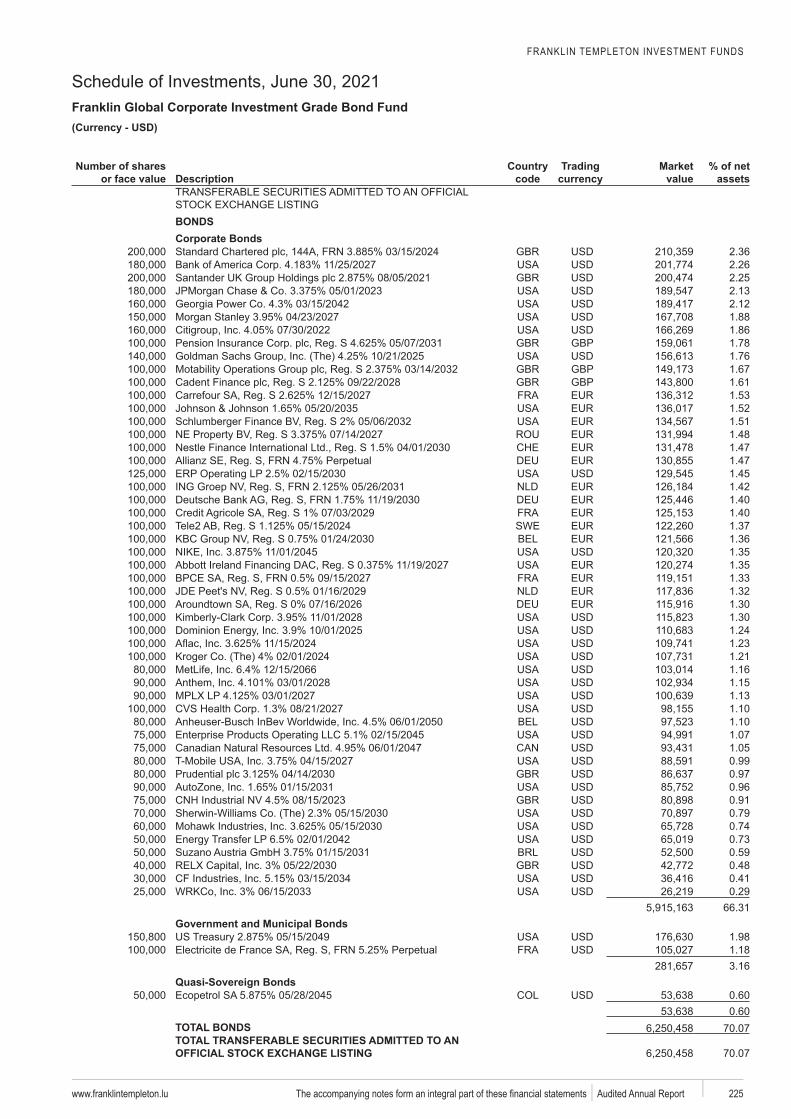
FRANKLIN TEMPLETON INVESTMENT FUNDS
Schedule of Investments, June 30, 2021Franklin Global Corporate Investment Grade Bond Fund
www.franklintempleton.lu 225 Audited Annual Report
USD)
Number of shares or face value Description
code
Trading Market value
% of net assets
BONDSCorporate Bonds
2.362.262.252.132.121.881.86
GBP 1.781.76
GBP 1.67GBP 1.61
1.531.521.511.481.471.471.451.421.401.40
SWE 1.371.361.351.351.33
JDE 1.321.301.301.241.231.211.161.151.131.101.101.071.050.990.970.960.910.790.740.730.590.480.410.29
66.31Government and Municipal Bonds
1.98Electricite 1.18
3.16Quasi-Sovereign Bonds
0.600.60
TOTAL BONDS 70.07TOTAL TRANSFERABLE SECURITIES ADMITTED TO AN
70.07
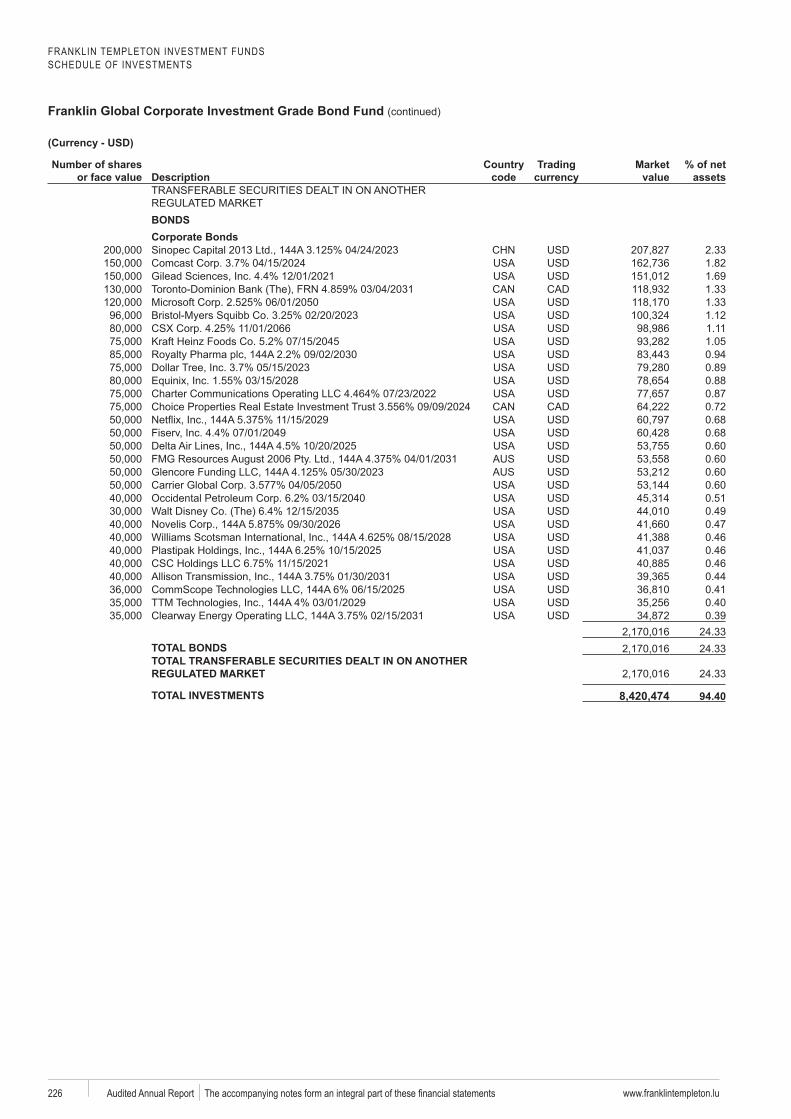
FRANKLIN TEMPLETON INVESTMENT FUNDSSCHEDULE OF INVESTMENTS
Franklin Global Corporate Investment Grade Bond Fund (continued)
www.franklintempleton.lu226 Audited Annual Report
Number of shares or face value Description
code
Trading Market value
% of net assets
BONDSCorporate Bonds
2.331.821.691.331.331.121.111.050.940.890.880.870.720.680.680.600.600.600.600.510.490.470.460.460.460.440.410.400.39
24.33TOTAL BONDS 24.33TOTAL TRANSFERABLE SECURITIES DEALT IN ON ANOTHER
24.33
TOTAL INVESTMENTS 8,420,474
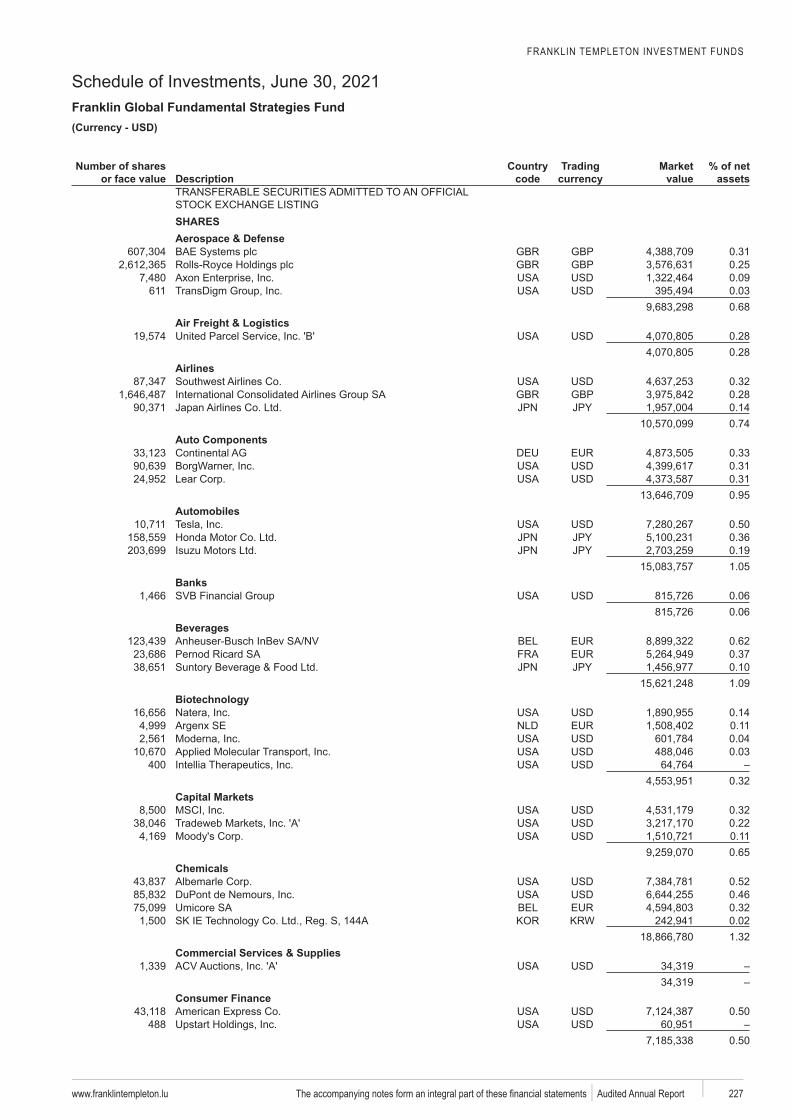
FRANKLIN TEMPLETON INVESTMENT FUNDS
Schedule of Investments, June 30, 2021Franklin Global Fundamental Strategies Fund
www.franklintempleton.lu 227 Audited Annual Report
USD)
Number of shares or face value Description
code
Trading Market value
% of net assets
SHARESAerospace & Defense
GBP 0.31GBP 0.25
0.09611 0.03
0.68Air Freight & Logistics
0.280.28
Airlines0.32
GBP 0.280.140.74
Auto Components0.330.310.310.95
Automobiles0.500.360.191.05
Banks0.060.06
Beverages0.620.370.101.09
0.140.110.040.03
4000.32
Capital Markets0.320.220.110.65
Chemicals0.520.460.320.021.32
Commercial Services & Supplies
Consumer Finance0.50
4880.50
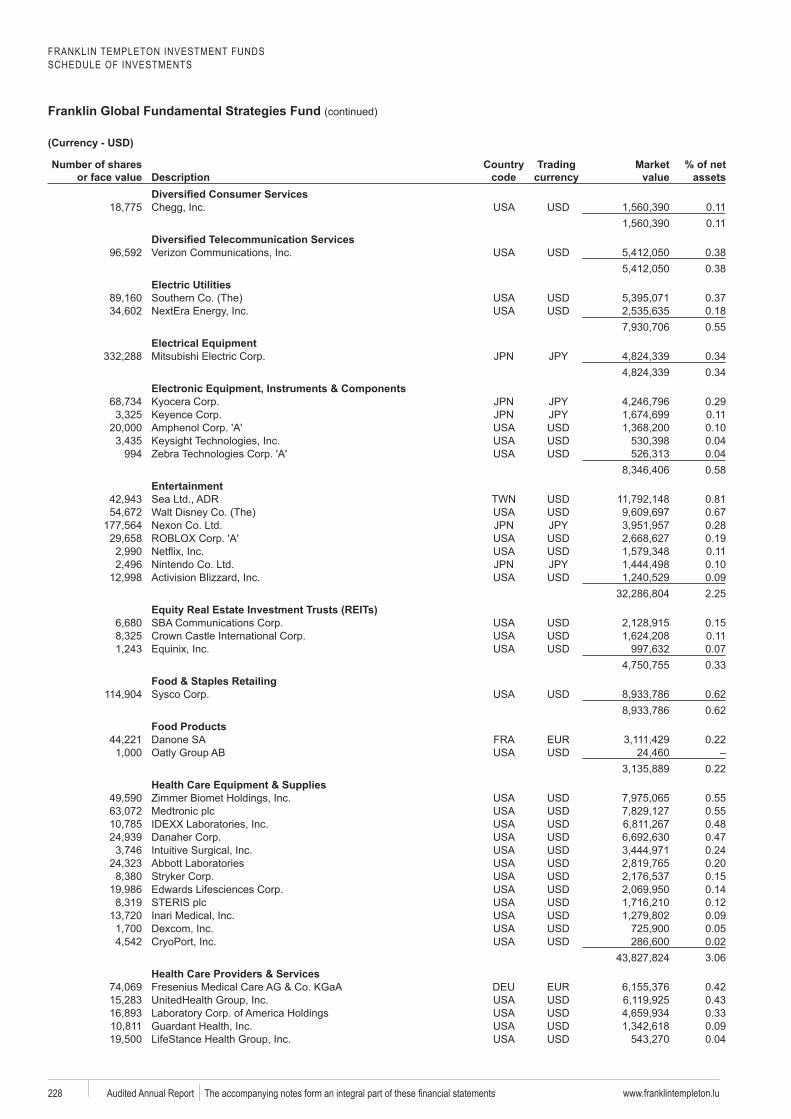
FRANKLIN TEMPLETON INVESTMENT FUNDSSCHEDULE OF INVESTMENTS
Franklin Global Fundamental Strategies Fund (continued)
www.franklintempleton.lu228 Audited Annual Report
Number of shares or face value Description
code
Trading Market value
% of net assets
0.110.11
0.380.38
Electric Utilities0.370.180.55
Electrical Equipment0.340.34
Electronic Equipment, Instruments & Components0.290.110.100.04
994 0.040.58
Entertainment0.810.670.280.190.110.100.092.25
0.150.110.070.33
Food & Staples Retailing0.620.62
Food Products0.22
0.22Health Care Equipment & Supplies
0.550.550.480.470.240.200.150.140.120.090.050.023.06
Health Care Providers & Services0.420.430.330.090.04
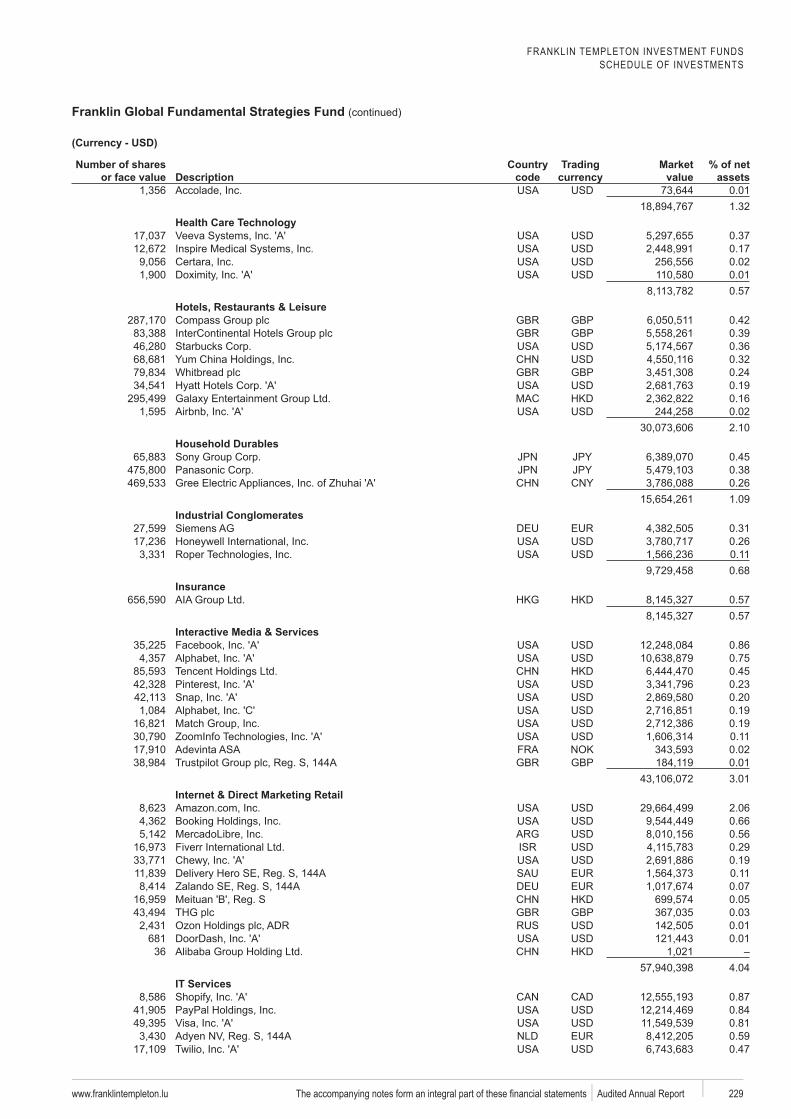
FRANKLIN TEMPLETON INVESTMENT FUNDSSCHEDULE OF INVESTMENTS
Franklin Global Fundamental Strategies Fund (continued)
www.franklintempleton.lu 229 Audited Annual Report
Number of shares or face value Description
code
Trading Market value
% of net assets
0.011.32
0.370.170.020.010.57
Hotels, Restaurants & LeisureGBP 0.42GBP 0.39
0.360.32
GBP 0.240.190.160.022.10
Household Durables0.450.380.261.09
Industrial Conglomerates0.310.260.110.68
Insurance0.570.57
Interactive Media & Services0.860.750.450.230.200.190.190.110.02
GBP 0.013.01
Internet & Direct Marketing Retail2.060.660.560.290.190.110.070.05
GBP 0.030.01
681 0.0136
4.04IT Services
0.870.840.810.590.47
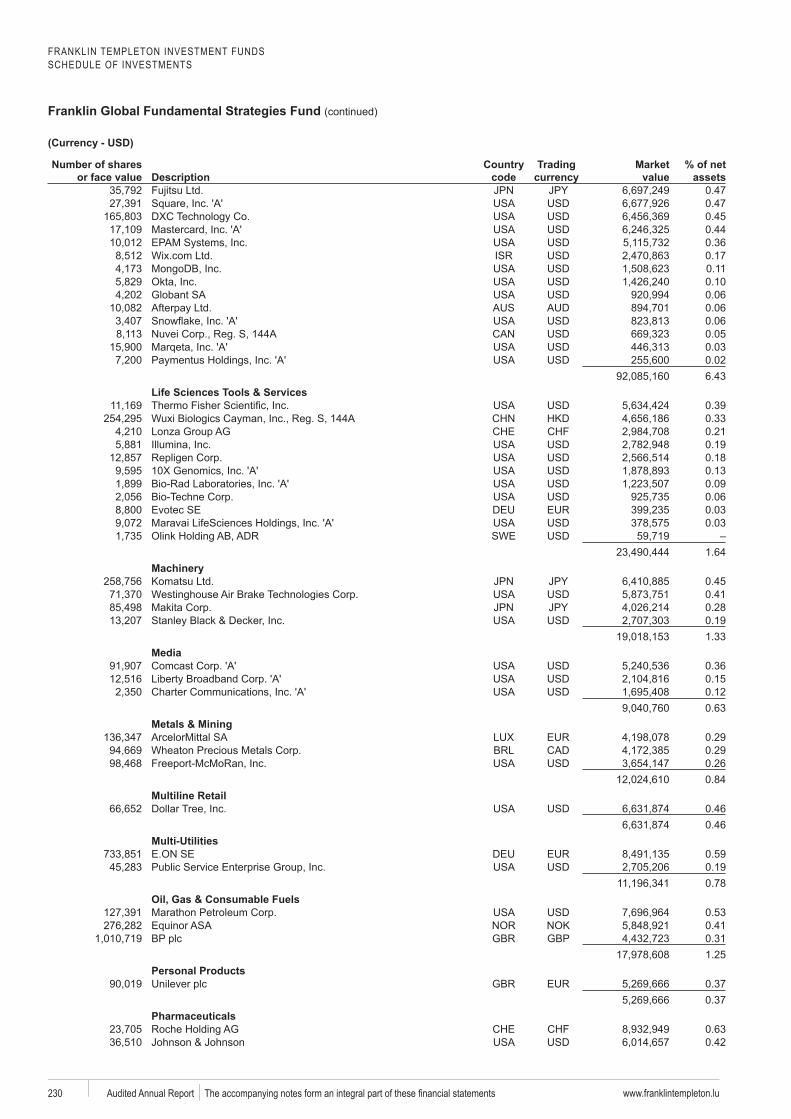
FRANKLIN TEMPLETON INVESTMENT FUNDSSCHEDULE OF INVESTMENTS
Franklin Global Fundamental Strategies Fund (continued)
www.franklintempleton.lu230 Audited Annual Report
Number of shares or face value Description
code
Trading Market value
% of net assets
0.470.470.450.440.360.170.110.100.060.060.060.050.030.026.43
Life Sciences Tools & Services0.390.330.210.190.180.130.090.06
Evotec SE 0.030.03
SWE1.64
0.450.410.280.191.33
Media0.360.150.120.63
Metals & Mining0.290.290.260.84
Multiline Retail0.460.46
Multi-Utilities0.590.190.78
Oil, Gas & Consumable Fuels0.530.41
GBP 0.311.25
Personal Products0.370.37
Pharmaceuticals0.630.42
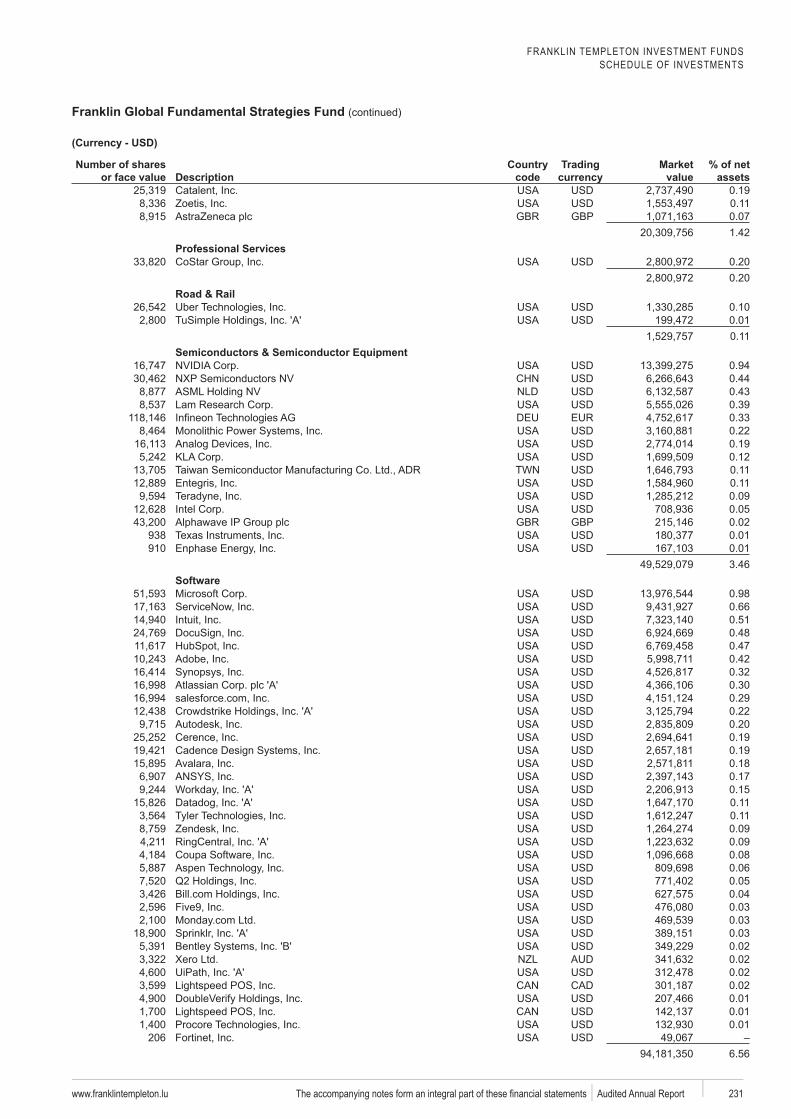
FRANKLIN TEMPLETON INVESTMENT FUNDSSCHEDULE OF INVESTMENTS
Franklin Global Fundamental Strategies Fund (continued)
www.franklintempleton.lu 231 Audited Annual Report
Number of shares or face value Description
code
Trading Market value
% of net assets
0.190.11
GBP 0.071.42
Professional Services0.200.20
Road & Rail0.100.010.11
Semiconductors & Semiconductor Equipment0.940.440.430.390.330.220.190.120.110.110.090.05
GBP 0.02938 0.01910 0.01
3.46
0.980.660.510.480.470.420.320.300.290.220.200.190.190.180.170.150.110.110.090.090.080.060.050.040.030.030.030.020.020.020.020.010.010.01
2066.56
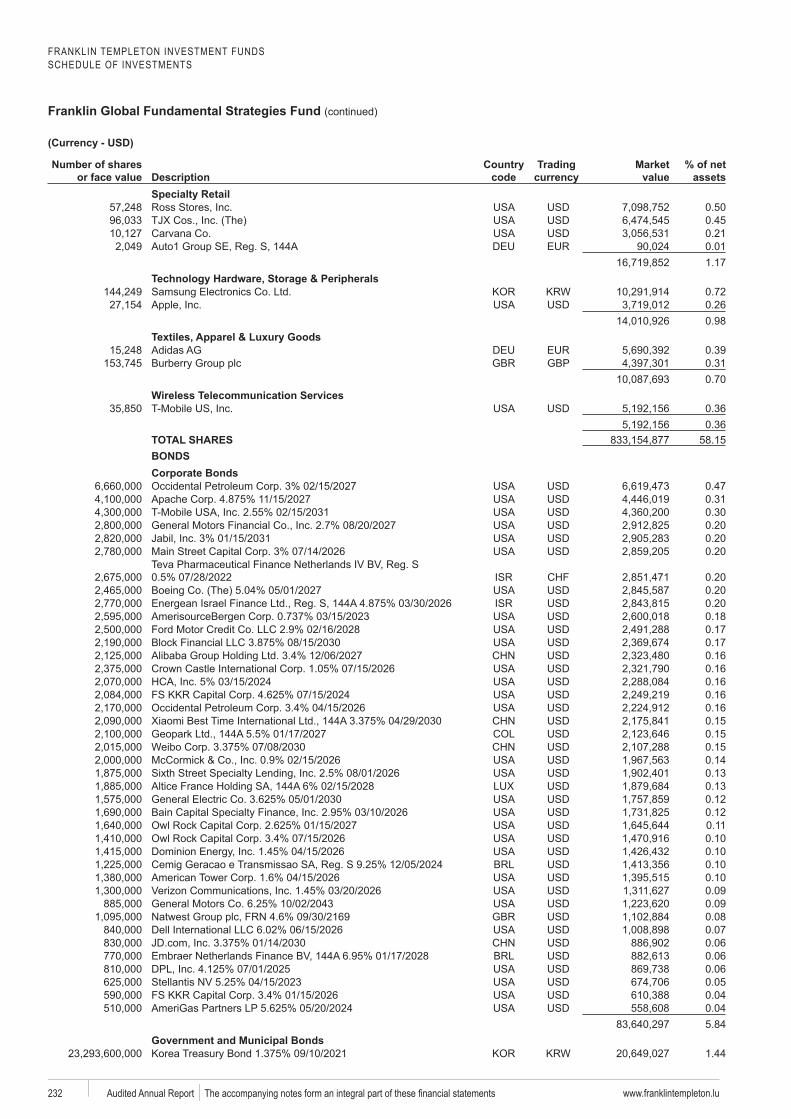
FRANKLIN TEMPLETON INVESTMENT FUNDSSCHEDULE OF INVESTMENTS
Franklin Global Fundamental Strategies Fund (continued)
www.franklintempleton.lu232 Audited Annual Report
Number of shares or face value Description
code
Trading Market value
% of net assets
0.500.450.210.011.17
0.720.260.98
0.39GBP 0.31
0.70Wireless Telecommunication Services
0.360.36
TOTAL SHARES 58.15BONDSCorporate Bonds
0.470.310.300.200.200.20
0.200.200.200.180.170.170.160.160.160.160.160.150.150.150.140.130.130.120.120.110.100.100.100.100.090.090.080.070.060.060.060.050.040.045.84
Government and Municipal Bonds1.44
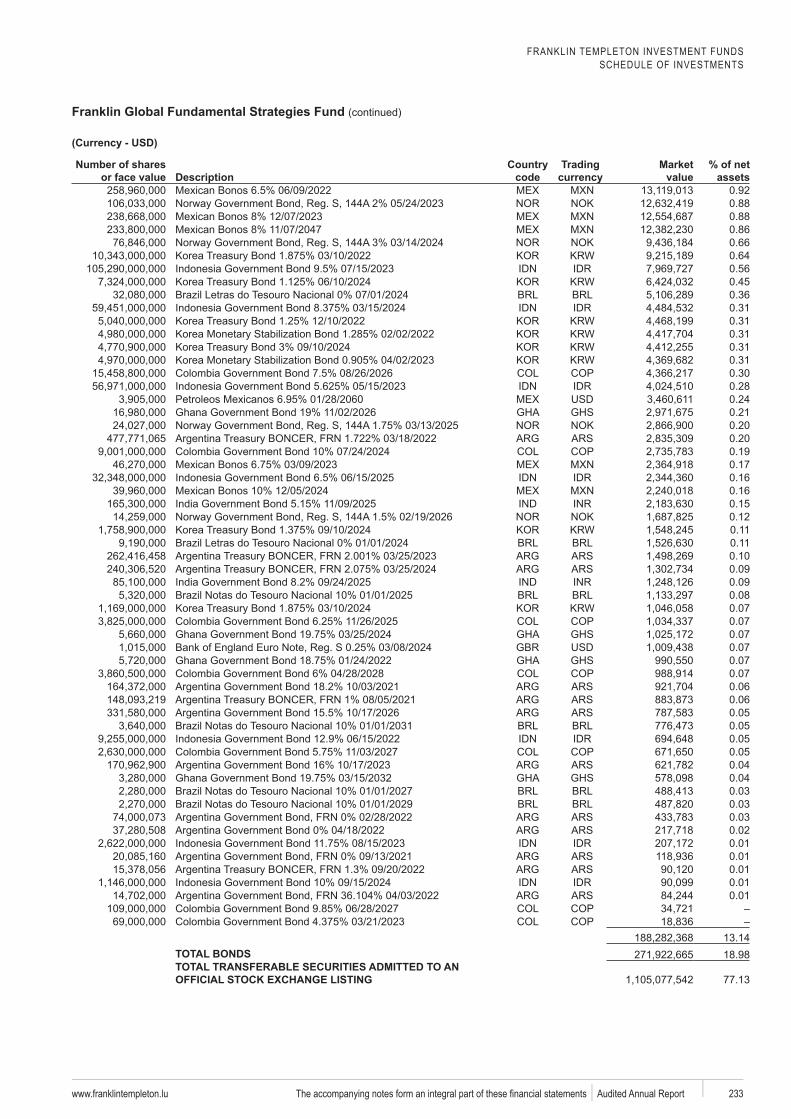
FRANKLIN TEMPLETON INVESTMENT FUNDSSCHEDULE OF INVESTMENTS
Franklin Global Fundamental Strategies Fund (continued)
www.franklintempleton.lu 233 Audited Annual Report
Number of shares or face value Description
code
Trading Market value
% of net assets
0.920.880.880.860.660.640.560.450.360.310.310.310.310.310.300.280.240.210.200.200.190.170.160.160.150.120.110.110.100.090.090.080.070.070.070.070.070.070.060.060.050.050.050.050.040.040.030.030.030.020.010.010.010.010.01
13.14TOTAL BONDS 18.98TOTAL TRANSFERABLE SECURITIES ADMITTED TO AN
77.13
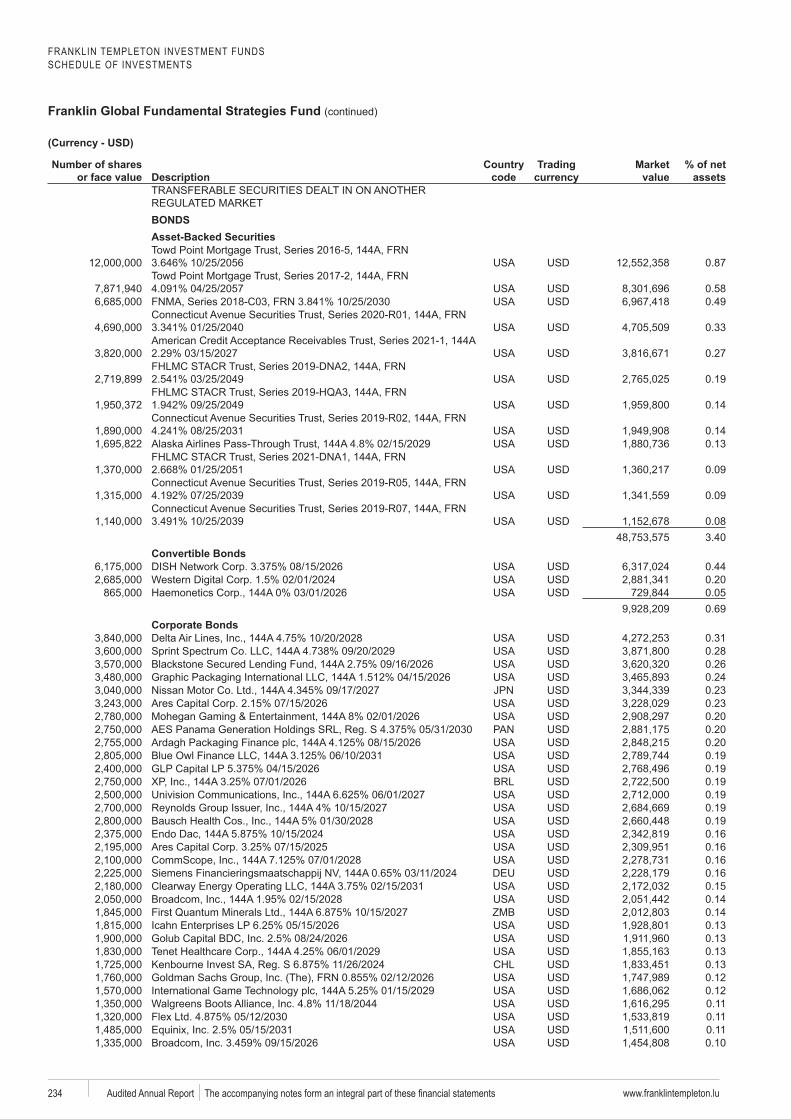
FRANKLIN TEMPLETON INVESTMENT FUNDSSCHEDULE OF INVESTMENTS
Franklin Global Fundamental Strategies Fund (continued)
www.franklintempleton.lu234 Audited Annual Report
Number of shares or face value Description
code
Trading Market value
% of net assets
BONDSAsset-Backed Securities
0.87
0.580.49
0.33
0.27
0.19
0.14
0.140.13
0.09
0.09
0.083.40
Convertible Bonds0.440.200.050.69
Corporate Bonds0.310.280.260.240.230.230.200.200.200.190.190.190.190.190.190.160.160.160.160.150.140.140.130.130.130.130.120.120.110.110.110.10
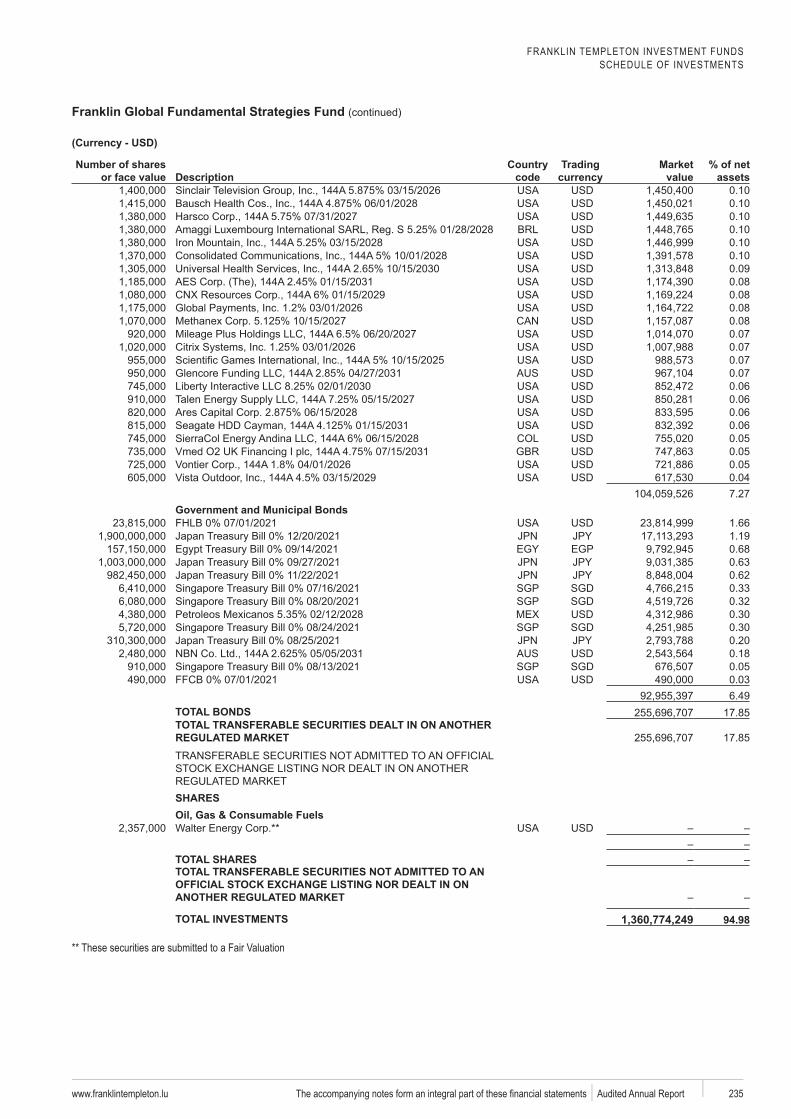
FRANKLIN TEMPLETON INVESTMENT FUNDSSCHEDULE OF INVESTMENTS
Franklin Global Fundamental Strategies Fund (continued)
www.franklintempleton.lu 235 Audited Annual Report
Number of shares or face value Description
code
Trading Market value
% of net assets
0.100.100.100.100.100.100.090.080.080.080.080.070.070.070.070.060.060.060.060.050.050.050.047.27
Government and Municipal Bonds1.661.19
EGP 0.680.630.62
SGP SGD 0.33SGP SGD 0.32
0.30SGP SGD 0.30
0.200.18
SGP SGD 0.050.036.49
TOTAL BONDS 17.85TOTAL TRANSFERABLE SECURITIES DEALT IN ON ANOTHER
17.85
SHARESOil, Gas & Consumable Fuels
TOTAL SHARESTOTAL TRANSFERABLE SECURITIES NOT ADMITTED TO AN
TOTAL INVESTMENTS 1,360,774,249
** These securities are submitted to a Fair Valuation
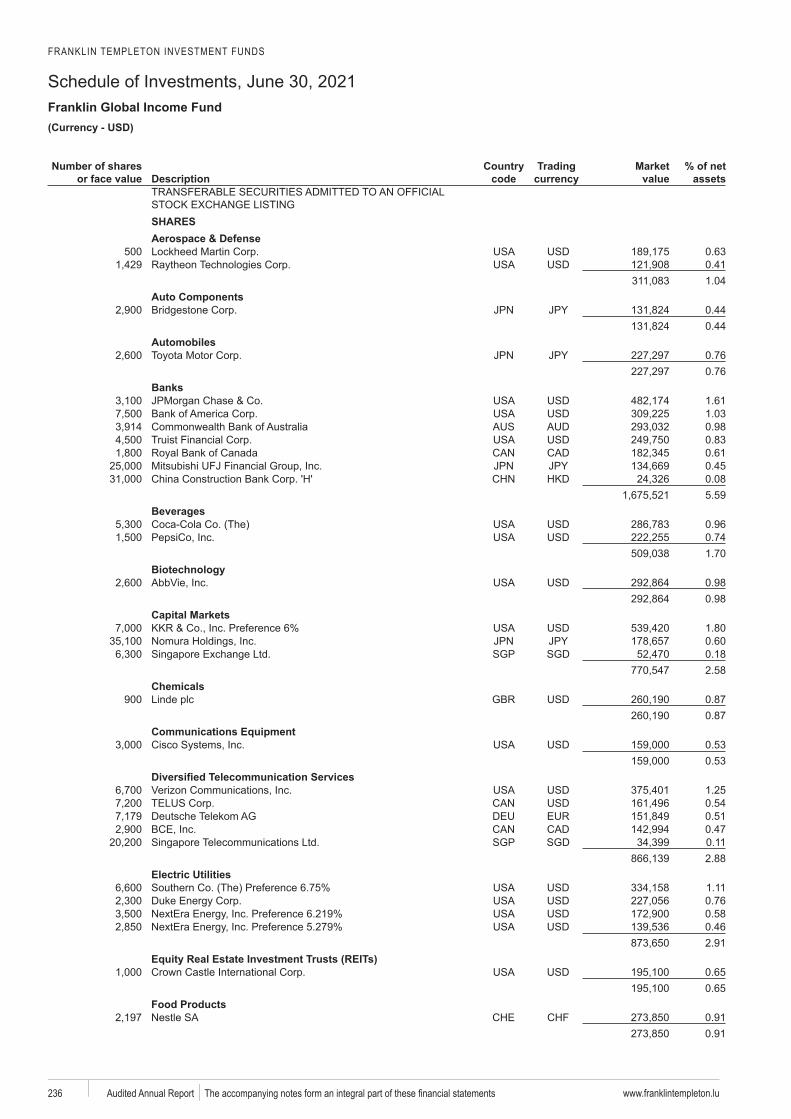
FRANKLIN TEMPLETON INVESTMENT FUNDS
Schedule of Investments, June 30, 2021Franklin Global Income Fund
www.franklintempleton.lu236 Audited Annual Report
USD)
Number of shares or face value Description
code
Trading Market value
% of net assets
SHARESAerospace & Defense
500 0.630.411.04
Auto Components0.440.44
Automobiles0.760.76
Banks1.611.030.980.830.610.450.085.59
Beverages0.960.741.70
0.980.98
Capital Markets1.800.60
SGP SGD 0.182.58
Chemicals900 0.87
0.87Communications Equipment
0.530.53
1.250.540.510.47
SGP SGD 0.112.88
Electric Utilities1.110.760.580.462.91
0.650.65
Food Products0.910.91
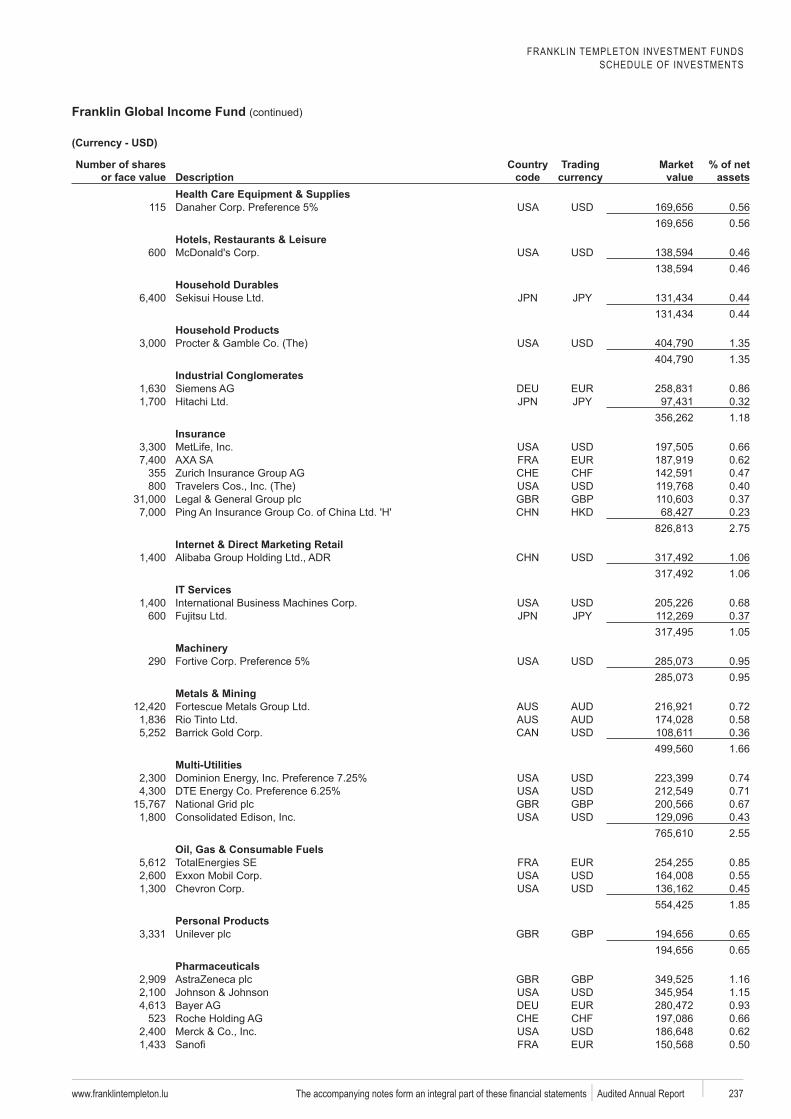
FRANKLIN TEMPLETON INVESTMENT FUNDSSCHEDULE OF INVESTMENTS
Franklin Global Income Fund (continued)
www.franklintempleton.lu 237 Audited Annual Report
Number of shares or face value Description
code
Trading Market value
% of net assets
Health Care Equipment & Supplies115 0.56
0.56Hotels, Restaurants & Leisure
600 0.460.46
Household Durables0.440.44
Household Products1.351.35
Industrial Conglomerates0.860.321.18
Insurance0.660.62
355 0.47800 0.40
GBP 0.370.232.75
Internet & Direct Marketing Retail1.061.06
IT Services0.68
600 0.371.05
290 0.950.95
Metals & Mining0.720.580.361.66
Multi-Utilities0.740.71
GBP 0.670.432.55
Oil, Gas & Consumable FuelsTotalEnergies SE 0.85
0.550.451.85
Personal ProductsGBP 0.65
0.65Pharmaceuticals
GBP 1.161.150.93
523 0.660.620.50
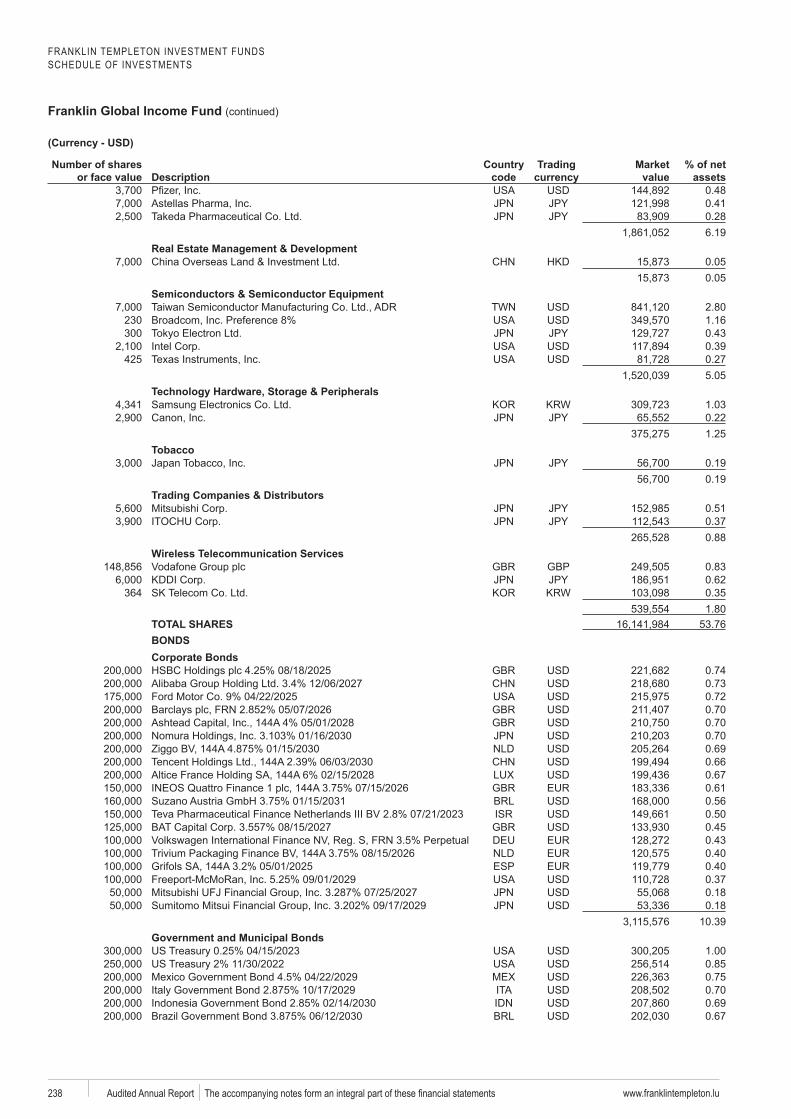
FRANKLIN TEMPLETON INVESTMENT FUNDSSCHEDULE OF INVESTMENTS
Franklin Global Income Fund (continued)
www.franklintempleton.lu238 Audited Annual Report
Number of shares or face value Description
code
Trading Market value
% of net assets
0.480.410.286.19
Real Estate Management & Development0.050.05
Semiconductors & Semiconductor Equipment2.80
230 1.16300 0.43
0.39425 0.27
5.05
1.030.221.25
Tobacco0.190.19
Trading Companies & Distributors0.510.370.88
Wireless Telecommunication ServicesGBP 0.83
0.62364 0.35
1.80TOTAL SHARES 53.76BONDSCorporate Bonds
0.740.730.720.700.700.700.690.660.670.610.560.500.450.430.40
ESP 0.400.370.180.18
10.39Government and Municipal Bonds
1.000.850.750.700.690.67
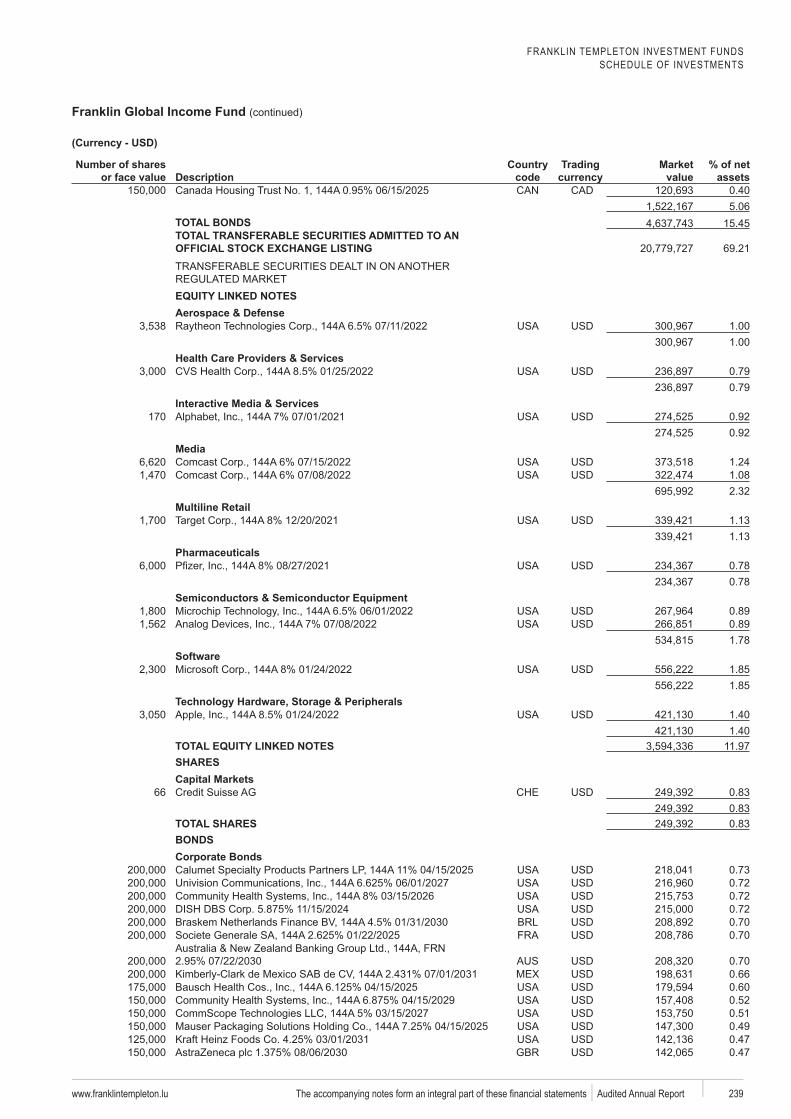
FRANKLIN TEMPLETON INVESTMENT FUNDSSCHEDULE OF INVESTMENTS
Franklin Global Income Fund (continued)
www.franklintempleton.lu 239 Audited Annual Report
Number of shares or face value Description
code
Trading Market value
% of net assets
0.405.06
TOTAL BONDS 15.45TOTAL TRANSFERABLE SECURITIES ADMITTED TO AN
69.21
Aerospace & Defense1.001.00
Health Care Providers & Services0.790.79
Interactive Media & Services170 0.92
0.92Media
1.241.082.32
Multiline Retail1.131.13
Pharmaceuticals0.780.78
Semiconductors & Semiconductor Equipment0.890.891.78
1.851.85
1.401.40
11.97SHARESCapital Markets
66 0.830.83
TOTAL SHARES 0.83BONDSCorporate Bonds
0.730.720.720.720.700.70
0.700.660.600.520.510.490.470.47
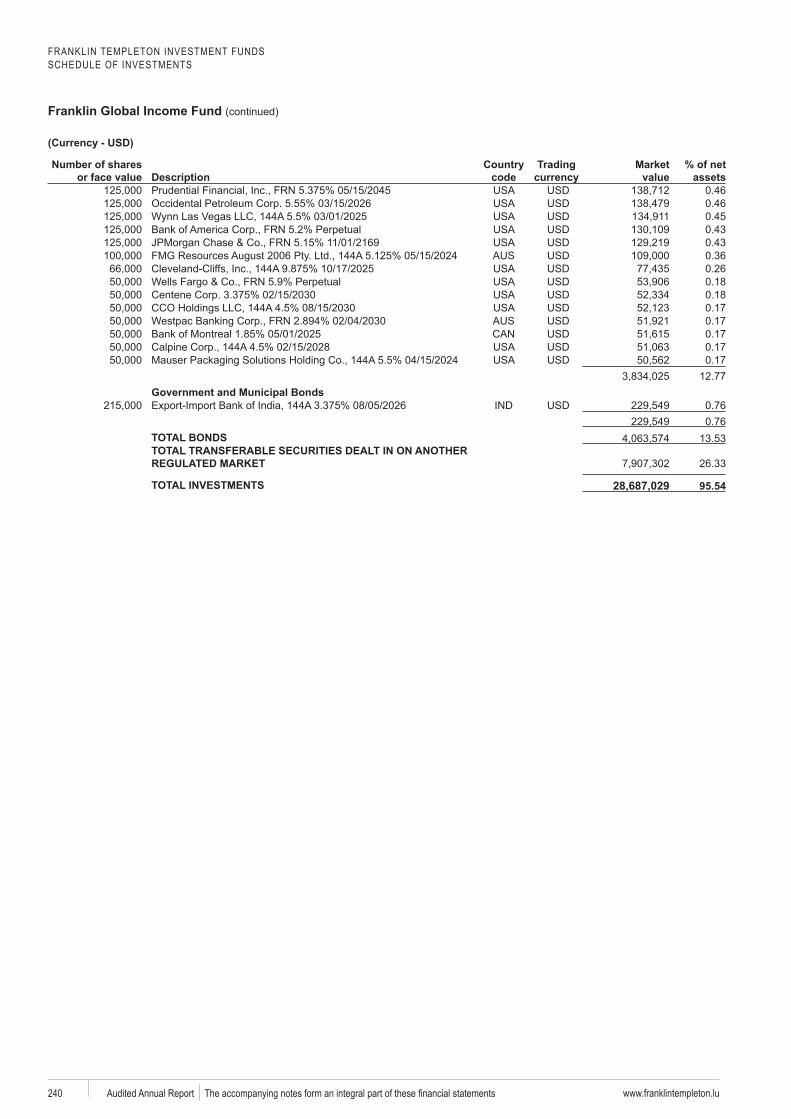
FRANKLIN TEMPLETON INVESTMENT FUNDSSCHEDULE OF INVESTMENTS
Franklin Global Income Fund (continued)
www.franklintempleton.lu240 Audited Annual Report
Number of shares or face value Description
code
Trading Market value
% of net assets
0.460.460.450.430.430.360.260.180.180.170.170.170.170.17
12.77Government and Municipal Bonds
0.760.76
TOTAL BONDS 13.53TOTAL TRANSFERABLE SECURITIES DEALT IN ON ANOTHER
26.33
TOTAL INVESTMENTS 28,687,029
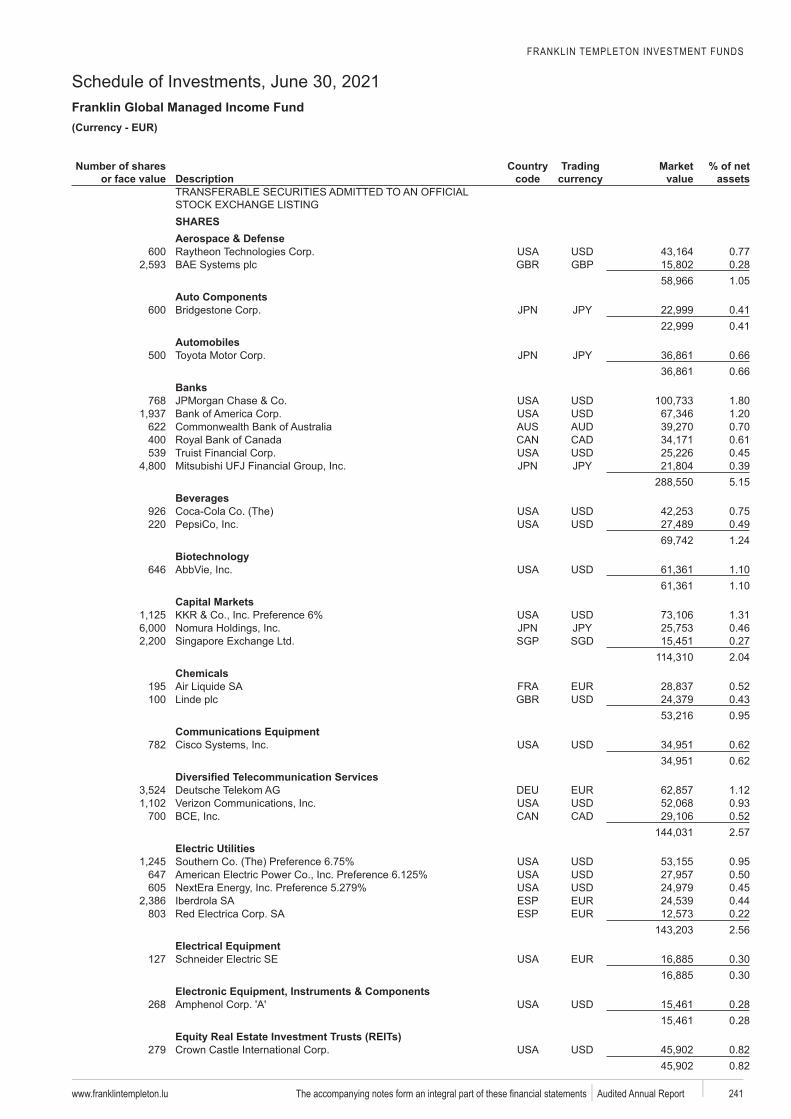
FRANKLIN TEMPLETON INVESTMENT FUNDS
Schedule of Investments, June 30, 2021Franklin Global Managed Income Fund
www.franklintempleton.lu 241 Audited Annual Report
EUR)
Number of shares or face value Description
code
Trading Market value
% of net assets
SHARESAerospace & Defense
600 0.77GBP 0.28
1.05Auto Components
600 0.410.41
Automobiles500 0.66
0.66Banks
768 1.801.20
622 0.70400 0.61539 Truist 0.45
0.395.15
Beverages926 0.75220 0.49
1.24
646 1.101.10
Capital Markets1.310.46
SGP SGD 0.272.04
Chemicals195 0.52100 0.43
0.95Communications Equipment
782 0.620.62
1.120.93
700 0.522.57
Electric Utilities0.95
647 0.50605 0.45
ESP 0.44803 Electrica ESP 0.22
2.56Electrical Equipment
127 Schneider Electric SE 0.300.30
Electronic Equipment, Instruments & Components268 0.28
0.28
279 0.820.82
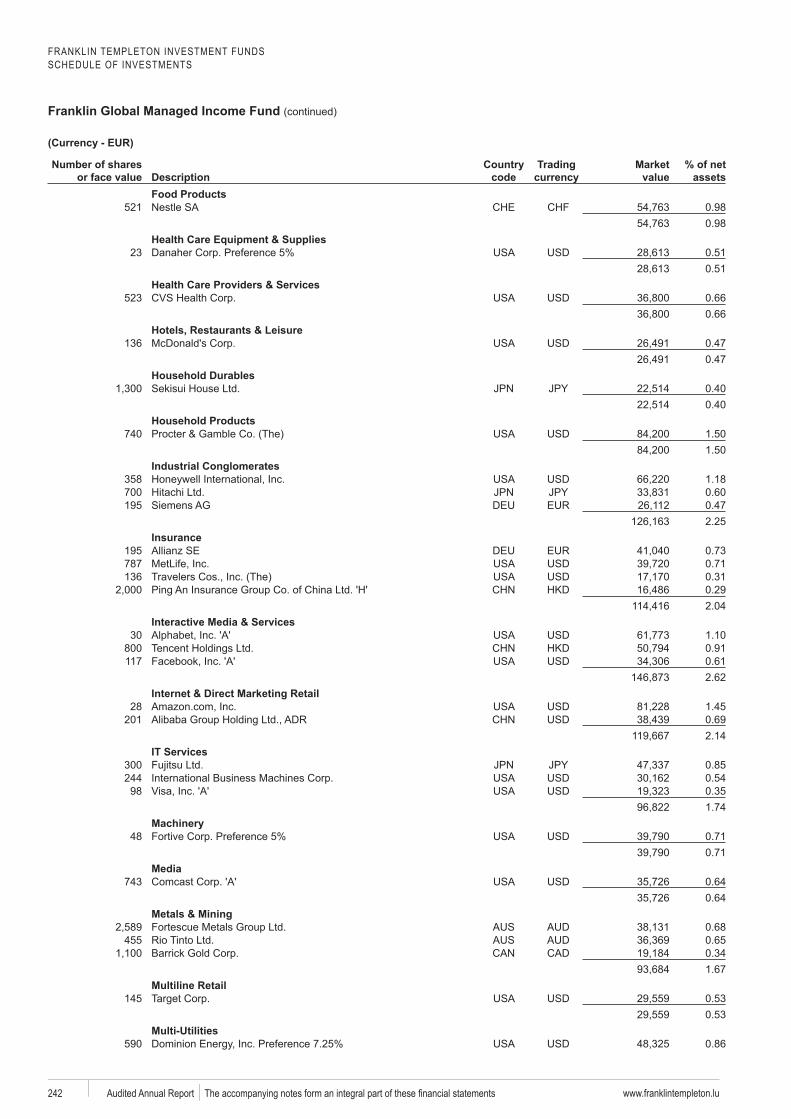
FRANKLIN TEMPLETON INVESTMENT FUNDSSCHEDULE OF INVESTMENTS
Franklin Global Managed Income Fund (continued)
www.franklintempleton.lu242 Audited Annual Report
Number of shares or face value Description
code
Trading Market value
% of net assets
Food Products521 0.98
0.98Health Care Equipment & Supplies
23 0.510.51
Health Care Providers & Services523 0.66
0.66Hotels, Restaurants & Leisure
136 0.470.47
Household Durables0.400.40
Household Products740 1.50
1.50Industrial Conglomerates
358 1.18700 0.60195 0.47
2.25Insurance
195 0.73787 0.71136 0.31
0.292.04
Interactive Media & Services30 1.10
800 Tencent 0.91117 0.61
2.62Internet & Direct Marketing Retail
28 1.45201 0.69
2.14IT Services
300 0.85244 0.5498 0.35
1.74
48 Fortive 0.710.71
Media743 0.64
0.64Metals & Mining
0.68455 0.65
0.341.67
Multiline Retail145 0.53
0.53Multi-Utilities
590 0.86
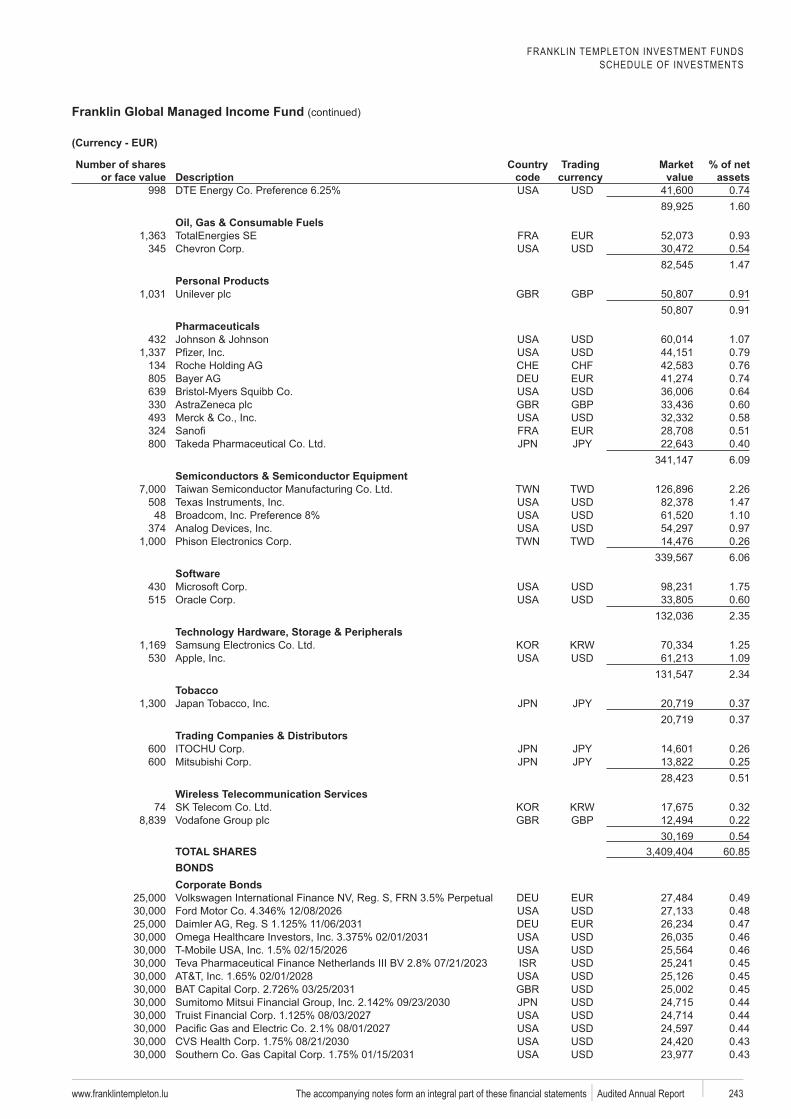
FRANKLIN TEMPLETON INVESTMENT FUNDSSCHEDULE OF INVESTMENTS
Franklin Global Managed Income Fund (continued)
www.franklintempleton.lu 243 Audited Annual Report
Number of shares or face value Description
code
Trading Market value
% of net assets
998 0.741.60
Oil, Gas & Consumable FuelsTotalEnergies SE 0.93
345 0.541.47
Personal ProductsGBP 0.91
0.91Pharmaceuticals
432 1.070.79
134 0.76805 0.74639 0.64330 GBP 0.60493 0.58324 0.51800 0.40
6.09Semiconductors & Semiconductor Equipment
TWD 2.26508 1.4748 1.10
374 0.97Phison TWD 0.26
6.06
430 1.75515 0.60
2.35
1.25530 1.09
2.34Tobacco
0.370.37
Trading Companies & Distributors600 0.26600 0.25
0.51Wireless Telecommunication Services
74 0.32GBP 0.22
0.54TOTAL SHARES 60.85BONDSCorporate Bonds
0.490.480.470.460.46
Teva 0.450.450.450.44
Truist 0.440.440.430.43
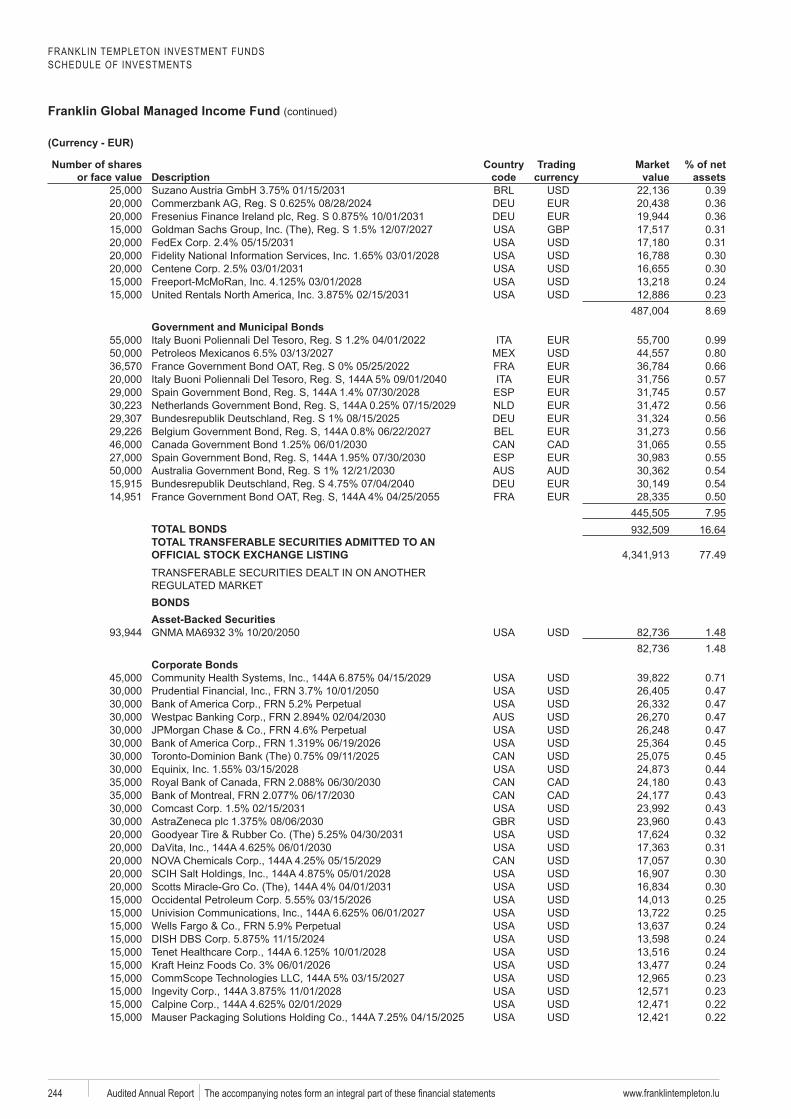
FRANKLIN TEMPLETON INVESTMENT FUNDSSCHEDULE OF INVESTMENTS
Franklin Global Managed Income Fund (continued)
www.franklintempleton.lu244 Audited Annual Report
Number of shares or face value Description
code
Trading Market value
% of net assets
0.390.360.36
GBP 0.310.310.300.300.240.238.69
Government and Municipal BondsBuoni Poliennali 0.99
Petroleos 0.800.66
Buoni Poliennali 0.57ESP 0.57
0.560.560.560.55
ESP 0.550.540.540.507.95
TOTAL BONDS 16.64TOTAL TRANSFERABLE SECURITIES ADMITTED TO AN
77.49
BONDSAsset-Backed Securities
1.481.48
Corporate Bonds0.710.470.470.470.470.450.450.440.430.430.430.430.320.310.300.30
Gro 0.300.250.250.240.240.240.240.230.230.220.22
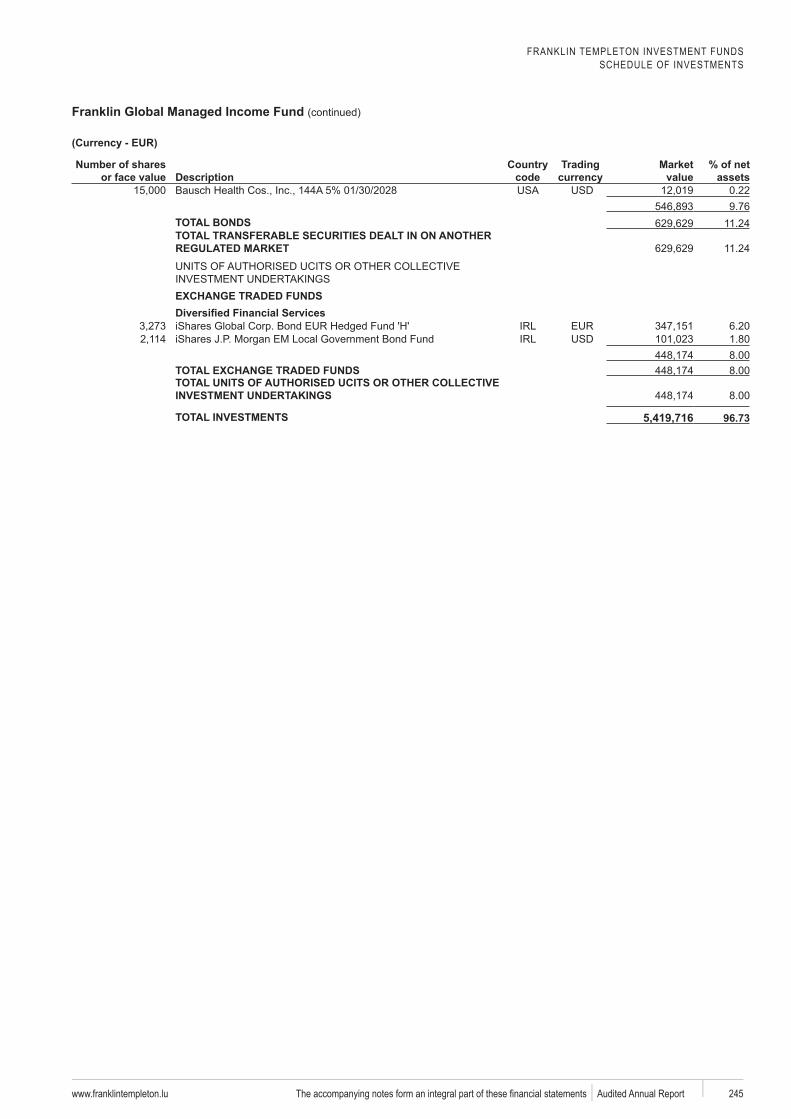
FRANKLIN TEMPLETON INVESTMENT FUNDSSCHEDULE OF INVESTMENTS
Franklin Global Managed Income Fund (continued)
www.franklintempleton.lu 245 Audited Annual Report
Number of shares or face value Description
code
Trading Market value
% of net assets
0.229.76
TOTAL BONDS 11.24TOTAL TRANSFERABLE SECURITIES DEALT IN ON ANOTHER
11.24
EXCHANGE TRADED FUNDS
iShares 6.20iShares 1.80
8.00TOTAL EXCHANGE TRADED FUNDS 8.00TOTAL UNITS OF AUTHORISED UCITS OR OTHER COLLECTIVE
8.00
TOTAL INVESTMENTS 5,419,716
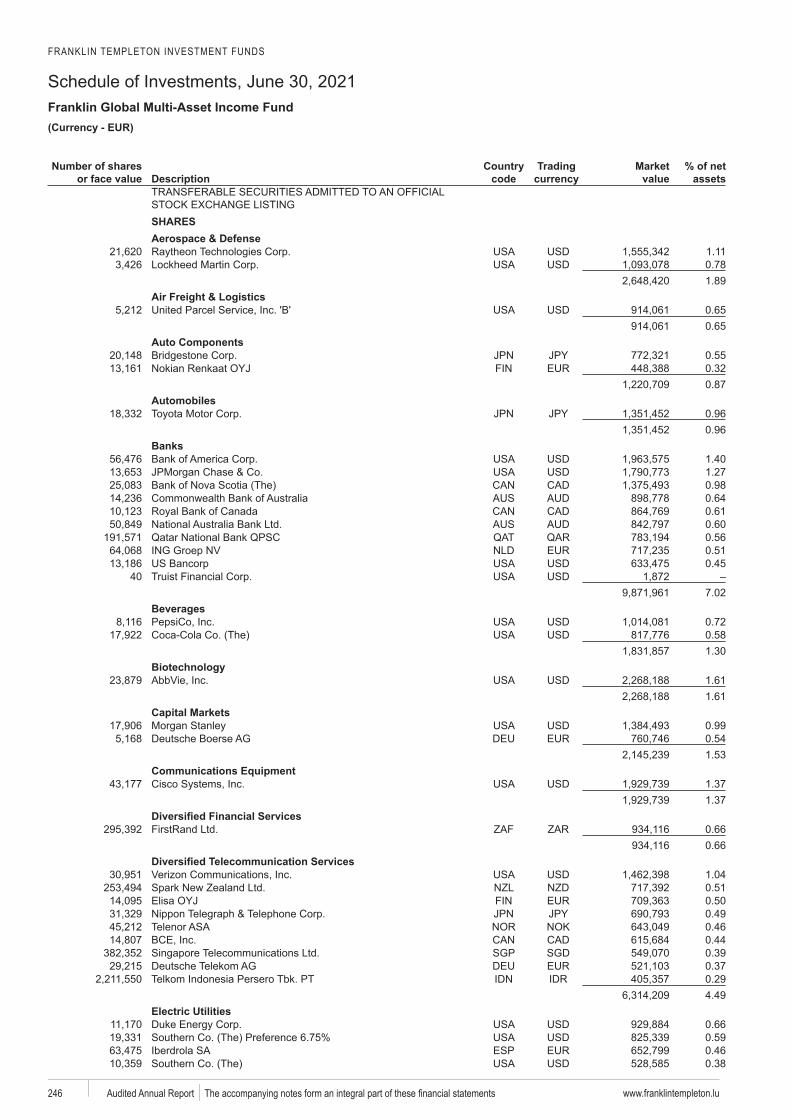
FRANKLIN TEMPLETON INVESTMENT FUNDS
Schedule of Investments, June 30, 2021Franklin Global Multi-Asset Income Fund
www.franklintempleton.lu246 Audited Annual Report
EUR)
Number of shares or face value Description
code
Trading Market value
% of net assets
SHARESAerospace & Defense
1.110.781.89
Air Freight & Logistics0.650.65
Auto Components0.550.320.87
Automobiles0.960.96
Banks1.401.270.980.640.610.600.560.510.45
407.02
Beverages0.720.581.30
1.611.61
Capital Markets0.990.541.53
Communications Equipment1.371.37
0.660.66
1.040.510.500.490.460.44
SGP SGD 0.390.370.294.49
Electric Utilities0.660.59
ESP 0.460.38
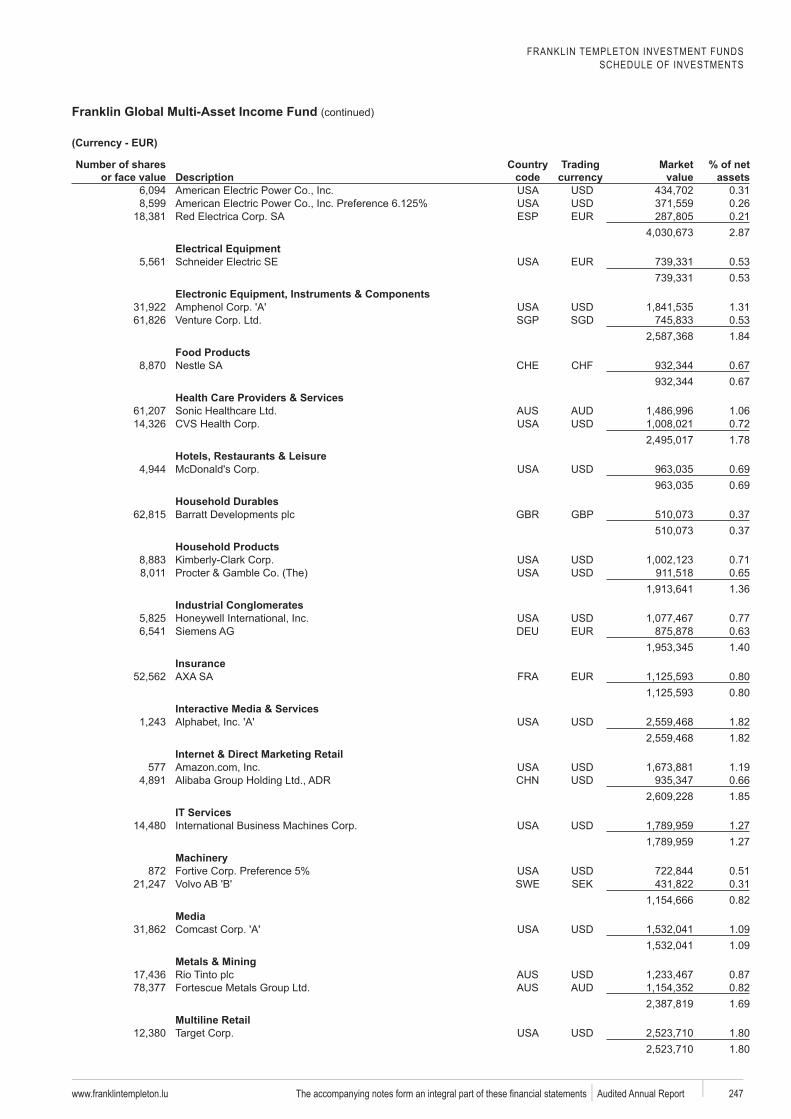
FRANKLIN TEMPLETON INVESTMENT FUNDSSCHEDULE OF INVESTMENTS
Franklin Global Multi-Asset Income Fund (continued)
www.franklintempleton.lu 247 Audited Annual Report
Number of shares or face value Description
code
Trading Market value
% of net assets
0.310.26
ESP 0.212.87
Electrical EquipmentSchneider Electric SE 0.53
0.53Electronic Equipment, Instruments & Components
1.31SGP SGD 0.53
1.84Food Products
0.670.67
Health Care Providers & Services1.060.721.78
Hotels, Restaurants & Leisure0.690.69
Household DurablesGBP 0.37
0.37Household Products
0.710.651.36
Industrial Conglomerates0.770.631.40
Insurance0.800.80
Interactive Media & Services1.821.82
Internet & Direct Marketing Retail577 1.19
0.661.85
IT Services1.271.27
872 0.51SWE SEK 0.31
0.82Media
1.091.09
Metals & Mining0.870.821.69
Multiline Retail1.801.80
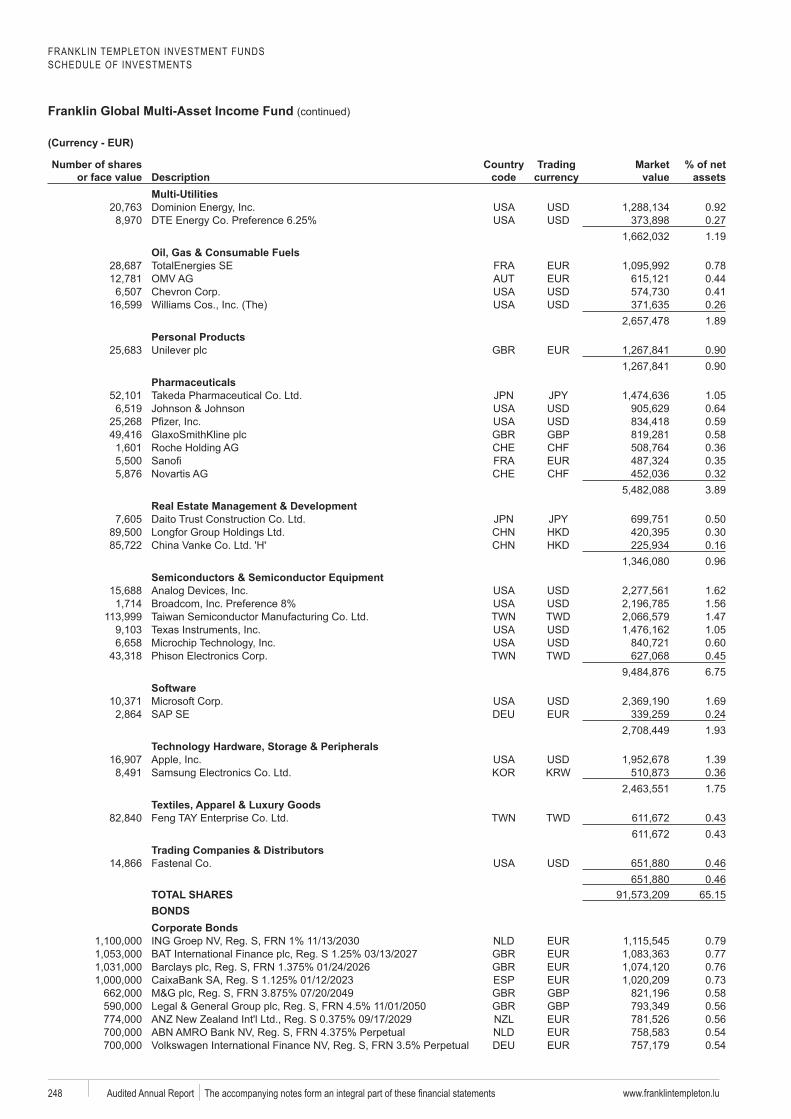
FRANKLIN TEMPLETON INVESTMENT FUNDSSCHEDULE OF INVESTMENTS
Franklin Global Multi-Asset Income Fund (continued)
www.franklintempleton.lu248 Audited Annual Report
Number of shares or face value Description
code
Trading Market value
% of net assets
Multi-Utilities0.920.271.19
Oil, Gas & Consumable FuelsTotalEnergies SE 0.78
0.440.410.261.89
Personal Products0.900.90
Pharmaceuticals1.050.640.59
GBP 0.580.360.350.323.89
Real Estate Management & Development0.500.300.160.96
Semiconductors & Semiconductor Equipment1.621.56
TWD 1.471.050.60
TWD 0.456.75
1.690.241.93
1.390.361.75
TWD 0.430.43
Trading Companies & Distributors0.460.46
TOTAL SHARES 65.15BONDSCorporate Bonds
0.790.770.76
ESP 0.73GBP 0.58GBP 0.56
0.560.540.54
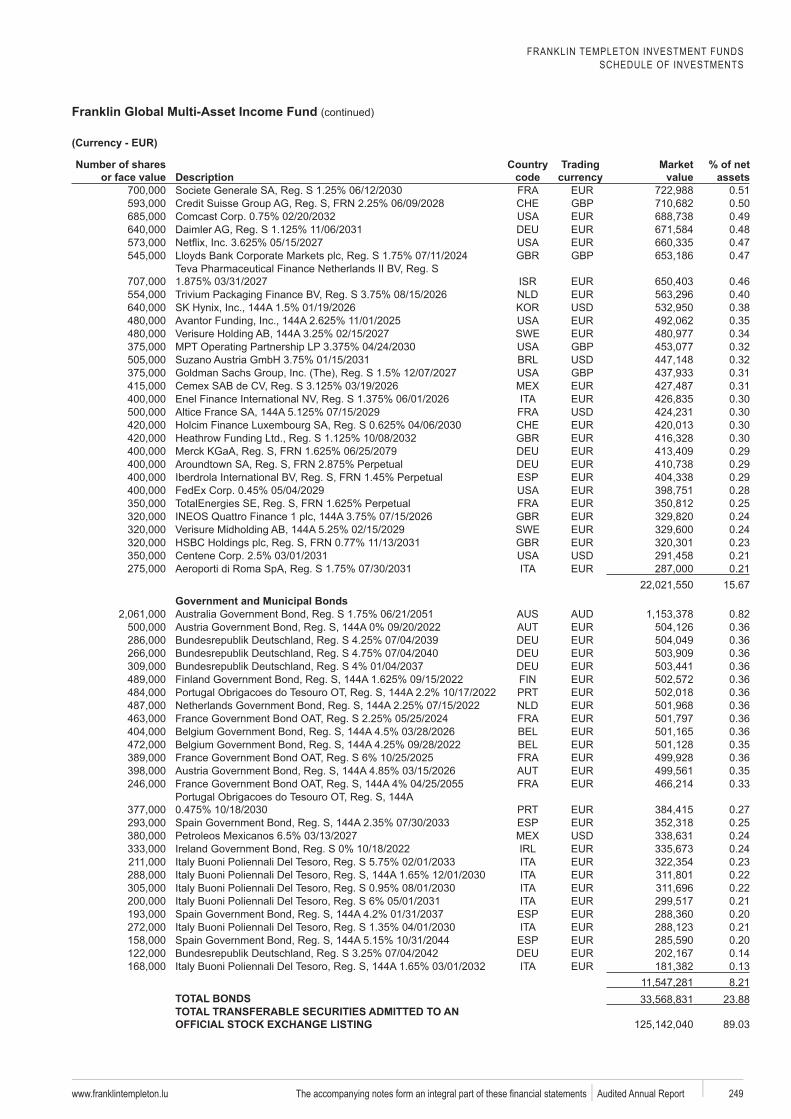
FRANKLIN TEMPLETON INVESTMENT FUNDSSCHEDULE OF INVESTMENTS
Franklin Global Multi-Asset Income Fund (continued)
www.franklintempleton.lu 249 Audited Annual Report
Number of shares or face value Description
code
Trading Market value
% of net assets
0.51GBP 0.50
0.490.480.47
GBP 0.47
0.460.400.380.35
SWE 0.34GBP 0.32
0.32GBP 0.31
0.310.300.300.300.300.290.29
ESP 0.290.280.250.24
SWE 0.240.230.210.21
15.67Government and Municipal Bonds
0.820.360.360.360.360.360.360.360.360.360.350.360.350.33
0.27ESP 0.25
0.240.240.230.220.220.21
ESP 0.200.21
ESP 0.200.140.138.21
TOTAL BONDS 23.88TOTAL TRANSFERABLE SECURITIES ADMITTED TO AN
89.03
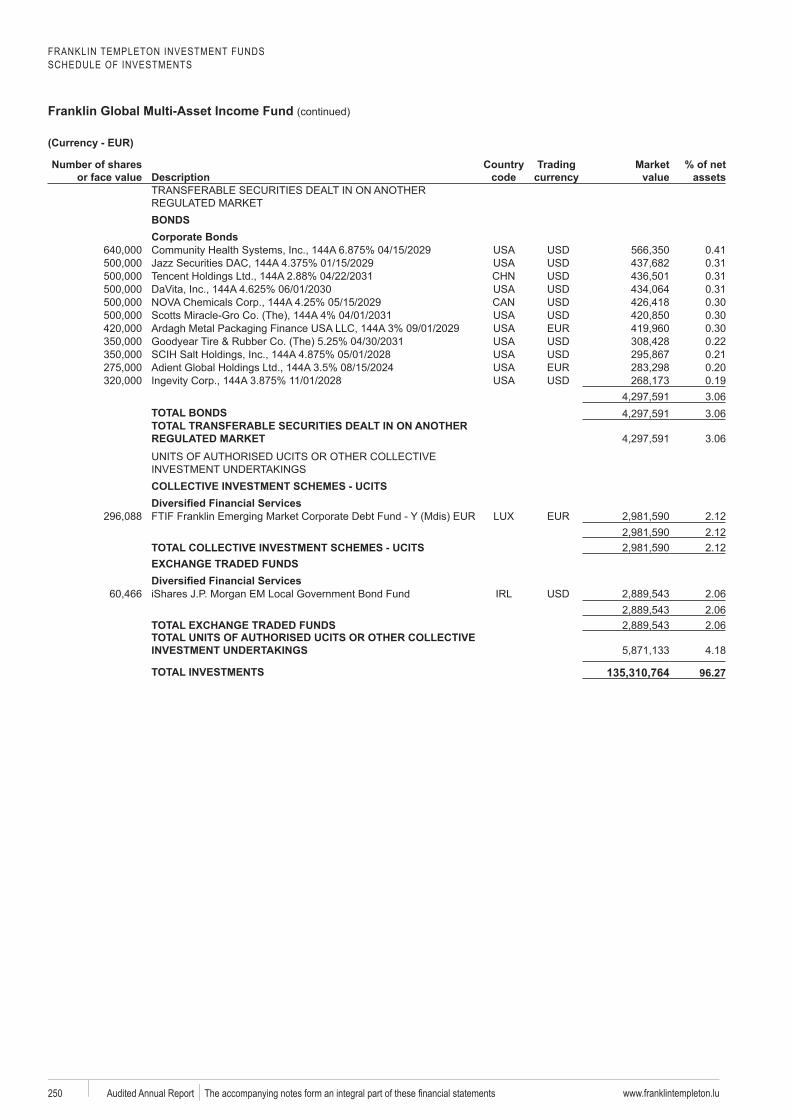
FRANKLIN TEMPLETON INVESTMENT FUNDSSCHEDULE OF INVESTMENTS
Franklin Global Multi-Asset Income Fund (continued)
www.franklintempleton.lu250 Audited Annual Report
Number of shares or face value Description
code
Trading Market value
% of net assets
BONDSCorporate Bonds
0.410.310.310.310.300.300.300.220.210.200.193.06
TOTAL BONDS 3.06TOTAL TRANSFERABLE SECURITIES DEALT IN ON ANOTHER
3.06
COLLECTIVE INVESTMENT SCHEMES - UCITS
2.122.12
TOTAL COLLECTIVE INVESTMENT SCHEMES - UCITS 2.12EXCHANGE TRADED FUNDS
2.062.06
TOTAL EXCHANGE TRADED FUNDS 2.06TOTAL UNITS OF AUTHORISED UCITS OR OTHER COLLECTIVE
4.18
TOTAL INVESTMENTS 135,310,764
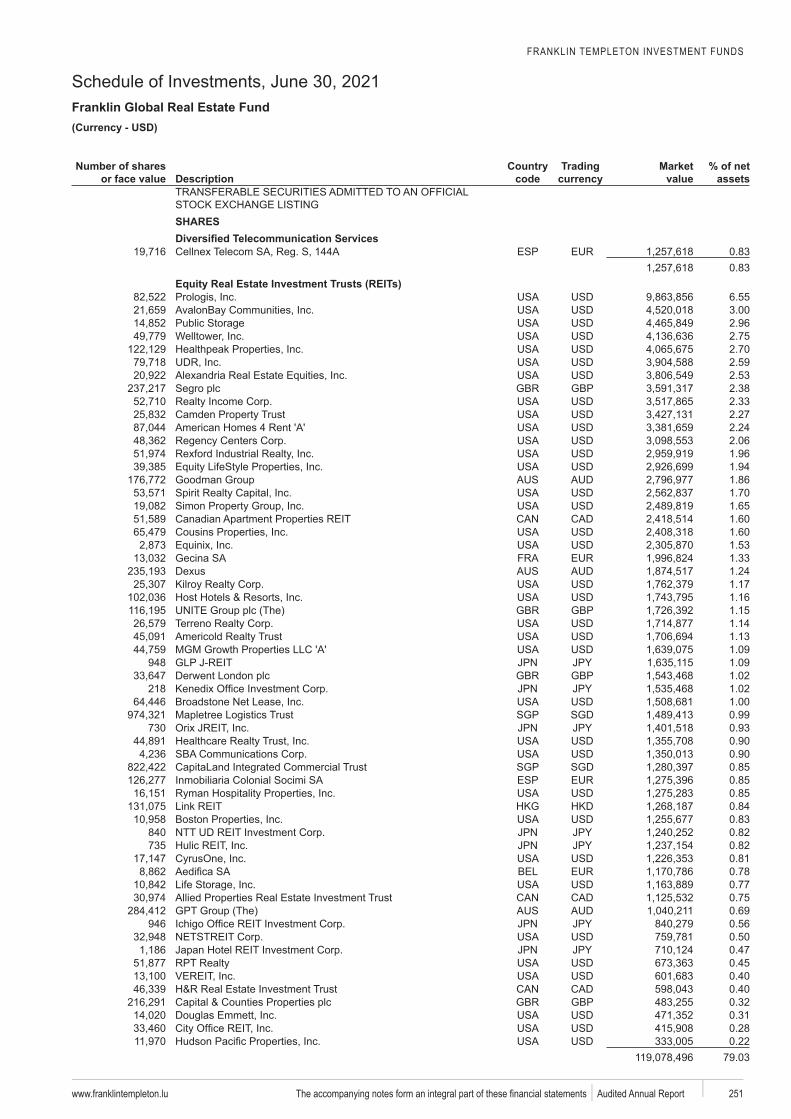
FRANKLIN TEMPLETON INVESTMENT FUNDS
Schedule of Investments, June 30, 2021Franklin Global Real Estate Fund
www.franklintempleton.lu 251 Audited Annual Report
USD)
Number of shares or face value Description
code
Trading Market value
% of net assets
SHARES
ESP 0.830.83
6.553.002.962.752.702.592.53
GBP 2.382.332.272.242.061.961.941.861.701.651.601.601.531.33
Dexus 1.241.171.16
GBP 1.151.141.131.09
948 1.09GBP 1.02
218 1.021.00
SGP SGD 0.99730 0.93
0.900.90
SGP SGD 0.85ESP 0.85
0.850.840.83
840 0.82735 0.82
0.810.780.770.750.69
946 0.560.500.470.450.400.40
GBP 0.320.310.280.22
79.03
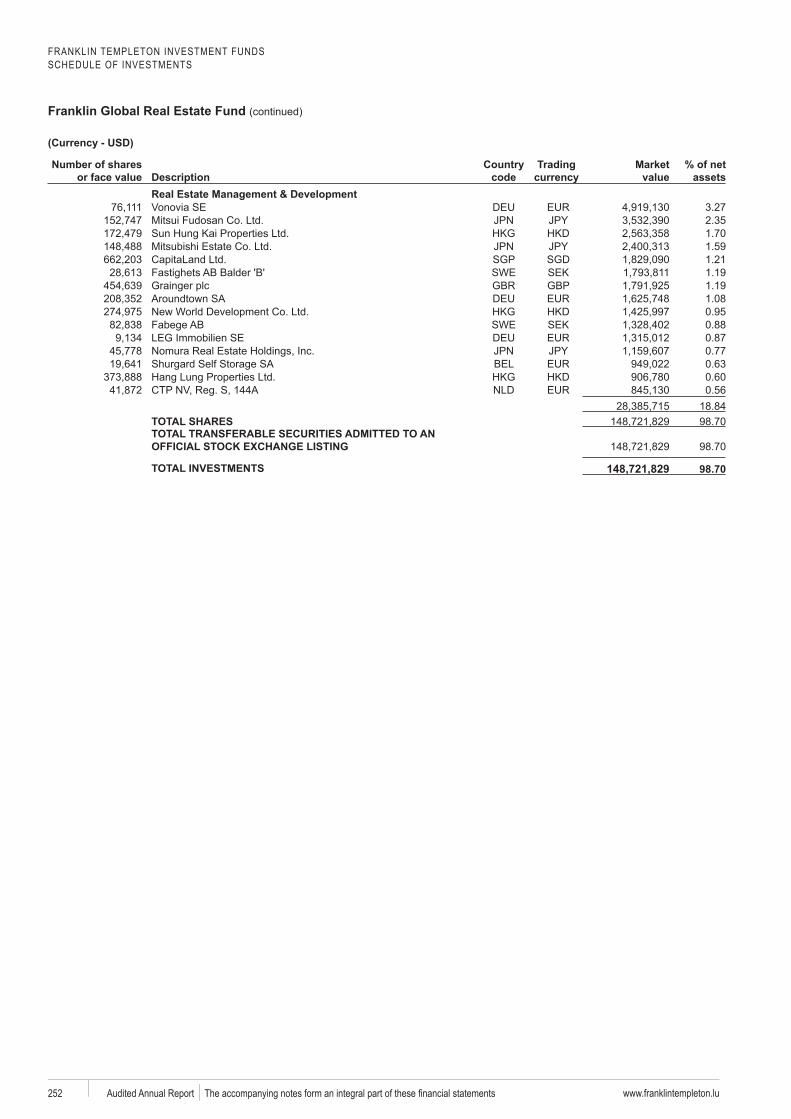
FRANKLIN TEMPLETON INVESTMENT FUNDSSCHEDULE OF INVESTMENTS
Franklin Global Real Estate Fund (continued)
www.franklintempleton.lu252 Audited Annual Report
Number of shares or face value Description
code
Trading Market value
% of net assets
Real Estate Management & Development3.272.351.701.59
SGP SGD 1.21SWE SEK 1.19
GBP 1.191.080.95
SWE SEK 0.880.870.770.630.600.56
18.84TOTAL SHARES 98.70TOTAL TRANSFERABLE SECURITIES ADMITTED TO AN
98.70
TOTAL INVESTMENTS 148,721,829
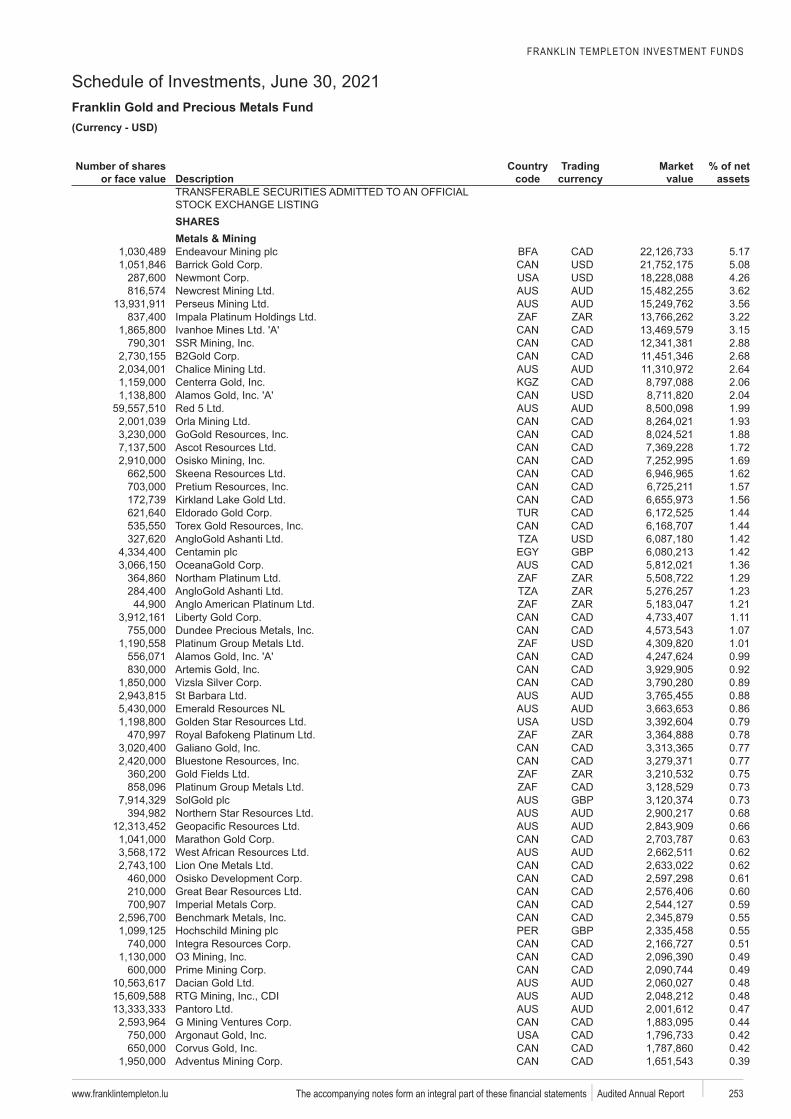
FRANKLIN TEMPLETON INVESTMENT FUNDS
Schedule of Investments, June 30, 2021Franklin Gold and Precious Metals Fund
www.franklintempleton.lu 253 Audited Annual Report
USD)
Number of shares or face value Description
code
Trading Market value
% of net assets
SHARESMetals & Mining
5.175.084.263.623.563.223.152.882.682.64
KGZ 2.062.041.991.93
GoGold 1.881.721.691.621.571.561.44
Torex 1.441.42
GBP 1.421.361.291.231.211.111.071.010.990.920.890.880.860.79
Bafokeng 0.78Galiano 0.77
0.770.750.73
SolGold GBP 0.730.680.660.630.620.620.610.600.590.55
GBP 0.550.510.490.490.480.48
Pantoro 0.470.440.420.420.39
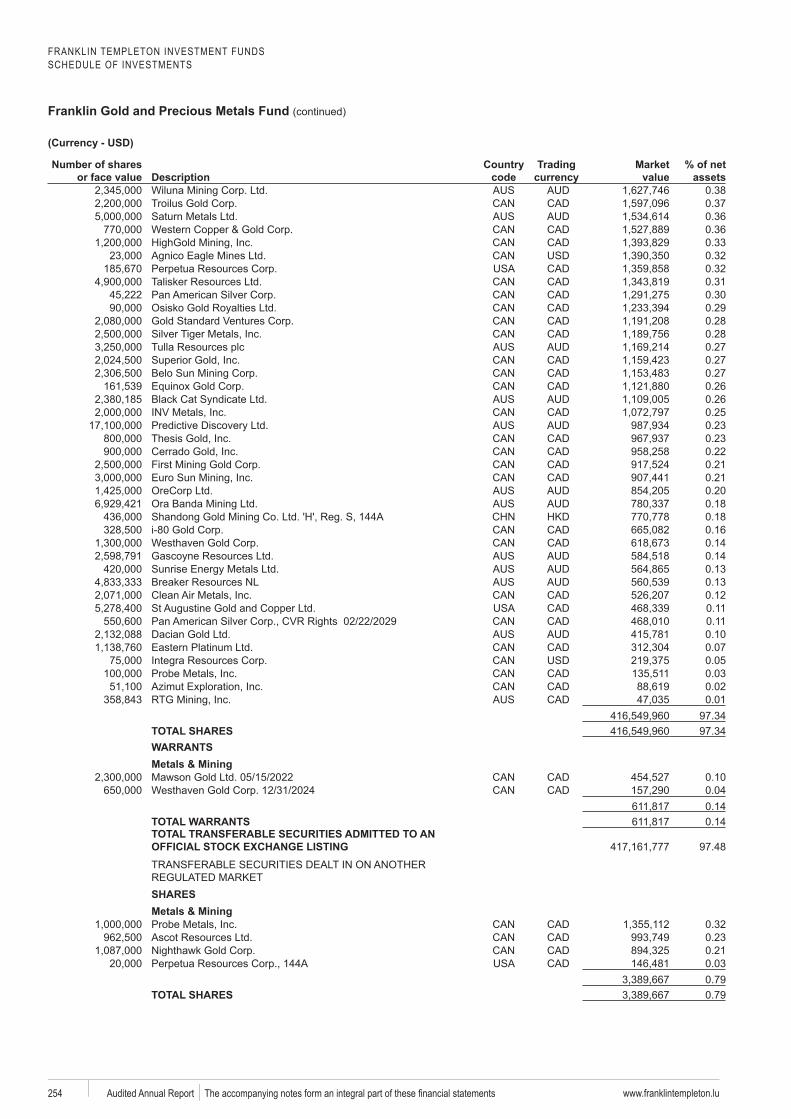
FRANKLIN TEMPLETON INVESTMENT FUNDSSCHEDULE OF INVESTMENTS
Franklin Gold and Precious Metals Fund (continued)
www.franklintempleton.lu254 Audited Annual Report
Number of shares or face value Description
code
Trading Market value
% of net assets
Wiluna 0.380.370.360.360.330.320.32
Talisker 0.310.300.290.280.28
Tulla 0.270.270.270.260.260.250.230.230.220.210.210.200.180.180.16
Westhaven 0.140.140.130.130.120.110.110.100.070.050.030.020.01
97.34TOTAL SHARES 97.34WARRANTSMetals & Mining
0.10Westhaven 0.04
0.14TOTAL WARRANTS 0.14TOTAL TRANSFERABLE SECURITIES ADMITTED TO AN
97.48
SHARESMetals & Mining
0.320.230.210.030.79
TOTAL SHARES 0.79
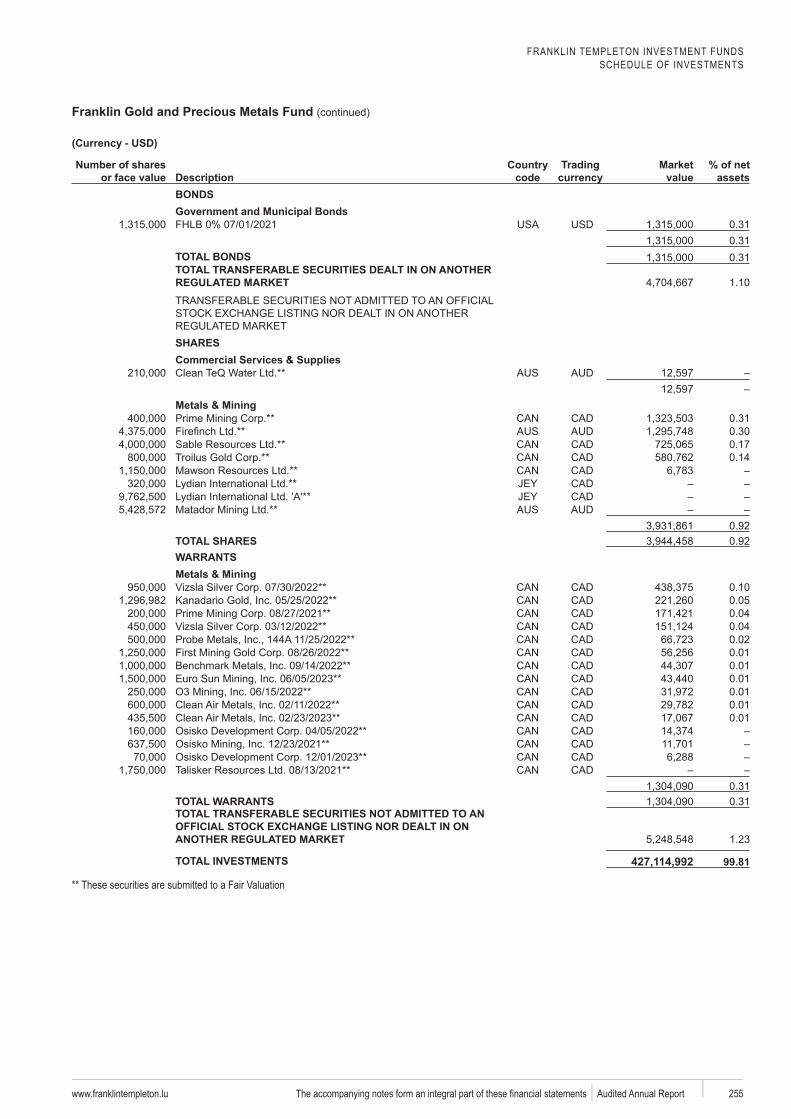
FRANKLIN TEMPLETON INVESTMENT FUNDSSCHEDULE OF INVESTMENTS
Franklin Gold and Precious Metals Fund (continued)
www.franklintempleton.lu 255 Audited Annual Report
Number of shares or face value Description
code
Trading Market value
% of net assets
BONDSGovernment and Municipal Bonds
0.310.31
TOTAL BONDS 0.31TOTAL TRANSFERABLE SECURITIES DEALT IN ON ANOTHER
1.10
SHARESCommercial Services & Supplies
Metals & Mining0.310.300.170.14
0.92TOTAL SHARES 0.92WARRANTSMetals & Mining
0.10Kanadario 0.05
0.040.040.020.010.010.010.010.010.01
Talisker0.31
TOTAL WARRANTS 0.31TOTAL TRANSFERABLE SECURITIES NOT ADMITTED TO AN
1.23
TOTAL INVESTMENTS 427,114,992a** These securities are submitted to a Fair Valuation
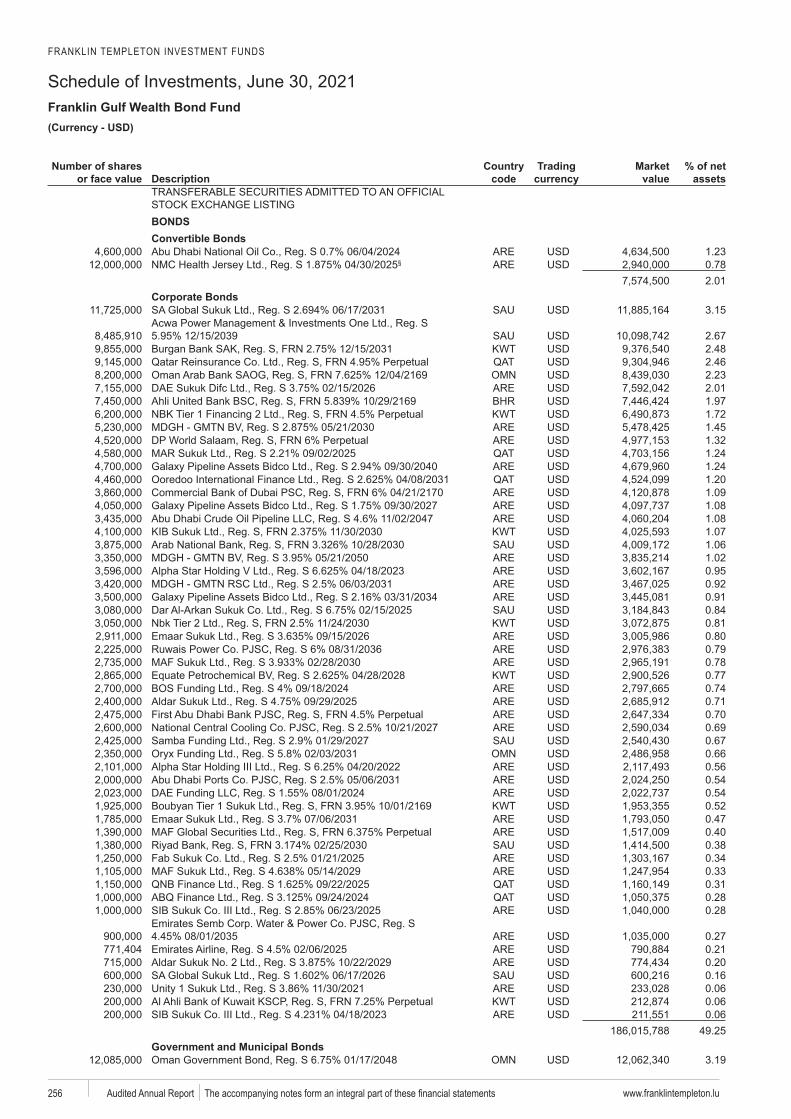
FRANKLIN TEMPLETON INVESTMENT FUNDS
Schedule of Investments, June 30, 2021Franklin Gulf Wealth Bond Fund
www.franklintempleton.lu256 Audited Annual Report
USD)
Number of shares or face value Description
code
Trading Market value
% of net assets
BONDSConvertible Bonds
1.23§ 0.78
2.01Corporate Bonds
3.15
2.67KWT 2.48
2.462.232.011.97
KWT 1.721.451.321.241.241.201.091.081.08
KWT 1.071.061.020.950.920.910.84
KWT 0.810.800.790.78
KWT 0.770.740.710.700.690.670.660.560.540.54
KWT 0.520.470.400.380.340.330.310.280.28
0.270.210.200.160.06
KWT 0.060.06
49.25Government and Municipal Bonds
3.19
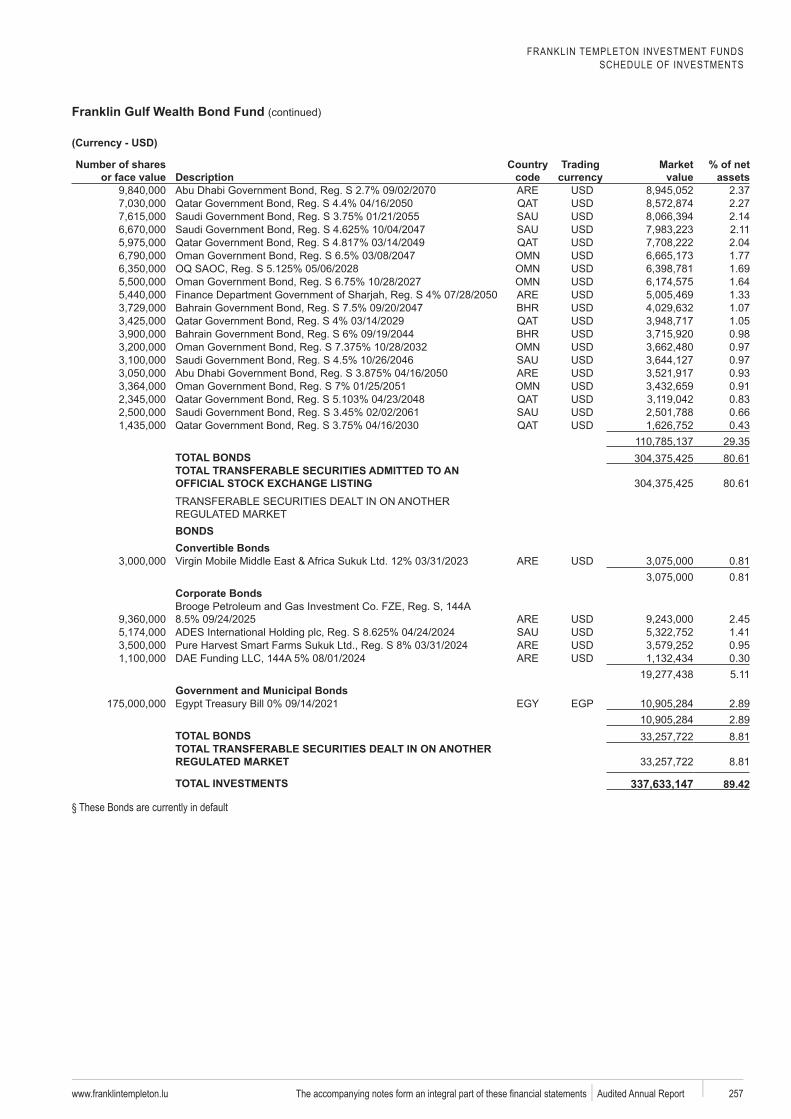
FRANKLIN TEMPLETON INVESTMENT FUNDSSCHEDULE OF INVESTMENTS
Franklin Gulf Wealth Bond Fund (continued)
www.franklintempleton.lu 257 Audited Annual Report
Number of shares or face value Description
code
Trading Market value
% of net assets
2.372.272.142.112.041.771.691.641.331.071.050.980.970.970.930.910.830.660.43
29.35TOTAL BONDS 80.61TOTAL TRANSFERABLE SECURITIES ADMITTED TO AN
80.61
BONDSConvertible Bonds
0.810.81
Corporate Bonds
2.451.410.950.305.11
Government and Municipal BondsEGP 2.89
2.89TOTAL BONDS 8.81TOTAL TRANSFERABLE SECURITIES DEALT IN ON ANOTHER
8.81
TOTAL INVESTMENTS 337,633,147a§ These Bonds are currently in default
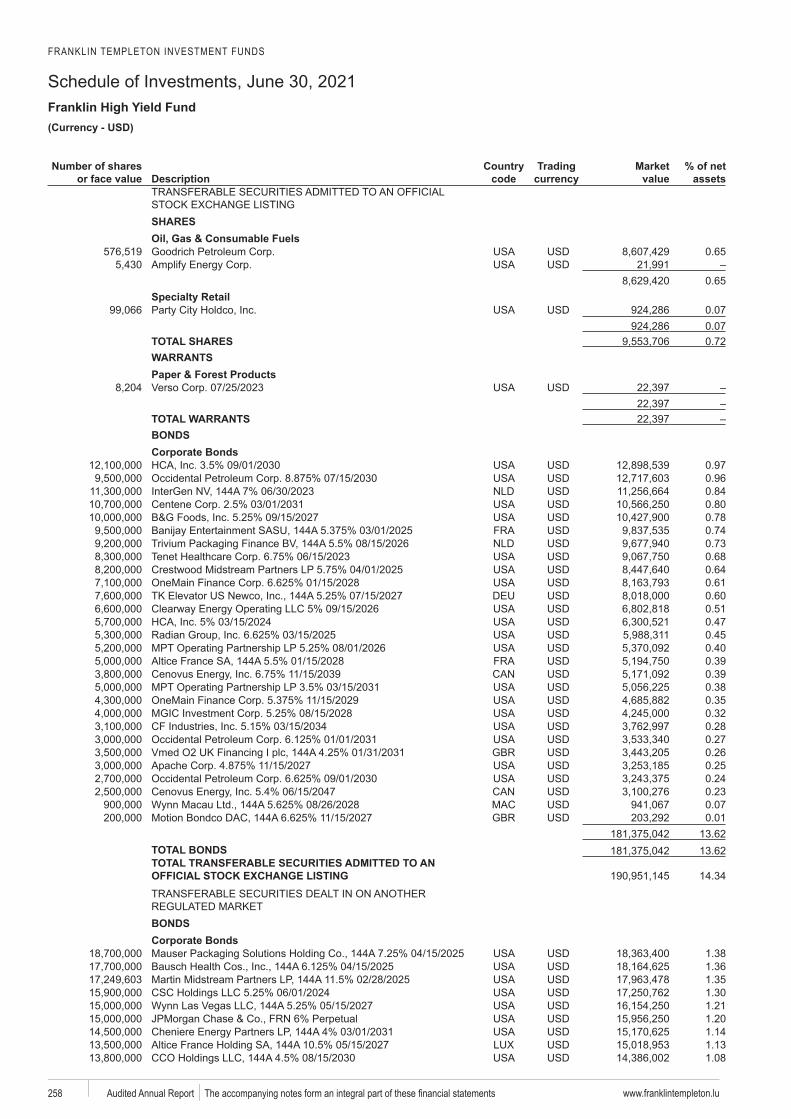
FRANKLIN TEMPLETON INVESTMENT FUNDS
Schedule of Investments, June 30, 2021Franklin High Yield Fund
www.franklintempleton.lu258 Audited Annual Report
USD)
Number of shares or face value Description
code
Trading Market value
% of net assets
SHARESOil, Gas & Consumable Fuels
0.65
0.65
0.070.07
TOTAL SHARES 0.72WARRANTSPaper & Forest Products
TOTAL WARRANTSBONDSCorporate Bonds
0.970.960.840.800.780.740.730.680.640.610.600.510.470.450.400.390.390.380.350.320.280.270.260.250.240.230.07
Bondco 0.0113.62
TOTAL BONDS 13.62TOTAL TRANSFERABLE SECURITIES ADMITTED TO AN
14.34
BONDSCorporate Bonds
1.381.361.351.301.211.201.141.131.08
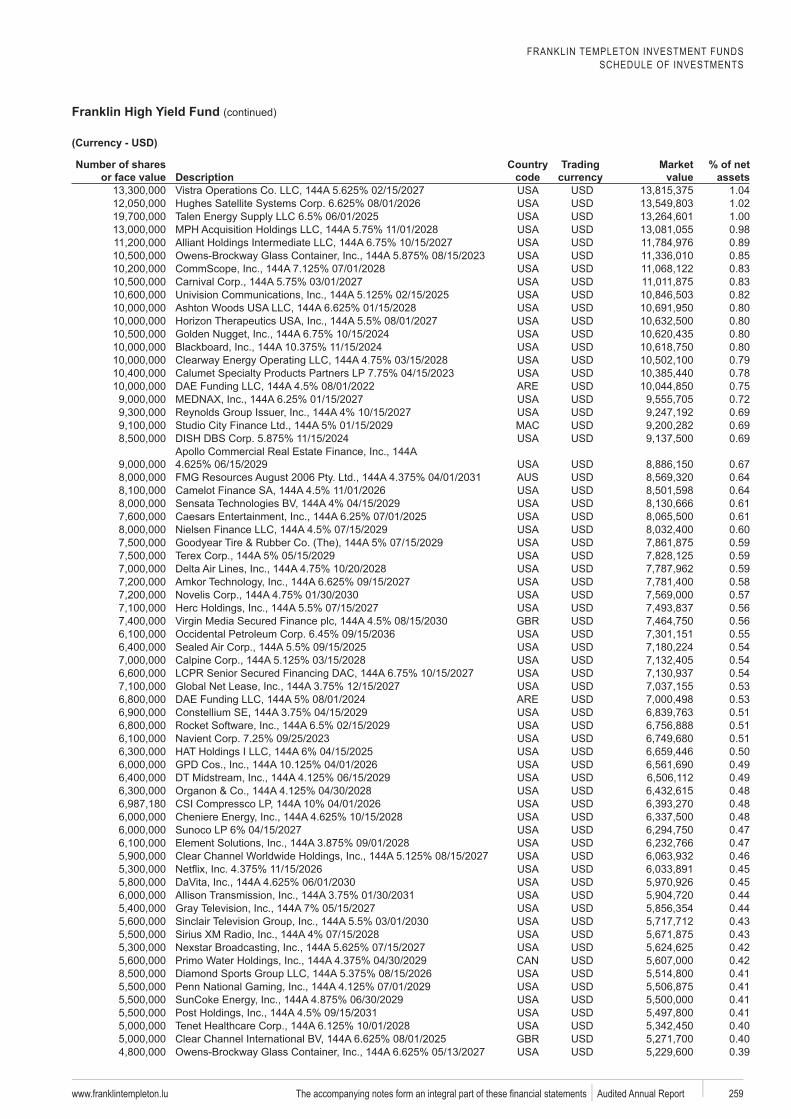
FRANKLIN TEMPLETON INVESTMENT FUNDSSCHEDULE OF INVESTMENTS
Franklin High Yield Fund (continued)
www.franklintempleton.lu 259 Audited Annual Report
Number of shares or face value Description
code
Trading Market value
% of net assets
1.041.021.000.980.890.850.830.830.820.800.800.800.800.790.780.750.720.690.690.69
0.670.640.64
Sensata 0.610.610.600.590.590.590.580.570.560.560.550.540.540.540.530.530.510.510.510.500.490.490.480.480.480.470.470.460.450.450.440.440.430.430.420.420.410.410.410.410.400.400.39
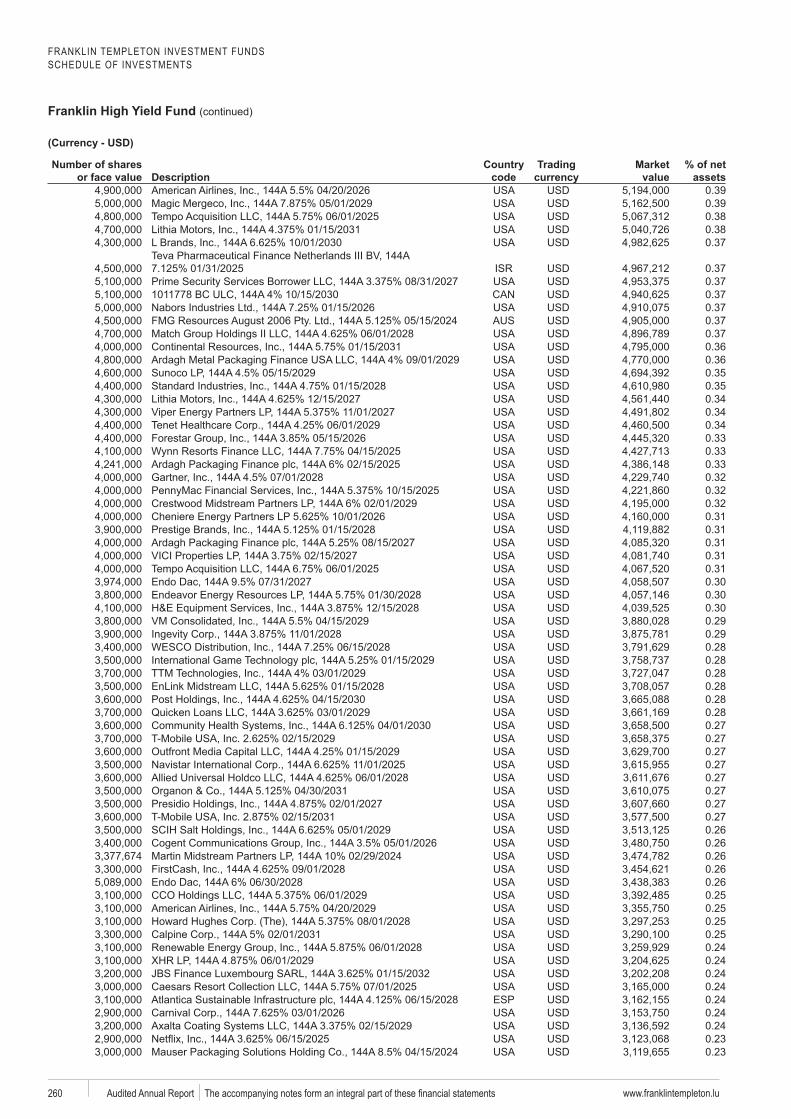
FRANKLIN TEMPLETON INVESTMENT FUNDSSCHEDULE OF INVESTMENTS
Franklin High Yield Fund (continued)
www.franklintempleton.lu260 Audited Annual Report
Number of shares or face value Description
code
Trading Market value
% of net assets
0.390.390.380.380.37
Teva0.370.370.370.370.370.370.360.360.350.350.340.340.34
Forestar 0.330.330.330.320.320.320.310.310.310.310.31
Endo Dac 0.300.300.300.290.290.280.280.280.280.280.280.270.270.270.270.270.270.270.270.260.260.260.26
Endo Dac 0.260.250.250.250.250.240.240.240.24
ESP 0.240.240.240.230.23
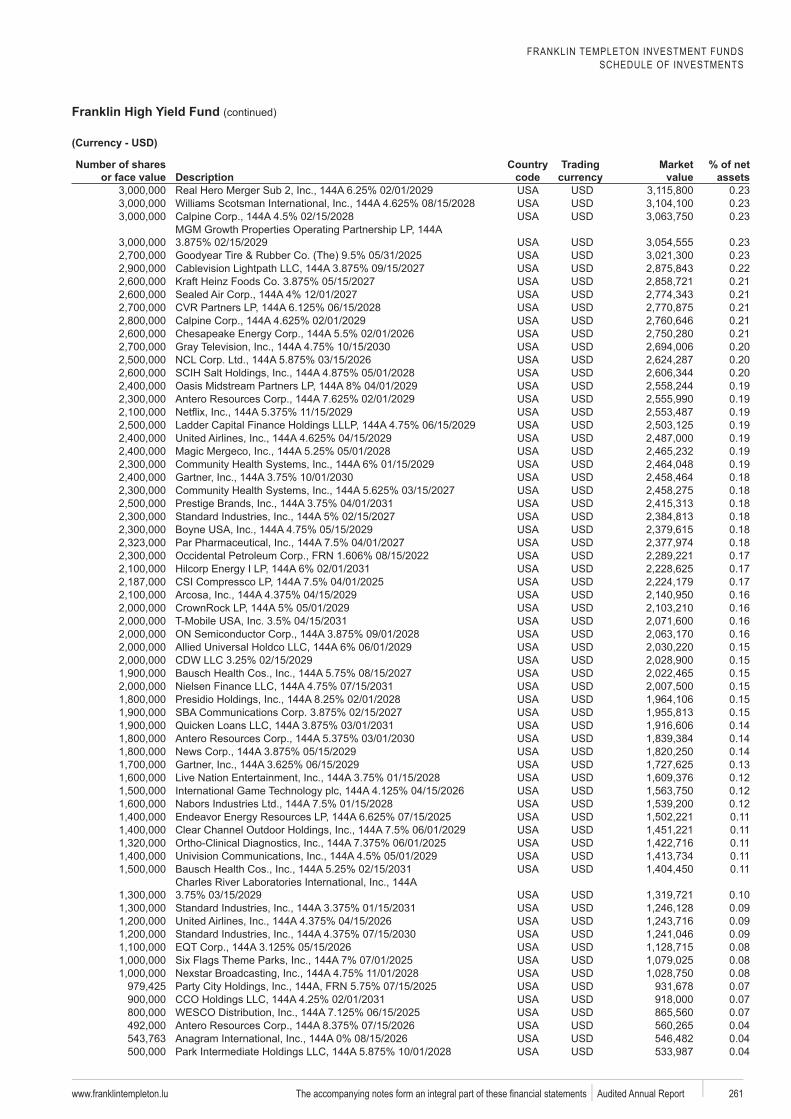
FRANKLIN TEMPLETON INVESTMENT FUNDSSCHEDULE OF INVESTMENTS
Franklin High Yield Fund (continued)
www.franklintempleton.lu 261 Audited Annual Report
Number of shares or face value Description
code
Trading Market value
% of net assets
0.230.230.23
0.230.230.220.210.210.210.210.210.200.200.200.190.190.190.190.190.190.190.180.180.180.180.180.180.170.170.170.160.160.160.160.150.150.150.150.150.150.140.140.140.130.120.120.120.110.110.110.110.11
0.100.090.090.090.080.080.080.070.070.070.040.040.04
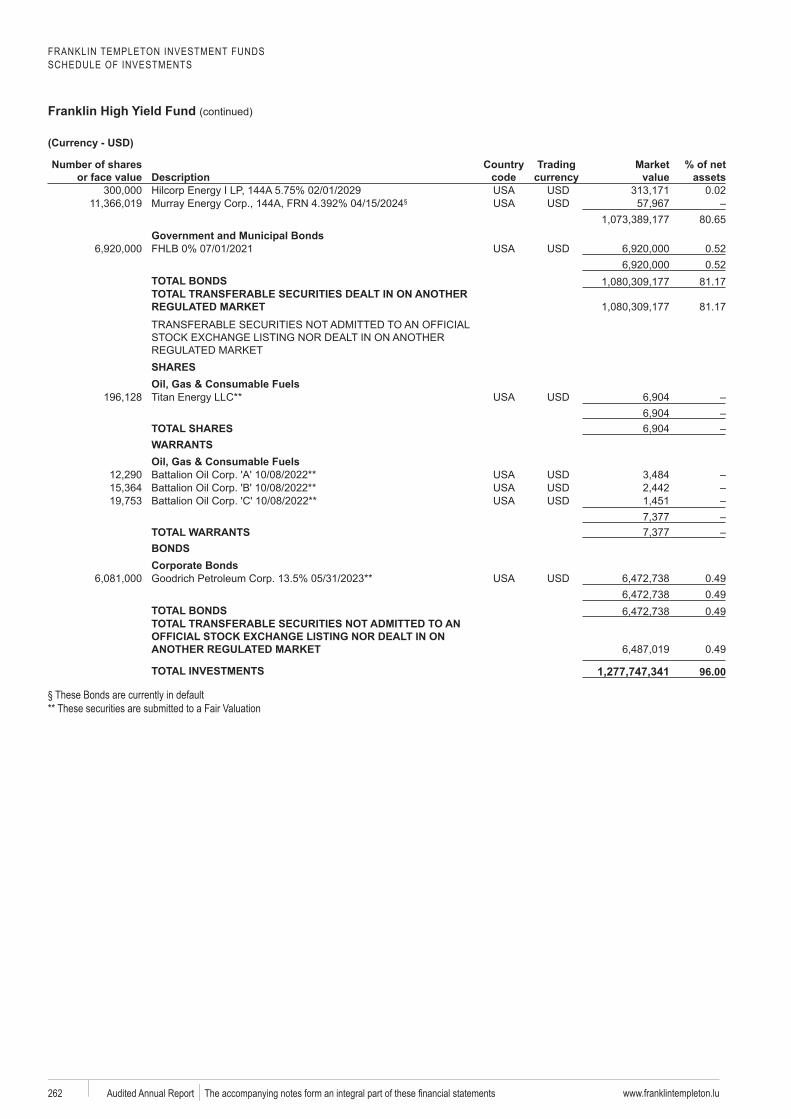
FRANKLIN TEMPLETON INVESTMENT FUNDSSCHEDULE OF INVESTMENTS
Franklin High Yield Fund (continued)
www.franklintempleton.lu262 Audited Annual Report
Number of shares or face value Description
code
Trading Market value
% of net assets
0.02§
80.65Government and Municipal Bonds
0.520.52
TOTAL BONDS 81.17TOTAL TRANSFERABLE SECURITIES DEALT IN ON ANOTHER
81.17
SHARESOil, Gas & Consumable Fuels
TOTAL SHARESWARRANTSOil, Gas & Consumable Fuels
TOTAL WARRANTSBONDSCorporate Bonds
0.490.49
TOTAL BONDS 0.49TOTAL TRANSFERABLE SECURITIES NOT ADMITTED TO AN
0.49
TOTAL INVESTMENTS 1,277,747,341a§ These Bonds are currently in default** These securities are submitted to a Fair Valuation
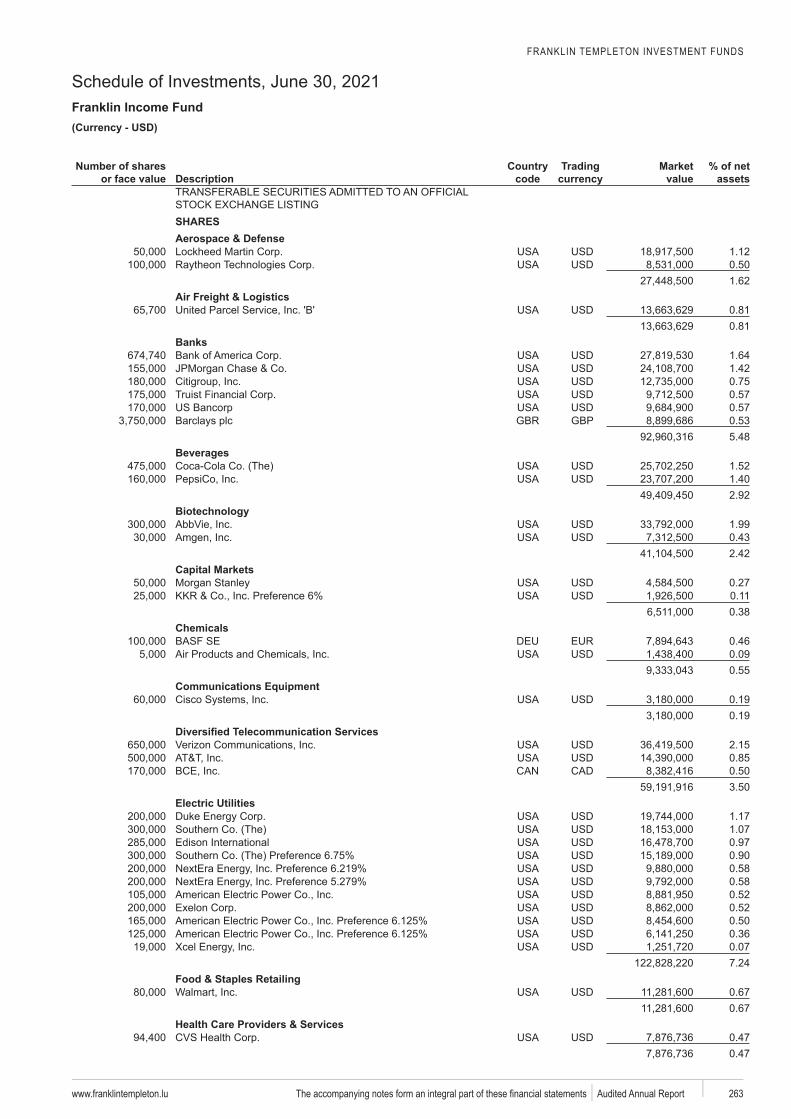
FRANKLIN TEMPLETON INVESTMENT FUNDS
Schedule of Investments, June 30, 2021Franklin Income Fund
www.franklintempleton.lu 263 Audited Annual Report
USD)
Number of shares or face value Description
code
Trading Market value
% of net assets
SHARESAerospace & Defense
1.120.501.62
Air Freight & Logistics0.810.81
Banks1.641.420.750.570.57
GBP 0.535.48
Beverages1.521.402.92
1.990.432.42
Capital Markets0.270.110.38
Chemicals0.460.090.55
Communications Equipment0.190.19
2.150.850.503.50
Electric Utilities1.171.070.970.900.580.580.520.520.500.360.077.24
Food & Staples Retailing0.670.67
Health Care Providers & Services0.470.47
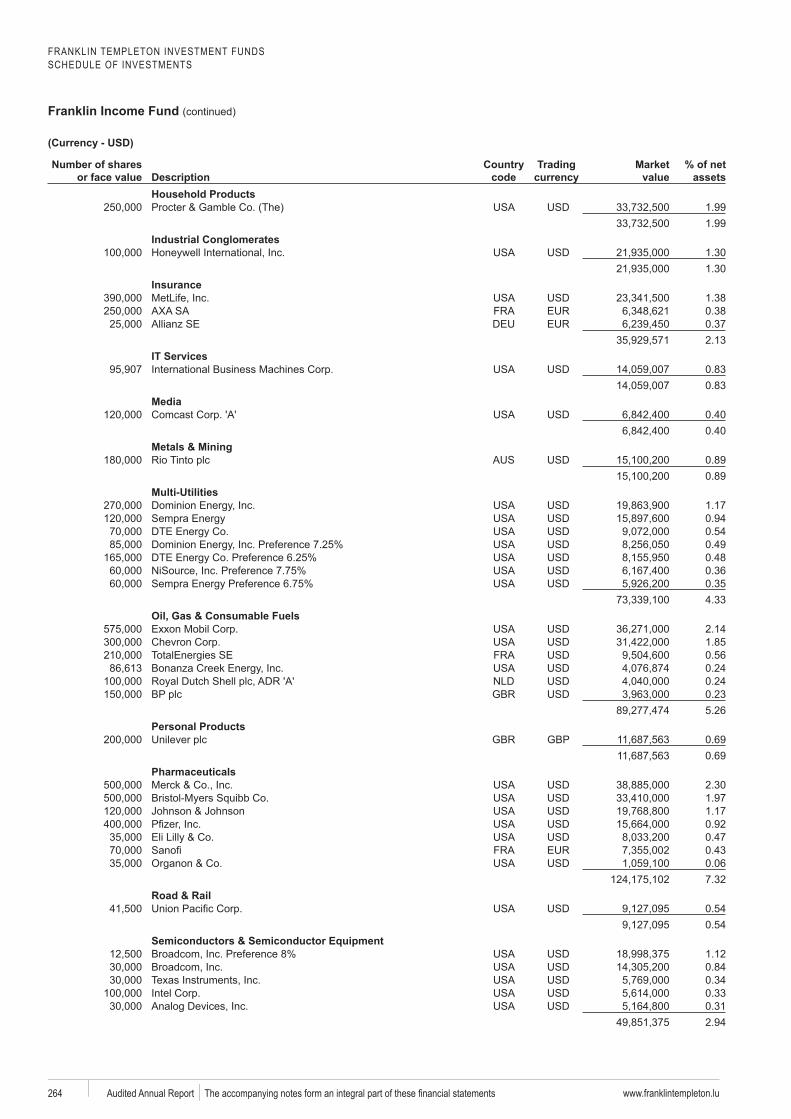
FRANKLIN TEMPLETON INVESTMENT FUNDSSCHEDULE OF INVESTMENTS
Franklin Income Fund (continued)
www.franklintempleton.lu264 Audited Annual Report
Number of shares or face value Description
code
Trading Market value
% of net assets
Household Products1.991.99
Industrial Conglomerates1.301.30
Insurance1.380.380.372.13
IT Services0.830.83
Media0.400.40
Metals & Mining0.890.89
Multi-Utilities1.170.940.540.490.480.360.354.33
Oil, Gas & Consumable Fuels2.141.85
TotalEnergies SE 0.560.240.240.235.26
Personal ProductsGBP 0.69
0.69Pharmaceuticals
2.301.971.170.920.470.430.067.32
Road & Rail0.540.54
Semiconductors & Semiconductor Equipment1.120.840.340.330.312.94
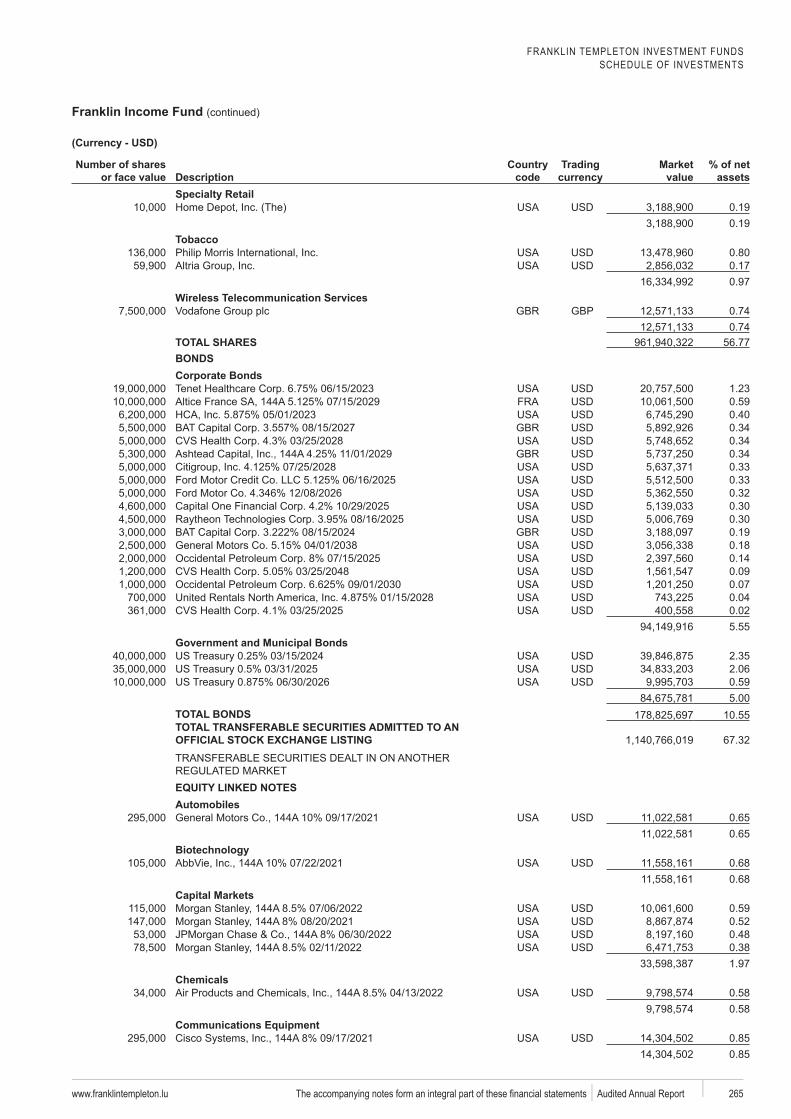
FRANKLIN TEMPLETON INVESTMENT FUNDSSCHEDULE OF INVESTMENTS
Franklin Income Fund (continued)
www.franklintempleton.lu 265 Audited Annual Report
Number of shares or face value Description
code
Trading Market value
% of net assets
0.190.19
Tobacco0.800.170.97
Wireless Telecommunication ServicesGBP 0.74
0.74TOTAL SHARES 56.77BONDSCorporate Bonds
1.230.590.400.340.340.340.330.330.320.300.300.190.180.140.090.070.040.025.55
Government and Municipal Bonds2.352.060.595.00
TOTAL BONDS 10.55TOTAL TRANSFERABLE SECURITIES ADMITTED TO AN
67.32
Automobiles0.650.65
0.680.68
Capital Markets0.590.520.480.381.97
Chemicals0.580.58
Communications Equipment0.850.85
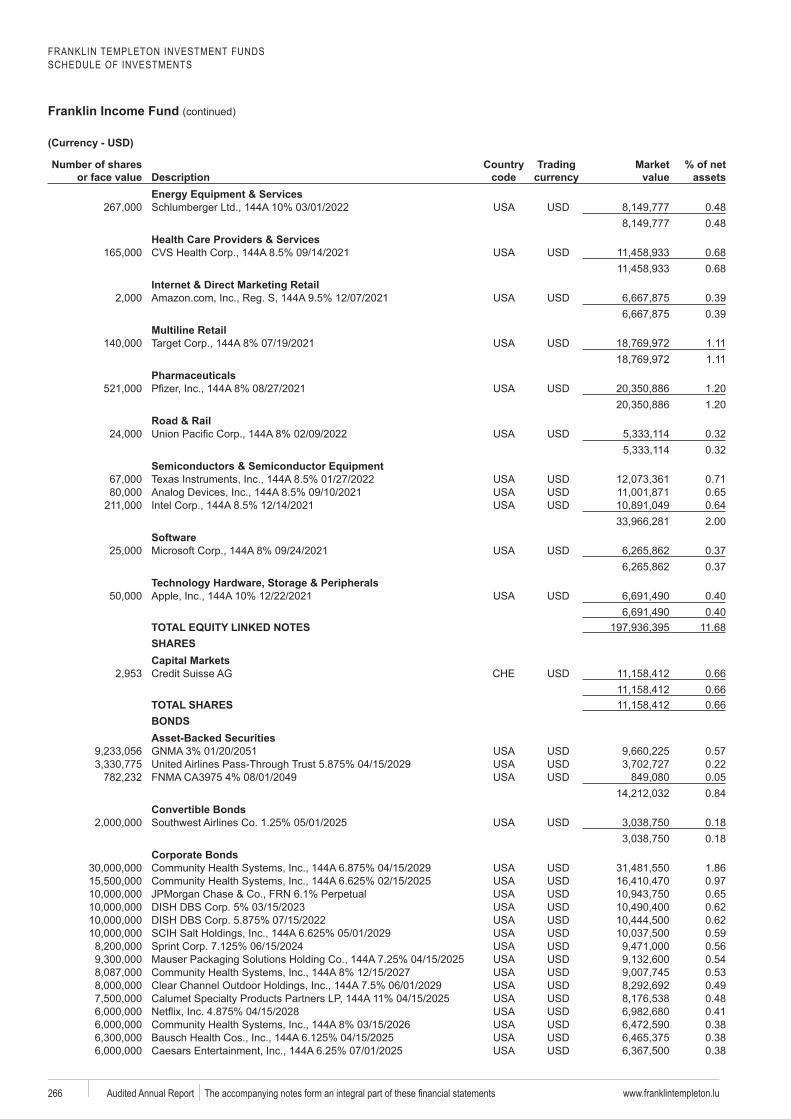
FRANKLIN TEMPLETON INVESTMENT FUNDSSCHEDULE OF INVESTMENTS
Franklin Income Fund (continued)
www.franklintempleton.lu266 Audited Annual Report
Number of shares or face value Description
code
Trading Market value
% of net assets
0.480.48
Health Care Providers & Services0.680.68
Internet & Direct Marketing Retail0.390.39
Multiline Retail1.111.11
Pharmaceuticals1.201.20
Road & Rail0.320.32
Semiconductors & Semiconductor Equipment0.710.650.642.00
0.370.37
0.400.40
11.68SHARESCapital Markets
0.660.66
TOTAL SHARES 0.66BONDSAsset-Backed Securities
0.570.220.050.84
Convertible Bonds0.180.18
Corporate Bonds1.860.970.650.620.620.590.560.540.530.490.480.410.380.380.38
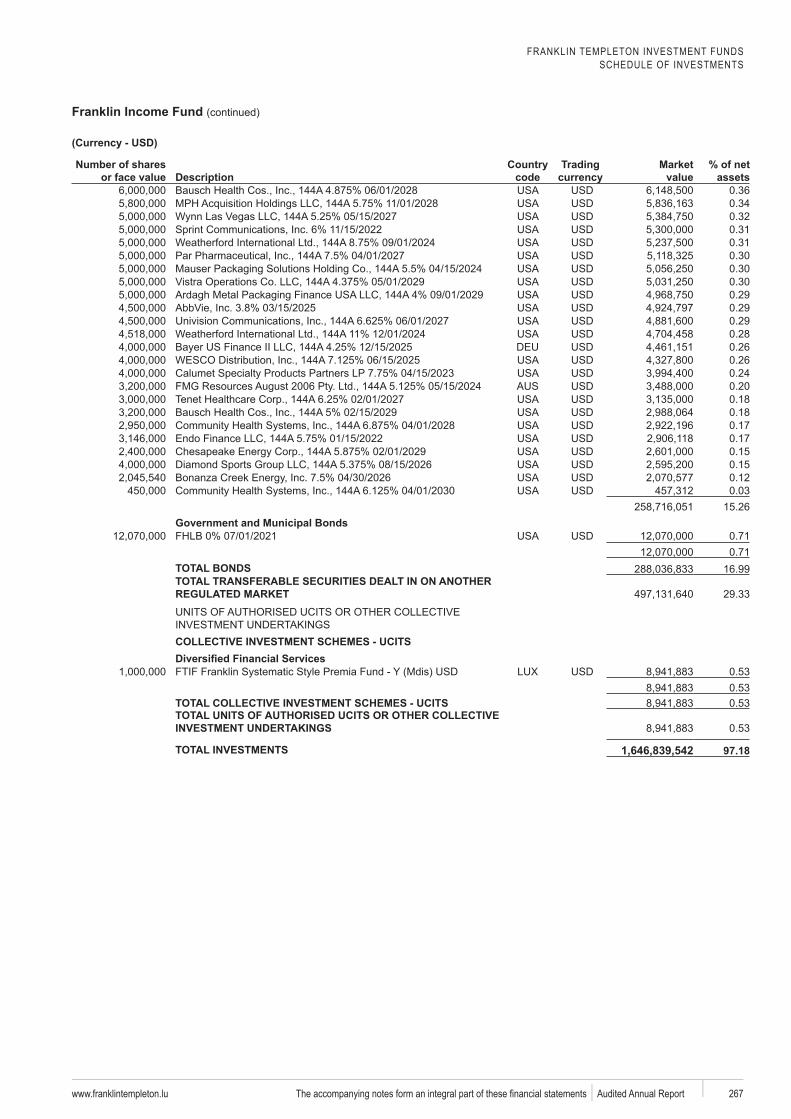
FRANKLIN TEMPLETON INVESTMENT FUNDSSCHEDULE OF INVESTMENTS
Franklin Income Fund (continued)
www.franklintempleton.lu 267 Audited Annual Report
Number of shares or face value Description
code
Trading Market value
% of net assets
0.360.340.320.310.310.300.300.300.290.290.290.280.260.260.240.200.180.180.170.170.150.150.120.03
15.26Government and Municipal Bonds
0.710.71
TOTAL BONDS 16.99TOTAL TRANSFERABLE SECURITIES DEALT IN ON ANOTHER
29.33
COLLECTIVE INVESTMENT SCHEMES - UCITS
0.530.53
TOTAL COLLECTIVE INVESTMENT SCHEMES - UCITS 0.53TOTAL UNITS OF AUTHORISED UCITS OR OTHER COLLECTIVE
0.53
TOTAL INVESTMENTS 1,646,839,542
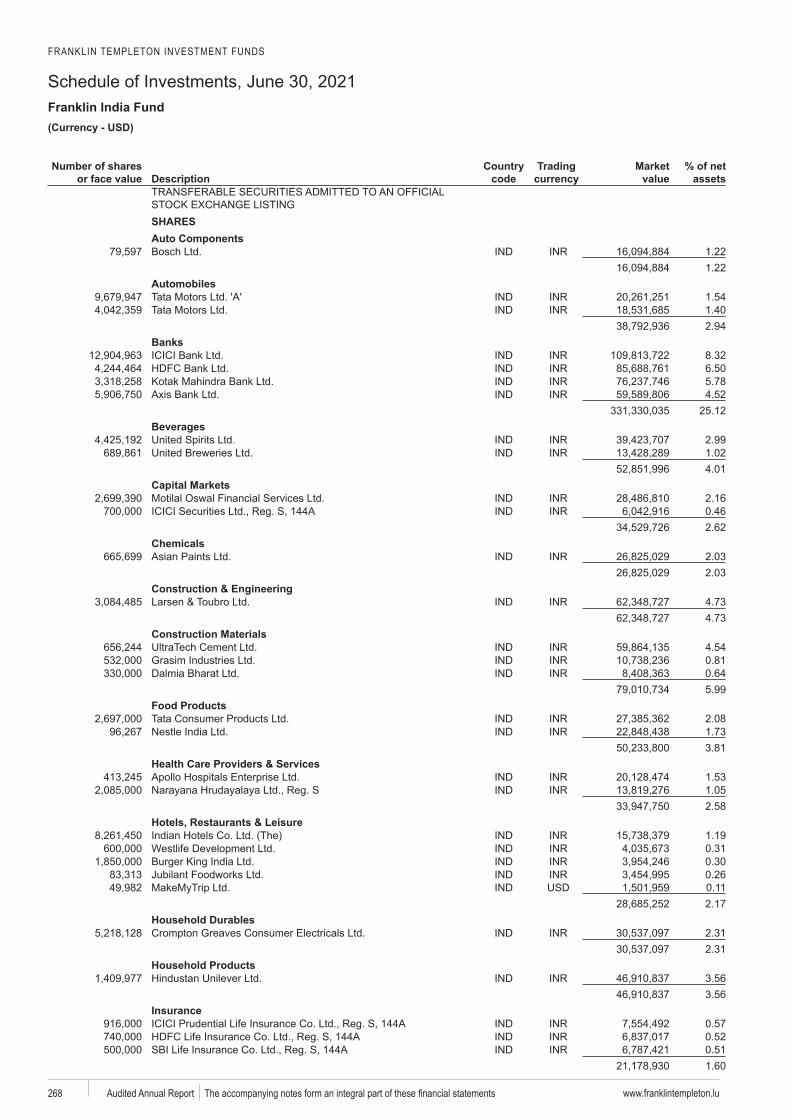
FRANKLIN TEMPLETON INVESTMENT FUNDS
Schedule of Investments, June 30, 2021Franklin India Fund
www.franklintempleton.lu268 Audited Annual Report
USD)
Number of shares or face value Description
code
Trading Market value
% of net assets
SHARESAuto Components
1.221.22
Automobiles1.541.402.94
Banks8.326.505.784.52
25.12Beverages
2.991.024.01
Capital Markets 2.16
0.462.62
Chemicals2.032.03
Construction & Engineering4.734.73
Construction Materials4.540.810.645.99
Food Products2.081.733.81
Health Care Providers & Services1.531.052.58
Hotels, Restaurants & Leisure1.19
Westlife 0.310.300.260.112.17
Household Durables2.312.31
Household Products3.563.56
Insurance0.570.520.511.60
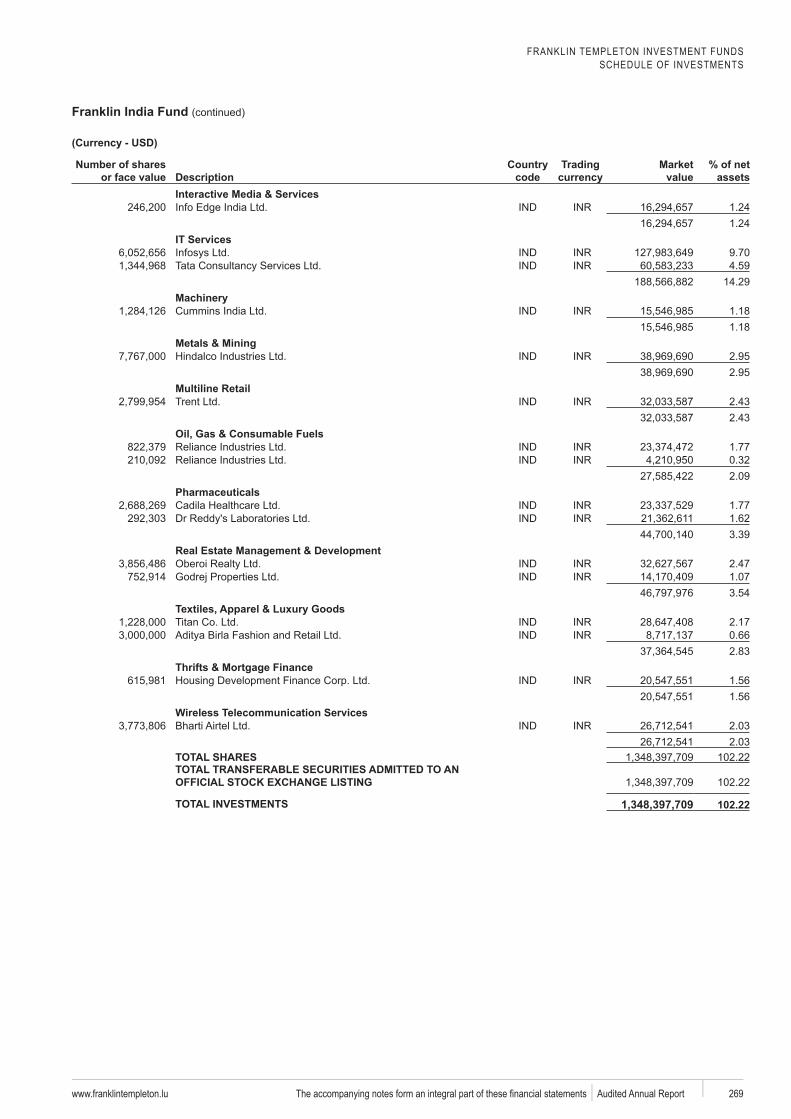
FRANKLIN TEMPLETON INVESTMENT FUNDSSCHEDULE OF INVESTMENTS
Franklin India Fund (continued)
www.franklintempleton.lu 269 Audited Annual Report
Number of shares or face value Description
code
Trading Market value
% of net assets
Interactive Media & Services1.241.24
IT Services9.704.59
14.29
1.181.18
Metals & Mining2.952.95
Multiline Retail2.432.43
Oil, Gas & Consumable Fuels1.770.322.09
Pharmaceuticals1.77
Dr 1.623.39
Real Estate Management & Development2.471.073.54
2.170.662.83
Thrifts & Mortgage Finance1.561.56
Wireless Telecommunication Services2.032.03
TOTAL SHARES 102.22TOTAL TRANSFERABLE SECURITIES ADMITTED TO AN
102.22
TOTAL INVESTMENTS 1,348,397,709
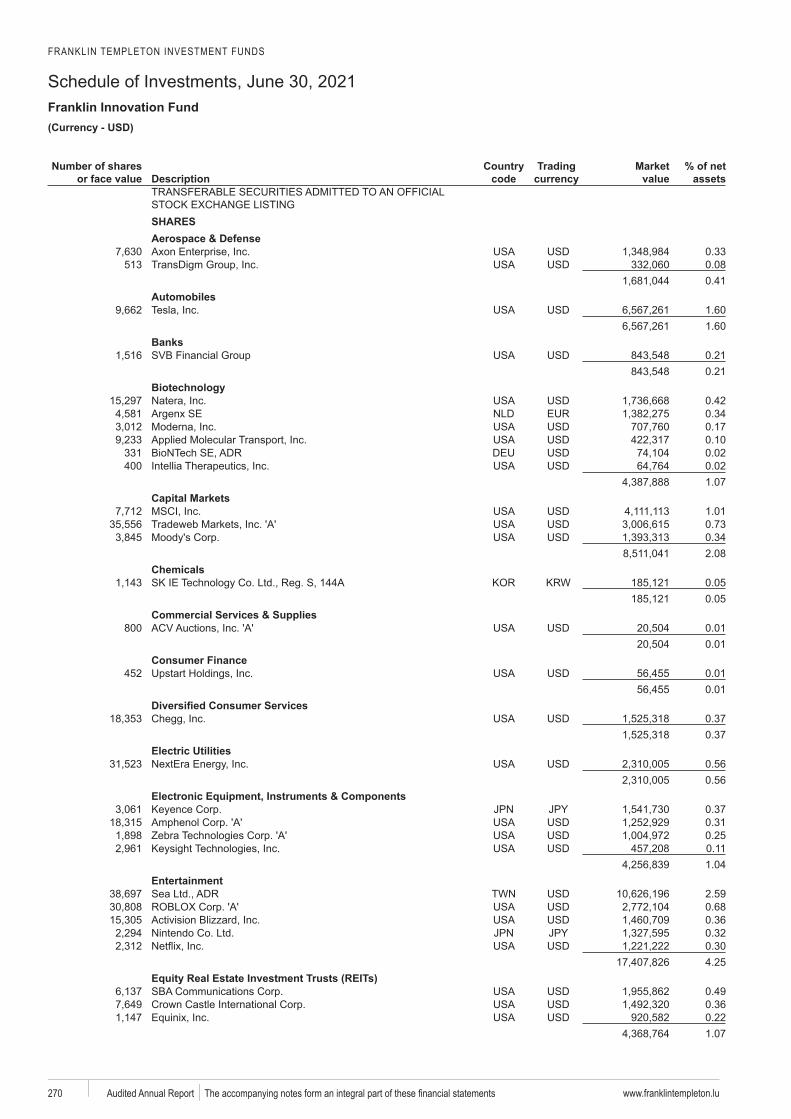
FRANKLIN TEMPLETON INVESTMENT FUNDS
Schedule of Investments, June 30, 2021Franklin Innovation Fund
www.franklintempleton.lu270 Audited Annual Report
USD)
Number of shares or face value Description
code
Trading Market value
% of net assets
SHARESAerospace & Defense
0.33513 0.08
0.41Automobiles
1.601.60
Banks0.210.21
0.42 SE 0.34
0.170.10
331 0.02400 0.02
1.07Capital Markets
1.010.730.342.08
Chemicals0.050.05
Commercial Services & Supplies800 0.01
0.01Consumer Finance
452 0.010.01
0.370.37
Electric Utilities0.560.56
Electronic Equipment, Instruments & Components0.370.310.25
Keysight 0.111.04
Entertainment2.590.680.360.320.304.25
0.490.360.221.07
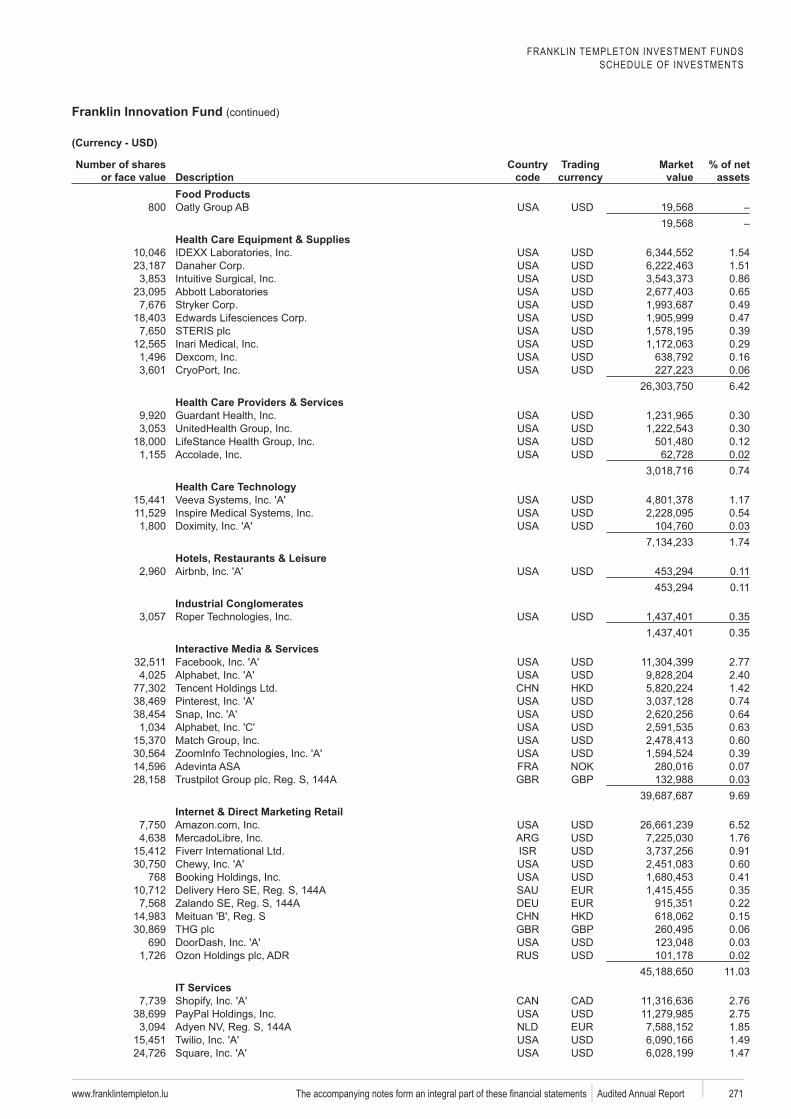
FRANKLIN TEMPLETON INVESTMENT FUNDSSCHEDULE OF INVESTMENTS
Franklin Innovation Fund (continued)
www.franklintempleton.lu 271 Audited Annual Report
Number of shares or face value Description
code
Trading Market value
% of net assets
Food Products800
Health Care Equipment & Supplies1.541.510.860.650.490.470.390.290.160.066.42
Health Care Providers & Services0.300.300.120.020.74
1.170.540.031.74
Hotels, Restaurants & Leisure0.110.11
Industrial Conglomerates0.350.35
Interactive Media & Services2.772.40
Tencent 1.420.740.640.630.600.390.07
GBP 0.039.69
Internet & Direct Marketing Retail6.521.760.910.60
768 0.410.35
Zalando 0.220.15
GBP 0.06690 DoorDash 0.03
0.0211.03
IT Services2.762.751.851.491.47
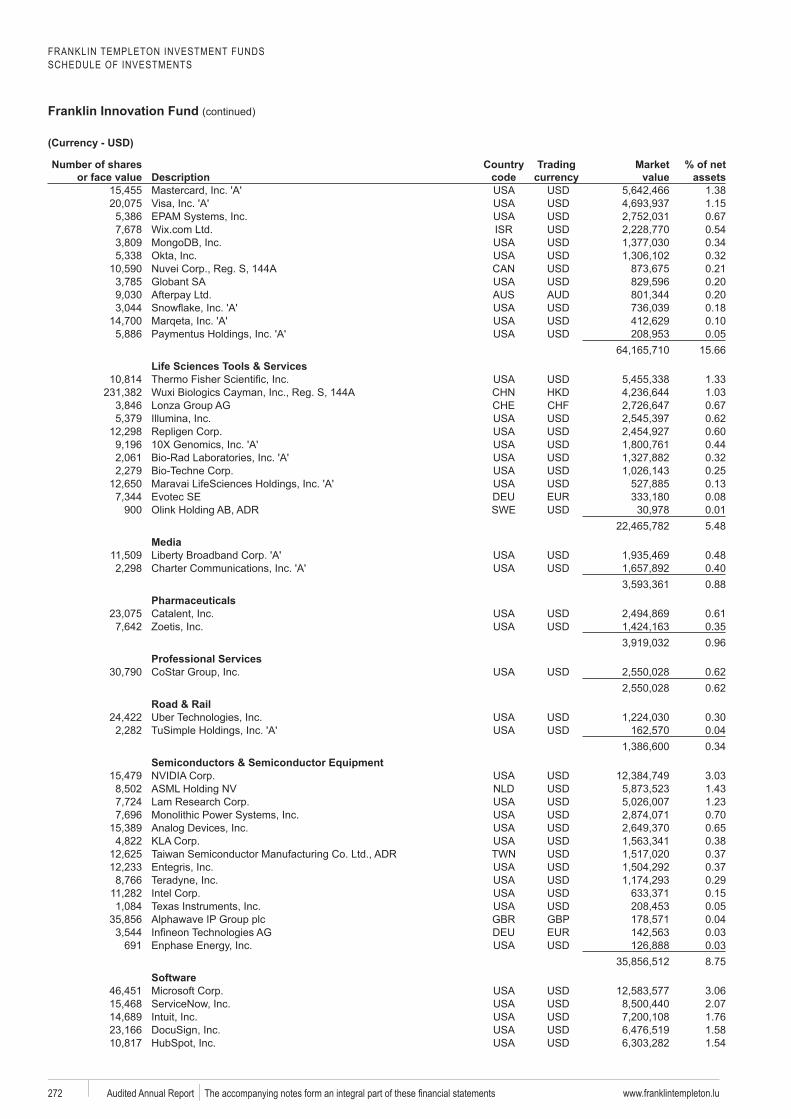
FRANKLIN TEMPLETON INVESTMENT FUNDSSCHEDULE OF INVESTMENTS
Franklin Innovation Fund (continued)
www.franklintempleton.lu272 Audited Annual Report
Number of shares or face value Description
code
Trading Market value
% of net assets
1.381.150.670.540.340.320.210.200.200.180.100.05
15.66Life Sciences Tools & Services
1.331.030.670.620.600.440.32
Bio-Techne 0.25 0.13
Evotec SE 0.08900 SWE 0.01
5.48Media
0.480.400.88
Pharmaceuticals0.610.350.96
Professional Services0.620.62
Road & Rail0.300.040.34
Semiconductors & Semiconductor Equipment3.031.431.230.700.650.380.37
Entegris 0.370.290.150.05
GBP 0.040.03
691 0.038.75
3.062.071.761.581.54
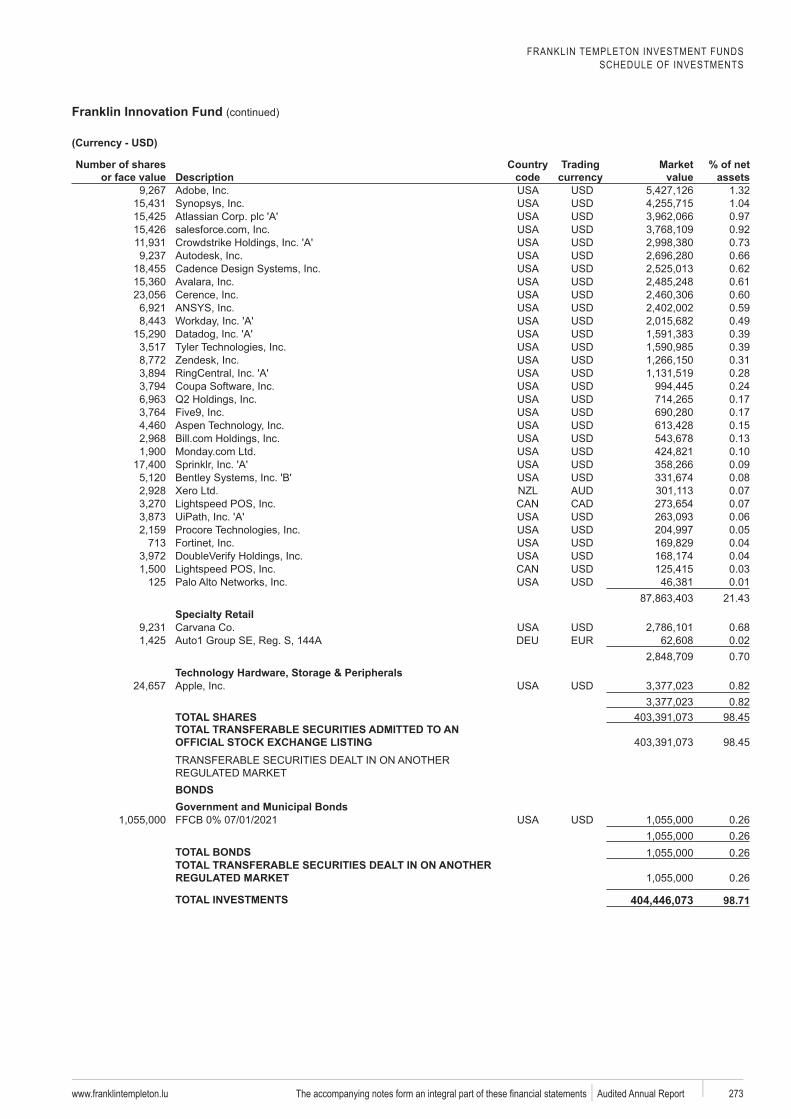
FRANKLIN TEMPLETON INVESTMENT FUNDSSCHEDULE OF INVESTMENTS
Franklin Innovation Fund (continued)
www.franklintempleton.lu 273 Audited Annual Report
Number of shares or face value Description
code
Trading Market value
% of net assets
1.321.040.970.920.730.660.620.610.600.590.49
Datadog 0.390.39
Zendesk 0.310.280.240.170.170.150.130.100.090.080.070.070.06
Procore 0.05713 0.04
0.040.03
125 0.0121.43
0.680.020.70
0.820.82
TOTAL SHARES 98.45TOTAL TRANSFERABLE SECURITIES ADMITTED TO AN
98.45
BONDSGovernment and Municipal Bonds
0.260.26
TOTAL BONDS 0.26TOTAL TRANSFERABLE SECURITIES DEALT IN ON ANOTHER
0.26
TOTAL INVESTMENTS 404,446,073
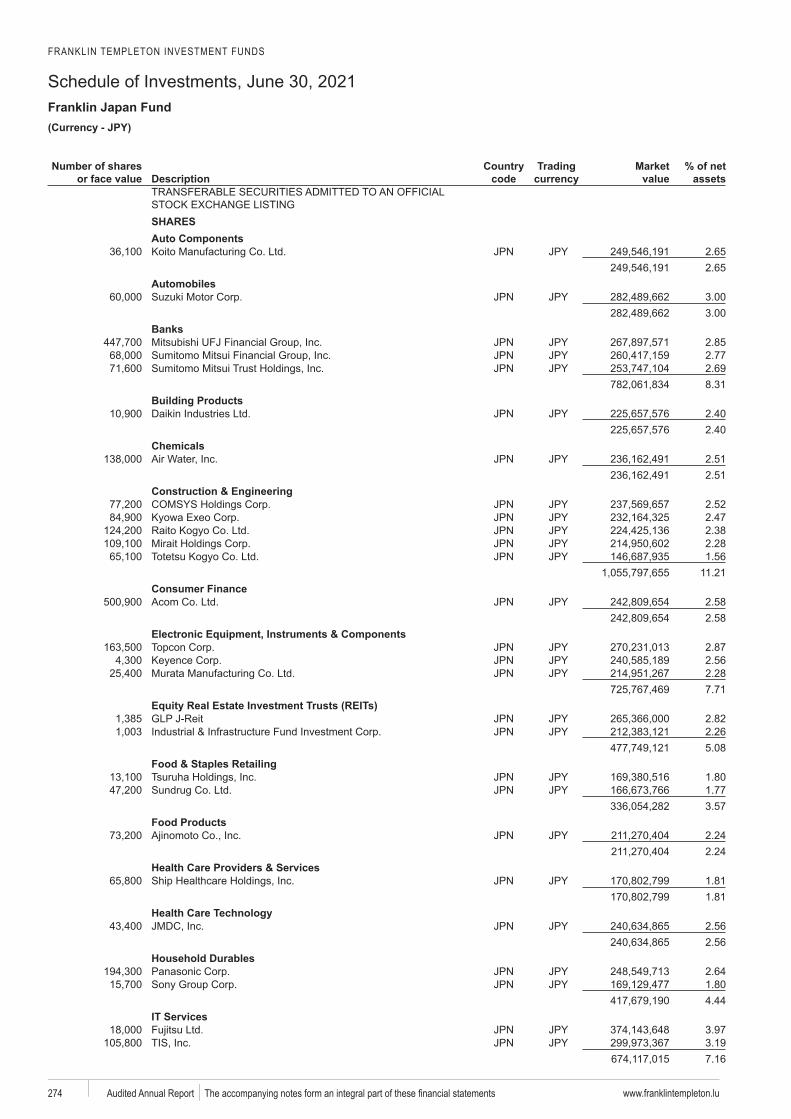
FRANKLIN TEMPLETON INVESTMENT FUNDS
Schedule of Investments, June 30, 2021Franklin Japan Fund
www.franklintempleton.lu274 Audited Annual Report
)
Number of shares or face value Description
code
Trading Market value
% of net assets
SHARESAuto Components
2.652.65
Automobiles3.003.00
Banks2.852.772.698.31
Building Products2.402.40
Chemicals2.512.51
Construction & Engineering2.522.472.382.281.56
11.21Consumer Finance
2.582.58
Electronic Equipment, Instruments & Components2.872.562.287.71
2.822.265.08
Food & Staples RetailingTsuruha 1.80Sundrug 1.77
3.57Food Products
2.242.24
Health Care Providers & Services1.811.81
2.562.56
Household Durables2.641.804.44
IT Services3.973.197.16
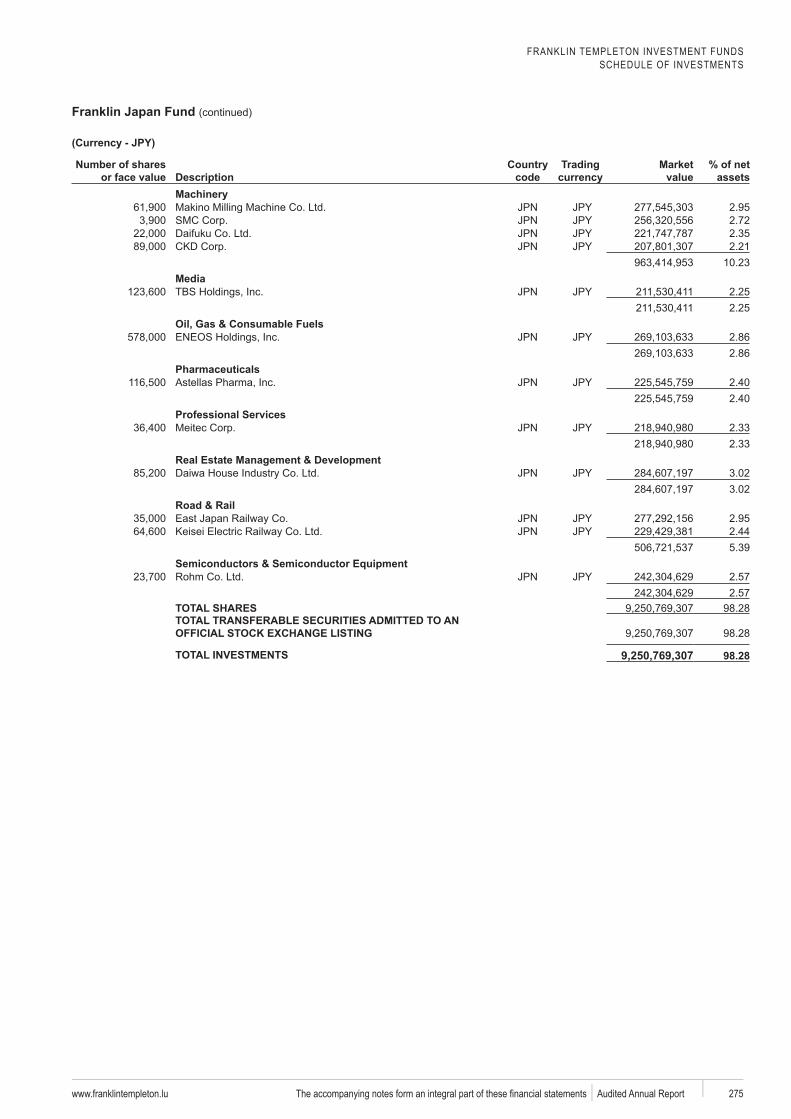
FRANKLIN TEMPLETON INVESTMENT FUNDSSCHEDULE OF INVESTMENTS
Franklin Japan Fund (continued)
www.franklintempleton.lu 275 Audited Annual Report
Number of shares or face value Description
code
Trading Market value
% of net assets
2.952.722.352.21
10.23Media
2.252.25
Oil, Gas & Consumable Fuels2.862.86
Pharmaceuticals2.402.40
Professional Services2.332.33
Real Estate Management & Development3.023.02
Road & Rail2.952.445.39
Semiconductors & Semiconductor Equipment2.572.57
TOTAL SHARES 98.28TOTAL TRANSFERABLE SECURITIES ADMITTED TO AN
98.28
TOTAL INVESTMENTS 9,250,769,307
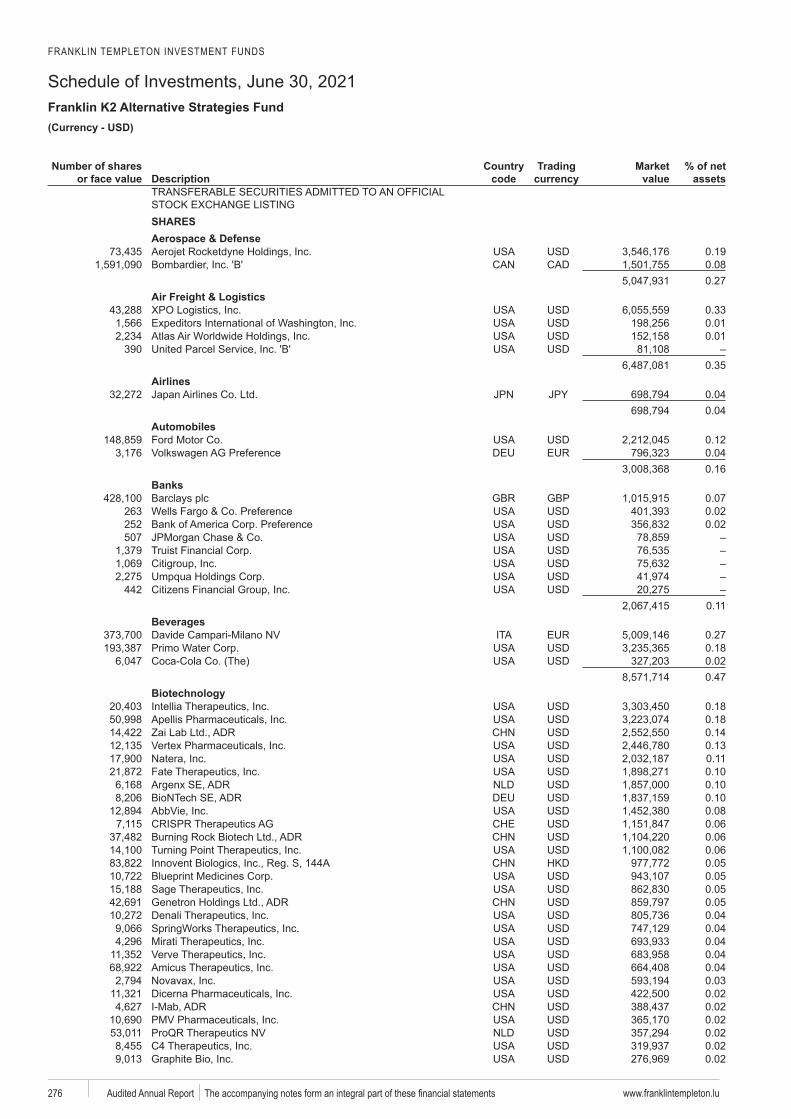
FRANKLIN TEMPLETON INVESTMENT FUNDS
Schedule of Investments, June 30, 2021Franklin K2 Alternative Strategies Fund
www.franklintempleton.lu276 Audited Annual Report
USD)
Number of shares or face value Description
code
Trading Market value
% of net assets
SHARESAerospace & Defense
0.190.080.27
Air Freight & Logistics0.330.010.01
3900.35
Airlines0.040.04
Automobiles0.120.040.16
BanksGBP 0.07
263 0.02252 0.02507
Truist
4420.11
BeveragesDavide 0.27
0.180.020.47
0.180.18
Zai 0.140.130.110.100.100.100.080.060.060.060.050.050.05
Genetron 0.050.040.040.040.040.040.03
Dicerna 0.020.020.020.020.020.02
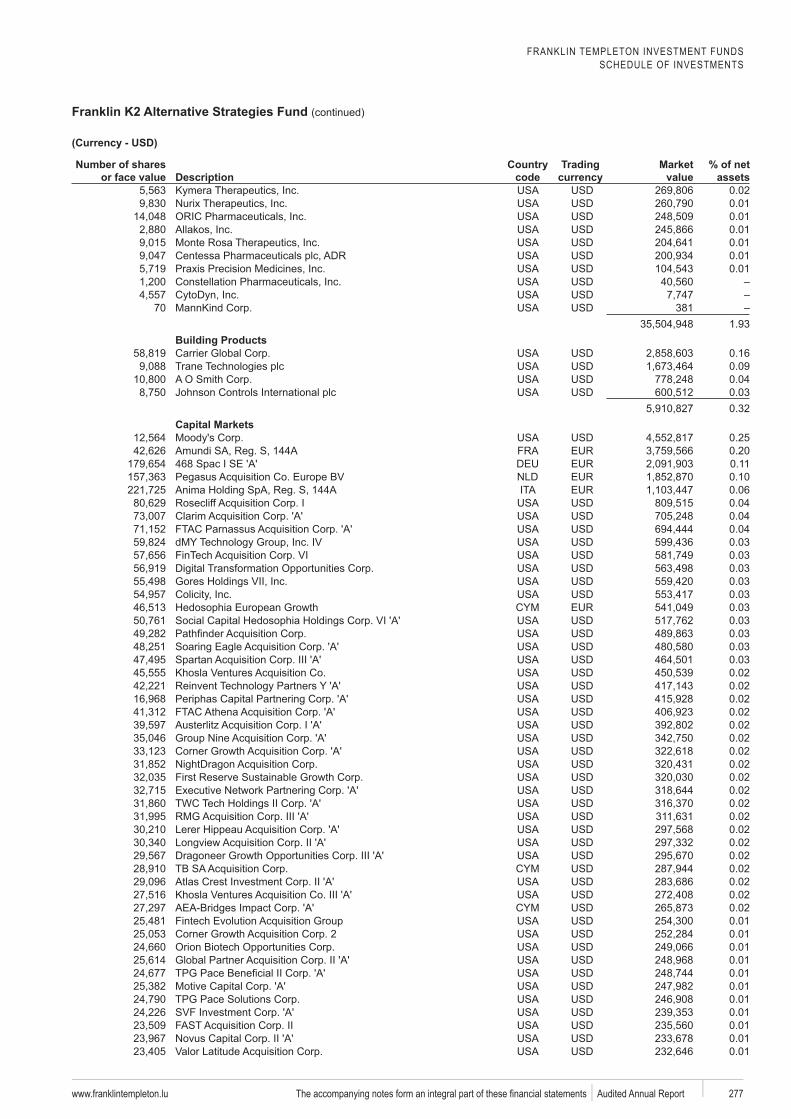
FRANKLIN TEMPLETON INVESTMENT FUNDSSCHEDULE OF INVESTMENTS
Franklin K2 Alternative Strategies Fund (continued)
www.franklintempleton.lu 277 Audited Annual Report
Number of shares or face value Description
code
Trading Market value
% of net assets
0.020.010.010.010.010.010.01
70 3811.93
Building Products0.160.090.040.030.32
Capital Markets0.250.20
468 0.110.100.060.040.040.040.03
FinTech 0.030.030.030.030.030.030.030.030.030.020.020.020.020.020.020.020.020.020.020.020.02
0.020.02
Dragoneer 0.020.020.020.020.020.010.010.010.010.010.010.010.010.010.010.01
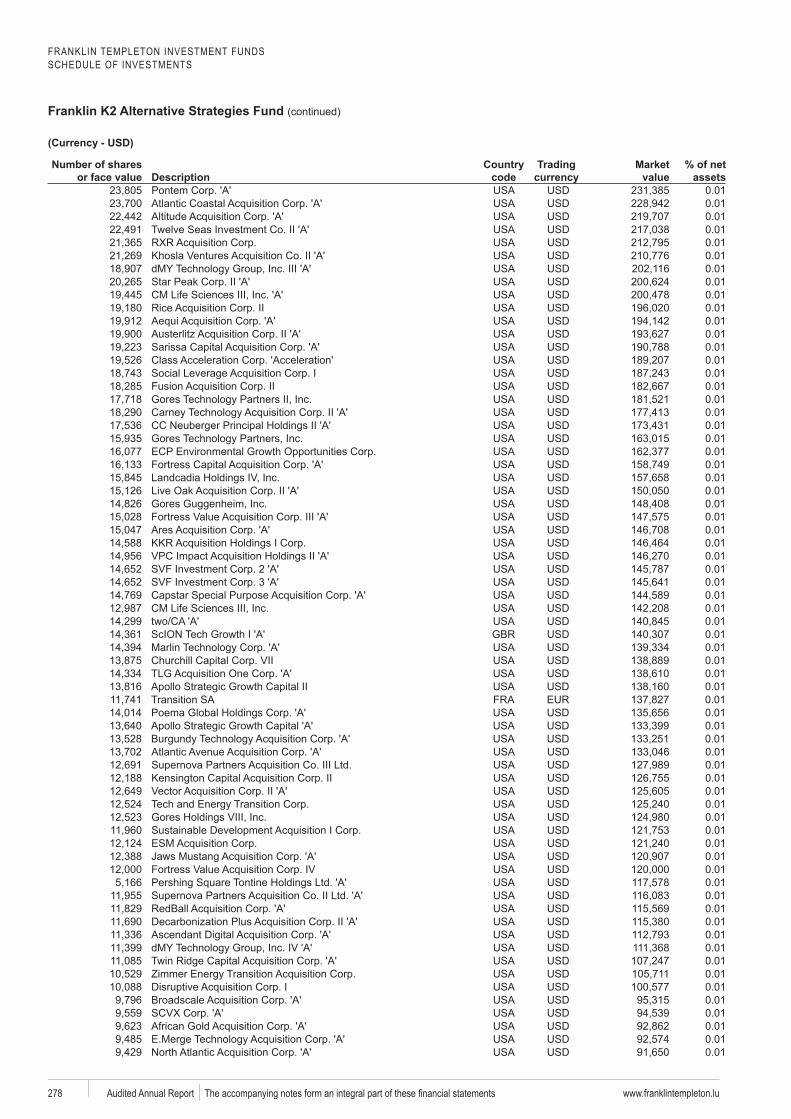
FRANKLIN TEMPLETON INVESTMENT FUNDSSCHEDULE OF INVESTMENTS
Franklin K2 Alternative Strategies Fund (continued)
www.franklintempleton.lu278 Audited Annual Report
Number of shares or face value Description
code
Trading Market value
% of net assets
0.010.010.010.010.010.010.010.010.010.010.010.01
Sarissa 0.010.010.010.010.010.010.010.010.010.010.010.010.010.010.010.010.010.010.010.010.010.010.010.010.010.010.010.010.010.010.010.010.010.010.010.010.010.010.010.010.010.010.010.010.010.010.010.010.010.01
Broadscale 0.010.010.010.010.01
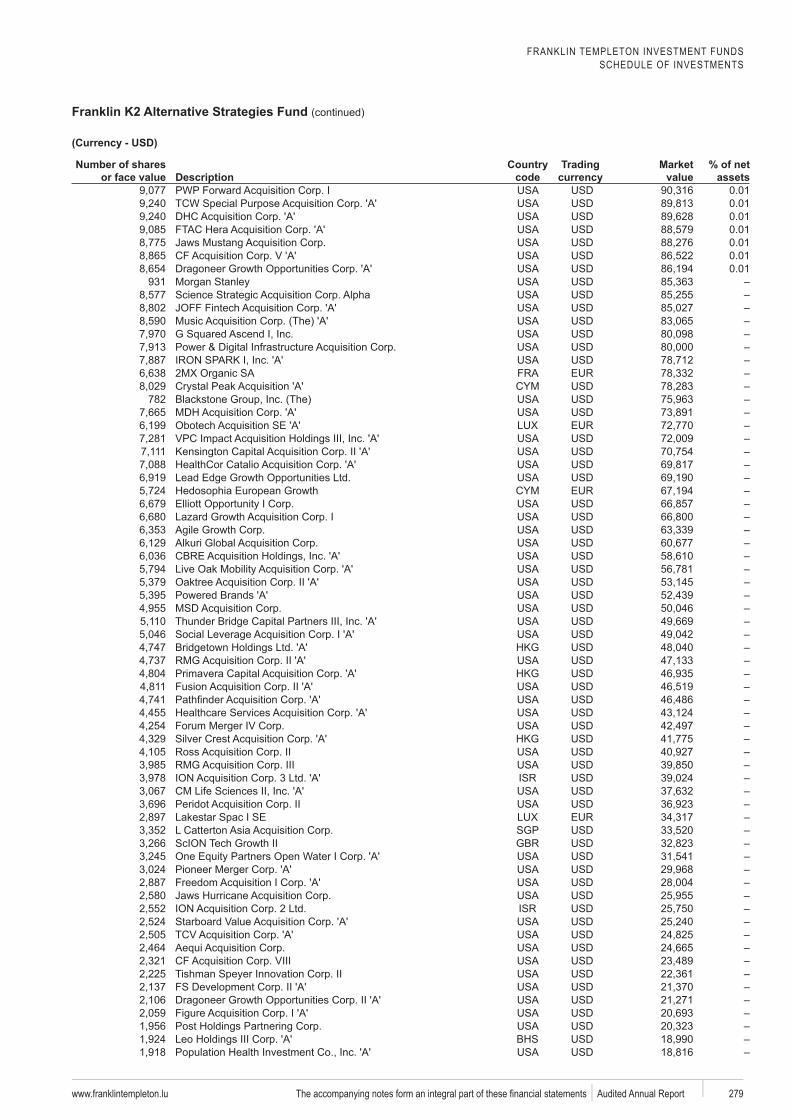
FRANKLIN TEMPLETON INVESTMENT FUNDSSCHEDULE OF INVESTMENTS
Franklin K2 Alternative Strategies Fund (continued)
www.franklintempleton.lu 279 Audited Annual Report
Number of shares or face value Description
code
Trading Market value
% of net assets
0.010.010.010.010.010.01
Dragoneer 0.01931
782
Peridot
SGP
Dragoneer
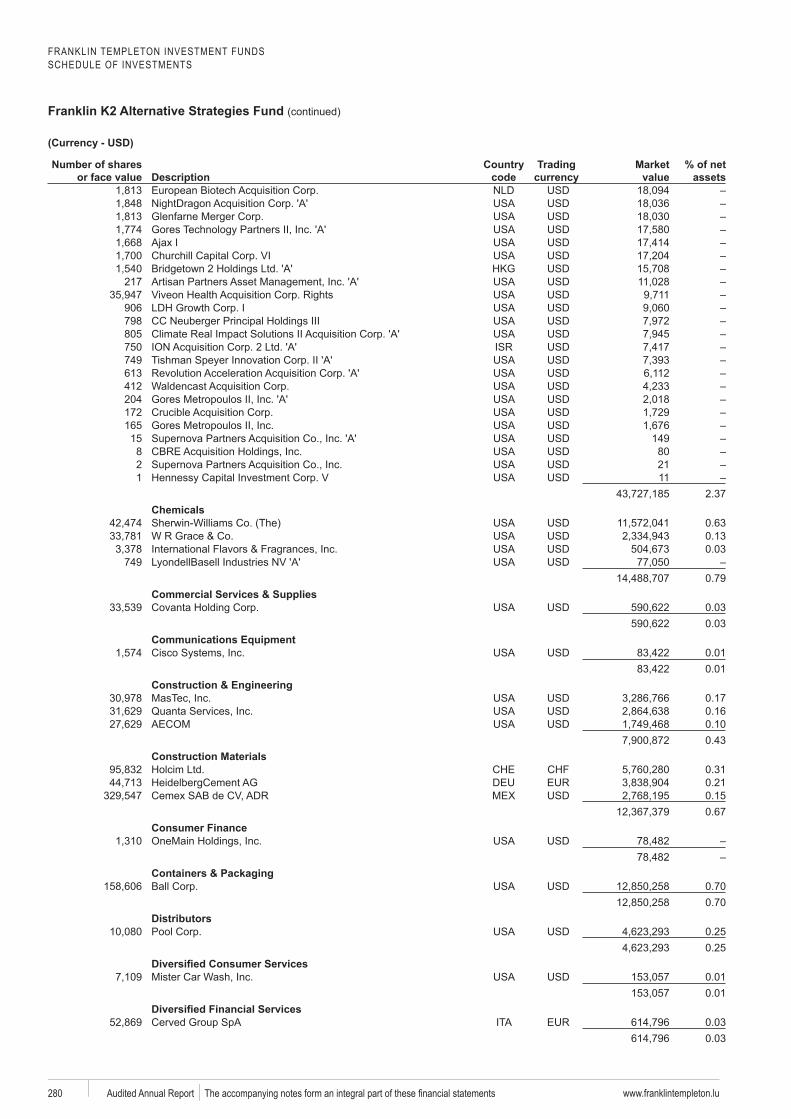
FRANKLIN TEMPLETON INVESTMENT FUNDSSCHEDULE OF INVESTMENTS
Franklin K2 Alternative Strategies Fund (continued)
www.franklintempleton.lu280 Audited Annual Report
Number of shares or face value Description
code
Trading Market value
% of net assets
Glenfarne
217
906798805750749613412 Waldencast20417216515 1498 802 211 11
2.37Chemicals
0.630.130.03
7490.79
Commercial Services & Supplies0.030.03
Communications Equipment0.010.01
Construction & Engineering0.170.160.100.43
Construction Materials0.310.210.150.67
Consumer Finance
Containers & Packaging0.700.70
Distributors0.250.25
0.010.01
0.030.03
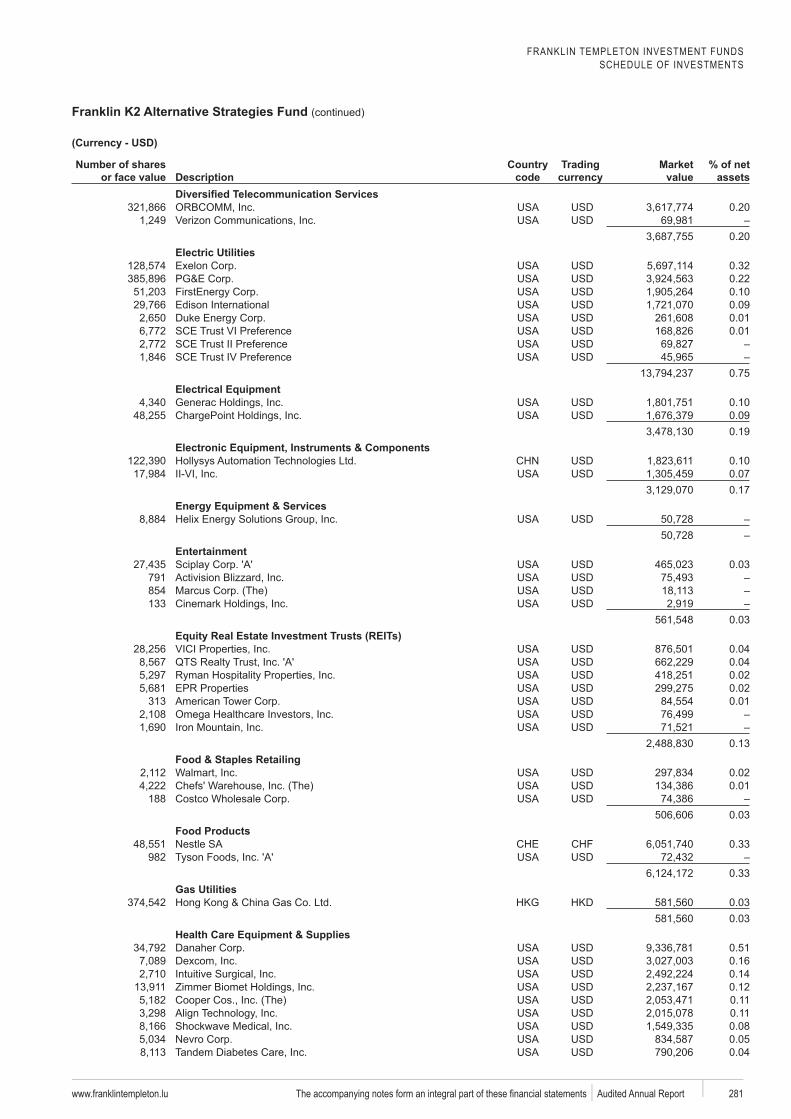
FRANKLIN TEMPLETON INVESTMENT FUNDSSCHEDULE OF INVESTMENTS
Franklin K2 Alternative Strategies Fund (continued)
www.franklintempleton.lu 281 Audited Annual Report
Number of shares or face value Description
code
Trading Market value
% of net assets
0.20
0.20Electric Utilities
0.320.220.100.090.010.01
0.75Electrical Equipment
0.100.090.19
Electronic Equipment, Instruments & Components0.100.070.17
Entertainment0.03
791854133
0.03
0.040.040.020.02
313 0.01
0.13Food & Staples Retailing
0.020.01
1880.03
Food Products0.33
9820.33
Gas Utilities0.030.03
Health Care Equipment & Supplies0.510.160.140.120.110.110.080.050.04
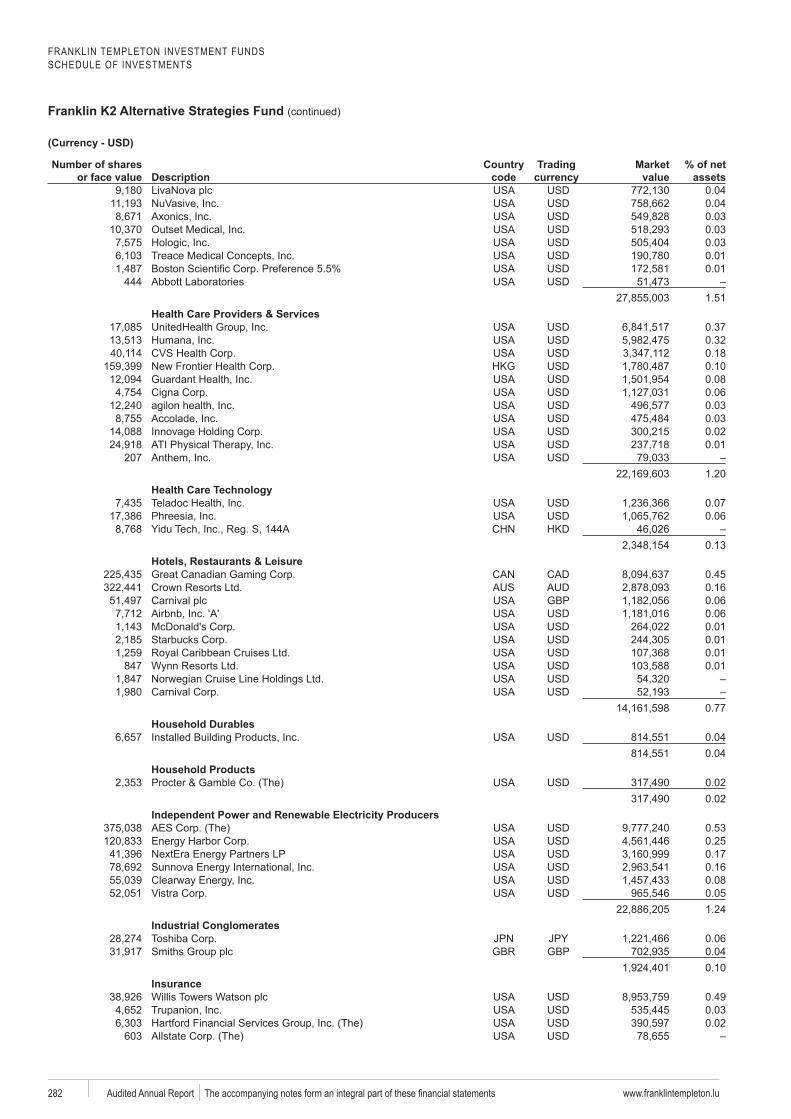
FRANKLIN TEMPLETON INVESTMENT FUNDSSCHEDULE OF INVESTMENTS
Franklin K2 Alternative Strategies Fund (continued)
www.franklintempleton.lu282 Audited Annual Report
Number of shares or face value Description
code
Trading Market value
% of net assets
0.040.040.030.030.03
Treace 0.010.01
4441.51
Health Care Providers & Services0.370.320.180.100.080.06
agilon 0.030.030.020.01
2071.20
Teladoc 0.07Phreesia 0.06
0.13Hotels, Restaurants & Leisure
0.450.16
GBP 0.060.060.010.010.01
847 0.01
0.77Household Durables
0.040.04
Household Products0.020.02
0.530.250.17
Sunnova 0.160.080.051.24
Industrial Conglomerates0.06
GBP 0.040.10
Insurance0.490.030.02
603
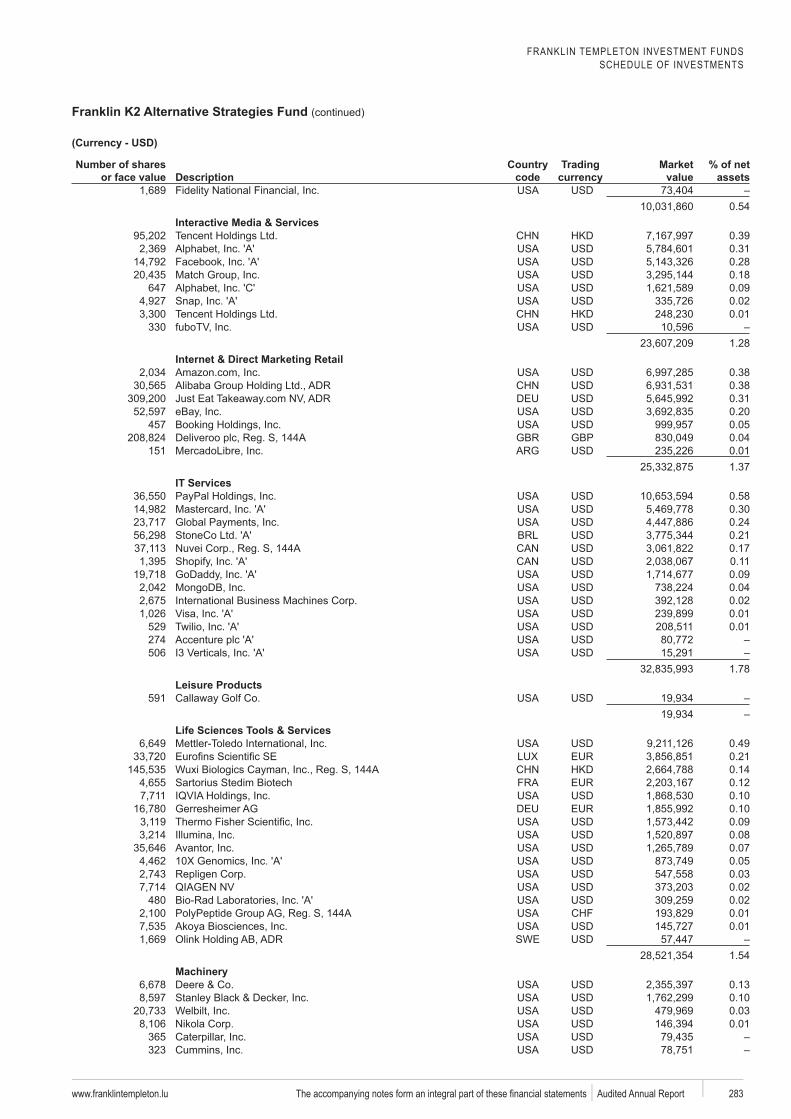
FRANKLIN TEMPLETON INVESTMENT FUNDSSCHEDULE OF INVESTMENTS
Franklin K2 Alternative Strategies Fund (continued)
www.franklintempleton.lu 283 Audited Annual Report
Number of shares or face value Description
code
Trading Market value
% of net assets
0.54Interactive Media & ServicesTencent 0.39
0.310.280.18
647 0.090.02
Tencent 0.01330
1.28Internet & Direct Marketing Retail
0.380.380.310.20
457 0.05Deliveroo GBP 0.04
151 0.011.37
IT Services0.580.300.240.210.170.11
GoDaddy 0.090.040.020.01
529 0.01274506
1.78Leisure Products
591
Life Sciences Tools & Services0.490.210.14
Sartorius Biotech 0.120.100.100.090.080.070.050.030.02
480 0.020.010.01
SWE1.54
0.130.100.030.01
365323
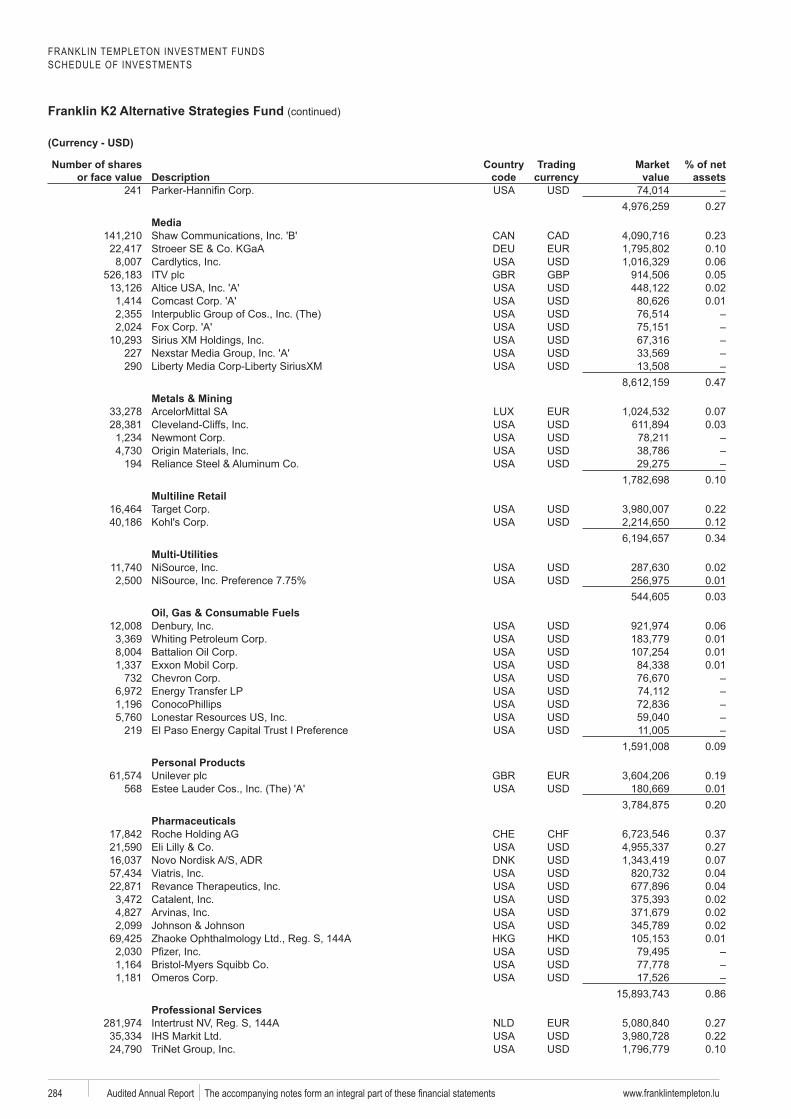
FRANKLIN TEMPLETON INVESTMENT FUNDSSCHEDULE OF INVESTMENTS
Franklin K2 Alternative Strategies Fund (continued)
www.franklintempleton.lu284 Audited Annual Report
Number of shares or face value Description
code
Trading Market value
% of net assets
2410.27
Media0.23
Stroeer 0.100.06
GBP 0.050.020.01
227290
0.47Metals & Mining
0.070.03
1940.10
Multiline Retail0.220.120.34
Multi-Utilities0.020.010.03
Oil, Gas & Consumable Fuels0.060.010.010.01
732
2190.09
Personal Products0.19
568 0.010.20
Pharmaceuticals0.370.270.070.040.040.020.020.02
Zhaoke 0.01
0.86Professional Services
0.270.220.10
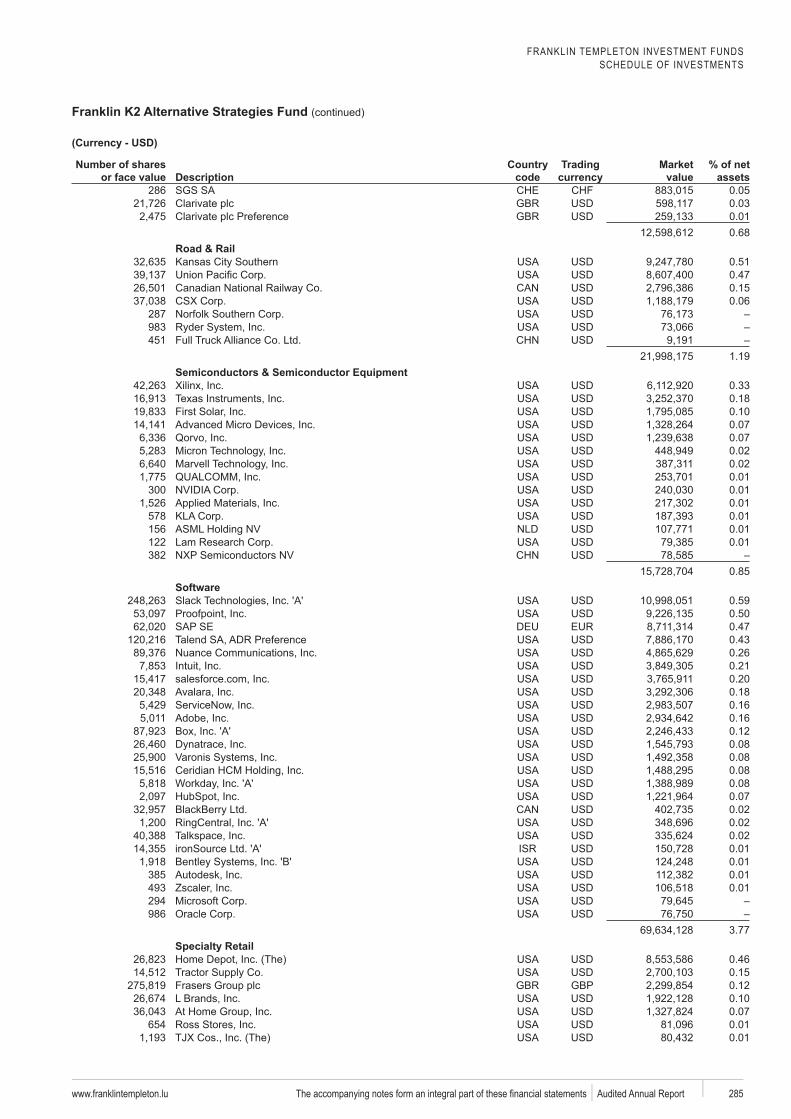
FRANKLIN TEMPLETON INVESTMENT FUNDSSCHEDULE OF INVESTMENTS
Franklin K2 Alternative Strategies Fund (continued)
www.franklintempleton.lu 285 Audited Annual Report
Number of shares or face value Description
code
Trading Market value
% of net assets
286 0.050.030.010.68
Road & Rail0.510.470.150.06
287983451
1.19Semiconductors & Semiconductor Equipment
0.330.180.100.070.070.020.020.01
300 0.010.01
578 0.01156 0.01122 0.01382
0.85
0.590.500.47
Talend 0.430.260.210.200.180.160.160.12
Dynatrace 0.080.080.080.080.070.020.020.02
ironSource 0.010.01
385 0.01493 Zscaler 0.01294986
3.77
0.460.15
GBP 0.120.100.07
654 0.010.01
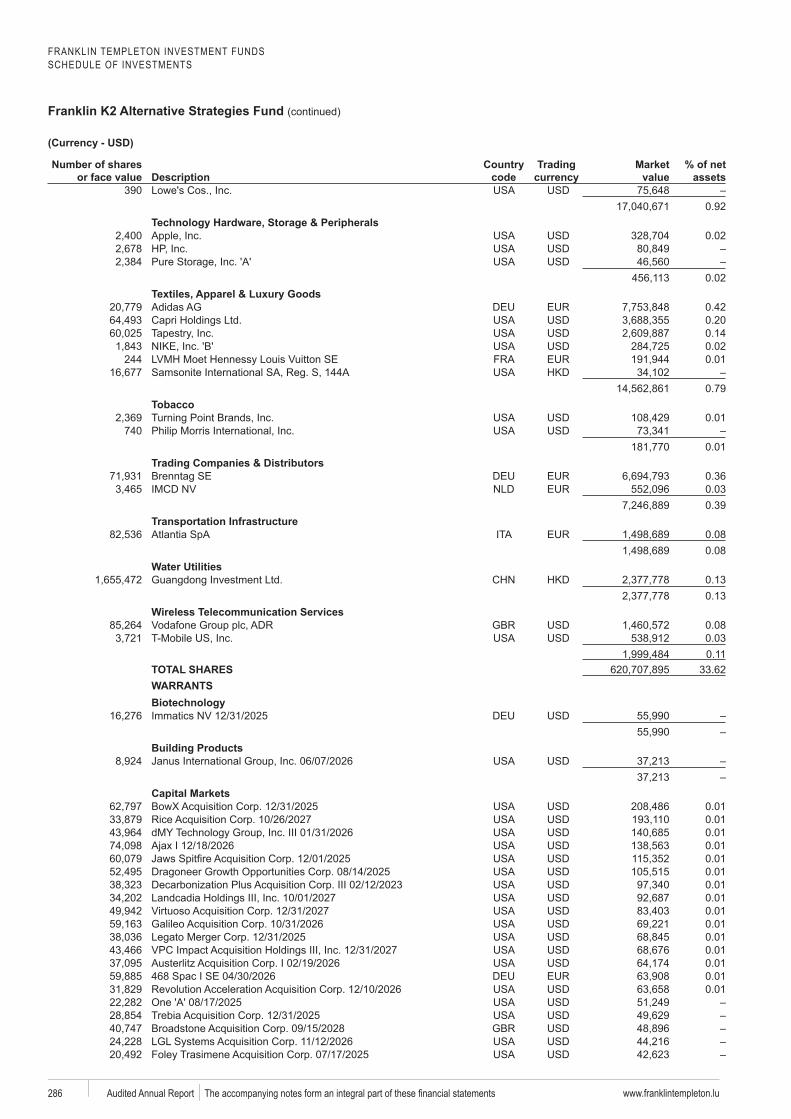
FRANKLIN TEMPLETON INVESTMENT FUNDSSCHEDULE OF INVESTMENTS
Franklin K2 Alternative Strategies Fund (continued)
www.franklintempleton.lu286 Audited Annual Report
Number of shares or face value Description
code
Trading Market value
% of net assets
3900.92
0.02
0.02
0.420.200.140.02
244 0.01
0.79Tobacco
0.01740
0.01Trading Companies & DistributorsBrenntag SE 0.36
0.030.39
Transportation Infrastructure 0.08
0.08Water Utilities
0.130.13
Wireless Telecommunication Services0.080.030.11
TOTAL SHARES 33.62WARRANTS
Building Products
Capital Markets0.010.010.010.010.01
Dragoneer 0.010.010.010.010.010.010.010.01
468 0.010.01
Broadstone
Foley
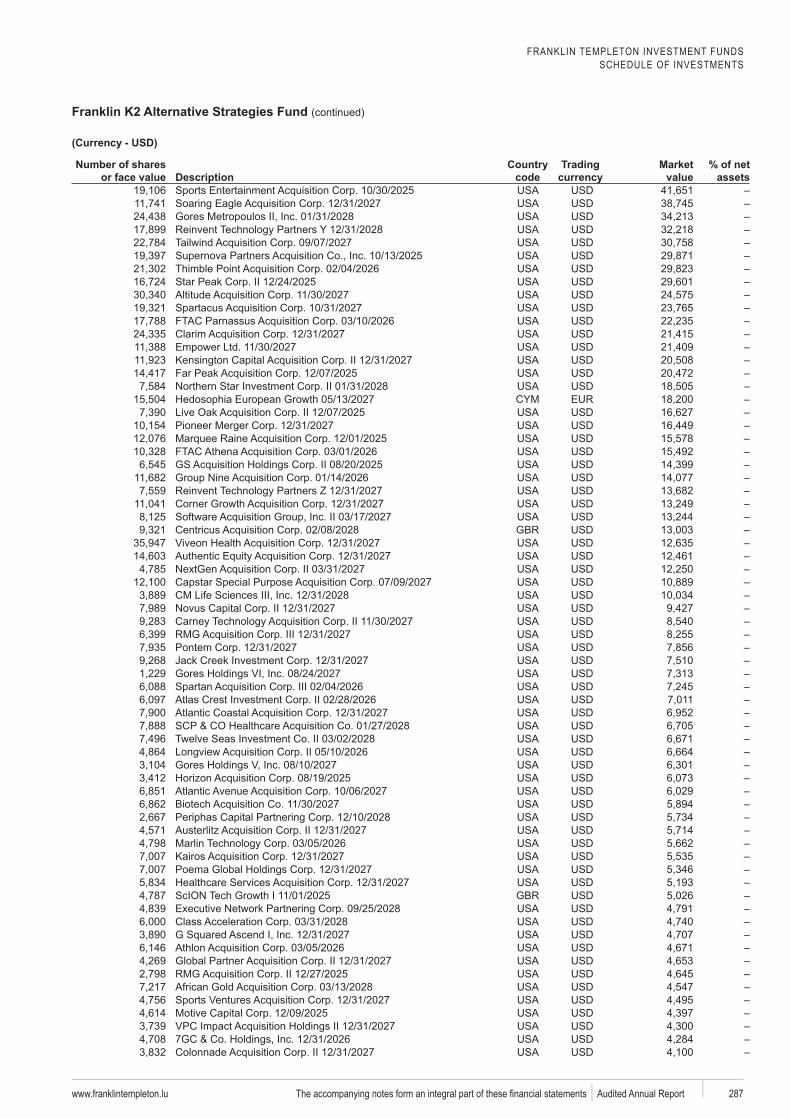
FRANKLIN TEMPLETON INVESTMENT FUNDSSCHEDULE OF INVESTMENTS
Franklin K2 Alternative Strategies Fund (continued)
www.franklintempleton.lu 287 Audited Annual Report
Number of shares or face value Description
code
Trading Market value
% of net assets
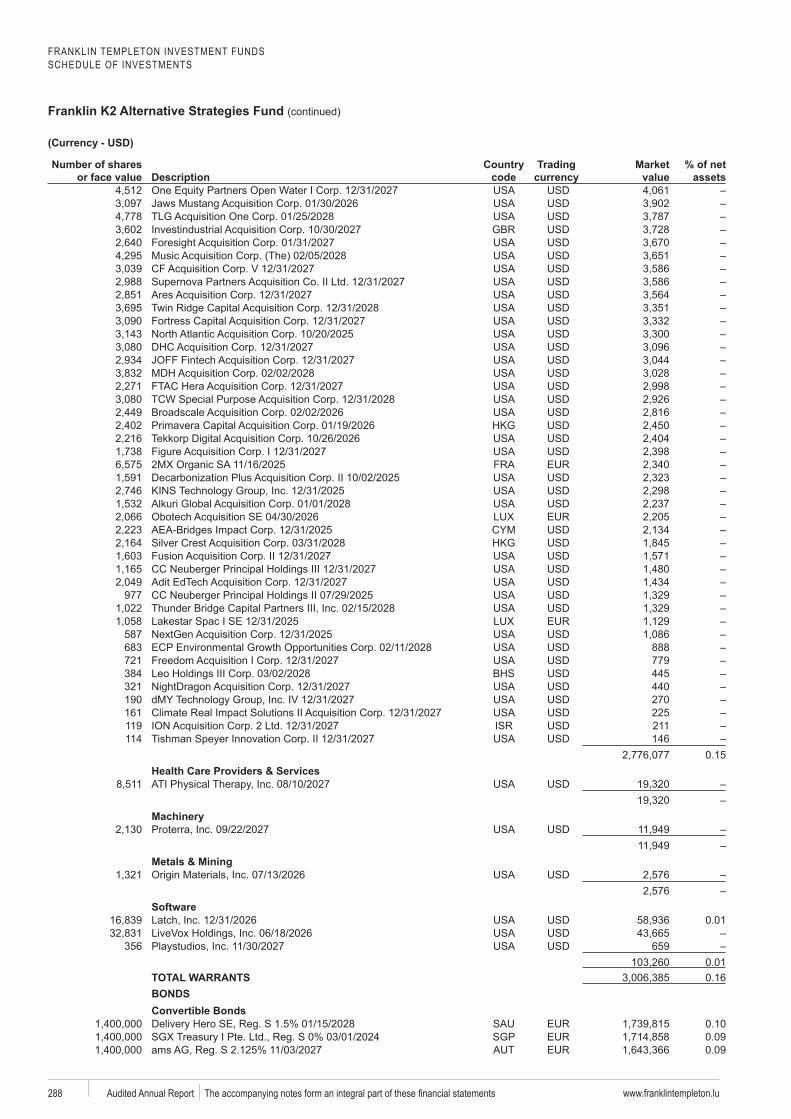
FRANKLIN TEMPLETON INVESTMENT FUNDSSCHEDULE OF INVESTMENTS
Franklin K2 Alternative Strategies Fund (continued)
www.franklintempleton.lu288 Audited Annual Report
Number of shares or face value Description
code
Trading Market value
% of net assets
Broadscale
EdTech977
587683 888721 779384 445321 440190 270161 225119 211114 146
0.15Health Care Providers & Services
Proterra
Metals & Mining
0.01
356 Playstudios 6590.01
TOTAL WARRANTS 0.16BONDSConvertible Bonds
0.10SGP 0.09
0.09
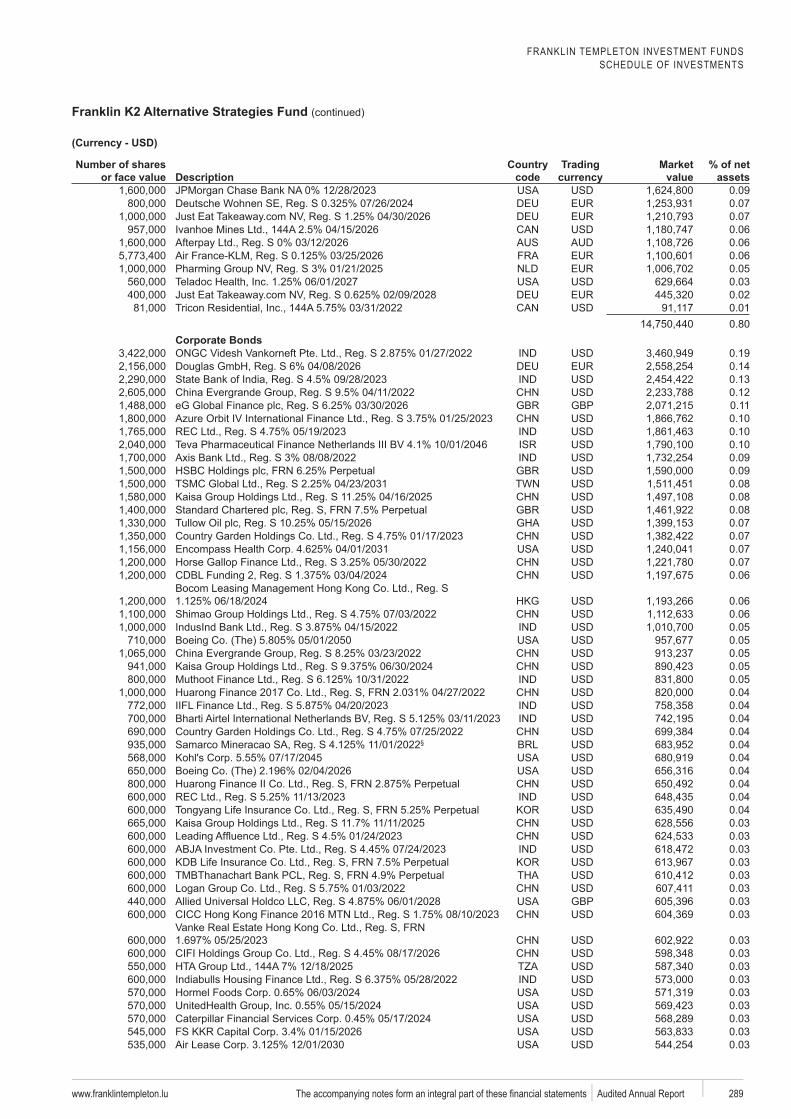
FRANKLIN TEMPLETON INVESTMENT FUNDSSCHEDULE OF INVESTMENTS
Franklin K2 Alternative Strategies Fund (continued)
www.franklintempleton.lu 289 Audited Annual Report
Number of shares or face value Description
code
Trading Market value
% of net assets
0.09Deutsche Wohnen 0.07
0.070.060.060.060.05
Teladoc 0.030.02
Tricon 0.010.80
Corporate Bonds 0.19
0.140.13
Evergrande 0.12eG GBP 0.11
0.100.10
Teva 0.100.090.090.08
Kaisa 0.080.080.070.070.070.070.06
0.060.060.050.05
Evergrande 0.05Kaisa 0.05
0.050.040.040.040.04
§ 0.040.040.040.040.04
Tongyang 0.04Kaisa 0.03
0.030.030.030.030.03
GBP 0.030.03
0.030.030.030.030.030.030.030.030.03
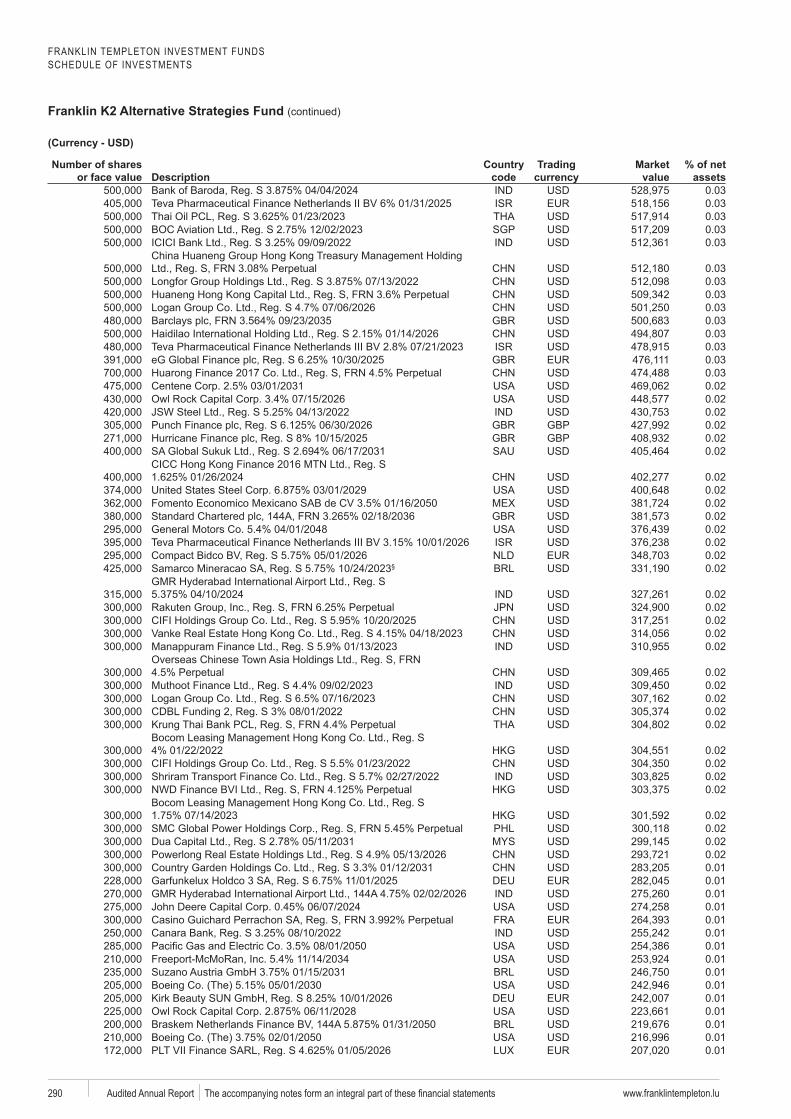
FRANKLIN TEMPLETON INVESTMENT FUNDSSCHEDULE OF INVESTMENTS
Franklin K2 Alternative Strategies Fund (continued)
www.franklintempleton.lu290 Audited Annual Report
Number of shares or face value Description
code
Trading Market value
% of net assets
0.03Teva 0.03
0.03SGP 0.03
0.03
0.030.030.030.030.030.03
Teva 0.03eG 0.03
0.030.020.020.02
GBP 0.02GBP 0.02
Sukuk 0.02
0.020.02
0.020.020.02
Teva 0.02Bidco 0.02 § 0.02
0.020.020.020.020.02
0.020.020.020.020.02
0.020.020.020.02
0.020.02
Dua 0.020.020.01
Garfunkelux 0.010.010.01
Guichard Perrachon 0.010.010.010.010.010.010.010.010.010.010.01
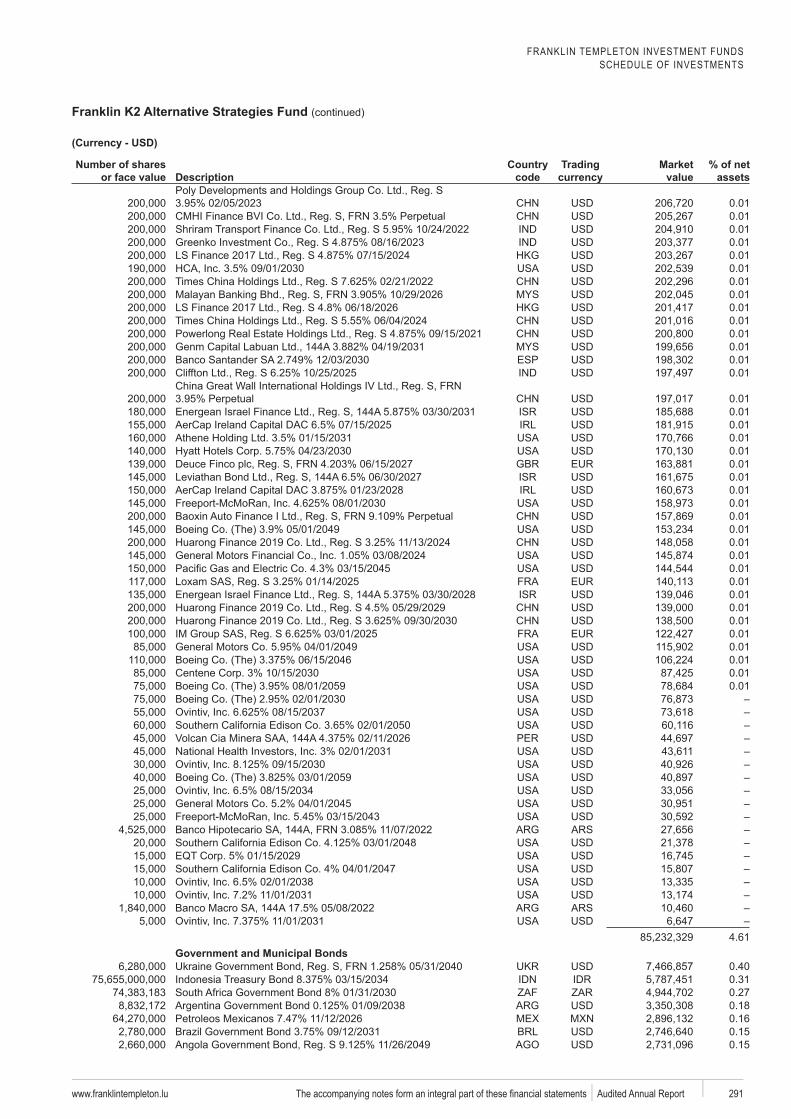
FRANKLIN TEMPLETON INVESTMENT FUNDSSCHEDULE OF INVESTMENTS
Franklin K2 Alternative Strategies Fund (continued)
www.franklintempleton.lu 291 Audited Annual Report
Number of shares or face value Description
code
Trading Market value
% of net assets
0.010.010.01
Greenko 0.010.010.010.010.010.010.010.010.01
ESP 0.010.01
0.01Energean 0.01
0.010.010.01
Deuce Finco 0.010.010.010.01
Baoxin 0.010.010.010.010.010.01
Energean 0.010.010.010.010.010.010.010.01
Banco
4.61Government and Municipal Bonds
0.400.310.270.18
Petroleos 0.160.150.15
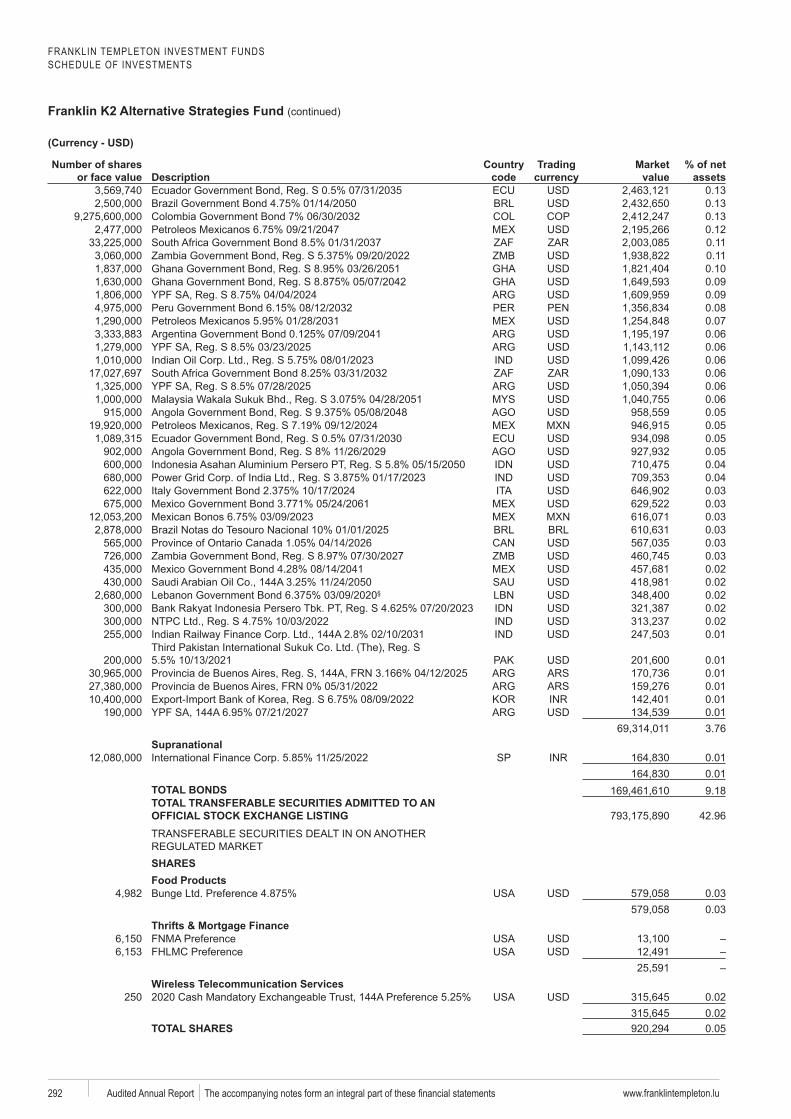
FRANKLIN TEMPLETON INVESTMENT FUNDSSCHEDULE OF INVESTMENTS
Franklin K2 Alternative Strategies Fund (continued)
www.franklintempleton.lu292 Audited Annual Report
Number of shares or face value Description
code
Trading Market value
% of net assets
0.130.130.13
Petroleos 0.120.110.110.100.090.090.08
Petroleos 0.070.060.060.060.060.06
Wakala Sukuk 0.060.05
Petroleos 0.050.050.05
Persero 0.040.040.030.03
Bonos 0.03 do Tesouro 0.03
0.030.030.020.02
§ 0.02Persero 0.02
0.020.01
Sukuk0.01
Provincia 0.01Provincia 0.01
0.010.013.76
SupranationalSP 0.01
0.01TOTAL BONDS 9.18TOTAL TRANSFERABLE SECURITIES ADMITTED TO AN
42.96
SHARESFood Products
0.030.03
Thrifts & Mortgage Finance
Wireless Telecommunication Services250 0.02
0.02TOTAL SHARES 0.05
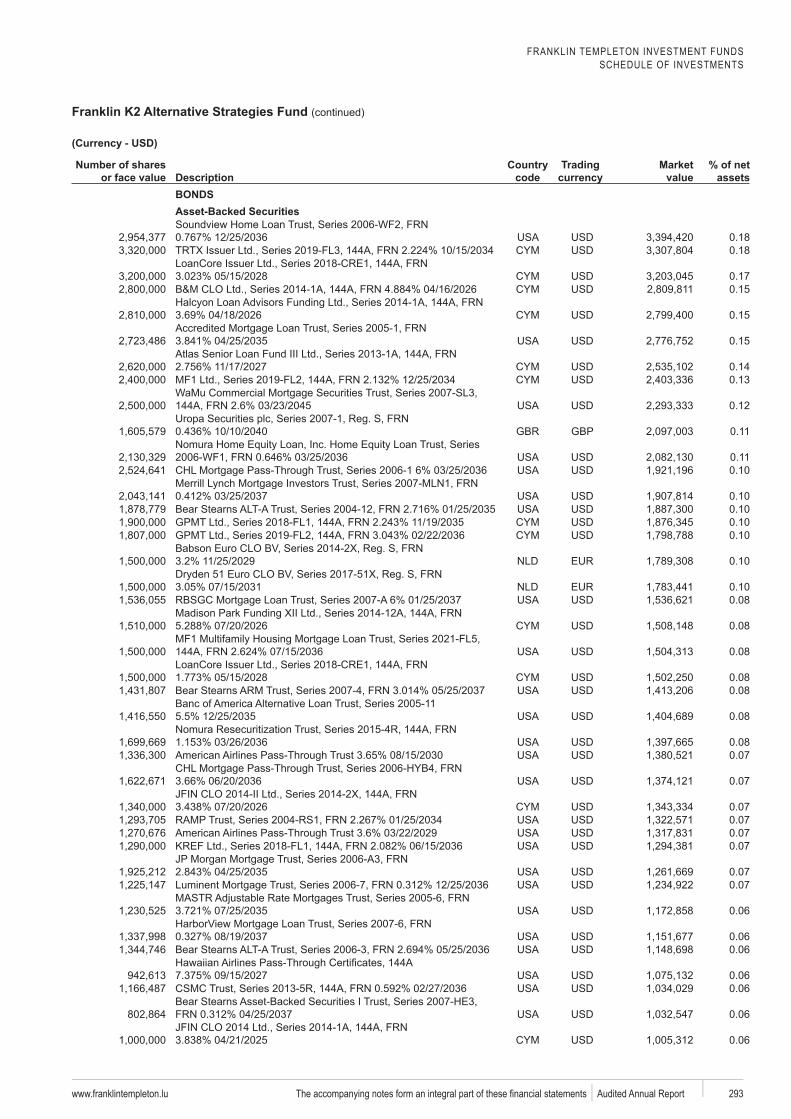
FRANKLIN TEMPLETON INVESTMENT FUNDSSCHEDULE OF INVESTMENTS
Franklin K2 Alternative Strategies Fund (continued)
www.franklintempleton.lu 293 Audited Annual Report
Number of shares or face value Description
code
Trading Market value
% of net assets
BONDSAsset-Backed Securities
0.180.18
0.170.15
0.15
0.15
0.140.13
0.12
GBP 0.11
0.110.10
0.100.100.100.10
0.10
0.100.08
0.08
0.08
0.080.08
0.08
0.080.07
0.07
0.070.070.070.07
0.070.07
0.06
0.060.06
0.060.06
0.06
0.06
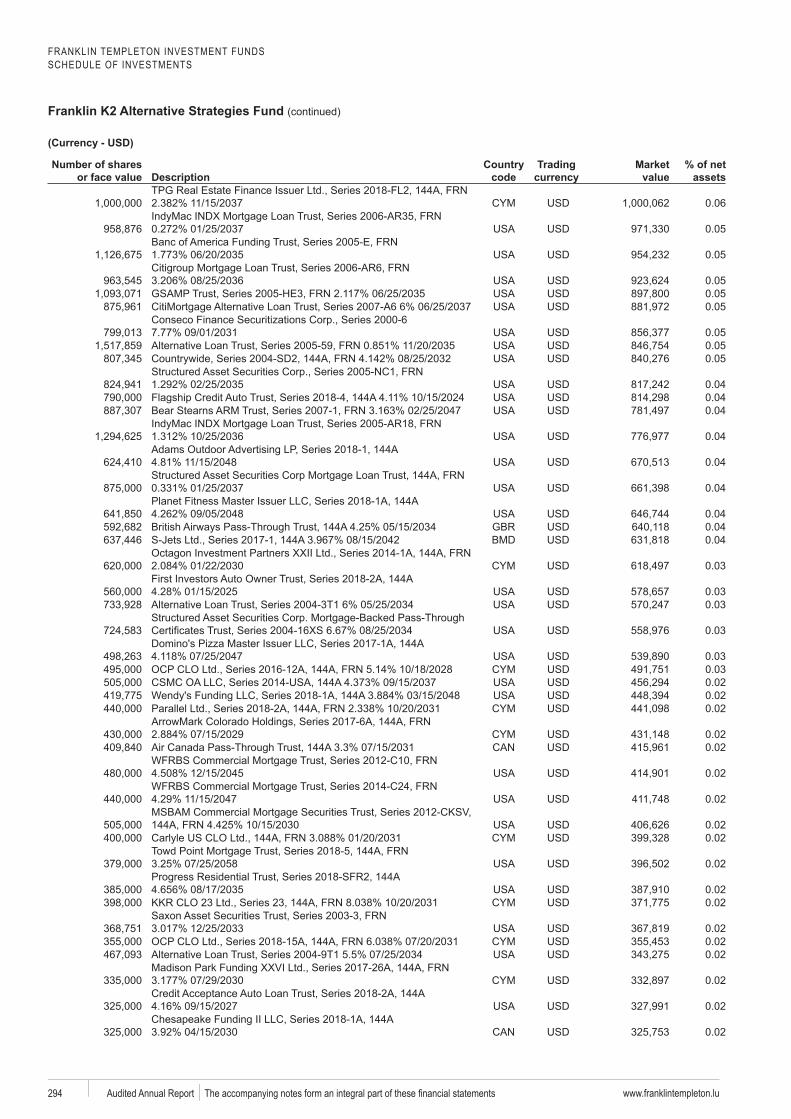
FRANKLIN TEMPLETON INVESTMENT FUNDSSCHEDULE OF INVESTMENTS
Franklin K2 Alternative Strategies Fund (continued)
www.franklintempleton.lu294 Audited Annual Report
Number of shares or face value Description
code
Trading Market value
% of net assets
0.06
0.05
0.05
0.050.050.05
0.050.050.05
0.040.040.04
0.04
0.04
0.04
0.040.040.04
0.03
0.030.03
0.03
0.030.030.020.020.02
0.020.02
0.02
0.02
0.020.02
0.02
0.020.02
0.020.020.02
0.02
0.02
0.02
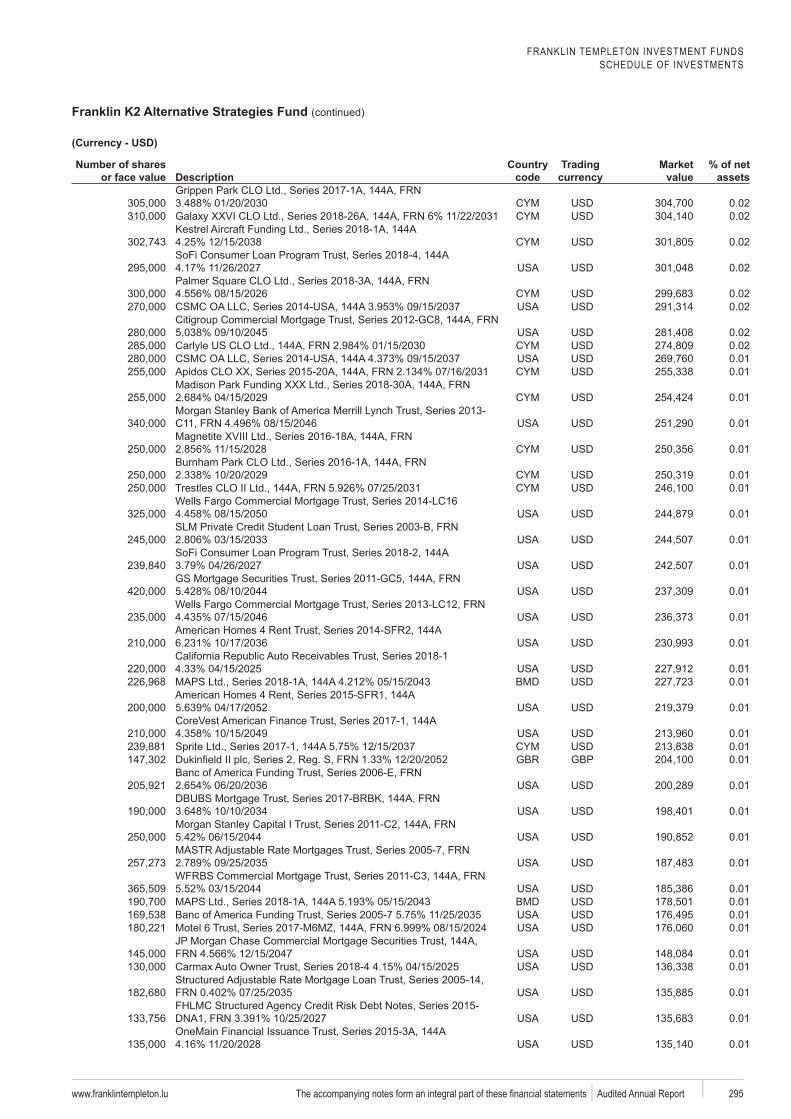
FRANKLIN TEMPLETON INVESTMENT FUNDSSCHEDULE OF INVESTMENTS
Franklin K2 Alternative Strategies Fund (continued)
www.franklintempleton.lu 295 Audited Annual Report
Number of shares or face value Description
code
Trading Market value
% of net assets
0.020.02
0.02SoFi
0.02
0.020.02
0.020.020.010.01
0.01
0.01
0.01
0.010.01
0.01
0.01SoFi
0.01
0.01
0.01
0.01
0.010.01
0.01
0.010.01
GBP 0.01
0.01
0.01
0.01
0.01
0.010.010.010.01
0.010.01
0.01
0.01
0.01
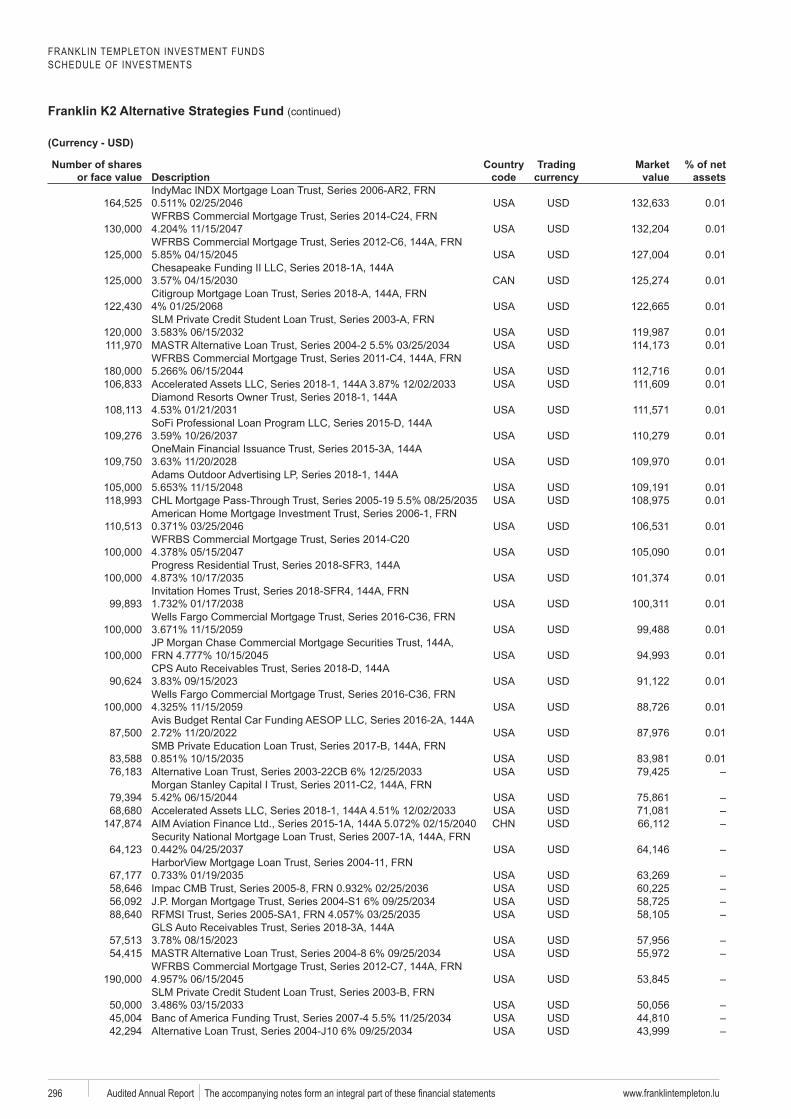
FRANKLIN TEMPLETON INVESTMENT FUNDSSCHEDULE OF INVESTMENTS
Franklin K2 Alternative Strategies Fund (continued)
www.franklintempleton.lu296 Audited Annual Report
Number of shares or face value Description
code
Trading Market value
% of net assets
0.01
0.01
0.01
0.01
0.01
0.010.01
0.010.01
0.01SoFi
0.01
0.01
0.010.01
0.01
0.01
0.01
0.01
0.01
0.01
0.01
0.01
0.01
0.01
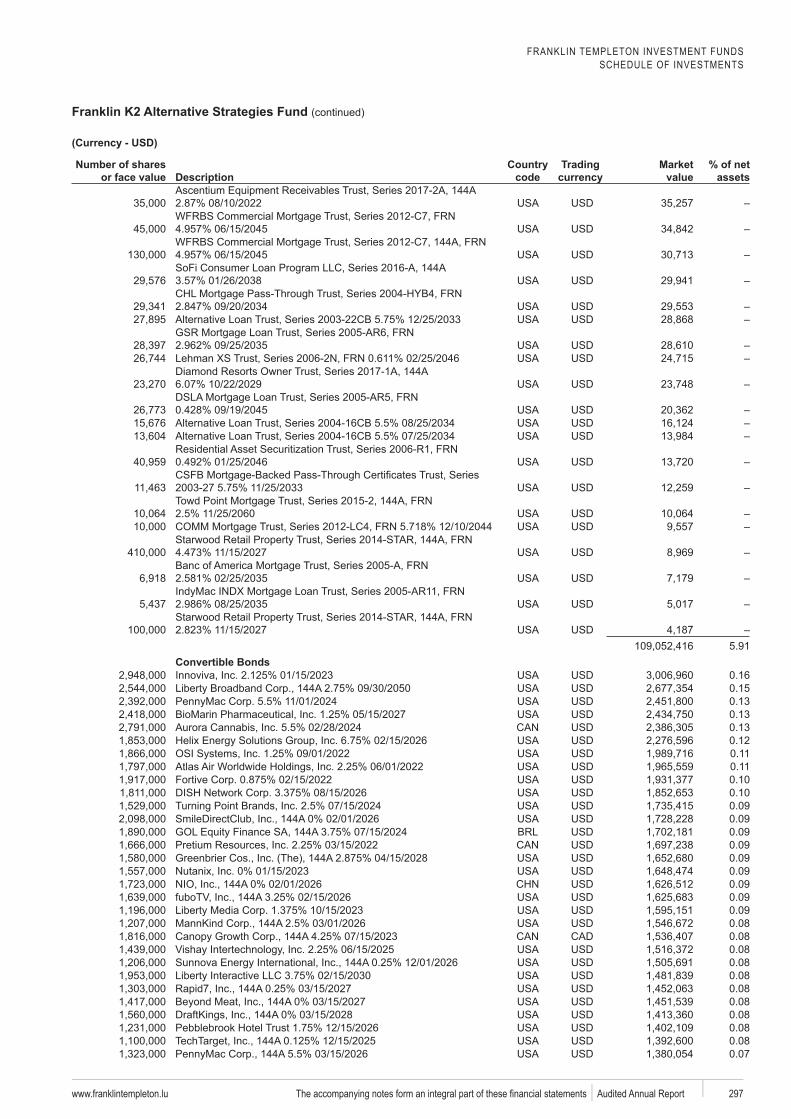
FRANKLIN TEMPLETON INVESTMENT FUNDSSCHEDULE OF INVESTMENTS
Franklin K2 Alternative Strategies Fund (continued)
www.franklintempleton.lu 297 Audited Annual Report
Number of shares or face value Description
code
Trading Market value
% of net assets
SoFi
5.91Convertible Bonds
0.160.150.130.130.130.120.110.11
Fortive 0.100.100.090.090.090.090.090.090.090.090.090.080.080.08
Sunnova 0.080.080.080.08
DraftKings 0.080.08
TechTarget 0.080.07
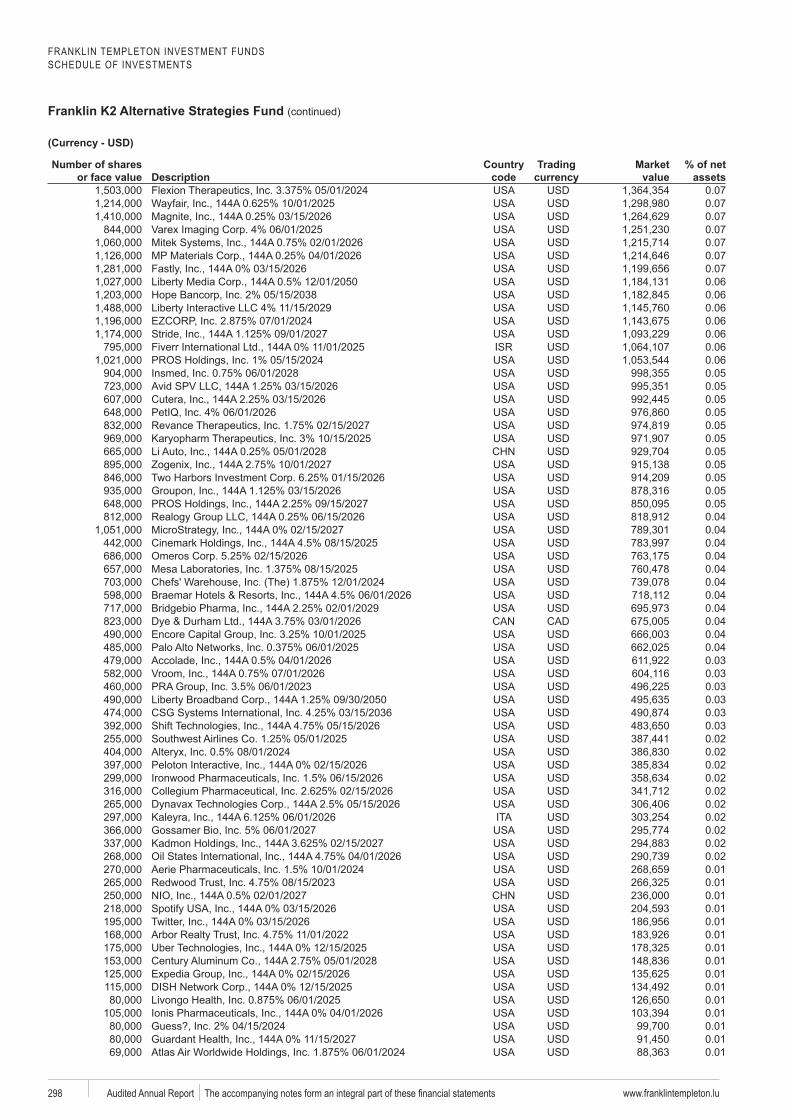
FRANKLIN TEMPLETON INVESTMENT FUNDSSCHEDULE OF INVESTMENTS
Franklin K2 Alternative Strategies Fund (continued)
www.franklintempleton.lu298 Audited Annual Report
Number of shares or face value Description
code
Trading Market value
% of net assets
0.070.070.070.070.070.07
Fastly 0.070.060.060.060.060.060.060.060.050.050.050.050.050.050.05
Zogenix 0.050.050.050.050.040.040.040.040.040.040.040.040.040.040.040.030.030.030.030.030.030.020.020.020.020.02
Dynavax 0.02Kaleyra 0.02
0.020.020.020.010.010.010.010.010.010.010.010.010.010.010.010.010.010.01
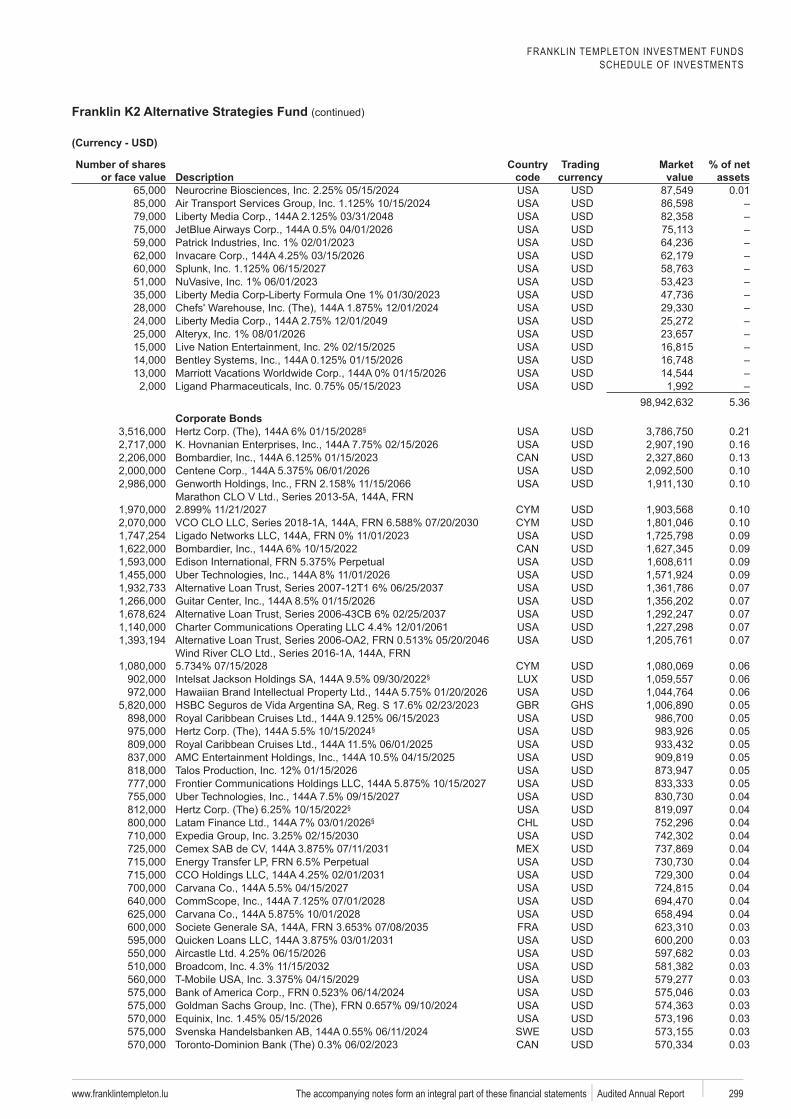
FRANKLIN TEMPLETON INVESTMENT FUNDSSCHEDULE OF INVESTMENTS
Franklin K2 Alternative Strategies Fund (continued)
www.franklintempleton.lu 299 Audited Annual Report
Number of shares or face value Description
code
Trading Market value
% of net assets
0.01
5.36Corporate Bonds
§ 0.210.160.130.100.10
0.100.100.090.090.090.090.070.070.070.070.07
0.06§ 0.06
0.06Seguros 0.05
0.05§ 0.05
0.050.05
Talos 0.050.050.04
§ 0.04§ 0.04
0.040.040.040.040.040.040.04
Societe Generale 0.030.030.030.030.030.030.030.03
Svenska SWE 0.030.03
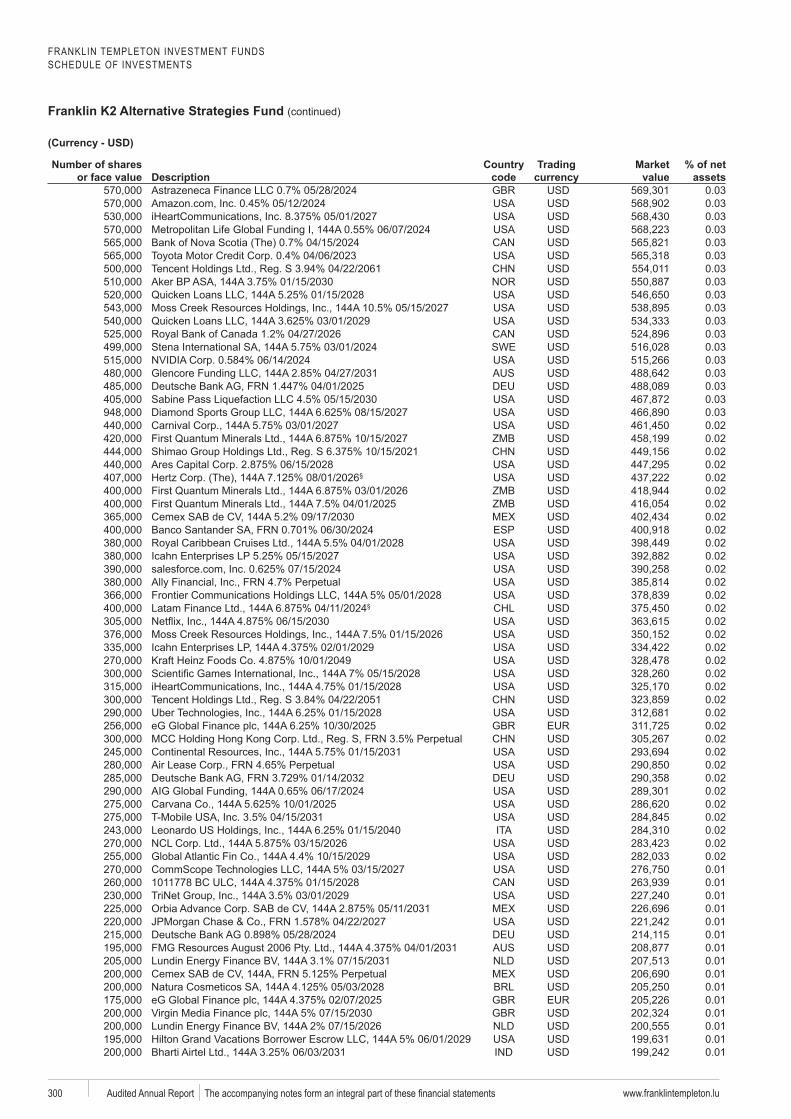
FRANKLIN TEMPLETON INVESTMENT FUNDSSCHEDULE OF INVESTMENTS
Franklin K2 Alternative Strategies Fund (continued)
www.franklintempleton.lu300 Audited Annual Report
Number of shares or face value Description
code
Trading Market value
% of net assets
0.030.030.030.030.030.03
Tencent 0.030.030.030.030.030.03
SWE 0.030.030.030.030.030.030.020.020.020.02
§ 0.020.020.020.02
ESP 0.020.020.020.020.020.02
§ 0.020.020.020.020.020.020.02
Tencent 0.020.02
eG 0.020.020.020.020.020.020.020.020.020.020.020.010.010.010.010.010.010.010.010.010.01
eG 0.010.010.010.010.01
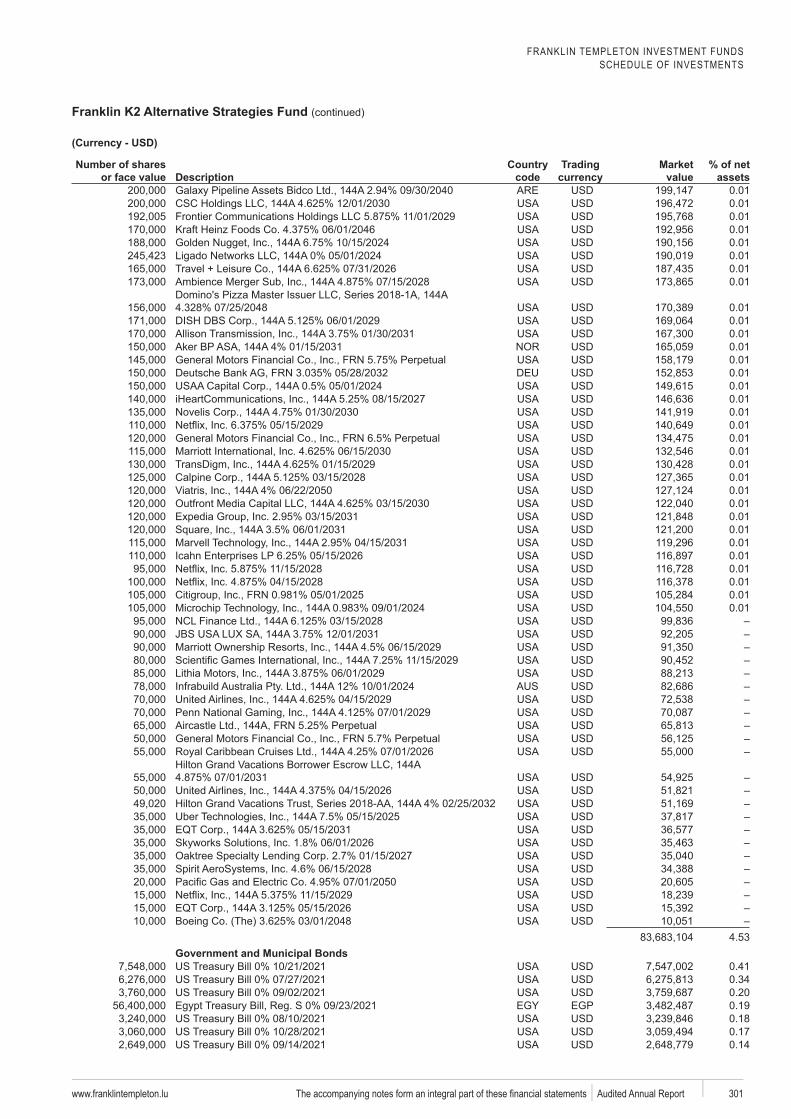
FRANKLIN TEMPLETON INVESTMENT FUNDSSCHEDULE OF INVESTMENTS
Franklin K2 Alternative Strategies Fund (continued)
www.franklintempleton.lu 301 Audited Annual Report
Number of shares or face value Description
code
Trading Market value
% of net assets
Bidco 0.010.010.010.010.010.010.010.01
0.010.010.010.010.010.010.010.010.010.010.010.010.010.010.010.010.010.010.010.010.010.010.010.01
4.53Government and Municipal Bonds
0.410.340.20
EGP 0.190.180.170.14
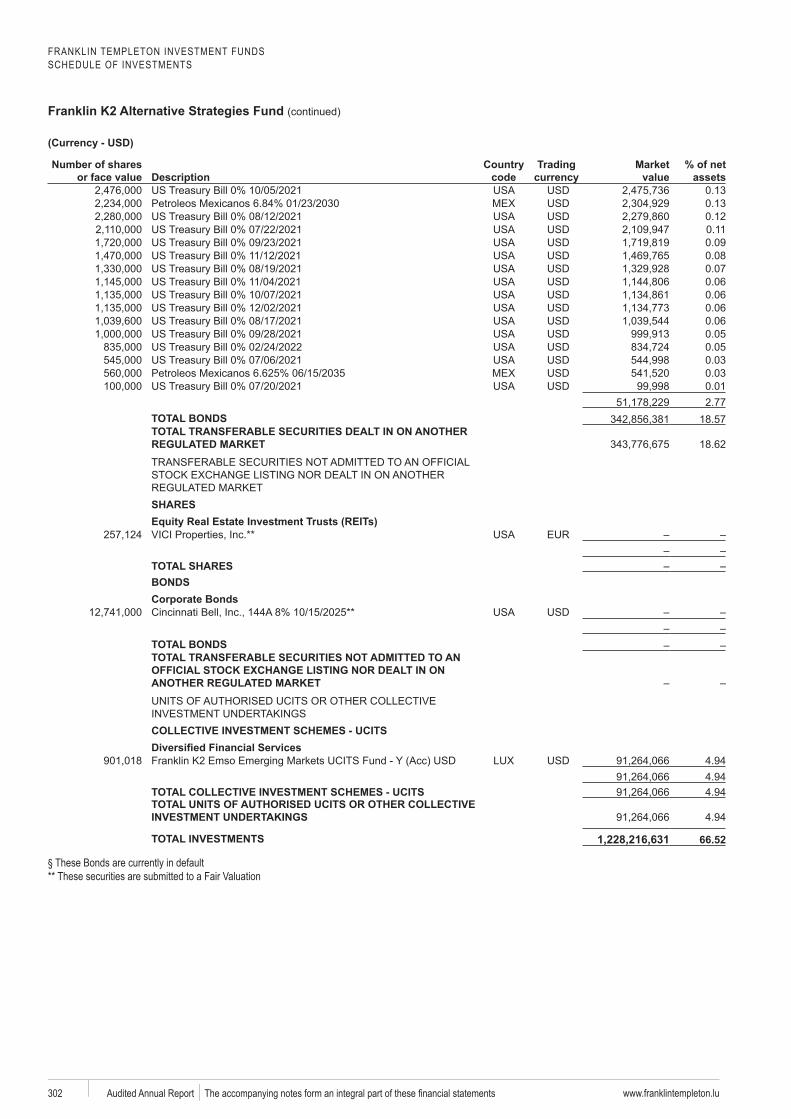
FRANKLIN TEMPLETON INVESTMENT FUNDSSCHEDULE OF INVESTMENTS
Franklin K2 Alternative Strategies Fund (continued)
www.franklintempleton.lu302 Audited Annual Report
Number of shares or face value Description
code
Trading Market value
% of net assets
0.13Petroleos 0.13
0.120.110.090.080.070.060.060.060.060.050.050.03
Petroleos 0.030.012.77
TOTAL BONDS 18.57TOTAL TRANSFERABLE SECURITIES DEALT IN ON ANOTHER
18.62
SHARES
TOTAL SHARESBONDSCorporate Bonds
TOTAL BONDSTOTAL TRANSFERABLE SECURITIES NOT ADMITTED TO AN
COLLECTIVE INVESTMENT SCHEMES - UCITS
Franklin K2 4.944.94
TOTAL COLLECTIVE INVESTMENT SCHEMES - UCITS 4.94TOTAL UNITS OF AUTHORISED UCITS OR OTHER COLLECTIVE
4.94
TOTAL INVESTMENTS 1,228,216,631as§ These Bonds are currently in default** These securities are submitted to a Fair Valuation
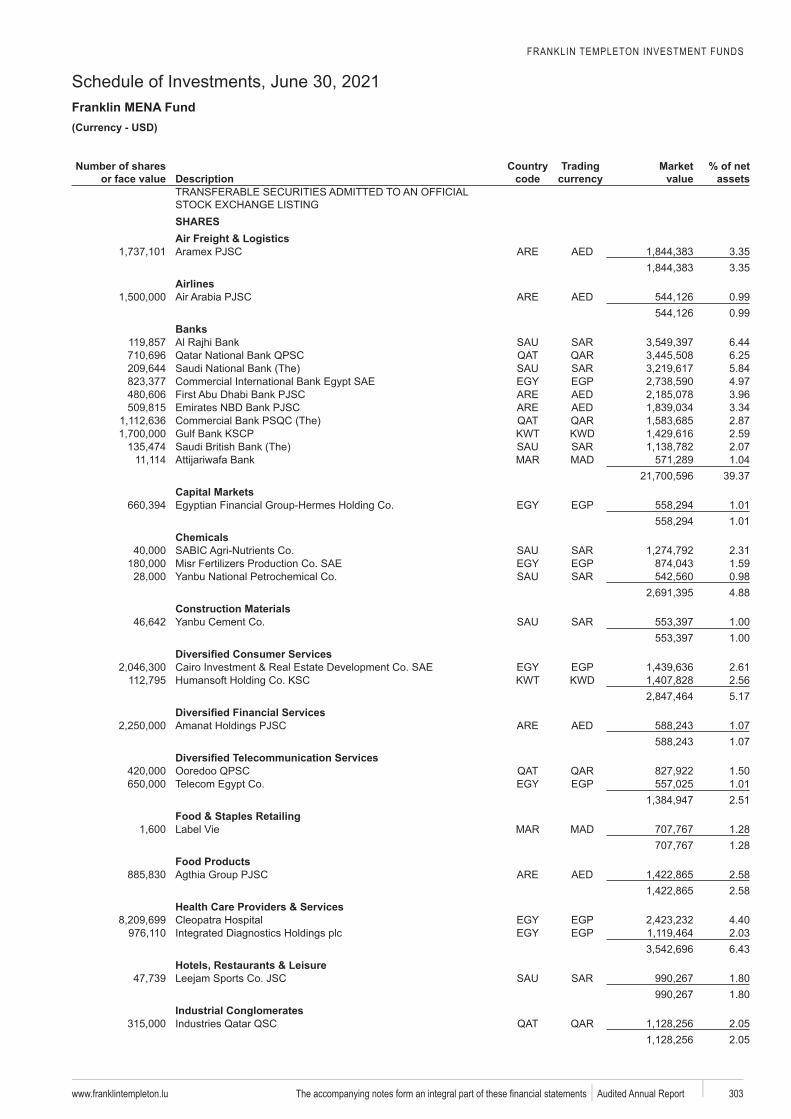
FRANKLIN TEMPLETON INVESTMENT FUNDS
Schedule of Investments, June 30, 2021Franklin MENA Fund
www.franklintempleton.lu 303 Audited Annual Report
USD)
Number of shares or face value Description
code
Trading Market value
% of net assets
SHARESAir Freight & Logistics
3.353.35
Airlines0.990.99
Banks Bank 6.44
6.255.84
EGP 4.973.963.342.87
KWT KWD 2.592.07
Bank 1.0439.37
Capital MarketsEGP 1.01
1.01Chemicals
2.31EGP 1.59
0.984.88
Construction Materials1.001.00
EGP 2.61KWT KWD 2.56
5.17
1.071.07
1.50EGP 1.01
2.51Food & Staples Retailing
1.281.28
Food Products2.582.58
Health Care Providers & ServicesEGP 4.40EGP 2.03
6.43Hotels, Restaurants & Leisure
1.801.80
Industrial Conglomerates2.052.05
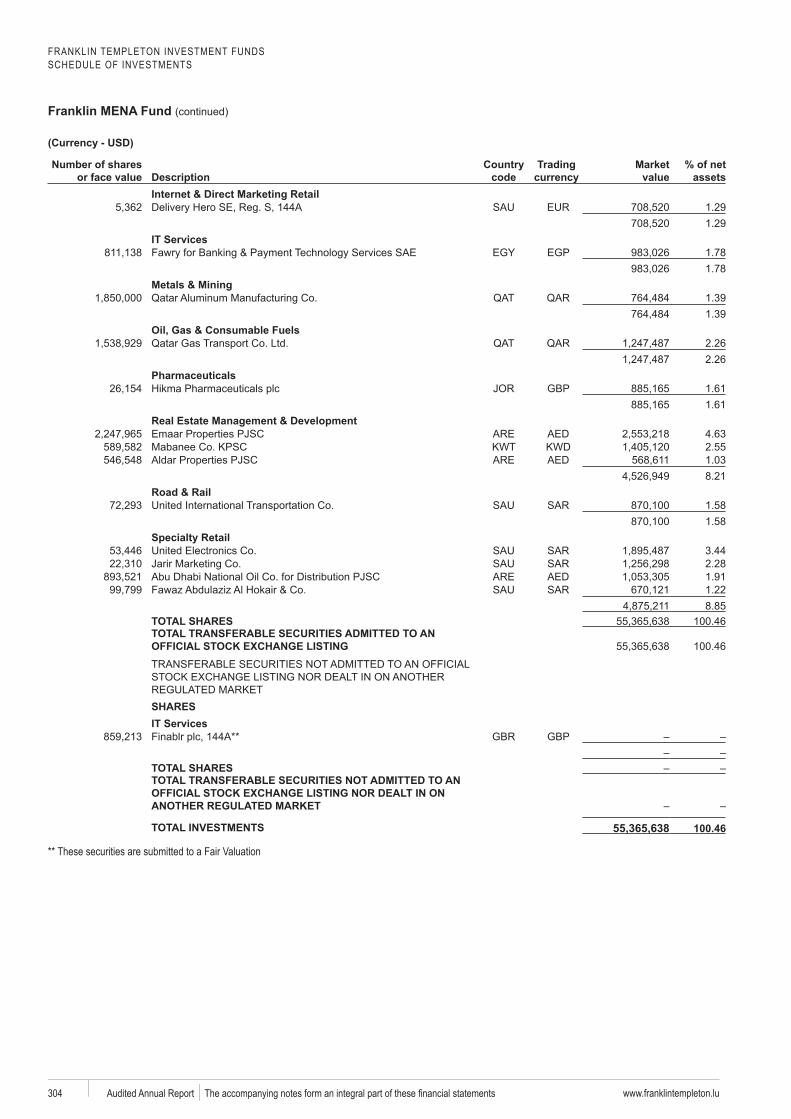
FRANKLIN TEMPLETON INVESTMENT FUNDSSCHEDULE OF INVESTMENTS
Franklin MENA Fund (continued)
www.franklintempleton.lu304 Audited Annual Report
Number of shares or face value Description
code
Trading Market value
% of net assets
Internet & Direct Marketing Retail1.291.29
IT ServicesEGP 1.78
1.78Metals & Mining
1.391.39
Oil, Gas & Consumable Fuels2.262.26
PharmaceuticalsGBP 1.61
1.61Real Estate Management & Development
4.63KWT KWD 2.55
1.038.21
Road & Rail1.581.58
3.44Jarir 2.28
1.91 1.22
8.85TOTAL SHARES 100.46TOTAL TRANSFERABLE SECURITIES ADMITTED TO AN
100.46
SHARESIT Services
GBP
TOTAL SHARESTOTAL TRANSFERABLE SECURITIES NOT ADMITTED TO AN
TOTAL INVESTMENTS 55,365,638a** These securities are submitted to a Fair Valuation
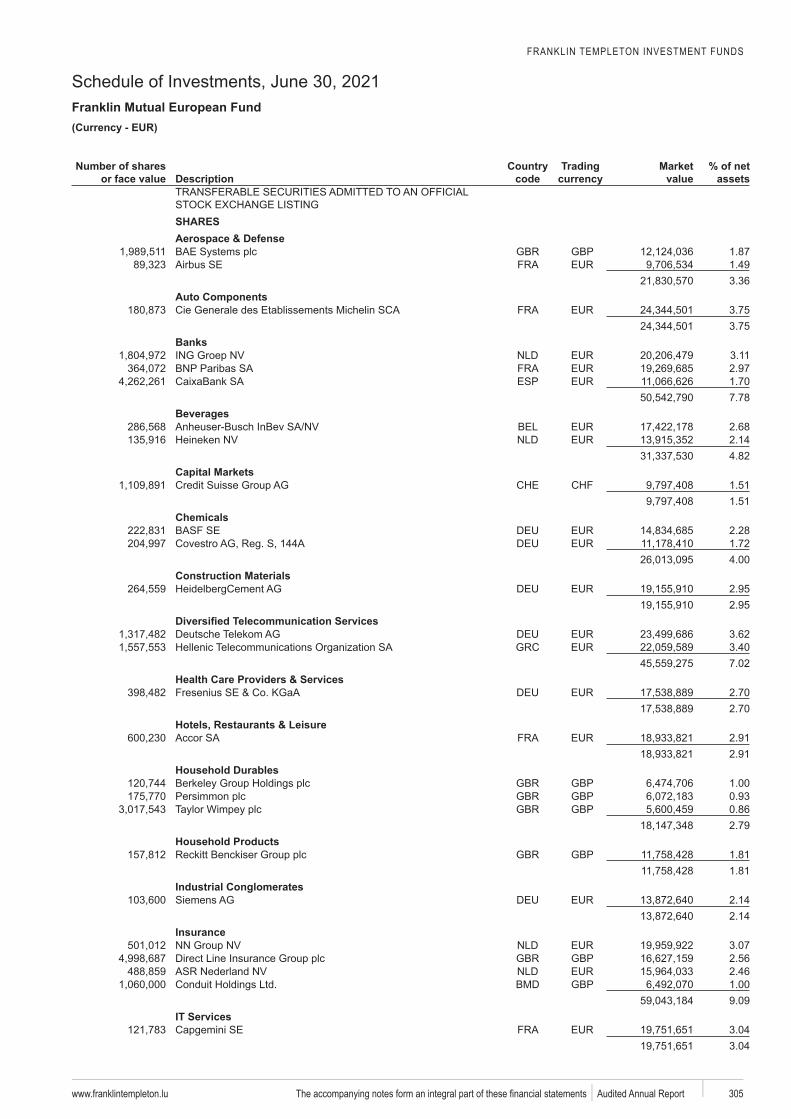
FRANKLIN TEMPLETON INVESTMENT FUNDS
Schedule of Investments, June 30, 2021Franklin Mutual European Fund
www.franklintempleton.lu 305 Audited Annual Report
EUR)
Number of shares or face value Description
code
Trading Market value
% of net assets
SHARESAerospace & Defense
GBP 1.871.493.36
Auto Components3.753.75
Banks3.112.97
ESP 1.707.78
Beverages2.682.144.82
Capital Markets1.511.51
Chemicals2.281.724.00
Construction Materials2.952.95
3.623.407.02
Health Care Providers & Services2.702.70
Hotels, Restaurants & Leisure2.912.91
Household DurablesGBP 1.00GBP 0.93GBP 0.86
2.79Household Products
GBP 1.811.81
Industrial Conglomerates2.142.14
Insurance3.07
GBP 2.562.46
GBP 1.009.09
IT Services3.043.04
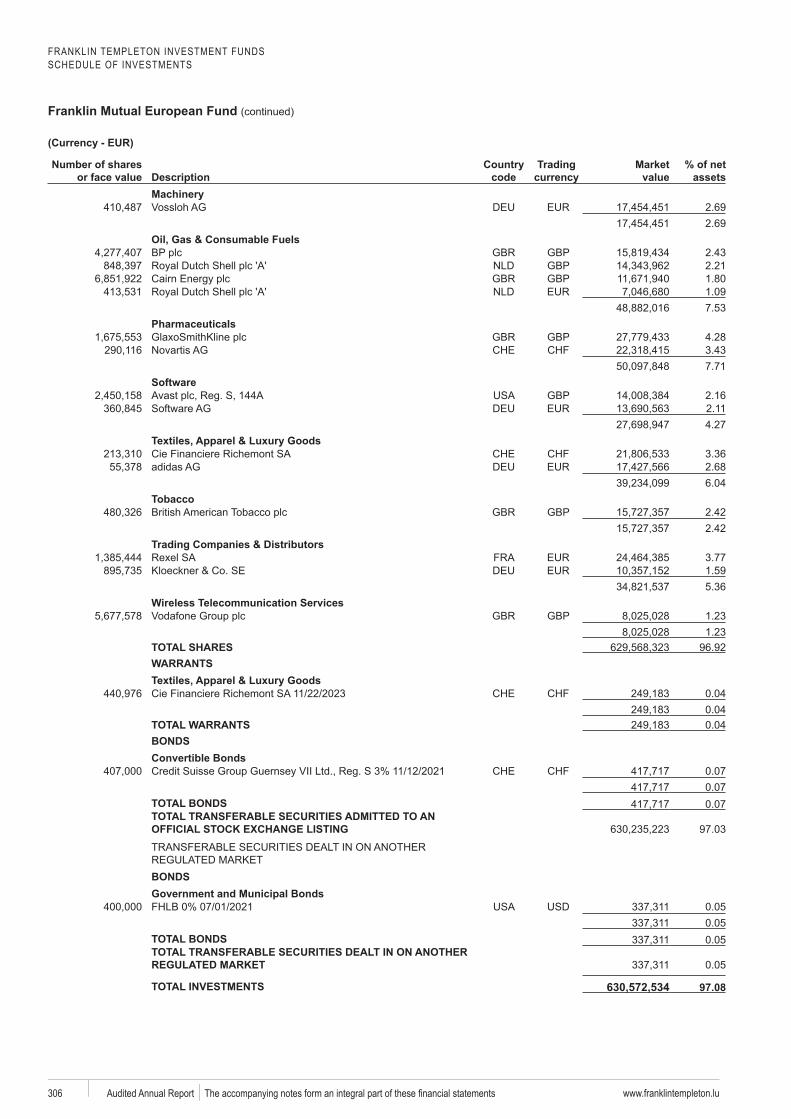
FRANKLIN TEMPLETON INVESTMENT FUNDSSCHEDULE OF INVESTMENTS
Franklin Mutual European Fund (continued)
www.franklintempleton.lu306 Audited Annual Report
Number of shares or face value Description
code
Trading Market value
% of net assets
2.692.69
Oil, Gas & Consumable FuelsGBP 2.43GBP 2.21GBP 1.80
1.097.53
PharmaceuticalsGBP 4.28
3.437.71
GBP 2.162.114.27
3.362.686.04
TobaccoGBP 2.42
2.42Trading Companies & Distributors
3.771.595.36
Wireless Telecommunication ServicesGBP 1.23
1.23TOTAL SHARES 96.92WARRANTS
0.040.04
TOTAL WARRANTS 0.04BONDSConvertible Bonds
0.070.07
TOTAL BONDS 0.07TOTAL TRANSFERABLE SECURITIES ADMITTED TO AN
97.03
BONDSGovernment and Municipal Bonds
0.050.05
TOTAL BONDS 0.05TOTAL TRANSFERABLE SECURITIES DEALT IN ON ANOTHER
0.05
TOTAL INVESTMENTS 630,572,534
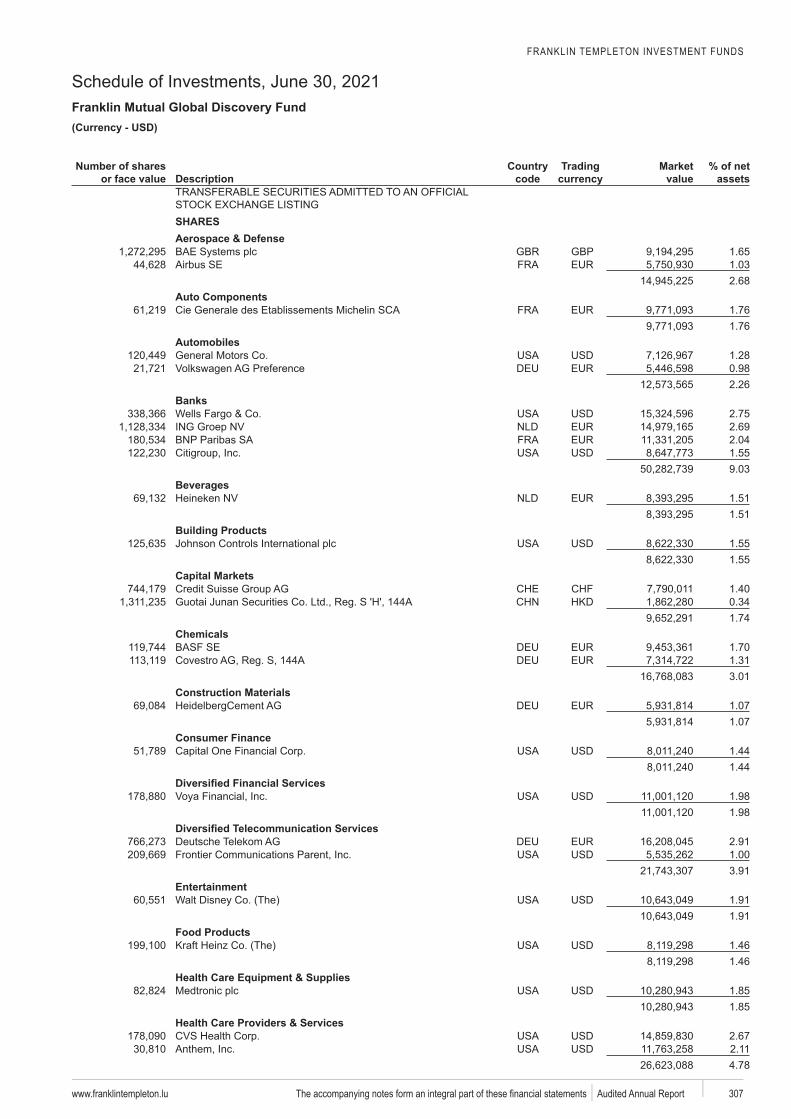
FRANKLIN TEMPLETON INVESTMENT FUNDS
Schedule of Investments, June 30, 2021Franklin Mutual Global Discovery Fund
www.franklintempleton.lu 307 Audited Annual Report
USD)
Number of shares or face value Description
code
Trading Market value
% of net assets
SHARESAerospace & Defense
GBP 1.651.032.68
Auto Components Generale des 1.76
1.76Automobiles
1.280.982.26
Banks2.752.692.041.559.03
Beverages1.511.51
Building Products1.551.55
Capital Markets1.40
Guotai Junan 0.341.74
Chemicals1.701.313.01
Construction Materials1.071.07
Consumer Finance1.441.44
1.981.98
2.911.003.91
Entertainment1.911.91
Food Products1.461.46
Health Care Equipment & Supplies1.851.85
Health Care Providers & Services2.672.114.78
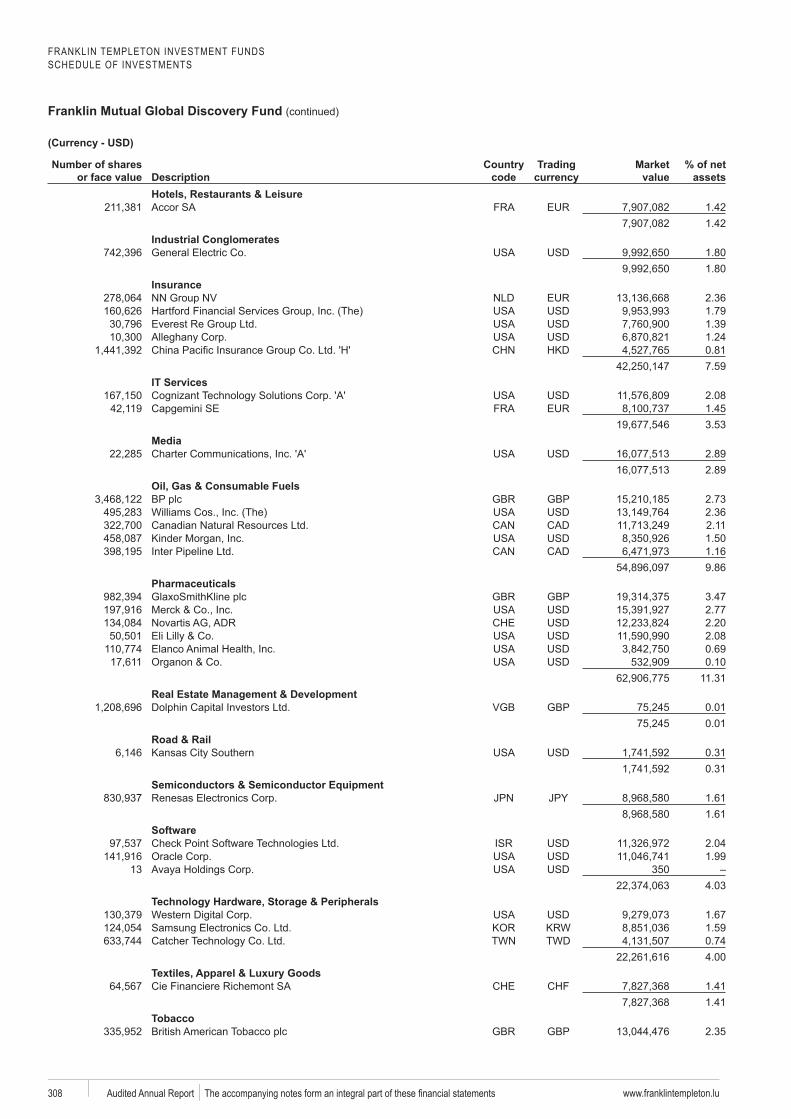
FRANKLIN TEMPLETON INVESTMENT FUNDSSCHEDULE OF INVESTMENTS
Franklin Mutual Global Discovery Fund (continued)
www.franklintempleton.lu308 Audited Annual Report
Number of shares or face value Description
code
Trading Market value
% of net assets
Hotels, Restaurants & Leisure1.421.42
Industrial Conglomerates1.801.80
Insurance2.361.791.391.240.817.59
IT Services2.08
SE 1.453.53
Media2.892.89
Oil, Gas & Consumable FuelsGBP 2.73
2.362.111.501.169.86
PharmaceuticalsGBP 3.47
2.772.202.080.690.10
11.31Real Estate Management & Development
GBP 0.010.01
Road & Rail0.310.31
Semiconductors & Semiconductor Equipment1.611.61
2.041.99
13 3504.03
1.671.59
TWD 0.744.00
Financiere 1.411.41
TobaccoGBP 2.35
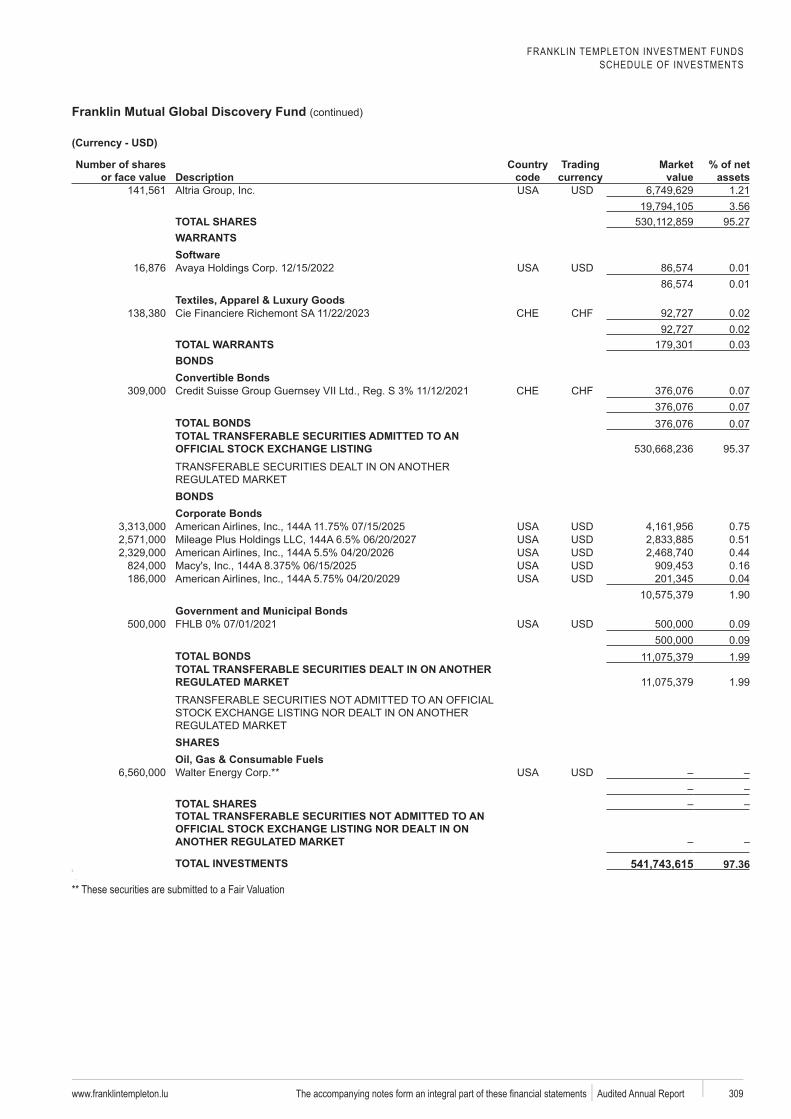
FRANKLIN TEMPLETON INVESTMENT FUNDSSCHEDULE OF INVESTMENTS
Franklin Mutual Global Discovery Fund (continued)
www.franklintempleton.lu 309 Audited Annual Report
Number of shares or face value Description
code
Trading Market value
% of net assets
1.213.56
TOTAL SHARES 95.27WARRANTS
0.010.01
Financiere 0.020.02
TOTAL WARRANTS 0.03BONDSConvertible Bonds
0.070.07
TOTAL BONDS 0.07TOTAL TRANSFERABLE SECURITIES ADMITTED TO AN
95.37
BONDSCorporate Bonds
0.750.510.440.160.041.90
Government and Municipal Bonds0.090.09
TOTAL BONDS 1.99TOTAL TRANSFERABLE SECURITIES DEALT IN ON ANOTHER
1.99
SHARESOil, Gas & Consumable Fuels
TOTAL SHARESTOTAL TRANSFERABLE SECURITIES NOT ADMITTED TO AN
TOTAL INVESTMENTS 541,743,615AAS
aa
** These securities are submitted to a Fair Valuation
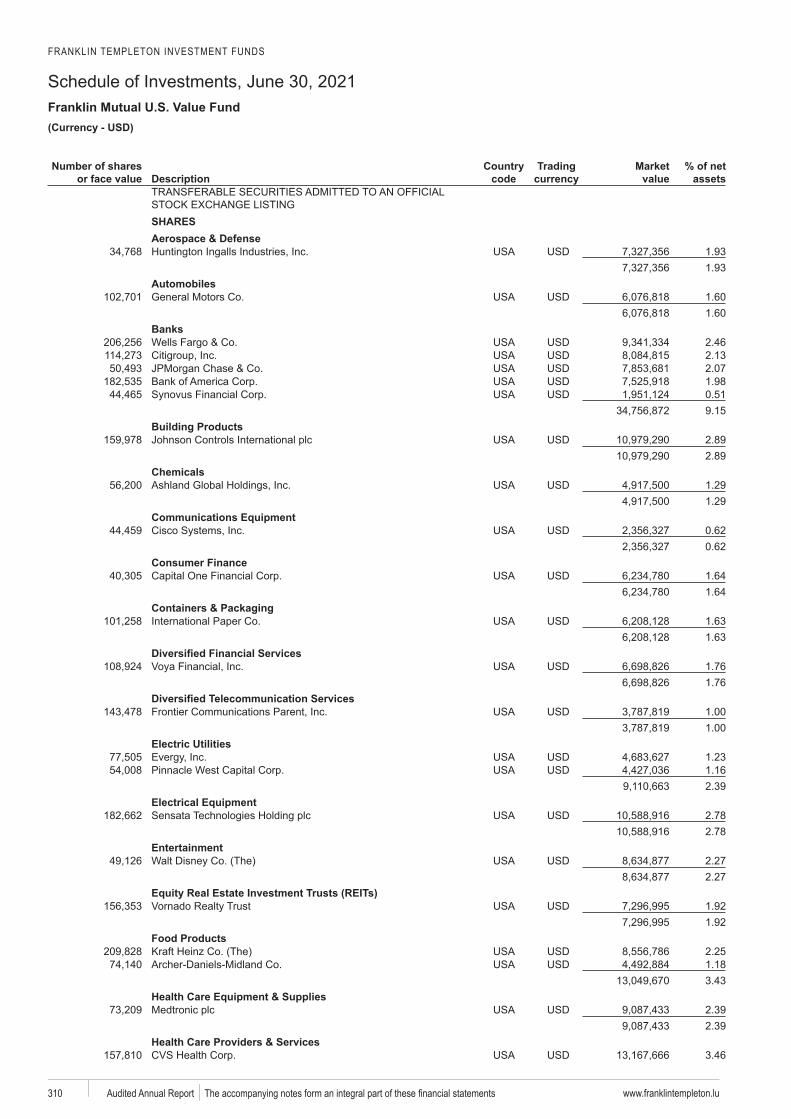
FRANKLIN TEMPLETON INVESTMENT FUNDS
Schedule of Investments, June 30, 2021Franklin Mutual U.S. Value Fund
www.franklintempleton.lu310 Audited Annual Report
USD)
Number of shares or face value Description
code
Trading Market value
% of net assets
SHARESAerospace & Defense
1.931.93
Automobiles1.601.60
Banks2.462.132.071.980.519.15
Building Products2.892.89
Chemicals1.291.29
Communications Equipment0.620.62
Consumer Finance1.641.64
Containers & Packaging1.631.63
1.761.76
1.001.00
Electric UtilitiesEvergy 1.23
1.162.39
Electrical EquipmentSensata 2.78
2.78Entertainment
2.272.27
1.921.92
Food Products2.251.183.43
Health Care Equipment & Supplies2.392.39
Health Care Providers & Services3.46
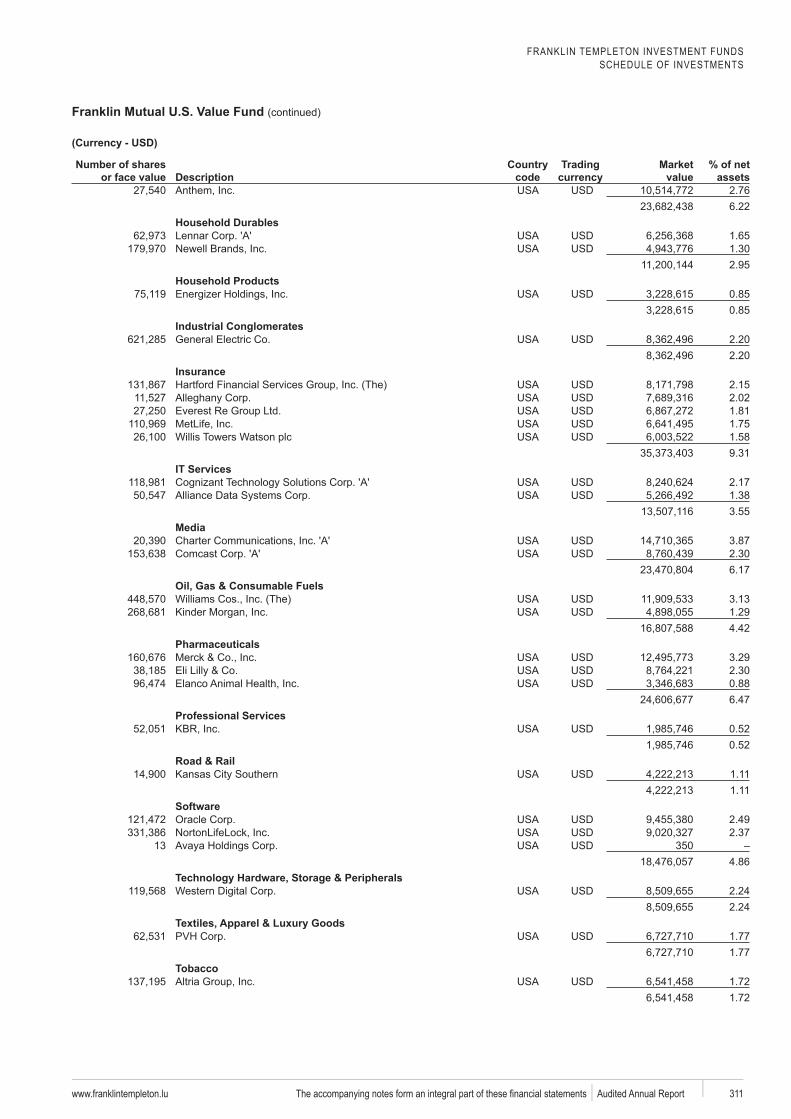
FRANKLIN TEMPLETON INVESTMENT FUNDSSCHEDULE OF INVESTMENTS
Franklin Mutual U.S. Value Fund (continued)
www.franklintempleton.lu 311 Audited Annual Report
Number of shares or face value Description
code
Trading Market value
% of net assets
2.766.22
Household Durables1.651.302.95
Household Products0.850.85
Industrial Conglomerates2.202.20
Insurance2.152.021.811.751.589.31
IT Services2.171.383.55
Media3.872.306.17
Oil, Gas & Consumable Fuels3.131.294.42
Pharmaceuticals3.292.300.886.47
Professional Services0.520.52
Road & Rail1.111.11
2.492.37
13 3504.86
2.242.24
1.771.77
Tobacco1.721.72
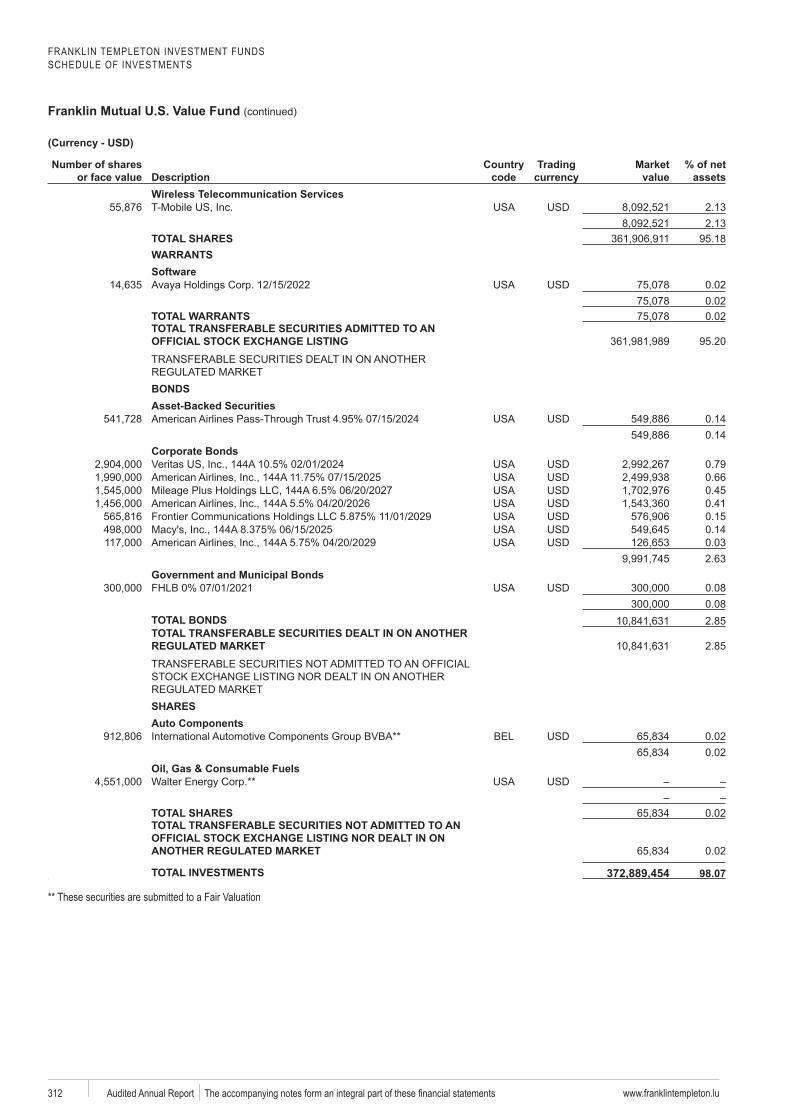
FRANKLIN TEMPLETON INVESTMENT FUNDSSCHEDULE OF INVESTMENTS
Franklin Mutual U.S. Value Fund (continued)
www.franklintempleton.lu312 Audited Annual Report
Number of shares or face value Description
code
Trading Market value
% of net assets
Wireless Telecommunication Services2.132.13
TOTAL SHARES 95.18WARRANTS
0.020.02
TOTAL WARRANTS 0.02TOTAL TRANSFERABLE SECURITIES ADMITTED TO AN
95.20
BONDSAsset-Backed Securities
0.140.14
Corporate Bonds0.790.660.450.410.150.140.032.63
Government and Municipal Bonds0.080.08
TOTAL BONDS 2.85TOTAL TRANSFERABLE SECURITIES DEALT IN ON ANOTHER
2.85
SHARESAuto Components
0.020.02
Oil, Gas & Consumable Fuels
TOTAL SHARES 0.02TOTAL TRANSFERABLE SECURITIES NOT ADMITTED TO AN
0.02
TOTAL INVESTMENTS 372,889,454A
a
** These securities are submitted to a Fair Valuation
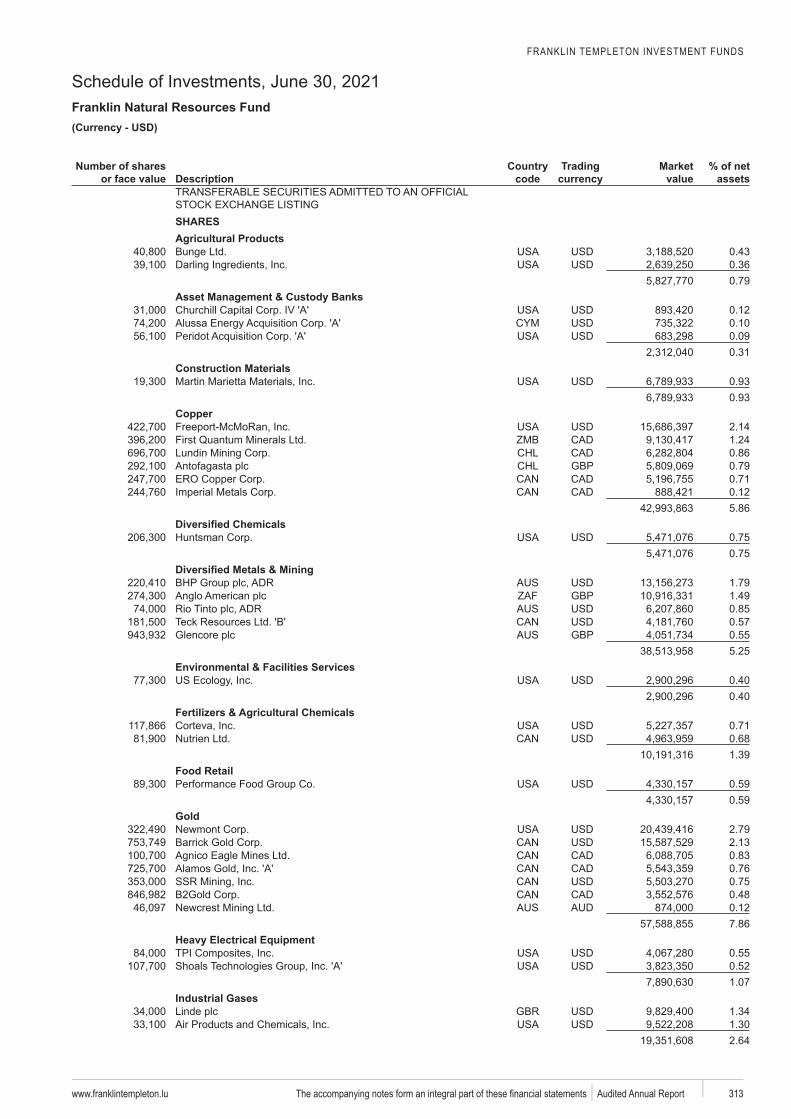
FRANKLIN TEMPLETON INVESTMENT FUNDS
Schedule of Investments, June 30, 2021Franklin Natural Resources Fund
www.franklintempleton.lu 313 Audited Annual Report
USD)
Number of shares or face value Description
code
Trading Market value
% of net assets
SHARESAgricultural Products
0.430.360.79
0.120.10
Peridot 0.090.31
Construction Materials0.930.93
Copper2.141.240.86
GBP 0.790.710.125.86
0.750.75
1.79GBP 1.49
0.850.57
GBP 0.555.25
Environmental & Facilities Services0.400.40
Fertilizers & Agricultural Chemicals0.710.681.39
Food Retail0.590.59
Gold2.792.130.830.760.750.480.127.86
0.550.521.07
Industrial Gases1.341.302.64
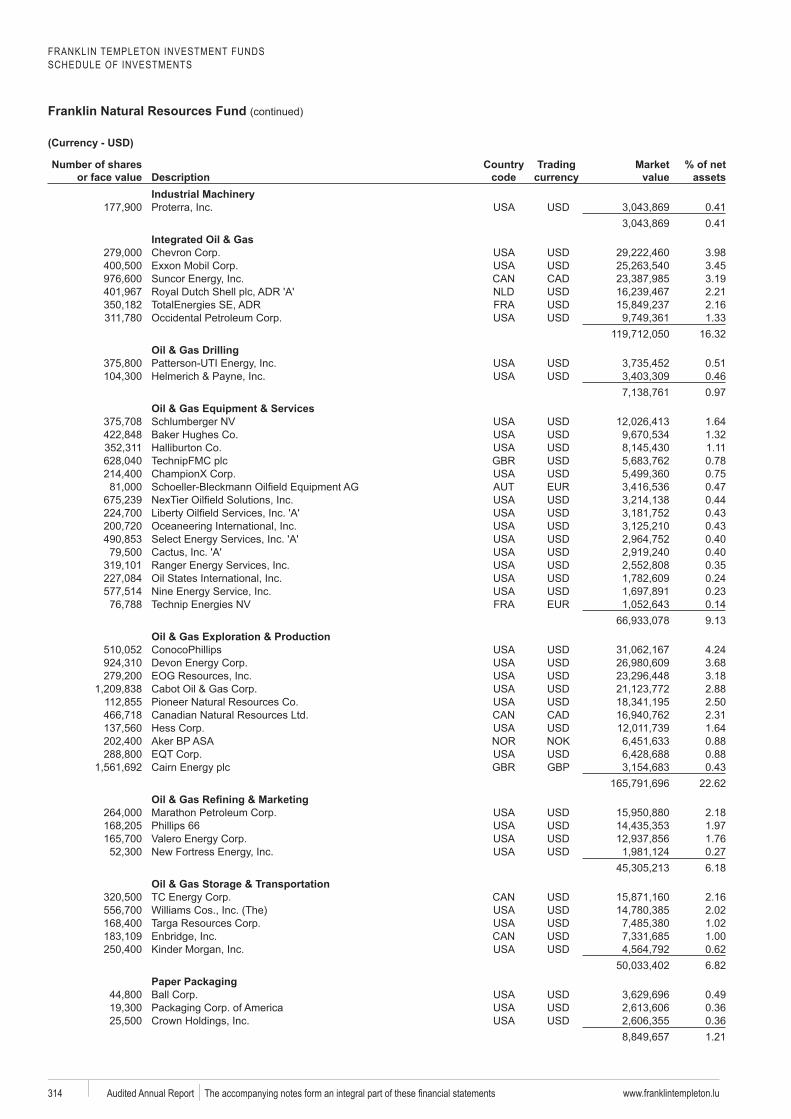
FRANKLIN TEMPLETON INVESTMENT FUNDSSCHEDULE OF INVESTMENTS
Franklin Natural Resources Fund (continued)
www.franklintempleton.lu314 Audited Annual Report
Number of shares or face value Description
code
Trading Market value
% of net assets
Proterra 0.410.41
Integrated Oil & Gas3.983.453.192.21
TotalEnergies 2.161.33
16.32Oil & Gas Drilling
0.510.460.97
Oil & Gas Equipment & Services1.641.321.110.780.750.470.440.430.430.400.400.350.240.230.149.13
Oil & Gas Exploration & Production4.243.683.182.882.502.311.640.880.88
GBP 0.4322.62
2.181.971.760.276.18
Oil & Gas Storage & Transportation2.162.021.021.000.626.82
Paper Packaging0.490.360.361.21
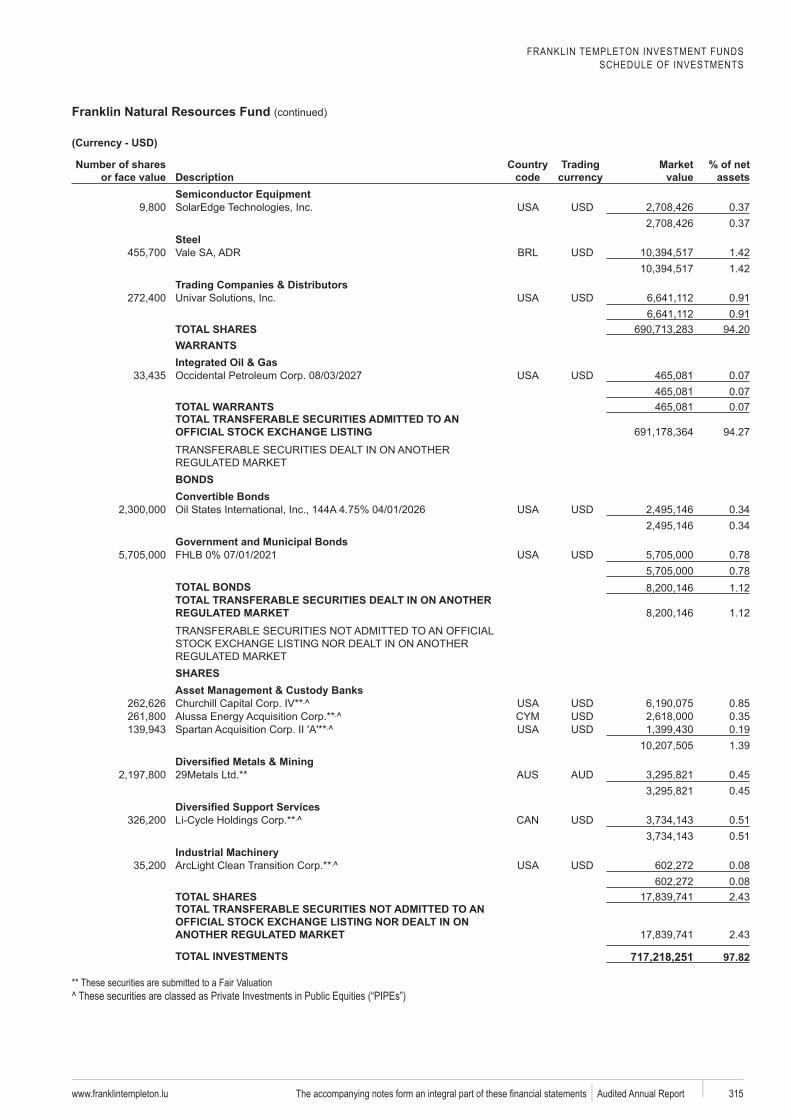
FRANKLIN TEMPLETON INVESTMENT FUNDSSCHEDULE OF INVESTMENTS
Franklin Natural Resources Fund (continued)
www.franklintempleton.lu 315 Audited Annual Report
Number of shares or face value Description
code
Trading Market value
% of net assets
Semiconductor EquipmentSolarEdge 0.37
0.37Steel
1.421.42
Trading Companies & Distributors0.910.91
TOTAL SHARES 94.20WARRANTSIntegrated Oil & Gas
0.070.07
TOTAL WARRANTS 0.07TOTAL TRANSFERABLE SECURITIES ADMITTED TO AN
94.27
BONDSConvertible Bonds
0.340.34
Government and Municipal Bonds0.780.78
TOTAL BONDS 1.12TOTAL TRANSFERABLE SECURITIES DEALT IN ON ANOTHER
1.12
SHARES
0.850.350.191.39
0.450.45
0.510.51
0.080.08
TOTAL SHARES 2.43TOTAL TRANSFERABLE SECURITIES NOT ADMITTED TO AN
2.43
TOTAL INVESTMENTS 717,218,251a** These securities are submitted to a Fair Valuation^ These securities are classed as Private Investments in Public Equities (“PIPEs”)
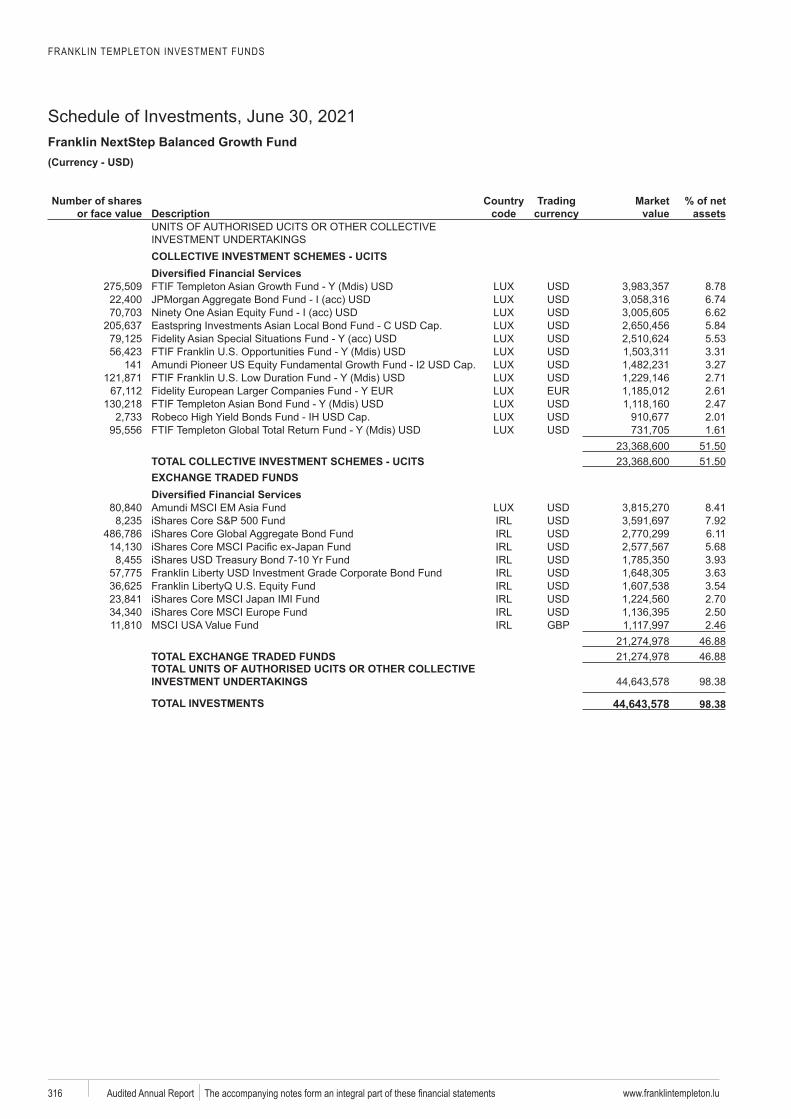
FRANKLIN TEMPLETON INVESTMENT FUNDS
Schedule of Investments, June 30, 2021Franklin NextStep Balanced Growth Fund
www.franklintempleton.lu316 Audited Annual Report
USD)
Number of shares or face value Description
code
Trading Market value
% of net assets
COLLECTIVE INVESTMENT SCHEMES - UCITS
8.786.746.625.845.533.31
141 3.272.712.612.472.011.61
51.50TOTAL COLLECTIVE INVESTMENT SCHEMES - UCITS 51.50EXCHANGE TRADED FUNDS
8.417.926.115.683.933.633.542.702.50
GBP 2.4646.88
TOTAL EXCHANGE TRADED FUNDS 46.88TOTAL UNITS OF AUTHORISED UCITS OR OTHER COLLECTIVE
98.38
TOTAL INVESTMENTS 44,643,578
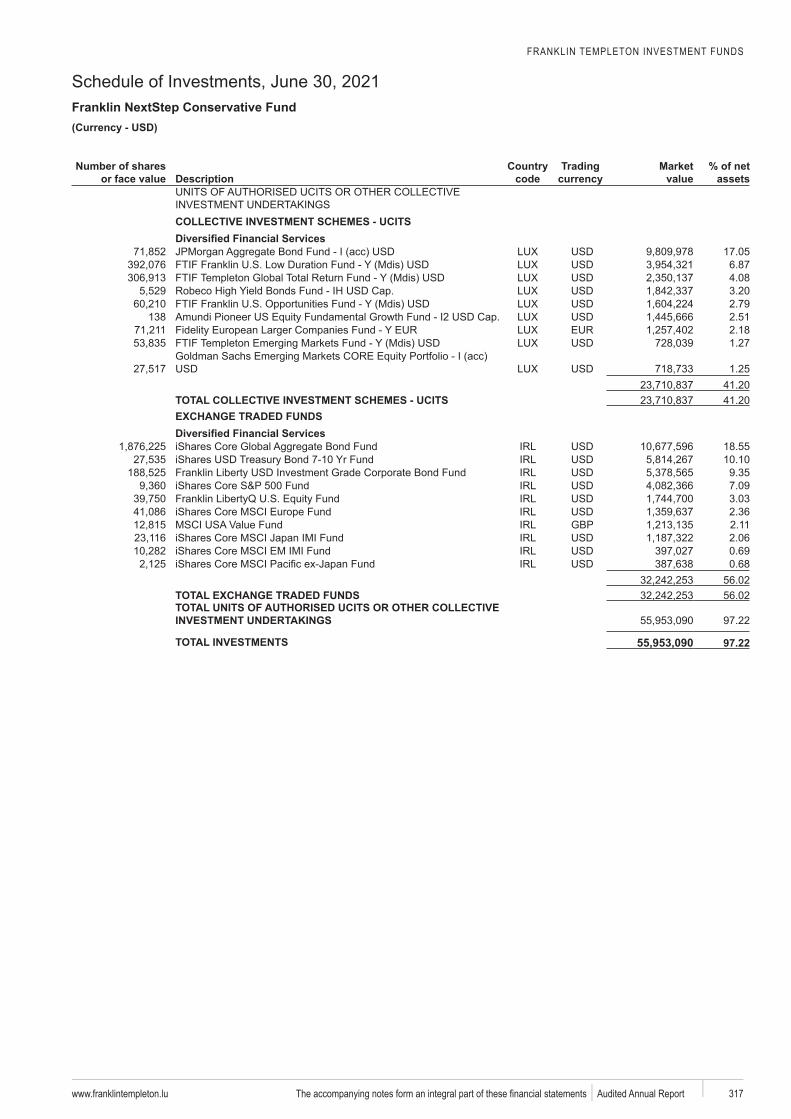
FRANKLIN TEMPLETON INVESTMENT FUNDS
Schedule of Investments, June 30, 2021Franklin NextStep Conservative Fund
www.franklintempleton.lu 317 Audited Annual Report
(C USD)
Number of shares or face value Description
code
Trading Market value
% of net assets
COLLECTIVE INVESTMENT SCHEMES - UCITS
acc 17.056.874.083.202.79
138 2.512.181.27
acc1.25
41.20TOTAL COLLECTIVE INVESTMENT SCHEMES - UCITS 41.20EXCHANGE TRADED FUNDS
iShares 18.55iShares Fund 10.10
9.35iShares 7.09Franklin 3.03iShares 2.36
GBP 2.11iShares 2.06iShares 0.69iShares 0.68
56.02TOTAL EXCHANGE TRADED FUNDS 56.02TOTAL UNITS OF AUTHORISED UCITS OR OTHER COLLECTIVE
97.22
TOTAL INVESTMENTS 55,953,090
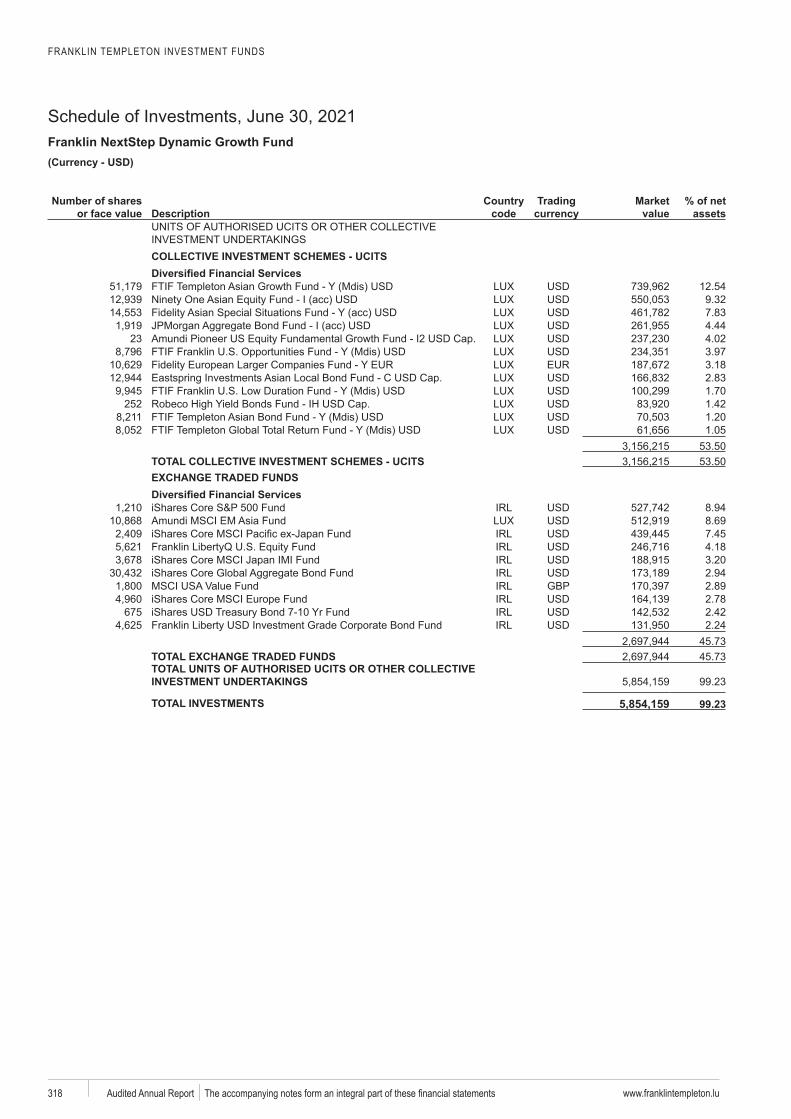
FRANKLIN TEMPLETON INVESTMENT FUNDS
Schedule of Investments, June 30, 2021Franklin NextStep Dynamic Growth Fund
www.franklintempleton.lu318 Audited Annual Report
USD)
Number of shares or face value Description
code
Trading Market value
% of net assets
COLLECTIVE INVESTMENT SCHEMES - UCITS
12.54acc 9.32
acc 7.83acc 4.44
23 4.023.973.182.831.70
252 1.421.201.05
53.50TOTAL COLLECTIVE INVESTMENT SCHEMES - UCITS 53.50EXCHANGE TRADED FUNDS
iShares 8.948.69
iShares 7.45Franklin 4.18iShares 3.20iShares 2.94
GBP 2.89iShares 2.78
675 iShares Fund 2.422.24
45.73TOTAL EXCHANGE TRADED FUNDS 45.73TOTAL UNITS OF AUTHORISED UCITS OR OTHER COLLECTIVE
99.23
TOTAL INVESTMENTS 5,854,159
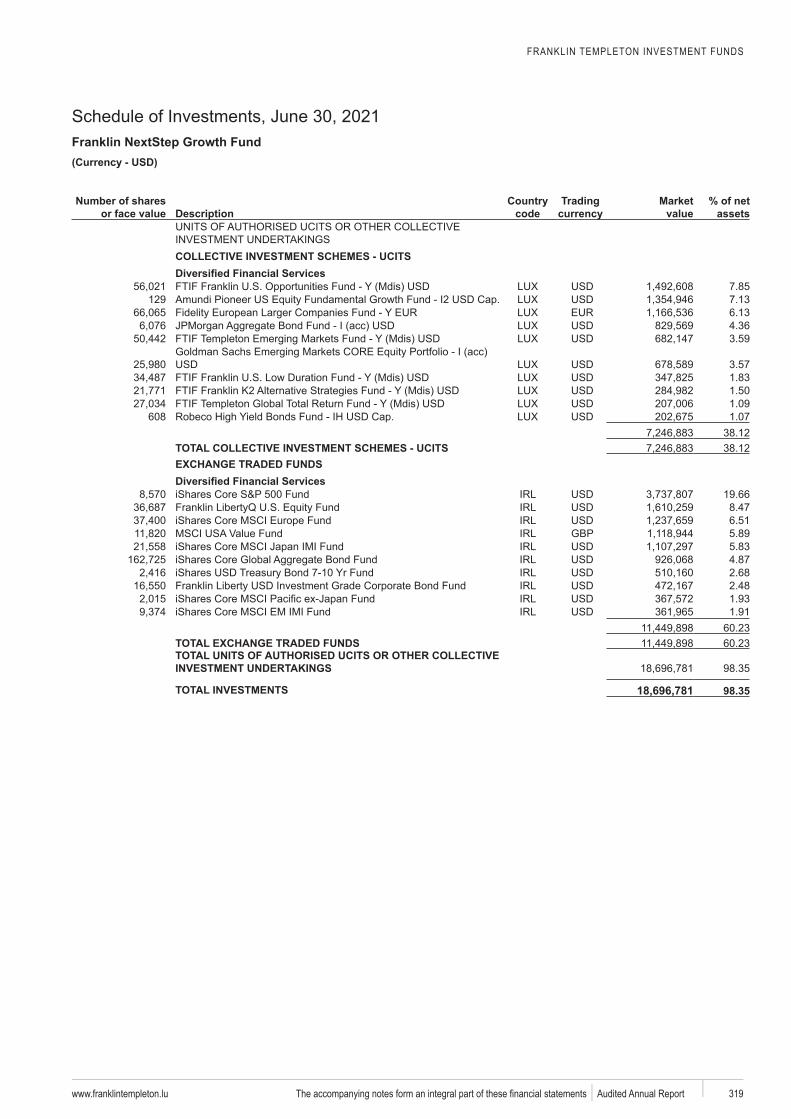
FRANKLIN TEMPLETON INVESTMENT FUNDS
Schedule of Investments, June 30, 2021Franklin NextStep Growth Fund
www.franklintempleton.lu 319 Audited Annual Report
USD)
Number of shares or face value Description
code
Trading Market value
% of net assets
COLLECTIVE INVESTMENT SCHEMES - UCITS
7.85129 7.13
6.13acc 4.36
3.59acc
3.571.831.501.09
608 1.0738.12
TOTAL COLLECTIVE INVESTMENT SCHEMES - UCITS 38.12EXCHANGE TRADED FUNDS
iShares 19.66Franklin 8.47iShares 6.51
GBP 5.89iShares 5.83iShares 4.87iShares Fund 2.68
2.48iShares 1.93iShares 1.91
60.23TOTAL EXCHANGE TRADED FUNDS 60.23TOTAL UNITS OF AUTHORISED UCITS OR OTHER COLLECTIVE
98.35
TOTAL INVESTMENTS 18,696,781
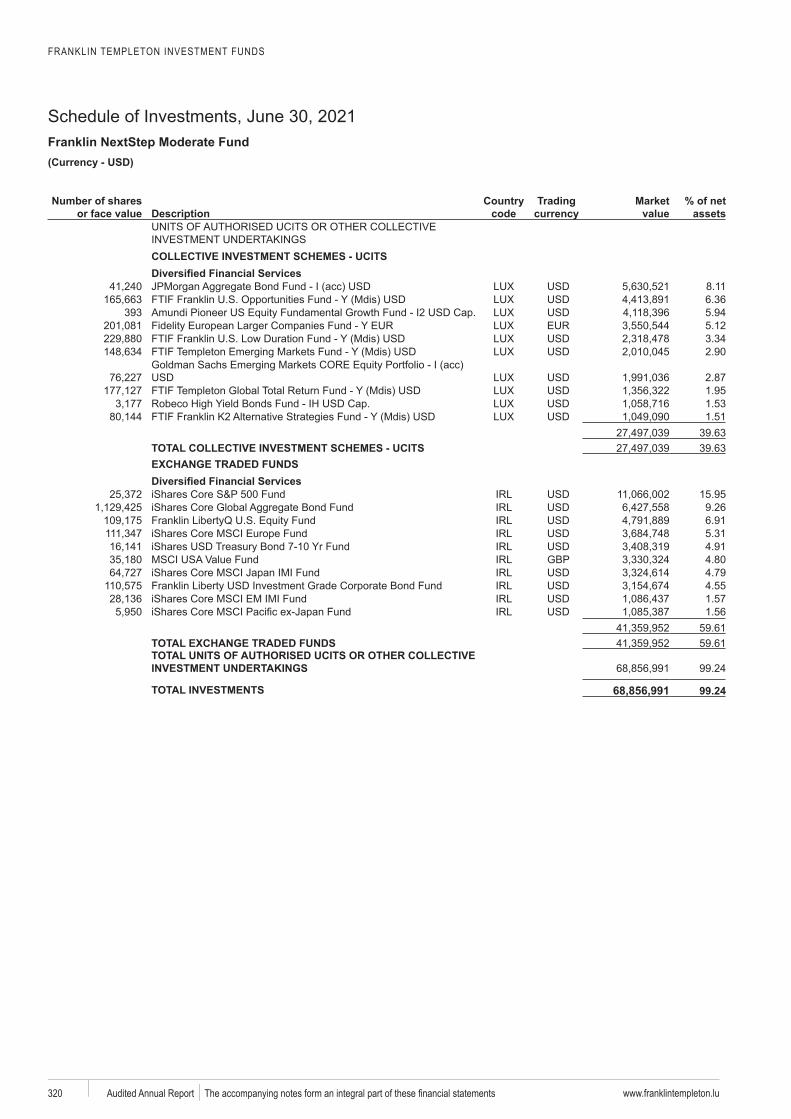
FRANKLIN TEMPLETON INVESTMENT FUNDS
Schedule of Investments, June 30, 2021Franklin NextStep Moderate Fund
www.franklintempleton.lu320 Audited Annual Report
USD)
Number of shares or face value Description
code
Trading Market value
% of net assets
COLLECTIVE INVESTMENT SCHEMES - UCITS
acc 8.116.36
393 5.945.123.342.90
acc2.871.951.531.51
39.63TOTAL COLLECTIVE INVESTMENT SCHEMES - UCITS 39.63EXCHANGE TRADED FUNDS
iShares 15.95iShares 9.26Franklin 6.91iShares 5.31iShares Fund 4.91
GBP 4.80iShares 4.79
4.55iShares 1.57iShares 1.56
59.61TOTAL EXCHANGE TRADED FUNDS 59.61TOTAL UNITS OF AUTHORISED UCITS OR OTHER COLLECTIVE
99.24
TOTAL INVESTMENTS 68,856,991
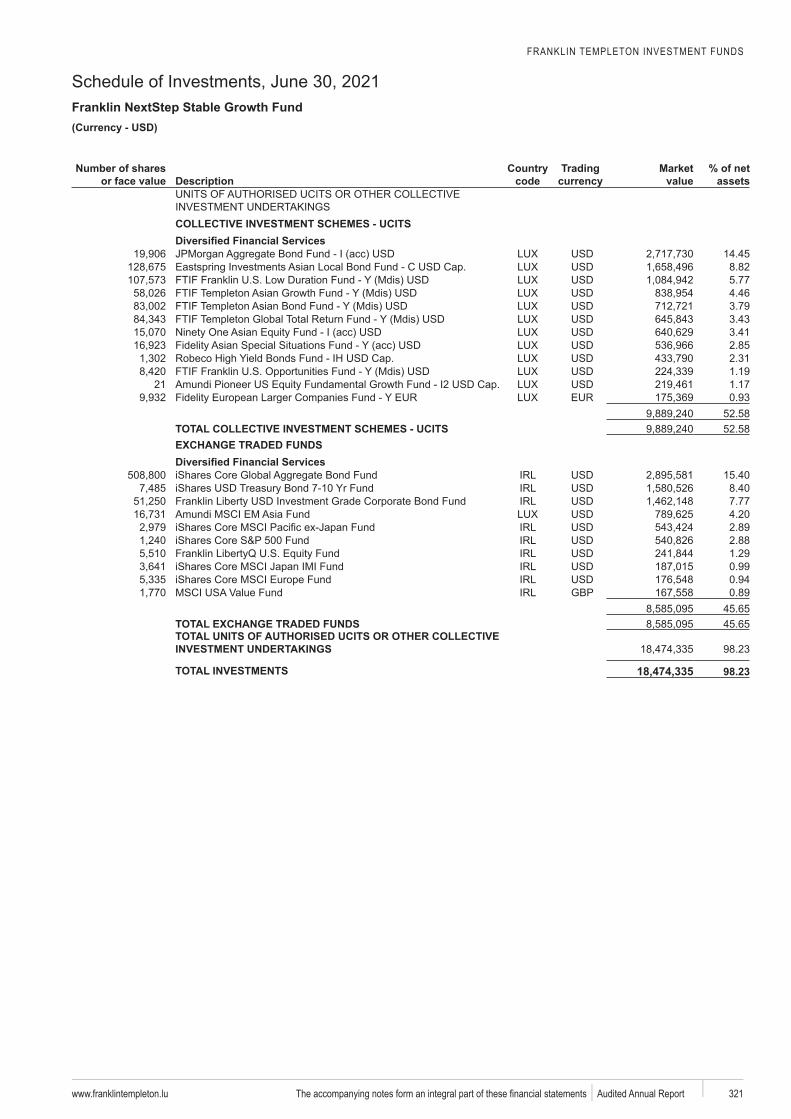
FRANKLIN TEMPLETON INVESTMENT FUNDS
Schedule of Investments, June 30, 2021Franklin NextStep Stable Growth Fund
www.franklintempleton.lu 321 Audited Annual Report
USD)
Number of shares or face value Description
code
Trading Market value
% of net assets
COLLECTIVE INVESTMENT SCHEMES - UCITS
acc 14.458.825.774.463.793.43
acc 3.41acc 2.85
2.311.19
21 1.170.93
52.58TOTAL COLLECTIVE INVESTMENT SCHEMES - UCITS 52.58EXCHANGE TRADED FUNDS
iShares 15.40iShares Fund 8.40
7.774.20
iShares 2.89iShares 2.88Franklin 1.29iShares 0.99iShares 0.94
GBP 0.8945.65
TOTAL EXCHANGE TRADED FUNDS 45.65TOTAL UNITS OF AUTHORISED UCITS OR OTHER COLLECTIVE
98.23
TOTAL INVESTMENTS 18,474,335
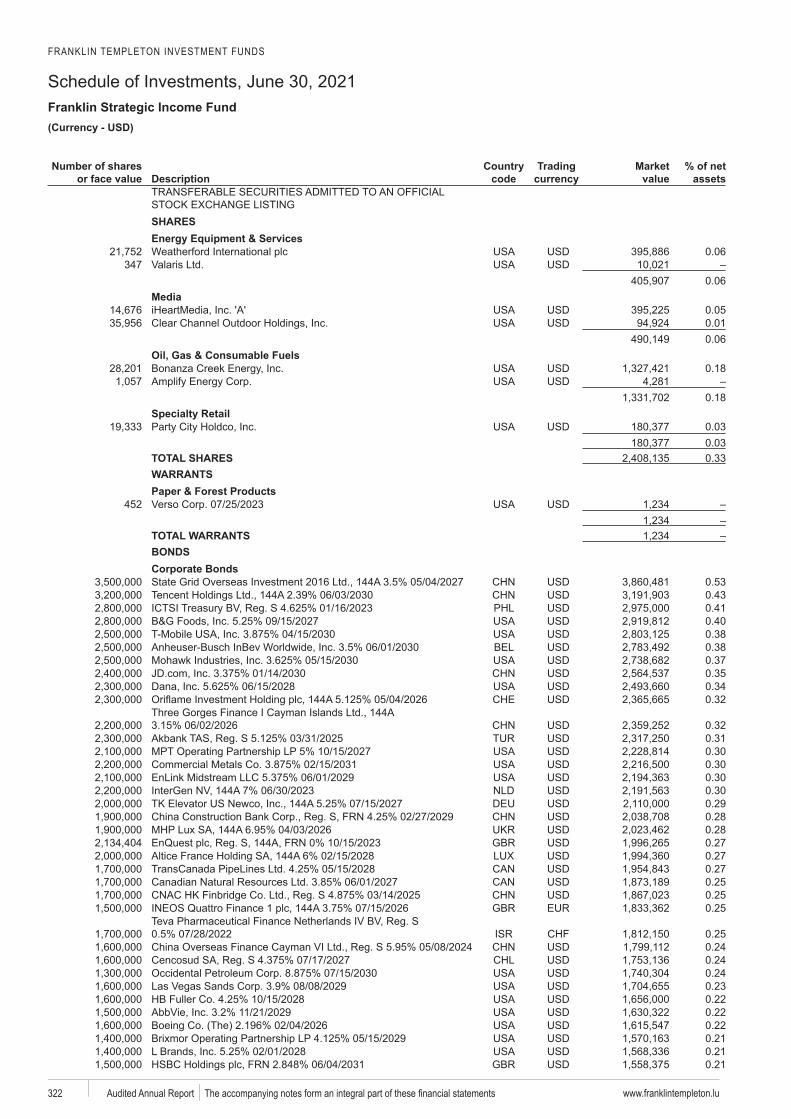
FRANKLIN TEMPLETON INVESTMENT FUNDS
Schedule of Investments, June 30, 2021Franklin Strategic Income Fund
www.franklintempleton.lu322 Audited Annual Report
USD)
Number of shares or face value Description
code
Trading Market value
% of net assets
SHARES
0.06347
0.06Media
0.050.010.06
Oil, Gas & Consumable Fuels0.18
0.18
0.030.03
TOTAL SHARES 0.33WARRANTSPaper & Forest Products
452
TOTAL WARRANTSBONDSCorporate Bonds
0.53Tencent 0.43
0.410.400.380.380.370.350.340.32
0.320.310.300.300.300.300.290.280.280.270.270.270.250.250.25
Teva0.250.240.240.240.230.220.220.220.210.210.21
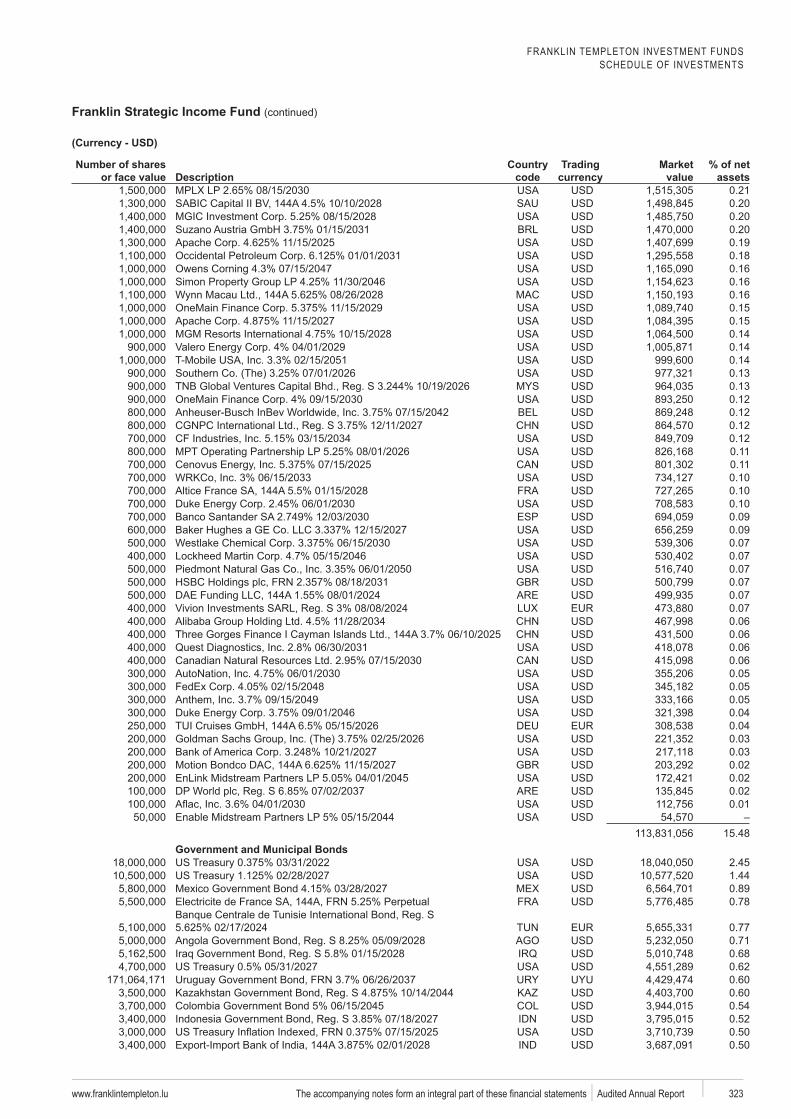
FRANKLIN TEMPLETON INVESTMENT FUNDSSCHEDULE OF INVESTMENTS
Franklin Strategic Income Fund (continued)
www.franklintempleton.lu 323 Audited Annual Report
Number of shares or face value Description
code
Trading Market value
% of net assets
0.210.200.200.200.190.180.160.160.160.150.150.140.140.140.130.130.120.120.120.120.110.110.100.100.10
ESP 0.090.090.070.070.070.070.070.070.060.060.060.060.050.050.050.040.040.030.03
Bondco 0.020.020.020.01
15.48Government and Municipal Bonds
2.451.440.89
Electricite 0.78Tunisie
0.770.710.680.620.600.600.540.520.500.50
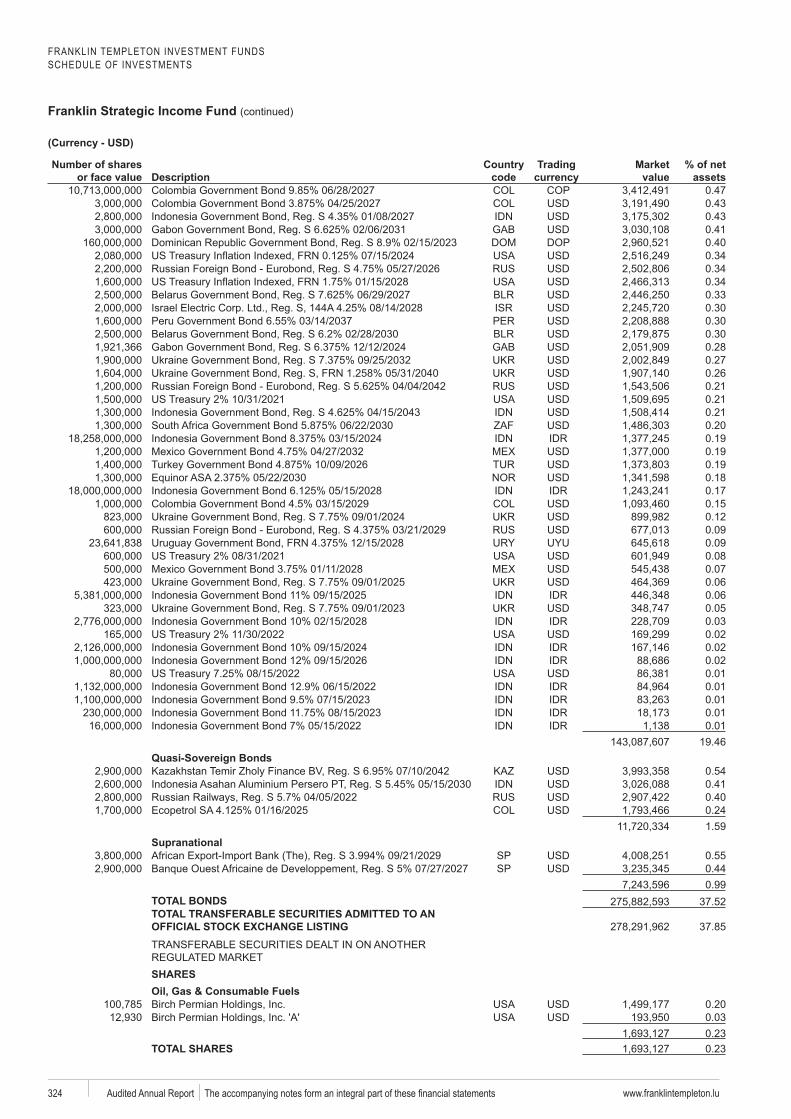
FRANKLIN TEMPLETON INVESTMENT FUNDSSCHEDULE OF INVESTMENTS
Franklin Strategic Income Fund (continued)
www.franklintempleton.lu324 Audited Annual Report
Number of shares or face value Description
code
Trading Market value
% of net assets
0.470.430.430.410.400.340.340.340.330.300.300.300.280.270.260.210.210.210.200.190.190.190.180.170.150.120.090.090.080.070.060.060.050.030.020.020.020.010.010.010.010.01
19.46Quasi-Sovereign Bonds
Zholy 0.54 Persero 0.41
0.400.241.59
SupranationalSP 0.55
de SP 0.440.99
TOTAL BONDS 37.52TOTAL TRANSFERABLE SECURITIES ADMITTED TO AN
37.85
SHARESOil, Gas & Consumable Fuels
0.200.030.23
TOTAL SHARES 0.23
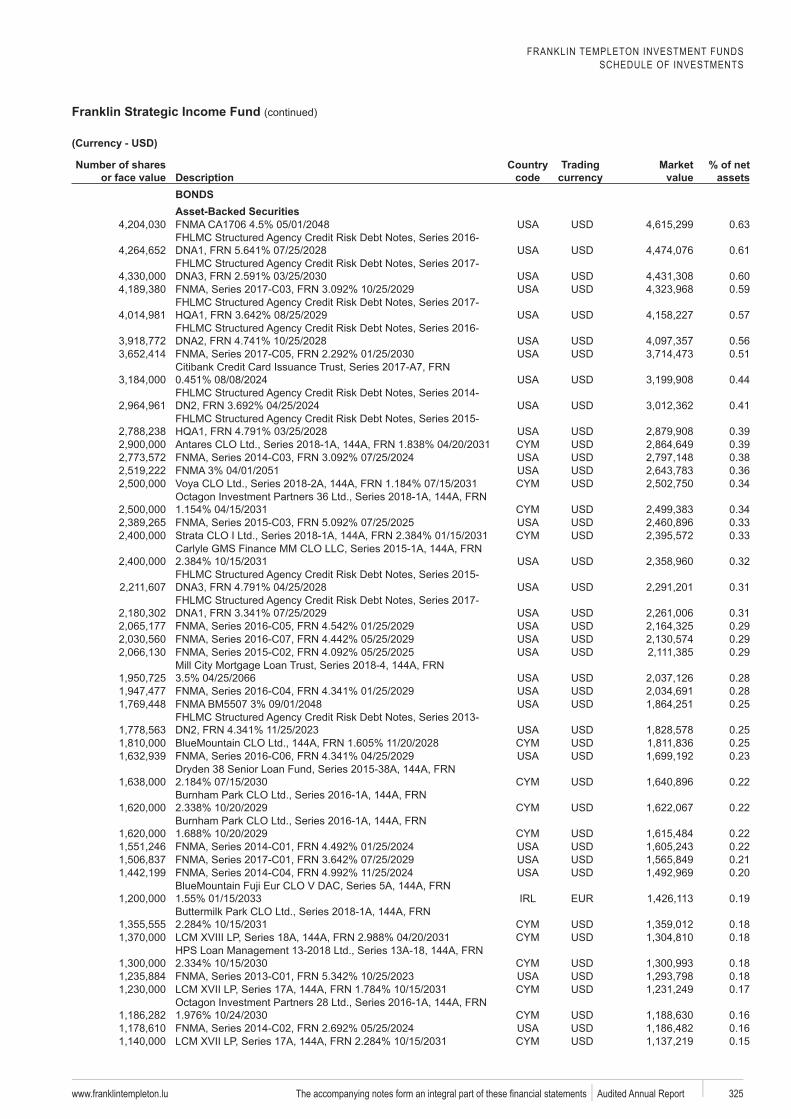
FRANKLIN TEMPLETON INVESTMENT FUNDSSCHEDULE OF INVESTMENTS
Franklin Strategic Income Fund (continued)
www.franklintempleton.lu 325 Audited Annual Report
Number of shares or face value Description
code
Trading Market value
% of net assets
BONDSAsset-Backed Securities
0.63
0.61
0.600.59
0.57
0.560.51
0.44
0.41
0.390.390.380.360.34
0.340.330.33
0.32
0.31
0.310.290.290.29
0.280.280.25
0.250.250.23
0.22
0.22
0.220.220.210.20
Eur0.19
0.180.18
0.180.180.17
0.160.160.15
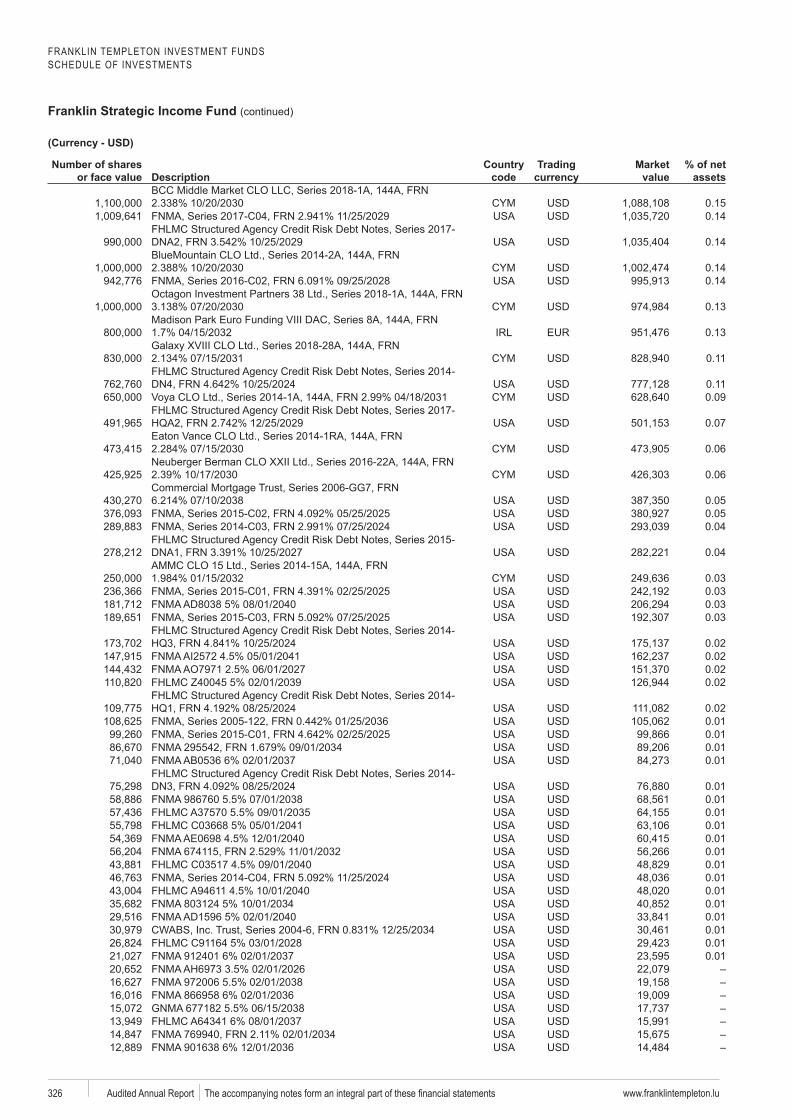
FRANKLIN TEMPLETON INVESTMENT FUNDSSCHEDULE OF INVESTMENTS
Franklin Strategic Income Fund (continued)
www.franklintempleton.lu326 Audited Annual Report
Number of shares or face value Description
code
Trading Market value
% of net assets
0.150.14
0.14
0.140.14
0.13
0.13
0.11
0.110.09
0.07
0.06
0.06
0.050.050.04
0.04
0.030.030.030.03
0.020.020.020.02
0.020.010.010.010.01
0.010.010.010.010.010.010.010.010.010.010.010.010.010.01
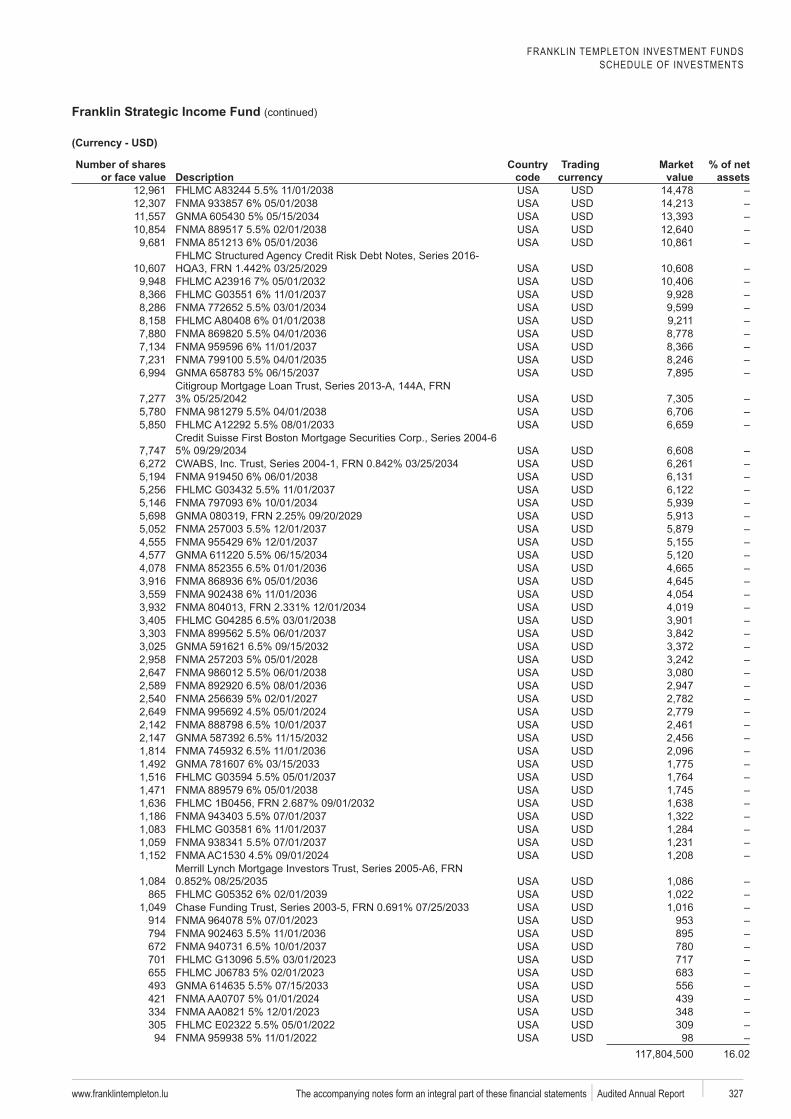
FRANKLIN TEMPLETON INVESTMENT FUNDSSCHEDULE OF INVESTMENTS
Franklin Strategic Income Fund (continued)
www.franklintempleton.lu 327 Audited Annual Report
Number of shares or face value Description
code
Trading Market value
% of net assets
865
914 953794 895672 780701 717655 683493 556421 439334 348305 30994 98
16.02
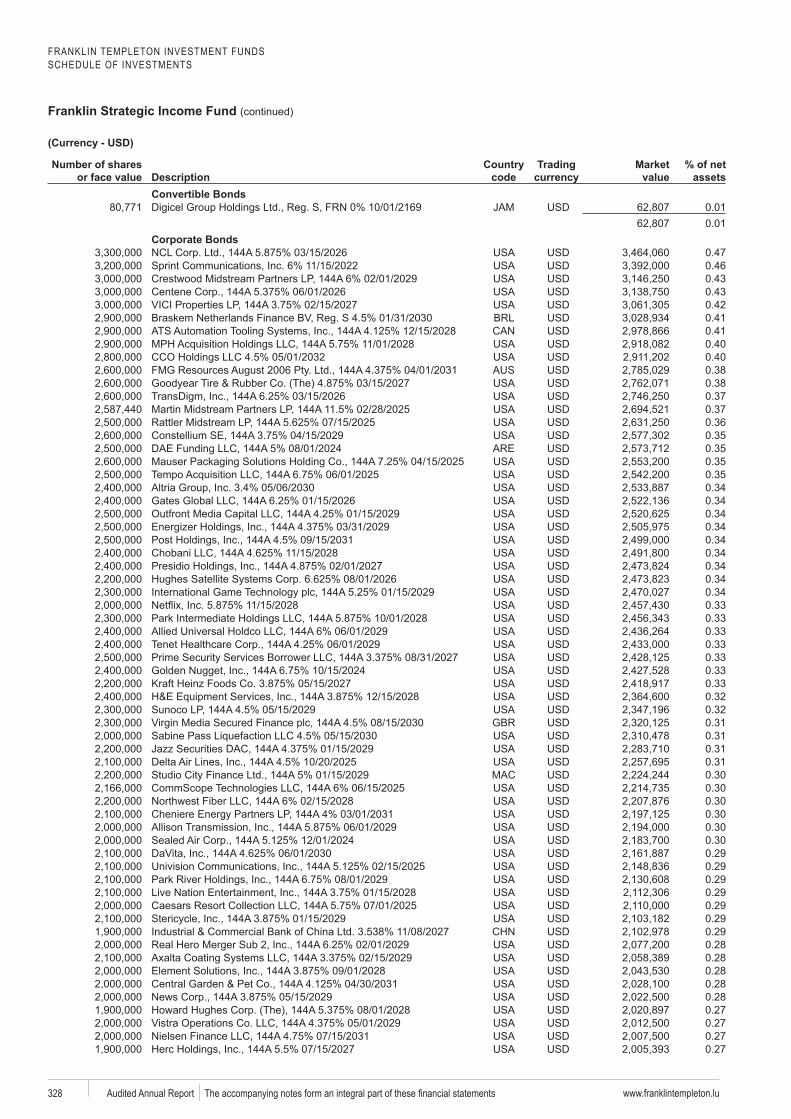
FRANKLIN TEMPLETON INVESTMENT FUNDSSCHEDULE OF INVESTMENTS
Franklin Strategic Income Fund (continued)
www.franklintempleton.lu328 Audited Annual Report
Number of shares or face value Description
code
Trading Market value
% of net assets
Convertible BondsDigicel 0.01
0.01Corporate Bonds
0.470.460.430.430.420.410.410.400.400.380.380.370.370.360.350.350.350.350.340.340.340.340.340.340.340.340.340.330.330.330.330.330.330.330.320.320.310.310.310.310.300.300.300.300.300.300.290.290.290.290.290.290.290.280.280.280.280.280.270.270.270.27
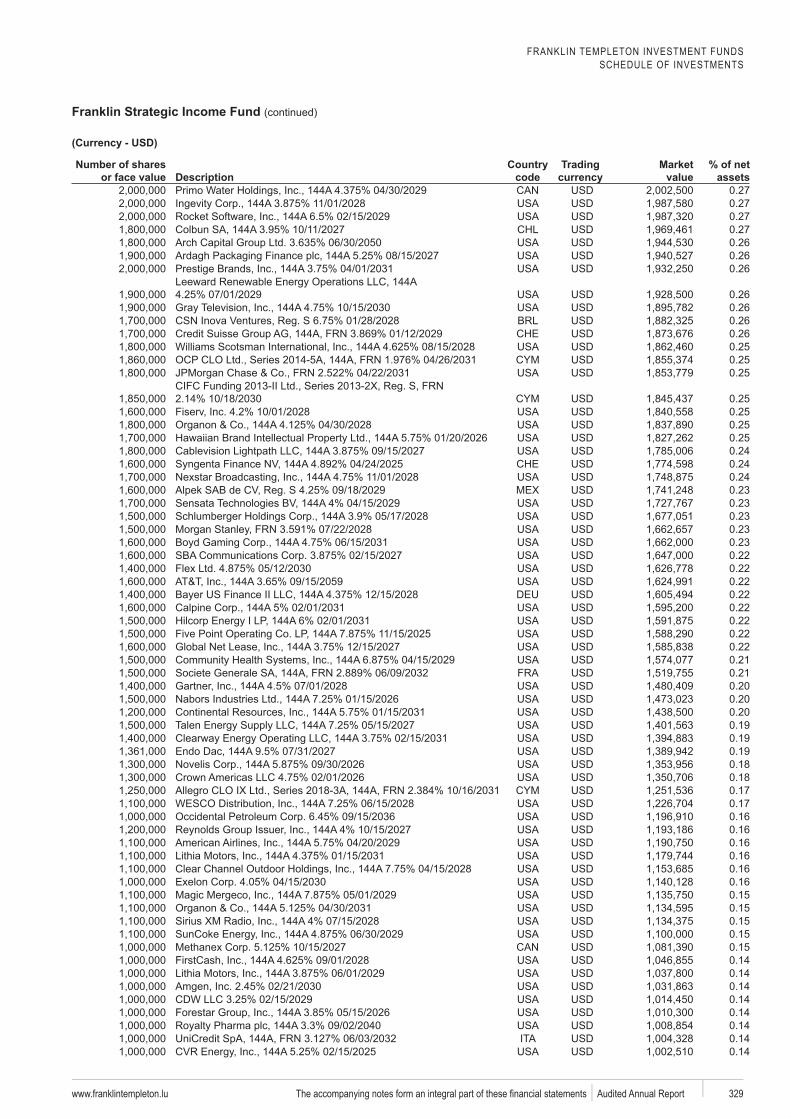
FRANKLIN TEMPLETON INVESTMENT FUNDSSCHEDULE OF INVESTMENTS
Franklin Strategic Income Fund (continued)
www.franklintempleton.lu 329 Audited Annual Report
Number of shares or face value Description
code
Trading Market value
% of net assets
0.270.270.270.270.260.260.26
0.260.260.260.260.250.250.25
0.250.250.250.250.240.240.240.23
Sensata 0.230.230.230.230.220.220.220.220.220.220.220.220.21
Societe Generale 0.210.200.200.200.190.19
Endo Dac 0.190.180.180.170.170.160.160.160.160.160.160.150.150.150.150.150.140.140.140.14
Forestar 0.140.14
0.140.14
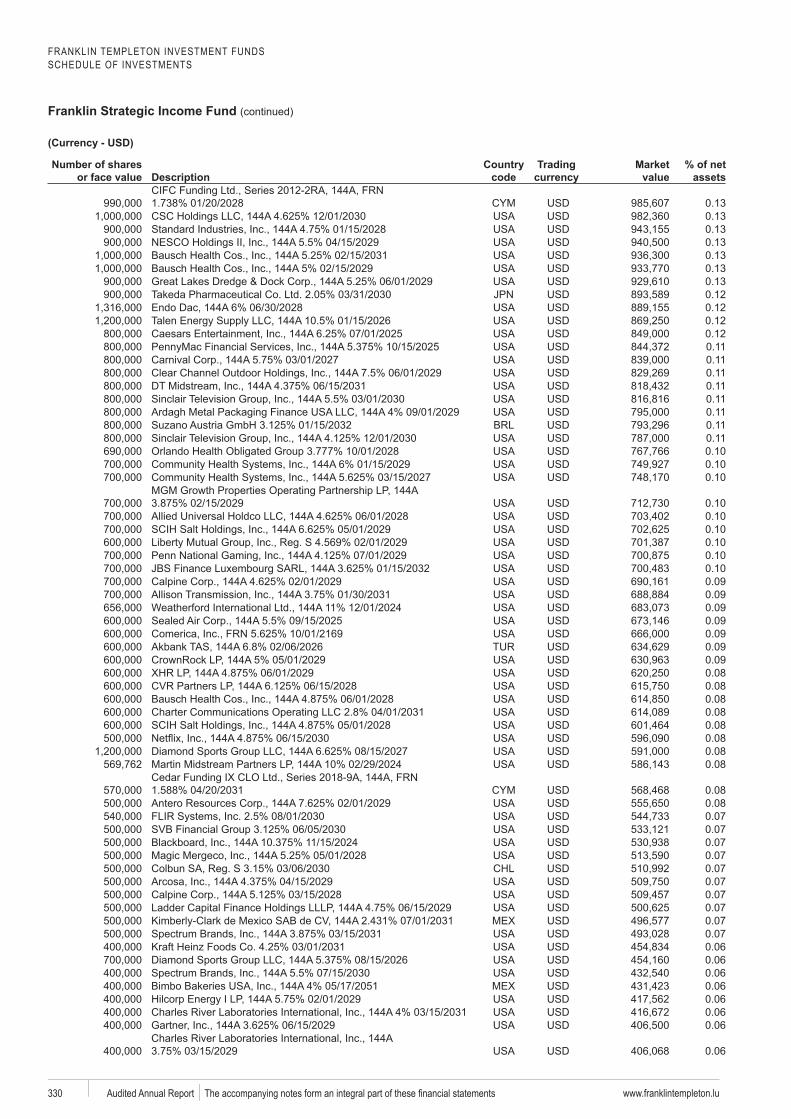
FRANKLIN TEMPLETON INVESTMENT FUNDSSCHEDULE OF INVESTMENTS
Franklin Strategic Income Fund (continued)
www.franklintempleton.lu330 Audited Annual Report
Number of shares or face value Description
code
Trading Market value
% of net assets
0.130.130.130.130.130.130.130.12
Endo Dac 0.120.120.120.110.110.110.110.110.110.110.110.100.100.10
0.100.100.100.100.100.100.090.090.090.090.090.090.090.080.080.080.080.080.080.080.08
0.080.080.070.070.070.070.070.070.070.070.070.070.060.060.060.060.060.060.06
0.06
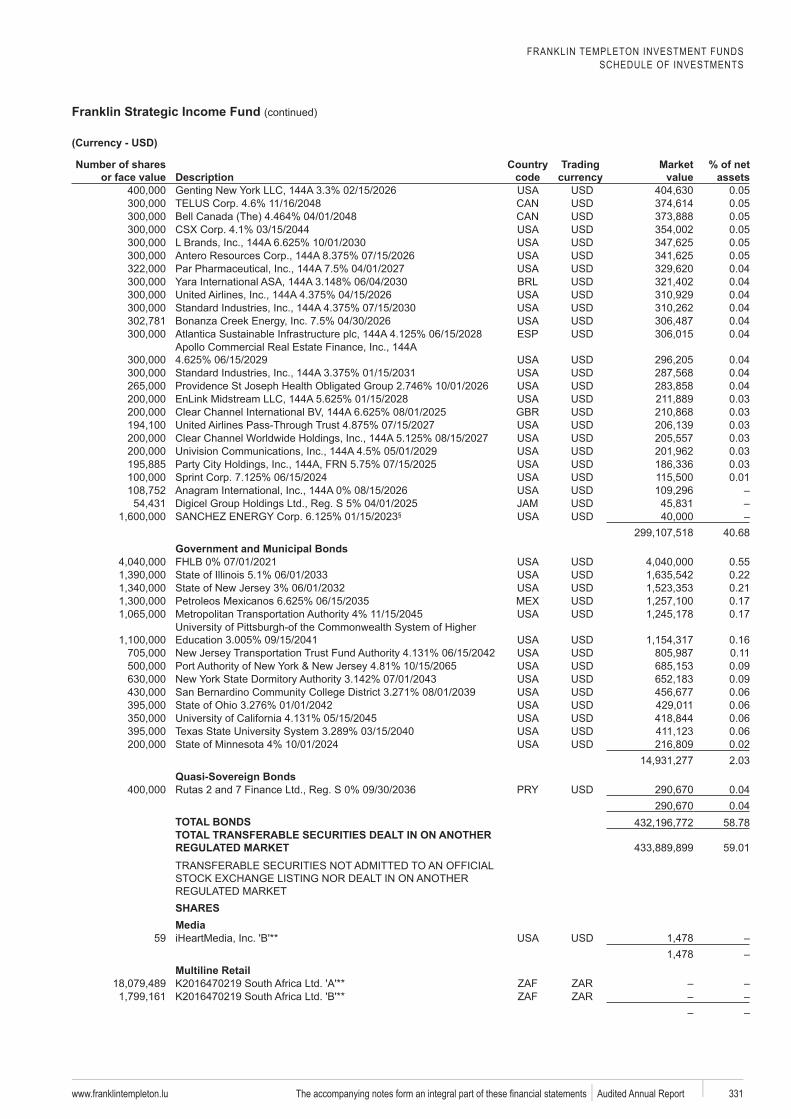
FRANKLIN TEMPLETON INVESTMENT FUNDSSCHEDULE OF INVESTMENTS
Franklin Strategic Income Fund (continued)
www.franklintempleton.lu 331 Audited Annual Report
Number of shares or face value Description
code
Trading Market value
% of net assets
0.050.050.050.050.050.050.040.040.040.040.04
ESP 0.04
0.040.040.040.030.030.030.030.030.030.01
Digicel§
40.68Government and Municipal Bonds
0.550.220.21
Petroleos 0.170.17
0.160.110.090.090.060.060.060.060.022.03
Quasi-Sovereign Bonds0.040.04
TOTAL BONDS 58.78TOTAL TRANSFERABLE SECURITIES DEALT IN ON ANOTHER
59.01
SHARESMedia
59
Multiline Retail
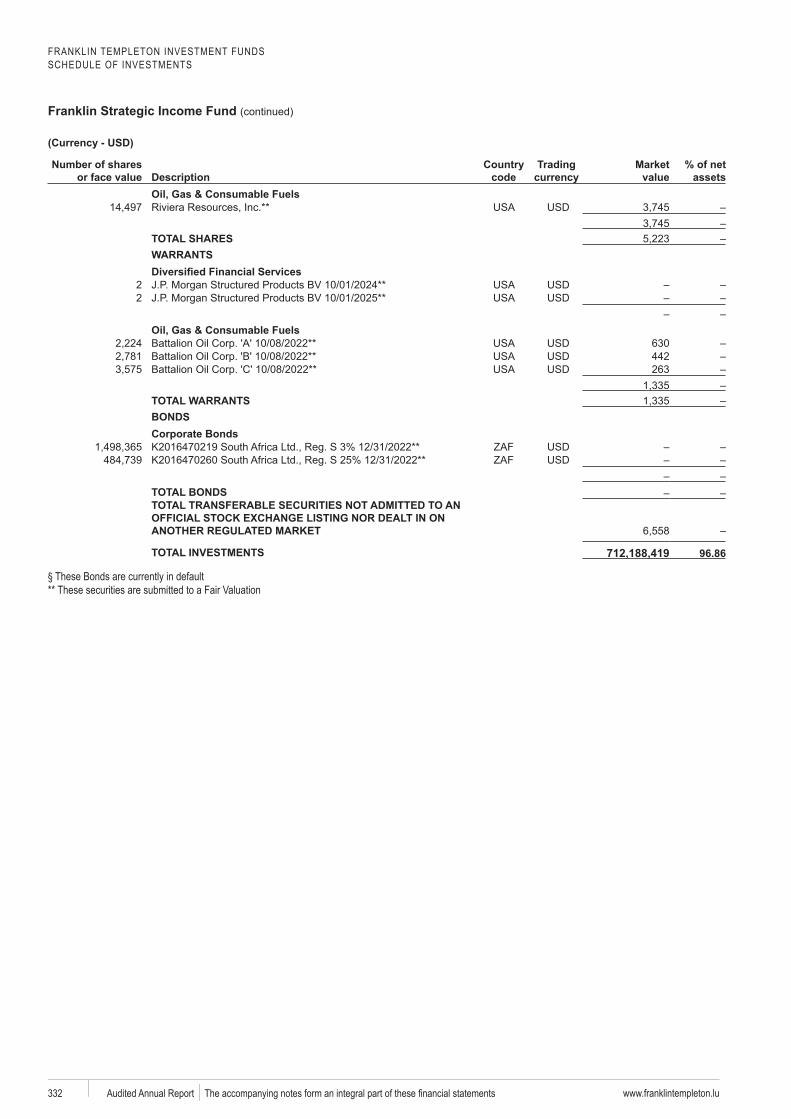
FRANKLIN TEMPLETON INVESTMENT FUNDSSCHEDULE OF INVESTMENTS
Franklin Strategic Income Fund (continued)
www.franklintempleton.lu332 Audited Annual Report
Number of shares or face value Description
code
Trading Market value
% of net assets
Oil, Gas & Consumable Fuels
TOTAL SHARESWARRANTS
22
Oil, Gas & Consumable Fuels630442263
TOTAL WARRANTSBONDSCorporate Bonds
TOTAL BONDSTOTAL TRANSFERABLE SECURITIES NOT ADMITTED TO AN
TOTAL INVESTMENTS 712,188,419a§ These Bonds are currently in default** These securities are submitted to a Fair Valuation
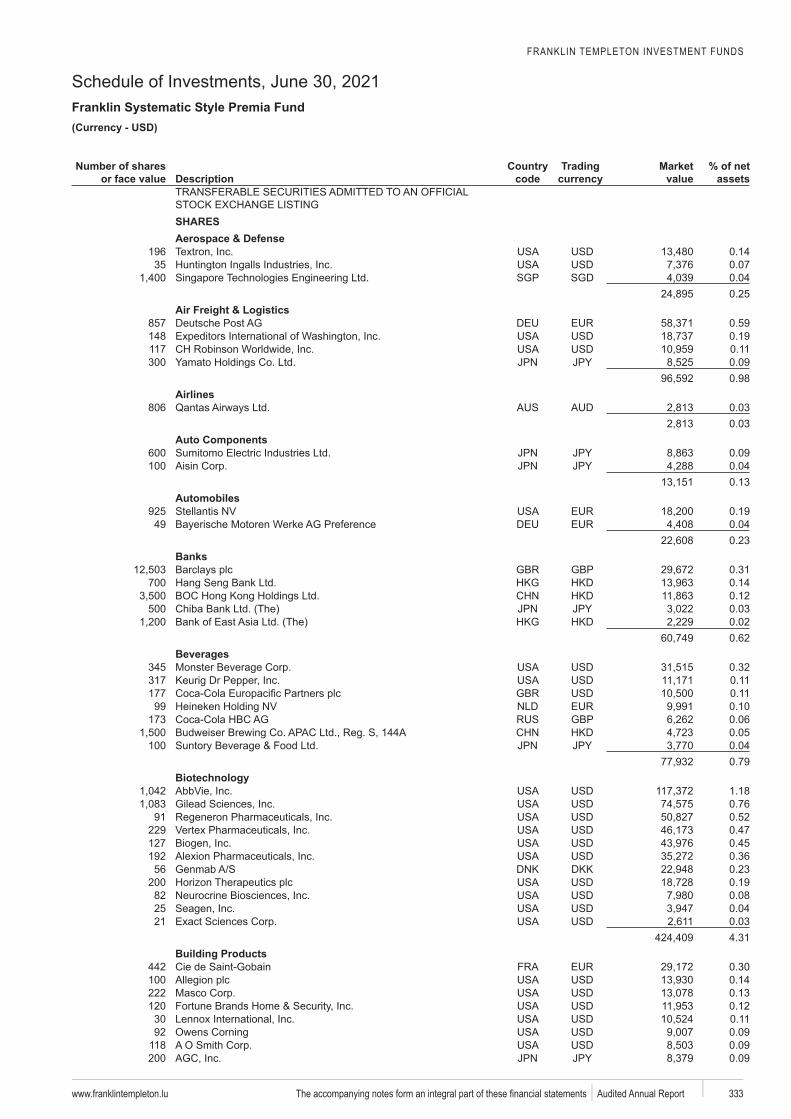
FRANKLIN TEMPLETON INVESTMENT FUNDS
Schedule of Investments, June 30, 2021Franklin Systematic Style Premia Fund
www.franklintempleton.lu 333 Audited Annual Report
USD)
Number of shares or face value Description
code
Trading Market value
% of net assets
SHARESAerospace & Defense
196 0.1435 0.07
SGP SGD 0.040.25
Air Freight & Logistics857 0.59148 0.19117 0.11300 0.09
0.98Airlines
806 0.030.03
Auto Components600 0.09100 0.04
0.13Automobiles
925 0.1949 0.04
0.23Banks
GBP 0.31700 0.14
0.12500 0.03
0.020.62
Beverages345 0.32317 0.11177 0.1199 0.10
173 GBP 0.060.05
100 0.040.79
1.180.76
91 0.52229 0.47127 0.45192 0.3656 DKK 0.23
200 0.1982 0.0825 0.0421 0.03
4.31Building Products
442 0.30100 0.14222 0.13120 0.1230 0.1192 0.09
118 0.09200 0.09
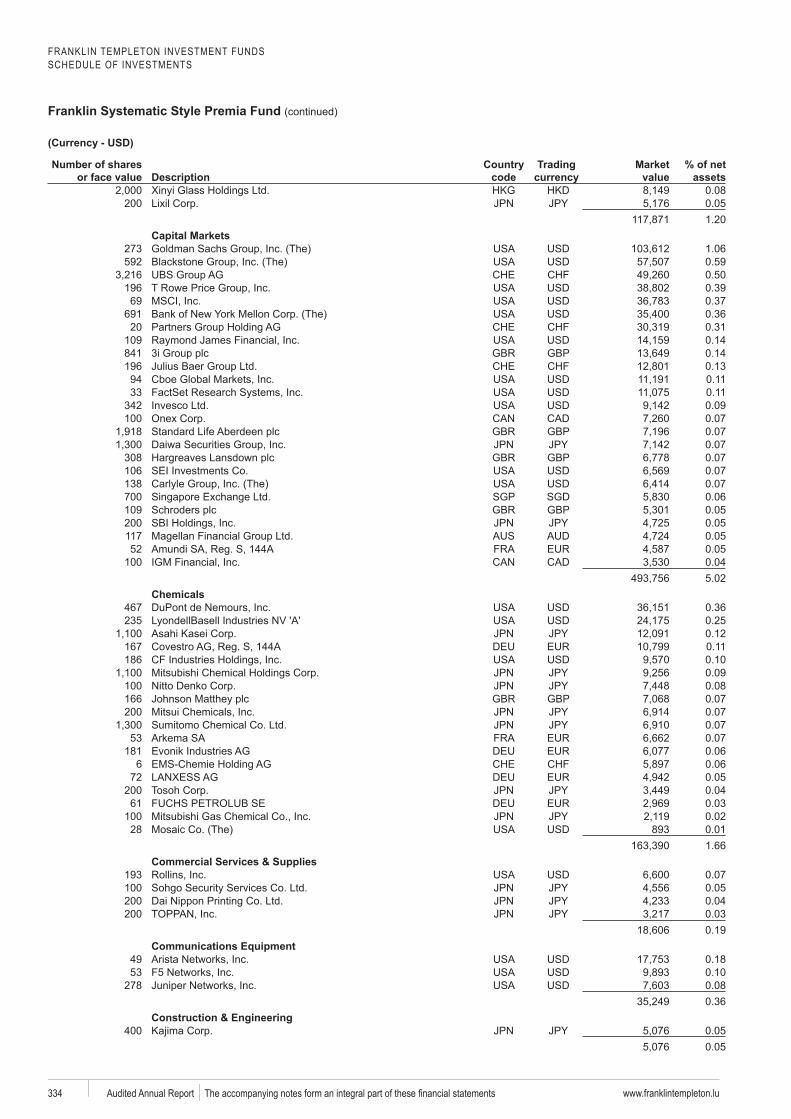
FRANKLIN TEMPLETON INVESTMENT FUNDSSCHEDULE OF INVESTMENTS
Franklin Systematic Style Premia Fund (continued)
www.franklintempleton.lu334 Audited Annual Report
Number of shares or face value Description
code
Trading Market value
% of net assets
0.08200 0.05
1.20Capital Markets
273 1.06592 0.59
0.50196 0.3969 0.37
691 0.3620 0.31
109 0.14841 GBP 0.14196 0.1394 0.1133 0.11
342 0.09100 0.07
GBP 0.070.07
308 GBP 0.07106 0.07138 0.07700 SGP SGD 0.06109 GBP 0.05200 0.05117 0.0552 0.05
100 0.045.02
Chemicals467 0.36235 0.25
0.12167 0.11186 0.10
0.09100 0.08166 GBP 0.07200 0.07
0.0753 0.07
181 0.066 0.06
72 0.05200 0.0461 0.03
100 0.0228 893 0.01
1.66Commercial Services & Supplies
193 0.07100 0.05200 0.04200 0.03
0.19Communications Equipment
49 0.1853 0.10
278 0.080.36
Construction & Engineering400 0.05
0.05
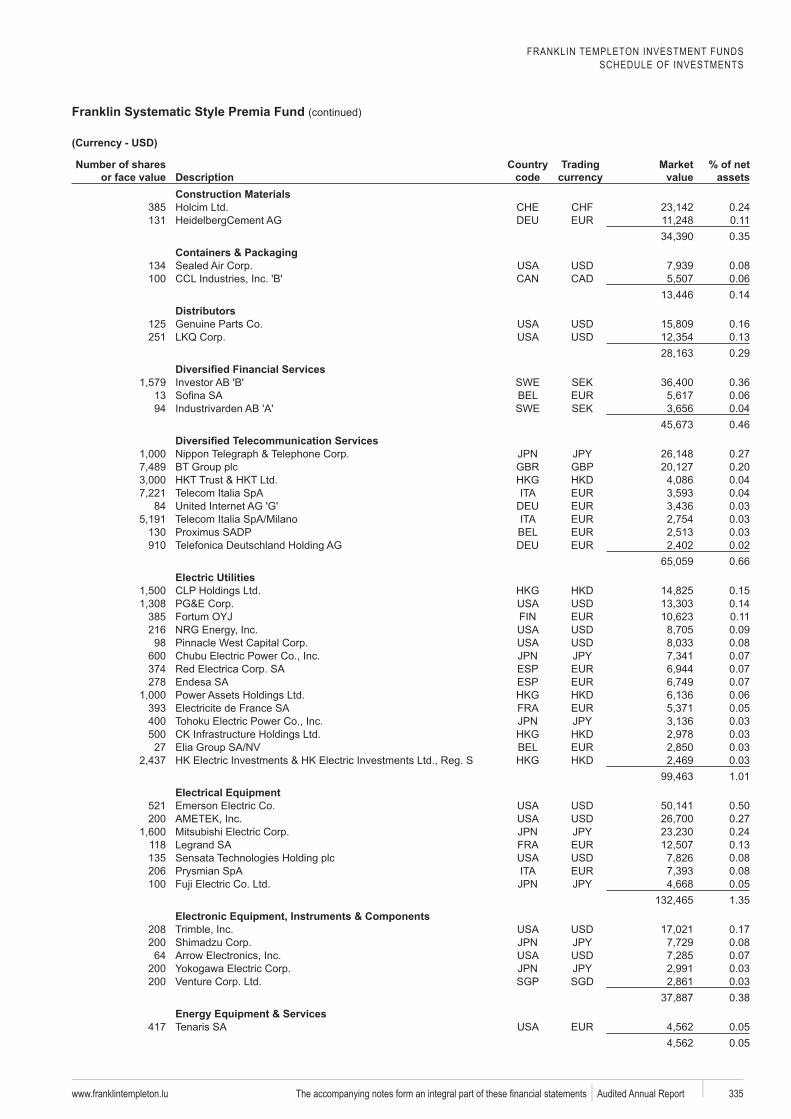
FRANKLIN TEMPLETON INVESTMENT FUNDSSCHEDULE OF INVESTMENTS
Franklin Systematic Style Premia Fund (continued)
www.franklintempleton.lu 335 Audited Annual Report
Number of shares or face value Description
code
Trading Market value
% of net assets
Construction Materials385 0.24131 0.11
0.35Containers & Packaging
134 0.08100 0.06
0.14Distributors
125 0.16251 0.13
0.29
SWE SEK 0.3613 0.0694 SWE SEK 0.04
0.46
0.27GBP 0.20
0.040.04
84 0.030.03
130 0.03910 0.02
0.66Electric Utilities
0.150.14
385 0.11216 0.0998 0.08
600 0.07374 ESP 0.07278 ESP 0.07
0.06393 0.05400 0.03500 0.0327 0.03
0.031.01
Electrical Equipment521 0.50200 0.27
0.24118 0.13135 0.08206 0.08100 0.05
1.35Electronic Equipment, Instruments & Components
208 0.17200 0.08
64 0.07200 0.03200 SGP SGD 0.03
0.38
417 0.050.05
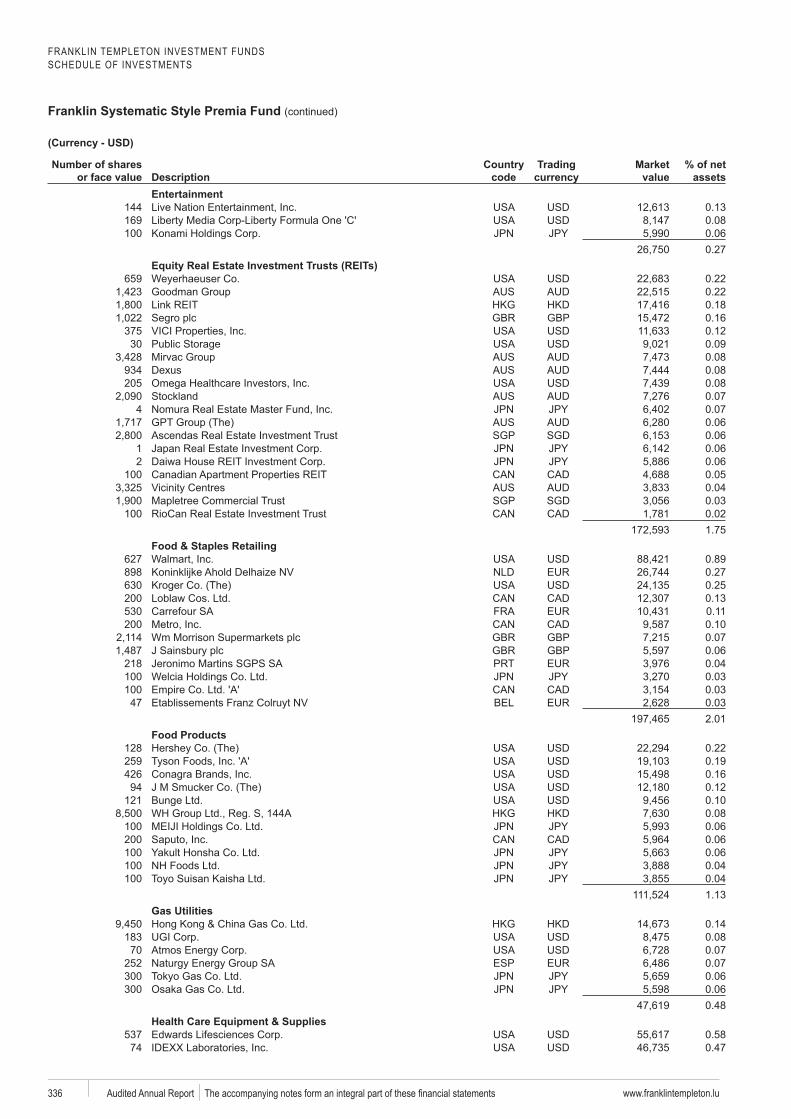
FRANKLIN TEMPLETON INVESTMENT FUNDSSCHEDULE OF INVESTMENTS
Franklin Systematic Style Premia Fund (continued)
www.franklintempleton.lu336 Audited Annual Report
Number of shares or face value Description
code
Trading Market value
% of net assets
Entertainment144 0.13169 0.08100 0.06
0.27
659 0.220.220.18
GBP 0.16375 0.1230 0.09
0.08934 Dexus 0.08205 0.08
Stockland 0.074 0.07
0.06SGP SGD 0.06
1 0.062 0.06
100 0.050.04
SGP SGD 0.03100 0.02
1.75Food & Staples Retailing
627 0.89898 0.27630 0.25200 0.13530 0.11200 0.10
GBP 0.07GBP 0.06
218 0.04100 0.03100 0.0347 0.03
2.01Food Products
128 0.22259 0.19426 0.1694 0.12
121 0.100.08
100 0.06200 0.06100 0.06100 0.04100 0.04
1.13Gas Utilities
0.14183 0.0870 0.07
252 ESP 0.07300 0.06300 0.06
0.48Health Care Equipment & Supplies
537 0.5874 0.47
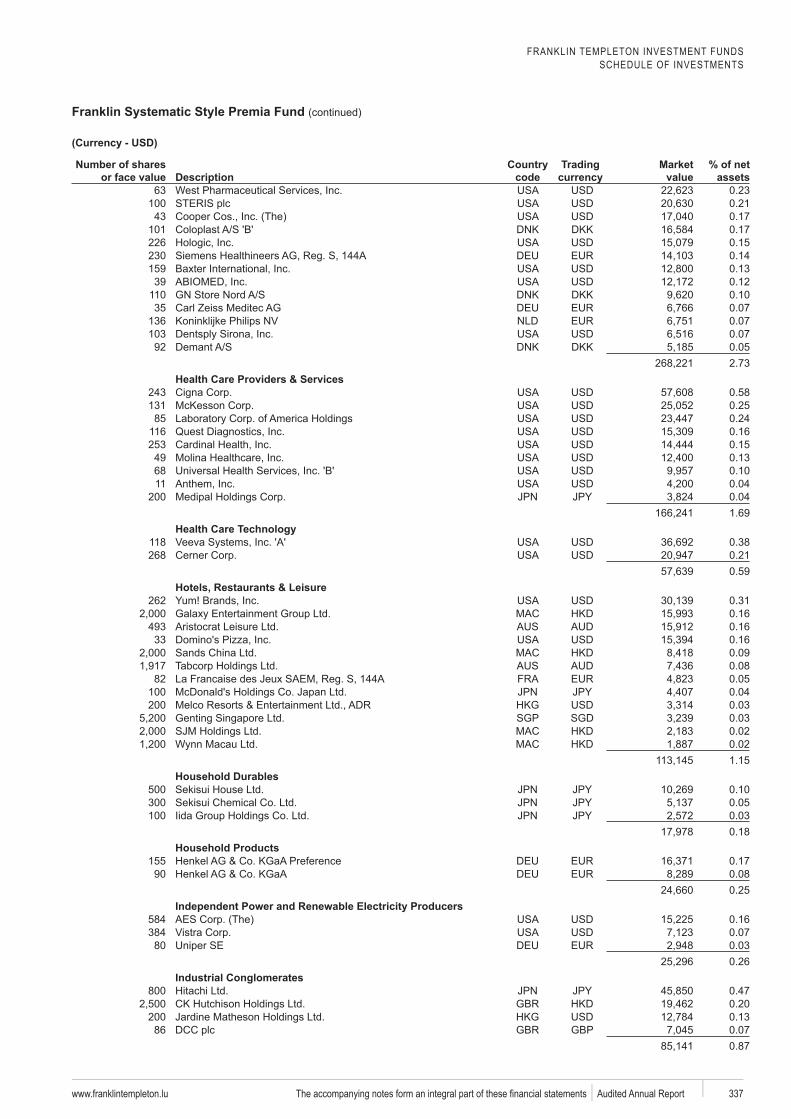
FRANKLIN TEMPLETON INVESTMENT FUNDSSCHEDULE OF INVESTMENTS
Franklin Systematic Style Premia Fund (continued)
www.franklintempleton.lu 337 Audited Annual Report
Number of shares or face value Description
code
Trading Market value
% of net assets
63 0.23100 0.2143 0.17
101 DKK 0.17226 0.15230 0.14159 0.1339 0.12
110 DKK 0.1035 0.07
136 0.07103 0.07
92 DKK 0.052.73
Health Care Providers & Services243 0.58131 0.25
85 0.24116 0.16253 0.1549 0.1368 0.1011 0.04
200 0.041.69
118 0.38268 0.21
0.59Hotels, Restaurants & Leisure
262 0.310.16
493 0.1633 0.16
0.090.08
82 0.05100 0.04200 0.03
SGP SGD 0.030.020.021.15
Household Durables500 0.10300 0.05100 0.03
0.18Household Products
155 0.1790 0.08
0.25
584 0.16384 0.07
80 0.030.26
Industrial Conglomerates800 0.47
0.20200 0.1386 GBP 0.07
0.87
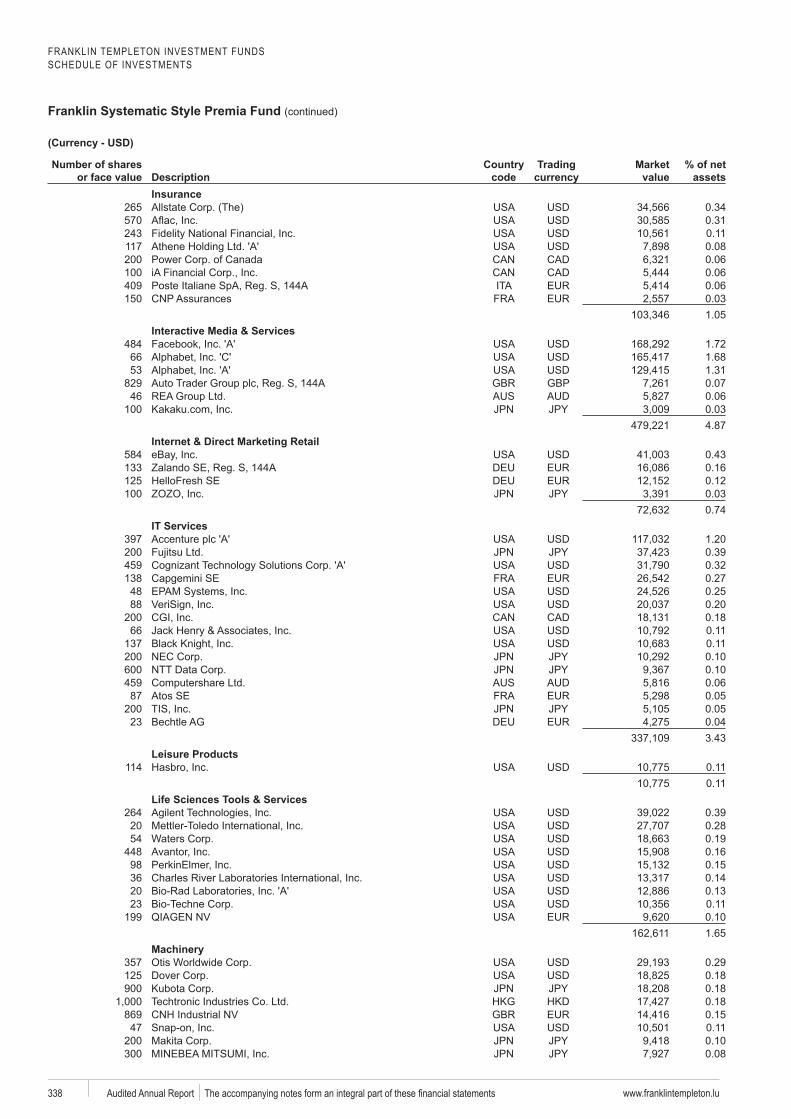
FRANKLIN TEMPLETON INVESTMENT FUNDSSCHEDULE OF INVESTMENTS
Franklin Systematic Style Premia Fund (continued)
www.franklintempleton.lu338 Audited Annual Report
Number of shares or face value Description
code
Trading Market value
% of net assets
Insurance265 0.34570 0.31243 0.11117 0.08200 0.06100 0.06409 0.06150 0.03
1.05Interactive Media & Services
484 1.7266 1.6853 1.31
829 GBP 0.0746 0.06
100 0.034.87
Internet & Direct Marketing Retail584 0.43133 0.16125 0.12100 0.03
0.74IT Services
397 1.20200 0.39459 0.32138 0.2748 0.2588 0.20
200 0.1866 0.11
137 0.11200 0.10600 0.10459 0.06
87 0.05200 0.05
23 0.043.43
Leisure Products114 0.11
0.11Life Sciences Tools & Services
264 0.3920 0.2854 0.19
448 0.1698 0.1536 0.1420 0.1323 0.11
199 0.101.65
357 0.29125 0.18900 0.18
0.18869 0.15
47 0.11200 0.10300 0.08
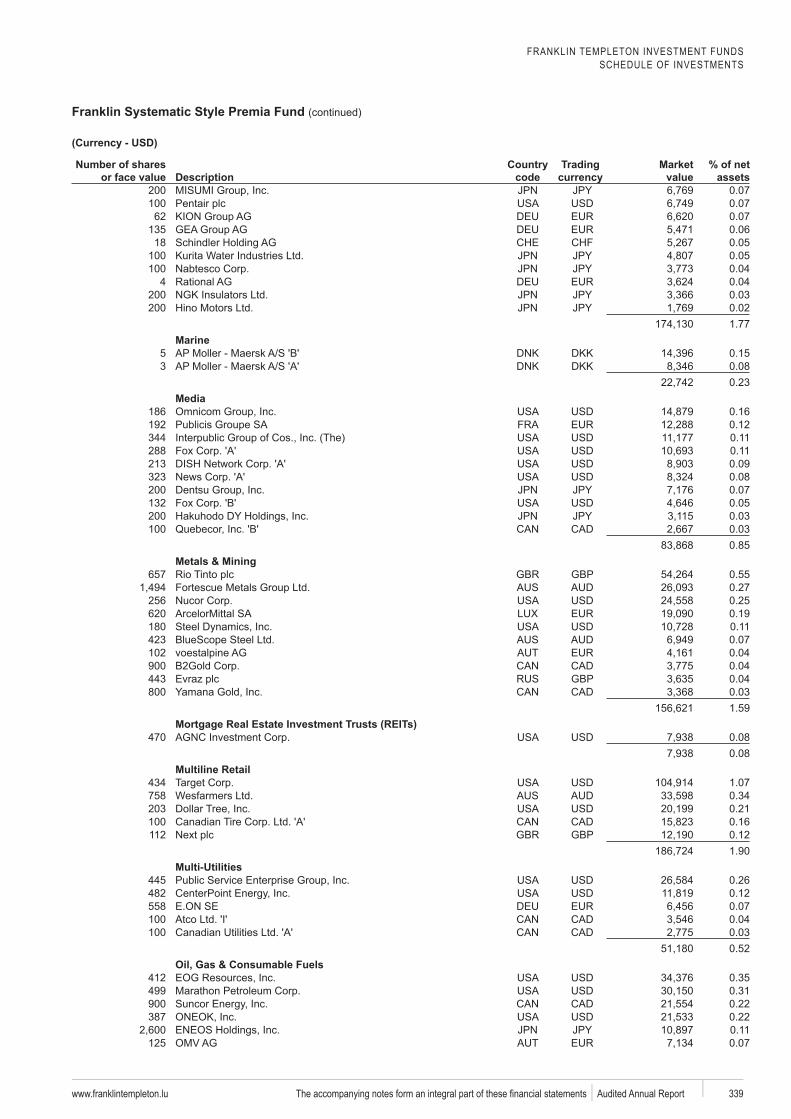
FRANKLIN TEMPLETON INVESTMENT FUNDSSCHEDULE OF INVESTMENTS
Franklin Systematic Style Premia Fund (continued)
www.franklintempleton.lu 339 Audited Annual Report
Number of shares or face value Description
code
Trading Market value
% of net assets
200 0.07100 0.0762 0.07
135 0.0618 0.05
100 0.05100 0.04
4 0.04200 0.03200 0.02
1.77Marine
5 DKK 0.153 DKK 0.08
0.23Media
186 0.16192 0.12344 0.11288 0.11213 0.09323 0.08200 0.07132 0.05200 0.03100 0.03
0.85Metals & Mining
657 GBP 0.550.27
256 0.25620 0.19180 0.11423 0.07102 0.04900 0.04443 GBP 0.04800 0.03
1.59Mortgage Real Estate Investment Trusts (REITs)
470 0.080.08
Multiline Retail434 1.07758 0.34203 0.21100 0.16112 GBP 0.12
1.90Multi-Utilities
445 0.26482 0.12558 0.07100 0.04100 0.03
0.52Oil, Gas & Consumable Fuels
412 0.35499 0.31900 0.22387 0.22
0.11125 0.07
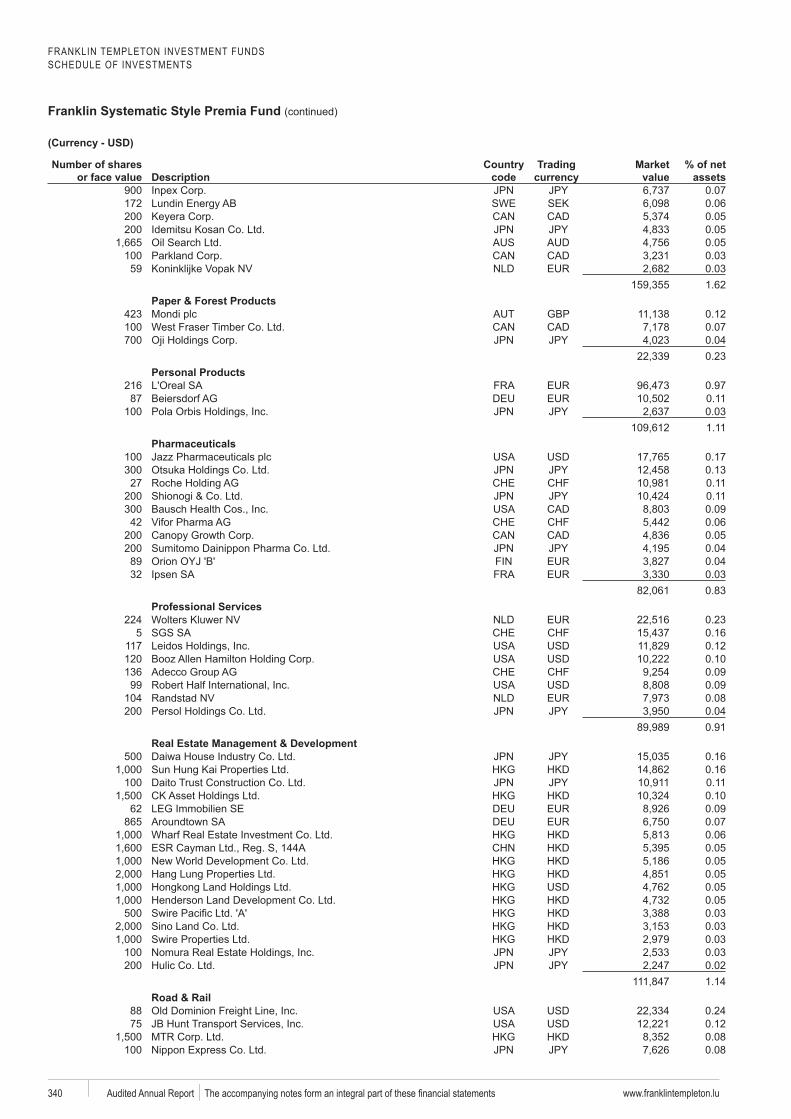
FRANKLIN TEMPLETON INVESTMENT FUNDSSCHEDULE OF INVESTMENTS
Franklin Systematic Style Premia Fund (continued)
www.franklintempleton.lu340 Audited Annual Report
Number of shares or face value Description
code
Trading Market value
% of net assets
900 0.07172 SWE SEK 0.06200 0.05200 0.05
0.05100 0.0359 0.03
1.62Paper & Forest Products
423 GBP 0.12100 0.07700 0.04
0.23Personal Products
216 0.9787 0.11
100 0.031.11
Pharmaceuticals100 0.17300 0.13
27 0.11200 0.11300 0.0942 0.06
200 0.05200 0.0489 0.0432 0.03
0.83Professional Services
224 0.235 0.16
117 0.12120 0.10136 0.0999 0.09
104 0.08200 0.04
0.91Real Estate Management & Development
500 0.160.16
100 0.110.10
62 0.09865 0.07
0.060.050.050.050.050.05
500 0.030.030.03
100 0.03200 0.02
1.14Road & Rail
88 0.2475 0.12
0.08100 0.08
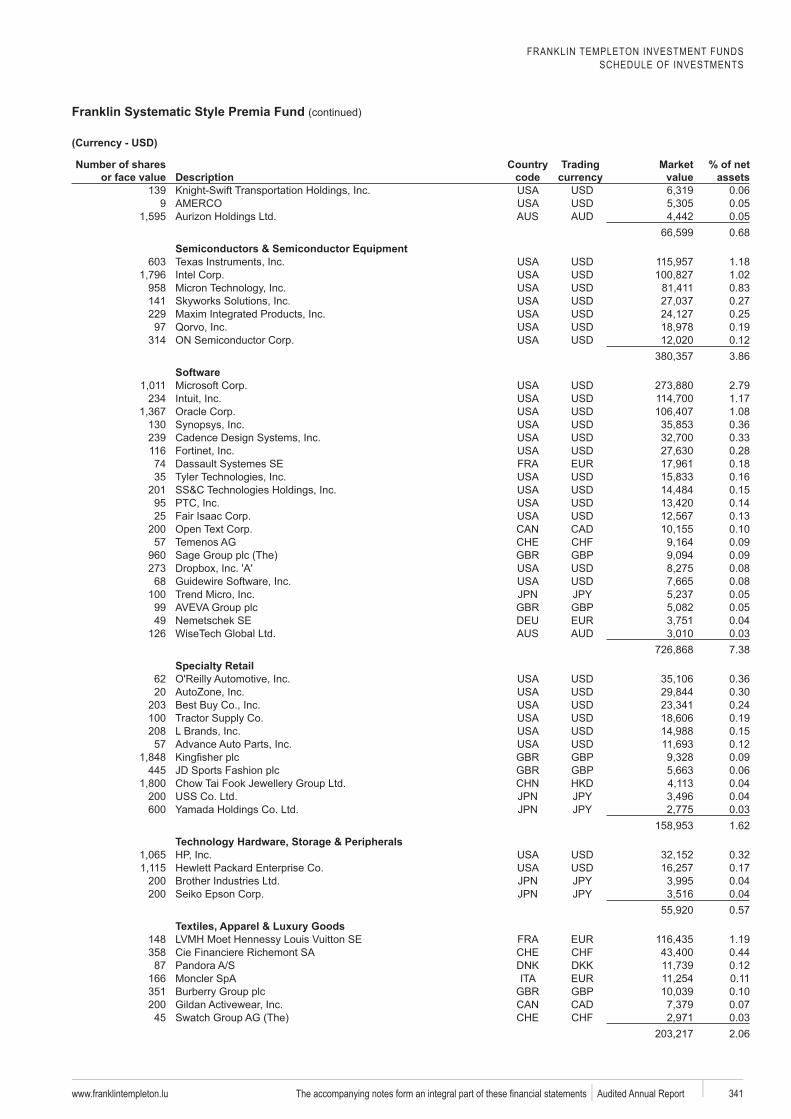
FRANKLIN TEMPLETON INVESTMENT FUNDSSCHEDULE OF INVESTMENTS
Franklin Systematic Style Premia Fund (continued)
www.franklintempleton.lu 341 Audited Annual Report
Number of shares or face value Description
code
Trading Market value
% of net assets
139 0.069 0.05
0.050.68
Semiconductors & Semiconductor Equipment603 1.18
1.02958 0.83141 0.27229 0.2597 0.19
314 0.123.86
2.79234 1.17
1.08130 0.36239 0.33116 0.2874 0.1835 0.16
201 0.1595 0.1425 0.13
200 0.1057 0.09
960 GBP 0.09273 0.0868 0.08
100 0.0599 GBP 0.0549 0.04
126 0.037.38
62 0.3620 0.30
203 0.24100 0.19208 0.1557 0.12
GBP 0.09445 GBP 0.06
0.04200 0.04600 0.03
1.62
0.320.17
200 0.04200 0.04
0.57
148 1.19358 0.4487 DKK 0.12
166 0.11351 GBP 0.10200 0.0745 0.03
2.06
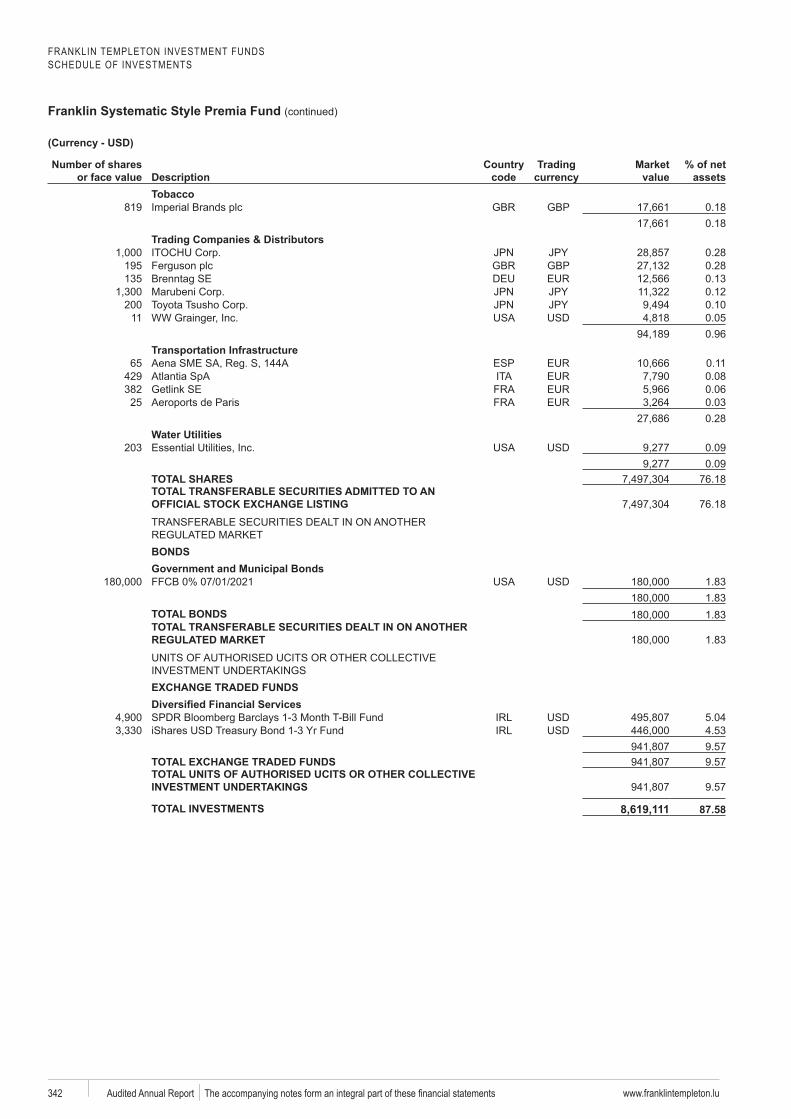
FRANKLIN TEMPLETON INVESTMENT FUNDSSCHEDULE OF INVESTMENTS
Franklin Systematic Style Premia Fund (continued)
www.franklintempleton.lu342 Audited Annual Report
Number of shares or face value Description
code
Trading Market value
% of net assets
Tobacco819 GBP 0.18
0.18Trading Companies & Distributors
0.28195 GBP 0.28135 Brenntag SE 0.13
0.12200 0.10
11 0.050.96
Transportation Infrastructure65 ESP 0.11
429 0.08382 Getlink SE 0.0625 0.03
0.28Water Utilities
203 0.090.09
TOTAL SHARES 76.18TOTAL TRANSFERABLE SECURITIES ADMITTED TO AN
76.18
BONDSGovernment and Municipal Bonds
1.831.83
TOTAL BONDS 1.83TOTAL TRANSFERABLE SECURITIES DEALT IN ON ANOTHER
1.83
EXCHANGE TRADED FUNDS
5.044.539.57
TOTAL EXCHANGE TRADED FUNDS 9.57TOTAL UNITS OF AUTHORISED UCITS OR OTHER COLLECTIVE
9.57
TOTAL INVESTMENTS 8,619,111
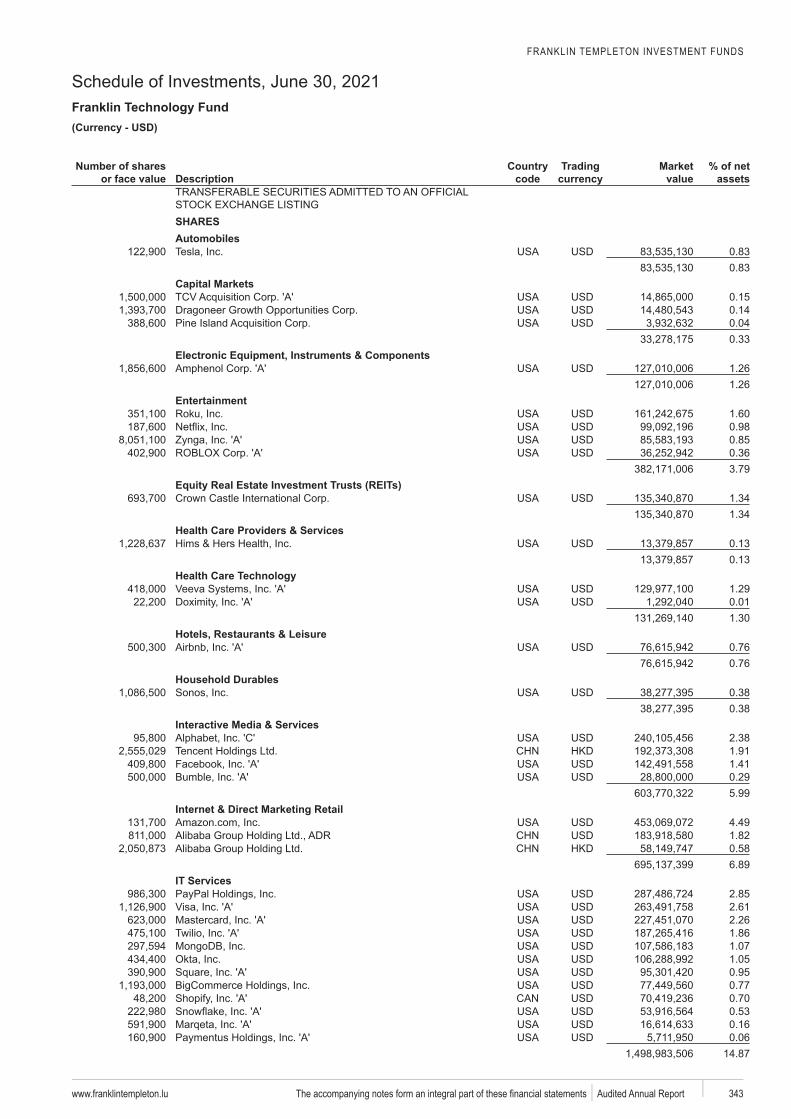
FRANKLIN TEMPLETON INVESTMENT FUNDS
Schedule of Investments, June 30, 2021Franklin Technology Fund
www.franklintempleton.lu 343 Audited Annual Report
USD)
Number of shares or face value Description
code
Trading Market value
% of net assets
SHARESAutomobiles
0.830.83
Capital Markets0.15
Dragoneer 0.140.040.33
Electronic Equipment, Instruments & Components1.261.26
Entertainment1.600.980.850.363.79
1.341.34
Health Care Providers & Services0.130.13
1.290.011.30
Hotels, Restaurants & Leisure0.760.76
Household DurablesSonos 0.38
0.38Interactive Media & Services
2.38Tencent 1.91
1.410.295.99
Internet & Direct Marketing Retail4.491.820.586.89
IT Services2.852.612.261.861.071.050.950.770.700.530.160.06
14.87
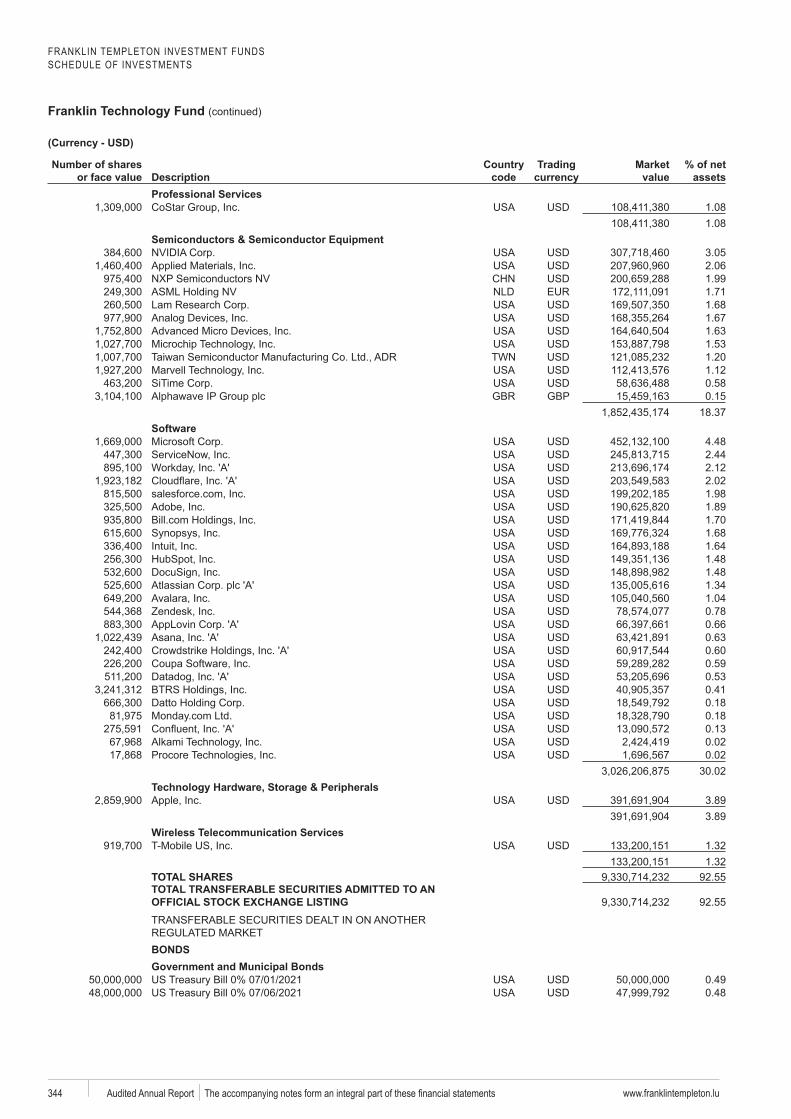
FRANKLIN TEMPLETON INVESTMENT FUNDSSCHEDULE OF INVESTMENTS
Franklin Technology Fund (continued)
www.franklintempleton.lu344 Audited Annual Report
Number of shares or face value Description
code
Trading Market value
% of net assets
Professional Services1.081.08
Semiconductors & Semiconductor Equipment3.052.061.991.711.681.671.631.531.201.120.58
GBP 0.1518.37
4.482.442.122.021.981.891.701.681.641.481.481.341.04
Zendesk 0.780.660.630.600.59
Datadog 0.530.410.180.180.130.02
Procore 0.0230.02
3.893.89
Wireless Telecommunication Services1.321.32
TOTAL SHARES 92.55TOTAL TRANSFERABLE SECURITIES ADMITTED TO AN
92.55
BONDSGovernment and Municipal Bonds
0.490.48
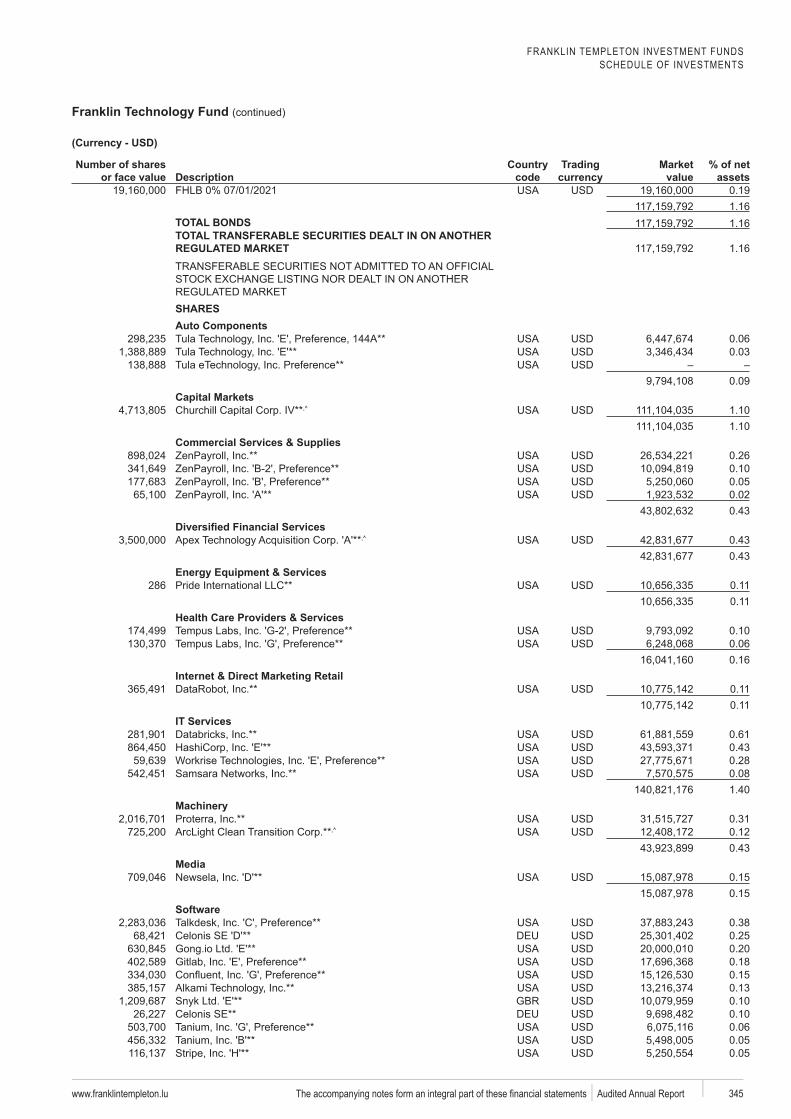
FRANKLIN TEMPLETON INVESTMENT FUNDSSCHEDULE OF INVESTMENTS
Franklin Technology Fund (continued)
www.franklintempleton.lu 345 Audited Annual Report
Number of shares or face value Description
code
Trading Market value
% of net assets
0.191.16
TOTAL BONDS 1.16TOTAL TRANSFERABLE SECURITIES DEALT IN ON ANOTHER
1.16
SHARESAuto Components
0.060.03
Tula eTechnology0.09
Capital Markets1.101.10
Commercial Services & SuppliesZenPayroll 0.26ZenPayroll 0.10ZenPayroll 0.05ZenPayroll 0.02
0.43
0.430.43
286 0.110.11
Health Care Providers & Services0.100.060.16
Internet & Direct Marketing Retail0.110.11
IT Services0.610.43
Workrise 0.280.081.40
Proterra 0.310.120.43
Media0.150.15
Talkdesk 0.380.250.200.180.150.13
Snyk 0.10 SE** 0.10
0.060.050.05
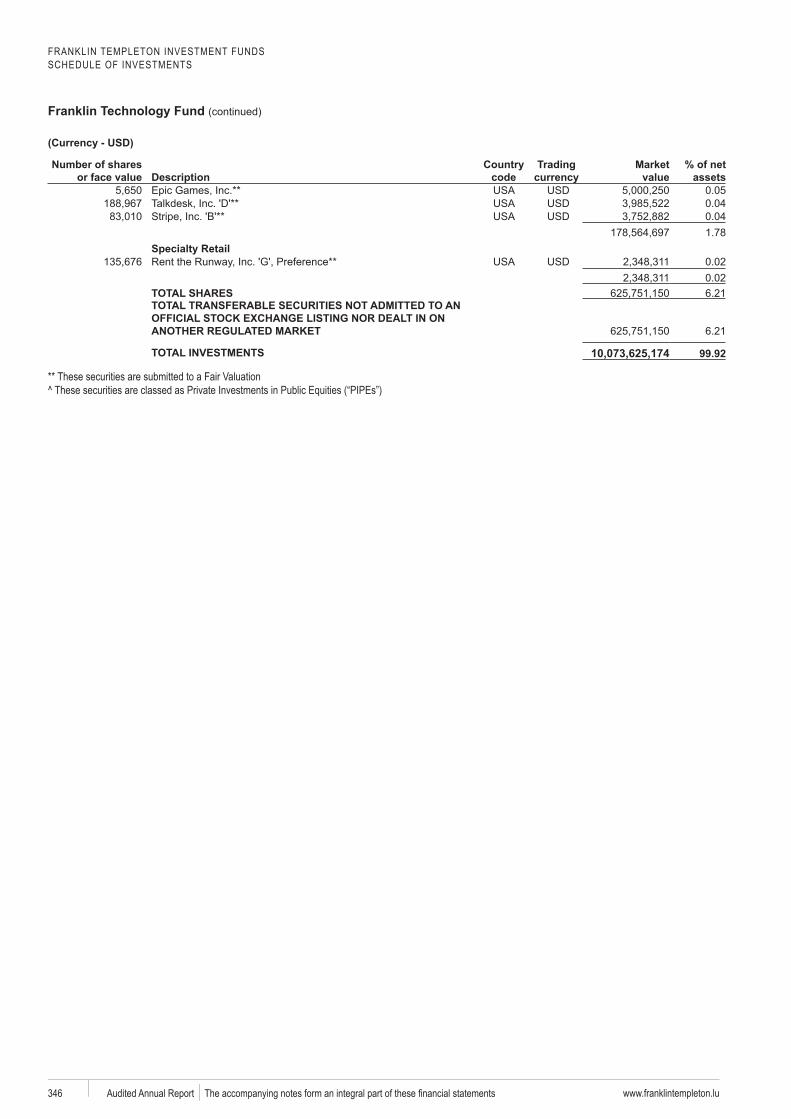
FRANKLIN TEMPLETON INVESTMENT FUNDSSCHEDULE OF INVESTMENTS
Franklin Technology Fund (continued)
www.franklintempleton.lu346 Audited Annual Report
Number of shares or face value Description
code
Trading Market value
% of net assets
0.05Talkdesk 0.04
0.041.78
0.020.02
TOTAL SHARES 6.21TOTAL TRANSFERABLE SECURITIES NOT ADMITTED TO AN
6.21
TOTAL INVESTMENTS 10,073,625,174a** These securities are submitted to a Fair Valuation^ These securities are classed as Private Investments in Public Equities (“PIPEs”)
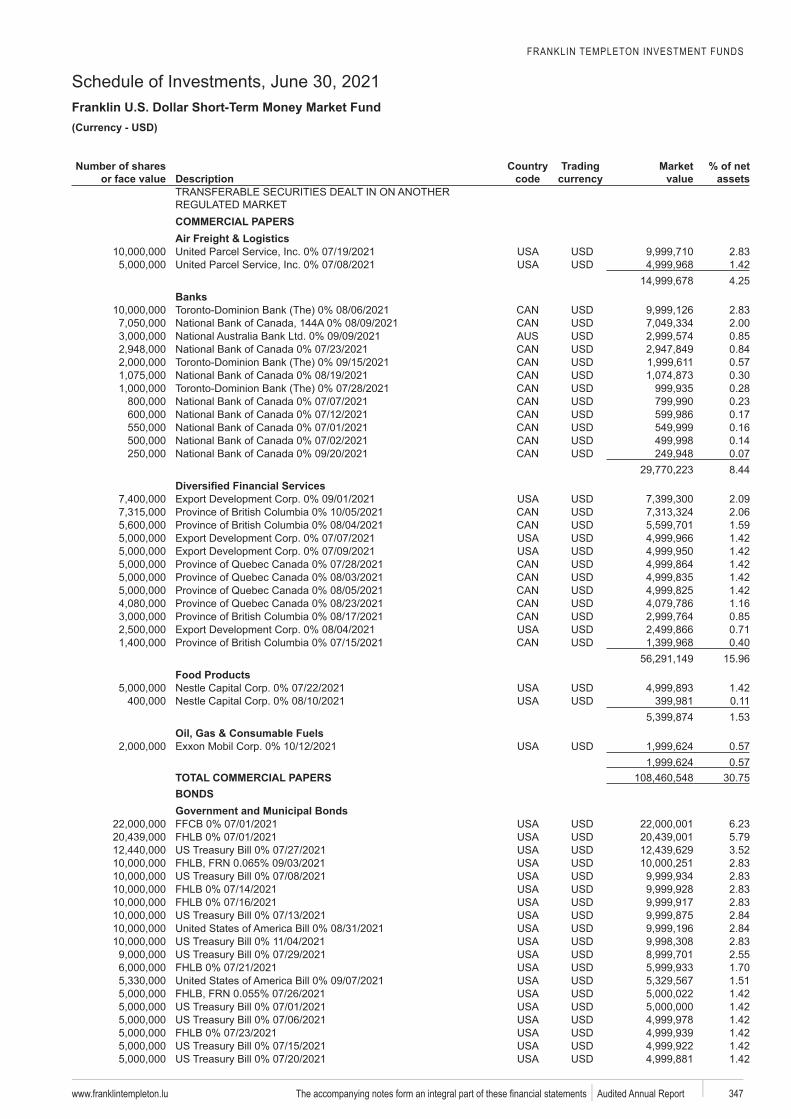
FRANKLIN TEMPLETON INVESTMENT FUNDS
Schedule of Investments, June 30, 2021Franklin U.S. Dollar Short-Term Money Market Fund
www.franklintempleton.lu 347 Audited Annual Report
USD)
Number of shares or face value Description
code
Trading Market value
% of net assets
COMMERCIAL PAPERSAir Freight & Logistics
2.831.424.25
Banks2.832.000.850.840.570.300.280.230.170.160.140.078.44
2.092.061.591.421.421.421.421.421.160.850.710.40
15.96Food Products
1.420.111.53
Oil, Gas & Consumable Fuels0.570.57
TOTAL COMMERCIAL PAPERS 30.75BONDSGovernment and Municipal Bonds
6.235.793.522.832.832.832.832.842.842.832.551.701.511.421.421.421.421.421.42
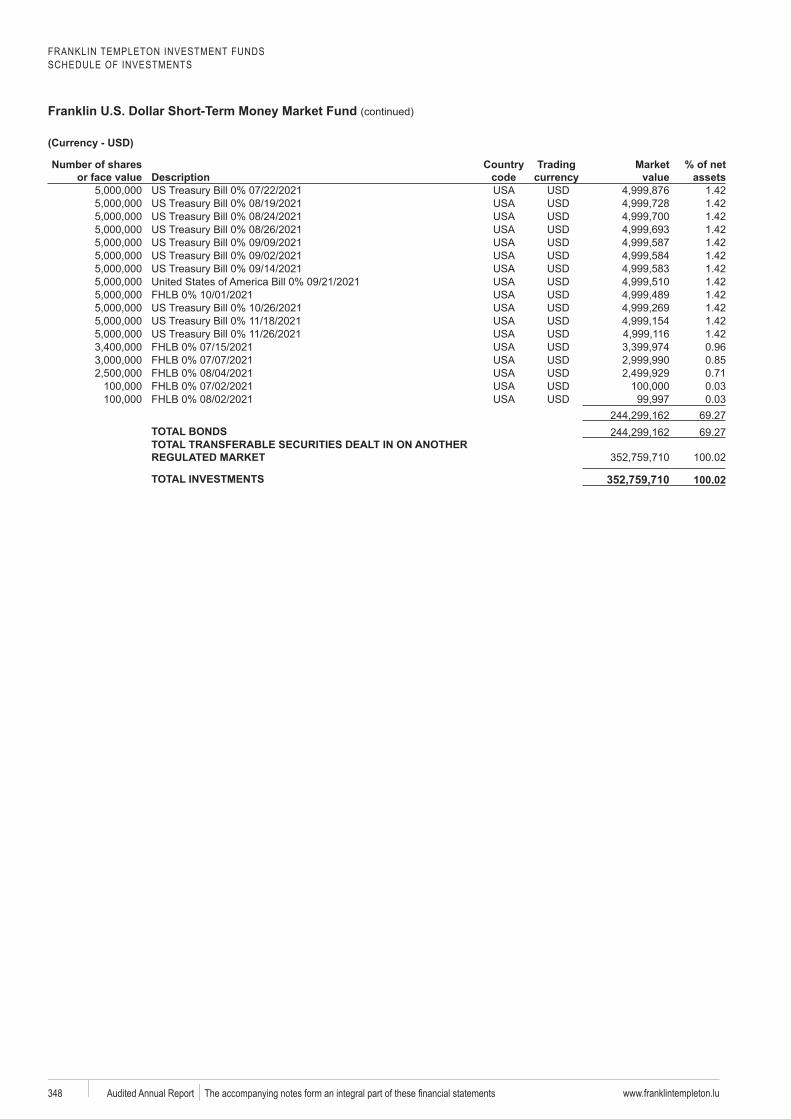
FRANKLIN TEMPLETON INVESTMENT FUNDSSCHEDULE OF INVESTMENTS
Franklin U.S. Dollar Short-Term Money Market Fund (continued)
www.franklintempleton.lu348 Audited Annual Report
Number of shares or face value Description
code
Trading Market value
% of net assets
1.421.421.421.421.421.421.421.421.421.421.421.420.960.850.710.030.03
69.27TOTAL BONDS 69.27TOTAL TRANSFERABLE SECURITIES DEALT IN ON ANOTHER
100.02
TOTAL INVESTMENTS 352,759,710
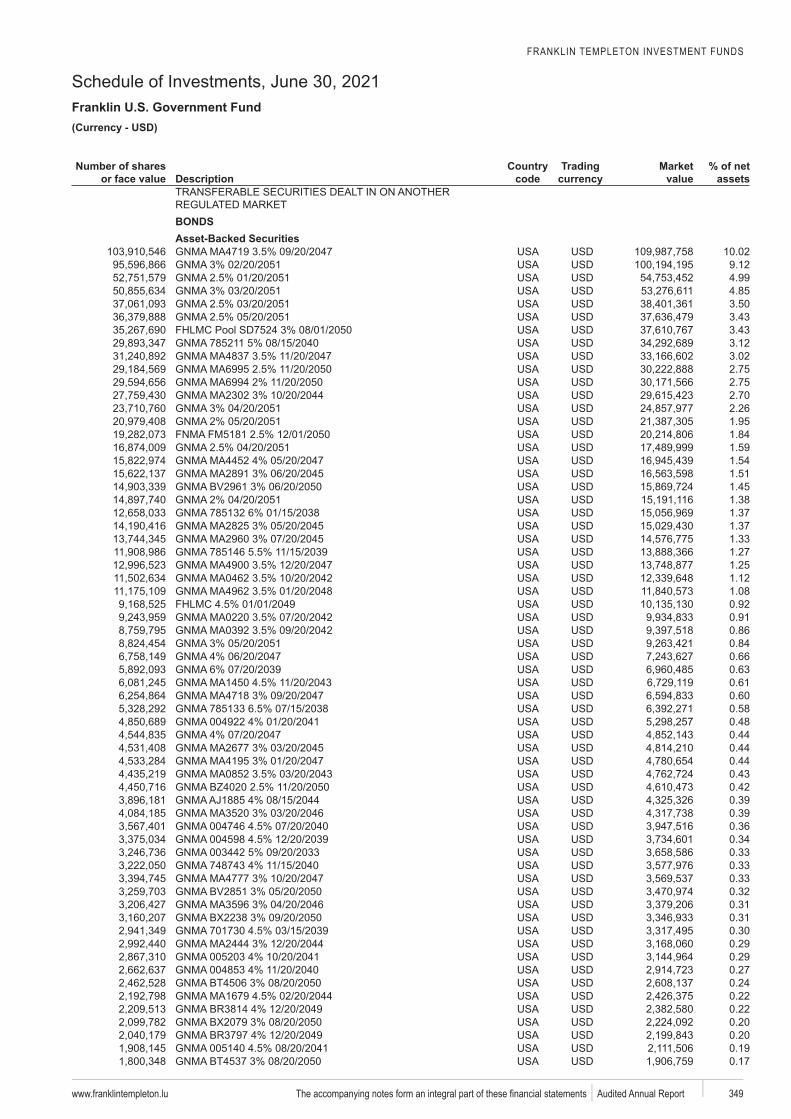
FRANKLIN TEMPLETON INVESTMENT FUNDS
Schedule of Investments, June 30, 2021Franklin U.S. Government Fund
www.franklintempleton.lu 349 Audited Annual Report
USD)
Number of shares or face value Description
code
Trading Market value
% of net assets
BONDSAsset-Backed Securities
10.029.124.994.853.503.433.433.123.022.752.752.702.261.951.841.591.541.511.451.381.371.371.331.271.251.121.080.920.910.860.840.660.630.610.600.580.480.440.440.440.430.420.390.390.360.340.330.330.330.320.310.310.300.290.290.270.240.220.220.200.200.190.17
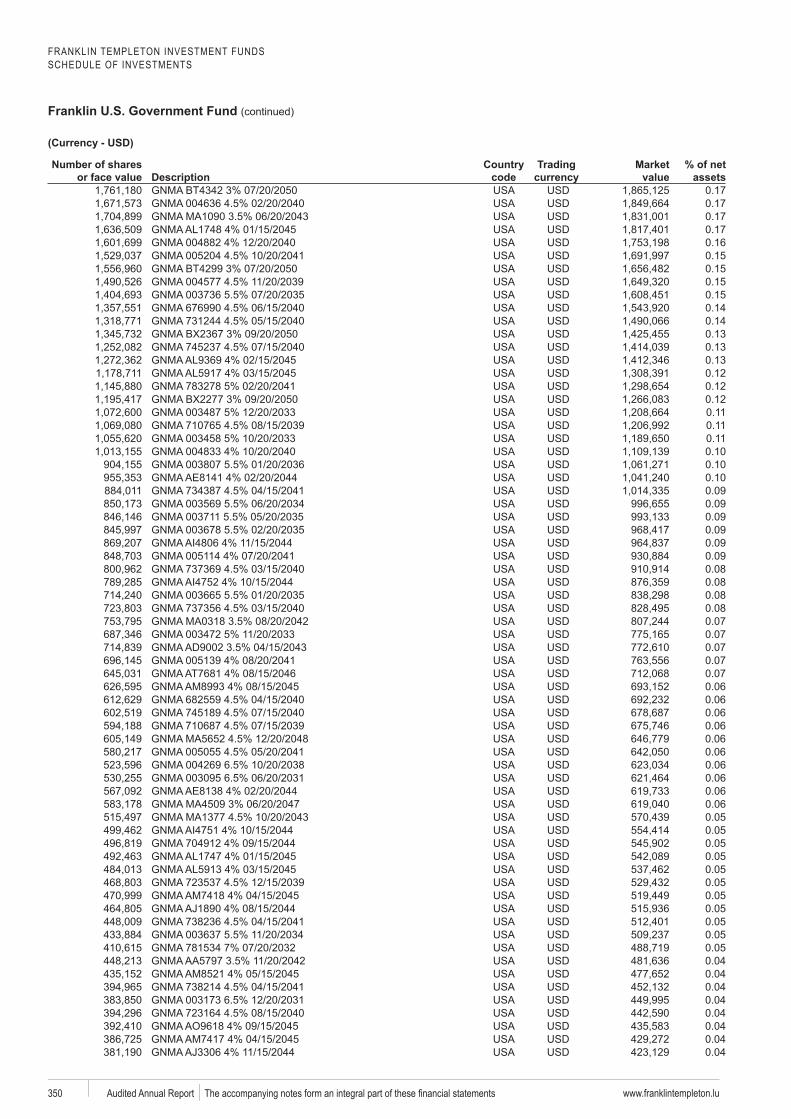
FRANKLIN TEMPLETON INVESTMENT FUNDSSCHEDULE OF INVESTMENTS
Franklin U.S. Government Fund (continued)
www.franklintempleton.lu350 Audited Annual Report
Number of shares or face value Description
code
Trading Market value
% of net assets
0.170.170.170.170.160.150.150.150.150.140.140.130.130.130.120.120.120.110.110.110.100.100.100.090.090.090.090.090.090.080.080.080.080.070.070.070.070.070.060.060.060.060.060.060.060.060.060.060.050.050.050.050.050.050.050.050.050.050.050.040.040.040.040.040.040.040.04
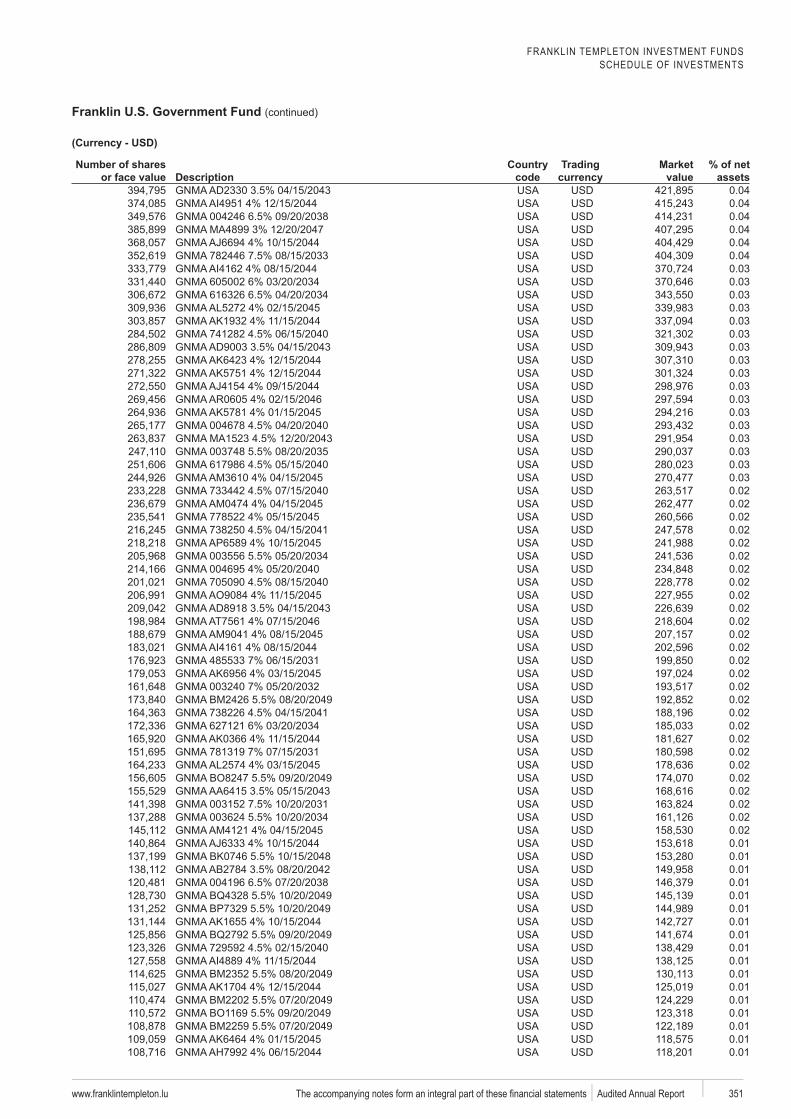
FRANKLIN TEMPLETON INVESTMENT FUNDSSCHEDULE OF INVESTMENTS
Franklin U.S. Government Fund (continued)
www.franklintempleton.lu 351 Audited Annual Report
Number of shares or face value Description
code
Trading Market value
% of net assets
0.040.040.040.040.040.040.030.030.030.030.030.030.030.030.030.030.030.030.030.030.030.030.030.020.020.020.020.020.020.020.020.020.020.020.020.020.020.020.020.020.020.020.020.020.020.020.020.020.020.020.010.010.010.010.010.010.010.010.010.010.010.010.010.010.010.010.01
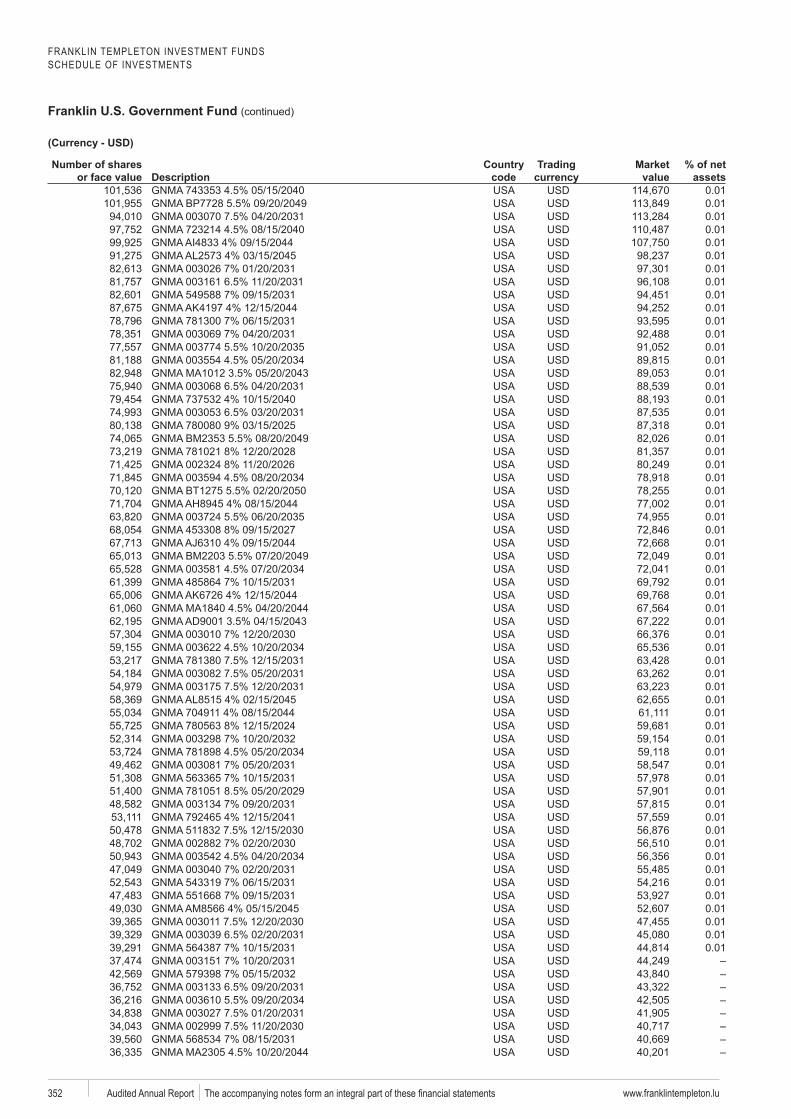
FRANKLIN TEMPLETON INVESTMENT FUNDSSCHEDULE OF INVESTMENTS
Franklin U.S. Government Fund (continued)
www.franklintempleton.lu352 Audited Annual Report
Number of shares or face value Description
code
Trading Market value
% of net assets
0.010.010.010.010.010.010.010.010.010.010.010.010.010.010.010.010.010.010.010.010.010.010.010.010.010.010.010.010.010.010.010.010.010.010.010.010.010.010.010.010.010.010.010.010.010.010.010.010.010.010.010.010.010.010.010.010.010.010.01
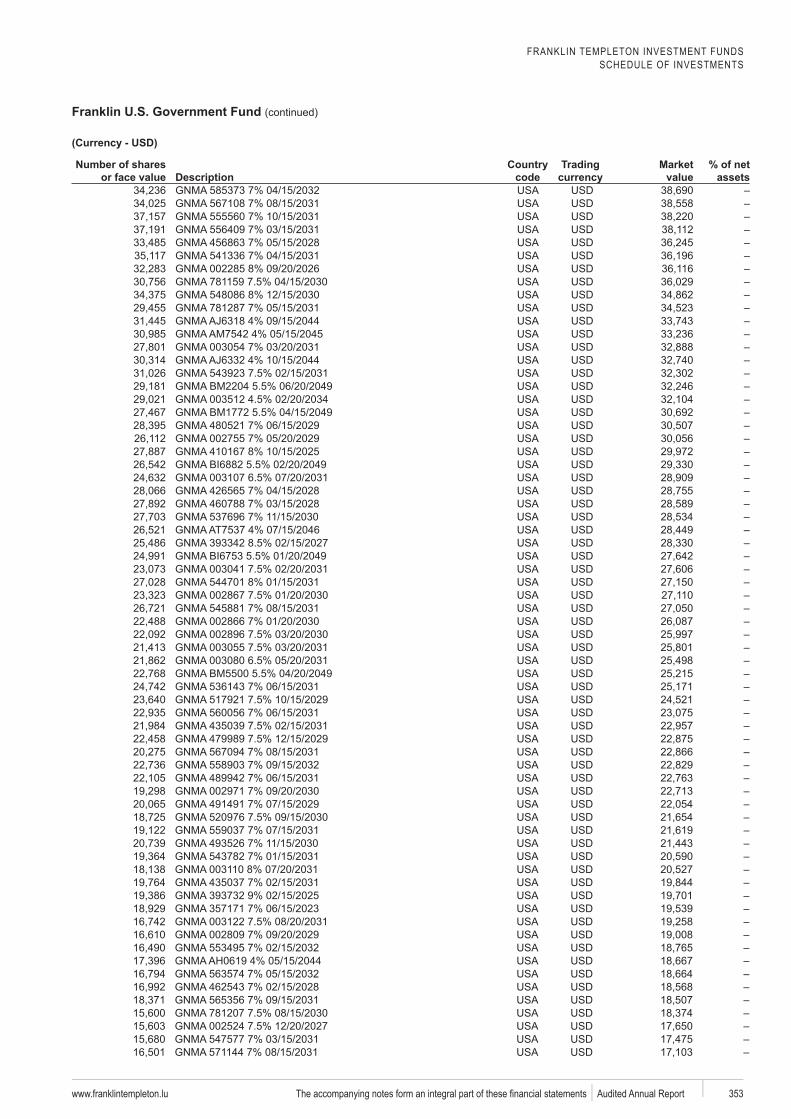
FRANKLIN TEMPLETON INVESTMENT FUNDSSCHEDULE OF INVESTMENTS
Franklin U.S. Government Fund (continued)
www.franklintempleton.lu 353 Audited Annual Report
Number of shares or face value Description
code
Trading Market value
% of net assets
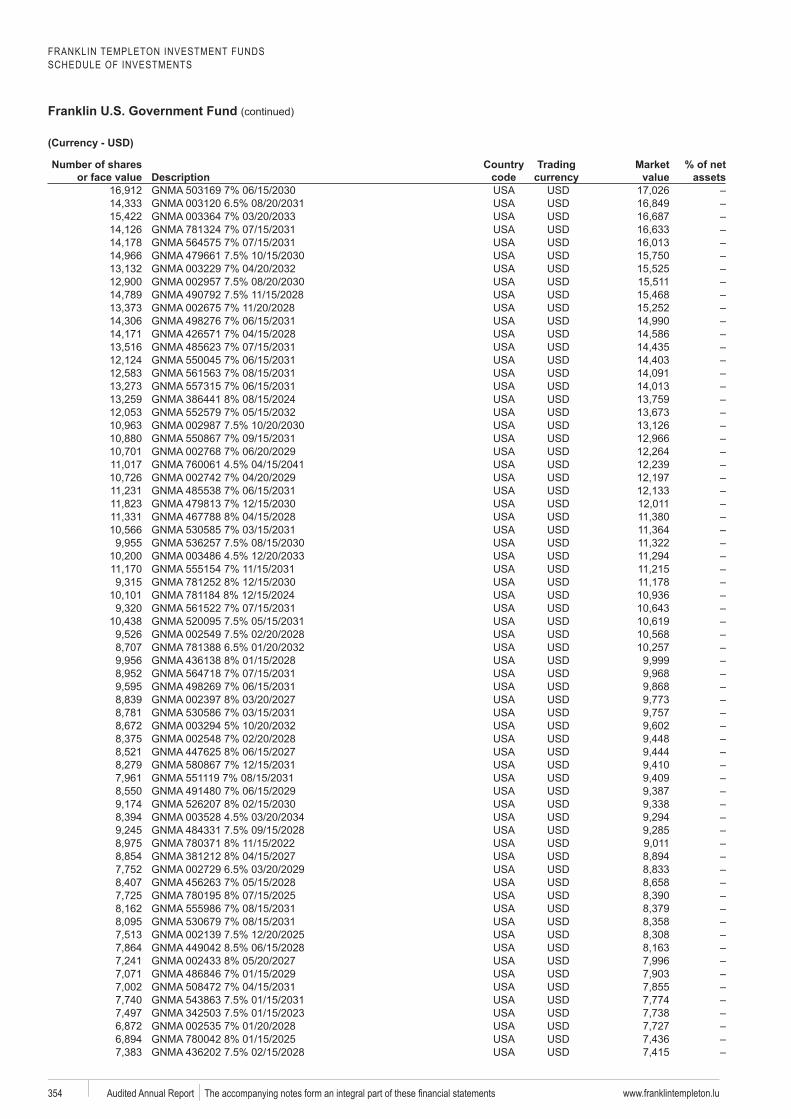
FRANKLIN TEMPLETON INVESTMENT FUNDSSCHEDULE OF INVESTMENTS
Franklin U.S. Government Fund (continued)
www.franklintempleton.lu354 Audited Annual Report
Number of shares or face value Description
code
Trading Market value
% of net assets
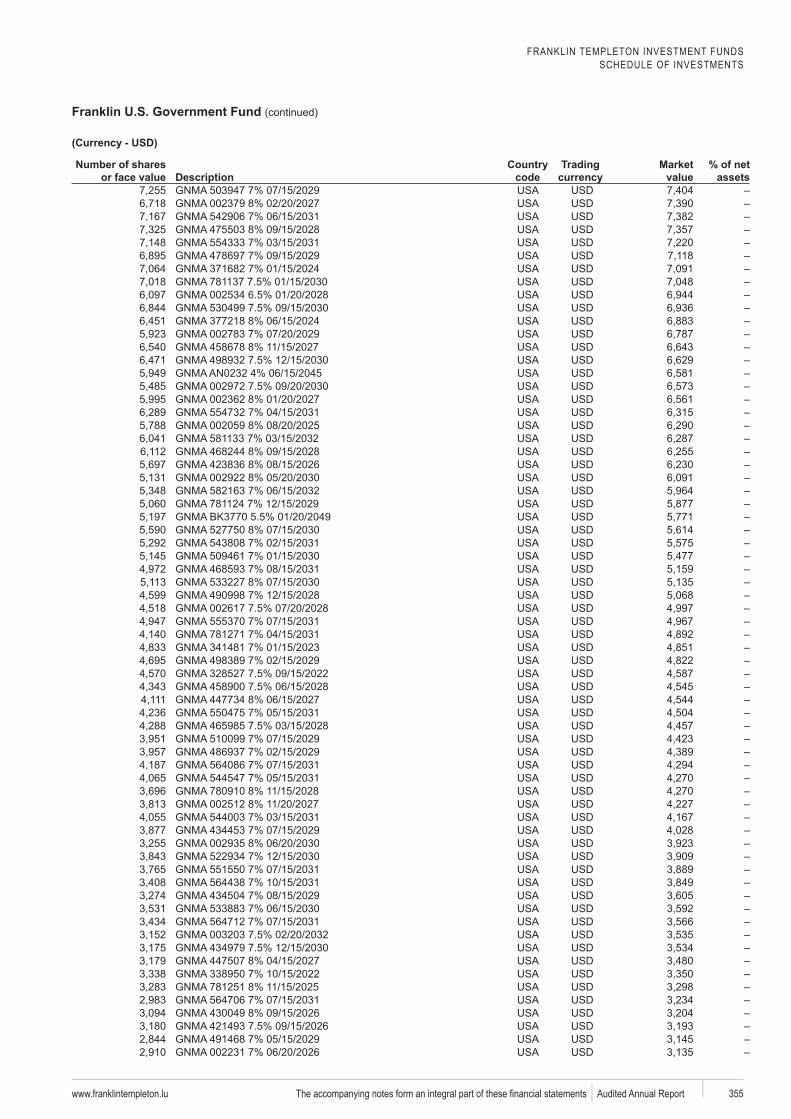
FRANKLIN TEMPLETON INVESTMENT FUNDSSCHEDULE OF INVESTMENTS
Franklin U.S. Government Fund (continued)
www.franklintempleton.lu 355 Audited Annual Report
Number of shares or face value Description
code
Trading Market value
% of net assets

FRANKLIN TEMPLETON INVESTMENT FUNDSSCHEDULE OF INVESTMENTS
Franklin U.S. Government Fund (continued)
www.franklintempleton.lu356 Audited Annual Report
Number of shares or face value Description
code
Trading Market value
% of net assets
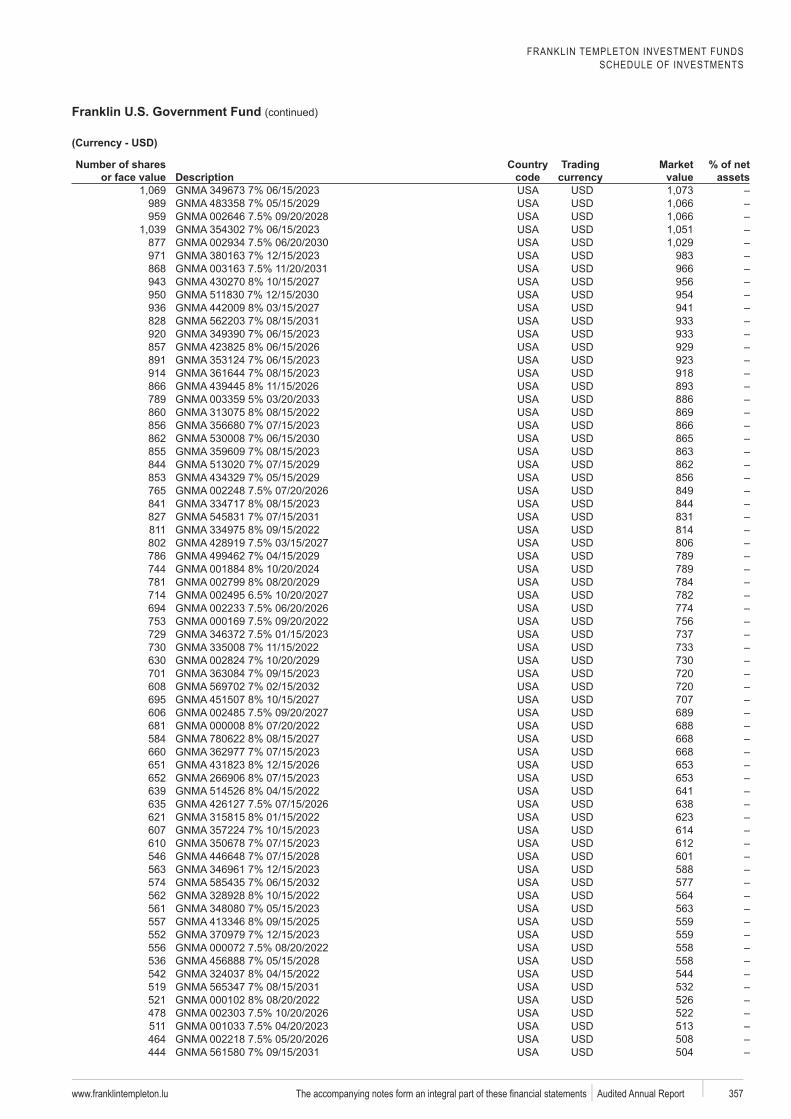
FRANKLIN TEMPLETON INVESTMENT FUNDSSCHEDULE OF INVESTMENTS
Franklin U.S. Government Fund (continued)
www.franklintempleton.lu 357 Audited Annual Report
Number of shares or face value Description
code
Trading Market value
% of net assets
989959
877971 983868 966943 956950 954936 941828 933920 933857 929891 923914 918866 893789 886860 869856 866862 865855 863844 862853 856765 849841 844827 831811 814802 806786 789744 789781 784714 782694 774753 756729 737730 733630 730701 720608 720695 707606 689681 688584 668660 668651 653652 653639 641635 638621 623607 614610 612546 601563 588574 577562 564561 563557 559552 559556 558536 558542 544519 532521 526478 522511 513464 508444 504
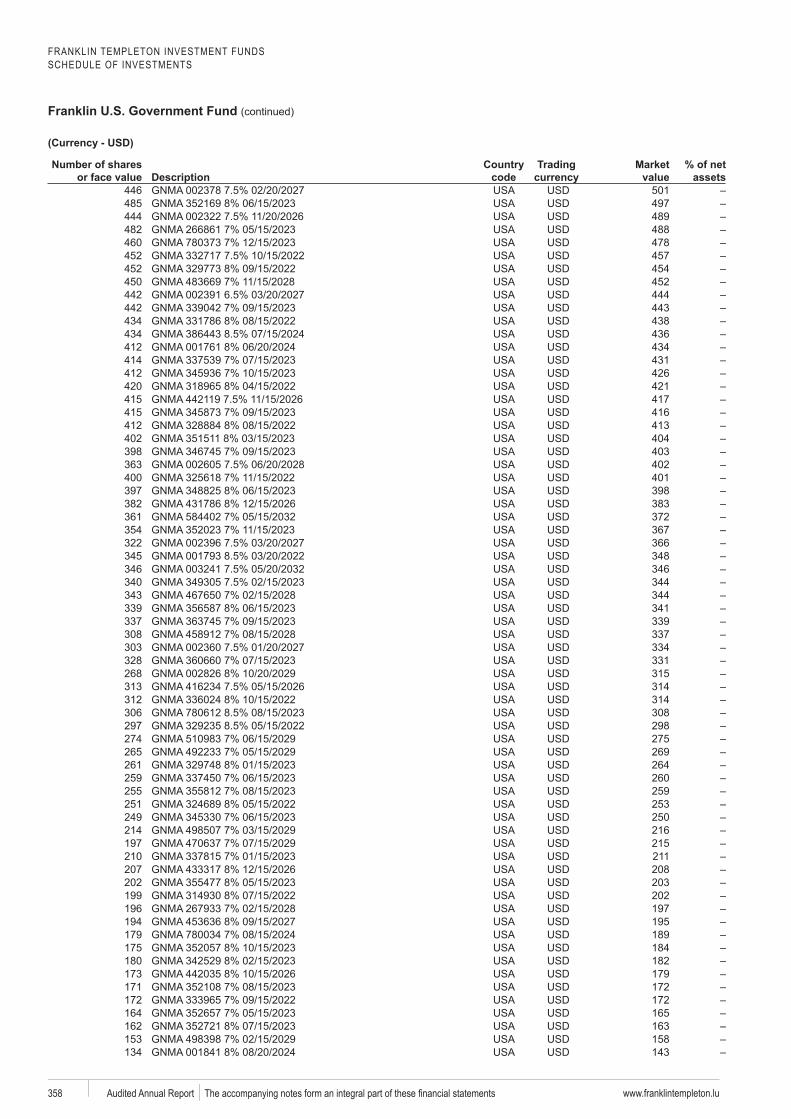
FRANKLIN TEMPLETON INVESTMENT FUNDSSCHEDULE OF INVESTMENTS
Franklin U.S. Government Fund (continued)
www.franklintempleton.lu358 Audited Annual Report
Number of shares or face value Description
code
Trading Market value
% of net assets
446 501485 497444 489482 488460 478452 457452 454450 452442 444442 443434 438434 436412 434414 431412 426420 421415 417415 416412 413402 404398 403363 402400 401397 398382 383361 372354 367322 366345 348346 346340 344343 344339 341337 339308 337303 334328 331268 315313 314312 314306 308297 298274 275265 269261 264259 260255 259251 253249 250214 216197 215210 211207 208202 203199 202196 197194 195179 189175 184180 182173 179171 172172 172164 165162 163153 158134 143
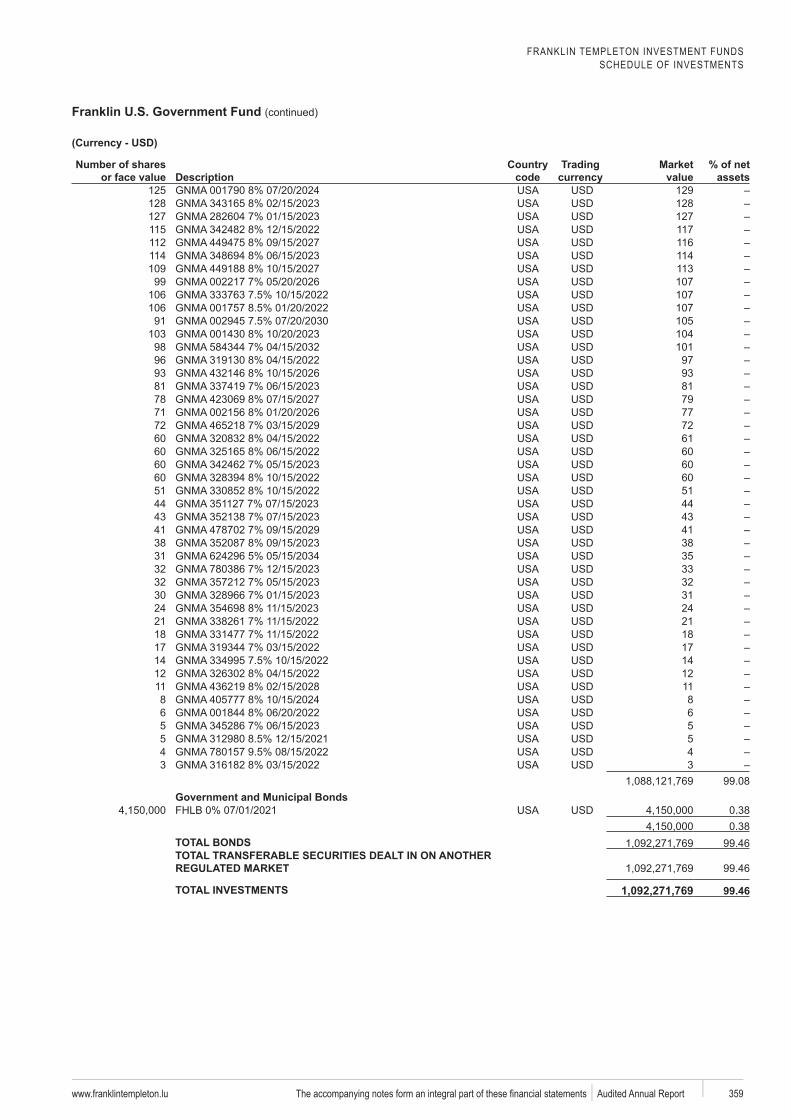
FRANKLIN TEMPLETON INVESTMENT FUNDSSCHEDULE OF INVESTMENTS
Franklin U.S. Government Fund (continued)
www.franklintempleton.lu 359 Audited Annual Report
Number of shares or face value Description
code
Trading Market value
% of net assets
125 129128 128127 127115 117112 116114 114109 11399 107
106 107106 10791 105
103 10498 10196 9793 9381 8178 7971 7772 7260 6160 6060 6060 6051 5144 4443 4341 4138 3831 3532 3332 3230 3124 2421 2118 1817 1714 1412 1211 118 86 65 55 54 43 3
99.08Government and Municipal Bonds
0.380.38
TOTAL BONDS 99.46TOTAL TRANSFERABLE SECURITIES DEALT IN ON ANOTHER
99.46
TOTAL INVESTMENTS 1,092,271,769
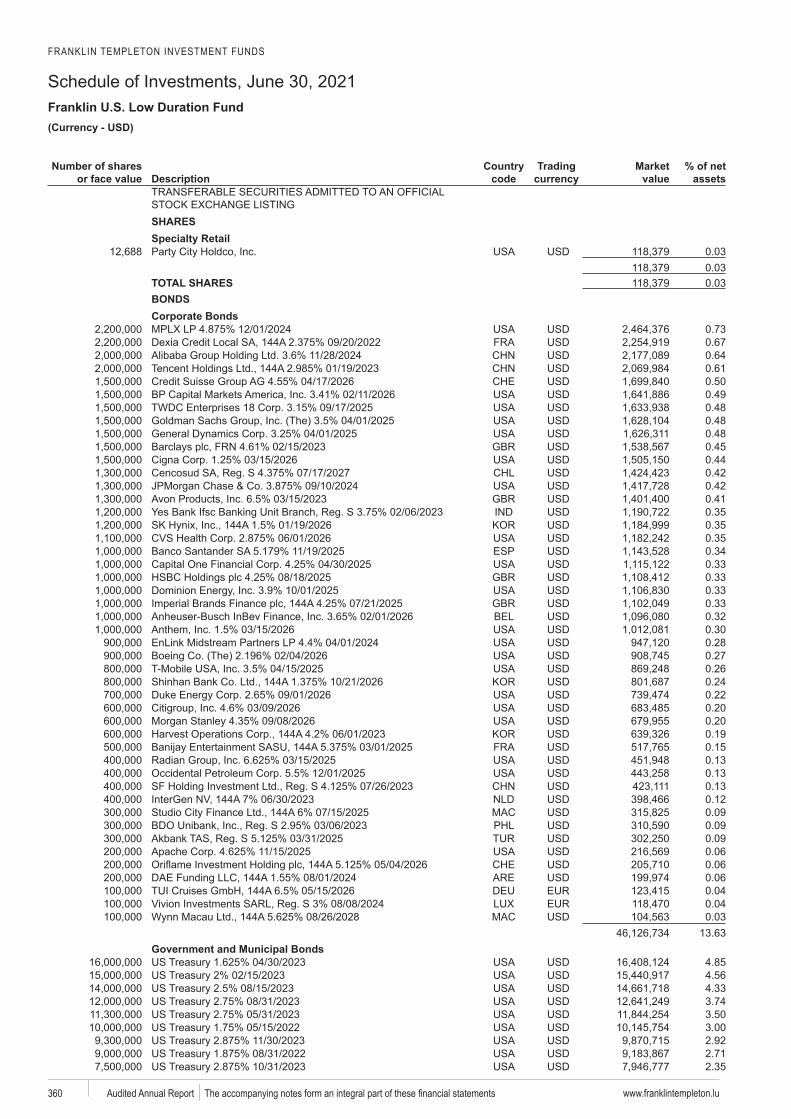
FRANKLIN TEMPLETON INVESTMENT FUNDS
Schedule of Investments, June 30, 2021Franklin U.S. Low Duration Fund
www.franklintempleton.lu360 Audited Annual Report
USD)
Number of shares or face value Description
code
Trading Market value
% of net assets
SHARES
0.030.03
TOTAL SHARES 0.03BONDSCorporate Bonds
0.73Dexia 0.67
0.64Tencent 0.61
0.500.490.480.480.480.450.440.420.420.410.350.350.35
ESP 0.340.330.330.330.330.320.300.280.270.26
Shinhan 0.240.220.200.200.190.150.130.130.130.120.090.090.090.060.060.060.040.040.03
13.63Government and Municipal Bonds
4.854.564.333.743.503.002.922.712.35
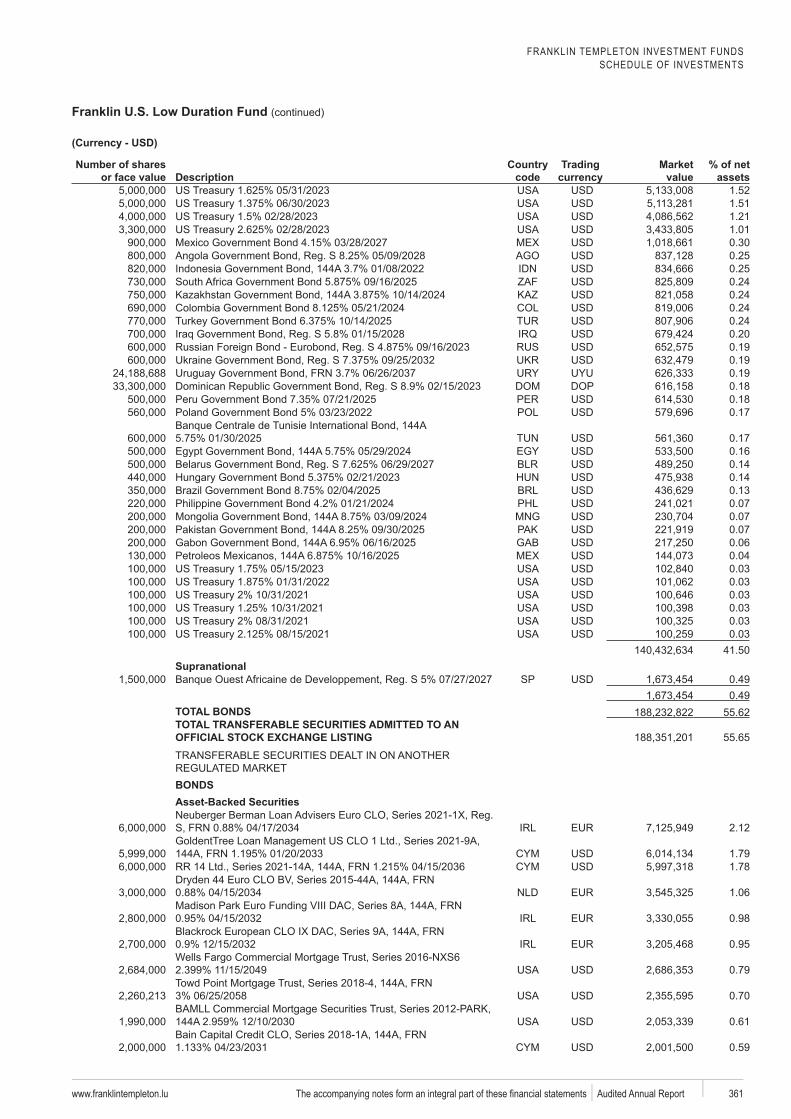
FRANKLIN TEMPLETON INVESTMENT FUNDSSCHEDULE OF INVESTMENTS
Franklin U.S. Low Duration Fund (continued)
www.franklintempleton.lu 361 Audited Annual Report
Number of shares or face value Description
code
Trading Market value
% of net assets
1.521.511.211.010.300.250.250.240.240.240.240.200.190.190.190.180.180.17
Tunisie0.170.160.140.140.130.070.070.070.06
Petroleos 0.040.030.030.030.030.030.03
41.50Supranational
de SP 0.490.49
TOTAL BONDS 55.62TOTAL TRANSFERABLE SECURITIES ADMITTED TO AN
55.65
BONDSAsset-Backed Securities
2.12GoldentTree
1.791.78
1.06
0.98
0.95
0.79
0.70
0.61
0.59
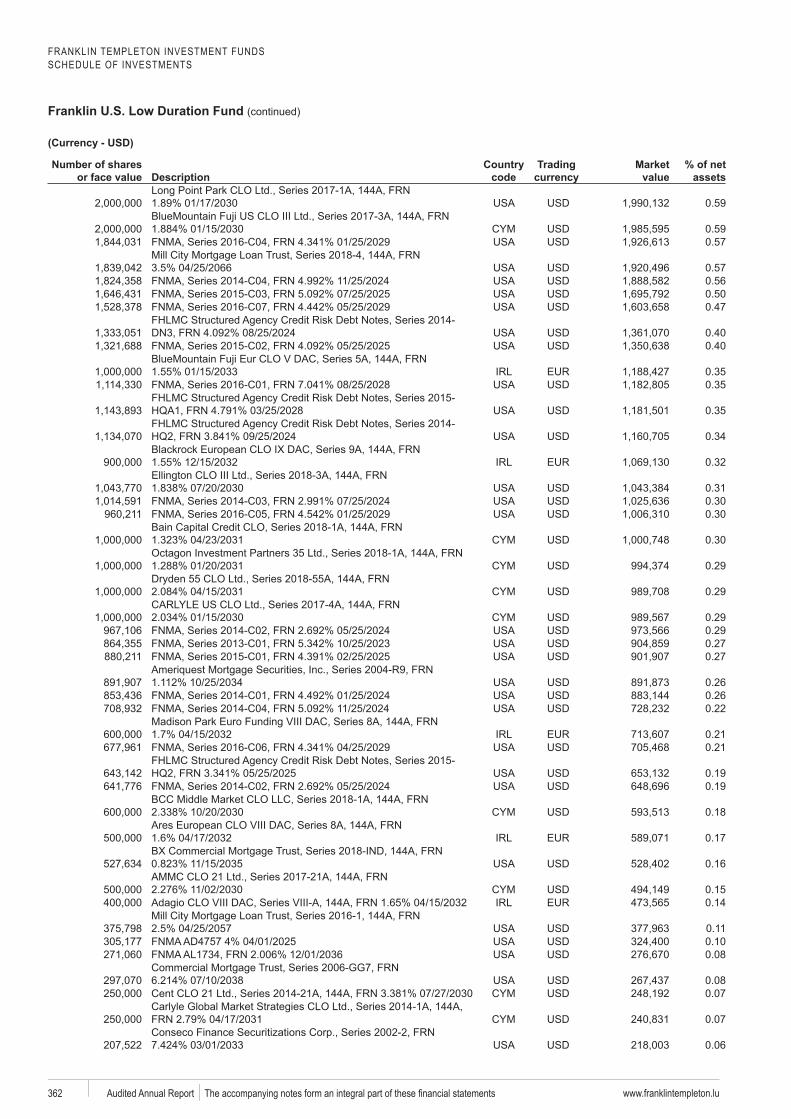
FRANKLIN TEMPLETON INVESTMENT FUNDSSCHEDULE OF INVESTMENTS
Franklin U.S. Low Duration Fund (continued)
www.franklintempleton.lu362 Audited Annual Report
Number of shares or face value Description
code
Trading Market value
% of net assets
0.59
0.590.57
0.570.560.500.47
0.400.40
Eur0.350.35
0.35
0.34
0.32
0.310.300.30
0.30
0.29
0.29
0.290.290.270.27
0.260.260.22
0.210.21
0.190.19
0.18
0.17
0.16
0.150.14
0.110.100.08
0.080.07
0.07
0.06
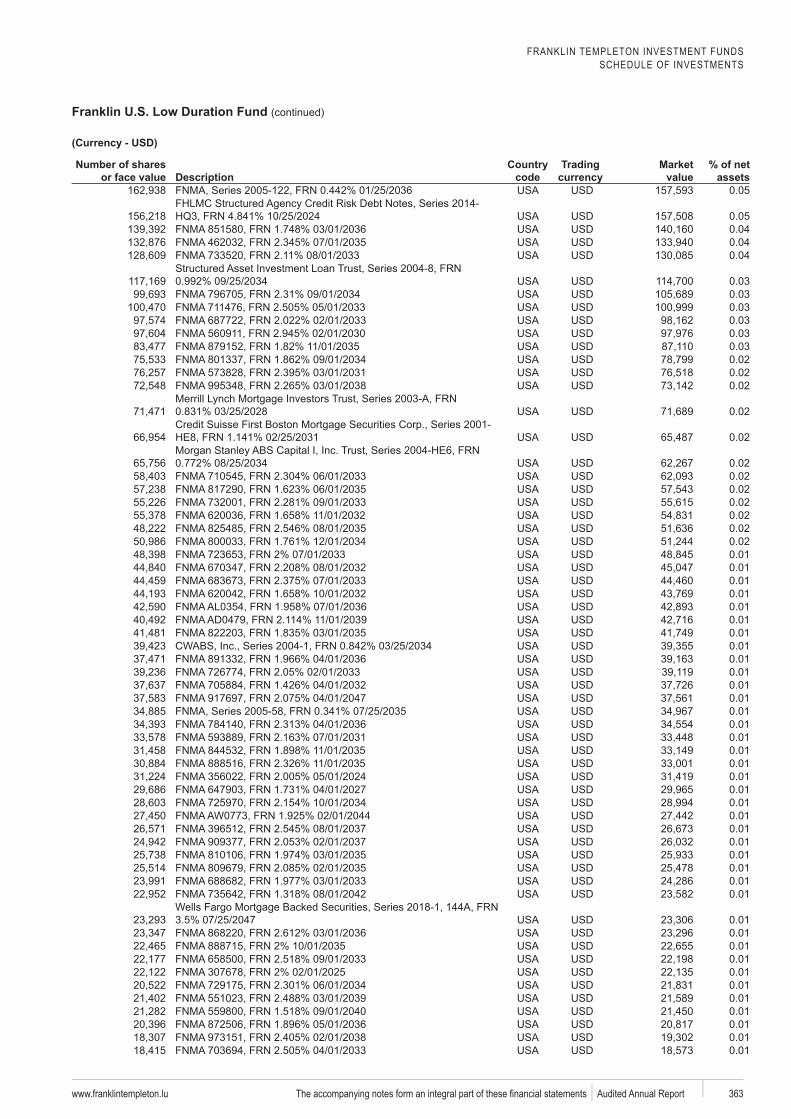
FRANKLIN TEMPLETON INVESTMENT FUNDSSCHEDULE OF INVESTMENTS
Franklin U.S. Low Duration Fund (continued)
www.franklintempleton.lu 363 Audited Annual Report
Number of shares or face value Description
code
Trading Market value
% of net assets
0.05
0.050.040.040.04
0.030.030.030.030.030.030.020.020.02
0.02
0.02
0.020.020.020.020.020.020.020.010.010.010.010.010.010.010.010.010.010.010.010.010.010.010.010.010.010.010.010.010.010.010.010.010.010.01
0.010.010.010.010.010.010.010.010.010.010.01
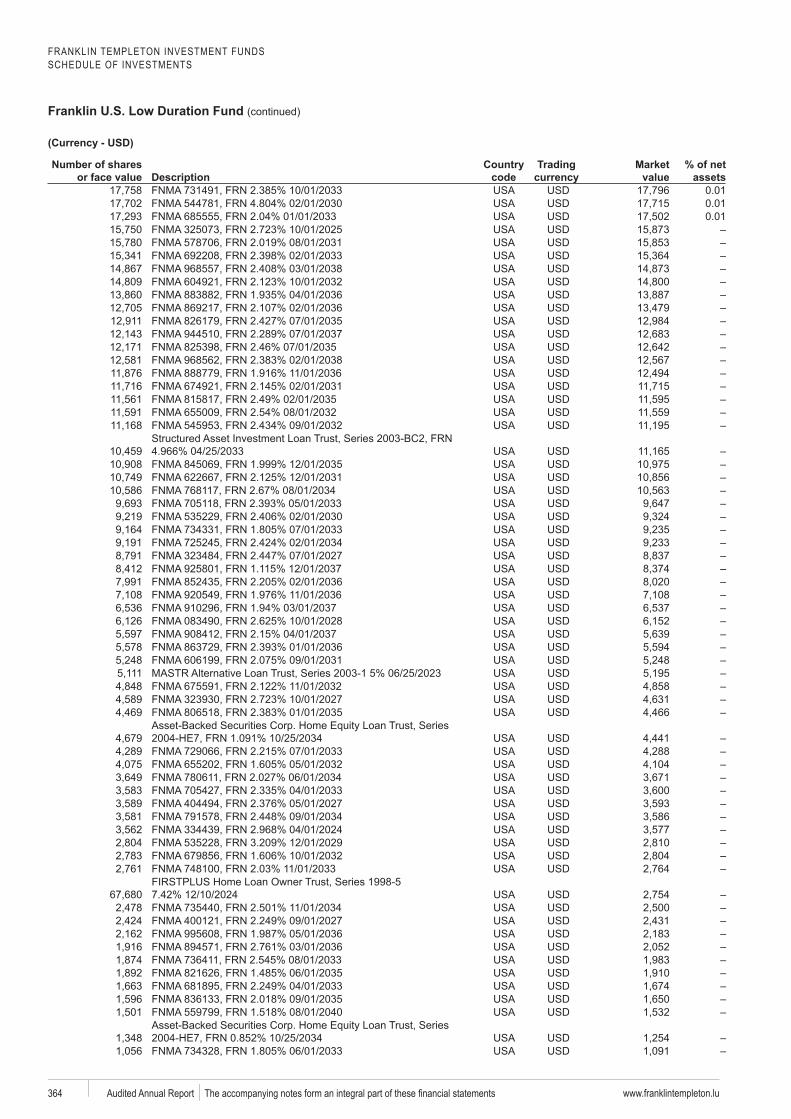
FRANKLIN TEMPLETON INVESTMENT FUNDSSCHEDULE OF INVESTMENTS
Franklin U.S. Low Duration Fund (continued)
www.franklintempleton.lu364 Audited Annual Report
Number of shares or face value Description
code
Trading Market value
% of net assets
0.010.010.01
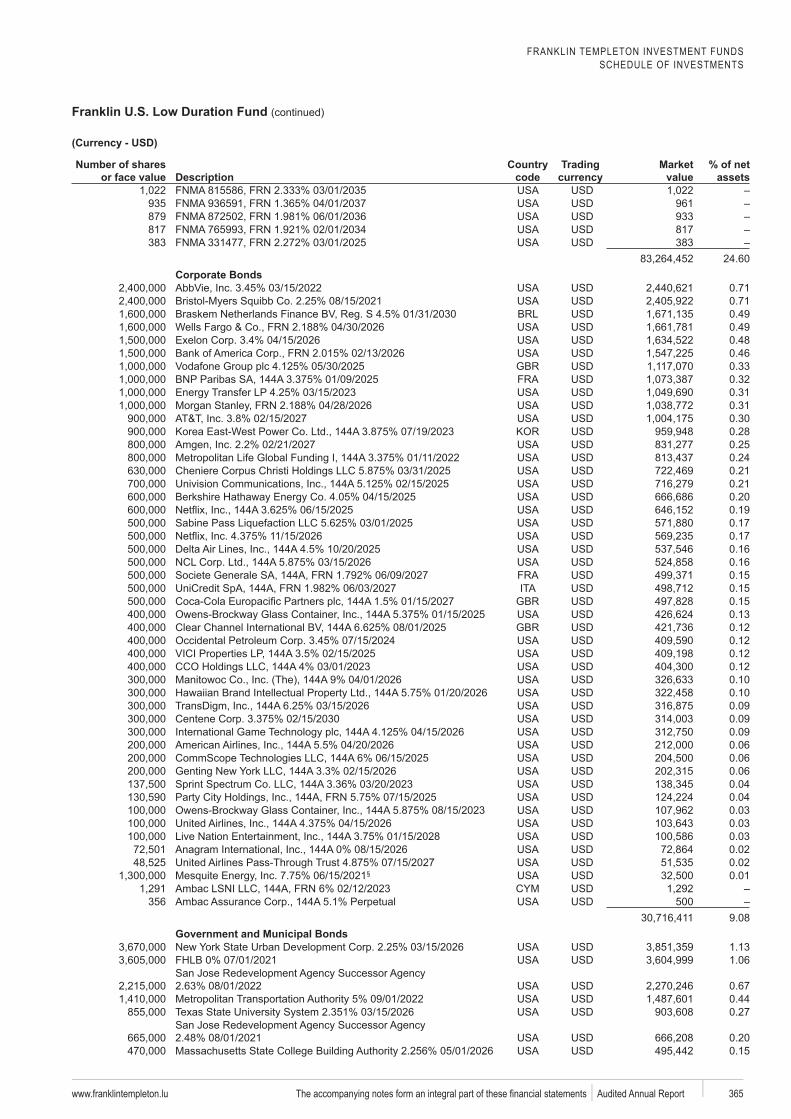
FRANKLIN TEMPLETON INVESTMENT FUNDSSCHEDULE OF INVESTMENTS
Franklin U.S. Low Duration Fund (continued)
www.franklintempleton.lu 365 Audited Annual Report
Number of shares or face value Description
code
Trading Market value
% of net assets
935 961879 933817 817383 383
24.60Corporate Bonds
0.710.710.490.490.480.460.330.320.310.310.300.280.250.240.210.210.200.190.170.170.160.16
Societe Generale 0.15 0.15
0.150.130.120.120.120.120.100.100.090.090.090.060.060.060.040.040.030.030.030.020.02
§ 0.01
356 5009.08
Government and Municipal Bonds1.131.06
0.670.440.27
0.200.15
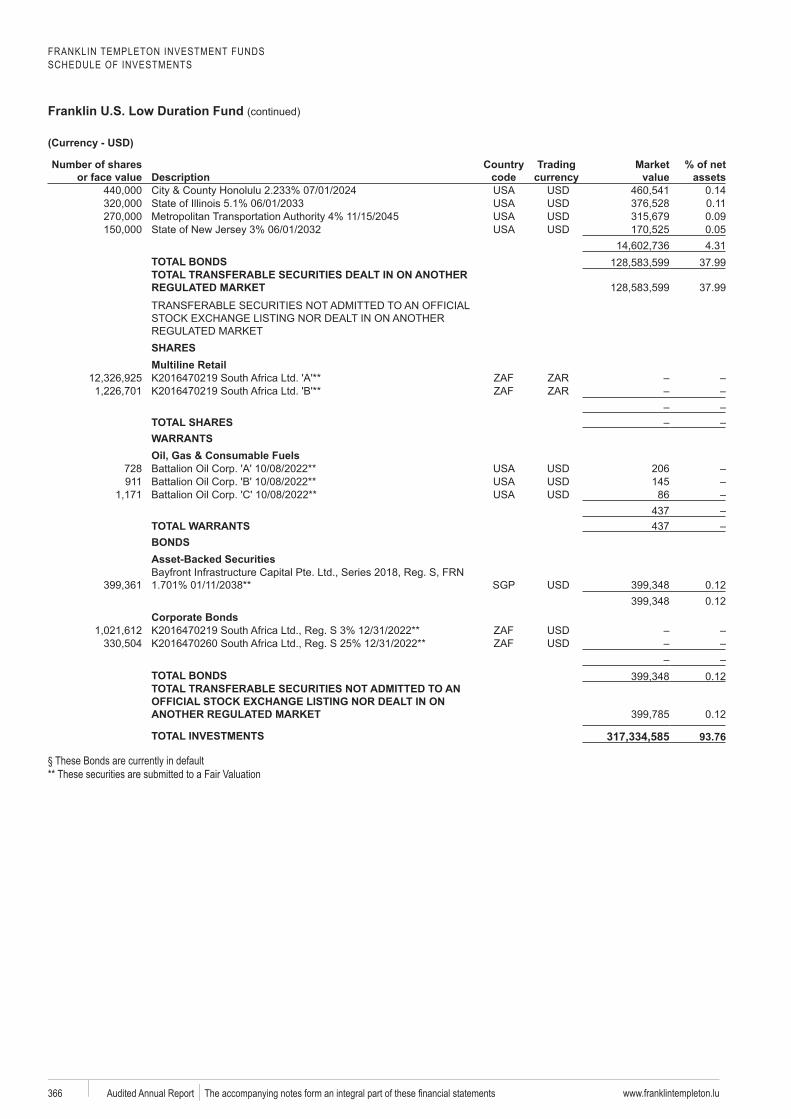
FRANKLIN TEMPLETON INVESTMENT FUNDSSCHEDULE OF INVESTMENTS
Franklin U.S. Low Duration Fund (continued)
www.franklintempleton.lu366 Audited Annual Report
Number of shares or face value Description
code
Trading Market value
% of net assets
0.140.110.090.054.31
TOTAL BONDS 37.99TOTAL TRANSFERABLE SECURITIES DEALT IN ON ANOTHER
37.99
SHARESMultiline Retail
TOTAL SHARESWARRANTSOil, Gas & Consumable Fuels
728 206911 145
86437
TOTAL WARRANTS 437BONDSAsset-Backed Securities
SGP 0.120.12
Corporate Bonds
TOTAL BONDS 0.12TOTAL TRANSFERABLE SECURITIES NOT ADMITTED TO AN
0.12
TOTAL INVESTMENTS 317,334,585B
§ These Bonds are currently in default** These securities are submitted to a Fair Valuation
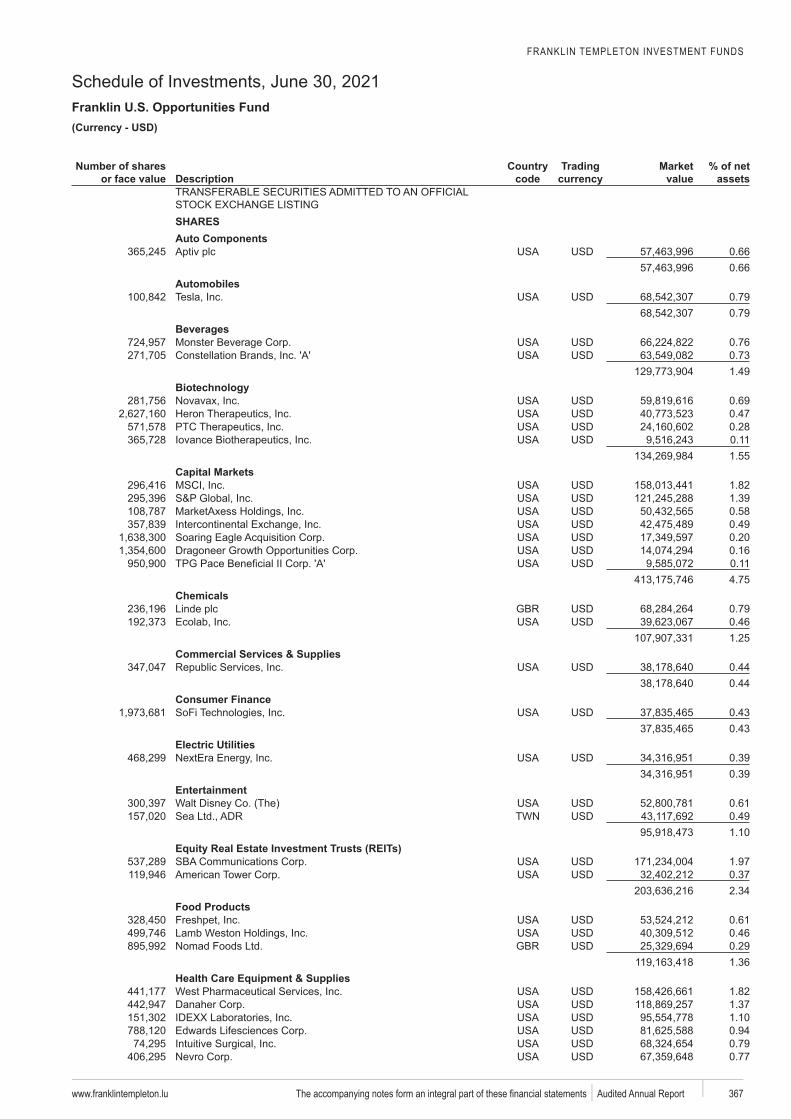
FRANKLIN TEMPLETON INVESTMENT FUNDS
Schedule of Investments, June 30, 2021Franklin U.S. Opportunities Fund
www.franklintempleton.lu 367 Audited Annual Report
USD)
Number of shares or face value Description
code
Trading Market value
% of net assets
SHARESAuto Components
0.660.66
Automobiles0.790.79
Beverages0.760.731.49
0.690.470.28
0.111.55
Capital Markets1.821.390.580.490.20
Dragoneer 0.160.114.75
Chemicals0.790.461.25
Commercial Services & Supplies0.440.44
Consumer FinanceSoFi 0.43
0.43Electric Utilities
0.390.39
Entertainment0.610.491.10
1.970.372.34
Food Products0.610.460.291.36
Health Care Equipment & Supplies1.821.371.100.940.790.77
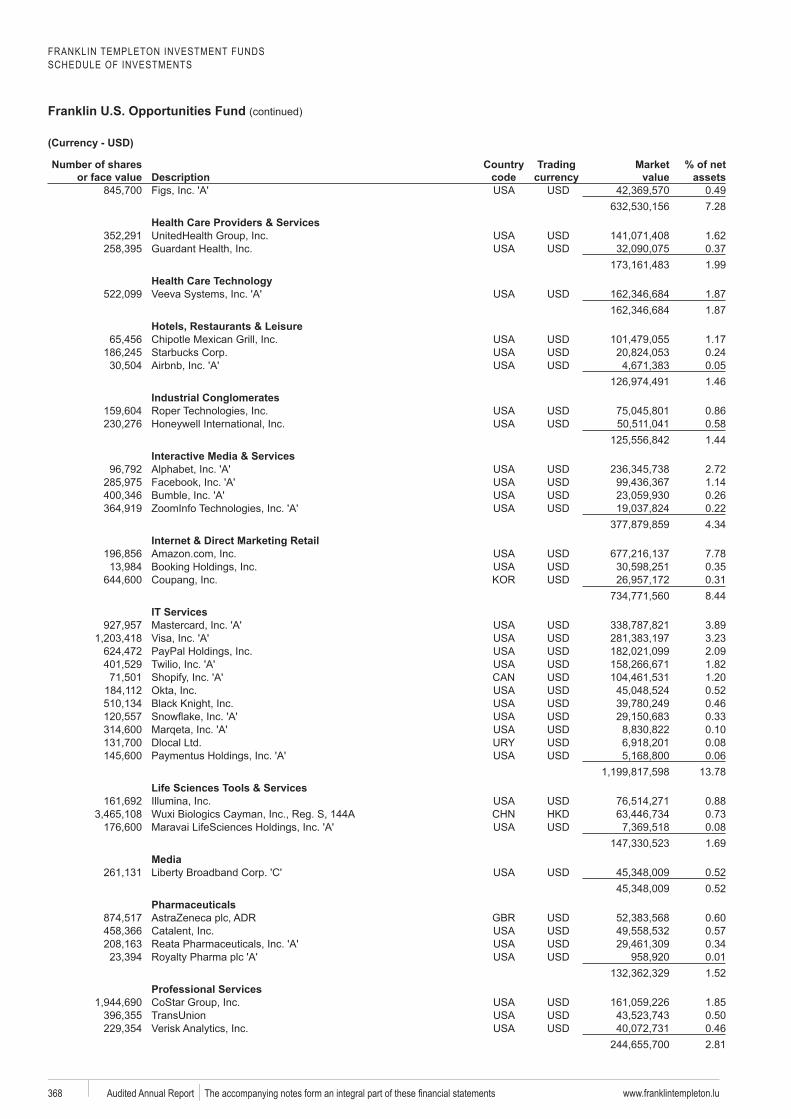
FRANKLIN TEMPLETON INVESTMENT FUNDSSCHEDULE OF INVESTMENTS
Franklin U.S. Opportunities Fund (continued)
www.franklintempleton.lu368 Audited Annual Report
Number of shares or face value Description
code
Trading Market value
% of net assets
0.497.28
Health Care Providers & Services1.620.371.99
1.871.87
Hotels, Restaurants & Leisure1.170.240.051.46
Industrial Conglomerates0.860.581.44
Interactive Media & Services2.721.140.260.224.34
Internet & Direct Marketing Retail7.780.350.318.44
IT Services3.893.232.091.821.200.520.460.330.10
Dlocal 0.080.06
13.78Life Sciences Tools & Services
0.880.73
0.081.69
Media0.520.52
Pharmaceuticals0.600.570.340.011.52
Professional Services1.850.500.462.81
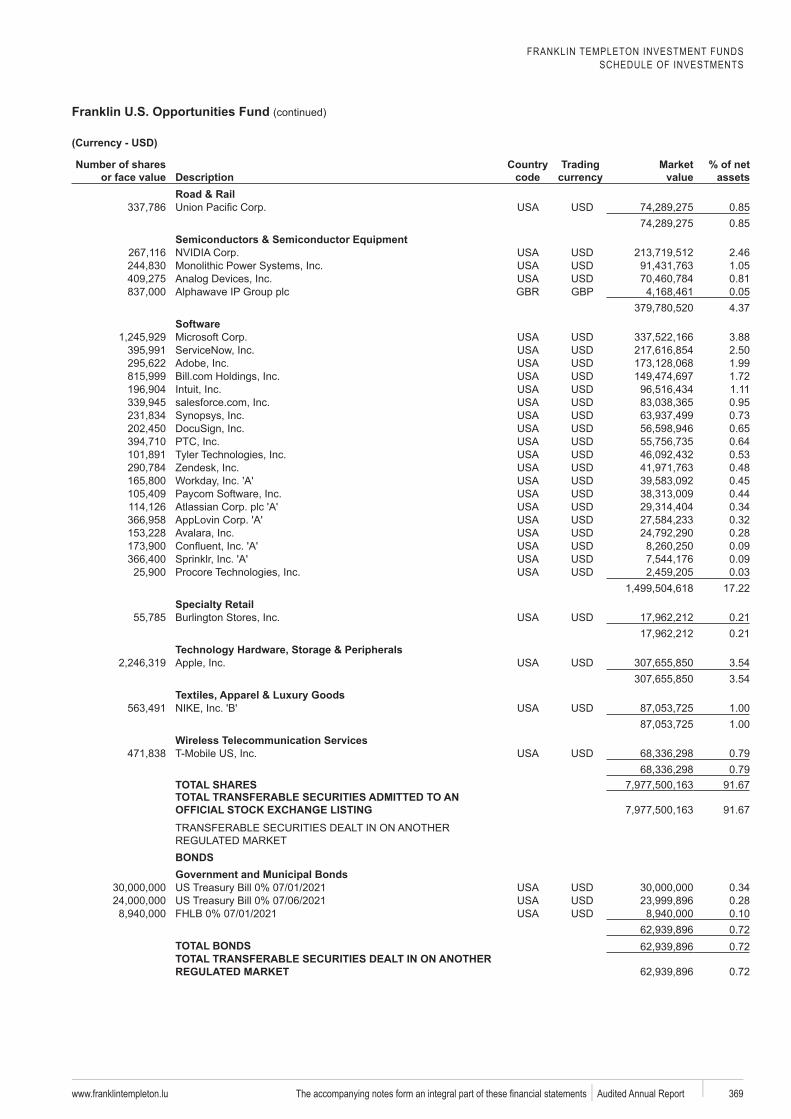
FRANKLIN TEMPLETON INVESTMENT FUNDSSCHEDULE OF INVESTMENTS
Franklin U.S. Opportunities Fund (continued)
www.franklintempleton.lu 369 Audited Annual Report
Number of shares or face value Description
code
Trading Market value
% of net assets
Road & Rail0.850.85
Semiconductors & Semiconductor Equipment2.461.050.81
GBP 0.054.37
3.882.501.991.721.110.950.730.650.640.53
Zendesk 0.480.450.440.340.320.280.090.09
Procore 0.0317.22
0.210.21
3.543.54
1.001.00
Wireless Telecommunication Services0.790.79
TOTAL SHARES 91.67TOTAL TRANSFERABLE SECURITIES ADMITTED TO AN
91.67
BONDSGovernment and Municipal Bonds
0.340.280.100.72
TOTAL BONDS 0.72TOTAL TRANSFERABLE SECURITIES DEALT IN ON ANOTHER
0.72
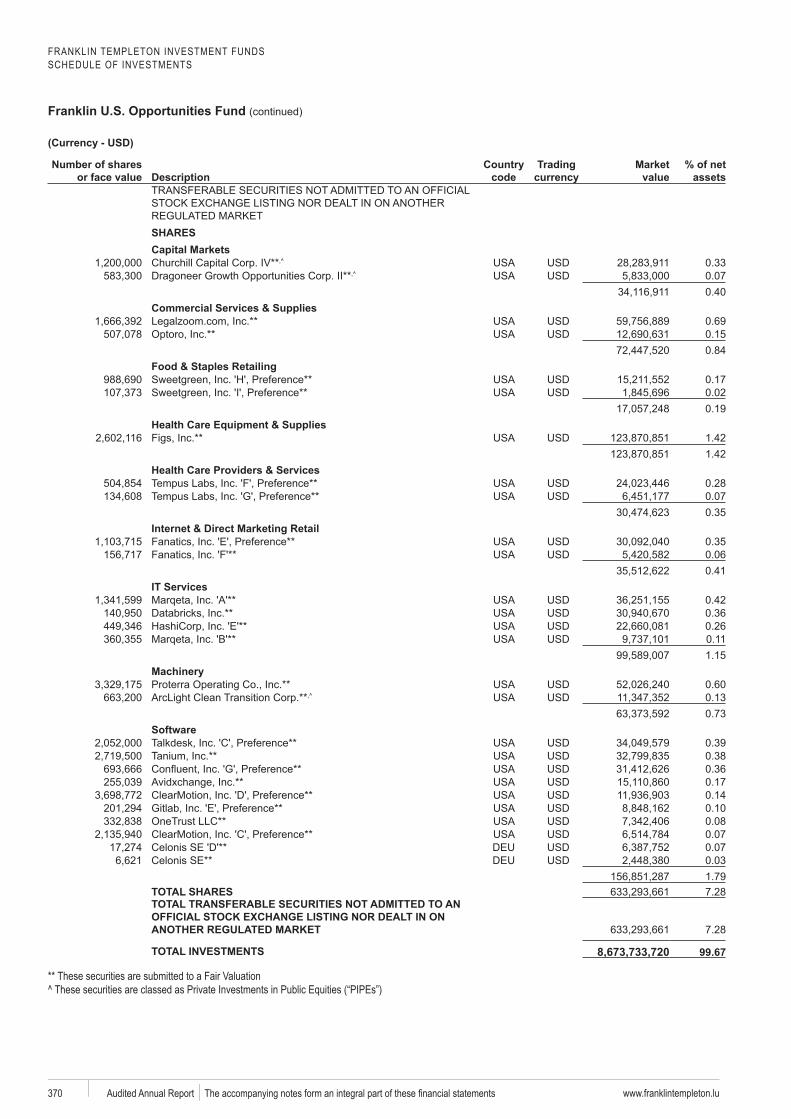
FRANKLIN TEMPLETON INVESTMENT FUNDSSCHEDULE OF INVESTMENTS
Franklin U.S. Opportunities Fund (continued)
www.franklintempleton.lu370 Audited Annual Report
Number of shares or face value Description
code
Trading Market value
% of net assets
SHARESCapital Markets
0.33Dragoneer 0.07
0.40Commercial Services & Supplies
0.690.150.84
Food & Staples Retailing0.170.020.19
Health Care Equipment & Supplies1.421.42
Health Care Providers & Services0.280.070.35
Internet & Direct Marketing Retail0.350.060.41
IT Services0.420.360.260.111.15
Proterra 0.600.130.73
Talkdesk 0.390.380.360.170.140.100.080.070.07
SE** 0.031.79
TOTAL SHARES 7.28TOTAL TRANSFERABLE SECURITIES NOT ADMITTED TO AN
7.28
TOTAL INVESTMENTS 8,673,733,720B
** These securities are submitted to a Fair Valuation^ These securities are classed as Private Investments in Public Equities (“PIPEs”)
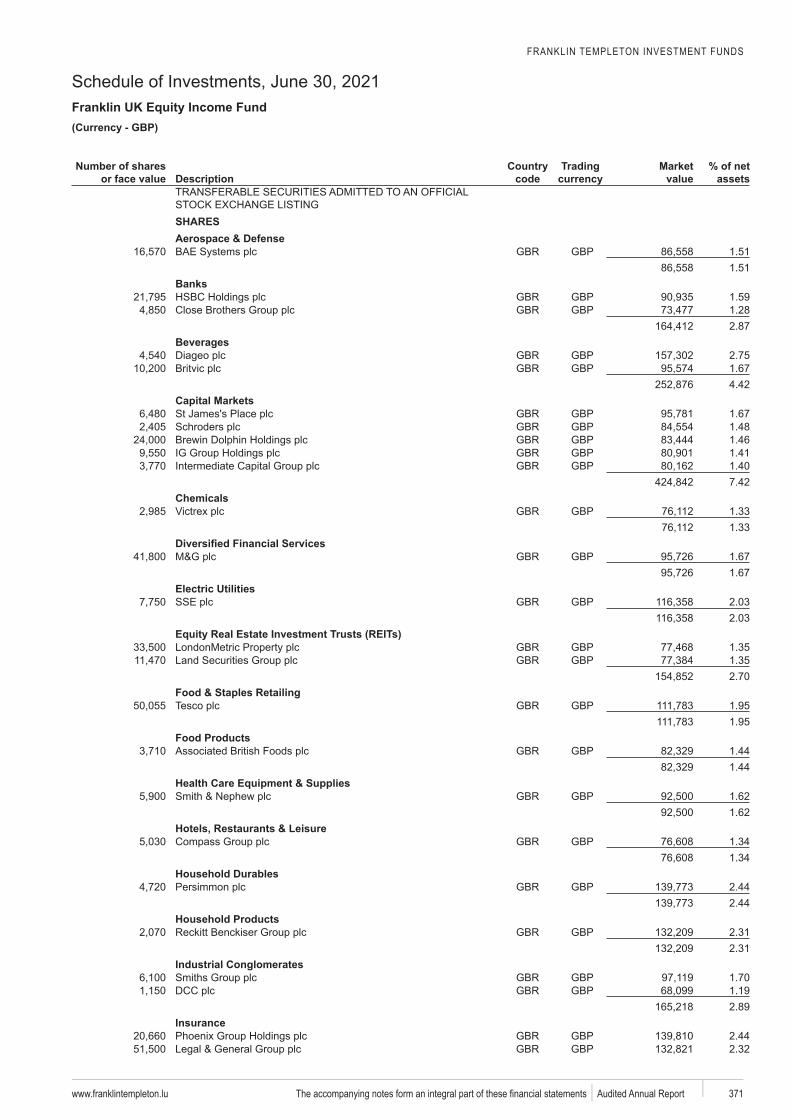
FRANKLIN TEMPLETON INVESTMENT FUNDS
Schedule of Investments, June 30, 2021Franklin UK Equity Income Fund
www.franklintempleton.lu 371 Audited Annual Report
GBP)
Number of shares or face value Description
code
Trading Market value
% of net assets
SHARESAerospace & Defense
GBP 1.511.51
BanksGBP 1.59GBP 1.28
2.87Beverages
GBP 2.75GBP 1.67
4.42Capital Markets
GBP 1.67GBP 1.48GBP 1.46GBP 1.41GBP 1.40
7.42Chemicals
GBP 1.331.33
GBP 1.671.67
Electric UtilitiesGBP 2.03
2.03
GBP 1.35GBP 1.35
2.70Food & Staples Retailing
GBP 1.951.95
Food ProductsGBP 1.44
1.44Health Care Equipment & Supplies
GBP 1.621.62
Hotels, Restaurants & LeisureGBP 1.34
1.34Household Durables
GBP 2.442.44
Household ProductsGBP 2.31
2.31Industrial Conglomerates
GBP 1.70GBP 1.19
2.89Insurance
GBP 2.44GBP 2.32
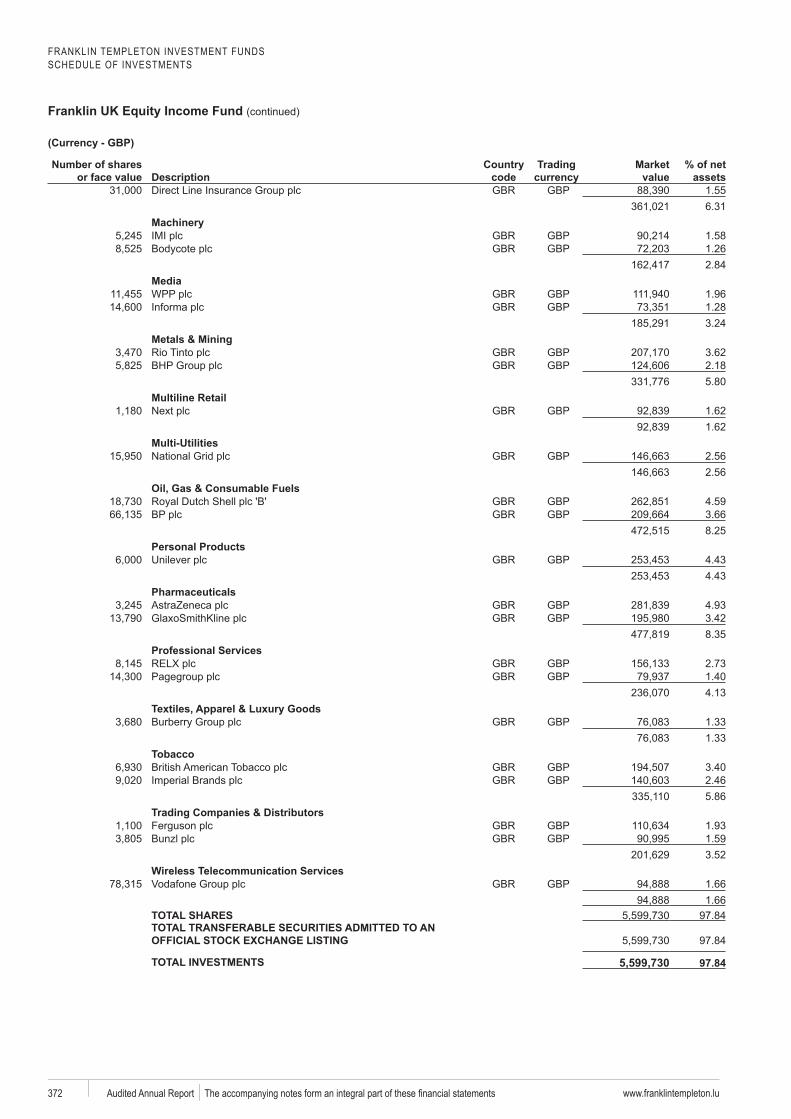
FRANKLIN TEMPLETON INVESTMENT FUNDSSCHEDULE OF INVESTMENTS
Franklin UK Equity Income Fund (continued)
www.franklintempleton.lu372 Audited Annual Report
Number of shares or face value Description
code
Trading Market value
% of net assets
GBP 1.556.31
GBP 1.58GBP 1.26
2.84Media
GBP 1.96GBP 1.28
3.24Metals & Mining
GBP 3.62GBP 2.18
5.80Multiline Retail
GBP 1.621.62
Multi-UtilitiesGBP 2.56
2.56Oil, Gas & Consumable Fuels
GBP 4.59GBP 3.66
8.25Personal Products
GBP 4.434.43
PharmaceuticalsGBP 4.93GBP 3.42
8.35Professional Services
GBP 2.73GBP 1.40
4.13
GBP 1.331.33
TobaccoGBP 3.40GBP 2.46
5.86Trading Companies & Distributors
GBP 1.93GBP 1.59
3.52Wireless Telecommunication Services
GBP 1.661.66
TOTAL SHARES 97.84TOTAL TRANSFERABLE SECURITIES ADMITTED TO AN
97.84
TOTAL INVESTMENTS 5,599,730
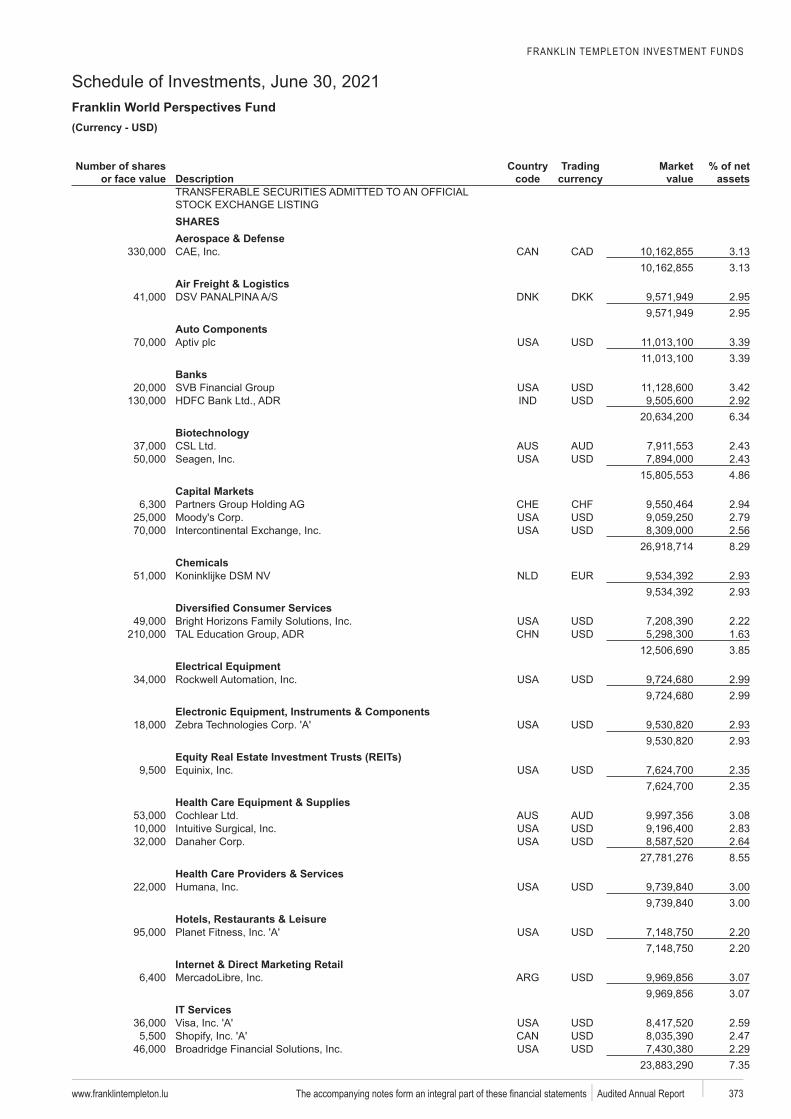
FRANKLIN TEMPLETON INVESTMENT FUNDS
Schedule of Investments, June 30, 2021Franklin World Perspectives Fund
www.franklintempleton.lu 373 Audited Annual Report
USD)
Number of shares or face value Description
code
Trading Market value
% of net assets
SHARESAerospace & Defense
3.133.13
Air Freight & LogisticsDKK 2.95
2.95Auto Components
3.393.39
Banks3.422.926.34
2.432.434.86
Capital Markets2.942.792.568.29
Chemicals2.932.93
2.221.633.85
Electrical Equipment2.992.99
Electronic Equipment, Instruments & Components2.932.93
2.352.35
Health Care Equipment & Supplies3.082.832.648.55
Health Care Providers & Services3.003.00
Hotels, Restaurants & Leisure2.202.20
Internet & Direct Marketing Retail3.073.07
IT Services2.592.472.297.35
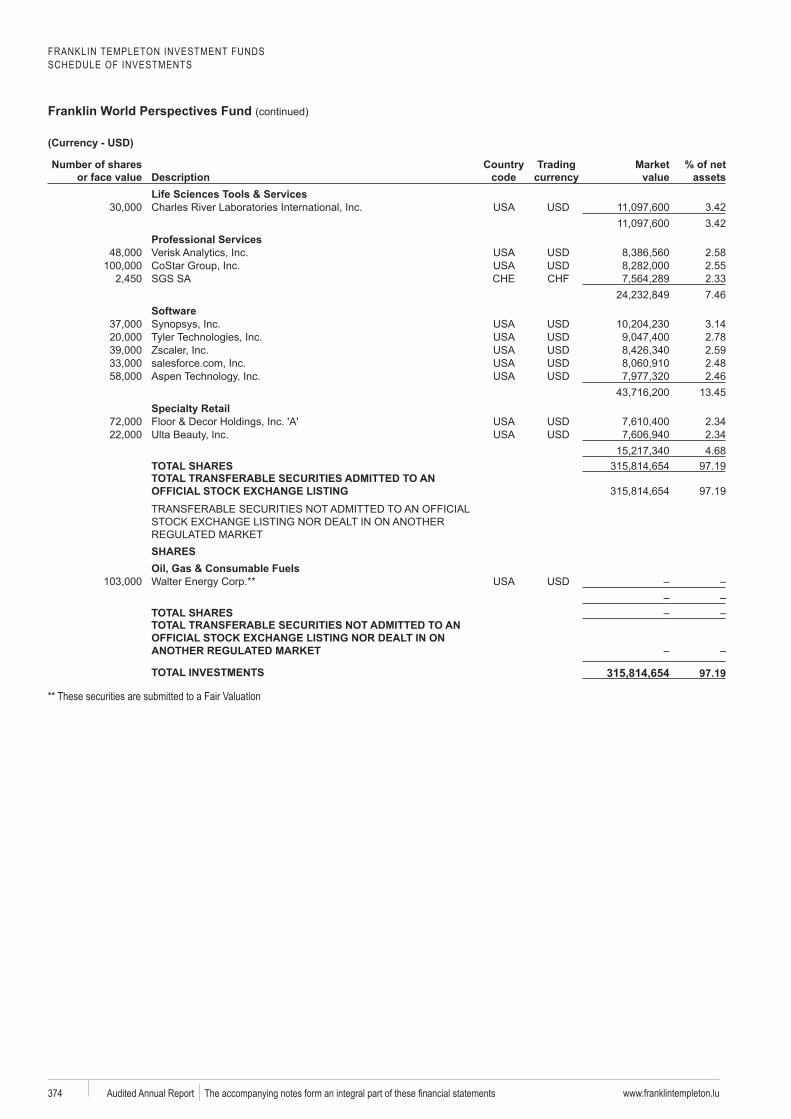
FRANKLIN TEMPLETON INVESTMENT FUNDSSCHEDULE OF INVESTMENTS
Franklin World Perspectives Fund (continued)
www.franklintempleton.lu374 Audited Annual Report
Number of shares or face value Description
code
Trading Market value
% of net assets
Life Sciences Tools & Services3.423.42
Professional Services2.582.552.337.46
3.142.782.592.482.46
13.45
2.342.344.68
TOTAL SHARES 97.19TOTAL TRANSFERABLE SECURITIES ADMITTED TO AN
97.19
SHARESOil, Gas & Consumable Fuels
TOTAL SHARESTOTAL TRANSFERABLE SECURITIES NOT ADMITTED TO AN
TOTAL INVESTMENTS 315,814,654a** These securities are submitted to a Fair Valuation
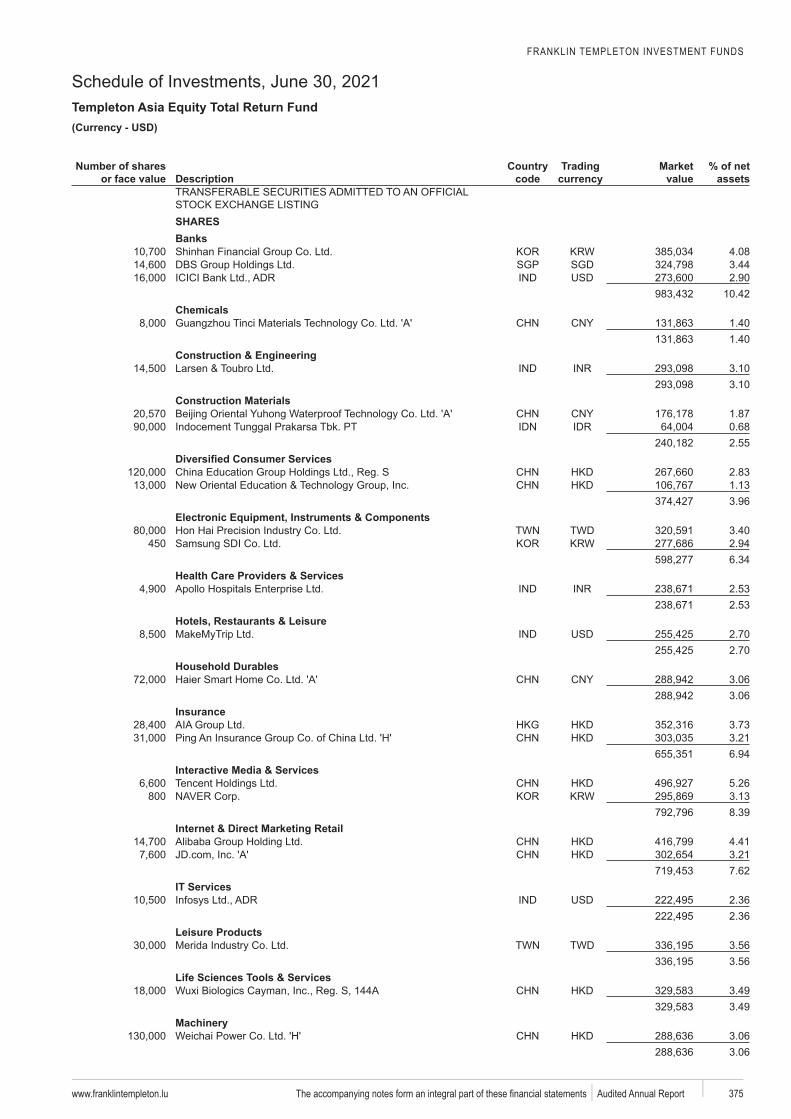
FRANKLIN TEMPLETON INVESTMENT FUNDS
Schedule of Investments, June 30, 2021Templeton Asia Equity Total Return Fund
www.franklintempleton.lu 375 Audited Annual Report
USD)
Number of shares or face value Description
code
Trading Market value
% of net assets
SHARESBanksShinhan 4.08
SGP SGD 3.442.90
10.42Chemicals
Tinci 1.401.40
Construction & Engineering3.103.10
Construction Materials1.87
Tunggal Prakarsa . PT 0.682.55
2.831.133.96
Electronic Equipment, Instruments & ComponentsTWD 3.40
450 2.946.34
Health Care Providers & Services2.532.53
Hotels, Restaurants & Leisure2.702.70
Household Durables3.063.06
Insurance3.733.216.94
Interactive Media & ServicesTencent 5.26
800 3.138.39
Internet & Direct Marketing Retail4.413.217.62
IT Services2.362.36
Leisure ProductsTWD 3.56
3.56Life Sciences Tools & Services
3.493.49
Weichai 3.063.06
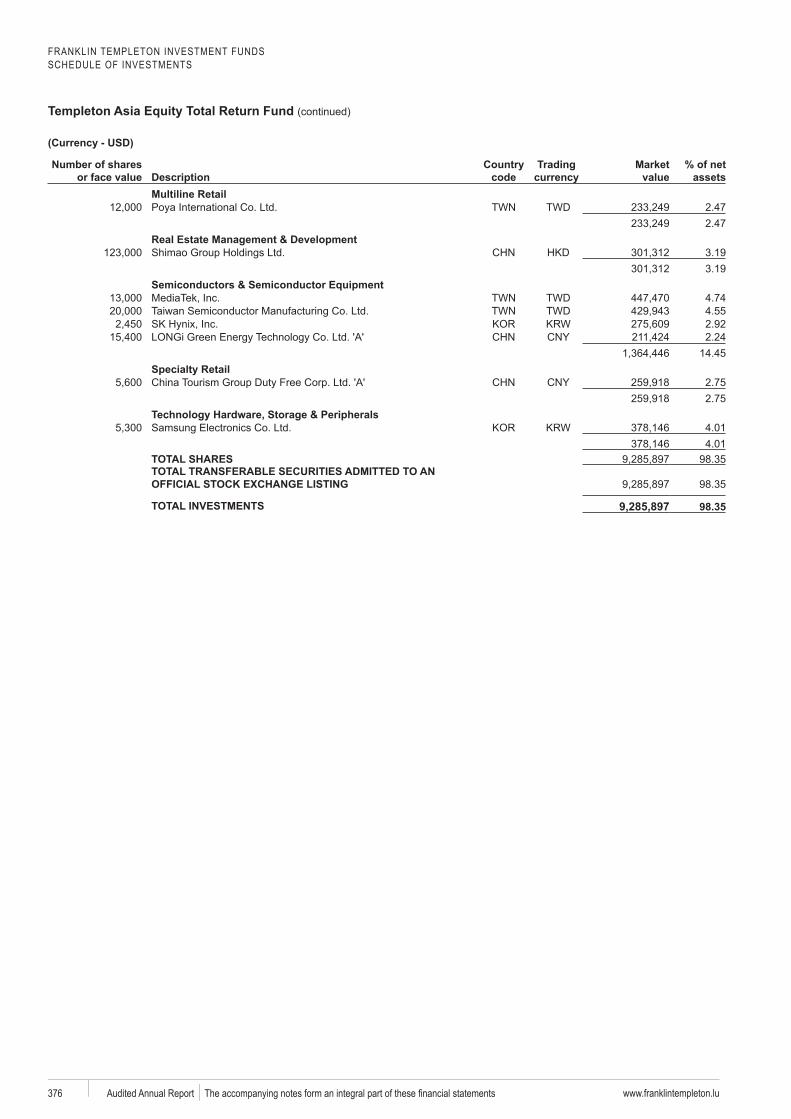
FRANKLIN TEMPLETON INVESTMENT FUNDSSCHEDULE OF INVESTMENTS
Templeton Asia Equity Total Return Fund (continued)
www.franklintempleton.lu376 Audited Annual Report
Number of shares or face value Description
code
Trading Market value
% of net assets
Multiline RetailPoya TWD 2.47
2.47Real Estate Management & Development
3.193.19
Semiconductors & Semiconductor EquipmentTWD 4.74TWD 4.55
2.922.24
14.45
2.752.75
4.014.01
TOTAL SHARES 98.35TOTAL TRANSFERABLE SECURITIES ADMITTED TO AN
98.35
TOTAL INVESTMENTS 9,285,897
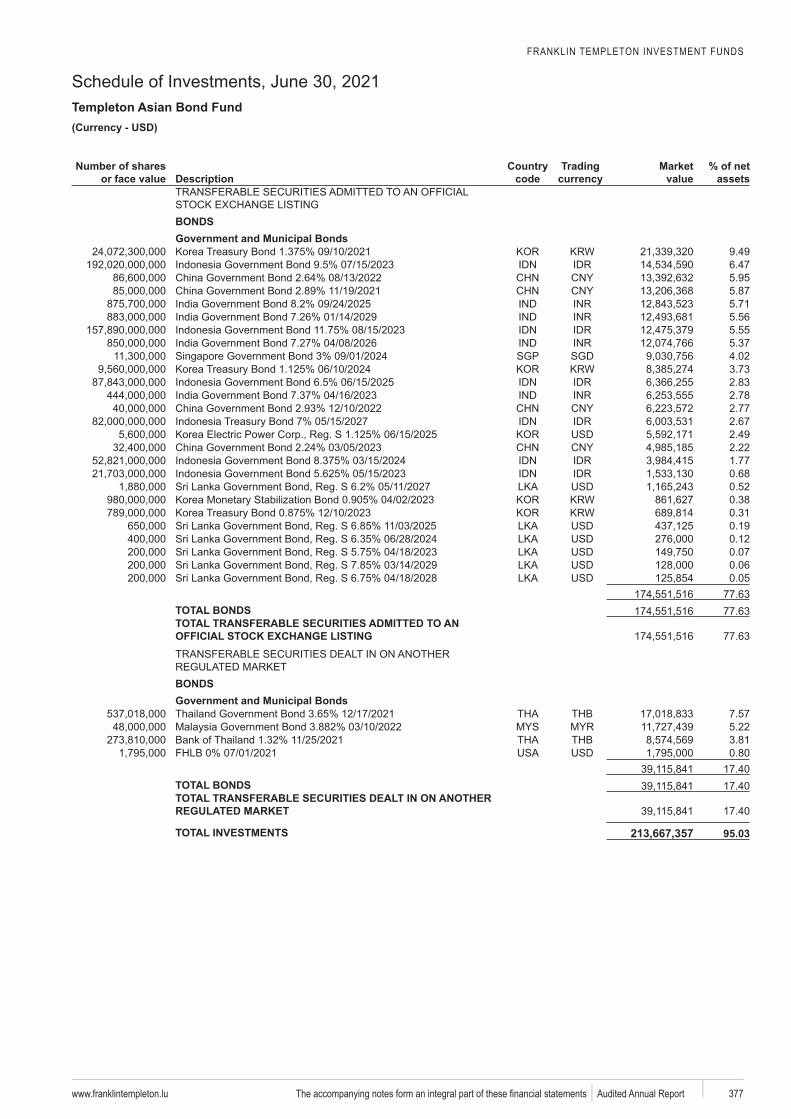
FRANKLIN TEMPLETON INVESTMENT FUNDS
Schedule of Investments, June 30, 2021Templeton Asian Bond Fund
www.franklintempleton.lu 377 Audited Annual Report
USD)
Number of shares or face value Description
code
Trading Market value
% of net assets
BONDSGovernment and Municipal Bonds
9.496.475.955.875.715.565.555.37
SGP SGD 4.023.732.832.782.772.672.492.221.770.680.520.380.310.190.120.070.060.05
77.63TOTAL BONDS 77.63TOTAL TRANSFERABLE SECURITIES ADMITTED TO AN
77.63
BONDSGovernment and Municipal Bonds
7.575.223.810.80
17.40TOTAL BONDS 17.40TOTAL TRANSFERABLE SECURITIES DEALT IN ON ANOTHER
17.40
TOTAL INVESTMENTS 213,667,357
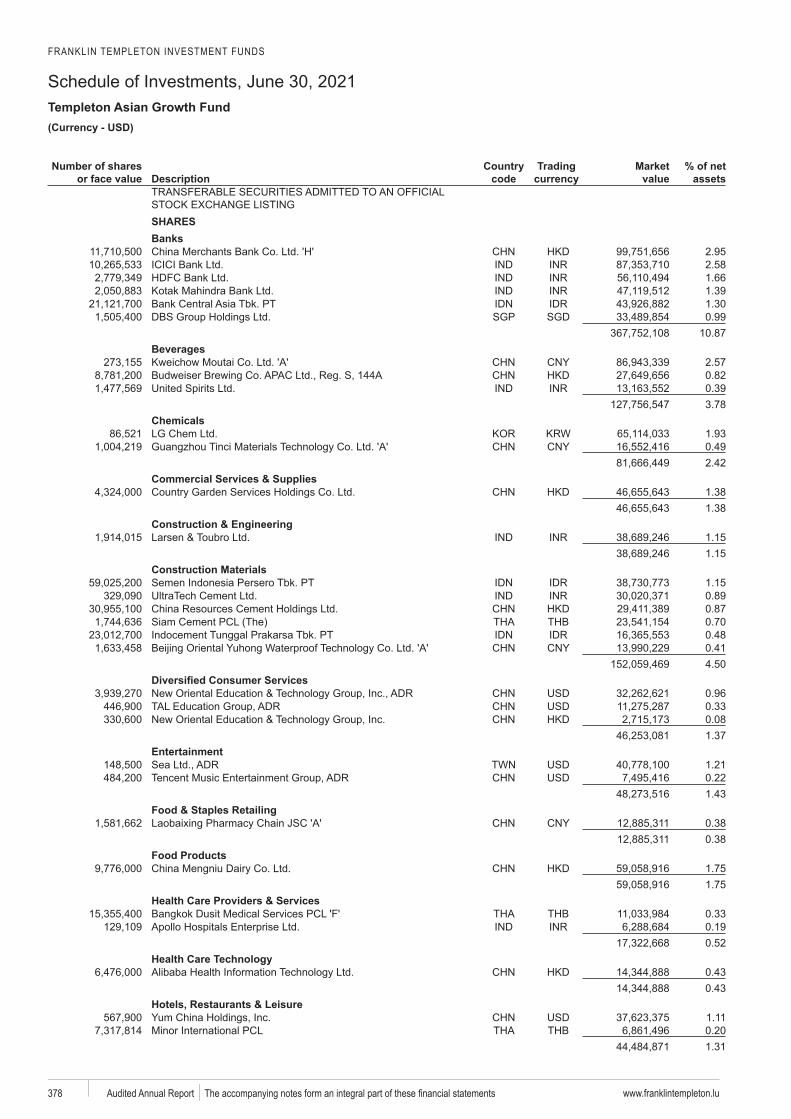
FRANKLIN TEMPLETON INVESTMENT FUNDS
Schedule of Investments, June 30, 2021Templeton Asian Growth Fund
www.franklintempleton.lu378 Audited Annual Report
USD)
Number of shares or face value Description
code
Trading Market value
% of net assets
SHARESBanks
2.952.581.661.39
. PT 1.30SGP SGD 0.99
10.87Beverages
2.570.820.393.78
Chemicals1.93
Tinci 0.492.42
Commercial Services & Supplies1.381.38
Construction & Engineering1.151.15
Construction MaterialsPersero . PT 1.15
0.890.870.70
Tunggal Prakarsa . PT 0.480.414.50
0.960.330.081.37
Entertainment1.21
Tencent 0.221.43
Food & Staples Retailing0.380.38
Food Products1.751.75
Health Care Providers & ServicesBangkok Dusit 0.33
0.190.52
0.430.43
Hotels, Restaurants & Leisure1.110.201.31
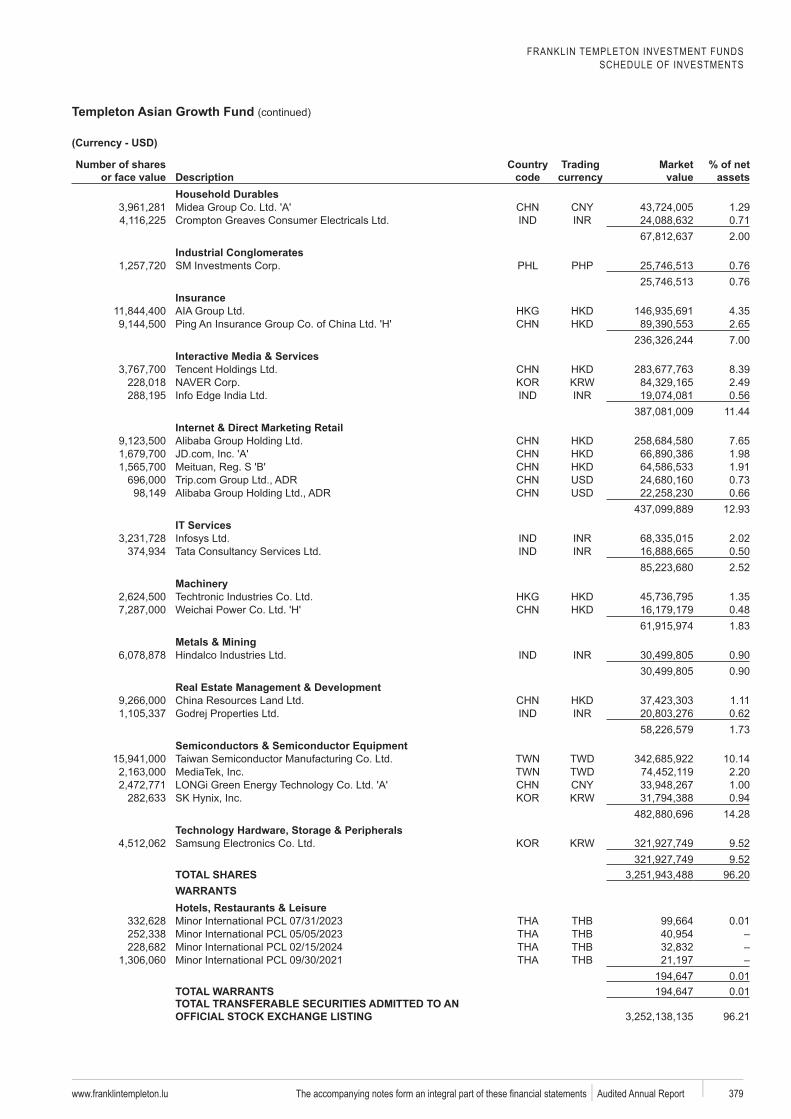
FRANKLIN TEMPLETON INVESTMENT FUNDSSCHEDULE OF INVESTMENTS
Templeton Asian Growth Fund (continued)
www.franklintempleton.lu 379 Audited Annual Report
Number of shares or face value Description
code
Trading Market value
% of net assets
Household Durables1.290.712.00
Industrial Conglomerates0.760.76
Insurance4.352.657.00
Interactive Media & ServicesTencent 8.39
2.490.56
11.44Internet & Direct Marketing Retail
7.651.981.910.730.66
12.93IT Services
2.020.502.52
1.35Weichai 0.48
1.83Metals & Mining
0.900.90
Real Estate Management & Development1.110.621.73
Semiconductors & Semiconductor EquipmentTWD 10.14TWD 2.20
1.000.94
14.28
9.529.52
TOTAL SHARES 96.20WARRANTSHotels, Restaurants & Leisure
0.01
0.01TOTAL WARRANTS 0.01TOTAL TRANSFERABLE SECURITIES ADMITTED TO AN
96.21
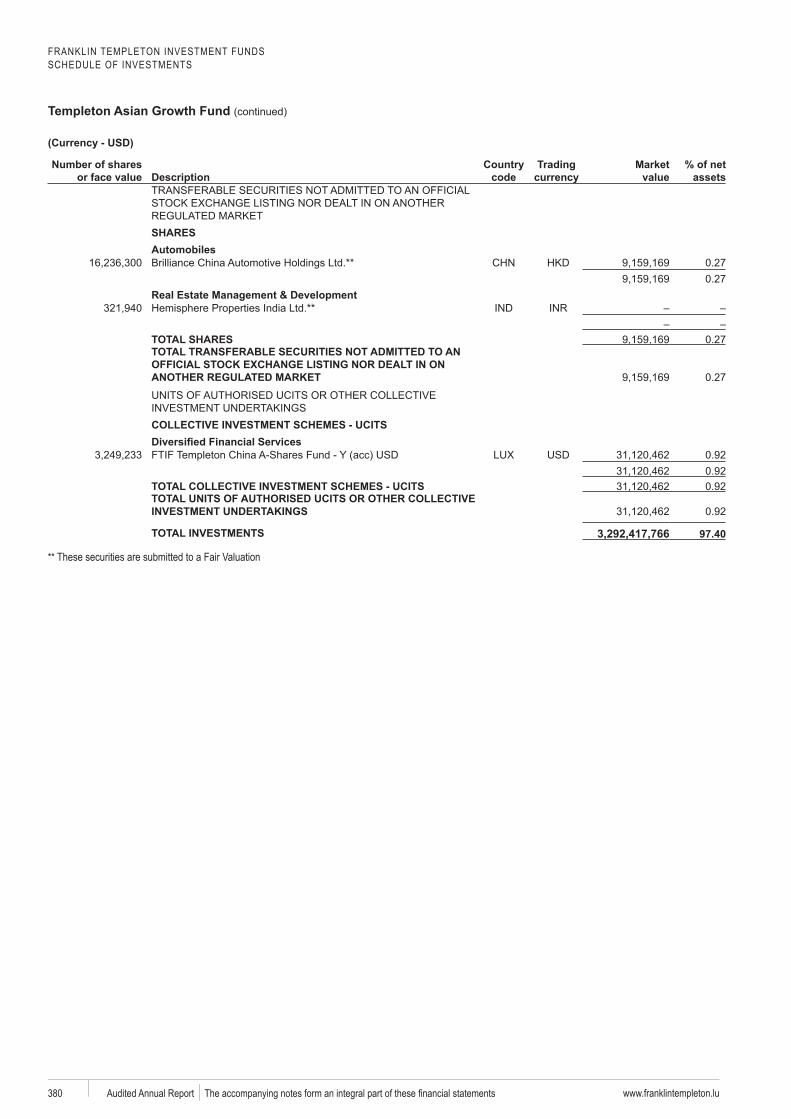
FRANKLIN TEMPLETON INVESTMENT FUNDSSCHEDULE OF INVESTMENTS
Templeton Asian Growth Fund (continued)
www.franklintempleton.lu380 Audited Annual Report
Number of shares or face value Description
code
Trading Market value
% of net assets
SHARESAutomobiles
0.270.27
Real Estate Management & Development
TOTAL SHARES 0.27TOTAL TRANSFERABLE SECURITIES NOT ADMITTED TO AN
0.27
COLLECTIVE INVESTMENT SCHEMES - UCITS
acc 0.920.92
TOTAL COLLECTIVE INVESTMENT SCHEMES - UCITS 0.92TOTAL UNITS OF AUTHORISED UCITS OR OTHER COLLECTIVE
0.92
TOTAL INVESTMENTS 3,292,417,766a** These securities are submitted to a Fair Valuation
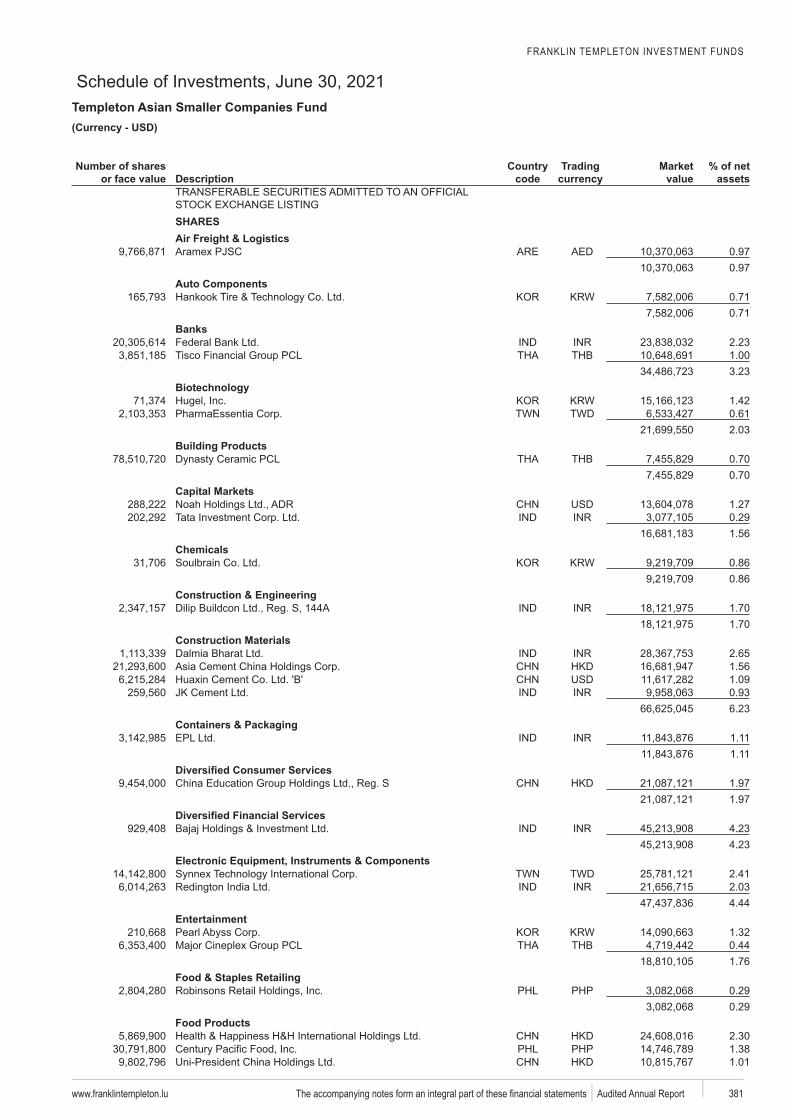
FRANKLIN TEMPLETON INVESTMENT FUNDS
Schedule of Investments, June 30, 2021Templeton Asian Smaller Companies Fund
www.franklintempleton.lu 381 Audited Annual Report
USD)
Number of shares or face value Description
code
Trading Market value
% of net assets
SHARESAir Freight & Logistics
0.970.97
Auto Components0.710.71
Banks2.23
Tisco 1.003.23
1.42TWD 0.61
2.03Building Products
0.700.70
Capital Markets1.270.291.56
Chemicals0.860.86
Construction & Engineering Buildcon 1.70
1.70Construction Materials
2.651.561.090.936.23
Containers & Packaging1.111.11
1.971.97
4.234.23
Electronic Equipment, Instruments & ComponentsSynnex TWD 2.41
2.034.44
Entertainment1.320.441.76
Food & Staples Retailing0.290.29
Food Products2.301.381.01
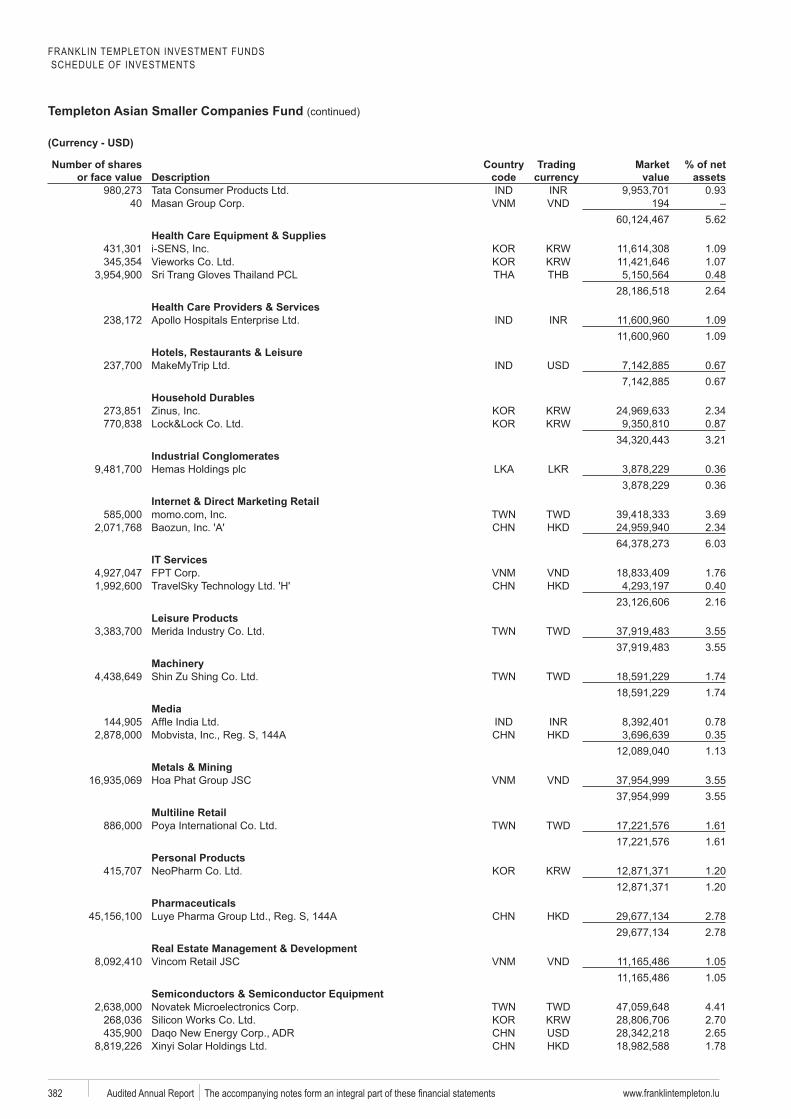
FRANKLIN TEMPLETON INVESTMENT FUNDS SCHEDULE OF INVESTMENTS
Templeton Asian Smaller Companies Fund (continued)
www.franklintempleton.lu382 Audited Annual Report
Number of shares or face value Description
code
Trading Market value
% of net assets
0.9340 194
5.62Health Care Equipment & Suppliesi 1.09
1.07Sri Trang 0.48
2.64Health Care Providers & Services
1.091.09
Hotels, Restaurants & Leisure0.670.67
Household DurablesZinus 2.34
0.873.21
Industrial Conglomerates0.360.36
Internet & Direct Marketing RetailTWD 3.69
2.346.03
IT Services1.76
TravelSky 0.402.16
Leisure ProductsTWD 3.55
3.55
Shin Zu Shing TWD 1.741.74
Media0.780.351.13
Metals & Mining3.553.55
Multiline RetailPoya TWD 1.61
1.61Personal Products
1.201.20
Pharmaceuticals2.782.78
Real Estate Management & Development1.051.05
Semiconductors & Semiconductor EquipmentTWD 4.41
2.702.651.78
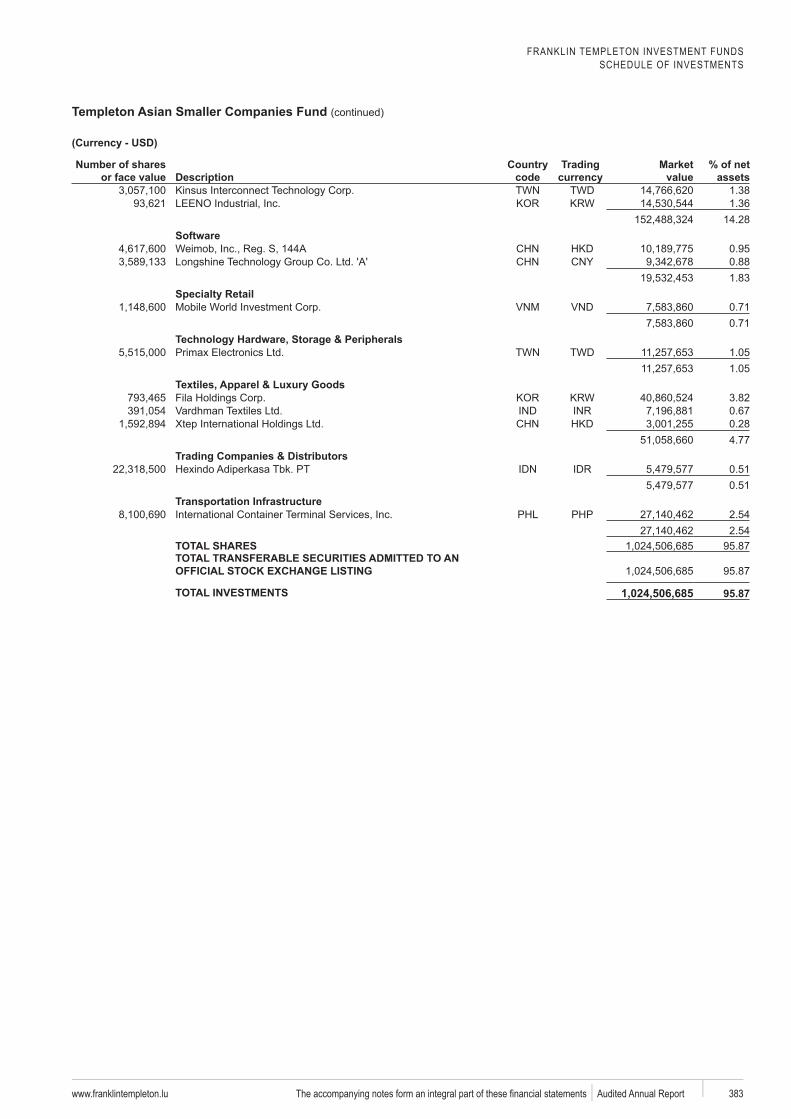
FRANKLIN TEMPLETON INVESTMENT FUNDS SCHEDULE OF INVESTMENTS
Templeton Asian Smaller Companies Fund (continued)
www.franklintempleton.lu 383 Audited Annual Report
Number of shares or face value Description
code
Trading Market value
% of net assets
Kinsus TWD 1.381.36
14.28
0.950.881.83
0.710.71
TWD 1.051.05
3.820.670.284.77
Trading Companies & Distributors . PT 0.51
0.51Transportation Infrastructure
2.542.54
TOTAL SHARES 95.87TOTAL TRANSFERABLE SECURITIES ADMITTED TO AN
95.87
TOTAL INVESTMENTS 1,024,506,685
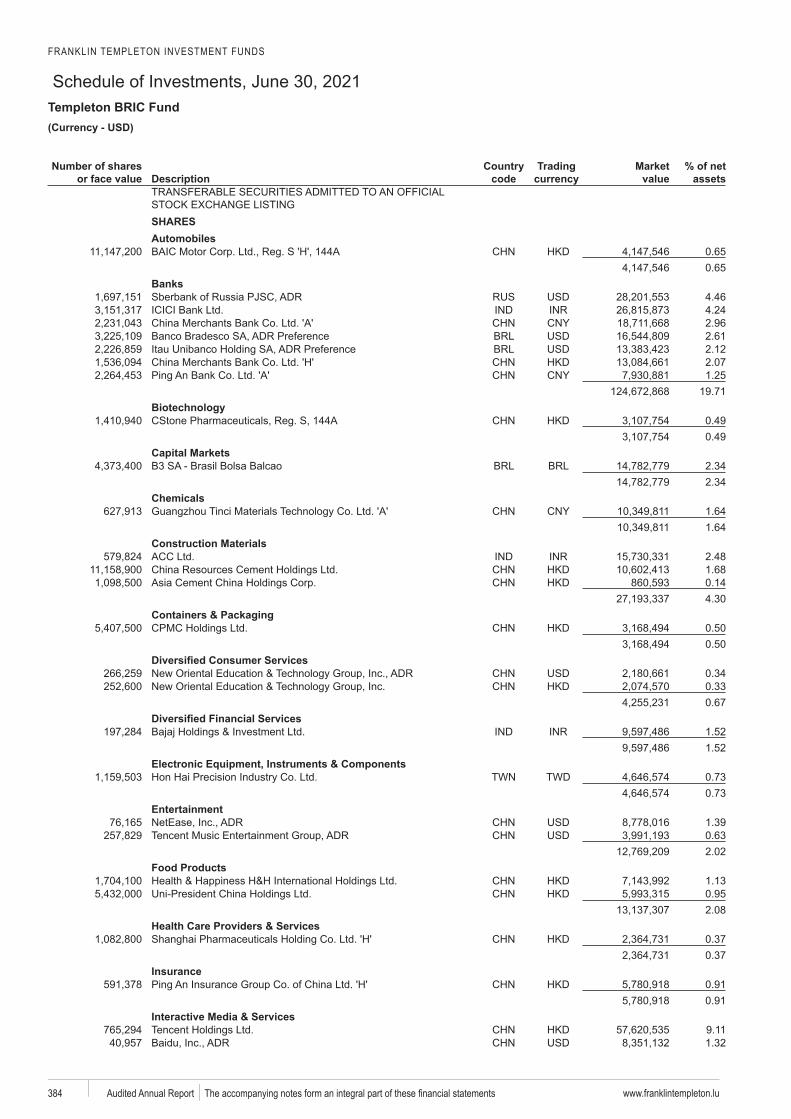
FRANKLIN TEMPLETON INVESTMENT FUNDS
Schedule of Investments, June 30, 2021Templeton BRIC Fund
www.franklintempleton.lu384 Audited Annual Report
USD)
Number of shares or face value Description
code
Trading Market value
% of net assets
SHARESAutomobiles
0.650.65
Banks4.464.242.96
Banco Bradesco 2.61 2.12
2.071.25
19.71
0.490.49
Capital MarketsBrasil Bolsa Balcao 2.34
2.34Chemicals
Tinci 1.641.64
Construction Materials2.481.680.144.30
Containers & Packaging0.500.50
0.340.330.67
1.521.52
Electronic Equipment, Instruments & ComponentsTWD 0.73
0.73Entertainment
1.39Tencent 0.63
2.02Food Products
1.130.952.08
Health Care Providers & Services0.370.37
Insurance0.910.91
Interactive Media & ServicesTencent 9.11
1.32
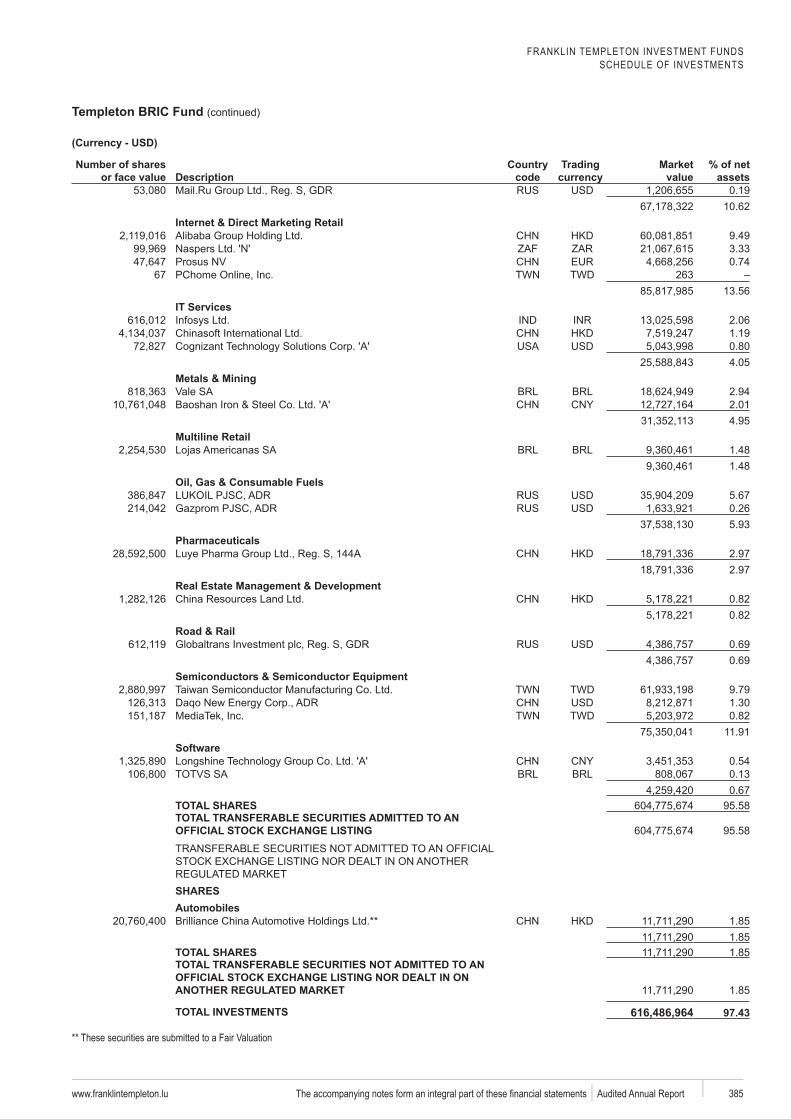
FRANKLIN TEMPLETON INVESTMENT FUNDS SCHEDULE OF INVESTMENTS
Templeton BRIC Fund (continued)
www.franklintempleton.lu 385 Audited Annual Report
Number of shares or face value Description
code
Trading Market value
% of net assets
0.1910.62
Internet & Direct Marketing Retail9.493.33
Prosus 0.7467 TWD 263
13.56IT Services
2.061.190.804.05
Metals & Mining2.94
Baoshan 2.014.95
Multiline Retail 1.48
1.48Oil, Gas & Consumable Fuels
5.670.265.93
Pharmaceuticals2.972.97
Real Estate Management & Development0.820.82
Road & Rail0.690.69
Semiconductors & Semiconductor EquipmentTWD 9.79
1.30TWD 0.82
11.91
0.540.130.67
TOTAL SHARES 95.58TOTAL TRANSFERABLE SECURITIES ADMITTED TO AN
95.58
SHARESAutomobiles
1.851.85
TOTAL SHARES 1.85TOTAL TRANSFERABLE SECURITIES NOT ADMITTED TO AN
1.85
TOTAL INVESTMENTS 616,486,964a
** These securities are submitted to a Fair Valuation
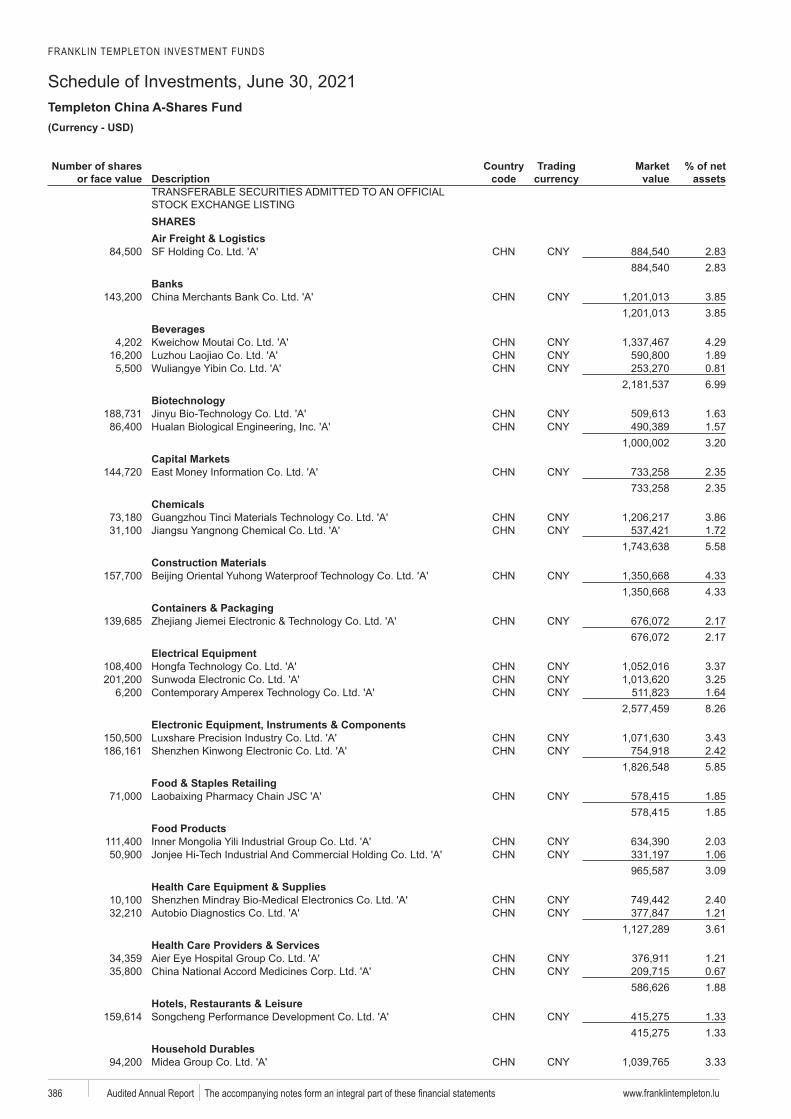
FRANKLIN TEMPLETON INVESTMENT FUNDS
Schedule of Investments, June 30, 2021Templeton China A-Shares Fund
www.franklintempleton.lu386 Audited Annual Report
USD)
Number of shares or face value Description
code
Trading Market value
% of net assets
SHARESAir Freight & Logistics
2.832.83
Banks3.853.85
Beverages4.291.890.816.99
1.631.573.20
Capital Markets2.352.35
Chemicals3.861.725.58
Construction Materials4.334.33
Containers & Packaging2.172.17
Electrical Equipment3.373.251.648.26
Electronic Equipment, Instruments & Components3.432.425.85
Food & Staples Retailing1.851.85
Food Products2.031.063.09
Health Care Equipment & Supplies2.401.213.61
Health Care Providers & Services1.210.671.88
Hotels, Restaurants & Leisure1.331.33
Household Durables3.33
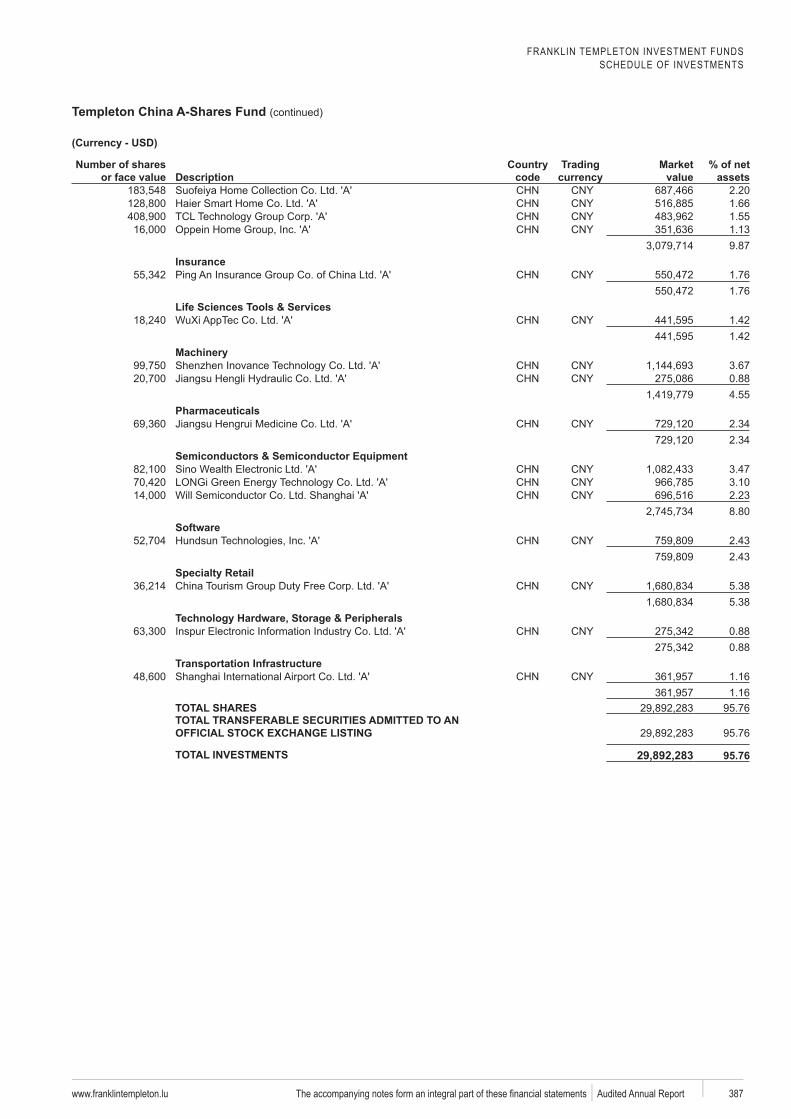
FRANKLIN TEMPLETON INVESTMENT FUNDSSCHEDULE OF INVESTMENTS
Templeton China A-Shares Fund (continued)
www.franklintempleton.lu 387 Audited Annual Report
Number of shares or face value Description
code
Trading Market value
% of net assets
2.201.661.551.139.87
Insurance1.761.76
Life Sciences Tools & Services1.421.42
3.670.884.55
Pharmaceuticals2.342.34
Semiconductors & Semiconductor Equipment3.473.102.238.80
2.432.43
5.385.38
0.880.88
Transportation Infrastructure1.161.16
TOTAL SHARES 95.76TOTAL TRANSFERABLE SECURITIES ADMITTED TO AN
95.76
TOTAL INVESTMENTS 29,892,283
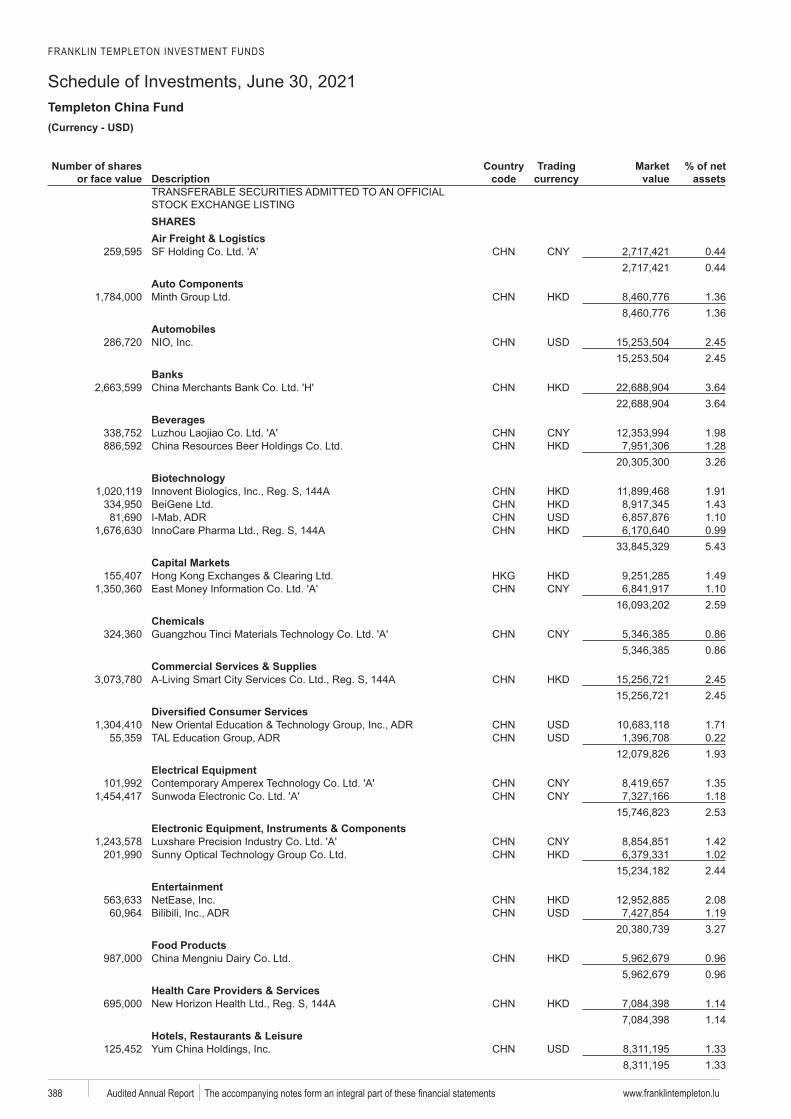
FRANKLIN TEMPLETON INVESTMENT FUNDS
Schedule of Investments, June 30, 2021Templeton China Fund
www.franklintempleton.lu388 Audited Annual Report
USD)
Number of shares or face value Description
code
Trading Market value
% of net assets
SHARESAir Freight & Logistics
0.440.44
Auto Components1.361.36
Automobiles2.452.45
Banks3.643.64
Beverages 1.98
1.283.26
1.91BeiGene 1.43
1.100.995.43
Capital Markets1.491.102.59
ChemicalsTinci 0.86
0.86Commercial Services & Supplies
2.452.45
1.710.221.93
Electrical Equipment1.351.182.53
Electronic Equipment, Instruments & Components1.421.022.44
Entertainment2.081.193.27
Food Products0.960.96
Health Care Providers & Services1.141.14
Hotels, Restaurants & Leisure1.331.33
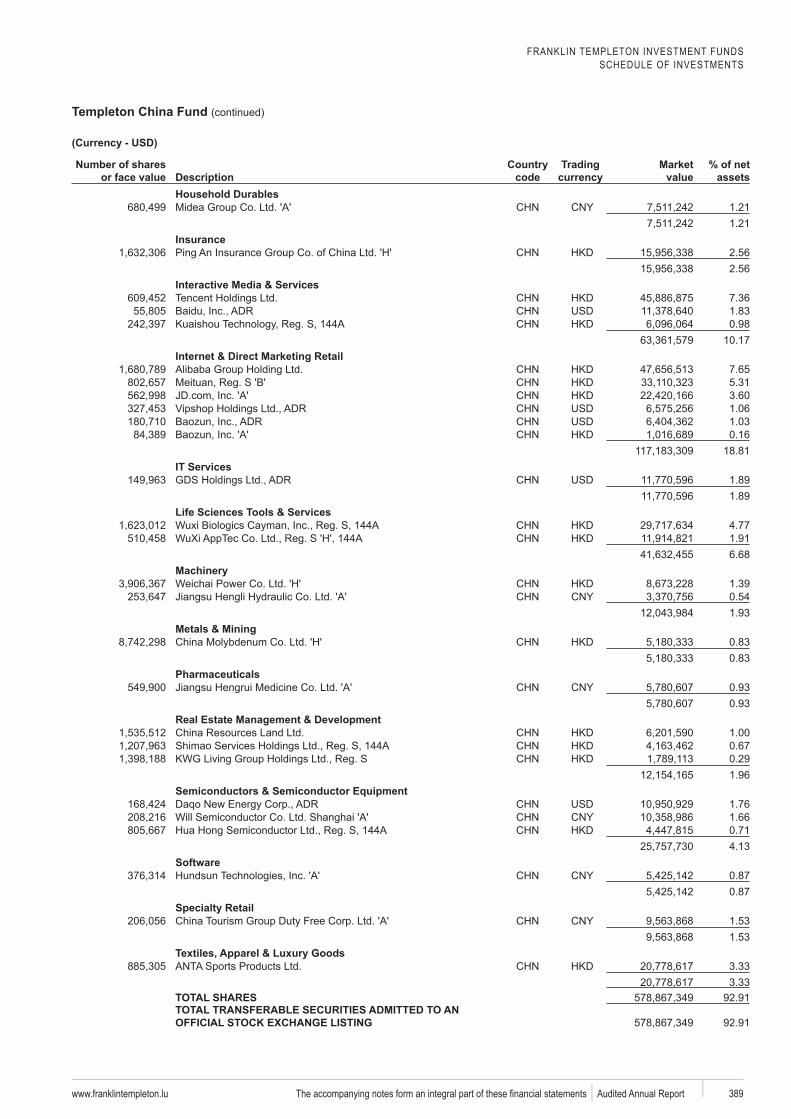
FRANKLIN TEMPLETON INVESTMENT FUNDSSCHEDULE OF INVESTMENTS
Templeton China Fund (continued)
www.franklintempleton.lu 389 Audited Annual Report
Number of shares or face value Description
code
Trading Market value
% of net assets
Household Durables1.211.21
Insurance2.562.56
Interactive Media & ServicesTencent 7.36
1.83Kuaishou 0.98
10.17Internet & Direct Marketing Retail
7.655.313.601.061.030.16
18.81IT Services
1.891.89
Life Sciences Tools & Services4.77
1.916.68
Weichai 1.39Jiangsu 0.54
1.93Metals & Mining
0.830.83
PharmaceuticalsJiangsu 0.93
0.93Real Estate Management & Development
1.000.670.291.96
Semiconductors & Semiconductor Equipment1.761.660.714.13
0.870.87
1.531.53
3.333.33
TOTAL SHARES 92.91TOTAL TRANSFERABLE SECURITIES ADMITTED TO AN
92.91
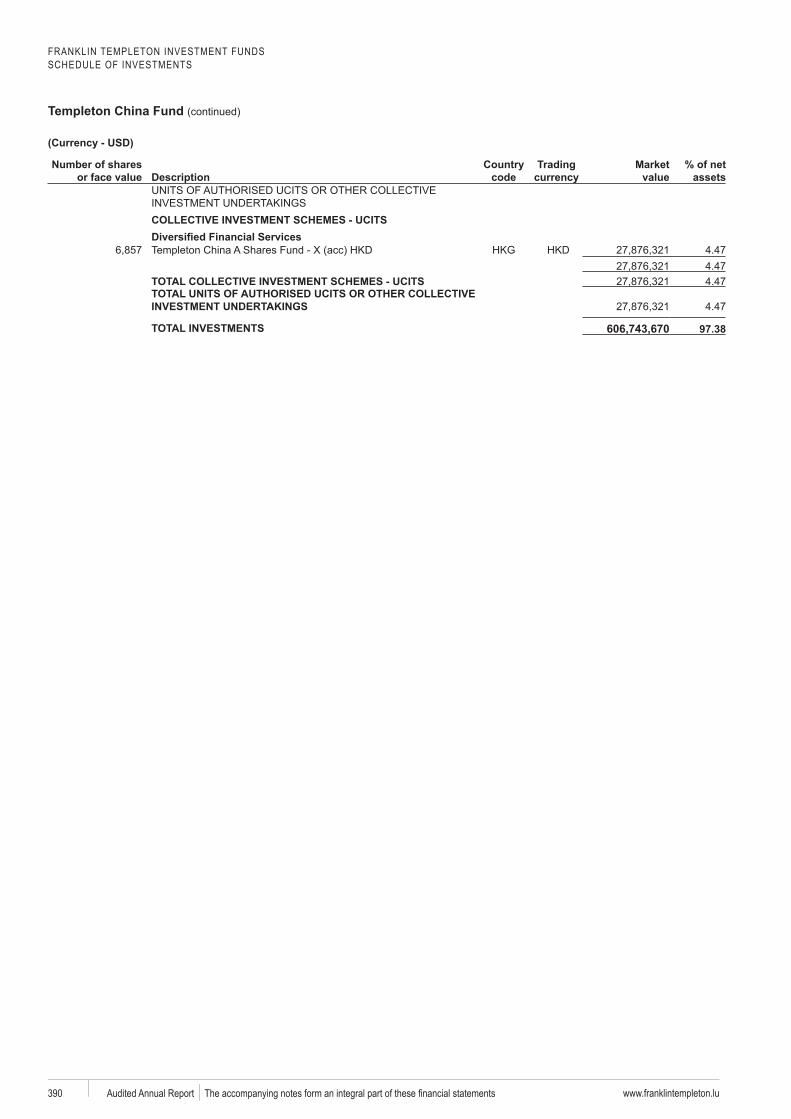
FRANKLIN TEMPLETON INVESTMENT FUNDSSCHEDULE OF INVESTMENTS
Templeton China Fund (continued)
www.franklintempleton.lu390 Audited Annual Report
Number of shares or face value Description
code
Trading Market value
% of net assets
COLLECTIVE INVESTMENT SCHEMES - UCITS
acc 4.474.47
TOTAL COLLECTIVE INVESTMENT SCHEMES - UCITS 4.47TOTAL UNITS OF AUTHORISED UCITS OR OTHER COLLECTIVE
4.47
TOTAL INVESTMENTS 606,743,670
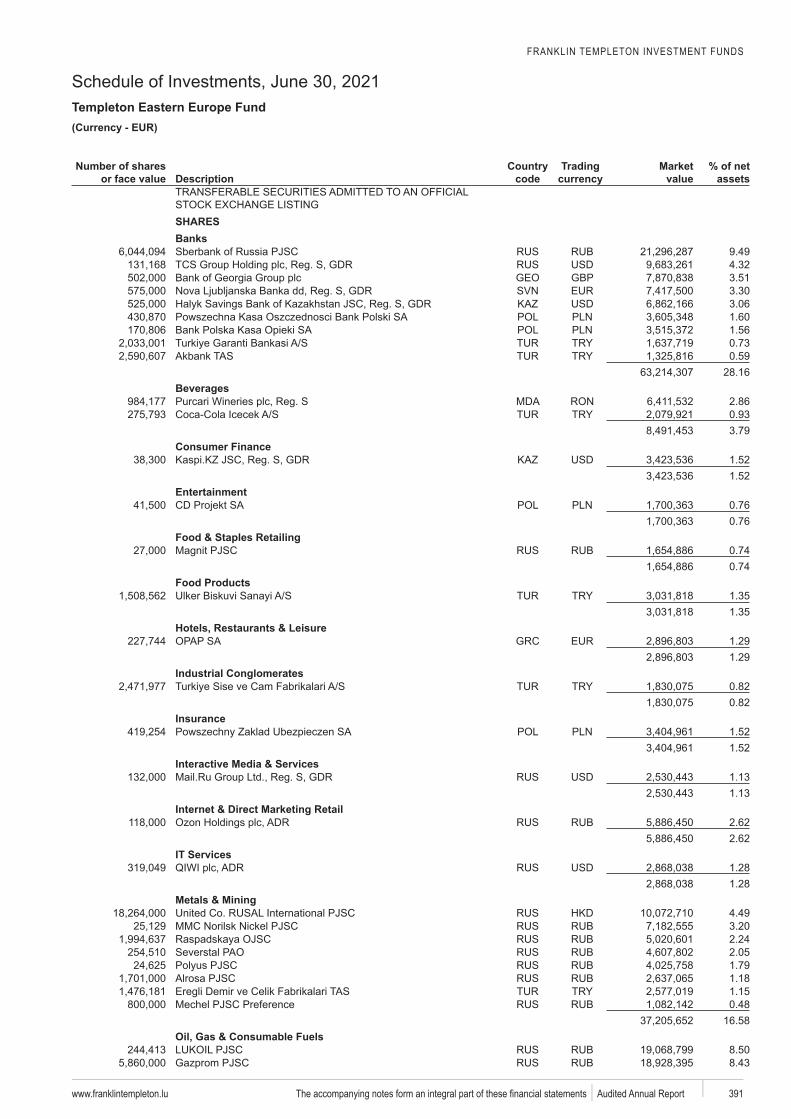
FRANKLIN TEMPLETON INVESTMENT FUNDS
Schedule of Investments, June 30, 2021Templeton Eastern Europe Fund
www.franklintempleton.lu 391 Audited Annual Report
EUR)
Number of shares or face value Description
code
Trading Market value
% of net assets
SHARESBanks
9.494.32
GBP 3.513.303.061.601.560.730.59
28.16Beverages
2.860.933.79
Consumer Finance1.521.52
Entertainment0.760.76
Food & Staples Retailing0.740.74
Food Products1.351.35
Hotels, Restaurants & Leisure1.291.29
Industrial Conglomerates0.820.82
Insurance1.521.52
Interactive Media & Services1.131.13
Internet & Direct Marketing Retail2.622.62
IT Services1.281.28
Metals & Mining4.493.202.242.051.791.181.150.48
16.58Oil, Gas & Consumable Fuels
8.508.43
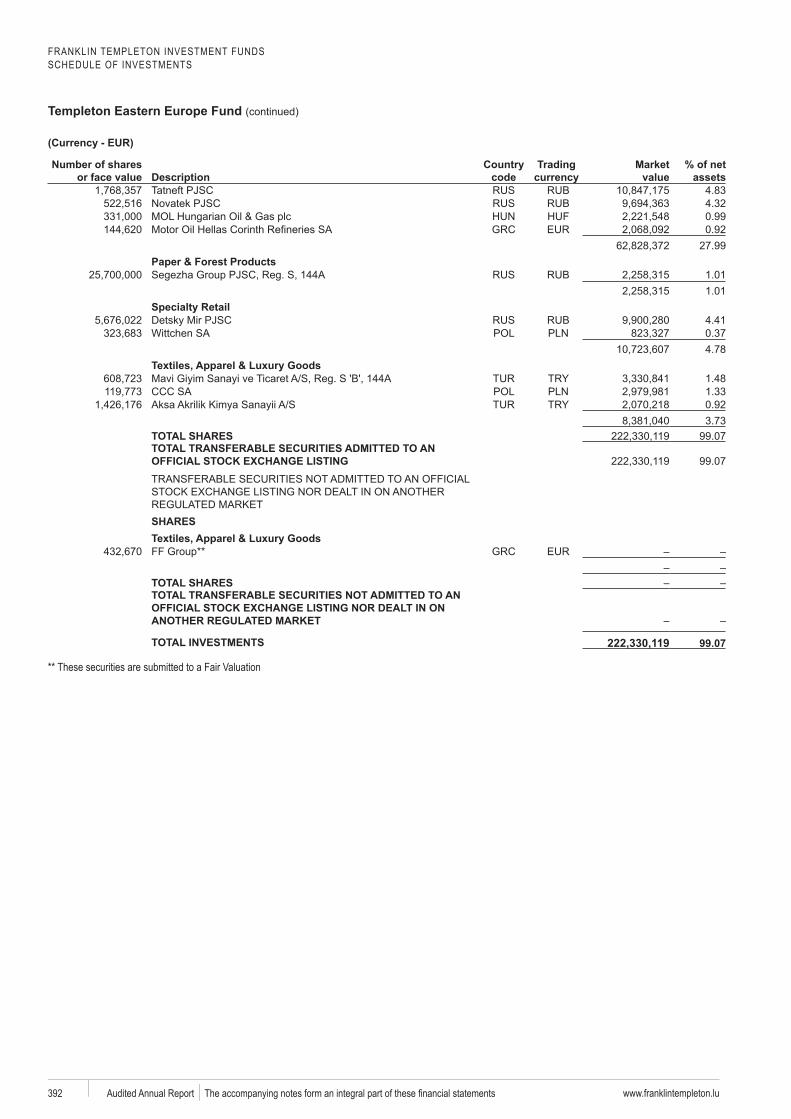
FRANKLIN TEMPLETON INVESTMENT FUNDSSCHEDULE OF INVESTMENTS
Templeton Eastern Europe Fund (continued)
www.franklintempleton.lu392 Audited Annual Report
Number of shares or face value Description
code
Trading Market value
% of net assets
4.834.320.990.92
27.99Paper & Forest Products
1.011.01
4.410.374.78
1.481.330.923.73
TOTAL SHARES 99.07TOTAL TRANSFERABLE SECURITIES ADMITTED TO AN
99.07
SHARES
TOTAL SHARESTOTAL TRANSFERABLE SECURITIES NOT ADMITTED TO AN
TOTAL INVESTMENTS 222,330,119B
** These securities are submitted to a Fair Valuation
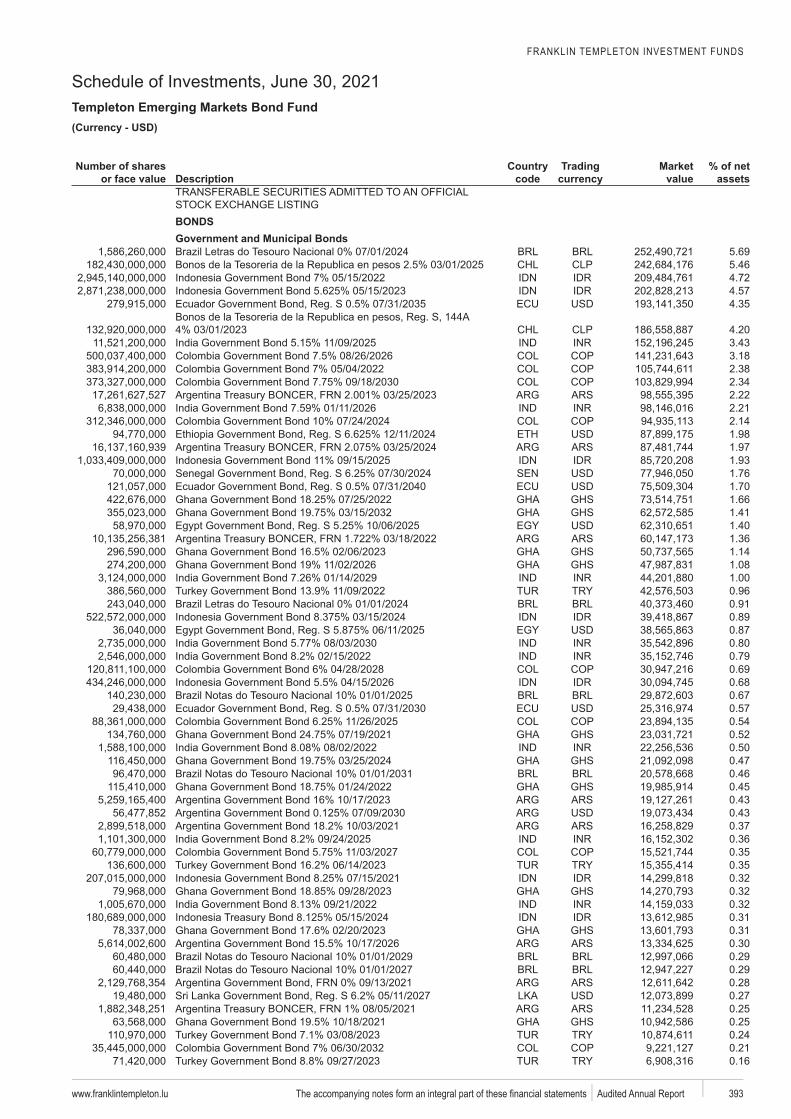
FRANKLIN TEMPLETON INVESTMENT FUNDS
Schedule of Investments, June 30, 2021Templeton Emerging Markets Bond Fund
www.franklintempleton.lu 393 Audited Annual Report
USD)
Number of shares or face value Description
code
Trading Market value
% of net assets
BONDSGovernment and Municipal Bonds
do Tesouro 5.69Bonos de la Tesoreria de la en 5.46
4.724.574.35
Bonos de la Tesoreria de la en4.203.433.182.382.342.222.212.141.981.971.931.761.701.661.411.401.361.141.081.000.96
do Tesouro 0.910.890.870.800.790.690.68
do Tesouro 0.670.570.540.520.500.47
do Tesouro 0.460.450.430.430.370.360.350.350.320.320.320.310.310.30
do Tesouro 0.29 do Tesouro 0.29
0.280.270.250.250.240.210.16
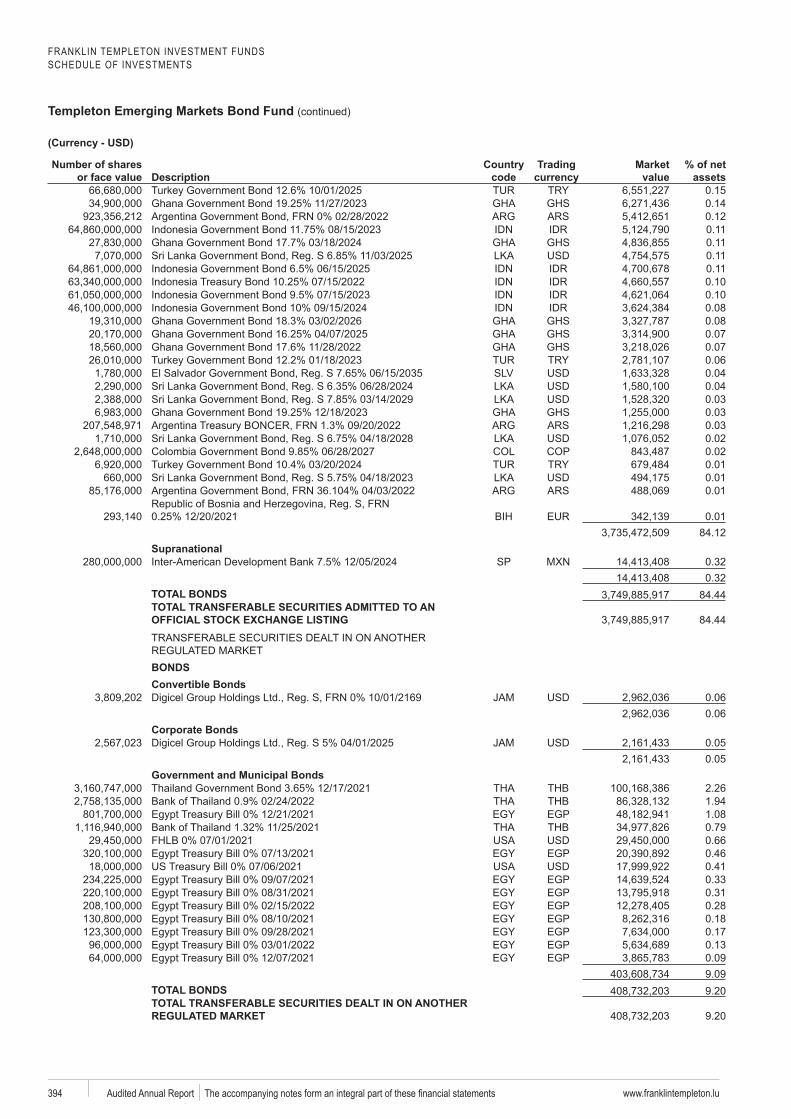
FRANKLIN TEMPLETON INVESTMENT FUNDSSCHEDULE OF INVESTMENTS
Templeton Emerging Markets Bond Fund (continued)
www.franklintempleton.lu394 Audited Annual Report
Number of shares or face value Description
code
Trading Market value
% of net assets
0.150.140.120.110.110.110.110.100.100.080.080.070.070.060.040.040.030.030.030.020.020.010.010.01
0.0184.12
SupranationalSP 0.32
0.32TOTAL BONDS 84.44TOTAL TRANSFERABLE SECURITIES ADMITTED TO AN
84.44
BONDSConvertible BondsDigicel 0.06
0.06Corporate BondsDigicel 0.05
0.05Government and Municipal Bonds
2.261.94
EGP 1.080.790.66
EGP 0.460.41
EGP 0.33EGP 0.31EGP 0.28EGP 0.18EGP 0.17EGP 0.13EGP 0.09
9.09TOTAL BONDS 9.20TOTAL TRANSFERABLE SECURITIES DEALT IN ON ANOTHER
9.20
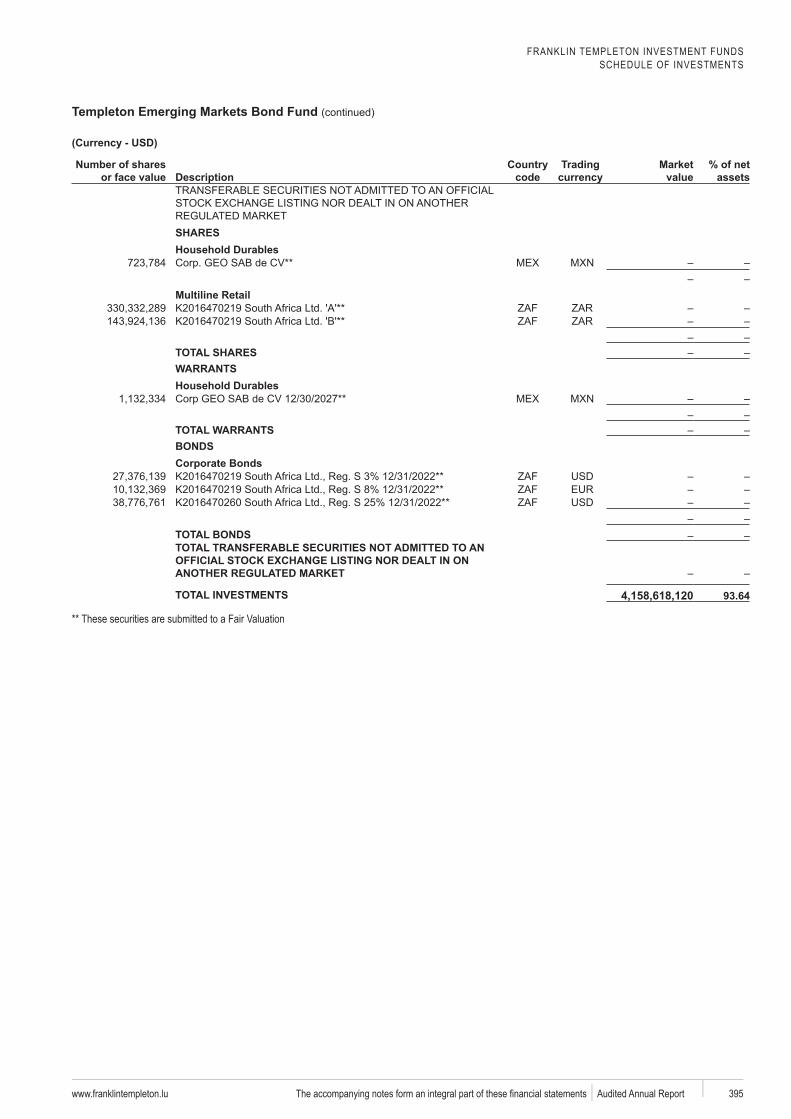
FRANKLIN TEMPLETON INVESTMENT FUNDSSCHEDULE OF INVESTMENTS
Templeton Emerging Markets Bond Fund (continued)
www.franklintempleton.lu 395 Audited Annual Report
Number of shares or face value Description
code
Trading Market value
% of net assets
SHARESHousehold Durables
Multiline Retail
TOTAL SHARESWARRANTSHousehold Durables
TOTAL WARRANTSBONDSCorporate Bonds
TOTAL BONDSTOTAL TRANSFERABLE SECURITIES NOT ADMITTED TO AN
TOTAL INVESTMENTS 4,158,618,120a** These securities are submitted to a Fair Valuation
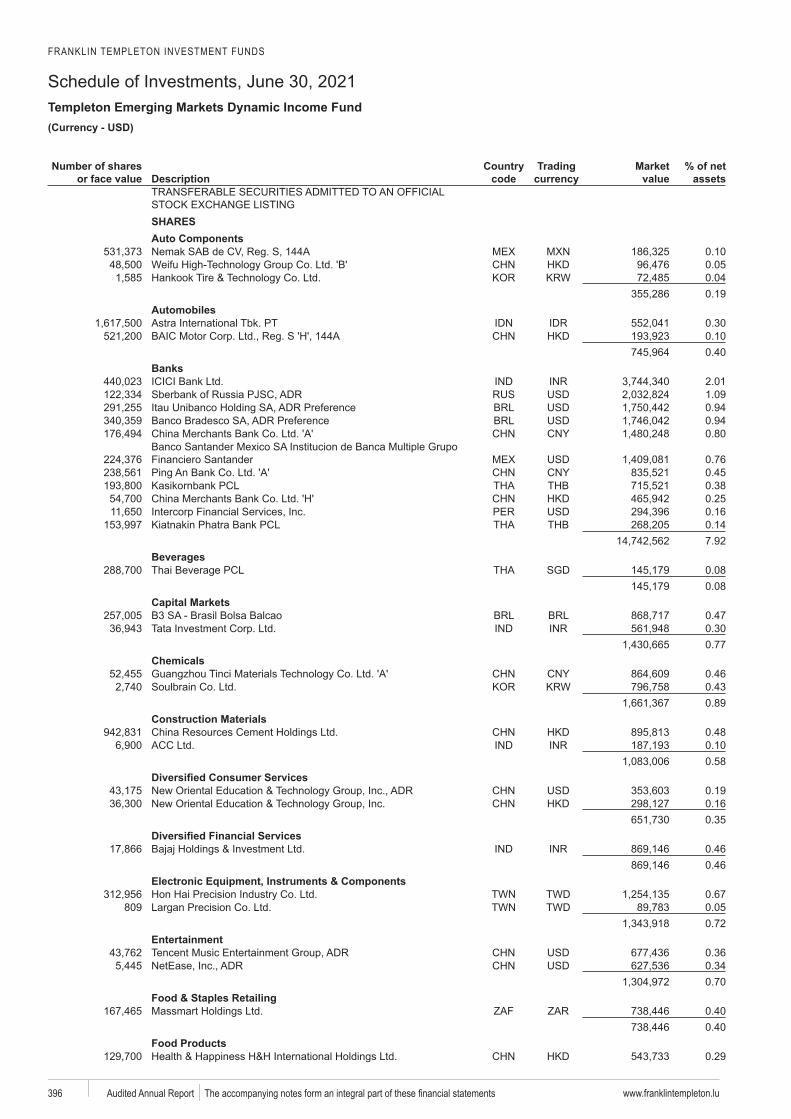
FRANKLIN TEMPLETON INVESTMENT FUNDS
Schedule of Investments, June 30, 2021Templeton Emerging Markets Dynamic Income Fund
www.franklintempleton.lu396 Audited Annual Report
USD)
Number of shares or face value Description
code
Trading Market value
% of net assets
SHARESAuto Components
0.10Weifu 0.05
0.040.19
Automobiles. PT 0.30
0.100.40
Banks2.011.09
0.94Banco Bradesco 0.94
0.80
Financiero Santander 0.760.450.380.250.16
Kiatnakin Phatra 0.147.92
BeveragesSGD 0.08
0.08Capital Markets
Brasil Bolsa Balcao 0.470.300.77
ChemicalsTinci 0.46
0.430.89
Construction Materials0.480.100.58
0.190.160.35
0.460.46
Electronic Equipment, Instruments & ComponentsTWD 0.67
809 TWD 0.050.72
EntertainmentTencent 0.36
0.340.70
Food & Staples Retailing0.400.40
Food Products0.29
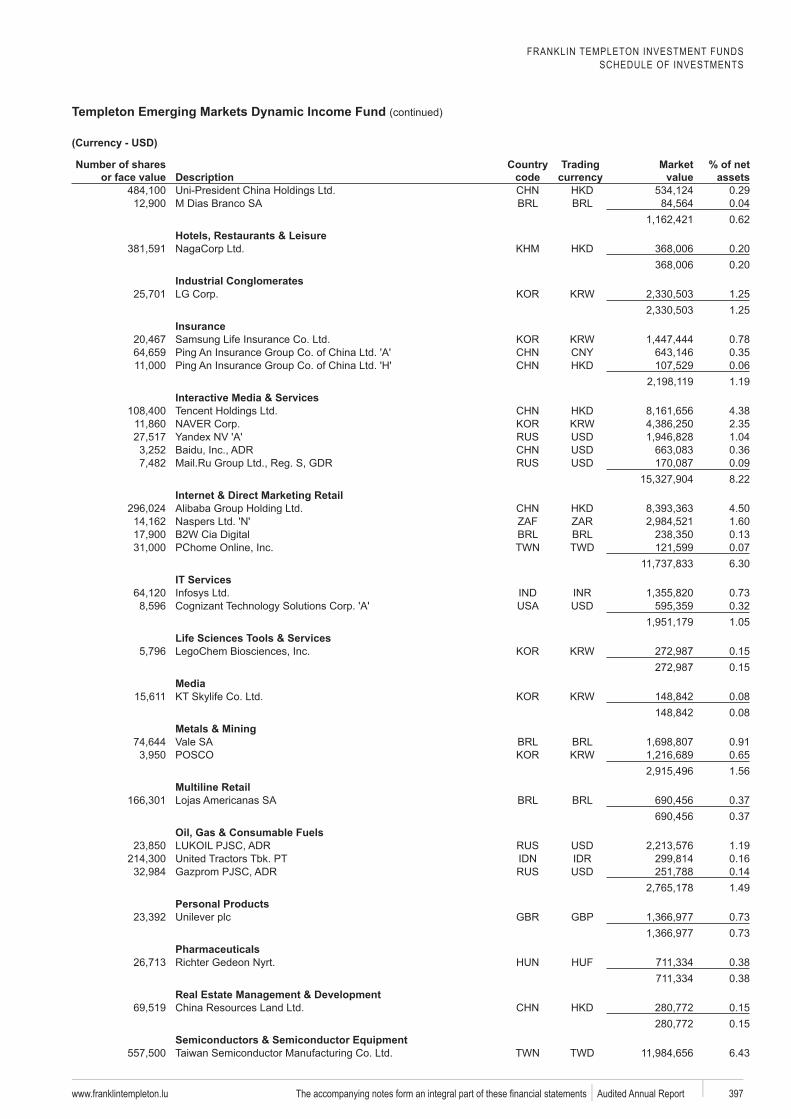
FRANKLIN TEMPLETON INVESTMENT FUNDSSCHEDULE OF INVESTMENTS
Templeton Emerging Markets Dynamic Income Fund (continued)
www.franklintempleton.lu 397 Audited Annual Report
Number of shares or face value Description
code
Trading Market value
% of net assets
0.29Branco 0.04
0.62Hotels, Restaurants & Leisure
0.200.20
Industrial Conglomerates1.251.25
Insurance0.780.350.061.19
Interactive Media & ServicesTencent 4.38
2.351.040.360.098.22
Internet & Direct Marketing Retail4.501.600.13
TWD 0.076.30
IT Services0.730.321.05
Life Sciences Tools & Services0.150.15
MediaKT Skylife 0.08
0.08Metals & Mining
0.910.651.56
Multiline Retail 0.37
0.37Oil, Gas & Consumable Fuels
1.19. PT 0.16
0.141.49
Personal ProductsGBP 0.73
0.73Pharmaceuticals
Gedeon . 0.380.38
Real Estate Management & Development0.150.15
Semiconductors & Semiconductor EquipmentTWD 6.43
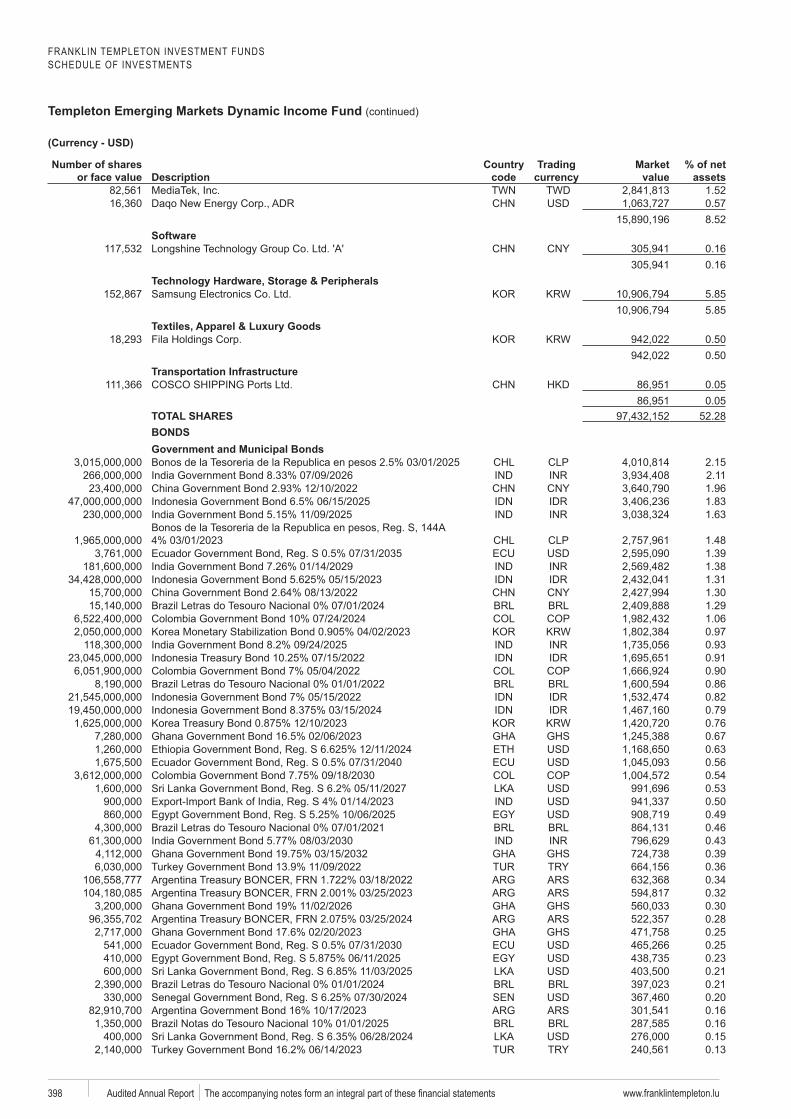
FRANKLIN TEMPLETON INVESTMENT FUNDSSCHEDULE OF INVESTMENTS
Templeton Emerging Markets Dynamic Income Fund (continued)
www.franklintempleton.lu398 Audited Annual Report
Number of shares or face value Description
code
Trading Market value
% of net assets
TWD 1.520.578.52
0.160.16
5.855.85
0.500.50
Transportation Infrastructure0.050.05
TOTAL SHARES 52.28BONDSGovernment and Municipal BondsBonos de la Tesoreria de la en 2.15
2.111.961.831.63
Bonos de la Tesoreria de la en1.481.391.381.311.30
do Tesouro 1.291.060.970.930.910.90
do Tesouro 0.860.820.790.760.670.630.560.540.530.500.49
do Tesouro 0.460.430.390.360.340.320.300.280.250.250.230.21
do Tesouro 0.210.200.16
do Tesouro 0.160.150.13
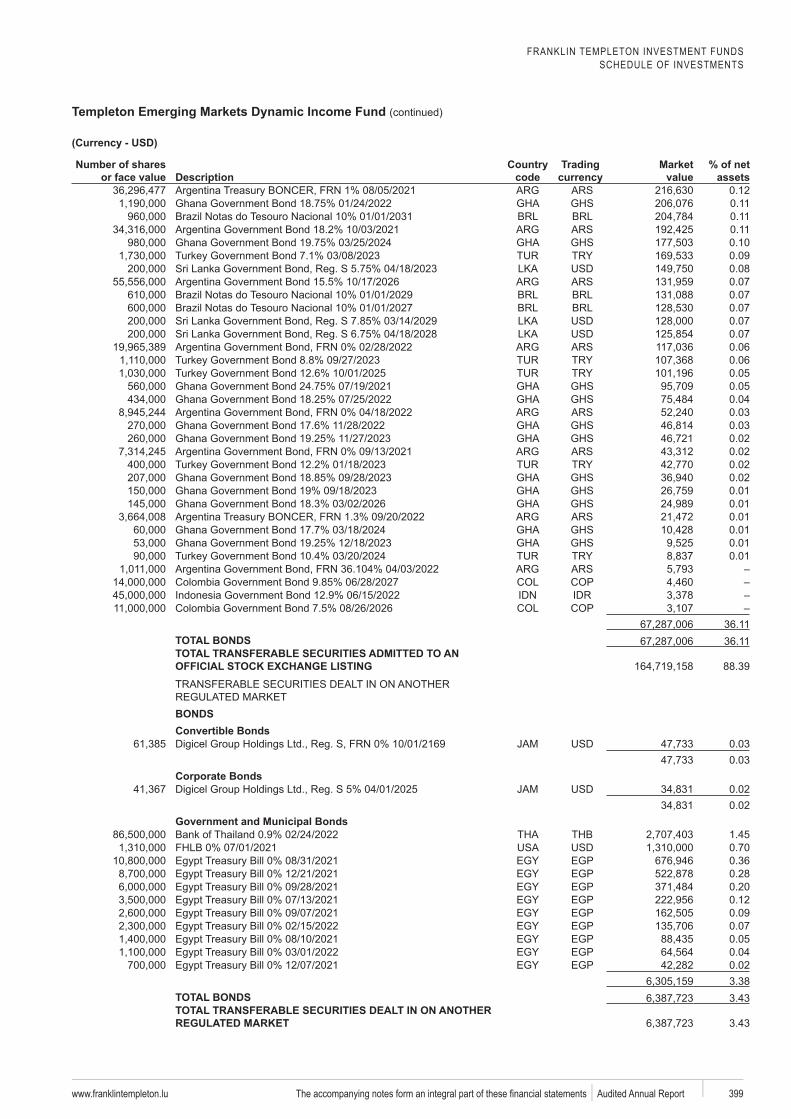
FRANKLIN TEMPLETON INVESTMENT FUNDSSCHEDULE OF INVESTMENTS
Templeton Emerging Markets Dynamic Income Fund (continued)
www.franklintempleton.lu 399 Audited Annual Report
Number of shares or face value Description
code
Trading Market value
% of net assets
0.120.11
do Tesouro 0.110.110.100.090.080.07
do Tesouro 0.07 do Tesouro 0.07
0.070.070.060.060.050.050.040.030.030.020.020.020.020.010.010.010.010.010.01
36.11TOTAL BONDS 36.11TOTAL TRANSFERABLE SECURITIES ADMITTED TO AN
88.39
BONDSConvertible BondsDigicel 0.03
0.03Corporate BondsDigicel 0.02
0.02Government and Municipal Bonds
1.450.70
EGP 0.36EGP 0.28EGP 0.20EGP 0.12EGP 0.09EGP 0.07EGP 0.05EGP 0.04EGP 0.02
3.38TOTAL BONDS 3.43TOTAL TRANSFERABLE SECURITIES DEALT IN ON ANOTHER
3.43
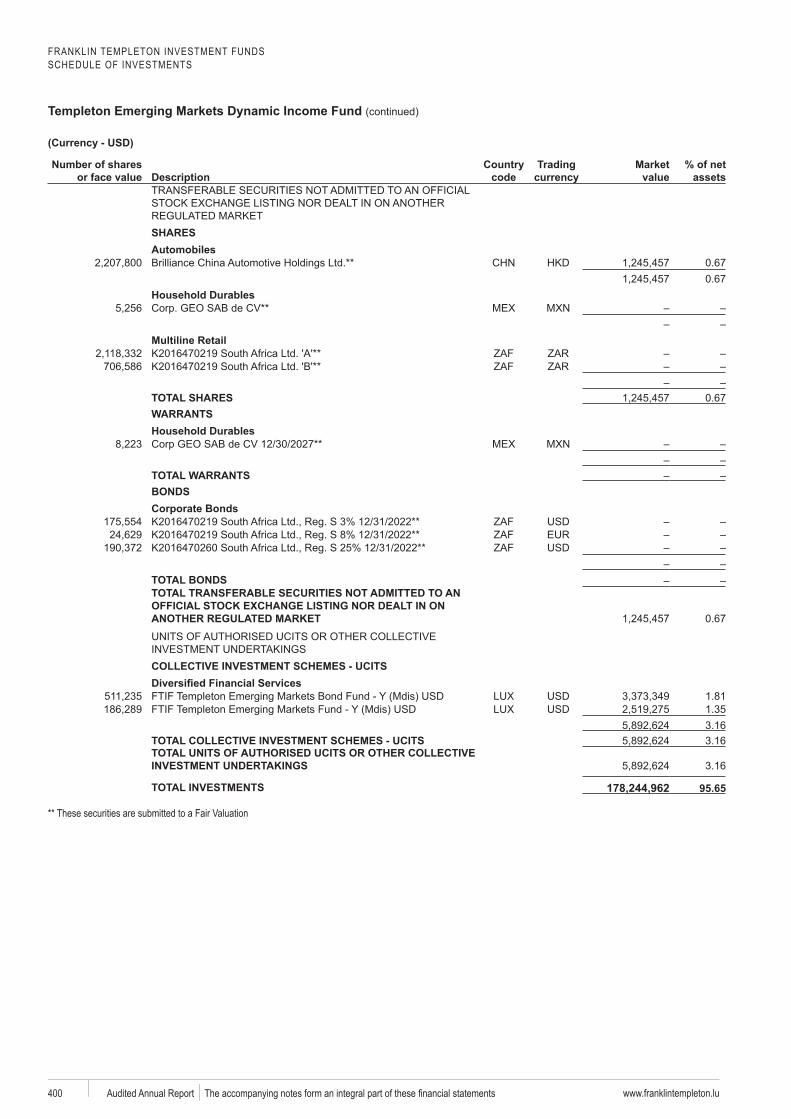
FRANKLIN TEMPLETON INVESTMENT FUNDSSCHEDULE OF INVESTMENTS
Templeton Emerging Markets Dynamic Income Fund (continued)
www.franklintempleton.lu400 Audited Annual Report
Number of shares or face value Description
code
Trading Market value
% of net assets
SHARESAutomobiles
0.670.67
Household Durables
Multiline Retail
TOTAL SHARES 0.67WARRANTSHousehold Durables
TOTAL WARRANTSBONDSCorporate Bonds
TOTAL BONDSTOTAL TRANSFERABLE SECURITIES NOT ADMITTED TO AN
0.67
COLLECTIVE INVESTMENT SCHEMES - UCITS
1.811.353.16
TOTAL COLLECTIVE INVESTMENT SCHEMES - UCITS 3.16TOTAL UNITS OF AUTHORISED UCITS OR OTHER COLLECTIVE
3.16
TOTAL INVESTMENTS 178,244,962a
** These securities are submitted to a Fair Valuation
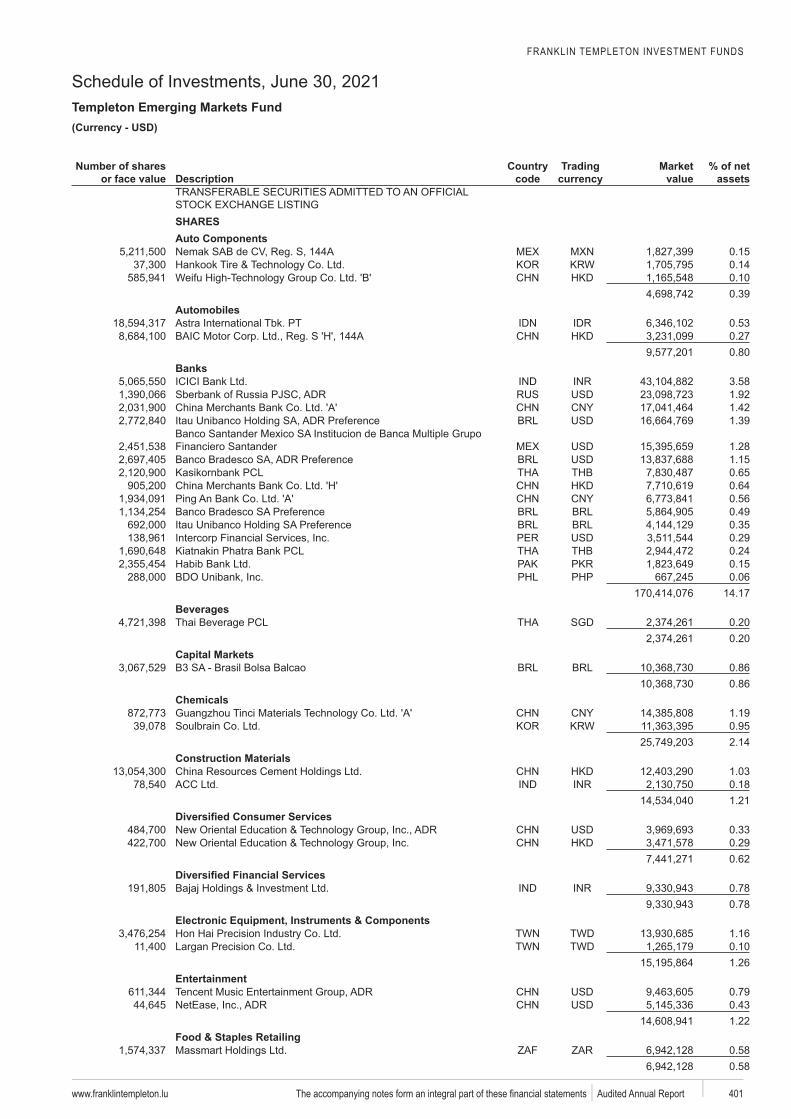
FRANKLIN TEMPLETON INVESTMENT FUNDS
Schedule of Investments, June 30, 2021Templeton Emerging Markets Fund
www.franklintempleton.lu 401 Audited Annual Report
USD)
Number of shares or face value Description
code
Trading Market value
% of net assets
SHARESAuto Components
0.150.140.100.39
Automobiles0.530.270.80
Banks3.581.921.421.39
Financiero Santander 1.281.150.650.640.560.490.350.290.240.150.06
14.17Beverages
SGD 0.200.20
Capital Markets0.860.86
Chemicals1.190.952.14
Construction Materials1.030.181.21
0.330.290.62
0.780.78
Electronic Equipment, Instruments & ComponentsTWD 1.16TWD 0.10
1.26Entertainment
0.790.431.22
Food & Staples Retailing0.580.58
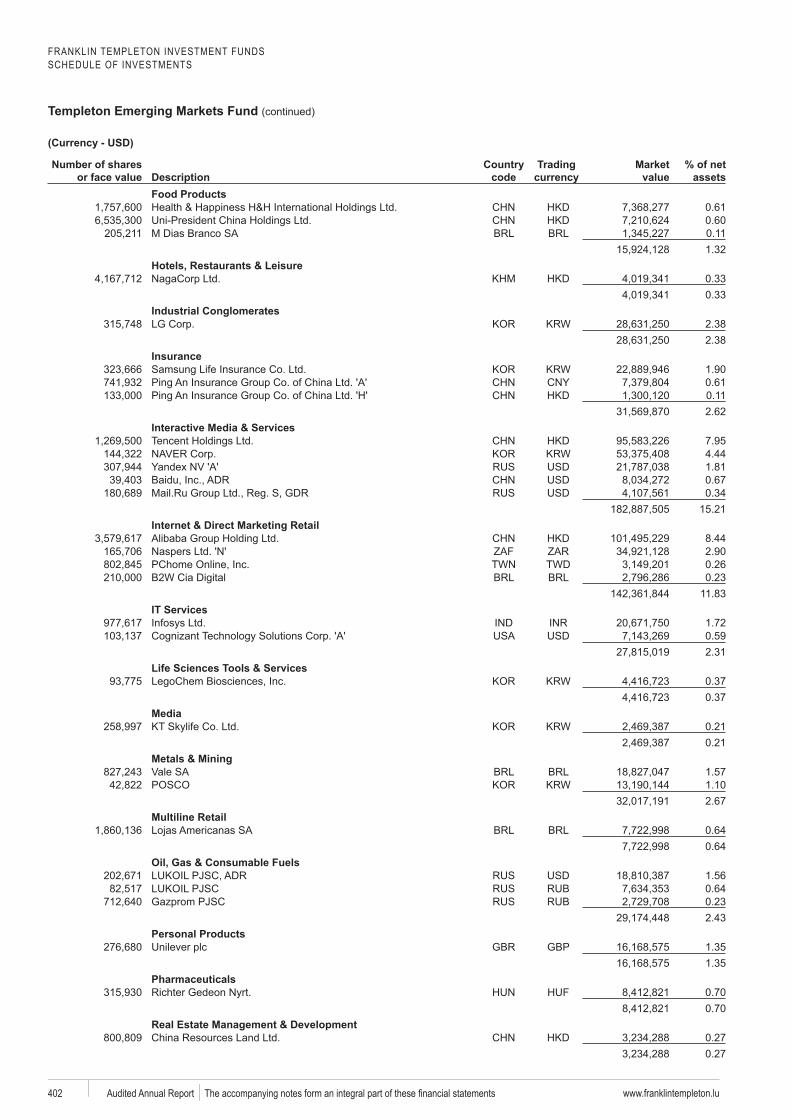
FRANKLIN TEMPLETON INVESTMENT FUNDSSCHEDULE OF INVESTMENTS
Templeton Emerging Markets Fund (continued)
www.franklintempleton.lu402 Audited Annual Report
Number of shares or face value Description
code
Trading Market value
% of net assets
Food Products0.610.600.111.32
Hotels, Restaurants & Leisure0.330.33
Industrial Conglomerates2.382.38
Insurance1.900.610.112.62
Interactive Media & Services7.954.441.810.670.34
15.21Internet & Direct Marketing Retail
8.442.90
TWD 0.260.23
11.83IT Services
1.720.592.31
Life Sciences Tools & Services0.370.37
Media0.210.21
Metals & Mining1.571.102.67
Multiline Retail0.640.64
Oil, Gas & Consumable Fuels1.560.640.232.43
Personal ProductsGBP 1.35
1.35Pharmaceuticals
0.700.70
Real Estate Management & Development0.270.27
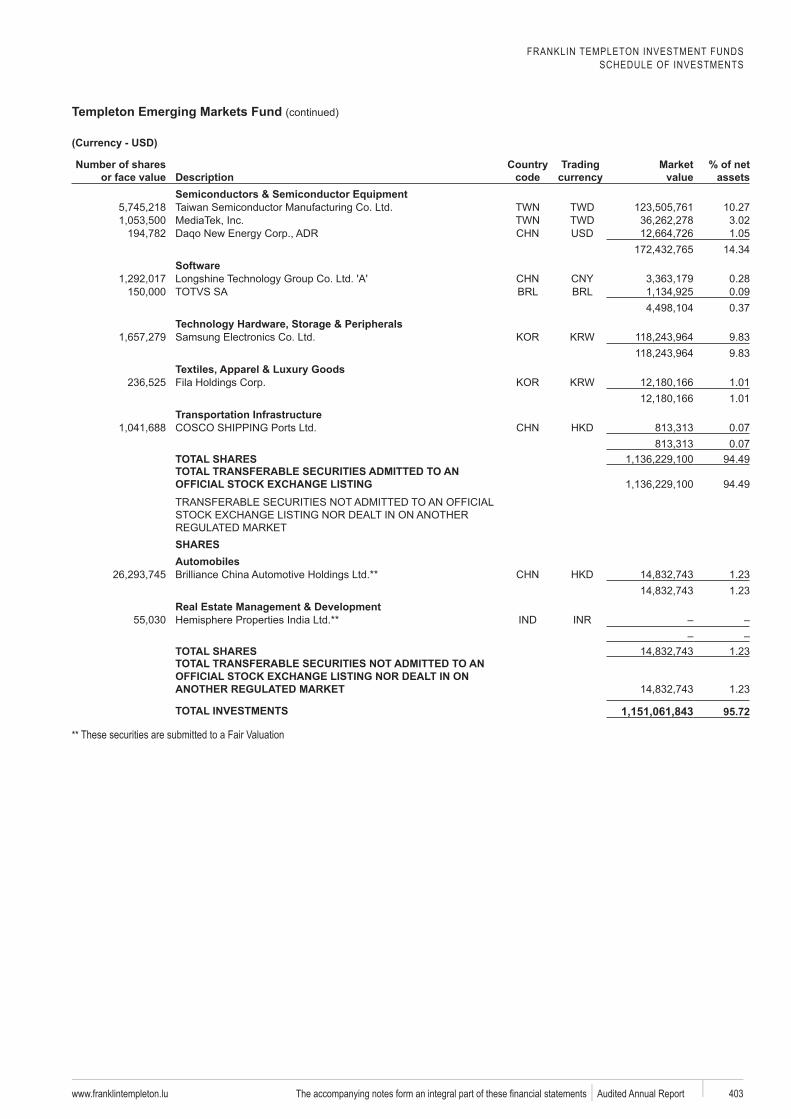
FRANKLIN TEMPLETON INVESTMENT FUNDSSCHEDULE OF INVESTMENTS
Templeton Emerging Markets Fund (continued)
www.franklintempleton.lu 403 Audited Annual Report
Number of shares or face value Description
code
Trading Market value
% of net assets
Semiconductors & Semiconductor EquipmentTWD 10.27TWD 3.02
1.0514.34
0.280.090.37
9.839.83
1.011.01
Transportation Infrastructure0.070.07
TOTAL SHARES 94.49TOTAL TRANSFERABLE SECURITIES ADMITTED TO AN
94.49
SHARESAutomobiles
1.231.23
Real Estate Management & Development
TOTAL SHARES 1.23TOTAL TRANSFERABLE SECURITIES NOT ADMITTED TO AN
1.23
TOTAL INVESTMENTS 1,151,061,843a** These securities are submitted to a Fair Valuation
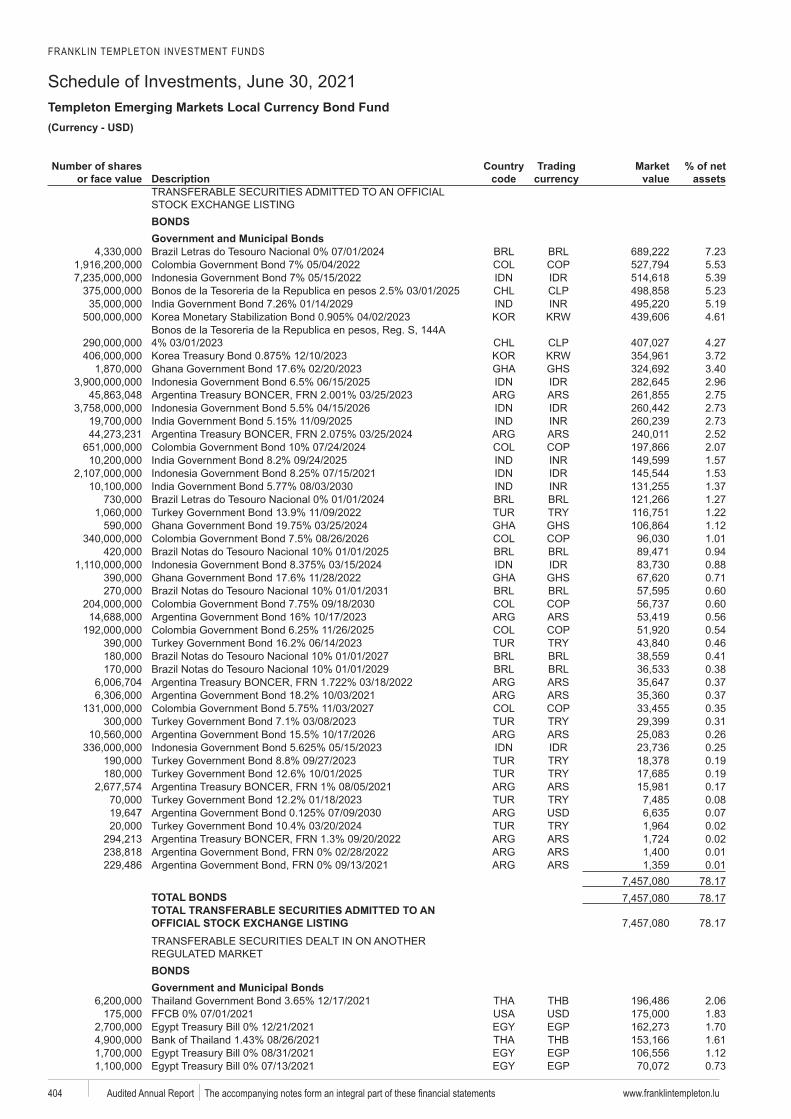
FRANKLIN TEMPLETON INVESTMENT FUNDS
Schedule of Investments, June 30, 2021Templeton Emerging Markets Local Currency Bond Fund
www.franklintempleton.lu404 Audited Annual Report
USD)
Number of shares or face value Description
code
Trading Market value
% of net assets
BONDSGovernment and Municipal Bonds
7.235.535.395.235.194.61
4.273.723.402.962.752.732.732.522.071.571.531.371.271.221.121.010.940.880.710.600.600.560.540.460.410.380.370.370.350.310.260.250.190.190.170.080.070.020.020.010.01
78.17TOTAL BONDS 78.17TOTAL TRANSFERABLE SECURITIES ADMITTED TO AN
78.17
BONDSGovernment and Municipal Bonds
2.061.83
EGP 1.701.61
EGP 1.12EGP 0.73
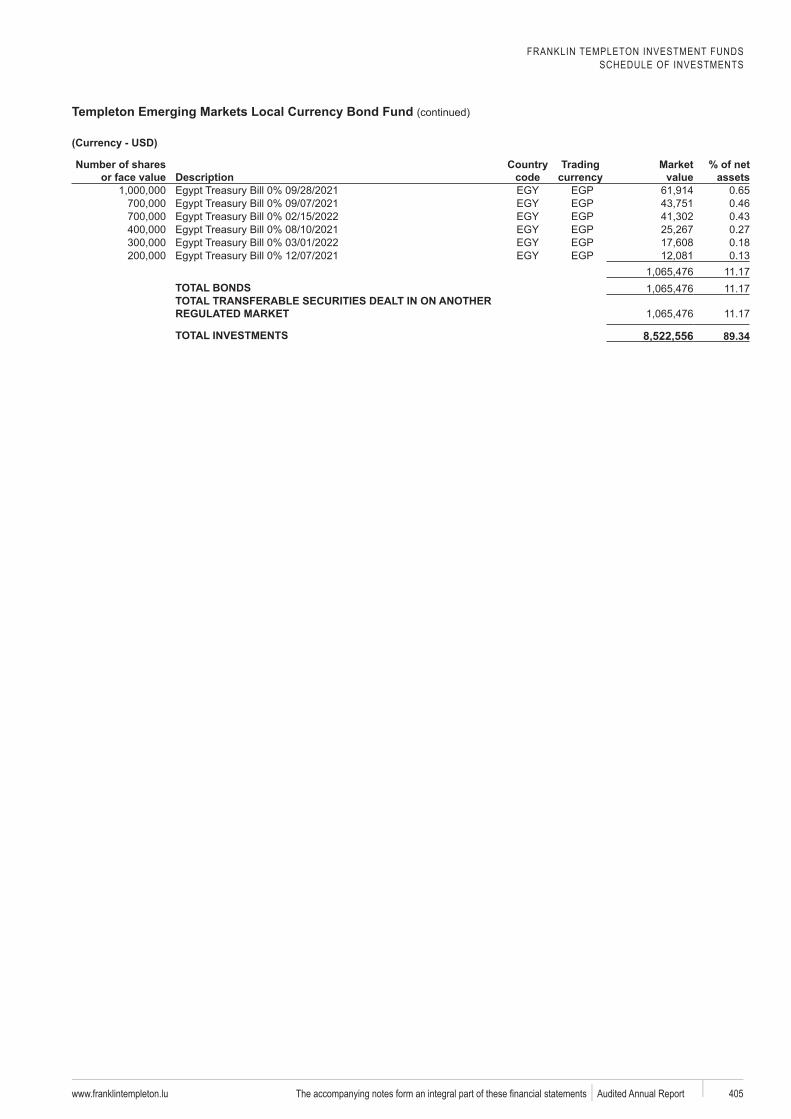
FRANKLIN TEMPLETON INVESTMENT FUNDSSCHEDULE OF INVESTMENTS
Templeton Emerging Markets Local Currency Bond Fund (continued)
www.franklintempleton.lu 405 Audited Annual Report
Number of shares or face value Description
code
Trading Market value
% of net assets
EGP 0.65EGP 0.46EGP 0.43EGP 0.27EGP 0.18EGP 0.13
11.17TOTAL BONDS 11.17TOTAL TRANSFERABLE SECURITIES DEALT IN ON ANOTHER
11.17
TOTAL INVESTMENTS 8,522,556
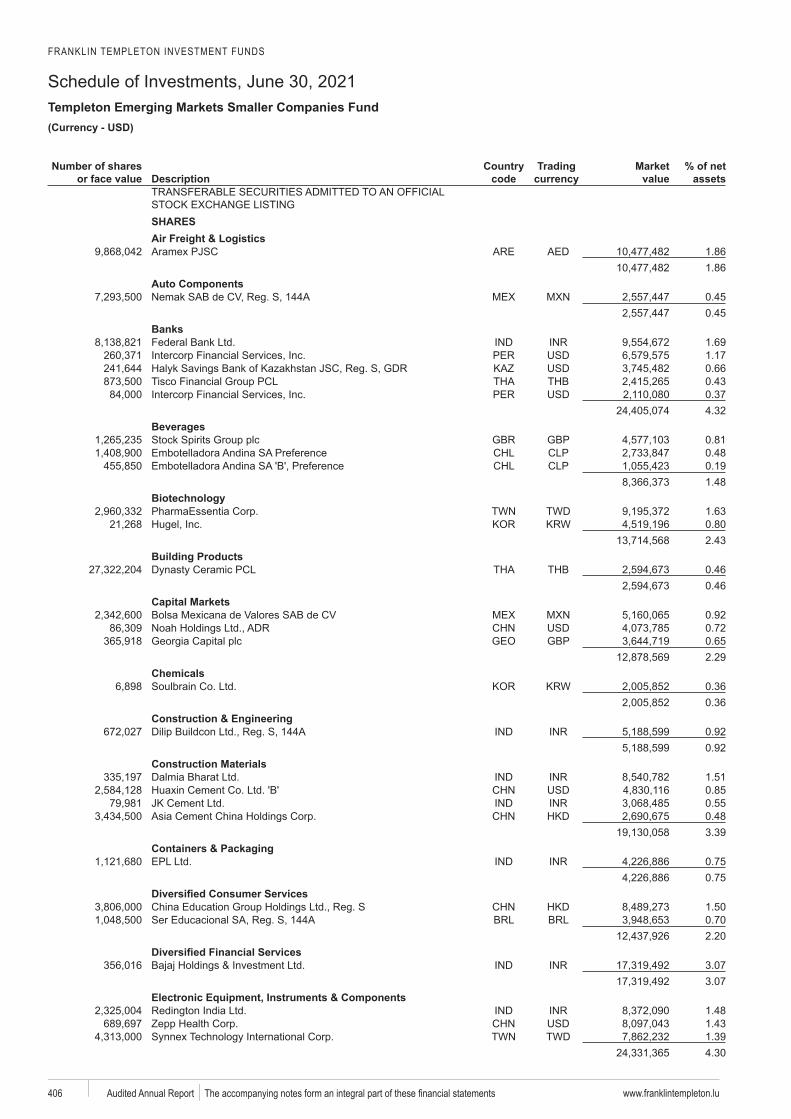
FRANKLIN TEMPLETON INVESTMENT FUNDS
Schedule of Investments, June 30, 2021Templeton Emerging Markets Smaller Companies Fund
www.franklintempleton.lu406 Audited Annual Report
USD)
Number of shares or face value Description
code
Trading Market value
% of net assets
SHARESAir Freight & Logistics
1.861.86
Auto Components0.450.45
Banks1.691.170.66
Tisco 0.430.374.32
BeveragesGBP 0.81
0.48 0.19
1.48
TWD 1.630.802.43
Building Products0.460.46
Capital MarketsBolsa 0.92
0.72GBP 0.65
2.29Chemicals
0.360.36
Construction & Engineering Buildcon 0.92
0.92Construction Materials
1.510.850.550.483.39
Containers & Packaging0.750.75
1.50Ser Educacional 0.70
2.20
3.073.07
Electronic Equipment, Instruments & Components1.481.43
Synnex TWD 1.394.30
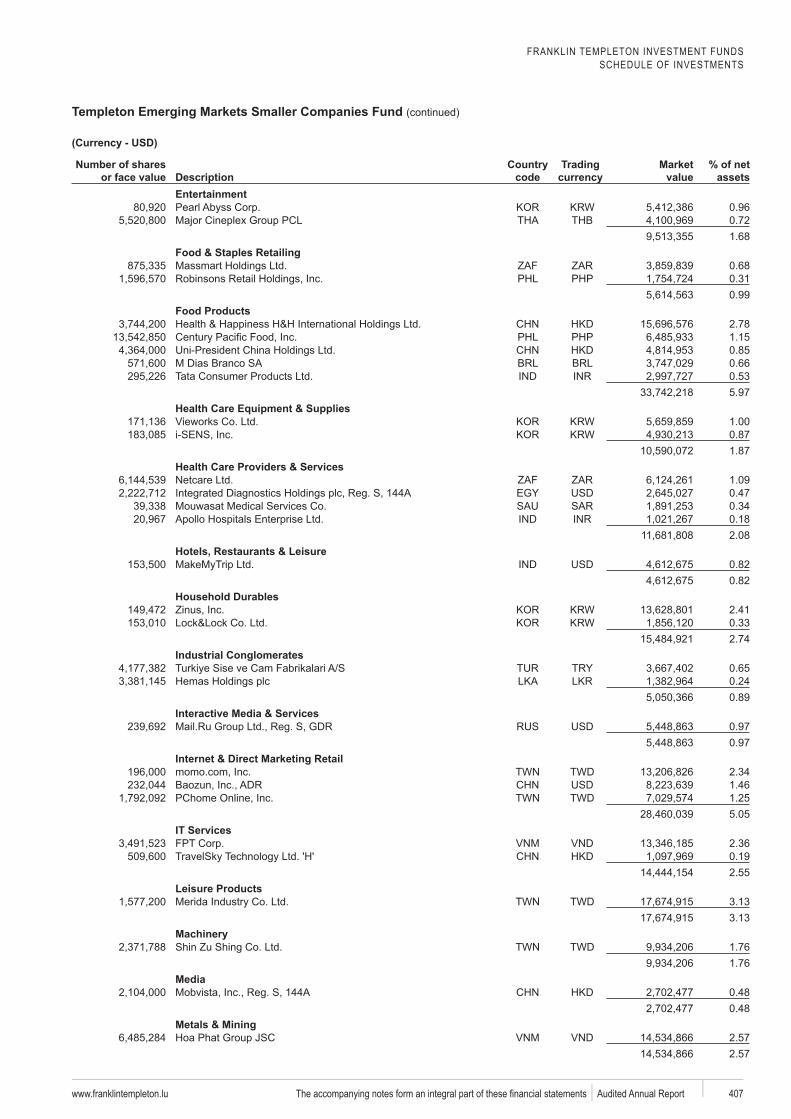
FRANKLIN TEMPLETON INVESTMENT FUNDSSCHEDULE OF INVESTMENTS
Templeton Emerging Markets Smaller Companies Fund (continued)
www.franklintempleton.lu 407 Audited Annual Report
Number of shares or face value Description
code
Trading Market value
% of net assets
Entertainment0.960.721.68
Food & Staples Retailing0.680.310.99
Food Products2.781.150.85
Branco 0.660.535.97
Health Care Equipment & Supplies1.00
i 0.871.87
Health Care Providers & Services1.090.470.340.182.08
Hotels, Restaurants & Leisure0.820.82
Household DurablesZinus 2.41
0.332.74
Industrial ConglomeratesTurkiye Sise ve 0.65
0.240.89
Interactive Media & Services0.970.97
Internet & Direct Marketing RetailTWD 2.34
1.46TWD 1.25
5.05IT Services
2.36TravelSky 0.19
2.55Leisure Products
TWD 3.133.13
Shin Zu Shing TWD 1.761.76
Media0.480.48
Metals & Mining2.572.57
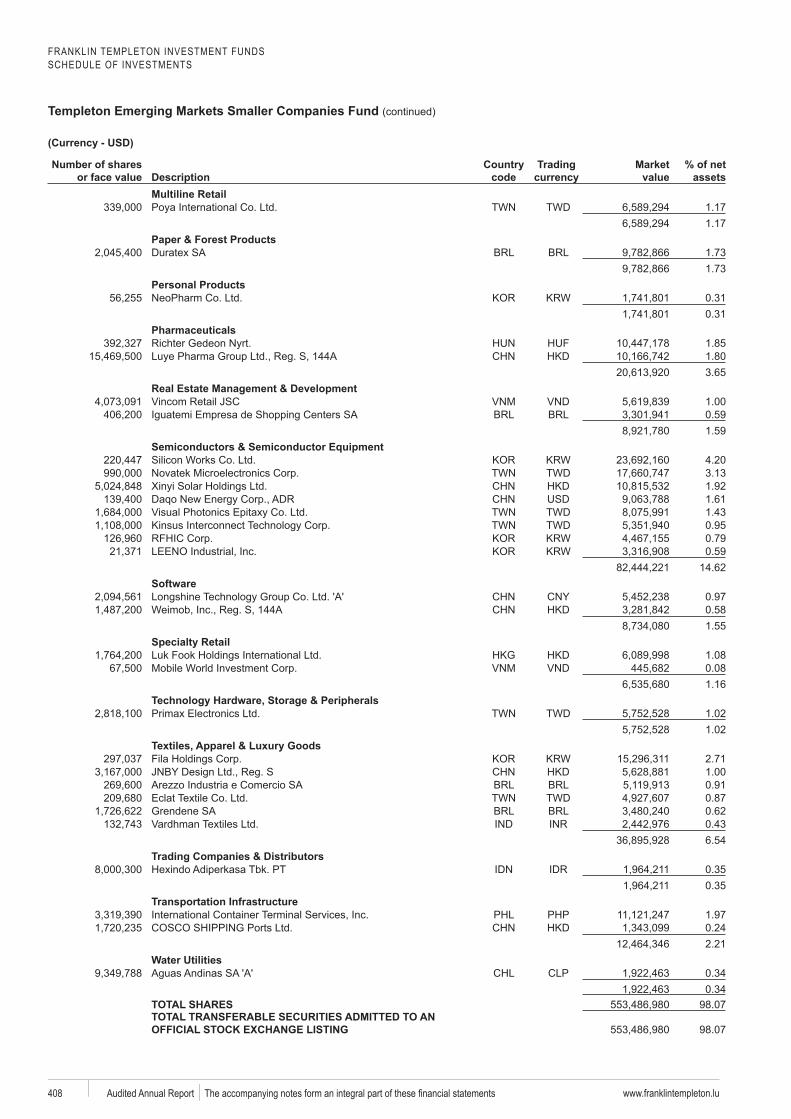
FRANKLIN TEMPLETON INVESTMENT FUNDSSCHEDULE OF INVESTMENTS
Templeton Emerging Markets Smaller Companies Fund (continued)
www.franklintempleton.lu408 Audited Annual Report
Number of shares or face value Description
code
Trading Market value
% of net assets
Multiline RetailPoya TWD 1.17
1.17Paper & Forest ProductsDuratex 1.73
1.73Personal Products
0.310.31
PharmaceuticalsGedeon . 1.85
1.803.65
Real Estate Management & Development1.00
0.591.59
Semiconductors & Semiconductor Equipment4.20
TWD 3.131.921.61
TWD 1.43Kinsus TWD 0.95
0.790.59
14.62
0.970.581.55
1.080.081.16
TWD 1.021.02
2.711.00
e 0.91Eclat TWD 0.87Grendene 0.62
0.436.54
Trading Companies & Distributors . PT 0.35
0.35Transportation Infrastructure
1.970.242.21
Water Utilities 0.34
0.34TOTAL SHARES 98.07TOTAL TRANSFERABLE SECURITIES ADMITTED TO AN
98.07
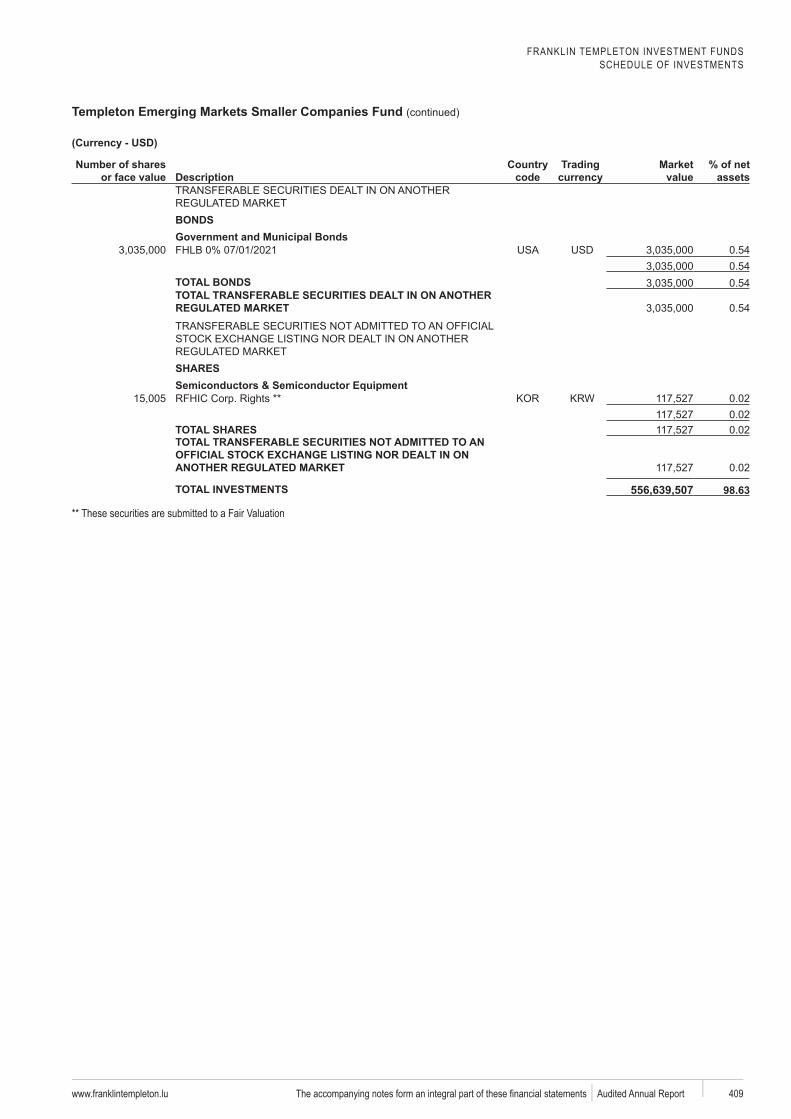
FRANKLIN TEMPLETON INVESTMENT FUNDSSCHEDULE OF INVESTMENTS
Templeton Emerging Markets Smaller Companies Fund (continued)
www.franklintempleton.lu 409 Audited Annual Report
Number of shares or face value Description
code
Trading Market value
% of net assets
BONDSGovernment and Municipal Bonds
0.540.54
TOTAL BONDS 0.54TOTAL TRANSFERABLE SECURITIES DEALT IN ON ANOTHER
0.54
SHARESSemiconductors & Semiconductor Equipment
0.020.02
TOTAL SHARES 0.02TOTAL TRANSFERABLE SECURITIES NOT ADMITTED TO AN
0.02
TOTAL INVESTMENTS 556,639,507a** These securities are submitted to a Fair Valuation
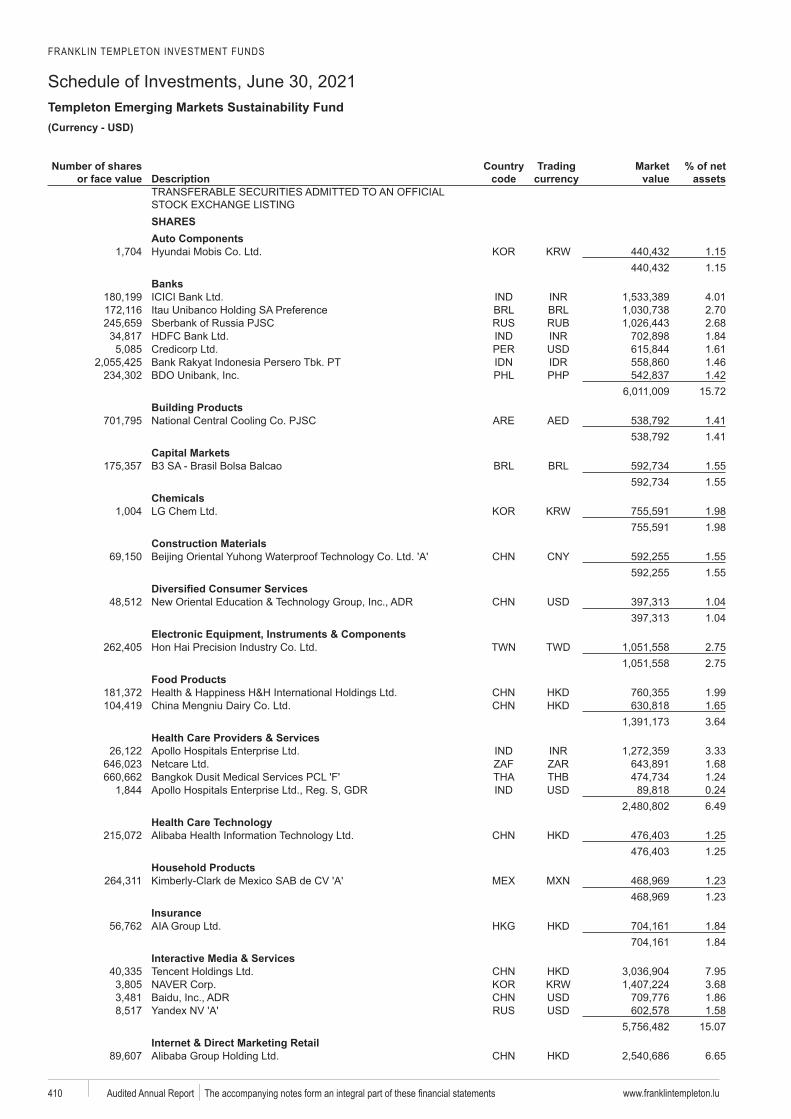
FRANKLIN TEMPLETON INVESTMENT FUNDS
Schedule of Investments, June 30, 2021Templeton Emerging Markets Sustainability Fund
www.franklintempleton.lu410 Audited Annual Report
USD)
Number of shares or face value Description
code
Trading Market value
% of net assets
SHARESAuto Components
1.151.15
Banks4.012.702.681.841.611.461.42
15.72Building Products
1.411.41
Capital Markets1.551.55
Chemicals1.981.98
Construction Materials1.551.55
1.041.04
Electronic Equipment, Instruments & ComponentsTWD 2.75
2.75Food Products
1.991.653.64
Health Care Providers & Services3.331.681.240.246.49
1.251.25
Household Products1.231.23
Insurance1.841.84
Interactive Media & Services7.953.681.861.58
15.07Internet & Direct Marketing Retail
6.65
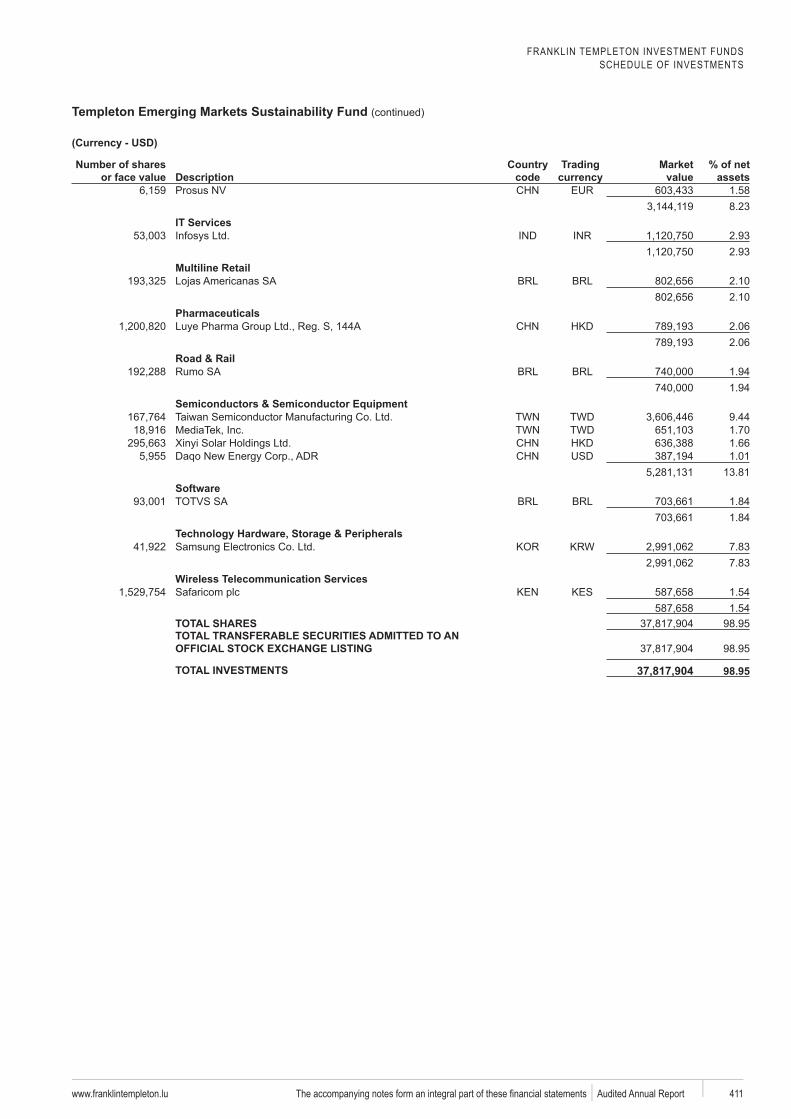
FRANKLIN TEMPLETON INVESTMENT FUNDSSCHEDULE OF INVESTMENTS
Templeton Emerging Markets Sustainability Fund (continued)
www.franklintempleton.lu 411 Audited Annual Report
Number of shares or face value Description
code
Trading Market value
% of net assets
1.588.23
IT Services2.932.93
Multiline Retail2.102.10
Pharmaceuticals2.062.06
Road & Rail1.941.94
Semiconductors & Semiconductor EquipmentTWD 9.44TWD 1.70
1.661.01
13.81
1.841.84
7.837.83
Wireless Telecommunication ServicesKES 1.54
1.54TOTAL SHARES 98.95TOTAL TRANSFERABLE SECURITIES ADMITTED TO AN
98.95
TOTAL INVESTMENTS 37,817,904
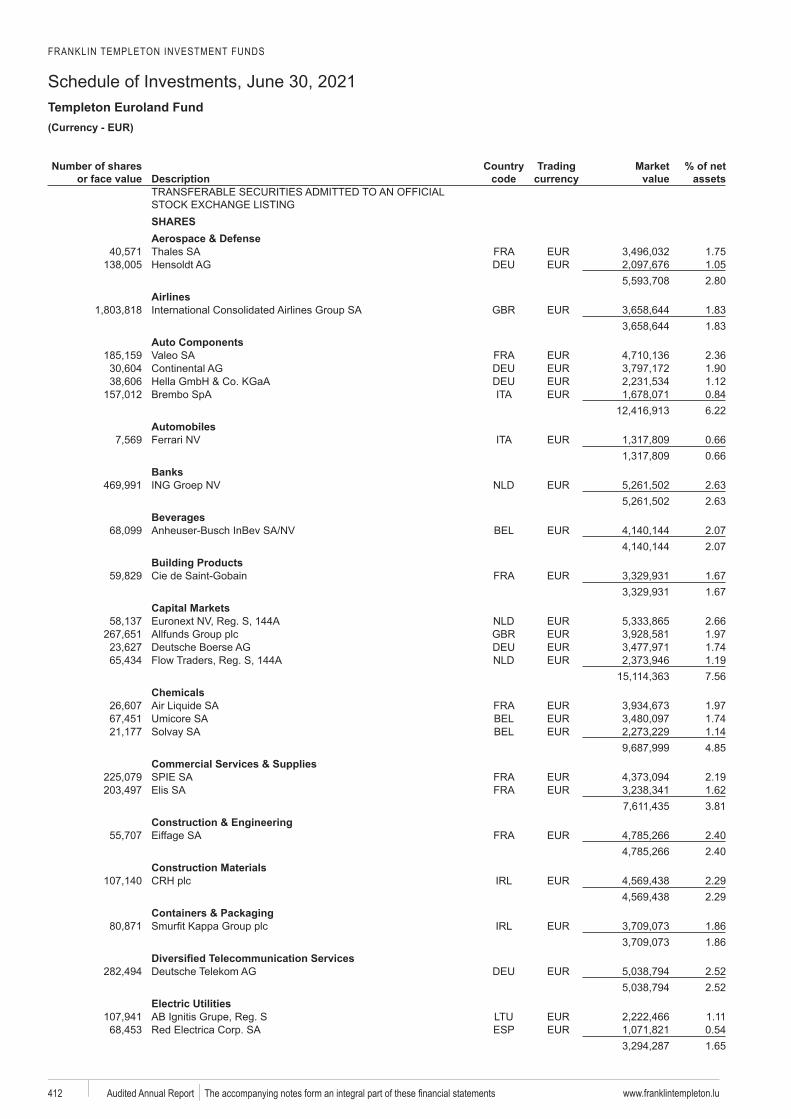
FRANKLIN TEMPLETON INVESTMENT FUNDS
Schedule of Investments, June 30, 2021Templeton Euroland Fund
www.franklintempleton.lu412 Audited Annual Report
EUR)
Number of shares or face value Description
code
Trading Market value
% of net assets
SHARESAerospace & Defense
1.751.052.80
Airlines1.831.83
Auto Components2.361.901.12
0.846.22
Automobiles0.660.66
Banks2.632.63
Beverages2.072.07
Building Products1.671.67
Capital Markets2.661.97
Deutsche Boerse 1.741.197.56
Chemicals1.971.741.144.85
Commercial Services & Supplies2.191.623.81
Construction & EngineeringEiffage 2.40
2.40Construction Materials
2.292.29
Containers & Packaging1.861.86
2.522.52
Electric Utilities 1.11
Electrica ESP 0.541.65
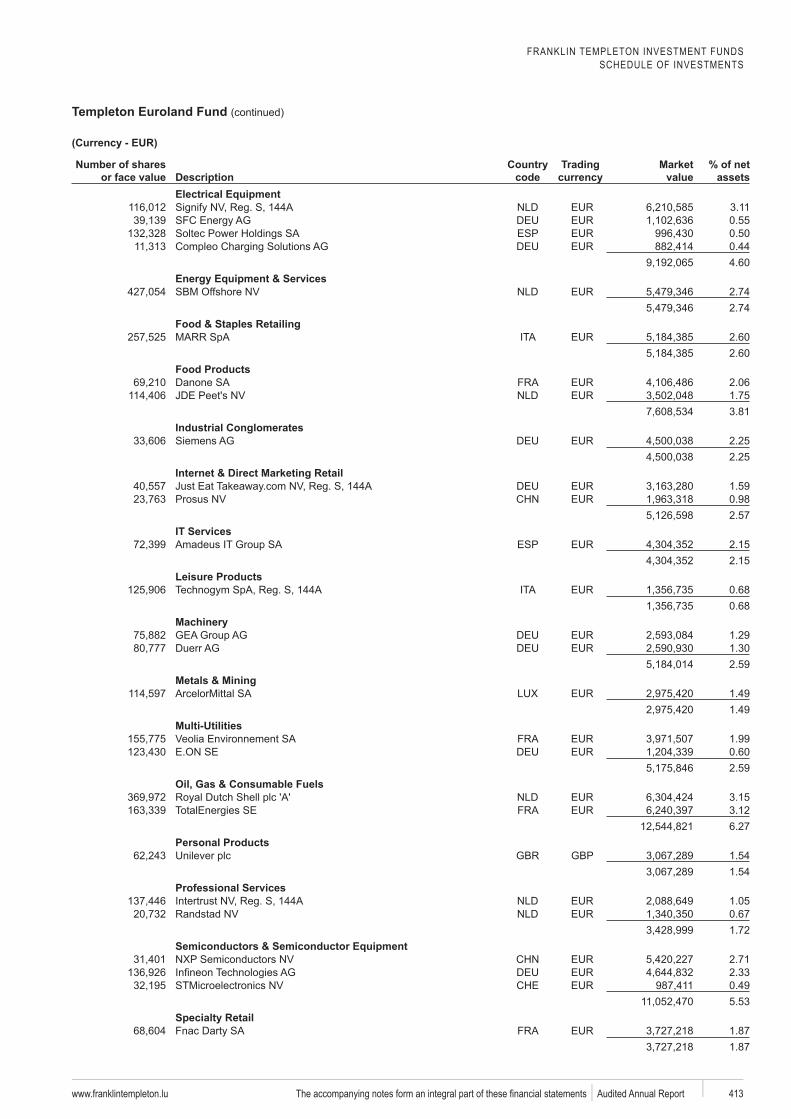
FRANKLIN TEMPLETON INVESTMENT FUNDSSCHEDULE OF INVESTMENTS
Templeton Euroland Fund (continued)
www.franklintempleton.lu 413 Audited Annual Report
Number of shares or face value Description
code
Trading Market value
% of net assets
Electrical Equipment3.110.55
Soltec ESP 0.500.444.60
2.742.74
Food & Staples Retailing2.602.60
Food Products2.06
JDE 1.753.81
Industrial Conglomerates2.252.25
Internet & Direct Marketing Retail1.59
Prosus 0.982.57
IT ServicesESP 2.15
2.15Leisure Products
0.680.68
1.29Duerr 1.30
2.59Metals & Mining
1.491.49
Multi-Utilities1.990.602.59
Oil, Gas & Consumable Fuels3.15
TotalEnergies SE 3.126.27
Personal ProductsGBP 1.54
1.54Professional Services
1.050.671.72
Semiconductors & Semiconductor Equipment2.712.330.495.53
Fnac Darty 1.871.87
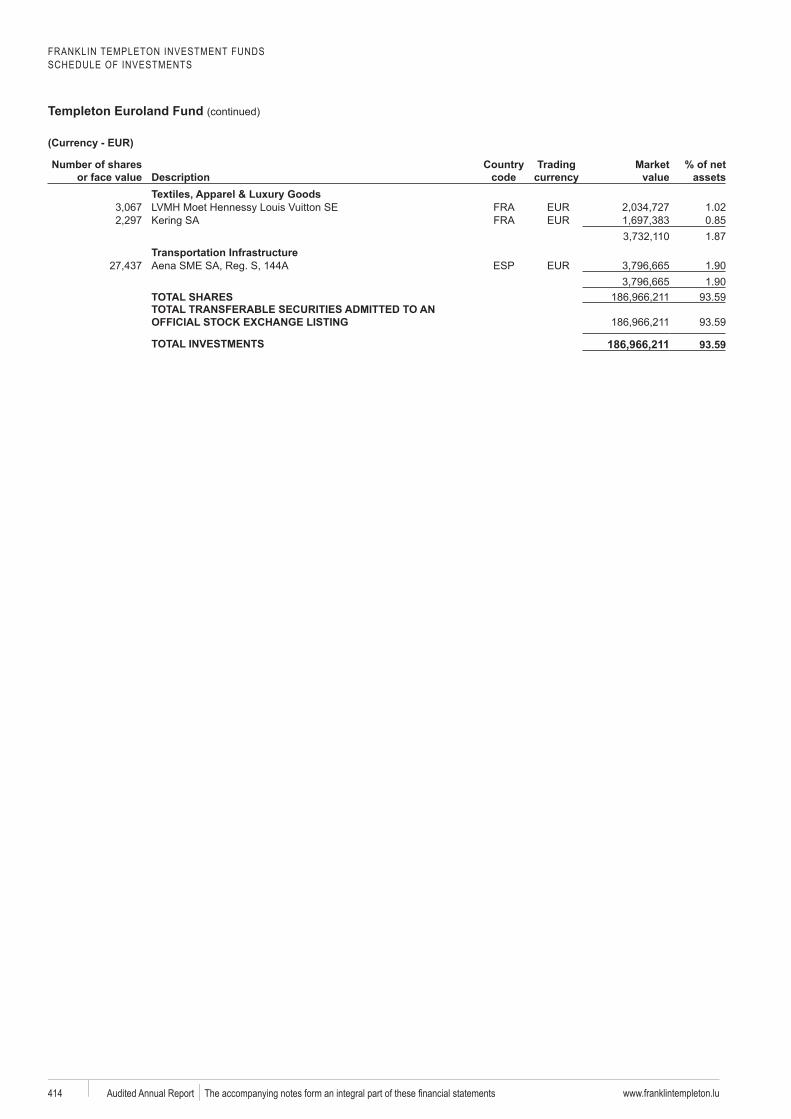
FRANKLIN TEMPLETON INVESTMENT FUNDSSCHEDULE OF INVESTMENTS
Templeton Euroland Fund (continued)
www.franklintempleton.lu414 Audited Annual Report
Number of shares or face value Description
code
Trading Market value
% of net assets
1.02Kering 0.85
1.87Transportation Infrastructure
ESP 1.901.90
TOTAL SHARES 93.59TOTAL TRANSFERABLE SECURITIES ADMITTED TO AN
93.59
TOTAL INVESTMENTS 186,966,211
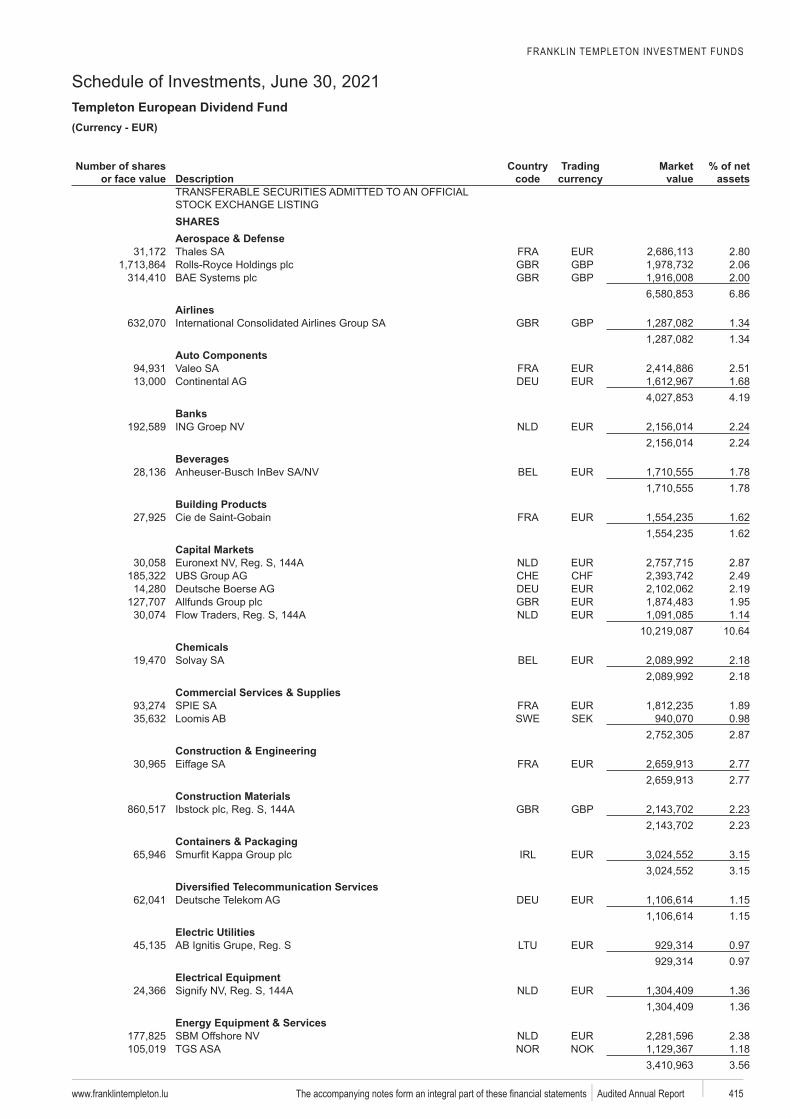
FRANKLIN TEMPLETON INVESTMENT FUNDS
Schedule of Investments, June 30, 2021Templeton European Dividend Fund
www.franklintempleton.lu 415 Audited Annual Report
EUR)
Number of shares or face value Description
code
Trading Market value
% of net assets
SHARESAerospace & Defense
2.80GBP 2.06GBP 2.00
6.86Airlines
GBP 1.341.34
Auto Components2.511.684.19
Banks2.242.24
Beverages1.781.78
Building Products1.621.62
Capital Markets2.872.49
Deutsche Boerse 2.191.951.14
10.64Chemicals
2.182.18
Commercial Services & Supplies1.89
SWE SEK 0.982.87
Construction & EngineeringEiffage 2.77
2.77Construction Materials
GBP 2.232.23
Containers & Packaging3.153.15
1.151.15
Electric Utilities 0.97
0.97Electrical Equipment
1.361.36
2.381.183.56
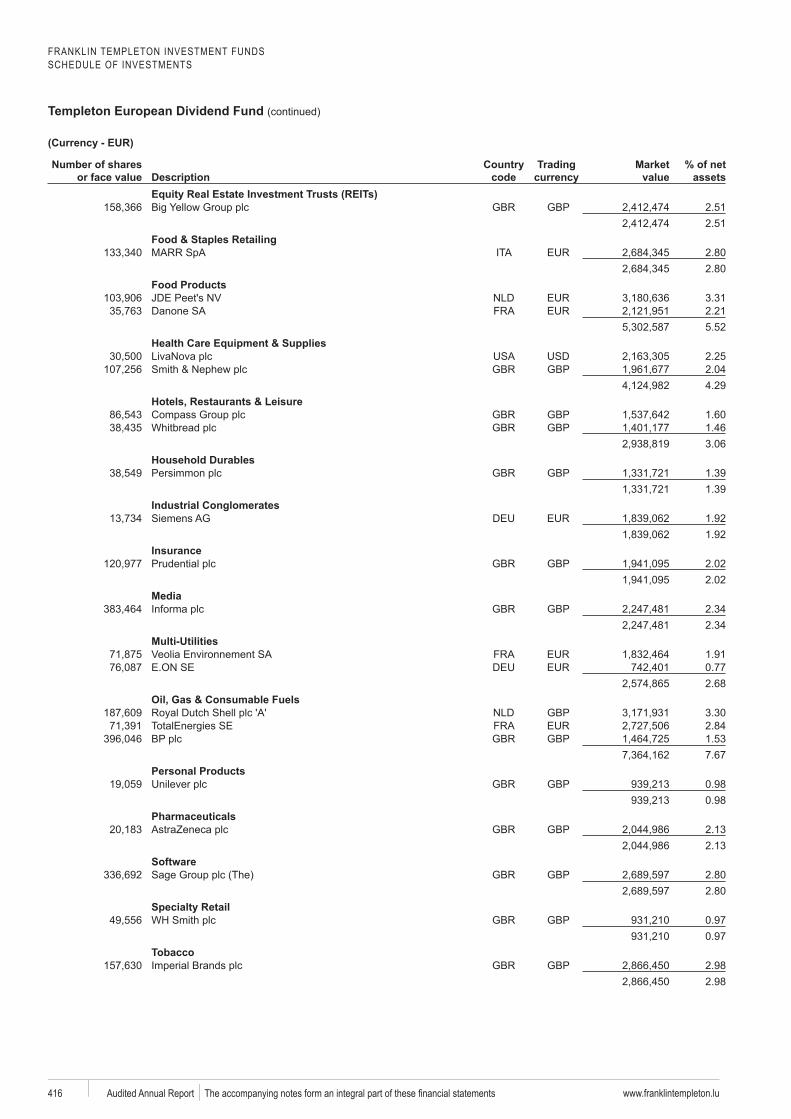
FRANKLIN TEMPLETON INVESTMENT FUNDSSCHEDULE OF INVESTMENTS
Templeton European Dividend Fund (continued)
www.franklintempleton.lu416 Audited Annual Report
Number of shares or face value Description
code
Trading Market value
% of net assets
GBP 2.512.51
Food & Staples Retailing2.802.80
Food ProductsJDE 3.31
2.215.52
Health Care Equipment & Supplies2.25
GBP 2.044.29
Hotels, Restaurants & LeisureGBP 1.60GBP 1.46
3.06Household Durables
GBP 1.391.39
Industrial Conglomerates1.921.92
InsuranceGBP 2.02
2.02Media
GBP 2.342.34
Multi-Utilities1.910.772.68
Oil, Gas & Consumable FuelsGBP 3.30
TotalEnergies SE 2.84GBP 1.53
7.67Personal Products
GBP 0.980.98
PharmaceuticalsGBP 2.13
2.13
GBP 2.802.80
GBP 0.970.97
TobaccoGBP 2.98
2.98
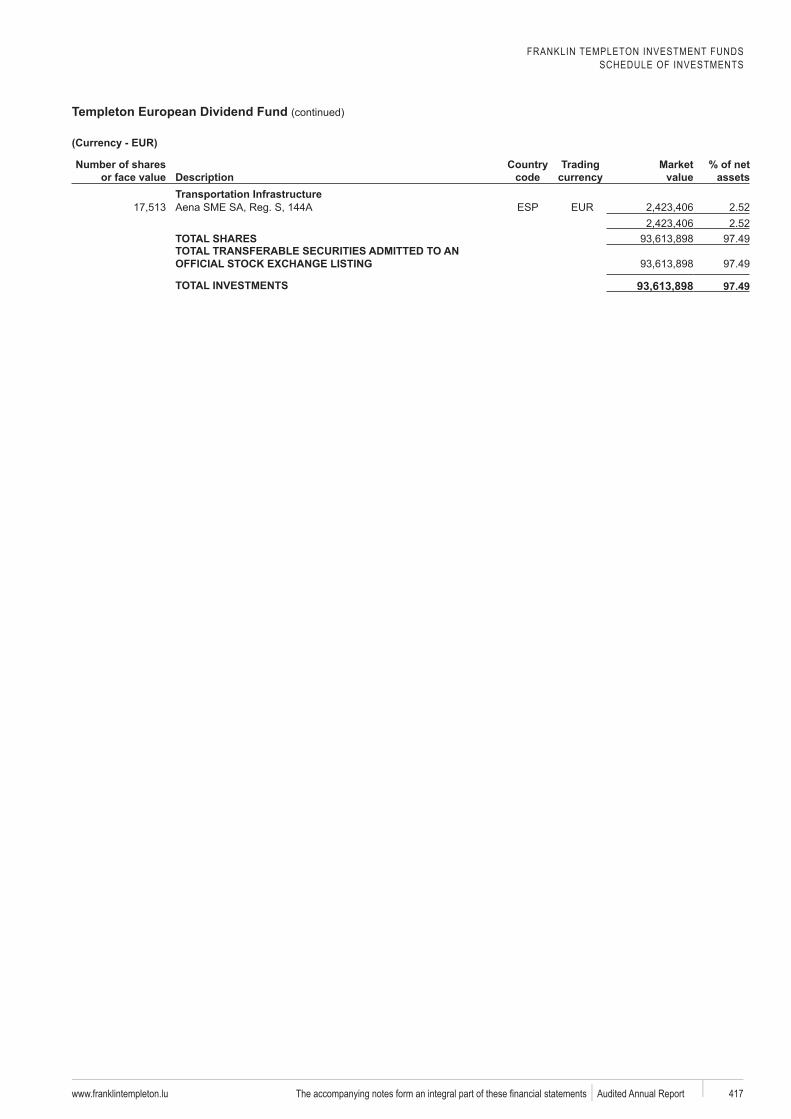
FRANKLIN TEMPLETON INVESTMENT FUNDSSCHEDULE OF INVESTMENTS
Templeton European Dividend Fund (continued)
www.franklintempleton.lu 417 Audited Annual Report
Number of shares or face value Description
code
Trading Market value
% of net assets
Transportation InfrastructureESP 2.52
2.52TOTAL SHARES 97.49TOTAL TRANSFERABLE SECURITIES ADMITTED TO AN
97.49
TOTAL INVESTMENTS 93,613,898
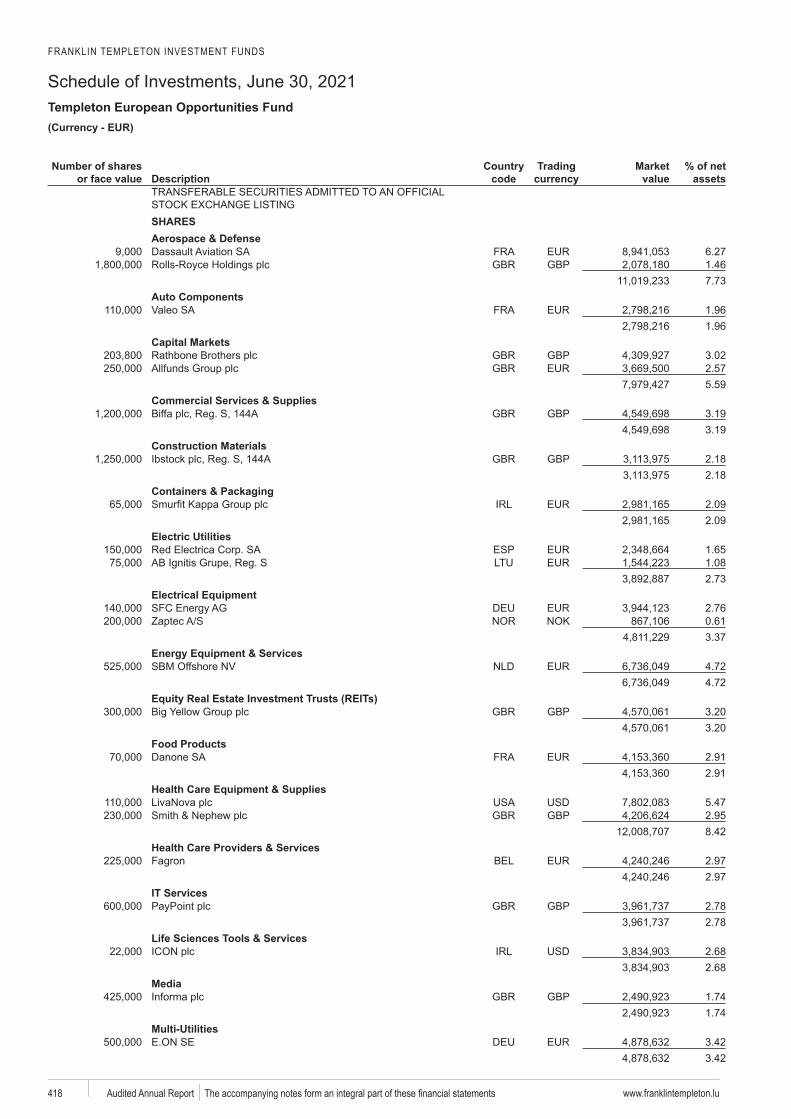
FRANKLIN TEMPLETON INVESTMENT FUNDS
Schedule of Investments, June 30, 2021Templeton European Opportunities Fund
www.franklintempleton.lu418 Audited Annual Report
EUR)
Number of shares or face value Description
code
Trading Market value
% of net assets
SHARESAerospace & DefenseDassault 6.27
GBP 1.467.73
Auto Components1.961.96
Capital MarketsGBP 3.02
2.575.59
Commercial Services & SuppliesGBP 3.19
3.19Construction Materials
GBP 2.182.18
Containers & Packaging2.092.09
Electric UtilitiesElectrica ESP 1.65
1.082.73
Electrical Equipment2.760.613.37
4.724.72
GBP 3.203.20
Food Products2.912.91
Health Care Equipment & Supplies5.47
GBP 2.958.42
Health Care Providers & ServicesFagron 2.97
2.97IT ServicesPayPoint GBP 2.78
2.78Life Sciences Tools & Services
2.682.68
MediaGBP 1.74
1.74Multi-Utilities
3.423.42
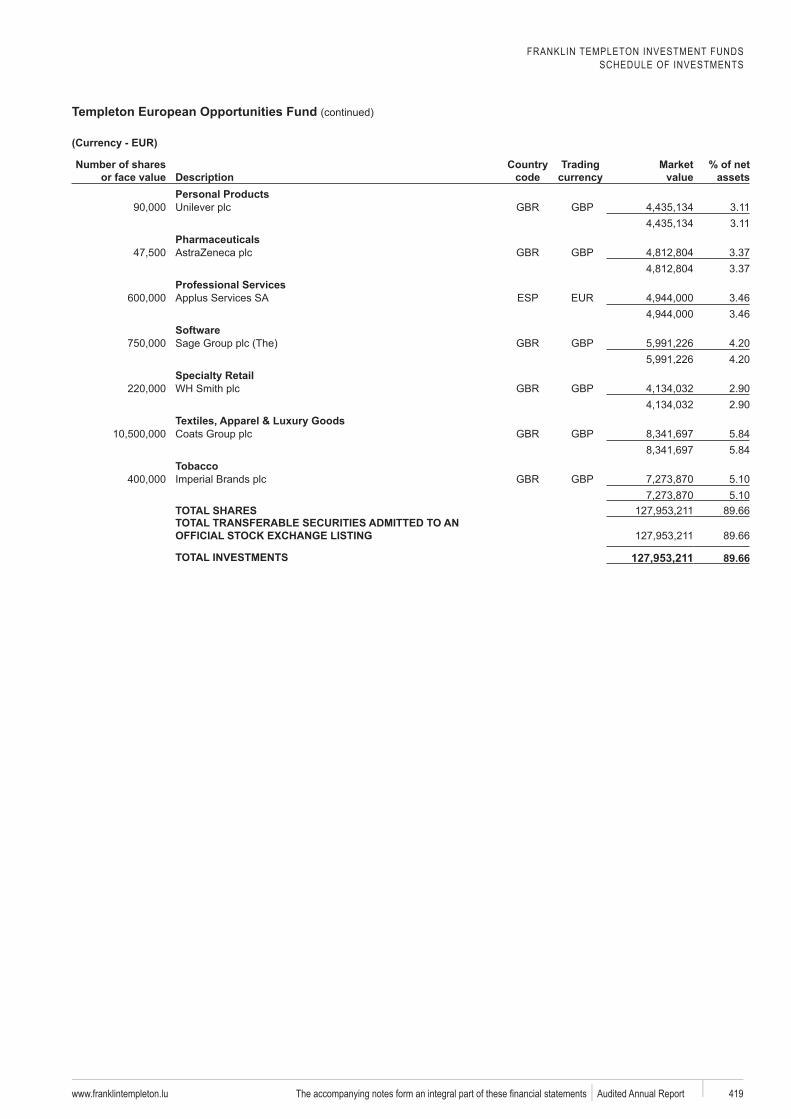
FRANKLIN TEMPLETON INVESTMENT FUNDSSCHEDULE OF INVESTMENTS
Templeton European Opportunities Fund (continued)
www.franklintempleton.lu 419 Audited Annual Report
Number of shares or face value Description
code
Trading Market value
% of net assets
Personal ProductsGBP 3.11
3.11Pharmaceuticals
GBP 3.373.37
Professional ServicesESP 3.46
3.46
GBP 4.204.20
GBP 2.902.90
GBP 5.845.84
TobaccoGBP 5.10
5.10TOTAL SHARES 89.66TOTAL TRANSFERABLE SECURITIES ADMITTED TO AN
89.66
TOTAL INVESTMENTS 127,953,211
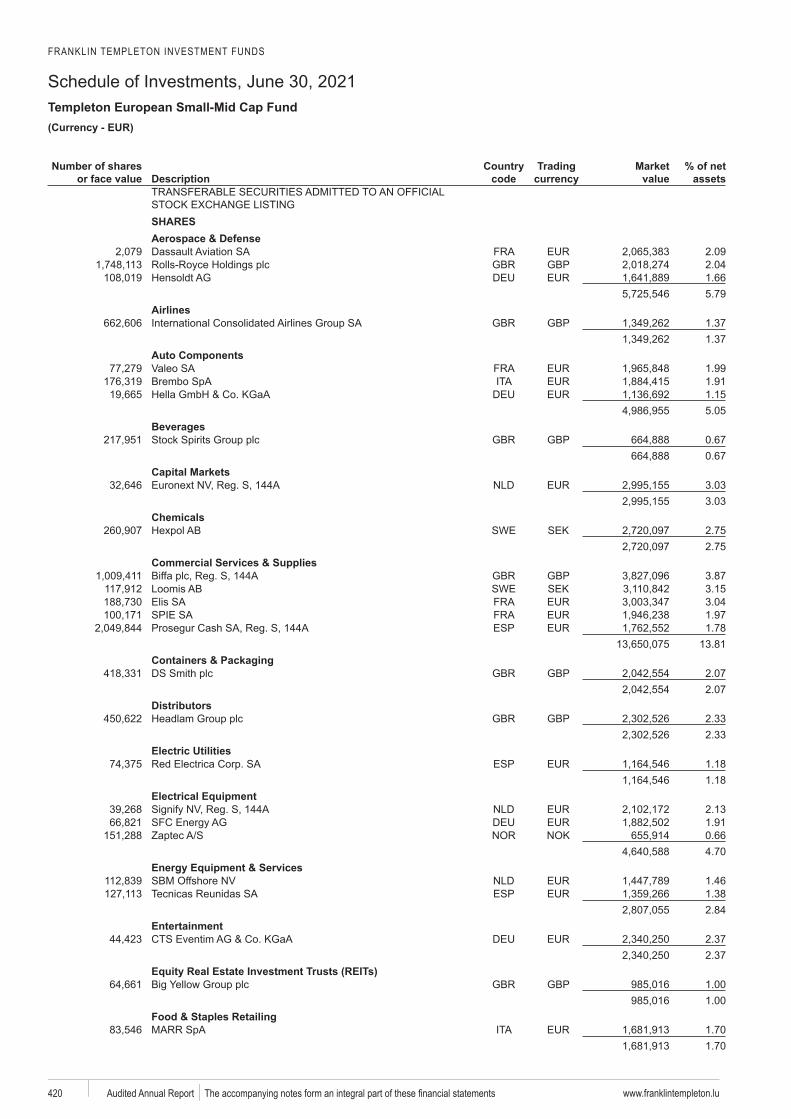
FRANKLIN TEMPLETON INVESTMENT FUNDS
Schedule of Investments, June 30, 2021Templeton European Small-Mid Cap Fund
www.franklintempleton.lu420 Audited Annual Report
EUR)
Number of shares or face value Description
code
Trading Market value
% of net assets
SHARESAerospace & DefenseDassault 2.09
GBP 2.041.665.79
AirlinesGBP 1.37
1.37Auto Components
1.99 1.91
1.155.05
BeveragesGBP 0.67
0.67Capital Markets
3.033.03
ChemicalsSWE SEK 2.75
2.75Commercial Services & Supplies
GBP 3.87SWE SEK 3.15
3.041.97
Prosegur ESP 1.7813.81
Containers & PackagingGBP 2.07
2.07Distributors
GBP 2.332.33
Electric UtilitiesElectrica ESP 1.18
1.18Electrical Equipment
2.131.910.664.70
1.46Tecnicas ESP 1.38
2.84Entertainment
2.372.37
GBP 1.001.00
Food & Staples Retailing1.701.70
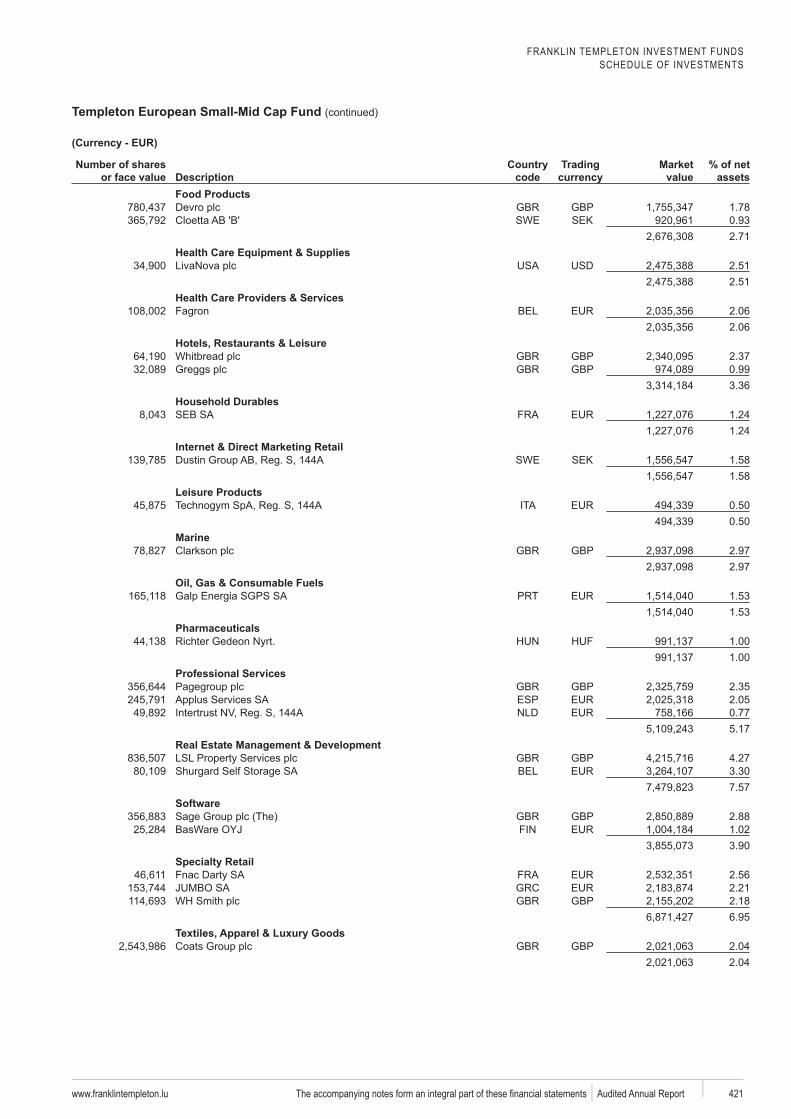
FRANKLIN TEMPLETON INVESTMENT FUNDSSCHEDULE OF INVESTMENTS
Templeton European Small-Mid Cap Fund (continued)
www.franklintempleton.lu 421 Audited Annual Report
Number of shares or face value Description
code
Trading Market value
% of net assets
Food ProductsDevro GBP 1.78
SWE SEK 0.932.71
Health Care Equipment & Supplies2.512.51
Health Care Providers & ServicesFagron 2.06
2.06Hotels, Restaurants & Leisure
GBP 2.37GBP 0.99
3.36Household Durables
1.241.24
Internet & Direct Marketing RetailSWE SEK 1.58
1.58Leisure Products
0.500.50
MarineGBP 2.97
2.97Oil, Gas & Consumable Fuels
Energia 1.531.53
PharmaceuticalsGedeon . 1.00
1.00Professional Services
GBP 2.35ESP 2.05
0.775.17
Real Estate Management & DevelopmentGBP 4.27
Shurgard 3.307.57
GBP 2.88BasWare 1.02
3.90
Fnac Darty 2.562.21
GBP 2.186.95
GBP 2.042.04
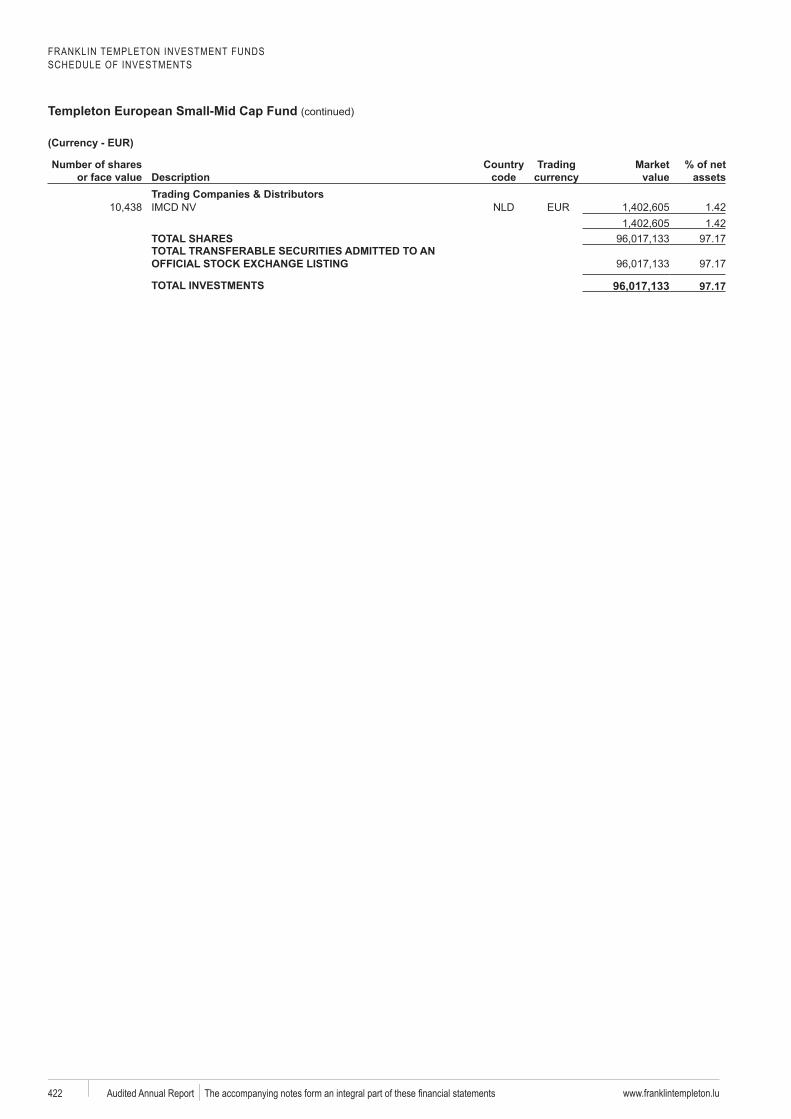
FRANKLIN TEMPLETON INVESTMENT FUNDSSCHEDULE OF INVESTMENTS
Templeton European Small-Mid Cap Fund (continued)
www.franklintempleton.lu422 Audited Annual Report
Number of shares or face value Description
code
Trading Market value
% of net assets
Trading Companies & Distributors1.421.42
TOTAL SHARES 97.17TOTAL TRANSFERABLE SECURITIES ADMITTED TO AN
97.17
TOTAL INVESTMENTS 96,017,133
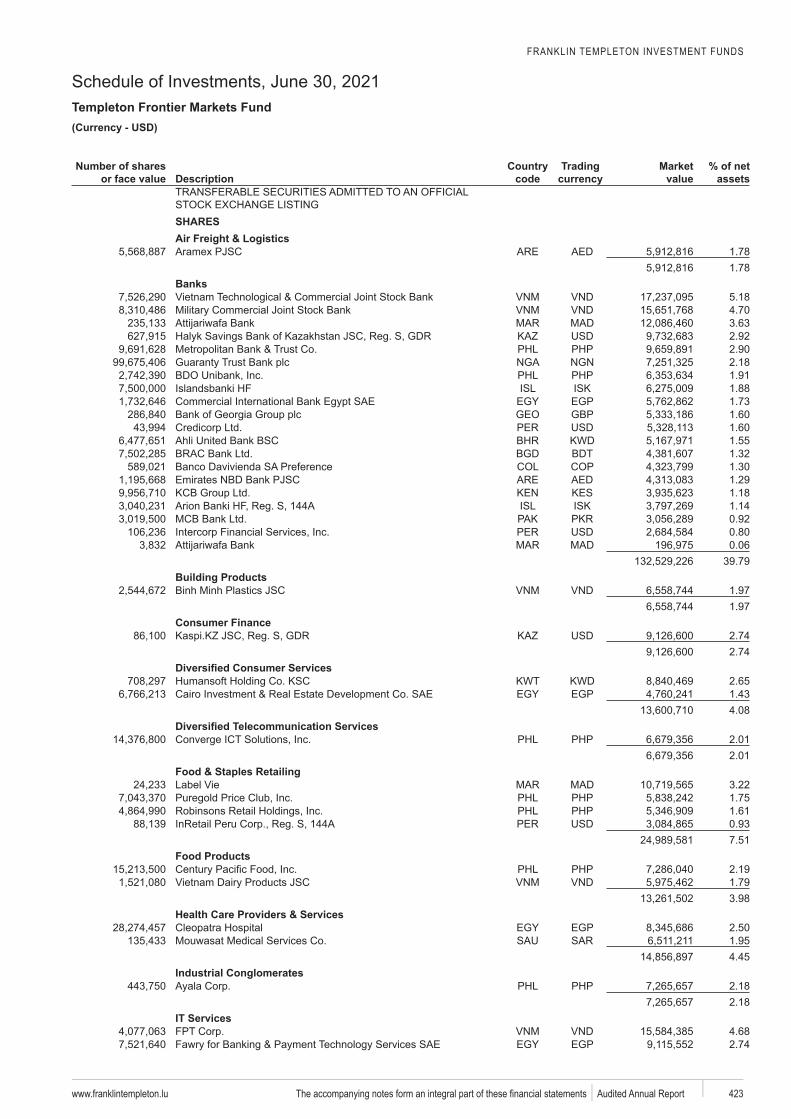
FRANKLIN TEMPLETON INVESTMENT FUNDS
Schedule of Investments, June 30, 2021Templeton Frontier Markets Fund
www.franklintempleton.lu 423 Audited Annual Report
USD)
Number of shares or face value Description
code
Trading Market value
% of net assets
SHARESAir Freight & Logistics
1.781.78
Banks5.184.703.632.922.902.181.911.88
EGP 1.73GBP 1.60
1.60KWD 1.55
BGD BDT 1.321.301.29
KES 1.181.140.920.800.06
39.79Building Products
1.971.97
Consumer Finance2.742.74
KWT KWD 2.65EGP 1.43
4.08
2.012.01
Food & Staples Retailing3.221.751.610.937.51
Food Products2.191.793.98
Health Care Providers & ServicesEGP 2.50
1.954.45
Industrial Conglomerates2.182.18
IT Services4.68
EGP 2.74
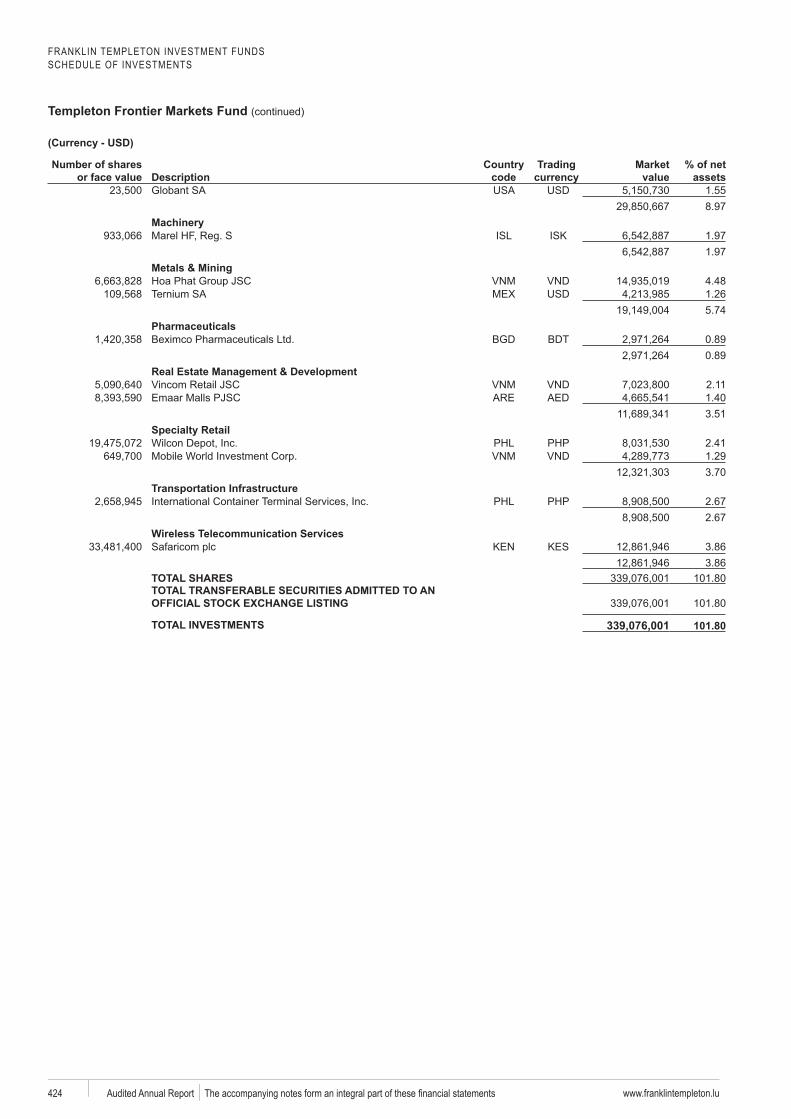
FRANKLIN TEMPLETON INVESTMENT FUNDSSCHEDULE OF INVESTMENTS
Templeton Frontier Markets Fund (continued)
www.franklintempleton.lu424 Audited Annual Report
Number of shares or face value Description
code
Trading Market value
% of net assets
1.558.97
1.971.97
Metals & Mining4.481.265.74
PharmaceuticalsBGD BDT 0.89
0.89Real Estate Management & Development
2.111.403.51
2.411.293.70
Transportation Infrastructure2.672.67
Wireless Telecommunication ServicesKES 3.86
3.86TOTAL SHARES 101.80TOTAL TRANSFERABLE SECURITIES ADMITTED TO AN
101.80
TOTAL INVESTMENTS 339,076,001
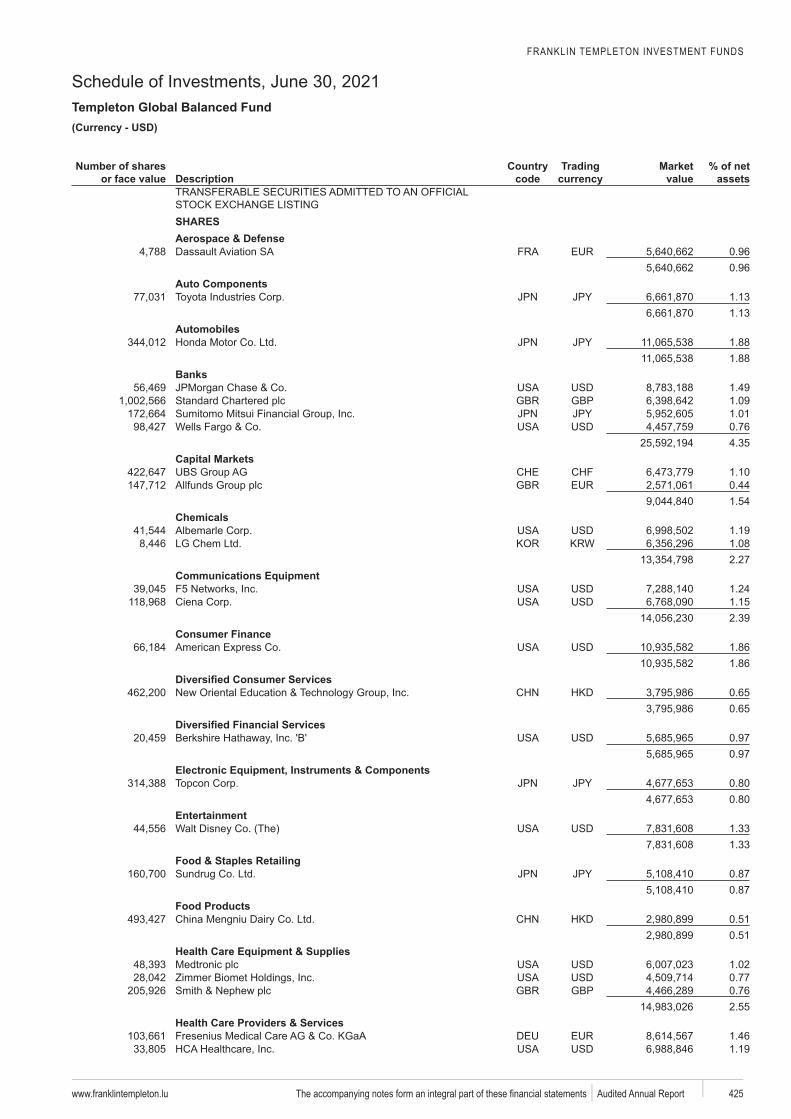
FRANKLIN TEMPLETON INVESTMENT FUNDS
Schedule of Investments, June 30, 2021Templeton Global Balanced Fund
www.franklintempleton.lu 425 Audited Annual Report
USD)
Number of shares or face value Description
code
Trading Market value
% of net assets
SHARESAerospace & DefenseDassault 0.96
0.96Auto Components
1.131.13
Automobiles1.881.88
Banks1.49
GBP 1.091.010.764.35
Capital Markets1.100.441.54
Chemicals1.191.082.27
Communications Equipment1.241.152.39
Consumer Finance1.861.86
0.650.65
0.970.97
Electronic Equipment, Instruments & Components0.800.80
Entertainment1.331.33
Food & Staples RetailingSundrug 0.87
0.87Food Products
0.510.51
Health Care Equipment & Supplies1.020.77
GBP 0.762.55
Health Care Providers & Services1.461.19
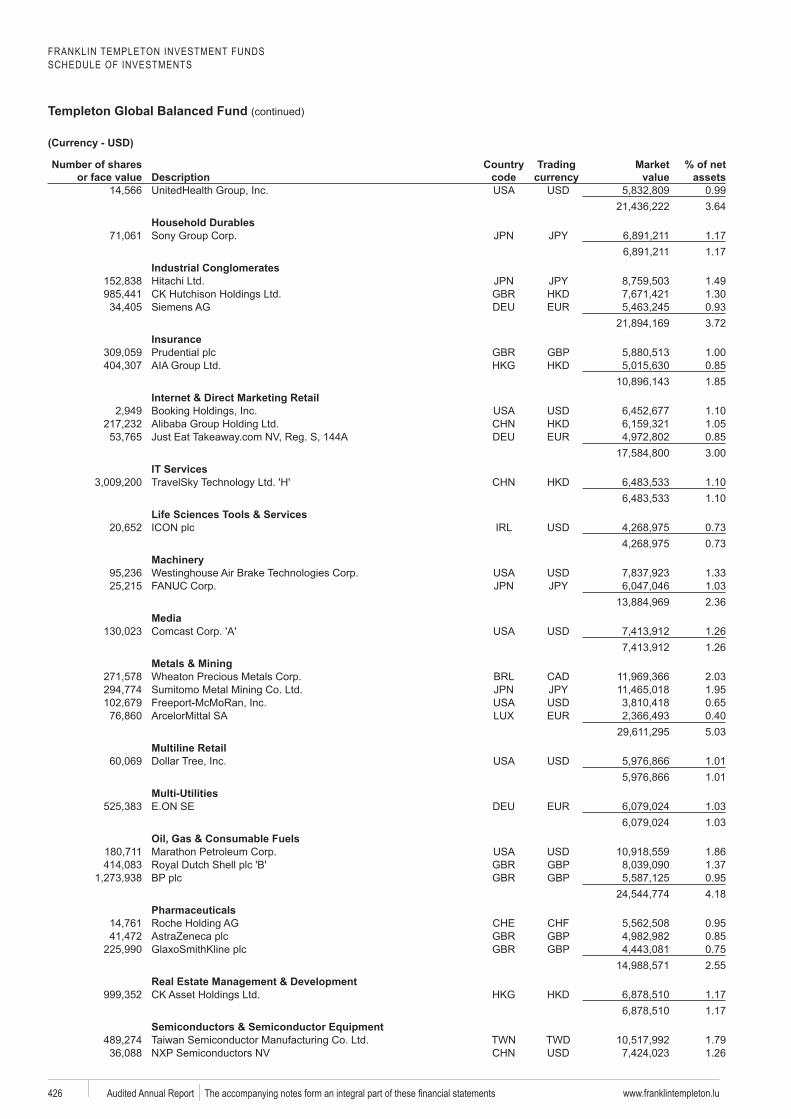
FRANKLIN TEMPLETON INVESTMENT FUNDSSCHEDULE OF INVESTMENTS
Templeton Global Balanced Fund (continued)
www.franklintempleton.lu426 Audited Annual Report
Number of shares or face value Description
code
Trading Market value
% of net assets
0.993.64
Household Durables1.171.17
Industrial Conglomerates1.491.300.933.72
InsuranceGBP 1.00
0.851.85
Internet & Direct Marketing Retail1.101.050.853.00
IT ServicesTravelSky 1.10
1.10Life Sciences Tools & Services
0.730.73
1.331.032.36
Media1.261.26
Metals & Mining2.031.950.650.405.03
Multiline Retail1.011.01
Multi-Utilities1.031.03
Oil, Gas & Consumable Fuels1.86
GBP 1.37GBP 0.95
4.18Pharmaceuticals
0.95GBP 0.85GBP 0.75
2.55Real Estate Management & Development
1.171.17
Semiconductors & Semiconductor EquipmentTWD 1.79
1.26
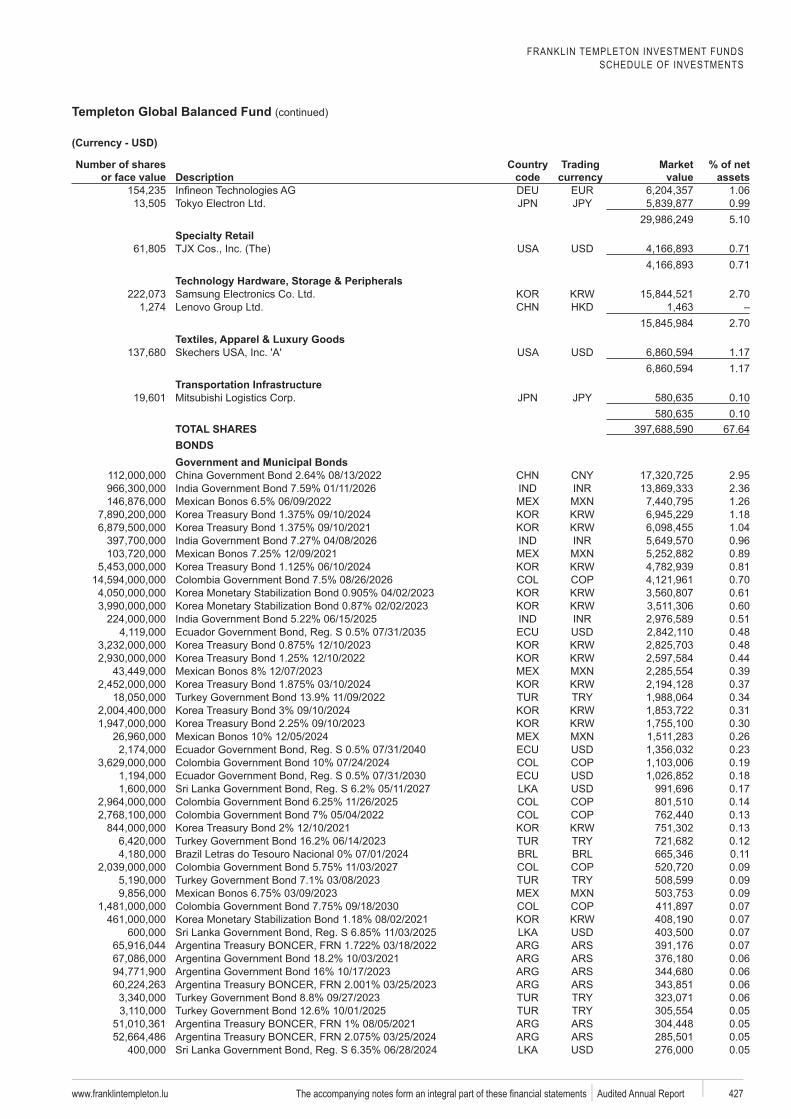
FRANKLIN TEMPLETON INVESTMENT FUNDSSCHEDULE OF INVESTMENTS
Templeton Global Balanced Fund (continued)
www.franklintempleton.lu 427 Audited Annual Report
Number of shares or face value Description
code
Trading Market value
% of net assets
1.060.995.10
0.710.71
2.70
2.70
Skechers 1.171.17
Transportation Infrastructure0.100.10
TOTAL SHARES 67.64BONDSGovernment and Municipal Bonds
2.952.36
Bonos 1.261.181.040.96
Bonos 0.890.810.700.610.600.510.480.480.44
Bonos 0.390.370.340.310.30
Bonos 0.260.230.190.180.170.140.130.130.12
do Tesouro 0.110.090.09
Bonos 0.090.070.070.070.070.060.060.060.060.050.050.050.05
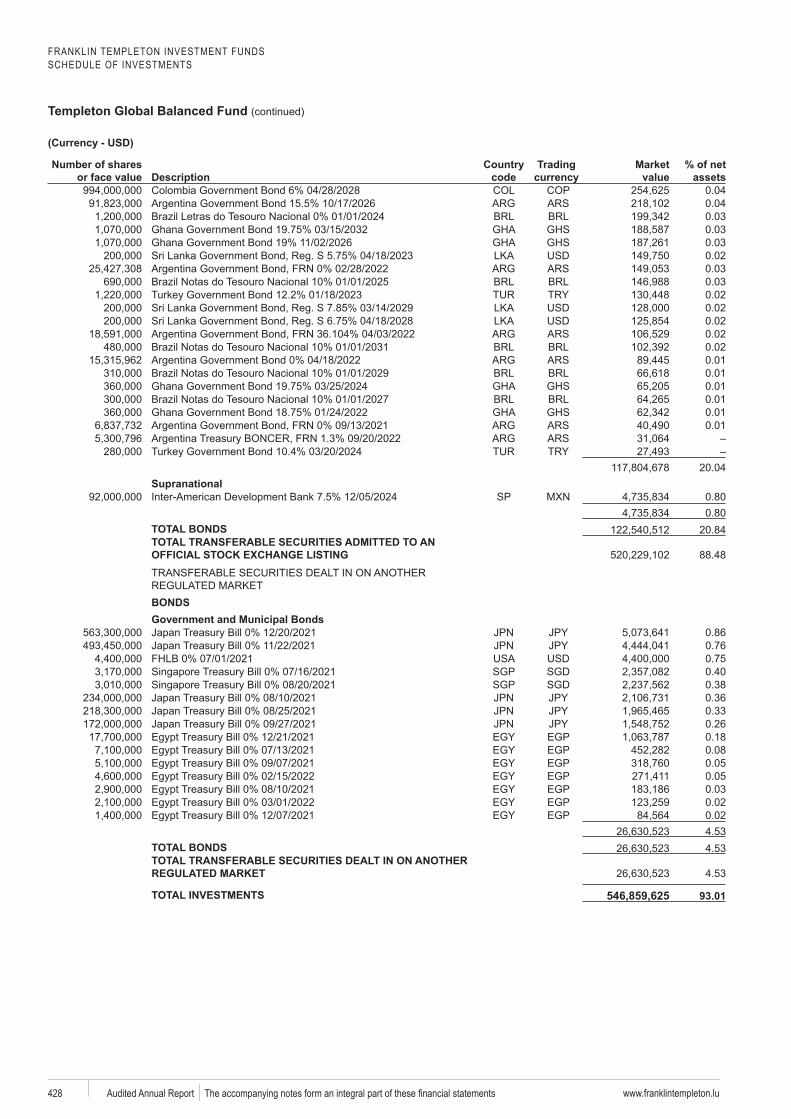
FRANKLIN TEMPLETON INVESTMENT FUNDSSCHEDULE OF INVESTMENTS
Templeton Global Balanced Fund (continued)
www.franklintempleton.lu428 Audited Annual Report
Number of shares or face value Description
code
Trading Market value
% of net assets
0.040.04
do Tesouro 0.030.030.030.020.03
do Tesouro 0.030.020.020.020.02
do Tesouro 0.020.01
do Tesouro 0.010.01
do Tesouro 0.010.010.01
20.04Supranational
SP 0.800.80
TOTAL BONDS 20.84TOTAL TRANSFERABLE SECURITIES ADMITTED TO AN
88.48
BONDSGovernment and Municipal Bonds
0.860.760.75
SGP SGD 0.40SGP SGD 0.38
0.360.330.26
EGP 0.18EGP 0.08EGP 0.05EGP 0.05EGP 0.03EGP 0.02EGP 0.02
4.53TOTAL BONDS 4.53TOTAL TRANSFERABLE SECURITIES DEALT IN ON ANOTHER
4.53
TOTAL INVESTMENTS 546,859,625
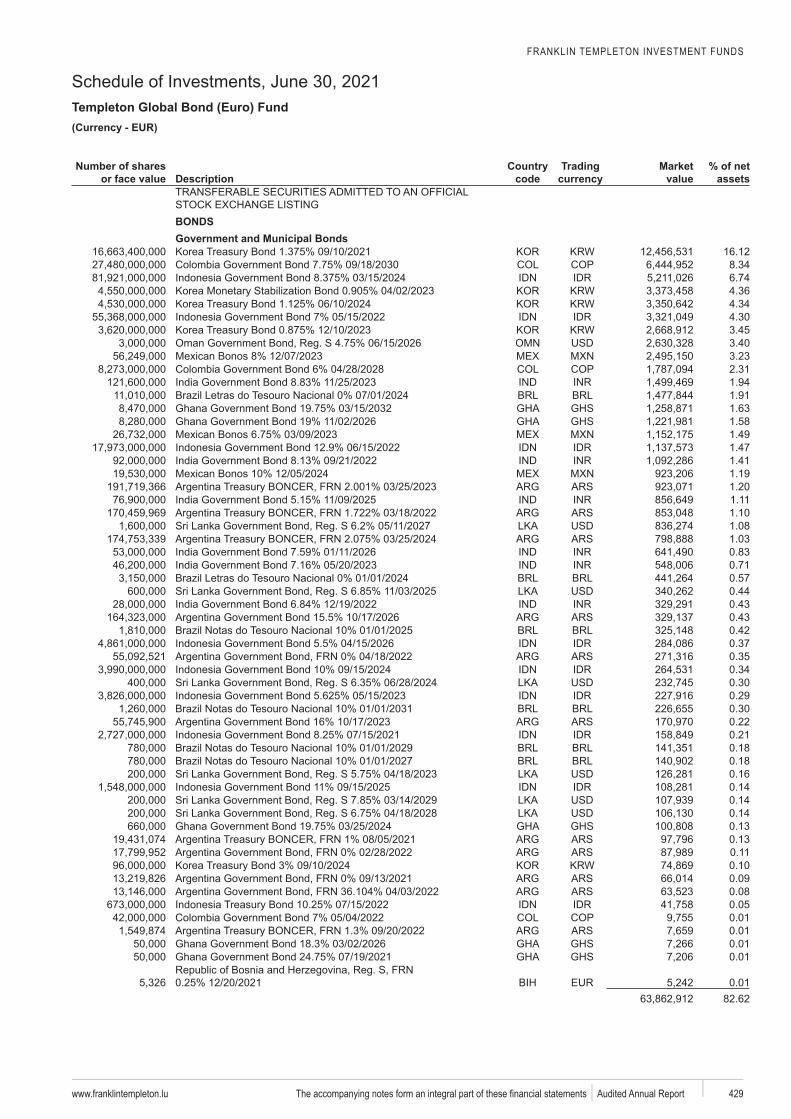
FRANKLIN TEMPLETON INVESTMENT FUNDS
Schedule of Investments, June 30, 2021Templeton Global Bond (Euro) Fund
www.franklintempleton.lu 429 Audited Annual Report
EUR)
Number of shares or face value Description
code
Trading Market value
% of net assets
BONDSGovernment and Municipal Bonds
16.128.346.744.364.344.303.453.40
Bonos 3.232.311.94
do Tesouro 1.911.631.58
Bonos 1.491.471.41
Bonos 1.191.201.111.101.081.030.830.71
do Tesouro 0.570.440.430.43
do Tesouro 0.420.370.350.340.300.29
do Tesouro 0.300.220.21
do Tesouro 0.18 do Tesouro 0.18
0.160.140.140.140.130.130.110.100.090.080.050.010.010.010.01
0.0182.62
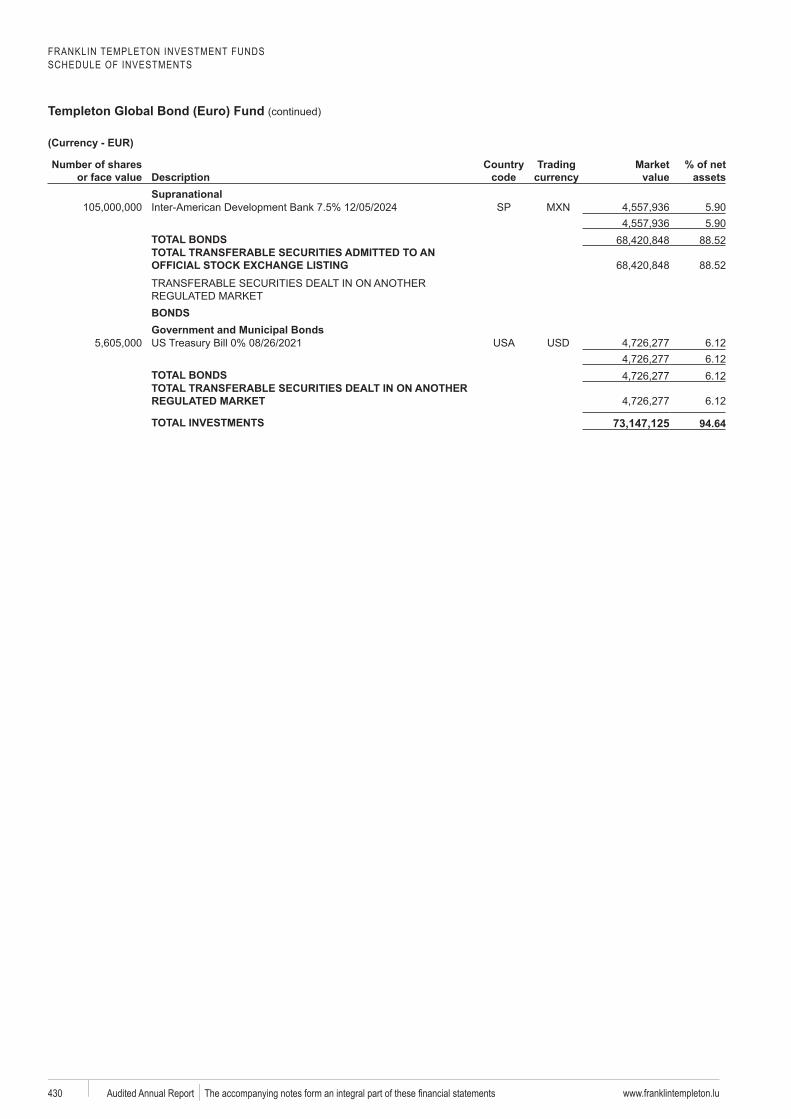
FRANKLIN TEMPLETON INVESTMENT FUNDSSCHEDULE OF INVESTMENTS
Templeton Global Bond (Euro) Fund (continued)
www.franklintempleton.lu430 Audited Annual Report
Number of shares or face value Description
code
Trading Market value
% of net assets
SupranationalSP 5.90
5.90TOTAL BONDS 88.52TOTAL TRANSFERABLE SECURITIES ADMITTED TO AN
88.52
BONDSGovernment and Municipal Bonds
6.126.12
TOTAL BONDS 6.12TOTAL TRANSFERABLE SECURITIES DEALT IN ON ANOTHER
6.12
TOTAL INVESTMENTS 73,147,125
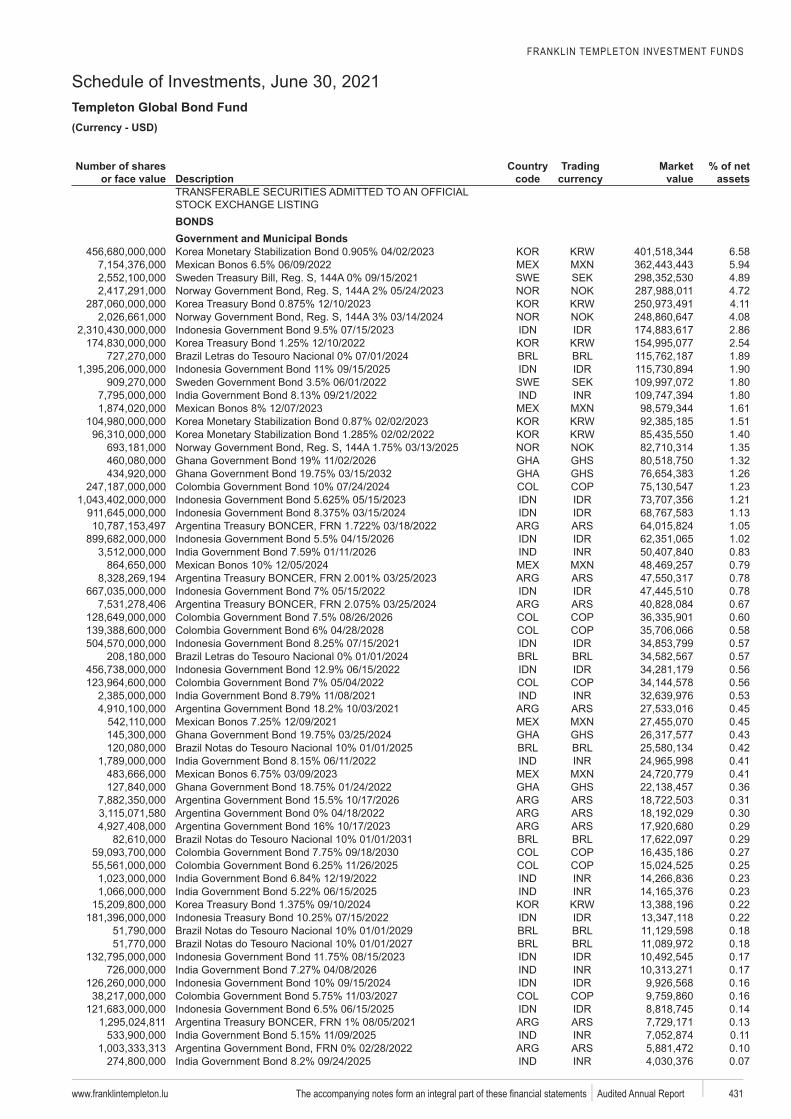
FRANKLIN TEMPLETON INVESTMENT FUNDS
Schedule of Investments, June 30, 2021Templeton Global Bond Fund
www.franklintempleton.lu 431 Audited Annual Report
USD)
Number of shares or face value Description
code
Trading Market value
% of net assets
BONDSGovernment and Municipal Bonds
6.58Bonos 5.94
SWE SEK 4.894.724.114.082.862.54
do Tesouro 1.891.90
SWE SEK 1.801.80
Bonos 1.611.511.401.351.321.261.231.211.131.051.020.83
Bonos 0.790.780.780.670.600.580.57
do Tesouro 0.570.560.560.530.45
Bonos 0.450.43
do Tesouro 0.420.41
Bonos 0.410.360.310.300.29
do Tesouro 0.290.270.250.230.230.220.22
do Tesouro 0.18 do Tesouro 0.18
0.170.170.160.160.140.130.110.100.07
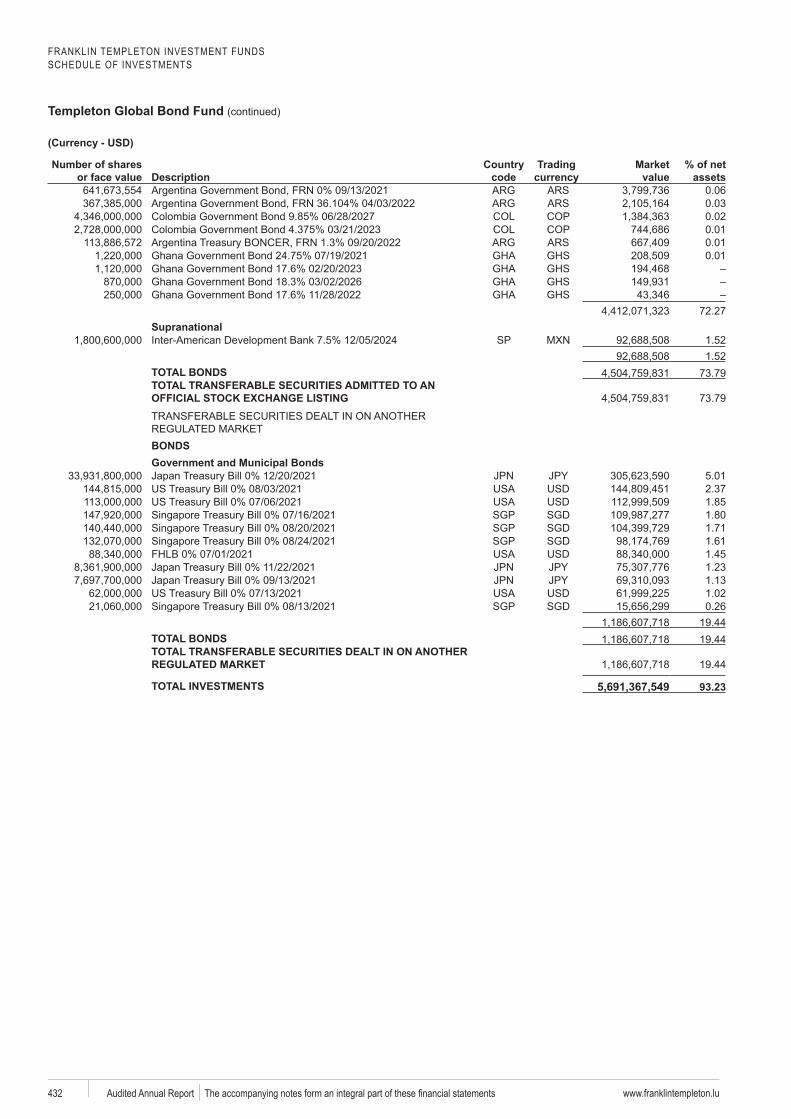
FRANKLIN TEMPLETON INVESTMENT FUNDSSCHEDULE OF INVESTMENTS
Templeton Global Bond Fund (continued)
www.franklintempleton.lu432 Audited Annual Report
Number of shares or face value Description
code
Trading Market value
% of net assets
0.060.030.020.010.010.01
72.27Supranational
SP 1.521.52
TOTAL BONDS 73.79TOTAL TRANSFERABLE SECURITIES ADMITTED TO AN
73.79
BONDSGovernment and Municipal Bonds
5.012.371.85
SGP SGD 1.80SGP SGD 1.71SGP SGD 1.61
1.451.231.131.02
SGP SGD 0.2619.44
TOTAL BONDS 19.44TOTAL TRANSFERABLE SECURITIES DEALT IN ON ANOTHER
19.44
TOTAL INVESTMENTS 5,691,367,549
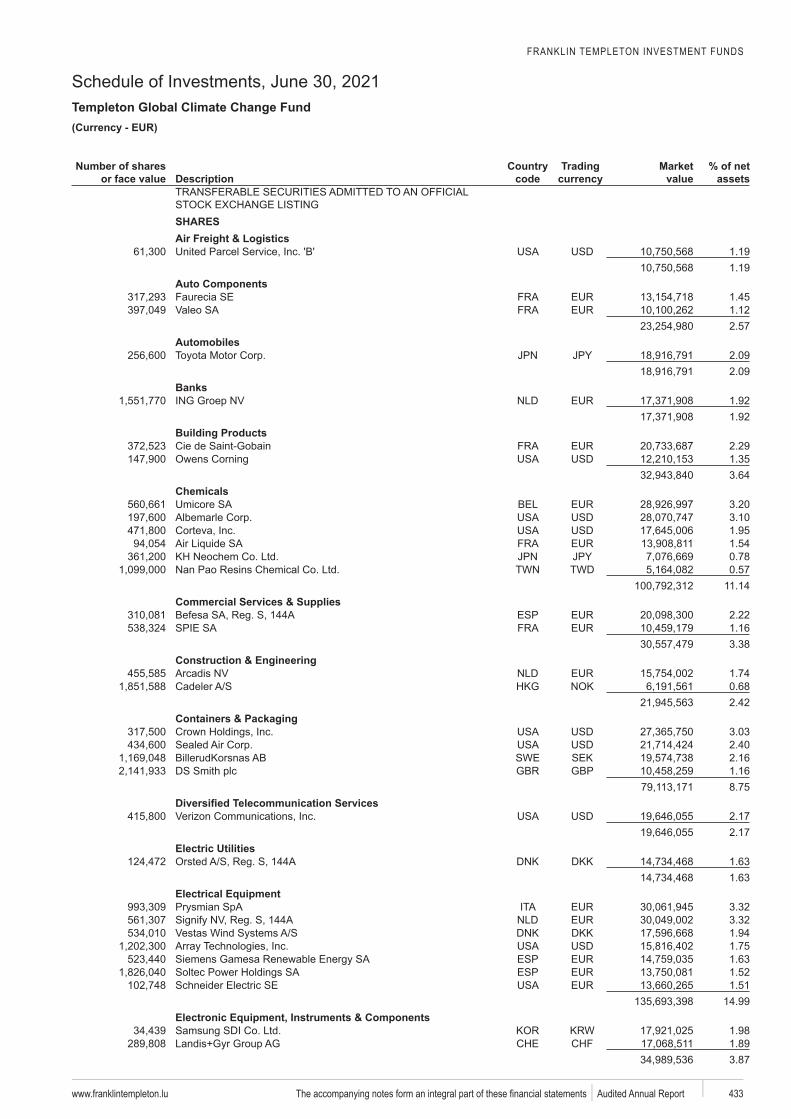
FRANKLIN TEMPLETON INVESTMENT FUNDS
Schedule of Investments, June 30, 2021Templeton Global Climate Change Fund
www.franklintempleton.lu 433 Audited Annual Report
EUR)
Number of shares or face value Description
code
Trading Market value
% of net assets
SHARESAir Freight & Logistics
1.191.19
Auto ComponentsFaurecia SE 1.45
1.122.57
Automobiles2.092.09
Banks1.921.92
Building Products2.291.353.64
Chemicals3.203.101.951.540.78
TWD 0.5711.14
Commercial Services & SuppliesESP 2.22
1.163.38
Construction & Engineering1.740.682.42
Containers & Packaging3.032.40
SWE SEK 2.16GBP 1.16
8.75
2.172.17
Electric UtilitiesDKK 1.63
1.63Electrical Equipment
3.323.32
DKK 1.941.75
ESP 1.63ESP 1.52
Schneider Electric SE 1.5114.99
Electronic Equipment, Instruments & Components1.981.893.87
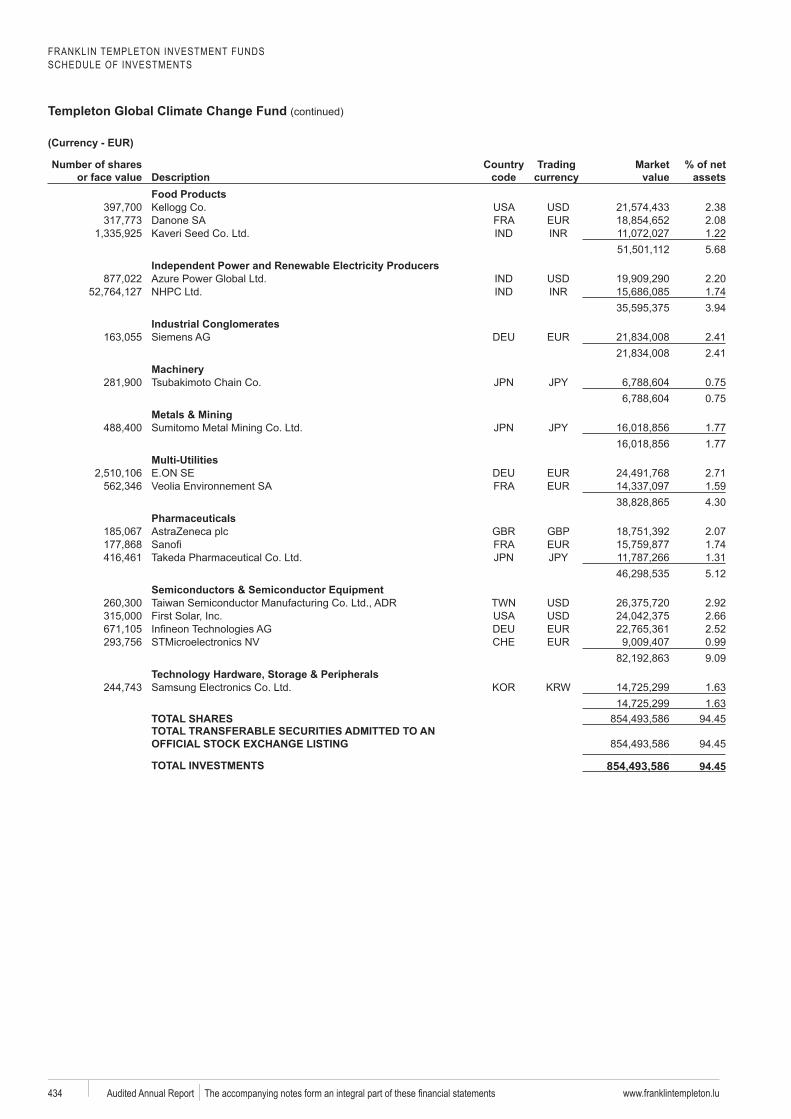
FRANKLIN TEMPLETON INVESTMENT FUNDSSCHEDULE OF INVESTMENTS
Templeton Global Climate Change Fund (continued)
www.franklintempleton.lu434 Audited Annual Report
Number of shares or face value Description
code
Trading Market value
% of net assets
Food Products2.382.081.225.68
2.201.743.94
Industrial Conglomerates2.412.41
0.750.75
Metals & Mining1.771.77
Multi-Utilities2.711.594.30
PharmaceuticalsGBP 2.07
1.741.315.12
Semiconductors & Semiconductor Equipment2.922.662.520.999.09
1.631.63
TOTAL SHARES 94.45TOTAL TRANSFERABLE SECURITIES ADMITTED TO AN
94.45
TOTAL INVESTMENTS 854,493,586
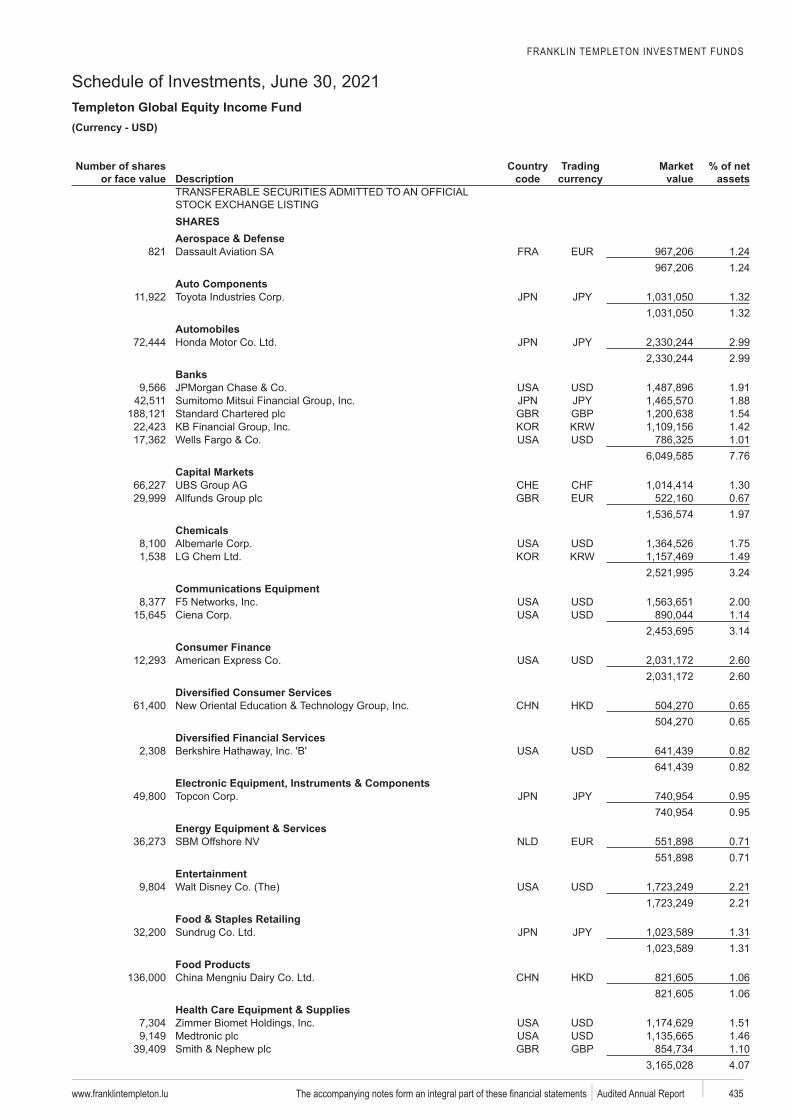
FRANKLIN TEMPLETON INVESTMENT FUNDS
Schedule of Investments, June 30, 2021Templeton Global Equity Income Fund
www.franklintempleton.lu 435 Audited Annual Report
USD)
Number of shares or face value Description
code
Trading Market value
% of net assets
SHARESAerospace & Defense
821 Dassault 1.241.24
Auto Components1.321.32
Automobiles2.992.99
Banks1.911.88
GBP 1.541.421.017.76
Capital Markets1.300.671.97
Chemicals1.751.493.24
Communications Equipment2.001.143.14
Consumer Finance2.602.60
0.650.65
0.820.82
Electronic Equipment, Instruments & Components0.950.95
0.710.71
Entertainment2.212.21
Food & Staples RetailingSundrug 1.31
1.31Food Products
1.061.06
Health Care Equipment & Supplies1.511.46
GBP 1.104.07
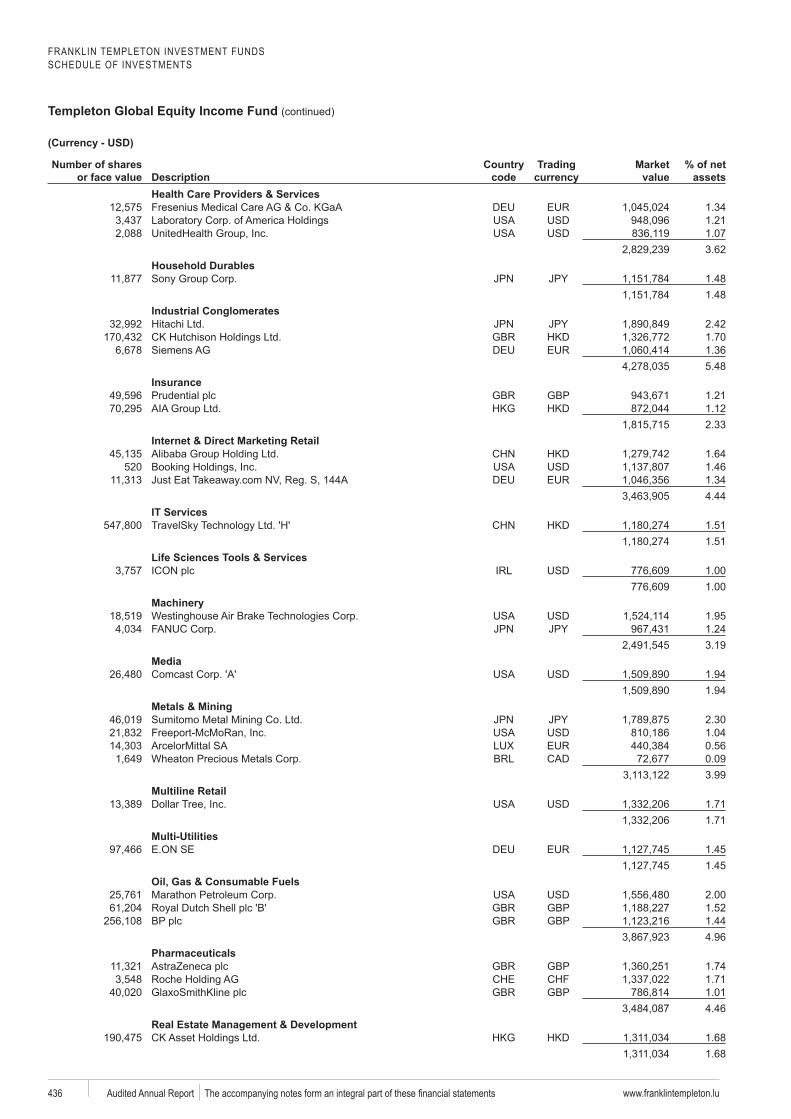
FRANKLIN TEMPLETON INVESTMENT FUNDSSCHEDULE OF INVESTMENTS
Templeton Global Equity Income Fund (continued)
www.franklintempleton.lu436 Audited Annual Report
Number of shares or face value Description
code
Trading Market value
% of net assets
Health Care Providers & Services1.341.211.073.62
Household Durables1.481.48
Industrial Conglomerates2.421.701.365.48
InsuranceGBP 1.21
1.122.33
Internet & Direct Marketing Retail1.64
520 1.461.344.44
IT ServicesTravelSky 1.51
1.51Life Sciences Tools & Services
1.001.00
1.951.243.19
Media1.941.94
Metals & Mining2.301.040.560.093.99
Multiline Retail1.711.71
Multi-Utilities1.451.45
Oil, Gas & Consumable Fuels2.00
GBP 1.52GBP 1.44
4.96Pharmaceuticals
GBP 1.741.71
GBP 1.014.46
Real Estate Management & Development1.681.68
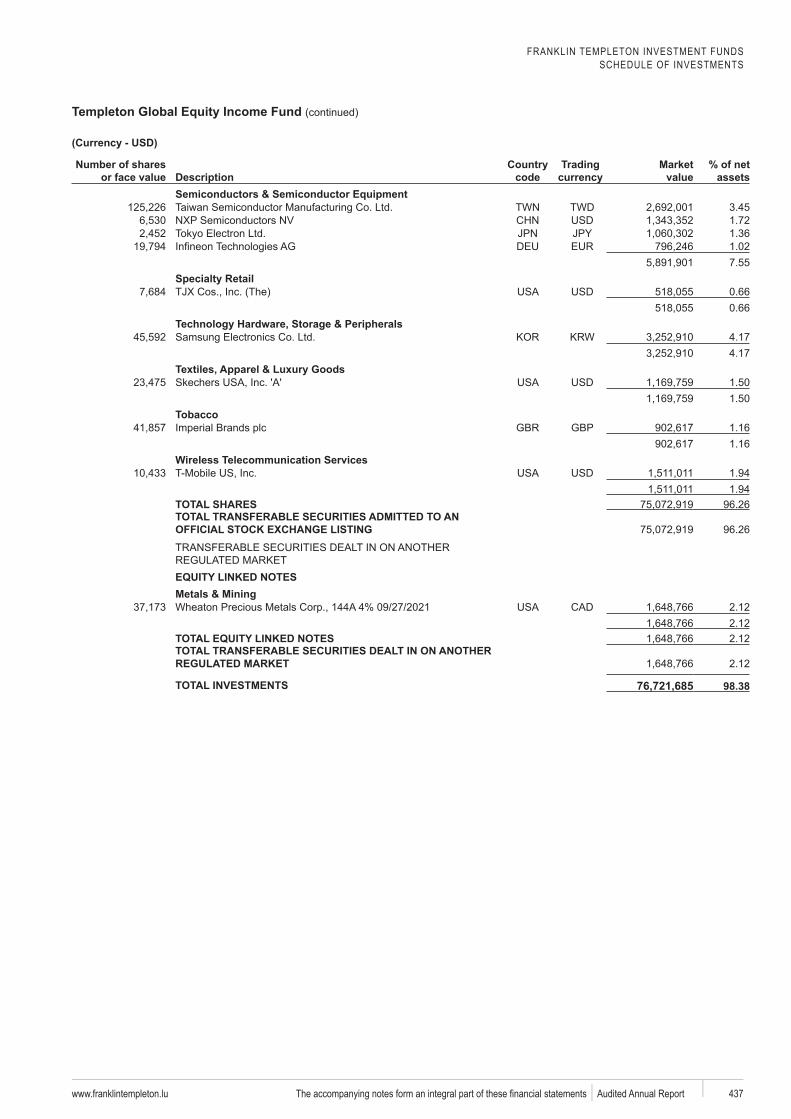
FRANKLIN TEMPLETON INVESTMENT FUNDSSCHEDULE OF INVESTMENTS
Templeton Global Equity Income Fund (continued)
www.franklintempleton.lu 437 Audited Annual Report
Number of shares or face value Description
code
Trading Market value
% of net assets
Semiconductors & Semiconductor EquipmentTWD 3.45
1.721.361.027.55
0.660.66
4.174.17
Skechers 1.501.50
TobaccoGBP 1.16
1.16Wireless Telecommunication Services
1.941.94
TOTAL SHARES 96.26TOTAL TRANSFERABLE SECURITIES ADMITTED TO AN
96.26
Metals & Mining2.122.122.12
TOTAL TRANSFERABLE SECURITIES DEALT IN ON ANOTHER 2.12
TOTAL INVESTMENTS 76,721,685
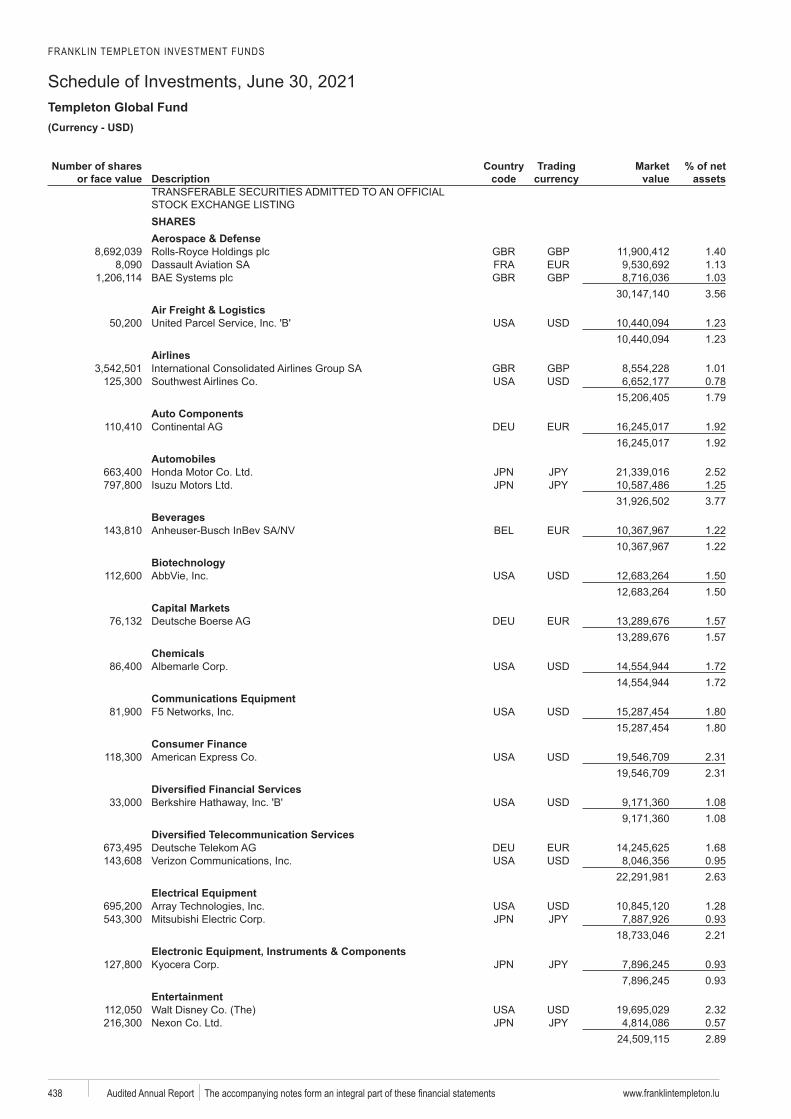
FRANKLIN TEMPLETON INVESTMENT FUNDS
Schedule of Investments, June 30, 2021Templeton Global Fund
www.franklintempleton.lu438 Audited Annual Report
USD)
Number of shares or face value Description
code
Trading Market value
% of net assets
SHARESAerospace & Defense
GBP 1.401.13
GBP 1.033.56
Air Freight & Logistics1.231.23
AirlinesGBP 1.01
0.781.79
Auto Components1.921.92
Automobiles2.521.253.77
Beverages1.221.22
1.501.50
Capital Markets1.571.57
Chemicals1.721.72
Communications Equipment1.801.80
Consumer Finance2.312.31
1.081.08
1.680.952.63
Electrical Equipment1.280.932.21
Electronic Equipment, Instruments & Components0.930.93
Entertainment2.320.572.89
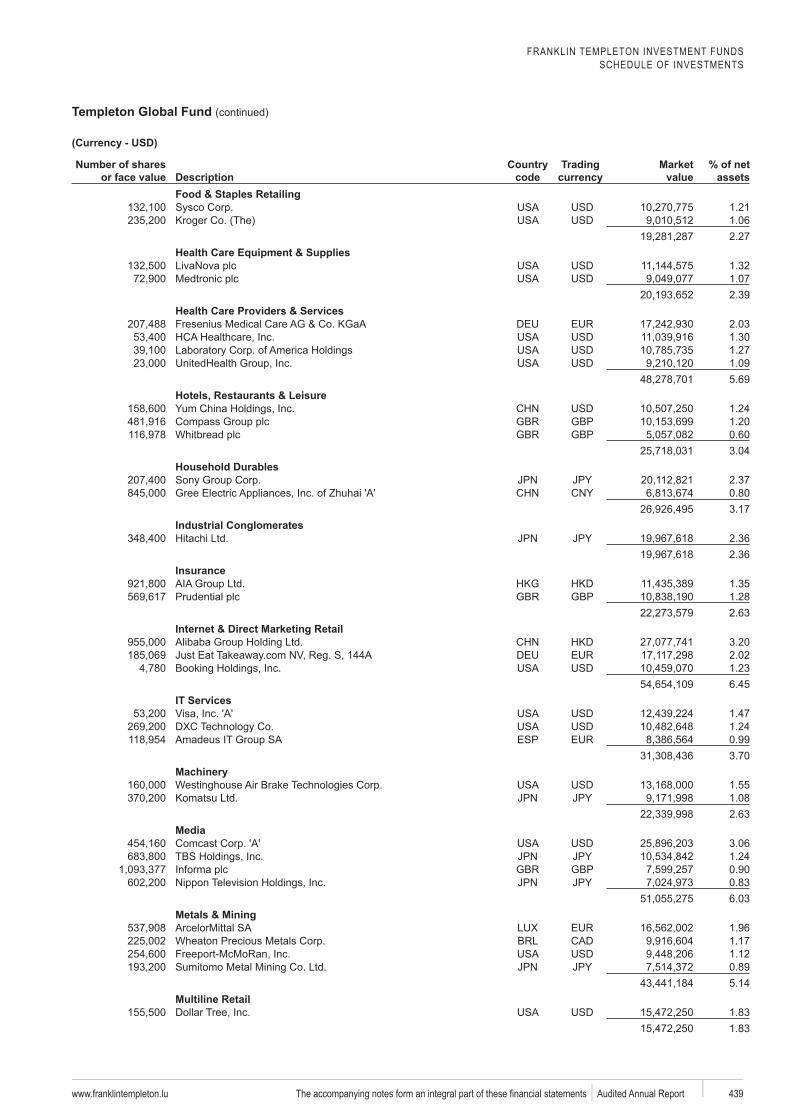
FRANKLIN TEMPLETON INVESTMENT FUNDSSCHEDULE OF INVESTMENTS
Templeton Global Fund (continued)
www.franklintempleton.lu 439 Audited Annual Report
Number of shares or face value Description
code
Trading Market value
% of net assets
Food & Staples Retailing1.211.062.27
Health Care Equipment & Supplies1.321.072.39
Health Care Providers & Services2.031.301.271.095.69
Hotels, Restaurants & Leisure1.24
GBP 1.20GBP 0.60
3.04Household Durables
2.370.803.17
Industrial Conglomerates2.362.36
Insurance1.35
GBP 1.282.63
Internet & Direct Marketing Retail3.202.021.236.45
IT Services1.471.24
ESP 0.993.70
1.551.082.63
Media3.061.24
GBP 0.900.836.03
Metals & Mining1.961.171.120.895.14
Multiline Retail1.831.83
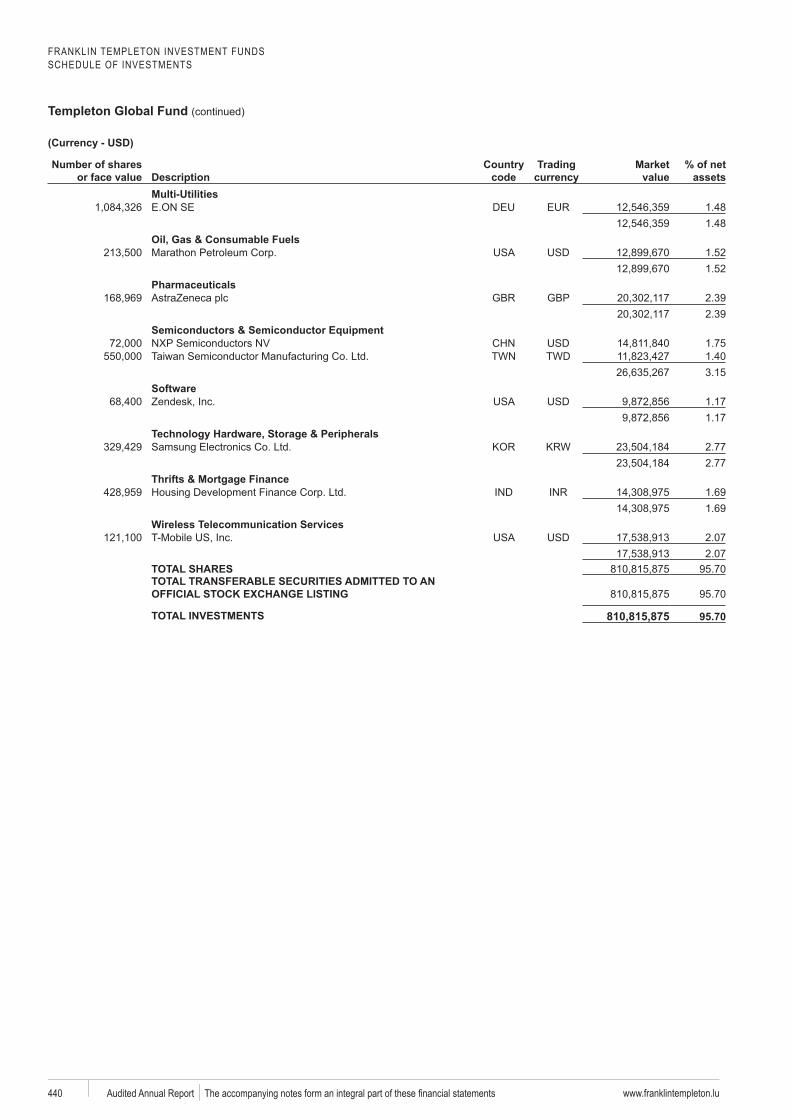
FRANKLIN TEMPLETON INVESTMENT FUNDSSCHEDULE OF INVESTMENTS
Templeton Global Fund (continued)
www.franklintempleton.lu440 Audited Annual Report
Number of shares or face value Description
code
Trading Market value
% of net assets
Multi-Utilities1.481.48
Oil, Gas & Consumable Fuels1.521.52
PharmaceuticalsGBP 2.39
2.39Semiconductors & Semiconductor Equipment
1.75TWD 1.40
3.15
1.171.17
2.772.77
Thrifts & Mortgage Finance1.691.69
Wireless Telecommunication Services2.072.07
TOTAL SHARES 95.70TOTAL TRANSFERABLE SECURITIES ADMITTED TO AN
95.70
TOTAL INVESTMENTS 810,815,875
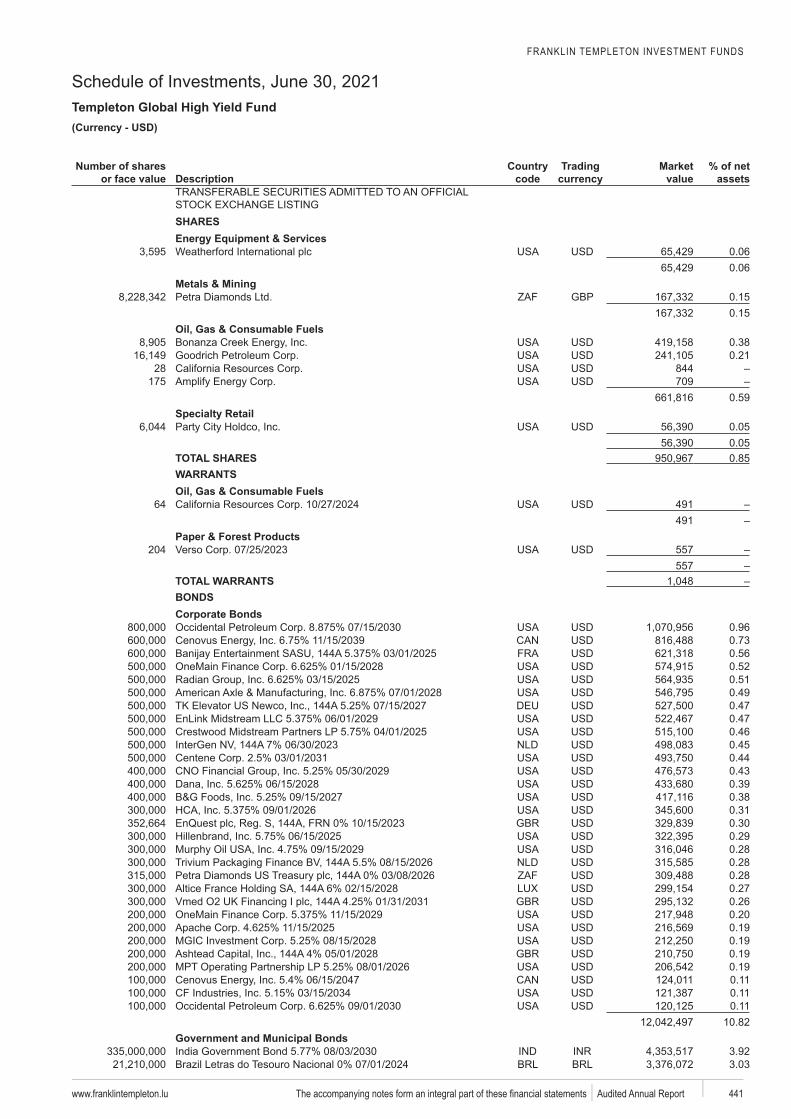
FRANKLIN TEMPLETON INVESTMENT FUNDS
Schedule of Investments, June 30, 2021Templeton Global High Yield Fund
www.franklintempleton.lu 441 Audited Annual Report
USD)
Number of shares or face value Description
code
Trading Market value
% of net assets
SHARES
0.060.06
Metals & MiningGBP 0.15
0.15Oil, Gas & Consumable Fuels
0.380.21
28 844175 709
0.59
0.050.05
TOTAL SHARES 0.85WARRANTSOil, Gas & Consumable Fuels
64 491491
Paper & Forest Products204 557
557TOTAL WARRANTSBONDSCorporate Bonds
0.960.730.560.520.510.490.470.470.460.450.440.430.390.380.310.300.290.280.280.280.270.260.200.190.190.190.190.110.110.11
10.82Government and Municipal Bonds
3.923.03
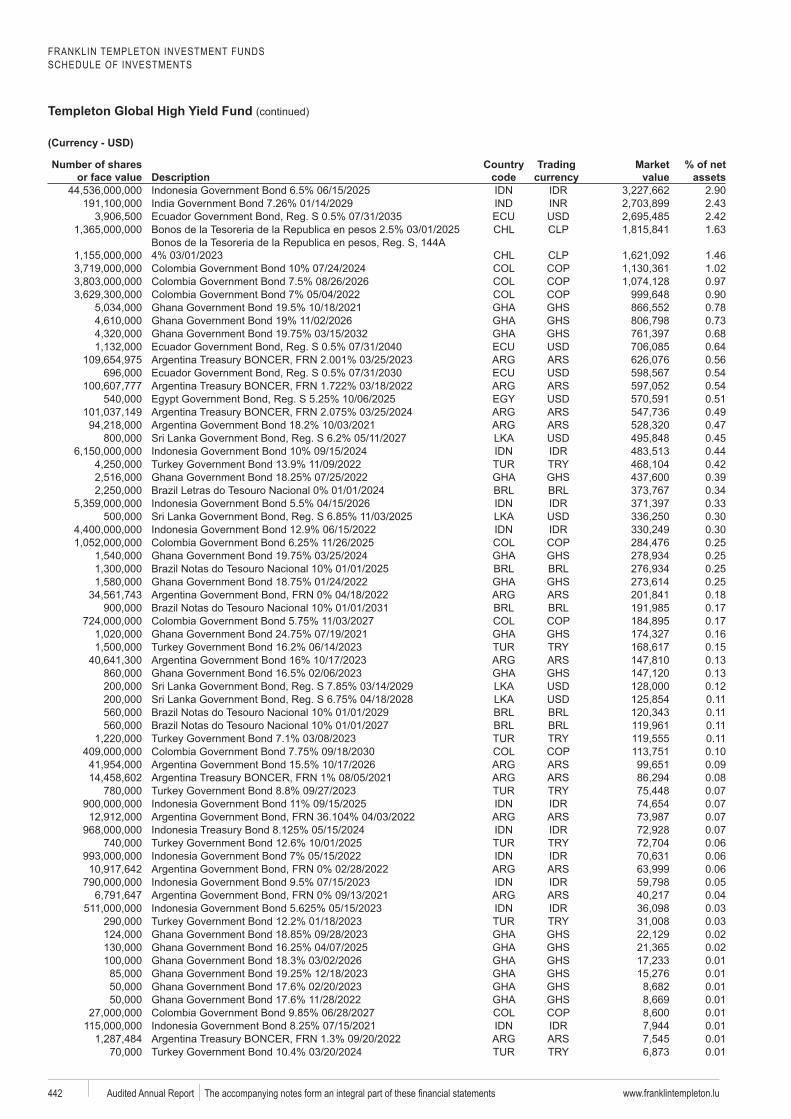
FRANKLIN TEMPLETON INVESTMENT FUNDSSCHEDULE OF INVESTMENTS
Templeton Global High Yield Fund (continued)
www.franklintempleton.lu442 Audited Annual Report
Number of shares or face value Description
code
Trading Market value
% of net assets
2.902.432.421.63
1.461.020.970.900.780.730.680.640.560.540.540.510.490.470.450.440.420.390.340.330.300.300.250.250.250.250.180.170.170.160.150.130.130.120.110.110.110.110.100.090.080.070.070.070.070.060.060.060.050.040.030.030.020.020.010.010.010.010.010.010.010.01
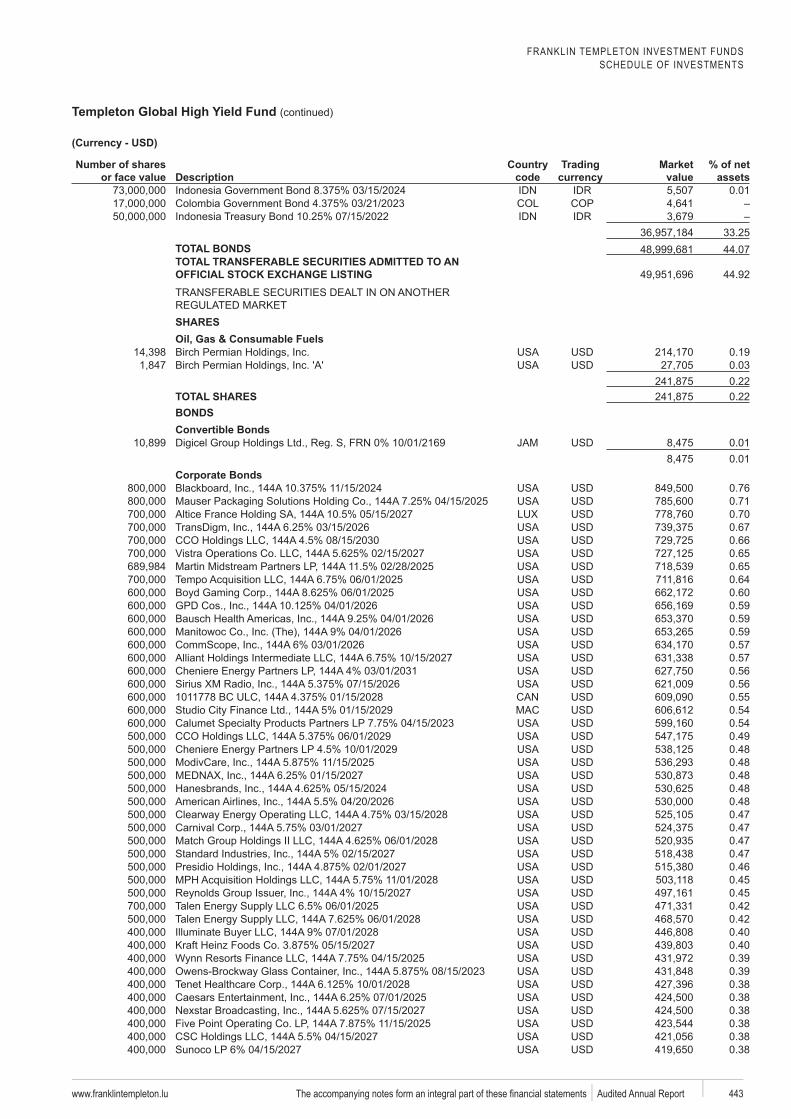
FRANKLIN TEMPLETON INVESTMENT FUNDSSCHEDULE OF INVESTMENTS
Templeton Global High Yield Fund (continued)
www.franklintempleton.lu 443 Audited Annual Report
Number of shares or face value Description
code
Trading Market value
% of net assets
0.01
33.25TOTAL BONDS 44.07TOTAL TRANSFERABLE SECURITIES ADMITTED TO AN
44.92
SHARESOil, Gas & Consumable Fuels
0.190.030.22
TOTAL SHARES 0.22BONDSConvertible Bonds
0.010.01
Corporate Bonds0.760.710.700.670.660.650.650.640.600.590.590.590.570.570.560.560.550.540.540.490.480.480.480.480.480.470.470.470.470.460.450.450.420.420.400.400.390.390.380.380.380.380.380.38
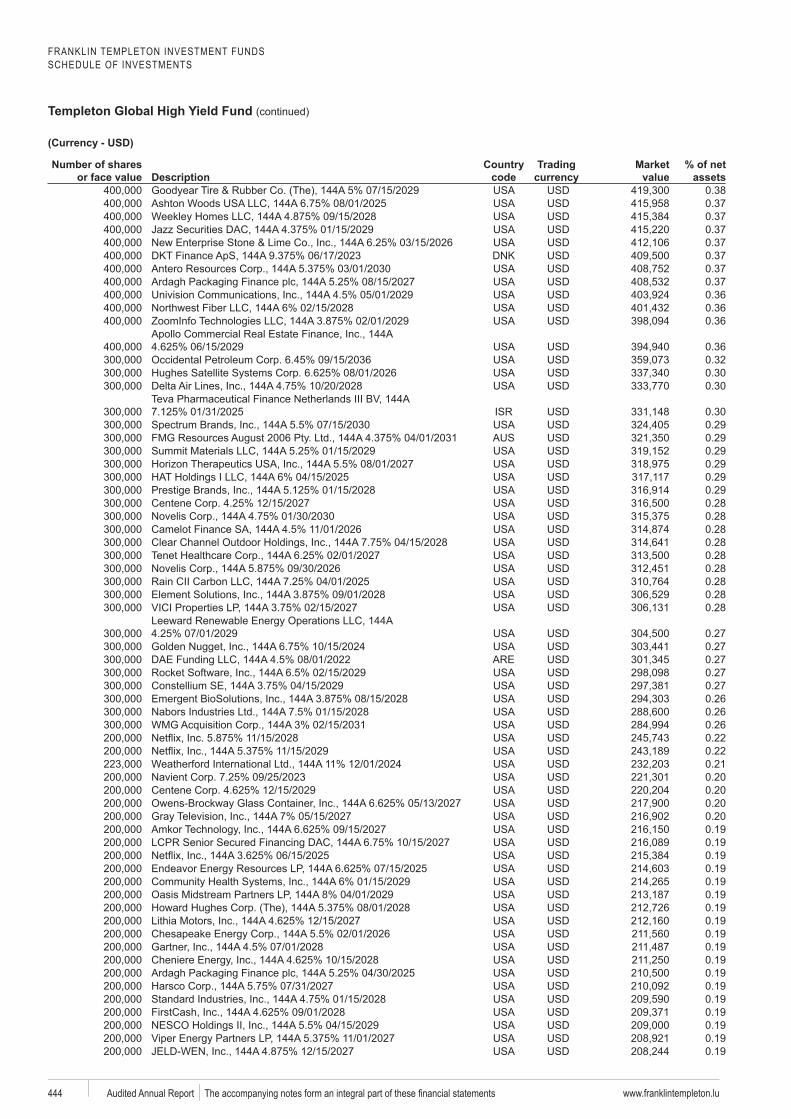
FRANKLIN TEMPLETON INVESTMENT FUNDSSCHEDULE OF INVESTMENTS
Templeton Global High Yield Fund (continued)
www.franklintempleton.lu444 Audited Annual Report
Number of shares or face value Description
code
Trading Market value
% of net assets
0.380.370.370.370.370.370.370.370.360.360.36
0.360.320.300.30
0.300.290.290.290.290.290.290.280.280.280.280.280.280.280.280.28
0.270.270.270.270.270.260.260.260.220.220.210.200.200.200.200.190.190.190.190.190.190.190.190.190.190.190.190.190.190.190.190.190.19
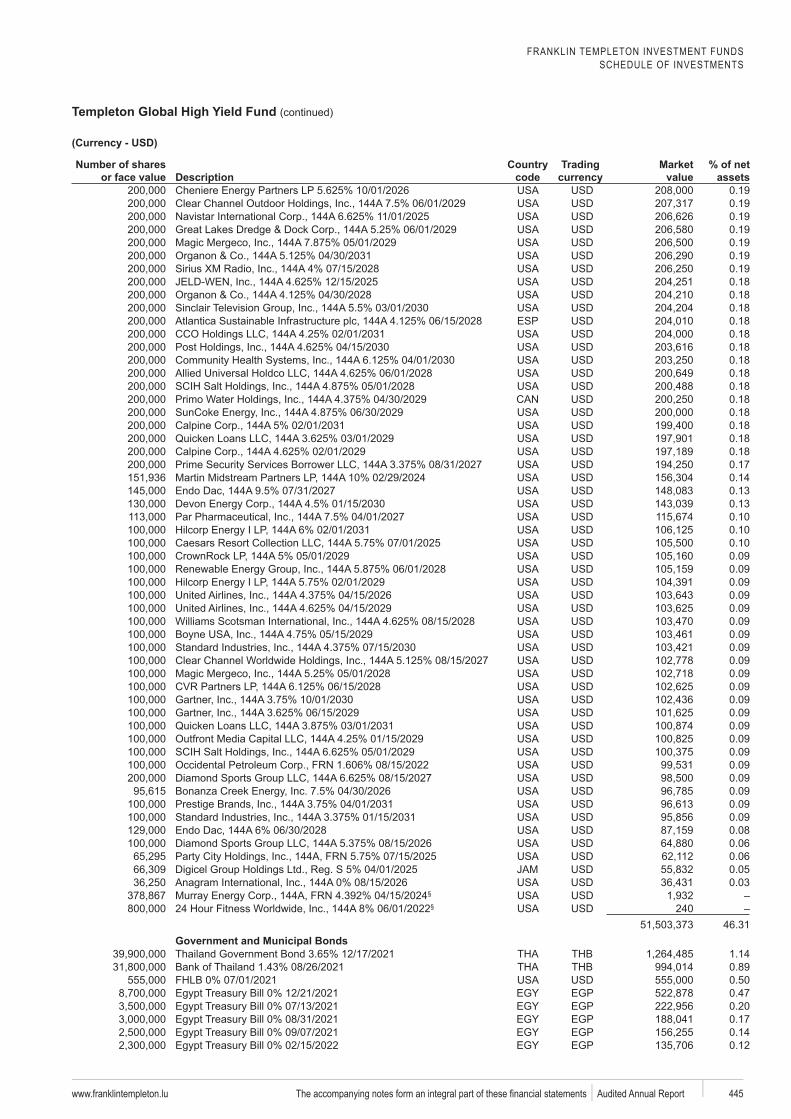
FRANKLIN TEMPLETON INVESTMENT FUNDSSCHEDULE OF INVESTMENTS
Templeton Global High Yield Fund (continued)
www.franklintempleton.lu 445 Audited Annual Report
Number of shares or face value Description
code
Trading Market value
% of net assets
0.190.190.190.190.190.190.190.180.180.18
ESP 0.180.180.180.180.180.180.180.180.180.180.180.170.140.130.130.100.100.100.090.090.090.090.090.090.090.090.090.090.090.090.090.090.090.090.090.090.090.090.090.080.060.060.050.03
§
§ 24046.31
Government and Municipal Bonds1.140.890.50
EGP 0.47EGP 0.20EGP 0.17EGP 0.14EGP 0.12
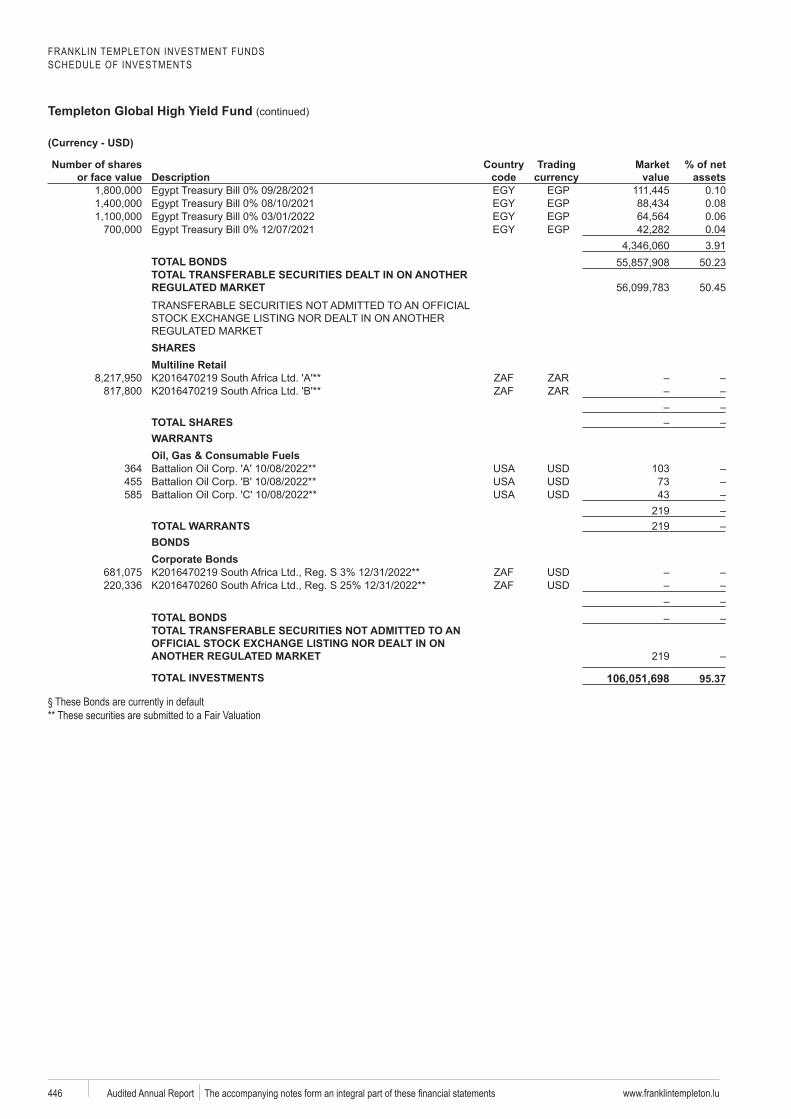
FRANKLIN TEMPLETON INVESTMENT FUNDSSCHEDULE OF INVESTMENTS
Templeton Global High Yield Fund (continued)
www.franklintempleton.lu446 Audited Annual Report
Number of shares or face value Description
code
Trading Market value
% of net assets
EGP 0.10EGP 0.08EGP 0.06EGP 0.04
3.91TOTAL BONDS 50.23TOTAL TRANSFERABLE SECURITIES DEALT IN ON ANOTHER
50.45
SHARESMultiline Retail
TOTAL SHARESWARRANTSOil, Gas & Consumable Fuels
364 103455 73585 43
219TOTAL WARRANTS 219BONDSCorporate Bonds
TOTAL BONDSTOTAL TRANSFERABLE SECURITIES NOT ADMITTED TO AN
219
TOTAL INVESTMENTS 106,051,698a§ These Bonds are currently in default** These securities are submitted to a Fair Valuation
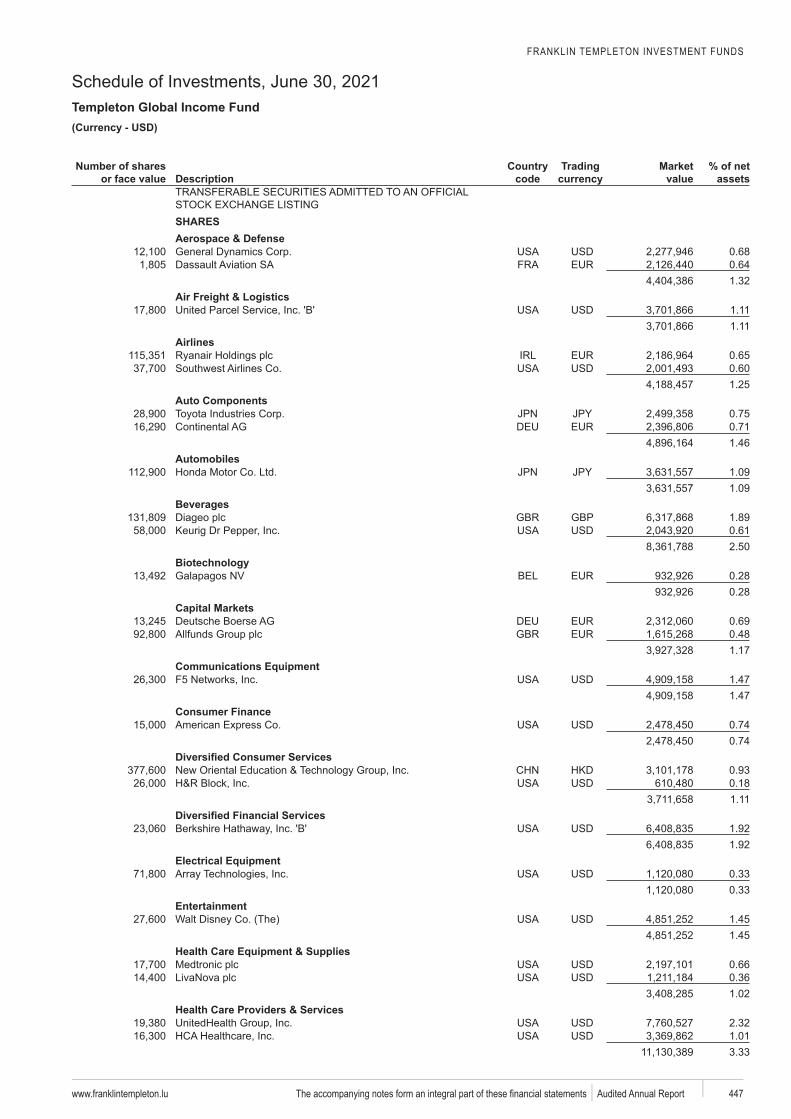
FRANKLIN TEMPLETON INVESTMENT FUNDS
Schedule of Investments, June 30, 2021Templeton Global Income Fund
www.franklintempleton.lu 447 Audited Annual Report
USD)
Number of shares or face value Description
code
Trading Market value
% of net assets
SHARESAerospace & Defense
0.68Dassault 0.64
1.32Air Freight & Logistics
1.111.11
Airlines0.650.601.25
Auto Components0.750.711.46
Automobiles1.091.09
BeveragesGBP 1.89
Keurig Dr 0.612.50
0.280.28
Capital MarketsDeutsche Boerse 0.69
0.481.17
Communications Equipment1.471.47
Consumer Finance0.740.74
0.930.181.11
1.921.92
Electrical Equipment0.330.33
Entertainment1.451.45
Health Care Equipment & Supplies0.660.361.02
Health Care Providers & Services2.321.013.33
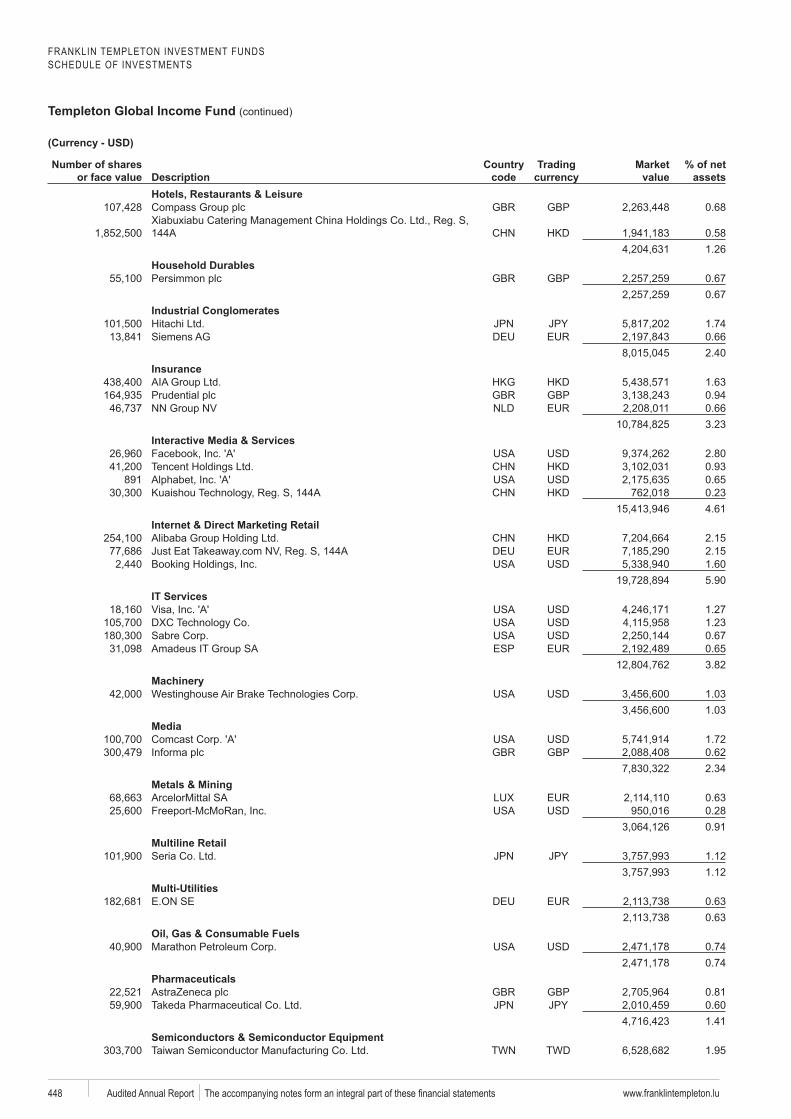
FRANKLIN TEMPLETON INVESTMENT FUNDSSCHEDULE OF INVESTMENTS
Templeton Global Income Fund (continued)
www.franklintempleton.lu448 Audited Annual Report
Number of shares or face value Description
code
Trading Market value
% of net assets
Hotels, Restaurants & LeisureGBP 0.68
0.581.26
Household DurablesGBP 0.67
0.67Industrial Conglomerates
1.740.662.40
Insurance1.63
GBP 0.940.663.23
Interactive Media & Services2.80
Tencent 0.93891 0.65
Kuaishou 0.234.61
Internet & Direct Marketing Retail2.152.151.605.90
IT Services1.271.230.67
ESP 0.653.82
1.031.03
Media1.72
GBP 0.622.34
Metals & Mining0.630.280.91
Multiline RetailSeria 1.12
1.12Multi-Utilities
0.630.63
Oil, Gas & Consumable Fuels0.740.74
PharmaceuticalsGBP 0.81
0.601.41
Semiconductors & Semiconductor EquipmentTWD 1.95
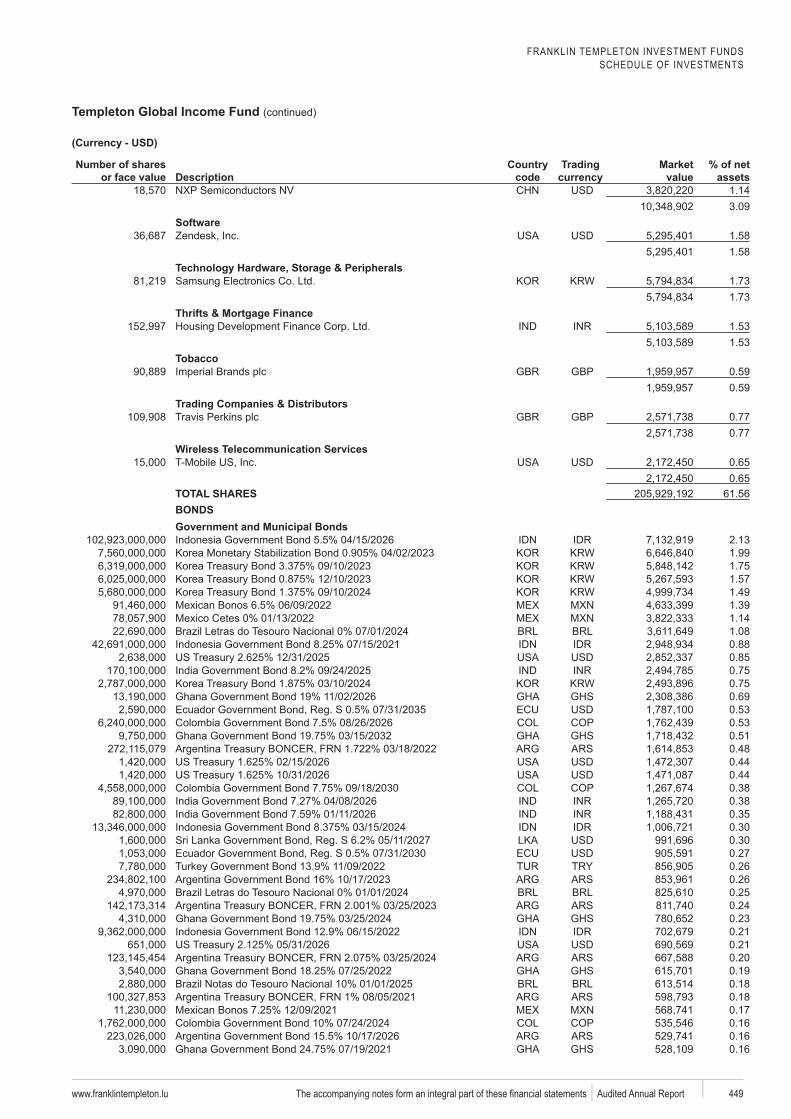
FRANKLIN TEMPLETON INVESTMENT FUNDSSCHEDULE OF INVESTMENTS
Templeton Global Income Fund (continued)
www.franklintempleton.lu 449 Audited Annual Report
Number of shares or face value Description
code
Trading Market value
% of net assets
1.143.09
Zendesk 1.581.58
1.731.73
Thrifts & Mortgage Finance1.531.53
TobaccoGBP 0.59
0.59Trading Companies & Distributors
GBP 0.770.77
Wireless Telecommunication Services0.650.65
TOTAL SHARES 61.56BONDSGovernment and Municipal Bonds
2.131.991.751.571.49
Bonos 1.391.14
do Tesouro 1.080.880.850.750.750.690.530.530.510.480.440.440.380.380.350.300.300.270.260.26
do Tesouro 0.250.240.230.210.210.200.19
do Tesouro 0.180.18
Bonos 0.170.160.160.16
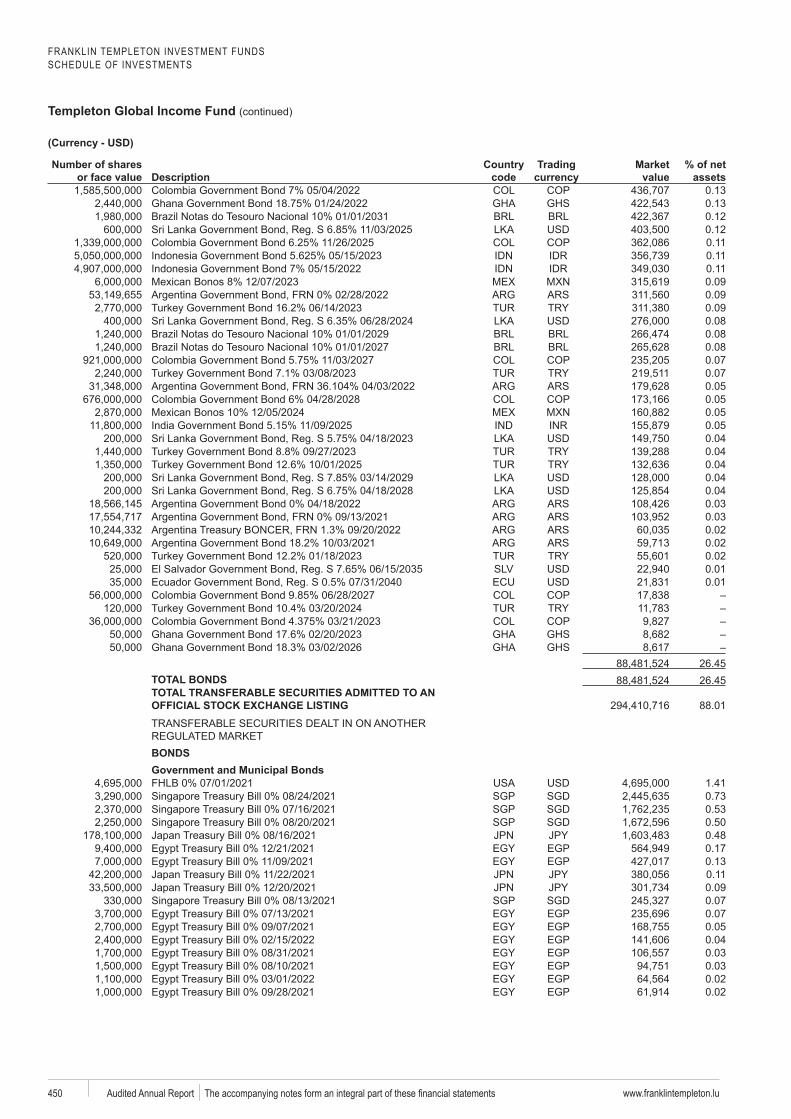
FRANKLIN TEMPLETON INVESTMENT FUNDSSCHEDULE OF INVESTMENTS
Templeton Global Income Fund (continued)
www.franklintempleton.lu450 Audited Annual Report
Number of shares or face value Description
code
Trading Market value
% of net assets
0.130.13
do Tesouro 0.120.120.110.110.11
Bonos 0.090.090.090.08
do Tesouro 0.08 do Tesouro 0.08
0.070.070.050.05
Bonos 0.050.050.040.040.040.040.040.030.030.020.020.020.010.01
26.45TOTAL BONDS 26.45TOTAL TRANSFERABLE SECURITIES ADMITTED TO AN
88.01
BONDSGovernment and Municipal Bonds
1.41SGP SGD 0.73SGP SGD 0.53SGP SGD 0.50
0.48EGP 0.17EGP 0.13
0.110.09
SGP SGD 0.07EGP 0.07EGP 0.05EGP 0.04EGP 0.03EGP 0.03EGP 0.02EGP 0.02
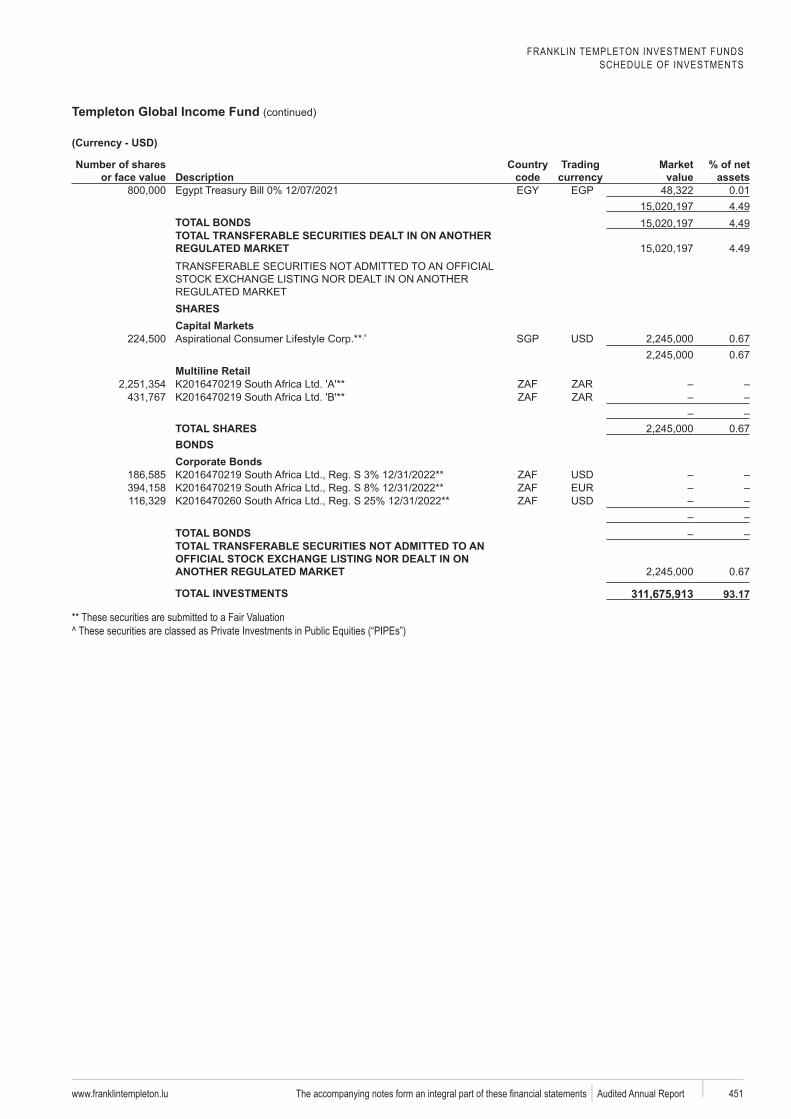
FRANKLIN TEMPLETON INVESTMENT FUNDSSCHEDULE OF INVESTMENTS
Templeton Global Income Fund (continued)
www.franklintempleton.lu 451 Audited Annual Report
Number of shares or face value Description
code
Trading Market value
% of net assets
EGP 0.014.49
TOTAL BONDS 4.49TOTAL TRANSFERABLE SECURITIES DEALT IN ON ANOTHER
4.49
SHARESCapital Markets
SGP 0.670.67
Multiline Retail
TOTAL SHARES 0.67BONDSCorporate Bonds
TOTAL BONDSTOTAL TRANSFERABLE SECURITIES NOT ADMITTED TO AN
0.67
TOTAL INVESTMENTS 311,675,913a** These securities are submitted to a Fair Valuation^ These securities are classed as Private Investments in Public Equities (“PIPEs”)
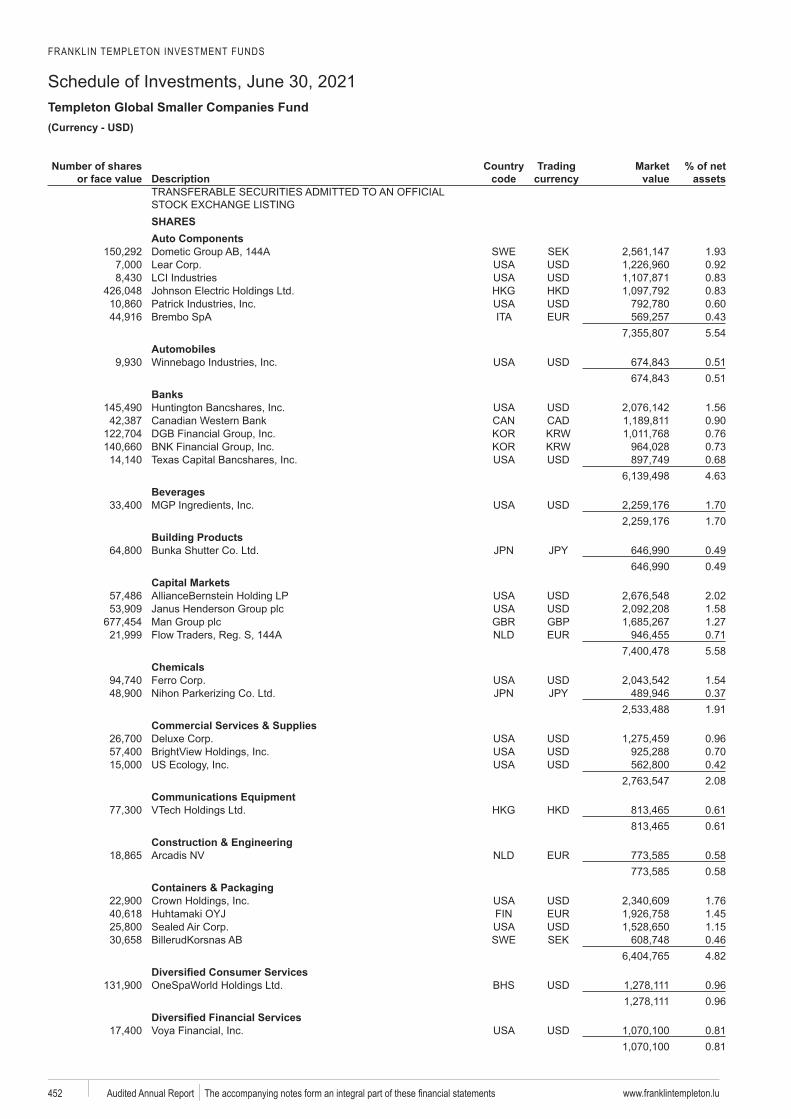
FRANKLIN TEMPLETON INVESTMENT FUNDS
Schedule of Investments, June 30, 2021Templeton Global Smaller Companies Fund
www.franklintempleton.lu452 Audited Annual Report
USD)
Number of shares or face value Description
code
Trading Market value
% of net assets
SHARESAuto Components
SWE SEK 1.930.920.830.830.60
0.435.54
Automobiles0.510.51
Banks1.560.900.760.730.684.63
Beverages1.701.70
Building Products0.490.49
Capital Markets2.021.58
GBP 1.270.715.58
Chemicals1.540.371.91
Commercial Services & Supplies0.960.700.422.08
Communications Equipment0.610.61
Construction & Engineering0.580.58
Containers & Packaging1.761.451.15
BillerudKorsnas SWE SEK 0.464.82
0.960.96
0.810.81
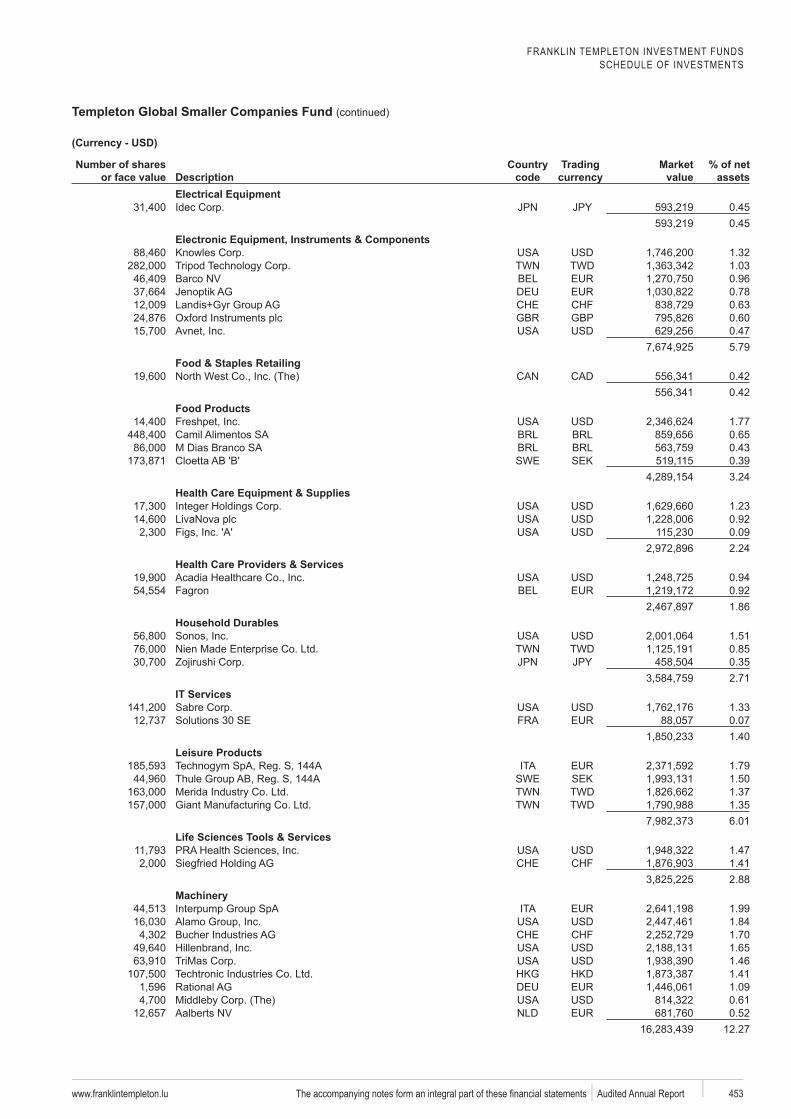
FRANKLIN TEMPLETON INVESTMENT FUNDSSCHEDULE OF INVESTMENTS
Templeton Global Smaller Companies Fund (continued)
www.franklintempleton.lu 453 Audited Annual Report
Number of shares or face value Description
code
Trading Market value
% of net assets
Electrical Equipment0.450.45
Electronic Equipment, Instruments & Components1.32
TWD 1.030.960.780.63
GBP 0.600.475.79
Food & Staples Retailing0.420.42
Food Products1.770.65
Branco 0.43SWE SEK 0.39
3.24Health Care Equipment & Supplies
1.230.920.092.24
Health Care Providers & Services0.94
Fagron 0.921.86
Household DurablesSonos 1.51
TWD 0.850.352.71
IT Services1.33
Solutions 30 SE 0.071.40
Leisure Products1.79
SWE SEK 1.50TWD 1.37TWD 1.35
6.01Life Sciences Tools & Services
1.471.412.88
1.991.841.701.651.461.411.090.610.52
12.27
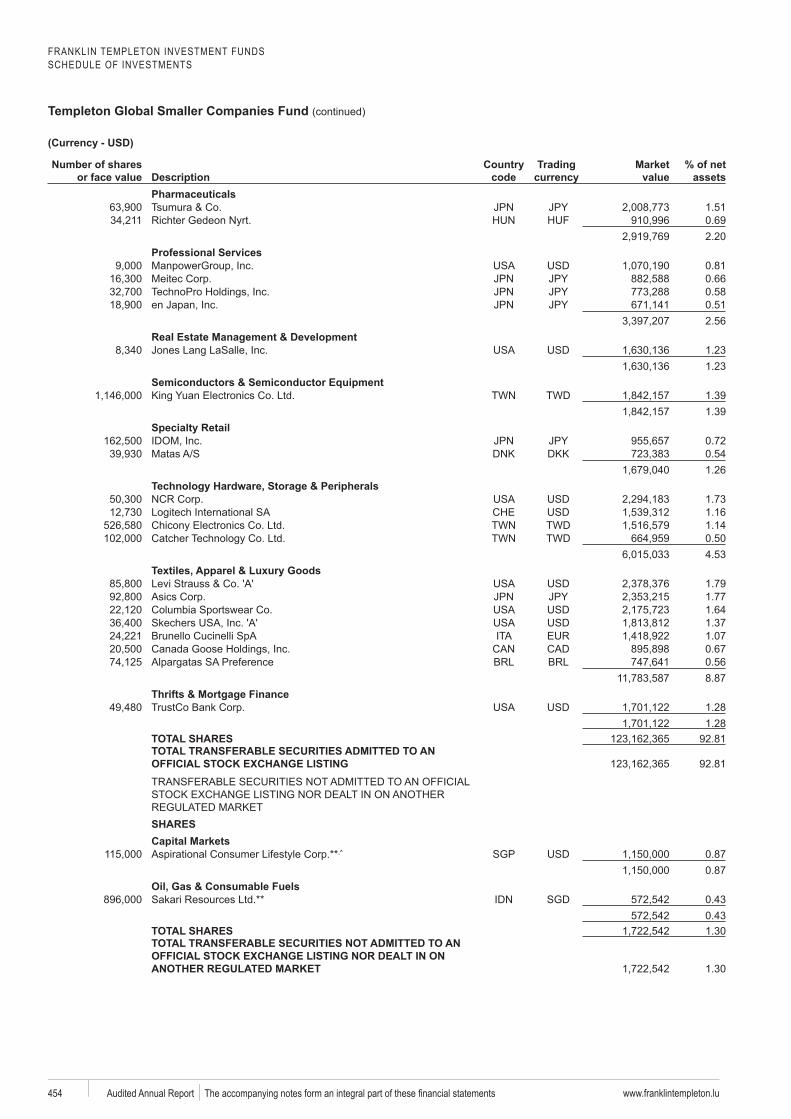
FRANKLIN TEMPLETON INVESTMENT FUNDSSCHEDULE OF INVESTMENTS
Templeton Global Smaller Companies Fund (continued)
www.franklintempleton.lu454 Audited Annual Report
Number of shares or face value Description
code
Trading Market value
% of net assets
Pharmaceuticals1.51
Gedeon . 0.692.20
Professional Services0.810.66
TechnoPro 0.58en 0.51
2.56Real Estate Management & Development
1.231.23
Semiconductors & Semiconductor EquipmentTWD 1.39
1.39
0.72DKK 0.54
1.26
1.731.16
TWD 1.14TWD 0.50
4.53
1.791.771.64
Skechers 1.37Brunello 1.07
0.670.568.87
Thrifts & Mortgage Finance1.281.28
TOTAL SHARES 92.81TOTAL TRANSFERABLE SECURITIES ADMITTED TO AN
92.81
SHARESCapital Markets
SGP 0.870.87
Oil, Gas & Consumable FuelsSakari SGD 0.43
0.43TOTAL SHARES 1.30TOTAL TRANSFERABLE SECURITIES NOT ADMITTED TO AN
1.30
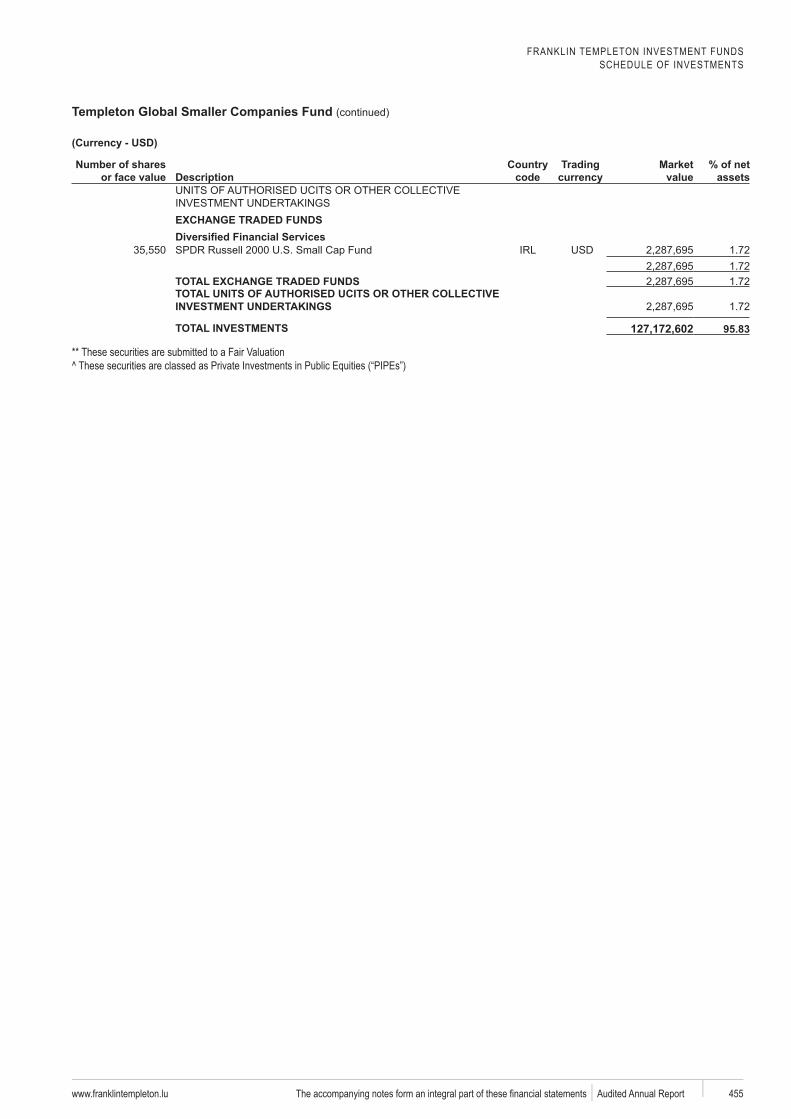
FRANKLIN TEMPLETON INVESTMENT FUNDSSCHEDULE OF INVESTMENTS
Templeton Global Smaller Companies Fund (continued)
www.franklintempleton.lu 455 Audited Annual Report
Number of shares or face value Description
code
Trading Market value
% of net assets
EXCHANGE TRADED FUNDS
1.721.72
TOTAL EXCHANGE TRADED FUNDS 1.72TOTAL UNITS OF AUTHORISED UCITS OR OTHER COLLECTIVE
1.72
TOTAL INVESTMENTS 127,172,602
** These securities are submitted to a Fair Valuation^ These securities are classed as Private Investments in Public Equities (“PIPEs”)
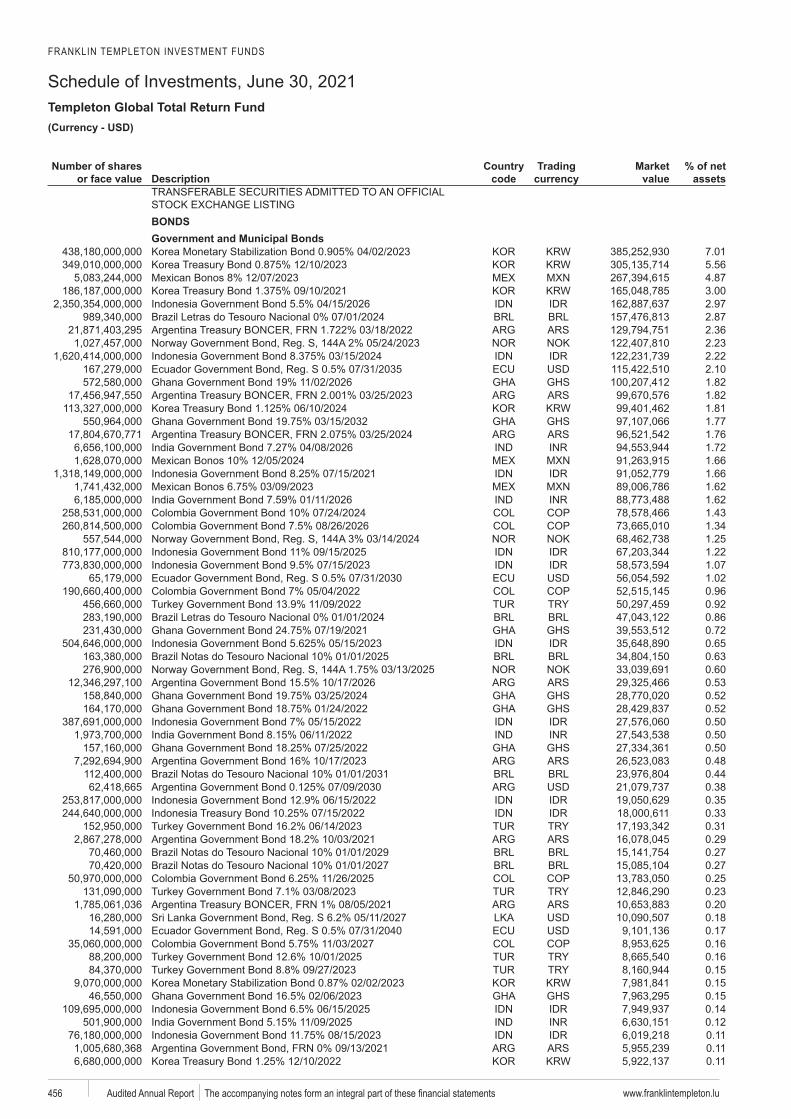
FRANKLIN TEMPLETON INVESTMENT FUNDS
Schedule of Investments, June 30, 2021Templeton Global Total Return Fund
www.franklintempleton.lu456 Audited Annual Report
USD)
Number of shares or face value Description
code
Trading Market value
% of net assets
BONDSGovernment and Municipal Bonds
7.015.56
Bonos 4.873.002.97
do Tesouro 2.872.362.232.222.101.821.821.811.771.761.72
Bonos 1.661.66
Bonos 1.621.621.431.341.251.221.071.020.960.92
do Tesouro 0.860.720.65
do Tesouro 0.630.600.530.520.520.500.500.500.48
do Tesouro 0.440.380.350.330.310.29
do Tesouro 0.27 do Tesouro 0.27
0.250.230.200.180.170.160.160.150.150.150.140.120.110.110.11
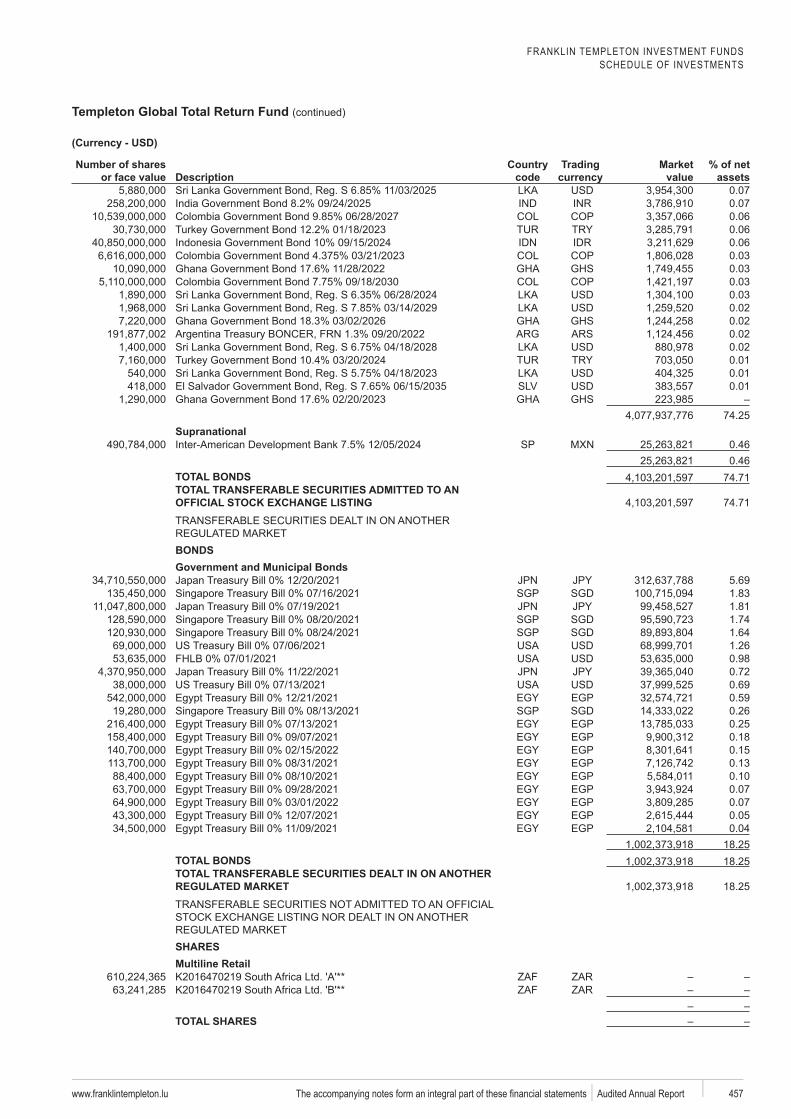
FRANKLIN TEMPLETON INVESTMENT FUNDSSCHEDULE OF INVESTMENTS
Templeton Global Total Return Fund (continued)
www.franklintempleton.lu 457 Audited Annual Report
Number of shares or face value Description
code
Trading Market value
% of net assets
0.070.070.060.060.060.030.030.030.030.020.020.020.020.010.010.01
74.25Supranational
SP 0.460.46
TOTAL BONDS 74.71TOTAL TRANSFERABLE SECURITIES ADMITTED TO AN
74.71
BONDSGovernment and Municipal Bonds
5.69SGP SGD 1.83
1.81SGP SGD 1.74SGP SGD 1.64
1.260.980.720.69
EGP 0.59SGP SGD 0.26
EGP 0.25EGP 0.18EGP 0.15EGP 0.13EGP 0.10EGP 0.07EGP 0.07EGP 0.05EGP 0.04
18.25TOTAL BONDS 18.25TOTAL TRANSFERABLE SECURITIES DEALT IN ON ANOTHER
18.25
SHARESMultiline Retail
TOTAL SHARES
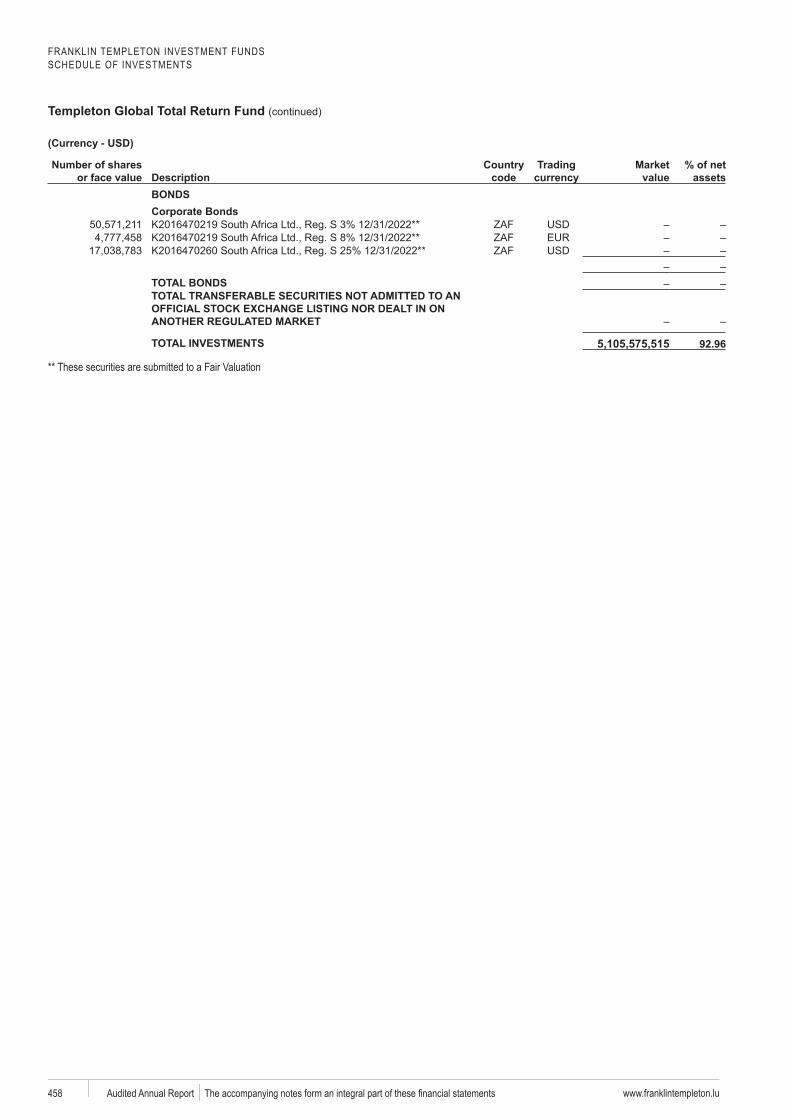
FRANKLIN TEMPLETON INVESTMENT FUNDSSCHEDULE OF INVESTMENTS
Templeton Global Total Return Fund (continued)
www.franklintempleton.lu458 Audited Annual Report
Number of shares or face value Description
code
Trading Market value
% of net assets
BONDSCorporate Bonds
TOTAL BONDSTOTAL TRANSFERABLE SECURITIES NOT ADMITTED TO AN
TOTAL INVESTMENTS 5,105,575,515a** These securities are submitted to a Fair Valuation
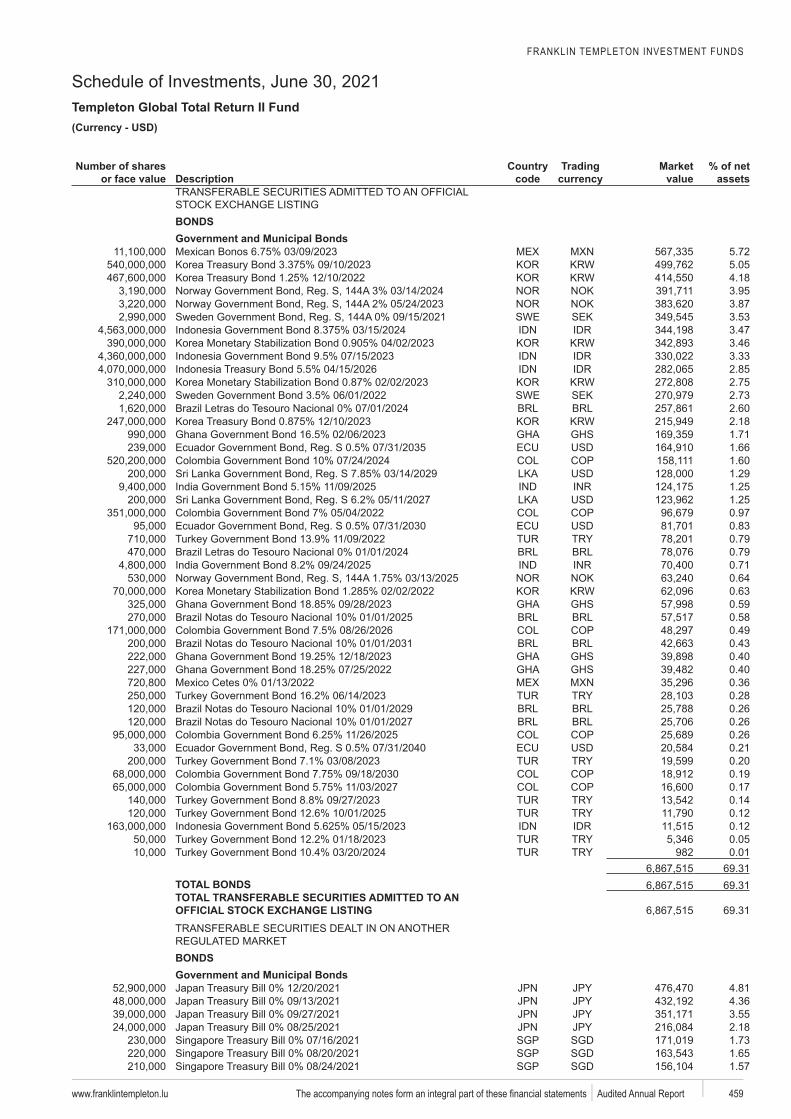
FRANKLIN TEMPLETON INVESTMENT FUNDS
Schedule of Investments, June 30, 2021Templeton Global Total Return II Fund
www.franklintempleton.lu 459 Audited Annual Report
USD)
Number of shares or face value Description
code
Trading Market value
% of net assets
BONDSGovernment and Municipal Bonds
5.725.054.183.953.87
SWE SEK 3.533.473.463.332.852.75
SWE SEK 2.732.602.181.711.661.601.291.251.250.970.830.790.790.710.640.630.590.580.490.430.400.400.360.280.260.260.260.210.200.190.170.140.120.120.05
982 0.0169.31
TOTAL BONDS 69.31TOTAL TRANSFERABLE SECURITIES ADMITTED TO AN
69.31
BONDSGovernment and Municipal Bonds
4.814.363.552.18
SGP SGD 1.73SGP SGD 1.65SGP SGD 1.57
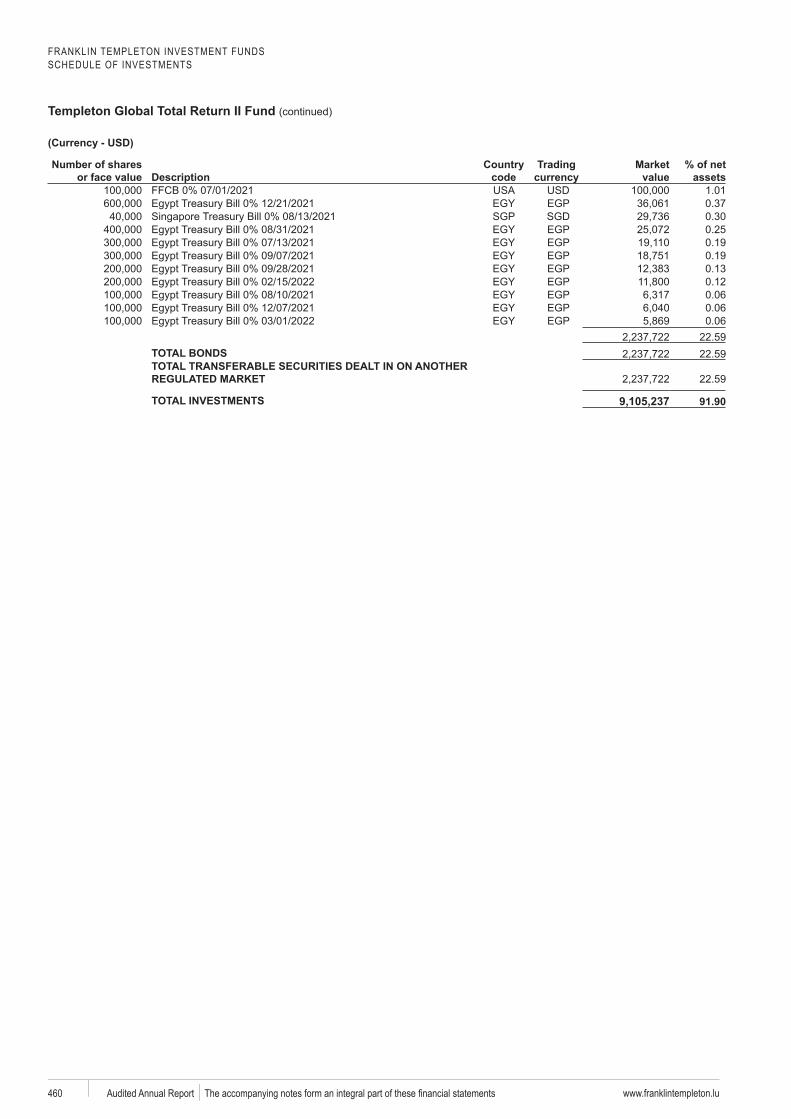
FRANKLIN TEMPLETON INVESTMENT FUNDSSCHEDULE OF INVESTMENTS
Templeton Global Total Return II Fund (continued)
www.franklintempleton.lu460 Audited Annual Report
Number of shares or face value Description
code
Trading Market value
% of net assets
1.01EGP 0.37
SGP SGD 0.30EGP 0.25EGP 0.19EGP 0.19EGP 0.13EGP 0.12EGP 0.06EGP 0.06EGP 0.06
22.59TOTAL BONDS 22.59TOTAL TRANSFERABLE SECURITIES DEALT IN ON ANOTHER
22.59
TOTAL INVESTMENTS 9,105,237
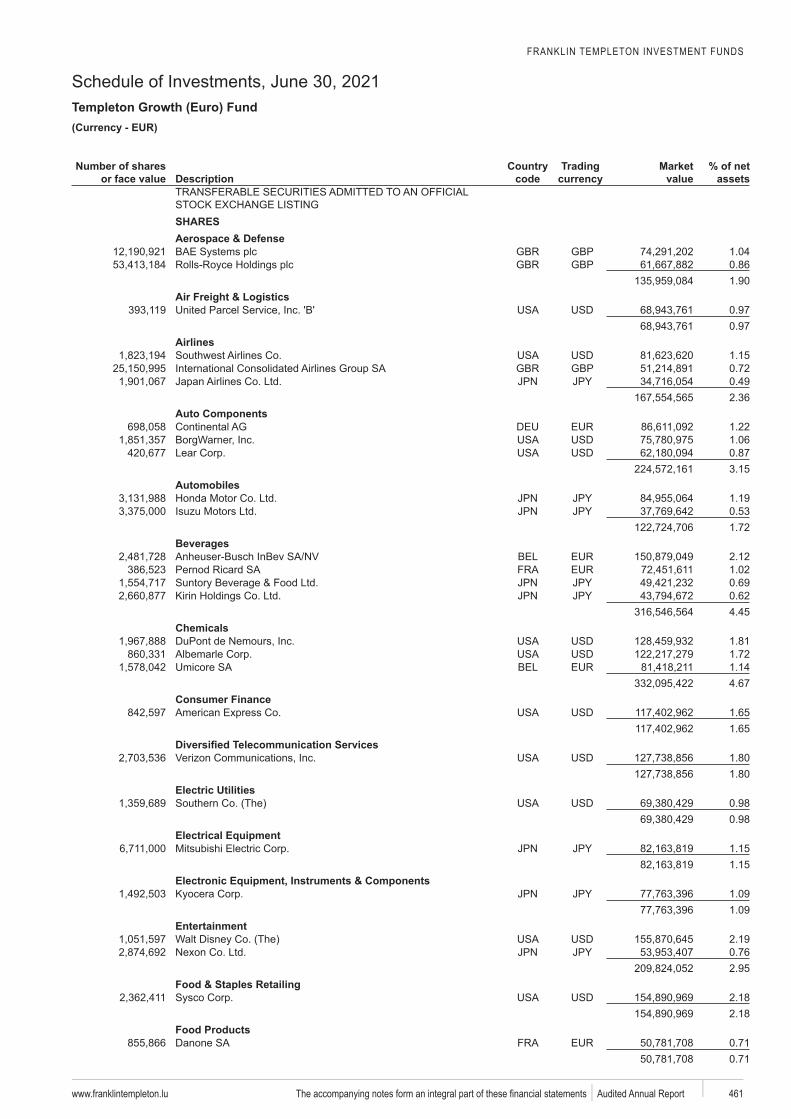
FRANKLIN TEMPLETON INVESTMENT FUNDS
Schedule of Investments, June 30, 2021Templeton Growth (Euro) Fund
www.franklintempleton.lu 461 Audited Annual Report
EUR)
Number of shares or face value Description
code
Trading Market value
% of net assets
SHARESAerospace & Defense
GBP 1.04GBP 0.86
1.90Air Freight & Logistics
0.970.97
Airlines1.15
GBP 0.720.492.36
Auto Components1.221.060.873.15
Automobiles1.190.531.72
Beverages2.121.020.690.624.45
Chemicals1.811.721.144.67
Consumer Finance1.651.65
1.801.80
Electric Utilities0.980.98
Electrical Equipment1.151.15
Electronic Equipment, Instruments & Components1.091.09
Entertainment2.190.762.95
Food & Staples Retailing2.182.18
Food Products0.710.71
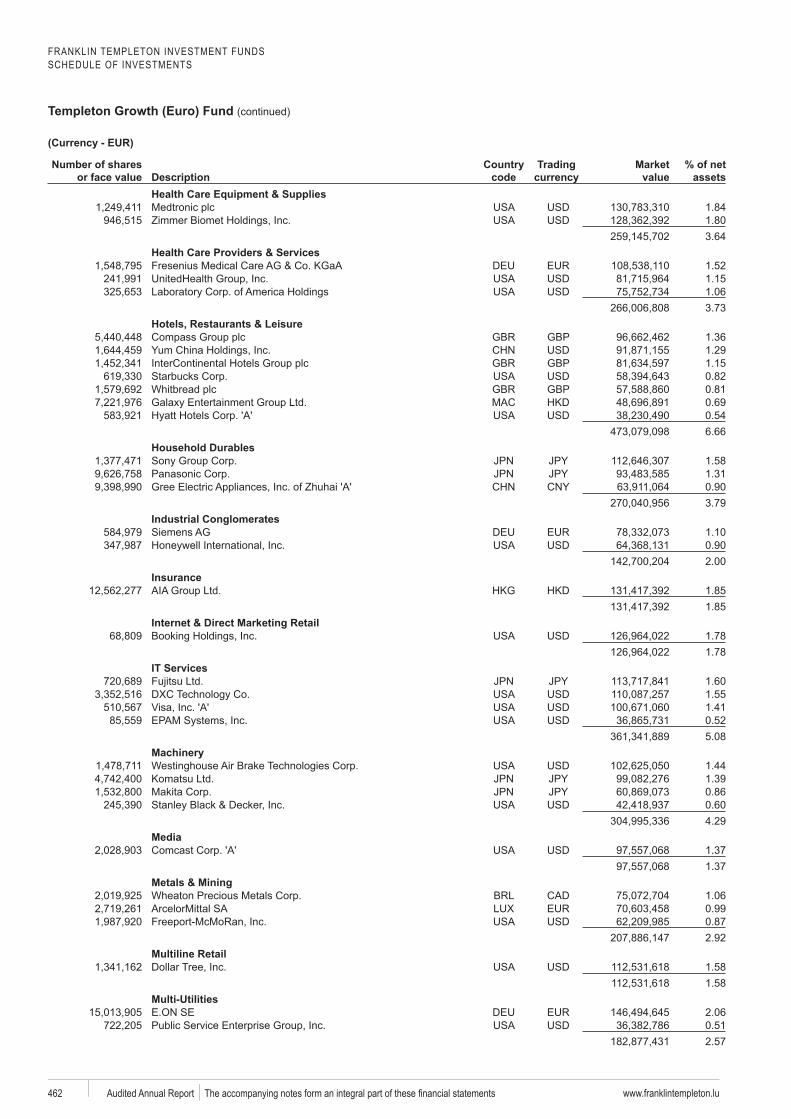
FRANKLIN TEMPLETON INVESTMENT FUNDSSCHEDULE OF INVESTMENTS
Templeton Growth (Euro) Fund (continued)
www.franklintempleton.lu462 Audited Annual Report
Number of shares or face value Description
code
Trading Market value
% of net assets
Health Care Equipment & Supplies1.841.803.64
Health Care Providers & Services1.521.151.063.73
Hotels, Restaurants & LeisureGBP 1.36
1.29GBP 1.15
0.82GBP 0.81
0.690.546.66
Household Durables1.581.310.903.79
Industrial Conglomerates1.100.902.00
Insurance1.851.85
Internet & Direct Marketing Retail1.781.78
IT Services1.601.551.410.525.08
1.441.390.860.604.29
Media1.371.37
Metals & Mining1.060.990.872.92
Multiline Retail1.581.58
Multi-Utilities2.060.512.57
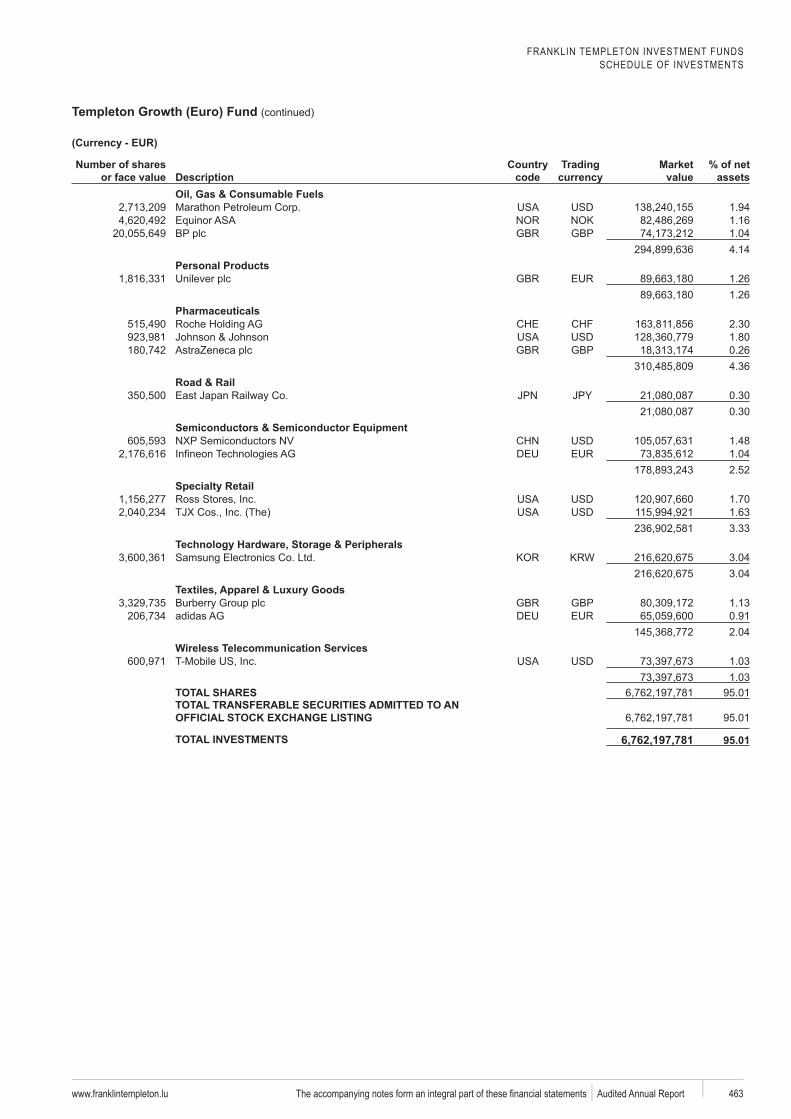
FRANKLIN TEMPLETON INVESTMENT FUNDSSCHEDULE OF INVESTMENTS
Templeton Growth (Euro) Fund (continued)
www.franklintempleton.lu 463 Audited Annual Report
Number of shares or face value Description
code
Trading Market value
% of net assets
Oil, Gas & Consumable Fuels1.941.16
GBP 1.044.14
Personal Products1.261.26
Pharmaceuticals2.301.80
GBP 0.264.36
Road & Rail0.300.30
Semiconductors & Semiconductor Equipment1.481.042.52
1.701.633.33
3.043.04
GBP 1.130.912.04
Wireless Telecommunication Services1.031.03
TOTAL SHARES 95.01TOTAL TRANSFERABLE SECURITIES ADMITTED TO AN
95.01
TOTAL INVESTMENTS 6,762,197,781
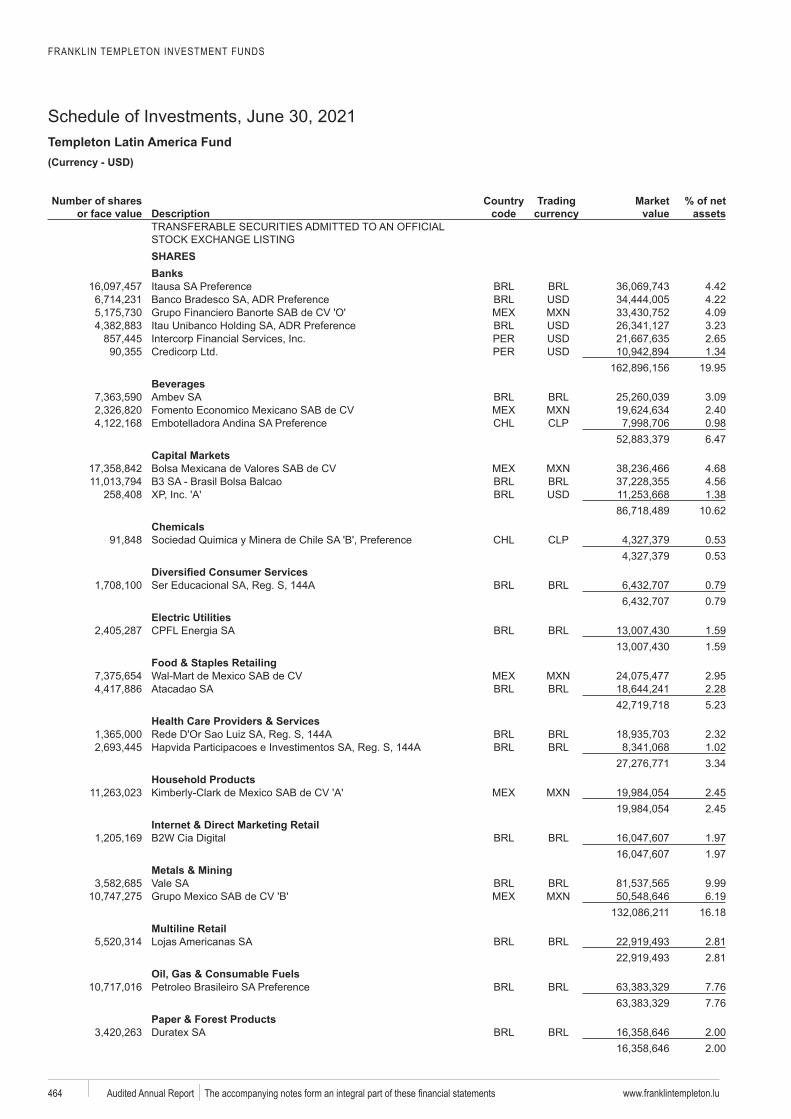
FRANKLIN TEMPLETON INVESTMENT FUNDS
Schedule of Investments, June 30, 2021Templeton Latin America Fund
www.franklintempleton.lu464 Audited Annual Report
USD)
Number of shares or face value Description
code
Trading Market value
% of net assets
SHARESBanks
4.424.224.093.232.651.34
19.95Beverages
3.092.400.986.47
Capital Markets4.684.561.38
10.62Chemicals
0.530.53
0.790.79
Electric Utilities1.591.59
Food & Staples Retailing2.952.285.23
Health Care Providers & Services2.321.023.34
Household Products2.452.45
Internet & Direct Marketing Retail1.971.97
Metals & Mining9.996.19
16.18Multiline Retail
2.812.81
Oil, Gas & Consumable Fuels7.767.76
Paper & Forest Products2.002.00
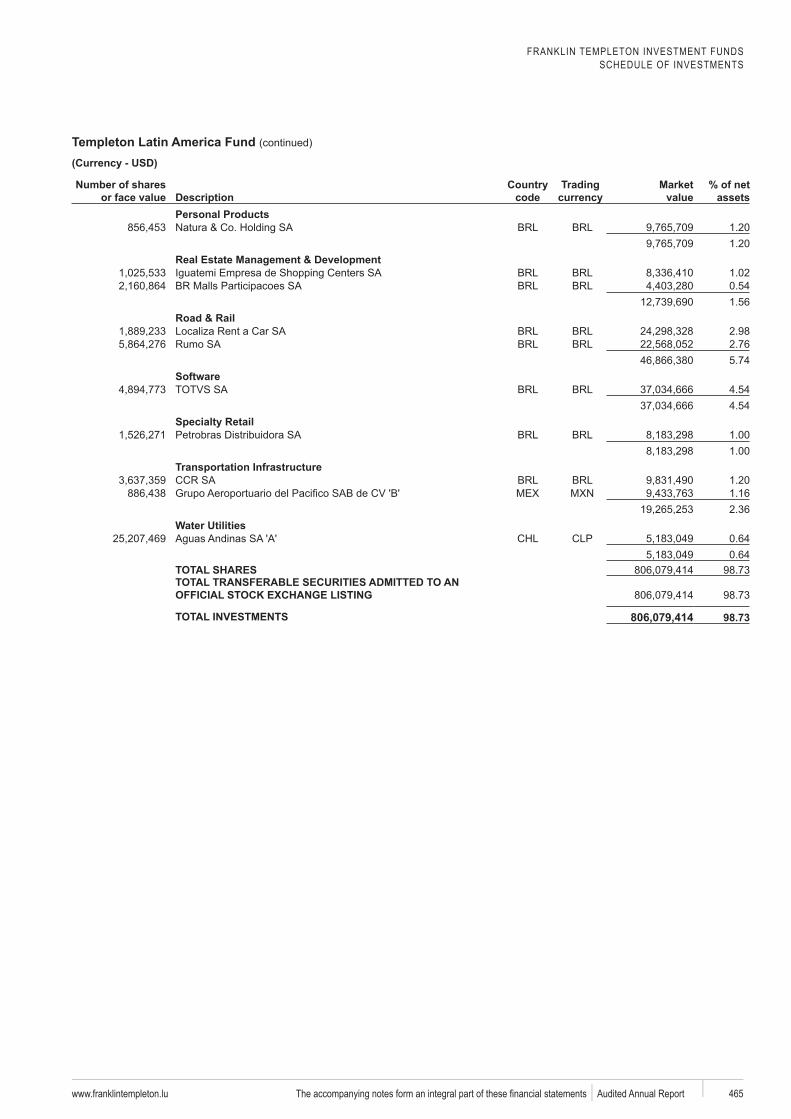
FRANKLIN TEMPLETON INVESTMENT FUNDSSCHEDULE OF INVESTMENTS
Templeton Latin America Fund (continued)
www.franklintempleton.lu 465 Audited Annual Report
Number of shares or face value Description
code
Trading Market value
% of net assets
Personal Products1.201.20
Real Estate Management & Development1.020.541.56
Road & Rail2.982.765.74
4.544.54
1.001.00
Transportation Infrastructure1.201.162.36
Water Utilities0.640.64
TOTAL SHARES 98.73TOTAL TRANSFERABLE SECURITIES ADMITTED TO AN
98.73
TOTAL INVESTMENTS 806,079,414
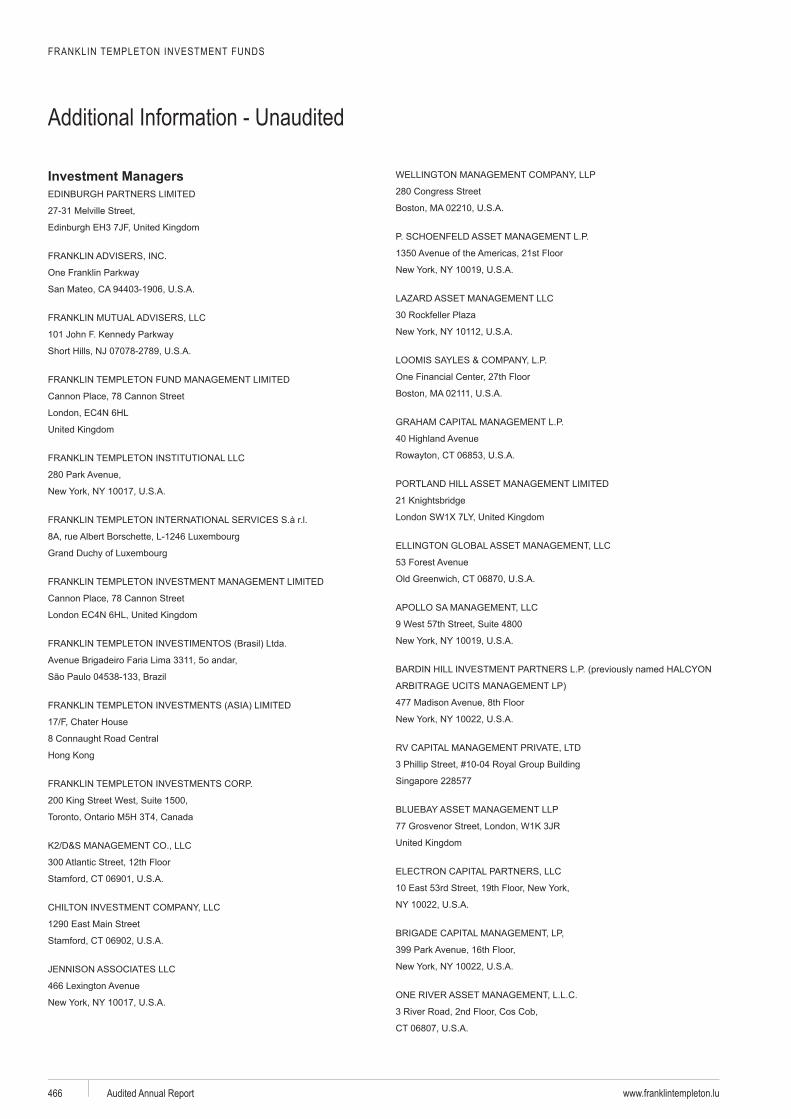
FRANKLIN TEMPLETON INVESTMENT FUNDS
Additional Information - Unaudited
www.franklintempleton.luAudited Annual Report466
Investment Managers
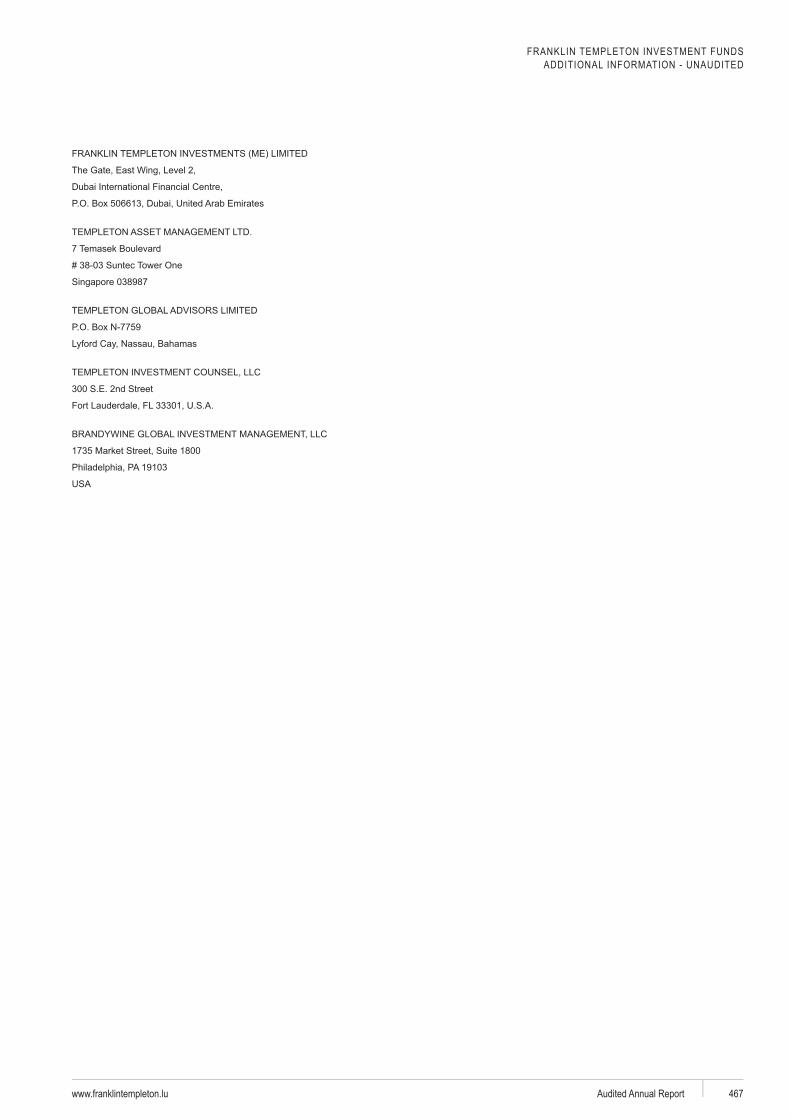
FRANKLIN TEMPLETON INVESTMENT FUNDSADDITIONAL INFORMATION - UNAUDITED
www.franklintempleton.lu Audited Annual Report 467
300 S.E. 2nd Street
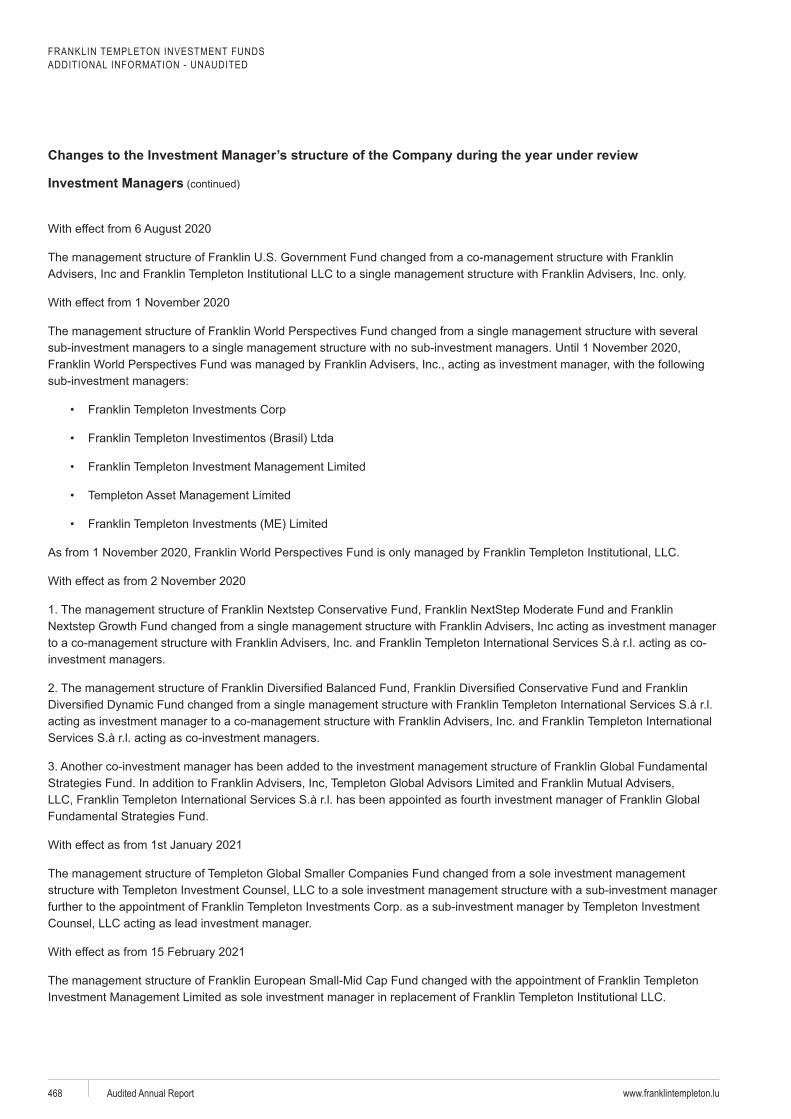
FRANKLIN TEMPLETON INVESTMENT FUNDSADDITIONAL INFORMATION - UNAUDITED
www.franklintempleton.luAudited Annual Report468
Investment Managers
•
•
•
•
•
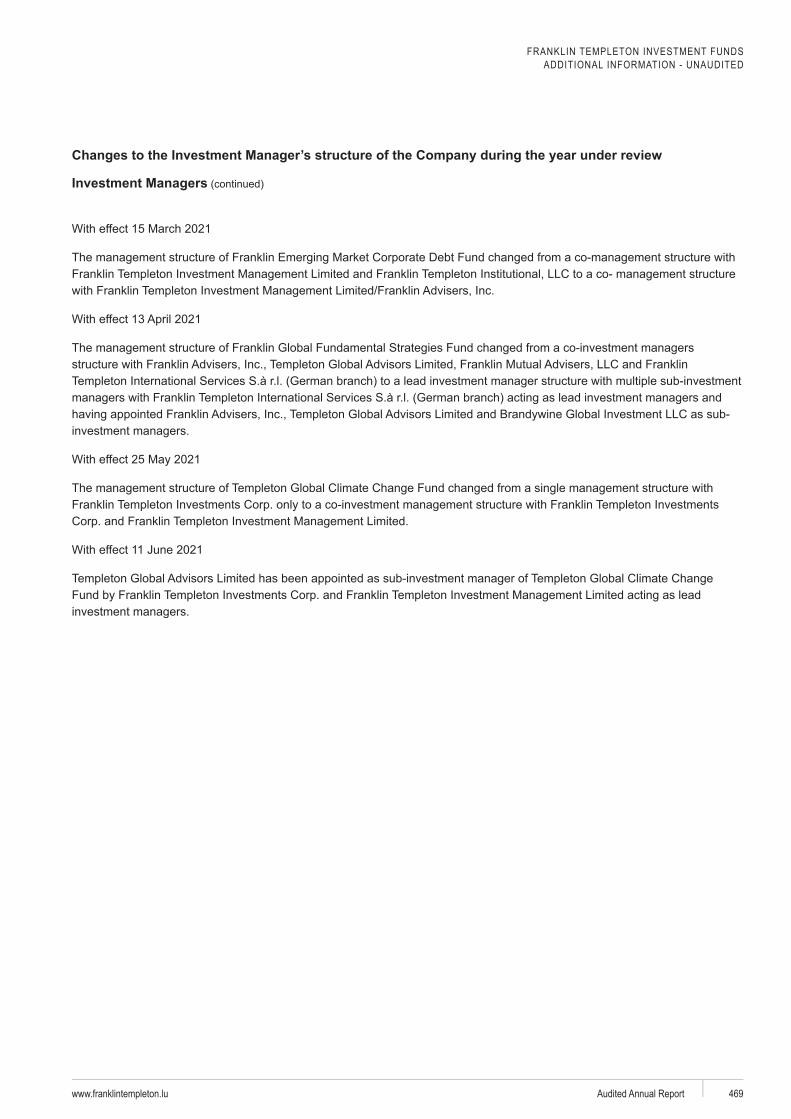
FRANKLIN TEMPLETON INVESTMENT FUNDSADDITIONAL INFORMATION - UNAUDITED
www.franklintempleton.lu Audited Annual Report 469
Investment Managers
With effect 11 June 2021
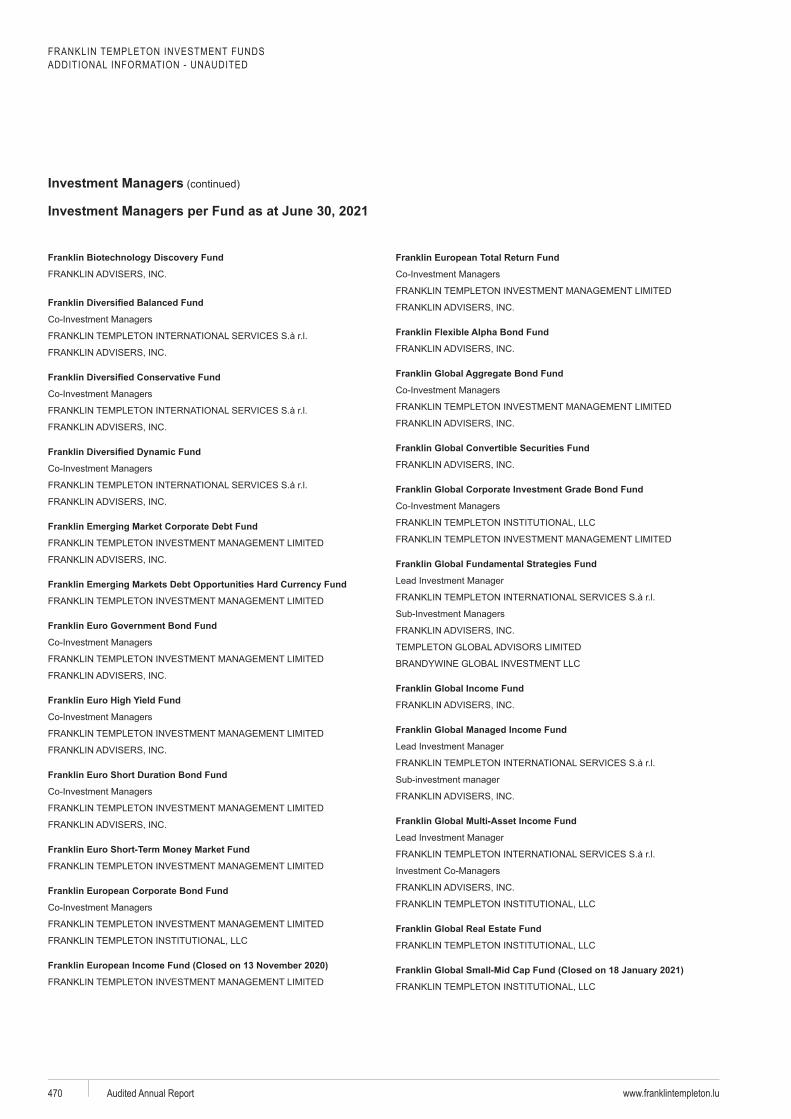
FRANKLIN TEMPLETON INVESTMENT FUNDSADDITIONAL INFORMATION - UNAUDITED
www.franklintempleton.luAudited Annual Report470
Investment Managers
Franklin Emerging Market Corporate Debt Fund
Franklin Euro Government Bond Fund
Franklin Euro High Yield Fund
Franklin Euro Short Duration Bond Fund
Franklin European Corporate Bond Fund
Franklin European Income Fund (Closed on 13 November 2020)
Franklin European Total Return Fund
Franklin Flexible Alpha Bond Fund
Franklin Global Aggregate Bond Fund
Franklin Global Convertible Securities Fund
Franklin Global Corporate Investment Grade Bond Fund
Franklin Global Fundamental Strategies Fund
Franklin Global Income Fund
Franklin Global Managed Income Fund
Franklin Global Multi-Asset Income Fund
Franklin Global Real Estate Fund
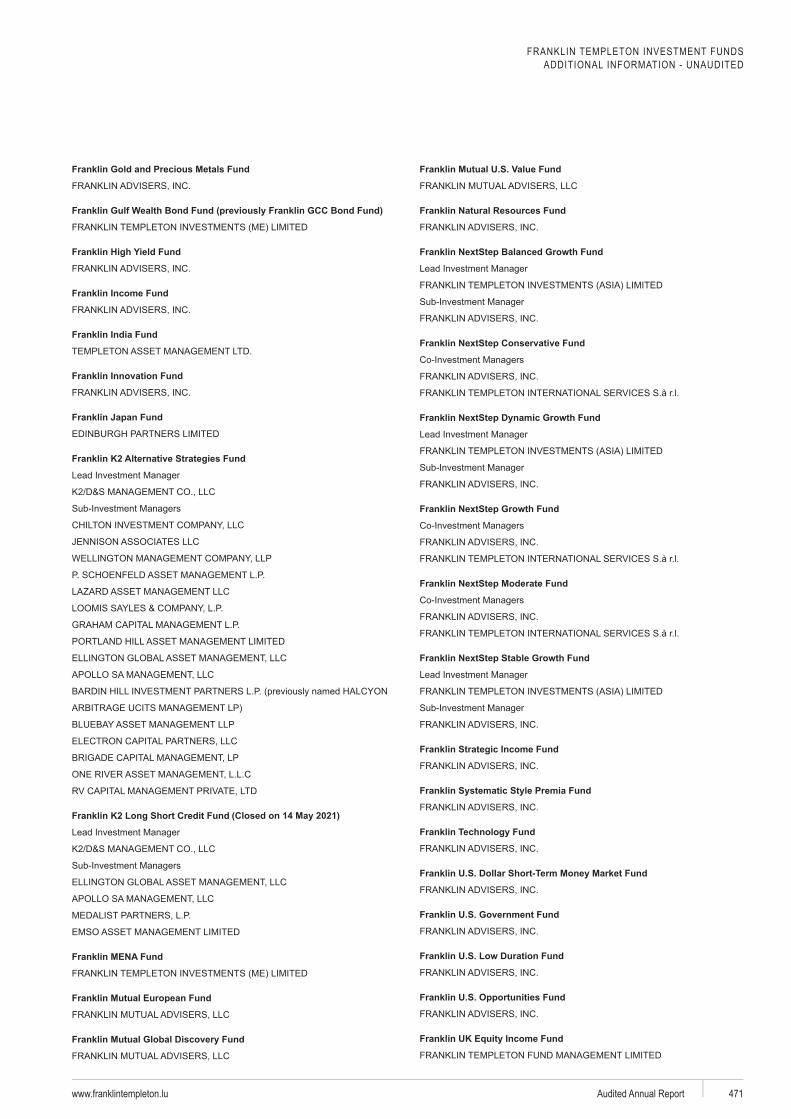
FRANKLIN TEMPLETON INVESTMENT FUNDSADDITIONAL INFORMATION - UNAUDITED
www.franklintempleton.lu Audited Annual Report 471
Franklin Gold and Precious Metals Fund
Franklin Gulf Wealth Bond Fund ( Franklin GCC Bond Fund)
Franklin High Yield Fund
Franklin Income Fund
Franklin India Fund
Franklin Innovation Fund
Franklin MENA Fund
Franklin Mutual European Fund
Franklin Natural Resources Fund
Franklin NextStep
Franklin NextStep Conservative Fund
Franklin NextStep
Franklin NextStep
Franklin NextStep Moderate Fund
Franklin NextStep
Franklin Strategic Income Fund
Premia Fund
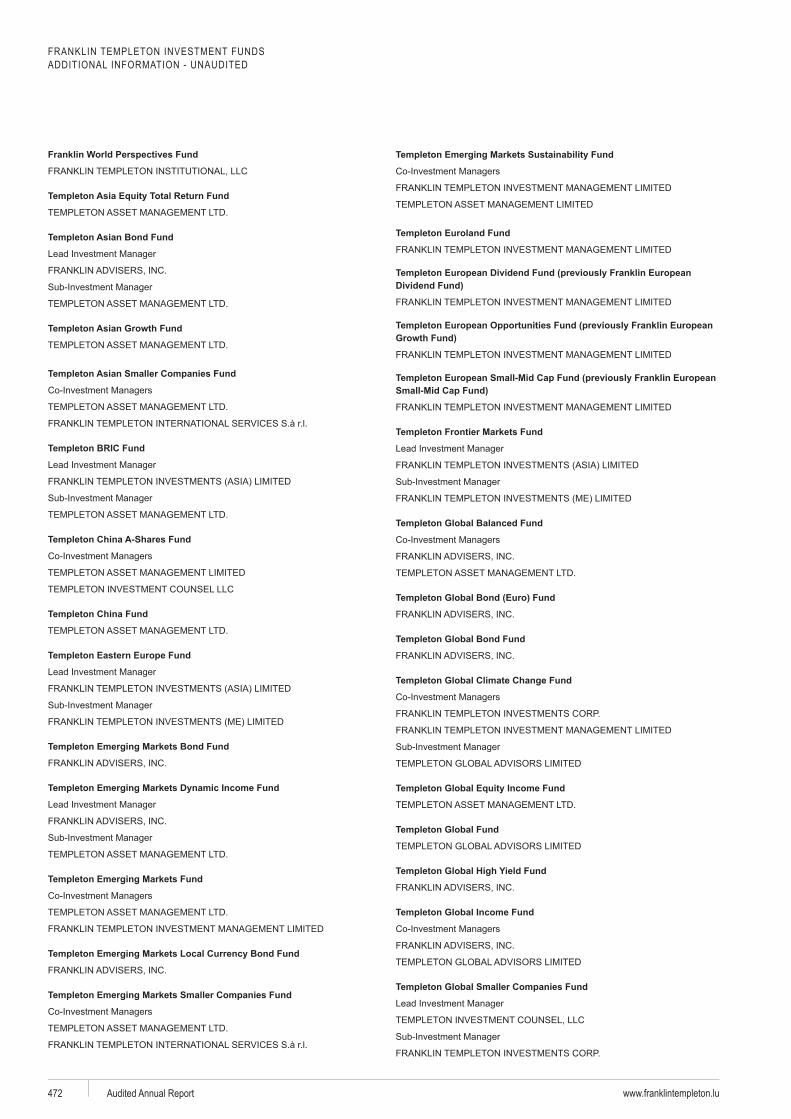
FRANKLIN TEMPLETON INVESTMENT FUNDSADDITIONAL INFORMATION - UNAUDITED
www.franklintempleton.luAudited Annual Report472
Franklin World Perspectives Fund
Templeton Asian Bond Fund
Templeton Asian Smaller Companies Fund
Templeton BRIC Fund
Templeton China A-Shares Fund
Templeton China Fund
Templeton Eastern Europe Fund
Templeton Emerging Markets Bond Fund
Templeton Emerging Markets Fund
Templeton Emerging Markets Smaller Companies Fund
Templeton Euroland Fund
Dividend Fund)
Small-Mid Cap Fund)
Templeton Frontier Markets Fund
Templeton Global Balanced Fund
Templeton Global Bond (Euro) Fund
Templeton Global Bond Fund
Templeton Global Climate Change Fund
Templeton Global Fund
Templeton Global High Yield Fund
Templeton Global Income Fund
Templeton Global Smaller Companies Fund
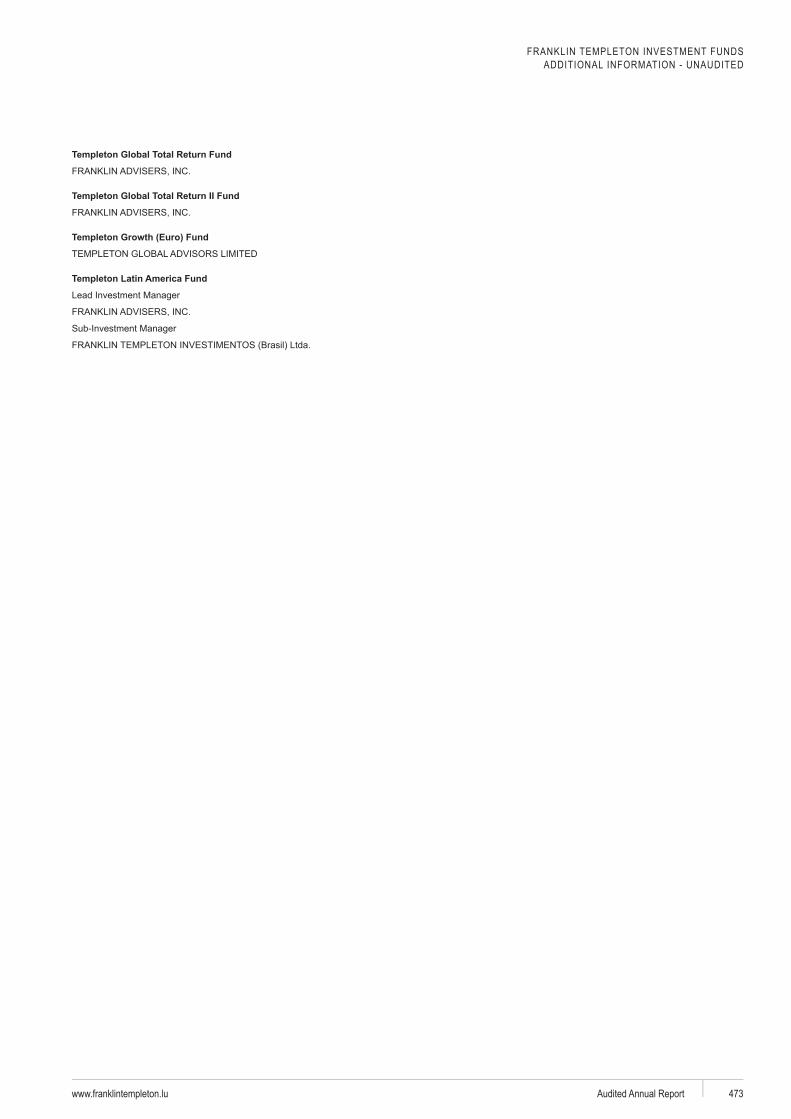
FRANKLIN TEMPLETON INVESTMENT FUNDSADDITIONAL INFORMATION - UNAUDITED
www.franklintempleton.lu Audited Annual Report 473
Templeton Global Total Return Fund
Templeton Global Total Return II Fund
Templeton Latin America Fund
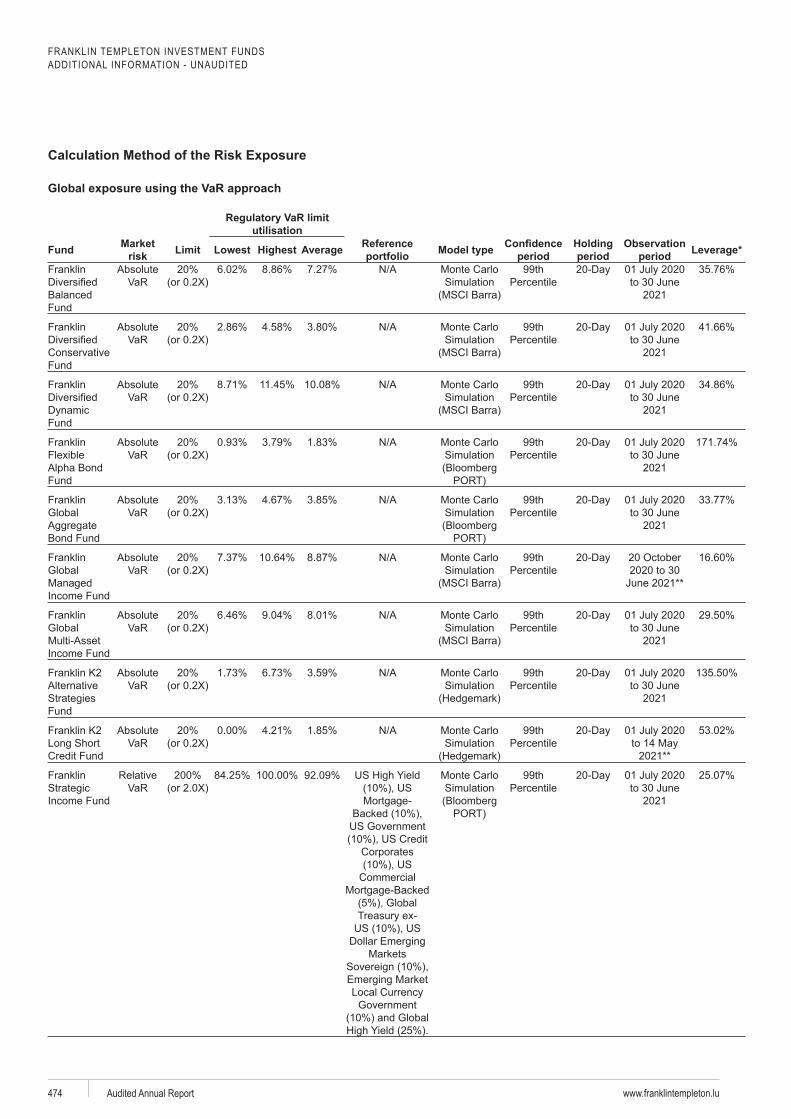
FRANKLIN TEMPLETON INVESTMENT FUNDSADDITIONAL INFORMATION - UNAUDITED
www.franklintempleton.luAudited Annual Report474
Calculation Method of the Risk Exposure
Global exposure using the VaR approach
VaR limit utilisation
Fund Market risk Limit Highest Average Reference
portfolio
periodHolding period
Observation period Leverage*
Franklin
Balanced Fund
99th Percentile
20-Day 01 July 2020 to 30 June
2021
Franklin
Fund
99th Percentile
20-Day 01 July 2020 to 30 June
2021
Franklin
Fund
99th Percentile
20-Day 01 July 2020 to 30 June
2021
Franklin
Fund
99th Percentile
20-Day 01 July 2020 to 30 June
2021
Franklin
Bond Fund
99th Percentile
20-Day 01 July 2020 to 30 June
2021
Franklin 99th Percentile
20-Day2020 to 30
June 2021**
Franklin 99th Percentile
20-Day 01 July 2020 to 30 June
2021
Franklin K2
Strategies Fund
99th Percentile
20-Day 01 July 2020 to 30 June
2021
Franklin K2 99th Percentile
20-Day 01 July 2020
2021**
Franklin Strategic
Treasury ex-
99th Percentile
20-Day 01 July 2020 to 30 June
2021
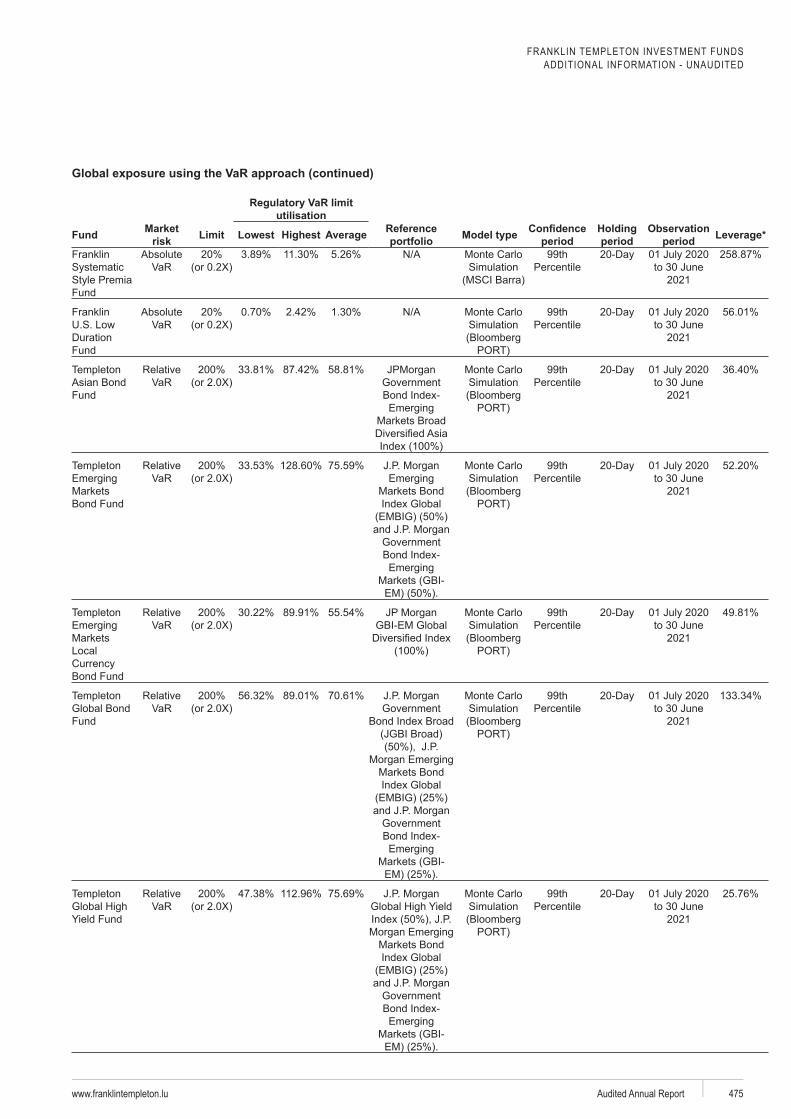
FRANKLIN TEMPLETON INVESTMENT FUNDSADDITIONAL INFORMATION - UNAUDITED
www.franklintempleton.lu Audited Annual Report 475
Global exposure using the VaR approach (continued)
utilisation Fund Market
risk Limit Highest Average Reference portfolio
period
Holding period
Observation period Leverage*
Franklin
Style Fund
99th Percentile
20-Day 01 July 2020 to 30 June
2021
Franklin
Duration Fund
99th Percentile
20-Day 01 July 2020 to 30 June
2021
Fund
99th Percentile
20-Day 01 July 2020 to 30 June
2021
Bond Fund
99th Percentile
20-Day 01 July 2020 to 30 June
2021
Bond Fund
99th Percentile
20-Day 01 July 2020 to 30 June
2021
Fund
99th Percentile
20-Day 01 July 2020 to 30 June
2021
99th Percentile
20-Day 01 July 2020 to 30 June
2021
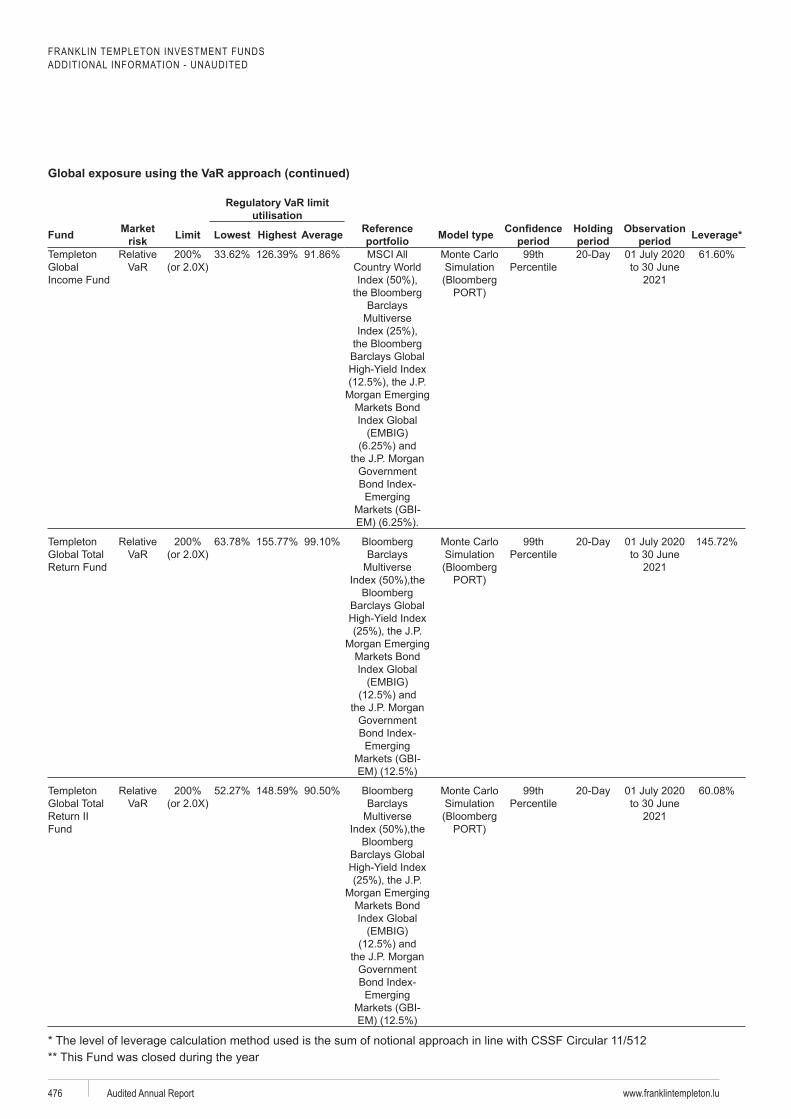
FRANKLIN TEMPLETON INVESTMENT FUNDSADDITIONAL INFORMATION - UNAUDITED
www.franklintempleton.luAudited Annual Report476
Global exposure using the VaR approach (continued) utilisation Fund Market
risk Limit Highest Average Reference portfolio
period
Holding period
Observation period Leverage*
Barclays
99th Percentile
20-Day 01 July 2020 to 30 June
2021
Barclays
99th Percentile
20-Day 01 July 2020 to 30 June
2021
Fund
Barclays
99th Percentile
20-Day 01 July 2020 to 30 June
2021
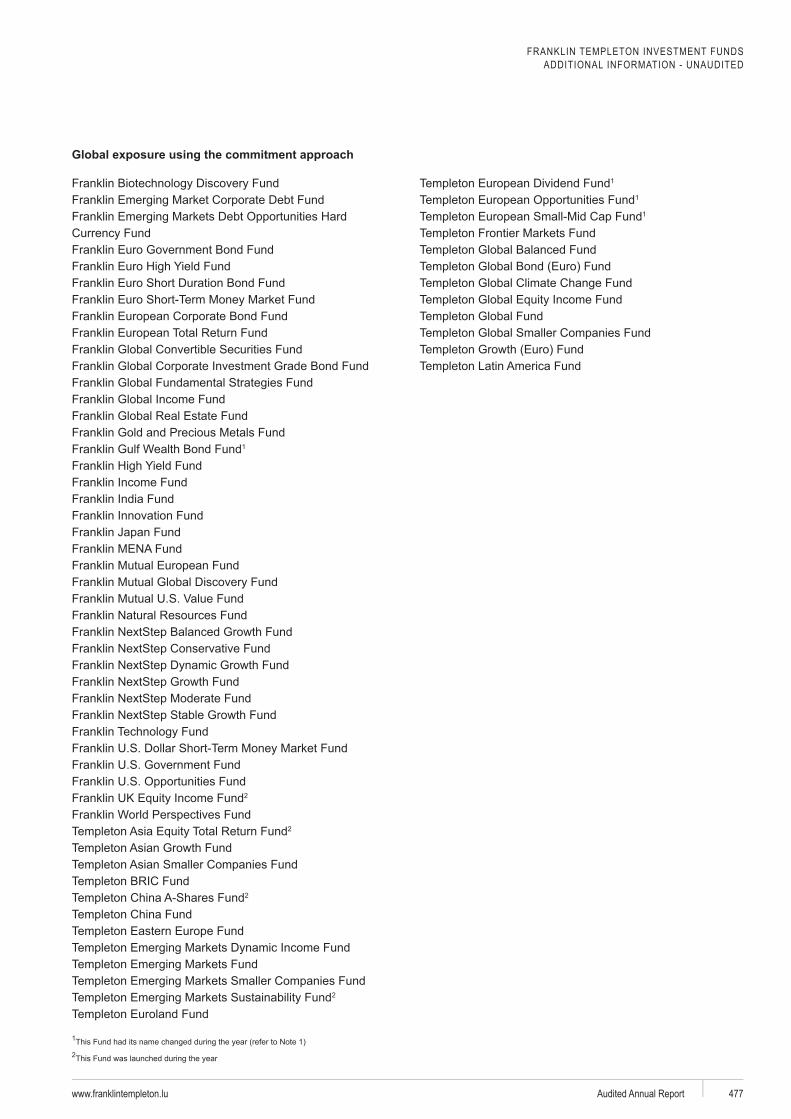
FRANKLIN TEMPLETON INVESTMENT FUNDSADDITIONAL INFORMATION - UNAUDITED
www.franklintempleton.lu Audited Annual Report 477
Global exposure using the commitment approach
Franklin Biotechnology Discovery Fund
Franklin Euro Short Duration Bond Fund
Franklin Gulf Wealth Bond Fund1
Franklin Technology Fund
2
2
2
2
1
1
1
1
2
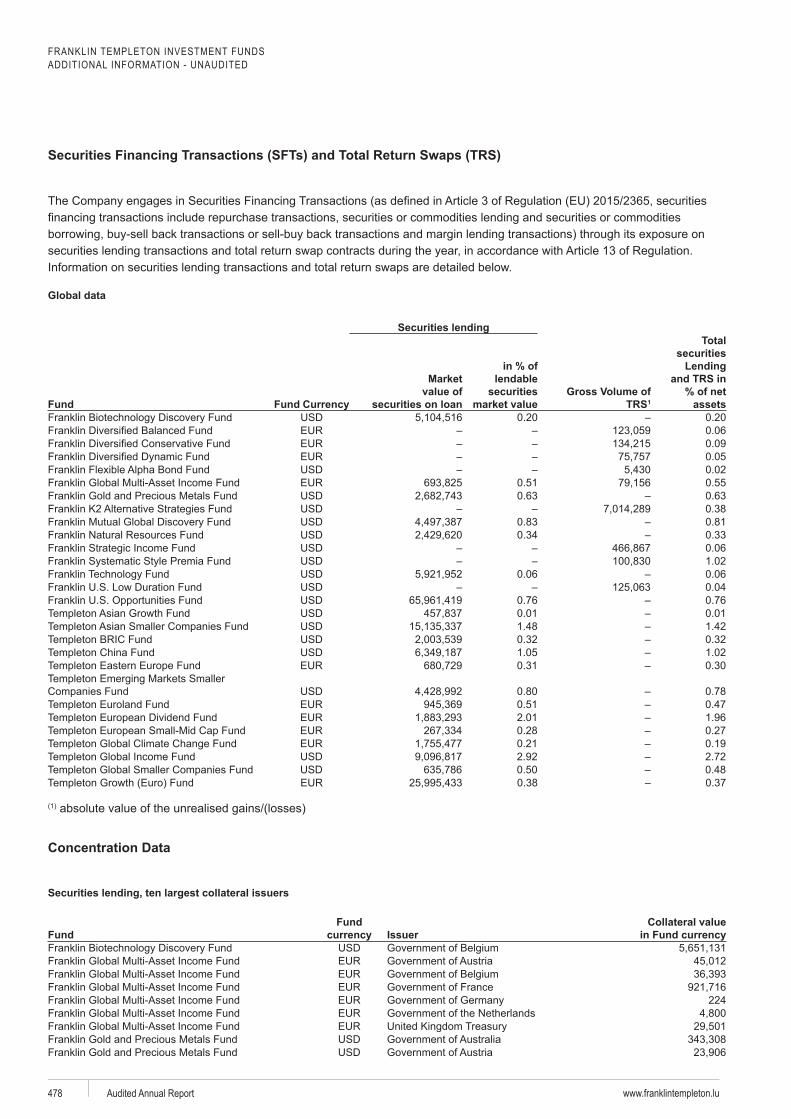
FRANKLIN TEMPLETON INVESTMENT FUNDSADDITIONAL INFORMATION - UNAUDITED
www.franklintempleton.luAudited Annual Report478
Global data
Securities lending
Fund
Market value of
securities on loan
in % of lendable
securities market value
Gross Volume of TRS1
Total securities
Lending and TRS in
% of net assets
Franklin Biotechnology Discovery Fund 0.20 0.200.060.090.050.02
0.51 0.550.63 0.63
0.380.83 0.810.34 0.33
0.06 Fund 1.02
Franklin Technology Fund 0.06 0.060.04
0.76 0.760.01 0.011.48 1.420.32 0.321.05 1.020.31 0.30
0.80 0.780.51 0.472.01 1.960.28 0.270.21 0.192.92 2.720.50 0.480.38 0.37
Concentration Data
Securities lending, ten largest collateral issuers
FundFund
IssuerCollateral value
Franklin Biotechnology Discovery Fund
224
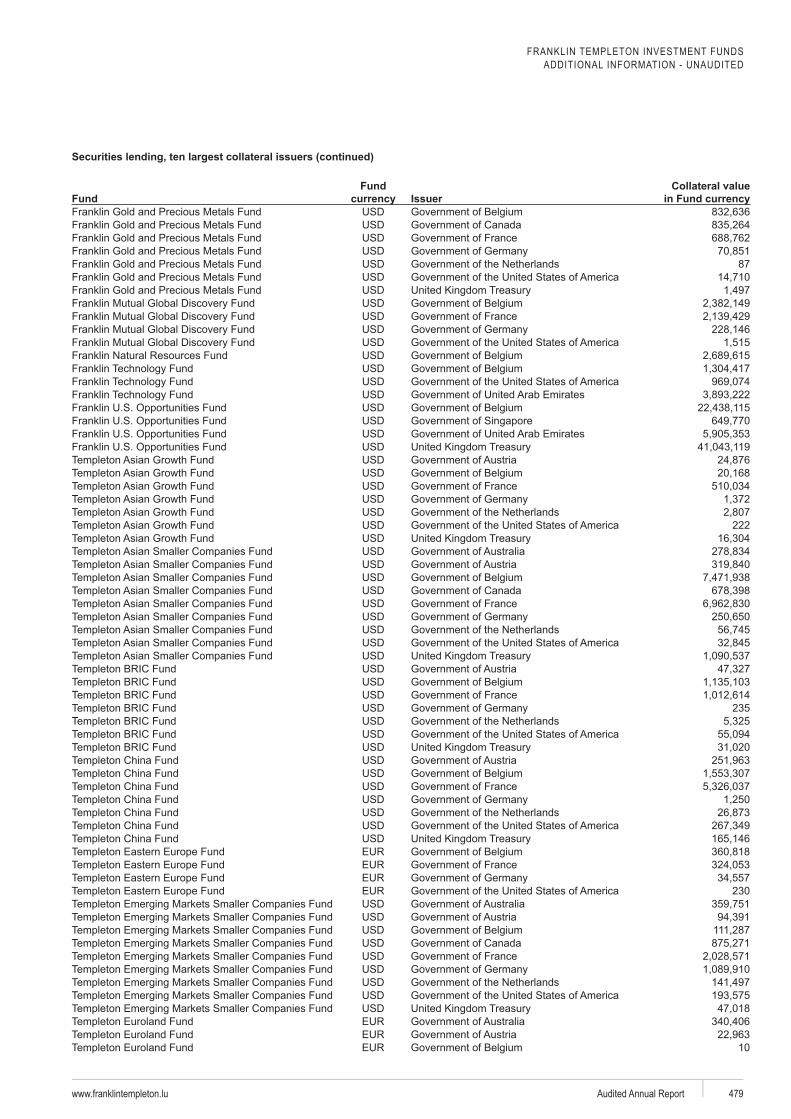
FRANKLIN TEMPLETON INVESTMENT FUNDSADDITIONAL INFORMATION - UNAUDITED
www.franklintempleton.lu Audited Annual Report 479
Securities lending, ten largest collateral issuers (continued)
FundFund
IssuerCollateral value
87
Franklin Technology FundFranklin Technology FundFranklin Technology Fund
222
235
230
10
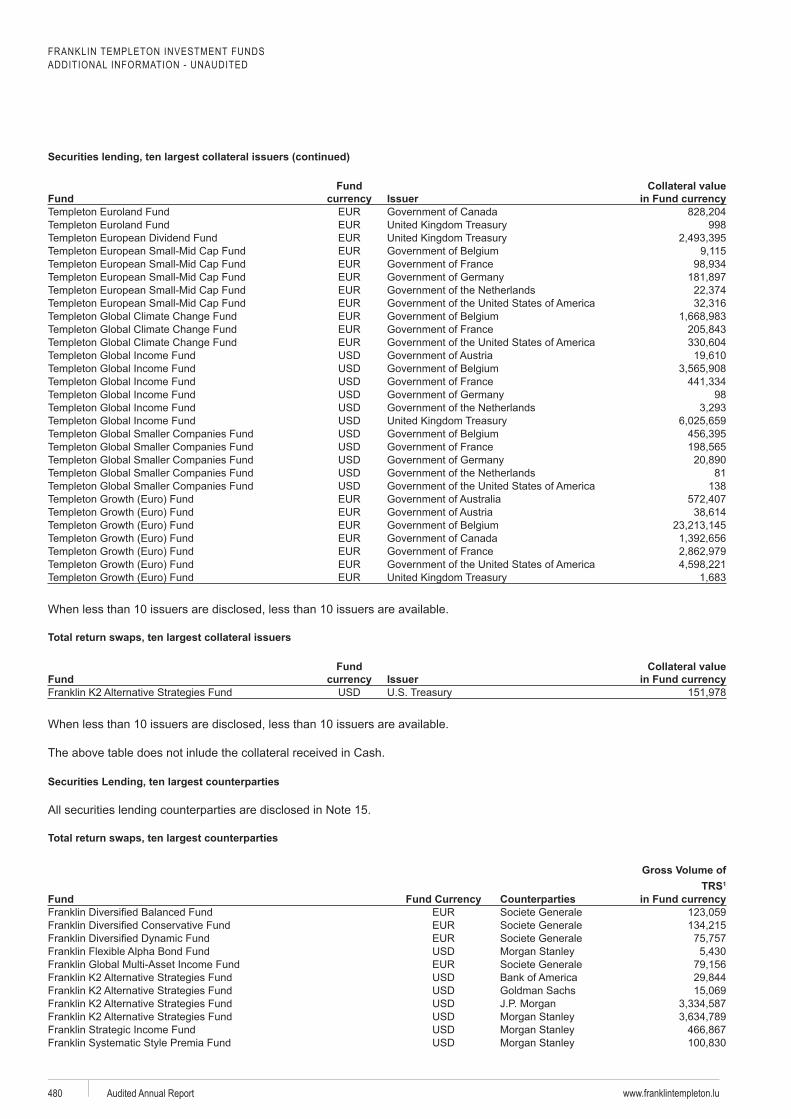
FRANKLIN TEMPLETON INVESTMENT FUNDSADDITIONAL INFORMATION - UNAUDITED
www.franklintempleton.luAudited Annual Report480
Securities lending, ten largest collateral issuers (continued)
FundFund
IssuerCollateral value
998
98
81138
, ten largest collateral issuers
FundFund
IssuerCollateral value
Securities Lending, ten largest counterparties
Gross Volume ofTRS1
Fund CounterpartiesSociete Generale Societe Generale Societe Generale
Societe Generale
Fund
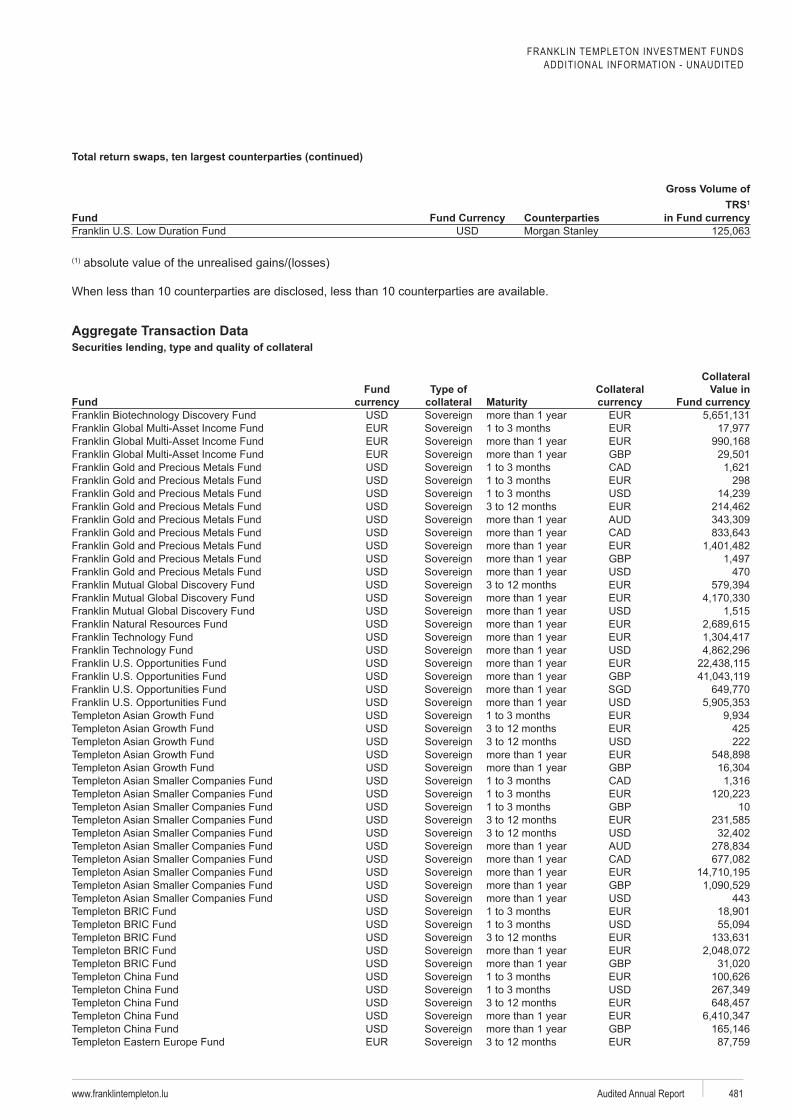
FRANKLIN TEMPLETON INVESTMENT FUNDSADDITIONAL INFORMATION - UNAUDITED
www.franklintempleton.lu Audited Annual Report 481
Gross Volume of TRS1
Fund Counterparties
Aggregate Transaction Data
FundFund
collateralCollateral
Collateral Value in
Franklin Biotechnology Discovery Fund SovereignSovereignSovereignSovereign GBPSovereignSovereign 298SovereignSovereignSovereignSovereignSovereignSovereign GBPSovereign 470SovereignSovereignSovereignSovereign
Franklin Technology Fund SovereignFranklin Technology Fund Sovereign
SovereignSovereign GBPSovereign SGDSovereignSovereignSovereign 425Sovereign 222SovereignSovereign GBPSovereignSovereignSovereign GBP 10SovereignSovereignSovereignSovereignSovereignSovereign GBPSovereign 443SovereignSovereignSovereignSovereignSovereign GBPSovereignSovereignSovereignSovereignSovereign GBPSovereign
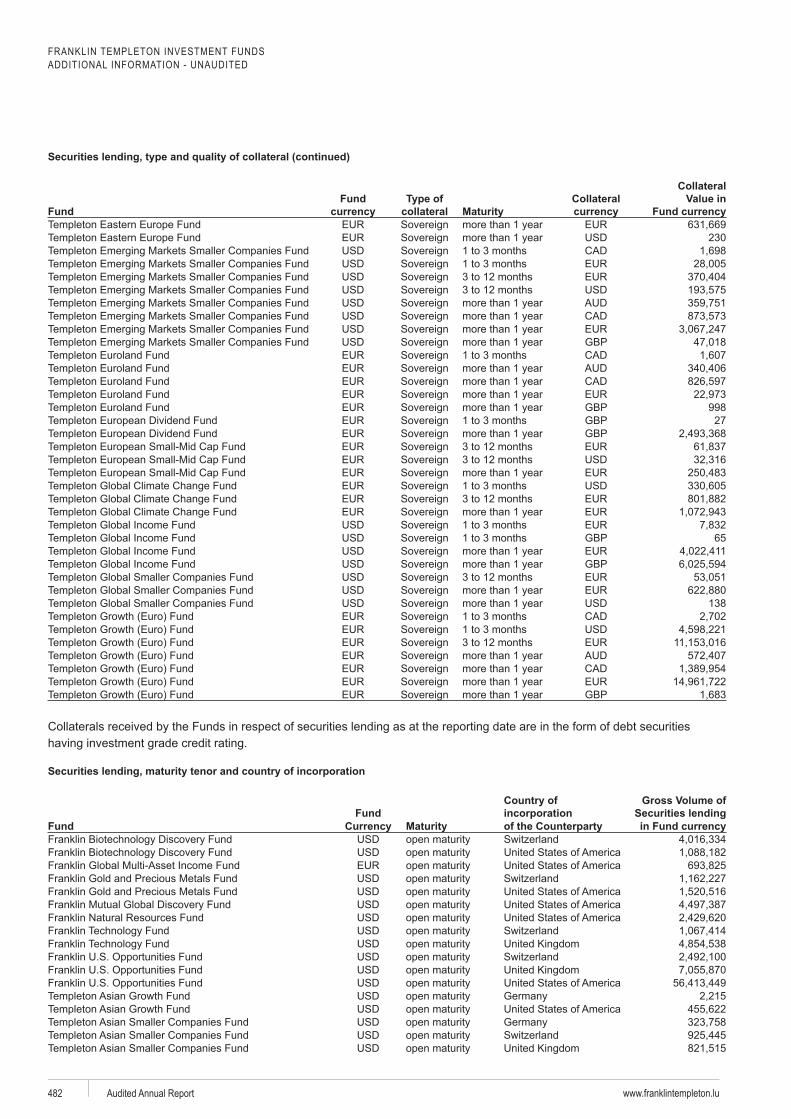
FRANKLIN TEMPLETON INVESTMENT FUNDSADDITIONAL INFORMATION - UNAUDITED
www.franklintempleton.luAudited Annual Report482
FundFund
collateralCollateral
Collateral Value in
SovereignSovereign 230SovereignSovereignSovereignSovereignSovereignSovereignSovereignSovereign GBPSovereignSovereignSovereignSovereignSovereign GBP 998Sovereign GBP 27Sovereign GBPSovereignSovereignSovereignSovereignSovereignSovereignSovereignSovereign GBP 65SovereignSovereign GBPSovereignSovereignSovereign 138SovereignSovereignSovereignSovereignSovereignSovereignSovereign GBP
Fund
incorporationGross Volume of
Securities lendingFundFranklin Biotechnology Discovery FundFranklin Biotechnology Discovery Fund
Franklin Technology FundFranklin Technology Fund
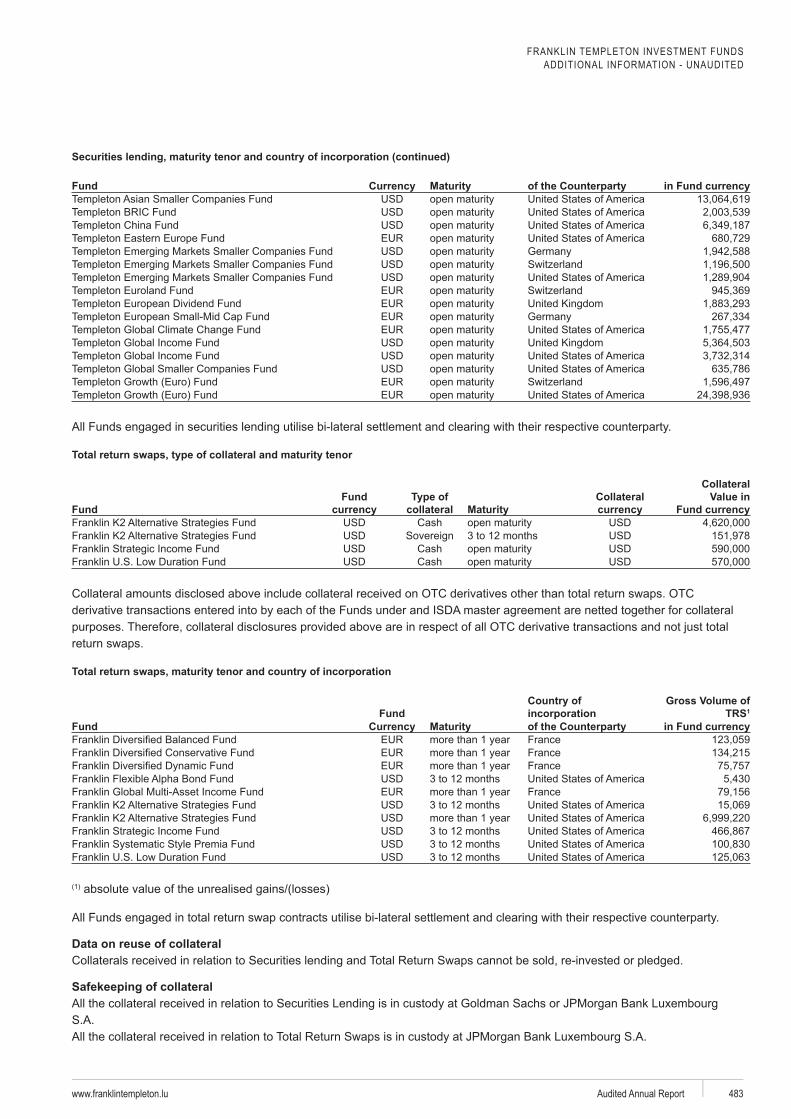
FRANKLIN TEMPLETON INVESTMENT FUNDSADDITIONAL INFORMATION - UNAUDITED
www.franklintempleton.lu Audited Annual Report 483
Fund
FundFund
collateralCollateral
Collateral Value in
Sovereign
Fund
incorporationGross Volume of
TRS1
FundFranceFranceFrance
France
Fund
Data on reuse of collateral
Safekeeping of collateral
FRANKLIN TEMPLETON INVESTMENT FUNDSADDITIONAL INFORMATION - UNAUDITED
www.franklintempleton.luAudited Annual Report484
Data on return
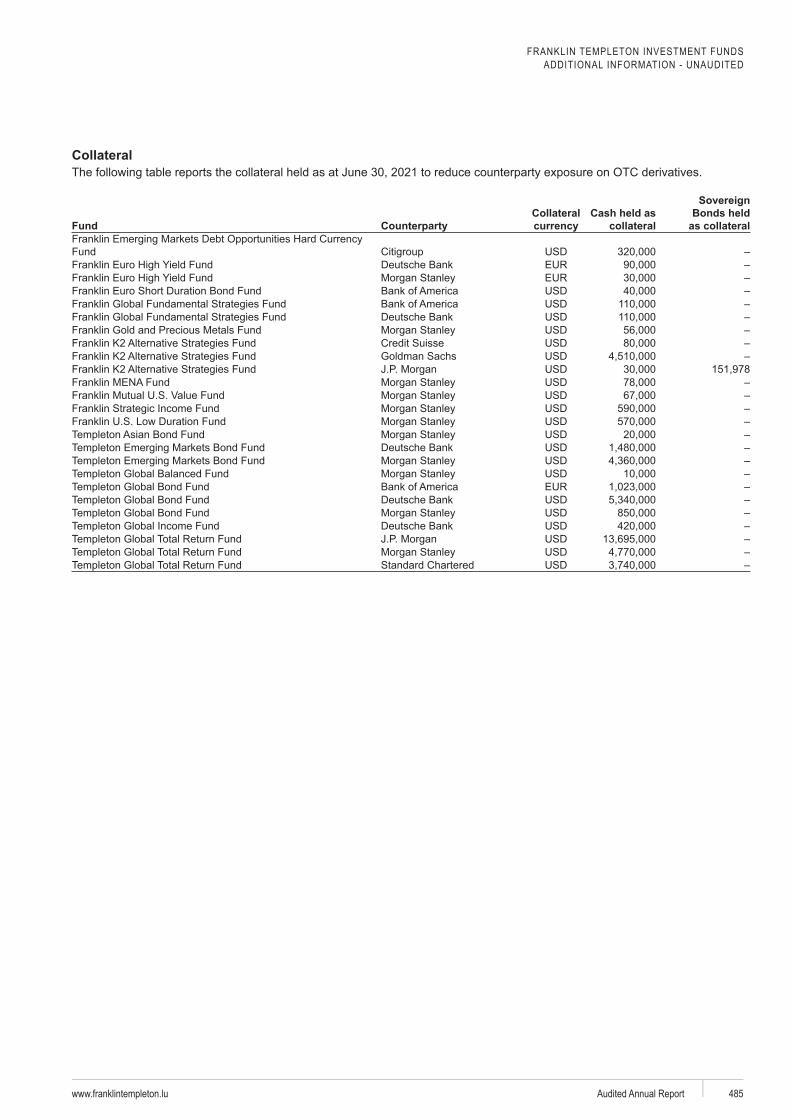
FRANKLIN TEMPLETON INVESTMENT FUNDSADDITIONAL INFORMATION - UNAUDITED
www.franklintempleton.lu Audited Annual Report 485
Collateral
FundCollateral Cash held as
collateral
Sovereign Bonds held
as collateral
FundDeutsche Bank
Franklin Euro Short Duration Bond Fund
Deutsche Bank
Deutsche Bank
Deutsche Bank
Deutsche Bank
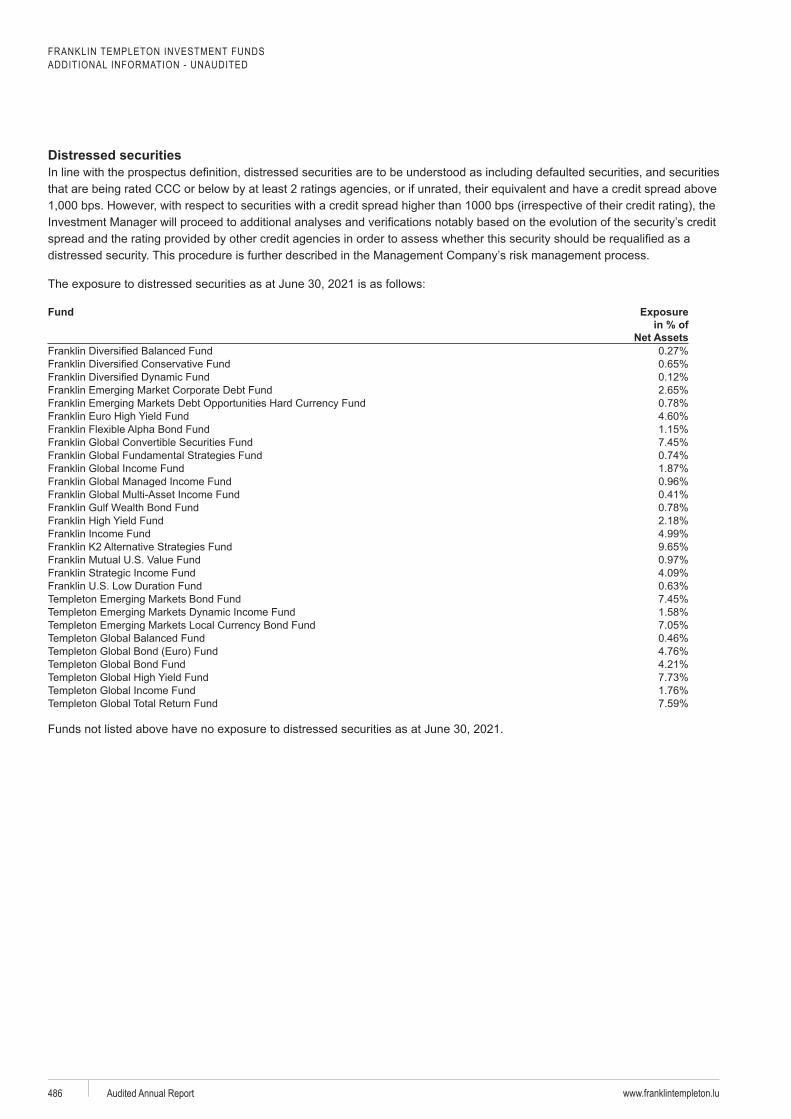
FRANKLIN TEMPLETON INVESTMENT FUNDSADDITIONAL INFORMATION - UNAUDITED
www.franklintempleton.luAudited Annual Report486
Distressed securities
Fund Exposure in % of
Net Assets
Franklin Gulf Wealth Bond Fund
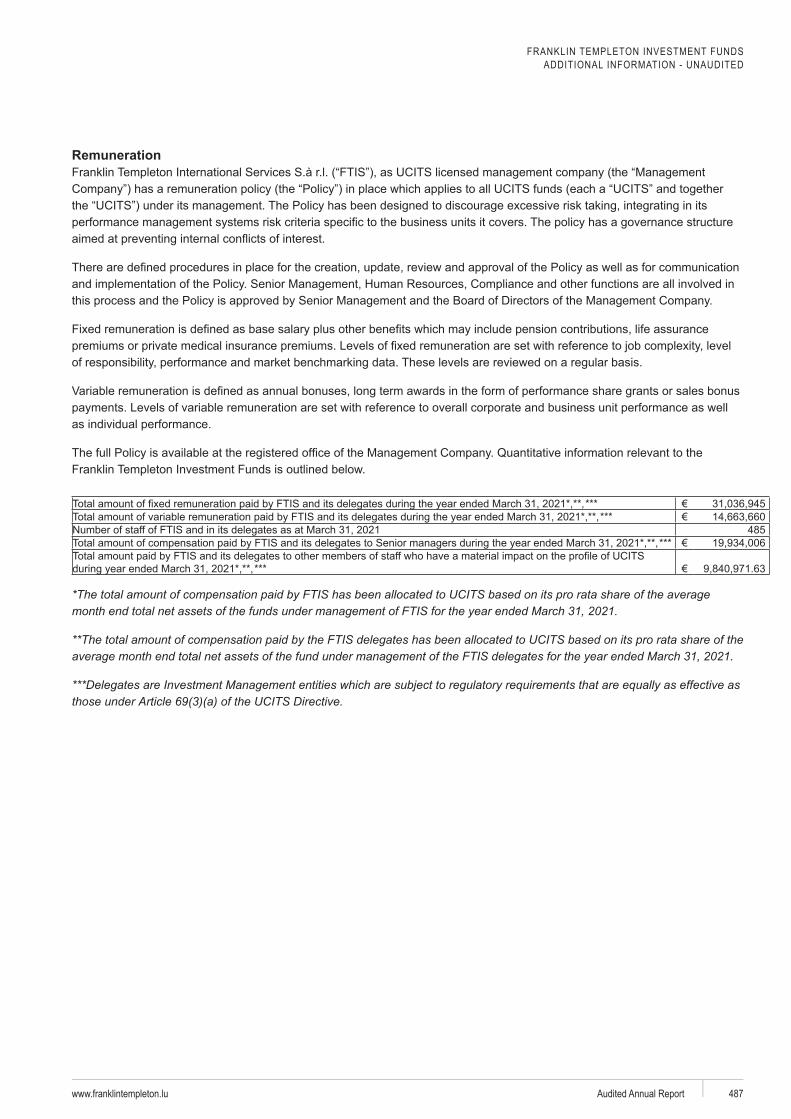
FRANKLIN TEMPLETON INVESTMENT FUNDSADDITIONAL INFORMATION - UNAUDITED
www.franklintempleton.lu Audited Annual Report 487
Remuneration
*** €*** €
485 *** €
*** €
*The total amount of compensation paid by FTIS has been allocated to UCITS based on its pro rata share of the average month end total net assets of the funds under management of FTIS for the year ended March 31, 2021.
**The total amount of compensation paid by the FTIS delegates has been allocated to UCITS based on its pro rata share of the average month end total net assets of the fund under management of the FTIS delegates for the year ended March 31, 2021.
***Delegates are Investment Management entities which are subject to regulatory requirements that are equally as effective as those under Article 69(3)(a) of the UCITS Directive.
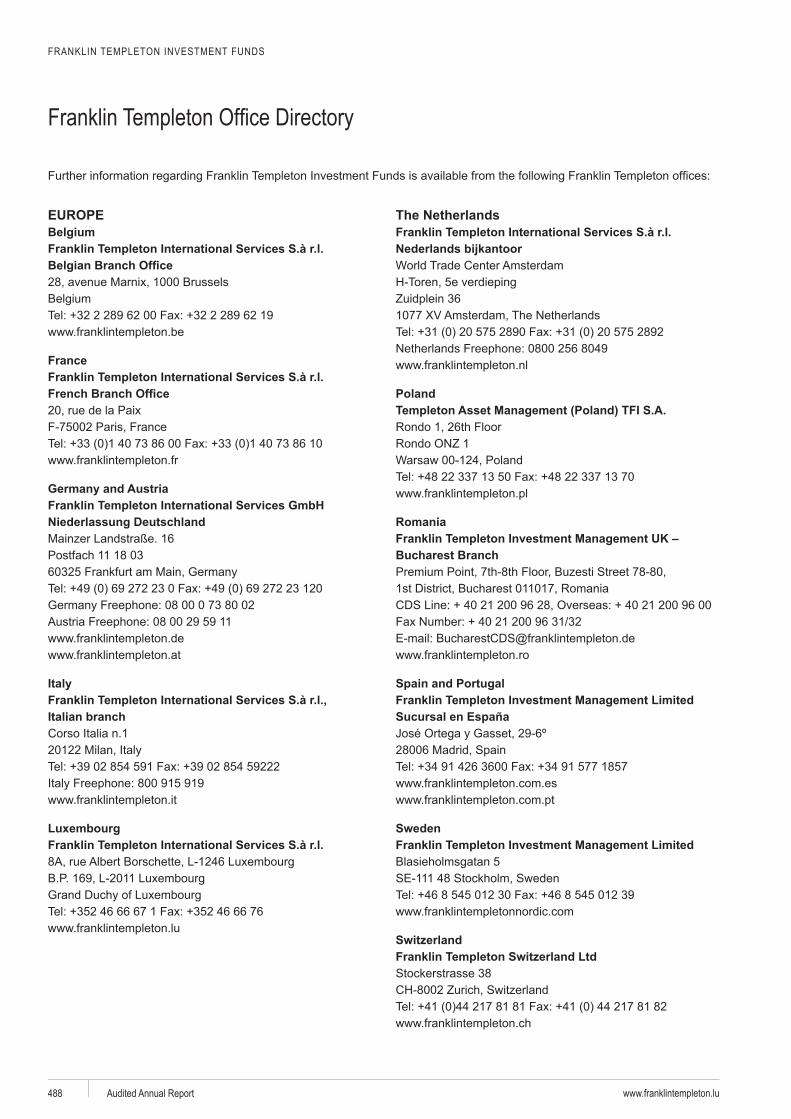
FRANKLIN TEMPLETON INVESTMENT FUNDS
www.franklintempleton.luAudited Annual Report488
EUROPEBelgium
France
Franklin Templeton International Services GmbH Niederlassung Deutschland
Postfach 11 18 03
Italian branch
Luxembourg
The Netherlands
Nederlands bijkantoor
Poland
Romania
Bucharest Branch
Spain and PortugalFranklin Templeton Investment Management LimitedSucursal en España
Franklin Templeton Investment Management Limited
Stockerstrasse 38
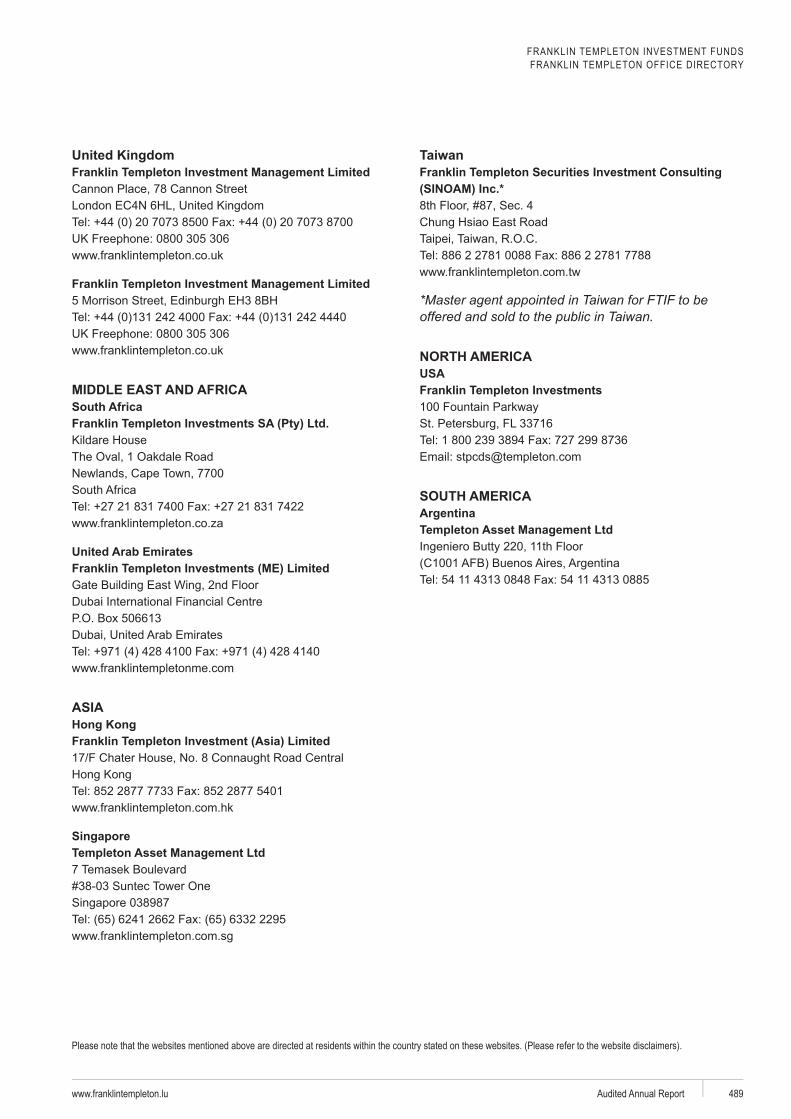
FRANKLIN TEMPLETON INVESTMENT FUNDSFRANKLIN TEMPLETON OFFICE DIRECTORY
www.franklintempleton.lu Audited Annual Report 489
Franklin Templeton Investment Management Limited
Franklin Templeton Investment Management Limited
MIDDLE EAST AND AFRICASouth Africa
United Arab EmiratesFranklin Templeton Investments (ME) Limited
ASIA
Franklin Templeton Investment (Asia) Limited
SingaporeTempleton Asset Management Ltd
Franklin Templeton Securities Investment Consulting
*Master agent appointed in Taiwan for FTIF to be offered and sold to the public in Taiwan.
NORTH AMERICAUSAFranklin Templeton Investments
SOUTH AMERICAArgentinaTempleton Asset Management Ltd
Please note that the websites mentioned above are directed at residents within the country stated on these websites. (Please refer to the website disclaimers).

FTIF AR RGBR 06/21
8A, rue Albert Borschette, L-1246 Luxembourg
Tel: +352 (46) 66-67-1
Related Documents