INTERIM REPORT FRANKLIN LIBERTYSHARES ICAV December 31, 2021 Franklin FTSE Brazil UCITS ETF Franklin LibertyQ Emerging Markets UCITS ETF Franklin FTSE China UCITS ETF Franklin LibertyQ European Dividend UCITS ETF Franklin FTSE India UCITS ETF Franklin LibertyQ European Equity UCITS ETF Franklin FTSE Korea UCITS ETF Franklin LibertyQ Global Dividend UCITS ETF Franklin Liberty Euro Green Bond UCITS ETF Franklin LibertyQ Global Equity SRI UCITS ETF Franklin Liberty Euro Short Maturity UCITS ETF Franklin LibertyQ U.S. Equity UCITS ETF Franklin Liberty USD Investment Grade Corporate Bond UCITS ETF Franklin STOXX Europe 600 Paris Aligned Climate UCITS ETF Franklin LibertyQ AC Asia ex Japan UCITS ETF Franklin S&P 500 Paris Aligned Climate UCITS ETF

Welcome message from author
This document is posted to help you gain knowledge. Please leave a comment to let me know what you think about it! Share it to your friends and learn new things together.
Transcript

INTERIM REPORT
FRANKLIN LIBERTYSHARES ICAV
December 31, 2021
Franklin FTSE Brazil UCITS ETF Franklin LibertyQ Emerging Markets UCITS ETF
Franklin FTSE China UCITS ETF Franklin LibertyQ European Dividend UCITS ETF
Franklin FTSE India UCITS ETF Franklin LibertyQ European Equity UCITS ETF
Franklin FTSE Korea UCITS ETF Franklin LibertyQ Global Dividend UCITS ETF
Franklin Liberty Euro Green Bond UCITS ETF Franklin LibertyQ Global Equity SRI UCITS ETF
Franklin Liberty Euro Short Maturity UCITS ETF Franklin LibertyQ U.S. Equity UCITS ETF
Franklin Liberty USD Investment Grade Corporate
Bond UCITS ETF
Franklin STOXX Europe 600 Paris Aligned Climate
UCITS ETF
Franklin LibertyQ AC Asia ex Japan UCITS ETF Franklin S&P 500 Paris Aligned Climate UCITS ETF
CONTENTS
Franklin LibertyShares ICAV Interim Report 1
Page
Directory ............................................................................................................................................................ 2
General Information .......................................................................................................................................... 4
Investment Manager’s Report ........................................................................................................................... 8
Condensed Statement of Financial Position ...................................................................................................... 30
Condensed Statement of Comprehensive Income ............................................................................................ 36
Condensed Statement of Changes in Net Assets Attributable to Holders of Redeemable Participating Shares ............................................................................................................................................................... 42
Notes to the Condensed Financial Statements ................................................................................................. 48
Schedule of Investments
Franklin FTSE Brazil UCITS ETF ................................................................................................................... 74
Franklin FTSE China UCITS ETF ................................................................................................................... 77
Franklin FTSE India UCITS ETF .................................................................................................................... 94
Franklin FTSE Korea UCITS ETF .................................................................................................................. 98
Franklin Liberty Euro Green Bond UCITS ETF ............................................................................................... 102
Franklin Liberty Euro Short Maturity UCITS ETF ............................................................................................ 106
Franklin Liberty USD Investment Grade Corporate Bond UCITS ETF ........................................................... 111
Franklin LibertyQ AC Asia ex Japan UCITS ETF ........................................................................................... 114
Franklin LibertyQ Emerging Markets UCITS ETF ........................................................................................... 121
Franklin LibertyQ European Dividend UCITS ETF ......................................................................................... 129
Franklin LibertyQ European Equity UCITS ETF ............................................................................................. 132
Franklin LibertyQ Global Dividend UCITS ETF .............................................................................................. 135
Franklin LibertyQ Global Equity SRI UCITS ETF ........................................................................................... 139
Franklin LibertyQ U.S. Equity UCITS ETF ...................................................................................................... 146
Franklin STOXX Europe 600 Paris Aligned Climate UCITS ETF ................................................................... 152
Franklin S&P 500 Paris Aligned Climate UCITS ETF ..................................................................................... 163
Schedule of Portfolio Changes .......................................................................................................................... 170
DIRECTORY
2 Interim Report Franklin LibertyShares ICAV
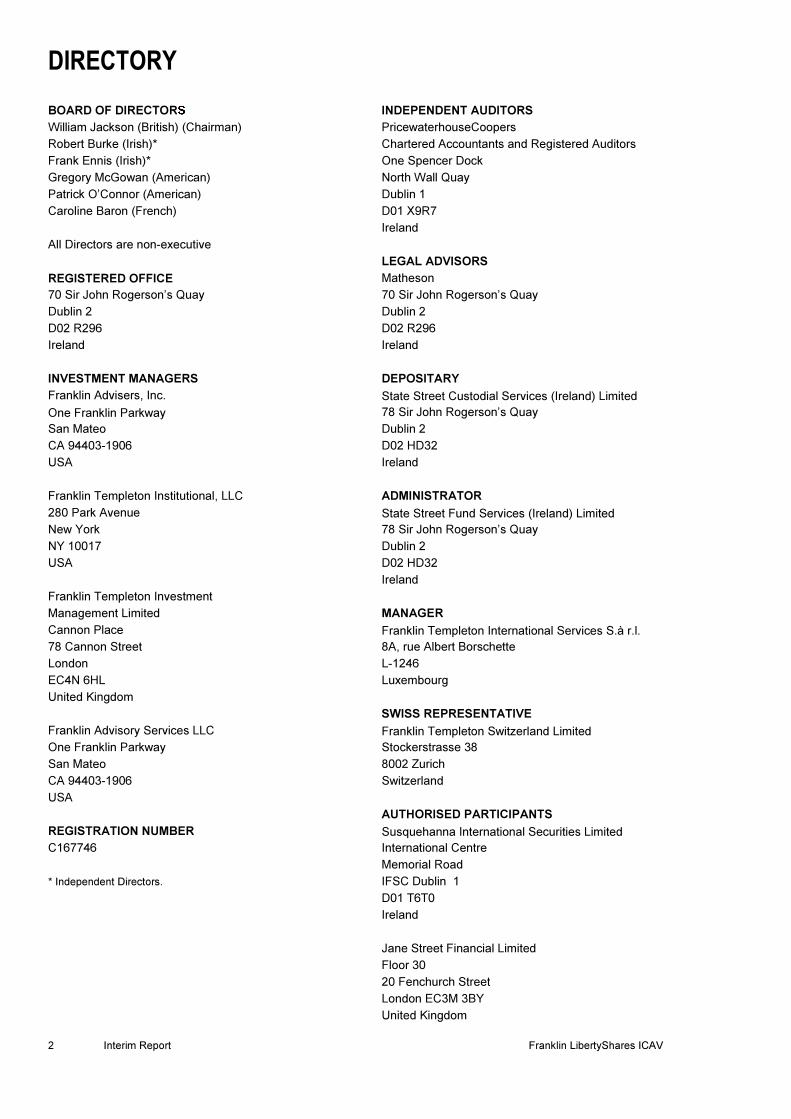
BOARD OF DIRECTORS INDEPENDENT AUDITORS
William Jackson (British) (Chairman) PricewaterhouseCoopers
Robert Burke (Irish)* Chartered Accountants and Registered Auditors
Frank Ennis (Irish)* One Spencer Dock
Gregory McGowan (American) North Wall Quay
Patrick O’Connor (American) Dublin 1
Caroline Baron (French) D01 X9R7
Ireland
All Directors are non-executive
LEGAL ADVISORS
REGISTERED OFFICE Matheson
70 Sir John Rogerson’s Quay 70 Sir John Rogerson’s Quay
Dublin 2 Dublin 2
D02 R296 D02 R296
Ireland Ireland
INVESTMENT MANAGERS DEPOSITARY
Franklin Advisers, Inc. State Street Custodial Services (Ireland) Limited
One Franklin Parkway 78 Sir John Rogerson’s Quay
San Mateo Dublin 2
CA 94403-1906 D02 HD32
USA Ireland
Franklin Templeton Institutional, LLC ADMINISTRATOR
280 Park Avenue State Street Fund Services (Ireland) Limited
New York 78 Sir John Rogerson’s Quay
NY 10017 Dublin 2
USA D02 HD32
Ireland
Franklin Templeton Investment
Management Limited MANAGER
Cannon Place Franklin Templeton International Services S.à r.l.
78 Cannon Street 8A, rue Albert Borschette
London L-1246
EC4N 6HL Luxembourg
United Kingdom
SWISS REPRESENTATIVE
Franklin Advisory Services LLC Franklin Templeton Switzerland Limited
One Franklin Parkway Stockerstrasse 38
San Mateo 8002 Zurich
CA 94403-1906 Switzerland
USA
AUTHORISED PARTICIPANTS
REGISTRATION NUMBER Susquehanna International Securities Limited
C167746 International Centre
Memorial Road
* Independent Directors. IFSC Dublin 1
D01 T6T0
Ireland
Jane Street Financial Limited
Floor 30
20 Fenchurch Street
London EC3M 3BY
United Kingdom
DIRECTORY (continued)
Franklin LibertyShares ICAV Interim Report 3
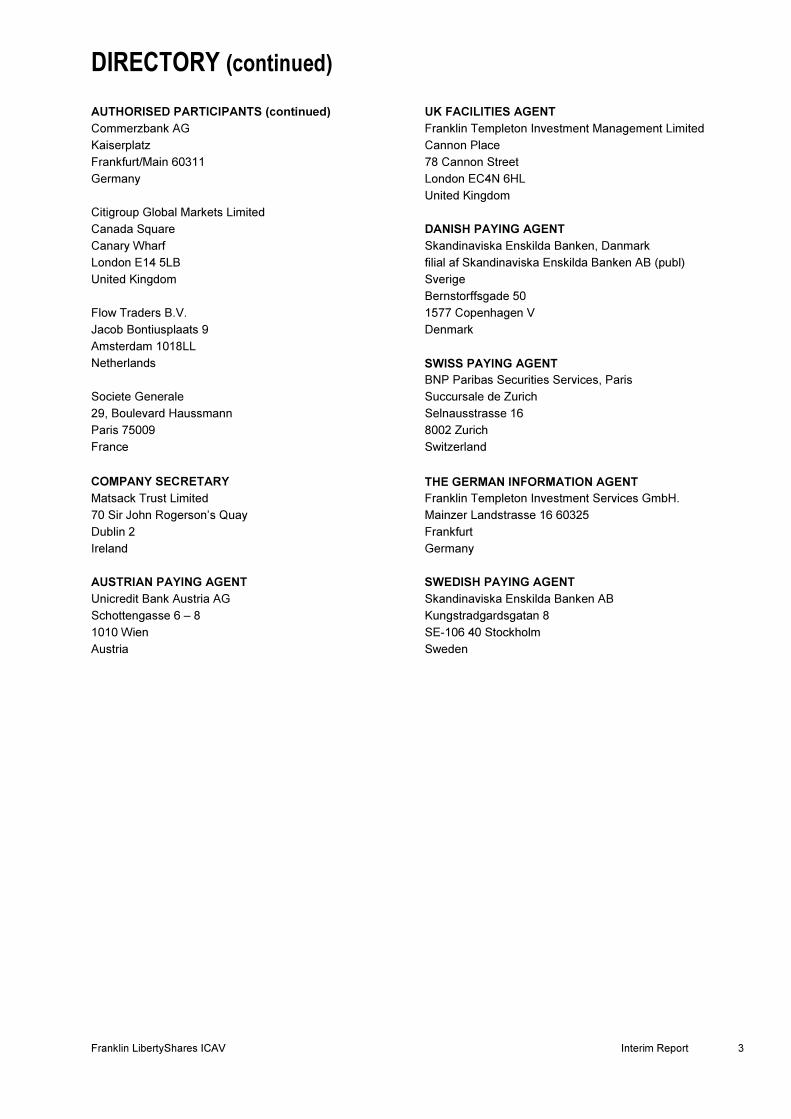
AUTHORISED PARTICIPANTS (continued) UK FACILITIES AGENT
Commerzbank AG Franklin Templeton Investment Management Limited
Kaiserplatz Cannon Place
Frankfurt/Main 60311 78 Cannon Street
Germany London EC4N 6HL
United Kingdom
Citigroup Global Markets Limited
Canada Square DANISH PAYING AGENT
Canary Wharf Skandinaviska Enskilda Banken, Danmark
London E14 5LB filial af Skandinaviska Enskilda Banken AB (publ)
United Kingdom Sverige
Bernstorffsgade 50
Flow Traders B.V. 1577 Copenhagen V
Jacob Bontiusplaats 9 Denmark
Amsterdam 1018LL
Netherlands SWISS PAYING AGENT
BNP Paribas Securities Services, Paris
Societe Generale Succursale de Zurich
29, Boulevard Haussmann Selnausstrasse 16
Paris 75009 8002 Zurich
France Switzerland
COMPANY SECRETARY THE GERMAN INFORMATION AGENT
Matsack Trust Limited Franklin Templeton Investment Services GmbH.
70 Sir John Rogerson’s Quay Mainzer Landstrasse 16 60325
Dublin 2 Frankfurt
Ireland Germany
AUSTRIAN PAYING AGENT SWEDISH PAYING AGENT
Unicredit Bank Austria AG Skandinaviska Enskilda Banken AB
Schottengasse 6 – 8 Kungstradgardsgatan 8
1010 Wien SE-106 40 Stockholm
Austria Sweden

GENERAL INFORMATION
4 Interim Report Franklin LibertyShares ICAV
Franklin LibertyShares ICAV (the “Fund” or the “ICAV”) is an Irish collective asset-management vehicle constituted as an
umbrella fund with segregated liability between Sub-Funds with registration number C167746. The ICAV was registered on
11 July 2017. The ICAV has been authorised by the Central Bank of Ireland (the “Central Bank”) as an Undertaking for
Collective Investment in Transferable Securities (“UCITS”) pursuant to the provisions of the European Communities
(Undertakings for Collective Investment in Transferable Securities) Regulations, 2011 (as amended) and the Central Bank
(Supervision and Enforcement) Act 2013 (section 48(1)) (Undertakings for Collective Investment in Transferable Securities)
Regulations 2019 (as amended) (together the “UCITS Regulations”). All capitalised terms used but not defined herein shall
have the meaning ascribed thereto in the ICAV’s Prospectus dated 24 August 2021 (the “Prospectus”).
The ICAV has been registered in accordance with the ICAV Act for the purpose of investing in transferable securities in
accordance with the UCITS Regulations.
The ICAV has been structured as an umbrella fund consisting of different Sub-Funds (please see Sub-Funds and share
classes below), each comprising of one class of shares. The Directors may from time to time, with the prior approval of the
Central Bank, create different series of shares representing separate portfolios of assets, each such series comprising a
Sub-Fund. Each Sub-Fund will bear its own liabilities and, under Irish law, none of the ICAV, the service providers
appointed to the ICAV, the Directors, any receiver, examiner nor liquidator, nor any other person will have access to the
assets of a Sub-Fund in satisfaction of a liability of any other Sub-Fund.
The ICAV has appointed Franklin Templeton International Services S.a.r.l. as Management Company (the "Management
Company").
The Management Company of the ICAV has appointed Franklin Advisory Services LLC and Franklin Templeton Investment
Management Limited as Investment Manager for all Index Tracking Sub-Funds (as defined below).
The Management Company of the ICAV has appointed Franklin Templeton Investment Management Limited as Investment
Manager in relation to Franklin Liberty Euro Green Bond UCITS ETF.
The Management Company of the ICAV has appointed Franklin Advisers Inc and Franklin Templeton Investment
Management Limited as Investment Manager in relation to Franklin Liberty Euro Short Maturity UCITS ETF.
The Management Company of the ICAV has delegated investment management to Franklin Advisers Inc which in turn has
delegated to Franklin Templeton Institutional LLC to act as Sub-Investment Manager in relation to Franklin Liberty USD
Investment Grade Corporate Bond UCITS ETF.
The Management Company has also appointed State Street Fund Services (Ireland) Limited as Administrator to the Fund.
The portfolio of assets maintained for each series of shares and comprising a Sub-Fund will be invested in accordance with
the investment objectives and policies applicable to such Sub-Fund as specified in the relevant Supplement. Shares may
be divided into different classes to accommodate, amongst other things, different dividend policies, charges, fee
arrangements (including different total expense ratios), currencies, or to provide for foreign exchange hedging in
accordance with the policies and requirements of the Central Bank from time to time.
Generally only an Authorised Participant may engage in creation or redemption transactions directly with the Sub-Fund in
the primary market (to be distinguished from the secondary market that Shares may trade in). The ETF Shares are listed
for secondary trading on each Listing Stock Exchange and individual ETF Shares may be purchased and sold by investors
on Listing Stock Exchanges through a broker-dealer. The Sub-Fund issues or redeems Creation Units to Authorised
Participants. Shares in the Sub-Funds may be created or redeemed on any Dealing Day at the Net Asset Value per Share
as of the relevant Dealing Day, subject to an appropriate provision for duties and charges. The Sub-Fund will generally
issue or redeem Creation Units in return for a basket of securities (and/or an amount of cash) that the Sub-Fund specifies
each day. All other investors may purchase ETF Shares through the secondary market which includes the Authorised
Participants, through a stock exchange listing or over the counter. An investor buying or selling ETF Shares in the
secondary market will pay the secondary market price for ETF Shares (broker costs and spreads may also apply) which
may deviate, to varying degrees, from the Net Asset Value per Share. Further information on purchases and sales on the
primary and secondary market is included in the Prospectus.

GENERAL INFORMATION (continued)
Franklin LibertyShares ICAV Interim Report 5
Sub-Funds and Share Classes
There are sixteen Sub-Funds in operation as at 31 December 2021. Thirteen of these Sub-Funds seek to track an Index
(the “Index Tracking Sub-Funds”) and three of the Sub-Funds are actively managed by the Investment Manager to seek to
achieve a specific investment objective (the “Actively Managed Sub-Funds”).
The following table details the Sub-Funds of the ICAV that are Index Tracking Sub-Funds.
Sub-Fund
Launch
date
Functional
Currency
Share
Class
Strategy
Franklin FTSE Brazil UCITS ETF 4 Jun 2019 USD USD Accumulating Shares Replicating
Franklin FTSE China UCITS ETF 4 Jun 2019 USD USD Accumulating Shares Optimised
Franklin FTSE India UCITS ETF 25 Jun 2019 USD USD Accumulating Shares Replicating
Franklin FTSE Korea UCITS ETF 4 Jun 2019 USD USD Accumulating Shares Replicating
Franklin LibertyQ AC Asia ex Japan UCITS ETF 27 Sep 2018 USD USD Accumulating Shares Replicating
Franklin LibertyQ Emerging Markets UCITS ETF 17 Oct 2017 USD USD Accumulating Shares Replicating
Franklin LibertyQ European Dividend UCITS ETF 6 Sep 2017 EUR EUR Distributing Shares Replicating
Franklin LibertyQ European Equity UCITS ETF 12 Sep 2018 EUR EUR Accumulating Shares Replicating
Franklin LibertyQ Global Dividend UCITS ETF 6 Sep 2017 USD USD Distributing Shares Replicating
Franklin LibertyQ Global Equity SRI UCITS ETF 6 Sep 2017 USD USD Accumulating Shares Replicating
Franklin LibertyQ U.S. Equity UCITS ETF 6 Sep 2017 USD USD Accumulating Shares Replicating
Franklin STOXX Europe 600 Paris Aligned
Climate UCITS ETF 29 Jul 2020 EUR EUR Accumulating Shares Replicating
Franklin S&P 500 Paris Aligned Climate UCITS
ETF 29 Jul 2020 USD USD Accumulating Shares Replicating
The following table details the Sub-Funds of the ICAV that are Actively Managed Sub-Funds.
Sub-Fund
Launch
date
Functional
Currency
Share
Class
Strategy
Franklin Liberty Euro Green Bond UCITS ETF 29 Apr 2019 EUR EUR Accumulating Shares Actively Managed
Franklin Liberty Euro Short Maturity UCITS ETF 19 Jun 2018 EUR EUR Distributing Shares Actively Managed
Franklin Liberty USD Investment Grade
Corporate Bond UCITS ETF 19 Jun 2018 USD USD Distributing Shares Actively Managed
All shares of the Sub-Funds, except for Franklin LibertyQ AC Asia ex Japan UCITS ETF, were launched at a price of EUR
25 or USD 25 respectively, in line with the functional currency of the Sub-Fund. Franklin LibertyQ AC Asia ex Japan UCITS
ETF was launched at a price of USD 20.
GENERAL INFORMATION (continued)
6 Interim Report Franklin LibertyShares ICAV
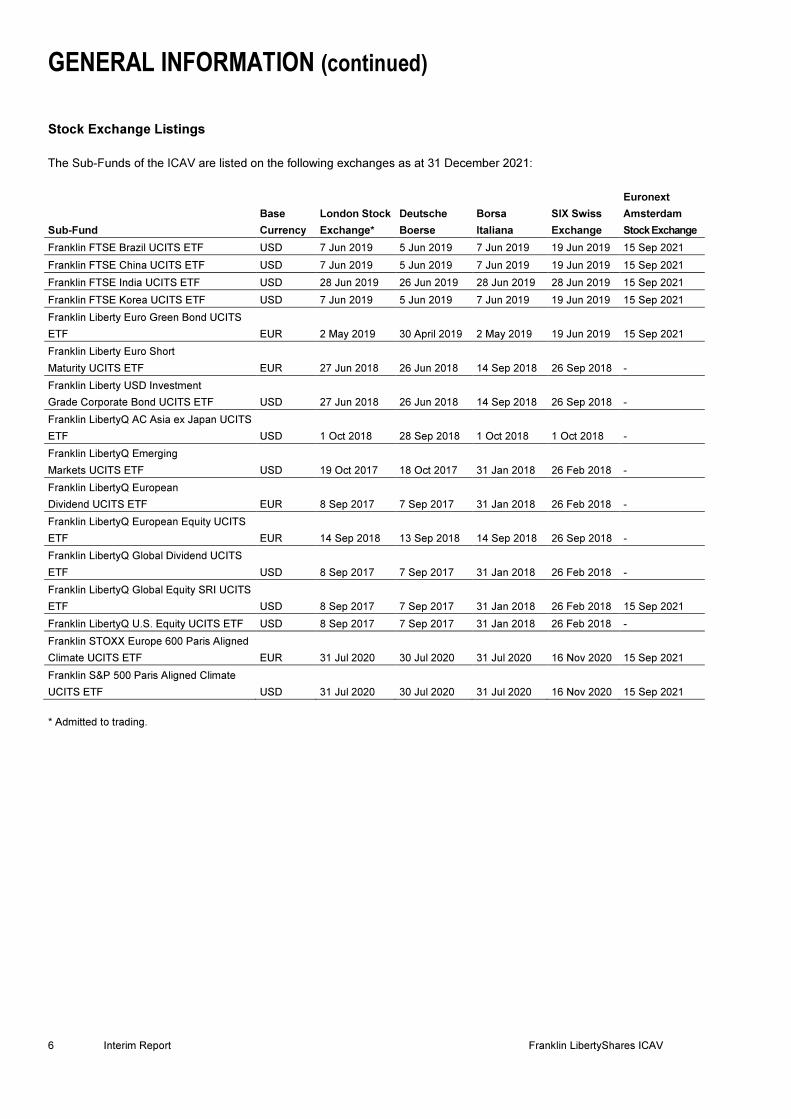
Stock Exchange Listings
The Sub-Funds of the ICAV are listed on the following exchanges as at 31 December 2021:
Sub-Fund
Base
Currency
London Stock
Exchange*
Deutsche
Boerse
Borsa
Italiana
SIX Swiss
Exchange
Euronext
Amsterdam
Stock Exchange
Franklin FTSE Brazil UCITS ETF USD 7 Jun 2019 5 Jun 2019 7 Jun 2019 19 Jun 2019 15 Sep 2021
Franklin FTSE China UCITS ETF USD 7 Jun 2019 5 Jun 2019 7 Jun 2019 19 Jun 2019 15 Sep 2021
Franklin FTSE India UCITS ETF USD 28 Jun 2019 26 Jun 2019 28 Jun 2019 28 Jun 2019 15 Sep 2021
Franklin FTSE Korea UCITS ETF USD 7 Jun 2019 5 Jun 2019 7 Jun 2019 19 Jun 2019 15 Sep 2021
Franklin Liberty Euro Green Bond UCITS
ETF EUR 2 May 2019 30 April 2019 2 May 2019 19 Jun 2019 15 Sep 2021
Franklin Liberty Euro Short
Maturity UCITS ETF EUR 27 Jun 2018 26 Jun 2018 14 Sep 2018 26 Sep 2018 -
Franklin Liberty USD Investment
Grade Corporate Bond UCITS ETF USD 27 Jun 2018 26 Jun 2018 14 Sep 2018 26 Sep 2018 -
Franklin LibertyQ AC Asia ex Japan UCITS
ETF USD 1 Oct 2018 28 Sep 2018 1 Oct 2018 1 Oct 2018 -
Franklin LibertyQ Emerging
Markets UCITS ETF USD 19 Oct 2017 18 Oct 2017 31 Jan 2018 26 Feb 2018 -
Franklin LibertyQ European
Dividend UCITS ETF EUR 8 Sep 2017 7 Sep 2017 31 Jan 2018 26 Feb 2018 -
Franklin LibertyQ European Equity UCITS
ETF EUR 14 Sep 2018 13 Sep 2018 14 Sep 2018 26 Sep 2018 -
Franklin LibertyQ Global Dividend UCITS
ETF USD 8 Sep 2017 7 Sep 2017 31 Jan 2018 26 Feb 2018 -
Franklin LibertyQ Global Equity SRI UCITS
ETF USD 8 Sep 2017 7 Sep 2017 31 Jan 2018 26 Feb 2018 15 Sep 2021
Franklin LibertyQ U.S. Equity UCITS ETF USD 8 Sep 2017 7 Sep 2017 31 Jan 2018 26 Feb 2018 -
Franklin STOXX Europe 600 Paris Aligned
Climate UCITS ETF EUR 31 Jul 2020 30 Jul 2020 31 Jul 2020 16 Nov 2020 15 Sep 2021
Franklin S&P 500 Paris Aligned Climate
UCITS ETF USD 31 Jul 2020 30 Jul 2020 31 Jul 2020 16 Nov 2020 15 Sep 2021
* Admitted to trading.

GENERAL INFORMATION (continued)
Franklin LibertyShares ICAV Interim Report 7
Stock Exchange Listings (continued)
Each of the Index Tracking Sub-Funds is intended to track or replicate the benchmark indices listed hereunder.
Sub-Fund Benchmark Index (“Index”)
Franklin FTSE Brazil UCITS ETF FTSE Brazil 30/18 Capped Index
Franklin FTSE China UCITS ETF FTSE China 30/18 Capped Index
Franklin FTSE India UCITS ETF FTSE India 30/18 Capped Index
Franklin FTSE Korea UCITS ETF FTSE Korea 30/18 Capped Index
Franklin LibertyQ AC Asia ex Japan UCITS ETF LibertyQ AC Asia ex Japan Index
Franklin LibertyQ Emerging Markets UCITS ETF LibertyQ Emerging Markets Index
Franklin LibertyQ European Dividend UCITS ETF LibertyQ European Dividend Index
Franklin LibertyQ European Equity UCITS ETF LibertyQ Europe Equity Index
Franklin LibertyQ Global Dividend UCITS ETF LibertyQ Global Dividend Index
Franklin LibertyQ Global Equity SRI UCITS ETF LibertyQ Global Equity SRI Index
Franklin LibertyQ U.S. Equity UCITS ETF LibertyQ U.S. Large Cap Equity Index
Franklin S&P 500 Paris Aligned Climate UCITS ETF S&P 500 Paris-Aligned Climate Index
Franklin STOXX Europe 600 Paris Aligned Climate UCITS ETF STOXX Europe 600 Paris-Aligned Benchmark Index
Where full replication of the Index is not reasonably possible the Sub-Fund will use an optimisation methodology to build a
representative portfolio that provides a return that is comparable to that of the Index.
The specific investment objectives, strategies and policies for each Sub-Fund are set out in each Investment Manager’s
report.
The investment policy of the Index Tracking Sub-Funds is to track the performance of the relevant Index as closely as
possible, regardless of whether the Index level rises or falls, while seeking to minimise as far as possible the tracking error
between the Sub-Fund’s performance and that of the Index. In order to seek to achieve this investment objective, the
Investment Manager will aim to replicate the Index by holding all of the Index securities in a similar proportion to their
weighting in the Index.
The Actively Managed Sub-Funds’ investments will be managed actively by the Investment Manager or its delegates to
seek to achieve its investment objective, for example, to seek to outperform an Index, rather than just to track it. Where a
Sub-Fund is actively managed, the Investment Manager will have greater discretion in relation to the composition of the
Sub-Fund’s portfolio, subject to the investment objectives and policies stated in the Relevant Supplement. An Actively
Managed Sub-Fund will not seek to track the performance of any Index.
INVESTMENT MANAGER’S REPORT Economic and Market Overview for Investment Manager’s Report
8 Interim Report Franklin LibertyShares ICAV
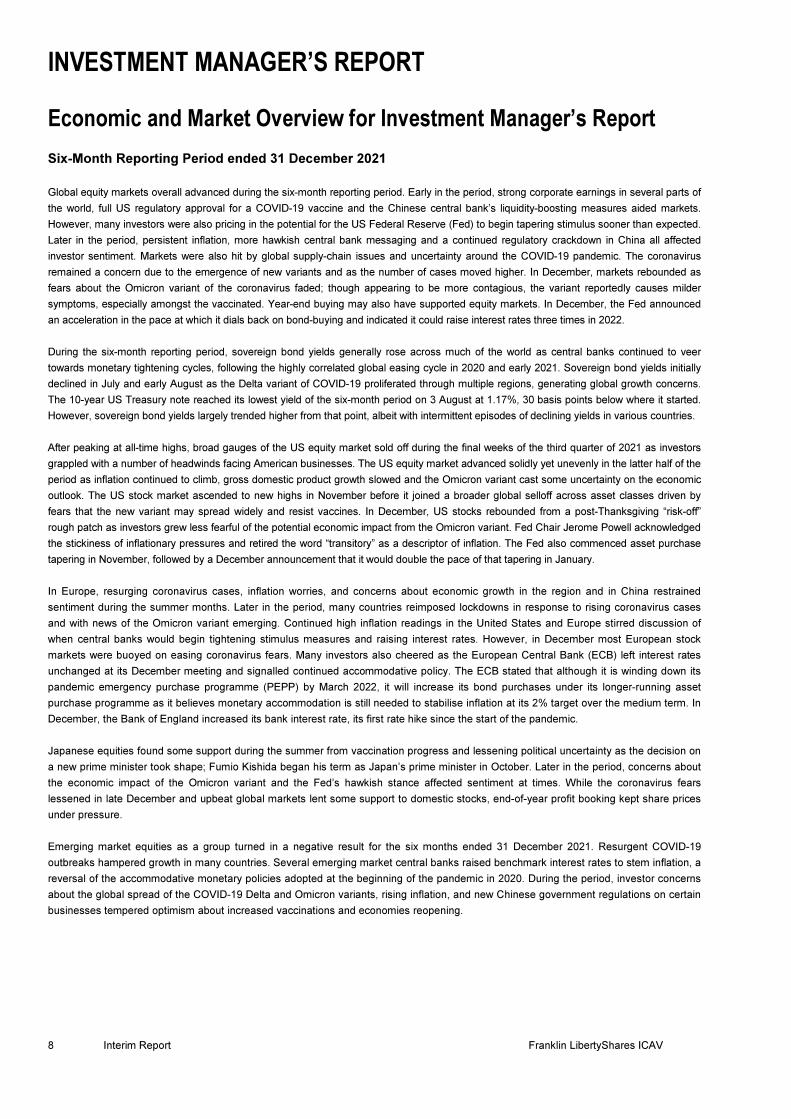
Six-Month Reporting Period ended 31 December 2021
Global equity markets overall advanced during the six-month reporting period. Early in the period, strong corporate earnings in several parts of
the world, full US regulatory approval for a COVID-19 vaccine and the Chinese central bank’s liquidity-boosting measures aided markets.
However, many investors were also pricing in the potential for the US Federal Reserve (Fed) to begin tapering stimulus sooner than expected.
Later in the period, persistent inflation, more hawkish central bank messaging and a continued regulatory crackdown in China all affected
investor sentiment. Markets were also hit by global supply-chain issues and uncertainty around the COVID-19 pandemic. The coronavirus
remained a concern due to the emergence of new variants and as the number of cases moved higher. In December, markets rebounded as
fears about the Omicron variant of the coronavirus faded; though appearing to be more contagious, the variant reportedly causes milder
symptoms, especially amongst the vaccinated. Year-end buying may also have supported equity markets. In December, the Fed announced
an acceleration in the pace at which it dials back on bond-buying and indicated it could raise interest rates three times in 2022.
During the six-month reporting period, sovereign bond yields generally rose across much of the world as central banks continued to veer
towards monetary tightening cycles, following the highly correlated global easing cycle in 2020 and early 2021. Sovereign bond yields initially
declined in July and early August as the Delta variant of COVID-19 proliferated through multiple regions, generating global growth concerns.
The 10-year US Treasury note reached its lowest yield of the six-month period on 3 August at 1.17%, 30 basis points below where it started.
However, sovereign bond yields largely trended higher from that point, albeit with intermittent episodes of declining yields in various countries.
After peaking at all-time highs, broad gauges of the US equity market sold off during the final weeks of the third quarter of 2021 as investors
grappled with a number of headwinds facing American businesses. The US equity market advanced solidly yet unevenly in the latter half of the
period as inflation continued to climb, gross domestic product growth slowed and the Omicron variant cast some uncertainty on the economic
outlook. The US stock market ascended to new highs in November before it joined a broader global selloff across asset classes driven by
fears that the new variant may spread widely and resist vaccines. In December, US stocks rebounded from a post-Thanksgiving “risk-off”
rough patch as investors grew less fearful of the potential economic impact from the Omicron variant. Fed Chair Jerome Powell acknowledged
the stickiness of inflationary pressures and retired the word “transitory” as a descriptor of inflation. The Fed also commenced asset purchase
tapering in November, followed by a December announcement that it would double the pace of that tapering in January.
In Europe, resurging coronavirus cases, inflation worries, and concerns about economic growth in the region and in China restrained
sentiment during the summer months. Later in the period, many countries reimposed lockdowns in response to rising coronavirus cases
and with news of the Omicron variant emerging. Continued high inflation readings in the United States and Europe stirred discussion of
when central banks would begin tightening stimulus measures and raising interest rates. However, in December most European stock
markets were buoyed on easing coronavirus fears. Many investors also cheered as the European Central Bank (ECB) left interest rates
unchanged at its December meeting and signalled continued accommodative policy. The ECB stated that although it is winding down its
pandemic emergency purchase programme (PEPP) by March 2022, it will increase its bond purchases under its longer-running asset
purchase programme as it believes monetary accommodation is still needed to stabilise inflation at its 2% target over the medium term. In
December, the Bank of England increased its bank interest rate, its first rate hike since the start of the pandemic.
Japanese equities found some support during the summer from vaccination progress and lessening political uncertainty as the decision on
a new prime minister took shape; Fumio Kishida began his term as Japan’s prime minister in October. Later in the period, concerns about
the economic impact of the Omicron variant and the Fed’s hawkish stance affected sentiment at times. While the coronavirus fears
lessened in late December and upbeat global markets lent some support to domestic stocks, end-of-year profit booking kept share prices
under pressure.
Emerging market equities as a group turned in a negative result for the six months ended 31 December 2021. Resurgent COVID-19
outbreaks hampered growth in many countries. Several emerging market central banks raised benchmark interest rates to stem inflation, a
reversal of the accommodative monetary policies adopted at the beginning of the pandemic in 2020. During the period, investor concerns
about the global spread of the COVID-19 Delta and Omicron variants, rising inflation, and new Chinese government regulations on certain
businesses tempered optimism about increased vaccinations and economies reopening.
INVESTMENT MANAGER’S REPORT (continued) Performance Review
Franklin LibertyShares ICAV Interim Report 9
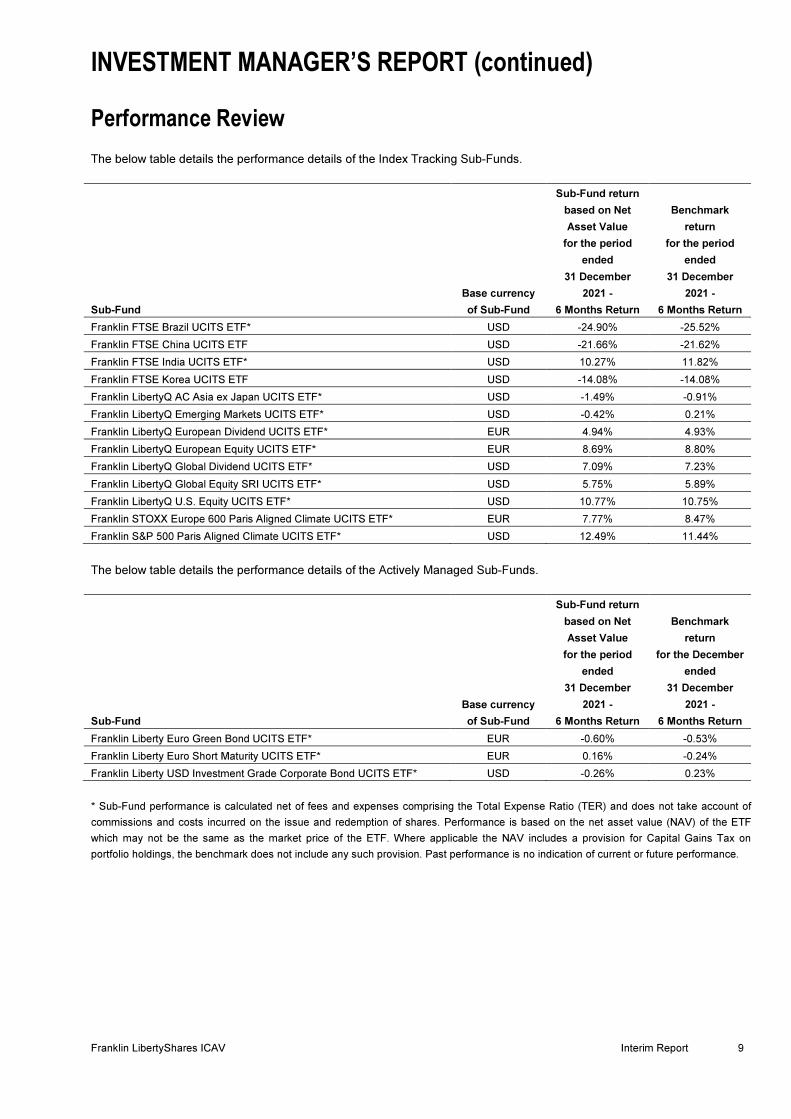
The below table details the performance details of the Index Tracking Sub-Funds.
Sub-Fund
Base currency
of Sub-Fund
Sub-Fund return
based on Net
Asset Value
for the period
ended
31 December
2021 -
6 Months Return
Benchmark
return
for the period
ended
31 December
2021 -
6 Months Return
Franklin FTSE Brazil UCITS ETF* USD -24.90% -25.52%
Franklin FTSE China UCITS ETF USD -21.66% -21.62%
Franklin FTSE India UCITS ETF* USD 10.27% 11.82%
Franklin FTSE Korea UCITS ETF USD -14.08% -14.08%
Franklin LibertyQ AC Asia ex Japan UCITS ETF* USD -1.49% -0.91%
Franklin LibertyQ Emerging Markets UCITS ETF* USD -0.42% 0.21%
Franklin LibertyQ European Dividend UCITS ETF* EUR 4.94% 4.93%
Franklin LibertyQ European Equity UCITS ETF* EUR 8.69% 8.80%
Franklin LibertyQ Global Dividend UCITS ETF* USD 7.09% 7.23%
Franklin LibertyQ Global Equity SRI UCITS ETF* USD 5.75% 5.89%
Franklin LibertyQ U.S. Equity UCITS ETF* USD 10.77% 10.75%
Franklin STOXX Europe 600 Paris Aligned Climate UCITS ETF* EUR 7.77% 8.47%
Franklin S&P 500 Paris Aligned Climate UCITS ETF* USD 12.49% 11.44%
The below table details the performance details of the Actively Managed Sub-Funds.
Sub-Fund
Base currency
of Sub-Fund
Sub-Fund return
based on Net
Asset Value
for the period
ended
31 December
2021 -
6 Months Return
Benchmark
return
for the December
ended
31 December
2021 -
6 Months Return
Franklin Liberty Euro Green Bond UCITS ETF* EUR -0.60% -0.53%
Franklin Liberty Euro Short Maturity UCITS ETF* EUR 0.16% -0.24%
Franklin Liberty USD Investment Grade Corporate Bond UCITS ETF* USD -0.26% 0.23%
* Sub-Fund performance is calculated net of fees and expenses comprising the Total Expense Ratio (TER) and does not take account of
commissions and costs incurred on the issue and redemption of shares. Performance is based on the net asset value (NAV) of the ETF
which may not be the same as the market price of the ETF. Where applicable the NAV includes a provision for Capital Gains Tax on
portfolio holdings, the benchmark does not include any such provision. Past performance is no indication of current or future performance.

INVESTMENT MANAGER’S REPORT (continued)
10 Interim Report Franklin LibertyShares ICAV
Tracking Error
The Sub-Funds of the Franklin Liberty Shares ICAV that are passively managed intend to track as closely as possible the performance of
their respective systematic rules-based proprietary index as described in the prospectus. The tool commonly used to measure
achievement of this objective is the realised tracking error.
Realised tracking error is the standard deviation of the delivered excess returns over an annual period. It is a measurement of the
consistency of the returns relative to the benchmark index over a defined period.
Realised tracking error can be affected by several factors, including but not limited to, the Total Expense Ratio (TER) of the Sub-Fund, the
timing of trades when index is rebalanced, efficient portfolio management techniques employed in attempting to replicate benchmark
returns, and the tax rate applied to dividend or interest received by the Sub-Fund as opposed to the tax rate assumed in the total return
calculation of the benchmark.
The table below compares the anticipated tracking error of the Sub-Funds (as disclosed in the prospectus on an ex ante basis) against the
actual realised tracking error of the Sub-Funds as of 31 December 2021:
Sub-Fund Anticipated tracking
error Annualised realised tracking
error
Franklin FTSE Brazil UCITS ETF* Up to 2.00% 1.77%
Franklin FTSE China UCITS ETF* Up to 0.80% 0.12%
Franklin FTSE India UCITS ETF* Up to 1.00% 1.53%
Franklin FTSE Korea UCITS ETF* Up to 0.50% 0.14%
Franklin LibertyQ AC Asia ex Japan UCITS ETF Up to 0.80% 0.45%
Franklin LibertyQ Emerging Markets UCITS ETF Up to 0.80% 0.30%
Franklin LibertyQ European Dividend UCITS ETF Up to 0.80% 0.20%
Franklin LibertyQ European Equity UCITS ETF Up to 0.50% 0.40%
Franklin LibertyQ Global Dividend UCITS ETF Up to 0.50% 0.10%
Franklin LibertyQ Global Equity SRI UCITS ETF Up to 0.50% 0.10%
Franklin LibertyQ U.S. Equity UCITS ETF Up to 0.50% 0.06%
Franklin S&P 500 Paris Aligned Climate UCITS ETF* Up to 0.20% 0.05%
Franklin STOXX Europe 600 Paris Aligned Climate UCITS ETF* Up to 0.50% 0.12%
* Realised tracking error is normally computed from 36 months of returns. The Sub-Fund's return history is too short to give a statistically
significant tracking error.
Over the period under review the Sub-Funds and their respective benchmarks achieved the performances disclosed in the Investment
Manager’s report. The over / (under) performance of a Sub-Fund to its respective benchmark is principally attributable to the differences in
timing of trades when index is rebalanced; to the Total Expense Ratio (TER) borne by the Sub-Fund, and the tax rate applied to dividends
or interests received by the fund as opposed to the tax rate assumed in the total return calculation of the benchmark. The wider tracking
error and under performance to the index of the Franklin FTSE India UCITS ETF are explained by the impact of taxation of capital gains in
this market.
Franklin Advisers, Inc.
Franklin Templeton Institutional, LLC
Franklin Templeton Investment Management Limited
Franklin Advisory Services LLC
17 February 2022
INVESTMENT MANAGER’S REPORT - INDEX TRACKING SUB-FUNDS Franklin FTSE Brazil UCITS ETF
Franklin LibertyShares ICAV Interim Report 11
This Investment Manager’s report for Franklin FTSE
Brazil UCITS ETF covers the period ended 31 December
2021.
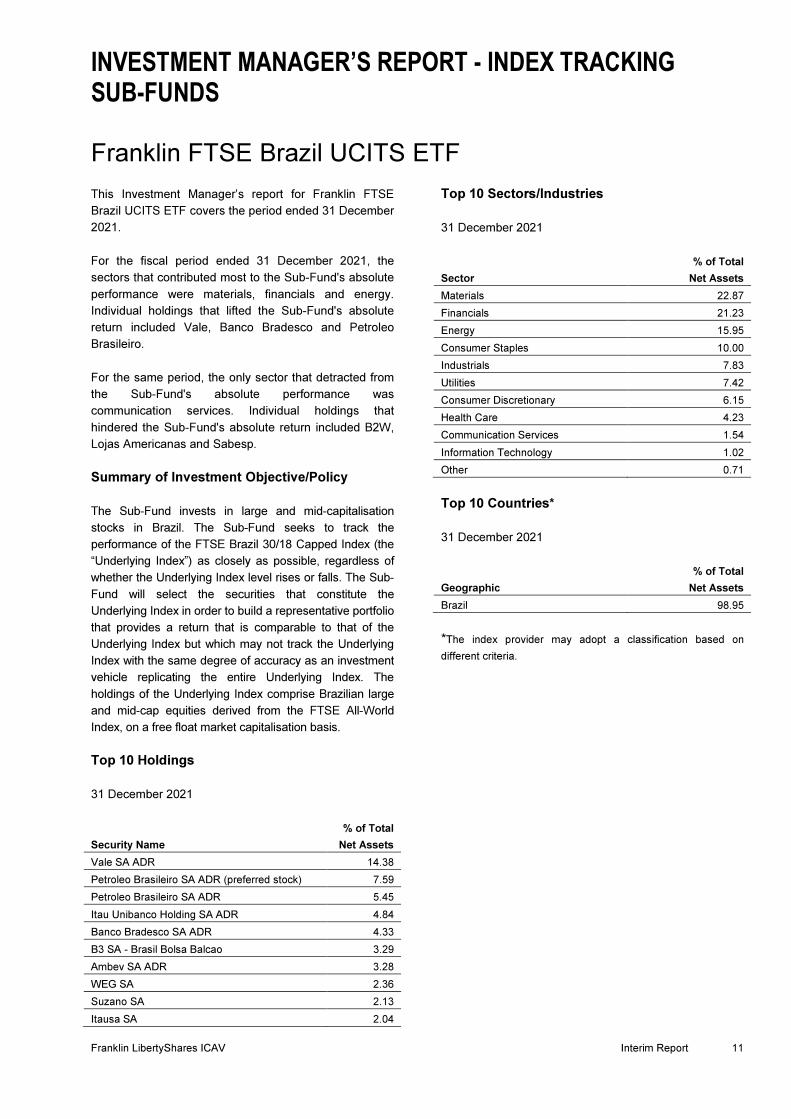
For the fiscal period ended 31 December 2021, the
sectors that contributed most to the Sub-Fund's absolute
performance were materials, financials and energy.
Individual holdings that lifted the Sub-Fund's absolute
return included Vale, Banco Bradesco and Petroleo
Brasileiro.
For the same period, the only sector that detracted from
the Sub-Fund's absolute performance was
communication services. Individual holdings that
hindered the Sub-Fund's absolute return included B2W,
Lojas Americanas and Sabesp.
Summary of Investment Objective/Policy
The Sub-Fund invests in large and mid-capitalisation
stocks in Brazil. The Sub-Fund seeks to track the
performance of the FTSE Brazil 30/18 Capped Index (the
“Underlying Index”) as closely as possible, regardless of
whether the Underlying Index level rises or falls. The Sub-
Fund will select the securities that constitute the
Underlying Index in order to build a representative portfolio
that provides a return that is comparable to that of the
Underlying Index but which may not track the Underlying
Index with the same degree of accuracy as an investment
vehicle replicating the entire Underlying Index. The
holdings of the Underlying Index comprise Brazilian large
and mid-cap equities derived from the FTSE All-World
Index, on a free float market capitalisation basis.
Top 10 Holdings
31 December 2021
Security Name
% of Total
Net Assets
Vale SA ADR 14.38
Petroleo Brasileiro SA ADR (preferred stock) 7.59
Petroleo Brasileiro SA ADR 5.45
Itau Unibanco Holding SA ADR 4.84
Banco Bradesco SA ADR 4.33
B3 SA - Brasil Bolsa Balcao 3.29
Ambev SA ADR 3.28
WEG SA 2.36
Suzano SA 2.13
Itausa SA 2.04
Top 10 Sectors/Industries
31 December 2021
Sector
% of Total
Net Assets
Materials 22.87
Financials 21.23
Energy 15.95
Consumer Staples 10.00
Industrials 7.83
Utilities 7.42
Consumer Discretionary 6.15
Health Care 4.23
Communication Services 1.54
Information Technology 1.02
Other 0.71
Top 10 Countries*
31 December 2021
Geographic
% of Total
Net Assets
Brazil 98.95
*The index provider may adopt a classification based on
different criteria.
INVESTMENT MANAGER’S REPORT - INDEX TRACKING SUB-FUNDS (continued)
Franklin FTSE China UCITS ETF
12 Interim Report Franklin LibertyShares ICAV
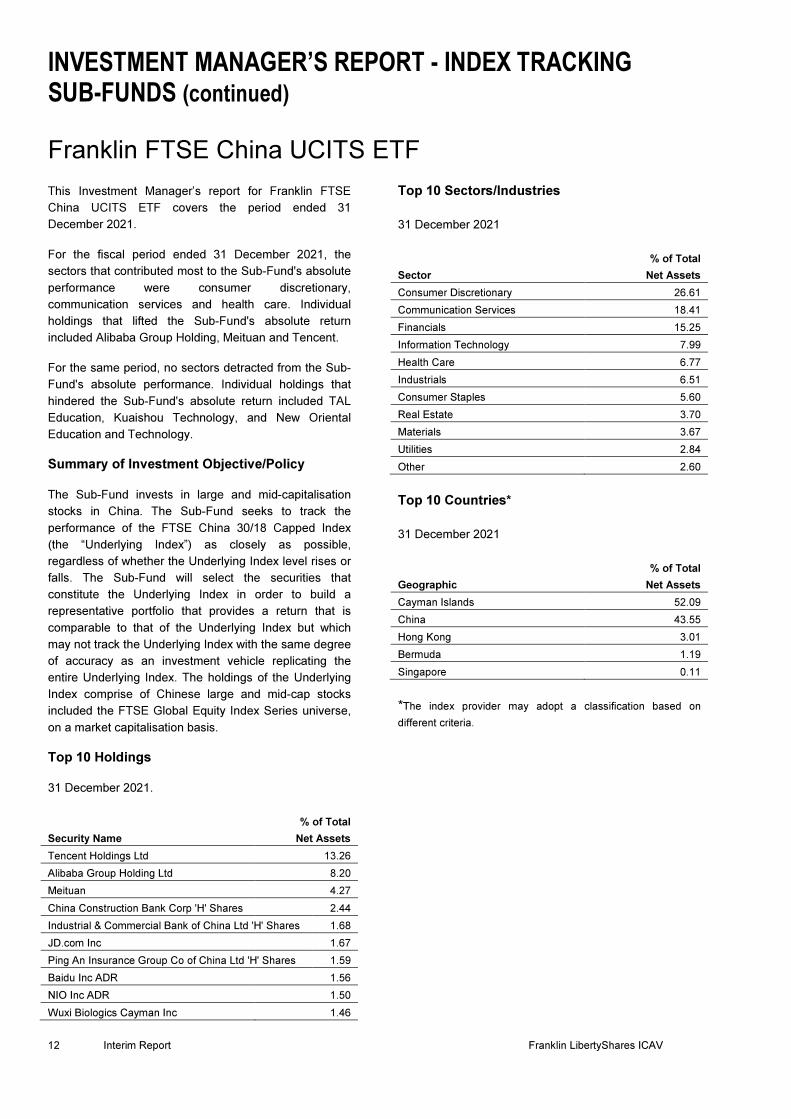
This Investment Manager’s report for Franklin FTSE
China UCITS ETF covers the period ended 31
December 2021.
For the fiscal period ended 31 December 2021, the
sectors that contributed most to the Sub-Fund's absolute
performance were consumer discretionary,
communication services and health care. Individual
holdings that lifted the Sub-Fund's absolute return
included Alibaba Group Holding, Meituan and Tencent.
For the same period, no sectors detracted from the Sub-
Fund's absolute performance. Individual holdings that
hindered the Sub-Fund's absolute return included TAL
Education, Kuaishou Technology, and New Oriental
Education and Technology.
Summary of Investment Objective/Policy
The Sub-Fund invests in large and mid-capitalisation
stocks in China. The Sub-Fund seeks to track the
performance of the FTSE China 30/18 Capped Index
(the “Underlying Index”) as closely as possible,
regardless of whether the Underlying Index level rises or
falls. The Sub-Fund will select the securities that
constitute the Underlying Index in order to build a
representative portfolio that provides a return that is
comparable to that of the Underlying Index but which
may not track the Underlying Index with the same degree
of accuracy as an investment vehicle replicating the
entire Underlying Index. The holdings of the Underlying
Index comprise of Chinese large and mid-cap stocks
included the FTSE Global Equity Index Series universe,
on a market capitalisation basis.
Top 10 Holdings
31 December 2021.
Security Name
% of Total
Net Assets
Tencent Holdings Ltd 13.26
Alibaba Group Holding Ltd 8.20
Meituan 4.27
China Construction Bank Corp 'H' Shares 2.44
Industrial & Commercial Bank of China Ltd 'H' Shares 1.68
JD.com Inc 1.67
Ping An Insurance Group Co of China Ltd 'H' Shares 1.59
Baidu Inc ADR 1.56
NIO Inc ADR 1.50
Wuxi Biologics Cayman Inc 1.46
Top 10 Sectors/Industries
31 December 2021
Sector
% of Total
Net Assets
Consumer Discretionary 26.61
Communication Services 18.41
Financials 15.25
Information Technology 7.99
Health Care 6.77
Industrials 6.51
Consumer Staples 5.60
Real Estate 3.70
Materials 3.67
Utilities 2.84
Other 2.60
Top 10 Countries*
31 December 2021
Geographic
% of Total
Net Assets
Cayman Islands 52.09
China 43.55
Hong Kong 3.01
Bermuda 1.19
Singapore 0.11
*The index provider may adopt a classification based on
different criteria.

INVESTMENT MANAGER’S REPORT - INDEX TRACKING SUB-FUNDS (continued) Franklin FTSE India UCITS ETF
Franklin LibertyShares ICAV Interim Report 13
This Investment Manager’s report for Franklin FTSE
India UCITS ETF covers the period ended 31 December
2021.
For the fiscal period ended 31 December 2021, the
sectors that contributed most to the Sub-Fund's absolute
performance were information technology, financials and
materials. Individual holdings that lifted the Sub-Fund's
absolute return included Infosys, Reliance Industries and
Housing Development Finance Corp Ltd.
For the same period, no sectors detracted from the Sub-
Fund's absolute performance. Individual holdings that
hindered the Sub-Fund's absolute return included Bharti
Airtel, Yes Bank, and Future Retail.
Summary of Investment Objective/Policy
The Sub-Fund invests in large and mid-capitalisation
stocks in India. The Sub-Fund seeks to track the
performance of the FTSE India 30/18 Capped Index (the
“Underlying Index”) as closely as possible, regardless of
whether the Underlying Index level rises or falls. The
Sub-Fund will select the securities that constitute the
Underlying Index in order to build a representative
portfolio that provides a return that is comparable to that
of the Underlying Index but which may not track the
Underlying Index with the same degree of accuracy as
an investment vehicle replicating the entire Underlying
Index. The holdings of the Underlying Index comprise of
Indian large and mid-cap equities derived from the FTSE
All-World Index, on a free float market capitalisation
basis.
Top 10 Holdings
31 December 2021
Security Name
% of Total
Net Assets
Reliance Industries Ltd 9.88
Infosys Ltd 8.54
Housing Development Finance Corp Ltd 5.75
Tata Consultancy Services Ltd 4.91
Hindustan Unilever Ltd 2.67
Bajaj Finance Ltd 2.08
Bharti Airtel Ltd 1.99
Axis Bank Ltd 1.96
Asian Paints Ltd 1.94
HCL Technologies Ltd 1.82
Top 10 Sectors/Industries
31 December 2021
Sector
% of Total
Net Assets
Financials 19.77
Information Technology 19.13
Energy 12.23
Materials 11.50
Consumer Discretionary 9.11
Consumer Staples 8.64
Industrials 6.53
Health Care 5.78
Utilities 5.07
Communication Services 3.69
Other 0.94
Top 10 Countries*
31 December 2021
Geographic
% of Total
Net Assets
India 102.39
*The index provider may adopt a classification based on
different criteria.

INVESTMENT MANAGER’S REPORT - INDEX TRACKING SUB-FUNDS (continued)
Franklin FTSE Korea UCITS ETF
14 Interim Report Franklin LibertyShares ICAV
This Investment Manager’s report for Franklin FTSE
Korea UCITS ETF covers the period ended 31
December 2021.
For the fiscal period ended 31 December 2021, the
sectors that contributed most to the Sub-Fund's absolute
performance were information technology, consumer
discretionary and materials. Individual holdings that lifted
the Sub-Fund's absolute return included Samsung
Electronics, Kakao and Hyundai.
For the same period, no sectors detracted from the Sub-
Fund's absolute performance. Individual holdings that
hindered the Sub-Fund's absolute return included SK
C&C, Alteogen and Helixmith.
Summary of Investment Objective/Policy
The Sub-Fund invests in large and mid-capitalisation
stocks in South Korea. The Sub-Fund seeks to track the
performance of the FTSE Korea 30/18 Capped Index
(the “Underlying Index”) as closely as possible,
regardless of whether the Underlying Index level rises or
falls. The Sub-Fund will select the securities that
constitute the Underlying Index in order to build a
representative portfolio that provides a return that is
comparable to that of the Underlying Index but which
may not track the Underlying Index with the same degree
of accuracy as an investment vehicle replicating the
entire Underlying Index. The holdings of the Underlying
Index comprise of South Korean large and mid-cap
equities derived from the FTSE All-World Index, on a
free float market capitalisation basis.
Top 10 Holdings
31 December 2021
Security Name
% of Total
Net Assets
Samsung Electronics Co Ltd 26.34
SK Hynix Inc 5.87
NAVER Corp 4.42
Samsung Electronics Co Ltd (preferred stock) 4.20
Samsung SDI Co Ltd 2.96
Kakao Corp 2.64
Hyundai Motor Co 2.51
LG Chem Ltd 2.47
Celltrion Inc 1.84
KB Financial Group Inc 1.84
Top 10 Sectors/Industries
31 December 2021
Sector
% of Total
Net Assets
Information Technology 46.46
Consumer Discretionary 11.31
Financials 8.71
Industrials 8.55
Materials 7.32
Communication Services 5.60
Health Care 5.35
Consumer Staples 3.58
Energy 1.58
Utilities 0.58
Other 0.01
Top 10 Countries*
31 December 2021
Geographic
% of Total
Net Assets
South Korea 99.05
*The index provider may adopt a classification based on
different criteria.
INVESTMENT MANAGER’S REPORT - INDEX TRACKING SUB-FUNDS (continued) Franklin LibertyQ AC Asia ex Japan UCITS ETF
Franklin LibertyShares ICAV Interim Report 15
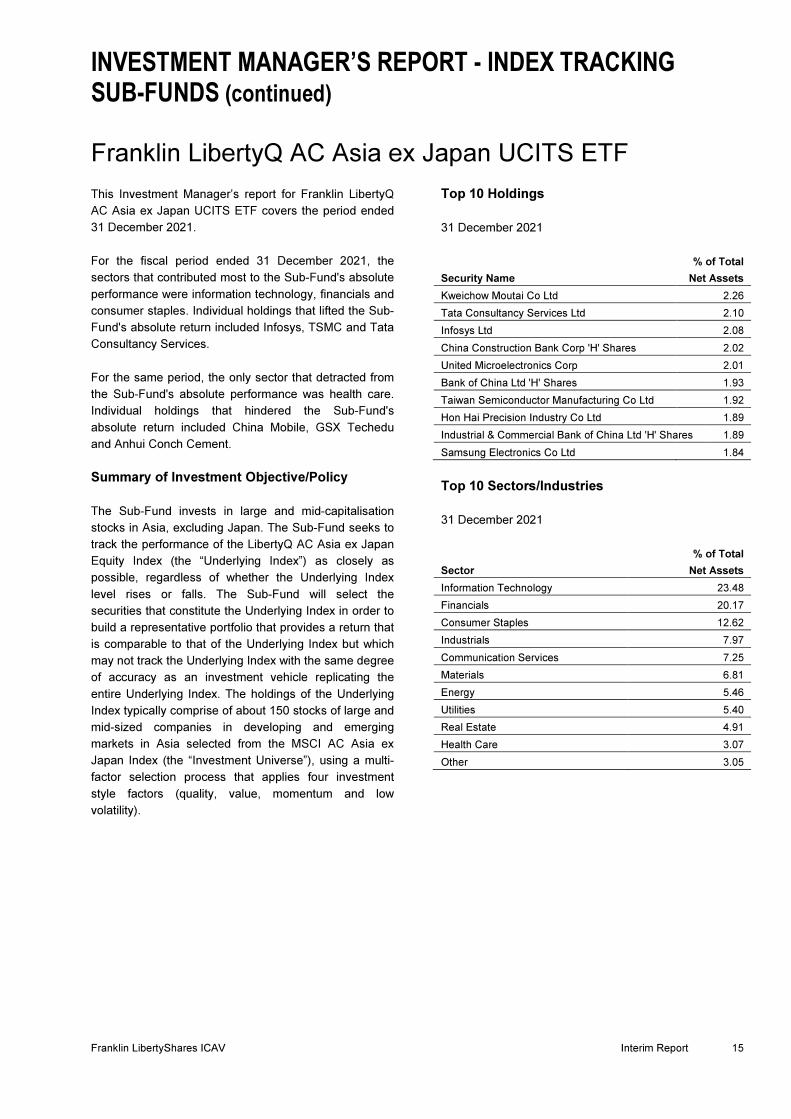
This Investment Manager’s report for Franklin LibertyQ
AC Asia ex Japan UCITS ETF covers the period ended
31 December 2021.
For the fiscal period ended 31 December 2021, the
sectors that contributed most to the Sub-Fund's absolute
performance were information technology, financials and
consumer staples. Individual holdings that lifted the Sub-
Fund's absolute return included Infosys, TSMC and Tata
Consultancy Services.
For the same period, the only sector that detracted from
the Sub-Fund's absolute performance was health care.
Individual holdings that hindered the Sub-Fund's
absolute return included China Mobile, GSX Techedu
and Anhui Conch Cement.
Summary of Investment Objective/Policy
The Sub-Fund invests in large and mid-capitalisation
stocks in Asia, excluding Japan. The Sub-Fund seeks to
track the performance of the LibertyQ AC Asia ex Japan
Equity Index (the “Underlying Index”) as closely as
possible, regardless of whether the Underlying Index
level rises or falls. The Sub-Fund will select the
securities that constitute the Underlying Index in order to
build a representative portfolio that provides a return that
is comparable to that of the Underlying Index but which
may not track the Underlying Index with the same degree
of accuracy as an investment vehicle replicating the
entire Underlying Index. The holdings of the Underlying
Index typically comprise of about 150 stocks of large and
mid-sized companies in developing and emerging
markets in Asia selected from the MSCI AC Asia ex
Japan Index (the “Investment Universe”), using a multi-
factor selection process that applies four investment
style factors (quality, value, momentum and low
volatility).
Top 10 Holdings
31 December 2021
Security Name
% of Total
Net Assets
Kweichow Moutai Co Ltd 2.26
Tata Consultancy Services Ltd 2.10
Infosys Ltd 2.08
China Construction Bank Corp 'H' Shares 2.02
United Microelectronics Corp 2.01
Bank of China Ltd 'H' Shares 1.93
Taiwan Semiconductor Manufacturing Co Ltd 1.92
Hon Hai Precision Industry Co Ltd 1.89
Industrial & Commercial Bank of China Ltd 'H' Shares 1.89
Samsung Electronics Co Ltd 1.84
Top 10 Sectors/Industries
31 December 2021
Sector
% of Total
Net Assets
Information Technology 23.48
Financials 20.17
Consumer Staples 12.62
Industrials 7.97
Communication Services 7.25
Materials 6.81
Energy 5.46
Utilities 5.40
Real Estate 4.91
Health Care 3.07
Other 3.05

INVESTMENT MANAGER’S REPORT - INDEX TRACKING SUB-FUNDS (continued) Franklin LibertyQ AC Asia ex Japan UCITS ETF (continued)
16 Interim Report Franklin LibertyShares ICAV
Top 10 Countries*
31 December 2021
Geographic
% of Total
Net Assets
China 25.63
Taiwan 20.59
India 17.53
Cayman Islands 9.40
South Korea 9.20
Hong Kong 6.26
Thailand 2.84
Singapore 2.59
Malaysia 2.43
Indonesia 2.39
Other 1.33
*The index provider may adopt a classification based on
different criteria.

INVESTMENT MANAGER’S REPORT - INDEX TRACKING SUB-FUNDS (continued) Franklin LibertyQ Emerging Markets UCITS ETF
Franklin LibertyShares ICAV Interim Report 17
This Investment Manager’s report for Franklin LibertyQ
Emerging Markets UCITS ETF covers the period ended
31 December 2021.
For the fiscal period ended 31 December 2021, the
sectors that contributed most to the Sub-Fund's absolute
performance were information technology, materials and
financials. Individual holdings that lifted the Sub-Fund's
absolute return included Vale, Infosys and TSMC.
For the same period, the only sector that detracted from
the Sub-Fund's absolute performance was health care.
Individual holdings that hindered the Sub-Fund's
absolute return included AngloGold Ashanti, GSX
Techedu and Top Glove.
Summary of Investment Objective/Policy
The Sub-Fund invests in large and mid-capitalisation
stocks in emerging market countries globally. The Sub-
Fund seeks to track the performance of the LibertyQ
Emerging Markets Equity Index (the “Underlying Index”)
as closely as possible, regardless of whether the
Underlying Index rises or falls. The Sub-Fund aims to
replicate the Underlying Index by holding all of its
securities in a similar proportion to their weighting in the
Index. The holdings of the Underlying Index comprise the
top quartile of stocks which are selected from the MSCI
Emerging Markets Index (the Investment Universe),
using a transparent multi-factor selection process that
applies four investment style factors (quality, value,
momentum and low volatility).
Top 10 Holdings
31 December 2021
Security Name
% of Total
Net Assets
Vale SA ADR 1.24
HCL Technologies Ltd 1.17
Kweichow Moutai Co Ltd 1.14
Tech Mahindra Ltd 1.11
Emirates Telecommunications Group Co PJSC 1.10
Telkom Indonesia Persero Tbk PT 1.10
Infosys Ltd 1.06
Tata Consultancy Services Ltd 1.06
Wal-Mart de Mexico SAB de CV 1.06
Asian Paints Ltd 1.04
Top 10 Sectors/Industries
31 December 2021
Sector
% of Total
Net Assets
Financials 19.32
Materials 17.45
Information Technology 15.70
Consumer Staples 11.66
Energy 11.19
Communication Services 9.11
Industrials 5.14
Consumer Discretionary 3.49
Utilities 3.01
Health Care 2.70
Other 1.32
Top 10 Countries*
31 December 2021
Geographic
% of Total
Net Assets
China 17.96
Taiwan 14.04
India 13.58
Russia 8.70
South Korea 7.46
Brazil 6.23
South Africa 5.24
Cayman Islands 4.20
Saudi Arabia 4.09
Mexico 2.86
Other 15.73
*The index provider may adopt a classification based on
different criteria.

INVESTMENT MANAGER’S REPORT - INDEX TRACKING SUB-FUNDS (continued)
Franklin LibertyQ European Dividend UCITS ETF
18 Interim Report Franklin LibertyShares ICAV
This Investment Manager’s report for Franklin LibertyQ
European Dividend UCITS ETF covers the period ended
31 December 2021.
For the fiscal period ended 31 December 2021, the
sectors that contributed most to the Sub-Fund's absolute
performance were financials, consumer discretionary
and materials. Individual holdings that lifted the Sub-
Fund's absolute return included Nokian Renkaat, Games
Workshop and Admiral.
For the same period, no sectors detracted from the Sub-
Fund's absolute performance. Individual holdings that
hindered the Sub-Fund's absolute return included
Proximus, TGS and Elisa.
Summary of Investment Objective/Policy
The Sub-Fund invests in high quality large and mid-
capitalisation stocks with high and persistent dividend
income in developed countries in Europe. The Sub-Fund
seeks to track the performance of the LibertyQ European
Dividend Index (the “Underlying Index”) as closely as
possible, regardless of whether the Underlying Index
level rises or falls. The Sub-Fund aims to replicate the
Underlying Index by holding all its securities in a similar
proportion to their weighting in the Underlying Index. The
holdings of the Underlying Index comprise 50 stocks
which are selected from the MSCI Europe IMI ex REITS
Index (the Investment Universe), using a transparent
selection process which applies a dividend persistence
and yield screen followed by a quality screen.
Top 10 Holdings
31 December 2021
Security Name
% of Total
Net Assets
BHP Group Plc 3.44
Rio Tinto Plc 3.26
Admiral Group Plc 3.11
GlaxoSmithKline Plc 3.10
Snam SpA 3.08
Red Electrica Corp SA 3.08
Hannover Rueck SE 3.05
TotalEnergies SE 3.02
UPM-Kymmene OYJ 3.00
Imperial Brands Plc 2.99
Top 10 Sectors/Industries
31 December 2021
Sector
% of Total
Net Assets
Financials 27.83
Communication Services 15.58
Materials 12.09
Utilities 12.08
Consumer Staples 8.33
Health Care 7.71
Industrials 5.25
Energy 4.82
Information Technology 2.60
Consumer Discretionary 2.28
Other 0.92
Top 10 Countries*
31 December 2021
Geographic
% of Total
Net Assets
United Kingdom 26.02
Spain 12.55
Finland 12.03
France 9.12
Italy 7.98
Germany 7.06
Switzerland 6.71
Norway 4.87
Netherlands 4.81
Denmark 3.29
Other 5.05
*The index provider may adopt a classification based on
different criteria.
INVESTMENT MANAGER’S REPORT - INDEX TRACKING SUB-FUNDS (continued) Franklin LibertyQ European Equity UCITS ETF
Franklin LibertyShares ICAV Interim Report 19
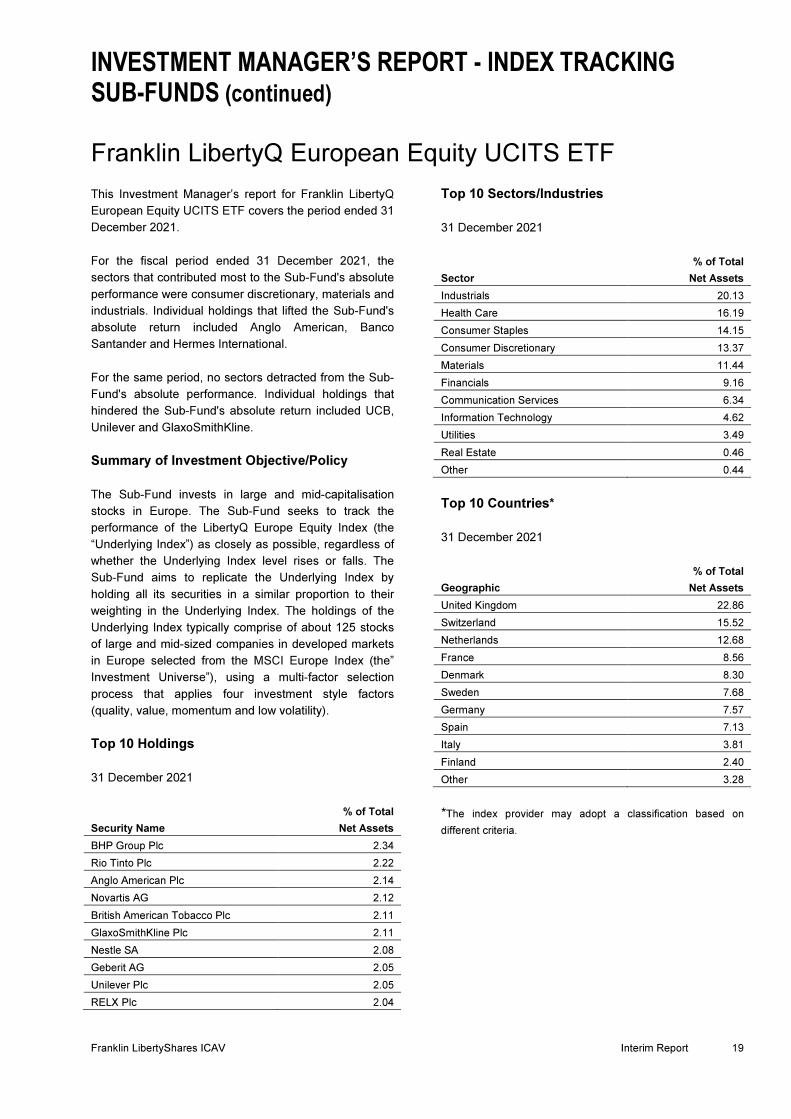
This Investment Manager’s report for Franklin LibertyQ
European Equity UCITS ETF covers the period ended 31
December 2021.
For the fiscal period ended 31 December 2021, the
sectors that contributed most to the Sub-Fund's absolute
performance were consumer discretionary, materials and
industrials. Individual holdings that lifted the Sub-Fund's
absolute return included Anglo American, Banco
Santander and Hermes International.
For the same period, no sectors detracted from the Sub-
Fund's absolute performance. Individual holdings that
hindered the Sub-Fund's absolute return included UCB,
Unilever and GlaxoSmithKline.
Summary of Investment Objective/Policy
The Sub-Fund invests in large and mid-capitalisation
stocks in Europe. The Sub-Fund seeks to track the
performance of the LibertyQ Europe Equity Index (the
“Underlying Index”) as closely as possible, regardless of
whether the Underlying Index level rises or falls. The
Sub-Fund aims to replicate the Underlying Index by
holding all its securities in a similar proportion to their
weighting in the Underlying Index. The holdings of the
Underlying Index typically comprise of about 125 stocks
of large and mid-sized companies in developed markets
in Europe selected from the MSCI Europe Index (the”
Investment Universe”), using a multi-factor selection
process that applies four investment style factors
(quality, value, momentum and low volatility).
Top 10 Holdings
31 December 2021
Security Name
% of Total
Net Assets
BHP Group Plc 2.34
Rio Tinto Plc 2.22
Anglo American Plc 2.14
Novartis AG 2.12
British American Tobacco Plc 2.11
GlaxoSmithKline Plc 2.11
Nestle SA 2.08
Geberit AG 2.05
Unilever Plc 2.05
RELX Plc 2.04
Top 10 Sectors/Industries
31 December 2021
Sector
% of Total
Net Assets
Industrials 20.13
Health Care 16.19
Consumer Staples 14.15
Consumer Discretionary 13.37
Materials 11.44
Financials 9.16
Communication Services 6.34
Information Technology 4.62
Utilities 3.49
Real Estate 0.46
Other 0.44
Top 10 Countries*
31 December 2021
Geographic
% of Total
Net Assets
United Kingdom 22.86
Switzerland 15.52
Netherlands 12.68
France 8.56
Denmark 8.30
Sweden 7.68
Germany 7.57
Spain 7.13
Italy 3.81
Finland 2.40
Other 3.28
*The index provider may adopt a classification based on
different criteria.

INVESTMENT MANAGER’S REPORT - INDEX TRACKING SUB-FUNDS (continued)
Franklin LibertyQ Global Dividend UCITS ETF
20 Interim Report Franklin LibertyShares ICAV
This Investment Manager’s report for Franklin LibertyQ
Global Dividend UCITS ETF covers the period ended 31
December 2021.
For the fiscal period ended 31 December 2021, the
sectors that contributed most to the Sub-Fund's absolute
performance were financials, information technology and
industrials. Individual holdings that lifted the Sub-Fund's
absolute return included TSMC, UPS and Target.
For the same period, the only sector that detracted from
the Sub-Fund's absolute performance was energy.
Individual holdings that hindered the Sub-Fund's
absolute return included Intel, Unilever and Tatneft.
Summary of Investment Objective/Policy
The Sub-Fund invests in high quality large and mid-
capitalisation stocks with high and persistent dividend
income in developed and emerging market countries
globally and seeks to track the performance of the
LibertyQ Global Dividend Index (the “Underlying Index”)
as closely as possible, regardless of whether the
Underlying Index level rises or falls. The Sub-Fund aims
to replicate the Underlying Index by holding all of its
securities in a similar proportion to their weighting in the
Underlying Index. The holdings of the Underlying Index
comprise 100 stocks which are selected from the MSCI
ACWI ex REITS Index (the Investment Universe), using
a transparent selection process which applies a dividend
persistence and yield screen followed by a quality
screen.
Top 10 Holdings
31 December 2021
Security Name
% of Total
Net Assets
Cisco Systems Inc 2.27
International Business Machines Corp 2.21
Procter & Gamble Co 2.15
Rio Tinto Plc 2.15
Amgen Inc 2.13
Paychex Inc 2.10
Bank of Nova Scotia 2.09
Novartis AG 2.09
Altria Group Inc 2.08
Kimberly-Clark Corp 2.08
Top 10 Sectors/Industries
31 December 2021
Sector
% of Total
Net Assets
Financials 26.10
Health Care 15.09
Consumer Staples 13.55
Information Technology 12.92
Industrials 12.19
Materials 6.72
Communication Services 6.53
Consumer Discretionary 4.06
Real Estate 1.83
Utilities 0.46
Other 0.38
Top 10 Countries*
31 December 2021
Geographic
% of Total
Net Assets
United States 39.20
Switzerland 9.31
Japan 8.32
United Kingdom 8.30
Canada 7.94
Australia 6.37
Ireland 3.47
Saudi Arabia 2.76
Germany 2.68
Taiwan 2.55
Other 8.93
*The index provider may adopt a classification based on
different criteria.

INVESTMENT MANAGER’S REPORT - INDEX TRACKING SUB-FUNDS (continued)
Franklin LibertyQ Global Equity SRI UCITS ETF
Franklin LibertyShares ICAV Interim Report 21
This Investment Manager’s report for Franklin LibertyQ
Global Equity SRI UCITS ETF covers the period ended
31 December 2021.
For the fiscal period ended 31 December 2021, the
sectors that contributed most to the Sub-Fund's absolute
performance were financials, consumer discretionary
and industrials. Individual holdings that lifted the Sub-
Fund's absolute return included TSMC, NVIDIA and
Bank of Montreal.
For the same period, no sectors detracted from the Sub-
Fund's absolute performance. Individual holdings that
hindered the Sub-Fund's absolute return included Vertex
Pharmaceuticals, KAO and Daikin Industries.
Summary of Investment Objective/Policy
The Sub-Fund invests in large and mid-capitalisation
stocks in developed and emerging market countries
globally that are considered to be environmentally and
socially responsible. The Sub-Fund seeks to track the
performance of the LibertyQ Global Equity SRI Index
(the “Underlying Index”) as closely as possible,
regardless of whether the Underlying Index level rises or
falls. The Sub-Fund aims to replicate the Underlying
Index by holding all of its securities in a similar proportion
to their weighting in the Underlying Index. The holdings
of the Underlying Index comprise 230 stocks which are
selected from the MSCI ACWI SRI Index, using a
transparent multi-factor selection process that applies
four investment style factors (quality, value, momentum
and low volatility).
Top 10 Holdings
31 December 2021
Security Name
% of Total
Net Assets
Vertex Pharmaceuticals Inc 1.17
Cisco Systems Inc 1.17
American Tower Corp 1.12
Colgate-Palmolive Co 1.10
Amgen Inc 1.08
Mettler-Toledo International Inc 1.08
Fortescue Metals Group Ltd 1.06
Ferguson Plc 1.06
Bank of Nova Scotia 1.06
Kimberly-Clark Corp 1.06
Top 10 Sectors/Industries
31 December 2021
Sector
% of Total
Net Assets
Health Care 19.71
Financials 16.51
Industrials 14.14
Consumer Staples 12.32
Consumer Discretionary 10.46
Information Technology 8.96
Communication Services 6.95
Materials 6.56
Real Estate 2.47
Utilities 1.56
Other 0.11
Top 10 Countries*
31 December 2021
Geographic
% of Total
Net Assets
United States 41.21
Japan 11.41
Canada 5.08
United Kingdom 4.88
Australia 4.24
Denmark 3.26
Taiwan 3.06
Switzerland 2.94
Germany 2.16
Spain 2.16
Other 19.35
*The index provider may adopt a classification based on
different criteria.

INVESTMENT MANAGER’S REPORT - INDEX TRACKING SUB-FUNDS (continued)
Franklin LibertyQ U.S. Equity UCITS ETF
22 Interim Report Franklin LibertyShares ICAV
This Investment Manager’s report for Franklin LibertyQ
U.S. Equity UCITS ETF covers the period ended 31
December 2021.
For the fiscal period ended 31 December 2021, the
sectors that contributed most to the Sub-Fund's absolute
performance were information technology, industrials
and consumer discretionary. Individual holdings that
lifted the Sub-Fund's absolute return included Applied
Materials, NVIDIA and Lam Research.
For the same period, no sectors detracted from the Sub-
Fund's absolute performance. Individual holdings that
hindered the Sub-Fund's absolute return included
American Tower, Vertex Pharmaceuticals and Clorox.
Summary of Investment Objective/Policy
The Sub-Fund invests in large and mid-capitalisation
stocks in the U.S. The Sub-Fund seeks to track the
performance of the LibertyQ U.S. Large Cap Equity
Index (the “Underlying Index”) as closely as possible,
regardless of whether the Underlying Index level rises or
falls. The Sub-Fund aims to replicate the Underlying
Index by holding all of its securities in a similar proportion
to their weighting in the Underlying Index. The holdings
of the Underlying Index comprise 250 stocks which are
selected from the Russell 1000® Index (the Investment
Universe), using a transparent multi-factor selection
process that applies four investment style factors
(quality, value, momentum and low volatility).
Top 10 Holdings
31 December 2021
Security Name
% of Total
Net Assets
AbbVie Inc 1.11
Accenture Plc 1.09
Cisco Systems Inc 1.09
UnitedHealth Group Inc 1.08
Amgen Inc 1.07
Mastercard Inc 1.07
Procter & Gamble Co 1.07
Coca-Cola Co 1.07
Bristol-Myers Squibb Co 1.05
Estee Lauder Co Inc 1.05
Top 10 Sectors/Industries
31 December 2021
Sector
% of Total
Net Assets
Information Technology 23.28
Health Care 18.39
Industrials 14.63
Consumer Staples 13.55
Consumer Discretionary 10.42
Communication Services 6.20
Financials 3.91
Materials 3.87
Utilities 2.92
Real Estate 2.50
Other 0.16
Top 10 Countries*
31 December 2021
Geographic
% of Total
Net Assets
United States 96.80
Ireland 1.75
Netherlands 0.43
Switzerland 0.31
Bermuda 0.28
Guernsey 0.15
Jersey 0.11
*The index provider may adopt a classification based on
different criteria.
INVESTMENT MANAGER’S REPORT - INDEX TRACKING SUB-FUNDS (continued)
Franklin STOXX Europe 600 Paris Aligned Climate UCITS ETF
Franklin LibertyShares ICAV Interim Report 23
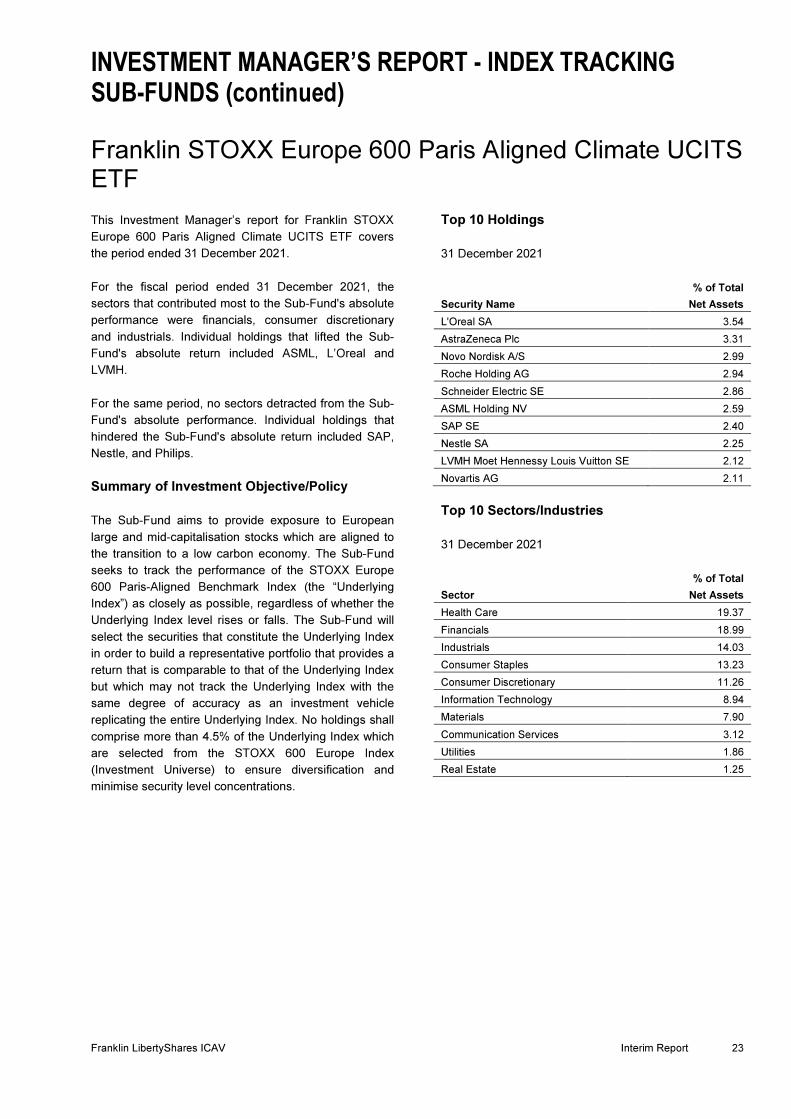
This Investment Manager’s report for Franklin STOXX
Europe 600 Paris Aligned Climate UCITS ETF covers
the period ended 31 December 2021.
For the fiscal period ended 31 December 2021, the
sectors that contributed most to the Sub-Fund's absolute
performance were financials, consumer discretionary
and industrials. Individual holdings that lifted the Sub-
Fund's absolute return included ASML, L’Oreal and
LVMH.
For the same period, no sectors detracted from the Sub-
Fund's absolute performance. Individual holdings that
hindered the Sub-Fund's absolute return included SAP,
Nestle, and Philips.
Summary of Investment Objective/Policy
The Sub-Fund aims to provide exposure to European
large and mid-capitalisation stocks which are aligned to
the transition to a low carbon economy. The Sub-Fund
seeks to track the performance of the STOXX Europe
600 Paris-Aligned Benchmark Index (the “Underlying
Index”) as closely as possible, regardless of whether the
Underlying Index level rises or falls. The Sub-Fund will
select the securities that constitute the Underlying Index
in order to build a representative portfolio that provides a
return that is comparable to that of the Underlying Index
but which may not track the Underlying Index with the
same degree of accuracy as an investment vehicle
replicating the entire Underlying Index. No holdings shall
comprise more than 4.5% of the Underlying Index which
are selected from the STOXX 600 Europe Index
(Investment Universe) to ensure diversification and
minimise security level concentrations.
Top 10 Holdings
31 December 2021
Security Name
% of Total
Net Assets
L'Oreal SA 3.54
AstraZeneca Plc 3.31
Novo Nordisk A/S 2.99
Roche Holding AG 2.94
Schneider Electric SE 2.86
ASML Holding NV 2.59
SAP SE 2.40
Nestle SA 2.25
LVMH Moet Hennessy Louis Vuitton SE 2.12
Novartis AG 2.11
Top 10 Sectors/Industries
31 December 2021
Sector
% of Total
Net Assets
Health Care 19.37
Financials 18.99
Industrials 14.03
Consumer Staples 13.23
Consumer Discretionary 11.26
Information Technology 8.94
Materials 7.90
Communication Services 3.12
Utilities 1.86
Real Estate 1.25
INVESTMENT MANAGER’S REPORT - INDEX TRACKING SUB-FUNDS (continued)
Franklin STOXX Europe 600 Paris Aligned Climate UCITS ETF (continued)
24 Interim Report Franklin LibertyShares ICAV
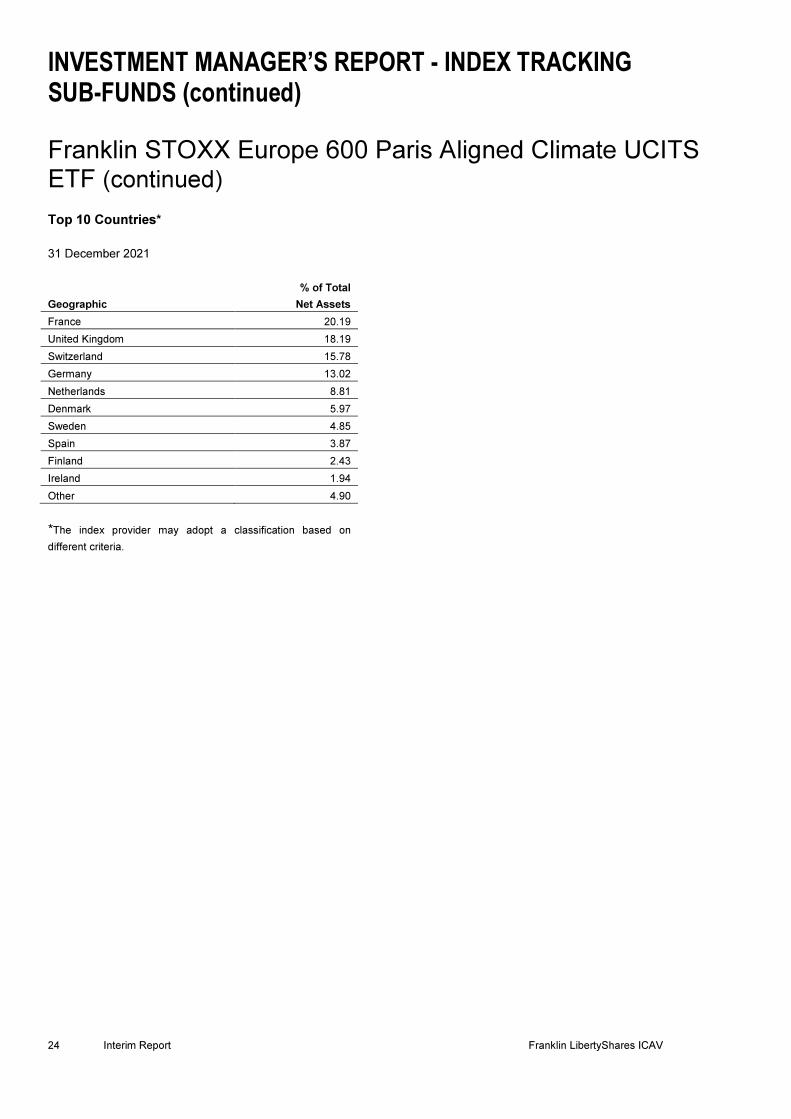
Top 10 Countries*
31 December 2021
Geographic
% of Total
Net Assets
France 20.19
United Kingdom 18.19
Switzerland 15.78
Germany 13.02
Netherlands 8.81
Denmark 5.97
Sweden 4.85
Spain 3.87
Finland 2.43
Ireland 1.94
Other 4.90
*The index provider may adopt a classification based on
different criteria.

INVESTMENT MANAGER’S REPORT - INDEX TRACKING SUB-FUNDS (continued)
Franklin S&P 500 Paris Aligned Climate UCITS ETF
Franklin LibertyShares ICAV Interim Report 25
This Investment Manager’s report for Franklin S&P 500
Paris Aligned Climate UCITS ETF covers the period
ended 31 December 2021.
For the fiscal period ended 31 December 2021, the
sectors that contributed most to the Sub-Fund's absolute
performance were information technology,
communication services and financials. Individual
holdings that lifted the Sub-Fund's absolute return
included Alphabet, Apple and Facebook.
For the same period, no sectors detracted from the Sub-
Fund's absolute performance. Individual holdings that
hindered the Sub-Fund's absolute return included
Regeneron Pharmaceuticals, Vertex Pharmaceuticals
and Becton Dickinson.
Summary of Investment Objective/Policy
The Sub-Fund aims to provide exposure to large
capitalisation US stocks which are aligned to the
transition to a low carbon economy. The Sub-Fund seeks
to track the performance of the Franklin S&P 500 Paris
Aligned Climate UCITS ETF (the “Underlying Index”) as
closely as possible, regardless of whether the Underlying
Index level rises or falls. The Sub-Fund will select the
securities that constitute the Underlying Index in order to
build a representative portfolio that provides a return that
is comparable to that of the Underlying Index but which
may not track the Underlying Index with the same degree
of accuracy as an investment vehicle replicating the
entire Underlying Index. No holdings shall comprise
more than 5% of the Underlying Index which are
selected from the S&P 500 Index (Investment Universe)
to ensure diversification and minimise security level
concentrations.
Top 10 Holdings
31 December 2021
Security Name
% of Total
Net Assets
Apple Inc 6.72
NVIDIA Corp 4.18
Alphabet Inc 'A' Shares 4.13
Alphabet Inc 'C' Shares 3.97
Adobe Inc 2.81
Bank of America Corp 2.59
Tesla Inc 2.44
Visa Inc 2.43
UnitedHealth Group Inc 2.09
Mastercard Inc 2.06
Top 10 Sectors/Industries
31 December 2021
Sector
% of Total
Net Assets
Information Technology 33.85
Health Care 22.37
Financials 13.37
Communication Services 12.58
Consumer Discretionary 6.40
Industrials 3.96
Consumer Staples 3.72
Real Estate 2.48
Materials 1.05
Utilities 0.16
Top 10 Countries*
31 December 2021
Geographic
% of Total
Net Assets
United States 96.49
Ireland 3.01
Switzerland 0.18
Bermuda 0.17
Jersey 0.08
United Kingdom 0.01
*The index provider may adopt a classification based on
different criteria.

INVESTMENT MANAGER’S REPORT - ACTIVELY MANAGED
SUB-FUNDS (continued)
Franklin Liberty Euro Green Bond UCITS ETF
26 Interim Report Franklin LibertyShares ICAV
This Investment Manager’s report for Franklin Liberty
Euro Green Bond UCITS ETF covers the period ended
31 December 2021.
For the fiscal period ended 31 December 2021, the Sub-
Fund's sector allocation helped relative performance,
particularly overweight exposures to corporate
investment-grade financial issues and high-yield
industrial bonds. The Sub-Fund's security selection in
government-related bonds also contributed to relative
returns. The Sub-Fund's local market allocation further
added to relative results, notably an overweight exposure
to the UK market. In contrast, the Sub-Fund's duration
and yield-curve positioning in eurozone bonds weighed
on relative performance.
Summary of Investment Objective/Policy
The Sub-Fund aims to provide exposure to the European
green bond market whilst maximizing total returns.
The Sub-Fund invests mainly in:
• bonds that are labelled green and denominated in
European currencies
The Sub-Fund can invest to a lesser extent in:
• bonds that are climate aligned
• derivatives for hedging, efficient portfolio
management and/or investment purposes
The Sub-Fund pursues an actively managed investment
strategy. Therefore, the Sub-Fund will hold a portfolio of
actively selected and managed investments rather than
seek to track the performance of a benchmark. Any
benchmark referred to is as a point of reference against
which the performance of the Sub-Fund may be
measured. The securities in which the Sub-Fund invests
will be primarily listed or traded on recognised markets
globally in accordance with the limits set out in the
UCITS Regulations.
Top 10 Holdings
31 December 2021
Security Name
% of Total
Net Assets
Netherlands Government Bond 5.26
Bundesobligation 3.34
Ireland Government Bond 3.30
Kingdom of Belgium Government Bond 3.23
Bundesrepublik Deutschland Bundesanleihe 2.73
Spain Government Bond 2.23
Societe Du Grand Paris EPIC 1.85
French Republic Government Bond OAT 1.83
Hungary Government International Bond 1.82
Chile Government International Bond 1.59
Top 10 Sectors/Industries
31 December 2021
Sector
% of Total
Net Assets
Corporate 66.00
Sovereign 30.12
Top 10 Countries*
31 December 2021
Geographic
% of Total
Net Assets
Netherlands 18.35
France 16.68
Germany 14.98
Spain 10.28
Italy 6.85
Belgium 4.70
Ireland 4.25
United Kingdom 3.85
Sweden 3.41
Luxembourg 2.73
Other 10.04
*The index provider may adopt a classification based on
different criteria.

INVESTMENT MANAGER’S REPORT - ACTIVELY MANAGED SUB-FUNDS (continued) Franklin Liberty Euro Short Maturity UCITS ETF
Franklin LibertyShares ICAV Interim Report 27
This Investment Manager’s report for Franklin Liberty
Euro Short Maturity UCITS ETF covers the period ended
31 December 2021.
For the fiscal period ended 31 December 2021, the Sub-
Fund's sector allocation helped relative performance,
particularly overweight exposures to corporate financial
and industrial bonds, both investment-grade and high
yield. A non-benchmark exposure to Icelandic
government bonds also added relative value. The Sub-
Fund's security selection in Italian sovereign issues and
corporate investment-grade financial bonds further
contributed to relative returns. The Sub-Fund's duration
and yield-curve positioning in eurozone bonds added
slightly to relative results. There were no significant
detractors from relative performance.
Summary of Investment Objective/Policy
The Sub-Fund aims to provide current income whilst
maximizing total returns in the Euro-denominated short
term fixed income market.
The Sub-Fund invests mainly in:
• short-term fixed and floating rate investment grade
debt securities denominated in Euro issued by
sovereign and corporate issuers including non-
European issuers
The Sub-Fund can invest to a lesser extent in:
• lower quality debt securities such as non-investment
grade securities or securities in default (limited to
20% of the Sub-Fund’s assets)
• derivatives for hedging, efficient portfolio
management and/or investment purposes
The Sub-Fund pursues an actively managed investment
strategy. Therefore, the Sub-Fund will hold a portfolio of
actively selected and managed investments rather than
seek to track the performance of a benchmark. Any
benchmark referred to is as a point of reference against
which the performance of the Sub-Fund may be
measured. The securities in which the fund invests will
be primarily listed or traded on recognised markets
globally in accordance with the limits set out in the
UCITS Regulations.
Top 10 Holdings
31 December 2021
Security Name
% of Total
Net Assets
Deutsche Bundesrepublik Inflation Linked Bond 9.65
Italy Buoni Ordinari del Tesoro BOT 4.02
Kingdom of Belgium Treasury Bill 3.44
Italy Treasury Bill 3.43
Spain Letras del Tesoro 2.87
France Treasury Bill BTF 2.87
French Republic Government Bond OAT 2.71
Allianz SE 1.25
Romanian Government International Bond 1.22
Bacardi Ltd 1.20
Top 10 Sectors/Industries
31 December 2021
Sector
% of Total
Net Assets
Corporate Bonds 56.25
Government Bonds 34.88
Mortgage Backed Securities 0.25
Top 10 Countries*
31 December 2021
Geographic
% of Total
Net Assets
Germany 13.61
Italy 12.61
France 9.59
Netherlands 8.68
Spain 7.55
United States 7.02
United Kingdom 5.43
Belgium 4.31
Luxembourg 2.93
Denmark 2.71
Other 16.94
*The index provider may adopt a classification based on
different criteria.

INVESTMENT MANAGER’S REPORT - ACTIVELY MANAGED
SUB-FUNDS (continued) Franklin Liberty USD Investment Grade Corporate Bond UCITS ETF
28 Interim Report Franklin LibertyShares ICAV
This Investment Manager’s report for Franklin Liberty
USD Investment Grade Corporate Bond UCITS ETF
covers the period ended 31 December 2021.
For the fiscal period ended 31 December 2021, the Sub-
Fund's security selection hurt its relative performance.
Bonds of energy firms were the main detractor, as the
Sub-Fund's higher-quality holdings trailed the energy
sector’s rally. The Sub-Fund's short duration, compared
with the index, and its yield curve positioning also
detracted from relative performance.
Individual holdings that most hindered the Sub-Fund's
performance, compared with the benchmark, included
bonds of Williams Companies, TransCanada Pipelines
and AT&T. The main individual holdings that lifted the
Sub-Fund's relative returns were long-dated bonds, of
delivery company FedEx, utility Georgia Power and
Takeda Pharmaceutical.
Summary of Investment Objective/Policy
The Sub-Fund aims to provide current income from the
USD fixed income market while seeking to preserve
capital.
The Sub-Fund invests mainly in:
• U.S. dollar denominated fixed and floating rate
investment grade corporate debt securities and
investments issued by U.S. companies
The Sub-Fund can invest to a lesser extent in:
• non-U.S. securities including those issued by
issuers in emerging markets
• derivatives for hedging, efficient portfolio
management and/or investment purposes
The Sub-Fund pursues an actively managed investment
strategy. Therefore, the Sub-Fund will hold a portfolio of
actively selected and managed investments rather than
seek to track the performance of a benchmark. Any
benchmark referred to is as a point of reference against
which the performance of the Sub-Fund may be
measured. The securities in which the Sub-Fund invests
will be primarily listed or traded on recognised markets
globally in accordance with the limits set out in the
UCITS Regulations.
Top 10 Holdings
31 December 2021
Security Name
% of Total
Net Assets
Bank of America Corp 2.34
Citigroup Inc 2.23
Verizon Communications Inc 1.98
Credit Suisse Group AG 1.96
CVS Health Corp 1.93
Microsoft Corp 1.91
Cigna Corp 1.81
JPMorgan Chase & Co 1.80
RELX Capital Inc 1.79
T-Mobile USA Inc 1.77
Top 10 Sectors/Industries
31 December 2021
Sector
% of Total
Net Assets
Industrial 40.16
Financials 31.20
Pharmaceuticals 7.12
Telecommunications Services 5.39
Utilities 5.03
Energy 4.53
Information Technology 2.77
Technology 1.42
Consumer Staples 1.01
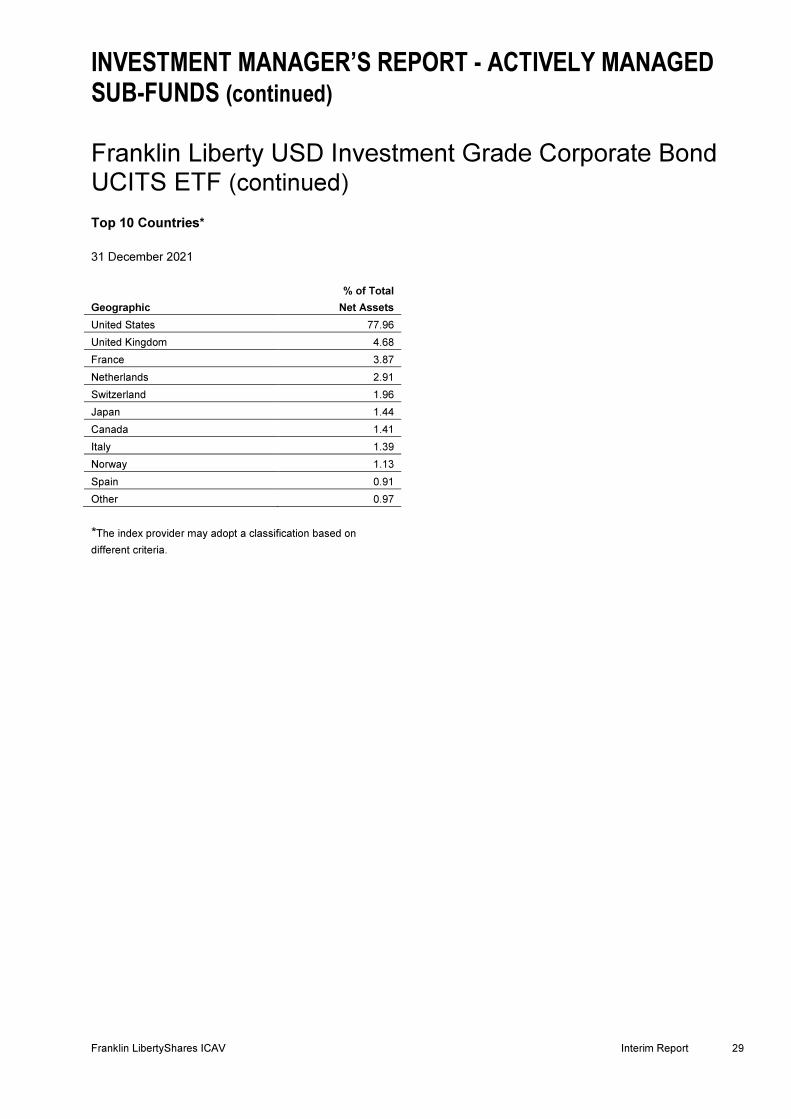
INVESTMENT MANAGER’S REPORT - ACTIVELY MANAGED
SUB-FUNDS (continued)
Franklin Liberty USD Investment Grade Corporate Bond UCITS ETF (continued)
Franklin LibertyShares ICAV Interim Report 29
Top 10 Countries*
31 December 2021
Geographic
% of Total
Net Assets
United States 77.96
United Kingdom 4.68
France 3.87
Netherlands 2.91
Switzerland 1.96
Japan 1.44
Canada 1.41
Italy 1.39
Norway 1.13
Spain 0.91
Other 0.97
*The index provider may adopt a classification based on
different criteria.
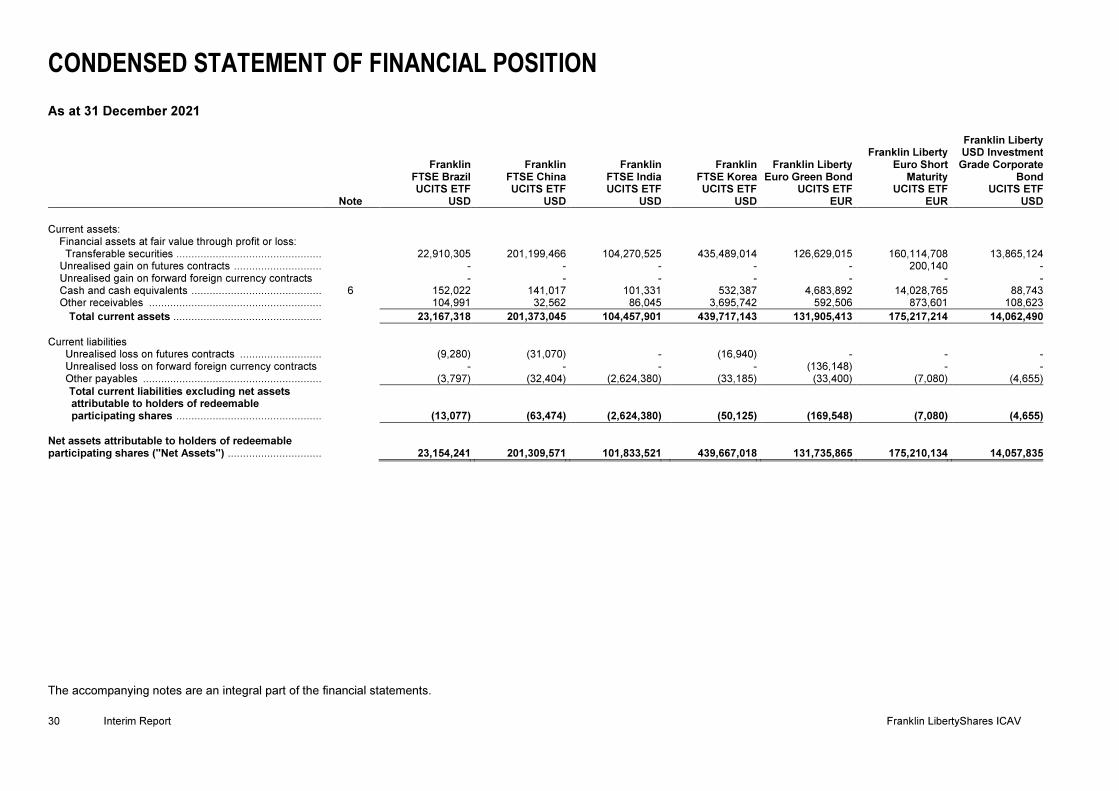
CONDENSED STATEMENT OF FINANCIAL POSITION
The accompanying notes are an integral part of the financial statements.
30 Interim Report Franklin LibertyShares ICAV
As at 31 December 2021
Note
Franklin FTSE Brazil UCITS ETF
USD
Franklin FTSE China UCITS ETF
USD
Franklin FTSE IndiaUCITS ETF
USD
Franklin FTSE KoreaUCITS ETF
USD
Franklin LibertyEuro Green Bond
UCITS ETFEUR
Franklin LibertyEuro Short
MaturityUCITS ETF
EUR
Franklin LibertyUSD Investment
Grade CorporateBond
UCITS ETFUSD
Current assets:
Financial assets at fair value through profit or loss: Transferable securities ................................................................ 22,910,305 201,199,466 104,270,525 435,489,014 126,629,015 160,114,708 13,865,124
Unrealised gain on futures contracts ................................ - - - - - 200,140 -Unrealised gain on forward foreign currency contracts - - - - - - -Cash and cash equivalents ................................................................6 152,022 141,017 101,331 532,387 4,683,892 14,028,765 88,743Other receivables ................................................................ 104,991 32,562 86,045 3,695,742 592,506 873,601 108,623
Total current assets ................................................................ 23,167,318 201,373,045 104,457,901 439,717,143 131,905,413 175,217,214 14,062,490
Current liabilities
Unrealised loss on futures contracts ................................ (9,280) (31,070) - (16,940) - - -Unrealised loss on forward foreign currency contracts - - - - (136,148) - -Other payables ................................................................ (3,797) (32,404) (2,624,380) (33,185) (33,400) (7,080) (4,655)
Total current liabilities excluding net assets attributable to holders of redeemable participating shares ................................................................ (13,077) (63,474) (2,624,380) (50,125) (169,548) (7,080) (4,655)
Net assets attributable to holders of redeemable participating shares ("Net Assets") ................................ 23,154,241 201,309,571 101,833,521 439,667,018 131,735,865 175,210,134 14,057,835

CONDENSED STATEMENT OF FINANCIAL POSITION (continued)
The accompanying notes are an integral part of the financial statements.
Franklin LibertyShares ICAV Interim Report 31
As at 31 December 2021 (continued)
Note
Franklin LibertyQAC Asia ex Japan
UCITS ETFUSD
Franklin LibertyQEmerging
MarketsUCITS ETF
USD
Franklin LibertyQEuropeanDividend
UCITS ETFEUR
Franklin LibertyQEuropean Equity
UCITS ETFEUR
Franklin LibertyQGlobal Dividend
UCITS ETFUSD
Franklin LibertyQGlobal Equity SRI
UCITS ETFUSD
Franklin LibertyQU.S. EquityUCITS ETF
USD
Current assets
Financial assets at fair value through profit or loss: Transferable securities ................................................................ 5,784,932 39,570,796 24,786,896 10,296,843 36,732,025 23,584,361 119,160,855Unrealised gain on futures contracts ................................ - 235 3,930 - 675 1,261 6,865Unrealised gain on forward foreign currency contracts - - - - 526 - -
Cash and cash equivalents ................................................................6 13,644 54,694 8,060 4,045 2,733,008 30,227 107,270Other receivables ................................................................ 17,087 144,628 120,555 22,248 689,351 37,350 110,090
Total current assets ................................................................ 5,815,663 39,770,353 24,919,441 10,323,136 40,155,585 23,653,199 119,385,080
Current liabilities
Unrealised loss on futures contracts ................................ - - - - - - -Bank Overdraft - - - - (68) - -Other payables ................................................................ (41,421) (234,741) (4,968) (4,157) (3,359,265) (11,535) (24,126)
Total current liabilities excluding net assets attributable to holders of redeemable participating shares ................................................................ (41,421) (234,741) (4,968) (4,157) (3,359,333) (11,535) (24,126)
Net assets attributable to holders of redeemable participating shares ("Net Assets") ................................ 5,774,242 39,535,612 24,914,473 10,318,979 36,796,252 23,641,664 119,360,954

CONDENSED STATEMENT OF FINANCIAL POSITION (continued)
The accompanying notes are an integral part of the financial statements.
32 Interim Report Franklin LibertyShares ICAV
As at 31 December 2021 (continued)
Note
Franklin STOXX Europe 600 Paris
Aligned Climate UCITS ETF
EUR
Franklin S&P 500 Paris Aligned
Climate UCITS ETF USD
Current assets
Financial assets at fair value through profit or loss: Transferable securities ................................................................ 16,709,785 115,335,397Unrealised gain on futures contracts ................................ 222 -
Cash and cash equivalents ................................................................6 3,247 50,776Other receivables ................................................................ 6,410 9,150,617
Total current assets ................................................................ 16,719,664 124,536,790
Current liabilities
Other payables ................................................................ (2,063) (9,135,794)
Total current liabilities excluding net assets attributable to holders of redeemable participating shares ................................................................ (2,063) (9,135,794)
Net assets attributable to holders of redeemable participating shares ("Net Assets") ................................ 16,717,601 115,400,996

CONDENSED STATEMENT OF FINANCIAL POSITION (continued)
The accompanying notes are an integral part of the financial statements.
Franklin LibertyShares ICAV Interim Report 33
As at 30 June 2021
Note
Franklin FTSE Brazil UCITS ETF
USD
Franklin FTSE China UCITS ETF
USD
Franklin FTSE IndiaUCITS ETF
USD
Franklin FTSE KoreaUCITS ETF
USD
Franklin LibertyEuro Green Bond
UCITS ETFEUR
Franklin LibertyEuro Short
MaturityUCITS ETF
EUR
Franklin LibertyUSD Investment
Grade CorporateBond
UCITS ETFUSD
Current assets:
Financial assets at fair value through profit or loss: Transferable securities ................................................................ 23,297,096 193,605,629 72,855,180 685,606,948 104,759,627 54,587,545 16,792,707
Unrealised gain on forward foreign currency contracts - - - - 13,153 - -Cash and cash equivalents ................................................................6 6,516 264,796 56,118 471,335 2,660,149 4,670,161 171,396Other receivables ................................................................ 163,843 794,667 83,864 899,992 418,897 2,308,903 136,739
Total current assets ................................................................ 23,467,455 194,665,092 72,995,162 686,978,275 107,851,826 61,566,609 17,100,842
Current liabilities
Unrealised loss on futures contracts ................................ (1,920) (770) - (888) - (18,780) -Other payables ................................................................ (338,572) (29,192) (1,339,788) (47,342) (26,087) (1,725,641) (4,670)
Total current liabilities excluding net assets attributable to holders of redeemable participating shares ................................................................ (340,492) (29,962) (1,339,788) (48,230) (26,087) (1,744,421) (4,670)
Net assets attributable to holders of redeemable participating shares ("Net Assets") ................................ 23,126,963 194,635,130 71,655,374 686,930,045 107,825,739 59,822,188 17,096,172
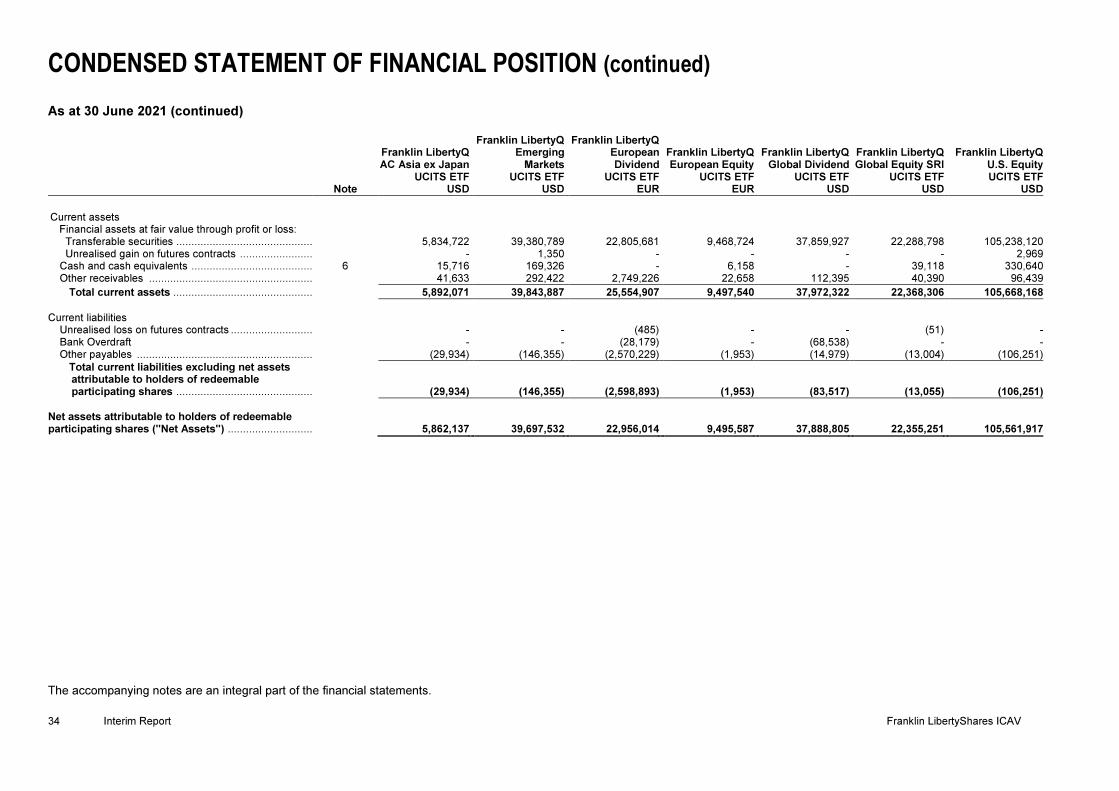
CONDENSED STATEMENT OF FINANCIAL POSITION (continued)
The accompanying notes are an integral part of the financial statements.
34 Interim Report Franklin LibertyShares ICAV
As at 30 June 2021 (continued)
Note
Franklin LibertyQAC Asia ex Japan
UCITS ETFUSD
Franklin LibertyQEmerging
MarketsUCITS ETF
USD
Franklin LibertyQEuropeanDividend
UCITS ETFEUR
Franklin LibertyQEuropean Equity
UCITS ETFEUR
Franklin LibertyQGlobal Dividend
UCITS ETFUSD
Franklin LibertyQGlobal Equity SRI
UCITS ETFUSD
Franklin LibertyQU.S. EquityUCITS ETF
USD
Current assets
Financial assets at fair value through profit or loss: Transferable securities ................................................................ 5,834,722 39,380,789 22,805,681 9,468,724 37,859,927 22,288,798 105,238,120Unrealised gain on futures contracts ................................ - 1,350 - - - - 2,969
Cash and cash equivalents ................................................................6 15,716 169,326 - 6,158 - 39,118 330,640Other receivables ................................................................ 41,633 292,422 2,749,226 22,658 112,395 40,390 96,439
Total current assets ................................................................ 5,892,071 39,843,887 25,554,907 9,497,540 37,972,322 22,368,306 105,668,168
Current liabilities
Unrealised loss on futures contracts ................................ - - (485) - - (51) -Bank Overdraft - - (28,179) - (68,538) - -Other payables ................................................................ (29,934) (146,355) (2,570,229) (1,953) (14,979) (13,004) (106,251)
Total current liabilities excluding net assets attributable to holders of redeemable participating shares ................................................................ (29,934) (146,355) (2,598,893) (1,953) (83,517) (13,055) (106,251)
Net assets attributable to holders of redeemable participating shares ("Net Assets") ................................ 5,862,137 39,697,532 22,956,014 9,495,587 37,888,805 22,355,251 105,561,917

CONDENSED STATEMENT OF FINANCIAL POSITION (continued)
The accompanying notes are an integral part of the financial statements.
Franklin LibertyShares ICAV Interim Report 35
As at 30 June 2021 (continued)
Note
Franklin STOXX Europe 600 Paris
Aligned Climate UCITS ETF*
EUR
Franklin S&P 500 Paris Aligned
Climate UCITS ETF*USD
Current assets
Financial assets at fair value through profit or loss: Transferable securities ................................................................ 9,297,102 46,064,715
Cash and cash equivalents ................................................................6 4,799 67,362Other receivables ................................................................ 7,251 11,469,800
Total current assets ................................................................ 9,309,152 57,601,877
Current liabilities
Other payables ................................................................ (1,123) (11,434,334)
Total current liabilities excluding net assets attributable to holders of redeemable participating shares ................................................................ (1,123) (11,434,334)
Net assets attributable to holders of redeemable participating shares ("Net Assets") ................................ 9,308,029 46,167,543
* The Fund launched post 30 June 2020.

CONDENSED STATEMENT OF COMPREHENSIVE INCOME
The accompanying notes are an integral part of the financial statements.
36 Interim Report Franklin LibertyShares ICAV
For the period ended 31 December 2021
Note
Franklin FTSE Brazil UCITS ETF
USD
Franklin FTSE China UCITS ETF
USD
Franklin FTSE IndiaUCITS ETF
USD
Franklin FTSE KoreaUCITS ETF
USD
Franklin Liberty Euro Green Bond
UCITS ETFEUR
Franklin Liberty Euro Short
Maturity UCITS ETF
EUR
Franklin Liberty USD Investment Grade Corporate
Bond UCITS ETF
USD
Income:
Dividend income ................................................................ 1,093,605 1,369,446 681,495 5,990,758 - - -Interest income ................................................................ 63 - 28,317 212 375,348 142,399 199,606Net (loss)/gain on financial assets/liabilities at fair value through profit or loss ................................ (7,560,623) (48,883,873) 9,347,634 (92,950,305) (1,230,560) (43,629) (227,394)
Total investment (loss)/income ................................ (6,466,955) (47,514,427) 10,057,446 (86,959,335) (855,212) 98,770 (27,788)
Expenses:
Operating expenses ................................................................4 (21,306) (194,170) (87,496) (230,271) (190,609) (27,029) (29,289)
Net (loss)/income ................................................................ (6,488,261) (47,708,597) 9,969,950 (87,189,606) (1,045,821) 71,741 (57,077)
Finance costs:
Distributions to holders of redeemable participating shares ................................................................9 - - - - - - (176,580)Interest expense ................................................................ (53) (646) (1,162) (163) (6,545) (40,505) -
Taxation: Withholding tax ................................................................ 2 (51,057) (103,972) (142,471) (972,532) - - -Capital gain tax ................................................................ 2 328,956 - (1,342,422) - - - -
(Decrease)/increase in Net assets attributable to holders of redeemable participating shares from investment activities ................................................................ (6,210,415) (47,813,215) 8,483,895 (88,162,301) (1,052,366) 31,236 (233,657)
Gains and losses arose solely from investment activities. There were no gains or losses other than those dealt with in the Statement of Comprehensive Income.

CONDENSED STATEMENT OF COMPREHENSIVE INCOME (continued)
The accompanying notes are an integral part of the financial statements.
Franklin LibertyShares ICAV Interim Report 37
For the period ended 31 December 2021 (continued)
Note
Franklin LibertyQ AC Asia ex Japan
UCITS ETF USD
Franklin LibertyQ Emerging
Markets UCITS ETF
USD
Franklin LibertyQ European Dividend
UCITS ETF EUR
Franklin LibertyQ European Equity
UCITS ETFEUR
Franklin LibertyQ Global Dividend
UCITS ETF USD
Franklin LibertyQ Global Equity SRI
UCITS ETF USD
Franklin LibertyQ U.S. Equity UCITS ETF
USD
Income:
Dividend income ................................................................ 121,304 1,066,951 368,225 117,762 559,410 265,870 1,093,355Interest income ................................................................ (1) (182) (79) 8 (92) 364 90Net (loss)/gain on financial assets/liabilities at fair value through profit or loss ................................ (167,610) (943,106) 775,806 722,546 2,265,818 1,094,978 10,753,708
Total investment (loss)/income ................................ (46,307) 123,663 1,143,952 840,316 2,825,136 1,361,212 11,847,153
Expenses:
Operating expenses ................................................................4 (11,465) (88,445) (27,132) (12,473) (87,590) (45,977) (140,531)
Net (loss)/income ................................................................ (57,772) 35,218 1,116,820 827,843 2,737,546 1,315,235 11,706,622
Finance costs:
Distributions to holders of redeemable participating shares ................................................................9 - - (415,030) - (414,720) - -Interest expense ................................................................ - - (260) (22) (123) (5) -
Taxation: Withholding tax ................................................................ 2 (18,330) (128,441) (12,074) (4,429) (65,663) (30,739) (163,840)Capital gain tax ................................................................ 2 (11,793) (68,697) - - - 1,922 -
(Decrease)/increase in Net assets attributable to holders of redeemable participating shares from investment activities ................................................................ (87,895) (161,920) 689,456 823,392 2,257,040 1,286,413 11,542,782
Gains and losses arose solely from investment activities. There were no gains or losses other than those dealt with in the Statement of Comprehensive Income

CONDENSED STATEMENT OF COMPREHENSIVE INCOME (continued)
The accompanying notes are an integral part of the financial statements.
38 Interim Report Franklin LibertyShares ICAV
For the period ended 31 December 2021 (continued)
Note
Franklin STOXX Europe 600 Paris
Aligned Climate UCITS ETF
EUR
Franklin S&P 500 Paris Aligned
Climate UCITS ETF USD
Income:
Dividend income ................................................................ 62,356 410,734Interest income ................................................................ 32 150Net gain on financial assets/liabilities at fair value through profit or loss ................................ 876,756 8,676,617
Total investment income ................................................................ 939,144 9,087,501
Expenses:
Operating expenses ................................................................4 (8,152) (25,001)
Net income ................................................................ 930,992 9,062,500
Finance costs:
Distributions to holders of redeemable participating shares ................................................................9 - -Interest expense ................................................................ (210) (12)
Taxation: Withholding tax ................................................................ 2 (4,016) (62,364)Capital gain tax ................................................................ 2 - -
Increase in Net assets attributable to holders of redeemable participating shares from investment activities ................................................................................................ 926,766 9,000,124
Gains and losses arose solely from investment activities. There were no gains or losses other than those dealt with in the Statement of Comprehensive Income
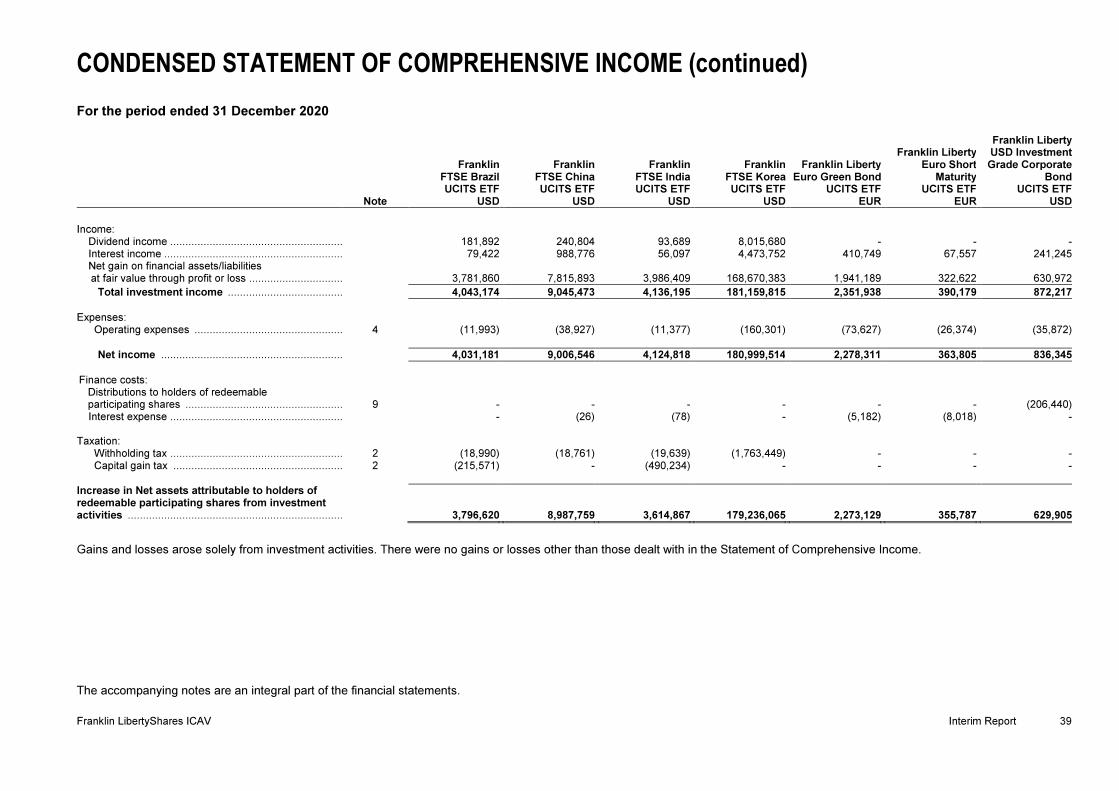
CONDENSED STATEMENT OF COMPREHENSIVE INCOME (continued)
The accompanying notes are an integral part of the financial statements.
Franklin LibertyShares ICAV Interim Report 39
For the period ended 31 December 2020
Note
Franklin FTSE Brazil UCITS ETF
USD
Franklin FTSE China UCITS ETF
USD
Franklin FTSE IndiaUCITS ETF
USD
Franklin FTSE KoreaUCITS ETF
USD
Franklin Liberty Euro Green Bond
UCITS ETF EUR
Franklin Liberty Euro Short
Maturity UCITS ETF
EUR
Franklin Liberty USD Investment Grade Corporate
Bond UCITS ETF
USD
Income:
Dividend income ................................................................ 181,892 240,804 93,689 8,015,680 - - -Interest income ................................................................ 79,422 988,776 56,097 4,473,752 410,749 67,557 241,245Net gain on financial assets/liabilities at fair value through profit or loss ................................ 3,781,860 7,815,893 3,986,409 168,670,383 1,941,189 322,622 630,972
Total investment income ................................................................ 4,043,174 9,045,473 4,136,195 181,159,815 2,351,938 390,179 872,217
Expenses:
Operating expenses ................................................................4 (11,993) (38,927) (11,377) (160,301) (73,627) (26,374) (35,872)
Net income ................................................................ 4,031,181 9,006,546 4,124,818 180,999,514 2,278,311 363,805 836,345
Finance costs:
Distributions to holders of redeemable participating shares ................................................................9 - - - - - - (206,440)Interest expense ................................................................ - (26) (78) - (5,182) (8,018) -
Taxation: Withholding tax ................................................................ 2 (18,990) (18,761) (19,639) (1,763,449) - - -Capital gain tax ................................................................ 2 (215,571) - (490,234) - - - -
Increase in Net assets attributable to holders of redeemable participating shares from investment activities ................................................................................................ 3,796,620 8,987,759 3,614,867 179,236,065 2,273,129 355,787 629,905
Gains and losses arose solely from investment activities. There were no gains or losses other than those dealt with in the Statement of Comprehensive Income.

CONDENSED STATEMENT OF COMPREHENSIVE INCOME (continued)
The accompanying notes are an integral part of the financial statements.
40 Interim Report Franklin LibertyShares ICAV
For the period ended 31 December 2020 (continued)
Note
Franklin LibertyQ AC Asia ex Japan
UCITS ETF USD
Franklin LibertyQ Emerging
Markets UCITS ETF
USD
Franklin LibertyQ European Dividend
UCITS ETF EUR
Franklin LibertyQ European Equity
UCITS ETFEUR
Franklin LibertyQ Global Dividend
UCITS ETF USD
Franklin LibertyQ Global Equity SRI
UCITS ETF USD
Franklin LibertyQ U.S. Equity UCITS ETF
USD
Income:
Dividend income ................................................................ 110,505 924,895 210,852 83,410 346,713 209,881 630,873Interest income ................................................................ 40 (486,440) 58,479 - 4,932 9,275 1,591,336Net gain on financial assets/liabilities at fair value through profit or loss ................................ 862,783 7,568,409 1,379,529 763,941 4,554,106 2,665,160 9,286,495
Total investment income ................................................................ 973,328 8,006,864 1,648,860 847,351 4,905,751 2,884,316 11,508,704
Expenses:
Operating expenses ................................................................4 (10,147) (96,275) (16,517) (9,573) (53,335) (34,426) (71,549)
Net income ................................................................ 963,181 7,910,589 1,632,343 837,778 4,852,416 2,849,890 11,437,155
Finance costs:
Distributions to holders of redeemable participating shares ................................................................9 - - (258,590) - (269,020) - -Interest expense ................................................................ (12) (125) (295) (18) (78) (52) -
Taxation: Withholding tax ................................................................ 2 (15,378) (126,095) (6,176) (5,971) (40,612) (28,214) (95,579)Capital gain tax ................................................................ 2 (36,560) (106,199) - - (447) (6,182) -
Increase in Net assets attributable to holders of redeemable participating shares from investment activities ................................................................................................ 911,231 7,678,170 1,367,282 831,789 4,542,259 2,815,442 11,341,576
Gains and losses arose solely from investment activities. There were no gains or losses other than those dealt with in the Statement of Comprehensive Income
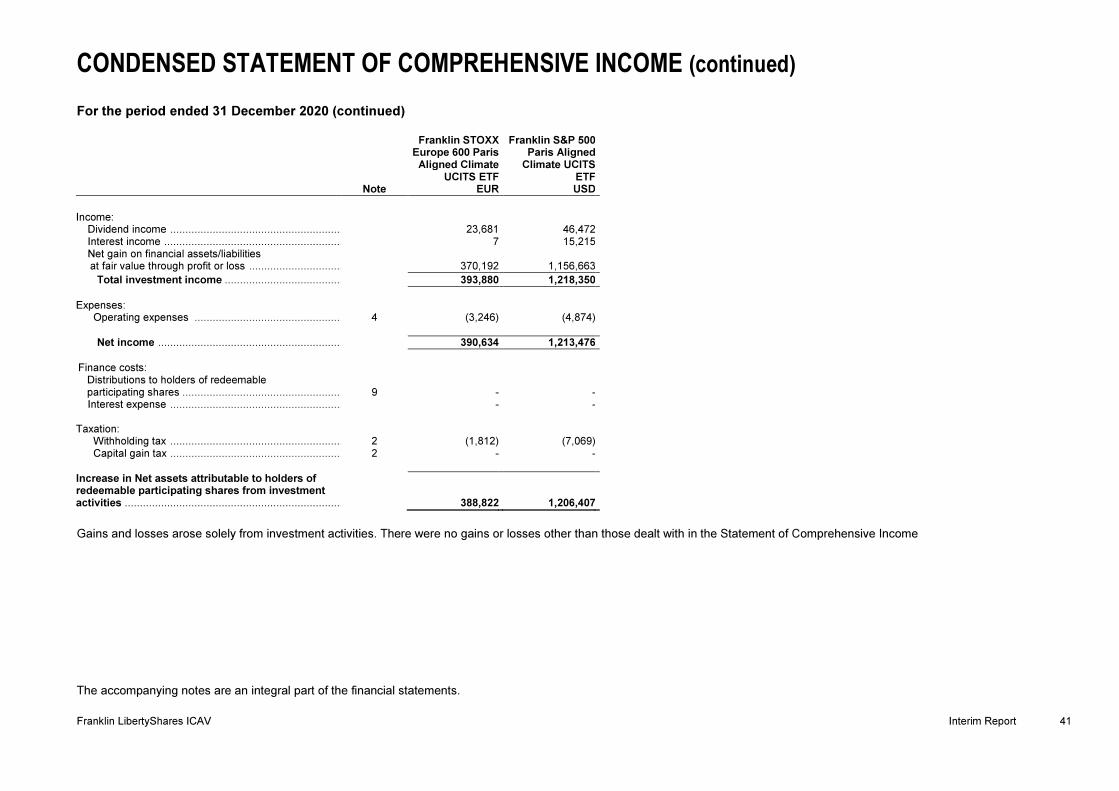
CONDENSED STATEMENT OF COMPREHENSIVE INCOME (continued)
The accompanying notes are an integral part of the financial statements.
Franklin LibertyShares ICAV Interim Report 41
For the period ended 31 December 2020 (continued)
Note
Franklin STOXX Europe 600 Paris
Aligned Climate UCITS ETF
EUR
Franklin S&P 500 Paris Aligned
Climate UCITS ETF USD
Income:
Dividend income ................................................................ 23,681 46,472 Interest income ................................................................ 7 15,215 Net gain on financial assets/liabilities at fair value through profit or loss ................................ 370,192 1,156,663
Total investment income ................................................................ 393,880 1,218,350
Expenses:
Operating expenses ................................................................4 (3,246) (4,874)
Net income ................................................................ 390,634 1,213,476
Finance costs:
Distributions to holders of redeemable participating shares ................................................................9 - - Interest expense ................................................................ - -
Taxation: Withholding tax ................................................................ 2 (1,812) (7,069) Capital gain tax ................................................................ 2 - -
Increase in Net assets attributable to holders of redeemable participating shares from investment activities ................................................................................................ 388,822 1,206,407
Gains and losses arose solely from investment activities. There were no gains or losses other than those dealt with in the Statement of Comprehensive Income
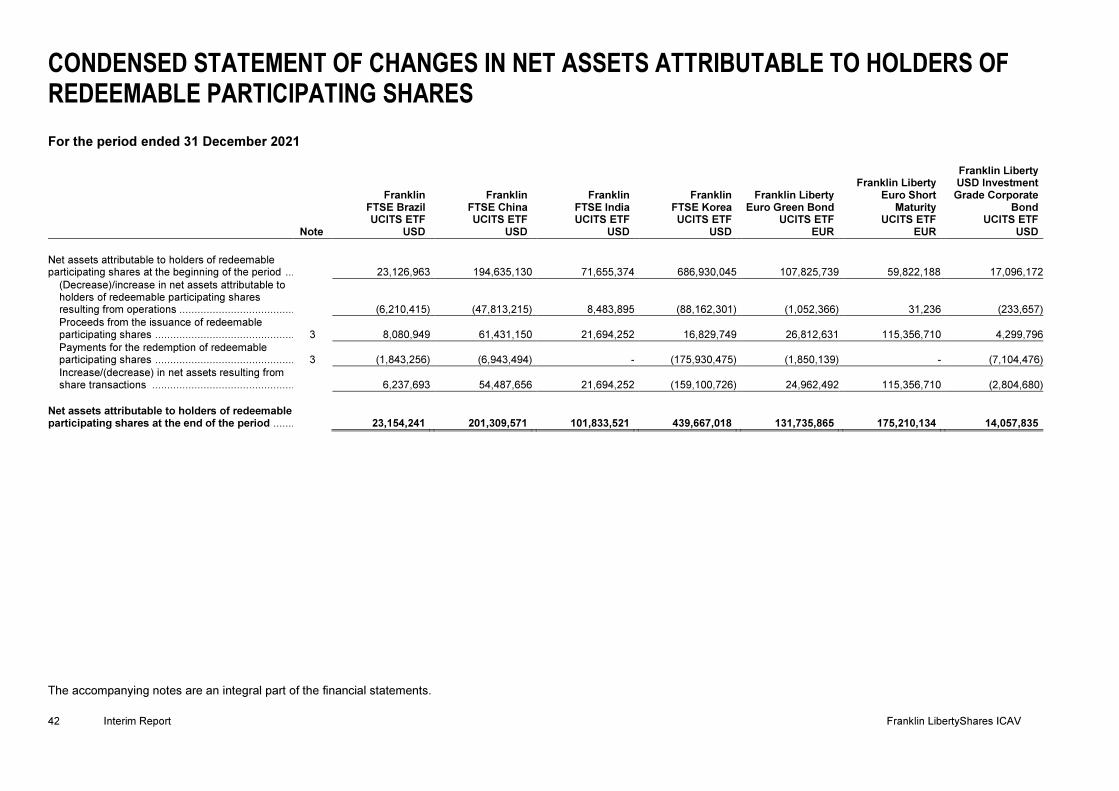
CONDENSED STATEMENT OF CHANGES IN NET ASSETS ATTRIBUTABLE TO HOLDERS OF REDEEMABLE PARTICIPATING SHARES
The accompanying notes are an integral part of the financial statements.
42 Interim Report Franklin LibertyShares ICAV
For the period ended 31 December 2021
Note
Franklin FTSE Brazil UCITS ETF
USD
Franklin FTSE China UCITS ETF
USD
Franklin FTSE India
UCITS ETF USD
Franklin FTSE Korea UCITS ETF
USD
Franklin Liberty Euro Green Bond
UCITS ETF EUR
Franklin Liberty Euro Short
Maturity UCITS ETF
EUR
Franklin Liberty USD Investment Grade Corporate
Bond UCITS ETF
USD
Net assets attributable to holders of redeemable participating shares at the beginning of the period ................................ 23,126,963 194,635,130 71,655,374 686,930,045 107,825,739 59,822,188 17,096,172
(Decrease)/increase in net assets attributable to holders of redeemable participating shares resulting from operations ................................................................ (6,210,415) (47,813,215) 8,483,895 (88,162,301) (1,052,366) 31,236 (233,657)
Proceeds from the issuance of redeemable participating shares ................................................................3 8,080,949 61,431,150 21,694,252 16,829,749 26,812,631 115,356,710 4,299,796
Payments for the redemption of redeemable participating shares ................................................................3 (1,843,256) (6,943,494) - (175,930,475) (1,850,139) - (7,104,476)
Increase/(decrease) in net assets resulting from share transactions ................................................................ 6,237,693 54,487,656 21,694,252 (159,100,726) 24,962,492 115,356,710 (2,804,680)
Net assets attributable to holders of redeemable participating shares at the end of the period ................................ 23,154,241 201,309,571 101,833,521 439,667,018 131,735,865 175,210,134 14,057,835

CONDENSED STATEMENT OF CHANGES IN NET ASSETS ATTRIBUTABLE TO HOLDERS OF REDEEMABLE PARTICIPATING SHARES (continued)
The accompanying notes are an integral part of the financial statements.
Franklin LibertyShares ICAV Interim Report 43
For the period ended 31 December 2021 (continued)
Note
Franklin LibertyQ AC Asia ex Japan
UCITS ETF USD
Franklin LibertyQ Emerging
Markets UCITS ETF
USD
Franklin LibertyQ European Dividend
UCITS ETF EUR
Franklin LibertyQ European Equity
UCITS ETF EUR
Franklin LibertyQ Global Dividend
UCITS ETF USD
Franklin LibertyQ Global Equity SRI
UCITS ETF USD
Franklin LibertyQ U.S. Equity UCITS ETF
USD
Net assets attributable to holders of redeemable participating shares at the beginning of the period ................................ 5,862,137 39,697,532 22,956,014 9,495,587 37,888,805 22,355,251 105,561,917
(Decrease)/increase in net assets attributable to holders of redeemable participating shares resulting from operations ................................................................ (87,895) (161,920) 689,456 823,392 2,257,040 1,286,413 11,542,782
Proceeds from the issuance of redeemable participating shares ................................................................3 - - 6,464,937 - - - 11,464,394
Payments for the redemption of redeemable participating shares ................................................................3 - - (5,195,934) - (3,349,593) - (9,208,139)
Increase/(decrease) in net assets resulting from share transactions ................................................................ - - 1,269,003 - (3,349,593) - 2,256,255
Net assets attributable to holders of redeemable participating shares at the end of the period ................................ 5,774,242 39,535,612 24,914,473 10,318,979 36,796,252 23,641,664 119,360,954
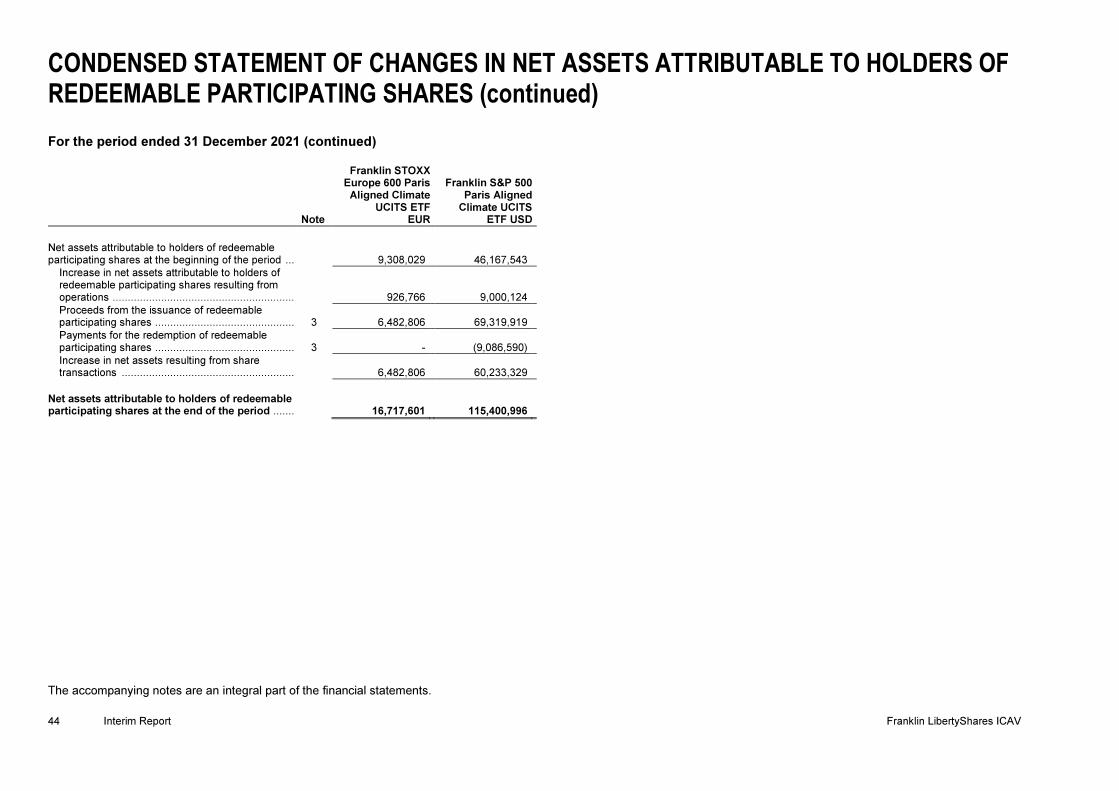
CONDENSED STATEMENT OF CHANGES IN NET ASSETS ATTRIBUTABLE TO HOLDERS OF REDEEMABLE PARTICIPATING SHARES (continued)
The accompanying notes are an integral part of the financial statements.
44 Interim Report Franklin LibertyShares ICAV
For the period ended 31 December 2021 (continued)
Note
Franklin STOXX Europe 600 Paris
Aligned Climate UCITS ETF
EUR
Franklin S&P 500 Paris Aligned
Climate UCITS ETF USD
Net assets attributable to holders of redeemable participating shares at the beginning of the period ................................ 9,308,029 46,167,543
Increase in net assets attributable to holders of redeemable participating shares resulting from operations ................................................................ 926,766 9,000,124
Proceeds from the issuance of redeemable participating shares ................................................................3 6,482,806 69,319,919
Payments for the redemption of redeemable participating shares ................................................................3 - (9,086,590)
Increase in net assets resulting from share transactions ................................................................ 6,482,806 60,233,329
Net assets attributable to holders of redeemable participating shares at the end of the period ................................ 16,717,601 115,400,996

CONDENSED STATEMENT OF CHANGES IN NET ASSETS ATTRIBUTABLE TO HOLDERS OF REDEEMABLE PARTICIPATING SHARES (continued)
The accompanying notes are an integral part of the financial statements.
Franklin LibertyShares ICAV Interim Report 45
For the period ended 31 December 2020
Note
Franklin FTSE Brazil UCITS ETF
USD
Franklin FTSE China UCITS ETF
USD
Franklin FTSE India
UCITS ETF USD
Franklin FTSE Korea UCITS ETF
USD
Franklin Liberty Euro Green Bond
UCITS ETF EUR
Franklin Liberty Euro Short
Maturity UCITS ETF
EUR
Franklin Liberty USD Investment Grade Corporate
Bond UCITS ETF
USD
Net assets attributable to holders of redeemable participating shares at the beginning of the period ................................ 10,642,572 24,414,681 9,431,488 155,387,818 25,055,354 33,194,289 18,516,316
Increase in net assets attributable to holders of redeemable participating shares resulting from operations ................................................................ 3,796,620 8,987,759 3,614,867 179,236,065 2,273,129 355,787 629,905
Proceeds from the issuance of redeemable participating shares ................................................................3 1,716,579 43,098,114 3,828,592 361,899,176 51,915,696 3,989,659 4,330,357
Payments for the redemption of redeemable participating shares ................................................................3 - - - - - (2,248,444) (4,381,304)
Increase/(decrease) in net assets resulting from share transactions ................................................................ 1,716,579 43,098,114 3,828,592 361,899,176 51,915,696 1,741,215 (50,947)
Net assets attributable to holders of redeemable participating shares at the end of the period ................................ 16,155,771 76,500,554 16,874,947 696,523,059 79,244,179 35,291,291 19,095,274

CONDENSED STATEMENT OF CHANGES IN NET ASSETS ATTRIBUTABLE TO HOLDERS OF REDEEMABLE PARTICIPATING SHARES (continued)
The accompanying notes are an integral part of the financial statements.
46 Interim Report Franklin LibertyShares ICAV
For the period ended 31 December 2020 (continued)
Note
Franklin LibertyQ AC Asia ex Japan
UCITS ETF USD
Franklin LibertyQ Emerging
Markets UCITS ETF
USD
Franklin LibertyQ European Dividend
UCITS ETF EUR
Franklin LibertyQ European Equity
UCITS ETF EUR
Franklin LibertyQ Global Dividend
UCITS ETF USD
Franklin LibertyQ Global Equity SRI
UCITS ETF USD
Franklin LibertyQ U.S. Equity UCITS ETF
USD
Net assets attributable to holders of redeemable participating shares at the beginning of the period ................................ 4,608,286 39,233,342 10,646,513 7,372,473 23,745,588 16,981,039 46,908,719
Increase in net assets attributable to holders of redeemable participating shares resulting from operations ................................................................ 911,231 7,678,170 1,367,282 831,789 4,542,259 2,815,442 11,341,576
Proceeds from the issuance of redeemable participating shares ................................................................3 - - 11,201,231 - 5,557,592 6,144,732 46,243,657
Payments for the redemption of redeemable participating shares ................................................................3 - (4,693,299) (2,132,666) - (5,100,910) (5,742,865) (13,770,587)
(Decrease)/increase in net assets resulting from share transactions ................................................................ - (4,693,299) 9,068,565 - 456,682 401,867 32,473,070
Net assets attributable to holders of redeemable participating shares at the end of the period ................................ 5,519,517 42,218,213 21,082,360 8,204,262 28,744,529 20,198,348 90,723,365

CONDENSED STATEMENT OF CHANGES IN NET ASSETS ATTRIBUTABLE TO HOLDERS OF REDEEMABLE PARTICIPATING SHARES (continued)
The accompanying notes are an integral part of the financial statements.
Franklin LibertyShares ICAV Interim Report 47
For the period ended 31 December 2020 (continued)
Note
Franklin STOXX Europe 600 Paris
Aligned Climate UCITS ETF*
EUR
Franklin S&P 500 Paris Aligned
Climate UCITS*ETF USD
Net assets attributable to holders of redeemable participating shares at the beginning of the period ................................ - -
Increase in net assets attributable to holders of redeemable participating shares resulting from operations ................................................................ 388,822 1,206,407
Proceeds from the issuance of redeemable participating shares ................................................................3 5,008,114 10,525,376
Payments for the redemption of redeemable participating shares ................................................................3 - -
Increase in net assets resulting from share transactions ................................................................ 5,008,114 10,525,376
Net assets attributable to holders of redeemable participating shares at the end of the period ................................ 5,396,936 11,731,783
* The Fund launched post 31 December 2019.
NOTES TO THE CONDENSED FINANCIAL STATEMENTS FOR THE PERIOD ENDED 31 DECEMBER 2021
48 Interim Report Franklin LibertyShares ICAV
1. Significant Accounting Policies
The principal accounting policies applied in the preparation of these financial statements are consistent with those of the
annual audited financial statements for the financial year ended 30 June 2021, as described in those financial statements.
a) Basis of Preparation
The ICAV’s unaudited condensed interim financial statements have been prepared in accordance with Financial Reporting
Standard 104 (“FRS 104”) Interim Financial Reporting, Irish statute comprising the Irish Collective Asset-Management
Vehicles Act 2015 (as amended) (the “ICAV Act”) and the Central Bank’s (Supervision and Enforcement) Act 2013 (section
48(1)) UCITS Regulations 2019, (the "Central Bank UCITS Regulations").
The financial statements are prepared under the historical cost convention as modified by the revaluation of financial
assets and financial liabilities at fair value through profit or loss.
In preparation of financial statements in conformity with FRS 104, the ICAV is required to make certain accounting
estimates and assumptions. Actual results may differ from these estimates and assumptions. The Directors believe that
any estimates used in preparing the financial statements are reasonable and prudent. Critical accounting estimates are
those which involve the most complex or subjective judgments or assessments. The areas of the ICAV’s business that
typically require such estimates are the determination of the fair value of financial assets and liabilities.
The Directors have a reasonable expectation that the ICAV has adequate resources to continue in operation and existence
for the foreseeable future. Therefore the Sub-Funds of the ICAV continue to adopt the going concern basis of accounting in
preparing these condensed financial statements.
The ICAV is availing of the exemption available to open-ended investment funds under FRS 104 and is not presenting a
cash flow statement.
b) Functional and Presentation Currency
Items included in each Sub-Fund's financial statements are measured using the currency of the primary economic
environment in which the relevant Sub-Fund operates (the “functional currency”). The functional or base currency of each
Sub-Fund is detailed in the General Information section. The ICAV also has adopted these functional currencies as the
presentation currency of each of the Sub-Funds.
Transactions in foreign currencies are translated into the functional currency at the exchange rate at the date of the
transaction. Monetary assets and liabilities denominated in foreign currencies at the reporting date are retranslated into the
functional currency of the Sub-Fund at the exchange rate at that date.
Non-monetary assets and liabilities denominated in foreign currencies that are measured at fair value are retranslated into
the functional currency of the Sub-Fund at the exchange rate at the date on which fair value was determined.
Any foreign currency differences arising on retranslation are recognised in the Condensed Statement of Comprehensive
Income in net gain/(loss) on investment activities, including those arising on financial instruments at fair value through profit
or loss (“FVTPL”), which are recognised as a component of net gain/(loss) on investment activities at fair value through
profit or loss.

NOTES TO THE CONDENSED FINANCIAL STATEMENTS FOR THE PERIOD ENDED 31 DECEMBER 2021 (continued)
Franklin LibertyShares ICAV Interim Report 49
2. Taxation
The ICAV is an investment undertaking as defined in section 739B of the Taxes Consolidation Act, 1997, as amended (the
“TCA”). On that basis, the ICAV is not liable to Irish tax in respect of its income and gains, provided the ICAV is resident for
tax purposes in Ireland. The ICAV shall be regarded as resident for tax purposes in Ireland provided it is authorised by the
Central Bank of Ireland and it is centrally managed and controlled in Ireland.
However, Irish tax can arise on the happening of a “chargeable event” in the ICAV. A chargeable event arises on any
distributions, redemption, repurchase, cancellation, transfer of Shares or the ending of a “relevant period”. A relevant period
is an eight year period beginning with the acquisition of the Shares by the shareholder and each subsequent period of eight
years beginning immediately after the preceding relevant period. A chargeable event does not include:
i) Any transactions in relation to shares held in a recognised clearing system as designated by order of the Revenue Commissioners of Ireland; or
ii) An exchange of shares representing one Sub-Fund for another Sub-Fund of the ICAV; or iii) An exchange of shares arising on a qualifying amalgamation or reconstruction of the ICAV with another fund;
or iv) Certain exchanges of shares between spouses and former spouses.
No Irish tax will arise in respect of chargeable events in respect of a Shareholder who is an Exempt Irish Investor (as
defined in Section 739D TCA) or in respect of a Shareholder who is neither Irish resident nor ordinarily resident in Ireland at
the time of the chargeable event provided that a relevant declaration is in place (in accordance with Schedule 2B of the
TCA) and the ICAV is not in possession of any information which would reasonably suggest that the information contained
therein is no longer materially correct.
In the absence of an appropriate declaration, the ICAV will be liable for Irish tax on the occurrence of a chargeable event,
and the ICAV reserves its right to withhold such taxes from the relevant shareholders. There were no chargeable events
during the period under review.
The ICAV is required to recognise a tax liability when it is probable that the tax laws of foreign countries require a tax
liability to be assessed on the Sub-Fund’s capital gains sourced from such foreign country, assuming the relevant taxing
authorities have full knowledge of all the facts and circumstances. The tax liability is then measured at the amount
expected to be paid to the relevant taxation authorities, using the tax laws and rates that have been enacted or
substantively enacted by the end of the reporting period. There is sometimes uncertainty about the way enacted tax law is
applied to offshore investment funds. This creates uncertainty about whether or not a tax liability will ultimately be paid by
the Fund. Therefore, when measuring any uncertain tax liabilities, management considers all of the relevant facts and
circumstances available at the time that could influence the likelihood of payment, including any formal or informal practices
of the relevant tax authorities.

NOTES TO THE CONDENSED FINANCIAL STATEMENTS FOR THE PERIOD ENDED 31 DECEMBER 2021 (continued)
50 Interim Report Franklin LibertyShares ICAV
2. Taxation (continued)
Dividends, interest and capital gains (if any) received on investments made by the ICAV may be subject to withholding
taxes imposed by foreign countries from which the investment income/gains are received and such taxes may not be
recoverable by the ICAV and its shareholders. Withholding tax and reclaims incurred on dividends are recorded on ex-date.
Dividends receivable are shown net of withholding taxes payable, if any, in the Condensed Statement of Financial Position.
The ICAV may be subject to taxes imposed on realised and unrealised gains on securities of certain foreign countries in
which the ICAV invests. Income/gains are received and such taxes may not be recoverable by the ICAV and its
shareholders. Many of these foreign countries have tax laws that indicate that capital gains taxes may be applicable to non
residents, such as the ICAV. Typically, these capital gains taxes are required to be determined on a self assessment basis;
therefore, such taxes may not be deducted by the ICAV’s broker on a ‘withholding’ basis. The foreign tax expense, if any, is
recorded on an accrual basis and is included in “Capital gains taxes” in the Condensed Statement of Comprehensive
Income. Capital gains tax for the period ended 31 December 2021 and 31 December 2020 was accrued on gains on
Franklin FTSE Brazil UCITS ETF, Franklin FTSE India UCITS ETF, Franklin LibertyQ AC Asia ex Japan UCITS ETF,
Franklin LibertyQ Emerging Markets UCITS ETF, Franklin LibertyQ Global Equity SRI UCITS ETF. The amount of foreign
tax owed, if any, is included in “Capital gains tax payable” in the Condensed Statement of Financial Position. Capital gains,
dividends and interest received may be subject to withholding taxes imposed by the country of origin and such taxes may
not be recoverable by the ICAV or its shareholders. The dividend withholding tax charge for the period ended 31 December
2021 and 31 December 2020 is presented in the Condensed Statement of Comprehensive Income. The capital gains tax
payable on unrealised gains for the period ended 31 December 2021 and year ended 30 June 2021 is presented in the
Condensed Statement of Financial Position.
The ICAV considers interest and penalties on related tax liabilities to be an inseparable element of the tax liability and
accounts for interest and penalties. These amounts would be included within the tax line in the Condensed Statement of
Comprehensive Income, and the liability, if any, would be included within the income tax liability on the Condensed
Statement of Financial Position.
In respect of the period ended 31 December 2021 and year ended 30 June 2021, the ICAV has measured uncertain tax
liabilities and related interest and penalties with respect to foreign capital gains taxes at nil. While this represents
management’s best estimate, the estimated value could differ significantly from the amount ultimately payable.
Reporting Fund Status
The ICAV has received confirmation from HM Revenue & Customs (HMRC) in the UK that it has been granted UK
Reporting Fund Status with effect from the launch dates of all Sub-Funds for UK tax purposes.
NOTES TO THE CONDENSED FINANCIAL STATEMENTS FOR THE PERIOD ENDED 31 DECEMBER 2021 (continued)
Franklin LibertyShares ICAV Interim Report 51
3. Share Capital & Net Asset Value per Share
Authorised
The authorised share capital of the ICAV is 500,000,000,002 shares of no par value divided into 2 subscriber shares of no
par value and 500,000,000,000 redeemable participating shares of no par value. The Directors have the power to issue all
of the shares of the ICAV on such terms as they think fit.
Subscriber Shares
The ICAV issued the 2 subscriber shares of no par value at EUR 1 each for the purpose of the registration of the ICAV. The
subscriber shares entitle the holders to attend and vote at general meetings of the ICAV but do not entitle the holders to
participate in the profits or assets of the ICAV except for a return of capital on a winding-up. They do not form part of the
Net Asset Value of the ICAV and are thus disclosed in the financial statements by way of this note only.
Redeemable Participating Shares
Each of the shares entitles the holder to attend and vote at any general meetings of the ICAV and to participate equally in
the profits and assets of the Sub-Fund to which the shares relate, subject to any differences between fees, charges and
expenses applicable to different classes. Each shareholder shall have one vote for each whole share held. The liability of
the shareholders shall be limited to the amount, if any, unpaid on the shares respectively held by them, and the
shareholders shall not be liable for the debts of the Sub-Fund. Minimum creation and redemption amounts are specified in
the relevant Supplement for each Sub-Fund.
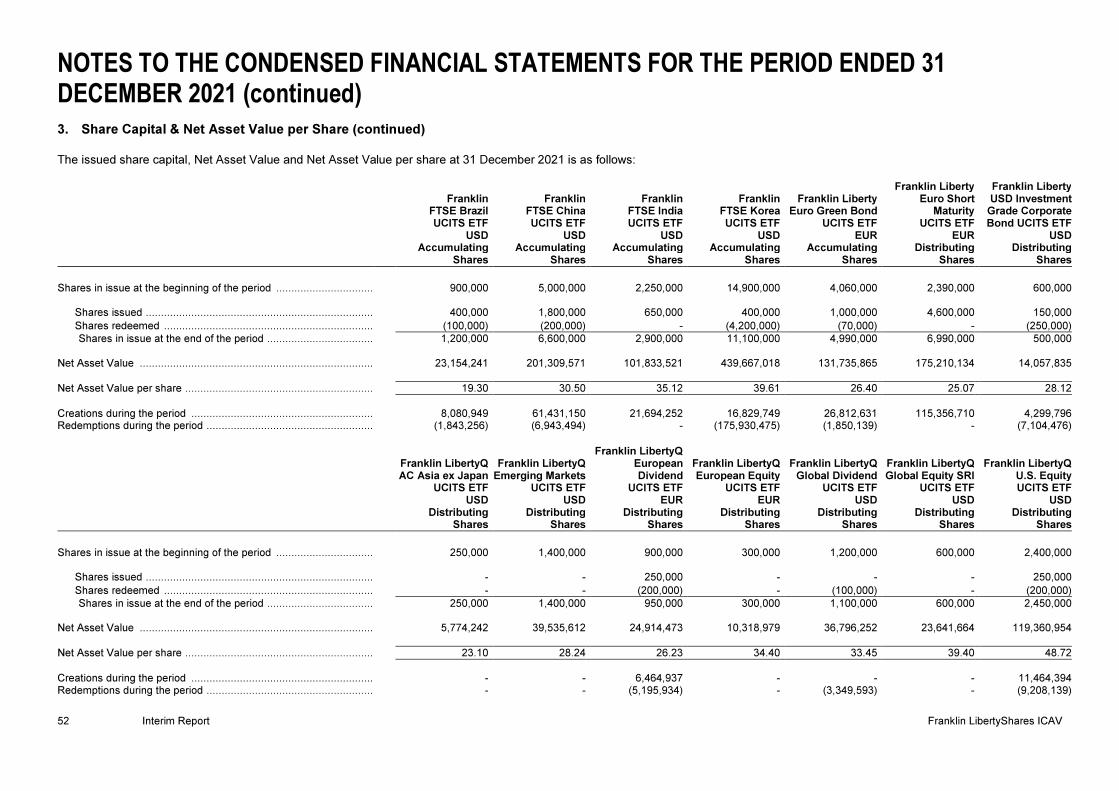
NOTES TO THE CONDENSED FINANCIAL STATEMENTS FOR THE PERIOD ENDED 31 DECEMBER 2021 (continued)
52 Interim Report Franklin LibertyShares ICAV
3. Share Capital & Net Asset Value per Share (continued)
The issued share capital, Net Asset Value and Net Asset Value per share at 31 December 2021 is as follows:
Franklin FTSE Brazil UCITS ETF
USD
Franklin FTSE China UCITS ETF
USD
Franklin FTSE IndiaUCITS ETF
USD
Franklin FTSE KoreaUCITS ETF
USD
Franklin LibertyEuro Green Bond
UCITS ETFEUR
Franklin Liberty Euro Short
Maturity UCITS ETF
EUR
Franklin Liberty USD Investment
Grade Corporate Bond UCITS ETF
USD
Accumulating
Shares Accumulating
SharesAccumulating
SharesAccumulating
SharesAccumulating
SharesDistributing
Shares Distributing
Shares
Shares in issue at the beginning of the period ................................................................ 900,000 5,000,000 2,250,000 14,900,000 4,060,000 2,390,000 600,000
Shares issued ................................................................................................ 400,000 1,800,000 650,000 400,000 1,000,000 4,600,000 150,000
Shares redeemed ................................................................................................ (100,000) (200,000) - (4,200,000) (70,000) - (250,000)
Shares in issue at the end of the period ................................................................ 1,200,000 6,600,000 2,900,000 11,100,000 4,990,000 6,990,000 500,000 Net Asset Value ................................................................................................ 23,154,241 201,309,571 101,833,521 439,667,018 131,735,865 175,210,134 14,057,835
Net Asset Value per share ................................................................ 19.30 30.50 35.12 39.61 26.40 25.07 28.12
Creations during the period ................................................................ 8,080,949 61,431,150 21,694,252 16,829,749 26,812,631 115,356,710 4,299,796 Redemptions during the period ................................................................ (1,843,256) (6,943,494) - (175,930,475) (1,850,139) - (7,104,476)
Franklin LibertyQ AC Asia ex Japan
UCITS ETF USD
Franklin LibertyQEmerging Markets
UCITS ETFUSD
Franklin LibertyQEuropeanDividend
UCITS ETFEUR
Franklin LibertyQ European Equity
UCITS ETFEUR
Franklin LibertyQ Global Dividend
UCITS ETFUSD
Franklin LibertyQ Global Equity SRI
UCITS ETF USD
Franklin LibertyQ U.S. Equity UCITS ETF
USD
Distributing
Shares Distributing
SharesDistributing
SharesDistributing
SharesDistributing
SharesDistributing
Shares Distributing
Shares
Shares in issue at the beginning of the period ................................................................ 250,000 1,400,000 900,000 300,000 1,200,000 600,000 2,400,000
Shares issued ................................................................................................ - - 250,000 - - - 250,000
Shares redeemed ................................................................................................ - - (200,000) - (100,000) - (200,000)
Shares in issue at the end of the period ................................................................ 250,000 1,400,000 950,000 300,000 1,100,000 600,000 2,450,000 Net Asset Value ................................................................................................ 5,774,242 39,535,612 24,914,473 10,318,979 36,796,252 23,641,664 119,360,954
Net Asset Value per share ................................................................ 23.10 28.24 26.23 34.40 33.45 39.40 48.72
Creations during the period ................................................................ - - 6,464,937 - - - 11,464,394 Redemptions during the period ................................................................ - - (5,195,934) - (3,349,593) - (9,208,139)

NOTES TO THE CONDENSED FINANCIAL STATEMENTS FOR THE PERIOD ENDED 31 DECEMBER 2021 (continued)
Franklin LibertyShares ICAV Interim Report 53
3. Share Capital & Net Asset Value per Share (continued)
The issued share capital, Net Asset Value and Net Asset Value per share at 31 December 2021 is as follows (continued):
Franklin STOXX Europe 600 Paris
Aligned Climate UCITS ETF
EUR
Franklin S&P 500 Paris Aligned
Climate UCITS ETF
USD
Accumulating
Shares Accumulating
Shares
Shares in issue at the beginning of the period ................................................................ 300,000 1,350,000
Shares issued ................................................................................................ 200,000 1,900,000
Shares redeemed ................................................................................................ - (250,000)
Shares in issue at the end of the period ................................................................ 500,000 3,000,000 Net Asset Value ................................................................................................ 16,717,601 115,400,996
Net Asset Value per share ................................................................ 33.44 38.47
Creations during the period ................................................................ 6,482,806 69,319,919 Redemptions during the period ................................................................ - (9,086,590)
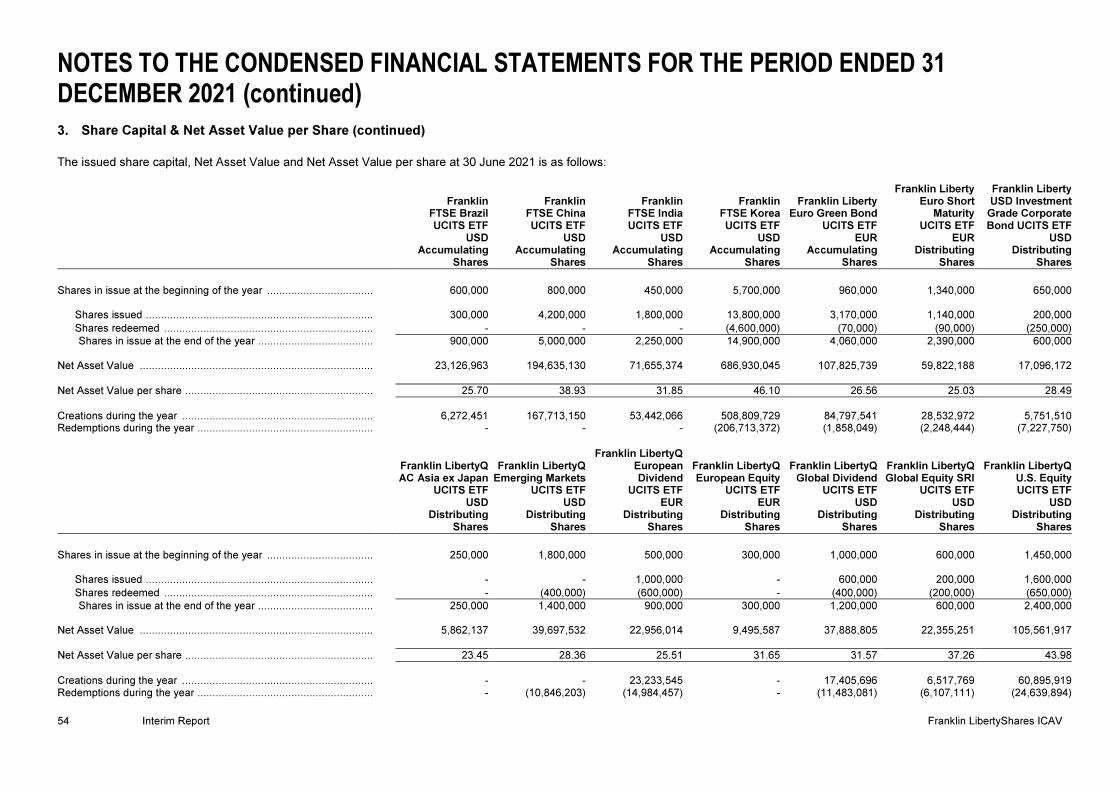
NOTES TO THE CONDENSED FINANCIAL STATEMENTS FOR THE PERIOD ENDED 31 DECEMBER 2021 (continued)
54 Interim Report Franklin LibertyShares ICAV
3. Share Capital & Net Asset Value per Share (continued)
The issued share capital, Net Asset Value and Net Asset Value per share at 30 June 2021 is as follows:
Franklin FTSE Brazil UCITS ETF
USD
Franklin FTSE China UCITS ETF
USD
Franklin FTSE India UCITS ETF
USD
Franklin FTSE Korea UCITS ETF
USD
Franklin LibertyEuro Green Bond
UCITS ETF EUR
Franklin Liberty Euro Short
Maturity UCITS ETF
EUR
Franklin Liberty USD Investment
Grade Corporate Bond UCITS ETF
USD
Accumulating
Shares Accumulating
SharesAccumulating
SharesAccumulating
SharesAccumulating
SharesDistributing
Shares Distributing
Shares
Shares in issue at the beginning of the year ................................................................ 600,000 800,000 450,000 5,700,000 960,000 1,340,000 650,000
Shares issued ................................................................................................ 300,000 4,200,000 1,800,000 13,800,000 3,170,000 1,140,000 200,000
Shares redeemed ................................................................................................ - - - (4,600,000) (70,000) (90,000) (250,000)
Shares in issue at the end of the year ................................................................ 900,000 5,000,000 2,250,000 14,900,000 4,060,000 2,390,000 600,000 Net Asset Value ................................................................................................ 23,126,963 194,635,130 71,655,374 686,930,045 107,825,739 59,822,188 17,096,172
Net Asset Value per share ................................................................ 25.70 38.93 31.85 46.10 26.56 25.03 28.49
Creations during the year ................................................................ 6,272,451 167,713,150 53,442,066 508,809,729 84,797,541 28,532,972 5,751,510 Redemptions during the year ................................................................ - - - (206,713,372) (1,858,049) (2,248,444) (7,227,750)
Franklin LibertyQ AC Asia ex Japan
UCITS ETF USD
Franklin LibertyQEmerging Markets
UCITS ETFUSD
Franklin LibertyQEuropeanDividend
UCITS ETFEUR
Franklin LibertyQ European Equity
UCITS ETFEUR
Franklin LibertyQ Global Dividend
UCITS ETFUSD
Franklin LibertyQ Global Equity SRI
UCITS ETF USD
Franklin LibertyQ U.S. Equity UCITS ETF
USD
Distributing
Shares Distributing
SharesDistributing
SharesDistributing
SharesDistributing
SharesDistributing
Shares Distributing
Shares
Shares in issue at the beginning of the year ................................................................ 250,000 1,800,000 500,000 300,000 1,000,000 600,000 1,450,000
Shares issued ................................................................................................ - - 1,000,000 - 600,000 200,000 1,600,000
Shares redeemed ................................................................................................ - (400,000) (600,000) - (400,000) (200,000) (650,000)
Shares in issue at the end of the year ................................................................ 250,000 1,400,000 900,000 300,000 1,200,000 600,000 2,400,000 Net Asset Value ................................................................................................ 5,862,137 39,697,532 22,956,014 9,495,587 37,888,805 22,355,251 105,561,917
Net Asset Value per share ................................................................ 23.45 28.36 25.51 31.65 31.57 37.26 43.98
Creations during the year ................................................................ - - 23,233,545 - 17,405,696 6,517,769 60,895,919 Redemptions during the year ................................................................ - (10,846,203) (14,984,457) - (11,483,081) (6,107,111) (24,639,894)

NOTES TO THE CONDENSED FINANCIAL STATEMENTS FOR THE PERIOD ENDED 31 DECEMBER 2021 (continued)
Franklin LibertyShares ICAV Interim Report 55
3. Share Capital & Net Asset Value per Share (continued)
The issued share capital, Net Asset Value and Net Asset Value per share at 30 June 2021 is as follows (continued):
Franklin STOXX Europe 600 Paris
Aligned Climate UCITS ETF
EUR
Franklin S&P 500 Paris Aligned
Climate UCITS ETF
USD
Accumulating
SharesAccumulating
Shares
Shares in issue at the beginning of the year ................................................................ - -
Shares issued ................................................................................................ 300,000 2,050,000
Shares redeemed ................................................................................................ - (700,000)
Shares in issue at the end of the year ................................................................ 300,000 1,350,000 Net Asset Value ................................................................................................ 9,308,029 46,167,543
Net Asset Value per share ................................................................ 31.03 34.20
Creations during the year ................................................................................................ 8,083,673 61,250,388 Redemptions during the year ................................................................ - (21,141,027)

NOTES TO THE CONDENSED FINANCIAL STATEMENTS FOR THE PERIOD ENDED 31 DECEMBER 2021 (continued)
56 Interim Report Franklin LibertyShares ICAV
3. Share Capital & Net Asset Value per Share (continued)
The issued share capital, Net Asset Value and Net Asset Value per share at 31 December 2020 is as follows:
Franklin FTSE Brazil UCITS ETF
USD
Franklin FTSE China UCITS ETF
USD
Franklin FTSE IndiaUCITS ETF
USD
Franklin FTSE Korea UCITS ETF
USD
Franklin LibertyEuro Green Bond
UCITS ETFEUR
Franklin Liberty Euro Short
Maturity UCITS ETF
EUR
Franklin Liberty USD Investment
Grade Corporate Bond UCITS ETF
USD
Accumulating
Shares Accumulating
SharesAccumulating
SharesAccumulating
SharesAccumulating
SharesDistributing
Shares Distributing
Shares
Shares in issue at the beginning of the period ................................................................ 600,000 800,000 450,000 5,700,000 960,000 1,340,000 650,000
Shares issued ................................................................................................ 100,000 1,200,000 150,000 10,700,000 1,950,000 160,000 150,000
Shares redeemed ................................................................................................ - - - - - (90,000) (150,000)
Shares in issue at the end of the period ................................................................ 700,000 2,000,000 600,000 16,400,000 2,910,000 1,410,000 650,000 Net Asset Value ................................................................................................ 16,155,771 76,500,554 16,874,947 696,523,059 79,244,179 35,291,291 19,095,274
Net Asset Value per share ................................................................ 23.08 38.25 28.12 42.47 27.23 25.03 29.38
Creations during the period ................................................................ 1,716,579 43,098,114 3,828,592 361,899,176 51,915,696 3,989,659 4,330,357 Redemptions during the period ................................................................ - - - - - (2,248,444) (4,381,304)
Franklin LibertyQ AC Asia ex Japan
UCITS ETF USD
Franklin LibertyQEmerging Markets
UCITS ETFUSD
Franklin LibertyQEuropeanDividend
UCITS ETFEUR
Franklin LibertyQ European Equity
UCITS ETFEUR
Franklin LibertyQ Global Dividend
UCITS ETFUSD
Franklin LibertyQ Global Equity SRI
UCITS ETF USD
Franklin LibertyQ U.S. Equity UCITS ETF
USD
Distributing
Shares Distributing
SharesDistributing
SharesDistributing
SharesDistributing
SharesDistributing
Shares Distributing
Shares
Shares in issue at the beginning of the period ................................................................ 250,000 1,800,000 500,000 300,000 1,000,000 600,000 1,450,000
Shares issued ................................................................................................ - - 500,000 - 200,000 200,000 1,300,000
Shares redeemed ................................................................................................ - (200,000) (100,000) - (200,000) (200,000) (400,000)
Shares in issue at the end of the period ................................................................ 250,000 1,600,000 900,000 300,000 1,000,000 600,000 2,350,000 Net Asset Value ................................................................................................ 5,519,517 42,218,213 21,082,360 8,204,262 28,744,529 20,198,348 90,723,365
Net Asset Value per share ................................................................ 22.08 26.39 23.42 27.35 28.74 33.66 38.61
Creations during the period ................................................................ - - 11,201,231 - 5,557,592 6,144,732 46,243,657 Redemptions during the period ................................................................ - (4,693,299) (2,132,666) - (5,100,910) (5,742,865) (13,770,587)
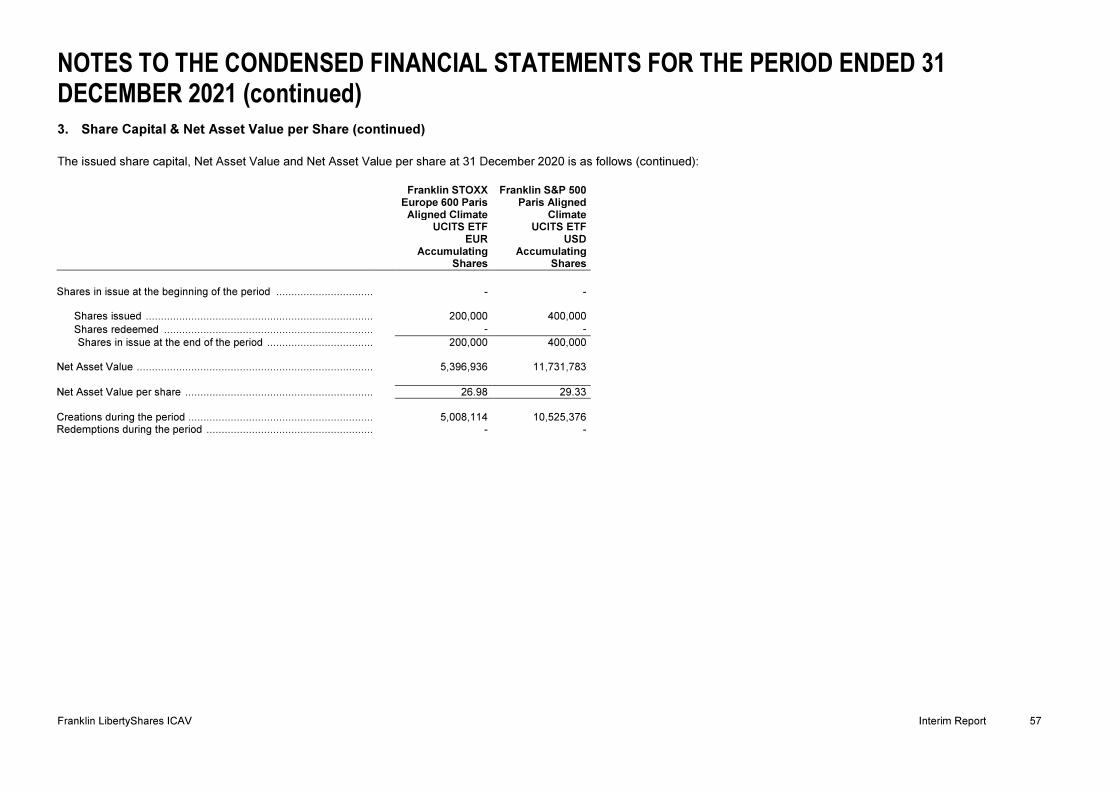
NOTES TO THE CONDENSED FINANCIAL STATEMENTS FOR THE PERIOD ENDED 31 DECEMBER 2021 (continued)
Franklin LibertyShares ICAV Interim Report 57
3. Share Capital & Net Asset Value per Share (continued)
The issued share capital, Net Asset Value and Net Asset Value per share at 31 December 2020 is as follows (continued):
Franklin STOXX Europe 600 Paris
Aligned Climate UCITS ETF
EUR
Franklin S&P 500 Paris Aligned
Climate UCITS ETF
USD
Accumulating
Shares Accumulating
Shares
Shares in issue at the beginning of the period ................................................................ - -
Shares issued ................................................................................................ 200,000 400,000
Shares redeemed ................................................................................................ - -
Shares in issue at the end of the period ................................................................ 200,000 400,000 Net Asset Value ................................................................................................ 5,396,936 11,731,783
Net Asset Value per share ................................................................ 26.98 29.33
Creations during the period ................................................................ 5,008,114 10,525,376 Redemptions during the period ................................................................ - -
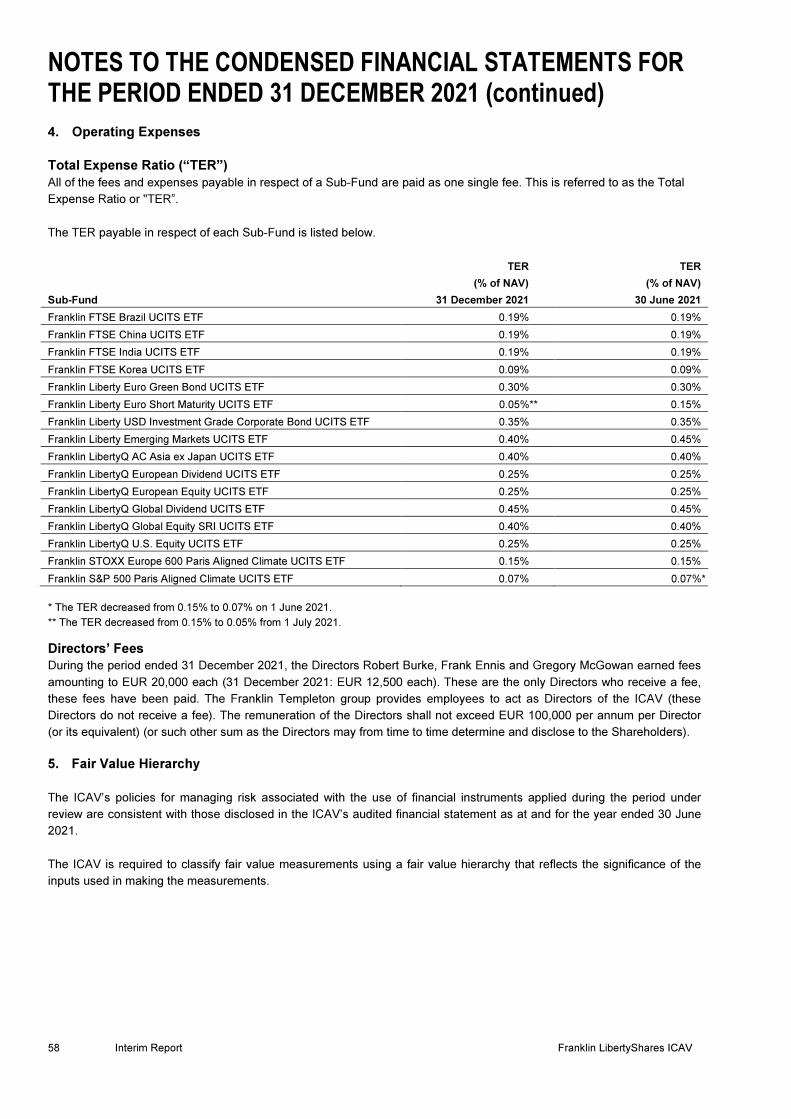
NOTES TO THE CONDENSED FINANCIAL STATEMENTS FOR THE PERIOD ENDED 31 DECEMBER 2021 (continued)
58 Interim Report Franklin LibertyShares ICAV
4. Operating Expenses
Total Expense Ratio (“TER”)
All of the fees and expenses payable in respect of a Sub-Fund are paid as one single fee. This is referred to as the Total
Expense Ratio or "TER”.
The TER payable in respect of each Sub-Fund is listed below.
Sub-Fund
TER
(% of NAV)
31 December 2021
TER
(% of NAV)
30 June 2021
Franklin FTSE Brazil UCITS ETF 0.19% 0.19%
Franklin FTSE China UCITS ETF 0.19% 0.19%
Franklin FTSE India UCITS ETF 0.19% 0.19%
Franklin FTSE Korea UCITS ETF 0.09% 0.09%
Franklin Liberty Euro Green Bond UCITS ETF 0.30% 0.30%
Franklin Liberty Euro Short Maturity UCITS ETF 0.05%** 0.15%
Franklin Liberty USD Investment Grade Corporate Bond UCITS ETF 0.35% 0.35%
Franklin Liberty Emerging Markets UCITS ETF 0.40% 0.45%
Franklin LibertyQ AC Asia ex Japan UCITS ETF 0.40% 0.40%
Franklin LibertyQ European Dividend UCITS ETF 0.25% 0.25%
Franklin LibertyQ European Equity UCITS ETF 0.25% 0.25%
Franklin LibertyQ Global Dividend UCITS ETF 0.45% 0.45%
Franklin LibertyQ Global Equity SRI UCITS ETF 0.40% 0.40%
Franklin LibertyQ U.S. Equity UCITS ETF 0.25% 0.25%
Franklin STOXX Europe 600 Paris Aligned Climate UCITS ETF 0.15% 0.15%
Franklin S&P 500 Paris Aligned Climate UCITS ETF 0.07% 0.07%*
* The TER decreased from 0.15% to 0.07% on 1 June 2021.
** The TER decreased from 0.15% to 0.05% from 1 July 2021.
Directors’ Fees
During the period ended 31 December 2021, the Directors Robert Burke, Frank Ennis and Gregory McGowan earned fees
amounting to EUR 20,000 each (31 December 2021: EUR 12,500 each). These are the only Directors who receive a fee,
these fees have been paid. The Franklin Templeton group provides employees to act as Directors of the ICAV (these
Directors do not receive a fee). The remuneration of the Directors shall not exceed EUR 100,000 per annum per Director
(or its equivalent) (or such other sum as the Directors may from time to time determine and disclose to the Shareholders).
5. Fair Value Hierarchy
The ICAV’s policies for managing risk associated with the use of financial instruments applied during the period under
review are consistent with those disclosed in the ICAV’s audited financial statement as at and for the year ended 30 June
2021.
The ICAV is required to classify fair value measurements using a fair value hierarchy that reflects the significance of the
inputs used in making the measurements.

NOTES TO THE CONDENSED FINANCIAL STATEMENTS FOR THE PERIOD ENDED 31 DECEMBER 2021 (continued)
Franklin LibertyShares ICAV Interim Report 59
5. Fair Value Hierarchy (continued)
The standard requires an entity to provide a quantitative and qualitative analysis of those instruments recognised at fair
value based on a three-level measurement hierarchy. The fair value hierarchy has the following levels:
• Level 1 - Quoted prices (unadjusted) in active markets for identical assets or liabilities.
• Level 2 - Inputs other than quoted prices included within level 1 that are observable for the asset or liability, either
directly (that is, as prices) or indirectly (that is, derived from prices).
• Level 3 - Inputs for the asset or liability that are not based on observable market data (that is, unobservable
inputs).
Furthermore, for those instruments which have significant unobservable inputs (Level 3), the amendment requires
disclosures on the transfers into and out of Level 3, a reconciliation of the opening and closing balances, total gains and
losses for the financial period split between those recognised in the Condensed Statement of Comprehensive Income and
recognised through the statement of total recognised gains and losses, purchases, sales issues and settlements. The level
in the fair value hierarchy within which the fair value measurement is categorised in its entirety is determined on the basis
of the lowest level input that is significant to the fair value measurement in its entirety.
For this purpose, the significance of an input is assessed against the fair value measurement in its entirety. If a fair value
measurement uses observable inputs that require significant adjustment based on unobservable inputs, that measurement
is a Level 3 measurement. Assessing the significance of a particular input to the fair value measurement in its entirety
requires judgement, considering factors specific to the asset or liability.
The determination of what constitutes ‘observable’ requires significant judgement by the Sub-Funds. The Sub-Funds
consider observable data to be that market data that is readily available, regularly distributed or updated, reliable and
verifiable, not proprietary, and provided by independent sources that are actively involved in the relevant market. Assets
and liabilities not carried at fair value are carried at amortised cost, their carrying values are a reasonable approximation of
fair value.
The following tables analyse within the fair value hierarchy the Sub-Funds’ financial assets and financial liabilities
measured at fair value at 31 December 2021.
Franklin FTSE Brazil UCITS ETF
Level 1
USD
Level 2
USD
Level 3
USD
Total
USD
Financial Assets:
Equities ................................................................................................ 22,910,305 - - 22,910,305
Future Contracts* ................................................................................................ (9,280) - - (9,280)
22,901,025 - - 22,901,025
Franklin FTSE China UCITS ETF
Level 1
USD
Level 2
USD
Level 3
USD
Total
USD
Financial Assets:
Equities ................................................................................................201,199,466 - - 201,199,466
Future Contracts* ................................................................................................ (31,070) - - (31,070)
201,168,396 - - 201,168,396
* Represents net unrealised gain/(loss).
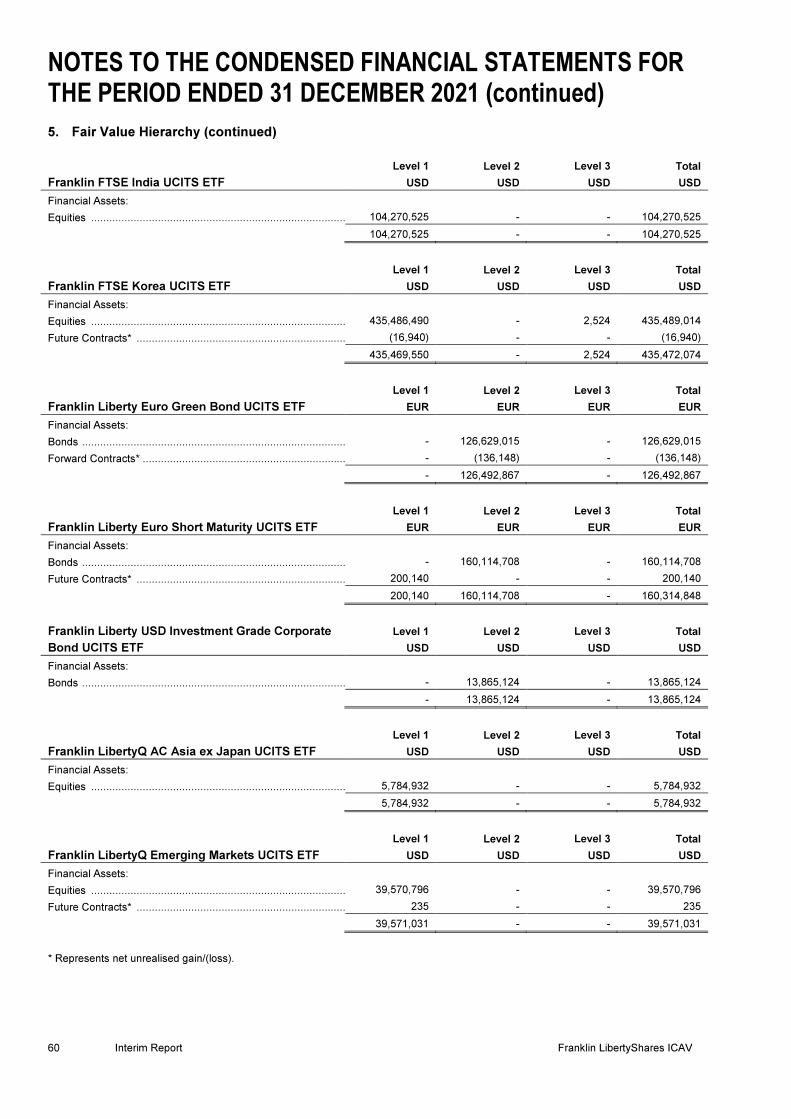
NOTES TO THE CONDENSED FINANCIAL STATEMENTS FOR THE PERIOD ENDED 31 DECEMBER 2021 (continued)
60 Interim Report Franklin LibertyShares ICAV
5. Fair Value Hierarchy (continued)
Franklin FTSE India UCITS ETF
Level 1
USD
Level 2
USD
Level 3
USD
Total
USD
Financial Assets:
Equities ................................................................................................ 104,270,525 - - 104,270,525
104,270,525 - - 104,270,525
Franklin FTSE Korea UCITS ETF
Level 1
USD
Level 2
USD
Level 3
USD
Total
USD
Financial Assets:
Equities ................................................................................................435,486,490 - 2,524 435,489,014
Future Contracts* ................................................................................................ (16,940) - - (16,940)
435,469,550 - 2,524 435,472,074
Franklin Liberty Euro Green Bond UCITS ETF
Level 1
EUR
Level 2
EUR
Level 3
EUR
Total
EUR
Financial Assets:
Bonds ................................................................................................ - 126,629,015 - 126,629,015
Forward Contracts* ................................................................................................ - (136,148) - (136,148)
- 126,492,867 - 126,492,867
Franklin Liberty Euro Short Maturity UCITS ETF
Level 1
EUR
Level 2
EUR
Level 3
EUR
Total
EUR
Financial Assets:
Bonds ................................................................................................ - 160,114,708 - 160,114,708
Future Contracts* ................................................................................................ 200,140 - - 200,140
200,140 160,114,708 - 160,314,848
Franklin Liberty USD Investment Grade Corporate
Bond UCITS ETF
Level 1
USD
Level 2
USD
Level 3
USD
Total
USD
Financial Assets:
Bonds ................................................................................................ - 13,865,124 - 13,865,124
- 13,865,124 - 13,865,124
Franklin LibertyQ AC Asia ex Japan UCITS ETF
Level 1
USD
Level 2
USD
Level 3
USD
Total
USD
Financial Assets:
Equities ................................................................................................ 5,784,932 - - 5,784,932
5,784,932 - - 5,784,932
Franklin LibertyQ Emerging Markets UCITS ETF
Level 1
USD
Level 2
USD
Level 3
USD
Total
USD
Financial Assets:
Equities ................................................................................................ 39,570,796 - - 39,570,796
Future Contracts* ................................................................................................ 235 - - 235
39,571,031 - - 39,571,031
* Represents net unrealised gain/(loss).
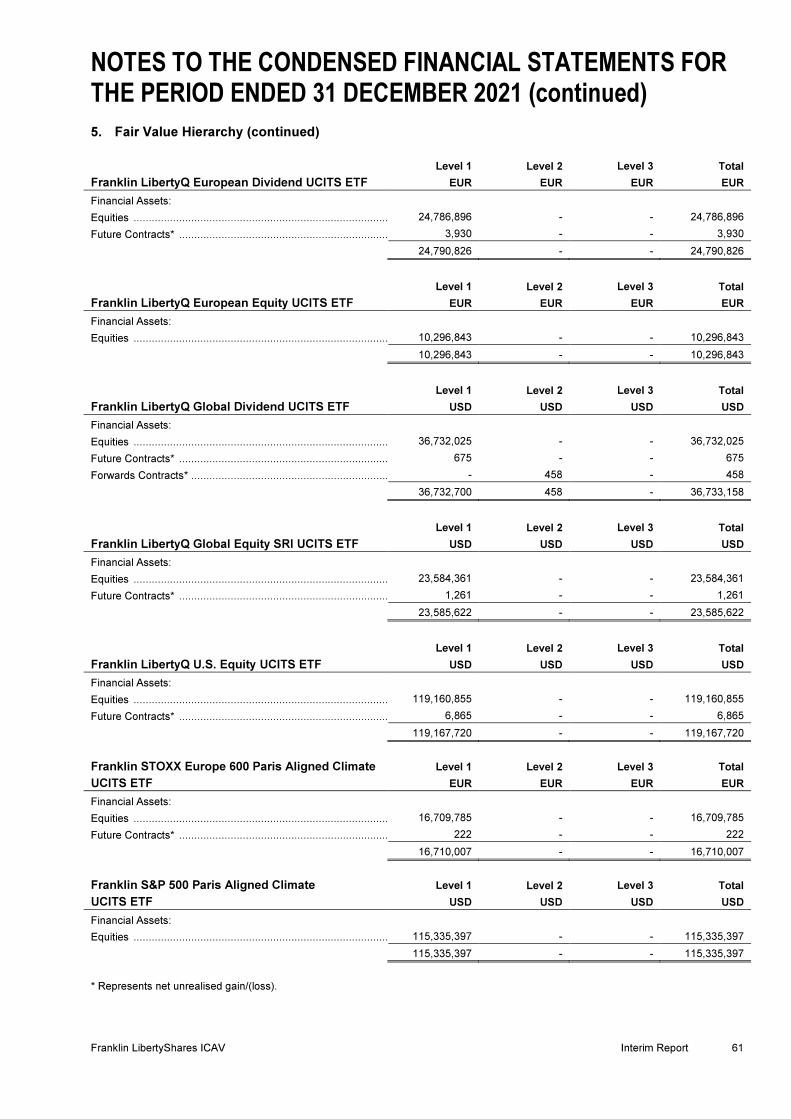
NOTES TO THE CONDENSED FINANCIAL STATEMENTS FOR THE PERIOD ENDED 31 DECEMBER 2021 (continued)
Franklin LibertyShares ICAV Interim Report 61
5. Fair Value Hierarchy (continued)
Franklin LibertyQ European Dividend UCITS ETF
Level 1
EUR
Level 2
EUR
Level 3
EUR
Total
EUR
Financial Assets:
Equities ................................................................................................ 24,786,896 - - 24,786,896
Future Contracts* ................................................................................................ 3,930 - - 3,930
24,790,826 - - 24,790,826
Franklin LibertyQ European Equity UCITS ETF
Level 1
EUR
Level 2
EUR
Level 3
EUR
Total
EUR
Financial Assets:
Equities ................................................................................................ 10,296,843 - - 10,296,843
10,296,843 - - 10,296,843
Franklin LibertyQ Global Dividend UCITS ETF
Level 1
USD
Level 2
USD
Level 3
USD
Total
USD
Financial Assets:
Equities ................................................................................................ 36,732,025 - - 36,732,025
Future Contracts* ................................................................................................ 675 - - 675
Forwards Contracts* ................................................................................................ - 458 - 458
36,732,700 458 - 36,733,158
Franklin LibertyQ Global Equity SRI UCITS ETF
Level 1
USD
Level 2
USD
Level 3
USD
Total
USD
Financial Assets:
Equities ................................................................................................ 23,584,361 - - 23,584,361
Future Contracts* ................................................................................................ 1,261 - - 1,261
23,585,622 - - 23,585,622
Franklin LibertyQ U.S. Equity UCITS ETF
Level 1
USD
Level 2
USD
Level 3
USD
Total
USD
Financial Assets:
Equities ................................................................................................ 119,160,855 - - 119,160,855
Future Contracts* ................................................................................................ 6,865 - - 6,865
119,167,720 - - 119,167,720
Franklin STOXX Europe 600 Paris Aligned Climate
UCITS ETF
Level 1
EUR
Level 2
EUR
Level 3
EUR
Total
EUR
Financial Assets:
Equities ................................................................................................ 16,709,785 - - 16,709,785
Future Contracts* ................................................................................................ 222 - - 222
16,710,007 - - 16,710,007
Franklin S&P 500 Paris Aligned Climate
UCITS ETF
Level 1
USD
Level 2
USD
Level 3
USD
Total
USD
Financial Assets:
Equities ................................................................................................ 115,335,397 - - 115,335,397
115,335,397 - - 115,335,397
* Represents net unrealised gain/(loss).
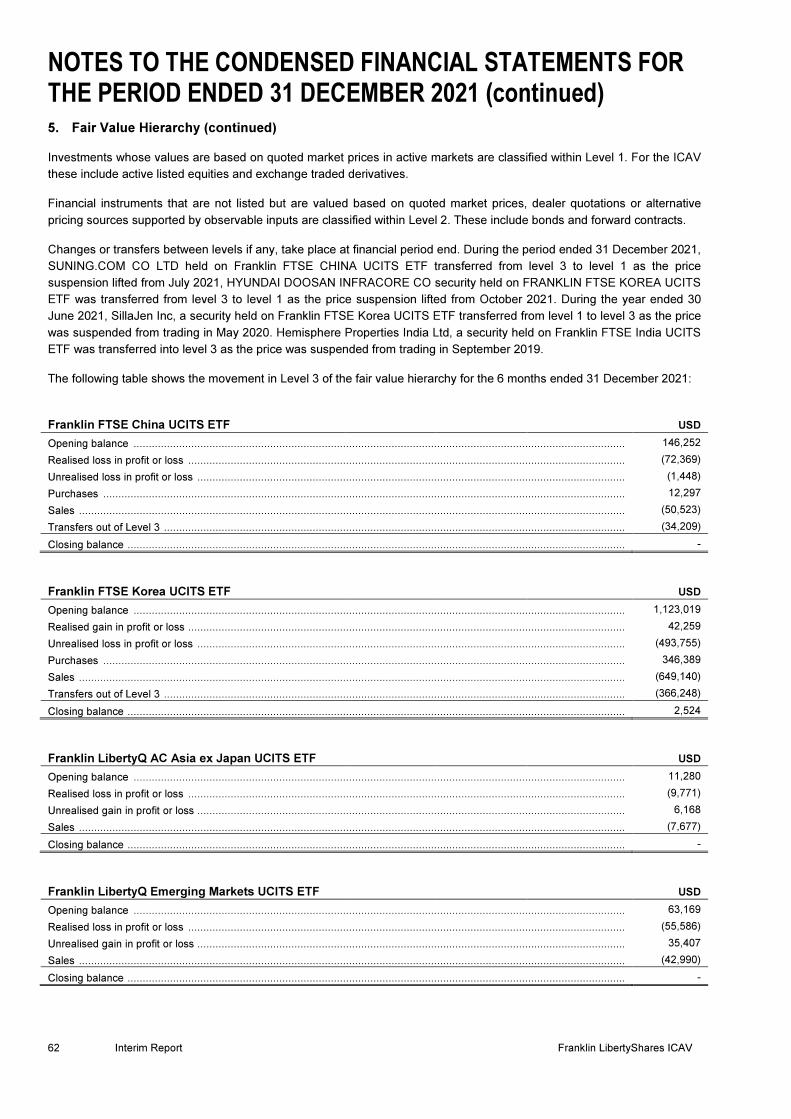
NOTES TO THE CONDENSED FINANCIAL STATEMENTS FOR THE PERIOD ENDED 31 DECEMBER 2021 (continued)
62 Interim Report Franklin LibertyShares ICAV
5. Fair Value Hierarchy (continued)
Investments whose values are based on quoted market prices in active markets are classified within Level 1. For the ICAV
these include active listed equities and exchange traded derivatives.
Financial instruments that are not listed but are valued based on quoted market prices, dealer quotations or alternative
pricing sources supported by observable inputs are classified within Level 2. These include bonds and forward contracts.
Changes or transfers between levels if any, take place at financial period end. During the period ended 31 December 2021,
SUNING.COM CO LTD held on Franklin FTSE CHINA UCITS ETF transferred from level 3 to level 1 as the price
suspension lifted from July 2021, HYUNDAI DOOSAN INFRACORE CO security held on FRANKLIN FTSE KOREA UCITS
ETF was transferred from level 3 to level 1 as the price suspension lifted from October 2021. During the year ended 30
June 2021, SillaJen Inc, a security held on Franklin FTSE Korea UCITS ETF transferred from level 1 to level 3 as the price
was suspended from trading in May 2020. Hemisphere Properties India Ltd, a security held on Franklin FTSE India UCITS
ETF was transferred into level 3 as the price was suspended from trading in September 2019.
The following table shows the movement in Level 3 of the fair value hierarchy for the 6 months ended 31 December 2021:
Franklin FTSE China UCITS ETF USD
Opening balance .................................................................................................................................................................. 146,252
Realised loss in profit or loss ................................................................................................................................................ (72,369)
Unrealised loss in profit or loss ............................................................................................................................................. (1,448)
Purchases ............................................................................................................................................................................ 12,297
Sales .................................................................................................................................................................................... (50,523)
Transfers out of Level 3 ........................................................................................................................................................ (34,209)
Closing balance .................................................................................................................................................................... -
Franklin FTSE Korea UCITS ETF USD
Opening balance .................................................................................................................................................................. 1,123,019
Realised gain in profit or loss ................................................................................................................................................ 42,259
Unrealised loss in profit or loss ............................................................................................................................................. (493,755)
Purchases ............................................................................................................................................................................ 346,389
Sales .................................................................................................................................................................................... (649,140)
Transfers out of Level 3 ........................................................................................................................................................ (366,248)
Closing balance .................................................................................................................................................................... 2,524
Franklin LibertyQ AC Asia ex Japan UCITS ETF USD
Opening balance .................................................................................................................................................................. 11,280
Realised loss in profit or loss ................................................................................................................................................ (9,771)
Unrealised gain in profit or loss ............................................................................................................................................. 6,168
Sales .................................................................................................................................................................................... (7,677)
Closing balance .................................................................................................................................................................... -
Franklin LibertyQ Emerging Markets UCITS ETF USD
Opening balance .................................................................................................................................................................. 63,169
Realised loss in profit or loss ................................................................................................................................................ (55,586)
Unrealised gain in profit or loss ............................................................................................................................................. 35,407
Sales .................................................................................................................................................................................... (42,990)
Closing balance .................................................................................................................................................................... -

NOTES TO THE CONDENSED FINANCIAL STATEMENTS FOR THE PERIOD ENDED 31 DECEMBER 2021 (continued)
Franklin LibertyShares ICAV Interim Report 63
5. Fair Value Hierarchy (continued)
The following tables analyse within the fair value hierarchy the Sub-Funds’ financial assets and financial liabilities
measured at fair value at 30 June 2021.
Franklin FTSE Brazil UCITS ETF
Level 1
USD
Level 2
USD
Level 3
USD
Total
USD
Financial Assets:
Equities ................................................................................................23,297,096 - - 23,297,096
Future Contracts* ................................................................................................(1,920) - - (1,920)
23,295,176 - - 23,295,176
Franklin FTSE China UCITS ETF
Level 1
USD
Level 2
USD
Level 3
USD
Total
USD
Financial Assets:
Equities ................................................................................................193,459,377 - 146,252 193,605,629
Future Contracts* ................................................................................................(770) - - (770)
193,458,607 - 146,252 193,604,859
Franklin FTSE India UCITS ETF
Level 1
USD
Level 2
USD
Level 3
USD
Total
USD
Financial Assets:
Bonds - 3,055 - 3,055
Equities ................................................................................................72,852,125 - - 72,852,125
72,852,125 3,055 - 72,855,180
Franklin FTSE Korea UCITS ETF
Level 1
USD
Level 2
USD
Level 3
USD
Total
USD
Financial Assets:
Equities ................................................................................................684,483,929 - 1,123,019 685,606,948
Future Contracts* ................................................................................................(888) - - (888)
684,483,041 - 1,123,019 685,606,060
Franklin Liberty Euro Green Bond UCITS ETF
Level 1
EUR
Level 2
EUR
Level 3
EUR
Total
EUR
Financial Assets:
Bonds ................................................................................................ - 104,759,627 - 104,759,627
Forward Contracts* ................................................................................................- 13,153 - 13,153
- 104,772,780 - 104,772,780
Franklin Liberty Euro Short Maturity UCITS ETF
Level 1
EUR
Level 2
EUR
Level 3
EUR
Total
EUR
Financial Assets:
Bonds ................................................................................................ - 54,587,545 - 54,587,545
Future Contracts* ................................................................................................(18,780) - - (18,780)
(18,780) 54,587,545 - 54,568,765
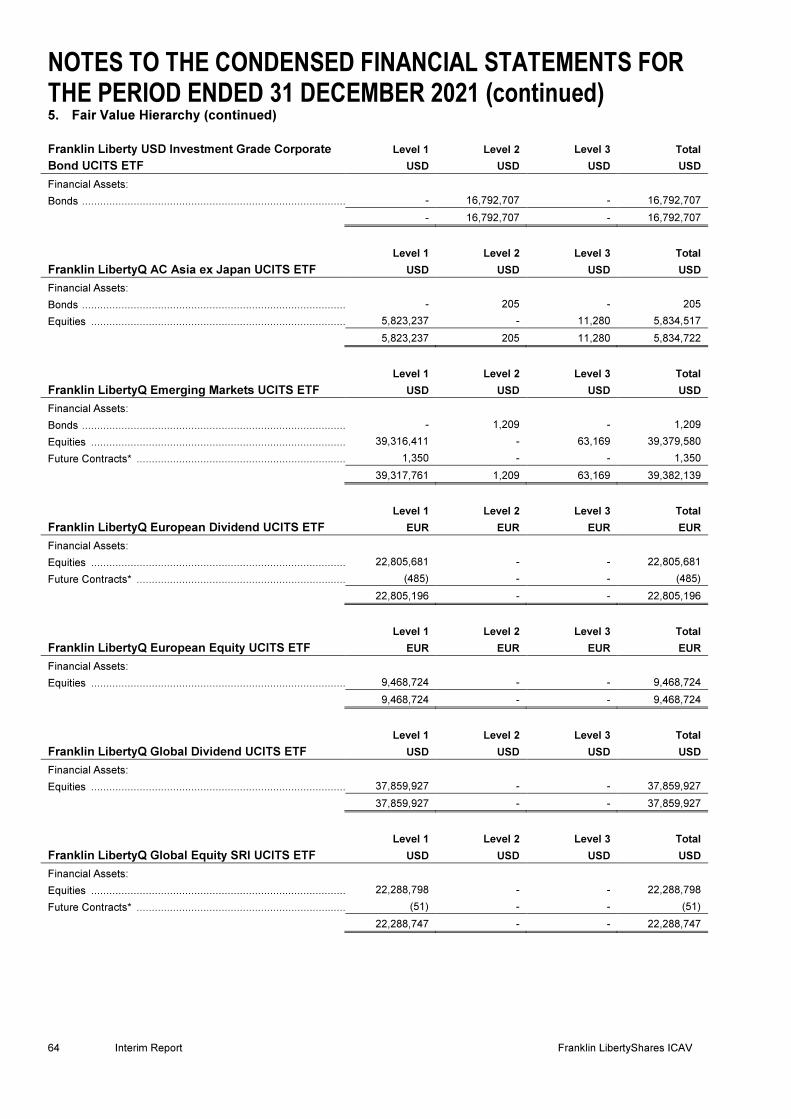
NOTES TO THE CONDENSED FINANCIAL STATEMENTS FOR THE PERIOD ENDED 31 DECEMBER 2021 (continued)
64 Interim Report Franklin LibertyShares ICAV
5. Fair Value Hierarchy (continued)
Franklin Liberty USD Investment Grade Corporate
Bond UCITS ETF
Level 1
USD
Level 2
USD
Level 3
USD
Total
USD
Financial Assets:
Bonds ................................................................................................ - 16,792,707 - 16,792,707
- 16,792,707 - 16,792,707
Franklin LibertyQ AC Asia ex Japan UCITS ETF
Level 1
USD
Level 2
USD
Level 3
USD
Total
USD
Financial Assets:
Bonds ................................................................................................ - 205 - 205
Equities ................................................................................................5,823,237 - 11,280 5,834,517
5,823,237 205 11,280 5,834,722
Franklin LibertyQ Emerging Markets UCITS ETF
Level 1
USD
Level 2
USD
Level 3
USD
Total
USD
Financial Assets:
Bonds ................................................................................................ - 1,209 - 1,209
Equities ................................................................................................39,316,411 - 63,169 39,379,580
Future Contracts* ................................................................................................1,350 - - 1,350
39,317,761 1,209 63,169 39,382,139
Franklin LibertyQ European Dividend UCITS ETF
Level 1
EUR
Level 2
EUR
Level 3
EUR
Total
EUR
Financial Assets:
Equities ................................................................................................22,805,681 - - 22,805,681
Future Contracts* ................................................................................................(485) - - (485)
22,805,196 - - 22,805,196
Franklin LibertyQ European Equity UCITS ETF
Level 1
EUR
Level 2
EUR
Level 3
EUR
Total
EUR
Financial Assets:
Equities ................................................................................................9,468,724 - - 9,468,724
9,468,724 - - 9,468,724
Franklin LibertyQ Global Dividend UCITS ETF
Level 1
USD
Level 2
USD
Level 3
USD
Total
USD
Financial Assets:
Equities ................................................................................................37,859,927 - - 37,859,927
37,859,927 - - 37,859,927
Franklin LibertyQ Global Equity SRI UCITS ETF
Level 1
USD
Level 2
USD
Level 3
USD
Total
USD
Financial Assets:
Equities ................................................................................................22,288,798 - - 22,288,798
Future Contracts* ................................................................................................(51) - - (51)
22,288,747 - - 22,288,747

NOTES TO THE CONDENSED FINANCIAL STATEMENTS FOR THE PERIOD ENDED 31 DECEMBER 2021 (continued)
Franklin LibertyShares ICAV Interim Report 65
5. Fair Value Hierarchy (continued)
Franklin LibertyQ U.S. Equity UCITS ETF
Level 1
USD
Level 2
USD
Level 3
USD
Total
USD
Financial Assets:
Equities ................................................................................................105,238,120 - - 105,238,120
Future Contracts* ................................................................................................2,969 - - 2,969
105,241,089 - - 105,241,089
Franklin STOXX Europe 600 Paris Aligned Climate
UCITS ETF
Level 1
EUR
Level 2
EUR
Level 3
EUR
Total
EUR
Financial Assets:
Equities ................................................................................................9,297,102 - - 9,297,102
9,297,102 - - 9,297,102
Franklin S&P 500 Paris Aligned Climate UCITS ETF
Level 1
USD
Level 2
USD
Level 3
USD
Total
USD
Financial Assets:
Equities ................................................................................................46,064,715 - - 46,064,715
46,064,715 - - 46,064,715
* Represents net unrealised gain/(loss).
The following table shows the movement in Level 3 of the fair value hierarchy for the financial year ended 30 June 2021:
Franklin FTSE China UCITS ETF 30 June 2021
Opening balance ................................................................................................................................................................ -
Transfers into level 3 ............................................................................................................................................................ 146,252
Closing balance .................................................................................................................................................................... 146,252
Franklin FTSE India UCITS ETF 30 June 2021
Opening balance ................................................................................................................................................................ 689
Realised loss in profit or loss ................................................................................................................................................ (520)
Unrealised gain in profit or loss ............................................................................................................................................ 165
Sales .................................................................................................................................................................................... (334)
Closing balance .................................................................................................................................................................... -
Franklin FTSE Korea UCITS ETF 30 June 2021
Opening balance ................................................................................................................................................................ 4,989
Unrealised loss in profit or loss ............................................................................................................................................. (2,324)
Transfers into level 3 ............................................................................................................................................................ 1,120,354
Closing balance .................................................................................................................................................................... 1,123,019
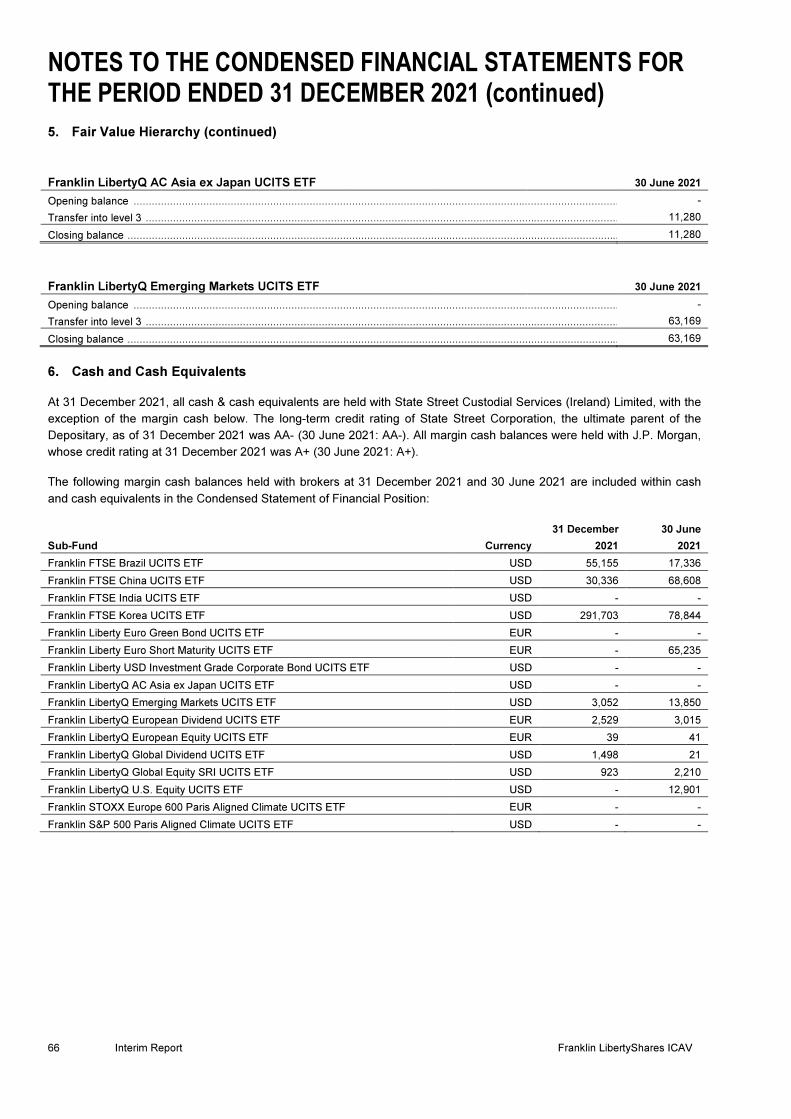
NOTES TO THE CONDENSED FINANCIAL STATEMENTS FOR THE PERIOD ENDED 31 DECEMBER 2021 (continued)
66 Interim Report Franklin LibertyShares ICAV
5. Fair Value Hierarchy (continued)
Franklin LibertyQ AC Asia ex Japan UCITS ETF 30 June 2021
Opening balance ................................................................................................................................................................ -
Transfer into level 3 .............................................................................................................................................................. 11,280
Closing balance .................................................................................................................................................................... 11,280
Franklin LibertyQ Emerging Markets UCITS ETF 30 June 2021
Opening balance ................................................................................................................................................................ -
Transfer into level 3 .............................................................................................................................................................. 63,169
Closing balance .................................................................................................................................................................... 63,169
6. Cash and Cash Equivalents
At 31 December 2021, all cash & cash equivalents are held with State Street Custodial Services (Ireland) Limited, with the
exception of the margin cash below. The long-term credit rating of State Street Corporation, the ultimate parent of the
Depositary, as of 31 December 2021 was AA- (30 June 2021: AA-). All margin cash balances were held with J.P. Morgan,
whose credit rating at 31 December 2021 was A+ (30 June 2021: A+).
The following margin cash balances held with brokers at 31 December 2021 and 30 June 2021 are included within cash
and cash equivalents in the Condensed Statement of Financial Position:
Sub-Fund Currency
31 December
2021
30 June
2021
Franklin FTSE Brazil UCITS ETF USD 55,155 17,336
Franklin FTSE China UCITS ETF USD 30,336 68,608
Franklin FTSE India UCITS ETF USD - -
Franklin FTSE Korea UCITS ETF USD 291,703 78,844
Franklin Liberty Euro Green Bond UCITS ETF EUR - -
Franklin Liberty Euro Short Maturity UCITS ETF EUR - 65,235
Franklin Liberty USD Investment Grade Corporate Bond UCITS ETF USD - -
Franklin LibertyQ AC Asia ex Japan UCITS ETF USD - -
Franklin LibertyQ Emerging Markets UCITS ETF USD 3,052 13,850
Franklin LibertyQ European Dividend UCITS ETF EUR 2,529 3,015
Franklin LibertyQ European Equity UCITS ETF EUR 39 41
Franklin LibertyQ Global Dividend UCITS ETF USD 1,498 21
Franklin LibertyQ Global Equity SRI UCITS ETF USD 923 2,210
Franklin LibertyQ U.S. Equity UCITS ETF USD - 12,901
Franklin STOXX Europe 600 Paris Aligned Climate UCITS ETF EUR - -
Franklin S&P 500 Paris Aligned Climate UCITS ETF USD - -

NOTES TO THE CONDENSED FINANCIAL STATEMENTS FOR THE PERIOD ENDED 31 DECEMBER 2021 (continued)
Franklin LibertyShares ICAV Interim Report 67
7. Related Party Disclosures
The Directors who are listed on page 2, the Investment Managers, Franklin Advisers, Inc., Franklin Templeton Investment
Management Limited, Franklin Templeton Institutional, LLC and Franklin Advisory Services LLC, the Manager, Franklin
Templeton International Services S.à r.l., the Swiss Representative, Franklin Templeton Switzerland Limited and the
German Information Agent, Franklin Templeton Investment Services GmbH are considered related parties for the purposes
of the accounting standards to which the ICAV is subject. Amounts received and payable to the Investment Manager during
the financial period are the operating expenses within the Statement of Comprehensive Income.
Transactions with Key Management Personnel
The interests of the Directors in related parties are as follows:
William Jackson is Chief Administration Officer for Technology & Operations at Franklin Templeton. He is also a director
of a number of Franklin Templeton corporate entities, including the Manager, and fund entities based in the U.K. and
Luxembourg. He is a U.K. national.
Gregory E. McGowan joined Franklin Templeton in 1986 until he resigned in 2016 and held various senior appointments
including Executive Vice President, Director and General Counsel of Templeton International Inc and Templeton Worldwide
Inc. He is a U.S. national.
Patrick O’Connor is head of Global Exchange Traded Funds for Franklin Templeton Investments. He is a U.S. national.
Caroline Baron is head of Exchange Traded Fund Sales - EMEA. She supports Franklin Templeton’s Global Exchange
Traded Funds rollout across Europe and promotes the Franklin LibertyShares ICAV range in the region. She is a French
national.
During the period ended 31 December 2021 and the year ended 30 June 2021, other than as disclosed above, no Director
or connected person of any Director has any interest, beneficial or non-beneficial, in the share capital of the ICAV, or any
material interest in the ICAV or in any agreement or arrangement with the ICAV.
Please see page 58 for details of Directors’ fee paid.
Connected Persons
Regulation 41(1) of the Central Bank UCITS Regulations states that “a responsible person shall ensure that any transaction
between a UCITS and a connected person is conducted a) at arm’s length; and b) in the best interest of the shareholders
of the UCITS”.
As required under Regulation 81 (4) of the Central Bank UCITS Regulations, the Directors are satisfied that there are
arrangements in place, evidenced by written procedures, to ensure that the obligations that are prescribed by Regulation
41(1) are applied to all transactions with connected persons; and all transactions with connected persons that were entered
into during the period to which the report relates complied with the obligations that are prescribed by Regulation 41(1).
The Directors are satisfied that (i) there are in place arrangements, evidenced by written procedures, to ensure that the
obligations that are prescribed 43(1) of the Central Bank UCITS Regulations are applied to all transactions with a
connected party (as defined in Regulation 42 of the Central Bank UCITS Regulations) and (ii) all transactions with
connected parties entered into during the period to which the report relates compiled with the obligations that are
prescribed by Regulation 43(1) of the Central Bank UCITS Regulation.
All related party transactions as noted above were carried out at arm’s length in the ordinary course of business.

NOTES TO THE CONDENSED FINANCIAL STATEMENTS FOR THE PERIOD ENDED 31 DECEMBER 2021 (continued)
68 Interim Report Franklin LibertyShares ICAV
7. Related Party Disclosures (continued) Significant Shareholders The significant shareholders as at 31 December 2021 and 30 June 2021 are the Authorised Participants who hold 100% of
the Sub-Funds on the primary share register at the reporting date, the majority of which are re-sold on the secondary
market. The beneficial ownership of these shares is then passed from the Authorised Participants through the trading of
shares on the secondary market.
8. Efficient Portfolio Management
The ICAV may, on behalf of each Sub-Fund, engage in techniques and instruments such as in FDIs, repurchase/reverse
repurchase and stock lending agreements for the purposes of efficient portfolio management meaning the reduction of risk,
including the risk of tracking error between the performance of a Sub-Fund and the performance of the Index tracked by the
relevant passive Sub-Fund, the reduction of costs to the Sub-Funds, the generation of additional capital or income for the
Sub-Fund and hedging against market movements, currency exchange or interest rate risks, taking into account the risk
profile of each Sub-Fund and the general provisions of the UCITS Regulations. Such transactions may include foreign
exchange transactions which alter the currency characteristics of transferable securities held by each Sub-Fund. No
securities lending took place during the period ended 31 December 2021 or the year ended 30 June 2021.
9. Distributions The following distributions were declared by the Sub-Funds during the period ended 31 December 2021:
Franklin Liberty USD Investment Grade Corporate Bond UCITS ETF
Value
USD
Per Share
USD Ex-date
USD Distributing Shares ................................................................................................ 176,580 0.29 10 Dec 2021
Total ................................................................................................................................ 176,580
Franklin LibertyQ European Dividend UCITS ETF
Value
EUR
Per Share
EUR Ex-date
EUR Distributing Shares ................................................................................................ 196,420 0.28 10 Sep 2021
EUR Distributing Shares ................................................................................................ 218,610 0.24 10 Dec 2021
Total ................................................................................................................................ 415,030
Franklin LibertyQ Global Dividend UCITS ETF
Value
USD
Per Share
USD Ex-date
USD Distributing Shares ................................................................................................ 205,080 0.17 10 Sep 2021
USD Distributing Shares ................................................................................................ 209,640 0.17 10 Dec 2021
Total ................................................................................................................................ 414,720
The following distributions were declared by the Sub-Funds during the period ended 31 December 2020:
Franklin Liberty USD Investment Grade Corporate Bond UCITS ETF
Value
USD
Per Share
USD Ex-date
USD Distributing Shares ................................................................................................ 206,440 0.32 11 Dec 2020
Total ................................................................................................................................ 206,440

NOTES TO THE CONDENSED FINANCIAL STATEMENTS FOR THE PERIOD ENDED 31 DECEMBER 2021 (continued)
Franklin LibertyShares ICAV Interim Report 69
9. Distributions (continued)
Franklin LibertyQ European Dividend UCITS ETF
Value
EUR
Per Share
EUR Ex-date
EUR Distributing Shares ................................................................................................ 93,800 0.19 11 Sep 2020
EUR Distributing Shares ................................................................................................ 164,790 0.18 11 Dec 2020
Total ................................................................................................................................ 258,590
Franklin LibertyQ Global Dividend UCITS ETF
Value
USD
Per Share
USD Ex-date
USD Distributing Shares ................................................................................................ 109,120 0.14 11 Sep 2020
USD Distributing Shares ................................................................................................ 159,900 0.16 11 Dec 2020
Total ................................................................................................................................ 269,020
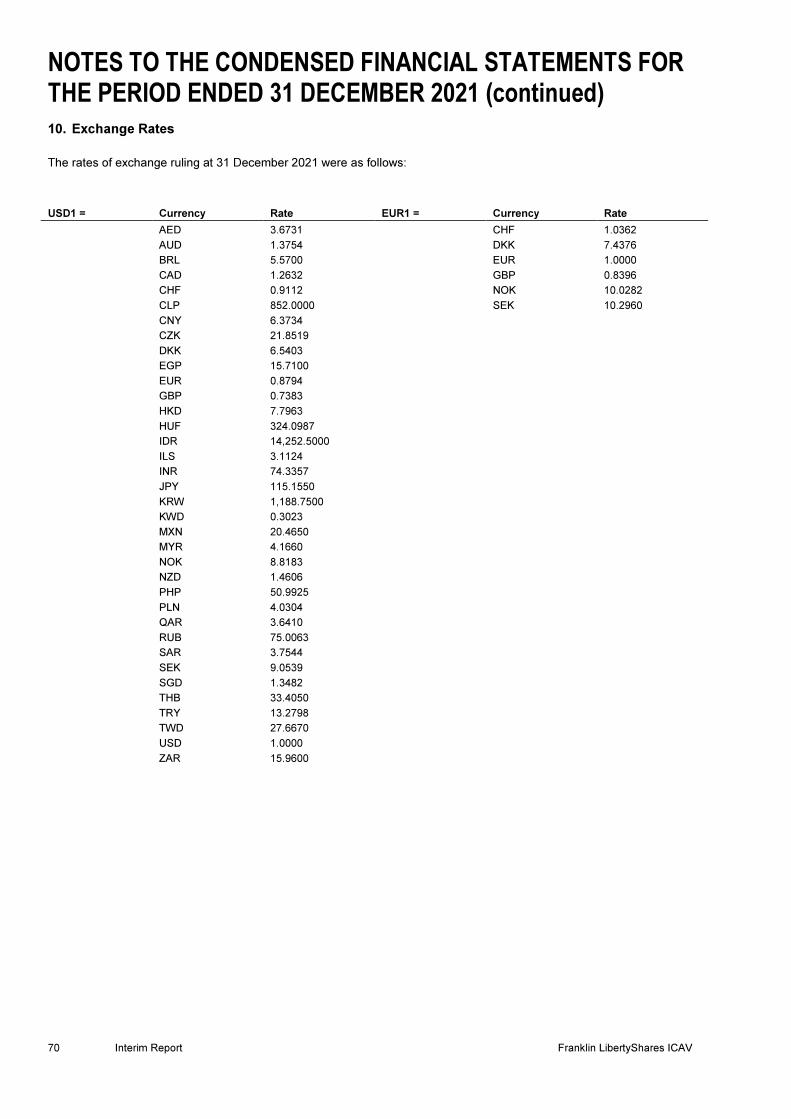
NOTES TO THE CONDENSED FINANCIAL STATEMENTS FOR THE PERIOD ENDED 31 DECEMBER 2021 (continued)
70 Interim Report Franklin LibertyShares ICAV
10. Exchange Rates
The rates of exchange ruling at 31 December 2021 were as follows:
USD1 = Currency Rate EUR1 = Currency Rate
AED 3.6731 CHF 1.0362
AUD 1.3754 DKK 7.4376
BRL 5.5700 EUR 1.0000
CAD 1.2632 GBP 0.8396
CHF 0.9112 NOK 10.0282
CLP 852.0000 SEK 10.2960
CNY 6.3734
CZK 21.8519
DKK 6.5403
EGP 15.7100
EUR 0.8794
GBP 0.7383
HKD 7.7963
HUF 324.0987
IDR 14,252.5000
ILS 3.1124
INR 74.3357
JPY 115.1550
KRW 1,188.7500
KWD 0.3023
MXN 20.4650
MYR 4.1660
NOK 8.8183
NZD 1.4606
PHP 50.9925
PLN 4.0304
QAR 3.6410
RUB 75.0063
SAR 3.7544
SEK 9.0539
SGD 1.3482
THB 33.4050
TRY 13.2798
TWD 27.6670
USD 1.0000
ZAR 15.9600

NOTES TO THE CONDENSED FINANCIAL STATEMENTS FOR THE PERIOD ENDED 31 DECEMBER 2021 (continued)
Franklin LibertyShares ICAV Interim Report 71
10. Exchange Rates (continued)
The rates of exchange ruling at 30 June 2021 were as follows:
USD1 = Currency Rate EUR1 = Currency Rate
AED 3.6732 CHF 1.0962
AUD 1.3320 DKK 7.4362
BRL 4.9568 GBP 0.8584
CAD 1.2383 NOK 10.2049
CHF 0.9244 PLN 4.5147
CLP 728.1100 SEK 10.1420
CNY 6.4615 USD 1.1859
CZK 21.5086
DKK 6.2706
EGP 15.6950
EUR 0.8432
GBP 0.7239
HKD 7.7659
HUF 296.0031
IDR 14,500.0000
ILS 3.2585
INR 74.3300
JPY 110.9900
KRW 1,126.1500
KWD 0.3013
MXN 19.9105
MYR 4.1515
NOK 8.6052
NZD 1.4311
PHP 48.8150
PKR 157.6000
PLN 3.8070
QAR 3.6410
RUB 73.0538
SAR 3.7504
SEK 8.5522
SGD 1.3442
THB 32.0500
TRY 8.6875
TWD 27.8625
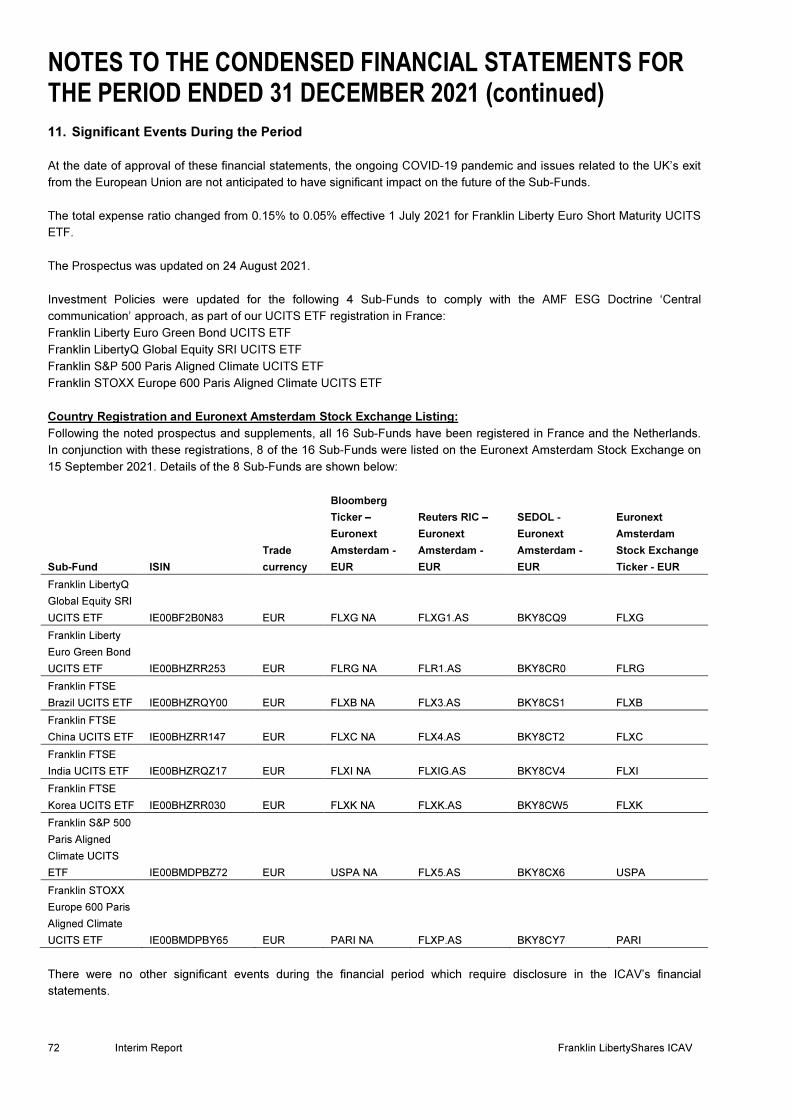
NOTES TO THE CONDENSED FINANCIAL STATEMENTS FOR THE PERIOD ENDED 31 DECEMBER 2021 (continued)
72 Interim Report Franklin LibertyShares ICAV
11. Significant Events During the Period
At the date of approval of these financial statements, the ongoing COVID-19 pandemic and issues related to the UK’s exit
from the European Union are not anticipated to have significant impact on the future of the Sub-Funds.
The total expense ratio changed from 0.15% to 0.05% effective 1 July 2021 for Franklin Liberty Euro Short Maturity UCITS
ETF.
The Prospectus was updated on 24 August 2021.
Investment Policies were updated for the following 4 Sub-Funds to comply with the AMF ESG Doctrine ‘Central
communication’ approach, as part of our UCITS ETF registration in France:
Franklin Liberty Euro Green Bond UCITS ETF
Franklin LibertyQ Global Equity SRI UCITS ETF
Franklin S&P 500 Paris Aligned Climate UCITS ETF
Franklin STOXX Europe 600 Paris Aligned Climate UCITS ETF
Country Registration and Euronext Amsterdam Stock Exchange Listing:
Following the noted prospectus and supplements, all 16 Sub-Funds have been registered in France and the Netherlands.
In conjunction with these registrations, 8 of the 16 Sub-Funds were listed on the Euronext Amsterdam Stock Exchange on
15 September 2021. Details of the 8 Sub-Funds are shown below:
Sub-Fund ISIN
Trade
currency
Bloomberg
Ticker –
Euronext
Amsterdam -
EUR
Reuters RIC –
Euronext
Amsterdam -
EUR
SEDOL -
Euronext
Amsterdam -
EUR
Euronext
Amsterdam
Stock Exchange
Ticker - EUR
Franklin LibertyQ
Global Equity SRI
UCITS ETF
IE00BF2B0N83
EUR
FLXG NA
FLXG1.AS BKY8CQ9
FLXG
Franklin Liberty
Euro Green Bond
UCITS ETF
IE00BHZRR253
EUR
FLRG NA
FLR1.AS BKY8CR0
FLRG
Franklin FTSE
Brazil UCITS ETF
IE00BHZRQY00
EUR
FLXB NA
FLX3.AS BKY8CS1
FLXB
Franklin FTSE
China UCITS ETF
IE00BHZRR147
EUR
FLXC NA
FLX4.AS BKY8CT2
FLXC
Franklin FTSE
India UCITS ETF
IE00BHZRQZ17
EUR
FLXI NA
FLXIG.AS BKY8CV4
FLXI
Franklin FTSE
Korea UCITS ETF
IE00BHZRR030
EUR
FLXK NA
FLXK.AS BKY8CW5
FLXK
Franklin S&P 500
Paris Aligned
Climate UCITS
ETF
IE00BMDPBZ72
EUR
USPA NA
FLX5.AS BKY8CX6
USPA
Franklin STOXX
Europe 600 Paris
Aligned Climate
UCITS ETF
IE00BMDPBY65
EUR
PARI NA
FLXP.AS BKY8CY7
PARI
There were no other significant events during the financial period which require disclosure in the ICAV’s financial
statements.

NOTES TO THE CONDENSED FINANCIAL STATEMENTS FOR THE PERIOD ENDED 31 DECEMBER 2021 (continued)
Franklin LibertyShares ICAV Interim Report 73
11. Significant Events Since the Period End
There were no significant events since the financial period end which would require disclosures in the ICAV’s financial
statements.
12. Comparative Figures
The comparative figures used on the Condensed Statement of Financial Position and related notes are as at 30 June 2021.
Comparative figures for the period ended 31 December 2020 are presented for the Condensed Statement of
Comprehensive Income, the Condensed Statement of Changes in Net Assets Attributable to Redeemable Participating
Shareholders and the related notes.
13. Seasonal and Cyclical Changes The ICAV is not subject to seasonal or cyclical changes.
14. Approval of the Financial Statements
The financial statements were approved by the Board of Directors on 17 February 2022.

SCHEDULE OF INVESTMENTS AS AT 31 DECEMBER 2021 Franklin FTSE Brazil UCITS ETF
74 Interim Report Franklin LibertyShares ICAV
Holding Investment
Fair Value USD
% of Net Assets
Transferable Securities: 98.95% (30 June 2021: 100.74%) Equities: 98.95% (30 June 2021: 100.74%) Brazil: 98.95% (30 June 2021: 100.74%)
8,400 Aliansce Sonae Shopping Centers SA ............................................................. 32,665 0.14
10,800 Alpargatas SA .................................................................................................. 71,780 0.31
271,200 Ambev SA ADR ............................................................................................... 759,360 3.28
26,400 Americanas SA ................................................................................................ 149,679 0.65
4,800 Armac Locacao Logistica E Servicos SA .......................................................... 22,569 0.10
16,800 Atacadao SA .................................................................................................... 45,996 0.20
16,800 Azul SA ............................................................................................................ 73,474 0.32
380,400 B3 SA - Brasil Bolsa Balcao ............................................................................. 760,800 3.29
87,600 Banco Bradesco SA ......................................................................................... 254,622 1.10
292,878 Banco Bradesco SA ADR ................................................................................. 1,001,643 4.33
60,000 Banco BTG Pactual SA .................................................................................... 226,212 0.98
52,800 Banco do Brasil SA .......................................................................................... 273,479 1.18
28,800 Banco Inter SA ................................................................................................. 48,603 0.21
49,200 Banco Inter SA (preferred stock) ...................................................................... 84,267 0.36
19,200 Banco Pan SA .................................................................................................. 36,814 0.16
22,800 Banco Santander Brasil SA .............................................................................. 122,719 0.53
42,000 BB Seguridade Participacoes SA ..................................................................... 156,463 0.68
51,600 BR Malls Participacoes SA ............................................................................... 76,983 0.33
2,400 Bradespar SA .................................................................................................. 9,385 0.04
15,600 Bradespar SA (preferred stock) ........................................................................ 69,990 0.30
12,000 Braskem SA ..................................................................................................... 124,158 0.54
49,200 BRF SA ............................................................................................................ 198,920 0.86
27,600 Caixa Seguridade Participacoes S/A ................................................................ 41,425 0.18
69,600 CCR SA ........................................................................................................... 144,823 0.63
38,400 Centrais Eletricas Brasileiras SA ...................................................................... 230,331 0.99
16,800 Centrais Eletricas Brasileiras SA (preferred stock) ........................................... 99,563 0.43
9,600 Cia Brasileira de Distribuicao ........................................................................... 37,452 0.16
21,600 Cia de Locacao das Americas .......................................................................... 91,170 0.39
21,600 Cia de Saneamento Basico do Estado de Sao Paulo ....................................... 155,815 0.67
12,000 Cia de Transmissao de Energia Eletrica Paulista ............................................. 52,373 0.23
15,601 Cia Energetica de Minas Gerais ....................................................................... 51,873 0.22
60,000 Cia Energetica de Minas Gerais (preferred stock) ............................................ 141,221 0.61
10,800 Cia Energetica de Sao Paulo ........................................................................... 41,707 0.18
20,400 Cia Paranaense de Energia ............................................................................. 22,414 0.10
81,600 Cia Paranaense de Energia (preferred stock) ................................................... 94,345 0.41
39,600 Cia Siderurgica Nacional SA ............................................................................ 177,667 0.77
69,600 Cielo SA ........................................................................................................... 28,490 0.12
114,000 Cogna Educacao ............................................................................................. 50,348 0.22
74,400 Cosan SA ......................................................................................................... 289,719 1.25
12,000 CPFL Energia SA ............................................................................................. 57,803 0.25
32,400 CSN Mineracao SA .......................................................................................... 39,206 0.17
18,000 Cyrela Brazil Realty SA Empreendimentos e Participacoes ............................. 50,995 0.22
19,200 Dexco SA ......................................................................................................... 51,568 0.22
16,800 EDP - Energias do Brasil SA ............................................................................ 63,158 0.27
45,600 Embraer SA ..................................................................................................... 203,194 0.88
15,600 Energisa SA ..................................................................................................... 124,268 0.54
60,000 Eneva SA ......................................................................................................... 152,424 0.66
10,800 Engie Brasil Energia SA ................................................................................... 74,475 0.32
56,400 Equatorial Energia SA ...................................................................................... 228,941 0.99
6,000 Ez Tec Empreendimentos e Participacoes SA ................................................. 22,029 0.10
14,400 Fleury SA ......................................................................................................... 46,509 0.20
67,200 Gerdau SA ....................................................................................................... 328,882 1.42
6,000 Getnet Adquirencia e Servicos para Meios de Pagamento SA ......................... 4,147 0.02
26,400 GPS Participacoes e Empreendimentos SA ..................................................... 75,219 0.32
21,600 Grendene SA ................................................................................................... 33,544 0.14
25,200 Grupo Mateus SA ............................................................................................ 27,281 0.12
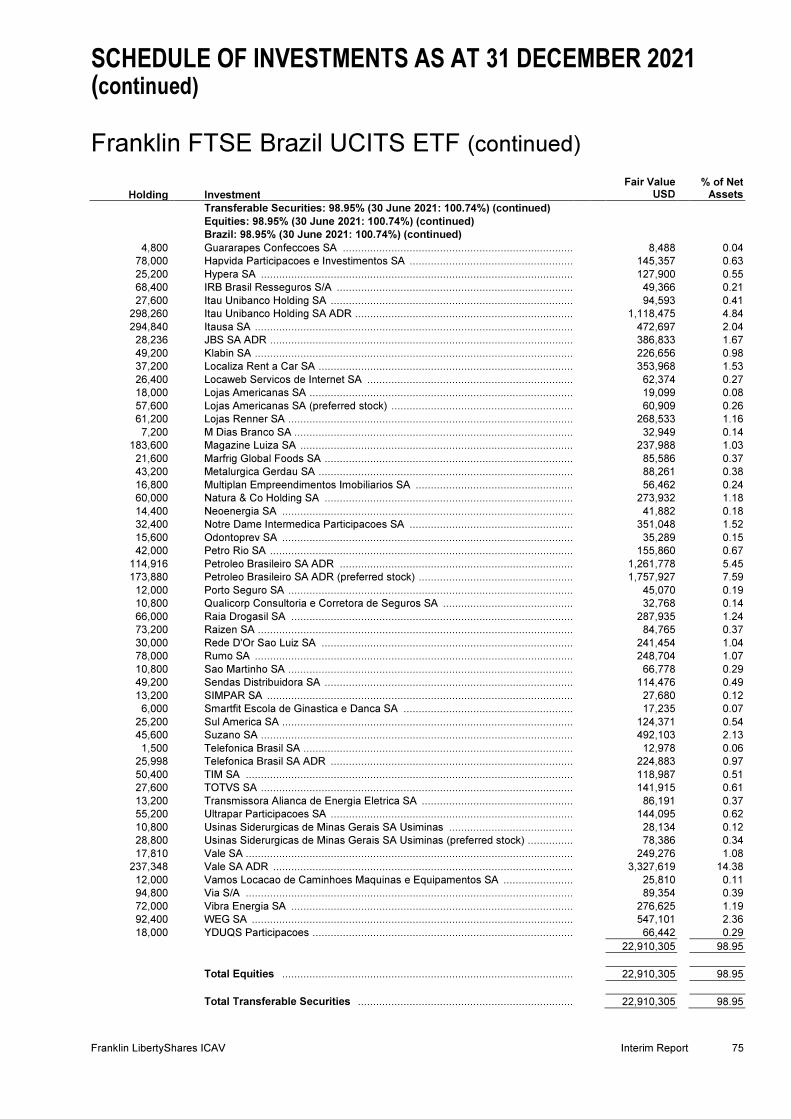
SCHEDULE OF INVESTMENTS AS AT 31 DECEMBER 2021 (continued) Franklin FTSE Brazil UCITS ETF (continued)
Franklin LibertyShares ICAV Interim Report 75
Holding Investment
Fair Value USD
% of Net Assets
Transferable Securities: 98.95% (30 June 2021: 100.74%) (continued) Equities: 98.95% (30 June 2021: 100.74%) (continued) Brazil: 98.95% (30 June 2021: 100.74%) (continued)
4,800 Guararapes Confeccoes SA ............................................................................. 8,488 0.04
78,000 Hapvida Participacoes e Investimentos SA ....................................................... 145,357 0.63
25,200 Hypera SA ........................................................................................................ 127,900 0.55
68,400 IRB Brasil Resseguros S/A ............................................................................... 49,366 0.21
27,600 Itau Unibanco Holding SA ................................................................................. 94,593 0.41
298,260 Itau Unibanco Holding SA ADR ......................................................................... 1,118,475 4.84
294,840 Itausa SA .......................................................................................................... 472,697 2.04
28,236 JBS SA ADR ..................................................................................................... 386,833 1.67
49,200 Klabin SA .......................................................................................................... 226,656 0.98
37,200 Localiza Rent a Car SA ..................................................................................... 353,968 1.53
26,400 Locaweb Servicos de Internet SA ..................................................................... 62,374 0.27
18,000 Lojas Americanas SA ........................................................................................ 19,099 0.08
57,600 Lojas Americanas SA (preferred stock) ............................................................. 60,909 0.26
61,200 Lojas Renner SA ............................................................................................... 268,533 1.16
7,200 M Dias Branco SA ............................................................................................. 32,949 0.14
183,600 Magazine Luiza SA ........................................................................................... 237,988 1.03
21,600 Marfrig Global Foods SA ................................................................................... 85,586 0.37
43,200 Metalurgica Gerdau SA ..................................................................................... 88,261 0.38
16,800 Multiplan Empreendimentos Imobiliarios SA ..................................................... 56,462 0.24
60,000 Natura & Co Holding SA ................................................................................... 273,932 1.18
14,400 Neoenergia SA ................................................................................................ 41,882 0.18
32,400 Notre Dame Intermedica Participacoes SA ....................................................... 351,048 1.52
15,600 Odontoprev SA ................................................................................................ 35,289 0.15
42,000 Petro Rio SA ..................................................................................................... 155,860 0.67
114,916 Petroleo Brasileiro SA ADR .............................................................................. 1,261,778 5.45
173,880 Petroleo Brasileiro SA ADR (preferred stock) .................................................... 1,757,927 7.59
12,000 Porto Seguro SA ............................................................................................... 45,070 0.19
10,800 Qualicorp Consultoria e Corretora de Seguros SA ............................................ 32,768 0.14
66,000 Raia Drogasil SA .............................................................................................. 287,935 1.24
73,200 Raizen SA ......................................................................................................... 84,765 0.37
30,000 Rede D'Or Sao Luiz SA .................................................................................... 241,454 1.04
78,000 Rumo SA .......................................................................................................... 248,704 1.07
10,800 Sao Martinho SA ............................................................................................... 66,778 0.29
49,200 Sendas Distribuidora SA ................................................................................... 114,476 0.49
13,200 SIMPAR SA ...................................................................................................... 27,680 0.12
6,000 Smartfit Escola de Ginastica e Danca SA ......................................................... 17,235 0.07
25,200 Sul America SA ................................................................................................ 124,371 0.54
45,600 Suzano SA ........................................................................................................ 492,103 2.13
1,500 Telefonica Brasil SA .......................................................................................... 12,978 0.06
25,998 Telefonica Brasil SA ADR ................................................................................. 224,883 0.97
50,400 TIM SA ............................................................................................................. 118,987 0.51
27,600 TOTVS SA ........................................................................................................ 141,915 0.61
13,200 Transmissora Alianca de Energia Eletrica SA ................................................... 86,191 0.37
55,200 Ultrapar Participacoes SA ................................................................................. 144,095 0.62
10,800 Usinas Siderurgicas de Minas Gerais SA Usiminas .......................................... 28,134 0.12
28,800 Usinas Siderurgicas de Minas Gerais SA Usiminas (preferred stock) ................ 78,386 0.34
17,810 Vale SA ............................................................................................................. 249,276 1.08
237,348 Vale SA ADR .................................................................................................... 3,327,619 14.38
12,000 Vamos Locacao de Caminhoes Maquinas e Equipamentos SA ........................ 25,810 0.11
94,800 Via S/A ............................................................................................................. 89,354 0.39
72,000 Vibra Energia SA .............................................................................................. 276,625 1.19
92,400 WEG SA ........................................................................................................... 547,101 2.36
18,000 YDUQS Participacoes ....................................................................................... 66,442 0.29
22,910,305 98.95
Total Equities ................................................................................................ 22,910,305 98.95
Total Transferable Securities ................................................................................................ 22,910,305 98.95

SCHEDULE OF INVESTMENTS AS AT 31 DECEMBER 2021 (continued) Franklin FTSE Brazil UCITS ETF (continued)
76 Interim Report Franklin LibertyShares ICAV
Financial Derivative Instruments: (0.04)% (30 June 2021: (0.01)%)
Futures Contracts: (0.04)% (30 June 2021: (0.01)%)*
Notional Amount
USD
Average Cost Price USD
Unrealised Loss USD
% of Net Assets
256,226 19,711 65 of Mini Bovespa Long Futures Contracts Expiring February 2022 ................................................................................................ (9,280) (0.04)
Net unrealised loss on futures contracts ................................ (9,280) (0.04)
Total Financial Derivative Instruments ................................ (9,280) (0.04)
Fair Value USD
% of Net Assets
Portfolio of Investments ................................................................................................ 22,901,025 98.91
Other Net Assets ................................................................................................ 253,216 1.09
Net Assets ................................................................................................................................ 23,154,241 100.00
Analysis of Total Assets
% of Total Assets
Transferable securities admitted to an official stock exchange listing ................................ 98.89
Other Current Assets ................................................................................................ 1.11
Total Assets ................................................................................................................................ 100.00
Country classifications are based upon country of incorporation and/or country of domicile.
* The counterparty for the futures contracts is J.P. Morgan. The value of variation margin cash at broker as at 31 December
2021 is USD 55,155.
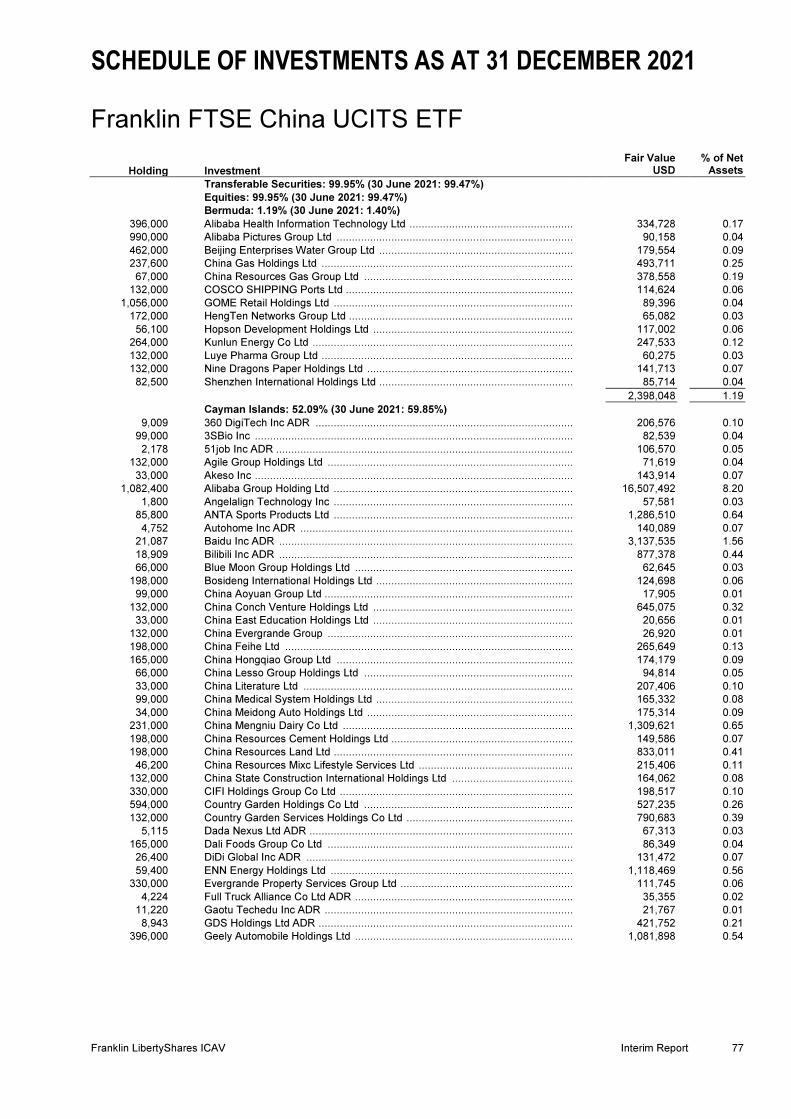
SCHEDULE OF INVESTMENTS AS AT 31 DECEMBER 2021 Franklin FTSE China UCITS ETF
Franklin LibertyShares ICAV Interim Report 77
Holding Investment
Fair Value USD
% of Net Assets
Transferable Securities: 99.95% (30 June 2021: 99.47%)
Equities: 99.95% (30 June 2021: 99.47%)
Bermuda: 1.19% (30 June 2021: 1.40%)
396,000 Alibaba Health Information Technology Ltd ....................................................... 334,728 0.17
990,000 Alibaba Pictures Group Ltd ............................................................................... 90,158 0.04
462,000 Beijing Enterprises Water Group Ltd ................................................................ 179,554 0.09
237,600 China Gas Holdings Ltd .................................................................................... 493,711 0.25
67,000 China Resources Gas Group Ltd ...................................................................... 378,558 0.19
132,000 COSCO SHIPPING Ports Ltd ............................................................................ 114,624 0.06
1,056,000 GOME Retail Holdings Ltd ................................................................................ 89,396 0.04
172,000 HengTen Networks Group Ltd ........................................................................... 65,082 0.03
56,100 Hopson Development Holdings Ltd ................................................................... 117,002 0.06
264,000 Kunlun Energy Co Ltd ....................................................................................... 247,533 0.12
132,000 Luye Pharma Group Ltd .................................................................................... 60,275 0.03
132,000 Nine Dragons Paper Holdings Ltd ..................................................................... 141,713 0.07
82,500 Shenzhen International Holdings Ltd ................................................................ 85,714 0.04
2,398,048 1.19
Cayman Islands: 52.09% (30 June 2021: 59.85%)
9,009 360 DigiTech Inc ADR ...................................................................................... 206,576 0.10
99,000 3SBio Inc .......................................................................................................... 82,539 0.04
2,178 51job Inc ADR ................................................................................................... 106,570 0.05
132,000 Agile Group Holdings Ltd .................................................................................. 71,619 0.04
33,000 Akeso Inc .......................................................................................................... 143,914 0.07
1,082,400 Alibaba Group Holding Ltd ................................................................................ 16,507,492 8.20
1,800 Angelalign Technology Inc ................................................................................ 57,581 0.03
85,800 ANTA Sports Products Ltd ................................................................................ 1,286,510 0.64
4,752 Autohome Inc ADR ........................................................................................... 140,089 0.07
21,087 Baidu Inc ADR .................................................................................................. 3,137,535 1.56
18,909 Bilibili Inc ADR .................................................................................................. 877,378 0.44
66,000 Blue Moon Group Holdings Ltd ......................................................................... 62,645 0.03
198,000 Bosideng International Holdings Ltd .................................................................. 124,698 0.06
99,000 China Aoyuan Group Ltd ................................................................................... 17,905 0.01
132,000 China Conch Venture Holdings Ltd ................................................................... 645,075 0.32
33,000 China East Education Holdings Ltd ................................................................... 20,656 0.01
132,000 China Evergrande Group .................................................................................. 26,920 0.01
198,000 China Feihe Ltd ................................................................................................ 265,649 0.13
165,000 China Hongqiao Group Ltd ............................................................................... 174,179 0.09
66,000 China Lesso Group Holdings Ltd ...................................................................... 94,814 0.05
33,000 China Literature Ltd .......................................................................................... 207,406 0.10
99,000 China Medical System Holdings Ltd .................................................................. 165,332 0.08
34,000 China Meidong Auto Holdings Ltd ..................................................................... 175,314 0.09
231,000 China Mengniu Dairy Co Ltd ............................................................................. 1,309,621 0.65
198,000 China Resources Cement Holdings Ltd ............................................................. 149,586 0.07
198,000 China Resources Land Ltd ................................................................................ 833,011 0.41
46,200 China Resources Mixc Lifestyle Services Ltd .................................................... 215,406 0.11
132,000 China State Construction International Holdings Ltd ......................................... 164,062 0.08
330,000 CIFI Holdings Group Co Ltd .............................................................................. 198,517 0.10
594,000 Country Garden Holdings Co Ltd ...................................................................... 527,235 0.26
132,000 Country Garden Services Holdings Co Ltd ........................................................ 790,683 0.39
5,115 Dada Nexus Ltd ADR ........................................................................................ 67,313 0.03
165,000 Dali Foods Group Co Ltd .................................................................................. 86,349 0.04
26,400 DiDi Global Inc ADR ......................................................................................... 131,472 0.07
59,400 ENN Energy Holdings Ltd ................................................................................. 1,118,469 0.56
330,000 Evergrande Property Services Group Ltd .......................................................... 111,745 0.06
4,224 Full Truck Alliance Co Ltd ADR ......................................................................... 35,355 0.02
11,220 Gaotu Techedu Inc ADR ................................................................................... 21,767 0.01
8,943 GDS Holdings Ltd ADR ..................................................................................... 421,752 0.21
396,000 Geely Automobile Holdings Ltd ......................................................................... 1,081,898 0.54

SCHEDULE OF INVESTMENTS AS AT 31 DECEMBER 2021 (continued) Franklin FTSE China UCITS ETF (continued)
78 Interim Report Franklin LibertyShares ICAV
Holding Investment
Fair Value USD
% of Net Assets
Transferable Securities: 99.95% (30 June 2021: 99.47%) (continued)
Equities: 99.95% (30 June 2021: 99.47%) (continued)
Cayman Islands: 52.09% (30 June 2021: 59.85%) (continued)
66,000 Genscript Biotech Corp .................................................................................... 292,062 0.15
66,000 Greentown China Holdings Ltd ......................................................................... 106,327 0.05
66,000 Haidilao International Holding Ltd ..................................................................... 148,994 0.07
34,000 Haitian International Holdings Ltd ..................................................................... 94,417 0.05
70,200 Hansoh Pharmaceutical Group Co Ltd ............................................................. 171,081 0.08
16,500 Health & Happiness H&H International Holdings Ltd ........................................ 25,566 0.01
12,705 Hello Group Inc ADR ........................................................................................ 114,091 0.06
49,500 Hengan International Group Co Ltd .................................................................. 254,919 0.13
16,764 Huazhu Group Ltd ADR ................................................................................... 625,968 0.31
26,400 Hygeia Healthcare Holdings Co Ltd .................................................................. 165,248 0.08
1,914 I-Mab ADR ....................................................................................................... 90,704 0.05
99,000 Innovent Biologics Inc ...................................................................................... 612,694 0.30
20,988 iQIYI Inc ADR ................................................................................................... 95,705 0.05
56,100 JD Health International Inc ............................................................................... 442,177 0.22
33,000 JD Logistics Inc ................................................................................................ 111,957 0.06
95,700 JD.com Inc ....................................................................................................... 3,363,365 1.67
66,000 Jiayuan International Group Ltd ....................................................................... 22,264 0.01
115,500 Jinxin Fertility Group Ltd ................................................................................... 129,036 0.06
33,000 Jiumaojiu International Holdings Ltd ................................................................. 57,989 0.03
4,026 JOYY Inc ADR ................................................................................................. 182,901 0.09
3,960 Kanzhun Ltd ADR ............................................................................................ 138,125 0.07
18,183 KE Holdings Inc ADR ....................................................................................... 365,842 0.18
49,500 Kingboard Holdings Ltd .................................................................................... 240,951 0.12
82,500 Kingboard Laminates Holdings Ltd ................................................................... 140,317 0.07
198,000 Kingdee International Software Group Co Ltd .................................................. 609,520 0.30
7,029 Kingsoft Cloud Holdings Ltd ADR 110,707 0.05
66,000 Kingsoft Corp Ltd ............................................................................................. 289,945 0.14
118,800 Kuaishou Technology ....................................................................................... 1,097,898 0.55
99,000 KWG Group Holdings Ltd ................................................................................. 64,761 0.03
66,000 KWG Living Group Holdings Ltd ....................................................................... 27,090 0.01
32,010 Li Auto Inc ADR ............................................................................................... 1,027,521 0.51
173,000 Li Ning Co Ltd .................................................................................................. 1,893,918 0.94
99,000 Logan Group Co Ltd ......................................................................................... 75,682 0.04
132,000 Longfor Group Holdings Ltd ............................................................................. 621,372 0.31
41,745 Lufax Holding Ltd ADR ..................................................................................... 235,024 0.12
297,000 Meituan ............................................................................................................ 8,586,612 4.27
33,000 Ming Yuan Cloud Group Holdings Ltd .............................................................. 75,174 0.04
5,577 MINISO Group Holding Ltd ADR ...................................................................... 57,666 0.03
115,500 NetEase Inc ..................................................................................................... 2,333,318 1.16
119,823 New Oriental Education & Technology Group Inc ADR .................................... 251,628 0.12
95,337 NIO Inc ADR .................................................................................................... 3,020,276 1.50
7,293 OneConnect Financial Technology Co Ltd ADR ............................................... 18,014 0.01
28,413 Pinduoduo Inc ADR .......................................................................................... 1,656,478 0.82
29,700 Ping An Healthcare and Technology Co Ltd ..................................................... 107,999 0.05
33,000 Pop Mart International Group Ltd ..................................................................... 189,205 0.09
56,496 RLX Technology Inc ADR ................................................................................ 220,334 0.11
6,285 Seazen Group Ltd (non-voting rights) ............................................................... - 0.00
132,000 Seazen Group Ltd (voting rights) ...................................................................... 89,227 0.04
56,100 Shenzhou International Group Holdings Ltd ..................................................... 1,078,639 0.54
115,500 Shimao Group Holdings Ltd ............................................................................. 75,555 0.04
66,000 Shimao Services Holdings Ltd .......................................................................... 45,883 0.02
759,000 Sino Biopharmaceutical Ltd .............................................................................. 531,552 0.26
132,000 Smoore International Holdings Ltd ................................................................... 673,012 0.33
165,000 SOHO China Ltd .............................................................................................. 36,402 0.02
198,000 Sunac China Holdings Ltd ................................................................................ 299,173 0.15
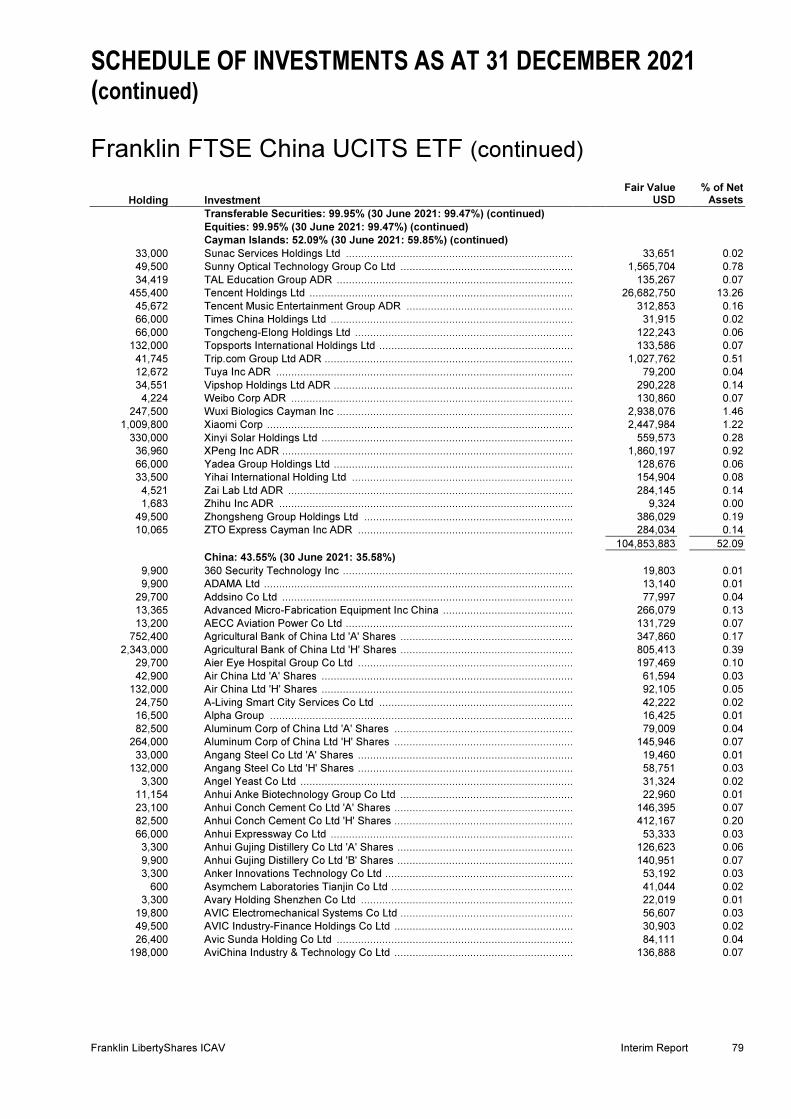
SCHEDULE OF INVESTMENTS AS AT 31 DECEMBER 2021 (continued) Franklin FTSE China UCITS ETF (continued)
Franklin LibertyShares ICAV Interim Report 79
Holding Investment
Fair Value USD
% of Net Assets
Transferable Securities: 99.95% (30 June 2021: 99.47%) (continued)
Equities: 99.95% (30 June 2021: 99.47%) (continued)
Cayman Islands: 52.09% (30 June 2021: 59.85%) (continued)
33,000 Sunac Services Holdings Ltd ............................................................................ 33,651 0.02
49,500 Sunny Optical Technology Group Co Ltd .......................................................... 1,565,704 0.78
34,419 TAL Education Group ADR ............................................................................... 135,267 0.07
455,400 Tencent Holdings Ltd ........................................................................................ 26,682,750 13.26
45,672 Tencent Music Entertainment Group ADR ........................................................ 312,853 0.16
66,000 Times China Holdings Ltd ................................................................................. 31,915 0.02
66,000 Tongcheng-Elong Holdings Ltd ......................................................................... 122,243 0.06
132,000 Topsports International Holdings Ltd ................................................................ 133,586 0.07
41,745 Trip.com Group Ltd ADR ................................................................................... 1,027,762 0.51
12,672 Tuya Inc ADR ................................................................................................... 79,200 0.04
34,551 Vipshop Holdings Ltd ADR ................................................................................ 290,228 0.14
4,224 Weibo Corp ADR .............................................................................................. 130,860 0.07
247,500 Wuxi Biologics Cayman Inc ............................................................................... 2,938,076 1.46
1,009,800 Xiaomi Corp ...................................................................................................... 2,447,984 1.22
330,000 Xinyi Solar Holdings Ltd .................................................................................... 559,573 0.28
36,960 XPeng Inc ADR ................................................................................................ 1,860,197 0.92
66,000 Yadea Group Holdings Ltd ................................................................................ 128,676 0.06
33,500 Yihai International Holding Ltd .......................................................................... 154,904 0.08
4,521 Zai Lab Ltd ADR ............................................................................................... 284,145 0.14
1,683 Zhihu Inc ADR .................................................................................................. 9,324 0.00
49,500 Zhongsheng Group Holdings Ltd ...................................................................... 386,029 0.19
10,065 ZTO Express Cayman Inc ADR ........................................................................ 284,034 0.14
104,853,883 52.09
China: 43.55% (30 June 2021: 35.58%)
9,900 360 Security Technology Inc ............................................................................. 19,803 0.01
9,900 ADAMA Ltd ....................................................................................................... 13,140 0.01
29,700 Addsino Co Ltd ................................................................................................ 77,997 0.04
13,365 Advanced Micro-Fabrication Equipment Inc China ............................................ 266,079 0.13
13,200 AECC Aviation Power Co Ltd ............................................................................ 131,729 0.07
752,400 Agricultural Bank of China Ltd 'A' Shares .......................................................... 347,860 0.17
2,343,000 Agricultural Bank of China Ltd 'H' Shares .......................................................... 805,413 0.39
29,700 Aier Eye Hospital Group Co Ltd ........................................................................ 197,469 0.10
42,900 Air China Ltd 'A' Shares .................................................................................... 61,594 0.03
132,000 Air China Ltd 'H' Shares .................................................................................... 92,105 0.05
24,750 A-Living Smart City Services Co Ltd ................................................................ 42,222 0.02
16,500 Alpha Group ..................................................................................................... 16,425 0.01
82,500 Aluminum Corp of China Ltd 'A' Shares ............................................................ 79,009 0.04
264,000 Aluminum Corp of China Ltd 'H' Shares ............................................................ 145,946 0.07
33,000 Angang Steel Co Ltd 'A' Shares ........................................................................ 19,460 0.01
132,000 Angang Steel Co Ltd 'H' Shares ........................................................................ 58,751 0.03
3,300 Angel Yeast Co Ltd ........................................................................................... 31,324 0.02
11,154 Anhui Anke Biotechnology Group Co Ltd .......................................................... 22,960 0.01
23,100 Anhui Conch Cement Co Ltd 'A' Shares ............................................................ 146,395 0.07
82,500 Anhui Conch Cement Co Ltd 'H' Shares ............................................................ 412,167 0.20
66,000 Anhui Expressway Co Ltd ................................................................................. 53,333 0.03
3,300 Anhui Gujing Distillery Co Ltd 'A' Shares ........................................................... 126,623 0.06
9,900 Anhui Gujing Distillery Co Ltd 'B' Shares ........................................................... 140,951 0.07
3,300 Anker Innovations Technology Co Ltd ............................................................... 53,192 0.03
600 Asymchem Laboratories Tianjin Co Ltd ............................................................. 41,044 0.02
3,300 Avary Holding Shenzhen Co Ltd ....................................................................... 22,019 0.01
19,800 AVIC Electromechanical Systems Co Ltd .......................................................... 56,607 0.03
49,500 AVIC Industry-Finance Holdings Co Ltd ............................................................ 30,903 0.02
26,400 Avic Sunda Holding Co Ltd ............................................................................... 84,111 0.04
198,000 AviChina Industry & Technology Co Ltd ............................................................ 136,888 0.07
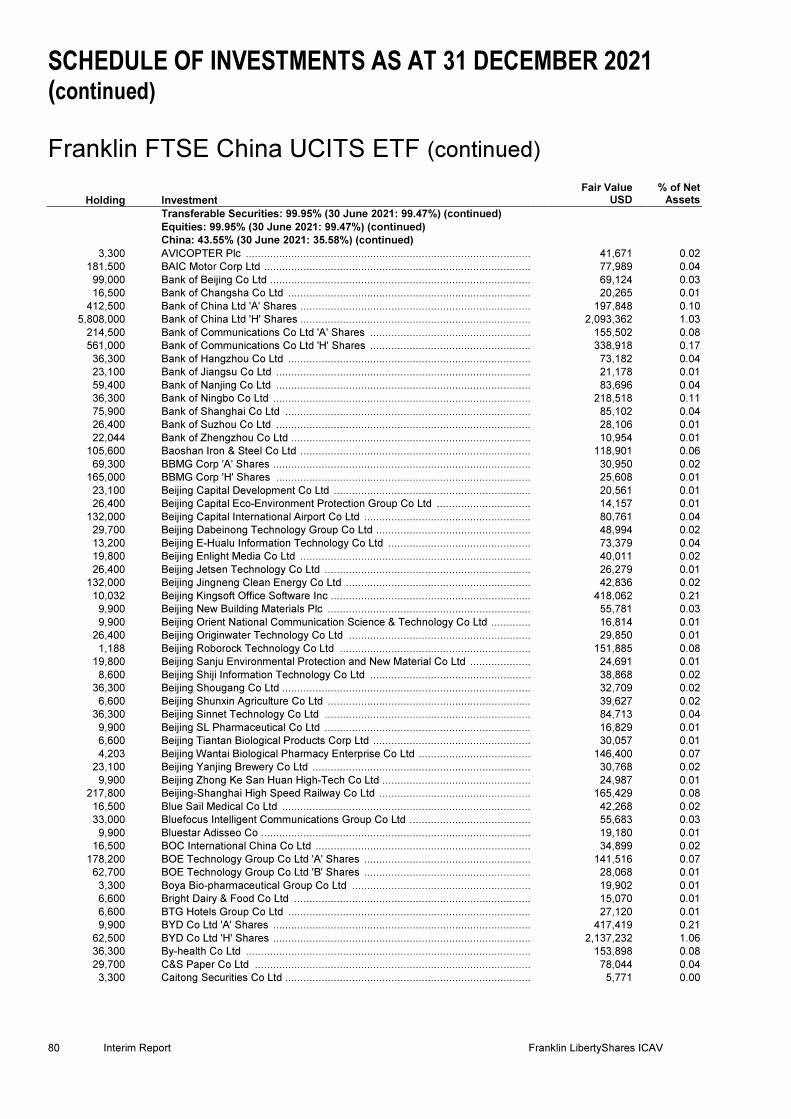
SCHEDULE OF INVESTMENTS AS AT 31 DECEMBER 2021 (continued) Franklin FTSE China UCITS ETF (continued)
80 Interim Report Franklin LibertyShares ICAV
Holding Investment
Fair Value USD
% of Net Assets
Transferable Securities: 99.95% (30 June 2021: 99.47%) (continued)
Equities: 99.95% (30 June 2021: 99.47%) (continued)
China: 43.55% (30 June 2021: 35.58%) (continued)
3,300 AVICOPTER Plc .............................................................................................. 41,671 0.02
181,500 BAIC Motor Corp Ltd ........................................................................................ 77,989 0.04
99,000 Bank of Beijing Co Ltd ...................................................................................... 69,124 0.03
16,500 Bank of Changsha Co Ltd ................................................................................ 20,265 0.01
412,500 Bank of China Ltd 'A' Shares ............................................................................ 197,848 0.10
5,808,000 Bank of China Ltd 'H' Shares ............................................................................ 2,093,362 1.03
214,500 Bank of Communications Co Ltd 'A' Shares ..................................................... 155,502 0.08
561,000 Bank of Communications Co Ltd 'H' Shares ..................................................... 338,918 0.17
36,300 Bank of Hangzhou Co Ltd ................................................................................ 73,182 0.04
23,100 Bank of Jiangsu Co Ltd .................................................................................... 21,178 0.01
59,400 Bank of Nanjing Co Ltd .................................................................................... 83,696 0.04
36,300 Bank of Ningbo Co Ltd ..................................................................................... 218,518 0.11
75,900 Bank of Shanghai Co Ltd ................................................................................. 85,102 0.04
26,400 Bank of Suzhou Co Ltd .................................................................................... 28,106 0.01
22,044 Bank of Zhengzhou Co Ltd ............................................................................... 10,954 0.01
105,600 Baoshan Iron & Steel Co Ltd ............................................................................ 118,901 0.06
69,300 BBMG Corp 'A' Shares ..................................................................................... 30,950 0.02
165,000 BBMG Corp 'H' Shares .................................................................................... 25,608 0.01
23,100 Beijing Capital Development Co Ltd ................................................................. 20,561 0.01
26,400 Beijing Capital Eco-Environment Protection Group Co Ltd ............................... 14,157 0.01
132,000 Beijing Capital International Airport Co Ltd ....................................................... 80,761 0.04
29,700 Beijing Dabeinong Technology Group Co Ltd ................................................... 48,994 0.02
13,200 Beijing E-Hualu Information Technology Co Ltd ............................................... 73,379 0.04
19,800 Beijing Enlight Media Co Ltd ............................................................................ 40,011 0.02
26,400 Beijing Jetsen Technology Co Ltd .................................................................... 26,279 0.01
132,000 Beijing Jingneng Clean Energy Co Ltd ............................................................. 42,836 0.02
10,032 Beijing Kingsoft Office Software Inc .................................................................. 418,062 0.21
9,900 Beijing New Building Materials Plc ................................................................... 55,781 0.03
9,900 Beijing Orient National Communication Science & Technology Co Ltd ............. 16,814 0.01
26,400 Beijing Originwater Technology Co Ltd ............................................................ 29,850 0.01
1,188 Beijing Roborock Technology Co Ltd ............................................................... 151,885 0.08
19,800 Beijing Sanju Environmental Protection and New Material Co Ltd .................... 24,691 0.01
8,600 Beijing Shiji Information Technology Co Ltd ..................................................... 38,868 0.02
36,300 Beijing Shougang Co Ltd .................................................................................. 32,709 0.02
6,600 Beijing Shunxin Agriculture Co Ltd ................................................................... 39,627 0.02
36,300 Beijing Sinnet Technology Co Ltd .................................................................... 84,713 0.04
9,900 Beijing SL Pharmaceutical Co Ltd .................................................................... 16,829 0.01
6,600 Beijing Tiantan Biological Products Corp Ltd .................................................... 30,057 0.01
4,203 Beijing Wantai Biological Pharmacy Enterprise Co Ltd ..................................... 146,400 0.07
23,100 Beijing Yanjing Brewery Co Ltd ........................................................................ 30,768 0.02
9,900 Beijing Zhong Ke San Huan High-Tech Co Ltd ................................................. 24,987 0.01
217,800 Beijing-Shanghai High Speed Railway Co Ltd .................................................. 165,429 0.08
16,500 Blue Sail Medical Co Ltd .................................................................................. 42,268 0.02
33,000 Bluefocus Intelligent Communications Group Co Ltd ........................................ 55,683 0.03
9,900 Bluestar Adisseo Co ......................................................................................... 19,180 0.01
16,500 BOC International China Co Ltd ....................................................................... 34,899 0.02
178,200 BOE Technology Group Co Ltd 'A' Shares ....................................................... 141,516 0.07
62,700 BOE Technology Group Co Ltd 'B' Shares ....................................................... 28,068 0.01
3,300 Boya Bio-pharmaceutical Group Co Ltd ........................................................... 19,902 0.01
6,600 Bright Dairy & Food Co Ltd .............................................................................. 15,070 0.01
6,600 BTG Hotels Group Co Ltd ................................................................................ 27,120 0.01
9,900 BYD Co Ltd 'A' Shares ..................................................................................... 417,419 0.21
62,500 BYD Co Ltd 'H' Shares ..................................................................................... 2,137,232 1.06
36,300 By-health Co Ltd .............................................................................................. 153,898 0.08
29,700 C&S Paper Co Ltd ........................................................................................... 78,044 0.04
3,300 Caitong Securities Co Ltd ................................................................................. 5,771 0.00
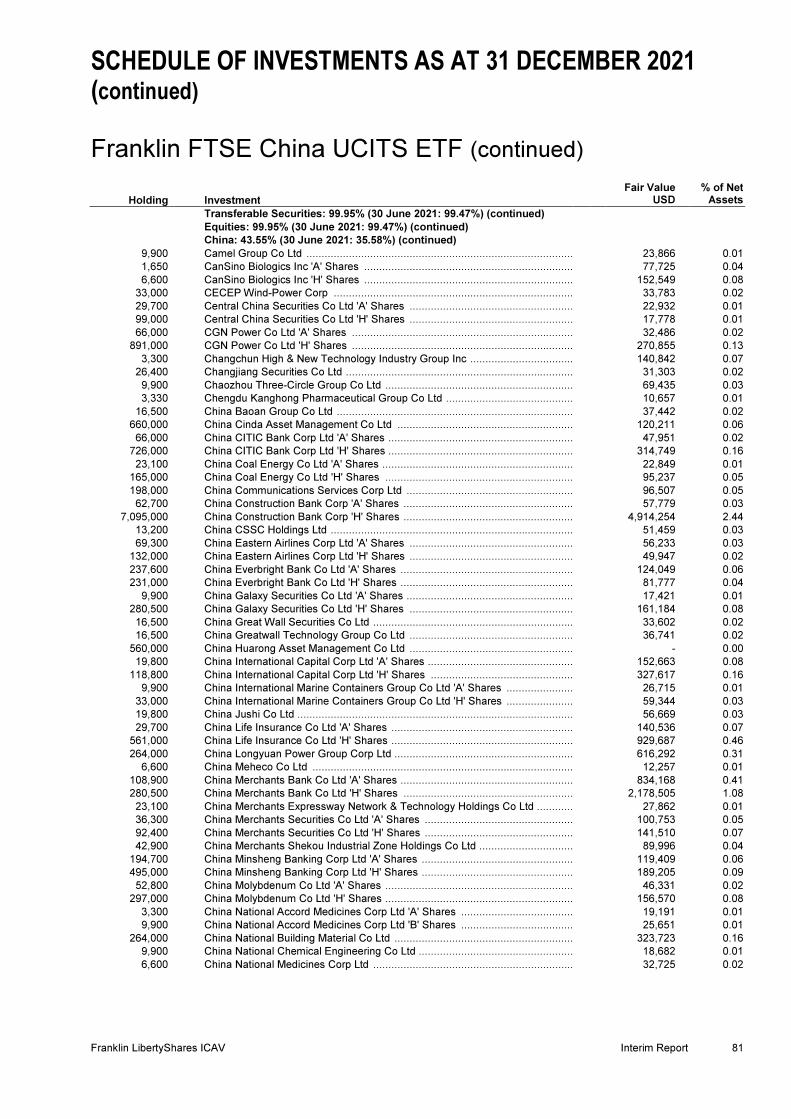
SCHEDULE OF INVESTMENTS AS AT 31 DECEMBER 2021 (continued) Franklin FTSE China UCITS ETF (continued)
Franklin LibertyShares ICAV Interim Report 81
Holding Investment
Fair Value USD
% of Net Assets
Transferable Securities: 99.95% (30 June 2021: 99.47%) (continued)
Equities: 99.95% (30 June 2021: 99.47%) (continued)
China: 43.55% (30 June 2021: 35.58%) (continued)
9,900 Camel Group Co Ltd ......................................................................................... 23,866 0.01
1,650 CanSino Biologics Inc 'A' Shares ...................................................................... 77,725 0.04
6,600 CanSino Biologics Inc 'H' Shares ...................................................................... 152,549 0.08
33,000 CECEP Wind-Power Corp ................................................................................ 33,783 0.02
29,700 Central China Securities Co Ltd 'A' Shares ....................................................... 22,932 0.01
99,000 Central China Securities Co Ltd 'H' Shares ....................................................... 17,778 0.01
66,000 CGN Power Co Ltd 'A' Shares .......................................................................... 32,486 0.02
891,000 CGN Power Co Ltd 'H' Shares .......................................................................... 270,855 0.13
3,300 Changchun High & New Technology Industry Group Inc ................................... 140,842 0.07
26,400 Changjiang Securities Co Ltd ............................................................................ 31,303 0.02
9,900 Chaozhou Three-Circle Group Co Ltd ............................................................... 69,435 0.03
3,330 Chengdu Kanghong Pharmaceutical Group Co Ltd ........................................... 10,657 0.01
16,500 China Baoan Group Co Ltd ............................................................................... 37,442 0.02
660,000 China Cinda Asset Management Co Ltd ........................................................... 120,211 0.06
66,000 China CITIC Bank Corp Ltd 'A' Shares .............................................................. 47,951 0.02
726,000 China CITIC Bank Corp Ltd 'H' Shares .............................................................. 314,749 0.16
23,100 China Coal Energy Co Ltd 'A' Shares ................................................................ 22,849 0.01
165,000 China Coal Energy Co Ltd 'H' Shares ............................................................... 95,237 0.05
198,000 China Communications Services Corp Ltd ........................................................ 96,507 0.05
62,700 China Construction Bank Corp 'A' Shares ......................................................... 57,779 0.03
7,095,000 China Construction Bank Corp 'H' Shares ......................................................... 4,914,254 2.44
13,200 China CSSC Holdings Ltd ................................................................................. 51,459 0.03
69,300 China Eastern Airlines Corp Ltd 'A' Shares ....................................................... 56,233 0.03
132,000 China Eastern Airlines Corp Ltd 'H' Shares ....................................................... 49,947 0.02
237,600 China Everbright Bank Co Ltd 'A' Shares .......................................................... 124,049 0.06
231,000 China Everbright Bank Co Ltd 'H' Shares .......................................................... 81,777 0.04
9,900 China Galaxy Securities Co Ltd 'A' Shares ........................................................ 17,421 0.01
280,500 China Galaxy Securities Co Ltd 'H' Shares ....................................................... 161,184 0.08
16,500 China Great Wall Securities Co Ltd ................................................................... 33,602 0.02
16,500 China Greatwall Technology Group Co Ltd ....................................................... 36,741 0.02
560,000 China Huarong Asset Management Co Ltd ....................................................... - 0.00
19,800 China International Capital Corp Ltd 'A' Shares ................................................. 152,663 0.08
118,800 China International Capital Corp Ltd 'H' Shares ................................................ 327,617 0.16
9,900 China International Marine Containers Group Co Ltd 'A' Shares ....................... 26,715 0.01
33,000 China International Marine Containers Group Co Ltd 'H' Shares ....................... 59,344 0.03
19,800 China Jushi Co Ltd ............................................................................................ 56,669 0.03
29,700 China Life Insurance Co Ltd 'A' Shares ............................................................. 140,536 0.07
561,000 China Life Insurance Co Ltd 'H' Shares ............................................................. 929,687 0.46
264,000 China Longyuan Power Group Corp Ltd ............................................................ 616,292 0.31
6,600 China Meheco Co Ltd ....................................................................................... 12,257 0.01
108,900 China Merchants Bank Co Ltd 'A' Shares .......................................................... 834,168 0.41
280,500 China Merchants Bank Co Ltd 'H' Shares ......................................................... 2,178,505 1.08
23,100 China Merchants Expressway Network & Technology Holdings Co Ltd ............. 27,862 0.01
36,300 China Merchants Securities Co Ltd 'A' Shares .................................................. 100,753 0.05
92,400 China Merchants Securities Co Ltd 'H' Shares .................................................. 141,510 0.07
42,900 China Merchants Shekou Industrial Zone Holdings Co Ltd ................................ 89,996 0.04
194,700 China Minsheng Banking Corp Ltd 'A' Shares ................................................... 119,409 0.06
495,000 China Minsheng Banking Corp Ltd 'H' Shares ................................................... 189,205 0.09
52,800 China Molybdenum Co Ltd 'A' Shares ............................................................... 46,331 0.02
297,000 China Molybdenum Co Ltd 'H' Shares ............................................................... 156,570 0.08
3,300 China National Accord Medicines Corp Ltd 'A' Shares ...................................... 19,191 0.01
9,900 China National Accord Medicines Corp Ltd 'B' Shares ...................................... 25,651 0.01
264,000 China National Building Material Co Ltd ............................................................ 323,723 0.16
9,900 China National Chemical Engineering Co Ltd .................................................... 18,682 0.01
6,600 China National Medicines Corp Ltd ................................................................... 32,725 0.02
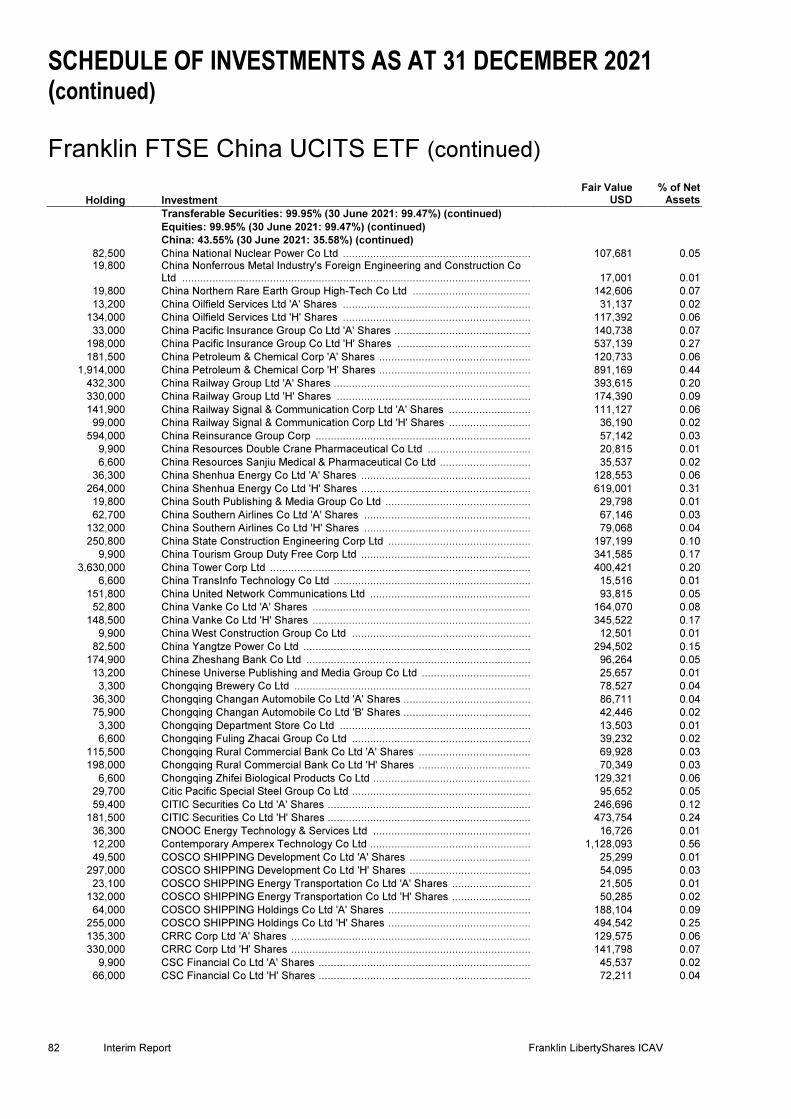
SCHEDULE OF INVESTMENTS AS AT 31 DECEMBER 2021 (continued) Franklin FTSE China UCITS ETF (continued)
82 Interim Report Franklin LibertyShares ICAV
Holding Investment
Fair Value USD
% of Net Assets
Transferable Securities: 99.95% (30 June 2021: 99.47%) (continued)
Equities: 99.95% (30 June 2021: 99.47%) (continued)
China: 43.55% (30 June 2021: 35.58%) (continued)
82,500 China National Nuclear Power Co Ltd .............................................................. 107,681 0.05 19,800
China Nonferrous Metal Industry's Foreign Engineering and Construction Co Ltd ................................................................................................................... 17,001 0.01
19,800 China Northern Rare Earth Group High-Tech Co Ltd ....................................... 142,606 0.07
13,200 China Oilfield Services Ltd 'A' Shares .............................................................. 31,137 0.02
134,000 China Oilfield Services Ltd 'H' Shares .............................................................. 117,392 0.06
33,000 China Pacific Insurance Group Co Ltd 'A' Shares ............................................. 140,738 0.07
198,000 China Pacific Insurance Group Co Ltd 'H' Shares ............................................ 537,139 0.27
181,500 China Petroleum & Chemical Corp 'A' Shares .................................................. 120,733 0.06
1,914,000 China Petroleum & Chemical Corp 'H' Shares .................................................. 891,169 0.44
432,300 China Railway Group Ltd 'A' Shares ................................................................. 393,615 0.20
330,000 China Railway Group Ltd 'H' Shares ................................................................ 174,390 0.09
141,900 China Railway Signal & Communication Corp Ltd 'A' Shares ........................... 111,127 0.06
99,000 China Railway Signal & Communication Corp Ltd 'H' Shares ........................... 36,190 0.02
594,000 China Reinsurance Group Corp ....................................................................... 57,142 0.03
9,900 China Resources Double Crane Pharmaceutical Co Ltd .................................. 20,815 0.01
6,600 China Resources Sanjiu Medical & Pharmaceutical Co Ltd .............................. 35,537 0.02
36,300 China Shenhua Energy Co Ltd 'A' Shares ........................................................ 128,553 0.06
264,000 China Shenhua Energy Co Ltd 'H' Shares ........................................................ 619,001 0.31
19,800 China South Publishing & Media Group Co Ltd ................................................ 29,798 0.01
62,700 China Southern Airlines Co Ltd 'A' Shares ....................................................... 67,146 0.03
132,000 China Southern Airlines Co Ltd 'H' Shares ....................................................... 79,068 0.04
250,800 China State Construction Engineering Corp Ltd ............................................... 197,199 0.10
9,900 China Tourism Group Duty Free Corp Ltd ........................................................ 341,585 0.17
3,630,000 China Tower Corp Ltd ...................................................................................... 400,421 0.20
6,600 China TransInfo Technology Co Ltd ................................................................. 15,516 0.01
151,800 China United Network Communications Ltd ..................................................... 93,815 0.05
52,800 China Vanke Co Ltd 'A' Shares ........................................................................ 164,070 0.08
148,500 China Vanke Co Ltd 'H' Shares ........................................................................ 345,522 0.17
9,900 China West Construction Group Co Ltd ........................................................... 12,501 0.01
82,500 China Yangtze Power Co Ltd ........................................................................... 294,502 0.15
174,900 China Zheshang Bank Co Ltd .......................................................................... 96,264 0.05
13,200 Chinese Universe Publishing and Media Group Co Ltd .................................... 25,657 0.01
3,300 Chongqing Brewery Co Ltd .............................................................................. 78,527 0.04
36,300 Chongqing Changan Automobile Co Ltd 'A' Shares .......................................... 86,711 0.04
75,900 Chongqing Changan Automobile Co Ltd 'B' Shares .......................................... 42,446 0.02
3,300 Chongqing Department Store Co Ltd ............................................................... 13,503 0.01
6,600 Chongqing Fuling Zhacai Group Co Ltd ........................................................... 39,232 0.02
115,500 Chongqing Rural Commercial Bank Co Ltd 'A' Shares ..................................... 69,928 0.03
198,000 Chongqing Rural Commercial Bank Co Ltd 'H' Shares ..................................... 70,349 0.03
6,600 Chongqing Zhifei Biological Products Co Ltd .................................................... 129,321 0.06
29,700 Citic Pacific Special Steel Group Co Ltd ........................................................... 95,652 0.05
59,400 CITIC Securities Co Ltd 'A' Shares ................................................................... 246,696 0.12
181,500 CITIC Securities Co Ltd 'H' Shares ................................................................... 473,754 0.24
36,300 CNOOC Energy Technology & Services Ltd .................................................... 16,726 0.01
12,200 Contemporary Amperex Technology Co Ltd ..................................................... 1,128,093 0.56
49,500 COSCO SHIPPING Development Co Ltd 'A' Shares ........................................ 25,299 0.01
297,000 COSCO SHIPPING Development Co Ltd 'H' Shares ........................................ 54,095 0.03
23,100 COSCO SHIPPING Energy Transportation Co Ltd 'A' Shares .......................... 21,505 0.01
132,000 COSCO SHIPPING Energy Transportation Co Ltd 'H' Shares .......................... 50,285 0.02
64,000 COSCO SHIPPING Holdings Co Ltd 'A' Shares ............................................... 188,104 0.09
255,000 COSCO SHIPPING Holdings Co Ltd 'H' Shares ............................................... 494,542 0.25
135,300 CRRC Corp Ltd 'A' Shares ............................................................................... 129,575 0.06
330,000 CRRC Corp Ltd 'H' Shares ............................................................................... 141,798 0.07
9,900 CSC Financial Co Ltd 'A' Shares ...................................................................... 45,537 0.02
66,000 CSC Financial Co Ltd 'H' Shares ...................................................................... 72,211 0.04

SCHEDULE OF INVESTMENTS AS AT 31 DECEMBER 2021 (continued) Franklin FTSE China UCITS ETF (continued)
Franklin LibertyShares ICAV Interim Report 83
Holding Investment
Fair Value USD
% of Net Assets
Transferable Securities: 99.95% (30 June 2021: 99.47%) (continued)
Equities: 99.95% (30 June 2021: 99.47%) (continued)
China: 43.55% (30 June 2021: 35.58%) (continued)
89,100 CSG Holding Co Ltd ......................................................................................... 38,057 0.02
9,900 Da An Gene Co Ltd of Sun Yat-Sen University ................................................. 31,230 0.02
330,000 Datang International Power Generation Co Ltd ................................................. 74,497 0.04
19,800 DHC Software Co Ltd ....................................................................................... 24,287 0.01
3,300 Dian Diagnostics Group Co Ltd ......................................................................... 17,421 0.01
3,300 Digital China Information Service Co Ltd ........................................................... 6,601 0.00
3,300 Do-Fluoride Chemicals Co Ltd .......................................................................... 23,347 0.01
3,300 Dong-E-E-Jiao Co Ltd ....................................................................................... 25,299 0.01
19,800 Dongfang Electric Corp Ltd 'A' Shares .............................................................. 66,695 0.03
33,000 Dongfang Electric Corp Ltd 'H' Shares .............................................................. 55,534 0.03
198,000 Dongfeng Motor Group Co Ltd .......................................................................... 164,570 0.08
13,200 Dongxing Securities Co Ltd ............................................................................... 24,141 0.01
3,300 Double Medical Technology Inc ........................................................................ 26,269 0.01
49,500 East Group Co Ltd ............................................................................................ 78,231 0.04
56,100 East Money Information Co Ltd ......................................................................... 327,387 0.16
39,600 Easyhome New Retail Group Co Ltd ................................................................ 32,133 0.02
13,200 Ecovacs Robotics Co Ltd .................................................................................. 313,339 0.16
16,500 ENN Natural Gas Co Ltd ................................................................................... 47,639 0.02
9,900 Eve Energy Co Ltd ............................................................................................ 183,987 0.09
19,800 Everbright Securities Co Ltd 'A' Shares ............................................................. 46,487 0.02
19,800 Everbright Securities Co Ltd 'H' Shares ............................................................. 15,314 0.01
23,100 Fangda Carbon New Material Co Ltd ................................................................ 39,305 0.02
16,500 FAW Jiefang Group Co Ltd ............................................................................... 26,700 0.01
6,600 Fiberhome Telecommunication Technologies Co Ltd ........................................ 18,661 0.01
19,800 Financial Street Holdings Co Ltd ....................................................................... 17,623 0.01
29,700 First Capital Securities Co Ltd ........................................................................... 34,188 0.02
9,900 Flat Glass Group Co Ltd 'A' Shares ................................................................... 90,203 0.04
33,000 Flat Glass Group Co Ltd 'H' Shares .................................................................. 167,618 0.08
82,500 Focus Media Information Technology Co Ltd .................................................... 106,254 0.05
8,136 Foshan Haitian Flavouring & Food Co Ltd ......................................................... 134,482 0.07
42,900 Founder Securities Co Ltd ................................................................................ 52,891 0.03
23,100 Foxconn Industrial Internet Co Ltd .................................................................... 43,301 0.02
3,300 Fu Jian Anjoy Foods Co Ltd .............................................................................. 88,625 0.04
6,600 Fujian Sunner Development Co Ltd .................................................................. 25,086 0.01
9,900 Fuyao Glass Industry Group Co Ltd 'A' Shares ................................................. 73,389 0.04
39,600 Fuyao Glass Industry Group Co Ltd 'H' Shares ................................................. 204,697 0.10
3,300 Gan & Lee Pharmaceuticals Co Ltd .................................................................. 36,503 0.02
6,600 Ganfeng Lithium Co Ltd 'A' Shares ................................................................... 148,263 0.07
13,200 Ganfeng Lithium Co Ltd 'H' Shares ................................................................... 207,745 0.10
36,300 GCL System Integration Technology Co Ltd ..................................................... 21,692 0.01
105,600 GD Power Development Co Ltd ........................................................................ 52,642 0.03
23,100 GEM Co Ltd ...................................................................................................... 37,598 0.02
23,100 Gemdale Corp .................................................................................................. 47,115 0.02
33,000 GF Securities Co Ltd 'A' Shares ........................................................................ 127,609 0.06
118,800 GF Securities Co Ltd 'H' Shares ........................................................................ 226,437 0.11
3,300 Gigadevice Semiconductor Beijing Inc .............................................................. 91,257 0.05
4,800 Ginlong Technologies Co Ltd ............................................................................ 174,781 0.09
26,400 Glarun Technology Co Ltd ................................................................................ 76,306 0.04
19,800 GoerTek Inc ...................................................................................................... 168,450 0.08
3,300 Gongniu Group Co Ltd ...................................................................................... 86,820 0.04
6,600 Gotion High-tech Co Ltd .................................................................................... 53,192 0.03
23,100 Grandjoy Holdings Group Co Ltd ...................................................................... 13,550 0.01
16,500 Great Wall Motor Co Ltd 'A' Shares ................................................................... 125,948 0.06
231,000 Great Wall Motor Co Ltd 'H' Shares .................................................................. 794,069 0.39
36,300 Greenland Holdings Corp Ltd ............................................................................ 24,774 0.01
16,500 GRG Banking Equipment Co Ltd ...................................................................... 30,877 0.02
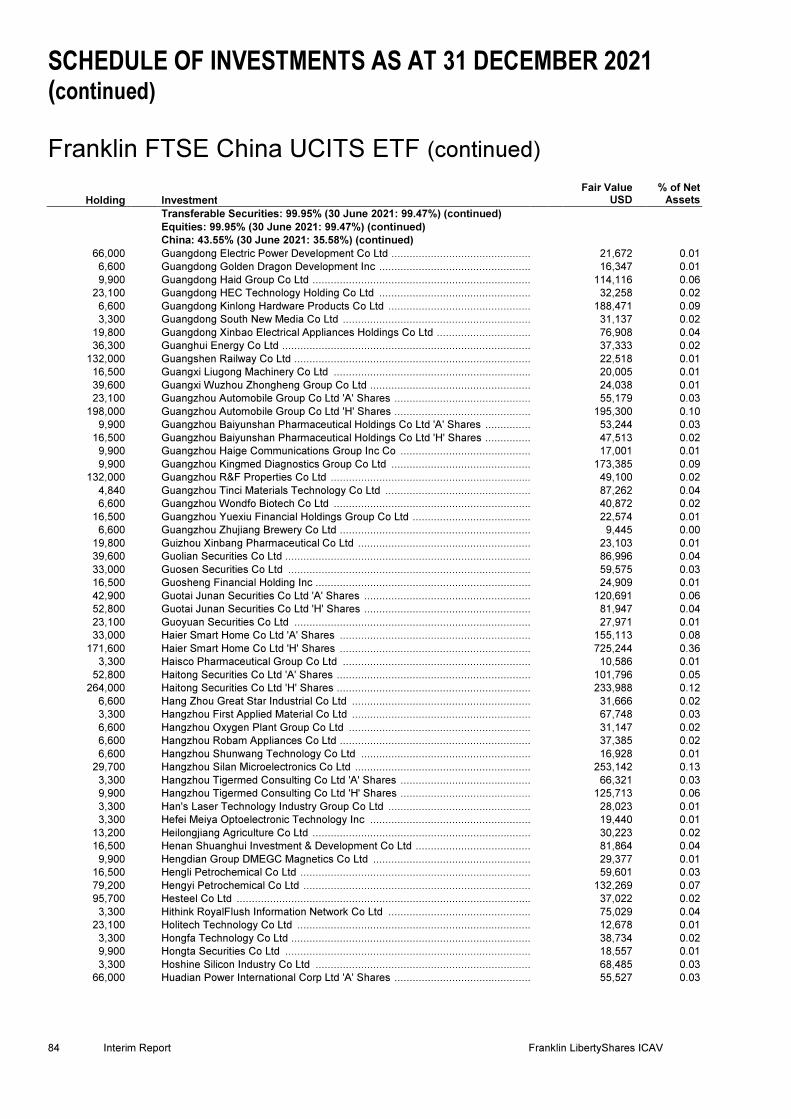
SCHEDULE OF INVESTMENTS AS AT 31 DECEMBER 2021 (continued) Franklin FTSE China UCITS ETF (continued)
84 Interim Report Franklin LibertyShares ICAV
Holding Investment
Fair Value USD
% of Net Assets
Transferable Securities: 99.95% (30 June 2021: 99.47%) (continued)
Equities: 99.95% (30 June 2021: 99.47%) (continued)
China: 43.55% (30 June 2021: 35.58%) (continued)
66,000 Guangdong Electric Power Development Co Ltd .............................................. 21,672 0.01
6,600 Guangdong Golden Dragon Development Inc .................................................. 16,347 0.01
9,900 Guangdong Haid Group Co Ltd ........................................................................ 114,116 0.06
23,100 Guangdong HEC Technology Holding Co Ltd .................................................. 32,258 0.02
6,600 Guangdong Kinlong Hardware Products Co Ltd ............................................... 188,471 0.09
3,300 Guangdong South New Media Co Ltd .............................................................. 31,137 0.02
19,800 Guangdong Xinbao Electrical Appliances Holdings Co Ltd ............................... 76,908 0.04
36,300 Guanghui Energy Co Ltd .................................................................................. 37,333 0.02
132,000 Guangshen Railway Co Ltd .............................................................................. 22,518 0.01
16,500 Guangxi Liugong Machinery Co Ltd ................................................................. 20,005 0.01
39,600 Guangxi Wuzhou Zhongheng Group Co Ltd ..................................................... 24,038 0.01
23,100 Guangzhou Automobile Group Co Ltd 'A' Shares ............................................. 55,179 0.03
198,000 Guangzhou Automobile Group Co Ltd 'H' Shares ............................................. 195,300 0.10
9,900 Guangzhou Baiyunshan Pharmaceutical Holdings Co Ltd 'A' Shares ............... 53,244 0.03
16,500 Guangzhou Baiyunshan Pharmaceutical Holdings Co Ltd 'H' Shares ............... 47,513 0.02
9,900 Guangzhou Haige Communications Group Inc Co ........................................... 17,001 0.01
9,900 Guangzhou Kingmed Diagnostics Group Co Ltd .............................................. 173,385 0.09
132,000 Guangzhou R&F Properties Co Ltd .................................................................. 49,100 0.02
4,840 Guangzhou Tinci Materials Technology Co Ltd ................................................ 87,262 0.04
6,600 Guangzhou Wondfo Biotech Co Ltd ................................................................. 40,872 0.02
16,500 Guangzhou Yuexiu Financial Holdings Group Co Ltd ....................................... 22,574 0.01
6,600 Guangzhou Zhujiang Brewery Co Ltd ............................................................... 9,445 0.00
19,800 Guizhou Xinbang Pharmaceutical Co Ltd ......................................................... 23,103 0.01
39,600 Guolian Securities Co Ltd ................................................................................. 86,996 0.04
33,000 Guosen Securities Co Ltd ................................................................................ 59,575 0.03
16,500 Guosheng Financial Holding Inc ....................................................................... 24,909 0.01
42,900 Guotai Junan Securities Co Ltd 'A' Shares ....................................................... 120,691 0.06
52,800 Guotai Junan Securities Co Ltd 'H' Shares ....................................................... 81,947 0.04
23,100 Guoyuan Securities Co Ltd .............................................................................. 27,971 0.01
33,000 Haier Smart Home Co Ltd 'A' Shares ............................................................... 155,113 0.08
171,600 Haier Smart Home Co Ltd 'H' Shares ............................................................... 725,244 0.36
3,300 Haisco Pharmaceutical Group Co Ltd .............................................................. 10,586 0.01
52,800 Haitong Securities Co Ltd 'A' Shares ................................................................ 101,796 0.05
264,000 Haitong Securities Co Ltd 'H' Shares ................................................................ 233,988 0.12
6,600 Hang Zhou Great Star Industrial Co Ltd ........................................................... 31,666 0.02
3,300 Hangzhou First Applied Material Co Ltd ........................................................... 67,748 0.03
6,600 Hangzhou Oxygen Plant Group Co Ltd ............................................................ 31,147 0.02
6,600 Hangzhou Robam Appliances Co Ltd ............................................................... 37,385 0.02
6,600 Hangzhou Shunwang Technology Co Ltd ........................................................ 16,928 0.01
29,700 Hangzhou Silan Microelectronics Co Ltd .......................................................... 253,142 0.13
3,300 Hangzhou Tigermed Consulting Co Ltd 'A' Shares ........................................... 66,321 0.03
9,900 Hangzhou Tigermed Consulting Co Ltd 'H' Shares ........................................... 125,713 0.06
3,300 Han's Laser Technology Industry Group Co Ltd ............................................... 28,023 0.01
3,300 Hefei Meiya Optoelectronic Technology Inc ..................................................... 19,440 0.01
13,200 Heilongjiang Agriculture Co Ltd ........................................................................ 30,223 0.02
16,500 Henan Shuanghui Investment & Development Co Ltd ...................................... 81,864 0.04
9,900 Hengdian Group DMEGC Magnetics Co Ltd .................................................... 29,377 0.01
16,500 Hengli Petrochemical Co Ltd ............................................................................ 59,601 0.03
79,200 Hengyi Petrochemical Co Ltd ........................................................................... 132,269 0.07
95,700 Hesteel Co Ltd ................................................................................................. 37,022 0.02
3,300 Hithink RoyalFlush Information Network Co Ltd ............................................... 75,029 0.04
23,100 Holitech Technology Co Ltd ............................................................................. 12,678 0.01
3,300 Hongfa Technology Co Ltd ............................................................................... 38,734 0.02
9,900 Hongta Securities Co Ltd ................................................................................. 18,557 0.01
3,300 Hoshine Silicon Industry Co Ltd ....................................................................... 68,485 0.03
66,000 Huadian Power International Corp Ltd 'A' Shares ............................................. 55,527 0.03

SCHEDULE OF INVESTMENTS AS AT 31 DECEMBER 2021 (continued) Franklin FTSE China UCITS ETF (continued)
Franklin LibertyShares ICAV Interim Report 85
Holding Investment
Fair Value USD
% of Net Assets
Transferable Securities: 99.95% (30 June 2021: 99.47%) (continued)
Equities: 99.95% (30 June 2021: 99.47%) (continued)
China: 43.55% (30 June 2021: 35.58%) (continued)
132,000 Huadian Power International Corp Ltd 'H' Shares .............................................. 57,566 0.03
9,900 Huadong Medicine Co Ltd ................................................................................. 62,585 0.03
16,500 Huafa Industrial Co Ltd Zhuhai .......................................................................... 15,620 0.01
6,600 Huagong Tech Co Ltd ....................................................................................... 28,916 0.01
13,200 Huaibei Mining Holdings Co Ltd ........................................................................ 23,207 0.01
9,900 Hualan Biological Engineering Inc ..................................................................... 45,366 0.02
52,800 Huaneng Power International Inc 'A' Shares ..................................................... 80,457 0.04
330,000 Huaneng Power International Inc 'H' Shares ..................................................... 220,528 0.11
36,300 Huatai Securities Co Ltd 'A' Shares ................................................................... 101,381 0.05
125,400 Huatai Securities Co Ltd 'H' Shares .................................................................. 208,777 0.10
13,200 Huaxi Securities Co Ltd ..................................................................................... 20,446 0.01
85,800 Huaxia Bank Co Ltd .......................................................................................... 75,558 0.04
6,600 Huaxin Cement Co Ltd 'A' Shares ..................................................................... 20,031 0.01
23,100 Huaxin Cement Co Ltd 'B' Shares ..................................................................... 42,504 0.02
16,500 Huayu Automotive Systems Co Ltd ................................................................... 73,431 0.04
33,000 Hubei Biocause Pharmaceutical Co Ltd ............................................................ 17,177 0.01
46,200 Hubei Energy Group Co Ltd .............................................................................. 38,070 0.02
3,300 Hubei Jumpcan Pharmaceutical Co Ltd ............................................................ 14,707 0.01
9,900 Huizhou Desay Sv Automotive Co Ltd .............................................................. 220,308 0.11
33,000 Humanwell Healthcare Group Co Ltd ................................................................ 116,867 0.06
13,200 Hunan Gold Corp Ltd ........................................................................................ 21,505 0.01
26,440 Hunan Valin Steel Co Ltd .................................................................................. 21,247 0.01
6,600 Hundsun Technologies Inc ................................................................................ 64,505 0.03
6,600 Huolinhe Opencut Coal Industry Corp Ltd of Inner Mongolia ............................. 15,413 0.01
16,500 Hytera Communications Corp Ltd ..................................................................... 14,323 0.01
13,200 Iflytek Co Ltd ..................................................................................................... 108,999 0.05
3,300 Imeik Technology Development Co Ltd ............................................................. 278,212 0.14
412,500 Industrial & Commercial Bank of China Ltd 'A' Shares ...................................... 300,340 0.15
6,006,000 Industrial & Commercial Bank of China Ltd 'H' Shares ...................................... 3,389,608 1.68
112,200 Industrial Bank Co Ltd ....................................................................................... 335,945 0.17
36,300 Industrial Securities Co Ltd ............................................................................... 56,399 0.03
6,600 Ingenic Semiconductor Co Ltd .......................................................................... 139,077 0.07
29,700 Inmyshow Digital Technology Group Co Ltd ..................................................... 57,681 0.03
224,400 Inner Mongolia BaoTou Steel Union Co Ltd ...................................................... 98,454 0.05
128,700 Inner Mongolia Junzheng Energy & Chemical Industry Group Co Ltd ............... 105,849 0.05
36,300 Inner Mongolia Yili Industrial Group Co Ltd ....................................................... 236,670 0.12
82,500 Inner Mongolia Yitai Coal Co Ltd ....................................................................... 72,022 0.04
9,900 Inspur Electronic Information Industry Co Ltd .................................................... 55,781 0.03
9,900 Intco Medical Technology Co Ltd ...................................................................... 90,047 0.04
33,000 JA Solar Technology Co Ltd ............................................................................. 481,062 0.24
3,300 Jafron Biomedical Co Ltd .................................................................................. 27,660 0.01
3,300 Jason Furniture Hangzhou Co Ltd ..................................................................... 40,042 0.02
6,600 JCET Group Co Ltd .......................................................................................... 32,195 0.02
13,200 Jiajiayue Group Co Ltd ..................................................................................... 34,541 0.02
16,500 Jiangsu Eastern Shenghong Co Ltd .................................................................. 50,182 0.02
13,200 Jiangsu Expressway Co Ltd 'A' Shares ............................................................. 17,893 0.01
68,000 Jiangsu Expressway Co Ltd 'H' Shares ............................................................. 69,689 0.03
6,600 Jiangsu Hengli Hydraulic Co Ltd ....................................................................... 84,899 0.04
33,000 Jiangsu Hengrui Medicine Co Ltd ..................................................................... 263,157 0.13
6,600 Jiangsu King's Luck Brewery JSC Ltd ............................................................... 56,461 0.03
6,600 Jiangsu Yanghe Brewery Joint-Stock Co Ltd ..................................................... 170,972 0.08
6,600 Jiangsu Yangnong Chemical Co Ltd ................................................................ 136,171 0.07
9,900 Jiangsu Yoke Technology Co Ltd ...................................................................... 126,368 0.06
6,600 Jiangsu Yuyue Medical Equipment & Supply Co Ltd ......................................... 39,232 0.02
26,400 Jiangsu Zhongnan Construction Group Co Ltd .................................................. 17,187 0.01
16,500 Jiangsu Zhongtian Technology Co Ltd .............................................................. 44,007 0.02
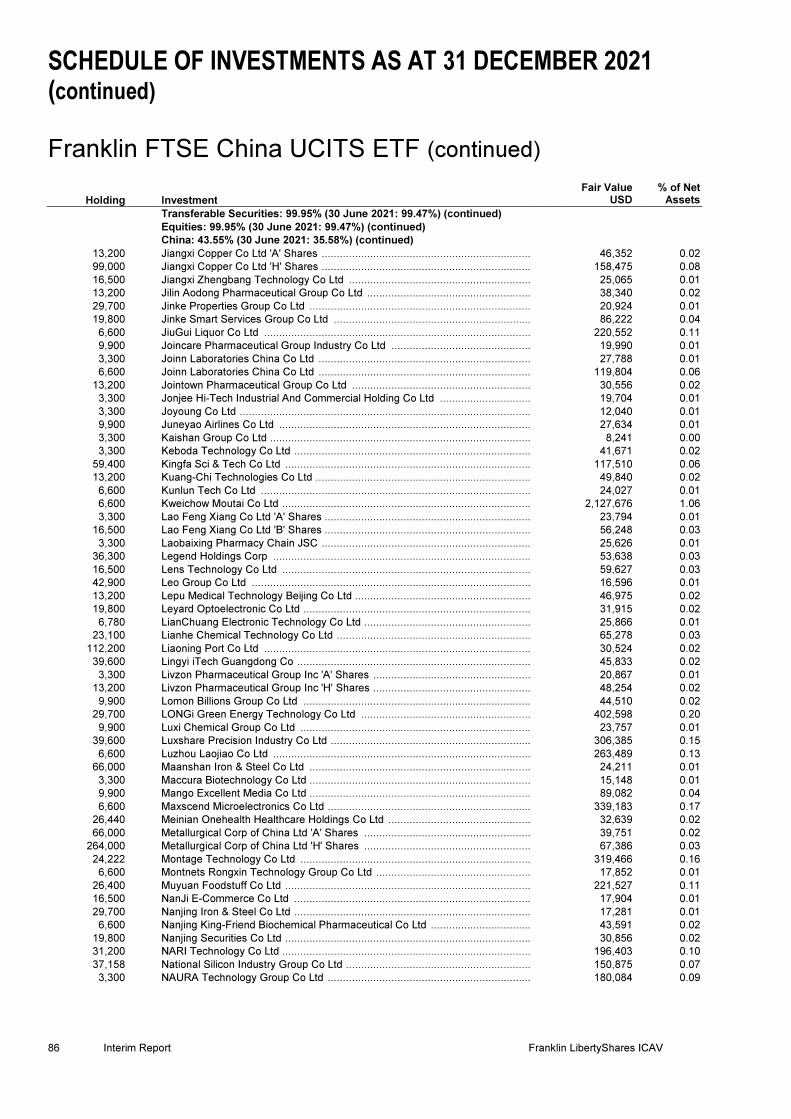
SCHEDULE OF INVESTMENTS AS AT 31 DECEMBER 2021 (continued) Franklin FTSE China UCITS ETF (continued)
86 Interim Report Franklin LibertyShares ICAV
Holding Investment
Fair Value USD
% of Net Assets
Transferable Securities: 99.95% (30 June 2021: 99.47%) (continued)
Equities: 99.95% (30 June 2021: 99.47%) (continued)
China: 43.55% (30 June 2021: 35.58%) (continued)
13,200 Jiangxi Copper Co Ltd 'A' Shares ..................................................................... 46,352 0.02
99,000 Jiangxi Copper Co Ltd 'H' Shares ..................................................................... 158,475 0.08
16,500 Jiangxi Zhengbang Technology Co Ltd ............................................................ 25,065 0.01
13,200 Jilin Aodong Pharmaceutical Group Co Ltd ...................................................... 38,340 0.02
29,700 Jinke Properties Group Co Ltd ......................................................................... 20,924 0.01
19,800 Jinke Smart Services Group Co Ltd ................................................................. 86,222 0.04
6,600 JiuGui Liquor Co Ltd ........................................................................................ 220,552 0.11
9,900 Joincare Pharmaceutical Group Industry Co Ltd .............................................. 19,990 0.01
3,300 Joinn Laboratories China Co Ltd ...................................................................... 27,788 0.01
6,600 Joinn Laboratories China Co Ltd ...................................................................... 119,804 0.06
13,200 Jointown Pharmaceutical Group Co Ltd ........................................................... 30,556 0.02
3,300 Jonjee Hi-Tech Industrial And Commercial Holding Co Ltd .............................. 19,704 0.01
3,300 Joyoung Co Ltd ................................................................................................ 12,040 0.01
9,900 Juneyao Airlines Co Ltd ................................................................................... 27,634 0.01
3,300 Kaishan Group Co Ltd ...................................................................................... 8,241 0.00
3,300 Keboda Technology Co Ltd .............................................................................. 41,671 0.02
59,400 Kingfa Sci & Tech Co Ltd ................................................................................. 117,510 0.06
13,200 Kuang-Chi Technologies Co Ltd ....................................................................... 49,840 0.02
6,600 Kunlun Tech Co Ltd ......................................................................................... 24,027 0.01
6,600 Kweichow Moutai Co Ltd .................................................................................. 2,127,676 1.06
3,300 Lao Feng Xiang Co Ltd 'A' Shares .................................................................... 23,794 0.01
16,500 Lao Feng Xiang Co Ltd 'B' Shares .................................................................... 56,248 0.03
3,300 Laobaixing Pharmacy Chain JSC ..................................................................... 25,626 0.01
36,300 Legend Holdings Corp ..................................................................................... 53,638 0.03
16,500 Lens Technology Co Ltd .................................................................................. 59,627 0.03
42,900 Leo Group Co Ltd ............................................................................................ 16,596 0.01
13,200 Lepu Medical Technology Beijing Co Ltd .......................................................... 46,975 0.02
19,800 Leyard Optoelectronic Co Ltd ........................................................................... 31,915 0.02
6,780 LianChuang Electronic Technology Co Ltd ....................................................... 25,866 0.01
23,100 Lianhe Chemical Technology Co Ltd ................................................................ 65,278 0.03
112,200 Liaoning Port Co Ltd ........................................................................................ 30,524 0.02
39,600 Lingyi iTech Guangdong Co ............................................................................. 45,833 0.02
3,300 Livzon Pharmaceutical Group Inc 'A' Shares .................................................... 20,867 0.01
13,200 Livzon Pharmaceutical Group Inc 'H' Shares .................................................... 48,254 0.02
9,900 Lomon Billions Group Co Ltd ........................................................................... 44,510 0.02
29,700 LONGi Green Energy Technology Co Ltd ........................................................ 402,598 0.20
9,900 Luxi Chemical Group Co Ltd ............................................................................ 23,757 0.01
39,600 Luxshare Precision Industry Co Ltd .................................................................. 306,385 0.15
6,600 Luzhou Laojiao Co Ltd ..................................................................................... 263,489 0.13
66,000 Maanshan Iron & Steel Co Ltd ......................................................................... 24,211 0.01
3,300 Maccura Biotechnology Co Ltd ......................................................................... 15,148 0.01
9,900 Mango Excellent Media Co Ltd ......................................................................... 89,082 0.04
6,600 Maxscend Microelectronics Co Ltd ................................................................... 339,183 0.17
26,440 Meinian Onehealth Healthcare Holdings Co Ltd ............................................... 32,639 0.02
66,000 Metallurgical Corp of China Ltd 'A' Shares ....................................................... 39,751 0.02
264,000 Metallurgical Corp of China Ltd 'H' Shares ....................................................... 67,386 0.03
24,222 Montage Technology Co Ltd ............................................................................ 319,466 0.16
6,600 Montnets Rongxin Technology Group Co Ltd ................................................... 17,852 0.01
26,400 Muyuan Foodstuff Co Ltd ................................................................................. 221,527 0.11
16,500 NanJi E-Commerce Co Ltd .............................................................................. 17,904 0.01
29,700 Nanjing Iron & Steel Co Ltd .............................................................................. 17,281 0.01
6,600 Nanjing King-Friend Biochemical Pharmaceutical Co Ltd ................................. 43,591 0.02
19,800 Nanjing Securities Co Ltd ................................................................................. 30,856 0.02
31,200 NARI Technology Co Ltd .................................................................................. 196,403 0.10
37,158 National Silicon Industry Group Co Ltd ............................................................. 150,875 0.07
3,300 NAURA Technology Group Co Ltd ................................................................... 180,084 0.09
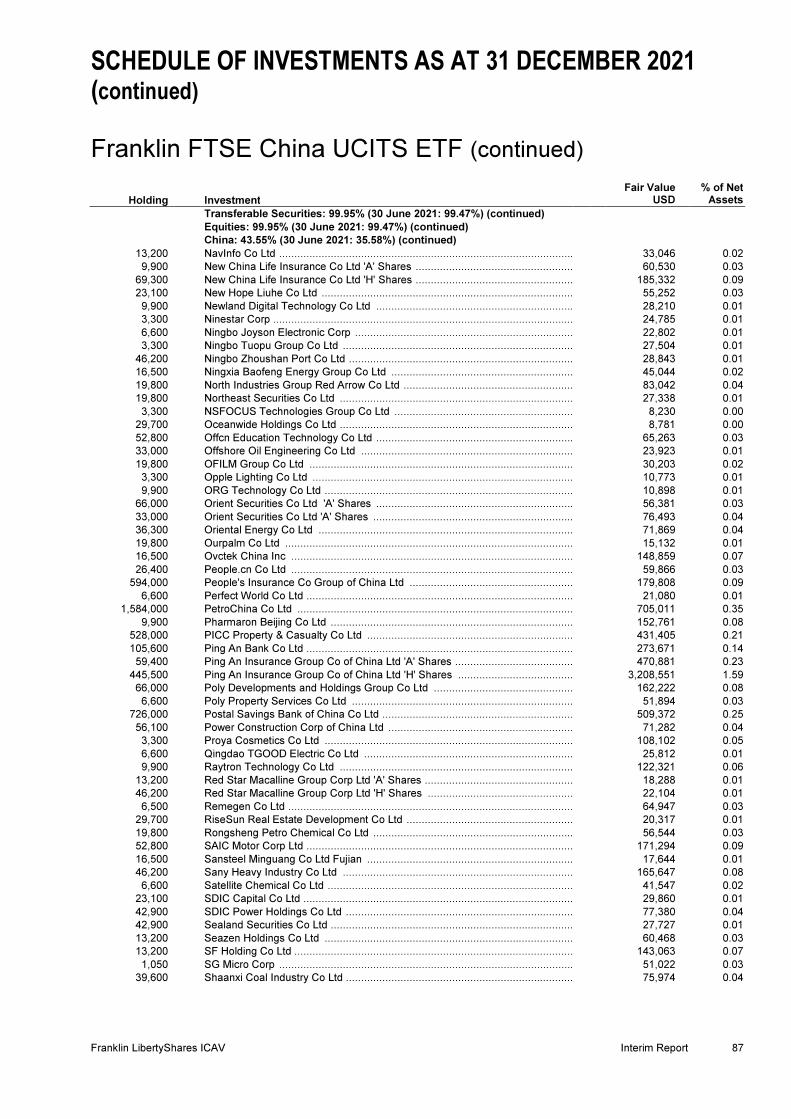
SCHEDULE OF INVESTMENTS AS AT 31 DECEMBER 2021 (continued) Franklin FTSE China UCITS ETF (continued)
Franklin LibertyShares ICAV Interim Report 87
Holding Investment
Fair Value USD
% of Net Assets
Transferable Securities: 99.95% (30 June 2021: 99.47%) (continued)
Equities: 99.95% (30 June 2021: 99.47%) (continued)
China: 43.55% (30 June 2021: 35.58%) (continued)
13,200 NavInfo Co Ltd .................................................................................................. 33,046 0.02
9,900 New China Life Insurance Co Ltd 'A' Shares ..................................................... 60,530 0.03
69,300 New China Life Insurance Co Ltd 'H' Shares ..................................................... 185,332 0.09
23,100 New Hope Liuhe Co Ltd .................................................................................... 55,252 0.03
9,900 Newland Digital Technology Co Ltd .................................................................. 28,210 0.01
3,300 Ninestar Corp .................................................................................................... 24,785 0.01
6,600 Ningbo Joyson Electronic Corp ......................................................................... 22,802 0.01
3,300 Ningbo Tuopu Group Co Ltd ............................................................................. 27,504 0.01
46,200 Ningbo Zhoushan Port Co Ltd ........................................................................... 28,843 0.01
16,500 Ningxia Baofeng Energy Group Co Ltd ............................................................. 45,044 0.02
19,800 North Industries Group Red Arrow Co Ltd ......................................................... 83,042 0.04
19,800 Northeast Securities Co Ltd .............................................................................. 27,338 0.01
3,300 NSFOCUS Technologies Group Co Ltd ............................................................ 8,230 0.00
29,700 Oceanwide Holdings Co Ltd .............................................................................. 8,781 0.00
52,800 Offcn Education Technology Co Ltd .................................................................. 65,263 0.03
33,000 Offshore Oil Engineering Co Ltd ....................................................................... 23,923 0.01
19,800 OFILM Group Co Ltd ........................................................................................ 30,203 0.02
3,300 Opple Lighting Co Ltd ....................................................................................... 10,773 0.01
9,900 ORG Technology Co Ltd ................................................................................... 10,898 0.01
66,000 Orient Securities Co Ltd 'A' Shares .................................................................. 56,381 0.03
33,000 Orient Securities Co Ltd 'A' Shares ................................................................... 76,493 0.04
36,300 Oriental Energy Co Ltd ..................................................................................... 71,869 0.04
19,800 Ourpalm Co Ltd ................................................................................................ 15,132 0.01
16,500 Ovctek China Inc .............................................................................................. 148,859 0.07
26,400 People.cn Co Ltd .............................................................................................. 59,866 0.03
594,000 People's Insurance Co Group of China Ltd ....................................................... 179,808 0.09
6,600 Perfect World Co Ltd ......................................................................................... 21,080 0.01
1,584,000 PetroChina Co Ltd ............................................................................................ 705,011 0.35
9,900 Pharmaron Beijing Co Ltd ................................................................................. 152,761 0.08
528,000 PICC Property & Casualty Co Ltd ..................................................................... 431,405 0.21
105,600 Ping An Bank Co Ltd ......................................................................................... 273,671 0.14
59,400 Ping An Insurance Group Co of China Ltd 'A' Shares ........................................ 470,881 0.23
445,500 Ping An Insurance Group Co of China Ltd 'H' Shares ....................................... 3,208,551 1.59
66,000 Poly Developments and Holdings Group Co Ltd ............................................... 162,222 0.08
6,600 Poly Property Services Co Ltd .......................................................................... 51,894 0.03
726,000 Postal Savings Bank of China Co Ltd ................................................................ 509,372 0.25
56,100 Power Construction Corp of China Ltd .............................................................. 71,282 0.04
3,300 Proya Cosmetics Co Ltd ................................................................................... 108,102 0.05
6,600 Qingdao TGOOD Electric Co Ltd ...................................................................... 25,812 0.01
9,900 Raytron Technology Co Ltd .............................................................................. 122,321 0.06
13,200 Red Star Macalline Group Corp Ltd 'A' Shares .................................................. 18,288 0.01
46,200 Red Star Macalline Group Corp Ltd 'H' Shares ................................................. 22,104 0.01
6,500 Remegen Co Ltd ............................................................................................... 64,947 0.03
29,700 RiseSun Real Estate Development Co Ltd ........................................................ 20,317 0.01
19,800 Rongsheng Petro Chemical Co Ltd ................................................................... 56,544 0.03
52,800 SAIC Motor Corp Ltd ......................................................................................... 171,294 0.09
16,500 Sansteel Minguang Co Ltd Fujian ..................................................................... 17,644 0.01
46,200 Sany Heavy Industry Co Ltd ............................................................................. 165,647 0.08
6,600 Satellite Chemical Co Ltd .................................................................................. 41,547 0.02
23,100 SDIC Capital Co Ltd .......................................................................................... 29,860 0.01
42,900 SDIC Power Holdings Co Ltd ............................................................................ 77,380 0.04
42,900 Sealand Securities Co Ltd ................................................................................. 27,727 0.01
13,200 Seazen Holdings Co Ltd ................................................................................... 60,468 0.03
13,200 SF Holding Co Ltd ............................................................................................. 143,063 0.07
1,050 SG Micro Corp .................................................................................................. 51,022 0.03
39,600 Shaanxi Coal Industry Co Ltd ............................................................................ 75,974 0.04

SCHEDULE OF INVESTMENTS AS AT 31 DECEMBER 2021 (continued) Franklin FTSE China UCITS ETF (continued)
88 Interim Report Franklin LibertyShares ICAV
Holding Investment
Fair Value USD
% of Net Assets
Transferable Securities: 99.95% (30 June 2021: 99.47%) (continued)
Equities: 99.95% (30 June 2021: 99.47%) (continued)
China: 43.55% (30 June 2021: 35.58%) (continued)
29,700 Shaanxi International Trust Co Ltd ................................................................... 15,086 0.01
13,200 Shan Xi Hua Yang Group New Energy Co Ltd ................................................. 24,598 0.01
75,900 Shandong Chenming Paper Holdings Ltd 'B' Shares ........................................ 34,074 0.02
49,500 Shandong Chenming Paper Holdings Ltd 'H' Shares ........................................ 23,682 0.01
6,600 Shandong Denghai Seeds Co Ltd .................................................................... 26,767 0.01
23,128 Shandong Gold Mining Co Ltd 'A' Shares ......................................................... 68,449 0.03
49,500 Shandong Gold Mining Co Ltd 'H' Shares ........................................................ 84,698 0.04
6,600 Shandong Himile Mechanical Science & Technology Co Ltd ............................ 28,812 0.01
6,600 Shandong Hualu Hengsheng Chemical Co Ltd ................................................ 32,486 0.02
3,300 Shandong Linglong Tyre Co Ltd ....................................................................... 18,967 0.01
72,600 Shandong Nanshan Aluminum Co Ltd ............................................................. 53,773 0.03
13,200 Shandong Pharmaceutical Glass Co Ltd .......................................................... 91,127 0.05
13,200 Shandong Sun Paper Industry JSC Ltd ............................................................ 23,851 0.01
171,600 Shandong Weigao Group Medical Polymer Co Ltd ........................................... 214,162 0.11
26,400 Shanghai 2345 Network Holding Group Co Ltd ................................................ 9,715 0.00
29,700 Shanghai Bailian Group Co Ltd ........................................................................ 26,136 0.01
3,300 Shanghai Bairun Investment Holding Group Co Ltd ......................................... 31,049 0.02
3,300 Shanghai Baosight Software Co Ltd 'A' Shares ................................................ 31,567 0.02
29,700 Shanghai Baosight Software Co Ltd 'B' Shares ................................................ 143,362 0.07
42,900 Shanghai Construction Group Co Ltd ............................................................... 24,287 0.01
19,800 Shanghai Dazhong Public Utilities Group Co Ltd .............................................. 11,801 0.01
62,700 Shanghai Electric Group Co Ltd 'A' Shares ...................................................... 47,919 0.02
264,000 Shanghai Electric Group Co Ltd 'H' Shares ...................................................... 80,592 0.04
13,200 Shanghai Electric Power Co Ltd ....................................................................... 26,612 0.01
9,900 Shanghai Fosun Pharmaceutical Group Co Ltd 'A' Shares ............................... 76,192 0.04
33,000 Shanghai Fosun Pharmaceutical Group Co Ltd 'H' Shares ............................... 145,396 0.07
1,952 Shanghai Friendess Electronic Technology Corp Ltd ....................................... 118,322 0.06
6,600 Shanghai Huayi Group Co Ltd .......................................................................... 4,851 0.00
9,900 Shanghai International Airport Co Ltd ............................................................... 72,689 0.04
75,900 Shanghai International Port Group Co Ltd ........................................................ 65,408 0.03
3,300 Shanghai Jahwa United Co Ltd ........................................................................ 20,971 0.01
3,300 Shanghai Jinjiang International Hotels Co Ltd 'A' Shares ................................. 30,410 0.02
9,900 Shanghai Jinjiang International Hotels Co Ltd 'B' Shares ................................. 19,404 0.01
3,300 Shanghai Junshi Biosciences Co Ltd 'A' Shares ............................................... 34,759 0.02
13,200 Shanghai Junshi Biosciences Co Ltd 'H' Shares .............................................. 98,200 0.05
39,600 Shanghai Lingang Holdings Corp Ltd ............................................................... 92,601 0.05
13,200 Shanghai Lujiazui Finance & Trade Zone Development Co Ltd 'A' Shares ....... 22,543 0.01
92,400 Shanghai Lujiazui Finance & Trade Zone Development Co Ltd 'B' Shares ....... 84,176 0.04
3,300 Shanghai M&G Stationery Inc .......................................................................... 33,477 0.02
13,200 Shanghai Mechanical and Electrical Industry Co Ltd ........................................ 18,005 0.01
9,900 Shanghai Pharmaceuticals Holding Co Ltd 'A' Shares ...................................... 30,934 0.02
72,600 Shanghai Pharmaceuticals Holding Co Ltd 'H' Shares ..................................... 137,633 0.07
158,400 Shanghai Pudong Development Bank Co Ltd .................................................. 212,477 0.11
3,300 Shanghai Putailai New Energy Technology Co Ltd ........................................... 83,348 0.04
33,000 Shanghai RAAS Blood Products Co Ltd ........................................................... 35,392 0.02
46,200 Shanghai Shibei Hi-Tech Co Ltd ...................................................................... 13,306 0.01
19,800 Shanghai Shimao Co Ltd ................................................................................. 10,213 0.01
19,800 Shanghai Tunnel Engineering Co Ltd ............................................................... 16,752 0.01
6,600 Shanghai Waigaoqiao Free Trade Zone Group Co Ltd 'A' Shares .................... 13,731 0.01
19,800 Shanghai Waigaoqiao Free Trade Zone Group Co Ltd 'B' Shares .................... 17,860 0.01
29,700 Shanghai Yuyuan Tourist Mart Group Co Ltd ................................................... 48,106 0.02
9,900 Shanghai Zhangjiang High-Tech Park Development Co Ltd ............................. 23,446 0.01
82,500 Shanghai Zhenhua Heavy Industries Co Ltd .................................................... 23,513 0.01
23,100 Shanxi Coking Coal Energy Group Co Ltd ....................................................... 30,042 0.01
16,500 Shanxi Lu'an Environmental Energy Development Co Ltd ................................ 29,346 0.01
29,740 Shanxi Securities Co Ltd .................................................................................. 30,867 0.02

SCHEDULE OF INVESTMENTS AS AT 31 DECEMBER 2021 (continued) Franklin FTSE China UCITS ETF (continued)
Franklin LibertyShares ICAV Interim Report 89
Holding Investment
Fair Value USD
% of Net Assets
Transferable Securities: 99.95% (30 June 2021: 99.47%) (continued)
Equities: 99.95% (30 June 2021: 99.47%) (continued)
China: 43.55% (30 June 2021: 35.58%) (continued)
125,400 Shanxi Taigang Stainless Steel Co Ltd ............................................................. 138,828 0.07
6,600 Shanxi Xinghuacun Fen Wine Factory Co Ltd ................................................... 327,745 0.16
49,500 Shanying International Holding Co Ltd .............................................................. 25,610 0.01
13,200 Shenghe Resources Holding Co Ltd ................................................................ 40,727 0.02
16,500 Shengyi Technology Co Ltd .............................................................................. 61,106 0.03
132,000 Shenwan Hongyuan Group Co Ltd 'A' Shares ................................................... 106,280 0.05
105,600 Shenwan Hongyuan Group Co Ltd 'H' Shares ................................................... 25,735 0.01
19,800 Shenzhen Airport Co Ltd ................................................................................... 22,792 0.01
9,900 Shenzhen Capchem Technology Co Ltd ........................................................... 175,922 0.09
39,600 Shenzhen Energy Group Co Ltd ....................................................................... 50,442 0.03
3,760 Shenzhen Everwin Precision Technology Co Ltd .............................................. 11,731 0.01
66,000 Shenzhen Expressway Corp Ltd ....................................................................... 63,915 0.03
13,200 Shenzhen Gas Corp Ltd .................................................................................... 18,329 0.01
6,600 Shenzhen Hepalink Pharmaceutical Group Co Ltd 'A' Shares ........................... 17,748 0.01
16,500 Shenzhen Hepalink Pharmaceutical Group Co Ltd 'H' Shares ........................... 17,227 0.01
3,300 Shenzhen Infogem Technologies Co Ltd ........................................................... 7,950 0.00
14,350 Shenzhen Inovance Technology Co Ltd ............................................................ 154,805 0.08
9,900 Shenzhen Jinjia Group Co Ltd .......................................................................... 23,555 0.01
13,200 Shenzhen Kaifa Technology Co Ltd .................................................................. 32,880 0.02
3,300 Shenzhen Kangtai Biological Products Co Ltd .................................................. 51,137 0.03
6,600 Shenzhen Kingdom Sci-Tech Co Ltd ................................................................ 14,863 0.01
4,300 Shenzhen Mindray Bio-Medical Electronics Co Ltd ........................................... 257,498 0.13
33,000 Shenzhen MTC Co Ltd ..................................................................................... 25,221 0.01
29,700 Shenzhen Neptunus Bioengineering Co Ltd ...................................................... 16,487 0.01
3,300 Shenzhen New Industries Biomedical Engineering Co Ltd ................................ 22,860 0.01
46,200 Shenzhen Overseas Chinese Town Co Ltd ....................................................... 51,147 0.03
6,600 Shenzhen Salubris Pharmaceuticals Co Ltd ..................................................... 28,355 0.01
6,600 Shenzhen SC New Energy Technology Corp .................................................... 118,631 0.06
6,600 Shenzhen Sunway Communication Co Ltd ....................................................... 26,279 0.01
17,424 Shenzhen Transsion Holdings Co Ltd ............................................................... 429,911 0.21
6,600 Shenzhen YUTO Packaging Technology Co Ltd ............................................... 34,967 0.02
16,500 Shenzhen Zhongjin Lingnan Nonfemet Co Ltd .................................................. 12,740 0.01
13,200 Shijiazhuang Changshan BeiMing Technology Co Ltd ...................................... 14,364 0.01
3,300 Shijiazhuang Yiling Pharmaceutical Co Ltd ....................................................... 10,171 0.01
16,500 Siasun Robot & Automation Co Ltd ................................................................... 28,983 0.01
33,000 Sichuan Chuantou Energy Co Ltd ..................................................................... 64,868 0.03
46,200 Sichuan Hebang Biotechnology Co Ltd ............................................................. 24,774 0.01
9,900 Sichuan Kelun Pharmaceutical Co Ltd .............................................................. 29,471 0.01
6,600 Sichuan Road & Bridge Co Ltd ......................................................................... 12,496 0.01
3,300 Sichuan Swellfun Co Ltd ................................................................................... 62,268 0.03
3,300 Sichuan Teway Food Group Co Ltd .................................................................. 13,913 0.01
3,300 Sieyuan Electric Co Ltd ..................................................................................... 25,537 0.01
16,500 Sinolink Securities Co Ltd ................................................................................. 29,398 0.01
9,900 Sinoma International Engineering Co ................................................................ 17,795 0.01
9,900 Sinoma Science & Technology Co Ltd .............................................................. 52,964 0.03
132,000 Sinopec Engineering Group Co Ltd ................................................................... 65,185 0.03
198,000 Sinopec Oilfield Service Corp ............................................................................ 16,508 0.01
330,000 Sinopec Shanghai Petrochemical Co Ltd .......................................................... 75,767 0.04
92,400 Sinopharm Group Co Ltd .................................................................................. 201,006 0.10
4,300 Sinosoft Co Ltd ................................................................................................ 18,501 0.01
33,000 Sinotrans Ltd 'A' Shares .................................................................................... 23,249 0.01
132,000 Sinotrans Ltd 'H' Shares .................................................................................... 42,328 0.02
6,600 Skshu Paint Co Ltd ........................................................................................... 144,423 0.07
16,500 Songcheng Performance Development Co Ltd ................................................. 37,156 0.02
25,740 SooChow Securities Co Ltd .............................................................................. 35,863 0.02
39,600 Southwest Securities Co Ltd ............................................................................. 32,943 0.02
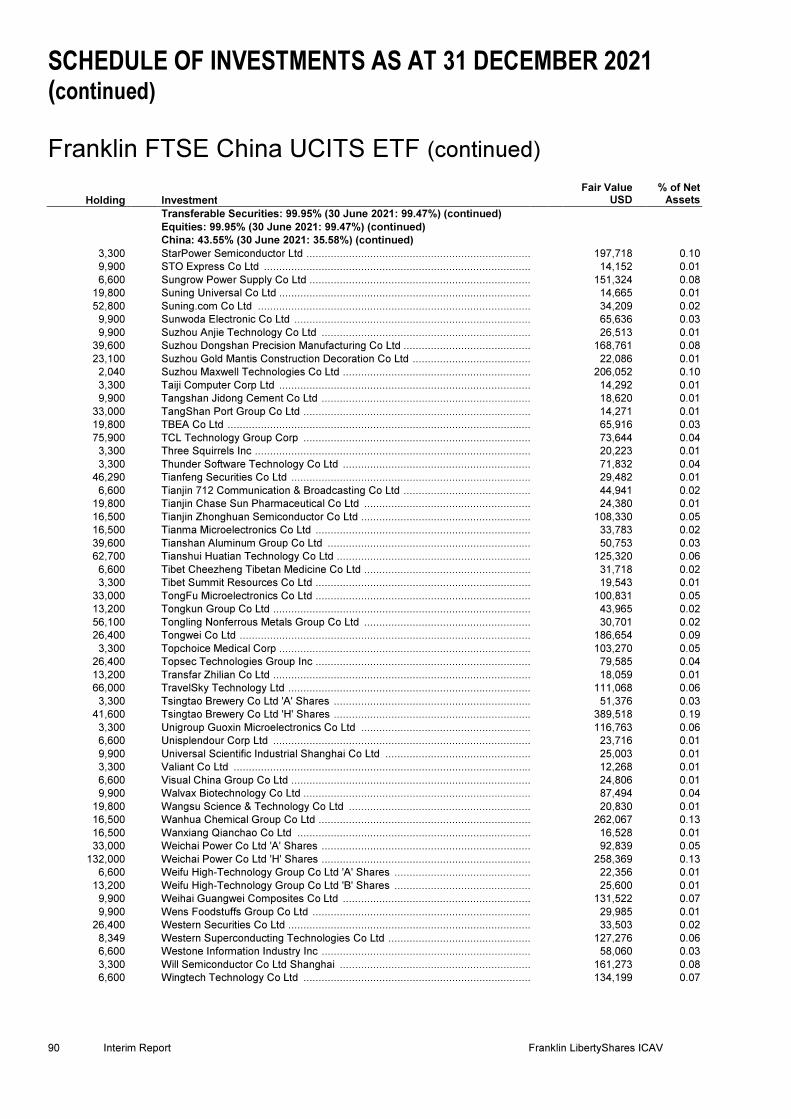
SCHEDULE OF INVESTMENTS AS AT 31 DECEMBER 2021 (continued) Franklin FTSE China UCITS ETF (continued)
90 Interim Report Franklin LibertyShares ICAV
Holding Investment
Fair Value USD
% of Net Assets
Transferable Securities: 99.95% (30 June 2021: 99.47%) (continued)
Equities: 99.95% (30 June 2021: 99.47%) (continued)
China: 43.55% (30 June 2021: 35.58%) (continued)
3,300 StarPower Semiconductor Ltd .......................................................................... 197,718 0.10
9,900 STO Express Co Ltd ........................................................................................ 14,152 0.01
6,600 Sungrow Power Supply Co Ltd ......................................................................... 151,324 0.08
19,800 Suning Universal Co Ltd ................................................................................... 14,665 0.01
52,800 Suning.com Co Ltd .......................................................................................... 34,209 0.02
9,900 Sunwoda Electronic Co Ltd .............................................................................. 65,636 0.03
9,900 Suzhou Anjie Technology Co Ltd ..................................................................... 26,513 0.01
39,600 Suzhou Dongshan Precision Manufacturing Co Ltd .......................................... 168,761 0.08
23,100 Suzhou Gold Mantis Construction Decoration Co Ltd ....................................... 22,086 0.01
2,040 Suzhou Maxwell Technologies Co Ltd .............................................................. 206,052 0.10
3,300 Taiji Computer Corp Ltd ................................................................................... 14,292 0.01
9,900 Tangshan Jidong Cement Co Ltd ..................................................................... 18,620 0.01
33,000 TangShan Port Group Co Ltd ........................................................................... 14,271 0.01
19,800 TBEA Co Ltd .................................................................................................... 65,916 0.03
75,900 TCL Technology Group Corp ........................................................................... 73,644 0.04
3,300 Three Squirrels Inc ........................................................................................... 20,223 0.01
3,300 Thunder Software Technology Co Ltd .............................................................. 71,832 0.04
46,290 Tianfeng Securities Co Ltd ............................................................................... 29,482 0.01
6,600 Tianjin 712 Communication & Broadcasting Co Ltd .......................................... 44,941 0.02
19,800 Tianjin Chase Sun Pharmaceutical Co Ltd ....................................................... 24,380 0.01
16,500 Tianjin Zhonghuan Semiconductor Co Ltd ........................................................ 108,330 0.05
16,500 Tianma Microelectronics Co Ltd ....................................................................... 33,783 0.02
39,600 Tianshan Aluminum Group Co Ltd ................................................................... 50,753 0.03
62,700 Tianshui Huatian Technology Co Ltd ................................................................ 125,320 0.06
6,600 Tibet Cheezheng Tibetan Medicine Co Ltd ....................................................... 31,718 0.02
3,300 Tibet Summit Resources Co Ltd ....................................................................... 19,543 0.01
33,000 TongFu Microelectronics Co Ltd ....................................................................... 100,831 0.05
13,200 Tongkun Group Co Ltd ..................................................................................... 43,965 0.02
56,100 Tongling Nonferrous Metals Group Co Ltd ....................................................... 30,701 0.02
26,400 Tongwei Co Ltd ................................................................................................ 186,654 0.09
3,300 Topchoice Medical Corp ................................................................................... 103,270 0.05
26,400 Topsec Technologies Group Inc ....................................................................... 79,585 0.04
13,200 Transfar Zhilian Co Ltd ..................................................................................... 18,059 0.01
66,000 TravelSky Technology Ltd ................................................................................ 111,068 0.06
3,300 Tsingtao Brewery Co Ltd 'A' Shares ................................................................. 51,376 0.03
41,600 Tsingtao Brewery Co Ltd 'H' Shares ................................................................. 389,518 0.19
3,300 Unigroup Guoxin Microelectronics Co Ltd ........................................................ 116,763 0.06
6,600 Unisplendour Corp Ltd ..................................................................................... 23,716 0.01
9,900 Universal Scientific Industrial Shanghai Co Ltd ................................................ 25,003 0.01
3,300 Valiant Co Ltd .................................................................................................. 12,268 0.01
6,600 Visual China Group Co Ltd ............................................................................... 24,806 0.01
9,900 Walvax Biotechnology Co Ltd ........................................................................... 87,494 0.04
19,800 Wangsu Science & Technology Co Ltd ............................................................ 20,830 0.01
16,500 Wanhua Chemical Group Co Ltd ...................................................................... 262,067 0.13
16,500 Wanxiang Qianchao Co Ltd ............................................................................. 16,528 0.01
33,000 Weichai Power Co Ltd 'A' Shares ..................................................................... 92,839 0.05
132,000 Weichai Power Co Ltd 'H' Shares ..................................................................... 258,369 0.13
6,600 Weifu High-Technology Group Co Ltd 'A' Shares ............................................. 22,356 0.01
13,200 Weifu High-Technology Group Co Ltd 'B' Shares ............................................. 25,600 0.01
9,900 Weihai Guangwei Composites Co Ltd .............................................................. 131,522 0.07
9,900 Wens Foodstuffs Group Co Ltd ........................................................................ 29,985 0.01
26,400 Western Securities Co Ltd ................................................................................ 33,503 0.02
8,349 Western Superconducting Technologies Co Ltd ............................................... 127,276 0.06
6,600 Westone Information Industry Inc ..................................................................... 58,060 0.03
3,300 Will Semiconductor Co Ltd Shanghai ............................................................... 161,273 0.08
6,600 Wingtech Technology Co Ltd ........................................................................... 134,199 0.07
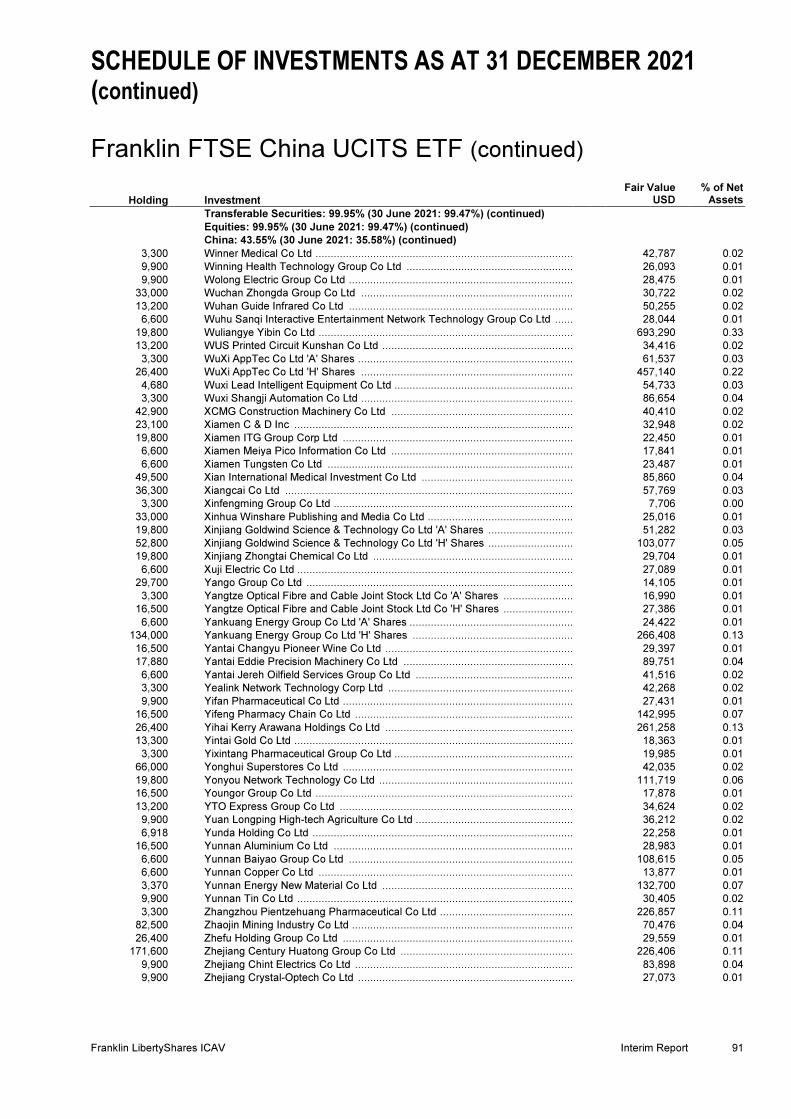
SCHEDULE OF INVESTMENTS AS AT 31 DECEMBER 2021 (continued) Franklin FTSE China UCITS ETF (continued)
Franklin LibertyShares ICAV Interim Report 91
Holding Investment
Fair Value USD
% of Net Assets
Transferable Securities: 99.95% (30 June 2021: 99.47%) (continued)
Equities: 99.95% (30 June 2021: 99.47%) (continued)
China: 43.55% (30 June 2021: 35.58%) (continued)
3,300 Winner Medical Co Ltd ...................................................................................... 42,787 0.02
9,900 Winning Health Technology Group Co Ltd ........................................................ 26,093 0.01
9,900 Wolong Electric Group Co Ltd ........................................................................... 28,475 0.01
33,000 Wuchan Zhongda Group Co Ltd ....................................................................... 30,722 0.02
13,200 Wuhan Guide Infrared Co Ltd ........................................................................... 50,255 0.02
6,600 Wuhu Sanqi Interactive Entertainment Network Technology Group Co Ltd ....... 28,044 0.01
19,800 Wuliangye Yibin Co Ltd ..................................................................................... 693,290 0.33
13,200 WUS Printed Circuit Kunshan Co Ltd ................................................................ 34,416 0.02
3,300 WuXi AppTec Co Ltd 'A' Shares ........................................................................ 61,537 0.03
26,400 WuXi AppTec Co Ltd 'H' Shares ....................................................................... 457,140 0.22
4,680 Wuxi Lead Intelligent Equipment Co Ltd ............................................................ 54,733 0.03
3,300 Wuxi Shangji Automation Co Ltd ....................................................................... 86,654 0.04
42,900 XCMG Construction Machinery Co Ltd ............................................................. 40,410 0.02
23,100 Xiamen C & D Inc ............................................................................................. 32,948 0.02
19,800 Xiamen ITG Group Corp Ltd ............................................................................. 22,450 0.01
6,600 Xiamen Meiya Pico Information Co Ltd ............................................................. 17,841 0.01
6,600 Xiamen Tungsten Co Ltd .................................................................................. 23,487 0.01
49,500 Xian International Medical Investment Co Ltd ................................................... 85,860 0.04
36,300 Xiangcai Co Ltd ................................................................................................ 57,769 0.03
3,300 Xinfengming Group Co Ltd ................................................................................ 7,706 0.00
33,000 Xinhua Winshare Publishing and Media Co Ltd ................................................. 25,016 0.01
19,800 Xinjiang Goldwind Science & Technology Co Ltd 'A' Shares ............................. 51,282 0.03
52,800 Xinjiang Goldwind Science & Technology Co Ltd 'H' Shares ............................. 103,077 0.05
19,800 Xinjiang Zhongtai Chemical Co Ltd ................................................................... 29,704 0.01
6,600 Xuji Electric Co Ltd ............................................................................................ 27,089 0.01
29,700 Yango Group Co Ltd ......................................................................................... 14,105 0.01
3,300 Yangtze Optical Fibre and Cable Joint Stock Ltd Co 'A' Shares ........................ 16,990 0.01
16,500 Yangtze Optical Fibre and Cable Joint Stock Ltd Co 'H' Shares ........................ 27,386 0.01
6,600 Yankuang Energy Group Co Ltd 'A' Shares ....................................................... 24,422 0.01
134,000 Yankuang Energy Group Co Ltd 'H' Shares ...................................................... 266,408 0.13
16,500 Yantai Changyu Pioneer Wine Co Ltd ............................................................... 29,397 0.01
17,880 Yantai Eddie Precision Machinery Co Ltd ......................................................... 89,751 0.04
6,600 Yantai Jereh Oilfield Services Group Co Ltd ..................................................... 41,516 0.02
3,300 Yealink Network Technology Corp Ltd .............................................................. 42,268 0.02
9,900 Yifan Pharmaceutical Co Ltd ............................................................................. 27,431 0.01
16,500 Yifeng Pharmacy Chain Co Ltd ......................................................................... 142,995 0.07
26,400 Yihai Kerry Arawana Holdings Co Ltd ............................................................... 261,258 0.13
13,300 Yintai Gold Co Ltd ............................................................................................. 18,363 0.01
3,300 Yixintang Pharmaceutical Group Co Ltd ............................................................ 19,985 0.01
66,000 Yonghui Superstores Co Ltd ............................................................................. 42,035 0.02
19,800 Yonyou Network Technology Co Ltd ................................................................ 111,719 0.06
16,500 Youngor Group Co Ltd ...................................................................................... 17,878 0.01
13,200 YTO Express Group Co Ltd .............................................................................. 34,624 0.02
9,900 Yuan Longping High-tech Agriculture Co Ltd ..................................................... 36,212 0.02
6,918 Yunda Holding Co Ltd ....................................................................................... 22,258 0.01
16,500 Yunnan Aluminium Co Ltd ................................................................................ 28,983 0.01
6,600 Yunnan Baiyao Group Co Ltd ........................................................................... 108,615 0.05
6,600 Yunnan Copper Co Ltd ..................................................................................... 13,877 0.01
3,370 Yunnan Energy New Material Co Ltd ................................................................ 132,700 0.07
9,900 Yunnan Tin Co Ltd ............................................................................................ 30,405 0.02
3,300 Zhangzhou Pientzehuang Pharmaceutical Co Ltd ............................................. 226,857 0.11
82,500 Zhaojin Mining Industry Co Ltd .......................................................................... 70,476 0.04
26,400 Zhefu Holding Group Co Ltd ............................................................................. 29,559 0.01
171,600 Zhejiang Century Huatong Group Co Ltd .......................................................... 226,406 0.11
9,900 Zhejiang Chint Electrics Co Ltd ......................................................................... 83,898 0.04
9,900 Zhejiang Crystal-Optech Co Ltd ........................................................................ 27,073 0.01

SCHEDULE OF INVESTMENTS AS AT 31 DECEMBER 2021 (continued) Franklin FTSE China UCITS ETF (continued)
92 Interim Report Franklin LibertyShares ICAV
Holding Investment
Fair Value USD
% of Net Assets
Transferable Securities: 99.95% (30 June 2021: 99.47%) (continued)
Equities: 99.95% (30 June 2021: 99.47%) (continued)
China: 43.55% (30 June 2021: 35.58%) (continued)
19,800 Zhejiang Dahua Technology Co Ltd ................................................................. 73,109 0.04
9,900 Zhejiang Dingli Machinery Co Ltd ..................................................................... 124,952 0.06
132,000 Zhejiang Expressway Co Ltd ............................................................................ 117,671 0.06
13,200 Zhejiang Hailiang Co Ltd .................................................................................. 25,802 0.01
16,500 Zhejiang Hisoar Pharmaceutical Co Ltd ........................................................... 21,381 0.01
13,200 Zhejiang Huace Film & Television Co Ltd ......................................................... 14,053 0.01
69,300 Zhejiang Huafeng Spandex Co Ltd .................................................................. 113,774 0.06
9,900 Zhejiang Huahai Pharmaceutical Co Ltd .......................................................... 33,721 0.02
6,600 Zhejiang Huayou Cobalt Co Ltd ....................................................................... 114,490 0.06
26,400 Zhejiang Jingsheng Mechanical & Electrical Co Ltd ......................................... 288,534 0.14
16,500 Zhejiang Jiuzhou Pharmaceutical Co Ltd ......................................................... 145,979 0.07
13,200 Zhejiang Juhua Co Ltd ..................................................................................... 26,798 0.01
23,100 Zhejiang Longsheng Group Co Ltd .................................................................. 45,880 0.02
9,900 Zhejiang Medicine Co Ltd ................................................................................. 26,591 0.01
13,200 Zhejiang NHU Co Ltd ....................................................................................... 64,598 0.03
9,900 Zhejiang Runtu Co Ltd ..................................................................................... 14,930 0.01
23,100 Zhejiang Sanhua Intelligent Controls Co Ltd .................................................... 91,905 0.05
9,900 Zhejiang Semir Garment Co Ltd ....................................................................... 12,034 0.01
3,300 Zhejiang Supor Co Ltd ..................................................................................... 32,299 0.02
19,800 Zhejiang Wanfeng Auto Wheel Co Ltd ............................................................. 17,094 0.01
6,600 Zhejiang Wanliyang Co Ltd .............................................................................. 15,299 0.01
9,960 Zhejiang Weixing New Building Materials Co Ltd ............................................. 38,092 0.02
9,900 Zhejiang Wolwo Bio-Pharmaceutical Co Ltd ..................................................... 89,207 0.04
6,600 Zhejiang Yasha Decoration Co Ltd ................................................................... 7,774 0.00
3,300 Zhejiang Yongtai Technology Co Ltd ................................................................ 26,575 0.01
6,600 Zheshang Securities Co Ltd ............................................................................. 13,679 0.01
26,400 ZhongAn Online P&C Insurance Co Ltd ........................................................... 91,767 0.05
3,300 Zhongji Innolight Co Ltd ................................................................................... 22,055 0.01
23,100 Zhongshan Broad Ocean Motor Co Ltd ............................................................ 31,931 0.02
49,500 Zhongtai Securities Co Ltd ............................................................................... 77,608 0.04
42,900 Zhuzhou CRRC Times Electric Co Ltd ............................................................. 248,443 0.12
33,000 Zhuzhou Kibing Group Co Ltd .......................................................................... 88,740 0.04
102,300 Zijin Mining Group Co Ltd 'A' Shares ................................................................ 156,047 0.08
462,000 Zijin Mining Group Co Ltd 'H' Shares ................................................................ 549,922 0.26
33,000 Zoomlion Heavy Industry Science and Technology Co Ltd 'A' Shares .............. 37,208 0.02
112,200 Zoomlion Heavy Industry Science and Technology Co Ltd 'H' Shares .............. 70,662 0.04
23,100 ZTE Corp 'A' Shares ........................................................................................ 121,693 0.06
59,400 ZTE Corp 'H' Shares ........................................................................................ 162,666 0.08
87,668,753 43.55
Hong Kong: 3.01% (30 June 2021: 2.55%)
33,000 Beijing Enterprises Holdings Ltd ....................................................................... 113,862 0.06
49,500 BYD Electronic International Co Ltd ................................................................. 181,269 0.09
297,000 China Everbright Environment Group Ltd ......................................................... 238,475 0.12
66,000 China Everbright Ltd ........................................................................................ 78,899 0.04
528,000 China Jinmao Holdings Group Ltd .................................................................... 163,216 0.08
132,000 China Merchants Port Holdings Co Ltd ............................................................ 240,422 0.12
280,500 China Overseas Land & Investment Ltd ........................................................... 664,165 0.33
396,000 China Power International Development Ltd .................................................... 266,665 0.13
122,000 China Resources Beer Holdings Co Ltd ........................................................... 999,153 0.50
148,500 China Resources Pharmaceutical Group Ltd .................................................... 67,619 0.03
132,000 China Resources Power Holdings Co Ltd ......................................................... 441,902 0.22
105,600 China Taiping Insurance Holdings Co Ltd ........................................................ 144,930 0.07
198,000 China Traditional Chinese Medicine Holdings Co Ltd ....................................... 131,301 0.07
396,000 CITIC Ltd ......................................................................................................... 391,109 0.19
660,000 CSPC Pharmaceutical Group Ltd ..................................................................... 717,032 0.36
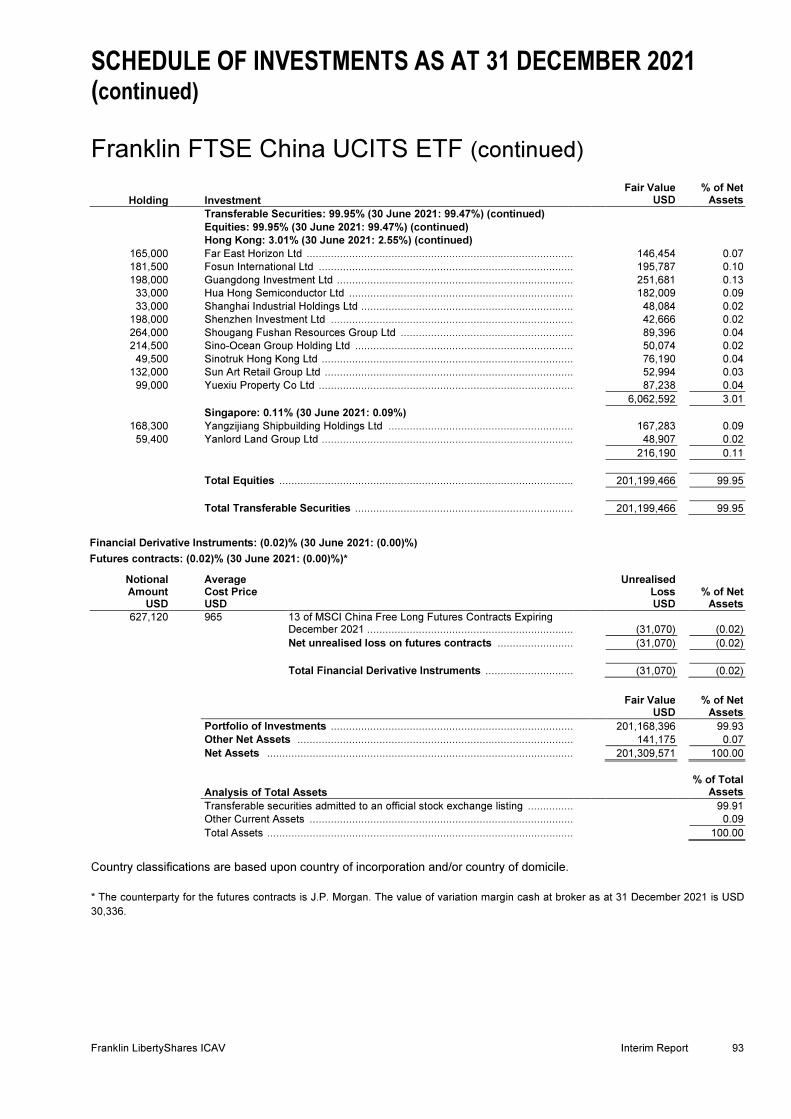
SCHEDULE OF INVESTMENTS AS AT 31 DECEMBER 2021 (continued) Franklin FTSE China UCITS ETF (continued)
Franklin LibertyShares ICAV Interim Report 93
Holding Investment
Fair Value USD
% of Net Assets
Transferable Securities: 99.95% (30 June 2021: 99.47%) (continued)
Equities: 99.95% (30 June 2021: 99.47%) (continued)
Hong Kong: 3.01% (30 June 2021: 2.55%) (continued)
165,000 Far East Horizon Ltd ......................................................................................... 146,454 0.07
181,500 Fosun International Ltd ..................................................................................... 195,787 0.10
198,000 Guangdong Investment Ltd ............................................................................... 251,681 0.13
33,000 Hua Hong Semiconductor Ltd ........................................................................... 182,009 0.09
33,000 Shanghai Industrial Holdings Ltd ....................................................................... 48,084 0.02
198,000 Shenzhen Investment Ltd ................................................................................. 42,666 0.02
264,000 Shougang Fushan Resources Group Ltd .......................................................... 89,396 0.04
214,500 Sino-Ocean Group Holding Ltd ......................................................................... 50,074 0.02
49,500 Sinotruk Hong Kong Ltd .................................................................................... 76,190 0.04
132,000 Sun Art Retail Group Ltd ................................................................................... 52,994 0.03
99,000 Yuexiu Property Co Ltd ..................................................................................... 87,238 0.04
6,062,592 3.01
Singapore: 0.11% (30 June 2021: 0.09%)
168,300 Yangzijiang Shipbuilding Holdings Ltd .............................................................. 167,283 0.09
59,400 Yanlord Land Group Ltd .................................................................................... 48,907 0.02
216,190 0.11
Total Equities ................................................................................................................................ 201,199,466 99.95
Total Transferable Securities ................................................................................................ 201,199,466 99.95
Financial Derivative Instruments: (0.02)% (30 June 2021: (0.00)%)
Futures contracts: (0.02)% (30 June 2021: (0.00)%)*
Notional Amount
USD
Average Cost Price USD
Unrealised Loss USD
% of Net Assets
627,120 965 13 of MSCI China Free Long Futures Contracts Expiring December 2021 ................................................................................................ (31,070) (0.02)
Net unrealised loss on futures contracts ................................ (31,070) (0.02)
Total Financial Derivative Instruments ................................ (31,070) (0.02)
Fair Value USD
% of Net Assets
Portfolio of Investments ................................................................................................ 201,168,396 99.93
Other Net Assets ................................................................................................ 141,175 0.07
Net Assets ................................................................................................................................ 201,309,571 100.00
Analysis of Total Assets
% of Total Assets
Transferable securities admitted to an official stock exchange listing ................................ 99.91
Other Current Assets ................................................................................................ 0.09
Total Assets ................................................................................................................................ 100.00
Country classifications are based upon country of incorporation and/or country of domicile.
* The counterparty for the futures contracts is J.P. Morgan. The value of variation margin cash at broker as at 31 December 2021 is USD
30,336.

SCHEDULE OF INVESTMENTS AS AT 31 DECEMBER 2021
Franklin FTSE India UCITS ETF
94 Interim Report Franklin LibertyShares ICAV
Holding Investment
Fair Value USD
% of Net Assets
Transferable Securities: 102.39% (30 June 2021: 101.67%) Equities: 102.39% (30 June 2021: 101.67%) India: 102.39% (30 June 2021: 101.67%)
290 3M India Ltd ..................................................................................................... 98,938 0.10
18,270 Aarti Industries Ltd ........................................................................................... 246,908 0.24
4,930 ABB India Ltd ................................................................................................... 148,134 0.15
8,236 ACC Ltd ........................................................................................................... 245,493 0.24
25,578 Adani Enterprises Ltd ....................................................................................... 588,201 0.58
26,854 Adani Gas Ltd .................................................................................................. 622,006 0.61
37,642 Adani Green Energy Ltd ................................................................................... 673,610 0.66
73,486 Adani Ports & Special Economic Zone Ltd ....................................................... 721,953 0.71
92,220 Adani Power Ltd ............................................................................................... 123,687 0.12
24,128 Adani Transmission Ltd .................................................................................... 565,048 0.55
45,820 Aditya Birla Capital Ltd ..................................................................................... 76,371 0.07
2,320 Alkem Laboratories Ltd .................................................................................... 113,106 0.11
66,642 Ambuja Cements Ltd ........................................................................................ 338,429 0.33
9,570 Apollo Hospitals Enterprise Ltd ........................................................................ 645,427 0.63
137,170 Ashok Leyland Ltd ........................................................................................... 225,954 0.22
43,442 Asian Paints Ltd ............................................................................................... 1,977,007 1.94
8,584 Astral Ltd .......................................................................................................... 263,494 0.26
15,022 AU Small Finance Bank Ltd ............................................................................. 209,459 0.21
25,578 Aurobindo Pharma Ltd ..................................................................................... 252,681 0.25
14,326 Avenue Supermarts Ltd ................................................................................... 900,284 0.88
218,776 Axis Bank Ltd ................................................................................................... 1,997,029 1.96
6,728 Bajaj Auto Ltd .................................................................................................. 294,084 0.29
22,620 Bajaj Finance Ltd ............................................................................................. 2,123,161 2.08
3,712 Bajaj Finserv Ltd .............................................................................................. 819,254 0.80
2,610 Bajaj Holdings & Investment Ltd ....................................................................... 190,725 0.19
7,772 Balkrishna Industries Ltd .................................................................................. 242,918 0.24
76,502 Bandhan Bank Ltd ........................................................................................... 260,064 0.26
97,150 Bank of Baroda ................................................................................................ 107,101 0.11
46,342 Bank of India .................................................................................................... 32,044 0.03
5,916 Bata India Ltd ................................................................................................... 148,955 0.15
1,276 Bayer CropScience Ltd .................................................................................... 85,230 0.08
22,504 Berger Paints India Ltd ..................................................................................... 233,636 0.23
105,618 Bharat Electronics Ltd ...................................................................................... 298,302 0.29
24,302 Bharat Forge Ltd .............................................................................................. 228,143 0.22
127,658 Bharat Heavy Electricals Ltd ............................................................................ 101,236 0.10
96,048 Bharat Petroleum Corp Ltd ............................................................................... 498,034 0.49
220,342 Bharti Airtel Ltd ................................................................................................ 2,026,886 1.99
43,442 Biocon Ltd ........................................................................................................ 213,103 0.21
812 Bosch Ltd ......................................................................................................... 189,196 0.19
11,542 Britannia Industries Ltd .................................................................................... 559,899 0.55
23,432 Cadila Healthcare Ltd ....................................................................................... 152,298 0.15
33,640 Canara Bank .................................................................................................... 90,486 0.09
46,632 Castrol India Ltd ............................................................................................... 77,034 0.08
38,918 Cholamandalam Investment and Finance Co Ltd ............................................. 272,452 0.27
48,952 Cipla Ltd .......................................................................................................... 621,715 0.61
182,642 Coal India Ltd ................................................................................................... 358,843 0.35
12,818 Colgate-Palmolive India Ltd ............................................................................. 255,427 0.25
26,506 Container Corp Of India Ltd ............................................................................. 219,131 0.22
10,904 Coromandel International Ltd ........................................................................... 110,902 0.11
12,876 Cummins India Ltd ........................................................................................... 163,133 0.16
50,692 Dabur India Ltd ................................................................................................ 395,556 0.39
8,004 Dalmia Bharat Ltd ............................................................................................ 198,970 0.20
12,238 Divi's Laboratories Ltd ...................................................................................... 770,180 0.76
57,014 DLF Ltd ............................................................................................................ 299,468 0.29
11,716 Dr Reddy's Laboratories Ltd ............................................................................. 773,390 0.76
12,992 Eicher Motors Ltd ............................................................................................. 452,999 0.44
19,604 Emami Ltd ........................................................................................................ 136,872 0.13
51,620 Embassy Office Parks REIT ............................................................................. 235,845 0.23
45,704 Exide Industries Ltd .......................................................................................... 103,507 0.10

SCHEDULE OF INVESTMENTS AS AT 31 DECEMBER 2021 (continued) Franklin FTSE India UCITS ETF (continued)
Franklin LibertyShares ICAV Interim Report 95
Holding Investment
Fair Value USD
% of Net Assets
Transferable Securities: 102.39% (30 June 2021: 101.67%) (continued) Equities: 102.39% (30 June 2021: 101.67%) (continued) India: 102.39% (30 June 2021: 101.67%) (continued)
146,566 Federal Bank Ltd .............................................................................................. 163,649 0.16
172,840 GAIL India Ltd ................................................................................................... 300,407 0.29
6,554 General Insurance Corp of India ....................................................................... 12,414 0.01
696 Gillette India Ltd ................................................................................................ 49,261 0.05
4,176 GlaxoSmithKline Pharmaceuticals Ltd .............................................................. 98,684 0.10
14,152 Glenmark Pharmaceuticals Ltd ......................................................................... 100,625 0.10
205,900 GMR Infrastructure Ltd ..................................................................................... 126,722 0.12
35,438 Godrej Consumer Products Ltd ......................................................................... 461,641 0.45
8,120 Godrej Industries Ltd ......................................................................................... 68,632 0.07
8,468 Godrej Properties Ltd ........................................................................................ 213,227 0.21
36,830 Grasim Industries Ltd ........................................................................................ 803,753 0.79
19,662 Gujarat Gas Ltd ................................................................................................ 167,920 0.16
23,316 Havells India Ltd ............................................................................................... 438,181 0.43
104,516 HCL Technologies Ltd ...................................................................................... 1,854,656 1.82
5,278 HDFC Asset Management Co Ltd ..................................................................... 173,679 0.17
89,146 HDFC Life Insurance Co Ltd ............................................................................. 778,964 0.76
12,702 Hero MotoCorp Ltd ........................................................................................... 420,708 0.41
135,662 Hindalco Industries Ltd ..................................................................................... 867,875 0.85
3,190 Hindustan Aeronautics Ltd ................................................................................ 51,953 0.05
67,280 Hindustan Petroleum Corp Ltd .......................................................................... 264,601 0.26
85,550 Hindustan Unilever Ltd ...................................................................................... 2,716,205 2.67
22,388 Hindustan Zinc Ltd ............................................................................................ 95,412 0.09
232 Honeywell Automation India Ltd ........................................................................ 131,615 0.13
168,316 Housing Development Finance Corp Ltd ........................................................... 5,856,422 5.75
150,220 ICICI Bank Ltd .................................................................................................. 1,495,720 1.47
23,142 ICICI Lombard General Insurance Co Ltd ......................................................... 436,234 0.43
34,626 ICICI Prudential Life Insurance Co Ltd .............................................................. 261,224 0.26
287,100 IDFC First Bank Ltd .......................................................................................... 186,738 0.18
33,930 Indiabulls Housing Finance Ltd ......................................................................... 99,505 0.10
265,408 Indian Oil Corp Ltd ............................................................................................ 398,100 0.39
25,056 Indian Railway Catering & Tourism Corp Ltd ..................................................... 280,354 0.28
177,364 Indian Railway Finance Corp Ltd ...................................................................... 54,520 0.05
33,872 Indraprastha Gas Ltd ........................................................................................ 214,344 0.21
120,292 Indus Towers Ltd .............................................................................................. 401,806 0.39
7,308 Info Edge India Ltd ............................................................................................ 548,250 0.54
342,490 Infosys Ltd ........................................................................................................ 8,697,516 8.54
9,222 InterGlobe Aviation Ltd ..................................................................................... 250,295 0.25
6,554 Ipca Laboratories Ltd ........................................................................................ 191,042 0.19
285,302 ITC Ltd .............................................................................................................. 836,881 0.82
37,932 Jindal Steel & Power Ltd ................................................................................... 192,503 0.19
36,424 JSW Energy Ltd ................................................................................................ 147,243 0.14
96,164 JSW Steel Ltd ................................................................................................... 848,567 0.83
7,018 Jubilant Foodworks Ltd ..................................................................................... 339,034 0.33
12,180 Kansai Nerolac Paints Ltd ................................................................................. 96,869 0.10
88,102 L&T Finance Holdings Ltd ................................................................................. 92,089 0.09
2,436 L&T Technology Services Ltd ........................................................................... 183,479 0.18
4,292 Larsen & Toubro Infotech Ltd ............................................................................ 423,336 0.42
66,410 Larsen & Toubro Ltd ......................................................................................... 1,693,760 1.66
35,032 Laurus Labs Ltd ................................................................................................ 253,966 0.25
31,784 LIC Housing Finance Ltd ................................................................................... 158,053 0.16
23,200 Lupin Ltd ........................................................................................................... 296,727 0.29
4,988 Macrotech Developers Ltd ................................................................................ 82,772 0.08
58,058 Mahindra & Mahindra Financial Services Ltd .................................................... 116,334 0.11
88,798 Mahindra & Mahindra Ltd .................................................................................. 1,000,021 0.98
16,414 Mangalore Refinery & Petrochemicals Ltd ........................................................ 9,517 0.01

SCHEDULE OF INVESTMENTS AS AT 31 DECEMBER 2021 (continued) Franklin FTSE India UCITS ETF (continued)
96 Interim Report Franklin LibertyShares ICAV
Holding Investment
Fair Value USD
% of Net Assets
Transferable Securities: 102.39% (30 June 2021: 101.67%) (continued) Equities: 102.39% (30 June 2021: 101.67%) (continued) India: 102.39% (30 June 2021: 101.67%) (continued)
50,286 Marico Ltd ........................................................................................................ 346,793 0.34
12,818 Maruti Suzuki India Ltd ..................................................................................... 1,280,573 1.26
23,026 Max Financial Services Ltd .............................................................................. 303,670 0.30
4,234 Mindtree Ltd ..................................................................................................... 272,259 0.27
117,392 Motherson Sumi Systems Ltd ........................................................................... 352,639 0.35
8,584 Mphasis Ltd ..................................................................................................... 392,238 0.39
259 MRF Ltd ........................................................................................................... 255,524 0.25
9,164 Muthoot Finance Ltd ........................................................................................ 184,382 0.18
3,480 Nestle India Ltd ................................................................................................ 922,516 0.91
218,080 NHPC Ltd ......................................................................................................... 90,799 0.09
15,022 Nippon Life India Asset Management Ltd ......................................................... 71,103 0.07
73,254 NMDC Ltd ........................................................................................................ 131,360 0.13
425,720 NTPC Ltd ......................................................................................................... 712,438 0.70
11,542 Oberoi Realty Ltd ............................................................................................. 133,811 0.13
293,422 Oil & Natural Gas Corp Ltd ............................................................................... 562,090 0.55
33,234 Oil India Ltd ...................................................................................................... 88,924 0.09
2,204 Oracle Financial Services Software Ltd ............................................................ 117,447 0.12
580 Page Industries Ltd .......................................................................................... 315,387 0.31
72,790 Petronet LNG Ltd ............................................................................................. 211,900 0.21
7,018 PI Industries Ltd ............................................................................................... 286,458 0.28
14,790 Pidilite Industries Ltd ........................................................................................ 490,005 0.48
12,064 Piramal Enterprises Ltd .................................................................................... 429,081 0.42
2,436 Polycab India Ltd ............................................................................................. 80,828 0.08
112,520 Power Finance Corp Ltd ................................................................................... 181,263 0.18
302,238 Power Grid Corp of India Ltd ............................................................................ 831,061 0.82
106,778 Punjab National Bank ....................................................................................... 53,579 0.05
12,818 Rajesh Exports Ltd ........................................................................................... 127,162 0.12
43,384 RBL Bank Ltd ................................................................................................... 74,208 0.07
90,306 REC Ltd ........................................................................................................... 162,546 0.16
315,984 Reliance Industries Ltd ..................................................................................... 10,066,469 9.88
27,782 SBI Cards & Payment Services Ltd ................................................................. 346,884 0.34
40,252 SBI Life Insurance Co Ltd ................................................................................ 647,622 0.64
1,276 Shree Cement Ltd ............................................................................................ 463,250 0.45
19,024 Shriram Transport Finance Co Ltd ................................................................... 311,455 0.31
8,236 Siemens Ltd ..................................................................................................... 261,625 0.26
17,284 Sona Blw Precision Forgings Ltd ...................................................................... 172,885 0.17
13,630 SRF Ltd ............................................................................................................ 443,744 0.44
172,202 State Bank of India ........................................................................................... 1,066,654 1.05
97,498 Steel Authority of India Ltd ............................................................................... 140,603 0.14
104,864 Sun Pharmaceutical Industries Ltd ................................................................... 1,193,014 1.17
9,628 Sun TV Network Ltd ......................................................................................... 64,773 0.06
6,554 Sundaram Finance Ltd ..................................................................................... 201,684 0.20
10,846 Tata Communications Ltd ................................................................................ 213,672 0.21
99,528 Tata Consultancy Services Ltd ......................................................................... 5,005,277 4.91
58,580 Tata Consumer Products Ltd ............................................................................ 585,874 0.58
178,118 Tata Motors Ltd ................................................................................................ 1,155,894 1.14
35,032 Tata Motors Ltd 'A' Shares ............................................................................... 112,798 0.11
196,620 Tata Power Co Ltd ........................................................................................... 584,419 0.57
77,198 Tata Steel Ltd ................................................................................................... 1,154,247 1.13
58,174 Tech Mahindra Ltd ........................................................................................... 1,401,258 1.38
40,136 Titan Co Ltd ..................................................................................................... 1,361,918 1.34
4,582 Torrent Pharmaceuticals Ltd ............................................................................ 202,081 0.20
20,474 Torrent Power Ltd ............................................................................................ 152,462 0.15
17,458 Trent Ltd .......................................................................................................... 250,119 0.25
19,314 TVS Motor Co Ltd ............................................................................................ 162,908 0.16
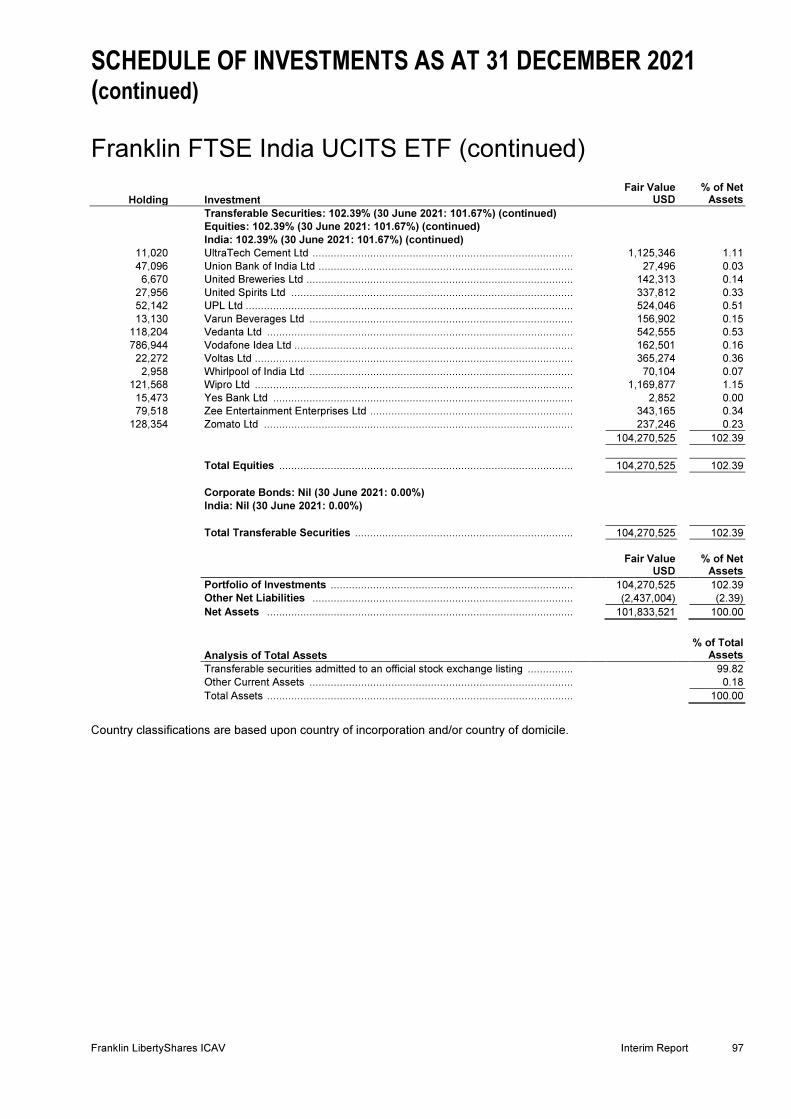
SCHEDULE OF INVESTMENTS AS AT 31 DECEMBER 2021 (continued) Franklin FTSE India UCITS ETF (continued)
Franklin LibertyShares ICAV Interim Report 97
Holding Investment
Fair Value USD
% of Net Assets
Transferable Securities: 102.39% (30 June 2021: 101.67%) (continued) Equities: 102.39% (30 June 2021: 101.67%) (continued) India: 102.39% (30 June 2021: 101.67%) (continued)
11,020 UltraTech Cement Ltd ....................................................................................... 1,125,346 1.11
47,096 Union Bank of India Ltd ..................................................................................... 27,496 0.03
6,670 United Breweries Ltd ......................................................................................... 142,313 0.14
27,956 United Spirits Ltd .............................................................................................. 337,812 0.33
52,142 UPL Ltd ............................................................................................................. 524,046 0.51
13,130 Varun Beverages Ltd ........................................................................................ 156,902 0.15
118,204 Vedanta Ltd ...................................................................................................... 542,555 0.53
786,944 Vodafone Idea Ltd ............................................................................................. 162,501 0.16
22,272 Voltas Ltd .......................................................................................................... 365,274 0.36
2,958 Whirlpool of India Ltd ........................................................................................ 70,104 0.07
121,568 Wipro Ltd .......................................................................................................... 1,169,877 1.15
15,473 Yes Bank Ltd .................................................................................................... 2,852 0.00
79,518 Zee Entertainment Enterprises Ltd .................................................................... 343,165 0.34
128,354 Zomato Ltd ....................................................................................................... 237,246 0.23
104,270,525 102.39
Total Equities ................................................................................................................................ 104,270,525 102.39
Corporate Bonds: Nil (30 June 2021: 0.00%)
India: Nil (30 June 2021: 0.00%)
Total Transferable Securities ................................................................................................ 104,270,525 102.39
Fair Value USD
% of Net Assets
Portfolio of Investments ................................................................................................ 104,270,525 102.39
Other Net Liabilities ................................................................................................ (2,437,004) (2.39)
Net Assets ................................................................................................................................ 101,833,521 100.00
Analysis of Total Assets
% of Total Assets
Transferable securities admitted to an official stock exchange listing ................................ 99.82
Other Current Assets ................................................................................................ 0.18
Total Assets ................................................................................................................................ 100.00
Country classifications are based upon country of incorporation and/or country of domicile.

SCHEDULE OF INVESTMENTS AS AT 31 DECEMBER 2021
Franklin FTSE Korea UCITS ETF
98 Interim Report Franklin LibertyShares ICAV
Holding Investment
Fair Value USD
% of Net Assets
Transferable Securities: 99.05% (30 June 2021: 99.81%)
Equities: 99.05% (30 June 2021: 99.81%)
South Korea: 99.05% (30 June 2021: 99.81%)
12,321 Alteogen Inc ..................................................................................................... 784,605 0.18
14,097 Amorepacific Corp ........................................................................................... 1,980,399 0.45
4,995 Amorepacific Corp (preferred stock) ................................................................. 307,579 0.07
12,876 AMOREPACIFIC Group ................................................................................... 480,379 0.11
2,886 BGF retail Co Ltd ............................................................................................. 353,239 0.08
131,535 BNK Financial Group Inc .................................................................................. 929,459 0.21
33,399 Celltrion Healthcare Co Ltd .............................................................................. 2,253,291 0.51
48,684 Celltrion Inc ...................................................................................................... 8,108,881 1.84
8,803 Celltrion Pharm Inc ........................................................................................... 921,214 0.21
30,525 Cheil Worldwide Inc ......................................................................................... 586,748 0.13
3,552 CJ CheilJedang Corp ....................................................................................... 1,157,855 0.26
666 CJ CheilJedang Corp (preferred stock) ............................................................ 99,445 0.02
5,661 CJ Corp ........................................................................................................... 397,163 0.09
4,662 CJ ENM Co Ltd ................................................................................................ 544,341 0.12
3,552 CJ Logistics Corp ............................................................................................. 376,490 0.09
25,419 Coway Co Ltd .................................................................................................. 1,590,893 0.36
81,252 Daewoo Engineering & Construction Co Ltd .................................................... 394,384 0.09
21,978 Daewoo Shipbuilding & Marine Engineering Co Ltd ......................................... 426,156 0.10
19,980 DB Insurance Co Ltd ........................................................................................ 907,609 0.21
67,821 DGB Financial Group Inc ................................................................................. 535,151 0.12
6,882 DL E&C Co Ltd ................................................................................................ 688,924 0.16
5,550 DL Holdings Co Ltd .......................................................................................... 284,328 0.06
13,875 Dongsuh Co Inc ............................................................................................... 361,830 0.08
10,989 Doosan Bobcat Inc ........................................................................................... 376,700 0.09
17,157 Doosan Heavy Industries & Construction Co Ltd (non-voting rights) ................. 63,504 0.01
134,865 Doosan Heavy Industries & Construction Co Ltd (voting rights) ........................ 2,314,403 0.53
5,217 Doosan Solus Co Ltd ....................................................................................... 391,906 0.09
3,996 Ecopro BM Co Ltd ............................................................................................ 1,683,446 0.38
8,991 E-MART Inc ..................................................................................................... 1,142,074 0.26
1,443 F&F Co Ltd ...................................................................................................... 1,147,117 0.26
23,421 Fila Holdings Corp ........................................................................................... 706,324 0.16
2,442 Green Cross Corp ............................................................................................ 447,828 0.10
27,861 GS Engineering & Construction Corp ............................................................... 928,114 0.21
22,977 GS Holdings Corp ............................................................................................ 755,752 0.17
17,427 GS Retail Co Ltd .............................................................................................. 445,662 0.10
129,759 Hana Financial Group Inc ................................................................................. 4,590,003 1.04
9,435 Hanjin Kal Corp ................................................................................................ 487,326 0.11
33,078 Hankook Tire & Technology Co Ltd .................................................................. 1,104,687 0.25
3,396 Hanmi Pharm Co Ltd ........................................................................................ 788,472 0.18
6,566 Hanmi Science Co ltd ....................................................................................... 299,371 0.07
71,595 Hanon Systems ................................................................................................ 810,055 0.18
4,440 Hanssem Co Ltd .............................................................................................. 345,862 0.08
15,540 Hanwha Aerospace Co Ltd .............................................................................. 627,483 0.14
19,314 Hanwha Corp ................................................................................................... 510,166 0.12
10,212 Hanwha Corp (preferred stock) ........................................................................ 137,449 0.03
122,766 Hanwha Life Insurance Co Ltd ......................................................................... 303,107 0.07
43,179 Hanwha Solutions Corp ................................................................................... 1,289,468 0.29
20,868 HDC Hyundai Development Co-Engineering & Construction ............................ 402,000 0.09
14,652 Helixmith Co Ltd ............................................................................................... 279,790 0.06
13,542 Hite Jinro Co Ltd .............................................................................................. 343,463 0.08
39,738 HLB Inc ............................................................................................................ 1,163,308 0.26
157,509 HMM Co Ltd ..................................................................................................... 3,564,242 0.81
13,986 Hotel Shilla Co Ltd ........................................................................................... 917,693 0.21
7,770 HYBE Co Ltd ................................................................................................... 2,281,161 0.52
6,771 Hyundai Department Store Co Ltd ................................................................... 427,762 0.10
61,494 Hyundai Doosan Infracore Co Ltd .................................................................... 366,248 0.08
32,745 Hyundai Engineering & Construction Co Ltd .................................................... 1,224,408 0.28
8,214 Hyundai Glovis Co Ltd ..................................................................................... 1,160,843 0.26
22,644 Hyundai Heavy Industries Holdings Co Ltd ...................................................... 1,022,909 0.23

SCHEDULE OF INVESTMENTS AS AT 31 DECEMBER 2021 (continued) Franklin FTSE Korea UCITS ETF (continued)
Franklin LibertyShares ICAV Interim Report 99
Holding Investment
Fair Value USD
% of Net Assets
Transferable Securities: 99.05% (30 June 2021: 99.81%) (continued)
Equities: 99.05% (30 June 2021: 99.81%) (continued)
South Korea: 99.05% (30 June 2021: 99.81%) (continued)
26,196 Hyundai Marine & Fire Insurance Co Ltd ........................................................... 505,740 0.12
9,213 Hyundai Mipo Dockyard Co Ltd ......................................................................... 542,511 0.12
28,749 Hyundai Mobis Co Ltd ....................................................................................... 6,154,886 1.40
62,715 Hyundai Motor Co ............................................................................................. 11,026,233 2.51
10,101 Hyundai Motor Co (preferred stock) .................................................................. 836,970 0.19
15,873 Hyundai Motor Co (second preferred stock) ...................................................... 1,348,621 0.31
33,855 Hyundai Steel Co .............................................................................................. 1,167,659 0.27
6,993 Hyundai Wia Corp ............................................................................................. 470,024 0.11
115,218 Industrial Bank of Korea .................................................................................... 998,314 0.23
122,877 Kakao Corp ....................................................................................................... 11,628,738 2.64
61,494 KakaoBank Corp ............................................................................................... 3,052,068 0.69
47,508 Kangwon Land Inc ............................................................................................ 961,150 0.22
174,825 KB Financial Group Inc ..................................................................................... 8,088,644 1.84
1,887 KCC Corp ......................................................................................................... 500,025 0.11
9,324 KEPCO Plant Service & Engineering Co Ltd ..................................................... 302,368 0.07
115,995 Kia Corp ............................................................................................................ 8,020,853 1.82
29,082 Korea Aerospace Industries Ltd ........................................................................ 793,868 0.18
114,885 Korea Electric Power Corp ................................................................................ 2,135,822 0.49
11,766 Korea Gas Corp ................................................................................................ 387,004 0.09
17,094 Korea Investment Holdings Co Ltd .................................................................... 1,160,451 0.26
19,425 Korea Shipbuilding & Offshore Engineering Co Ltd ........................................... 1,545,830 0.35
4,440 Korea Zinc Co Ltd ............................................................................................. 1,908,593 0.43
78,810 Korean Air Lines Co Ltd .................................................................................... 1,945,803 0.44
12,543 Krafton Inc ........................................................................................................ 4,853,653 1.10
48,951 KT&G Corp ....................................................................................................... 3,253,105 0.74
7,881 Kumho Petrochemical Co Ltd ............................................................................ 1,100,522 0.25
20,979 LG Chem Ltd .................................................................................................... 10,853,489 2.47
3,441 LG Chem Ltd (preferred stock) .......................................................................... 830,761 0.19
40,404 LG Corp ............................................................................................................ 2,749,681 0.63
100,899 LG Display Co Ltd ............................................................................................. 2,088,005 0.47
48,507 LG Electronics Inc ............................................................................................. 5,631,097 1.28
7,548 LG Electronics Inc (preferred stock) .................................................................. 415,894 0.09
3,996 LG Household & Health Care Ltd ...................................................................... 3,687,581 0.84
999 LG Household & Health Care Ltd (preferred stock) ........................................... 517,673 0.12
6,327 LG Innotek Co Ltd ............................................................................................. 1,937,353 0.44
96,681 LG Uplus Corp .................................................................................................. 1,106,088 0.25
6,549 Lotte Chemical Corp ......................................................................................... 1,195,485 0.27
1,554 Lotte Chilsung Beverage Co Ltd ....................................................................... 174,519 0.04
11,655 Lotte Corp ......................................................................................................... 293,152 0.07
7,770 LOTTE Fine Chemical Co Ltd ........................................................................... 490,221 0.11
4,884 Lotte Shopping Co Ltd ...................................................................................... 358,263 0.08
7,881 LS Corp ............................................................................................................ 358,664 0.08
14,985 Mando Corp ...................................................................................................... 799,200 0.18
1,981 Medytox Inc ...................................................................................................... 239,803 0.05
61,605 Mirae Asset Daewoo Co Ltd ............................................................................. 240,201 0.05
156,843 Mirae Asset Securities Co Ltd ........................................................................... 1,141,276 0.26
60,717 NAVER Corp ..................................................................................................... 19,332,395 4.42
7,548 NCSoft Corp ..................................................................................................... 4,082,746 0.93
7,881 Netmarble Corp ................................................................................................ 828,707 0.19
61,383 NH Investment & Securities Co Ltd ................................................................... 645,457 0.15
8,214 NHN Corp ......................................................................................................... 310,940 0.07
1,443 NongShim Co Ltd ............................................................................................. 386,621 0.09
8,214 OCI Co Ltd ........................................................................................................ 718,617 0.16
9,657 Orion Corp ........................................................................................................ 840,799 0.19
555 Ottogi Corp ....................................................................................................... 212,896 0.05
87,024 Pan Ocean Co Ltd ............................................................................................ 396,046 0.09
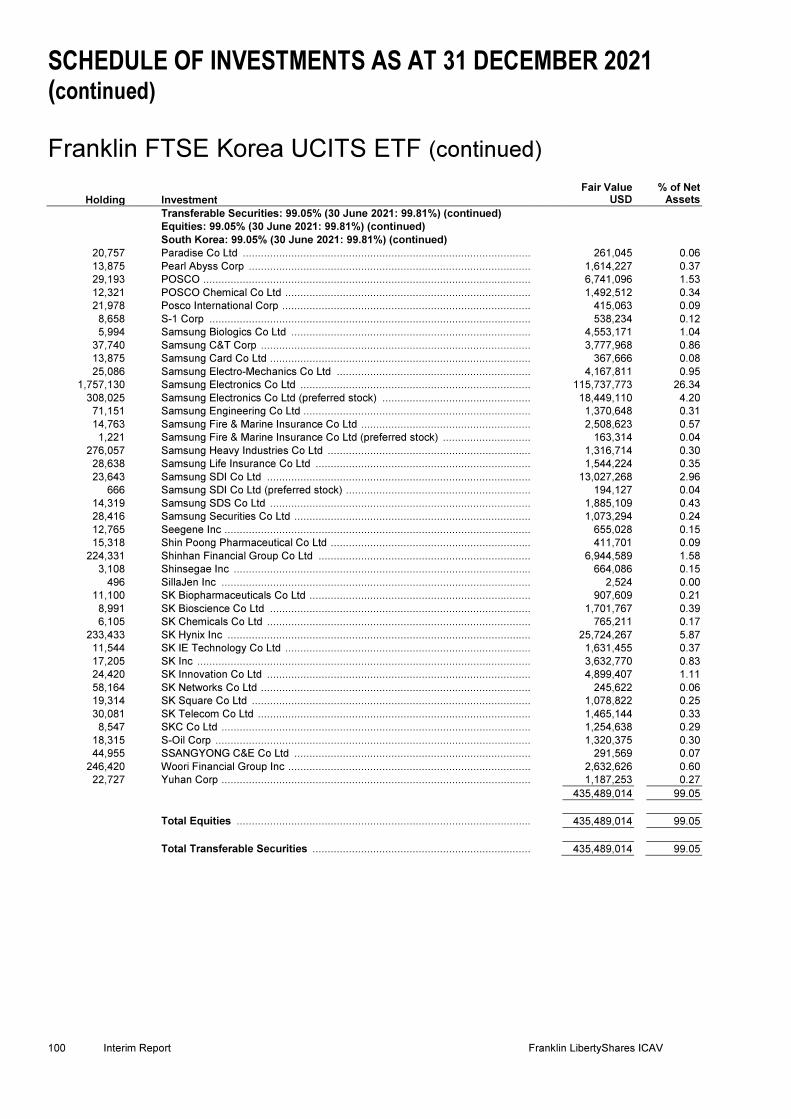
SCHEDULE OF INVESTMENTS AS AT 31 DECEMBER 2021 (continued) Franklin FTSE Korea UCITS ETF (continued)
100 Interim Report Franklin LibertyShares ICAV
Holding Investment
Fair Value USD
% of Net Assets
Transferable Securities: 99.05% (30 June 2021: 99.81%) (continued)
Equities: 99.05% (30 June 2021: 99.81%) (continued)
South Korea: 99.05% (30 June 2021: 99.81%) (continued)
20,757 Paradise Co Ltd ............................................................................................... 261,045 0.06
13,875 Pearl Abyss Corp ............................................................................................. 1,614,227 0.37
29,193 POSCO ............................................................................................................ 6,741,096 1.53
12,321 POSCO Chemical Co Ltd ................................................................................. 1,492,512 0.34
21,978 Posco International Corp .................................................................................. 415,063 0.09
8,658 S-1 Corp .......................................................................................................... 538,234 0.12
5,994 Samsung Biologics Co Ltd ............................................................................... 4,553,171 1.04
37,740 Samsung C&T Corp ......................................................................................... 3,777,968 0.86
13,875 Samsung Card Co Ltd ...................................................................................... 367,666 0.08
25,086 Samsung Electro-Mechanics Co Ltd ................................................................ 4,167,811 0.95
1,757,130 Samsung Electronics Co Ltd ............................................................................ 115,737,773 26.34
308,025 Samsung Electronics Co Ltd (preferred stock) ................................................. 18,449,110 4.20
71,151 Samsung Engineering Co Ltd ........................................................................... 1,370,648 0.31
14,763 Samsung Fire & Marine Insurance Co Ltd ........................................................ 2,508,623 0.57
1,221 Samsung Fire & Marine Insurance Co Ltd (preferred stock) ............................. 163,314 0.04
276,057 Samsung Heavy Industries Co Ltd ................................................................... 1,316,714 0.30
28,638 Samsung Life Insurance Co Ltd ....................................................................... 1,544,224 0.35
23,643 Samsung SDI Co Ltd ....................................................................................... 13,027,268 2.96
666 Samsung SDI Co Ltd (preferred stock) ............................................................. 194,127 0.04
14,319 Samsung SDS Co Ltd ...................................................................................... 1,885,109 0.43
28,416 Samsung Securities Co Ltd .............................................................................. 1,073,294 0.24
12,765 Seegene Inc ..................................................................................................... 655,028 0.15
15,318 Shin Poong Pharmaceutical Co Ltd .................................................................. 411,701 0.09
224,331 Shinhan Financial Group Co Ltd ...................................................................... 6,944,589 1.58
3,108 Shinsegae Inc .................................................................................................. 664,086 0.15
496 SillaJen Inc ...................................................................................................... 2,524 0.00
11,100 SK Biopharmaceuticals Co Ltd ......................................................................... 907,609 0.21
8,991 SK Bioscience Co Ltd ...................................................................................... 1,701,767 0.39
6,105 SK Chemicals Co Ltd ....................................................................................... 765,211 0.17
233,433 SK Hynix Inc .................................................................................................... 25,724,267 5.87
11,544 SK IE Technology Co Ltd ................................................................................. 1,631,455 0.37
17,205 SK Inc .............................................................................................................. 3,632,770 0.83
24,420 SK Innovation Co Ltd ....................................................................................... 4,899,407 1.11
58,164 SK Networks Co Ltd ......................................................................................... 245,622 0.06
19,314 SK Square Co Ltd ............................................................................................ 1,078,822 0.25
30,081 SK Telecom Co Ltd .......................................................................................... 1,465,144 0.33
8,547 SKC Co Ltd ...................................................................................................... 1,254,638 0.29
18,315 S-Oil Corp ........................................................................................................ 1,320,375 0.30
44,955 SSANGYONG C&E Co Ltd .............................................................................. 291,569 0.07
246,420 Woori Financial Group Inc ................................................................................ 2,632,626 0.60
22,727 Yuhan Corp ...................................................................................................... 1,187,253 0.27
435,489,014 99.05
Total Equities ................................................................................................................................ 435,489,014 99.05
Total Transferable Securities ................................................................................................ 435,489,014 99.05

SCHEDULE OF INVESTMENTS AS AT 31 DECEMBER 2021 (continued) Franklin FTSE Korea UCITS ETF (continued)
Franklin LibertyShares ICAV Interim Report 101
Financial Derivative Instruments: (0.00)% (30 June 2021: (0.00)%)
Futures contracts: (0.00)% (30 June 2021: (0.00)%)*
Notional Amount
USD
Average Cost Price USD
Unrealised Loss USD
% of Net Assets
3,167,625 0.33 38 of Kospi2 Inx Long Futures Contracts Expiring March 2022 ................................................................................................ (16,940) (0.00)
Net unrealised loss on futures contracts ................................ (16,940) (0.00)
Total Financial Derivative Instruments ................................ (16,940) (0.00)
Fair Value USD
% of Net Assets
Portfolio of Investments ................................................................................................ 435,472,074 99.05
Other Net Assets ................................................................................................ 4,194,944 0.95
Net Assets ................................................................................................................................ 439,667,018 100.00
Analysis of Total Assets
% of Total Assets
Transferable securities admitted to an official stock exchange listing ................................ 99.04
Other Current Assets ................................................................................................ 0.96
Total Assets ................................................................................................................................ 100.00
Country classifications are based upon country of incorporation and/or country of domicile.
* The counterparty for the futures contracts is J.P. Morgan. The value of variation margin cash at broker as at 31 December 2021 is USD
291,703.
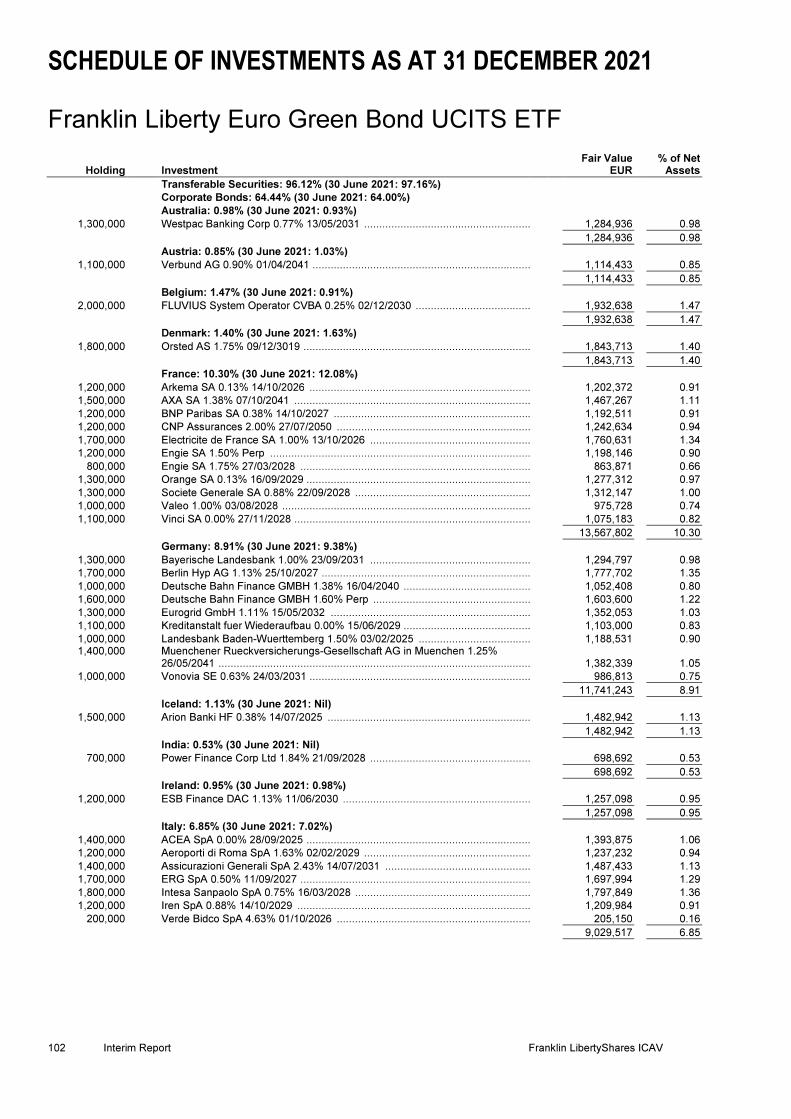
SCHEDULE OF INVESTMENTS AS AT 31 DECEMBER 2021 Franklin Liberty Euro Green Bond UCITS ETF
102 Interim Report Franklin LibertyShares ICAV
Holding Investment Fair Value
EUR % of Net
Assets
Transferable Securities: 96.12% (30 June 2021: 97.16%)
Corporate Bonds: 64.44% (30 June 2021: 64.00%)
Australia: 0.98% (30 June 2021: 0.93%)
1,300,000 Westpac Banking Corp 0.77% 13/05/2031 ....................................................... 1,284,936 0.98
1,284,936 0.98
Austria: 0.85% (30 June 2021: 1.03%)
1,100,000 Verbund AG 0.90% 01/04/2041 ........................................................................ 1,114,433 0.85
1,114,433 0.85
Belgium: 1.47% (30 June 2021: 0.91%)
2,000,000 FLUVIUS System Operator CVBA 0.25% 02/12/2030 ...................................... 1,932,638 1.47
1,932,638 1.47
Denmark: 1.40% (30 June 2021: 1.63%)
1,800,000 Orsted AS 1.75% 09/12/3019 ........................................................................... 1,843,713 1.40
1,843,713 1.40
France: 10.30% (30 June 2021: 12.08%)
1,200,000 Arkema SA 0.13% 14/10/2026 ......................................................................... 1,202,372 0.91
1,500,000 AXA SA 1.38% 07/10/2041 .............................................................................. 1,467,267 1.11
1,200,000 BNP Paribas SA 0.38% 14/10/2027 ................................................................. 1,192,511 0.91
1,200,000 CNP Assurances 2.00% 27/07/2050 ................................................................ 1,242,634 0.94
1,700,000 Electricite de France SA 1.00% 13/10/2026 ..................................................... 1,760,631 1.34
1,200,000 Engie SA 1.50% Perp ...................................................................................... 1,198,146 0.90
800,000 Engie SA 1.75% 27/03/2028 ............................................................................ 863,871 0.66
1,300,000 Orange SA 0.13% 16/09/2029 .......................................................................... 1,277,312 0.97
1,300,000 Societe Generale SA 0.88% 22/09/2028 .......................................................... 1,312,147 1.00
1,000,000 Valeo 1.00% 03/08/2028 .................................................................................. 975,728 0.74
1,100,000 Vinci SA 0.00% 27/11/2028 .............................................................................. 1,075,183 0.82
13,567,802 10.30
Germany: 8.91% (30 June 2021: 9.38%)
1,300,000 Bayerische Landesbank 1.00% 23/09/2031 ..................................................... 1,294,797 0.98
1,700,000 Berlin Hyp AG 1.13% 25/10/2027 ..................................................................... 1,777,702 1.35
1,000,000 Deutsche Bahn Finance GMBH 1.38% 16/04/2040 .......................................... 1,052,408 0.80
1,600,000 Deutsche Bahn Finance GMBH 1.60% Perp .................................................... 1,603,600 1.22
1,300,000 Eurogrid GmbH 1.11% 15/05/2032 .................................................................. 1,352,053 1.03
1,100,000 Kreditanstalt fuer Wiederaufbau 0.00% 15/06/2029 .......................................... 1,103,000 0.83
1,000,000 Landesbank Baden-Wuerttemberg 1.50% 03/02/2025 ..................................... 1,188,531 0.90 1,400,000
Muenchener Rueckversicherungs-Gesellschaft AG in Muenchen 1.25% 26/05/2041 ....................................................................................................... 1,382,339 1.05
1,000,000 Vonovia SE 0.63% 24/03/2031 ......................................................................... 986,813 0.75
11,741,243 8.91
Iceland: 1.13% (30 June 2021: Nil)
1,500,000 Arion Banki HF 0.38% 14/07/2025 ................................................................... 1,482,942 1.13
1,482,942 1.13
India: 0.53% (30 June 2021: Nil)
700,000 Power Finance Corp Ltd 1.84% 21/09/2028 ..................................................... 698,692 0.53
698,692 0.53
Ireland: 0.95% (30 June 2021: 0.98%)
1,200,000 ESB Finance DAC 1.13% 11/06/2030 .............................................................. 1,257,098 0.95
1,257,098 0.95
Italy: 6.85% (30 June 2021: 7.02%)
1,400,000 ACEA SpA 0.00% 28/09/2025 .......................................................................... 1,393,875 1.06
1,200,000 Aeroporti di Roma SpA 1.63% 02/02/2029 ....................................................... 1,237,232 0.94
1,400,000 Assicurazioni Generali SpA 2.43% 14/07/2031 ................................................ 1,487,433 1.13
1,700,000 ERG SpA 0.50% 11/09/2027 ............................................................................ 1,697,994 1.29
1,800,000 Intesa Sanpaolo SpA 0.75% 16/03/2028 .......................................................... 1,797,849 1.36
1,200,000 Iren SpA 0.88% 14/10/2029 ............................................................................. 1,209,984 0.91
200,000 Verde Bidco SpA 4.63% 01/10/2026 ................................................................ 205,150 0.16
9,029,517 6.85

SCHEDULE OF INVESTMENTS AS AT 31 DECEMBER 2021 (continued) Franklin Liberty Euro Green Bond UCITS ETF (continued)
Franklin LibertyShares ICAV Interim Report 103
Holding Investment Fair Value
EUR % of Net
Assets
Transferable Securities: 96.12% (30 June 2021: 97.16%) (continued)
Corporate Bonds: 64.44% (30 June 2021: 64.00%) (continued)
Luxembourg: 2.73% (30 June 2021: 2.12%)
500,000 CPI Property Group SA 1.63% 23/04/2027 ....................................................... 510,481 0.39
700,000 CPI Property Group SA 2.75% 12/05/2026 ....................................................... 752,728 0.57
1,200,000 Segro Capital Sarl 0.50% 22/09/2031 ............................................................... 1,157,851 0.88
1,200,000 SELP Finance Sarl 0.88% 27/05/2029 .............................................................. 1,176,060 0.89
3,597,120 2.73
Netherlands: 13.09% (30 June 2021: 14.19%)
1,500,000 ABN AMRO Bank NV 0.50% 15/04/2026 .......................................................... 1,525,781 1.16
1,000,000 Enel Finance International NV 0.38% 17/06/2027 ............................................. 996,930 0.76
1,000,000 Enel Finance International NV 1.00% 20/10/2027 ............................................. 1,147,640 0.88
1,100,000 Enexis Holding NV 0.63% 17/06/2032 .............................................................. 1,102,140 0.84
1,400,000 ING Groep NV 1.13% 07/12/2028 ..................................................................... 1,600,549 1.21
1,500,000 Mondelez International Holdings Netherlands BV 0.25% 09/09/2029 ................ 1,466,531 1.11
1,400,000 NE Property BV 3.38% 14/07/2027 ................................................................... 1,547,910 1.18
600,000 OI European Group BV 2.88% 15/02/2025 ....................................................... 606,691 0.46
1,000,000 PostNL NV 0.63% 23/09/2026 .......................................................................... 1,016,075 0.77
1,300,000 Stedin Holding NV 0.00% 16/11/2026 ............................................................... 1,290,062 0.98
1,000,000 Swisscom Finance BV 0.38% 14/11/2028 ......................................................... 1,007,414 0.76
800,000 Telefonica Europe BV 2.50% Perp .................................................................... 807,251 0.61
1,400,000 TenneT Holding BV 1.50% 03/06/2039 ............................................................. 1,492,218 1.13
1,000,000 Vesteda Finance BV 1.50% 24/05/2027 ............................................................ 1,055,849 0.80
600,000 VZ Vendor Financing II BV 2.88% 15/01/2029 .................................................. 581,923 0.44
17,244,964 13.09
Portugal: 0.83% (30 June 2021: 1.03%)
1,100,000 EDP - Energias de Portugal SA 1.88% 02/08/2081 ........................................... 1,091,613 0.83
1,091,613 0.83
Spain: 6.87% (30 June 2021: 5.21%)
2,000,000 Acciona Energia Financiacion Filiales SA 0.38% 07/10/2027 ............................ 1,978,880 1.50
1,700,000 Banco Bilbao Vizcaya Argentaria SA 1.38% 14/05/2025 ................................... 1,764,746 1.34
1,300,000 Banco de Sabadell SA 1.13% 11/03/2027 ......................................................... 1,324,323 1.01
1,400,000 CaixaBank SA 0.50% 09/02/2029 ..................................................................... 1,371,759 1.04
1,300,000 FCC Servicios Medio Ambiente Holding SAU 0.82% 04/12/2023 ...................... 1,317,706 1.00
1,300,000 Iberdrola Finanzas SA 1.58% Perp ................................................................... 1,296,750 0.98
9,054,164 6.87
Supranational: 0.46% (30 June 2021: Nil)
600,000 European Union 0.40% 04/02/2037 .................................................................. 606,718 0.46
606,718 0.46
Sweden: 3.41% (30 June 2021: 3.40%)
1,500,000 Swedbank AB 0.30% 20/05/2027 ...................................................................... 1,489,886 1.13
1,200,000 Telia Co AB 1.38% 11/05/2081 ......................................................................... 1,216,483 0.92
600,000 Vattenfall AB 2.50% 29/06/2083 ....................................................................... 700,290 0.53
1,000,000 Volvo Car AB 2.50% 07/10/2027 ....................................................................... 1,080,848 0.83
4,487,507 3.41
Turkey: 0.45% (30 June 2021: 0.56%)
600,000 Arcelik AS 3.00% 27/05/2026 ............................................................................ 586,612 0.45
586,612 0.45
United Kingdom: 3.23% (30 June 2021: 3.53%)
1,100,000 Barclays Plc 1.70% 03/11/2026 ........................................................................ 1,301,009 0.98
500,000 Co-Operative Group Ltd 5.13% 17/05/2024 ...................................................... 622,681 0.47
1,700,000 HSBC Holdings Plc 1.50% 04/12/2024 ............................................................. 1,749,853 1.32
500,000 Whitbread Group Plc 3.00% 31/05/2031 ........................................................... 601,203 0.46
4,274,746 3.23
Total Corporate Bonds 84,896,458 64.44

SCHEDULE OF INVESTMENTS AS AT 31 DECEMBER 2021 (continued) Franklin Liberty Euro Green Bond UCITS ETF (continued)
104 Interim Report Franklin LibertyShares ICAV
Holding Investment Fair Value
EUR % of Net
Assets
Transferable Securities: 96.12% (30 June 2021: 97.16%) (continued)
Government Bonds: 31.68% (30 June 2021: 33.16%)
Belgium: 3.23% (30 June 2020: 3.87%)
3,800,000 Kingdom of Belgium Government Bond 1.25% 22/04/2033 .............................. 4,256,319 3.23
4,256,319 3.23
Chile: 1.59% (30 June 2021: 1.98%)
2,100,000 Chile Government International Bond 0.83% 02/07/2031 ................................. 2,093,700 1.59
2,093,700 1.59
France: 6.38% (30 June 2021: 7.19%)
1,500,000 Bpifrance SACA 0.00% 25/05/2028 .................................................................. 1,501,175 1.14
2,000,000 French Republic Government Bond OAT 1.75% 25/06/2039 ............................ 2,417,340 1.83
2,500,000 Societe Du Grand Paris EPIC 0.00% 25/11/2030 ............................................. 2,434,870 1.85
2,000,000 Societe Nationale SNCF SA 0.63% 17/04/2030 ............................................... 2,052,432 1.56
8,405,817 6.38
Germany: 6.07% (30 June 2021: 5.35%)
4,300,000 Bundesobligation 0.00% 10/10/2025 ................................................................ 4,398,521 3.34
3,500,000 Bundesrepublik Deutschland Bundesanleihe 0.00% 15/08/2030 ...................... 3,602,245 2.73
8,000,766 6.07
Hungary: 1.82% (30 June 2021: 1.87%)
2,300,000 Hungary Government International Bond 1.75% 05/06/2035 ............................ 2,398,021 1.82
2,398,021 1.82
Ireland: 3.30% (30 June 2021: 2.92%)
3,900,000 Ireland Government Bond 1.35% 18/03/2031 ................................................... 4,347,759 3.30
4,347,759 3.30
Netherlands: 5.26% (30 June 2021: 8.52%)
6,500,000 Netherlands Government Bond 0.50% 15/01/2040 ........................................... 6,928,196 5.26
6,928,196 5.26
Spain: 3.41% (30 June 2021: 1.46%)
1,500,000 Autonomous Community of Madrid Spain 0.83% 30/07/2027 ........................... 1,560,872 1.18
3,000,000 Spain Government Bond 1.00% 30/07/2042 ..................................................... 2,923,433 2.23
4,484,305 3.41
United Kingdom: 0.62% (30 June 2021: Nil)
700,000 United Kingdom Gilt 0.88% 31/07/2033 ............................................................ 817,674 0.62
817,674 0.62
Total Government Bonds ................................................................................................ 41,732,557 31.68
Total Transferable Securities ................................................................................................ 126,629,015 96.12

SCHEDULE OF INVESTMENTS AS AT 31 DECEMBER 2021 (continued) Franklin Liberty Euro Green Bond UCITS ETF (continued)
Franklin LibertyShares ICAV Interim Report 105
Financial Derivative Instruments: (0.10)% (30 June 2021: 0.01%)
Forward Foreign Currency Contracts: (0.10)% (30 June 2021: 0.01%)
Settlement date Amount bought Amount sold Counterparty
Unrealised Loss EUR
% of Net Assets
24/01/2022 EUR 8,102,570 GBP 6,920,000 Citibank (136,148) (0.10)
Net unrealised loss on forward foreign currency contracts (136,148) (0.10)
Total Financial Derivative Instruments ................................................................ (136,148) (0.10)
Fair Value EUR
% of Net Assets
Portfolio of Investments ................................................................................................ 126,492,867 96.02
Other Net Assets ................................................................................................ 5,242,998 3.98
Net Assets ................................................................................................................................ 131,735,865 100.00
Analysis of Total Assets
% of Total Assets
Transferable securities admitted to an official stock exchange listing ................................ 96.00
Other Current Assets ................................................................................................ 4.00
Total Assets ................................................................................................................................ 100.00
Country classifications are based upon country of incorporation and/or country of domicile.

SCHEDULE OF INVESTMENTS AS AT 31 DECEMBER 2021 Franklin Liberty Euro Short Maturity UCITS ETF
106 Annual Report Franklin LibertyShares ICAV
Holding Investment
Fair Value EUR
% of Net Assets
Transferable Securities: 91.38% (30 June 2021: 91.25%)
Corporate Bonds: 56.25% (30 June 2021: 53.65%)
Australia: 1.52% (30 June 2021: 2.10%)
600,000 Commonwealth Bank of Australia 0.38% 11/04/2024 ....................................... 608,485 0.35
700,000 Commonwealth Bank of Australia 1.94% 03/10/2029 ....................................... 727,373 0.42
1,300,000 National Australia Bank Ltd 0.63% 10/11/2023 ................................................. 1,320,757 0.75
2,656,615 1.52
Austria: 0.59% (30 June 2021: Nil)
1,000,000 BAWAG Group AG 2.38% 26/03/2029 ............................................................. 1,031,725 0.59
1,031,725 0.59
Belgium: 0.87% (30 June 2021: 0.85%)
500,000 Belfius Bank SA 0.38% 24/10/2023 .................................................................. 506,616 0.29
1,000,000 KBC Group NV 1.13% 25/01/2024 ................................................................... 1,026,105 0.58
1,532,721 0.87
Bermuda: 1.20% (30 June 2021: 0.70%)
2,023,000 Bacardi Ltd 2.75% 03/07/2023 ......................................................................... 2,102,830 1.20
2,102,830 1.20
Canada: Nil (30 June 2021: 1.01%)
China: 0.23% (30 June 2021: 0.67%)
400,000 Bank of China Ltd 0.50% 13/03/2022 ............................................................... 400,416 0.23
400,416 0.23
Denmark: 2.71% (30 June 2021: 2.54%)
700,000 Danske Bank A/S 1.38% 24/05/2022 ............................................................... 704,906 0.40
1,000,000 Danske Bank A/S 1.38% 24/05/2023 ............................................................... 1,005,731 0.57
500,000 Nykredit Realkredit AS 0.00% 02/06/2022 ........................................................ 500,908 0.29
1,000,000 Nykredit Realkredit AS 0.50% 19/01/2022 ........................................................ 1,000,372 0.57
1,500,000 Nykredit Realkredit AS 2.75% 17/11/2027 ........................................................ 1,535,159 0.88
4,747,076 2.71
Finland: Nil (30 June 2021: 0.84%)
France: 3.72% (30 June 2021: 5.62%)
1,300,000 BNP Paribas SA 1.13% 10/10/2023 ................................................................. 1,329,513 0.77
800,000 BNP Paribas SA 6.13% Perp ........................................................................... 822,276 0.47
500,000 BPCE SA 0.88% 31/01/2024 ............................................................................ 509,751 0.29
1,200,000 BPCE SA 2.75% 30/11/2027 ............................................................................ 1,230,493 0.70
600,000 Carrefour SA 1.75% 15/07/2022 ...................................................................... 603,697 0.34
1,000,000 Credit Mutuel Arkea SA 0.88% 05/10/2023 ...................................................... 1,018,168 0.58
1,000,000 Pernod Ricard SA 0.00% 24/10/2023 ............................................................... 1,003,755 0.57
6,517,653 3.72
Germany: 3.96% (30 June 2021: 2.94%)
2,100,000 Allianz SE 5.63% 17/10/2042 ........................................................................... 2,191,139 1.25
1,200,000 Commerzbank AG 0.50% 13/09/2023 .............................................................. 1,211,098 0.69
700,000 Deutsche Bank AG 1.88% 14/02/2022 ............................................................. 701,844 0.40
1,000,000 Deutsche Bank AG 2.38% 11/01/2023 ............................................................. 1,027,675 0.59
500,000 DZ HYP AG 0.13% 01/03/2024 ........................................................................ 504,827 0.29
300,000 Peach Property Finance GmbH 3.50% 15/02/2023 .......................................... 302,301 0.17
1,000,000 Vonovia SE 0.00% 01/09/2023 ......................................................................... 1,003,087 0.57
6,941,971 3.96
Guernsey: 1.15% (30 June 2021: 0.68%)
2,000,000 Credit Suisse Group Funding Guernsey Ltd 1.25% 14/04/2022 ........................ 2,009,122 1.15
2,009,122 1.15
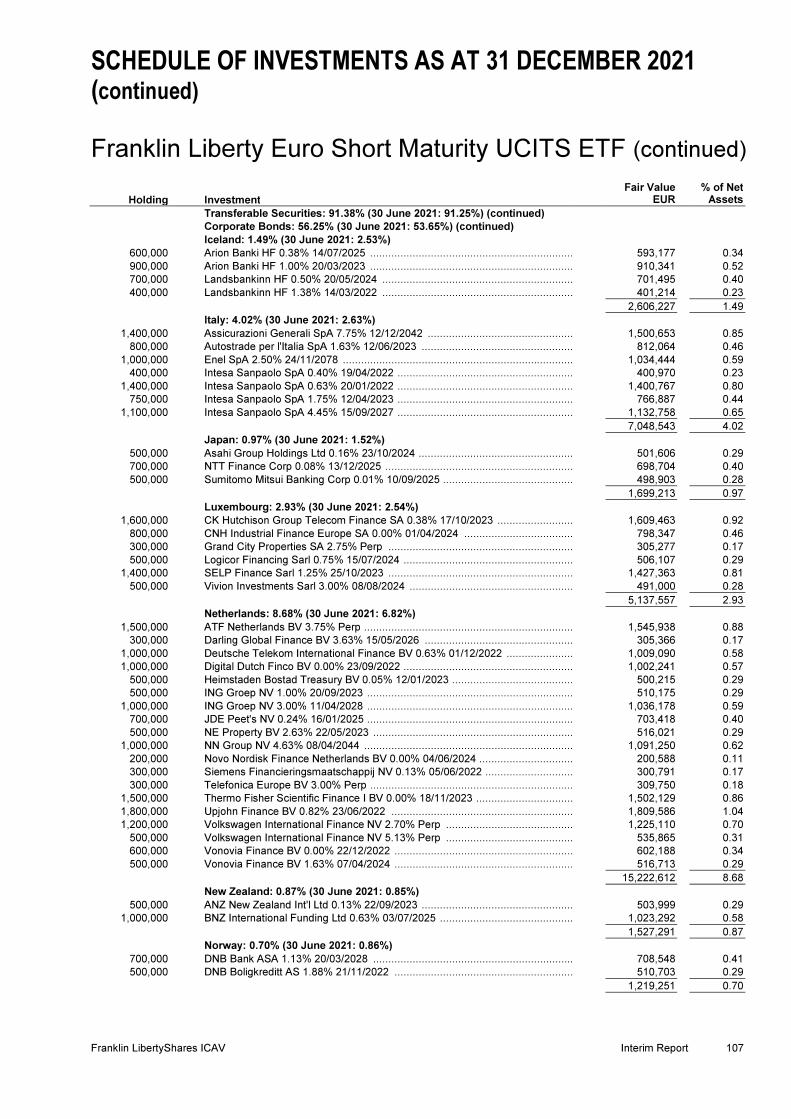
SCHEDULE OF INVESTMENTS AS AT 31 DECEMBER 2021 (continued) Franklin Liberty Euro Short Maturity UCITS ETF (continued)
Franklin LibertyShares ICAV Interim Report 107
Holding Investment
Fair Value EUR
% of Net Assets
Transferable Securities: 91.38% (30 June 2021: 91.25%) (continued)
Corporate Bonds: 56.25% (30 June 2021: 53.65%) (continued)
Iceland: 1.49% (30 June 2021: 2.53%)
600,000 Arion Banki HF 0.38% 14/07/2025 .................................................................... 593,177 0.34
900,000 Arion Banki HF 1.00% 20/03/2023 .................................................................... 910,341 0.52
700,000 Landsbankinn HF 0.50% 20/05/2024 ................................................................ 701,495 0.40
400,000 Landsbankinn HF 1.38% 14/03/2022 ................................................................ 401,214 0.23
2,606,227 1.49
Italy: 4.02% (30 June 2021: 2.63%)
1,400,000 Assicurazioni Generali SpA 7.75% 12/12/2042 ................................................. 1,500,653 0.85
800,000 Autostrade per l'Italia SpA 1.63% 12/06/2023 ................................................... 812,064 0.46
1,000,000 Enel SpA 2.50% 24/11/2078 ............................................................................. 1,034,444 0.59
400,000 Intesa Sanpaolo SpA 0.40% 19/04/2022 ........................................................... 400,970 0.23
1,400,000 Intesa Sanpaolo SpA 0.63% 20/01/2022 ........................................................... 1,400,767 0.80
750,000 Intesa Sanpaolo SpA 1.75% 12/04/2023 ........................................................... 766,887 0.44
1,100,000 Intesa Sanpaolo SpA 4.45% 15/09/2027 ........................................................... 1,132,758 0.65
7,048,543 4.02
Japan: 0.97% (30 June 2021: 1.52%)
500,000 Asahi Group Holdings Ltd 0.16% 23/10/2024 .................................................... 501,606 0.29
700,000 NTT Finance Corp 0.08% 13/12/2025 ............................................................... 698,704 0.40
500,000 Sumitomo Mitsui Banking Corp 0.01% 10/09/2025 ............................................ 498,903 0.28
1,699,213 0.97
Luxembourg: 2.93% (30 June 2021: 2.54%)
1,600,000 CK Hutchison Group Telecom Finance SA 0.38% 17/10/2023 .......................... 1,609,463 0.92
800,000 CNH Industrial Finance Europe SA 0.00% 01/04/2024 ..................................... 798,347 0.46
300,000 Grand City Properties SA 2.75% Perp .............................................................. 305,277 0.17
500,000 Logicor Financing Sarl 0.75% 15/07/2024 ......................................................... 506,107 0.29
1,400,000 SELP Finance Sarl 1.25% 25/10/2023 .............................................................. 1,427,363 0.81
500,000 Vivion Investments Sarl 3.00% 08/08/2024 ....................................................... 491,000 0.28
5,137,557 2.93
Netherlands: 8.68% (30 June 2021: 6.82%)
1,500,000 ATF Netherlands BV 3.75% Perp ...................................................................... 1,545,938 0.88
300,000 Darling Global Finance BV 3.63% 15/05/2026 .................................................. 305,366 0.17
1,000,000 Deutsche Telekom International Finance BV 0.63% 01/12/2022 ....................... 1,009,090 0.58
1,000,000 Digital Dutch Finco BV 0.00% 23/09/2022 ......................................................... 1,002,241 0.57
500,000 Heimstaden Bostad Treasury BV 0.05% 12/01/2023 ......................................... 500,215 0.29
500,000 ING Groep NV 1.00% 20/09/2023 ..................................................................... 510,175 0.29
1,000,000 ING Groep NV 3.00% 11/04/2028 ..................................................................... 1,036,178 0.59
700,000 JDE Peet's NV 0.24% 16/01/2025 ..................................................................... 703,418 0.40
500,000 NE Property BV 2.63% 22/05/2023 ................................................................... 516,021 0.29
1,000,000 NN Group NV 4.63% 08/04/2044 ...................................................................... 1,091,250 0.62
200,000 Novo Nordisk Finance Netherlands BV 0.00% 04/06/2024 ................................ 200,588 0.11
300,000 Siemens Financieringsmaatschappij NV 0.13% 05/06/2022 .............................. 300,791 0.17
300,000 Telefonica Europe BV 3.00% Perp .................................................................... 309,750 0.18
1,500,000 Thermo Fisher Scientific Finance I BV 0.00% 18/11/2023 ................................ 1,502,129 0.86
1,800,000 Upjohn Finance BV 0.82% 23/06/2022 ............................................................. 1,809,586 1.04
1,200,000 Volkswagen International Finance NV 2.70% Perp ........................................... 1,225,110 0.70
500,000 Volkswagen International Finance NV 5.13% Perp ........................................... 535,865 0.31
600,000 Vonovia Finance BV 0.00% 22/12/2022 ............................................................ 602,188 0.34
500,000 Vonovia Finance BV 1.63% 07/04/2024 ............................................................ 516,713 0.29
15,222,612 8.68
New Zealand: 0.87% (30 June 2021: 0.85%)
500,000 ANZ New Zealand Int'l Ltd 0.13% 22/09/2023 ................................................... 503,999 0.29
1,000,000 BNZ International Funding Ltd 0.63% 03/07/2025 ............................................. 1,023,292 0.58
1,527,291 0.87
Norway: 0.70% (30 June 2021: 0.86%)
700,000 DNB Bank ASA 1.13% 20/03/2028 ................................................................... 708,548 0.41
500,000 DNB Boligkreditt AS 1.88% 21/11/2022 ............................................................ 510,703 0.29
1,219,251 0.70

SCHEDULE OF INVESTMENTS AS AT 31 DECEMBER 2021 (continued) Franklin Liberty Euro Short Maturity UCITS ETF (continued)
108 Interim Report Franklin LibertyShares ICAV
Holding Investment
Fair Value EUR
% of Net Assets
Transferable Securities: 91.38% (30 June 2021: 91.25%) (continued)
Corporate Bonds: 56.25% (30 June 2021: 53.65%) (continued)
Portugal: 0.69% (30 June 2021: Nil)
1,200,000 Caixa Geral de Depositos SA 1.00% 27/01/2022 ............................................. 1,201,174 0.69
1,201,174 0.69
Spain: 4.20% (30 June 2021: 2.39%)
400,000 Abanca Corp Bancaria SA 6.13% 18/01/2029 .................................................. 433,886 0.25
600,000 Banco de Sabadell SA 1.75% 29/06/2023 ........................................................ 605,030 0.35
300,000 Banco de Sabadell SA 1.75% 10/05/2024 ........................................................ 307,374 0.18
600,000 Banco de Sabadell SA 5.38% 12/12/2028 ........................................................ 648,937 0.37
1,900,000 Bankinter SA 2.50% 06/04/2027 ...................................................................... 1,911,930 1.08
400,000 CaixaBank SA 1.13% 12/01/2023 .................................................................... 405,279 0.23
1,100,000 CaixaBank SA 2.75% 14/07/2028 .................................................................... 1,136,513 0.65
1,500,000 CaixaBank SA 3.50% 15/02/2027 .................................................................... 1,506,383 0.86
400,000 El Corte Ingles SA 3.63% 15/03/2024 .............................................................. 410,091 0.23
7,365,423 4.20
Sweden: 2.55% (30 June 2021: 2.20%)
397,000 Heimstaden Bostad AB 2.13% 05/09/2023 ....................................................... 410,156 0.23
500,000 Heimstaden Bostad AB 3.25% Perp ................................................................. 502,103 0.29
600,000 Skandinaviska Enskilda Banken AB 1.38% 31/10/2028 .................................... 612,964 0.35
1,300,000 Svenska Handelsbanken AB 1.25% 02/03/2028 .............................................. 1,317,766 0.75
300,000 Swedbank AB 0.25% 07/11/2022 ..................................................................... 301,832 0.17
1,000,000 Swedbank Hypotek AB 0.45% 23/08/2023 ....................................................... 1,014,346 0.59
300,000 Volvo Treasury AB 0.10% 24/05/2022 .............................................................. 300,492 0.17
4,459,659 2.55
Switzerland: 0.75% (30 June 2021: 1.21%)
1,100,000 Credit Suisse AG 1.00% 07/06/2023 ................................................................ 1,119,140 0.63
200,000 UBS Group AG 5.75% Perp ............................................................................. 201,750 0.12
1,320,890 0.75
United Kingdom: 5.43% (30 June 2021: 5.61%)
500,000 Barclays Plc 2.00% 07/02/2028 ........................................................................ 509,138 0.29
2,000,000 Coca-Cola Europacific Partners Plc 0.75% 24/02/2022 .................................... 2,001,339 1.15
890,000 GlaxoSmithKline Capital Plc 0.13% 12/05/2023 ............................................... 895,769 0.51
500,000 HSBC Holdings Plc 0.00% 05/10/2023 ............................................................. 501,552 0.29
300,000 HSBC Holdings Plc 5.25% Perp ....................................................................... 309,750 0.18
400,000 Lloyds Banking Group Plc 0.20% 21/06/2024 ................................................... 406,106 0.23
500,000 National Westminster Bank Plc 0.50% 15/05/2024 ........................................... 508,259 0.29
1,500,000 Nationwide Building Society 0.50% 23/02/2024 ................................................ 1,524,666 0.87
1,500,000 NatWest Group Plc 2.00% 08/03/2023 ............................................................. 1,506,261 0.86
800,000 Standard Chartered Plc 3.63% 23/11/2022 ...................................................... 826,280 0.47
500,000 Vodafone Group Plc 3.10% 03/01/2079 ........................................................... 516,688 0.29
9,505,808 5.43
United States: 7.02% (30 June 2021: 6.61%)
1,000,000 AT&T Inc 1.45% 01/06/2022 ............................................................................ 1,002,829 0.57
600,000 Bank of America Corp 0.15% 25/04/2024 ......................................................... 603,221 0.34
1,200,000 Bank of America Corp 0.75% 26/07/2023 ......................................................... 1,217,263 0.70
1,000,000 Citigroup Inc 0.75% 26/10/2023 ....................................................................... 1,014,690 0.58
500,000 Citigroup Inc 2.38% 22/05/2024 ....................................................................... 529,004 0.30
600,000 Fiserv Inc 0.38% 01/07/2023 ............................................................................ 604,014 0.34
500,000 Goldman Sachs Group Inc 0.00% 21/04/2023 .................................................. 500,545 0.29
700,000 Goldman Sachs Group Inc 0.03% 26/09/2023 .................................................. 701,880 0.40
700,000 Goldman Sachs Group Inc 0.44% 30/04/2024 .................................................. 706,316 0.40
400,000 Goldman Sachs Group Inc 1.38% 26/07/2022 .................................................. 404,161 0.23
1,000,000 JPMorgan Chase & Co 2.75% 01/02/2023 ....................................................... 1,033,796 0.59
600,000 Kraft Heinz Foods Co 2.00% 30/06/2023 ......................................................... 614,304 0.35
1,200,000 Stryker Corp 1.13% 30/11/2023 ....................................................................... 1,229,443 0.71
500,000 Utah Acquisition Sub Inc 2.25% 22/11/2024 ..................................................... 528,640 0.30
1,200,000 Wells Fargo & Co 0.50% 26/04/2024 ............................................................... 1,213,507 0.69
400,000 Wells Fargo & Co 1.50% 12/09/2022 ............................................................... 405,465 0.23
12,309,078 7.02

SCHEDULE OF INVESTMENTS AS AT 31 DECEMBER 2021 (continued) Franklin Liberty Euro Short Maturity UCITS ETF (continued)
Franklin LibertyShares ICAV Interim Report 109
Holding Investment
Fair Value EUR
% of Net Assets
Transferable Securities: 91.38% (30 June 2021: 91.25%) (continued)
Total Corporate Bonds ................................................................................................ 98,562,855 56.25
Government Bonds: 34.88% (30 June 2021: 36.82%)
Belgium: 3.44% (30 June 2021: 3.34%)
6,000,000 Kingdom of Belgium Treasury Bill 0.00% 08/09/2022 ........................................ 6,027,026 3.44
6,027,026 3.44
Cyprus: 0.24% (30 June 2021: 0.73%)
400,000 Cyprus Government International Bond 3.75% 26/07/2023 ............................... 426,410 0.24
426,410 0.24
France: 5.87% (30 June 2021: 5.06%)
5,000,000 France Treasury Bill BTF 0.00% 10/08/2022 ..................................................... 5,022,659 2.87
4,418,880 French Republic Government Bond OAT 0.25% 25/07/2024 ............................. 4,755,144 2.71
500,000 SNCF Reseau 4.38% 02/06/2022 ..................................................................... 510,057 0.29
10,287,860 5.87
Germany: 9.65% (30 June 2021: 11.44%)
16,327,580 Deutsche Bundesrepublik Inflation Linked Bond 0.10% 15/04/2023 .................. 16,912,695 9.65
16,912,695 9.65
Greece: 0.24% (30 June 2021: 0.71%)
400,000 Hellenic Republic Government Bond 3.50% 30/01/2023 ................................... 416,505 0.24
416,505 0.24
Iceland: 0.29% (30 June 2021: 0.84%)
500,000 Iceland Government International Bond 0.50% 20/12/2022 ............................... 503,583 0.29
503,583 0.29
Indonesia: 1.42% (30 June 2021: 2.05%)
500,000 Indonesia Government International Bond 2.15% 18/07/2024 ........................... 523,965 0.30
1,900,000 Indonesia Government International Bond 2.63% 14/06/2023 ........................... 1,969,911 1.12
2,493,876 1.42
Italy: 8.59% (30 June 2021: 5.85%)
2,000,000 Italy Buoni Ordinari del Tesoro BOT 0.00% 31/01/2022 .................................... 2,001,098 1.14
7,000,000 Italy Buoni Ordinari del Tesoro BOT 0.00% 14/11/2022 .................................... 7,038,678 4.02
6,000,000 Italy Treasury Bill 0.00% 14/03/2022 ................................................................ 6,001,267 3.43
15,041,043 8.59
Netherlands: Nil (30 June 2021: 4.19%)
Poland: 0.57% (30 June 2021: 1.35%)
1,000,000 Republic of Poland Government International Bond 0.00% 07/07/2023 ............. 1,004,272 0.57
1,004,272 0.57
Romania: 1.22% (30 June 2021: 0.37%)
2,000,000 Romanian Government International Bond 2.88% 28/10/2024 .......................... 2,133,728 1.22
2,133,728 1.22
Spain: 3.35% (30 June 2021: 0.89%)
800,000 Autonomous Community of Madrid Spain 2.88% 17/07/2023 ............................ 840,775 0.48
5,000,000 Spain Letras del Tesoro 0.00% 07/10/2022 ...................................................... 5,023,742 2.87
5,864,517 3.35
Total Government Bonds ................................................................................................ 61,111,515 34.88
Mortgage Backed Securities: 0.25% (30 June 2021: 0.78%)
Ireland: 0.25% (30 June 2021: 0.78%)
441,707 Primrose Residential 2021-1 DAC 0.11% 24/03/2061 ....................................... 440,338 0.25
440,338 0.25
Total Mortgage Backed Securities ................................................................ 440,338 0.25
Total Transferable Securities ................................................................................................ 160,114,708 91.38

SCHEDULE OF INVESTMENTS AS AT 31 DECEMBER 2021 (continued) Franklin Liberty Euro Short Maturity UCITS ETF (continued)
110 Interim Report Franklin LibertyShares ICAV
Financial Derivative Instruments: 0.12% (30 June 2021: (0.03)%)
Futures Contracts: 0.12% (30 June 2021: (0.03)%)
Notional Amount
EUR
Average Cost Price EUR
Unrealised Gain EUR
% of Net Assets
(7,507,360) (134) 56 of Euro-Bobl Short Futures Contracts Expiring March 2022 ................................................................................................ 45,920 0.03
(7,302,960) (174) 42 of Euro-Bund Short Futures Contracts Expiring March 2022 ................................................................................................ 105,420 0.06
(3,311,800) (166) 20 of Euro-Oat Short Futures Contracts Expiring March 2022 ................................................................................................ 48,800 0.03
Net unrealised gain on futures contracts ................................ 200,140 0.12
Total Financial Derivative Instruments ................................ 200,140 0.12
Fair Value EUR
% of Net Assets
Portfolio of Investments ................................................................................................ 160,314,848 91.50
Other Net Assets ................................................................................................ 14,895,286 8.50
Net Assets ................................................................................................................................ 175,210,134 100.00
Analysis of Total Assets
% of Total Assets
Transferable securities admitted to an official stock exchange listing ................................ 91.38
Exchange-Traded Derivative Instruments ................................................................ 0.11
Other Current Assets ................................................................................................ 8.51
Total Assets ................................................................................................................................ 100.00
Country classifications are based upon country of incorporation and/or country of domicile.

SCHEDULE OF INVESTMENTS AS AT 31 DECEMBER 2021 Franklin Liberty USD Investment Grade Corporate Bond
UCITS ETF
Franklin LibertyShares ICAV Interim Report 111
Holding Investment
Fair Value USD
% of Net Assets
Transferable Securities: 98.63% (30 June 2021: 98.22%)
Corporate Bonds: 98.63% (30 June 2021: 98.22%)
Austria: 0.72% (30 June 2021: 0.61%)
100,000 Suzano Austria GmbH 3.75% 15/01/2031 ......................................................... 101,799 0.72
101,799 0.72
Bermuda: 0.25% (30 June 2021: 0.93%)
30,000 IHS Markit Ltd 4.75% 01/08/2028 ..................................................................... 34,879 0.25
34,879 0.25
Canada: 1.41% (30 June 2021: 4.69%)
200,000 Toronto-Dominion Bank 1.15% 12/06/2025 ....................................................... 198,475 1.41
198,475 1.41
Cayman Islands: Nil (30 June 2021: 1.28%)
France: 3.87% (30 June 2021: 6.75%)
125,000 AXA SA 8.60% 15/12/2030 ............................................................................... 180,549 1.28
200,000 BNP Paribas SA 3.38% 09/01/2025 .................................................................. 210,129 1.49
100,000 Orange SA 9.00% 01/03/2031 .......................................................................... 153,397 1.10
544,075 3.87
Italy: 1.39% (30 June 2021: Nil)
200,000 UniCredit SpA 1.98% 03/06/2027 ..................................................................... 195,054 1.39
195,054 1.39
Japan: 1.44% (30 June 2021: 1.18%)
200,000 Takeda Pharmaceutical Co Ltd 3.18% 09/07/2050 ............................................ 202,174 1.44
202,174 1.44
Netherlands: 2.91% (30 June 2021: 1.63%)
200,000 EDP Finance BV 1.71% 24/01/2028 ................................................................ 194,880 1.39
200,000 Enel Finance International NV 3.50% 06/04/2028 ............................................. 213,924 1.52
408,804 2.91
Norway: 1.13% (30 June 2021: 0.95%)
150,000 Aker BP ASA 3.75% 15/01/2030 ....................................................................... 159,001 1.13
159,001 1.13
Spain: 0.91% (30 June 2021: 0.76%)
90,000 Telefonica Emisiones SA 7.05% 20/06/2036 ..................................................... 128,561 0.91
128,561 0.91
Switzerland: 1.96% (30 June 2021: 1.64%)
250,000 Credit Suisse Group AG 4.19% 01/04/2031 ..................................................... 276,005 1.96
276,005 1.96
United Kingdom: 4.68% (30 June 2021: 6.3%)
165,000 AstraZeneca Plc 4.38% 16/11/2045 .................................................................. 211,817 1.51
200,000 Coca-Cola Europacific Partners Plc 0.50% 05/05/2023 ..................................... 198,403 1.41
250,000 HSBC Holdings Plc 1.65% 18/04/2026 ............................................................. 248,122 1.76
658,342 4.68
United States: 77.96% (30 June 2021: 70.57%)
100,000 AbbVie Inc 4.25% 21/11/2049 ........................................................................... 120,532 0.86
135,000 Aflac Inc 4.75% 15/01/2049 .............................................................................. 179,282 1.28
125,000 Allstate Corp 4.20% 15/12/2046 ........................................................................ 150,414 1.07
200,000 American Express Co 3.30% 03/05/2027 .......................................................... 214,525 1.53
165,000 Amgen Inc 2.45% 21/02/2030 ........................................................................... 168,115 1.20
150,000 Anheuser-Busch Co LLC 4.70% 01/02/2036 .................................................... 181,309 1.29
185,000 Anthem Inc 4.10% 01/03/2028 .......................................................................... 205,242 1.46
100,000 AT&T Inc 3.50% 01/06/2041 ............................................................................. 102,992 0.73
145,000 Baker Hughes Holdings LLC 4.08% 15/12/2047 ............................................... 165,129 1.17
300,000 Bank of America Corp 4.18% 25/11/2027 ......................................................... 328,463 2.34
120,000 Berkshire Hathaway Energy Co 6.13% 01/04/2036 ........................................... 163,579 1.16
116,000 Bristol-Myers Squibb Co 5.00% 15/08/2045 ...................................................... 154,429 1.10
100,000 Brixmor Operating Partnership LP 4.13% 15/05/2029 ....................................... 110,891 0.79
100,000 Burlington Northern Santa Fe LLC 5.75% 01/05/2040 ....................................... 139,083 0.99
175,000 Carrier Global Corp 3.58% 05/04/2050 ............................................................. 186,576 1.33

SCHEDULE OF INVESTMENTS AS AT 31 DECEMBER 2021 (continued) Franklin Liberty USD Investment Grade Corporate Bond
UCITS ETF (continued)
112 Interim Report Franklin LibertyShares ICAV
Holding Investment
Fair Value USD
% of Net Assets
Transferable Securities: 98.63% (30 June 2021: 98.22%) (continued)
Corporate Bonds: 98.63% (30 June 2021: 98.22%) (continued)
United States: 77.96% (30 June 2021: 70.57%) (continued)
175,000 Caterpillar Inc 2.60% 09/04/2030 ..................................................................... 182,548 1.30
100,000 Centene Corp 3.38% 15/02/2030 ..................................................................... 102,006 0.73
150,000 Charter Communications Operating LLC 2.80% 01/04/2031 ............................ 148,608 1.06
50,000 Cheniere Corpus Christi Holdings LLC 5.88% 31/03/2025 ............................... 55,452 0.39
240,000 Cigna Corp 3.05% 15/10/2027 ......................................................................... 255,075 1.81
50,000 Citigroup Inc 3.35% 24/04/2025 ....................................................................... 52,235 0.37
290,000 Citigroup Inc 3.67% 24/07/2028 ....................................................................... 313,015 2.23
125,000 Comcast Corp 4.95% 15/10/2058 .................................................................... 173,172 1.23
150,000 Costco Wholesale Corp 1.75% 20/04/2032 ...................................................... 145,889 1.04
145,000 CSX Corp 3.25% 01/06/2027 ........................................................................... 155,603 1.11
205,000 CVS Health Corp 5.30% 05/12/2043 ................................................................ 271,210 1.93
185,000 Dominion Energy Inc 3.90% 01/10/2025 .......................................................... 199,702 1.42
130,000 Duke Energy Corp 4.80% 15/12/2045 .............................................................. 159,985 1.14
100,000 ERP Operating LP 4.50% 01/07/2044 .............................................................. 125,838 0.90
190,000 Essex Portfolio LP 2.65% 15/03/2032 .............................................................. 190,867 1.36
175,000 Exelon Corp 4.05% 15/04/2030 ........................................................................ 194,642 1.38
170,000 FedEx Corp 4.75% 15/11/2045 ........................................................................ 207,648 1.48
175,000 Fidelity National Information Services Inc 2.25% 01/03/2031 ........................... 171,320 1.22
200,000 Fiserv Inc 3.20% 01/07/2026 ............................................................................ 211,689 1.51
200,000 Goldman Sachs Group Inc 4.25% 21/10/2025 .................................................. 218,314 1.55
210,000 Home Depot Inc 3.35% 15/04/2050 .................................................................. 229,626 1.63
140,000 Honeywell International Inc 1.95% 01/06/2030 ................................................. 139,348 0.99
250,000 JPMorgan Chase & Co 2.52% 22/04/2031 ....................................................... 252,954 1.80
230,000 JPMorgan Chase & Co 3.38% 01/05/2023 ....................................................... 237,196 1.69
60,000 Kinder Morgan Energy Partners LP 5.50% 01/03/2044 .................................... 73,753 0.52
125,000 Kraft Heinz Foods Co 4.25% 01/03/2031 ......................................................... 142,282 1.01
135,000 MDC Holdings Inc 2.50% 15/01/2031 ............................................................... 130,770 0.93
120,000 MetLife Inc 6.40% 15/12/2036 .......................................................................... 147,866 1.05
275,000 Microsoft Corp 2.53% 01/06/2050 .................................................................... 268,950 1.91
100,000 Mohawk Industries Inc 3.63% 15/05/2030 ........................................................ 107,352 0.76
215,000 Morgan Stanley 3.59% 22/07/2028 .................................................................. 231,965 1.65
170,000 MPLX LP 4.13% 01/03/2027 ............................................................................ 186,126 1.32
150,000 Netflix Inc 5.75% 01/03/2024 ........................................................................... 163,293 1.16
70,000 PulteGroup Inc 5.00% 15/01/2027 ................................................................... 79,588 0.57
175,000 Regeneron Pharmaceuticals Inc 1.75% 15/09/2030 ......................................... 165,691 1.18
240,000 RELX Capital Inc 3.00% 22/05/2030 ................................................................ 251,891 1.79
205,000 ServiceNow Inc 1.40% 01/09/2030 .................................................................. 191,051 1.36
150,000 Simon Property Group LP 3.38% 01/12/2027 ................................................... 161,415 1.15
175,000 SVB Financial Group 3.13% 05/06/2030 .......................................................... 183,869 1.31
200,000 Thermo Fisher Scientific Inc 1.22% 18/10/2024 ............................................... 199,887 1.42
230,000 T-Mobile USA Inc 3.75% 15/04/2027 ............................................................... 249,182 1.77
135,000 Transcontinental Gas Pipe Line Co LLC 7.85% 01/02/2026 ............................. 164,934 1.17
100,000 Truist Financial Corp 3.88% 19/03/2029 ........................................................... 110,248 0.78
205,000 UnitedHealth Group Inc 3.05% 15/05/2041 ...................................................... 214,854 1.53
265,000 Verizon Communications Inc 3.40% 22/03/2041 .............................................. 277,935 1.98
165,000 Vistra Operations Co LLC 3.55% 15/07/2024 ................................................... 170,015 1.21
110,000 WRKCo Inc 3.90% 01/06/2028 ......................................................................... 120,535 0.86
10,957,955 77.96
Total Corporate Bonds ................................................................................................ 13,865,124 98.63
Total Transferable Securities ................................................................................................ 13,865,124 98.63
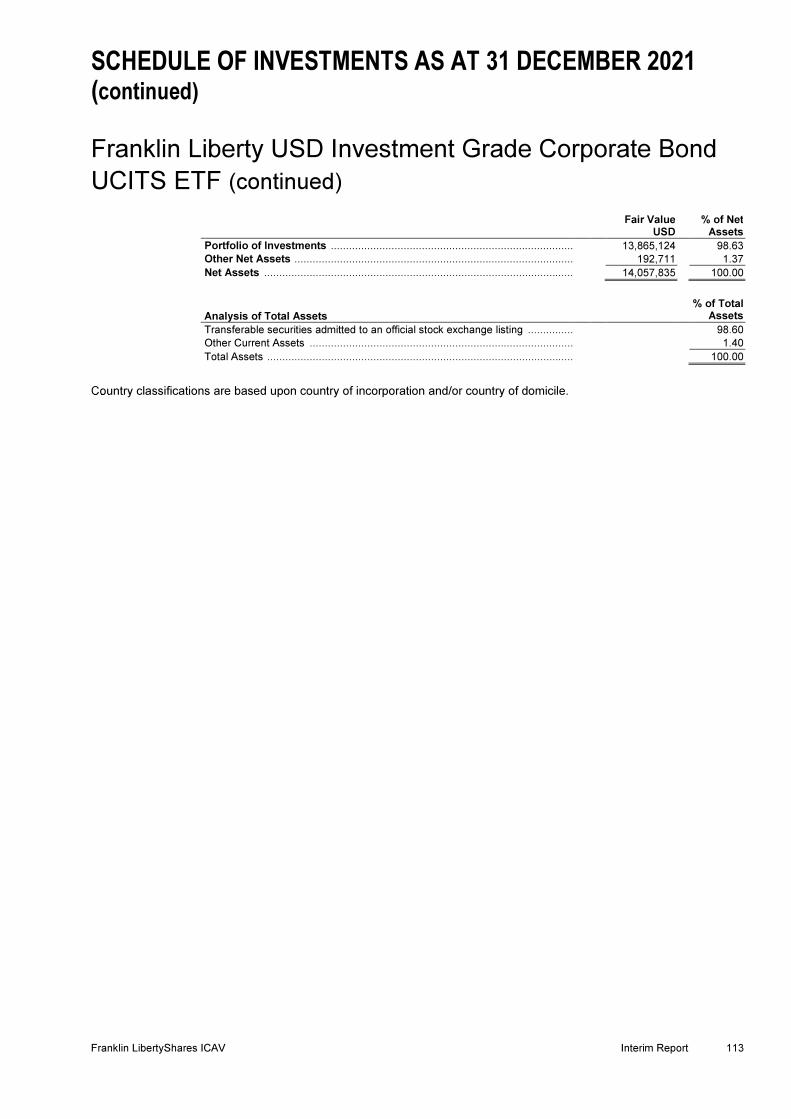
SCHEDULE OF INVESTMENTS AS AT 31 DECEMBER 2021 (continued) Franklin Liberty USD Investment Grade Corporate Bond
UCITS ETF (continued)
Franklin LibertyShares ICAV Interim Report 113
Fair Value USD
% of Net Assets
Portfolio of Investments ................................................................................................ 13,865,124 98.63
Other Net Assets ................................................................................................ 192,711 1.37
Net Assets ................................................................................................................................ 14,057,835 100.00
Analysis of Total Assets
% of Total Assets
Transferable securities admitted to an official stock exchange listing ................................ 98.60
Other Current Assets ................................................................................................ 1.40
Total Assets ................................................................................................................................ 100.00
Country classifications are based upon country of incorporation and/or country of domicile.
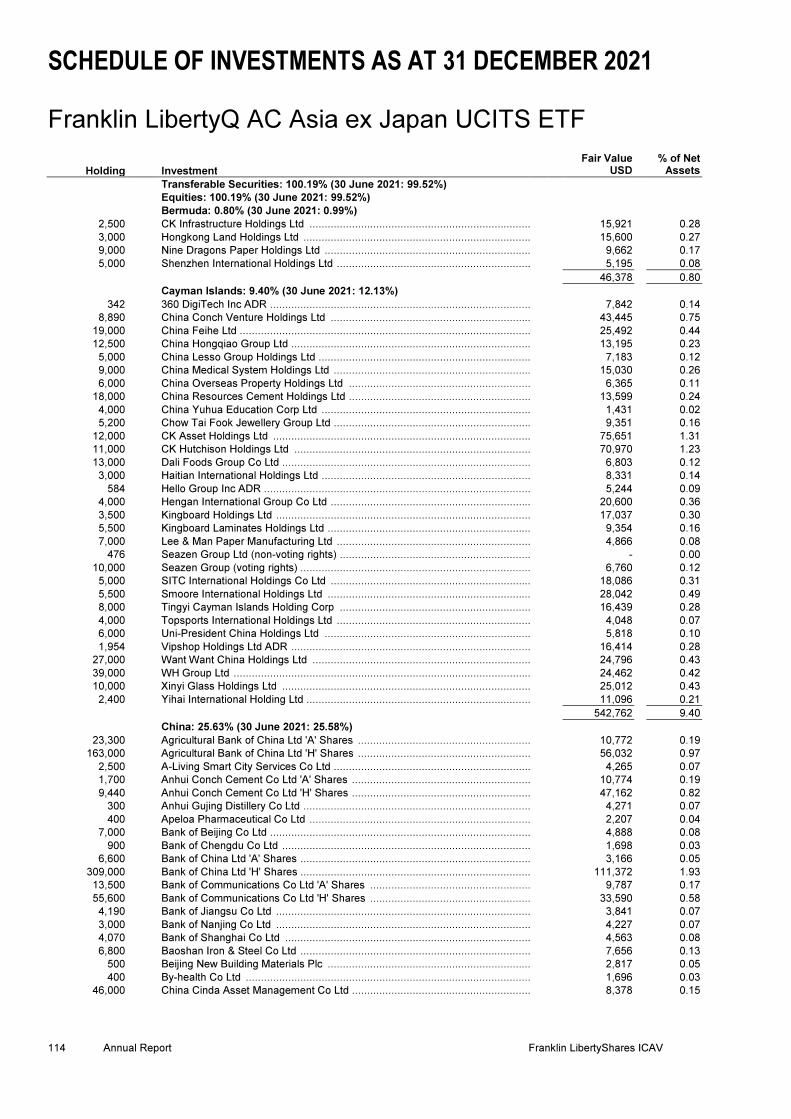
SCHEDULE OF INVESTMENTS AS AT 31 DECEMBER 2021 Franklin LibertyQ AC Asia ex Japan UCITS ETF
114 Annual Report Franklin LibertyShares ICAV
Holding Investment
Fair Value USD
% of Net Assets
Transferable Securities: 100.19% (30 June 2021: 99.52%) Equities: 100.19% (30 June 2021: 99.52%) Bermuda: 0.80% (30 June 2021: 0.99%)
2,500 CK Infrastructure Holdings Ltd ......................................................................... 15,921 0.28
3,000 Hongkong Land Holdings Ltd ........................................................................... 15,600 0.27
9,000 Nine Dragons Paper Holdings Ltd .................................................................... 9,662 0.17
5,000 Shenzhen International Holdings Ltd ................................................................ 5,195 0.08
46,378 0.80
Cayman Islands: 9.40% (30 June 2021: 12.13%)
342 360 DigiTech Inc ADR ...................................................................................... 7,842 0.14
8,890 China Conch Venture Holdings Ltd .................................................................. 43,445 0.75
19,000 China Feihe Ltd ................................................................................................ 25,492 0.44
12,500 China Hongqiao Group Ltd ............................................................................... 13,195 0.23
5,000 China Lesso Group Holdings Ltd ...................................................................... 7,183 0.12
9,000 China Medical System Holdings Ltd ................................................................. 15,030 0.26
6,000 China Overseas Property Holdings Ltd ............................................................ 6,365 0.11
18,000 China Resources Cement Holdings Ltd ............................................................ 13,599 0.24
4,000 China Yuhua Education Corp Ltd ..................................................................... 1,431 0.02
5,200 Chow Tai Fook Jewellery Group Ltd ................................................................. 9,351 0.16
12,000 CK Asset Holdings Ltd ..................................................................................... 75,651 1.31
11,000 CK Hutchison Holdings Ltd .............................................................................. 70,970 1.23
13,000 Dali Foods Group Co Ltd .................................................................................. 6,803 0.12
3,000 Haitian International Holdings Ltd ..................................................................... 8,331 0.14
584 Hello Group Inc ADR ........................................................................................ 5,244 0.09
4,000 Hengan International Group Co Ltd .................................................................. 20,600 0.36
3,500 Kingboard Holdings Ltd .................................................................................... 17,037 0.30
5,500 Kingboard Laminates Holdings Ltd ................................................................... 9,354 0.16
7,000 Lee & Man Paper Manufacturing Ltd ................................................................ 4,866 0.08
476 Seazen Group Ltd (non-voting rights) ............................................................... - 0.00
10,000 Seazen Group (voting rights) ............................................................................ 6,760 0.12
5,000 SITC International Holdings Co Ltd .................................................................. 18,086 0.31
5,500 Smoore International Holdings Ltd ................................................................... 28,042 0.49
8,000 Tingyi Cayman Islands Holding Corp ............................................................... 16,439 0.28
4,000 Topsports International Holdings Ltd ................................................................ 4,048 0.07
6,000 Uni-President China Holdings Ltd .................................................................... 5,818 0.10
1,954 Vipshop Holdings Ltd ADR ............................................................................... 16,414 0.28
27,000 Want Want China Holdings Ltd ........................................................................ 24,796 0.43
39,000 WH Group Ltd .................................................................................................. 24,462 0.42
10,000 Xinyi Glass Holdings Ltd .................................................................................. 25,012 0.43
2,400 Yihai International Holding Ltd .......................................................................... 11,096 0.21
542,762 9.40
China: 25.63% (30 June 2021: 25.58%)
23,300 Agricultural Bank of China Ltd 'A' Shares ......................................................... 10,772 0.19
163,000 Agricultural Bank of China Ltd 'H' Shares ......................................................... 56,032 0.97
2,500 A-Living Smart City Services Co Ltd ................................................................. 4,265 0.07
1,700 Anhui Conch Cement Co Ltd 'A' Shares ........................................................... 10,774 0.19
9,440 Anhui Conch Cement Co Ltd 'H' Shares ........................................................... 47,162 0.82
300 Anhui Gujing Distillery Co Ltd ........................................................................... 4,271 0.07
400 Apeloa Pharmaceutical Co Ltd ......................................................................... 2,207 0.04
7,000 Bank of Beijing Co Ltd ...................................................................................... 4,888 0.08
900 Bank of Chengdu Co Ltd .................................................................................. 1,698 0.03
6,600 Bank of China Ltd 'A' Shares ............................................................................ 3,166 0.05
309,000 Bank of China Ltd 'H' Shares ............................................................................ 111,372 1.93
13,500 Bank of Communications Co Ltd 'A' Shares ..................................................... 9,787 0.17
55,600 Bank of Communications Co Ltd 'H' Shares ..................................................... 33,590 0.58
4,190 Bank of Jiangsu Co Ltd .................................................................................... 3,841 0.07
3,000 Bank of Nanjing Co Ltd .................................................................................... 4,227 0.07
4,070 Bank of Shanghai Co Ltd ................................................................................. 4,563 0.08
6,800 Baoshan Iron & Steel Co Ltd ............................................................................ 7,656 0.13
500 Beijing New Building Materials Plc ................................................................... 2,817 0.05
400 By-health Co Ltd .............................................................................................. 1,696 0.03
46,000 China Cinda Asset Management Co Ltd ........................................................... 8,378 0.15

SCHEDULE OF INVESTMENTS AS AT 31 DECEMBER 2021 (continued) Franklin LibertyQ AC Asia ex Japan UCITS ETF (continued)
Franklin LibertyShares ICAV Interim Report 115
Holding Investment
Fair Value USD
% of Net Assets
Transferable Securities: 100.19% (30 June 2021: 99.52%) (continued) Equities: 100.19% (30 June 2021: 99.52%) (continued) China: 25.63% (30 June 2021: 25.58%) (continued)
55,000 China CITIC Bank Corp Ltd .............................................................................. 23,845 0.41
6,000 China Coal Energy Co Ltd ................................................................................ 3,463 0.06
10,000 China Communications Services Corp Ltd ........................................................ 4,874 0.08
700 China Construction Bank Corp 'A' Shares ......................................................... 645 0.01
168,000 China Construction Bank Corp 'H' Shares ......................................................... 116,363 2.02
12,600 China Everbright Bank Co Ltd 'A' Shares .......................................................... 6,578 0.11
19,000 China Everbright Bank Co Ltd 'H' Shares .......................................................... 6,726 0.12
10,900 China Minsheng Banking Corp Ltd 'A' Shares ................................................... 6,685 0.12
33,000 China Minsheng Banking Corp Ltd 'H' Shares ................................................... 12,614 0.22
20,000 China National Building Material Co Ltd ............................................................ 24,524 0.42
5,600 China Petroleum & Chemical Corp 'A' Shares ................................................... 3,725 0.06
108,000 China Petroleum & Chemical Corp 'H' Shares ................................................... 50,285 0.87
18,000 China Railway Group Ltd .................................................................................. 9,512 0.16
2,400 China Shenhua Energy Co Ltd .......................................................................... 8,499 0.15
6,800 China State Construction Engineering Corp Ltd ................................................ 5,347 0.09
300 China Tourism Group Duty Free Corp Ltd ......................................................... 10,351 0.18
6,800 China Yangtze Power Co Ltd ............................................................................ 24,274 0.42
200 Chongqing Brewery Co Ltd ............................................................................... 4,759 0.08
300 Chongqing Fuling Zhacai Group Co Ltd ............................................................ 1,783 0.03
1,500 Chongqing Rural Commercial Bank Co Ltd ....................................................... 908 0.02
300 Chongqing Zhifei Biological Products Co Ltd ..................................................... 5,878 0.10
2,400 COSCO SHIPPING Holdings Co Ltd 'A' Shares ................................................ 7,054 0.12
11,000 COSCO SHIPPING Holdings Co Ltd 'H' Shares ................................................ 21,333 0.37
552 Da An Gene Co Ltd of Sun Yat-Sen University ................................................. 1,741 0.03
15,000 Dongfeng Motor Group Co Ltd .......................................................................... 12,467 0.22
4,700 Focus Media Information Technology Co Ltd .................................................... 6,053 0.10
1,152 Foshan Haitian Flavouring & Food Co Ltd ......................................................... 19,042 0.33
400 Fujian Sunner Development Co Ltd .................................................................. 1,520 0.03
100 Guangzhou Kingmed Diagnostics Group Co Ltd ............................................... 1,751 0.03
200 Guangzhou Shiyuan Electronic Technology Co Ltd ........................................... 2,560 0.04
7,200 Haitong Securities Co Ltd ................................................................................. 6,381 0.11
200 Hangzhou Robam Appliances Co Ltd ............................................................... 1,133 0.02
200 Hefei Meiya Optoelectronic Technology Inc ...................................................... 1,178 0.02
500 Heilongjiang Agriculture Co Ltd ......................................................................... 1,145 0.02
1,100 Henan Shuanghui Investment & Development Co Ltd ....................................... 5,458 0.09
200 Hithink RoyalFlush Information Network Co Ltd ................................................ 4,547 0.08
460 Hualan Biological Engineering Inc ..................................................................... 2,108 0.04
4,000 Huaxia Bank Co Ltd .......................................................................................... 3,523 0.06
600 Huaxin Cement Co Ltd ...................................................................................... 1,821 0.03
2,500 Hunan Valin Steel Co Ltd .................................................................................. 2,009 0.03
10,900 Industrial & Commercial Bank of China Ltd 'A' Shares ...................................... 7,936 0.14
193,000 Industrial & Commercial Bank of China Ltd 'H' Shares ...................................... 108,923 1.89
2,600 Inner Mongolia Junzheng Energy & Chemical Industry Group Co Ltd ............... 2,138 0.04
1,700 Inner Mongolia Yili Industrial Group Co Ltd ....................................................... 11,084 0.19
600 Inner Mongolia Yuan Xing Energy Co Ltd ......................................................... 689 0.01
250 Intco Medical Technology Co Ltd ...................................................................... 2,274 0.04
290 Jafron Biomedical Co Ltd .................................................................................. 2,431 0.04
100 Jason Furniture Hangzhou Co Ltd ..................................................................... 1,213 0.02
6,000 Jiangsu Expressway Co Ltd .............................................................................. 6,149 0.11
300 Jiangsu Hengli Hydraulic Co Ltd ....................................................................... 3,859 0.07
200 Jiangsu Yuyue Medical Equipme ...................................................................... 1,189 0.02
800 Jiangsu Zhongtian Technology Co Ltd .............................................................. 2,134 0.04
900 Jiangxi Zhengbang Technology Co Ltd ............................................................. 1,367 0.02
300 Jointown Pharmaceutical Group Co Ltd ............................................................ 694 0.01
200 Juewei Food Co Ltd .......................................................................................... 2,149 0.04
600 Kingfa Sci & Tech Co Ltd .................................................................................. 1,187 0.02
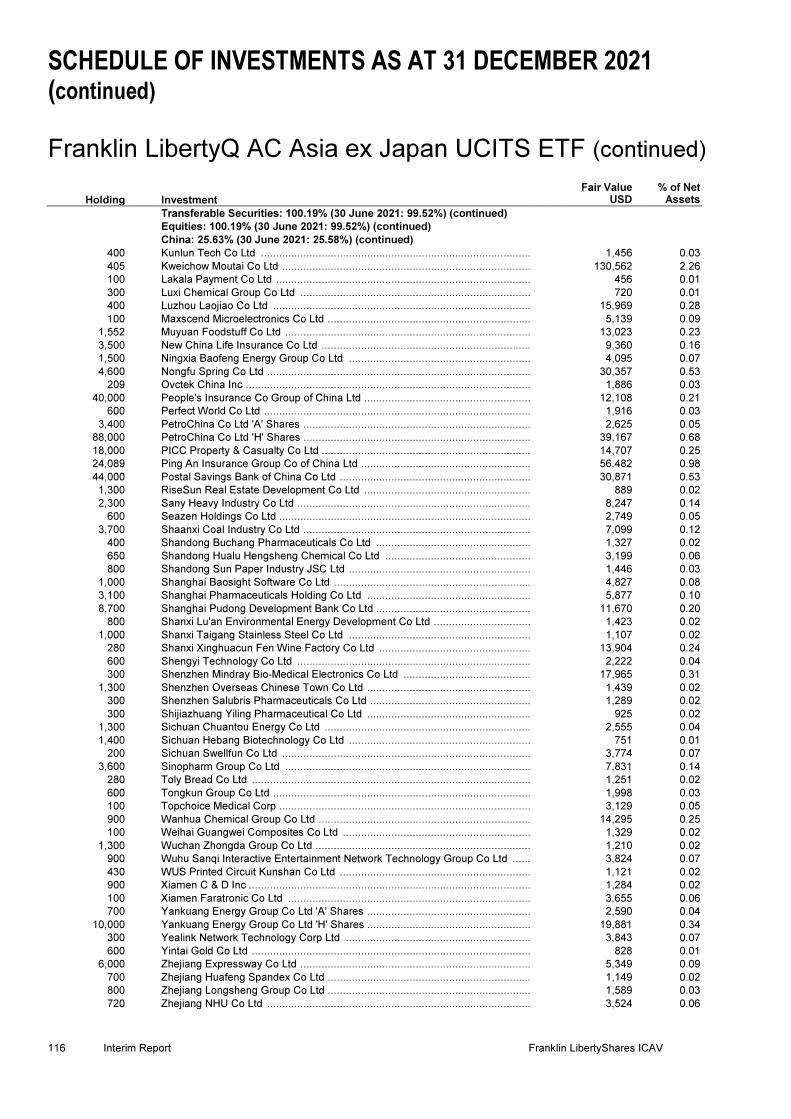
SCHEDULE OF INVESTMENTS AS AT 31 DECEMBER 2021 (continued) Franklin LibertyQ AC Asia ex Japan UCITS ETF (continued)
116 Interim Report Franklin LibertyShares ICAV
Holding Investment
Fair Value USD
% of Net Assets
Transferable Securities: 100.19% (30 June 2021: 99.52%) (continued) Equities: 100.19% (30 June 2021: 99.52%) (continued)
China: 25.63% (30 June 2021: 25.58%) (continued)
400 Kunlun Tech Co Ltd ......................................................................................... 1,456 0.03
405 Kweichow Moutai Co Ltd .................................................................................. 130,562 2.26
100 Lakala Payment Co Ltd .................................................................................... 456 0.01
300 Luxi Chemical Group Co Ltd ............................................................................ 720 0.01
400 Luzhou Laojiao Co Ltd ..................................................................................... 15,969 0.28
100 Maxscend Microelectronics Co Ltd ................................................................... 5,139 0.09
1,552 Muyuan Foodstuff Co Ltd ................................................................................. 13,023 0.23
3,500 New China Life Insurance Co Ltd ..................................................................... 9,360 0.16
1,500 Ningxia Baofeng Energy Group Co Ltd ............................................................ 4,095 0.07
4,600 Nongfu Spring Co Ltd ....................................................................................... 30,357 0.53
209 Ovctek China Inc .............................................................................................. 1,886 0.03
40,000 People's Insurance Co Group of China Ltd ....................................................... 12,108 0.21
600 Perfect World Co Ltd ........................................................................................ 1,916 0.03
3,400 PetroChina Co Ltd 'A' Shares ........................................................................... 2,625 0.05
88,000 PetroChina Co Ltd 'H' Shares ........................................................................... 39,167 0.68
18,000 PICC Property & Casualty Co Ltd ..................................................................... 14,707 0.25
24,089 Ping An Insurance Group Co of China Ltd ........................................................ 56,482 0.98
44,000 Postal Savings Bank of China Co Ltd ............................................................... 30,871 0.53
1,300 RiseSun Real Estate Development Co Ltd ....................................................... 889 0.02
2,300 Sany Heavy Industry Co Ltd ............................................................................. 8,247 0.14
600 Seazen Holdings Co Ltd ................................................................................... 2,749 0.05
3,700 Shaanxi Coal Industry Co Ltd ........................................................................... 7,099 0.12
400 Shandong Buchang Pharmaceuticals Co Ltd ................................................... 1,327 0.02
650 Shandong Hualu Hengsheng Chemical Co Ltd ................................................ 3,199 0.06
800 Shandong Sun Paper Industry JSC Ltd ............................................................ 1,446 0.03
1,000 Shanghai Baosight Software Co Ltd ................................................................. 4,827 0.08
3,100 Shanghai Pharmaceuticals Holding Co Ltd ...................................................... 5,877 0.10
8,700 Shanghai Pudong Development Bank Co Ltd ................................................... 11,670 0.20
800 Shanxi Lu'an Environmental Energy Development Co Ltd ................................ 1,423 0.02
1,000 Shanxi Taigang Stainless Steel Co Ltd ............................................................ 1,107 0.02
280 Shanxi Xinghuacun Fen Wine Factory Co Ltd .................................................. 13,904 0.24
600 Shengyi Technology Co Ltd ............................................................................. 2,222 0.04
300 Shenzhen Mindray Bio-Medical Electronics Co Ltd .......................................... 17,965 0.31
1,300 Shenzhen Overseas Chinese Town Co Ltd ...................................................... 1,439 0.02
300 Shenzhen Salubris Pharmaceuticals Co Ltd ..................................................... 1,289 0.02
300 Shijiazhuang Yiling Pharmaceutical Co Ltd ...................................................... 925 0.02
1,300 Sichuan Chuantou Energy Co Ltd .................................................................... 2,555 0.04
1,400 Sichuan Hebang Biotechnology Co Ltd ............................................................ 751 0.01
200 Sichuan Swellfun Co Ltd .................................................................................. 3,774 0.07
3,600 Sinopharm Group Co Ltd ................................................................................. 7,831 0.14
280 Toly Bread Co Ltd ............................................................................................ 1,251 0.02
600 Tongkun Group Co Ltd ..................................................................................... 1,998 0.03
100 Topchoice Medical Corp ................................................................................... 3,129 0.05
900 Wanhua Chemical Group Co Ltd ...................................................................... 14,295 0.25
100 Weihai Guangwei Composites Co Ltd .............................................................. 1,329 0.02
1,300 Wuchan Zhongda Group Co Ltd ....................................................................... 1,210 0.02
900 Wuhu Sanqi Interactive Entertainment Network Technology Group Co Ltd ...... 3,824 0.07
430 WUS Printed Circuit Kunshan Co Ltd ............................................................... 1,121 0.02
900 Xiamen C & D Inc ............................................................................................. 1,284 0.02
100 Xiamen Faratronic Co Ltd ................................................................................ 3,655 0.06
700 Yankuang Energy Group Co Ltd 'A' Shares ...................................................... 2,590 0.04
10,000 Yankuang Energy Group Co Ltd 'H' Shares ...................................................... 19,881 0.34
300 Yealink Network Technology Corp Ltd ............................................................. 3,843 0.07
600 Yintai Gold Co Ltd ............................................................................................ 828 0.01
6,000 Zhejiang Expressway Co Ltd ............................................................................ 5,349 0.09
700 Zhejiang Huafeng Spandex Co Ltd ................................................................... 1,149 0.02
800 Zhejiang Longsheng Group Co Ltd ................................................................... 1,589 0.03
720 Zhejiang NHU Co Ltd ....................................................................................... 3,524 0.06
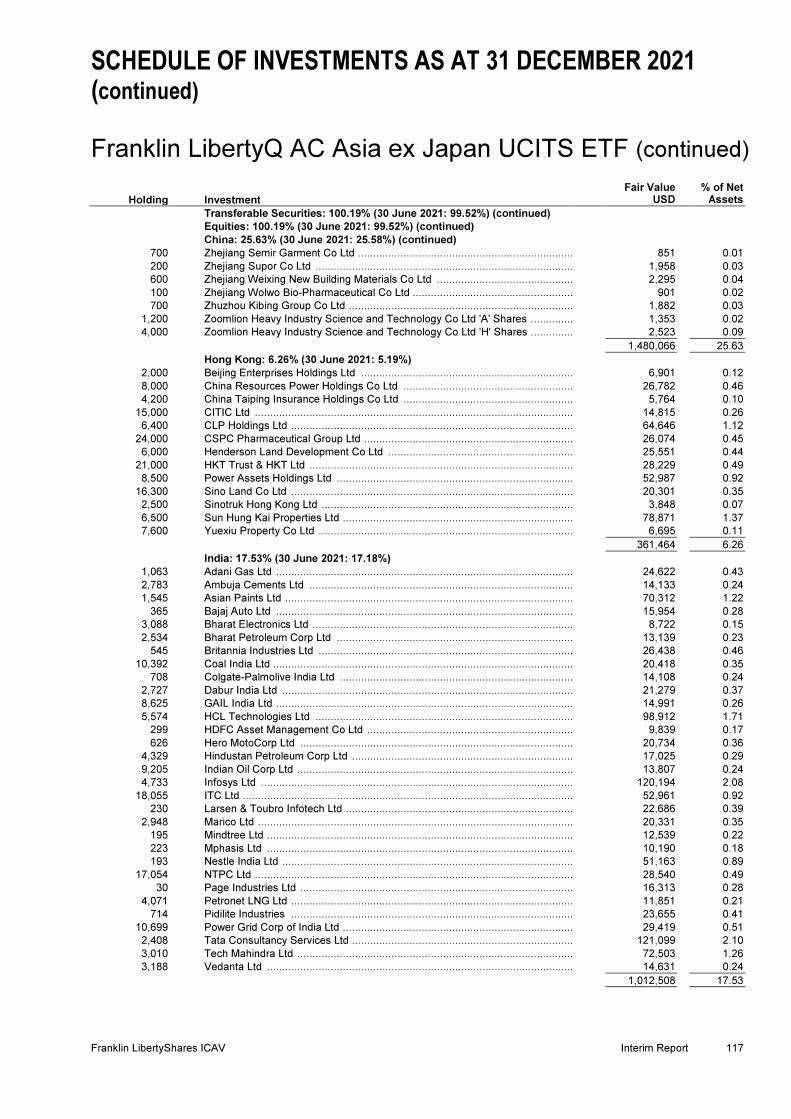
SCHEDULE OF INVESTMENTS AS AT 31 DECEMBER 2021 (continued) Franklin LibertyQ AC Asia ex Japan UCITS ETF (continued)
Franklin LibertyShares ICAV Interim Report 117
Holding Investment
Fair Value USD
% of Net Assets
Transferable Securities: 100.19% (30 June 2021: 99.52%) (continued) Equities: 100.19% (30 June 2021: 99.52%) (continued)
China: 25.63% (30 June 2021: 25.58%) (continued)
700 Zhejiang Semir Garment Co Ltd ........................................................................ 851 0.01
200 Zhejiang Supor Co Ltd ...................................................................................... 1,958 0.03
600 Zhejiang Weixing New Building Materials Co Ltd .............................................. 2,295 0.04
100 Zhejiang Wolwo Bio-Pharmaceutical Co Ltd ...................................................... 901 0.02
700 Zhuzhou Kibing Group Co Ltd ........................................................................... 1,882 0.03
1,200 Zoomlion Heavy Industry Science and Technology Co Ltd 'A' Shares ............... 1,353 0.02
4,000 Zoomlion Heavy Industry Science and Technology Co Ltd 'H' Shares ............... 2,523 0.09
1,480,066 25.63
Hong Kong: 6.26% (30 June 2021: 5.19%)
2,000 Beijing Enterprises Holdings Ltd ....................................................................... 6,901 0.12
8,000 China Resources Power Holdings Co Ltd ......................................................... 26,782 0.46
4,200 China Taiping Insurance Holdings Co Ltd ......................................................... 5,764 0.10
15,000 CITIC Ltd .......................................................................................................... 14,815 0.26
6,400 CLP Holdings Ltd .............................................................................................. 64,646 1.12
24,000 CSPC Pharmaceutical Group Ltd ...................................................................... 26,074 0.45
6,000 Henderson Land Development Co Ltd .............................................................. 25,551 0.44
21,000 HKT Trust & HKT Ltd ........................................................................................ 28,229 0.49
8,500 Power Assets Holdings Ltd ............................................................................... 52,987 0.92
16,300 Sino Land Co Ltd .............................................................................................. 20,301 0.35
2,500 Sinotruk Hong Kong Ltd .................................................................................... 3,848 0.07
6,500 Sun Hung Kai Properties Ltd ............................................................................. 78,871 1.37
7,600 Yuexiu Property Co Ltd ..................................................................................... 6,695 0.11
361,464 6.26
India: 17.53% (30 June 2021: 17.18%)
1,063 Adani Gas Ltd ................................................................................................... 24,622 0.43
2,783 Ambuja Cements Ltd ........................................................................................ 14,133 0.24
1,545 Asian Paints Ltd ................................................................................................ 70,312 1.22
365 Bajaj Auto Ltd ................................................................................................... 15,954 0.28
3,088 Bharat Electronics Ltd ....................................................................................... 8,722 0.15
2,534 Bharat Petroleum Corp Ltd ............................................................................... 13,139 0.23
545 Britannia Industries Ltd ..................................................................................... 26,438 0.46
10,392 Coal India Ltd .................................................................................................... 20,418 0.35
708 Colgate-Palmolive India Ltd .............................................................................. 14,108 0.24
2,727 Dabur India Ltd ................................................................................................ 21,279 0.37
8,625 GAIL India Ltd ................................................................................................... 14,991 0.26
5,574 HCL Technologies Ltd ...................................................................................... 98,912 1.71
299 HDFC Asset Management Co Ltd ..................................................................... 9,839 0.17
626 Hero MotoCorp Ltd ........................................................................................... 20,734 0.36
4,329 Hindustan Petroleum Corp Ltd .......................................................................... 17,025 0.29
9,205 Indian Oil Corp Ltd ............................................................................................ 13,807 0.24
4,733 Infosys Ltd ........................................................................................................ 120,194 2.08
18,055 ITC Ltd .............................................................................................................. 52,961 0.92
230 Larsen & Toubro Infotech Ltd ............................................................................ 22,686 0.39
2,948 Marico Ltd ......................................................................................................... 20,331 0.35
195 Mindtree Ltd ...................................................................................................... 12,539 0.22
223 Mphasis Ltd ...................................................................................................... 10,190 0.18
193 Nestle India Ltd ................................................................................................ 51,163 0.89
17,054 NTPC Ltd .......................................................................................................... 28,540 0.49
30 Page Industries Ltd ........................................................................................... 16,313 0.28
4,071 Petronet LNG Ltd .............................................................................................. 11,851 0.21
714 Pidilite Industries .............................................................................................. 23,655 0.41
10,699 Power Grid Corp of India Ltd ............................................................................. 29,419 0.51
2,408 Tata Consultancy Services Ltd .......................................................................... 121,099 2.10
3,010 Tech Mahindra Ltd ............................................................................................ 72,503 1.26
3,188 Vedanta Ltd ...................................................................................................... 14,631 0.24
1,012,508 17.53

SCHEDULE OF INVESTMENTS AS AT 31 DECEMBER 2021 (continued) Franklin LibertyQ AC Asia ex Japan UCITS ETF (continued)
118 Interim Report Franklin LibertyShares ICAV
Holding Investment
Fair Value USD
% of Net Assets
Transferable Securities: 100.19% (30 June 2021: 99.52%) (continued) Equities: 100.19% (30 June 2021: 99.52%) (continued)
Indonesia: 2.39% (30 June 2021: 2.13%)
72,500 Adaro Energy Tbk PT ....................................................................................... 11,445 0.20
2,800 Gudang Garam Tbk PT .................................................................................... 6,012 0.10
20,900 Indofood Sukses Makmur Tbk PT .................................................................... 9,275 0.16
289,800 Telkom Indonesia Persero Tbk PT ................................................................... 82,146 1.42
50,200 Unilever Indonesia Tbk PT ............................................................................... 14,476 0.25
9,500 United Tractors Tbk PT .................................................................................... 14,765 0.26
138,119 2.39
Malaysia: 2.43% (30 June 2021: 2.6%)
18,700 DiGi.Com Bhd .................................................................................................. 19,571 0.34
600 Fraser & Neave Holdings Bhd .......................................................................... 3,563 0.06
12,600 Hartalega Holdings Bhd ................................................................................... 17,330 0.30
7,700 Inari Amertron Bhd ........................................................................................... 7,393 0.13
5,300 MISC Bhd ........................................................................................................ 8,969 0.16
450 Nestle Malaysia Bhd ........................................................................................ 14,496 0.25
4,700 Petronas Gas Bhd ............................................................................................ 20,307 0.35
6,800 RHB Bank Bhd ................................................................................................. 8,765 0.15
12,800 Sime Darby Bhd ............................................................................................... 7,128 0.12
43,800 Top Glove Corp Bhd ........................................................................................ 27,230 0.47
5,500 Westports Holdings Bhd ................................................................................... 5,348 0.10
140,100 2.43
Philippines: 0.53% (30 June 2021: 0.49%)
160 Globe Telecom Inc ........................................................................................... 10,423 0.18
1,210 Manila Electric Co ............................................................................................ 7,005 0.12
375 PLDT Inc 13,326 0.23
30,754 0.53
Singapore: 2.59% (30 June 2021: 2.87%)
5,100 Singapore Exchange Ltd .................................................................................. 35,182 0.61
7,300 Singapore Technologies Engineering Ltd ......................................................... 20,360 0.35
42,900 Singapore Telecommunications Ltd ................................................................. 73,826 1.28
1,500 Venture Corp Ltd .............................................................................................. 20,371 0.35
149,739 2.59
South Korea: 9.20% (30 June 2021: 9.33%)
280 Coway Co Ltd .................................................................................................. 17,524 0.30
118 DB Insurance Co Ltd ........................................................................................ 5,360 0.09
9 F&F Co Ltd ...................................................................................................... 7,155 0.12
125 GS Holdings Corp ............................................................................................ 4,111 0.07
1,630 Hana Financial Group Inc ................................................................................. 57,658 1.00
1,627 Industrial Bank of Korea ................................................................................... 14,097 0.24
1,734 KB Financial Group Inc .................................................................................... 80,227 1.39
683 KT&G Corp ...................................................................................................... 45,390 0.79
104 Kumho Petrochemical Co Ltd ........................................................................... 14,523 0.25
10 LG Household & Health Care Ltd ..................................................................... 5,182 0.09
202 POSCO ............................................................................................................ 46,645 0.81
86 S-1 Corp .......................................................................................................... 5,346 0.09
1,616 Samsung Electronics Co Ltd ............................................................................ 106,442 1.84
295 Samsung Electronics Co Ltd (preferred stock) ................................................. 17,669 0.31
143 SD Biosensor Inc ............................................................................................. 6,724 0.12
202 Seegene Inc ..................................................................................................... 10,366 0.18
1,891 Shinhan Financial Group Co Ltd ...................................................................... 58,539 1.01
2,626 Woori Financial Group Inc ................................................................................ 28,056 0.50
531,014 9.20
Taiwan: 20.59% (30 June 2021: 18.24%)
11,000 Acer Inc ............................................................................................................ 12,106 0.21
1,840 Advantech Co Ltd ............................................................................................ 26,369 0.46
11,000 Asia Cement Corp ............................................................................................ 17,613 0.31
3,740 Asustek Computer Inc ...................................................................................... 50,827 0.88

SCHEDULE OF INVESTMENTS AS AT 31 DECEMBER 2021 (continued) Franklin LibertyQ AC Asia ex Japan UCITS ETF (continued)
Franklin LibertyShares ICAV Interim Report 119
Holding Investment
Fair Value USD
% of Net Assets
Transferable Securities: 100.19% (30 June 2021: 99.52%) (continued) Equities: 100.19% (30 June 2021: 99.52%) (continued)
Taiwan: 20.59% (30 June 2021: 18.24%) (continued)
32,000 Cathay Financial Holding Co Ltd ....................................................................... 72,288 1.25
56,000 China Development Financial Holding Corp ...................................................... 35,421 0.61
3,650 China Development Financial Holding Corp (preferred stock) ........................... 1,265 0.02
18,900 Chunghwa Telecom Co Ltd ............................................................................... 79,584 1.38
16,000 Compal Electronics Inc ..................................................................................... 13,995 0.24
180 eMemory Technology Inc .................................................................................. 14,248 0.25
7,000 Evergreen Marine Corp Taiwan Ltd ................................................................... 36,054 0.62
32,486 Fubon Financial Holding Co Ltd ........................................................................ 89,590 1.55
29,000 Hon Hai Precision Industry Co Ltd .................................................................... 109,011 1.89
12,000 Lite-On Technology Corp .................................................................................. 27,672 0.48
3,000 Micro-Star International Co Ltd ......................................................................... 17,403 0.30
120 momo.com Inc .................................................................................................. 7,048 0.12
940 Nien Made Enterprise Co Ltd ............................................................................ 14,015 0.24
3,590 Novatek Microelectronics Corp ......................................................................... 69,939 1.21
10,000 Quanta Computer Inc ........................................................................................ 34,229 0.59
8,000 Ruentex Development Co Ltd ........................................................................... 18,448 0.32
7,000 Synnex Technology International Corp ............................................................. 16,749 0.29
25,100 Taiwan Cement Corp ........................................................................................ 43,546 0.75
8,000 Taiwan Mobile Co Ltd ....................................................................................... 28,915 0.50
5,000 Taiwan Semiconductor Manufacturing Co Ltd ................................................... 111,143 1.92
49,500 United Microelectronics Corp ............................................................................ 116,294 2.01
5,000 Vanguard International Semi ............................................................................. 28,554 0.49
3,200 Wan Hai Lines Ltd ............................................................................................. 22,959 0.40
370 Wiwynn Corp .................................................................................................... 14,911 0.26
6,000 WPG Holdings Ltd ............................................................................................ 11,407 0.20
5,000 Yang Ming Marine Transport Corp .................................................................... 21,867 0.38
28,000 Yuanta Financial Holding Co Ltd ....................................................................... 25,607 0.46
1,189,077 20.59
Thailand: 2.84% (30 June 2021: 2.75%)
6,600 Advanced Info Service PCL .............................................................................. 45,442 0.79
2,200 Bumrungrad Hospital PCL ................................................................................ 9,286 0.16
1,100 Carabao Group PCL ......................................................................................... 3,935 0.07
10,200 Intouch Holdings PCL ....................................................................................... 24,504 0.42
13,900 Krung Thai Bank PCL ....................................................................................... 5,493 0.10
49,400 Land & Houses PCL ......................................................................................... 13,014 0.23
5,200 Osotspa PCL .................................................................................................... 5,332 0.09
3,800 Siam Cement PCL ............................................................................................ 43,910 0.76
6,200 Sri Trang Gloves Thailand PCL ......................................................................... 5,614 0.10
11,000 Thai Union Group PCL ...................................................................................... 6,421 0.12
162,951 2.84
Total Equities ................................................................................................................................ 5,784,932 100.19
Total Transferable Securities ................................................................................................ 5,784,932 100.19
Fair Value USD
% of Net Assets
Portfolio of Investments ................................................................................................ 5,784,932 100.19
Other Net Liabilities ................................................................................................ (10,690) (0.19)
Net Assets ................................................................................................................................ 5,774,242 100.00

SCHEDULE OF INVESTMENTS AS AT 31 DECEMBER 2021 (continued) Franklin LibertyQ AC Asia ex Japan UCITS ETF (continued)
120 Interim Report Franklin LibertyShares ICAV
Analysis of Total Assets
% of Total Assets
Transferable securities admitted to an official stock exchange listing ................................ 99.47
Other Current Assets ................................................................................................ 0.53
Total Assets ................................................................................................................................ 100.00
Country classifications are based upon country of incorporation and/or country of domicile.

SCHEDULE OF INVESTMENTS AS AT 31 DECEMBER 2021 Franklin LibertyQ Emerging Markets UCITS ETF
Franklin LibertyShares ICAV Interim Report 121
Holding Investment Fair Value
USD % of Net
Assets
Transferable Securities: 100.09% (30 June 2021: 98.71%) Equities: 100.09% (30 June 2021: 98.71%) Bermuda: 0.23% (30 June 2021: 0.62%)
56,000 Nine Dragons Paper Holdings Ltd ..................................................................... 60,121 0.15
28,000 Shenzhen International Holdings Ltd ................................................................ 29,091 0.08
89,212 0.23
Brazil: 6.23% (30 June 2021: 3.68%)
123,200 Ambev SA ADR ................................................................................................ 344,960 0.87
89,600 B3 SA - Brasil Bolsa Balcao .............................................................................. 179,200 0.45
22,400 Banco Bradesco SA .......................................................................................... 65,109 0.16
70,000 Banco Bradesco SA (preferred stock) ............................................................... 241,418 0.61
14,000 Banco do Brasil SA ........................................................................................... 72,513 0.18
29,400 BB Seguridade Participacoes SA ...................................................................... 109,524 0.28
25,200 Cia Energetica de Minas Gerais ........................................................................ 59,313 0.15
5,600 Engie Brasil Energia SA .................................................................................... 38,617 0.10
16,800 Gerdau SA ........................................................................................................ 82,220 0.21
35,000 Petroleo Brasileiro SA ....................................................................................... 192,908 0.49
46,200 Petroleo Brasileiro SA (preferred stock) ............................................................ 235,977 0.60
18,200 Telefonica Brasil SA .......................................................................................... 157,461 0.40
26,600 TIM SA ............................................................................................................. 62,799 0.16
2,791 Vale SA ............................................................................................................. 39,064 0.10
35,000 Vale SA ADR .................................................................................................... 490,700 1.24
23,800 Vibra Energia SA .............................................................................................. 91,441 0.23
2,463,224 6.23
Cayman Islands: 4.20% (30 June 2021: 7.12%)
2,114 360 DigiTech Inc ADR ...................................................................................... 48,474 0.12
28,000 Agile Group Holdings Ltd .................................................................................. 15,192 0.04
52,000 China Conch Venture Holdings Ltd ................................................................... 254,121 0.64
98,000 China Feihe Ltd ................................................................................................ 131,483 0.33
70,000 China Hongqiao Group Ltd ............................................................................... 73,894 0.19
56,000 China Medical System Holdings Ltd .................................................................. 93,521 0.24
40,000 China Overseas Property Holdings Ltd ............................................................. 42,430 0.11
112,000 China Resources Cement Holdings Ltd ............................................................. 84,615 0.21
70,000 Dali Foods Group Co Ltd .................................................................................. 36,633 0.09
14,000 Haitian International Holdings Ltd ..................................................................... 38,877 0.10
18,000 Hengan International Group Co Ltd ................................................................... 92,698 0.23
19,000 Kingboard Holdings Ltd ..................................................................................... 92,486 0.23
28,000 Kingboard Laminates Holdings Ltd .................................................................... 47,623 0.12
42,000 Lee & Man Paper Manufacturing Ltd ................................................................ 29,198 0.07
56,000 Seazen Group Ltd ............................................................................................. 37,854 0.10
2,666 Seazen Group Ltd (rights) ................................................................................. 0 0.00
21,000 Shimao Group Holdings Ltd .............................................................................. 13,737 0.03
32,000 Smoore International Holdings Ltd .................................................................... 163,154 0.41
42,000 Sunac China Holdings Ltd ................................................................................. 63,461 0.16
28,000 Uni-President China Holdings Ltd ..................................................................... 27,151 0.07
11,116 Vipshop Holdings Ltd ADR ................................................................................ 93,374 0.24
126,000 Want Want China Holdings Ltd ......................................................................... 115,716 0.29
14,000 Yihai International Holding Ltd .......................................................................... 64,737 0.18
1,660,429 4.20
Chile: 0.26% (30 June 2021: 0.66%)
19,712 Cencosud SA .................................................................................................... 32,969 0.08
4,550 Cia Cervecerias Unidas SA ............................................................................... 37,009 0.09
886,788 Enel Chile SA .................................................................................................... 31,017 0.09
100,995 0.26
China: 17.96% (30 June 2021: 18.65%)
137,200 Agricultural Bank of China Ltd 'A' Shares .......................................................... 63,432 0.16
966,000 Agricultural Bank of China Ltd 'H' Shares .......................................................... 332,065 0.84
14,000 A-Living Smart City Services Co Ltd ................................................................ 23,883 0.06
9,800 Anhui Conch Cement Co Ltd 'A' Shares ............................................................ 62,107 0.16

SCHEDULE OF INVESTMENTS AS AT 31 DECEMBER 2021 (continued) Franklin LibertyQ Emerging Markets UCITS ETF (continued)
122 Interim Report Franklin LibertyShares ICAV
Holding Investment Fair Value
USD % of Net
Assets
Transferable Securities: 100.09% (30 June 2021: 98.71%) (continued) Equities: 100.09% (30 June 2021: 98.71%) (continued)
China: 17.96% (30 June 2021: 18.65%) (continued)
53,500 Anhui Conch Cement Co Ltd 'H' Shares ........................................................... 267,284 0.68
1,400 Anhui Gujing Distillery Co Ltd ........................................................................... 19,933 0.05
1,400 Apeloa Pharmaceutical Co Ltd ......................................................................... 7,725 0.02
40,600 Bank of Beijing Co Ltd ...................................................................................... 28,348 0.07
2,800 Bank of Changsha Co Ltd ................................................................................ 3,439 0.01
5,600 Bank of Chengdu Co Ltd .................................................................................. 10,568 0.03
22,400 Bank of China Ltd 'A' Shares ............................................................................ 10,744 0.03
1,064,000 Bank of China Ltd 'H' Shares ............................................................................ 383,495 0.97
82,600 Bank of Communications Co Ltd 'A' Shares ..................................................... 59,881 0.15
336,000 Bank of Communications Co Ltd 'H' Shares ..................................................... 202,989 0.51
19,600 Bank of Jiangsu Co Ltd .................................................................................... 17,969 0.05
15,400 Bank of Nanjing Co Ltd .................................................................................... 21,699 0.05
12,600 Bank of Shanghai Co Ltd ................................................................................. 14,128 0.04
36,400 Baoshan Iron & Steel Co Ltd ............................................................................ 40,985 0.10
2,800 By-health Co Ltd .............................................................................................. 11,871 0.03
294,000 China Cinda Asset Management Co Ltd ........................................................... 53,548 0.14
350,000 China CITIC Bank Corp Ltd .............................................................................. 151,739 0.38
28,000 China Coal Energy Co Ltd ................................................................................ 16,162 0.04
56,000 China Communications Services Corp Ltd ....................................................... 27,295 0.07
4,200 China Construction Bank Corp 'A' Shares ........................................................ 3,870 0.01
574,000 China Construction Bank Corp 'H' Shares ........................................................ 397,573 1.01
77,000 China Everbright Bank Co Ltd 'A' Shares ......................................................... 40,201 0.10
126,000 China Everbright Bank Co Ltd 'H' Shares ......................................................... 44,606 0.11
112,000 China Life Insurance Co Ltd ............................................................................. 185,606 0.47
68,600 China Minsheng Banking Corp Ltd 'A' Shares .................................................. 42,072 0.11
210,000 China Minsheng Banking Corp Ltd 'H' Shares .................................................. 80,269 0.20
120,000 China National Building Material Co Ltd ........................................................... 147,147 0.37
9,800 China Pacific Insurance Group Co Ltd 'A' Shares ............................................. 41,795 0.11
72,800 China Pacific Insurance Group Co Ltd 'H' Shares ............................................. 197,494 0.50
29,400 China Petroleum & Chemical Corp 'A' Shares .................................................. 19,557 0.05
616,000 China Petroleum & Chemical Corp 'H' Shares .................................................. 286,813 0.73
112,000 China Railway Group Ltd ................................................................................. 59,187 0.15
14,000 China Shenhua Energy Co Ltd ......................................................................... 49,580 0.13
39,200 China State Construction Engineering Corp Ltd ............................................... 30,822 0.08
37,800 China Yangtze Power Co Ltd ........................................................................... 134,935 0.34
1,000 Chongqing Brewery Co Ltd .............................................................................. 23,796 0.06
11,200 Chongqing Rural Commercial Bank Co Ltd ...................................................... 6,781 0.02
12,600 COSCO SHIPPING Holdings Co Ltd 'A' Shares ............................................... 37,033 0.09
56,000 COSCO SHIPPING Holdings Co Ltd 'H' Shares ............................................... 108,605 0.27
2,800 Da An Gene Co Ltd of Sun Yat-Sen University ................................................. 8,833 0.02
84,000 Dongfeng Motor Group Co Ltd ......................................................................... 69,818 0.18
25,200 Focus Media Information Technology Co Ltd ................................................... 32,456 0.08
5,600 Foshan Haitian Flavouring & Food Co Ltd ........................................................ 92,564 0.23
2,800 Fujian Sunner Development Co Ltd .................................................................. 10,642 0.03
200 G-bits Network Technology Xiamen Co Ltd ...................................................... 13,268 0.03
11,285 Greenland Holdings Corp Ltd ........................................................................... 7,702 0.02
44,800 Guangzhou R&F Properties Co Ltd .................................................................. 16,664 0.04
1,400 Guangzhou Shiyuan Electronic Technology Co Ltd .......................................... 17,921 0.05
44,800 Haitong Securities Co Ltd ................................................................................. 39,707 0.10
1,400 Hangzhou Robam Appliances Co Ltd ............................................................... 7,930 0.02
2,800 Heilongjiang Agriculture Co Ltd ........................................................................ 6,411 0.02
7,000 Henan Shuanghui Investment & Development Co Ltd ...................................... 34,730 0.09
1,400 Hithink RoyalFlush Information Network Co Ltd ............................................... 31,831 0.08
22,400 Huaxia Bank Co Ltd ......................................................................................... 19,726 0.05
2,800 Huaxin Cement Co Ltd ..................................................................................... 8,498 0.02
14,000 Hunan Valin Steel Co Ltd ................................................................................. 11,250 0.03
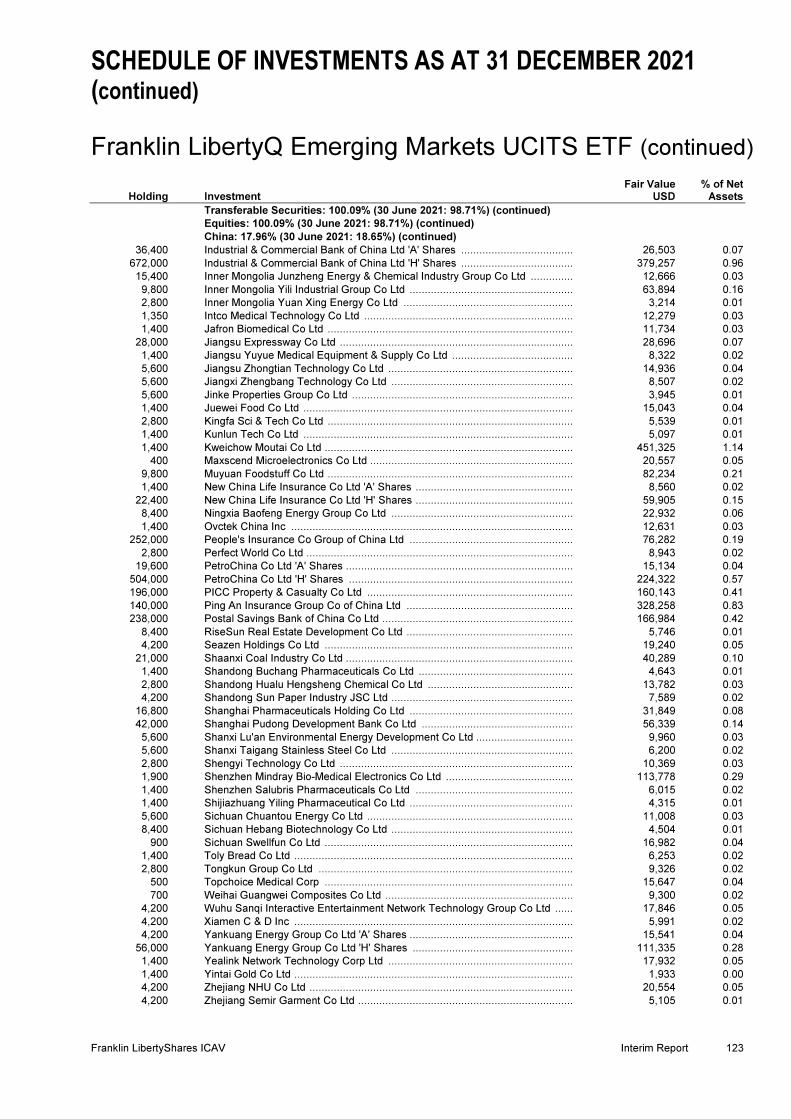
SCHEDULE OF INVESTMENTS AS AT 31 DECEMBER 2021 (continued) Franklin LibertyQ Emerging Markets UCITS ETF (continued)
Franklin LibertyShares ICAV Interim Report 123
Holding Investment Fair Value
USD % of Net
Assets
Transferable Securities: 100.09% (30 June 2021: 98.71%) (continued) Equities: 100.09% (30 June 2021: 98.71%) (continued)
China: 17.96% (30 June 2021: 18.65%) (continued)
36,400 Industrial & Commercial Bank of China Ltd 'A' Shares ...................................... 26,503 0.07
672,000 Industrial & Commercial Bank of China Ltd 'H' Shares ...................................... 379,257 0.96
15,400 Inner Mongolia Junzheng Energy & Chemical Industry Group Co Ltd ............... 12,666 0.03
9,800 Inner Mongolia Yili Industrial Group Co Ltd ....................................................... 63,894 0.16
2,800 Inner Mongolia Yuan Xing Energy Co Ltd ......................................................... 3,214 0.01
1,350 Intco Medical Technology Co Ltd ...................................................................... 12,279 0.03
1,400 Jafron Biomedical Co Ltd .................................................................................. 11,734 0.03
28,000 Jiangsu Expressway Co Ltd .............................................................................. 28,696 0.07
1,400 Jiangsu Yuyue Medical Equipment & Supply Co Ltd ......................................... 8,322 0.02
5,600 Jiangsu Zhongtian Technology Co Ltd .............................................................. 14,936 0.04
5,600 Jiangxi Zhengbang Technology Co Ltd ............................................................. 8,507 0.02
5,600 Jinke Properties Group Co Ltd .......................................................................... 3,945 0.01
1,400 Juewei Food Co Ltd .......................................................................................... 15,043 0.04
2,800 Kingfa Sci & Tech Co Ltd .................................................................................. 5,539 0.01
1,400 Kunlun Tech Co Ltd .......................................................................................... 5,097 0.01
1,400 Kweichow Moutai Co Ltd ................................................................................... 451,325 1.14
400 Maxscend Microelectronics Co Ltd .................................................................... 20,557 0.05
9,800 Muyuan Foodstuff Co Ltd .................................................................................. 82,234 0.21
1,400 New China Life Insurance Co Ltd 'A' Shares ..................................................... 8,560 0.02
22,400 New China Life Insurance Co Ltd 'H' Shares ..................................................... 59,905 0.15
8,400 Ningxia Baofeng Energy Group Co Ltd ............................................................. 22,932 0.06
1,400 Ovctek China Inc .............................................................................................. 12,631 0.03
252,000 People's Insurance Co Group of China Ltd ....................................................... 76,282 0.19
2,800 Perfect World Co Ltd ......................................................................................... 8,943 0.02
19,600 PetroChina Co Ltd 'A' Shares ............................................................................ 15,134 0.04
504,000 PetroChina Co Ltd 'H' Shares ........................................................................... 224,322 0.57
196,000 PICC Property & Casualty Co Ltd ..................................................................... 160,143 0.41
140,000 Ping An Insurance Group Co of China Ltd ........................................................ 328,258 0.83
238,000 Postal Savings Bank of China Co Ltd ................................................................ 166,984 0.42
8,400 RiseSun Real Estate Development Co Ltd ........................................................ 5,746 0.01
4,200 Seazen Holdings Co Ltd ................................................................................... 19,240 0.05
21,000 Shaanxi Coal Industry Co Ltd ............................................................................ 40,289 0.10
1,400 Shandong Buchang Pharmaceuticals Co Ltd .................................................... 4,643 0.01
2,800 Shandong Hualu Hengsheng Chemical Co Ltd ................................................. 13,782 0.03
4,200 Shandong Sun Paper Industry JSC Ltd ............................................................. 7,589 0.02
16,800 Shanghai Pharmaceuticals Holding Co Ltd ....................................................... 31,849 0.08
42,000 Shanghai Pudong Development Bank Co Ltd ................................................... 56,339 0.14
5,600 Shanxi Lu'an Environmental Energy Development Co Ltd ................................ 9,960 0.03
5,600 Shanxi Taigang Stainless Steel Co Ltd ............................................................. 6,200 0.02
2,800 Shengyi Technology Co Ltd .............................................................................. 10,369 0.03
1,900 Shenzhen Mindray Bio-Medical Electronics Co Ltd ........................................... 113,778 0.29
1,400 Shenzhen Salubris Pharmaceuticals Co Ltd ..................................................... 6,015 0.02
1,400 Shijiazhuang Yiling Pharmaceutical Co Ltd ....................................................... 4,315 0.01
5,600 Sichuan Chuantou Energy Co Ltd ..................................................................... 11,008 0.03
8,400 Sichuan Hebang Biotechnology Co Ltd ............................................................. 4,504 0.01
900 Sichuan Swellfun Co Ltd ................................................................................... 16,982 0.04
1,400 Toly Bread Co Ltd ............................................................................................. 6,253 0.02
2,800 Tongkun Group Co Ltd ..................................................................................... 9,326 0.02
500 Topchoice Medical Corp ................................................................................... 15,647 0.04
700 Weihai Guangwei Composites Co Ltd ............................................................... 9,300 0.02
4,200 Wuhu Sanqi Interactive Entertainment Network Technology Group Co Ltd ....... 17,846 0.05
4,200 Xiamen C & D Inc ............................................................................................. 5,991 0.02
4,200 Yankuang Energy Group Co Ltd 'A' Shares ....................................................... 15,541 0.04
56,000 Yankuang Energy Group Co Ltd 'H' Shares ...................................................... 111,335 0.28
1,400 Yealink Network Technology Corp Ltd .............................................................. 17,932 0.05
1,400 Yintai Gold Co Ltd ............................................................................................. 1,933 0.00
4,200 Zhejiang NHU Co Ltd ........................................................................................ 20,554 0.05
4,200 Zhejiang Semir Garment Co Ltd ........................................................................ 5,105 0.01
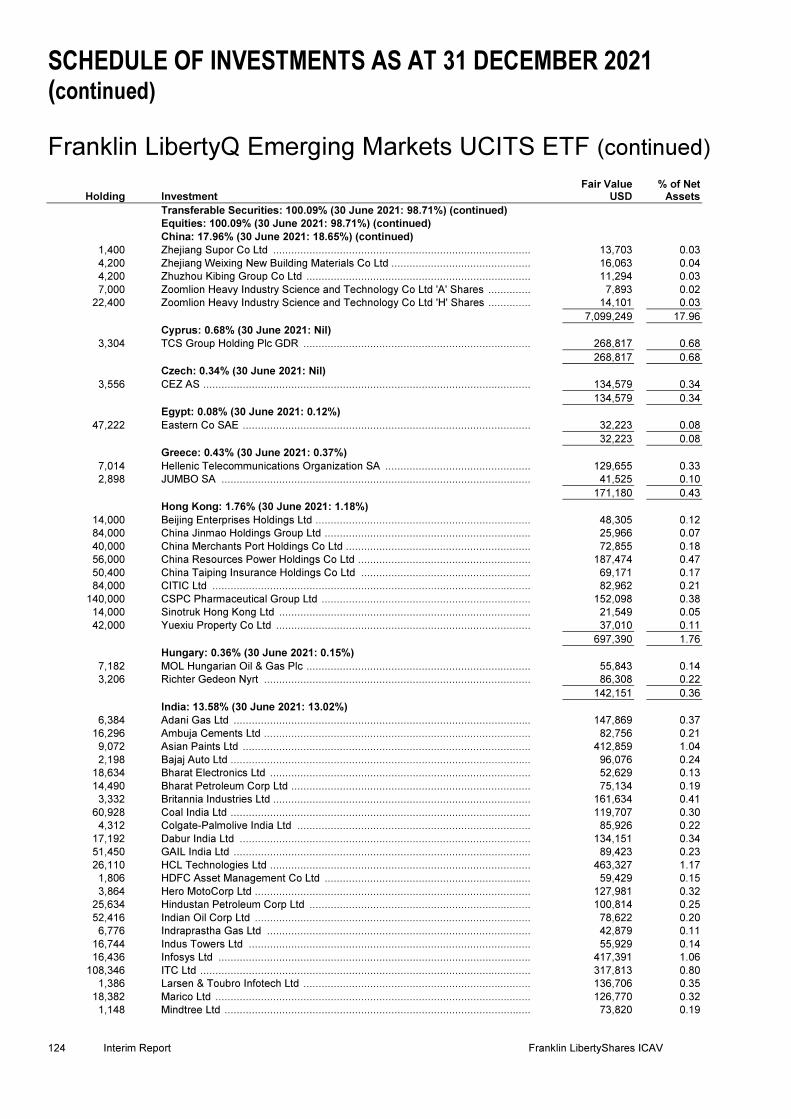
SCHEDULE OF INVESTMENTS AS AT 31 DECEMBER 2021 (continued) Franklin LibertyQ Emerging Markets UCITS ETF (continued)
124 Interim Report Franklin LibertyShares ICAV
Holding Investment Fair Value
USD % of Net
Assets
Transferable Securities: 100.09% (30 June 2021: 98.71%) (continued) Equities: 100.09% (30 June 2021: 98.71%) (continued)
China: 17.96% (30 June 2021: 18.65%) (continued)
1,400 Zhejiang Supor Co Ltd ..................................................................................... 13,703 0.03
4,200 Zhejiang Weixing New Building Materials Co Ltd .............................................. 16,063 0.04
4,200 Zhuzhou Kibing Group Co Ltd .......................................................................... 11,294 0.03
7,000 Zoomlion Heavy Industry Science and Technology Co Ltd 'A' Shares .............. 7,893 0.02
22,400 Zoomlion Heavy Industry Science and Technology Co Ltd 'H' Shares .............. 14,101 0.03
7,099,249 17.96
Cyprus: 0.68% (30 June 2021: Nil)
3,304 TCS Group Holding Plc GDR ........................................................................... 268,817 0.68
268,817 0.68
Czech: 0.34% (30 June 2021: Nil)
3,556 CEZ AS ............................................................................................................ 134,579 0.34
134,579 0.34
Egypt: 0.08% (30 June 2021: 0.12%)
47,222 Eastern Co SAE ............................................................................................... 32,223 0.08
32,223 0.08
Greece: 0.43% (30 June 2021: 0.37%)
7,014 Hellenic Telecommunications Organization SA ................................................ 129,655 0.33
2,898 JUMBO SA ...................................................................................................... 41,525 0.10
171,180 0.43
Hong Kong: 1.76% (30 June 2021: 1.18%)
14,000 Beijing Enterprises Holdings Ltd ....................................................................... 48,305 0.12
84,000 China Jinmao Holdings Group Ltd .................................................................... 25,966 0.07
40,000 China Merchants Port Holdings Co Ltd ............................................................. 72,855 0.18
56,000 China Resources Power Holdings Co Ltd ......................................................... 187,474 0.47
50,400 China Taiping Insurance Holdings Co Ltd ........................................................ 69,171 0.17
84,000 CITIC Ltd ......................................................................................................... 82,962 0.21
140,000 CSPC Pharmaceutical Group Ltd ..................................................................... 152,098 0.38
14,000 Sinotruk Hong Kong Ltd ................................................................................... 21,549 0.05
42,000 Yuexiu Property Co Ltd .................................................................................... 37,010 0.11
697,390 1.76
Hungary: 0.36% (30 June 2021: 0.15%)
7,182 MOL Hungarian Oil & Gas Plc .......................................................................... 55,843 0.14
3,206 Richter Gedeon Nyrt ........................................................................................ 86,308 0.22
142,151 0.36
India: 13.58% (30 June 2021: 13.02%)
6,384 Adani Gas Ltd .................................................................................................. 147,869 0.37
16,296 Ambuja Cements Ltd ........................................................................................ 82,756 0.21
9,072 Asian Paints Ltd ............................................................................................... 412,859 1.04
2,198 Bajaj Auto Ltd ................................................................................................... 96,076 0.24
18,634 Bharat Electronics Ltd ...................................................................................... 52,629 0.13
14,490 Bharat Petroleum Corp Ltd ............................................................................... 75,134 0.19
3,332 Britannia Industries Ltd ..................................................................................... 161,634 0.41
60,928 Coal India Ltd ................................................................................................... 119,707 0.30
4,312 Colgate-Palmolive India Ltd ............................................................................. 85,926 0.22
17,192 Dabur India Ltd ................................................................................................ 134,151 0.34
51,450 GAIL India Ltd .................................................................................................. 89,423 0.23
26,110 HCL Technologies Ltd ...................................................................................... 463,327 1.17
1,806 HDFC Asset Management Co Ltd .................................................................... 59,429 0.15
3,864 Hero MotoCorp Ltd ........................................................................................... 127,981 0.32
25,634 Hindustan Petroleum Corp Ltd ......................................................................... 100,814 0.25
52,416 Indian Oil Corp Ltd ........................................................................................... 78,622 0.20
6,776 Indraprastha Gas Ltd ....................................................................................... 42,879 0.11
16,744 Indus Towers Ltd ............................................................................................. 55,929 0.14
16,436 Infosys Ltd ....................................................................................................... 417,391 1.06
108,346 ITC Ltd ............................................................................................................. 317,813 0.80
1,386 Larsen & Toubro Infotech Ltd ........................................................................... 136,706 0.35
18,382 Marico Ltd ........................................................................................................ 126,770 0.32
1,148 Mindtree Ltd ..................................................................................................... 73,820 0.19

SCHEDULE OF INVESTMENTS AS AT 31 DECEMBER 2021 (continued) Franklin LibertyQ Emerging Markets UCITS ETF (continued)
Franklin LibertyShares ICAV Interim Report 125
Holding Investment Fair Value
USD % of Net
Assets
Transferable Securities: 100.09% (30 June 2021: 98.71%) (continued) Equities: 100.09% (30 June 2021: 98.71%) (continued)
India: 13.58% (30 June 2021: 13.02%) (continued)
1,274 Mphasis Ltd ...................................................................................................... 58,214 0.15
1,190 Nestle India Ltd ................................................................................................ 315,458 0.80
182 Page Industries Ltd ........................................................................................... 98,966 0.25
24,234 Petronet LNG Ltd .............................................................................................. 70,548 0.18
4,326 Pidilite Industries Ltd ......................................................................................... 143,324 0.36
8,372 Tata Consultancy Services Ltd .......................................................................... 421,029 1.06
18,256 Tech Mahindra Ltd ............................................................................................ 439,739 1.11
18,102 Vedanta Ltd ...................................................................................................... 83,088 0.21
28,784 Wipro Ltd .......................................................................................................... 276,998 0.72
5,367,009 13.58
Indonesia: 1.93% (30 June 2021: 1.87%)
428,400 Adaro Energy Tbk PT ....................................................................................... 67,630 0.17
16,800 Gudang Garam Tbk PT ..................................................................................... 36,069 0.09
112,000 Indofood Sukses Makmur Tbk PT ..................................................................... 49,704 0.13
1,534,400 Telkom Indonesia Persero Tbk PT .................................................................... 434,940 1.10
302,400 Unilever Indonesia Tbk PT ................................................................................ 87,203 0.22
57,400 United Tractors Tbk PT ..................................................................................... 89,206 0.22
764,752 1.93
Jersey: 0.60% (30 June 2021: 0.69%)
13,552 Polymetal International Plc ................................................................................ 237,140 0.60
237,140 0.60
Kuwait: 0.28% (30 June 2021: 0.26%)
56,504 Mobile Telecommunications Co KSCP .............................................................. 111,232 0.28
111,232 0.28
Malaysia: 1.90% (30 June 2021: 2.13%)
112,000 DiGi.Com Bhd ................................................................................................... 117,216 0.30
78,400 Hartalega Holdings Bhd .................................................................................... 107,833 0.27
44,800 Inari Amertron Bhd ............................................................................................ 43,015 0.11
30,800 MISC Bhd ......................................................................................................... 52,122 0.13
2,800 Nestle Malaysia Bhd ......................................................................................... 90,197 0.23
26,600 Petronas Gas Bhd ............................................................................................. 114,930 0.29
67,200 Sime Darby Bhd ................................................................................................ 37,423 0.09
250,600 Top Glove Corp Bhd ......................................................................................... 155,798 0.39
33,600 Westports Holdings Bhd .................................................................................... 32,664 0.09
751,198 1.90
Mexico: 2.86% (30 June 2021: 2.55%)
6,692 Arca Continental SAB de CV ............................................................................. 42,680 0.11
8,862 Coca-Cola Femsa SAB de CV .......................................................................... 48,370 0.12
86,478 Fibra Uno Administracion SA de CV ................................................................ 91,443 0.23
94,038 Grupo Mexico SAB de CV ................................................................................. 410,293 1.04
53,802 Kimberly-Clark de Mexico SAB de CV .............................................................. 81,525 0.21
10,416 Megacable Holdings SAB de CV ....................................................................... 35,506 0.09
112,770 Wal-Mart de Mexico SAB de CV ....................................................................... 419,284 1.06
1,129,101 2.86
Philippines: 0.46% (30 June 2021: 0.45%)
980 Globe Telecom Inc ............................................................................................ 63,844 0.16
6,860 Manila Electric Co ............................................................................................. 39,713 0.10
2,170 PLDT Inc 77,110 0.20
180,667 0.46
Poland: 0.98% (30 June 2021: 0.57%)
1,218 CD Projekt SA ................................................................................................... 58,295 0.15
8,372 Polski Koncern Naftowy ORLEN SA ................................................................ 154,420 0.39
51,422 Polskie Gornictwo Naftowe i Gazownictwo SA .................................................. 80,379 0.20
10,584 Powszechny Zaklad Ubezpieczen SA ............................................................... 92,830 0.24
385,924 0.98

SCHEDULE OF INVESTMENTS AS AT 31 DECEMBER 2021 (continued) Franklin LibertyQ Emerging Markets UCITS ETF (continued)
126 Interim Report Franklin LibertyShares ICAV
Holding Investment Fair Value
USD % of Net
Assets
Transferable Securities: 100.09% (30 June 2021: 98.71%) (continued) Equities: 100.09% (30 June 2021: 98.71%) (continued)
Qatar: 1.23% (30 June 2021: 1.22%)
52,360 Industries Qatar QSC ....................................................................................... 222,757 0.56
100,604 Masraf Al Rayan QSC ...................................................................................... 128,207 0.32
14,322 Qatar Electricity & Water Co QSC .................................................................... 65,297 0.17
13,720 Qatar Fuel QSC ............................................................................................... 68,882 0.18
485,143 1.23
Russia: 8.70% (30 June 2021: 9.43%)
102,144 Alrosa PJSC ..................................................................................................... 167,230 0.42
83,636 Gazprom PJSC ................................................................................................ 382,776 0.97
1,511,510 Inter RAO UES PJSC ....................................................................................... 86,099 0.22
4,242 LUKOIL PJSC .................................................................................................. 371,568 0.94
1,302 MMC Norilsk Nickel PJSC ................................................................................ 396,261 1.00
17,710 Mobile TeleSystems PJSC ADR ...................................................................... 140,795 0.36
39,606 Moscow Exchange MICEX-RTS PJSC ............................................................. 80,885 0.20
65,240 Novolipetsk Steel PJSC ................................................................................... 189,302 0.48
6,034 PhosAgro PJSC GDR ...................................................................................... 130,214 0.33
1,428 Polyus PJSC .................................................................................................... 248,927 0.63
37,254 Rosneft Oil Co PJSC ........................................................................................ 297,958 0.75
11,312 Severstal PAO ................................................................................................. 242,087 0.61
246,834 Surgutneftegas PJSC ....................................................................................... 130,910 0.33
303,786 Surgutneftegas PJSC (preferred stock) ............................................................ 155,849 0.39
55,916 Tatneft PJSC .................................................................................................... 373,115 0.94
44,856 United Co RUSAL International PJSC .............................................................. 44,252 0.13
3,438,228 8.70
Saudi Arabia: 4.09% (30 June 2021: 4.1%)
1,218 Abdullah Al Othaim Markets Co ....................................................................... 35,102 0.09
3,738 Advanced Petrochemical Co ............................................................................ 70,092 0.18
10,150 Al Rajhi Bank ................................................................................................... 383,356 0.97
1,708 Bupa Arabia for Cooperative Insurance Co ...................................................... 59,778 0.15
1,176 Dr Sulaiman Al Habib Medical Services Group Co ........................................... 50,556 0.13
2,380 Jarir Marketing Co ............................................................................................ 124,756 0.32
7,140 SABIC Agri-Nutrients Co .................................................................................. 335,852 0.85
2,548 Saudi Cement Co ............................................................................................. 37,191 0.09
12,838 Saudi Telecom Co ............................................................................................ 384,347 0.97
7,350 Yanbu National Petrochemical Co .................................................................... 134,494 0.34
1,615,524 4.09
South Africa: 5.24% (30 June 2021: 4.92%)
4,298 African Rainbow Minerals Ltd ........................................................................... 62,267 0.16
1,386 Anglo American Platinum Ltd ........................................................................... 157,772 0.40
13,440 AngloGold Ashanti Ltd ..................................................................................... 276,800 0.70
7,112 Clicks Group Ltd .............................................................................................. 140,605 0.36
10,472 Exxaro Resources Ltd ...................................................................................... 100,304 0.25
20,538 Gold Fields Ltd ................................................................................................. 224,091 0.57
8,162 Harmony Gold Mining Co Ltd ........................................................................... 34,059 0.09
28,924 Impala Platinum Holdings Ltd ........................................................................... 407,763 1.03
3,416 Kumba Iron Ore Ltd .......................................................................................... 98,475 0.25
8,274 Mr Price Group Ltd ........................................................................................... 103,425 0.26
69,594 Sibanye Stillwater Ltd ....................................................................................... 214,102 0.54
5,096 Tiger Brands Ltd .............................................................................................. 57,793 0.15
22,820 Vodacom Group Ltd ......................................................................................... 192,484 0.48
2,069,940 5.24
South Korea: 7.46% (30 June 2021: 7.71%)
1,694 Coway Co Ltd .................................................................................................. 106,022 0.27
56 F&F Co Ltd ...................................................................................................... 44,517 0.11
700 GS Holdings Corp ............................................................................................ 23,024 0.06
9,744 Hana Financial Group Inc ................................................................................. 344,677 0.87
9,394 Industrial Bank of Korea ................................................................................... 81,395 0.21
8,344 KB Financial Group Inc .................................................................................... 386,053 0.98
224 Korea Zinc Co Ltd ............................................................................................ 96,289 0.24

SCHEDULE OF INVESTMENTS AS AT 31 DECEMBER 2021 (continued) Franklin LibertyQ Emerging Markets UCITS ETF (continued)
Franklin LibertyShares ICAV Interim Report 127
Holding Investment Fair Value
USD % of Net
Assets
Transferable Securities: 100.09% (30 June 2021: 98.71%) (continued) Equities: 100.09% (30 June 2021: 98.71%) (continued)
South Korea: 7.46% (30 June 2021: 7.71%) (continued)
4,004 KT&G Corp ....................................................................................................... 266,091 0.67
630 Kumho Petrochemical Co Ltd ............................................................................ 87,975 0.22
56 LG Household & Health Care Ltd ...................................................................... 29,019 0.07
840 Pearl Abyss Corp .............................................................................................. 97,726 0.25
1,134 POSCO ............................................................................................................. 261,857 0.66
560 S-1 Corp ........................................................................................................... 34,813 0.09
5,684 Samsung Electronics Co Ltd ............................................................................. 374,391 0.95
1,022 Samsung Electronics Co Ltd (preferred stock) .................................................. 61,213 0.15
770 SD Biosensor Inc .............................................................................................. 36,209 0.09
1,260 Seegene Inc ..................................................................................................... 64,656 0.16
12,516 Shinhan Financial Group Co Ltd ....................................................................... 387,456 0.98
15,484 Woori Financial Group Inc ................................................................................. 165,424 0.43
2,948,807 7.46
Taiwan: 14.04% (30 June 2021: 13.1%)
70,000 Acer Inc ............................................................................................................ 77,041 0.19
10,550 Advantech Co Ltd ............................................................................................. 151,194 0.38
70,000 Asia Cement Corp ............................................................................................. 112,083 0.28
22,000 Asustek Computer Inc ....................................................................................... 298,984 0.76
112,000 AU Optronics Corp ............................................................................................ 92,703 0.23
119,000 Cathay Financial Holding Co Ltd ....................................................................... 268,822 0.68
95,000 Chunghwa Telecom Co Ltd ............................................................................... 400,025 1.01
84,000 Compal Electronics Inc ..................................................................................... 73,474 0.19
5,000 Eclat Textile Co Ltd ........................................................................................... 114,035 0.29
1,100 eMemory Technology Inc .................................................................................. 87,071 0.22
42,000 Evergreen Marine Corp Taiwan Ltd ................................................................... 216,323 0.55
140,000 Fubon Financial Holding Co Ltd ........................................................................ 386,092 0.98
140,000 Innolux Corp ..................................................................................................... 99,180 0.25
2,900 Largan Precision Co Ltd .................................................................................... 258,376 0.65
70,000 Lite-On Technology Corp .................................................................................. 161,420 0.41
20,000 Micro-Star International Co Ltd ......................................................................... 116,023 0.29
700 momo.com Inc .................................................................................................. 41,114 0.10
5,000 Nien Made Enterprise Co Ltd ............................................................................ 74,547 0.19
21,000 Novatek Microelectronics Corp ......................................................................... 409,116 1.03
28,000 Ruentex Development Co Ltd ........................................................................... 64,568 0.16
42,000 Synnex Technology International Corp ............................................................. 100,495 0.25
147,000 Taiwan Cement Corp ........................................................................................ 255,033 0.65
47,214 Taiwan Mobile Co Ltd ....................................................................................... 170,651 0.43
18,000 Taiwan Semiconductor Manufacturing Co Ltd ................................................... 400,116 1.01
172,000 United Microelectronics Corp ............................................................................ 404,092 1.02
28,000 Vanguard International Semiconductor Corp ..................................................... 159,902 0.40
17,000 Wan Hai Lines Ltd ............................................................................................. 121,968 0.31
2,300 Wiwynn Corp .................................................................................................... 92,692 0.23
42,000 WPG Holdings Ltd ............................................................................................ 79,850 0.20
28,000 Yang Ming Marine Transport Corp .................................................................... 122,456 0.31
154,000 Yuanta Financial Holding Co Ltd ....................................................................... 140,822 0.39
5,550,268 14.04
Thailand: 1.59% (30 June 2021: 1.46%)
40,600 Advanced Info Service PCL .............................................................................. 279,539 0.71
12,600 Bumrungrad Hospital PCL ................................................................................ 53,184 0.13
7,000 Carabao Group PCL ......................................................................................... 25,041 0.06
61,600 Intouch Holdings PCL ....................................................................................... 147,984 0.37
86,800 Krung Thai Bank PCL ....................................................................................... 34,299 0.09
29,400 Osotspa PCL .................................................................................................... 30,144 0.08
37,800 Sri Trang Gloves Thailand PCL ......................................................................... 34,230 0.09
42,000 Thai Union Group PCL ...................................................................................... 24,517 0.06
628,938 1.59
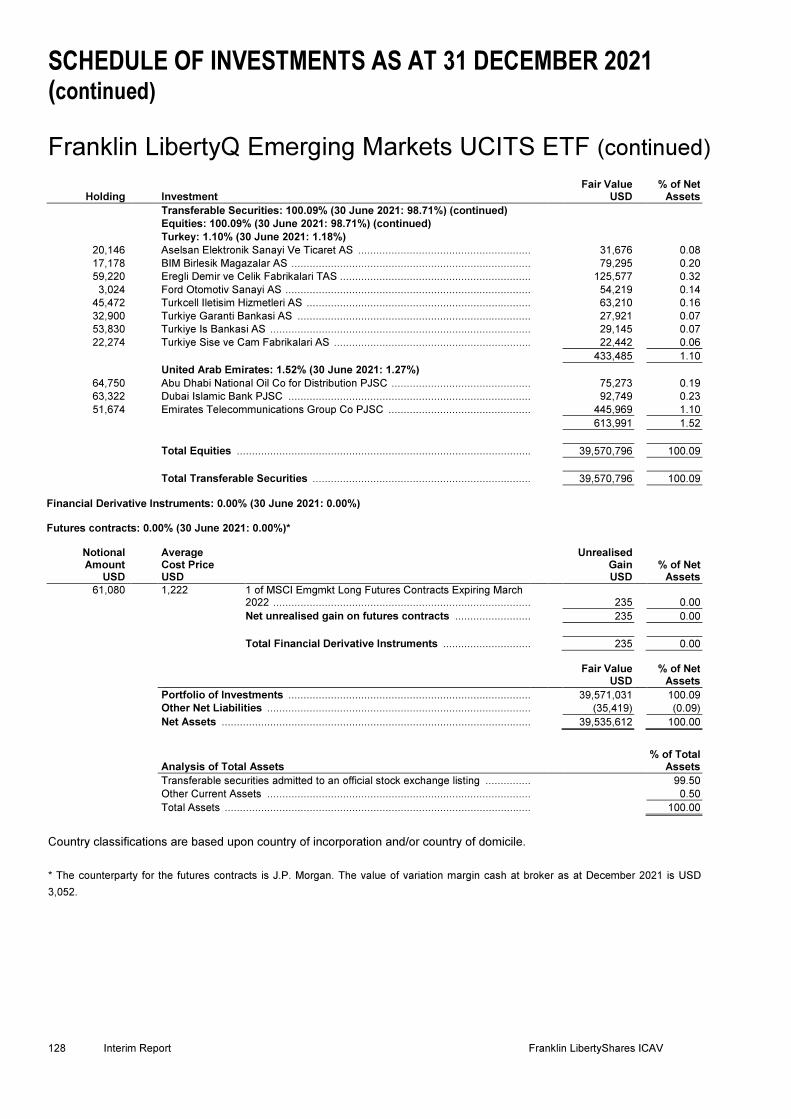
SCHEDULE OF INVESTMENTS AS AT 31 DECEMBER 2021 (continued) Franklin LibertyQ Emerging Markets UCITS ETF (continued)
128 Interim Report Franklin LibertyShares ICAV
Holding Investment Fair Value
USD % of Net
Assets
Transferable Securities: 100.09% (30 June 2021: 98.71%) (continued) Equities: 100.09% (30 June 2021: 98.71%) (continued)
Turkey: 1.10% (30 June 2021: 1.18%)
20,146 Aselsan Elektronik Sanayi Ve Ticaret AS ......................................................... 31,676 0.08
17,178 BIM Birlesik Magazalar AS ............................................................................... 79,295 0.20
59,220 Eregli Demir ve Celik Fabrikalari TAS ............................................................... 125,577 0.32
3,024 Ford Otomotiv Sanayi AS ................................................................................. 54,219 0.14
45,472 Turkcell Iletisim Hizmetleri AS .......................................................................... 63,210 0.16
32,900 Turkiye Garanti Bankasi AS ............................................................................. 27,921 0.07
53,830 Turkiye Is Bankasi AS ...................................................................................... 29,145 0.07
22,274 Turkiye Sise ve Cam Fabrikalari AS ................................................................. 22,442 0.06
433,485 1.10
United Arab Emirates: 1.52% (30 June 2021: 1.27%)
64,750 Abu Dhabi National Oil Co for Distribution PJSC .............................................. 75,273 0.19
63,322 Dubai Islamic Bank PJSC ................................................................................ 92,749 0.23
51,674 Emirates Telecommunications Group Co PJSC ............................................... 445,969 1.10
613,991 1.52
Total Equities ................................................................................................................................ 39,570,796 100.09
Total Transferable Securities ................................................................................................ 39,570,796 100.09
Financial Derivative Instruments: 0.00% (30 June 2021: 0.00%) Futures contracts: 0.00% (30 June 2021: 0.00%)*
Notional Amount
USD
Average Cost Price USD
Unrealised Gain USD
% of Net Assets
61,080
1,222 1 of MSCI Emgmkt Long Futures Contracts Expiring March 2022 ................................................................................................ 235 0.00
Net unrealised gain on futures contracts ................................ 235 0.00
Total Financial Derivative Instruments ................................ 235 0.00
Fair Value
USD % of Net
Assets
Portfolio of Investments ................................................................................................ 39,571,031 100.09
Other Net Liabilities ................................................................................................ (35,419) (0.09)
Net Assets ................................................................................................................................ 39,535,612 100.00
Analysis of Total Assets % of Total
Assets
Transferable securities admitted to an official stock exchange listing ................................ 99.50
Other Current Assets ................................................................................................ 0.50
Total Assets ................................................................................................................................ 100.00
Country classifications are based upon country of incorporation and/or country of domicile.
* The counterparty for the futures contracts is J.P. Morgan. The value of variation margin cash at broker as at December 2021 is USD
3,052.
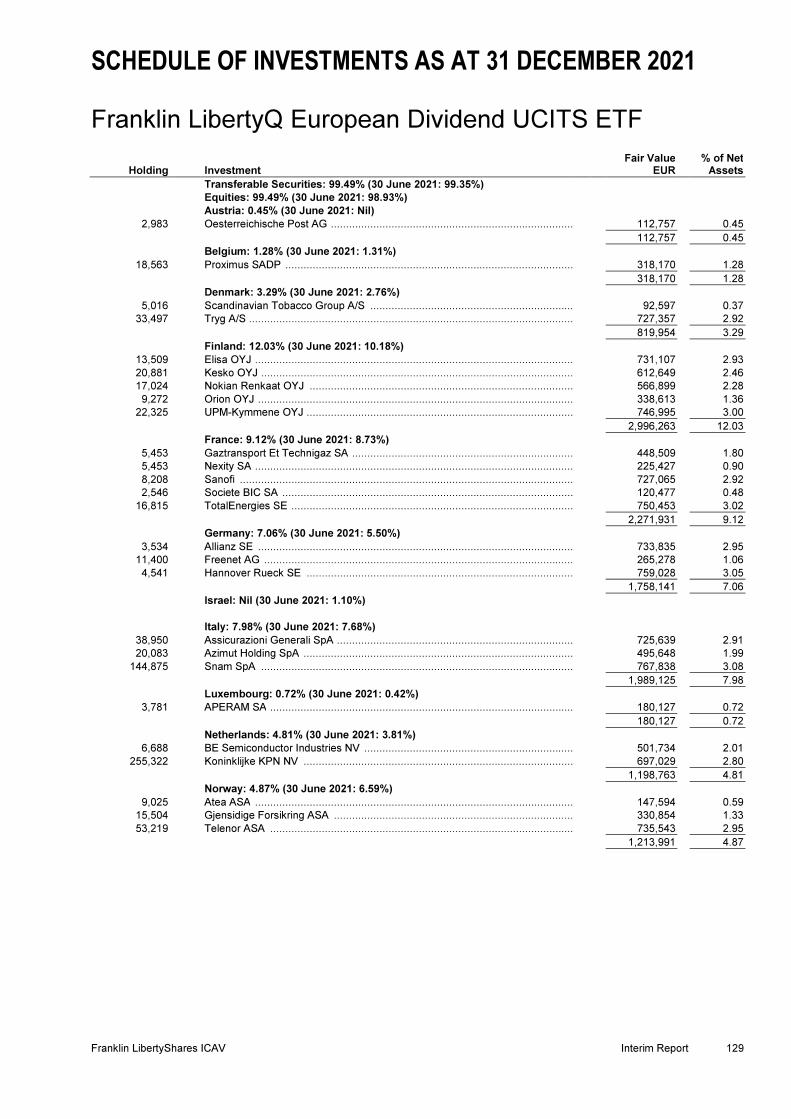
SCHEDULE OF INVESTMENTS AS AT 31 DECEMBER 2021
Franklin LibertyQ European Dividend UCITS ETF
Franklin LibertyShares ICAV Interim Report 129
Holding Investment Fair Value
EUR % of Net
Assets
Transferable Securities: 99.49% (30 June 2021: 99.35%)
Equities: 99.49% (30 June 2021: 98.93%)
Austria: 0.45% (30 June 2021: Nil)
2,983 Oesterreichische Post AG ................................................................................. 112,757 0.45
112,757 0.45
Belgium: 1.28% (30 June 2021: 1.31%)
18,563 Proximus SADP ................................................................................................ 318,170 1.28
318,170 1.28
Denmark: 3.29% (30 June 2021: 2.76%)
5,016 Scandinavian Tobacco Group A/S .................................................................... 92,597 0.37
33,497 Tryg A/S ............................................................................................................ 727,357 2.92
819,954 3.29
Finland: 12.03% (30 June 2021: 10.18%)
13,509 Elisa OYJ .......................................................................................................... 731,107 2.93
20,881 Kesko OYJ ........................................................................................................ 612,649 2.46
17,024 Nokian Renkaat OYJ ........................................................................................ 566,899 2.28
9,272 Orion OYJ ......................................................................................................... 338,613 1.36
22,325 UPM-Kymmene OYJ ......................................................................................... 746,995 3.00
2,996,263 12.03
France: 9.12% (30 June 2021: 8.73%)
5,453 Gaztransport Et Technigaz SA .......................................................................... 448,509 1.80
5,453 Nexity SA .......................................................................................................... 225,427 0.90
8,208 Sanofi ............................................................................................................... 727,065 2.92
2,546 Societe BIC SA ................................................................................................ 120,477 0.48
16,815 TotalEnergies SE .............................................................................................. 750,453 3.02
2,271,931 9.12
Germany: 7.06% (30 June 2021: 5.50%)
3,534 Allianz SE ......................................................................................................... 733,835 2.95
11,400 Freenet AG ....................................................................................................... 265,278 1.06
4,541 Hannover Rueck SE ......................................................................................... 759,028 3.05
1,758,141 7.06
Israel: Nil (30 June 2021: 1.10%)
Italy: 7.98% (30 June 2021: 7.68%)
38,950 Assicurazioni Generali SpA ............................................................................... 725,639 2.91
20,083 Azimut Holding SpA .......................................................................................... 495,648 1.99
144,875 Snam SpA ........................................................................................................ 767,838 3.08
1,989,125 7.98
Luxembourg: 0.72% (30 June 2021: 0.42%)
3,781 APERAM SA ..................................................................................................... 180,127 0.72
180,127 0.72
Netherlands: 4.81% (30 June 2021: 3.81%)
6,688 BE Semiconductor Industries NV ...................................................................... 501,734 2.01
255,322 Koninklijke KPN NV .......................................................................................... 697,029 2.80
1,198,763 4.81
Norway: 4.87% (30 June 2021: 6.59%)
9,025 Atea ASA .......................................................................................................... 147,594 0.59
15,504 Gjensidige Forsikring ASA ................................................................................ 330,854 1.33
53,219 Telenor ASA ..................................................................................................... 735,543 2.95
1,213,991 4.87
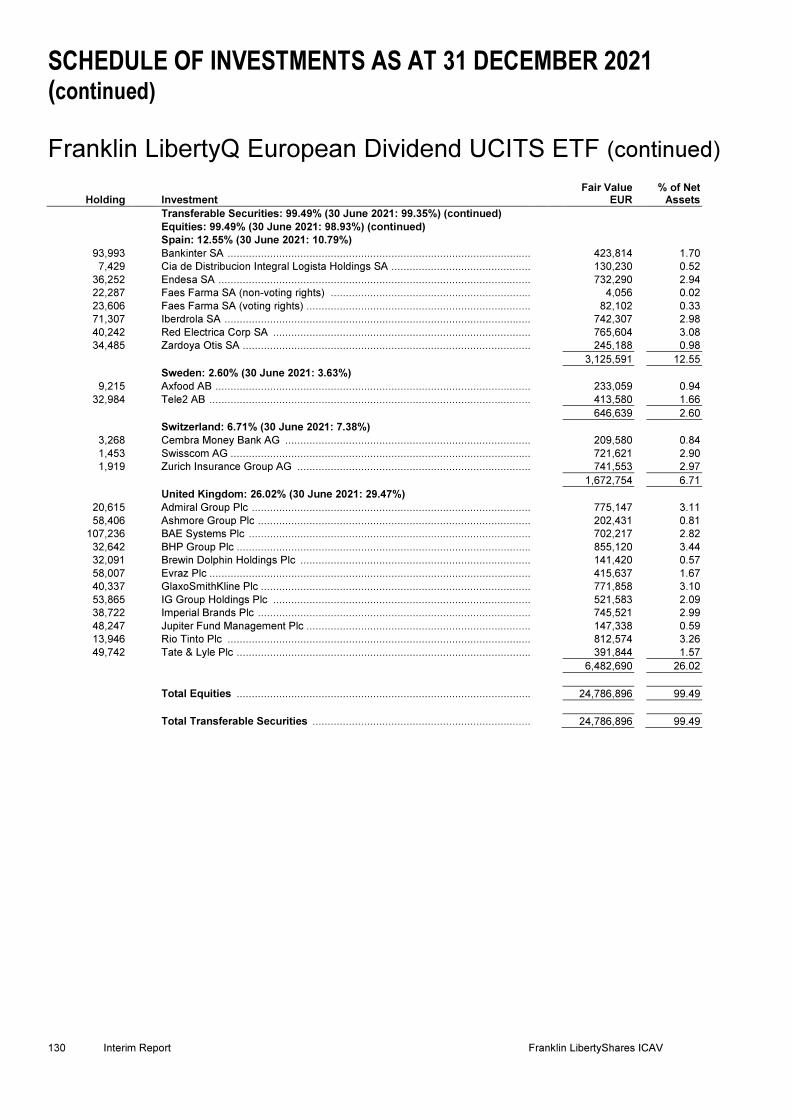
SCHEDULE OF INVESTMENTS AS AT 31 DECEMBER 2021 (continued) Franklin LibertyQ European Dividend UCITS ETF (continued)
130 Interim Report Franklin LibertyShares ICAV
Holding Investment Fair Value
EUR % of Net
Assets
Transferable Securities: 99.49% (30 June 2021: 99.35%) (continued)
Equities: 99.49% (30 June 2021: 98.93%) (continued)
Spain: 12.55% (30 June 2021: 10.79%)
93,993 Bankinter SA .................................................................................................... 423,814 1.70
7,429 Cia de Distribucion Integral Logista Holdings SA .............................................. 130,230 0.52
36,252 Endesa SA ....................................................................................................... 732,290 2.94
22,287 Faes Farma SA (non-voting rights) .................................................................. 4,056 0.02
23,606 Faes Farma SA (voting rights) .......................................................................... 82,102 0.33
71,307 Iberdrola SA ..................................................................................................... 742,307 2.98
40,242 Red Electrica Corp SA ..................................................................................... 765,604 3.08
34,485 Zardoya Otis SA ............................................................................................... 245,188 0.98
3,125,591 12.55
Sweden: 2.60% (30 June 2021: 3.63%)
9,215 Axfood AB ........................................................................................................ 233,059 0.94
32,984 Tele2 AB .......................................................................................................... 413,580 1.66
646,639 2.60
Switzerland: 6.71% (30 June 2021: 7.38%)
3,268 Cembra Money Bank AG ................................................................................. 209,580 0.84
1,453 Swisscom AG ................................................................................................... 721,621 2.90
1,919 Zurich Insurance Group AG ............................................................................. 741,553 2.97
1,672,754 6.71
United Kingdom: 26.02% (30 June 2021: 29.47%)
20,615 Admiral Group Plc ............................................................................................ 775,147 3.11
58,406 Ashmore Group Plc .......................................................................................... 202,431 0.81
107,236 BAE Systems Plc ............................................................................................. 702,217 2.82
32,642 BHP Group Plc ................................................................................................. 855,120 3.44
32,091 Brewin Dolphin Holdings Plc ............................................................................ 141,420 0.57
58,007 Evraz Plc .......................................................................................................... 415,637 1.67
40,337 GlaxoSmithKline Plc ......................................................................................... 771,858 3.10
53,865 IG Group Holdings Plc ..................................................................................... 521,583 2.09
38,722 Imperial Brands Plc .......................................................................................... 745,521 2.99
48,247 Jupiter Fund Management Plc .......................................................................... 147,338 0.59
13,946 Rio Tinto Plc .................................................................................................... 812,574 3.26
49,742 Tate & Lyle Plc ................................................................................................. 391,844 1.57
6,482,690 26.02
Total Equities ................................................................................................................................ 24,786,896 99.49
Total Transferable Securities ................................................................................................ 24,786,896 99.49

SCHEDULE OF INVESTMENTS AS AT 31 DECEMBER 2021 (continued) Franklin LibertyQ European Dividend UCITS ETF (continued)
Franklin LibertyShares ICAV Interim Report 131
Financial Derivative Instruments: 0.02% (30 June 2021: (0.00)%)
Futures contracts: 0.02% (30 June 2021: (0.00)%)*
Notional Amount
EUR
Average Cost Price EUR
Unrealised Gain EUR
% of Net Assets
81,820 4,091 2 of Euro Stoxx 50 Long Futures Contracts Expiring March 2022 ................................................................................................ 3,930 3,930
Net unrealised gain on futures contracts ................................ 3,930 3,930
Total Financial Derivative Instruments ................................ 3,930 3,930
Fair Value
EUR % of Net
Assets
Portfolio of Investments ................................................................................................ 24,790,826 99.50
Other Net Assets ................................................................................................ 123,647 0.50
Net Assets ................................................................................................................................ 24,914,473 100.00
Analysis of Total Assets % of Total
Assets
Transferable securities admitted to an official stock exchange listing ................................ 99.46
Exchange-Traded Derivative Instruments ................................................................ 0.02
Other Current Assets ................................................................................................ 0.52
Total Assets ................................................................................................................................ 100.00
Country classifications are based upon country of incorporation and/or country of domicile.
* The counterparty for the futures contracts is J.P. Morgan. The value of variation margin cash at broker as at 31 December 2021 is EUR
2,529.

SCHEDULE OF INVESTMENTS AS AT 31 DECEMBER 2021 Franklin LibertyQ European Equity UCITS ETF
132 Interim Report Franklin LibertyShares ICAV
Holding Investment Fair Value
EUR % of Net
Assets
Transferable Securities: 99.79% (30 June 2021: 99.72%)
Equities: 99.79% (30 June 2021: 99.72%)
Austria: 0.44% (30 June 2021: 0.33%)
918 OMV AG .......................................................................................................... 45,854 0.44
45,854 0.44
Belgium: 0.37% (30 June 2021: 0.43%)
432 Colruyt SA ........................................................................................................ 16,096 0.16
1,290 Proximus SADP ............................................................................................... 22,111 0.21
38,207 0.37
Denmark: 8.30% (30 June 2021: 7.56%)
11 AP Moller - Maersk A/S 'A' Shares ................................................................... 32,212 0.31
33 AP Moller - Maersk A/S 'B' Shares ................................................................... 104,046 1.01
1,152 Coloplast A/S ................................................................................................... 178,278 1.73
390 Genmab A/S .................................................................................................... 137,908 1.34
2,022 Novo Nordisk A/S ............................................................................................. 199,819 1.93
1,488 Novozymes A/S ............................................................................................... 107,475 1.04
882 Pandora A/S .................................................................................................... 96,696 0.94
856,434 8.30
Finland: 2.40% (30 June 2021: 3.70%)
1,110 Elisa OYJ ......................................................................................................... 60,073 0.58
2,454 Kone OYJ ........................................................................................................ 154,700 1.50
894 Orion OYJ ........................................................................................................ 32,649 0.32
247,422 2.40
France: 8.56% (30 June 2021: 9.06%)
246 BioMerieux ....................................................................................................... 30,725 0.30
128 Hermes International ........................................................................................ 196,608 1.91
270 Ipsen SA .......................................................................................................... 21,735 0.21
1,452 Klepierre SA ..................................................................................................... 30,274 0.29
486 La Francaise des Jeux SAEM .......................................................................... 18,925 0.18
480 L'Oreal SA ....................................................................................................... 200,136 1.94
10,764 Orange SA ....................................................................................................... 101,322 0.98
2,316 Sanofi .............................................................................................................. 205,151 1.99
162 Sartorius Stedim Biotech .................................................................................. 78,149 0.76
883,025 8.56
Germany: 7.57% (30 June 2021: 5.22%)
1,056 Bayerische Motoren Werke AG ......................................................................... 93,445 0.91
198 Bayerische Motoren Werke AG (preferred stock) ............................................. 14,513 0.14
708 Brenntag SE .................................................................................................... 56,343 0.55
678 Covestro AG .................................................................................................... 36,748 0.36
3,630 Deutsche Post AG ........................................................................................... 205,239 1.99
8,154 E.ON SE .......................................................................................................... 99,414 0.96
492 FUCHS PETROLUB SE ................................................................................... 19,641 0.19
1,014 HelloFresh SE .................................................................................................. 68,486 0.66
432 Knorr-Bremse AG ............................................................................................ 37,541 0.36
396 LANXESS AG .................................................................................................. 21,582 0.21
1,212 Porsche Automobil Holding SE ........................................................................ 101,129 0.98
30 Rational AG ..................................................................................................... 27,012 0.26
781,093 7.57
Italy: 3.81% (30 June 2021: 3.66%)
6,924 Assicurazioni Generali SpA .............................................................................. 128,994 1.25
210 DiaSorin SpA ................................................................................................... 35,165 0.34
1,362 Moncler SpA .................................................................................................... 87,195 0.84
810 Recordati Industria Chimica e Farmaceutica SpA ............................................ 45,765 0.44
13,782 Snam SpA ........................................................................................................ 73,045 0.71
53,646 Telecom Italia SpA ........................................................................................... 23,293 0.23
393,457 3.81
Netherlands: 12.68% (30 June 2021: 11.95%)
80 Adyen NV ......................................................................................................... 184,920 1.79
265 ASML Holding NV ............................................................................................ 187,276 1.81
870 Ferrari NV ........................................................................................................ 197,924 1.92
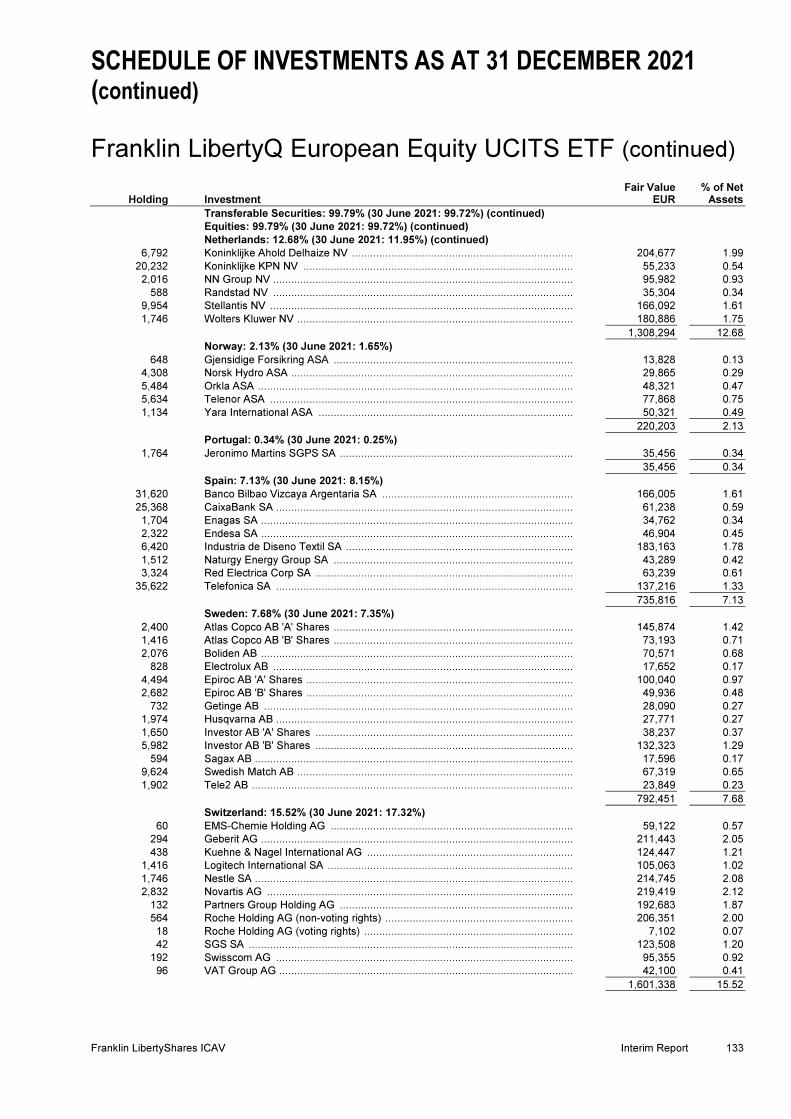
SCHEDULE OF INVESTMENTS AS AT 31 DECEMBER 2021 (continued) Franklin LibertyQ European Equity UCITS ETF (continued)
Franklin LibertyShares ICAV Interim Report 133
Holding Investment Fair Value
EUR % of Net
Assets
Transferable Securities: 99.79% (30 June 2021: 99.72%) (continued)
Equities: 99.79% (30 June 2021: 99.72%) (continued)
Netherlands: 12.68% (30 June 2021: 11.95%) (continued)
6,792 Koninklijke Ahold Delhaize NV .......................................................................... 204,677 1.99
20,232 Koninklijke KPN NV .......................................................................................... 55,233 0.54
2,016 NN Group NV .................................................................................................... 95,982 0.93
588 Randstad NV .................................................................................................... 35,304 0.34
9,954 Stellantis NV ..................................................................................................... 166,092 1.61
1,746 Wolters Kluwer NV ............................................................................................ 180,886 1.75
1,308,294 12.68
Norway: 2.13% (30 June 2021: 1.65%)
648 Gjensidige Forsikring ASA ................................................................................ 13,828 0.13
4,308 Norsk Hydro ASA .............................................................................................. 29,865 0.29
5,484 Orkla ASA ......................................................................................................... 48,321 0.47
5,634 Telenor ASA ..................................................................................................... 77,868 0.75
1,134 Yara International ASA ..................................................................................... 50,321 0.49
220,203 2.13
Portugal: 0.34% (30 June 2021: 0.25%)
1,764 Jeronimo Martins SGPS SA .............................................................................. 35,456 0.34
35,456 0.34
Spain: 7.13% (30 June 2021: 8.15%)
31,620 Banco Bilbao Vizcaya Argentaria SA ................................................................ 166,005 1.61
25,368 CaixaBank SA ................................................................................................... 61,238 0.59
1,704 Enagas SA ........................................................................................................ 34,762 0.34
2,322 Endesa SA ........................................................................................................ 46,904 0.45
6,420 Industria de Diseno Textil SA ............................................................................ 183,163 1.78
1,512 Naturgy Energy Group SA ................................................................................ 43,289 0.42
3,324 Red Electrica Corp SA ...................................................................................... 63,239 0.61
35,622 Telefonica SA ................................................................................................... 137,216 1.33
735,816 7.13
Sweden: 7.68% (30 June 2021: 7.35%)
2,400 Atlas Copco AB 'A' Shares ................................................................................ 145,874 1.42
1,416 Atlas Copco AB 'B' Shares ................................................................................ 73,193 0.71
2,076 Boliden AB ........................................................................................................ 70,571 0.68
828 Electrolux AB .................................................................................................... 17,652 0.17
4,494 Epiroc AB 'A' Shares ......................................................................................... 100,040 0.97
2,682 Epiroc AB 'B' Shares ......................................................................................... 49,936 0.48
732 Getinge AB ....................................................................................................... 28,090 0.27
1,974 Husqvarna AB ................................................................................................... 27,771 0.27
1,650 Investor AB 'A' Shares ...................................................................................... 38,237 0.37
5,982 Investor AB 'B' Shares ...................................................................................... 132,323 1.29
594 Sagax AB .......................................................................................................... 17,596 0.17
9,624 Swedish Match AB ............................................................................................ 67,319 0.65
1,902 Tele2 AB ........................................................................................................... 23,849 0.23
792,451 7.68
Switzerland: 15.52% (30 June 2021: 17.32%)
60 EMS-Chemie Holding AG ................................................................................. 59,122 0.57
294 Geberit AG ........................................................................................................ 211,443 2.05
438 Kuehne & Nagel International AG ..................................................................... 124,447 1.21
1,416 Logitech International SA .................................................................................. 105,063 1.02
1,746 Nestle SA .......................................................................................................... 214,745 2.08
2,832 Novartis AG ...................................................................................................... 219,419 2.12
132 Partners Group Holding AG .............................................................................. 192,683 1.87
564 Roche Holding AG (non-voting rights) ............................................................... 206,351 2.00
18 Roche Holding AG (voting rights) ...................................................................... 7,102 0.07
42 SGS SA ............................................................................................................ 123,508 1.20
192 Swisscom AG ................................................................................................... 95,355 0.92
96 VAT Group AG .................................................................................................. 42,100 0.41
1,601,338 15.52

SCHEDULE OF INVESTMENTS AS AT 31 DECEMBER 2021 (continued) Franklin LibertyQ European Equity UCITS ETF (continued)
134 Interim Report Franklin LibertyShares ICAV
Holding Investment Fair Value
EUR % of Net
Assets
Transferable Securities: 99.79% (30 June 2021: 99.72%) (continued)
Equities: 99.79% (30 June 2021: 99.72%) (continued)
United Kingdom: 22.86% (30 June 2021: 23.09%)
1,770 Admiral Group Plc ............................................................................................ 66,554 0.64
6,144 Anglo American Plc .......................................................................................... 220,703 2.14
6,726 Auto Trader Group Plc ..................................................................................... 59,281 0.57
3,324 Barratt Developments Plc ................................................................................. 29,613 0.29
9,198 BHP Group Plc ................................................................................................. 240,959 2.34
6,702 British American Tobacco Plc ........................................................................... 218,198 2.11
5,142 Evraz Plc .......................................................................................................... 36,844 0.36
11,364 GlaxoSmithKline Plc ......................................................................................... 217,453 2.11
3,090 Hargreaves Lansdown Plc ............................................................................... 49,868 0.48
1,002 Hikma Pharmaceuticals Plc .............................................................................. 26,482 0.26
9,132 Imperial Brands Plc .......................................................................................... 175,820 1.70
858 Intertek Group Pl .............................................................................................. 57,534 0.56
2,586 Mondi Plc ......................................................................................................... 56,241 0.55
900 Next Plc ........................................................................................................... 87,363 0.85
2,580 Persimmon Plc ................................................................................................. 87,762 0.85
7,344 RELX Plc ......................................................................................................... 210,103 2.04
3,930 Rio Tinto Plc ..................................................................................................... 228,984 2.22
402 Spirax-Sarco Engineering Plc ........................................................................... 76,847 0.74
4,494 Unilever Plc ...................................................................................................... 211,184 2.05
2,357,793 22.86
Total Equities ................................................................................................................................ 10,296,843 99.79
Total Transferable Securities ................................................................................................ 10,296,843 99.79
Fair Value
EUR % of Net
Assets
Portfolio of Investments ................................................................................................ 10,296,843 99.79
Other Net Assets ................................................................................................ 22,136 0.21
Net Assets ................................................................................................................................ 10,318,979 100.00
Analysis of Total Assets % of Total
Assets
Transferable securities admitted to an official stock exchange listing ................................ 99.75
Other Current Assets ................................................................................................ 0.25
Total Assets ................................................................................................................................ 100.00
Country classifications are based upon country of incorporation and/or country of domicile.
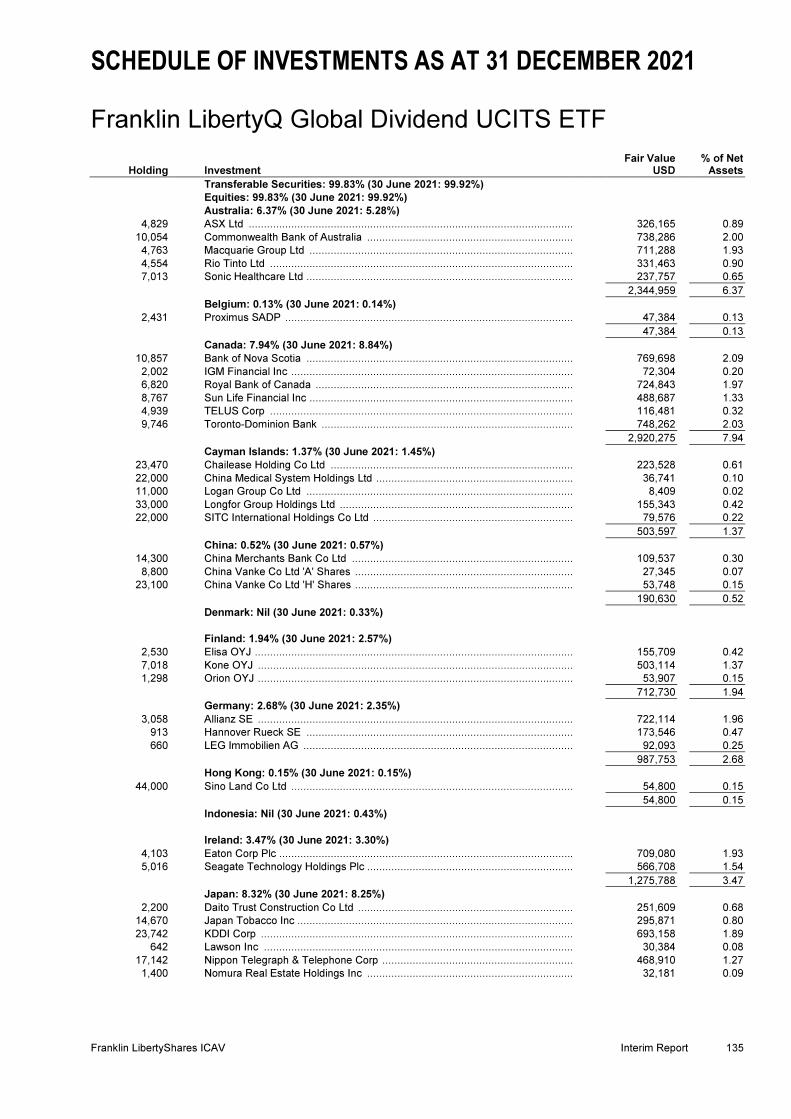
SCHEDULE OF INVESTMENTS AS AT 31 DECEMBER 2021 Franklin LibertyQ Global Dividend UCITS ETF
Franklin LibertyShares ICAV Interim Report 135
Holding Investment Fair Value
USD % of Net
Assets
Transferable Securities: 99.83% (30 June 2021: 99.92%)
Equities: 99.83% (30 June 2021: 99.92%)
Australia: 6.37% (30 June 2021: 5.28%)
4,829 ASX Ltd ............................................................................................................ 326,165 0.89
10,054 Commonwealth Bank of Australia ..................................................................... 738,286 2.00
4,763 Macquarie Group Ltd ........................................................................................ 711,288 1.93
4,554 Rio Tinto Ltd ..................................................................................................... 331,463 0.90
7,013 Sonic Healthcare Ltd ......................................................................................... 237,757 0.65
2,344,959 6.37
Belgium: 0.13% (30 June 2021: 0.14%)
2,431 Proximus SADP ................................................................................................ 47,384 0.13
47,384 0.13
Canada: 7.94% (30 June 2021: 8.84%)
10,857 Bank of Nova Scotia ......................................................................................... 769,698 2.09
2,002 IGM Financial Inc .............................................................................................. 72,304 0.20
6,820 Royal Bank of Canada ...................................................................................... 724,843 1.97
8,767 Sun Life Financial Inc ........................................................................................ 488,687 1.33
4,939 TELUS Corp ..................................................................................................... 116,481 0.32
9,746 Toronto-Dominion Bank .................................................................................... 748,262 2.03
2,920,275 7.94
Cayman Islands: 1.37% (30 June 2021: 1.45%)
23,470 Chailease Holding Co Ltd ................................................................................. 223,528 0.61
22,000 China Medical System Holdings Ltd .................................................................. 36,741 0.10
11,000 Logan Group Co Ltd ......................................................................................... 8,409 0.02
33,000 Longfor Group Holdings Ltd .............................................................................. 155,343 0.42
22,000 SITC International Holdings Co Ltd ................................................................... 79,576 0.22
503,597 1.37
China: 0.52% (30 June 2021: 0.57%)
14,300 China Merchants Bank Co Ltd .......................................................................... 109,537 0.30
8,800 China Vanke Co Ltd 'A' Shares ......................................................................... 27,345 0.07
23,100 China Vanke Co Ltd 'H' Shares ......................................................................... 53,748 0.15
190,630 0.52
Denmark: Nil (30 June 2021: 0.33%)
Finland: 1.94% (30 June 2021: 2.57%)
2,530 Elisa OYJ .......................................................................................................... 155,709 0.42
7,018 Kone OYJ ......................................................................................................... 503,114 1.37
1,298 Orion OYJ ......................................................................................................... 53,907 0.15
712,730 1.94
Germany: 2.68% (30 June 2021: 2.35%)
3,058 Allianz SE ......................................................................................................... 722,114 1.96
913 Hannover Rueck SE ......................................................................................... 173,546 0.47
660 LEG Immobilien AG .......................................................................................... 92,093 0.25
987,753 2.68
Hong Kong: 0.15% (30 June 2021: 0.15%)
44,000 Sino Land Co Ltd .............................................................................................. 54,800 0.15
54,800 0.15
Indonesia: Nil (30 June 2021: 0.43%)
Ireland: 3.47% (30 June 2021: 3.30%)
4,103 Eaton Corp Plc .................................................................................................. 709,080 1.93
5,016 Seagate Technology Holdings Plc ..................................................................... 566,708 1.54
1,275,788 3.47
Japan: 8.32% (30 June 2021: 8.25%)
2,200 Daito Trust Construction Co Ltd ........................................................................ 251,609 0.68
14,670 Japan Tobacco Inc ............................................................................................ 295,871 0.80
23,742 KDDI Corp ........................................................................................................ 693,158 1.89
642 Lawson Inc ....................................................................................................... 30,384 0.08
17,142 Nippon Telegraph & Telephone Corp ................................................................ 468,910 1.27
1,400 Nomura Real Estate Holdings Inc ..................................................................... 32,181 0.09

SCHEDULE OF INVESTMENTS AS AT 31 DECEMBER 2021 (continued) Franklin LibertyQ Global Dividend UCITS ETF (continued)
136 Interim Report Franklin LibertyShares ICAV
Holding Investment
Fair Value USD
% of Net Assets
Transferable Securities: 99.83% (30 June 2021: 99.92%) (continued)
Equities: 99.83% (30 June 2021: 99.92%) (continued)
Japan: 8.32% (30 June 2021: 8.25%) (continued)
19,800 ORIX Corp ....................................................................................................... 403,634 1.10
7,700 Sekisui House Ltd ............................................................................................ 165,093 0.45
3,850 Sompo Holdings Inc ......................................................................................... 162,452 0.44
6,600 T&D Holdings Inc ............................................................................................. 84,366 0.23
8,525 Tokio Marine Holdings Inc ................................................................................ 473,205 1.29
3,060,863 8.32
Jersey: 0.31% (30 June 2021: 0.32%)
6,578 Polymetal International Plc ............................................................................... 115,105 0.31
115,105 0.31
Malaysia: 0.14% (30 June 2021: 0.11%)
12,100 Petronas Gas Bhd ............................................................................................ 52,280 0.14
52,280 0.14
Netherlands: 0.91% (30 June 2021: 1.21%)
3,619 LyondellBasell Industries NV ............................................................................ 333,780 0.91
333,780 0.91
New Zealand: 0.35% (30 June 2021: 0.44%)
41,107 Spark New Zealand Ltd .................................................................................... 127,210 0.35
127,210 0.35
Norway: 0.44% (30 June 2021: 0.28%)
2,420 Gjensidige Forsikring ASA ............................................................................... 58,728 0.16
10,329 Orkla ASA ........................................................................................................ 103,497 0.28
162,225 0.44
Philippines: 0.06% (30 June 2021: 0.04%)
330 Globe Telecom Inc ........................................................................................... 21,498 0.06
21,498 0.06
Qatar: 0.56% (30 June 2021: 1.56%)
65,692 Masraf Al Rayan QSC ...................................................................................... 83,716 0.22
9,625 Qatar International Islamic Bank QSC .............................................................. 24,347 0.07
19,426 Qatar Islamic Bank SAQ .................................................................................. 97,797 0.27
205,860 0.56
Russia: 0.38% (30 June 2021: 0.47%)
21,197 Tatneft PJSC .................................................................................................... 141,443 0.38
141,443 0.38
Saudi Arabia: 2.76% (30 June 2021: 3.55%)
18,414 Al Rajhi Bank ................................................................................................... 695,479 1.90
1,496 Jarir Marketing Co ............................................................................................ 78,418 0.21
8,041 Saudi Telecom Co ............................................................................................ 240,733 0.65
1,014,630 2.76
Singapore: 0.18% (30 June 2021: 0.88%)
4,950 Venture Corp Ltd .............................................................................................. 67,229 0.18
67,229 0.18
South Africa: 0.17% (30 June 2021: 0.24%)
5,137 Mr Price Group Ltd ........................................................................................... 64,213 0.17
64,213 0.17
Spain: 0.32% (30 June 2021: 0.29%)
5,368 Red Electrica Corp SA ..................................................................................... 116,138 0.32
116,138 0.32
Switzerland: 9.31% (30 June 2021: 9.31%)
132 EMS-Chemie Holding AG ................................................................................. 147,914 0.40
3,553 Garmin Ltd ....................................................................................................... 483,812 1.31
8,690 Novartis AG ..................................................................................................... 765,662 2.09
1,727 Roche Holding AG (non-voting rights) .............................................................. 718,549 1.95
55 Roche Holding AG (voting rights) ..................................................................... 24,677 0.07
110 SGS SA ........................................................................................................... 367,854 1.00

SCHEDULE OF INVESTMENTS AS AT 31 DECEMBER 2021 (continued) Franklin LibertyQ Global Dividend UCITS ETF (continued)
Franklin LibertyShares ICAV Interim Report 137
Holding Investment
Fair Value USD
% of Net Assets
Transferable Securities: 99.83% (30 June 2021: 99.92%) (continued)
Equities: 99.83% (30 June 2021: 99.92%) (continued)
Switzerland: 9.31% (30 June 2021: 9.31%) (continued)
341 Swisscom AG ................................................................................................... 192,590 0.52
1,650 Zurich Insurance Group AG .............................................................................. 725,084 1.97
3,426,142 9.31
Taiwan: 2.55% (30 June 2021: 2.38%)
1,840 Nien Made Enterprise Co Ltd ............................................................................ 27,433 0.07
4,584 Realtek Semiconductor Corp ............................................................................ 96,097 0.26
32,243 Taiwan Semiconductor Manufacturing Co Ltd ................................................... 716,719 1.95
17,420 Vanguard International Semiconductor Corp ..................................................... 99,482 0.27
939,731 2.55
Turkey: 0.08% (30 June 2021: 0.09%)
1,628 Ford Otomotiv Sanayi AS .................................................................................. 29,189 0.08
29,189 0.08
United Arab Emirates: 0.92% (30 June 2021: 0.38%)
39,160 Emirates Telecommunications Group Co PJSC ................................................ 337,968 0.92
337,968 0.92
United Kingdom: 8.30% (30 June 2021: 6.00%)
34,892 GlaxoSmithKline Plc ......................................................................................... 759,270 2.06
95,513 Legal & General Group Plc ............................................................................... 384,869 1.05
11,858 Rio Tinto Plc ..................................................................................................... 785,708 2.15
2,013 Schroders Plc ................................................................................................... 97,064 0.26
5,214 Smiths Group Plc .............................................................................................. 111,546 0.30
7,821 St James's Place Plc ......................................................................................... 178,336 0.48
13,805 Unilever Plc ...................................................................................................... 737,736 2.00
3,054,529 8.30
United States: 39.20% (30 June 2021: 38.71%)
3,982 3M Co ............................................................................................................... 707,323 1.92
16,159 Altria Group Inc ................................................................................................ 765,775 2.08
3,487 Amgen Inc ........................................................................................................ 784,470 2.13
13,255 Cisco Systems Inc ............................................................................................ 839,969 2.27
12,837 Coca-Cola Co ................................................................................................... 760,079 2.07
2,629 Cummins Inc ..................................................................................................... 573,490 1.56
7,502 Emerson Electric Co ......................................................................................... 697,461 1.90
6,226 Fidelity National Financial Inc ............................................................................ 324,873 0.88
10,494 Gilead Sciences Inc .......................................................................................... 761,969 2.07
6,094 International Business Machines Corp .............................................................. 814,524 2.21
4,378 Johnson & Johnson .......................................................................................... 748,944 2.04
5,346 Kimberly-Clark Corp .......................................................................................... 764,050 2.08
8,558 Merck & Co Inc ................................................................................................ 655,885 1.78
4,774 Nucor Corp ....................................................................................................... 544,952 1.48
1,551 Packaging Corp of America .............................................................................. 211,169 0.57
5,665 Paychex Inc ...................................................................................................... 773,273 2.10
7,766 Philip Morris International Inc ............................................................................ 737,770 2.01
4,829 Procter & Gamble Co ........................................................................................ 789,928 2.15
3,817 QUALCOMM Inc ............................................................................................... 698,015 1.90
2,816 Target Corp ...................................................................................................... 651,735 1.77
3,410 United Parcel Service Inc .................................................................................. 730,899 1.99
4,906 Western Union Co ............................................................................................. 87,523 0.24
14,424,076 39.20
Total Equities ................................................................................................................................ 36,732,025 99.83
Total Transferable Securities ................................................................................................ 36,732,025 99.83

SCHEDULE OF INVESTMENTS AS AT 31 DECEMBER 2021 (continued) Franklin LibertyQ Global Dividend UCITS ETF (continued)
138 Interim Report Franklin LibertyShares ICAV
Financial Derivative Instruments: 0.00% (30 June 2021: Nil)
Forward Foreign Currency Contracts: 0.00% (30 June 2021: Nil)
Settlement date Amount bought Amount Sold Counterparty
Unrealised Gain/(Loss)
USD
% of Net Assets
04/01/2022 USD277,504 JPY31,895,374 J.P. Morgan 526 0.00
04/01/2022 USD1,976 PHP100,800 State Street Bank (1) (0.00)
04/01/2022 USD91,797 SAR344,887 State Street Bank (65) (0.00)
04/01/2022 USD2,656 TWD73,545 State Street Bank (2) (0.00)
Unrealised gain on forward foreign currency contracts 526 0.00
Unrealised loss on forward foreign currency contracts (68) (0.00)
Net unrealised gain on forward foreign currency contracts 458 0.00
Futures contracts: 0.00% (30 June 2021: Nil)*
Notional Amount
USD
Average Cost Price USD
Unrealised Gain USD
% of Net Assets
38,440 384 MSCI ACWI Long Futures Contracts Expiring March 2022 ............................... 675 0.00
Net unrealised gain on futures contracts ................................ 675 0.00
Total Financial Derivative Instruments ................................ 1,133 0.00
Fair Value USD
% of Net Assets
Portfolio of Investments ................................................................................................ 36,733,158 99.83
Other Net Assets ................................................................................................ 63,094 0.17
Net Assets ................................................................................................................................ 36,796,252 100.00
Analysis of Total Assets
% of Total Assets
Transferable securities admitted to an official stock exchange listing ................................ 91.48
Other Current Assets ................................................................................................ 8.52
Total Assets ................................................................................................................................ 100.00
Country classifications are based upon country of incorporation and/or country of domicile.
The counterparty for the futures contracts is J.P. Morgan. The value of variation margin cash at broker as at 31 December 2021 is USD 1,498.

SCHEDULE OF INVESTMENTS AS AT 31 DECEMBER 2021 Franklin LibertyQ Global Equity SRI UCITS ETF
Franklin LibertyShares ICAV Interim Report 139
Holding Investment Fair Value
USD % of Net
Assets
Transferable Securities: 99.76% (30 June 2021: 99.74%)
Equities: 99.76% (30 June 2021: 99.74%)
Australia: 4.24% (30 June 2021: 4.35%)
1,572 ASX Ltd ............................................................................................................. 106,178 0.45
15,624 Aurizon Holdings Ltd .......................................................................................... 39,644 0.17
3,702 BlueScope Steel Ltd .......................................................................................... 56,253 0.24
11,976 Brambles Ltd ..................................................................................................... 92,557 0.39
11,184 Coles Group Ltd ................................................................................................ 145,875 0.62
8,736 Dexus ................................................................................................................ 70,629 0.30
18,090 Fortescue Metals Group Ltd ............................................................................... 252,656 1.06
12,804 GPT Group ........................................................................................................ 50,456 0.21
23,298 Mirvac Group ..................................................................................................... 49,292 0.21
5,988 Newcrest Mining Ltd .......................................................................................... 106,576 0.45
264 REA Group Ltd .................................................................................................. 32,177 0.14
1,002,293 4.24
Bermuda: 0.25% (30 June 2021: 0.38%)
2,598 Invesco Ltd ........................................................................................................ 59,806 0.25
59,806 0.25
Brazil: 0.68% (30 June 2021: 0.71%)
32,400 B3 SA - Brasil Bolsa Balcao ............................................................................... 64,800 0.28
6,000 Banco do Brasil SA ............................................................................................ 31,077 0.13
9,000 Cia Energetica de Minas Gerais ......................................................................... 21,183 0.09
4,200 Telefonica Brasil SA ........................................................................................... 36,337 0.15
3,000 TIM SA .............................................................................................................. 7,083 0.03
160,480 0.68
Canada: 5.08% (30 June 2021: 5.42%)
2,130 Bank of Montreal ................................................................................................ 229,652 0.97
3,546 Bank of Nova Scotia .......................................................................................... 251,390 1.06
1,818 Canadian National Railway Co ........................................................................... 223,632 0.95
390 Canadian Tire Corp Ltd ...................................................................................... 56,020 0.24
1,248 Franco-Nevada Corp ......................................................................................... 172,842 0.73
1,998 Magna International Inc ..................................................................................... 161,893 0.68
2,220 Rogers Communications Inc .............................................................................. 105,855 0.45
1,201,284 5.08
Cayman Islands: 0.86% (30 June 2021: 1.53%)
8,450 Chailease Holding Co Ltd .................................................................................. 80,478 0.34
6,000 China Lesso Group Holdings Ltd ....................................................................... 8,619 0.04
6,000 China Medical System Holdings Ltd ................................................................... 10,020 0.04
4,800 Shenzhou International Group Holdings Ltd ....................................................... 92,290 0.39
6,000 Yadea Group Holdings Ltd ................................................................................. 11,698 0.05
203,105 0.86
Chile: 0.08% (30 June 2021: 0.15%)
166,968 Enel Americas SA .............................................................................................. 18,225 0.08
18,225 0.08
China: 1.19% (30 June 2021: 1.17%)
3,000 A-Living Smart City Services Co Ltd .................................................................. 5,118 0.02
600 China National Medicines Corp Ltd .................................................................... 2,975 0.01
24,000 Guangzhou Automobile Group Co Ltd ............................................................... 23,673 0.10
600 Hangzhou Robam Appliances Co Ltd 3,399 0.01
3,000 Ping An Insurance Group Co of China Ltd 'A' Shares ......................................... 23,782 0.10
28,500 Ping An Insurance Group Co of China Ltd 'H' Shares ........................................ 205,260 0.87
4,800 Shanghai Pharmaceuticals Holding Co Ltd ........................................................ 9,100 0.04
2,400 Sinotrans Ltd ..................................................................................................... 1,691 0.01
600 Wuhu Sanqi Interactive Entertainment Network Technology Group Co Ltd ........ 2,549 0.01
1,200 Zhejiang Weixing New Building Materials Co Ltd ............................................... 4,589 0.02
282,136 1.19

SCHEDULE OF INVESTMENTS AS AT 31 DECEMBER 2021 (continued)
Franklin LibertyQ Global Equity SRI UCITS ETF (continued)
140 Interim Report Franklin LibertyShares ICAV
Holding Investment Fair Value
USD % of Net
Assets
Transferable Securities: 99.76% (30 June 2021: 99.74%) (continued)
Equities: 99.76% (30 June 2021: 99.74%) (continued)
Denmark: 3.26% (30 June 2021: 3.33%)
1,182 Coloplast A/S .................................................................................................... 208,017 0.88
306 Genmab A/S ..................................................................................................... 123,050 0.52
2,022 Novo Nordisk A/S .............................................................................................. 227,234 0.96
1,248 Novozymes A/S ............................................................................................... 102,508 0.43
888 Pandora A/S .................................................................................................... 110,711 0.47
771,520 3.26
Finland: 0.94% (30 June 2021: 1.04%)
1,014 Elisa OYJ ......................................................................................................... 62,407 0.26
894 Orion OYJ ........................................................................................................ 37,128 0.16
3,252 UPM-Kymmene OYJ ........................................................................................ 123,741 0.52
223,276 0.94
France: 1.93% (30 June 2021: 1.88%)
342 Amundi SA ....................................................................................................... 28,216 0.12
1,068 Cie Generale des Etablissements Michelin SCA .............................................. 175,074 0.74
168 Gecina SA ........................................................................................................ 23,480 0.10
486 L'Oreal SA ....................................................................................................... 230,440 0.97
457,210 1.93
Germany: 2.16% (30 June 2021: 2.13%)
1,008 Allianz SE ........................................................................................................ 238,029 1.01
3,654 Deutsche Post AG ........................................................................................... 234,942 0.99
480 Henkel AG & Co KGaA .................................................................................... 37,500 0.16
510,471 2.16
Hong Kong: 1.56% (30 June 2021: 1.63%)
27,000 BOC Hong Kong Holdings Ltd .......................................................................... 88,484 0.38
24,000 China Everbright Environment Group Ltd ......................................................... 19,271 0.08
3,900 Hong Kong Exchanges & Clearing Ltd ............................................................. 227,808 0.97
3,000 Swire Pacific Ltd .............................................................................................. 17,066 0.07
6,000 Swire Properties Ltd ......................................................................................... 15,038 0.06
367,667 1.56
India: 1.52% (30 June 2021: 1.72%)
756 Colgate-Palmolive India Ltd ............................................................................. 15,065 0.06
3,744 Dabur India Ltd ................................................................................................ 29,215 0.12
864 Hero MotoCorp Ltd ........................................................................................... 28,617 0.12
5,472 Hindustan Unilever Ltd ..................................................................................... 173,735 0.74
3,924 Indus Towers Ltd ............................................................................................. 13,107 0.06
4,044 Marico Ltd ........................................................................................................ 27,889 0.12
270 Nestle India Ltd ................................................................................................ 71,575 0.30
359,203 1.52
Indonesia: 0.31% (30 June 2021: 0.06%)
139,800 Kalbe Farma Tbk PT ........................................................................................ 15,841 0.07
201,000 Telkom Indonesia Persero Tbk PT ................................................................... 56,975 0.24
72,816 0.31
Ireland: 0.19% (30 June 2021: 0.31%)
360 Jazz Pharmaceuticals Plc ................................................................................ 45,864 0.19
45,864 0.19
Israel: 0.23% (30 June 2021: Nil)
4,974 Bank Leumi Le-Israel BM ................................................................................. 53,457 0.23
53,457 0.23
Italy: 1.23% (30 June 2021: 1.22%)
82,926 Intesa Sanpaolo SpA ....................................................................................... 214,446 0.90
12,816 Snam SpA ........................................................................................................ 77,244 0.33
291,690 1.23

SCHEDULE OF INVESTMENTS AS AT 31 DECEMBER 2021 (continued)
Franklin LibertyQ Global Equity SRI UCITS ETF (continued)
Franklin LibertyShares ICAV Interim Report 141
Holding Investment Fair Value
USD % of Net
Assets
Transferable Securities: 99.76% (30 June 2021: 99.74%) (continued)
Equities: 99.76% (30 June 2021: 99.74%) (continued)
Japan: 11.41% (30 June 2021: 11.53%)
2,400 Ajinomoto Co Inc .............................................................................................. 72,883 0.31
7,800 Asahi Kasei Corp .............................................................................................. 73,221 0.31
13,800 Astellas Pharma Inc .......................................................................................... 224,158 0.95
900 Capcom Co Ltd ................................................................................................ 21,165 0.09
3,900 Chugai Pharmaceutical Co Ltd .......................................................................... 126,495 0.54
1,055 Daikin Industries Ltd ......................................................................................... 239,025 1.01
1,930 FUJIFILM Holdings Corp ................................................................................... 142,896 0.60
1,100 Fujitsu Ltd ......................................................................................................... 188,468 0.80
2,400 Hulic Co Ltd ...................................................................................................... 22,759 0.10
3,300 Kao Corp .......................................................................................................... 172,487 0.73
7,800 KDDI Corp ........................................................................................................ 227,724 0.96
600 Kobe Bussan Co Ltd ......................................................................................... 23,212 0.10
400 Kurita Water Industries Ltd ................................................................................ 18,966 0.08
800 Nippon Yusen KK ............................................................................................. 60,857 0.26
1,050 Nitto Denko Corp .............................................................................................. 81,060 0.34
2,400 Nomura Research Institute Ltd .......................................................................... 102,853 0.44
6,600 ORIX Corp ........................................................................................................ 134,545 0.57
5,100 Sekisui House Ltd ............................................................................................. 109,347 0.46
2,400 SG Holdings Co Ltd .......................................................................................... 56,126 0.24
3,600 Shimizu Corp .................................................................................................... 22,290 0.09
1,900 Shionogi & Co Ltd ............................................................................................. 134,058 0.57
600 Stanley Electric Co Ltd ...................................................................................... 15,001 0.06
1,000 Sysmex Corp .................................................................................................... 135,035 0.57
435 Tokyo Electron Ltd ............................................................................................ 250,374 1.05
1,800 Yamaha Motor Co Ltd ....................................................................................... 43,126 0.18
2,698,131 11.41
Jersey: 1.30% (30 June 2021: 1.25%)
1,422 Ferguson Plc ..................................................................................................... 252,406 1.06
3,132 Polymetal International Plc ................................................................................ 54,805 0.24
307,211 1.30
Malaysia: 0.60% (30 June 2021: 0.68%)
10,200 AMMB Holdings Bhd ......................................................................................... 7,761 0.03
24,600 DiGi.Com Bhd ................................................................................................... 25,746 0.11
1,200 Fraser & Neave Holdings Bhd ........................................................................... 7,126 0.03
3,600 HAP Seng Consolidated Bhd ............................................................................ 6,654 0.03
17,400 Hartalega Holdings Bhd .................................................................................... 23,932 0.10
13,800 Maxis Bhd ......................................................................................................... 16,066 0.07
600 Nestle Malaysia Bhd ......................................................................................... 19,328 0.08
1,800 Petronas Dagangan Bhd ................................................................................... 8,901 0.04
11,400 RHB Bank Bhd .................................................................................................. 14,695 0.06
19,200 Sime Darby Bhd ................................................................................................ 10,692 0.05
140,901 0.60
Netherlands: 1.27% (30 June 2021: 1.31%)
264 ASML Holding NV ............................................................................................. 212,166 0.90
1,626 NN Group NV .................................................................................................... 88,035 0.37
300,201 1.27
New Zealand: 0.65% (30 June 2021: 0.65%)
5,202 Fisher & Paykel Healthcare Corp Ltd ................................................................ 116,676 0.49
12,318 Spark New Zealand Ltd ..................................................................................... 38,120 0.16
154,796 0.65
Norway: 0.59% (30 June 2021: 0.64%)
5,586 Orkla ASA ......................................................................................................... 55,972 0.24
5,358 Telenor ASA ..................................................................................................... 84,213 0.35
140,185 0.59
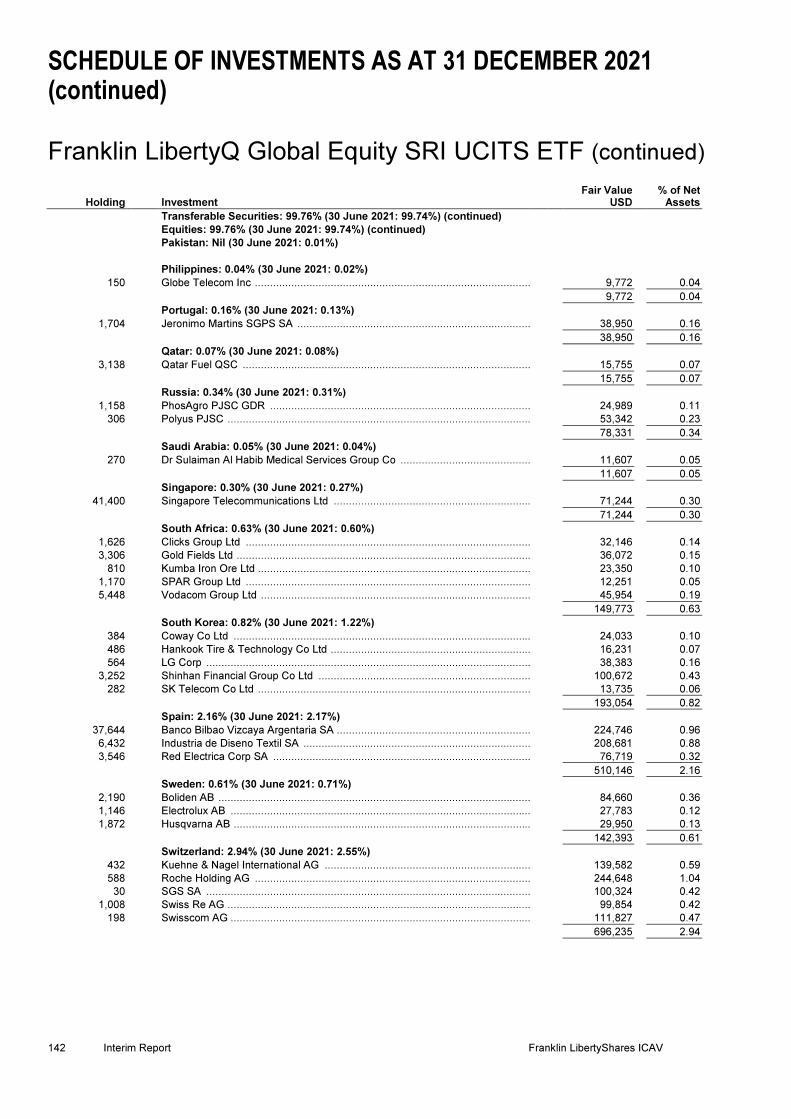
SCHEDULE OF INVESTMENTS AS AT 31 DECEMBER 2021 (continued)
Franklin LibertyQ Global Equity SRI UCITS ETF (continued)
142 Interim Report Franklin LibertyShares ICAV
Holding Investment Fair Value
USD % of Net
Assets
Transferable Securities: 99.76% (30 June 2021: 99.74%) (continued)
Equities: 99.76% (30 June 2021: 99.74%) (continued)
Pakistan: Nil (30 June 2021: 0.01%)
Philippines: 0.04% (30 June 2021: 0.02%)
150 Globe Telecom Inc ........................................................................................... 9,772 0.04
9,772 0.04
Portugal: 0.16% (30 June 2021: 0.13%)
1,704 Jeronimo Martins SGPS SA ............................................................................. 38,950 0.16
38,950 0.16
Qatar: 0.07% (30 June 2021: 0.08%)
3,138 Qatar Fuel QSC ............................................................................................... 15,755 0.07
15,755 0.07
Russia: 0.34% (30 June 2021: 0.31%)
1,158 PhosAgro PJSC GDR ...................................................................................... 24,989 0.11
306 Polyus PJSC .................................................................................................... 53,342 0.23
78,331 0.34
Saudi Arabia: 0.05% (30 June 2021: 0.04%)
270 Dr Sulaiman Al Habib Medical Services Group Co ........................................... 11,607 0.05
11,607 0.05
Singapore: 0.30% (30 June 2021: 0.27%)
41,400 Singapore Telecommunications Ltd ................................................................. 71,244 0.30
71,244 0.30
South Africa: 0.63% (30 June 2021: 0.60%)
1,626 Clicks Group Ltd .............................................................................................. 32,146 0.14
3,306 Gold Fields Ltd ................................................................................................. 36,072 0.15
810 Kumba Iron Ore Ltd .......................................................................................... 23,350 0.10
1,170 SPAR Group Ltd .............................................................................................. 12,251 0.05
5,448 Vodacom Group Ltd ......................................................................................... 45,954 0.19
149,773 0.63
South Korea: 0.82% (30 June 2021: 1.22%)
384 Coway Co Ltd .................................................................................................. 24,033 0.10
486 Hankook Tire & Technology Co Ltd .................................................................. 16,231 0.07
564 LG Corp ........................................................................................................... 38,383 0.16
3,252 Shinhan Financial Group Co Ltd ...................................................................... 100,672 0.43
282 SK Telecom Co Ltd .......................................................................................... 13,735 0.06
193,054 0.82
Spain: 2.16% (30 June 2021: 2.17%)
37,644 Banco Bilbao Vizcaya Argentaria SA ................................................................ 224,746 0.96
6,432 Industria de Diseno Textil SA ........................................................................... 208,681 0.88
3,546 Red Electrica Corp SA ..................................................................................... 76,719 0.32
510,146 2.16
Sweden: 0.61% (30 June 2021: 0.71%)
2,190 Boliden AB ....................................................................................................... 84,660 0.36
1,146 Electrolux AB ................................................................................................... 27,783 0.12
1,872 Husqvarna AB .................................................................................................. 29,950 0.13
142,393 0.61
Switzerland: 2.94% (30 June 2021: 2.55%)
432 Kuehne & Nagel International AG .................................................................... 139,582 0.59
588 Roche Holding AG ........................................................................................... 244,648 1.04
30 SGS SA ........................................................................................................... 100,324 0.42
1,008 Swiss Re AG .................................................................................................... 99,854 0.42
198 Swisscom AG ................................................................................................... 111,827 0.47
696,235 2.94

SCHEDULE OF INVESTMENTS AS AT 31 DECEMBER 2021 (continued)
Franklin LibertyQ Global Equity SRI UCITS ETF (continued)
Franklin LibertyShares ICAV Interim Report 143
Holding Investment Fair Value
USD % of Net
Assets
Transferable Securities: 99.76% (30 June 2021: 99.74%) (continued)
Equities: 99.76% (30 June 2021: 99.74%) (continued)
Taiwan: 3.06% (30 June 2021: 2.62%)
42,000 Cathay Financial Holding Co Ltd ....................................................................... 94,878 0.40
27,000 Chunghwa Telecom Co Ltd ............................................................................... 113,691 0.48
10,000 Evergreen Marine Corp Taiwan Ltd ................................................................... 51,505 0.22
12,000 Far EasTone Telecommunications Co Ltd ........................................................ 28,019 0.12
45,000 Fubon Financial Holding Co Ltd ........................................................................ 124,102 0.52
3,300 President Chain Store Corp .............................................................................. 32,622 0.14
12,000 Taiwan Mobile Co Ltd ....................................................................................... 43,373 0.18
10,530 Taiwan Semiconductor Manufacturing Co Ltd ................................................... 234,068 1.00
722,258 3.06
Thailand: 0.89% (30 June 2021: 1.01%)
9,000 Advanced Info Service PCL .............................................................................. 61,967 0.26
3,000 Bumrungrad Hospital PCL ................................................................................ 12,663 0.05
13,800 Central Pattana PCL ......................................................................................... 23,341 0.10
36,000 Home Product Center PCL ............................................................................... 15,626 0.07
14,400 Intouch Holdings PCL ....................................................................................... 34,594 0.15
5,400 Siam Cement PCL ............................................................................................ 62,397 0.26
210,588 0.89
Turkey: 0.06% (30 June 2021: 0.08%)
10,992 Turkcell Iletisim Hizmetleri AS ........................................................................... 15,280 0.06
15,280 0.06
United Kingdom: 4.88% (30 June 2021: 4.31%)
7,572 Barratt Developments Plc ................................................................................. 76,714 0.32
780 Berkeley Group Holdings Plc ............................................................................ 50,446 0.21
5,910 British Land Co Plc ........................................................................................... 42,505 0.18
46,302 BT Group Plc .................................................................................................... 106,331 0.45
942 Croda International Plc ..................................................................................... 129,121 0.55
11,424 J Sainsbury Plc ................................................................................................ 42,675 0.18
924 Johnson Matthey Plc ......................................................................................... 25,606 0.11
15,552 Kingfisher Plc .................................................................................................... 71,261 0.30
3,492 Mondi Plc .......................................................................................................... 86,365 0.37
7,422 RELX Plc .......................................................................................................... 241,468 1.02
762 Schroders Plc ................................................................................................... 36,742 0.16
4,536 Unilever Plc ...................................................................................................... 242,403 1.03
1,151,637 4.88
United States: 41.21% (30 June 2021: 39.72%)
264 ABIOMED Inc ................................................................................................... 94,821 0.40
906 American Tower Corp ....................................................................................... 265,004 1.12
570 AmerisourceBergen Corp .................................................................................. 75,747 0.32
1,140 Amgen Inc ........................................................................................................ 256,466 1.08
4,020 Bank of New York Mellon Corp ......................................................................... 233,482 0.99
1,710 Best Buy Co Inc ................................................................................................ 173,736 0.73
906 Biogen Inc ......................................................................................................... 217,368 0.92
1,272 Campbell Soup Co ............................................................................................ 55,281 0.23
1,800 Cardinal Health Inc ........................................................................................... 92,682 0.39
1,794 Cerner Corp ...................................................................................................... 166,609 0.70
894 CH Robinson Worldwide Inc ............................................................................. 96,221 0.41
4,332 Cisco Systems Inc ............................................................................................ 274,519 1.17
1,044 Clorox Co .......................................................................................................... 182,032 0.77
3,042 Colgate-Palmolive Co ....................................................................................... 259,604 1.10
2,058 Consolidated Edison Inc ................................................................................... 175,589 0.74
1,020 Cummins Inc ..................................................................................................... 222,503 0.94
2,994 eBay Inc ............................................................................................................ 199,101 0.84
1,692 Electronic Arts Inc ............................................................................................. 223,175 0.94
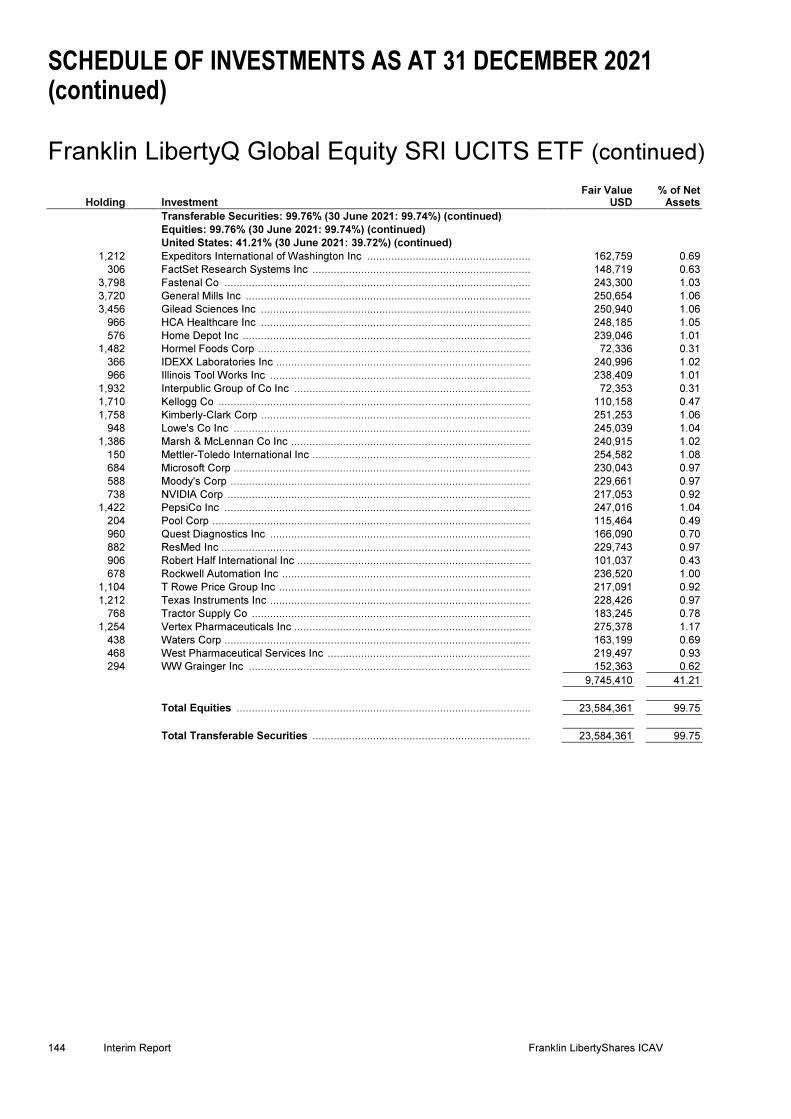
SCHEDULE OF INVESTMENTS AS AT 31 DECEMBER 2021 (continued)
Franklin LibertyQ Global Equity SRI UCITS ETF (continued)
144 Interim Report Franklin LibertyShares ICAV
Holding Investment Fair Value
USD % of Net
Assets
Transferable Securities: 99.76% (30 June 2021: 99.74%) (continued)
Equities: 99.76% (30 June 2021: 99.74%) (continued)
United States: 41.21% (30 June 2021: 39.72%) (continued)
1,212 Expeditors International of Washington Inc ...................................................... 162,759 0.69
306 FactSet Research Systems Inc ........................................................................ 148,719 0.63
3,798 Fastenal Co ..................................................................................................... 243,300 1.03
3,720 General Mills Inc .............................................................................................. 250,654 1.06
3,456 Gilead Sciences Inc ......................................................................................... 250,940 1.06
966 HCA Healthcare Inc ......................................................................................... 248,185 1.05
576 Home Depot Inc ............................................................................................... 239,046 1.01
1,482 Hormel Foods Corp .......................................................................................... 72,336 0.31
366 IDEXX Laboratories Inc .................................................................................... 240,996 1.02
966 Illinois Tool Works Inc ...................................................................................... 238,409 1.01
1,932 Interpublic Group of Co Inc .............................................................................. 72,353 0.31
1,710 Kellogg Co ....................................................................................................... 110,158 0.47
1,758 Kimberly-Clark Corp ......................................................................................... 251,253 1.06
948 Lowe's Co Inc .................................................................................................. 245,039 1.04
1,386 Marsh & McLennan Co Inc ............................................................................... 240,915 1.02
150 Mettler-Toledo International Inc ........................................................................ 254,582 1.08
684 Microsoft Corp .................................................................................................. 230,043 0.97
588 Moody's Corp ................................................................................................... 229,661 0.97
738 NVIDIA Corp .................................................................................................... 217,053 0.92
1,422 PepsiCo Inc ..................................................................................................... 247,016 1.04
204 Pool Corp ......................................................................................................... 115,464 0.49
960 Quest Diagnostics Inc ...................................................................................... 166,090 0.70
882 ResMed Inc ...................................................................................................... 229,743 0.97
906 Robert Half International Inc ............................................................................. 101,037 0.43
678 Rockwell Automation Inc .................................................................................. 236,520 1.00
1,104 T Rowe Price Group Inc ................................................................................... 217,091 0.92
1,212 Texas Instruments Inc ...................................................................................... 228,426 0.97
768 Tractor Supply Co ............................................................................................ 183,245 0.78
1,254 Vertex Pharmaceuticals Inc .............................................................................. 275,378 1.17
438 Waters Corp ..................................................................................................... 163,199 0.69
468 West Pharmaceutical Services Inc ................................................................... 219,497 0.93
294 WW Grainger Inc ............................................................................................. 152,363 0.62
9,745,410 41.21
Total Equities ................................................................................................................................ 23,584,361 99.75
Total Transferable Securities ................................................................................................ 23,584,361 99.75

SCHEDULE OF INVESTMENTS AS AT 31 DECEMBER 2021 (continued)
Franklin LibertyQ Global Equity SRI UCITS ETF (continued)
Franklin LibertyShares ICAV Interim Report 145
Financial Derivative Instruments: 0.01% (30 June 2021: (0.00)%)
Futures contracts: 0.01% (30 June 2021: (0.00)%)*
Notional Amount
USD
Average Cost Price USD
Unrealised Gain USD
% of Net Assets
37,854 379 MSCI ACWI Long Futures Contracts Expiring March 2022 ................................................................ 1,261
0.01
Net unrealised gain on futures contracts ................................ 1,261 0.01
Total Financial Derivative Instruments ................................ 1,261 0.01
Fair Value USD
% of Net Assets
Portfolio of Investments ................................................................................................ 23,585,622 99.76
Other Net Assets ................................................................................................ 56,042 0.24
Net Assets ................................................................................................................................ 23,641,664 100.00
Analysis of Total Assets
% of Total Assets
Transferable securities admitted to an official stock exchange listing ................................ 99.70
Exchange-Traded Derivative Instruments ................................................................ 0.01
Other Current Assets ................................................................................................ 0.29
Total Assets ................................................................................................................................ 100.00
Country classifications are based upon country of incorporation and/or country of domicile.
* The counterparty for the futures contracts is J.P. Morgan. The value of variation margin cash at broker as at 31 December 2021 is USD
923.
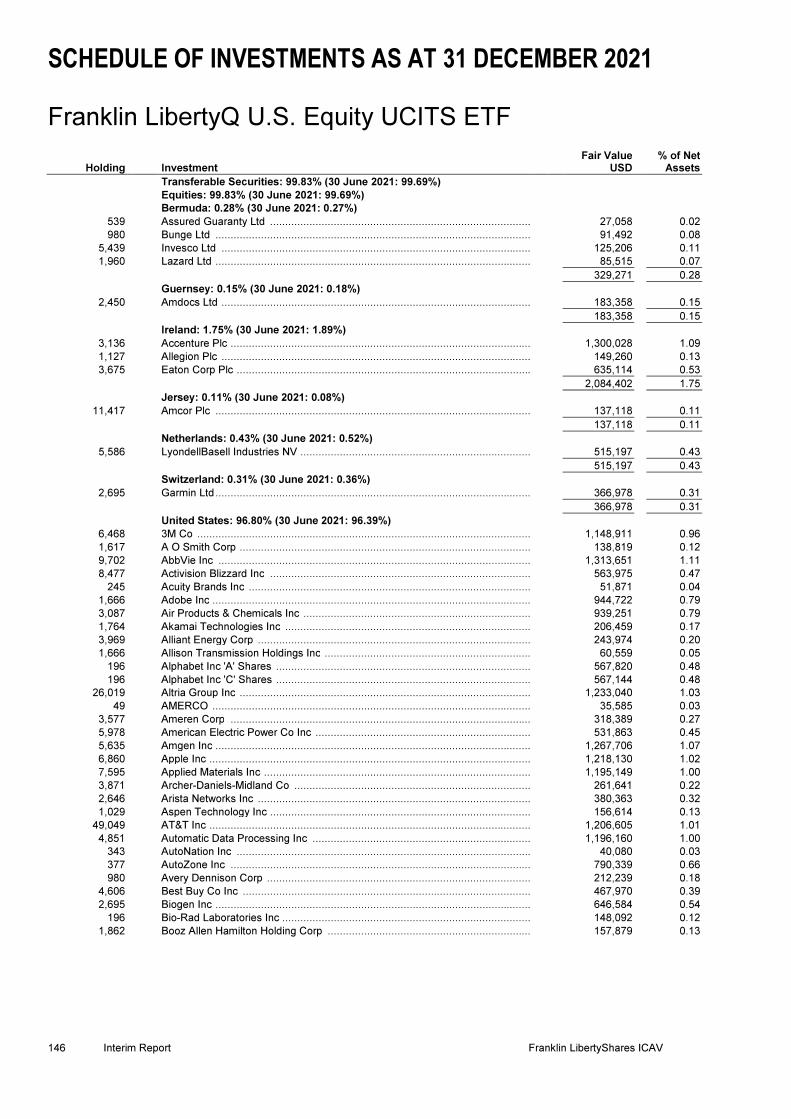
SCHEDULE OF INVESTMENTS AS AT 31 DECEMBER 2021 Franklin LibertyQ U.S. Equity UCITS ETF
146 Interim Report Franklin LibertyShares ICAV
Holding Investment Fair Value
USD % of Net
Assets
Transferable Securities: 99.83% (30 June 2021: 99.69%)
Equities: 99.83% (30 June 2021: 99.69%)
Bermuda: 0.28% (30 June 2021: 0.27%)
539 Assured Guaranty Ltd ...................................................................................... 27,058 0.02
980 Bunge Ltd ........................................................................................................ 91,492 0.08
5,439 Invesco Ltd ...................................................................................................... 125,206 0.11
1,960 Lazard Ltd ........................................................................................................ 85,515 0.07
329,271 0.28
Guernsey: 0.15% (30 June 2021: 0.18%)
2,450 Amdocs Ltd ...................................................................................................... 183,358 0.15
183,358 0.15
Ireland: 1.75% (30 June 2021: 1.89%)
3,136 Accenture Plc ................................................................................................... 1,300,028 1.09
1,127 Allegion Plc ...................................................................................................... 149,260 0.13
3,675 Eaton Corp Plc ................................................................................................. 635,114 0.53
2,084,402 1.75
Jersey: 0.11% (30 June 2021: 0.08%)
11,417 Amcor Plc ........................................................................................................ 137,118 0.11
137,118 0.11
Netherlands: 0.43% (30 June 2021: 0.52%)
5,586 LyondellBasell Industries NV ............................................................................ 515,197 0.43
515,197 0.43
Switzerland: 0.31% (30 June 2021: 0.36%)
2,695 Garmin Ltd ........................................................................................................ 366,978 0.31
366,978 0.31
United States: 96.80% (30 June 2021: 96.39%)
6,468 3M Co .............................................................................................................. 1,148,911 0.96
1,617 A O Smith Corp ................................................................................................ 138,819 0.12
9,702 AbbVie Inc ....................................................................................................... 1,313,651 1.11
8,477 Activision Blizzard Inc ...................................................................................... 563,975 0.47
245 Acuity Brands Inc ............................................................................................. 51,871 0.04
1,666 Adobe Inc ......................................................................................................... 944,722 0.79
3,087 Air Products & Chemicals Inc ........................................................................... 939,251 0.79
1,764 Akamai Technologies Inc ................................................................................. 206,459 0.17
3,969 Alliant Energy Corp .......................................................................................... 243,974 0.20
1,666 Allison Transmission Holdings Inc .................................................................... 60,559 0.05
196 Alphabet Inc 'A' Shares .................................................................................... 567,820 0.48
196 Alphabet Inc 'C' Shares .................................................................................... 567,144 0.48
26,019 Altria Group Inc ................................................................................................ 1,233,040 1.03
49 AMERCO ......................................................................................................... 35,585 0.03
3,577 Ameren Corp ................................................................................................... 318,389 0.27
5,978 American Electric Power Co Inc ....................................................................... 531,863 0.45
5,635 Amgen Inc ........................................................................................................ 1,267,706 1.07
6,860 Apple Inc .......................................................................................................... 1,218,130 1.02
7,595 Applied Materials Inc ........................................................................................ 1,195,149 1.00
3,871 Archer-Daniels-Midland Co .............................................................................. 261,641 0.22
2,646 Arista Networks Inc .......................................................................................... 380,363 0.32
1,029 Aspen Technology Inc ...................................................................................... 156,614 0.13
49,049 AT&T Inc .......................................................................................................... 1,206,605 1.01
4,851 Automatic Data Processing Inc ........................................................................ 1,196,160 1.00
343 AutoNation Inc ................................................................................................. 40,080 0.03
377 AutoZone Inc ................................................................................................... 790,339 0.66
980 Avery Dennison Corp ....................................................................................... 212,239 0.18
4,606 Best Buy Co Inc ............................................................................................... 467,970 0.39
2,695 Biogen Inc ........................................................................................................ 646,584 0.54
196 Bio-Rad Laboratories Inc .................................................................................. 148,092 0.12
1,862 Booz Allen Hamilton Holding Corp ................................................................... 157,879 0.13

SCHEDULE OF INVESTMENTS AS AT 31 DECEMBER 2021 (continued) Franklin LibertyQ U.S. Equity UCITS ETF (continued)
Franklin LibertyShares ICAV Interim Report 147
Holding Investment Fair Value
USD % of Net
Assets
Transferable Securities: 99.83% (30 June 2021: 99.69%) (continued)
Equities: 99.83% (30 June 2021: 99.69%) (continued)
United States: 96.80% (30 June 2021: 96.39%) (continued)
98 Boston Beer Co Inc ........................................................................................... 49,500 0.04
20,139 Bristol-Myers Squibb Co ................................................................................... 1,255,666 1.05
539 Brunswick Corp ................................................................................................ 54,293 0.05
1,127 Cadence Design Systems Inc ........................................................................... 210,016 0.18
2,303 Campbell Soup Co ............................................................................................ 100,088 0.08
2,205 Cardinal Health Inc ........................................................................................... 113,535 0.10
784 Carter's Inc ....................................................................................................... 79,356 0.07
637 Casey's General Stores Inc ............................................................................... 125,712 0.11
441 Cboe Global Markets Inc ................................................................................... 57,506 0.05
1,715 Celanese Corp .................................................................................................. 288,223 0.24
4,949 Cerner Corp ...................................................................................................... 459,614 0.39
2,499 CH Robinson Worldwide Inc ............................................................................. 268,967 0.23
245 Chemed Corp ................................................................................................... 129,615 0.11
4,361 Church & Dwight Co Inc .................................................................................... 447,003 0.37
1,421 Cintas Corp ....................................................................................................... 629,745 0.53
20,433 Cisco Systems Inc ............................................................................................ 1,294,839 1.09
1,911 Cleveland-Cliffs Inc ........................................................................................... 41,602 0.03
21,364 Coca-Cola Co ................................................................................................... 1,264,962 1.07
8,526 Cognizant Technology Solutions Corp .............................................................. 756,427 0.63
3,234 Colgate-Palmolive Co ....................................................................................... 275,990 0.23
22,393 Comcast Corp ................................................................................................... 1,127,040 0.94
3,332 Conagra Brands Inc .......................................................................................... 113,788 0.10
5,635 Consolidated Edison Inc ................................................................................... 480,778 0.40
196 Cooper Co Inc ................................................................................................... 82,112 0.07
3,675 Copart Inc ......................................................................................................... 557,204 0.47
2,058 Costco Wholesale Corp .................................................................................... 1,168,327 0.98
8,085 Coterra Energy Inc ............................................................................................ 153,615 0.13
1,470 CubeSmart ....................................................................................................... 83,658 0.07
2,695 Cummins Inc ..................................................................................................... 587,887 0.49
9,359 CVS Health Corp .............................................................................................. 965,474 0.81
1,078 Dell Technologies Inc ........................................................................................ 60,551 0.05
539 Dick's Sporting Goods Inc ................................................................................. 61,980 0.05
4,263 Dollar General Corp .......................................................................................... 1,005,343 0.84
5,978 Dow Inc ............................................................................................................. 339,072 0.28
4,214 DR Horton Inc ................................................................................................... 457,008 0.38
294 Eagle Materials Inc ........................................................................................... 48,939 0.04
6,958 eBay Inc ............................................................................................................ 462,707 0.39
3,136 Electronic Arts Inc ............................................................................................. 413,638 0.35
4,508 Eli Lilly & Co ..................................................................................................... 1,245,199 1.04
10,290 Emerson Electric Co ......................................................................................... 956,661 0.80
392 EPAM Systems Inc ........................................................................................... 262,032 0.22
3,381 Estee Lauder Co Inc ......................................................................................... 1,251,645 1.05
490 Evercore Inc ..................................................................................................... 66,567 0.06
3,332 Evergy Inc ......................................................................................................... 228,609 0.19
3,185 Expeditors International of Washington Inc ....................................................... 427,714 0.36
1,274 Extra Space Storage Inc ................................................................................... 288,854 0.24
1,078 F5 Inc ............................................................................................................... 263,797 0.22
686 FactSet Research Systems Inc ......................................................................... 333,403 0.28
294 Fair Isaac Corp ................................................................................................ 127,499 0.11
11,466 Fastenal Co ...................................................................................................... 734,512 0.62
3,528 Flowers Foods Inc ............................................................................................. 96,914 0.08
2,205 Foot Locker Inc ................................................................................................ 96,204 0.08

SCHEDULE OF INVESTMENTS AS AT 31 DECEMBER 2021 (continued) Franklin LibertyQ U.S. Equity UCITS ETF (continued)
148 Interim Report Franklin LibertyShares ICAV
Holding Investment Fair Value
USD % of Net
Assets
Transferable Securities: 99.83% (30 June 2021: 99.69%) (continued)
Equities: 99.83% (30 June 2021: 99.69%) (continued)
United States: 96.80% (30 June 2021: 96.39%) (continued)
1,568 Fortinet Inc ....................................................................................................... 563,539 0.47
2,303 Fox Corp .......................................................................................................... 84,981 0.07
343 FTI Consulting Inc ............................................................................................ 52,623 0.04
686 Generac Holdings Inc ....................................................................................... 241,417 0.20
1,862 General Dynamics Corp ................................................................................... 388,171 0.33
11,515 General Mills Inc .............................................................................................. 775,881 0.65
4,949 Gentex Corp .................................................................................................... 172,473 0.14
1,029 Genuine Parts Co ............................................................................................ 144,266 0.12
16,219 Gilead Sciences Inc ......................................................................................... 1,177,662 0.99
2,940 Graco Inc ......................................................................................................... 237,023 0.20
441 Grand Canyon Education Inc ........................................................................... 37,798 0.03
3,920 H&R Block Inc .................................................................................................. 92,355 0.08
1,862 Hawaiian Electric Industries Inc ........................................................................ 77,273 0.06
2,940 Hershey Co ...................................................................................................... 568,802 0.48
10,094 Hewlett Packard Enterprise Co ........................................................................ 159,182 0.13
1,029 Hologic Inc ....................................................................................................... 78,780 0.07
2,793 Home Depot Inc ............................................................................................... 1,159,123 0.97
5,145 Hormel Foods Corp .......................................................................................... 251,127 0.21
27,048 HP Inc .............................................................................................................. 1,018,898 0.85
539 Hubbell Inc ....................................................................................................... 112,258 0.09
735 Huntington Ingalls Industries Inc ...................................................................... 137,254 0.11
2,352 Huntsman Corp ................................................................................................ 82,038 0.07
980 IDEXX Laboratories Inc .................................................................................... 645,291 0.54
4,802 Illinois Tool Works Inc ...................................................................................... 1,185,134 0.99
1,127 Ingredion Inc .................................................................................................... 108,913 0.09
22,736 Intel Corp ......................................................................................................... 1,170,904 0.98
9,212 International Business Machines Corp ............................................................. 1,231,276 1.03
4,018 International Paper Co ..................................................................................... 188,766 0.16
6,272 Interpublic Group of Co Inc .............................................................................. 234,886 0.20
1,715 Intuit Inc ........................................................................................................... 1,103,122 0.92
1,764 J M Smucker Co .............................................................................................. 239,586 0.20
1,372 Jack Henry & Associates Inc ............................................................................ 229,110 0.19
1,568 JB Hunt Transport Services Inc ........................................................................ 320,499 0.27
2,450 Jefferies Financial Group Inc ............................................................................ 95,060 0.08
7,203 Johnson & Johnson .......................................................................................... 1,232,217 1.03
3,969 Kellogg Co ....................................................................................................... 255,683 0.21
735 Keysight Technologies Inc ............................................................................... 151,785 0.13
2,646 Kimberly-Clark Corp ......................................................................................... 378,166 0.32
2,744 KLA Corp ......................................................................................................... 1,180,222 0.99
637 Knight-Swift Transportation Holdings Inc .......................................................... 38,819 0.03
11,809 Kroger Co ........................................................................................................ 534,475 0.45
686 Laboratory Corp of America Holdings ............................................................... 215,548 0.18
1,666 Lam Research Corp ......................................................................................... 1,198,104 1.00
686 Landstar System Inc ........................................................................................ 122,808 0.10
2,009 Lennar Corp ..................................................................................................... 233,365 0.20
490 Lennox International Inc ................................................................................... 158,936 0.13
588 Life Storage Inc ................................................................................................ 90,070 0.08
637 Lincoln Electric Holdings Inc ............................................................................ 88,842 0.07
3,234 Lockheed Martin Corp ...................................................................................... 1,149,396 0.96
784 Louisiana-Pacific Corp ..................................................................................... 61,426 0.05
2,695 Lowe's Co Inc .................................................................................................. 696,604 0.58
245 Manhattan Associates Inc ................................................................................ 38,095 0.03

SCHEDULE OF INVESTMENTS AS AT 31 DECEMBER 2021 (continued) Franklin LibertyQ U.S. Equity UCITS ETF (continued)
Franklin LibertyShares ICAV Interim Report 149
Holding Investment Fair Value
USD % of Net
Assets
Transferable Securities: 99.83% (30 June 2021: 99.69%) (continued)
Equities: 99.83% (30 June 2021: 99.69%) (continued)
United States: 96.80% (30 June 2021: 96.39%) (continued)
392 ManpowerGroup Inc ......................................................................................... 38,153 0.03
3,528 Mastercard Inc .................................................................................................. 1,267,681 1.07
4,557 McDonald's Corp .............................................................................................. 1,221,595 1.02
14,945 Merck & Co Inc ................................................................................................ 1,145,385 0.96
3,430 Meta Platforms Inc ............................................................................................ 1,153,681 0.97
441 Mettler-Toledo International Inc ......................................................................... 748,470 0.63
3,381 Microsoft Corp .................................................................................................. 1,137,098 0.95
2,793 Moderna Inc ...................................................................................................... 709,366 0.59
490 Monolithic Power Systems Inc .......................................................................... 241,732 0.20
6,272 Monster Beverage Corp .................................................................................... 602,363 0.50
2,401 Moody's Corp .................................................................................................... 937,783 0.79
2,891 Motorola Solutions Inc ...................................................................................... 785,485 0.66
784 MSC Industrial Direct Co Inc ............................................................................. 65,903 0.06
686 National Fuel Gas Co ........................................................................................ 43,863 0.04
3,136 National Retail Properties Inc ............................................................................ 150,748 0.13
4,165 NetApp Inc ........................................................................................................ 383,138 0.32
3,332 New York Community Bancorp Inc .................................................................... 40,684 0.03
147 NewMarket Corp ............................................................................................... 50,380 0.04
8,722 Newmont Corp .................................................................................................. 540,938 0.45
4,900 NIKE Inc ........................................................................................................... 816,683 0.68
2,058 Northrop Grumman Corp .................................................................................. 796,590 0.67
1,176 NRG Energy Inc ................................................................................................ 50,662 0.04
4,606 Nucor Corp ....................................................................................................... 525,775 0.44
57 NVR Inc ............................................................................................................ 336,806 0.28
1,470 OGE Energy Corp ............................................................................................. 56,419 0.05
1,421 Old Dominion Freight Line Inc ........................................................................... 509,258 0.43
2,009 Old Republic International Corp ........................................................................ 49,381 0.04
3,871 Omnicom Group Inc .......................................................................................... 283,628 0.24
12,348 Oracle Corp ...................................................................................................... 1,076,869 0.90
1,304 O'Reilly Automotive Inc ..................................................................................... 920,924 0.77
2,303 Organon & Co ................................................................................................... 70,126 0.06
637 Orion Office REIT Inc ........................................................................................ 11,893 0.01
4,557 PACCAR Inc ..................................................................................................... 402,201 0.34
1,568 Packaging Corp of America .............................................................................. 213,483 0.18
6,321 Paychex Inc ...................................................................................................... 862,817 0.72
245 Penske Automotive Group Inc ........................................................................... 26,269 0.02
4,263 People's United Financial Inc ............................................................................ 75,967 0.06
7,007 PepsiCo Inc ...................................................................................................... 1,217,186 1.02
20,825 Pfizer Inc ........................................................................................................... 1,229,716 1.03
13,034 Philip Morris International Inc ............................................................................ 1,238,229 1.04
441 Polaris Inc ......................................................................................................... 48,470 0.04
784 Pool Corp .......................................................................................................... 443,744 0.37
1,519 Premier Inc ....................................................................................................... 62,537 0.05
7,742 Procter & Gamble Co ........................................................................................ 1,266,435 1.07
7,007 Progressive Corp .............................................................................................. 719,269 0.59
3,234 Public Storage .................................................................................................. 1,211,327 1.01
3,871 PulteGroup Inc .................................................................................................. 221,266 0.19
6,223 QUALCOMM Inc ............................................................................................... 1,138,000 0.95
980 Quanta Services Inc .......................................................................................... 112,367 0.09
1,323 Quest Diagnostics Inc ....................................................................................... 228,892 0.19
441 Quidel Corp ...................................................................................................... 59,531 0.05
3,136 Qurate Retail Inc ............................................................................................... 23,834 0.02

SCHEDULE OF INVESTMENTS AS AT 31 DECEMBER 2021 (continued) Franklin LibertyQ U.S. Equity UCITS ETF (continued)
150 Interim Report Franklin LibertyShares ICAV
Holding Investment Fair Value
USD % of Net
Assets
Transferable Securities: 99.83% (30 June 2021: 99.69%) (continued)
Equities: 99.83% (30 June 2021: 99.69%) (continued)
United States: 96.80% (30 June 2021: 96.39%) (continued)
6,664 Realty Income Corp ......................................................................................... 477,076 0.40
1,421 Regeneron Pharmaceuticals Inc ...................................................................... 897,390 0.75
882 Reliance Steel & Aluminum Co ........................................................................ 143,078 0.12
2,499 ResMed Inc ...................................................................................................... 650,940 0.55
2,352 Robert Half International Inc ............................................................................. 262,295 0.22
2,156 Rockwell Automation Inc .................................................................................. 752,121 0.63
4,165 Rollins Inc ........................................................................................................ 142,485 0.12
196 Ryder System Inc ............................................................................................. 16,156 0.01
2,450 S&P Global Inc ................................................................................................. 1,156,229 0.97
588 Schneider National Inc ..................................................................................... 15,823 0.01
1,764 SEI Investments Co ......................................................................................... 107,498 0.09
588 Silgan Holdings Inc .......................................................................................... 25,190 0.02
1,274 Skillz Inc .......................................................................................................... 9,479 0.01
3,283 Skyworks Solutions Inc .................................................................................... 509,325 0.43
539 SL Green Realty Corp ...................................................................................... 38,646 0.03
882 Snap-on Inc ..................................................................................................... 189,965 0.16
15,239 Southern Co ..................................................................................................... 1,045,091 0.88
784 Southern Copper Corp ..................................................................................... 48,381 0.04
1,960 Spirit Realty Capital Inc .................................................................................... 94,452 0.08
3,283 Steel Dynamics Inc .......................................................................................... 203,776 0.17
3,724 STORE Capital Corp ........................................................................................ 128,106 0.11
286 Sylvamo Corp .................................................................................................. 7,977 0.01
4,214 Synchrony Financial ......................................................................................... 195,487 0.16
3,038 T Rowe Price Group Inc ................................................................................... 597,392 0.50
4,606 Target Corp ...................................................................................................... 1,066,013 0.89
1,519 Teradyne Inc .................................................................................................... 248,402 0.21
5,831 Texas Instruments Inc ...................................................................................... 1,098,969 0.92
24 Texas Pacific Land Corp .................................................................................. 29,973 0.03
1,764 Thermo Fisher Scientific Inc ............................................................................. 1,177,011 0.99
2,058 Toro Co ............................................................................................................ 205,615 0.17
2,254 Tractor Supply Co ............................................................................................ 537,804 0.45
1,372 Trex Co Inc ...................................................................................................... 185,261 0.16
5,047 Tyson Foods Inc .............................................................................................. 439,897 0.37
1,519 UGI Corp .......................................................................................................... 69,737 0.06
4,753 Union Pacific Corp ........................................................................................... 1,197,423 1.00
5,635 United Parcel Service Inc ................................................................................. 1,207,806 1.01
1,127 United States Steel Corp .................................................................................. 26,834 0.02
294 United Therapeutics Corp ................................................................................ 63,528 0.05
2,548 UnitedHealth Group Inc .................................................................................... 1,279,453 1.08
22,295 Verizon Communications Inc ............................................................................ 1,158,448 0.97
3,136 Vertex Pharmaceuticals Inc .............................................................................. 688,666 0.58
5,488 VICI Properties Inc ........................................................................................... 165,244 0.14
196 Victoria's Secret & Co ...................................................................................... 10,886 0.01
12,544 Walgreens Boots Alliance Inc ........................................................................... 654,295 0.55
7,938 Walmart Inc ...................................................................................................... 1,148,549 0.96
735 Waters Corp ..................................................................................................... 273,861 0.23
588 Watsco Inc ....................................................................................................... 183,973 0.15
3,430 WEC Energy Group Inc .................................................................................... 332,950 0.28
882 West Pharmaceutical Services Inc ................................................................... 413,667 0.35
1,715 Western Union Co ............................................................................................ 30,596 0.03
441 Whirlpool Corp ................................................................................................. 103,485 0.09
1,568 Williams-Sonoma Inc ....................................................................................... 265,196 0.22
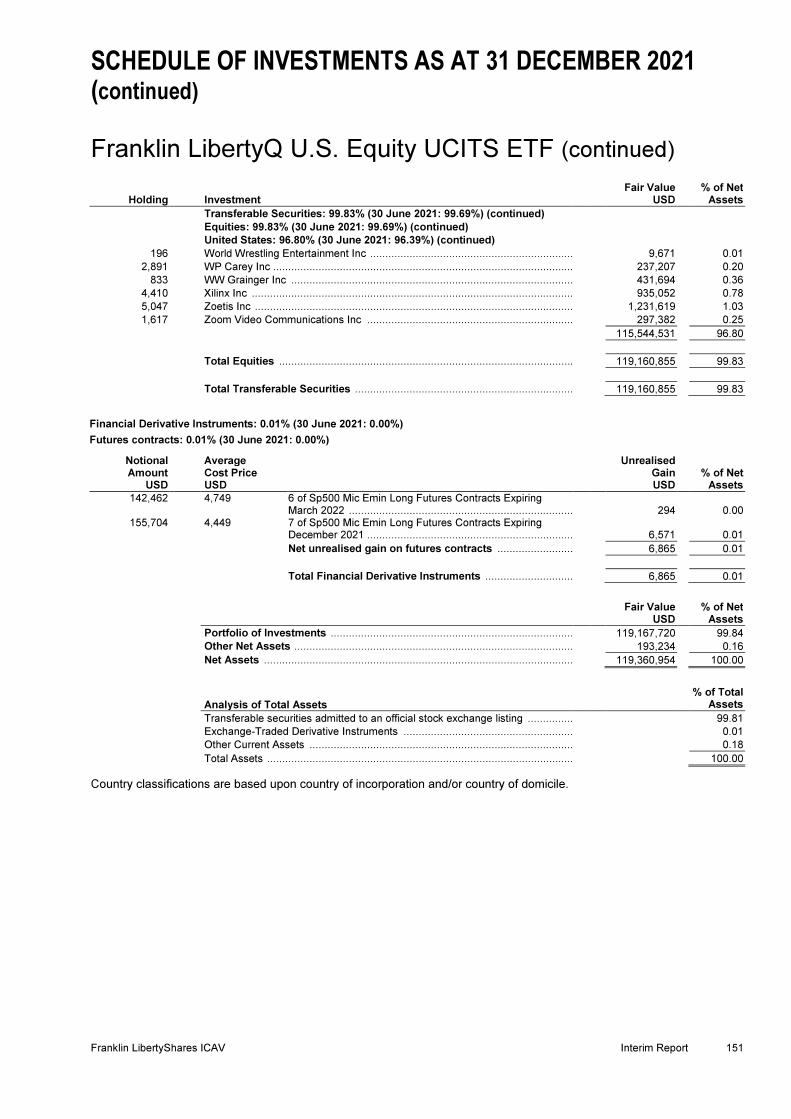
SCHEDULE OF INVESTMENTS AS AT 31 DECEMBER 2021 (continued) Franklin LibertyQ U.S. Equity UCITS ETF (continued)
Franklin LibertyShares ICAV Interim Report 151
Holding Investment Fair Value
USD % of Net
Assets
Transferable Securities: 99.83% (30 June 2021: 99.69%) (continued)
Equities: 99.83% (30 June 2021: 99.69%) (continued)
United States: 96.80% (30 June 2021: 96.39%) (continued)
196 World Wrestling Entertainment Inc .................................................................... 9,671 0.01
2,891 WP Carey Inc .................................................................................................... 237,207 0.20
833 WW Grainger Inc .............................................................................................. 431,694 0.36
4,410 Xilinx Inc ........................................................................................................... 935,052 0.78
5,047 Zoetis Inc .......................................................................................................... 1,231,619 1.03
1,617 Zoom Video Communications Inc ..................................................................... 297,382 0.25
115,544,531 96.80
Total Equities .................................................................................................. 119,160,855 99.83
Total Transferable Securities ......................................................................... 119,160,855 99.83
Financial Derivative Instruments: 0.01% (30 June 2021: 0.00%)
Futures contracts: 0.01% (30 June 2021: 0.00%)
Notional Amount
USD
Average Cost Price USD
Unrealised Gain USD
% of Net Assets
142,462 4,749 6 of Sp500 Mic Emin Long Futures Contracts Expiring March 2022 ................................................................................................ 294 0.00
155,704 4,449 7 of Sp500 Mic Emin Long Futures Contracts Expiring December 2021 ................................................................................................ 6,571 0.01
Net unrealised gain on futures contracts ................................ 6,865 0.01
Total Financial Derivative Instruments ................................ 6,865 0.01
Fair Value USD
% of Net Assets
Portfolio of Investments ................................................................................................ 119,167,720 99.84
Other Net Assets ................................................................................................ 193,234 0.16
Net Assets ................................................................................................................................ 119,360,954 100.00
Analysis of Total Assets
% of Total Assets
Transferable securities admitted to an official stock exchange listing ................................ 99.81
Exchange-Traded Derivative Instruments ................................................................ 0.01
Other Current Assets ................................................................................................ 0.18
Total Assets ................................................................................................................................ 100.00
Country classifications are based upon country of incorporation and/or country of domicile.

SCHEDULE OF INVESTMENTS AS AT 31 DECEMBER 2021 Franklin STOXX Europe 600 Paris Aligned Climate UCITS
ETF
152 Interim Report Franklin LibertyShares ICAV
Holding Investment
Fair Value EUR
% of Net Assets
Transferable Securities: 99.95% (30 June 2021: 99.88%)
Equities: 99.95% (30 June 2021: 99.88%)
Austria: 0.42% (30 June 2021: 0.37%)
145 ams AG ............................................................................................................ 2,322 0.01
120 BAWAG Group AG ........................................................................................... 6,504 0.04
235 Erste Group Bank AG ...................................................................................... 9,717 0.06
200 Raiffeisen Bank International AG ..................................................................... 5,176 0.03
390 Verbund AG ..................................................................................................... 38,572 0.23
185 voestalpine AG ................................................................................................. 5,920 0.04
65 Wienerberger AG ............................................................................................. 2,102 0.01
70,313 0.42
Belgium: 1.02% (30 June 2021: 1.05%)
16 Aedifica SA ...................................................................................................... 1,838 0.01
270 Ageas SA ......................................................................................................... 12,299 0.07
1,175 Anheuser-Busch InBev SA ............................................................................... 62,475 0.38
15 Cofinimmo SA .................................................................................................. 2,108 0.01
50 Colruyt SA ........................................................................................................ 1,863 0.01
20 Elia Group SA .................................................................................................. 2,314 0.01
15 Groupe Bruxelles Lambert SA .......................................................................... 1,472 0.01
380 KBC Group NV ................................................................................................. 28,674 0.17
310 Proximus SADP ............................................................................................... 5,313 0.03
20 Sofina SA ......................................................................................................... 8,640 0.05
260 UCB SA ........................................................................................................... 26,091 0.16
400 Umicore SA ...................................................................................................... 14,300 0.09
75 Warehouses De Pauw CVA ............................................................................. 3,164 0.02
170,551 1.02
Bermuda: 0.04% (30 June 2021: 0.04%)
660 Hiscox Ltd ........................................................................................................ 6,767 0.04
6,767 0.04
Denmark: 5.97% (30 June 2021: 5.80%)
140 Ambu A/S ......................................................................................................... 3,256 0.02
5 AP Moller - Maersk A/S .................................................................................... 15,765 0.09
190 Carlsberg AS ................................................................................................... 28,854 0.17
215 Chr Hansen Holding A/S .................................................................................. 14,899 0.09
320 Coloplast A/S ................................................................................................... 49,521 0.30
65 Demant A/S ..................................................................................................... 2,929 0.02
335 DSV PANALPINA A/S ...................................................................................... 68,800 0.41
50 Genmab A/S .................................................................................................... 17,681 0.11
75 GN Store Nord AS ........................................................................................... 4,148 0.02
120 ISS A/S ............................................................................................................ 2,017 0.01
15 Netcompany Group A/S ................................................................................... 1,421 0.01
5,040 Novo Nordisk A/S ............................................................................................. 498,066 2.99
565 Novozymes A/S ............................................................................................... 40,808 0.24
50 Pandora A/S .................................................................................................... 5,482 0.03
35 ROCKWOOL International A/S ......................................................................... 13,459 0.08
25 Royal Unibrew A/S ........................................................................................... 2,478 0.01
30 SimCorp A/S .................................................................................................... 2,883 0.02
550 Tryg A/S ........................................................................................................... 11,943 0.07
7,925 Vestas Wind Systems A/S ................................................................................ 213,107 1.28
997,517 5.97
Faroe Islands: 0.01% (30 June 2021: 0.01%)
30 Bakkafrost P/F ................................................................................................. 1,746 0.01
1,746 0.01
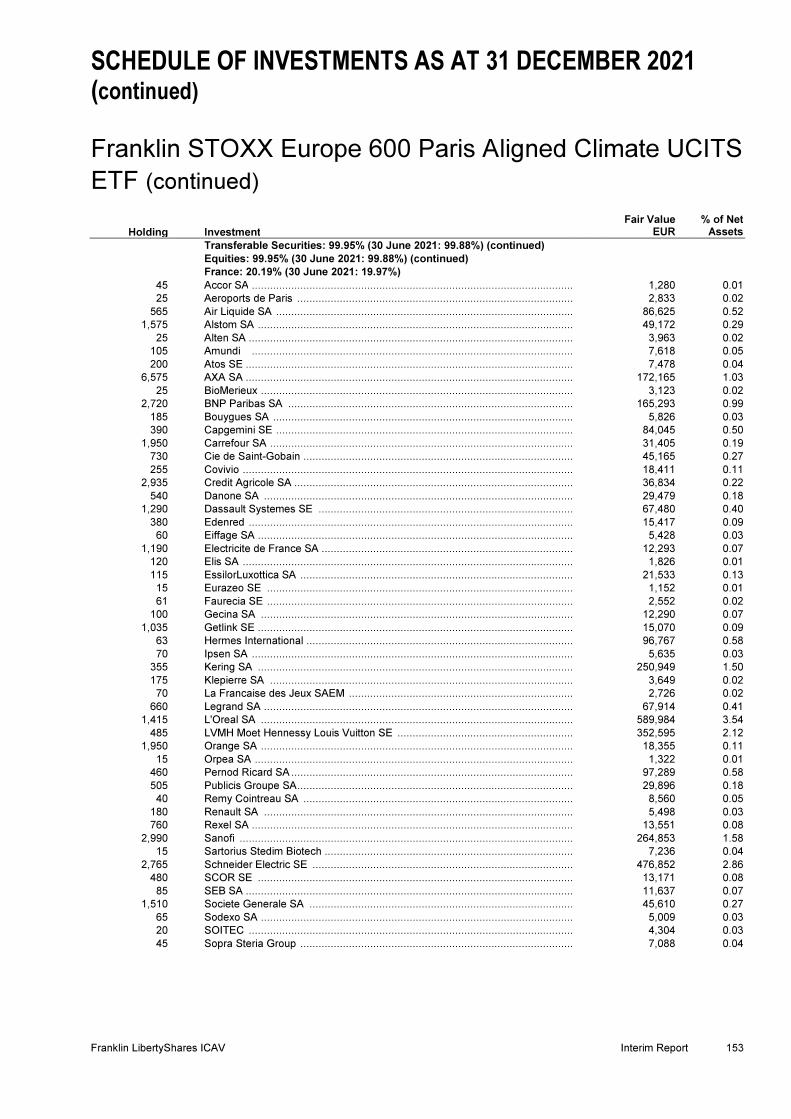
SCHEDULE OF INVESTMENTS AS AT 31 DECEMBER 2021 (continued) Franklin STOXX Europe 600 Paris Aligned Climate UCITS
ETF (continued)
Franklin LibertyShares ICAV Interim Report 153
Holding Investment
Fair Value EUR
% of Net Assets
Transferable Securities: 99.95% (30 June 2021: 99.88%) (continued)
Equities: 99.95% (30 June 2021: 99.88%) (continued)
France: 20.19% (30 June 2021: 19.97%)
45 Accor SA ........................................................................................................... 1,280 0.01
25 Aeroports de Paris ............................................................................................ 2,833 0.02
565 Air Liquide SA ................................................................................................... 86,625 0.52
1,575 Alstom SA ......................................................................................................... 49,172 0.29
25 Alten SA ............................................................................................................ 3,963 0.02
105 Amundi ........................................................................................................... 7,618 0.05
200 Atos SE ............................................................................................................. 7,478 0.04
6,575 AXA SA ............................................................................................................. 172,165 1.03
25 BioMerieux ........................................................................................................ 3,123 0.02
2,720 BNP Paribas SA ............................................................................................... 165,293 0.99
185 Bouygues SA .................................................................................................... 5,826 0.03
390 Capgemini SE ................................................................................................... 84,045 0.50
1,950 Carrefour SA ..................................................................................................... 31,405 0.19
730 Cie de Saint-Gobain .......................................................................................... 45,165 0.27
255 Covivio .............................................................................................................. 18,411 0.11
2,935 Credit Agricole SA ............................................................................................. 36,834 0.22
540 Danone SA ....................................................................................................... 29,479 0.18
1,290 Dassault Systemes SE ..................................................................................... 67,480 0.40
380 Edenred ............................................................................................................ 15,417 0.09
60 Eiffage SA ......................................................................................................... 5,428 0.03
1,190 Electricite de France SA .................................................................................... 12,293 0.07
120 Elis SA .............................................................................................................. 1,826 0.01
115 EssilorLuxottica SA ........................................................................................... 21,533 0.13
15 Eurazeo SE ...................................................................................................... 1,152 0.01
61 Faurecia SE ...................................................................................................... 2,552 0.02
100 Gecina SA ........................................................................................................ 12,290 0.07
1,035 Getlink SE ......................................................................................................... 15,070 0.09
63 Hermes International ......................................................................................... 96,767 0.58
70 Ipsen SA ........................................................................................................... 5,635 0.03
355 Kering SA ......................................................................................................... 250,949 1.50
175 Klepierre SA ..................................................................................................... 3,649 0.02
70 La Francaise des Jeux SAEM ........................................................................... 2,726 0.02
660 Legrand SA ....................................................................................................... 67,914 0.41
1,415 L'Oreal SA ........................................................................................................ 589,984 3.54
485 LVMH Moet Hennessy Louis Vuitton SE ........................................................... 352,595 2.12
1,950 Orange SA ........................................................................................................ 18,355 0.11
15 Orpea SA .......................................................................................................... 1,322 0.01
460 Pernod Ricard SA .............................................................................................. 97,289 0.58
505 Publicis Groupe SA ............................................................................................ 29,896 0.18
40 Remy Cointreau SA .......................................................................................... 8,560 0.05
180 Renault SA ....................................................................................................... 5,498 0.03
760 Rexel SA ........................................................................................................... 13,551 0.08
2,990 Sanofi ............................................................................................................... 264,853 1.58
15 Sartorius Stedim Biotech ................................................................................... 7,236 0.04
2,765 Schneider Electric SE ....................................................................................... 476,852 2.86
480 SCOR SE ......................................................................................................... 13,171 0.08
85 SEB SA ............................................................................................................. 11,637 0.07
1,510 Societe Generale SA ........................................................................................ 45,610 0.27
65 Sodexo SA ........................................................................................................ 5,009 0.03
20 SOITEC ............................................................................................................ 4,304 0.03
45 Sopra Steria Group ........................................................................................... 7,088 0.04
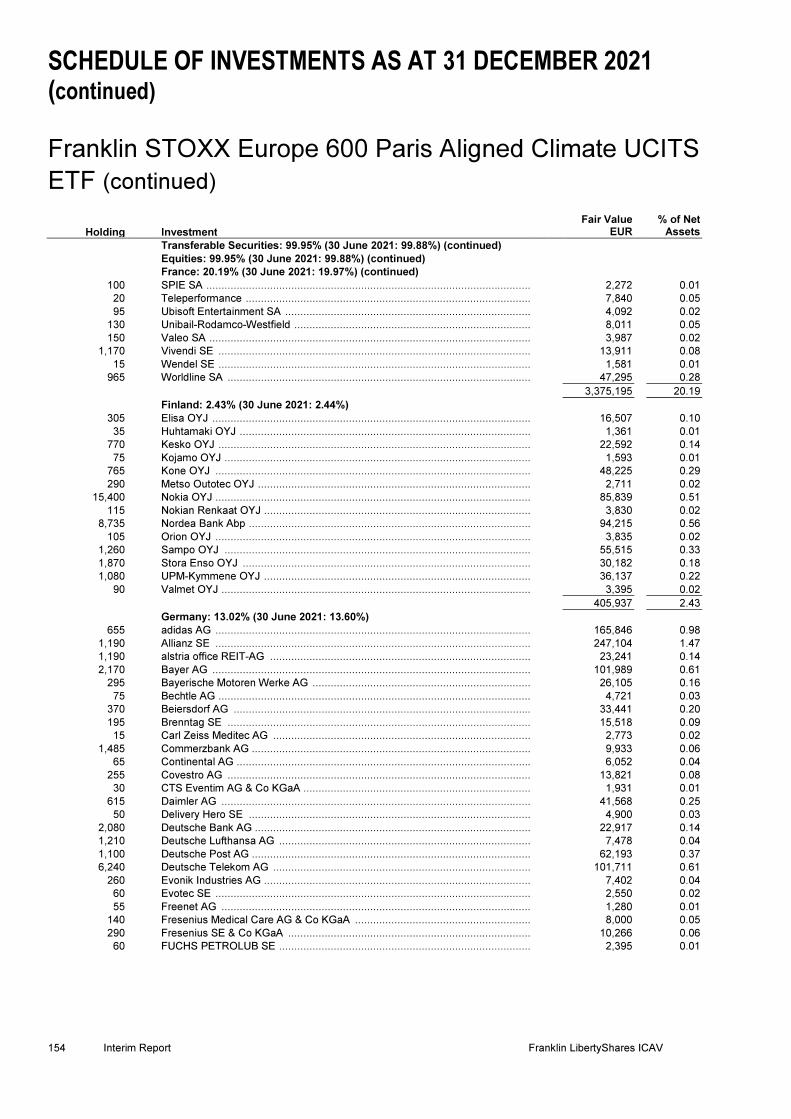
SCHEDULE OF INVESTMENTS AS AT 31 DECEMBER 2021 (continued) Franklin STOXX Europe 600 Paris Aligned Climate UCITS
ETF (continued)
154 Interim Report Franklin LibertyShares ICAV
Holding Investment
Fair Value EUR
% of Net Assets
Transferable Securities: 99.95% (30 June 2021: 99.88%) (continued)
Equities: 99.95% (30 June 2021: 99.88%) (continued)
France: 20.19% (30 June 2021: 19.97%) (continued)
100 SPIE SA ........................................................................................................... 2,272 0.01
20 Teleperformance .............................................................................................. 7,840 0.05
95 Ubisoft Entertainment SA ................................................................................. 4,092 0.02
130 Unibail-Rodamco-Westfield .............................................................................. 8,011 0.05
150 Valeo SA .......................................................................................................... 3,987 0.02
1,170 Vivendi SE ....................................................................................................... 13,911 0.08
15 Wendel SE ....................................................................................................... 1,581 0.01
965 Worldline SA .................................................................................................... 47,295 0.28
3,375,195 20.19
Finland: 2.43% (30 June 2021: 2.44%)
305 Elisa OYJ ......................................................................................................... 16,507 0.10
35 Huhtamaki OYJ ................................................................................................ 1,361 0.01
770 Kesko OYJ ....................................................................................................... 22,592 0.14
75 Kojamo OYJ ..................................................................................................... 1,593 0.01
765 Kone OYJ ........................................................................................................ 48,225 0.29
290 Metso Outotec OYJ .......................................................................................... 2,711 0.02
15,400 Nokia OYJ ........................................................................................................ 85,839 0.51
115 Nokian Renkaat OYJ ........................................................................................ 3,830 0.02
8,735 Nordea Bank Abp ............................................................................................. 94,215 0.56
105 Orion OYJ ........................................................................................................ 3,835 0.02
1,260 Sampo OYJ ..................................................................................................... 55,515 0.33
1,870 Stora Enso OYJ ............................................................................................... 30,182 0.18
1,080 UPM-Kymmene OYJ ........................................................................................ 36,137 0.22
90 Valmet OYJ ...................................................................................................... 3,395 0.02
405,937 2.43
Germany: 13.02% (30 June 2021: 13.60%)
655 adidas AG ........................................................................................................ 165,846 0.98
1,190 Allianz SE ........................................................................................................ 247,104 1.47
1,190 alstria office REIT-AG ...................................................................................... 23,241 0.14
2,170 Bayer AG ......................................................................................................... 101,989 0.61
295 Bayerische Motoren Werke AG ........................................................................ 26,105 0.16
75 Bechtle AG ....................................................................................................... 4,721 0.03
370 Beiersdorf AG .................................................................................................. 33,441 0.20
195 Brenntag SE .................................................................................................... 15,518 0.09
15 Carl Zeiss Meditec AG ..................................................................................... 2,773 0.02
1,485 Commerzbank AG ............................................................................................ 9,933 0.06
65 Continental AG ................................................................................................. 6,052 0.04
255 Covestro AG .................................................................................................... 13,821 0.08
30 CTS Eventim AG & Co KGaA ........................................................................... 1,931 0.01
615 Daimler AG ...................................................................................................... 41,568 0.25
50 Delivery Hero SE ............................................................................................. 4,900 0.03
2,080 Deutsche Bank AG ........................................................................................... 22,917 0.14
1,210 Deutsche Lufthansa AG ................................................................................... 7,478 0.04
1,100 Deutsche Post AG ............................................................................................ 62,193 0.37
6,240 Deutsche Telekom AG ..................................................................................... 101,711 0.61
260 Evonik Industries AG ........................................................................................ 7,402 0.04
60 Evotec SE ........................................................................................................ 2,550 0.02
55 Freenet AG ...................................................................................................... 1,280 0.01
140 Fresenius Medical Care AG & Co KGaA .......................................................... 8,000 0.05
290 Fresenius SE & Co KGaA ................................................................................ 10,266 0.06
60 FUCHS PETROLUB SE ................................................................................... 2,395 0.01
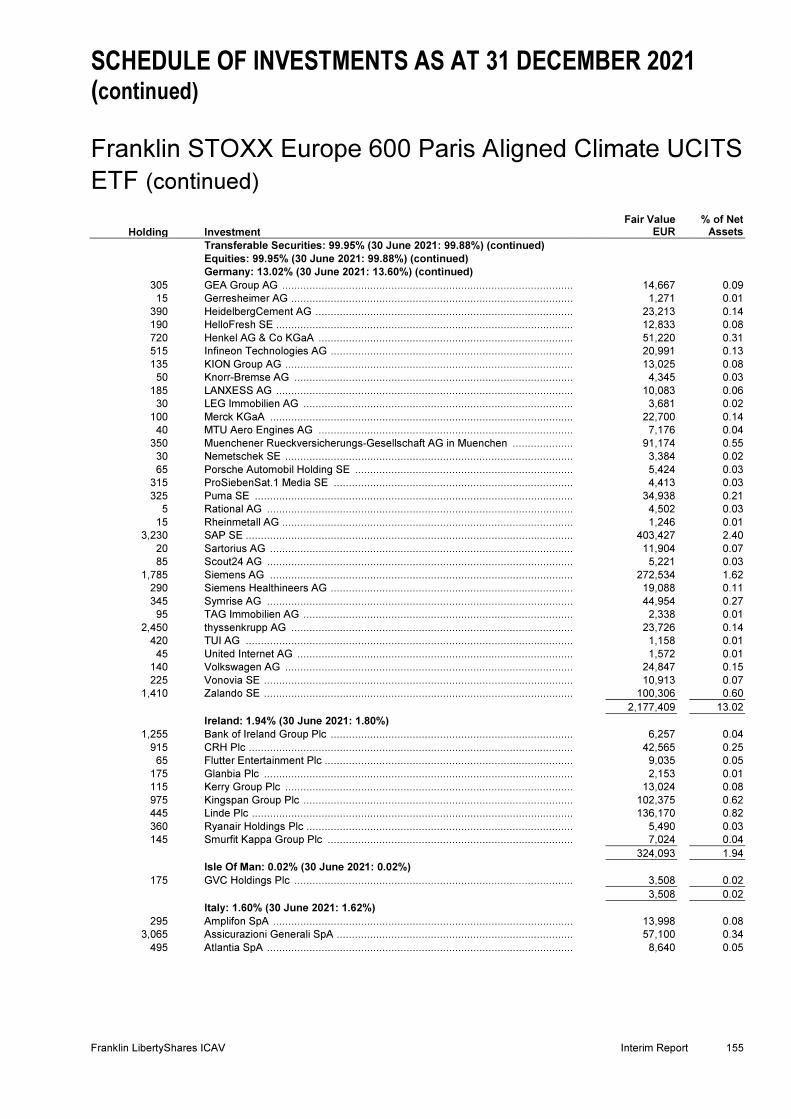
SCHEDULE OF INVESTMENTS AS AT 31 DECEMBER 2021 (continued) Franklin STOXX Europe 600 Paris Aligned Climate UCITS
ETF (continued)
Franklin LibertyShares ICAV Interim Report 155
Holding Investment
Fair Value EUR
% of Net Assets
Transferable Securities: 99.95% (30 June 2021: 99.88%) (continued)
Equities: 99.95% (30 June 2021: 99.88%) (continued)
Germany: 13.02% (30 June 2021: 13.60%) (continued)
305 GEA Group AG ................................................................................................ 14,667 0.09
15 Gerresheimer AG .............................................................................................. 1,271 0.01
390 HeidelbergCement AG ...................................................................................... 23,213 0.14
190 HelloFresh SE ................................................................................................... 12,833 0.08
720 Henkel AG & Co KGaA ..................................................................................... 51,220 0.31
515 Infineon Technologies AG ................................................................................. 20,991 0.13
135 KION Group AG ................................................................................................ 13,025 0.08
50 Knorr-Bremse AG ............................................................................................. 4,345 0.03
185 LANXESS AG ................................................................................................... 10,083 0.06
30 LEG Immobilien AG .......................................................................................... 3,681 0.02
100 Merck KGaA ..................................................................................................... 22,700 0.14
40 MTU Aero Engines AG ..................................................................................... 7,176 0.04
350 Muenchener Rueckversicherungs-Gesellschaft AG in Muenchen ..................... 91,174 0.55
30 Nemetschek SE ................................................................................................ 3,384 0.02
65 Porsche Automobil Holding SE ......................................................................... 5,424 0.03
315 ProSiebenSat.1 Media SE ................................................................................ 4,413 0.03
325 Puma SE .......................................................................................................... 34,938 0.21
5 Rational AG ...................................................................................................... 4,502 0.03
15 Rheinmetall AG ................................................................................................ 1,246 0.01
3,230 SAP SE ............................................................................................................. 403,427 2.40
20 Sartorius AG ..................................................................................................... 11,904 0.07
85 Scout24 AG ...................................................................................................... 5,221 0.03
1,785 Siemens AG ..................................................................................................... 272,534 1.62
290 Siemens Healthineers AG ................................................................................. 19,088 0.11
345 Symrise AG ...................................................................................................... 44,954 0.27
95 TAG Immobilien AG .......................................................................................... 2,338 0.01
2,450 thyssenkrupp AG .............................................................................................. 23,726 0.14
420 TUI AG ............................................................................................................. 1,158 0.01
45 United Internet AG ............................................................................................ 1,572 0.01
140 Volkswagen AG ................................................................................................ 24,847 0.15
225 Vonovia SE ....................................................................................................... 10,913 0.07
1,410 Zalando SE ....................................................................................................... 100,306 0.60
2,177,409 13.02
Ireland: 1.94% (30 June 2021: 1.80%)
1,255 Bank of Ireland Group Plc ................................................................................. 6,257 0.04
915 CRH Plc ............................................................................................................ 42,565 0.25
65 Flutter Entertainment Plc ................................................................................... 9,035 0.05
175 Glanbia Plc ....................................................................................................... 2,153 0.01
115 Kerry Group Plc ................................................................................................ 13,024 0.08
975 Kingspan Group Plc .......................................................................................... 102,375 0.62
445 Linde Plc ........................................................................................................... 136,170 0.82
360 Ryanair Holdings Plc ......................................................................................... 5,490 0.03
145 Smurfit Kappa Group Plc .................................................................................. 7,024 0.04
324,093 1.94
Isle Of Man: 0.02% (30 June 2021: 0.02%)
175 GVC Holdings Plc ............................................................................................. 3,508 0.02
3,508 0.02
Italy: 1.60% (30 June 2021: 1.62%)
295 Amplifon SpA .................................................................................................... 13,998 0.08
3,065 Assicurazioni Generali SpA ............................................................................... 57,100 0.34
495 Atlantia SpA ...................................................................................................... 8,640 0.05

SCHEDULE OF INVESTMENTS AS AT 31 DECEMBER 2021 (continued) Franklin STOXX Europe 600 Paris Aligned Climate UCITS
ETF (continued)
156 Interim Report Franklin LibertyShares ICAV
Holding Investment
Fair Value EUR
% of Net Assets
Transferable Securities: 99.95% (30 June 2021: 99.88%) (continued)
Equities: 99.95% (30 June 2021: 99.88%) (continued)
Italy: 1.60% (30 June 2021: 1.62%) (continued)
1,805 Banco BPM SpA .............................................................................................. 4,765 0.03
10 DiaSorin SpA ................................................................................................... 1,675 0.01
660 FinecoBank Banca Fineco SpA ........................................................................ 10,187 0.06
125 Infrastrutture Wireless Italiane SpA .................................................................. 1,335 0.01
40 Interpump Group SpA ...................................................................................... 2,578 0.02
28,270 Intesa Sanpaolo SpA ....................................................................................... 64,286 0.39
880 Mediobanca Banca di Credito Finanziario SpA ................................................. 8,897 0.05
325 Moncler SpA .................................................................................................... 20,807 0.12
225 Nexi SpA .......................................................................................................... 3,148 0.02
410 Poste Italiane SpA ............................................................................................ 4,731 0.03
215 Prysmian SpA .................................................................................................. 7,119 0.04
50 Recordati Industria Chimica e Farmaceutica SpA ............................................. 2,825 0.02
6,860 Telecom Italia SpA ........................................................................................... 2,979 0.02
1,975 Terna Rete Elettrica Nazionale SpA ................................................................. 14,050 0.08
2,875 UniCredit SpA .................................................................................................. 38,939 0.23
268,059 1.60
Jersey: 0.76% (30 June 2021: 0.61%)
1,065 Experian Plc ..................................................................................................... 46,070 0.27
260 Ferguson Plc .................................................................................................... 40,582 0.24
435 IWG Plc ............................................................................................................ 1,508 0.01
1,780 Man Group Plc ................................................................................................. 4,821 0.03
105 Polymetal International Plc ............................................................................... 1,640 0.01
25 Wizz Air Holdings Plc ....................................................................................... 1,247 0.01
2,400 WPP Plc ........................................................................................................... 32,001 0.19
Luxembourg: 0.07% (30 June 2021: 0.08%)
435 Aroundtown SA ................................................................................................ 2,314 0.01
440 B&M European Value Retail SA ....................................................................... 3,323 0.02
35 Eurofins Scientific SE ....................................................................................... 3,808 0.03
205 SES SA ............................................................................................................ 1,429 0.01
10,874 0.07
Malta: 0.01% (30 June 2021: Nil)
155 Kindred Group Plc SDR ................................................................................... 1,621 0.01
1,621 0.01
Netherlands: 8.81% (30 June 2021: 8.57%)
1,060 ABN AMRO Bank NV ....................................................................................... 13,691 0.08
20 Adyen NV ......................................................................................................... 46,230 0.28
4,640 Aegon NV ........................................................................................................ 20,384 0.12
560 Akzo Nobel NV ................................................................................................. 54,040 0.32
20 Argenx SE ........................................................................................................ 6,306 0.04
25 ASM International NV ....................................................................................... 9,718 0.06
610 ASML Holding NV ............................................................................................ 431,087 2.59
370 ASR Nederland NV .......................................................................................... 14,985 0.09
35 BE Semiconductor Industries NV ..................................................................... 2,626 0.02
1,405 CNH Industrial NV ............................................................................................ 23,983 0.14
220 Davide Campari-Milano NV .............................................................................. 2,828 0.02
60 Euronext NV .................................................................................................... 5,475 0.03
75 EXOR NV ......................................................................................................... 5,922 0.04
45 Ferrari NV ........................................................................................................ 10,238 0.06
50 Heineken Holding NV ....................................................................................... 4,058 0.02
260 Heineken NV .................................................................................................... 25,704 0.15

SCHEDULE OF INVESTMENTS AS AT 31 DECEMBER 2021 (continued) Franklin STOXX Europe 600 Paris Aligned Climate UCITS
ETF (continued)
Franklin LibertyShares ICAV Interim Report 157
Holding Investment
Fair Value EUR
% of Net Assets
Transferable Securities: 99.95% (30 June 2021: 99.88%) (continued)
Equities: 99.95% (30 June 2021: 99.88%) (continued)
Netherlands: 8.81% (30 June 2021: 8.57%) (continued)
135 IMCD NV .......................................................................................................... 26,285 0.16
10,985 ING Groep NV .................................................................................................. 134,477 0.80
65 JDE Peet's NV .................................................................................................. 1,762 0.01
30 Just Eat Takeaway.com NV .............................................................................. 1,454 0.01
1,840 Koninklijke Ahold Delhaize NV .......................................................................... 55,447 0.33
705 Koninklijke DSM NV .......................................................................................... 139,589 0.83
4,285 Koninklijke KPN NV .......................................................................................... 11,698 0.07
6,900 Koninklijke Philips NV ....................................................................................... 226,078 1.35
960 NN Group NV .................................................................................................... 45,706 0.27
435 Prosus NV ........................................................................................................ 31,986 0.19
155 QIAGEN NV ...................................................................................................... 7,593 0.05
250 Randstad NV .................................................................................................... 15,010 0.09
570 Signify NV ......................................................................................................... 23,245 0.14
2,110 Stellantis NV ..................................................................................................... 35,207 0.21
510 STMicroelectronics NV ..................................................................................... 22,318 0.13
170 Wolters Kluwer NV ............................................................................................ 17,612 0.11
1,472,742 8.81
Norway: 0.84% (30 June 2021: 0.93%)
295 Adevinta ASA .................................................................................................... 3,451 0.02
2,025 DNB Bank ASA ................................................................................................ 40,789 0.24
455 Gjensidige Forsikring ASA ................................................................................ 9,710 0.06
330 Mowi ASA ......................................................................................................... 6,868 0.04
150 Nordic Semiconductor ASA ............................................................................... 4,451 0.03
3,995 Norsk Hydro ASA .............................................................................................. 27,695 0.17
1,320 Orkla ASA ......................................................................................................... 11,631 0.07
30 Salmar ASA ...................................................................................................... 1,819 0.01
140 Schibsted ASA .................................................................................................. 4,748 0.03
2,340 Storebrand ASA ................................................................................................ 20,656 0.12
150 Telenor ASA ..................................................................................................... 2,073 0.01
150 Yara International ASA ..................................................................................... 6,656 0.04
140,547 0.84
Poland: 0.08% (30 June 2021: 0.08%)
105 Bank Polska Kasa Opieki SA ............................................................................ 2,795 0.02
35 CD Projekt SA ................................................................................................... 1,473 0.01
30 Dino Polska SA ................................................................................................ 2,404 0.01
45 KGHM Polska Miedz SA ................................................................................... 1,369 0.01
360 Powszechna Kasa Oszczednosci Bank Polski SA ............................................. 3,529 0.02
265 Powszechny Zaklad Ubezpieczen SA ............................................................... 2,044 0.01
13,614 0.08
Portugal: 0.03% (30 June 2021: 0.02%)
245 Jeronimo Martins SGPS SA .............................................................................. 4,925 0.03
4,925 0.03
Spain: 3.87% (30 June 2021: 4.36%)
60 Acciona SA ....................................................................................................... 10,086 0.06
40 Aena SME SA ................................................................................................... 5,552 0.03
585 Amadeus IT Group SA ...................................................................................... 34,889 0.21
9,010 Banco Bilbao Vizcaya Argentaria SA ................................................................ 47,303 0.28
12,280 Banco de Sabadell SA ...................................................................................... 7,267 0.04
27,460 Banco Santander SA ........................................................................................ 80,746 0.48
1,090 Bankinter SA ..................................................................................................... 4,915 0.03
9,095 CaixaBank SA ................................................................................................... 21,955 0.13

SCHEDULE OF INVESTMENTS AS AT 31 DECEMBER 2021 (continued) Franklin STOXX Europe 600 Paris Aligned Climate UCITS
ETF (continued)
158 Interim Report Franklin LibertyShares ICAV
Holding Investment
Fair Value EUR
% of Net Assets
Transferable Securities: 99.95% (30 June 2021: 99.88%) (continued)
Equities: 99.95% (30 June 2021: 99.88%) (continued)
Spain: 3.87% (30 June 2021: 4.36%) (continued)
140 Cellnex Telecom SA ......................................................................................... 7,165 0.04
2,100 EDP Renovaveis SA ........................................................................................ 45,990 0.28
403 Ferrovial SA ..................................................................................................... 11,107 0.07
560 Grifols SA ......................................................................................................... 9,450 0.06
15,125 Iberdrola SA ..................................................................................................... 157,451 0.95
4,090 Industria de Diseno Textil SA ........................................................................... 116,688 0.70
285 Inmobiliaria Colonial Socimi SA ........................................................................ 2,351 0.01
2,840 International Consolidated Airlines Group SA ................................................... 4,819 0.03
140 Merlin Properties Socimi SA ............................................................................. 1,340 0.01
395 Red Electrica Corp SA ..................................................................................... 7,515 0.04
1,765 Siemens Gamesa Renewable Energy SA ....................................................... 37,189 0.22
8,670 Telefonica SA ................................................................................................... 33,397 0.20
647,175 3.87
Sweden: 4.85% (30 June 2021: 4.97%)
100 AAK AB ............................................................................................................ 1,897 0.01
365 AddTech AB ..................................................................................................... 7,657 0.05
55 AFRY AB ......................................................................................................... 1,362 0.01
865 Assa Abloy AB ................................................................................................. 23,204 0.14
870 Atlas Copco AB ................................................................................................ 52,880 0.32
215 Avanza Bank Holding AB ................................................................................. 6,937 0.04
55 Beijer Ref AB ................................................................................................... 1,057 0.01
690 BillerudKorsnas AB .......................................................................................... 11,440 0.07
105 Boliden AB ....................................................................................................... 3,569 0.02
420 Castellum AB ................................................................................................... 9,945 0.06
165 Dometic Group AB ........................................................................................... 1,906 0.01
810 Electrolux AB ................................................................................................... 17,268 0.10
1,330 Elekta AB ......................................................................................................... 14,797 0.09
1,160 EQT AB ............................................................................................................ 55,545 0.33
1,025 Essity AB ......................................................................................................... 29,408 0.18
30 Evolution AB .................................................................................................... 3,748 0.02
455 Fabege AB ....................................................................................................... 6,697 0.04
25 Fastighets AB Balder ....................................................................................... 1,583 0.01
765 Getinge AB ...................................................................................................... 29,356 0.18
3,830 Hennes & Mauritz AB ....................................................................................... 66,244 0.39
850 Hexagon AB ..................................................................................................... 11,859 0.07
425 Hexpol AB ........................................................................................................ 5,007 0.03
230 Holmen AB ....................................................................................................... 9,711 0.06
1,520 Husqvarna AB .................................................................................................. 21,384 0.13
475 Industrivarden AB ............................................................................................. 13,305 0.08
1,010 Indutrade AB .................................................................................................... 27,192 0.16
110 Investment AB Latour ....................................................................................... 3,939 0.02
585 Investor AB ...................................................................................................... 12,940 0.08
490 Kinnevik AB ..................................................................................................... 15,360 0.09
40 L E Lundbergforetagen AB ............................................................................... 1,974 0.01
450 Lifco AB ........................................................................................................... 11,831 0.07
1,705 Nibe Industrier AB ............................................................................................ 22,645 0.14
140 Nordic Entertainment Group AB ....................................................................... 6,380 0.04
50 Sagax AB ......................................................................................................... 1,481 0.01
450 Samhallsbyggnadsbolaget i Norden AB ........................................................... 2,903 0.02
105 Securitas AB .................................................................................................... 1,271 0.01
770 Sinch AB .......................................................................................................... 8,608 0.05

SCHEDULE OF INVESTMENTS AS AT 31 DECEMBER 2021 (continued) Franklin STOXX Europe 600 Paris Aligned Climate UCITS
ETF (continued)
Franklin LibertyShares ICAV Interim Report 159
Holding Investment
Fair Value EUR
% of Net Assets
Transferable Securities: 99.95% (30 June 2021: 99.88%) (continued)
Equities: 99.95% (30 June 2021: 99.88%) (continued)
Sweden: 4.85% (30 June 2021: 4.97%) (continued)
3,050 Skandinaviska Enskilda Banken AB .................................................................. 37,281 0.22
270 Skanska AB ...................................................................................................... 6,142 0.04
315 SKF AB ............................................................................................................. 6,562 0.04
710 Svenska Cellulosa AB SCA .............................................................................. 11,085 0.07
2,670 Svenska Handelsbanken AB ............................................................................. 25,377 0.15
110 Sweco AB ......................................................................................................... 1,818 0.01
555 Swedish Orphan Biovitrum AB .......................................................................... 9,978 0.06
210 Tele2 AB ........................................................................................................... 2,633 0.02
9,375 Telefonaktiebolaget LM Ericsson ...................................................................... 90,863 0.53
5,555 Telia Co AB ...................................................................................................... 19,102 0.11
245 Thule Group AB ................................................................................................ 13,040 0.08
115 Trelleborg AB .................................................................................................... 2,656 0.02
2,810 Volvo AB ........................................................................................................... 57,218 0.33
90 Wallenstam AB ................................................................................................ 1,469 0.01
75 Wihlborgs Fastigheter AB ................................................................................. 1,496 0.01
811,010 4.85
Switzerland: 15.78% (30 June 2021: 15.33%)
310 Adecco Group AG ............................................................................................. 13,942 0.08
220 Alcon Inc ........................................................................................................... 17,143 0.10
80 Baloise Holding AG ........................................................................................... 11,512 0.07
5 Barry Callebaut AG ........................................................................................... 10,693 0.06
5 Belimo Holding AG ............................................................................................ 2,799 0.02
5 Bucher Industries AG ........................................................................................ 2,176 0.01
1,005 Cie Financiere Richemont SA ........................................................................... 132,832 0.79
250 Coca-Cola HBC AG .......................................................................................... 7,608 0.05
4,315 Credit Suisse Group AG .................................................................................... 36,947 0.22
65 Dufry AG ........................................................................................................... 2,832 0.02
5 EMS-Chemie Holding AG ................................................................................. 4,927 0.03
15 Flughafen Zurich AG ......................................................................................... 2,376 0.01
185 Galenica AG ..................................................................................................... 12,239 0.07
25 Geberit AG ........................................................................................................ 17,980 0.11
36 Givaudan SA ..................................................................................................... 166,492 1.00
80 Helvetia Holding AG .......................................................................................... 8,292 0.05
1,805 Holcim Ltd ......................................................................................................... 81,021 0.48
335 Julius Baer Group Ltd ....................................................................................... 19,780 0.12
45 Kuehne & Nagel International AG ..................................................................... 12,786 0.08
550 Logitech International SA .................................................................................. 40,808 0.24
75 Lonza Group AG ............................................................................................... 55,127 0.33
3,065 Nestle SA .......................................................................................................... 376,973 2.25
4,545 Novartis AG ...................................................................................................... 352,139 2.11
35 Partners Group Holding AG .............................................................................. 51,090 0.31
25 PSP Swiss Property AG .................................................................................... 2,743 0.02
1,345 Roche Holding AG ............................................................................................ 492,096 2.94
30 Schindler Holding AG ........................................................................................ 7,108 0.04
3 Siegfried Holding AG ........................................................................................ 2,575 0.02
250 SIG Combibloc Group AG ................................................................................. 6,143 0.04
420 Sika AG ............................................................................................................ 154,111 0.92
95 Sonova Holding AG .......................................................................................... 32,805 0.20
15 Straumann Holding AG ..................................................................................... 28,041 0.17
15 Swatch Group AG ............................................................................................. 4,039 0.02
85 Swiss Life Holding AG ...................................................................................... 45,857 0.27
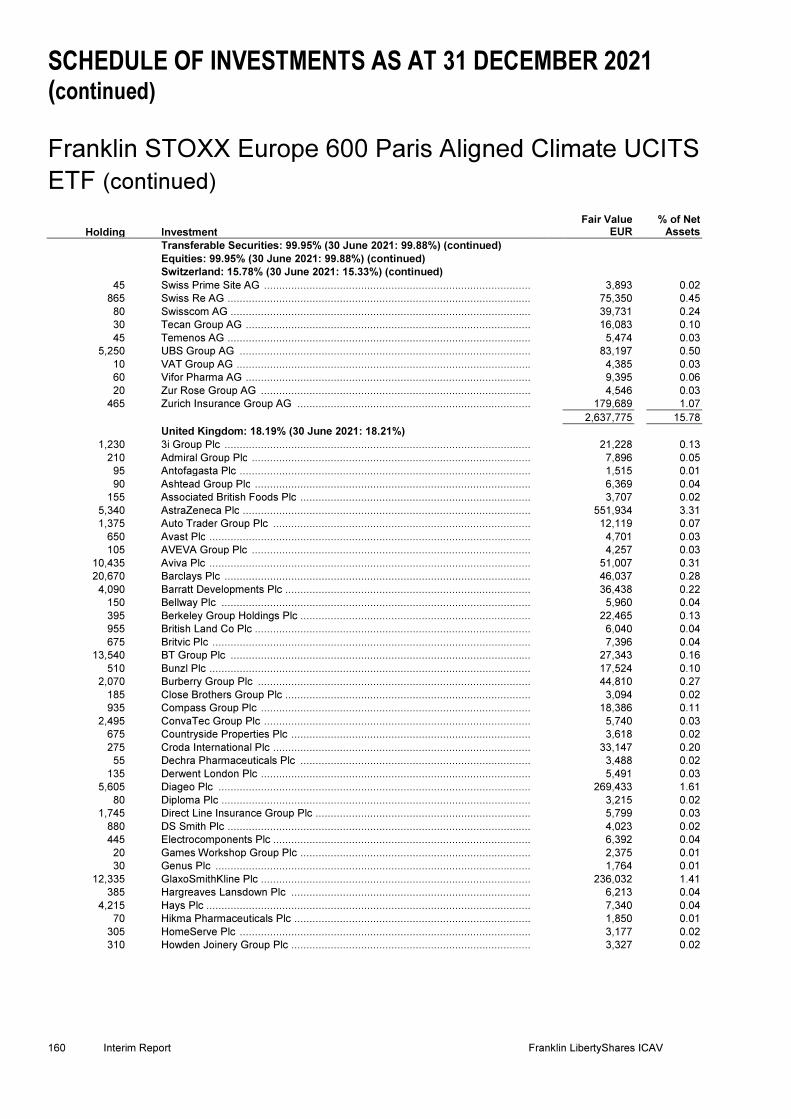
SCHEDULE OF INVESTMENTS AS AT 31 DECEMBER 2021 (continued) Franklin STOXX Europe 600 Paris Aligned Climate UCITS
ETF (continued)
160 Interim Report Franklin LibertyShares ICAV
Holding Investment
Fair Value EUR
% of Net Assets
Transferable Securities: 99.95% (30 June 2021: 99.88%) (continued)
Equities: 99.95% (30 June 2021: 99.88%) (continued)
Switzerland: 15.78% (30 June 2021: 15.33%) (continued)
45 Swiss Prime Site AG ........................................................................................ 3,893 0.02
865 Swiss Re AG .................................................................................................... 75,350 0.45
80 Swisscom AG ................................................................................................... 39,731 0.24
30 Tecan Group AG .............................................................................................. 16,083 0.10
45 Temenos AG .................................................................................................... 5,474 0.03
5,250 UBS Group AG ................................................................................................ 83,197 0.50
10 VAT Group AG ................................................................................................. 4,385 0.03
60 Vifor Pharma AG .............................................................................................. 9,395 0.06
20 Zur Rose Group AG ......................................................................................... 4,546 0.03
465 Zurich Insurance Group AG ............................................................................. 179,689 1.07
2,637,775 15.78
United Kingdom: 18.19% (30 June 2021: 18.21%)
1,230 3i Group Plc ..................................................................................................... 21,228 0.13
210 Admiral Group Plc ............................................................................................ 7,896 0.05
95 Antofagasta Plc ................................................................................................ 1,515 0.01
90 Ashtead Group Plc ........................................................................................... 6,369 0.04
155 Associated British Foods Plc ............................................................................ 3,707 0.02
5,340 AstraZeneca Plc ............................................................................................... 551,934 3.31
1,375 Auto Trader Group Plc ..................................................................................... 12,119 0.07
650 Avast Plc .......................................................................................................... 4,701 0.03
105 AVEVA Group Plc ............................................................................................ 4,257 0.03
10,435 Aviva Plc .......................................................................................................... 51,007 0.31
20,670 Barclays Plc ..................................................................................................... 46,037 0.28
4,090 Barratt Developments Plc ................................................................................. 36,438 0.22
150 Bellway Plc ...................................................................................................... 5,960 0.04
395 Berkeley Group Holdings Plc ............................................................................ 22,465 0.13
955 British Land Co Plc ........................................................................................... 6,040 0.04
675 Britvic Plc ......................................................................................................... 7,396 0.04
13,540 BT Group Plc ................................................................................................... 27,343 0.16
510 Bunzl Plc .......................................................................................................... 17,524 0.10
2,070 Burberry Group Plc .......................................................................................... 44,810 0.27
185 Close Brothers Group Plc ................................................................................. 3,094 0.02
935 Compass Group Plc ......................................................................................... 18,386 0.11
2,495 ConvaTec Group Plc ........................................................................................ 5,740 0.03
675 Countryside Properties Plc ............................................................................... 3,618 0.02
275 Croda International Plc ..................................................................................... 33,147 0.20
55 Dechra Pharmaceuticals Plc ............................................................................ 3,488 0.02
135 Derwent London Plc ......................................................................................... 5,491 0.03
5,605 Diageo Plc ....................................................................................................... 269,433 1.61
80 Diploma Plc ...................................................................................................... 3,215 0.02
1,745 Direct Line Insurance Group Plc ....................................................................... 5,799 0.03
880 DS Smith Plc .................................................................................................... 4,023 0.02
445 Electrocomponents Plc ..................................................................................... 6,392 0.04
20 Games Workshop Group Plc ............................................................................ 2,375 0.01
30 Genus Plc ........................................................................................................ 1,764 0.01
12,335 GlaxoSmithKline Plc ......................................................................................... 236,032 1.41
385 Hargreaves Lansdown Plc ............................................................................... 6,213 0.04
4,215 Hays Plc ........................................................................................................... 7,340 0.04
70 Hikma Pharmaceuticals Plc .............................................................................. 1,850 0.01
305 HomeServe Plc ................................................................................................ 3,177 0.02
310 Howden Joinery Group Plc ............................................................................... 3,327 0.02
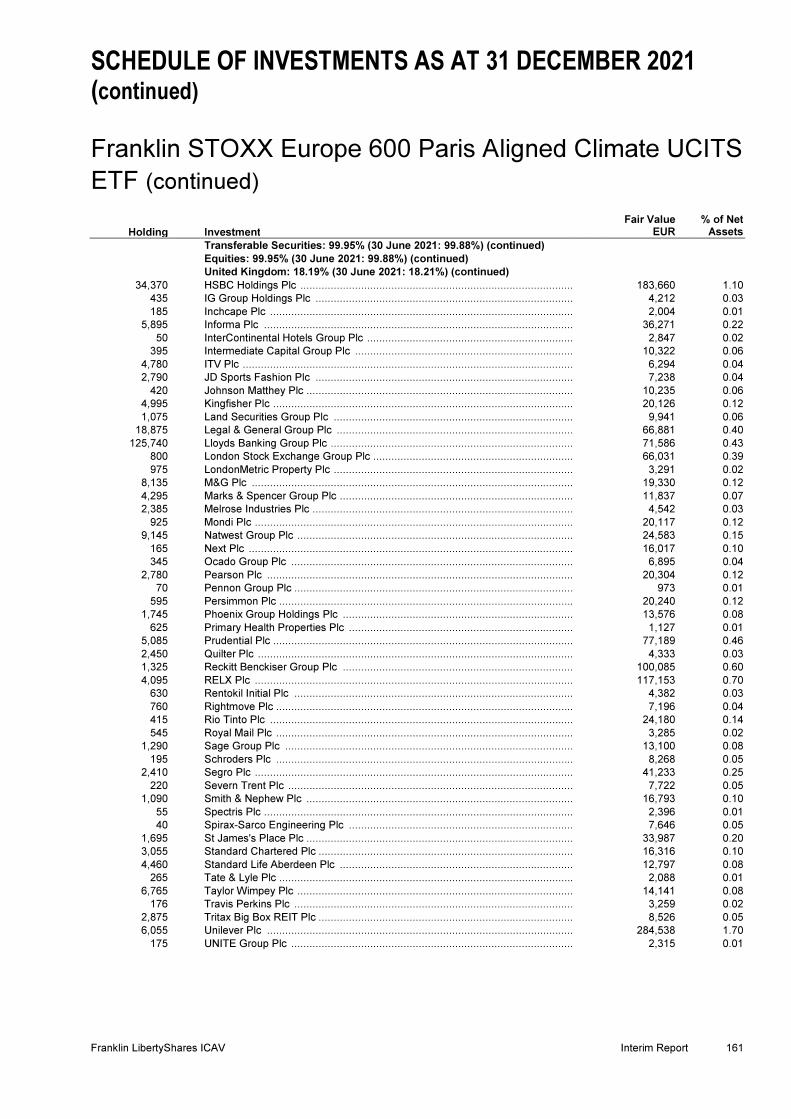
SCHEDULE OF INVESTMENTS AS AT 31 DECEMBER 2021 (continued) Franklin STOXX Europe 600 Paris Aligned Climate UCITS
ETF (continued)
Franklin LibertyShares ICAV Interim Report 161
Holding Investment
Fair Value EUR
% of Net Assets
Transferable Securities: 99.95% (30 June 2021: 99.88%) (continued)
Equities: 99.95% (30 June 2021: 99.88%) (continued)
United Kingdom: 18.19% (30 June 2021: 18.21%) (continued)
34,370 HSBC Holdings Plc ........................................................................................... 183,660 1.10
435 IG Group Holdings Plc ...................................................................................... 4,212 0.03
185 Inchcape Plc ..................................................................................................... 2,004 0.01
5,895 Informa Plc ....................................................................................................... 36,271 0.22
50 InterContinental Hotels Group Plc ..................................................................... 2,847 0.02
395 Intermediate Capital Group Plc ......................................................................... 10,322 0.06
4,780 ITV Plc .............................................................................................................. 6,294 0.04
2,790 JD Sports Fashion Plc ...................................................................................... 7,238 0.04
420 Johnson Matthey Plc ......................................................................................... 10,235 0.06
4,995 Kingfisher Plc .................................................................................................... 20,126 0.12
1,075 Land Securities Group Plc ................................................................................ 9,941 0.06
18,875 Legal & General Group Plc ............................................................................... 66,881 0.40
125,740 Lloyds Banking Group Plc ................................................................................. 71,586 0.43
800 London Stock Exchange Group Plc ................................................................... 66,031 0.39
975 LondonMetric Property Plc ................................................................................ 3,291 0.02
8,135 M&G Plc ........................................................................................................... 19,330 0.12
4,295 Marks & Spencer Group Plc .............................................................................. 11,837 0.07
2,385 Melrose Industries Plc ....................................................................................... 4,542 0.03
925 Mondi Plc .......................................................................................................... 20,117 0.12
9,145 Natwest Group Plc ............................................................................................ 24,583 0.15
165 Next Plc ............................................................................................................ 16,017 0.10
345 Ocado Group Plc .............................................................................................. 6,895 0.04
2,780 Pearson Plc ...................................................................................................... 20,304 0.12
70 Pennon Group Plc ............................................................................................. 973 0.01
595 Persimmon Plc .................................................................................................. 20,240 0.12
1,745 Phoenix Group Holdings Plc ............................................................................. 13,576 0.08
625 Primary Health Properties Plc ........................................................................... 1,127 0.01
5,085 Prudential Plc .................................................................................................... 77,189 0.46
2,450 Quilter Plc ......................................................................................................... 4,333 0.03
1,325 Reckitt Benckiser Group Plc ............................................................................. 100,085 0.60
4,095 RELX Plc .......................................................................................................... 117,153 0.70
630 Rentokil Initial Plc ............................................................................................. 4,382 0.03
760 Rightmove Plc ................................................................................................... 7,196 0.04
415 Rio Tinto Plc ..................................................................................................... 24,180 0.14
545 Royal Mail Plc ................................................................................................... 3,285 0.02
1,290 Sage Group Plc ................................................................................................ 13,100 0.08
195 Schroders Plc ................................................................................................... 8,268 0.05
2,410 Segro Plc .......................................................................................................... 41,233 0.25
220 Severn Trent Plc ............................................................................................... 7,722 0.05
1,090 Smith & Nephew Plc ......................................................................................... 16,793 0.10
55 Spectris Plc ....................................................................................................... 2,396 0.01
40 Spirax-Sarco Engineering Plc ........................................................................... 7,646 0.05
1,695 St James's Place Plc ......................................................................................... 33,987 0.20
3,055 Standard Chartered Plc ..................................................................................... 16,316 0.10
4,460 Standard Life Aberdeen Plc .............................................................................. 12,797 0.08
265 Tate & Lyle Plc .................................................................................................. 2,088 0.01
6,765 Taylor Wimpey Plc ............................................................................................ 14,141 0.08
176 Travis Perkins Plc ............................................................................................. 3,259 0.02
2,875 Tritax Big Box REIT Plc ..................................................................................... 8,526 0.05
6,055 Unilever Plc ...................................................................................................... 284,538 1.70
175 UNITE Group Plc .............................................................................................. 2,315 0.01
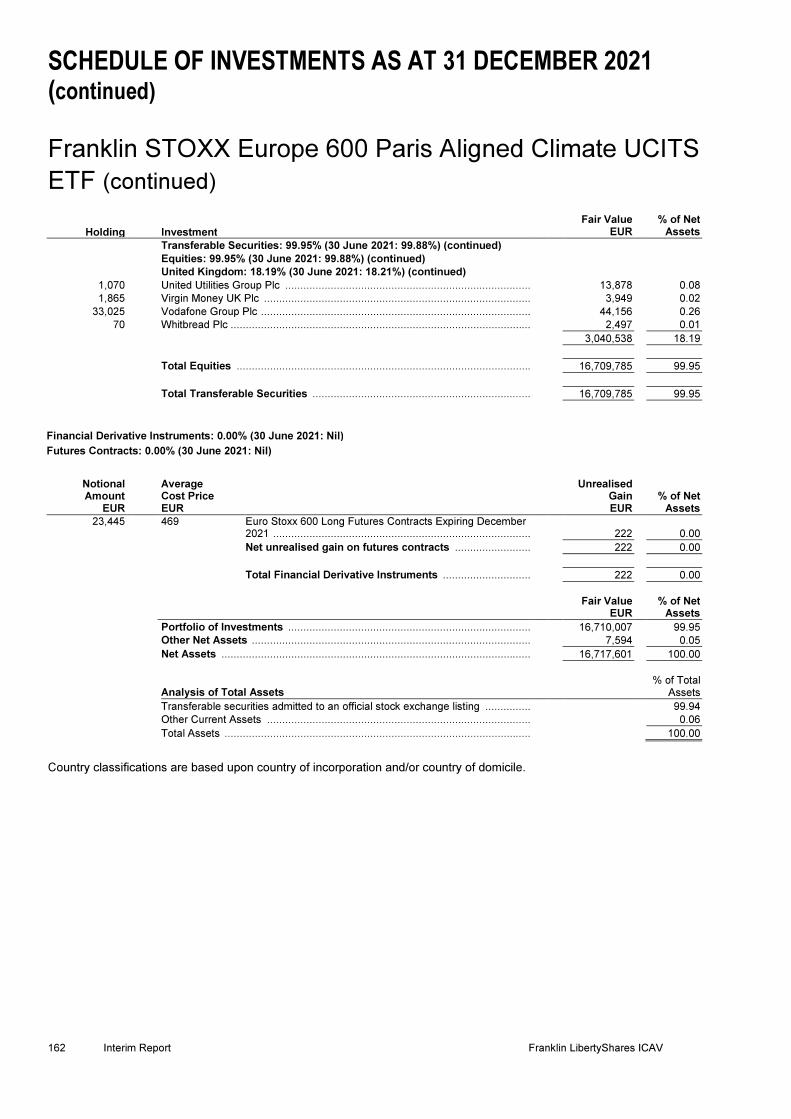
SCHEDULE OF INVESTMENTS AS AT 31 DECEMBER 2021 (continued) Franklin STOXX Europe 600 Paris Aligned Climate UCITS
ETF (continued)
162 Interim Report Franklin LibertyShares ICAV
Holding Investment
Fair Value EUR
% of Net Assets
Transferable Securities: 99.95% (30 June 2021: 99.88%) (continued)
Equities: 99.95% (30 June 2021: 99.88%) (continued)
United Kingdom: 18.19% (30 June 2021: 18.21%) (continued)
1,070 United Utilities Group Plc ................................................................................. 13,878 0.08
1,865 Virgin Money UK Plc ........................................................................................ 3,949 0.02
33,025 Vodafone Group Plc ......................................................................................... 44,156 0.26
70 Whitbread Plc ................................................................................................... 2,497 0.01
3,040,538 18.19
Total Equities ................................................................................................................................ 16,709,785 99.95
Total Transferable Securities ................................................................................................ 16,709,785 99.95
Financial Derivative Instruments: 0.00% (30 June 2021: Nil)
Futures Contracts: 0.00% (30 June 2021: Nil)
Notional Amount
EUR
Average Cost Price EUR
Unrealised Gain EUR
% of Net Assets
23,445 469 Euro Stoxx 600 Long Futures Contracts Expiring December 2021 ................................................................................................ 222 0.00
Net unrealised gain on futures contracts ................................ 222 0.00
Total Financial Derivative Instruments ................................ 222 0.00
Fair Value EUR
% of Net Assets
Portfolio of Investments ................................................................................................ 16,710,007 99.95
Other Net Assets ................................................................................................ 7,594 0.05
Net Assets ................................................................................................................................ 16,717,601 100.00
Analysis of Total Assets % of Total
Assets
Transferable securities admitted to an official stock exchange listing ................................ 99.94
Other Current Assets ................................................................................................ 0.06
Total Assets ................................................................................................................................ 100.00
Country classifications are based upon country of incorporation and/or country of domicile.
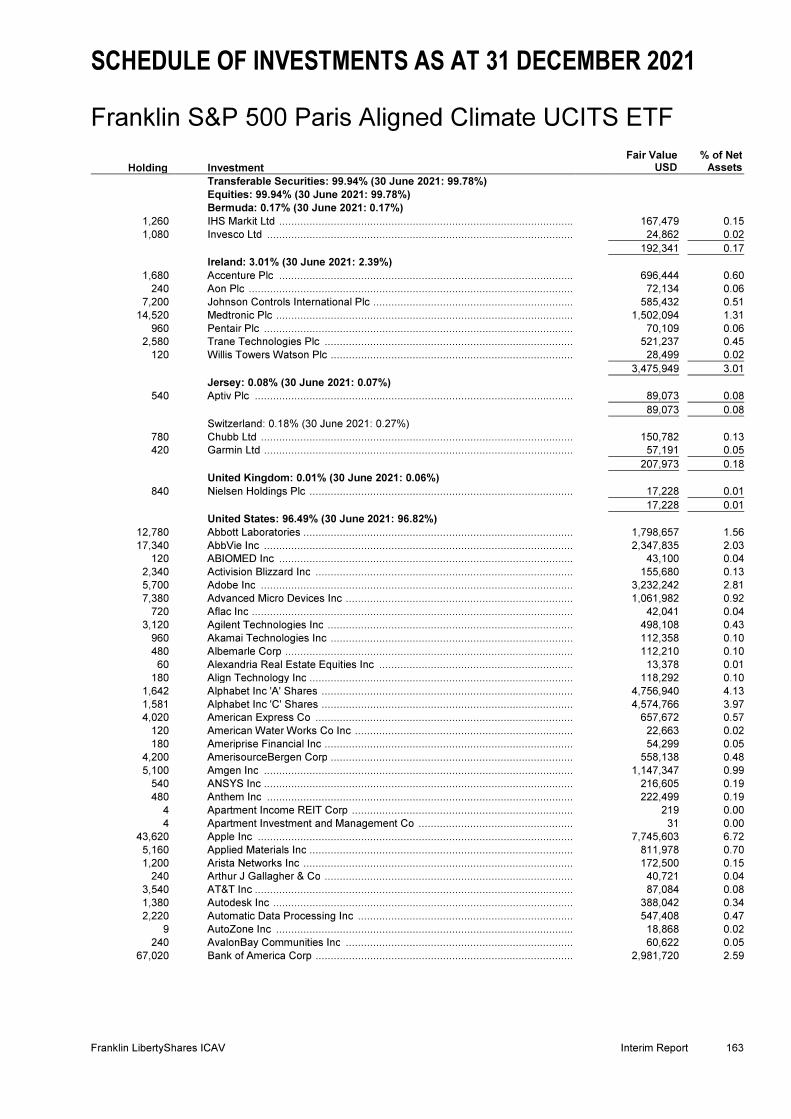
SCHEDULE OF INVESTMENTS AS AT 31 DECEMBER 2021 Franklin S&P 500 Paris Aligned Climate UCITS ETF
Franklin LibertyShares ICAV Interim Report 163
Holding Investment
Fair Value USD
% of Net Assets
Transferable Securities: 99.94% (30 June 2021: 99.78%) Equities: 99.94% (30 June 2021: 99.78%)
Bermuda: 0.17% (30 June 2021: 0.17%)
1,260 IHS Markit Ltd ................................................................................................... 167,479 0.15
1,080 Invesco Ltd ....................................................................................................... 24,862 0.02
192,341 0.17
Ireland: 3.01% (30 June 2021: 2.39%)
1,680 Accenture Plc ................................................................................................... 696,444 0.60
240 Aon Plc ............................................................................................................. 72,134 0.06
7,200 Johnson Controls International Plc .................................................................... 585,432 0.51
14,520 Medtronic Plc .................................................................................................... 1,502,094 1.31
960 Pentair Plc ........................................................................................................ 70,109 0.06
2,580 Trane Technologies Plc .................................................................................... 521,237 0.45
120 Willis Towers Watson Plc .................................................................................. 28,499 0.02
3,475,949 3.01
Jersey: 0.08% (30 June 2021: 0.07%)
540 Aptiv Plc ........................................................................................................... 89,073 0.08
89,073 0.08
Switzerland: 0.18% (30 June 2021: 0.27%)
780 Chubb Ltd ......................................................................................................... 150,782 0.13
420 Garmin Ltd ........................................................................................................ 57,191 0.05
207,973 0.18
United Kingdom: 0.01% (30 June 2021: 0.06%)
840 Nielsen Holdings Plc ......................................................................................... 17,228 0.01
17,228 0.01
United States: 96.49% (30 June 2021: 96.82%)
12,780 Abbott Laboratories ........................................................................................... 1,798,657 1.56
17,340 AbbVie Inc ........................................................................................................ 2,347,835 2.03
120 ABIOMED Inc ................................................................................................... 43,100 0.04
2,340 Activision Blizzard Inc ....................................................................................... 155,680 0.13
5,700 Adobe Inc ......................................................................................................... 3,232,242 2.81
7,380 Advanced Micro Devices Inc ............................................................................. 1,061,982 0.92
720 Aflac Inc ............................................................................................................ 42,041 0.04
3,120 Agilent Technologies Inc ................................................................................... 498,108 0.43
960 Akamai Technologies Inc .................................................................................. 112,358 0.10
480 Albemarle Corp ................................................................................................ 112,210 0.10
60 Alexandria Real Estate Equities Inc .................................................................. 13,378 0.01
180 Align Technology Inc ......................................................................................... 118,292 0.10
1,642 Alphabet Inc 'A' Shares ..................................................................................... 4,756,940 4.13
1,581 Alphabet Inc 'C' Shares ..................................................................................... 4,574,766 3.97
4,020 American Express Co ....................................................................................... 657,672 0.57
120 American Water Works Co Inc .......................................................................... 22,663 0.02
180 Ameriprise Financial Inc .................................................................................... 54,299 0.05
4,200 AmerisourceBergen Corp .................................................................................. 558,138 0.48
5,100 Amgen Inc ........................................................................................................ 1,147,347 0.99
540 ANSYS Inc ........................................................................................................ 216,605 0.19
480 Anthem Inc ....................................................................................................... 222,499 0.19
4 Apartment Income REIT Corp ........................................................................... 219 0.00
4 Apartment Investment and Management Co ..................................................... 31 0.00
43,620 Apple Inc .......................................................................................................... 7,745,603 6.72
5,160 Applied Materials Inc ......................................................................................... 811,978 0.70
1,200 Arista Networks Inc ........................................................................................... 172,500 0.15
240 Arthur J Gallagher & Co .................................................................................... 40,721 0.04
3,540 AT&T Inc ........................................................................................................... 87,084 0.08
1,380 Autodesk Inc ..................................................................................................... 388,042 0.34
2,220 Automatic Data Processing Inc ......................................................................... 547,408 0.47
9 AutoZone Inc .................................................................................................... 18,868 0.02
240 AvalonBay Communities Inc ............................................................................. 60,622 0.05
67,020 Bank of America Corp ....................................................................................... 2,981,720 2.59
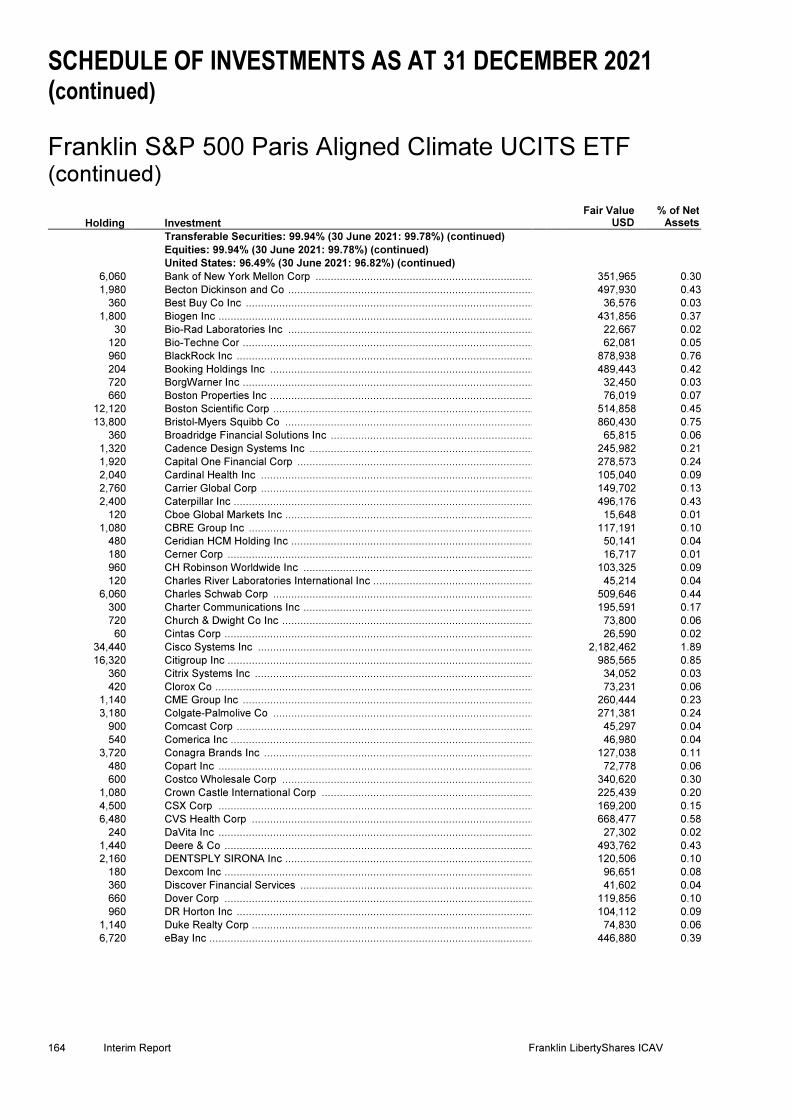
SCHEDULE OF INVESTMENTS AS AT 31 DECEMBER 2021 (continued) Franklin S&P 500 Paris Aligned Climate UCITS ETF
(continued)
164 Interim Report Franklin LibertyShares ICAV
Holding Investment
Fair Value USD
% of Net Assets
Transferable Securities: 99.94% (30 June 2021: 99.78%) (continued) Equities: 99.94% (30 June 2021: 99.78%) (continued)
United States: 96.49% (30 June 2021: 96.82%) (continued)
6,060 Bank of New York Mellon Corp ........................................................................ 351,965 0.30
1,980 Becton Dickinson and Co ................................................................................. 497,930 0.43
360 Best Buy Co Inc ............................................................................................... 36,576 0.03
1,800 Biogen Inc ........................................................................................................ 431,856 0.37
30 Bio-Rad Laboratories Inc ................................................................................. 22,667 0.02
120 Bio-Techne Cor ................................................................................................ 62,081 0.05
960 BlackRock Inc .................................................................................................. 878,938 0.76
204 Booking Holdings Inc ....................................................................................... 489,443 0.42
720 BorgWarner Inc ................................................................................................ 32,450 0.03
660 Boston Properties Inc ....................................................................................... 76,019 0.07
12,120 Boston Scientific Corp ...................................................................................... 514,858 0.45
13,800 Bristol-Myers Squibb Co .................................................................................. 860,430 0.75
360 Broadridge Financial Solutions Inc ................................................................... 65,815 0.06
1,320 Cadence Design Systems Inc .......................................................................... 245,982 0.21
1,920 Capital One Financial Corp .............................................................................. 278,573 0.24
2,040 Cardinal Health Inc .......................................................................................... 105,040 0.09
2,760 Carrier Global Corp .......................................................................................... 149,702 0.13
2,400 Caterpillar Inc ................................................................................................... 496,176 0.43
120 Cboe Global Markets Inc .................................................................................. 15,648 0.01
1,080 CBRE Group Inc .............................................................................................. 117,191 0.10
480 Ceridian HCM Holding Inc ................................................................................ 50,141 0.04
180 Cerner Corp ..................................................................................................... 16,717 0.01
960 CH Robinson Worldwide Inc ............................................................................ 103,325 0.09
120 Charles River Laboratories International Inc ..................................................... 45,214 0.04
6,060 Charles Schwab Corp ...................................................................................... 509,646 0.44
300 Charter Communications Inc ............................................................................ 195,591 0.17
720 Church & Dwight Co Inc ................................................................................... 73,800 0.06
60 Cintas Corp ...................................................................................................... 26,590 0.02
34,440 Cisco Systems Inc ........................................................................................... 2,182,462 1.89
16,320 Citigroup Inc ..................................................................................................... 985,565 0.85
360 Citrix Systems Inc ............................................................................................ 34,052 0.03
420 Clorox Co ......................................................................................................... 73,231 0.06
1,140 CME Group Inc ................................................................................................ 260,444 0.23
3,180 Colgate-Palmolive Co ...................................................................................... 271,381 0.24
900 Comcast Corp .................................................................................................. 45,297 0.04
540 Comerica Inc .................................................................................................... 46,980 0.04
3,720 Conagra Brands Inc ......................................................................................... 127,038 0.11
480 Copart Inc ........................................................................................................ 72,778 0.06
600 Costco Wholesale Corp ................................................................................... 340,620 0.30
1,080 Crown Castle International Corp ...................................................................... 225,439 0.20
4,500 CSX Corp ........................................................................................................ 169,200 0.15
6,480 CVS Health Corp ............................................................................................. 668,477 0.58
240 DaVita Inc ........................................................................................................ 27,302 0.02
1,440 Deere & Co ...................................................................................................... 493,762 0.43
2,160 DENTSPLY SIRONA Inc .................................................................................. 120,506 0.10
180 Dexcom Inc ...................................................................................................... 96,651 0.08
360 Discover Financial Services ............................................................................. 41,602 0.04
660 Dover Corp ...................................................................................................... 119,856 0.10
960 DR Horton Inc .................................................................................................. 104,112 0.09
1,140 Duke Realty Corp ............................................................................................. 74,830 0.06
6,720 eBay Inc ........................................................................................................... 446,880 0.39
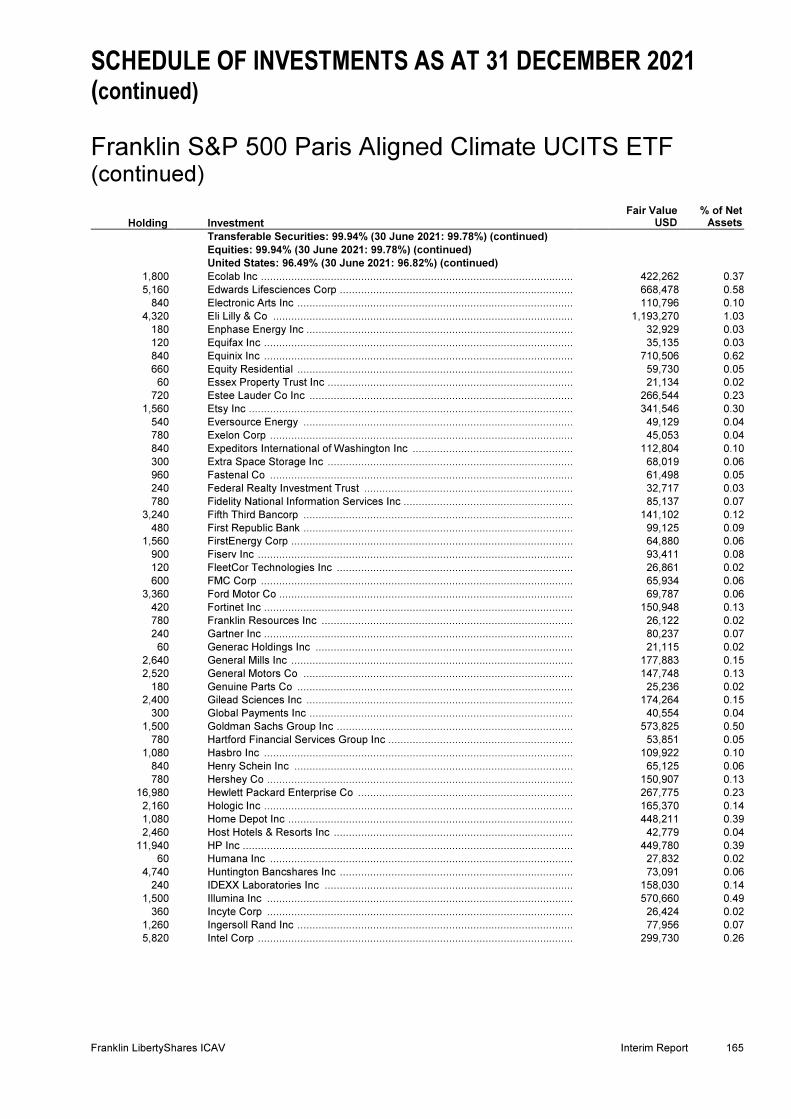
SCHEDULE OF INVESTMENTS AS AT 31 DECEMBER 2021 (continued) Franklin S&P 500 Paris Aligned Climate UCITS ETF
(continued)
Franklin LibertyShares ICAV Interim Report 165
Holding Investment
Fair Value USD
% of Net Assets
Transferable Securities: 99.94% (30 June 2021: 99.78%) (continued) Equities: 99.94% (30 June 2021: 99.78%) (continued)
United States: 96.49% (30 June 2021: 96.82%) (continued)
1,800 Ecolab Inc ......................................................................................................... 422,262 0.37
5,160 Edwards Lifesciences Corp ............................................................................... 668,478 0.58
840 Electronic Arts Inc ............................................................................................. 110,796 0.10
4,320 Eli Lilly & Co ..................................................................................................... 1,193,270 1.03
180 Enphase Energy Inc .......................................................................................... 32,929 0.03
120 Equifax Inc ........................................................................................................ 35,135 0.03
840 Equinix Inc ........................................................................................................ 710,506 0.62
660 Equity Residential ............................................................................................. 59,730 0.05
60 Essex Property Trust Inc ................................................................................... 21,134 0.02
720 Estee Lauder Co Inc ......................................................................................... 266,544 0.23
1,560 Etsy Inc ............................................................................................................. 341,546 0.30
540 Eversource Energy ........................................................................................... 49,129 0.04
780 Exelon Corp ...................................................................................................... 45,053 0.04
840 Expeditors International of Washington Inc ....................................................... 112,804 0.10
300 Extra Space Storage Inc ................................................................................... 68,019 0.06
960 Fastenal Co ...................................................................................................... 61,498 0.05
240 Federal Realty Investment Trust ....................................................................... 32,717 0.03
780 Fidelity National Information Services Inc .......................................................... 85,137 0.07
3,240 Fifth Third Bancorp ........................................................................................... 141,102 0.12
480 First Republic Bank ........................................................................................... 99,125 0.09
1,560 FirstEnergy Corp ............................................................................................... 64,880 0.06
900 Fiserv Inc .......................................................................................................... 93,411 0.08
120 FleetCor Technologies Inc ................................................................................ 26,861 0.02
600 FMC Corp ......................................................................................................... 65,934 0.06
3,360 Ford Motor Co ................................................................................................... 69,787 0.06
420 Fortinet Inc ........................................................................................................ 150,948 0.13
780 Franklin Resources Inc ..................................................................................... 26,122 0.02
240 Gartner Inc ........................................................................................................ 80,237 0.07
60 Generac Holdings Inc ....................................................................................... 21,115 0.02
2,640 General Mills Inc ............................................................................................... 177,883 0.15
2,520 General Motors Co ........................................................................................... 147,748 0.13
180 Genuine Parts Co ............................................................................................. 25,236 0.02
2,400 Gilead Sciences Inc .......................................................................................... 174,264 0.15
300 Global Payments Inc ......................................................................................... 40,554 0.04
1,500 Goldman Sachs Group Inc ................................................................................ 573,825 0.50
780 Hartford Financial Services Group Inc ............................................................... 53,851 0.05
1,080 Hasbro Inc ........................................................................................................ 109,922 0.10
840 Henry Schein Inc .............................................................................................. 65,125 0.06
780 Hershey Co ....................................................................................................... 150,907 0.13
16,980 Hewlett Packard Enterprise Co ......................................................................... 267,775 0.23
2,160 Hologic Inc ........................................................................................................ 165,370 0.14
1,080 Home Depot Inc ................................................................................................ 448,211 0.39
2,460 Host Hotels & Resorts Inc ................................................................................. 42,779 0.04
11,940 HP Inc ............................................................................................................... 449,780 0.39
60 Humana Inc ...................................................................................................... 27,832 0.02
4,740 Huntington Bancshares Inc ............................................................................... 73,091 0.06
240 IDEXX Laboratories Inc .................................................................................... 158,030 0.14
1,500 Illumina Inc ....................................................................................................... 570,660 0.49
360 Incyte Corp ....................................................................................................... 26,424 0.02
1,260 Ingersoll Rand Inc ............................................................................................. 77,956 0.07
5,820 Intel Corp .......................................................................................................... 299,730 0.26

SCHEDULE OF INVESTMENTS AS AT 31 DECEMBER 2021 (continued) Franklin S&P 500 Paris Aligned Climate UCITS ETF
(continued)
166 Interim Report Franklin LibertyShares ICAV
Holding Investment
Fair Value USD
% of Net Assets
Transferable Securities: 99.94% (30 June 2021: 99.78%) (continued) Equities: 99.94% (30 June 2021: 99.78%) (continued)
United States: 96.49% (30 June 2021: 96.82%) (continued)
1,740 Intercontinental Exchange Inc .......................................................................... 237,980 0.21
900 International Business Machines Corp ............................................................. 120,294 0.10
2,280 International Flavors & Fragrances Inc ............................................................. 343,482 0.30
1,920 Interpublic Group of Co Inc .............................................................................. 71,904 0.06
2,280 Intuit Inc ........................................................................................................... 1,466,542 1.27
1,020 Intuitive Surgical Inc ......................................................................................... 366,486 0.32
720 IQVIA Holdings Inc ........................................................................................... 203,141 0.18
120 Jack Henry & Associates Inc ............................................................................ 20,039 0.02
12,360 JPMorgan Chase & Co .................................................................................... 1,957,206 1.70
1,920 Juniper Networks Inc ........................................................................................ 68,563 0.06
4,200 KeyCorp ........................................................................................................... 97,146 0.08
1,320 Keysight Technologies Inc ............................................................................... 272,593 0.24
1,620 Kimco Realty Corp ........................................................................................... 39,933 0.03
420 KLA Corp ......................................................................................................... 180,646 0.16
3,960 Kraft Heinz Co ................................................................................................. 142,164 0.12
660 L Brands Inc ..................................................................................................... 46,061 0.04
1,500 Lam Research Corp ......................................................................................... 1,078,725 0.93
240 Lamb Weston Holdings Inc .............................................................................. 15,211 0.01
900 Lowe's Co Inc .................................................................................................. 232,632 0.20
120 M&T Bank Corp ............................................................................................... 18,430 0.02
120 MarketAxess Holdings Inc ................................................................................ 49,352 0.04
1,440 Marsh & McLennan Co Inc ............................................................................... 250,301 0.22
840 Masco Corp ..................................................................................................... 58,985 0.05
6,600 Mastercard Inc ................................................................................................. 2,371,511 2.06
720 Match Group Inc .............................................................................................. 95,220 0.08
1,740 McCormick & Co Inc ........................................................................................ 168,101 0.15
1,020 McDonald's Corp ............................................................................................. 273,431 0.24
1,200 McKesson Corp ............................................................................................... 298,284 0.26
20,640 Merck & Co Inc ................................................................................................ 1,581,850 1.37
6,360 Meta Platforms Inc ........................................................................................... 2,139,186 1.85
77 Mettler-Toledo International Inc ........................................................................ 130,685 0.11
1,500 Micron Technology Inc ..................................................................................... 139,725 0.12
60 Mid-America Apartment Communities Inc ........................................................ 13,766 0.01
1,440 Moderna Inc ..................................................................................................... 365,731 0.32
3,600 Mondelez International Inc ............................................................................... 238,716 0.21
19 Monolithic Power Systems Inc ......................................................................... 9,373 0.01
720 Monster Beverage Corp ................................................................................... 69,149 0.06
1,200 Moody's Corp ................................................................................................... 468,696 0.41
7,200 Morgan Stanley ................................................................................................ 706,752 0.61
720 Motorola Solutions Inc ...................................................................................... 195,624 0.17
420 MSCI Inc .......................................................................................................... 257,330 0.22
720 Nasdaq Inc ....................................................................................................... 151,207 0.13
720 Netflix Inc ......................................................................................................... 433,757 0.38
3,840 News Corp 'A' Shares ...................................................................................... 85,670 0.07
1,260 News Corp 'B' Shares ...................................................................................... 28,350 0.02
4,140 NIKE Inc .......................................................................................................... 690,014 0.60
1,320 Northern Trust Corp ......................................................................................... 157,885 0.14
3,120 NortonLifeLock Inc ........................................................................................... 81,058 0.07
16,380 NVIDIA Corp .................................................................................................... 4,817,522 4.18
8 NVR Inc ........................................................................................................... 47,271 0.04
11,700 Oracle Corp ..................................................................................................... 1,020,357 0.88

SCHEDULE OF INVESTMENTS AS AT 31 DECEMBER 2021 (continued) Franklin S&P 500 Paris Aligned Climate UCITS ETF
(continued)
Franklin LibertyShares ICAV Interim Report 167
Holding Investment
Fair Value USD
% of Net Assets
Transferable Securities: 99.94% (30 June 2021: 99.78%) (continued) Equities: 99.94% (30 June 2021: 99.78%) (continued)
United States: 96.49% (30 June 2021: 96.82%) (continued)
780 Organon & Co ................................................................................................... 23,751 0.02
780 Otis Worldwide Corp ......................................................................................... 67,915 0.06
1,200 PACCAR Inc ..................................................................................................... 105,912 0.09
960 Paychex Inc ...................................................................................................... 131,040 0.11
120 Paycom Software Inc ........................................................................................ 49,823 0.04
3,780 PayPal Holdings Inc .......................................................................................... 712,832 0.62
1,020 People's United Financial Inc ............................................................................ 18,176 0.02
3,000 PepsiCo Inc ...................................................................................................... 521,130 0.45
540 PerkinElmer Inc ................................................................................................ 108,572 0.09
33,900 Pfizer Inc ........................................................................................................... 2,001,795 1.73
1,740 PNC Financial Services Group Inc .................................................................... 348,905 0.30
60 Pool Corp .......................................................................................................... 33,960 0.03
240 PPG Industries Inc ............................................................................................ 41,386 0.04
8,280 Procter & Gamble Co ........................................................................................ 1,354,442 1.17
2,400 Prologis Inc ....................................................................................................... 404,064 0.35
420 PTC Inc ............................................................................................................ 50,883 0.04
480 Public Storage .................................................................................................. 179,789 0.16
780 PulteGroup Inc .................................................................................................. 44,585 0.04
840 PVH Corp ......................................................................................................... 89,586 0.08
5,760 QUALCOMM Inc ............................................................................................... 1,053,331 0.91
240 Quest Diagnostics Inc ....................................................................................... 41,522 0.04
240 Ralph Lauren Corp ........................................................................................... 28,526 0.02
360 Raymond James Financial Inc .......................................................................... 36,144 0.03
1,680 Realty Income Corp .......................................................................................... 120,271 0.10
300 Regency Centers Corp ..................................................................................... 22,605 0.02
1,080 Regeneron Pharmaceuticals Inc ....................................................................... 682,042 0.59
360 Republic Services Inc ....................................................................................... 50,202 0.04
420 ResMed Inc ...................................................................................................... 109,402 0.09
360 Robert Half International Inc ............................................................................. 40,147 0.03
360 Rockwell Automation Inc ................................................................................... 125,586 0.11
180 Ross Stores Inc ................................................................................................ 20,570 0.02
2,460 S&P Global Inc ................................................................................................ 1,160,948 1.01
8,460 salesforce.com Inc ............................................................................................ 2,149,939 1.86
240 SBA Communications Corp .............................................................................. 93,365 0.08
960 ServiceNow Inc ................................................................................................ 623,146 0.54
600 Sherwin-Williams Co ......................................................................................... 211,296 0.18
1,260 Simon Property Group Inc ................................................................................. 201,310 0.17
1 SL Green Realty Corp ....................................................................................... 72 0.00
1,260 Stanley Black & Decker Inc ............................................................................... 237,661 0.21
540 Starbucks Corp ................................................................................................ 63,164 0.05
2,580 State Street Corp .............................................................................................. 239,940 0.21
900 Stryker Corp ..................................................................................................... 240,678 0.21
180 SVB Financial Group ........................................................................................ 122,083 0.11
1,620 Synchrony Financial .......................................................................................... 75,152 0.07
900 Synopsys Inc .................................................................................................... 331,650 0.29
1,080 Sysco Corp ....................................................................................................... 84,834 0.07
1,620 T Rowe Price Group Inc .................................................................................... 318,557 0.28
300 Take-Two Interactive Software Inc .................................................................... 53,316 0.05
1,560 Tapestry Inc ...................................................................................................... 63,336 0.05
1,020 Target Corp ...................................................................................................... 236,069 0.20
120 Teleflex Inc ....................................................................................................... 39,418 0.03

SCHEDULE OF INVESTMENTS AS AT 31 DECEMBER 2021 (continued) Franklin S&P 500 Paris Aligned Climate UCITS ETF
(continued)
168 Interim Report Franklin LibertyShares ICAV
Holding Investment
Fair Value USD
% of Net Assets
Transferable Securities: 99.94% (30 June 2021: 99.78%) (continued) Equities: 99.94% (30 June 2021: 99.78%) (continued)
United States: 96.49% (30 June 2021: 96.82%) (continued)
2,657 Tesla Inc .......................................................................................................... 2,807,864 2.44
2,520 Thermo Fisher Scientific Inc ............................................................................. 1,681,445 1.46
1,500 TJX Co Inc ....................................................................................................... 113,880 0.10
1,740 Truist Financial Corp ........................................................................................ 101,877 0.09
2,460 Twitter Inc ........................................................................................................ 106,321 0.09
240 Tyler Technologies Inc ..................................................................................... 129,108 0.11
960 Tyson Foods Inc .............................................................................................. 83,674 0.07
600 UDR Inc ........................................................................................................... 35,994 0.03
1,200 United Parcel Service Inc ................................................................................. 257,208 0.22
4,800 UnitedHealth Group Inc .................................................................................... 2,410,271 2.09
3,780 US Bancorp ..................................................................................................... 212,323 0.18
1,200 Ventas Inc ........................................................................................................ 61,344 0.05
240 VeriSign Inc ..................................................................................................... 60,917 0.05
960 Verisk Analytics Inc .......................................................................................... 219,581 0.19
3,360 Verizon Communications Inc ............................................................................ 174,586 0.15
540 Vertex Pharmaceuticals Inc .............................................................................. 118,584 0.10
780 VF Corp ........................................................................................................... 57,112 0.05
2,460 Viatris Inc ......................................................................................................... 33,284 0.03
12,900 Visa Inc ............................................................................................................ 2,795,559 2.43
2,940 Walgreens Boots Alliance Inc ........................................................................... 153,350 0.13
9,000 Walt Disney Co ................................................................................................ 1,394,010 1.21
420 Waters Corp ..................................................................................................... 156,492 0.14
1,560 Welltower Inc ................................................................................................... 133,801 0.12
180 West Pharmaceutical Services Inc ................................................................... 84,422 0.07
1,500 Weyerhaeuser Co ............................................................................................ 61,770 0.05
180 Whirlpool Corp ................................................................................................. 42,239 0.04
960 Xylem Inc ......................................................................................................... 115,123 0.10
420 Yum! Brands Inc .............................................................................................. 58,321 0.05
60 Zebra Technologies Corp ................................................................................. 35,712 0.03
660 Zimmer Biomet Holdings Inc ............................................................................ 83,846 0.07
300 Zions Bancorp NA ............................................................................................ 18,948 0.02
1,440 Zoetis Inc ......................................................................................................... 351,403 0.30
111,352,833 96.49
Total Equities ................................................................................................................................115,335,397 99.94
Total Transferable Securities ................................................................................................115,335,397 99.94

SCHEDULE OF INVESTMENTS AS AT 31 DECEMBER 2021 (continued) Franklin S&P 500 Paris Aligned Climate UCITS ETF
(continued)
Franklin LibertyShares ICAV Interim Report 169
Fair Value USD
% of Net Assets
Portfolio of Investments ................................................................................................ 115,335,397 99.94
Other Net Assets ................................................................................................ 65,599 0.06
Net Assets ................................................................................................................................ 115,400,996 100.00
Analysis of Total Assets
% of Total Assets
Transferable securities admitted to an official stock exchange listing ................................ 92.61
Other Current Assets ................................................................................................ 7.39
Total Assets ................................................................................................................................ 100.00
Country classifications are based upon country of incorporation and/or country of domicile.

SCHEDULE OF PORTFOLIO CHANGES
Franklin FTSE Brazil UCITS ETF
Schedule of Portfolio Changes for the period ended 31 December 2021.
170 Interim Report Franklin LibertyShares ICAV
In accordance with the UCITS Regulations this statement presents the aggregate purchases and aggregate sales of a
security exceeding 1.00% of the total value of purchases or sales for the period or at least the top 20 purchases and sales.
Major Purchases Shares Cost USD
Vale SA ADR .................................................................................................................... 87,713 1,219,736
Petroleo Brasileiro SA ADR .............................................................................................. 61,779 626,315
Itau Unibanco Holding SA ADR ........................................................................................ 105,960 457,916
Petroleo Brasileiro SA ADR .............................................................................................. 41,180 430,426
Banco Bradesco SA ADR ................................................................................................. 104,641 390,122
B3 SA - Brasil Bolsa Balcao ............................................................................................. 135,500 300,670
Rede D'Or Sao Luiz SA .................................................................................................... 22,500 272,424
Ambev SA ADR ................................................................................................................ 97,120 271,290
WEG SA ........................................................................................................................... 33,400 225,848
Embraer SA ...................................................................................................................... 49,400 200,062
Itausa SA .......................................................................................................................... 100,500 197,622
Vibra Energia SA (voting rights) ........................................................................................ 38,700 189,488
Petro Rio SA .................................................................................................................... 45,400 186,307
Natura & Co Holding SA ................................................................................................... 21,700 165,179
Magazine Luiza SA ........................................................................................................... 64,800 159,424
Suzano SA ....................................................................................................................... 16,900 153,735
Notre Dame Intermedica Participacoes SA ....................................................................... 11,700 149,563
Lojas Renner SA .............................................................................................................. 24,760 146,825
JBS SA ADR .................................................................................................................... 10,400 140,254
Localiza Rent a Car SA .................................................................................................... 13,200 124,437
Gerdau SA ....................................................................................................................... 24,100 114,627
Cosan SA ......................................................................................................................... 26,500 108,166
Banco do Brasil SA ........................................................................................................... 18,500 100,950
Banco Bradesco SA ......................................................................................................... 31,800 100,438

SCHEDULE OF PORTFOLIO CHANGES (continued)
Franklin FTSE Brazil UCITS ETF (continued)
Schedule of Portfolio Changes for the period ended 31 December 2021.
Franklin LibertyShares ICAV Interim Report 171
Major Sales Shares Proceeds USD
Vale SA ADR .................................................................................................................... 25,676 343,096
XP Inc .............................................................................................................................. 5,007 208,878
Petroleo Brasileiro SA ADR .............................................................................................. 16,059 164,506
Petroleo Brasileiro SA ADR .............................................................................................. 11,282 118,631
Itau Unibanco Holding SA ADR ........................................................................................ 28,200 115,277
Banco Bradesco SA ADR ................................................................................................. 27,769 98,702
Cosan SA ......................................................................................................................... 17,800 74,379
B3 SA - Brasil Bolsa Balcao ............................................................................................. 35,900 73,723
Ambev SA ADR ................................................................................................................ 25,900 73,530
WEG SA ........................................................................................................................... 8,500 49,973
Itausa SA ......................................................................................................................... 26,700 46,889
Suzano SA ....................................................................................................................... 4,600 45,669
JBS SA ADR .................................................................................................................... 3,539 44,104
Cia de Saneamento do Parana ........................................................................................ 10,800 37,639
Natura & Co Holding SA ................................................................................................... 5,800 31,279
Banco do Brasil SA .......................................................................................................... 5,300 29,686
Notre Dame Intermedica Participacoes SA ....................................................................... 2,700 29,363
Gerdau SA ....................................................................................................................... 6,400 29,271
Banco Bradesco SA ......................................................................................................... 9,000 27,531
Localiza Rent a Car SA .................................................................................................... 3,000 27,131
TOTVS SA ....................................................................................................................... 4,900 26,569
Raia Drogasil SA .............................................................................................................. 6,400 26,231

SCHEDULE OF PORTFOLIO CHANGES (continued) Franklin FTSE China UCITS ETF
Schedule of Portfolio Changes for the period ended 31 December 2021.
172 Interim Report Franklin LibertyShares ICAV
In accordance with the UCITS Regulations this statement presents the aggregate purchases and aggregate sales of a
security exceeding 1.00% of the total value of purchases or sales for the period or at least the top 20 purchases and sales.
Major Purchases Shares Cost USD
Tencent Holdings Ltd ........................................................................................................ 127,500 8,019,271
Alibaba Group Holding Ltd ................................................................................................ 304,200 6,796,890
Meituan ............................................................................................................................ 83,400 2,610,925
China Construction Bank Corp ......................................................................................... 1,992,000 1,425,939
Kuaishou Technology ....................................................................................................... 107,400 1,390,872
Wuxi Biologics Cayman Inc .............................................................................................. 75,900 1,179,101
NIO Inc ADR .................................................................................................................... 27,683 1,134,636
Ping An Insurance Group Co of China Ltd ........................................................................ 126,000 1,034,556
Baidu Inc ADR .................................................................................................................. 5,922 972,300
Industrial & Commercial Bank of China Ltd ....................................................................... 1,679,000 951,384
Contemporary Amperex Technology Co Ltd ..................................................................... 9,200 922,559
JD.com Inc ....................................................................................................................... 12,000 911,433
Xiaomi Corp ..................................................................................................................... 282,200 888,932
Pinduoduo Inc ADR .......................................................................................................... 7,925 757,663
XPeng Inc ADR ................................................................................................................ 18,203 735,446
China Merchants Bank Co Ltd .......................................................................................... 80,500 665,841
Li Ning Co Ltd ................................................................................................................... 53,000 635,396
BYD Co Ltd ...................................................................................................................... 18,000 593,029
Bank of China Ltd ............................................................................................................. 1,625,000 576,858
NetEase Inc ...................................................................................................................... 5,568 533,671
Major Sales Shares Proceeds USD
Tencent Holdings Ltd ........................................................................................................ 28,600 1,762,288
Alibaba Group Holding Ltd ................................................................................................ 69,300 1,426,823
Meituan ............................................................................................................................ 18,900 637,513
NIO Inc ADR .................................................................................................................... 9,471 338,266
China Construction Bank Corp ......................................................................................... 447,000 316,383
Wuxi Biologics Cayman Inc .............................................................................................. 15,900 246,103
Ping An Insurance Group Co of China Ltd ........................................................................ 30,500 230,484
Baidu Inc ADR .................................................................................................................. 1,310 213,791
China Merchants Bank Co Ltd .......................................................................................... 25,000 207,415
Li Auto Inc ADR ................................................................................................................ 6,745 201,211
Industrial & Commercial Bank of China Ltd ....................................................................... 348,000 193,424
BYD Co Ltd ...................................................................................................................... 5,500 190,492
XPeng Inc ADR ................................................................................................................ 4,618 190,309
JD.com Inc ....................................................................................................................... 4,600 182,310
Pinduoduo Inc ADR .......................................................................................................... 1,587 159,767
Xiaomi Corp ..................................................................................................................... 57,400 159,534
ANTA Sports Products Ltd ................................................................................................ 8,640 152,501
Geely Automobile Holdings Ltd ......................................................................................... 45,000 150,607
Kweichow Moutai Co Ltd .................................................................................................. 500 134,776
Sanan Optoelectronics Co Ltd .......................................................................................... 23,800 132,487
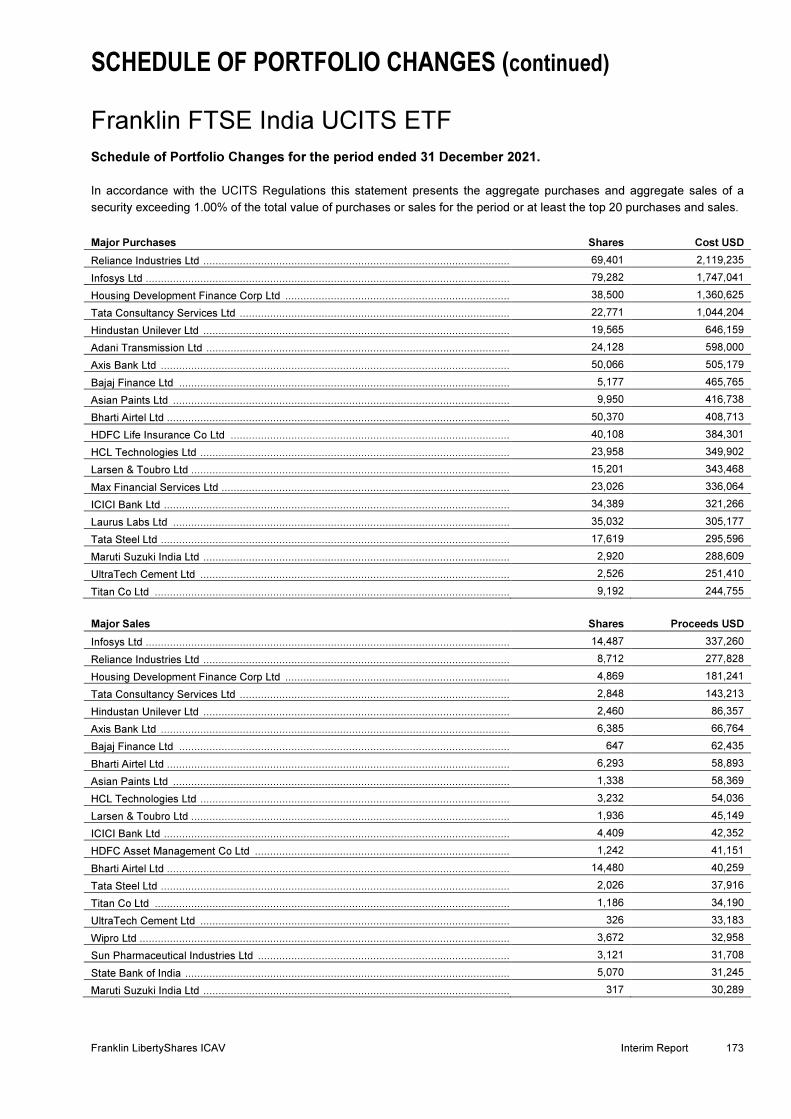
SCHEDULE OF PORTFOLIO CHANGES (continued) Franklin FTSE India UCITS ETF
Schedule of Portfolio Changes for the period ended 31 December 2021.
Franklin LibertyShares ICAV Interim Report 173
In accordance with the UCITS Regulations this statement presents the aggregate purchases and aggregate sales of a
security exceeding 1.00% of the total value of purchases or sales for the period or at least the top 20 purchases and sales.
Major Purchases Shares Cost USD
Reliance Industries Ltd ..................................................................................................... 69,401 2,119,235
Infosys Ltd ........................................................................................................................ 79,282 1,747,041
Housing Development Finance Corp Ltd .......................................................................... 38,500 1,360,625
Tata Consultancy Services Ltd ......................................................................................... 22,771 1,044,204
Hindustan Unilever Ltd ..................................................................................................... 19,565 646,159
Adani Transmission Ltd .................................................................................................... 24,128 598,000
Axis Bank Ltd ................................................................................................................... 50,066 505,179
Bajaj Finance Ltd ............................................................................................................. 5,177 465,765
Asian Paints Ltd ............................................................................................................... 9,950 416,738
Bharti Airtel Ltd ................................................................................................................. 50,370 408,713
HDFC Life Insurance Co Ltd ............................................................................................ 40,108 384,301
HCL Technologies Ltd ...................................................................................................... 23,958 349,902
Larsen & Toubro Ltd ......................................................................................................... 15,201 343,468
Max Financial Services Ltd ............................................................................................... 23,026 336,064
ICICI Bank Ltd .................................................................................................................. 34,389 321,266
Laurus Labs Ltd ............................................................................................................... 35,032 305,177
Tata Steel Ltd ................................................................................................................... 17,619 295,596
Maruti Suzuki India Ltd ..................................................................................................... 2,920 288,609
UltraTech Cement Ltd ...................................................................................................... 2,526 251,410
Titan Co Ltd ..................................................................................................................... 9,192 244,755
Major Sales Shares Proceeds USD
Infosys Ltd ........................................................................................................................ 14,487 337,260
Reliance Industries Ltd ..................................................................................................... 8,712 277,828
Housing Development Finance Corp Ltd .......................................................................... 4,869 181,241
Tata Consultancy Services Ltd ......................................................................................... 2,848 143,213
Hindustan Unilever Ltd ..................................................................................................... 2,460 86,357
Axis Bank Ltd ................................................................................................................... 6,385 66,764
Bajaj Finance Ltd ............................................................................................................. 647 62,435
Bharti Airtel Ltd ................................................................................................................. 6,293 58,893
Asian Paints Ltd ............................................................................................................... 1,338 58,369
HCL Technologies Ltd ...................................................................................................... 3,232 54,036
Larsen & Toubro Ltd ......................................................................................................... 1,936 45,149
ICICI Bank Ltd .................................................................................................................. 4,409 42,352
HDFC Asset Management Co Ltd .................................................................................... 1,242 41,151
Bharti Airtel Ltd ................................................................................................................. 14,480 40,259
Tata Steel Ltd ................................................................................................................... 2,026 37,916
Titan Co Ltd ..................................................................................................................... 1,186 34,190
UltraTech Cement Ltd ...................................................................................................... 326 33,183
Wipro Ltd .......................................................................................................................... 3,672 32,958
Sun Pharmaceutical Industries Ltd ................................................................................... 3,121 31,708
State Bank of India ........................................................................................................... 5,070 31,245
Maruti Suzuki India Ltd ..................................................................................................... 317 30,289
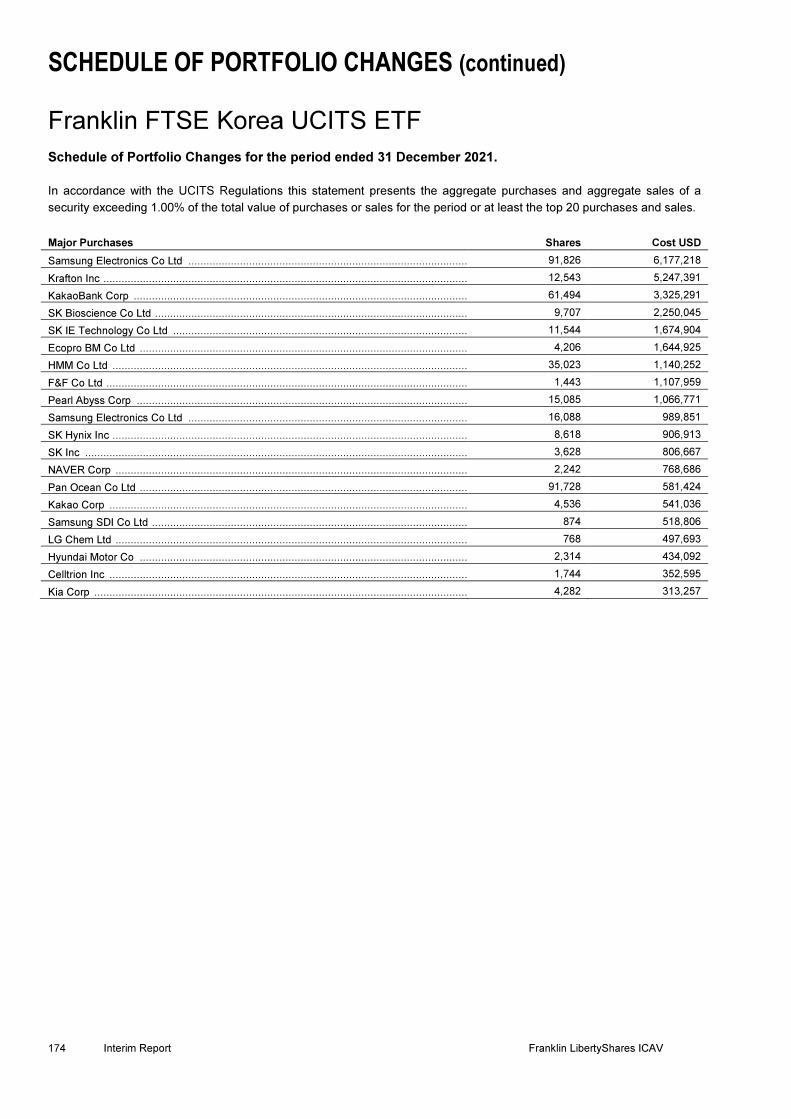
SCHEDULE OF PORTFOLIO CHANGES (continued)
Franklin FTSE Korea UCITS ETF
Schedule of Portfolio Changes for the period ended 31 December 2021.
174 Interim Report Franklin LibertyShares ICAV
In accordance with the UCITS Regulations this statement presents the aggregate purchases and aggregate sales of a
security exceeding 1.00% of the total value of purchases or sales for the period or at least the top 20 purchases and sales.
Major Purchases Shares Cost USD
Samsung Electronics Co Ltd ............................................................................................ 91,826 6,177,218
Krafton Inc ........................................................................................................................ 12,543 5,247,391
KakaoBank Corp .............................................................................................................. 61,494 3,325,291
SK Bioscience Co Ltd ....................................................................................................... 9,707 2,250,045
SK IE Technology Co Ltd ................................................................................................. 11,544 1,674,904
Ecopro BM Co Ltd ............................................................................................................ 4,206 1,644,925
HMM Co Ltd ..................................................................................................................... 35,023 1,140,252
F&F Co Ltd ....................................................................................................................... 1,443 1,107,959
Pearl Abyss Corp ............................................................................................................. 15,085 1,066,771
Samsung Electronics Co Ltd ............................................................................................ 16,088 989,851
SK Hynix Inc ..................................................................................................................... 8,618 906,913
SK Inc .............................................................................................................................. 3,628 806,667
NAVER Corp .................................................................................................................... 2,242 768,686
Pan Ocean Co Ltd ............................................................................................................ 91,728 581,424
Kakao Corp ...................................................................................................................... 4,536 541,036
Samsung SDI Co Ltd ........................................................................................................ 874 518,806
LG Chem Ltd .................................................................................................................... 768 497,693
Hyundai Motor Co ............................................................................................................ 2,314 434,092
Celltrion Inc ...................................................................................................................... 1,744 352,595
Kia Corp ........................................................................................................................... 4,282 313,257
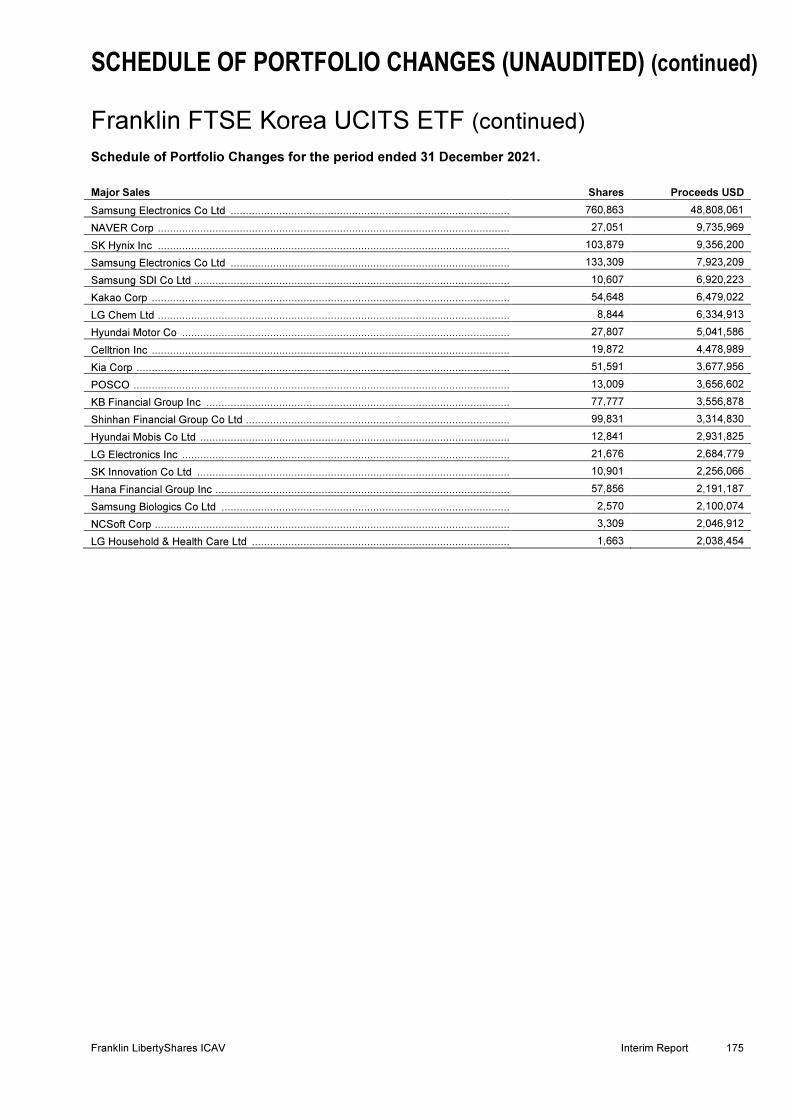
SCHEDULE OF PORTFOLIO CHANGES (UNAUDITED) (continued) Franklin FTSE Korea UCITS ETF (continued)
Schedule of Portfolio Changes for the period ended 31 December 2021.
Franklin LibertyShares ICAV Interim Report 175
Major Sales Shares Proceeds USD
Samsung Electronics Co Ltd ............................................................................................ 760,863 48,808,061
NAVER Corp .................................................................................................................... 27,051 9,735,969
SK Hynix Inc .................................................................................................................... 103,879 9,356,200
Samsung Electronics Co Ltd ............................................................................................ 133,309 7,923,209
Samsung SDI Co Ltd ........................................................................................................ 10,607 6,920,223
Kakao Corp ...................................................................................................................... 54,648 6,479,022
LG Chem Ltd .................................................................................................................... 8,844 6,334,913
Hyundai Motor Co ............................................................................................................ 27,807 5,041,586
Celltrion Inc ...................................................................................................................... 19,872 4,478,989
Kia Corp ........................................................................................................................... 51,591 3,677,956
POSCO ............................................................................................................................ 13,009 3,656,602
KB Financial Group Inc .................................................................................................... 77,777 3,556,878
Shinhan Financial Group Co Ltd ....................................................................................... 99,831 3,314,830
Hyundai Mobis Co Ltd ...................................................................................................... 12,841 2,931,825
LG Electronics Inc ............................................................................................................ 21,676 2,684,779
SK Innovation Co Ltd ....................................................................................................... 10,901 2,256,066
Hana Financial Group Inc ................................................................................................. 57,856 2,191,187
Samsung Biologics Co Ltd ............................................................................................... 2,570 2,100,074
NCSoft Corp ..................................................................................................................... 3,309 2,046,912
LG Household & Health Care Ltd ..................................................................................... 1,663 2,038,454

SCHEDULE OF PORTFOLIO CHANGES (continued) Franklin Liberty Euro Green Bond UCITS ETF
Schedule of Portfolio Changes for the period ended 31 December 2021.
176 Interim Report Franklin LibertyShares ICAV
In accordance with the UCITS Regulations this statement presents the aggregate purchases and aggregate sales of a
security exceeding 1.00% of the total value of purchases or sales for the period or at least the top 20 purchases and sales.
Major Purchases Shares Cost EUR
Spain Government Bond 1.00% 30/07/2042 ..................................................................... 3,000,000 2,987,892
Acciona Energia Financiacion Filiales SA 0.38% 07/10/2027 ............................................ 2,000,000 1,993,155
Bundesobligation 0.00% 10/10/2025 ................................................................................ 1,800,000 1,858,144
Arion Banki HF 0.38% 14/07/2025 .................................................................................... 1,500,000 1,497,863
Mondelez International Holdings Netherlands BV 0.25% 09/09/2029 ................................ 1,500,000 1,493,490
Netherlands Government Bond 0.50% 15/01/2040 ........................................................... 1,300,000 1,420,818
Iberdrola Finanzas SA 1.58% Perp. .................................................................................. 1,300,000 1,298,600
Stedin Holding NV 0.00% 16/11/2026 ............................................................................... 1,300,000 1,295,658
Ireland Government Bond 1.35% 18/03/2031 ................................................................... 1,100,000 1,250,782
Segro Capital Sarl 0.50% 22/09/2031 ............................................................................... 1,200,000 1,189,596
Kreditanstalt fuer Wiederaufbau 0.00% 15/06/2029 .......................................................... 1,100,000 1,127,005
FLUVIUS System Operator CVBA 0.25% 02/12/2030 ...................................................... 1,000,000 1,008,106
Valeo 1.00% 03/08/2028 .................................................................................................. 1,000,000 1,000,357
United Kingdom Gilt 0.88% 31/07/2033 ............................................................................ 700,000 815,717
Kingdom of Belgium Government Bond 1.25% 22/04/2033 .............................................. 700,000 802,485
Power Finance Corp Ltd 1.84% 21/09/2028 ..................................................................... 700,000 700,000
Vesteda Finance BV 1.50% 24/05/2027 ........................................................................... 600,000 645,498
European Union 0.40% 04/02/2037 .................................................................................. 600,000 595,314
Eurogrid GmbH 1.11% 15/05/2032 ................................................................................... 500,000 534,331
AXA SA 1.38% 07/10/2041 ............................................................................................... 500,000 510,172
ACEA SpA 0.00% 28/09/2025 .......................................................................................... 500,000 501,729
Societe Du Grand Paris EPIC 0.00% 25/11/2030 ............................................................. 500,000 495,936
ING Groep NV 1.13% 07/12/2028 .................................................................................... 400,000 463,138
Hungary Government International Bond 1.75% 05/06/2035 ............................................ 400,000 428,012
Aeroporti di Roma SpA 1.63% 02/02/2029 ....................................................................... 400,000 425,056
Bundesrepublik Deutschland Bundesanleihe 0.00% 15/08/2030 ...................................... 400,000 416,492
Muenchener Rueckversicherungs-Gesellschaft AG in Muenchen 1.25% 26/05/2041 ....... 400,000 416,428
Orsted AS 1.75% 09/12/3019 ........................................................................................... 400,000 412,000
Deutsche Bahn Finance GMBH 1.60% Perp. .................................................................... 400,000 411,750
Telia Co AB 1.38% 11/05/2081 ......................................................................................... 400,000 409,500
Major Sales* Shares Proceeds EUR
Netherlands Government Bond 0.50% 15/01/2040 ........................................................... 3,500,000 3,696,345
Credit Agricole SA 0.38% 21/10/2025 ............................................................................... 1,400,000 1,421,392
Iberdrola International BV 1.45% 12/11/2021 .................................................................... 1,300,000 1,300,650
Naturgy Finance BV 0.88% 15/05/2025 ............................................................................ 1,000,000 1,034,160
Deutsche Wohnen SE 0.50% 07/04/2031 ......................................................................... 1,000,000 1,005,960
Kingdom of Belgium Government Bond 1.25% 22/04/2033 .............................................. 600,000 667,656
Orsted AS 2.25% 24/11/3017 ........................................................................................... 300,000 315,000
ING Groep NV 0.88% 09/06/2032 .................................................................................... 200,000 200,732
* There were no other sales on this Sub-Fund during the financial period.

SCHEDULE OF PORTFOLIO CHANGES (continued)
Franklin Liberty Euro Short Maturity UCITS ETF
Schedule of Portfolio Changes for the period ended 31 December 2021.
Franklin LibertyShares ICAV Interim Report 177
In accordance with the UCITS Regulations this statement presents the aggregate purchases and aggregate sales of a
security exceeding 1.00% of the total value of purchases or sales for the period or at least the top 20 purchases and sales.
Major Purchases Shares Cost EUR
Deutsche Bundesrepublik Inflation Linked Bond 0.10% 15/04/2023 ................................. 13,357,217 13,819,909
Italy Buoni Ordinari del Tesoro BOT 0.00% 14/11/2022 .................................................... 7,000,000 7,033,920
Kingdom of Belgium Treasury Bill 0.00% 08/09/2022 ....................................................... 6,000,000 6,034,380
Italy Buoni Ordinari del Tesoro BOT 0.00% 14/01/2022 .................................................... 6,000,000 6,014,257
French Republic Government Bond OAT 0.00% 24/11/2021 ............................................ 6,000,000 6,005,991
France Treasury Bill BTF 0.00% 10/08/2022 .................................................................... 5,000,000 5,029,295
Spain Letras del Tesoro 0.00% 07/10/2022 ...................................................................... 5,000,000 5,028,213
French Republic Government Bond OAT 0.25% 25/07/2024 ............................................ 4,366,865 4,730,420
Netherlands Government Bond 0.00% 29/11/2021 ........................................................... 3,500,000 3,506,203
Italy Buoni Ordinari del Tesoro BOT 0.00% 31/01/2022 .................................................... 2,000,000 2,003,403
Romanian Government International Bond 2.88% 28/10/2024 ......................................... 1,800,000 1,953,645
Coca-Cola Europacific Partners Plc 0.75% 24/02/2022 .................................................... 1,700,000 1,705,017
Bacardi Ltd 2.75% 03/07/2023 ......................................................................................... 1,623,000 1,698,313
Allianz SE 5.63% 17/10/2042 ........................................................................................... 1,600,000 1,681,581
CK Hutchison Group Telecom Finance SA 0.38% 17/10/2023 ......................................... 1,600,000 1,613,093
Credit Suisse Group Funding Guernsey Ltd 1.25% 14/04/2022 ........................................ 1,600,000 1,610,108
Nykredit Realkredit AS 2.75% 17/11/2027 ........................................................................ 1,500,000 1,544,483
CaixaBank SA 3.50% 15/02/2027 .................................................................................... 1,500,000 1,520,940
Thermo Fisher Scientific Finance I BV 0.00% 18/11/2023 ................................................ 1,500,000 1,505,409
Indonesia Government International Bond 2.63% 14/06/2023 .......................................... 1,400,000 1,463,978
Bankinter SA 2.50% 06/04/2027 ....................................................................................... 1,400,000 1,417,888
Major Sales* Shares Proceeds EUR
SBB Treasury OYJ 0.09% 01/02/2023 ............................................................................. 500,000 500,955
Samhallsbyggnadsbolaget i Norden AB 4.63% 29/06/2021 .............................................. 300,000 323,553
ADLER Real Estate AG 1.50% 17/04/2022 ...................................................................... 100,000 99,887
* There were no other sales on this Sub-Fund during the financial period.
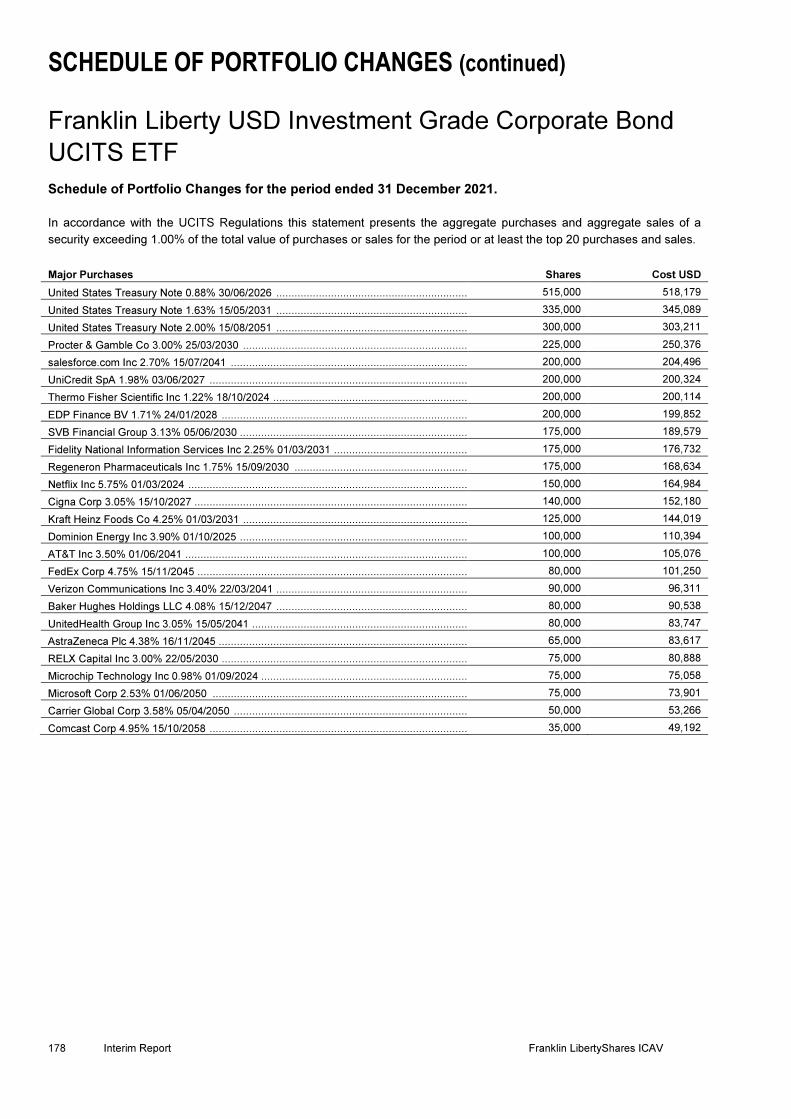
SCHEDULE OF PORTFOLIO CHANGES (continued)
Franklin Liberty USD Investment Grade Corporate Bond
UCITS ETF
Schedule of Portfolio Changes for the period ended 31 December 2021.
178 Interim Report Franklin LibertyShares ICAV
In accordance with the UCITS Regulations this statement presents the aggregate purchases and aggregate sales of a
security exceeding 1.00% of the total value of purchases or sales for the period or at least the top 20 purchases and sales.
Major Purchases Shares Cost USD
United States Treasury Note 0.88% 30/06/2026 ............................................................... 515,000 518,179
United States Treasury Note 1.63% 15/05/2031 ............................................................... 335,000 345,089
United States Treasury Note 2.00% 15/08/2051 ............................................................... 300,000 303,211
Procter & Gamble Co 3.00% 25/03/2030 .......................................................................... 225,000 250,376
salesforce.com Inc 2.70% 15/07/2041 .............................................................................. 200,000 204,496
UniCredit SpA 1.98% 03/06/2027 ..................................................................................... 200,000 200,324
Thermo Fisher Scientific Inc 1.22% 18/10/2024 ................................................................ 200,000 200,114
EDP Finance BV 1.71% 24/01/2028 ................................................................................. 200,000 199,852
SVB Financial Group 3.13% 05/06/2030 ........................................................................... 175,000 189,579
Fidelity National Information Services Inc 2.25% 01/03/2031 ............................................ 175,000 176,732
Regeneron Pharmaceuticals Inc 1.75% 15/09/2030 ......................................................... 175,000 168,634
Netflix Inc 5.75% 01/03/2024 ............................................................................................ 150,000 164,984
Cigna Corp 3.05% 15/10/2027 .......................................................................................... 140,000 152,180
Kraft Heinz Foods Co 4.25% 01/03/2031 .......................................................................... 125,000 144,019
Dominion Energy Inc 3.90% 01/10/2025 ........................................................................... 100,000 110,394
AT&T Inc 3.50% 01/06/2041 ............................................................................................. 100,000 105,076
FedEx Corp 4.75% 15/11/2045 ......................................................................................... 80,000 101,250
Verizon Communications Inc 3.40% 22/03/2041 ............................................................... 90,000 96,311
Baker Hughes Holdings LLC 4.08% 15/12/2047 ............................................................... 80,000 90,538
UnitedHealth Group Inc 3.05% 15/05/2041 ....................................................................... 80,000 83,747
AstraZeneca Plc 4.38% 16/11/2045 .................................................................................. 65,000 83,617
RELX Capital Inc 3.00% 22/05/2030 ................................................................................. 75,000 80,888
Microchip Technology Inc 0.98% 01/09/2024 .................................................................... 75,000 75,058
Microsoft Corp 2.53% 01/06/2050 .................................................................................... 75,000 73,901
Carrier Global Corp 3.58% 05/04/2050 ............................................................................. 50,000 53,266
Comcast Corp 4.95% 15/10/2058 ..................................................................................... 35,000 49,192
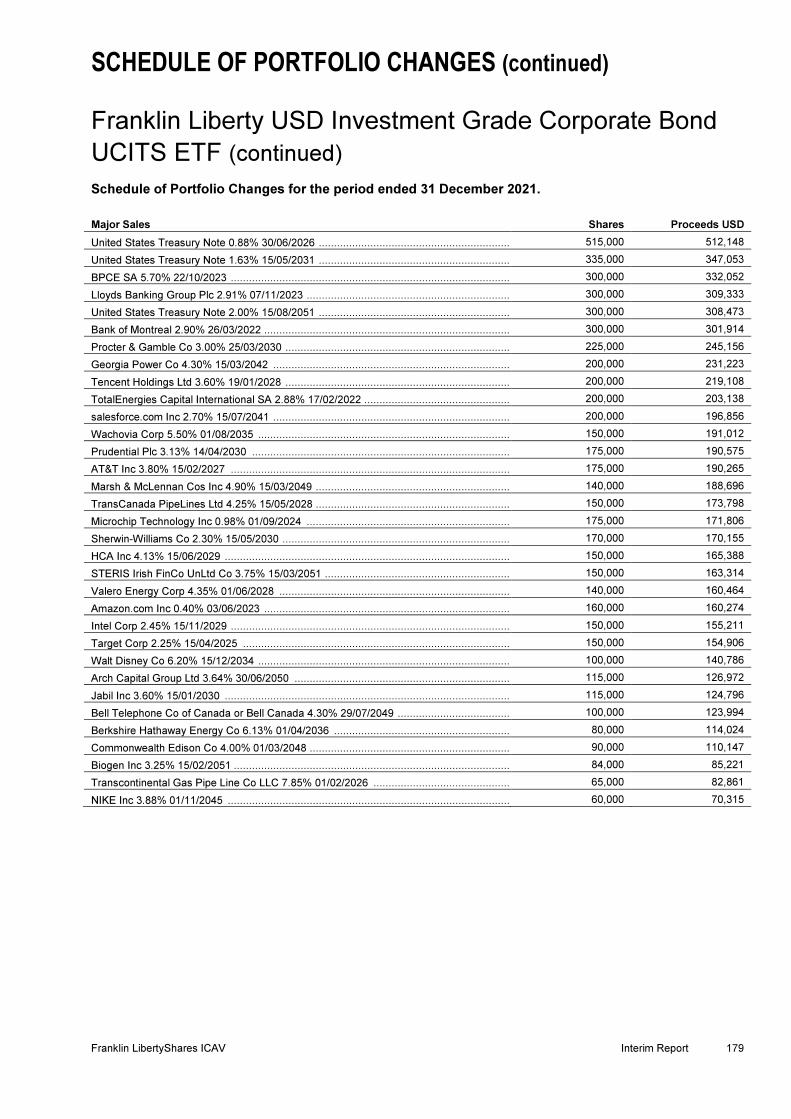
SCHEDULE OF PORTFOLIO CHANGES (continued)
Franklin Liberty USD Investment Grade Corporate Bond
UCITS ETF (continued)
Schedule of Portfolio Changes for the period ended 31 December 2021.
Franklin LibertyShares ICAV Interim Report 179
Major Sales Shares Proceeds USD
United States Treasury Note 0.88% 30/06/2026 ............................................................... 515,000 512,148
United States Treasury Note 1.63% 15/05/2031 ............................................................... 335,000 347,053
BPCE SA 5.70% 22/10/2023 ............................................................................................ 300,000 332,052
Lloyds Banking Group Plc 2.91% 07/11/2023 ................................................................... 300,000 309,333
United States Treasury Note 2.00% 15/08/2051 ............................................................... 300,000 308,473
Bank of Montreal 2.90% 26/03/2022 ................................................................................. 300,000 301,914
Procter & Gamble Co 3.00% 25/03/2030 .......................................................................... 225,000 245,156
Georgia Power Co 4.30% 15/03/2042 .............................................................................. 200,000 231,223
Tencent Holdings Ltd 3.60% 19/01/2028 .......................................................................... 200,000 219,108
TotalEnergies Capital International SA 2.88% 17/02/2022 ................................................ 200,000 203,138
salesforce.com Inc 2.70% 15/07/2041 .............................................................................. 200,000 196,856
Wachovia Corp 5.50% 01/08/2035 ................................................................................... 150,000 191,012
Prudential Plc 3.13% 14/04/2030 ..................................................................................... 175,000 190,575
AT&T Inc 3.80% 15/02/2027 ............................................................................................ 175,000 190,265
Marsh & McLennan Cos Inc 4.90% 15/03/2049 ................................................................ 140,000 188,696
TransCanada PipeLines Ltd 4.25% 15/05/2028 ................................................................ 150,000 173,798
Microchip Technology Inc 0.98% 01/09/2024 ................................................................... 175,000 171,806
Sherwin-Williams Co 2.30% 15/05/2030 ........................................................................... 170,000 170,155
HCA Inc 4.13% 15/06/2029 .............................................................................................. 150,000 165,388
STERIS Irish FinCo UnLtd Co 3.75% 15/03/2051 ............................................................. 150,000 163,314
Valero Energy Corp 4.35% 01/06/2028 ............................................................................ 140,000 160,464
Amazon.com Inc 0.40% 03/06/2023 ................................................................................. 160,000 160,274
Intel Corp 2.45% 15/11/2029 ............................................................................................ 150,000 155,211
Target Corp 2.25% 15/04/2025 ........................................................................................ 150,000 154,906
Walt Disney Co 6.20% 15/12/2034 ................................................................................... 100,000 140,786
Arch Capital Group Ltd 3.64% 30/06/2050 ....................................................................... 115,000 126,972
Jabil Inc 3.60% 15/01/2030 .............................................................................................. 115,000 124,796
Bell Telephone Co of Canada or Bell Canada 4.30% 29/07/2049 ..................................... 100,000 123,994
Berkshire Hathaway Energy Co 6.13% 01/04/2036 .......................................................... 80,000 114,024
Commonwealth Edison Co 4.00% 01/03/2048 .................................................................. 90,000 110,147
Biogen Inc 3.25% 15/02/2051 ........................................................................................... 84,000 85,221
Transcontinental Gas Pipe Line Co LLC 7.85% 01/02/2026 ............................................. 65,000 82,861
NIKE Inc 3.88% 01/11/2045 ............................................................................................. 60,000 70,315

SCHEDULE OF PORTFOLIO CHANGES (continued) Franklin LibertyQ AC Asia ex Japan UCITS ETF
Schedule of Portfolio Changes for the period ended 31 December 2021.
180 Interim Report Franklin LibertyShares ICAV
In accordance with the UCITS Regulations this statement presents the aggregate purchases and aggregate sales of a
security exceeding 1.00% of the total value of purchases or sales for the period or at least the top 20 purchases and sales.
Major Purchases Shares Cost USD
POSCO ............................................................................................................................ 202 44,396
Intouch Holdings PCL ....................................................................................................... 14,200 34,745
Fubon Financial Holding Co Ltd ........................................................................................ 13,000 34,212
Evergreen Marine Corp Taiwan Ltd .................................................................................. 7,000 31,353
Kweichow Moutai Co Ltd .................................................................................................. 100 31,082
Cathay Financial Holding Co Ltd ...................................................................................... 13,000 27,830
Nongfu Spring Co Ltd ....................................................................................................... 4,600 26,415
CSPC Pharmaceutical Group Ltd ..................................................................................... 24,000 24,912
Yuanta Financial Holding Co Ltd ...................................................................................... 28,000 23,874
Yang Ming Marine Transport Corp .................................................................................... 5,000 20,776
CLP Holdings Ltd ............................................................................................................. 2,100 20,636
SITC International Holdings Co Ltd ................................................................................... 5,000 20,072
China Petroleum & Chemical Corp ................................................................................... 44,000 19,275
COSCO SHIPPING Holdings Co Ltd ................................................................................ 11,000 18,851
Hongkong Land Holdings Ltd ............................................................................................ 3,000 16,208
China Construction Bank Corp ......................................................................................... 24,000 15,801
PICC Property & Casualty Co Ltd ..................................................................................... 18,000 15,423
Smoore International Holdings Ltd .................................................................................... 2,500 14,421
Vedanta Ltd ...................................................................................................................... 3,188 14,409
eMemory Technology Inc ................................................................................................. 180 14,247
PetroChina Co Ltd ............................................................................................................ 32,000 13,960
CITIC Ltd .......................................................................................................................... 15,000 13,566
United Microelectronics Corp ............................................................................................ 6,000 13,364
Bharat Petroleum Corp Ltd ............................................................................................... 2,534 12,502
Samsung Electronics Co Ltd ............................................................................................ 202 12,334
Industrial & Commercial Bank of China Ltd ....................................................................... 22,000 11,727
Mindtree Ltd ..................................................................................................................... 195 11,271
China Development Financial Holding Corp ..................................................................... 18,000 10,620
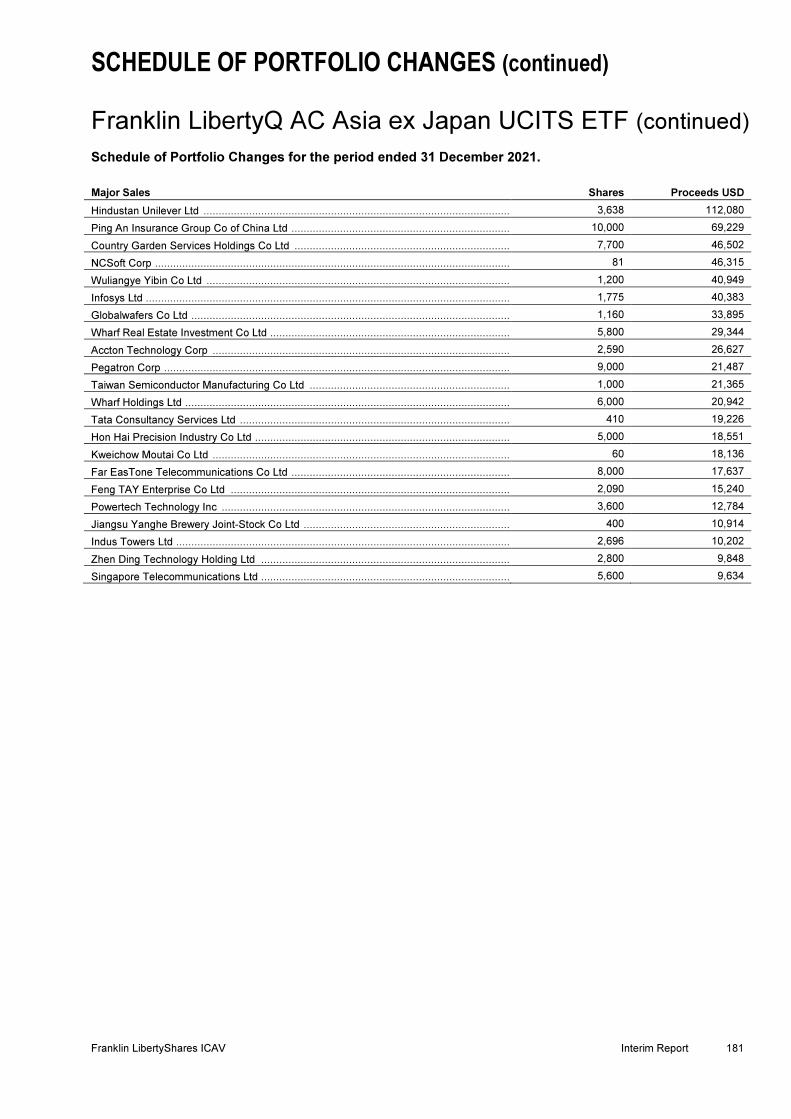
SCHEDULE OF PORTFOLIO CHANGES (continued)
Franklin LibertyQ AC Asia ex Japan UCITS ETF (continued)
Schedule of Portfolio Changes for the period ended 31 December 2021.
Franklin LibertyShares ICAV Interim Report 181
Major Sales Shares Proceeds USD
Hindustan Unilever Ltd ..................................................................................................... 3,638 112,080
Ping An Insurance Group Co of China Ltd ........................................................................ 10,000 69,229
Country Garden Services Holdings Co Ltd ....................................................................... 7,700 46,502
NCSoft Corp ..................................................................................................................... 81 46,315
Wuliangye Yibin Co Ltd .................................................................................................... 1,200 40,949
Infosys Ltd ........................................................................................................................ 1,775 40,383
Globalwafers Co Ltd ......................................................................................................... 1,160 33,895
Wharf Real Estate Investment Co Ltd ............................................................................... 5,800 29,344
Accton Technology Corp .................................................................................................. 2,590 26,627
Pegatron Corp .................................................................................................................. 9,000 21,487
Taiwan Semiconductor Manufacturing Co Ltd .................................................................. 1,000 21,365
Wharf Holdings Ltd ........................................................................................................... 6,000 20,942
Tata Consultancy Services Ltd ......................................................................................... 410 19,226
Hon Hai Precision Industry Co Ltd .................................................................................... 5,000 18,551
Kweichow Moutai Co Ltd .................................................................................................. 60 18,136
Far EasTone Telecommunications Co Ltd ........................................................................ 8,000 17,637
Feng TAY Enterprise Co Ltd ............................................................................................ 2,090 15,240
Powertech Technology Inc ............................................................................................... 3,600 12,784
Jiangsu Yanghe Brewery Joint-Stock Co Ltd .................................................................... 400 10,914
Indus Towers Ltd .............................................................................................................. 2,696 10,202
Zhen Ding Technology Holding Ltd .................................................................................. 2,800 9,848
Singapore Telecommunications Ltd .................................................................................. 5,600 9,634

SCHEDULE OF PORTFOLIO CHANGES (continued)
Franklin LibertyQ Emerging Markets UCITS ETF
Schedule of Portfolio Changes for the period ended 31 December 2021.
182 Interim Report Franklin LibertyShares ICAV
In accordance with the UCITS Regulations this statement presents the aggregate purchases and aggregate sales of a
security exceeding 1.00% of the total value of purchases or sales for the period or at least the top 20 purchases and sales.
Major Purchases Shares Cost USD
Cathay Financial Holding Co Ltd ...................................................................................... 119,000 256,844
POSCO ............................................................................................................................ 1,134 249,232
Banco Bradesco SA ......................................................................................................... 70,000 246,880
Petroleo Brasileiro SA ...................................................................................................... 46,200 240,592
Intouch Holdings PCL ....................................................................................................... 87,500 213,337
Vale SA ADR .................................................................................................................... 16,800 211,118
Evergreen Marine Corp Taiwan Ltd .................................................................................. 42,000 188,120
Petroleo Brasileiro SA ...................................................................................................... 35,000 186,865
China Life Insurance Co Ltd ............................................................................................. 112,000 184,740
B3 SA - Brasil Bolsa Balcao ............................................................................................. 89,600 176,335
CSPC Pharmaceutical Group Ltd ..................................................................................... 140,000 145,317
Yuanta Financial Holding Co Ltd ...................................................................................... 154,000 131,306
Yang Ming Marine Transport Corp .................................................................................... 28,000 116,347
TCS Group Holding Plc GDR ............................................................................................ 1,057 102,659
Impala Platinum Holdings Ltd ........................................................................................... 7,665 98,159
COSCO SHIPPING Holdings Co Ltd ................................................................................ 56,000 95,967
China Petroleum & Chemical Corp ................................................................................... 210,000 92,834
Powszechny Zaklad Ubezpieczen SA ............................................................................... 10,584 91,991
Innolux Corp ..................................................................................................................... 140,000 87,890
eMemory Technology Inc ................................................................................................. 1,100 85,264
Vedanta Ltd ...................................................................................................................... 18,102 81,816
AU Optronics Corp ........................................................................................................... 112,000 80,990
Banco do Brasil SA ........................................................................................................... 14,000 78,962
Gerdau SA ....................................................................................................................... 16,800 76,779
CITIC Ltd .......................................................................................................................... 84,000 75,968
Sunac China Holdings Ltd ................................................................................................ 42,000 75,752

SCHEDULE OF PORTFOLIO CHANGES (continued) Franklin LibertyQ Emerging Markets UCITS ETF (continued)
Schedule of Portfolio Changes for the period ended 31 December 2021.
Franklin LibertyShares ICAV Interim Report 183
Major Sales Shares Proceeds USD
NetEase Inc ..................................................................................................................... 3,780 407,177
Hindustan Unilever Ltd ..................................................................................................... 12,327 379,773
NCSoft Corp ..................................................................................................................... 497 284,180
Country Garden Services Holdings Co Ltd ....................................................................... 40,600 245,190
Wuliangye Yibin Co Ltd .................................................................................................... 7,000 238,870
Globalwafers Co Ltd ......................................................................................................... 7,000 204,505
United Microelectronics Corp ............................................................................................ 82,000 187,242
Accton Technology Corp .................................................................................................. 16,000 165,468
Al Rajhi Bank ................................................................................................................... 4,676 164,519
Gazprom PJSC ................................................................................................................ 34,272 155,755
Wharf Holdings Ltd ........................................................................................................... 42,000 146,592
Infosys Ltd ........................................................................................................................ 5,782 131,547
Enel Americas SA ............................................................................................................ 851,536 108,945
Far EasTone Telecommunications Co Ltd ........................................................................ 49,000 108,024
Feng TAY Enterprise Co Ltd ............................................................................................ 14,000 102,127
Luzhou Laojiao Co Ltd ..................................................................................................... 2,800 100,830
Pegatron Corp .................................................................................................................. 42,000 100,270
Emirates Telecommunications Group Co PJSC ............................................................... 11,116 96,632
Shanxi Xinghuacun Fen Wine Factory Co Ltd .................................................................. 1,960 95,116
HCL Technologies Ltd ...................................................................................................... 5,936 89,840
Wanhua Chemical Group Co Ltd ...................................................................................... 5,600 83,933
Powertech Technology Inc ............................................................................................... 21,000 74,601
Telkom Indonesia Persero Tbk PT ................................................................................... 266,700 74,168
LUKOIL PJSC .................................................................................................................. 805 71,315

SCHEDULE OF PORTFOLIO CHANGES (continued)
Franklin LibertyQ European Dividend UCITS ETF
Schedule of Portfolio Changes for the period ended 31 December 2021.
184 Interim Report Franklin LibertyShares ICAV
In accordance with the UCITS Regulations this statement presents the aggregate purchases and aggregate sales of a
security exceeding 1.00% of the total value of purchases or sales for the period or at least the top 20 purchases and sales.
Major Purchases Shares Cost EUR
BHP Group Plc ................................................................................................................. 32,804 803,361
Rio Tinto Plc ..................................................................................................................... 6,708 384,476
Hannover Rueck SE ......................................................................................................... 2,435 382,146
Orion OYJ ........................................................................................................................ 9,326 338,215
Kesko OYJ ....................................................................................................................... 10,910 317,699
Gjensidige Forsikring ASA ................................................................................................ 15,576 312,591
BE Semiconductor Industries NV ...................................................................................... 3,490 284,652
Endesa SA ....................................................................................................................... 13,424 271,519
Tryg A/S ........................................................................................................................... 11,982 251,795
Telenor ASA ..................................................................................................................... 17,286 242,943
Koninklijke KPN NV .......................................................................................................... 86,945 237,509
Iberdrola SA ..................................................................................................................... 23,341 236,671
Admiral Group Plc ............................................................................................................ 5,699 231,062
Axfood AB ........................................................................................................................ 9,287 223,239
Allianz SE ......................................................................................................................... 1,097 215,045
Elisa OYJ ......................................................................................................................... 3,971 214,304
Tele2 AB .......................................................................................................................... 16,511 208,270
Zurich Insurance Group AG .............................................................................................. 561 207,520
GlaxoSmithKline Plc ......................................................................................................... 11,990 205,284
BAE Systems Plc ............................................................................................................. 31,424 205,212
UPM-Kymmene OYJ ........................................................................................................ 6,124 204,310
Red Electrica Corp SA ...................................................................................................... 11,667 202,640
Swisscom AG ................................................................................................................... 408 199,378
Snam SpA ........................................................................................................................ 39,852 199,185
Assicurazioni Generali SpA .............................................................................................. 11,029 196,365
Imperial Brands Plc .......................................................................................................... 10,544 193,423
TotalEnergies SE ............................................................................................................. 4,832 189,420
IG Group Holdings Plc ...................................................................................................... 19,349 186,207
Sanofi ............................................................................................................................... 2,211 183,491
Evraz Plc .......................................................................................................................... 25,452 178,566
Games Workshop Group Plc ............................................................................................ 1,262 176,235
Bankinter SA .................................................................................................................... 37,574 173,583
Mowi ASA ......................................................................................................................... 7,474 172,168
AstraZeneca Plc ............................................................................................................... 1,726 165,046
Nokian Renkaat OYJ ........................................................................................................ 4,741 150,652
Azimut Holding SpA .......................................................................................................... 5,529 132,018
Telia Co AB ...................................................................................................................... 35,278 127,644
Tate & Lyle Plc ................................................................................................................. 14,649 118,491
Oesterreichische Post AG ................................................................................................ 2,983 109,338
Gaztransport Et Technigaz SA ......................................................................................... 1,568 107,779
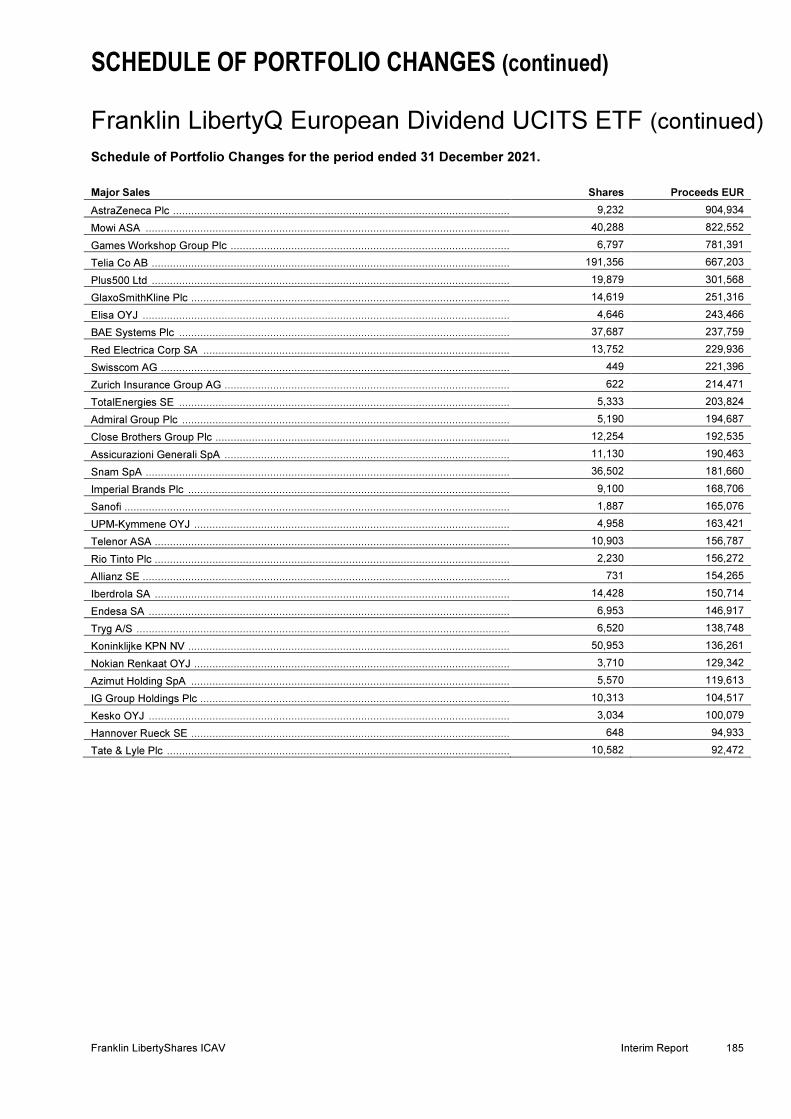
SCHEDULE OF PORTFOLIO CHANGES (continued) Franklin LibertyQ European Dividend UCITS ETF (continued)
Schedule of Portfolio Changes for the period ended 31 December 2021.
Franklin LibertyShares ICAV Interim Report 185
Major Sales Shares Proceeds EUR
AstraZeneca Plc ............................................................................................................... 9,232 904,934
Mowi ASA ........................................................................................................................ 40,288 822,552
Games Workshop Group Plc ............................................................................................ 6,797 781,391
Telia Co AB ...................................................................................................................... 191,356 667,203
Plus500 Ltd ...................................................................................................................... 19,879 301,568
GlaxoSmithKline Plc ......................................................................................................... 14,619 251,316
Elisa OYJ ......................................................................................................................... 4,646 243,466
BAE Systems Plc ............................................................................................................. 37,687 237,759
Red Electrica Corp SA ..................................................................................................... 13,752 229,936
Swisscom AG ................................................................................................................... 449 221,396
Zurich Insurance Group AG .............................................................................................. 622 214,471
TotalEnergies SE ............................................................................................................. 5,333 203,824
Admiral Group Plc ............................................................................................................ 5,190 194,687
Close Brothers Group Plc ................................................................................................. 12,254 192,535
Assicurazioni Generali SpA .............................................................................................. 11,130 190,463
Snam SpA ........................................................................................................................ 36,502 181,660
Imperial Brands Plc .......................................................................................................... 9,100 168,706
Sanofi ............................................................................................................................... 1,887 165,076
UPM-Kymmene OYJ ........................................................................................................ 4,958 163,421
Telenor ASA ..................................................................................................................... 10,903 156,787
Rio Tinto Plc ..................................................................................................................... 2,230 156,272
Allianz SE ......................................................................................................................... 731 154,265
Iberdrola SA ..................................................................................................................... 14,428 150,714
Endesa SA ....................................................................................................................... 6,953 146,917
Tryg A/S ........................................................................................................................... 6,520 138,748
Koninklijke KPN NV .......................................................................................................... 50,953 136,261
Nokian Renkaat OYJ ........................................................................................................ 3,710 129,342
Azimut Holding SpA ......................................................................................................... 5,570 119,613
IG Group Holdings Plc ...................................................................................................... 10,313 104,517
Kesko OYJ ....................................................................................................................... 3,034 100,079
Hannover Rueck SE ......................................................................................................... 648 94,933
Tate & Lyle Plc ................................................................................................................. 10,582 92,472
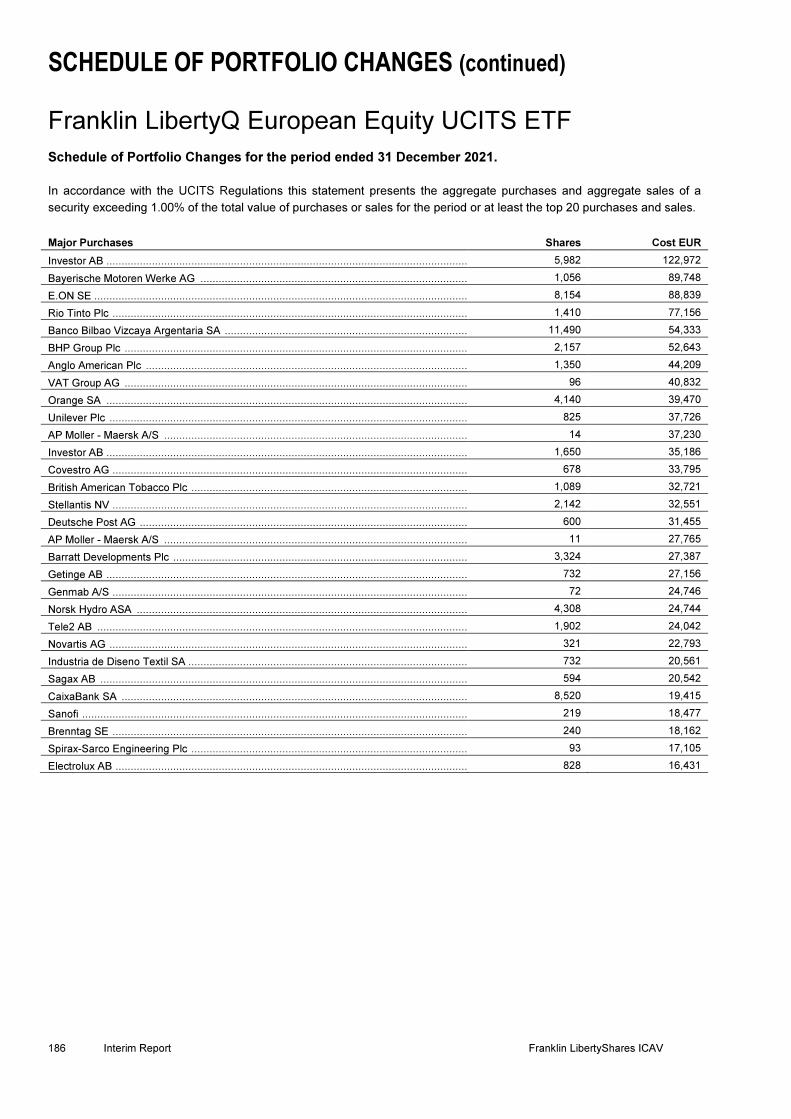
SCHEDULE OF PORTFOLIO CHANGES (continued)
Franklin LibertyQ European Equity UCITS ETF
Schedule of Portfolio Changes for the period ended 31 December 2021.
186 Interim Report Franklin LibertyShares ICAV
In accordance with the UCITS Regulations this statement presents the aggregate purchases and aggregate sales of a
security exceeding 1.00% of the total value of purchases or sales for the period or at least the top 20 purchases and sales.
Major Purchases Shares Cost EUR
Investor AB ....................................................................................................................... 5,982 122,972
Bayerische Motoren Werke AG ........................................................................................ 1,056 89,748
E.ON SE ........................................................................................................................... 8,154 88,839
Rio Tinto Plc ..................................................................................................................... 1,410 77,156
Banco Bilbao Vizcaya Argentaria SA ................................................................................ 11,490 54,333
BHP Group Plc ................................................................................................................. 2,157 52,643
Anglo American Plc .......................................................................................................... 1,350 44,209
VAT Group AG ................................................................................................................. 96 40,832
Orange SA ....................................................................................................................... 4,140 39,470
Unilever Plc ...................................................................................................................... 825 37,726
AP Moller - Maersk A/S .................................................................................................... 14 37,230
Investor AB ....................................................................................................................... 1,650 35,186
Covestro AG ..................................................................................................................... 678 33,795
British American Tobacco Plc ........................................................................................... 1,089 32,721
Stellantis NV ..................................................................................................................... 2,142 32,551
Deutsche Post AG ............................................................................................................ 600 31,455
AP Moller - Maersk A/S .................................................................................................... 11 27,765
Barratt Developments Plc ................................................................................................. 3,324 27,387
Getinge AB ....................................................................................................................... 732 27,156
Genmab A/S ..................................................................................................................... 72 24,746
Norsk Hydro ASA ............................................................................................................. 4,308 24,744
Tele2 AB .......................................................................................................................... 1,902 24,042
Novartis AG ...................................................................................................................... 321 22,793
Industria de Diseno Textil SA ............................................................................................ 732 20,561
Sagax AB ......................................................................................................................... 594 20,542
CaixaBank SA .................................................................................................................. 8,520 19,415
Sanofi ............................................................................................................................... 219 18,477
Brenntag SE ..................................................................................................................... 240 18,162
Spirax-Sarco Engineering Plc ........................................................................................... 93 17,105
Electrolux AB .................................................................................................................... 828 16,431

SCHEDULE OF PORTFOLIO CHANGES (continued) Franklin LibertyQ European Equity UCITS ETF (continued)
Schedule of Portfolio Changes for the period ended 31 December 2021.
Franklin LibertyShares ICAV Interim Report 187
Major Sales Shares Proceeds EUR
Zurich Insurance Group AG .............................................................................................. 534 194,329
Iberdrola SA ..................................................................................................................... 16,767 166,044
BT Group Plc ................................................................................................................... 57,816 107,765
UPM-Kymmene OYJ ........................................................................................................ 3,297 105,658
Evolution AB .................................................................................................................... 963 89,630
Hermes International ........................................................................................................ 46 76,030
Novo Nordisk A/S ............................................................................................................. 786 74,471
ASML Holding NV ............................................................................................................ 93 65,056
Publicis Groupe SA .......................................................................................................... 1,089 62,219
Kinnevik AB ...................................................................................................................... 1,383 43,681
Partners Group Holding AG .............................................................................................. 27 41,210
RELX Plc .......................................................................................................................... 1,302 35,759
Berkeley Group Holdings Plc ............................................................................................ 693 34,890
ICA Gruppen AB .............................................................................................................. 648 33,493
M&G Plc ........................................................................................................................... 15,063 33,085
Roche Holding AG ........................................................................................................... 93 32,107
British Land Co Plc ........................................................................................................... 4,407 26,351
Zalando SE ...................................................................................................................... 270 25,570
Koninklijke Ahold Delhaize NV ......................................................................................... 783 23,214
Investment AB Latour ....................................................................................................... 657 21,944
Adyen NV ......................................................................................................................... 8 19,578
Antofagasta Plc ................................................................................................................ 1,185 19,218
L'Oreal SA ........................................................................................................................ 42 16,693
Telecom Italia SpA ........................................................................................................... 35,733 15,414

SCHEDULE OF PORTFOLIO CHANGES (continued) Franklin LibertyQ Global Dividend UCITS ETF
Schedule of Portfolio Changes for the period ended 31 December 2021.
188 Interim Report Franklin LibertyShares ICAV
In accordance with the UCITS Regulations this statement presents the aggregate purchases and aggregate sales of a
security exceeding 1.00% of the total value of purchases or sales for the period or at least the top 20 purchases and sales.
Major Purchases Shares Cost USD
Rio Tinto Plc ..................................................................................................................... 12,984 796,283
Amgen Inc ........................................................................................................................ 3,804 756,615
Rio Tinto Ltd ..................................................................................................................... 4,968 329,392
Sun Life Financial Inc ....................................................................................................... 3,288 173,698
International Business Machines Corp .............................................................................. 1,452 172,804
Emirates Telecommunications Group Co PJSC ................................................................ 18,834 162,604
Unilever Plc ...................................................................................................................... 2,610 135,147
3M Co .............................................................................................................................. 660 114,365
Altria Group Inc ................................................................................................................ 2,538 110,141
Allianz SE ......................................................................................................................... 468 102,417
LEG Immobilien AG .......................................................................................................... 720 100,098
Realtek Semiconductor Corp ............................................................................................ 5,000 99,834
SITC International Holdings Co Ltd ................................................................................... 24,000 96,347
Nucor Corp ....................................................................................................................... 876 94,086
Saudi Telecom Co ............................................................................................................ 2,904 86,665
Novartis AG ...................................................................................................................... 960 78,352
KDDI Corp ........................................................................................................................ 2,500 73,774
Bank of Nova Scotia ......................................................................................................... 1,170 72,978
Fidelity National Financial Inc ........................................................................................... 1,470 71,870
Commonwealth Bank of Australia ..................................................................................... 1,032 70,023
Philip Morris International Inc ............................................................................................ 732 65,898
Gjensidige Forsikring ASA ................................................................................................ 2,640 59,520
Orion OYJ ........................................................................................................................ 1,416 57,847
Johnson & Johnson .......................................................................................................... 348 56,178

SCHEDULE OF PORTFOLIO CHANGES (continued) Franklin LibertyQ Global Dividend UCITS ETF (continued)
Schedule of Portfolio Changes for the period ended 31 December 2021.
Franklin LibertyShares ICAV Interim Report 189
Major Sales Shares Proceeds USD
Analog Devices Inc ........................................................................................................... 4,725 790,508
Canadian Imperial Bank of Commerce ............................................................................. 5,694 632,234
Saudi National Bank ......................................................................................................... 32,178 517,256
Qatar National Bank QPSC .............................................................................................. 76,014 404,142
QUALCOMM Inc .............................................................................................................. 2,153 390,654
Macquarie Group Ltd ........................................................................................................ 1,873 265,696
Singapore Telecommunications Ltd .................................................................................. 153,600 264,242
Paychex Inc ..................................................................................................................... 2,081 257,382
Bank Rakyat Indonesia Persero Tbk PT ........................................................................... 755,052 212,122
Target Corp ...................................................................................................................... 868 207,548
Roche Holding AG ........................................................................................................... 511 203,026
UPM-Kymmene OYJ ........................................................................................................ 5,472 197,385
Eaton Corp Plc ................................................................................................................. 1,141 188,482
Taiwan Semiconductor Manufacturing Co Ltd .................................................................. 7,157 155,325
ORIX Corp ....................................................................................................................... 7,800 155,047
Tryg A/S ........................................................................................................................... 5,136 123,546
Procter & Gamble Co ....................................................................................................... 787 122,371
GlaxoSmithKline Plc ......................................................................................................... 4,954 105,040
Tokio Marine Holdings Inc ................................................................................................ 1,675 88,405
Cisco Systems Inc ............................................................................................................ 1,403 88,075
Merck & Co Inc ................................................................................................................. 1,126 85,919
Royal Bank of Canada ..................................................................................................... 818 84,759
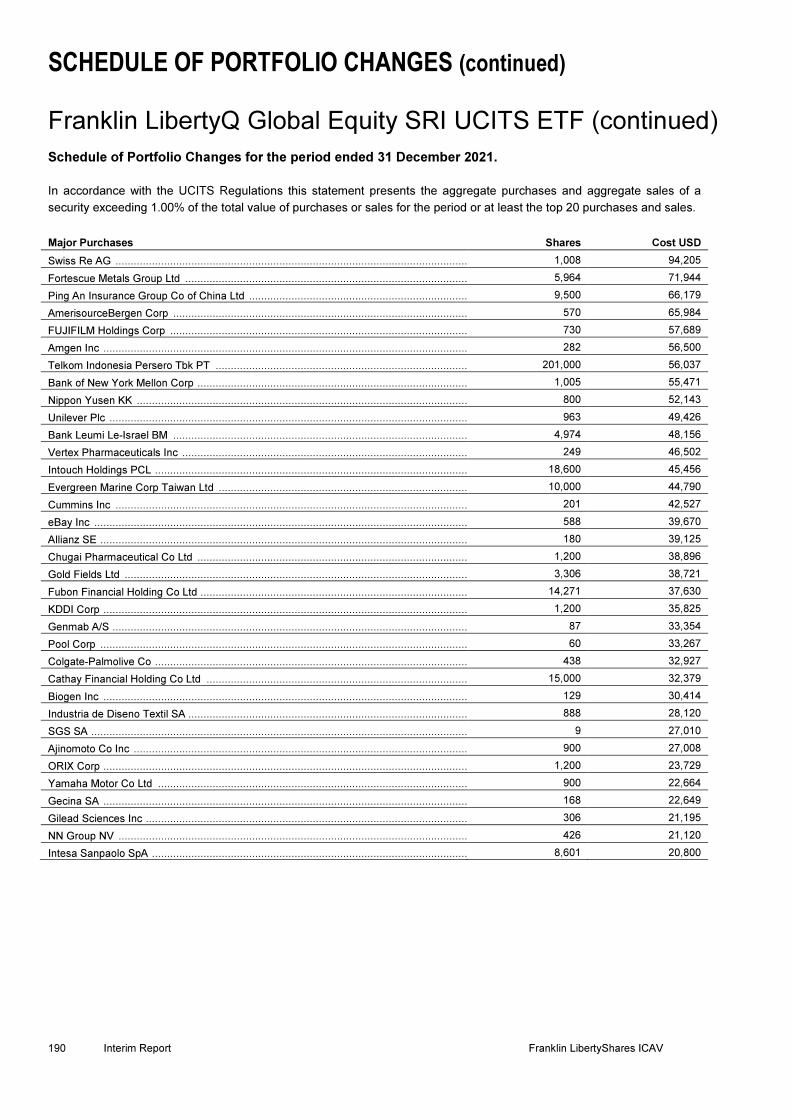
SCHEDULE OF PORTFOLIO CHANGES (continued)
Franklin LibertyQ Global Equity SRI UCITS ETF (continued)
Schedule of Portfolio Changes for the period ended 31 December 2021.
190 Interim Report Franklin LibertyShares ICAV
In accordance with the UCITS Regulations this statement presents the aggregate purchases and aggregate sales of a
security exceeding 1.00% of the total value of purchases or sales for the period or at least the top 20 purchases and sales.
Major Purchases Shares Cost USD
Swiss Re AG .................................................................................................................... 1,008 94,205
Fortescue Metals Group Ltd ............................................................................................. 5,964 71,944
Ping An Insurance Group Co of China Ltd ........................................................................ 9,500 66,179
AmerisourceBergen Corp ................................................................................................. 570 65,984
FUJIFILM Holdings Corp .................................................................................................. 730 57,689
Amgen Inc ........................................................................................................................ 282 56,500
Telkom Indonesia Persero Tbk PT ................................................................................... 201,000 56,037
Bank of New York Mellon Corp ......................................................................................... 1,005 55,471
Nippon Yusen KK ............................................................................................................. 800 52,143
Unilever Plc ...................................................................................................................... 963 49,426
Bank Leumi Le-Israel BM ................................................................................................. 4,974 48,156
Vertex Pharmaceuticals Inc .............................................................................................. 249 46,502
Intouch Holdings PCL ....................................................................................................... 18,600 45,456
Evergreen Marine Corp Taiwan Ltd .................................................................................. 10,000 44,790
Cummins Inc .................................................................................................................... 201 42,527
eBay Inc ........................................................................................................................... 588 39,670
Allianz SE ......................................................................................................................... 180 39,125
Chugai Pharmaceutical Co Ltd ......................................................................................... 1,200 38,896
Gold Fields Ltd ................................................................................................................. 3,306 38,721
Fubon Financial Holding Co Ltd ........................................................................................ 14,271 37,630
KDDI Corp ........................................................................................................................ 1,200 35,825
Genmab A/S ..................................................................................................................... 87 33,354
Pool Corp ......................................................................................................................... 60 33,267
Colgate-Palmolive Co ....................................................................................................... 438 32,927
Cathay Financial Holding Co Ltd ...................................................................................... 15,000 32,379
Biogen Inc ........................................................................................................................ 129 30,414
Industria de Diseno Textil SA ............................................................................................ 888 28,120
SGS SA ............................................................................................................................ 9 27,010
Ajinomoto Co Inc .............................................................................................................. 900 27,008
ORIX Corp ........................................................................................................................ 1,200 23,729
Yamaha Motor Co Ltd ...................................................................................................... 900 22,664
Gecina SA ........................................................................................................................ 168 22,649
Gilead Sciences Inc .......................................................................................................... 306 21,195
NN Group NV ................................................................................................................... 426 21,120
Intesa Sanpaolo SpA ........................................................................................................ 8,601 20,800

SCHEDULE OF PORTFOLIO CHANGES (continued)
Franklin LibertyQ Global Equity SRI UCITS ETF
Schedule of Portfolio Changes for the period ended 31 December 2021.
Franklin LibertyShares ICAV Interim Report 191
Major Sales Shares Proceeds USD
NVIDIA Corp .................................................................................................................... 816 266,608
Eisai Co Ltd ...................................................................................................................... 1,200 72,630
Novo Nordisk A/S ............................................................................................................. 678 72,306
Microsoft Corp .................................................................................................................. 216 71,400
ASML Holding NV ............................................................................................................ 84 66,141
Country Garden Services Holdings Co Ltd ....................................................................... 9,000 54,352
Tokyo Electron Ltd ........................................................................................................... 100 52,696
Lowe's Co Inc ................................................................................................................... 189 46,223
Rockwell Automation Inc .................................................................................................. 132 44,374
Home Depot Inc ............................................................................................................... 108 43,261
ICA Gruppen AB .............................................................................................................. 684 39,913
Marsh & McLennan Co Inc ............................................................................................... 231 37,885
Mettler-Toledo International Inc ........................................................................................ 24 36,335
IDEXX Laboratories Inc .................................................................................................... 51 31,008
RELX Plc .......................................................................................................................... 969 29,956
Clorox Co ......................................................................................................................... 180 29,310
Moody's Corp ................................................................................................................... 72 28,123
Hindustan Unilever Ltd ..................................................................................................... 867 26,711
Canadian National Railway Co ......................................................................................... 207 26,116
Roche Holding AG ........................................................................................................... 63 24,482
Ferguson Plc .................................................................................................................... 159 24,114
Daikin Industries Ltd ......................................................................................................... 100 20,386
Pandora A/S ..................................................................................................................... 165 20,326
Tractor Supply Co ............................................................................................................ 90 20,278
HCA Healthcare Inc .......................................................................................................... 84 18,948
SK Square Co Ltd ............................................................................................................ 276 18,052
Sekisui House Ltd ............................................................................................................ 900 17,516
WW Grainger Inc .............................................................................................................. 36 17,329

SCHEDULE OF PORTFOLIO CHANGES (continued)
Franklin LibertyQ U.S. Equity UCITS ETF (continued)
Schedule of Portfolio Changes for the period ended 31 December 2021.
192 Interim Report Franklin LibertyShares ICAV
In accordance with the UCITS Regulations this statement presents the aggregate purchases and aggregate sales of a
security exceeding 1.00% of the total value of purchases or sales for the period or at least the top 20 purchases and sales.
Major Purchases Shares Cost USD
Home Depot Inc ............................................................................................................... 2,793 1,083,635
NIKE Inc ........................................................................................................................... 4,900 790,676
Lowe's Co Inc ................................................................................................................... 2,695 668,609
CVS Health Corp .............................................................................................................. 4,167 412,216
AT&T Inc .......................................................................................................................... 16,949 409,047
Moderna Inc ..................................................................................................................... 1,341 406,938
Amgen Inc ........................................................................................................................ 1,679 371,504
Bristol-Myers Squibb Co ................................................................................................... 5,765 354,456
International Business Machines Corp .............................................................................. 2,616 336,905
Altria Group Inc ................................................................................................................ 6,807 326,834
3M Co .............................................................................................................................. 1,808 320,025
Intel Corp .......................................................................................................................... 6,208 317,325
Mastercard Inc .................................................................................................................. 888 308,449
Philip Morris International Inc ............................................................................................ 3,230 307,365
Comcast Corp .................................................................................................................. 5,957 302,777
Verizon Communications Inc ............................................................................................ 5,591 296,955
Johnson & Johnson .......................................................................................................... 1,619 272,746
Lockheed Martin Corp ...................................................................................................... 774 267,819
Colgate-Palmolive Co ....................................................................................................... 3,234 266,748
United Parcel Service Inc ................................................................................................. 1,239 249,416

SCHEDULE OF PORTFOLIO CHANGES (continued)
Franklin LibertyQ U.S. Equity UCITS ETF
Schedule of Portfolio Changes for the period ended 31 December 2021.
Franklin LibertyShares ICAV Interim Report 193
Major Sales Shares Proceeds USD
NVIDIA Corp .................................................................................................................... 7,102 1,976,190
Honeywell International Inc .............................................................................................. 4,982 1,025,528
Dominion Energy Inc ........................................................................................................ 11,289 863,488
Public Service Enterprise Group Inc ................................................................................. 9,646 617,766
Humana Inc ...................................................................................................................... 1,325 600,266
Intuit Inc ........................................................................................................................... 882 548,488
Costco Wholesale Corp .................................................................................................... 963 518,210
Analog Devices Inc ........................................................................................................... 3,054 511,080
Pfizer Inc .......................................................................................................................... 8,961 507,849
Clorox Co ......................................................................................................................... 2,809 486,943
Thermo Fisher Scientific Inc ............................................................................................. 674 433,117
Xcel Energy Inc ................................................................................................................ 6,254 417,761
QUALCOMM Inc .............................................................................................................. 2,363 404,586
Apple Inc .......................................................................................................................... 2,415 402,219
Microsoft Corp .................................................................................................................. 1,230 397,949
Veeva Systems Inc ........................................................................................................... 1,431 373,001
Trane Technologies Plc .................................................................................................... 1,908 369,418
Accenture Plc ................................................................................................................... 945 363,555
Adobe Inc ......................................................................................................................... 613 357,846
Eli Lilly & Co ..................................................................................................................... 1,269 332,552
Match Group Inc ............................................................................................................... 2,385 306,087
S&P Global Inc ................................................................................................................. 571 265,401
Eastman Chemical Co ...................................................................................................... 2,120 249,954
Automatic Data Processing Inc ......................................................................................... 1,032 235,055

SCHEDULE OF PORTFOLIO CHANGES (continued)
Franklin STOXX Europe 600 Paris Aligned Climate UCITS ETF
Schedule of Portfolio Changes for the period ended 31 December 2021.
194 Interim Report Franklin LibertyShares ICAV
In accordance with the UCITS Regulations this statement presents the aggregate purchases and aggregate sales of a
security exceeding 1.00% of the total value of purchases or sales for the period or at least the top 20 purchases and sales.
Major Purchases Shares Cost EUR
AstraZeneca Plc ............................................................................................................... 2,604 257,721
L'Oreal SA ........................................................................................................................ 583 237,544
Roche Holding AG ............................................................................................................ 604 208,535
Novo Nordisk A/S ............................................................................................................. 2,049 196,136
Schneider Electric SE ....................................................................................................... 1,163 183,114
ASML Holding NV ............................................................................................................ 251 176,974
SAP SE ............................................................................................................................ 1,387 161,936
Nestle SA ......................................................................................................................... 1,271 146,522
LVMH Moet Hennessy Louis Vuitton SE ........................................................................... 200 142,556
Novartis AG ...................................................................................................................... 1,857 133,325
Unilever Plc ...................................................................................................................... 2,473 115,143
Allianz SE ......................................................................................................................... 575 114,519
Kering SA ......................................................................................................................... 160 111,615
Diageo Plc ........................................................................................................................ 2,383 109,063
Siemens AG ..................................................................................................................... 726 107,043
Sanofi ............................................................................................................................... 1,217 104,073
Vestas Wind Systems A/S ................................................................................................ 3,344 99,339
Koninklijke Philips NV ....................................................................................................... 2,916 94,997
GlaxoSmithKline Plc ......................................................................................................... 5,182 94,095
HSBC Holdings Plc ........................................................................................................... 15,600 79,111
adidas AG ........................................................................................................................ 301 78,210
Zurich Insurance Group AG .............................................................................................. 207 76,796
AXA SA ............................................................................................................................ 2,954 73,797

SCHEDULE OF PORTFOLIO CHANGES (continued)
Franklin STOXX Europe 600 Paris Aligned Climate UCITS ETF (continued)
Schedule of Portfolio Changes for the period ended 31 December 2021.
Franklin LibertyShares ICAV Interim Report 195
Major Sales Shares Proceeds EUR
Roche Holding AG ........................................................................................................... 171 61,242
ICA Gruppen AB .............................................................................................................. 388 19,907
L'Oreal SA ........................................................................................................................ 47 18,591
Universal Music Group NV ............................................................................................... 636 15,959
Diageo Plc ........................................................................................................................ 336 15,304
RELX Plc .......................................................................................................................... 520 14,313
Linde Plc .......................................................................................................................... 48 12,551
Novartis AG ...................................................................................................................... 165 12,132
Fortum OYJ ....................................................................................................................... 440 11,809
SAP SE ............................................................................................................................ 95 11,734
ASML Holding NV ............................................................................................................ 16 11,005
Merck KGaA ..................................................................................................................... 50 10,989
Kering SA ......................................................................................................................... 15 10,346
Telefonaktiebolaget LM Ericsson ...................................................................................... 921 8,895
Straumann Holding AG .................................................................................................... 5 8,756
Daimler Truck Holding AG ................................................................................................ 287 8,545
HSBC Holdings Plc .......................................................................................................... 1,480 7,756
Scatec ASA ...................................................................................................................... 468 7,437
Severn Trent Plc .............................................................................................................. 215 7,408
Nestle SA ......................................................................................................................... 66 6,907
Assicurazioni Generali SpA .............................................................................................. 370 6,843

SCHEDULE OF PORTFOLIO CHANGES (continued) Franklin S&P 500 Paris Aligned Climate UCITS ETF
Schedule of Portfolio Changes for the period ended 31 December 2021.
196 Interim Report Franklin LibertyShares ICAV
In accordance with the UCITS Regulations this statement presents the aggregate purchases and aggregate sales of a
security exceeding 1.00% of the total value of purchases or sales for the period or at least the top 20 purchases and sales.
Major Purchases Shares Cost USD
Apple Inc .......................................................................................................................... 30,682 4,765,518
Alphabet Inc ..................................................................................................................... 1,055 2,960,580
Alphabet Inc ..................................................................................................................... 1,006 2,843,434
NVIDIA Corp .................................................................................................................... 10,416 2,834,573
Adobe Inc ......................................................................................................................... 4,600 2,727,129
Visa Inc ............................................................................................................................ 9,456 2,068,744
Meta Platforms Inc ............................................................................................................ 5,859 2,001,198
Bank of America Corp ...................................................................................................... 46,191 1,998,619
Tesla Inc ........................................................................................................................... 1,912 1,786,871
salesforce.com Inc ............................................................................................................ 6,639 1,743,374
AbbVie Inc ........................................................................................................................ 14,680 1,711,648
UnitedHealth Group Inc .................................................................................................... 3,870 1,699,561
Mastercard Inc .................................................................................................................. 4,711 1,642,114
Cisco Systems Inc ............................................................................................................ 28,250 1,608,809
Microsoft Corp .................................................................................................................. 4,799 1,398,590
JPMorgan Chase & Co ..................................................................................................... 8,432 1,346,507
Medtronic Plc .................................................................................................................... 10,681 1,232,174
Pfizer Inc .......................................................................................................................... 23,780 1,170,308
Merck & Co Inc ................................................................................................................. 14,878 1,137,469
Abbott Laboratories .......................................................................................................... 8,875 1,127,028
Thermo Fisher Scientific Inc ............................................................................................. 1,754 1,075,215
Lam Research Corp ......................................................................................................... 1,426 1,001,980
Intuit Inc ........................................................................................................................... 1,688 1,001,363
Walt Disney Co ................................................................................................................. 5,943 979,349
Eli Lilly & Co ..................................................................................................................... 3,424 861,240
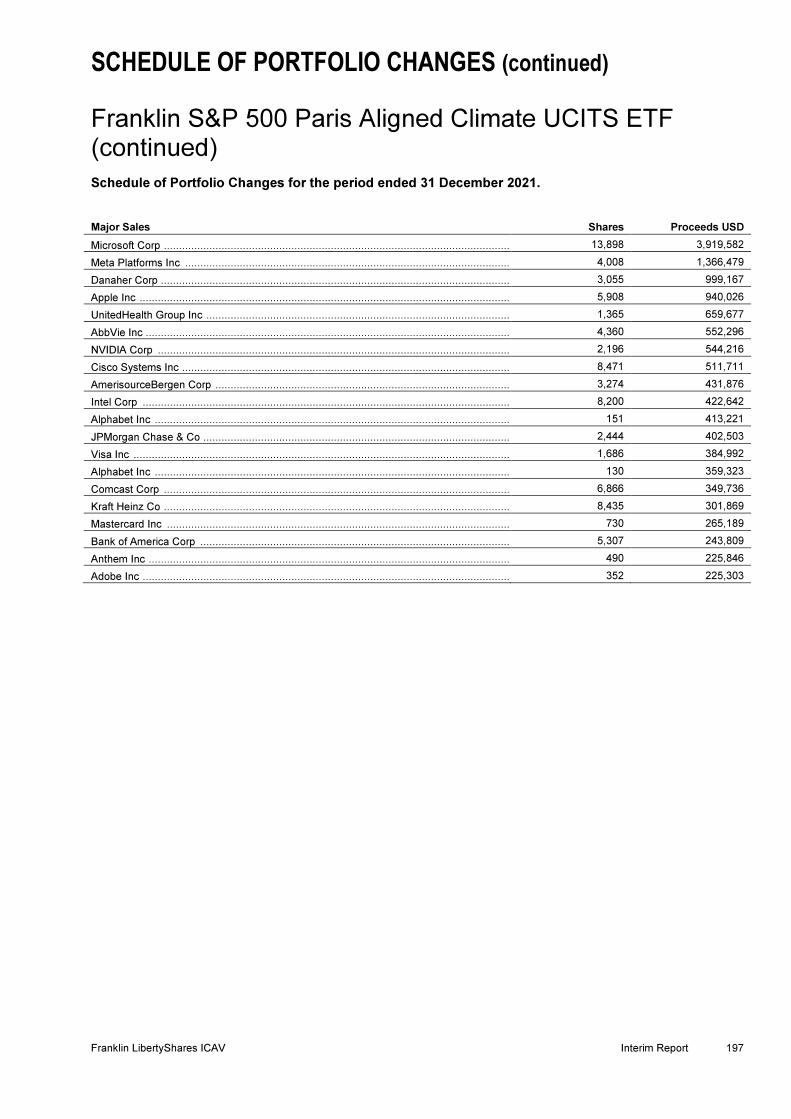
SCHEDULE OF PORTFOLIO CHANGES (continued) Franklin S&P 500 Paris Aligned Climate UCITS ETF (continued)
Schedule of Portfolio Changes for the period ended 31 December 2021.
Franklin LibertyShares ICAV Interim Report 197
Major Sales Shares Proceeds USD
Microsoft Corp .................................................................................................................. 13,898 3,919,582
Meta Platforms Inc ........................................................................................................... 4,008 1,366,479
Danaher Corp ................................................................................................................... 3,055 999,167
Apple Inc .......................................................................................................................... 5,908 940,026
UnitedHealth Group Inc .................................................................................................... 1,365 659,677
AbbVie Inc ........................................................................................................................ 4,360 552,296
NVIDIA Corp .................................................................................................................... 2,196 544,216
Cisco Systems Inc ............................................................................................................ 8,471 511,711
AmerisourceBergen Corp ................................................................................................. 3,274 431,876
Intel Corp ......................................................................................................................... 8,200 422,642
Alphabet Inc ..................................................................................................................... 151 413,221
JPMorgan Chase & Co ..................................................................................................... 2,444 402,503
Visa Inc ............................................................................................................................ 1,686 384,992
Alphabet Inc ..................................................................................................................... 130 359,323
Comcast Corp .................................................................................................................. 6,866 349,736
Kraft Heinz Co .................................................................................................................. 8,435 301,869
Mastercard Inc ................................................................................................................. 730 265,189
Bank of America Corp ...................................................................................................... 5,307 243,809
Anthem Inc ....................................................................................................................... 490 225,846
Adobe Inc ......................................................................................................................... 352 225,303

Authorized for distribution only when accompanied or preceded by a summary prospectus and/or prospectus. Investors should
carefully consider a fund’s investment goals, risks, charges and expenses before investing. A prospectus contains this and other
information; please read it carefully before investing.
To help ensure we provide you with quality service, all calls to and from our service areas are monitored and/or recorded.
Interim Report Franklin LibertyShares ICAV
© 2021 Franklin Templeton Investments. All rights reserved. ETF I 12/21
Related Documents