1 Please refer to this article using: 1 Frankl, A., Poesen, J., Mitiku Haile, Deckers, J., Nyssen, J., 2013. Quantifying long-term changes in 2 gully networks and volumes in dryland environments: the case of Northern Ethiopia, 3 Geomorphology, 201, 254-263. 10.1016/j.geomorph.2013.06.025 4 - Check the website of Geomorphology for the final version of this publication 5 6 Quantifying long-term changes in gully networks and volumes in dryland environments: 7 the case of Northern Ethiopia 8 9 Amaury Frankl a, *, Jean Poesen b , Mitiku Haile c , Jozef Deckers b , Jan Nyssen a 10 11 a Department of Geography, Ghent University, Krijgslaan 281 (S8), B-9000 Ghent, Belgium. 12 b Department of Earth and Environmental Sciences, KU Leuven, B-3001 Heverlee, Belgium. 13 c Department of Land Resources Management and Environmental Protection, Mekelle 14 University, Mekelle, Ethiopia. 15 * Corresponding author: Tel.: +32 92644701; fax: +32 92644985; e-mail address: 16 [email protected] (A. Frankl) 17 18 Abstract 19 Understanding historical and present gully development is essential when addressing the causes 20 and consequences of land degradation, especially in vulnerable dryland environments. For 21 Northern Ethiopia, several studies exist on the severity of gully erosion, yet few have quantified 22 gully development. In this study, gully network and volume development were quantified over 23 the period 1963-2010 for an area of 123 km², representing the regional variability in 24

Welcome message from author
This document is posted to help you gain knowledge. Please leave a comment to let me know what you think about it! Share it to your friends and learn new things together.
Transcript
1
Please refer to this article using: 1
Frankl, A., Poesen, J., Mitiku Haile, Deckers, J., Nyssen, J., 2013. Quantifying long-term changes in 2
gully networks and volumes in dryland environments: the case of Northern Ethiopia, 3
Geomorphology, 201, 254-263. 10.1016/j.geomorph.2013.06.025 4
- Check the website of Geomorphology for the final version of this publication 5
6
Quantifying long-term changes in gully networks and volumes in dryland environments: 7
the case of Northern Ethiopia 8
9
Amaury Frankl a,*, Jean Poesen
b, Mitiku Haile
c, Jozef Deckers
b, Jan Nyssen
a 10
11
a Department of Geography, Ghent University, Krijgslaan 281 (S8), B-9000 Ghent, Belgium. 12
b Department of Earth and Environmental Sciences, KU Leuven, B-3001 Heverlee, Belgium. 13
c Department of Land Resources Management and Environmental Protection, Mekelle 14
University, Mekelle, Ethiopia. 15
* Corresponding author: Tel.: +32 92644701; fax: +32 92644985; e-mail address: 16
[email protected] (A. Frankl) 17
18
Abstract 19
Understanding historical and present gully development is essential when addressing the causes 20
and consequences of land degradation, especially in vulnerable dryland environments. For 21
Northern Ethiopia, several studies exist on the severity of gully erosion, yet few have quantified 22
gully development. In this study, gully network and volume development were quantified over 23
the period 1963-2010 for an area of 123 km², representing the regional variability in 24
2
environmental characteristics. Gully networks were mapped from small-scale aerial photographs 25
and high-resolution satellite images. For the latter, visualizing Google Earth images in 3D 26
proved to be very suitable to investigate gully erosion. From the changes in networks and 27
volumes over the period 1963-2010, the occurrence of one cut-and-fill cycle is apparent. From a 28
largely low-dynamic gully system in the 1960s, network expansion and increased erosion rates in 29
the 1980s and 1990s caused the drainage density and volume to peak in 1994. The average gully 30
density (Dtotal) was then 2.52 km km-2
and the area-specific gully volume (Va) 60 10³ m³ km-2
. 31
This coincides with soil losses by gully erosion (SLg) of 17.6 t ha-1
y-1
over the period 1963-32
1994. By 2010, improved land management and the region-wide implementation of soil and 33
water conservation measures caused 25% of the gully network to stabilize, resulting in a net 34
infilling of the gully channels over the period 1994-2010. The study validates previous findings 35
that land degradation by gullying was indeed severe in Northern Ethiopia in the second half of 36
the 20th century, but also shows that when proper land management is applied, a gully can be 37
transformed into a linear oasis, which increases the resistance of gullies to further erosion. 38
39
Keywords: Aerial photographs; Dryland; Ethiopia; Google Earth; Gully; Volume 40
41
1. Introduction 42
Drylands are areas where evapotranspiration exceeds precipitation during part of, or during, the 43
whole year (Kassas, 1995). They cover 40% of the Earth’s surface and house about 2.1 billion 44
people in nearly 100 countries, including Ethiopia (UNEP-DDD, 2012). In terms of aridity, 45
drylands are defined as regions where the ratio between long-term annual precipitation and 46
potential evapotranspiration is between 0.05 and 0.65, and include hyper-arid, arid, semi-arid and 47
3
dry sub-humid zones (Thornthwaite, 1948; UNEP, 1994). For these zones, water availability and 48
biomass production are restricted and mostly confined to a short rainy season. As a result, the 49
carrying capacity of the ecosystems is rapidly exceeded by the human exploitation of natural 50
resources, especially in poor countries with fast demographic expansion and deficient 51
exploitation techniques (Kassas, 1995). Furthermore, the resilience of drylands is often reduced 52
by the occurrence of recurring droughts and severe desertification, which threatens sustainable 53
development in these fragile environments. 54
Gully erosion is acknowledged as a key erosion process whereby land degradation in dryland 55
environments occurs. In a review, Poesen et al. (2002) conclude that gully erosion contributes to 56
50% to 80% of the overall sediment production in drylands. Sediment yields are locally very 57
variable, but may be as high as 3.4 t ha-1
y-1
in Kenya, 32 t ha-1
y-1
in Niger, 16.1 t ha-1
y-1
in 58
Portugal, 64.9
t ha
-1 y
-1 in Spain and 36.8 t ha
-1 y
-1 in the USA (Poesen et al., 2003). 59
Understanding historical and present-day gully erosion is therefore essential when addressing the 60
consequences of future land-use and climate change scenarios (Poesen et al., 2003; Valentin et 61
al., 2005). For instance, land managers need to foresee the effects of land-use changes, 62
infrastructure construction or urbanization on gully development. Without such projections, 63
future developments may be unsustainable and yield much higher costs than originally budgeted. 64
In addition, soil losses may strongly increase, jeopardising in-situ and downstream agricultural 65
production (Poesen et al., 2003). Furthermore, the rapid expansion of gullies is related to shifts in 66
the hydrological regime of landscapes (Knighton, 1998), by which runoff and soil water rapidly 67
converge to gullies (Muhindo Sahani, 2011). This often results in flash floods of polluted water 68
which threaten human health. 69
4
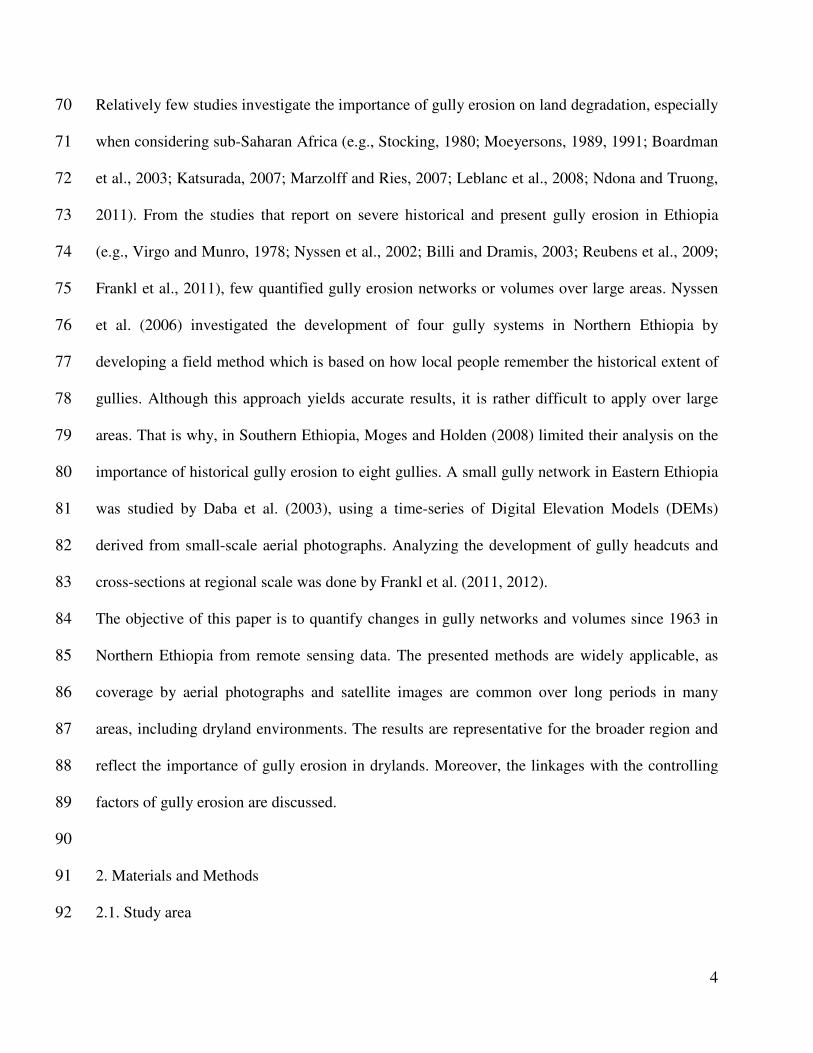
Relatively few studies investigate the importance of gully erosion on land degradation, especially 70
when considering sub-Saharan Africa (e.g., Stocking, 1980; Moeyersons, 1989, 1991; Boardman 71
et al., 2003; Katsurada, 2007; Marzolff and Ries, 2007; Leblanc et al., 2008; Ndona and Truong, 72
2011). From the studies that report on severe historical and present gully erosion in Ethiopia 73
(e.g., Virgo and Munro, 1978; Nyssen et al., 2002; Billi and Dramis, 2003; Reubens et al., 2009; 74
Frankl et al., 2011), few quantified gully erosion networks or volumes over large areas. Nyssen 75
et al. (2006) investigated the development of four gully systems in Northern Ethiopia by 76
developing a field method which is based on how local people remember the historical extent of 77
gullies. Although this approach yields accurate results, it is rather difficult to apply over large 78
areas. That is why, in Southern Ethiopia, Moges and Holden (2008) limited their analysis on the 79
importance of historical gully erosion to eight gullies. A small gully network in Eastern Ethiopia 80
was studied by Daba et al. (2003), using a time-series of Digital Elevation Models (DEMs) 81
derived from small-scale aerial photographs. Analyzing the development of gully headcuts and 82
cross-sections at regional scale was done by Frankl et al. (2011, 2012). 83
The objective of this paper is to quantify changes in gully networks and volumes since 1963 in 84
Northern Ethiopia from remote sensing data. The presented methods are widely applicable, as 85
coverage by aerial photographs and satellite images are common over long periods in many 86
areas, including dryland environments. The results are representative for the broader region and 87
reflect the importance of gully erosion in drylands. Moreover, the linkages with the controlling 88
factors of gully erosion are discussed. 89
90
2. Materials and Methods 91
2.1. Study area 92
5
Eight catchments, representative for the regional variability in environmental characteristics, 93
were selected to study gully development in Northern Ethiopia: Ablo (15.2 km²), May Mekdan 94
(44.7 km²), May Ba’ati (4 km²), May Tsimble (8.1 km²), Atsela (4.9 km²), Ayba (37 km²), 95
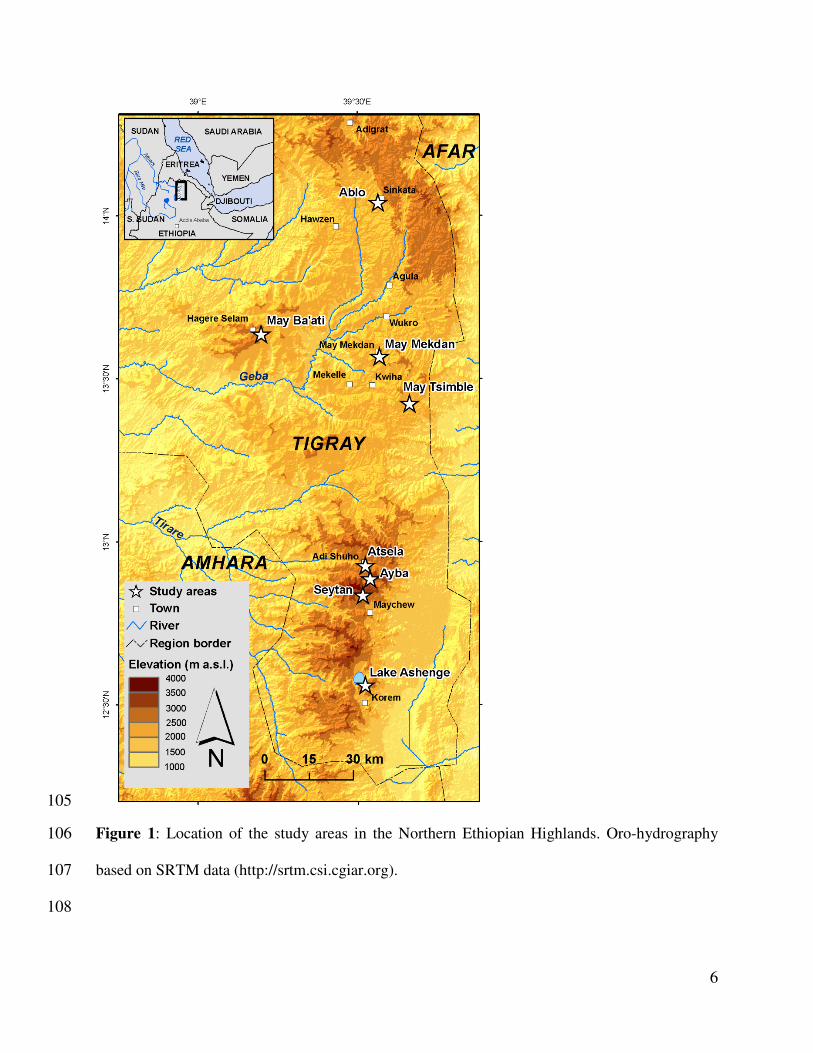
Seytan (8.2 km²) and Lake Ashenge (1.1 km²) (Figure 1). The study areas have elevations that 96
range between 2100 and 3900 m a.s.l., and consist of deeply incised valleys which developed 97
with the uplift of Ethiopian Highlands at the western margin of the Rift Valley (Williams and 98
Williams, 1980). The Ablo catchment exposes sandstone; May Mekdan and May Tsimble shale 99
with limestone cliffs and occasionally dolerite at the summits; Atsela, Ayba, Seytan and Lake 100
Ashenge expose volcanics (flood basalt, rhyolites and consolidated volcanic ash) and May Ba’ati 101
exposes volcanics at higher elevations, while sandstone, limestone and shale occur at lower 102
elevations. 103
104
6
105
Figure 1: Location of the study areas in the Northern Ethiopian Highlands. Oro-hydrography 106
based on SRTM data (http://srtm.csi.cgiar.org). 107
108
7
Rainfall is mostly restricted to a short rainy season from July until early September. Average 109
annual rain increases from north to south, ranging between 500 and 900 mm y−1
, and usually 110
falls as intense showers that seldom last longer than ten minutes (Nyssen et al., 2005). Rain is 111
however highly unreliable and droughts frequently occur. 112
Due to active geomorphologic processes, most soils are young (HTS, 1976; Nyssen et al., 113
2008a). Leptosols are found in high landscape positions while Regosols or Cambisols occur on 114
steep slopes. In footslope positions, more developed fine-textured soils occur, with Vertisols on 115
basalt (colluvium) and Calcisols on limestone. Under remnant forests, Phaeozems occur 116
(Descheemaeker et al., 2006). 117
Land degradation is severe in Northern Ethiopia (Virgo and Munro, 1978; Nyssen et al., 2004). 118
Gullies affect nearly all slopes and frequently exceed 2 m in depth and 5 m in top width. Their 119
occurrence is related to the vulnerable environment, which exposes steep slopes, where rainfall 120
intensities are high and where deforestation and overgrazing depleted the landscape of most 121
vegetation. However, with the introduction of soil and water conservation measures since the 122
1970s – including slope terracing, the establishment of exclosures, and the construction of check 123
dams in gullies – the landscape is greening and reports on land rehabilitation are becoming more 124
frequent (e.g., McCann, 1997; Crummey, 1998; Nyssen et al., 2009; Munro et al, 2008). 125
126
2.2. Creating time-series of aerial photographs and satellite images 127
A database of satellite images and digitized stereographic aerial photographs was created for all 128
eight study areas. Aerial photographs of 1963, 1965, 1986 and 1994 having scales ranging 129
between 1:35,000 and 1:60,000 (ground resolutions of 1-2 m) were collected from the Ethiopian 130
Mapping Authority. They were scanned at a resolution of 1200 dpi with a desktop scanner. 131
8
IKONOS-2 satellite images (resolution of 1 m) of 2006 were available from the VLIR MU-IUC 132
program for the study areas of Ablo and May Ba’ati. For all other study areas, images were 133
consulted on Google Earth. This platform offers high resolution GeoEye - 1 (resolution of 0.50 134
m) images of 2005, Digital Globe (resolution of 0.60 m) images of 2006, and Cnes SPOT 135
(resolution 2.5 m) images of 2011, and allows 3D visualization of the images. 136
Next, the aerial photographs and satellite images were geometrically rectified into the UTM-137
WGS1984 coordinate system. Considering the satellite images, a good rectification was already 138
provided by reading the IKONOS-2 images into ArcGIS 9.2 together with the period rational 139
polynomial coefficient (RPC) data. In order to increase the accuracy for the areas of interest, 140
Ground Control Points (GCPs) were used to perform a second order polynomial transformation 141
on the images. Considering the aerial photographs, the geometric rectification was done from a 142
photogrammetric restitution (Miller, 2004) or, when this yielded poor results, from a co-143
registration (Hughes et al. 2006; James et al., 2012). Photogrammetric restitutions were done 144
with Supersoft Inc VirtuoZo 2.2 and were based on a DEM devised for the same area. Producing 145
DEMs from the aerial photographs required inner and exterior orientation. The relative 146
orientation was based on >300 tie points per stereo pair, and the exterior orientation on seven to 147
fifteen GCPs. When the number of GCPs suitable for the DEM production was too low for a 148
specific area and period, the photogrammetric restitution proved to be unsuccessful. This was 149
especially the case when considering the oldest aerial photographs that display a landscape that 150
has undergone important changes. Within decades of fast population growth, rural settlements, 151
infrastructure and land management structures may have changed considerably. Moreover, the 152
low level of technological development implies that few human-built structures were stable. For 153
instance, the position of footpaths may change over time, trees may be cut and traditional houses 154
9
and fences rebuilt. Therefore, the geometric rectification of some aerial photographs was done by 155
co-registration. Second or third order polynomial transformations (with ArcGIS 9.2) were 156
performed, using points that were derived from the most recent orthophotographs or Google 157
Earth images. The advantage of such an image-to-image registration is that a large number of 158
corresponding points can be identified on both layers, assuring a density of 2 to 9 points per km². 159
As shown by Hughes et al. (2006) and James et al. (2012), such an approach can yield reasonable 160
results when considering small areas and using enough control points that are located close to the 161
features of interest. 162
Once all photographs and images were geometrically rectified, they were organized as layers in a 163
Geographic Information System (GIS) environment. Switching the layers on or off allows easy 164
and rapid observations of gully network changes in the study areas. As could be visually 165
observed, some orthophotographs produced from DEMs showed relatively large lateral 166
displacements when compared to each other. This was solved by performing a co-registration of 167
these layers to the most recent image. As a result, observed changes in the gully networks that 168
were the result of mismatches between the different layers were kept minimal. 169
Assessing the horizontal positional accuracy was done for each layer by calculating the distance 170
between an independent set of ten ground control points measured by GPS in the field, and their 171
location on the different layers. This approach quantifies the horizontal error that is not 172
influenced by the type of data used, or the way in which they were geometrically rectified. 173
Consequently, the average horizontal positional error (± standard deviation) for the different 174
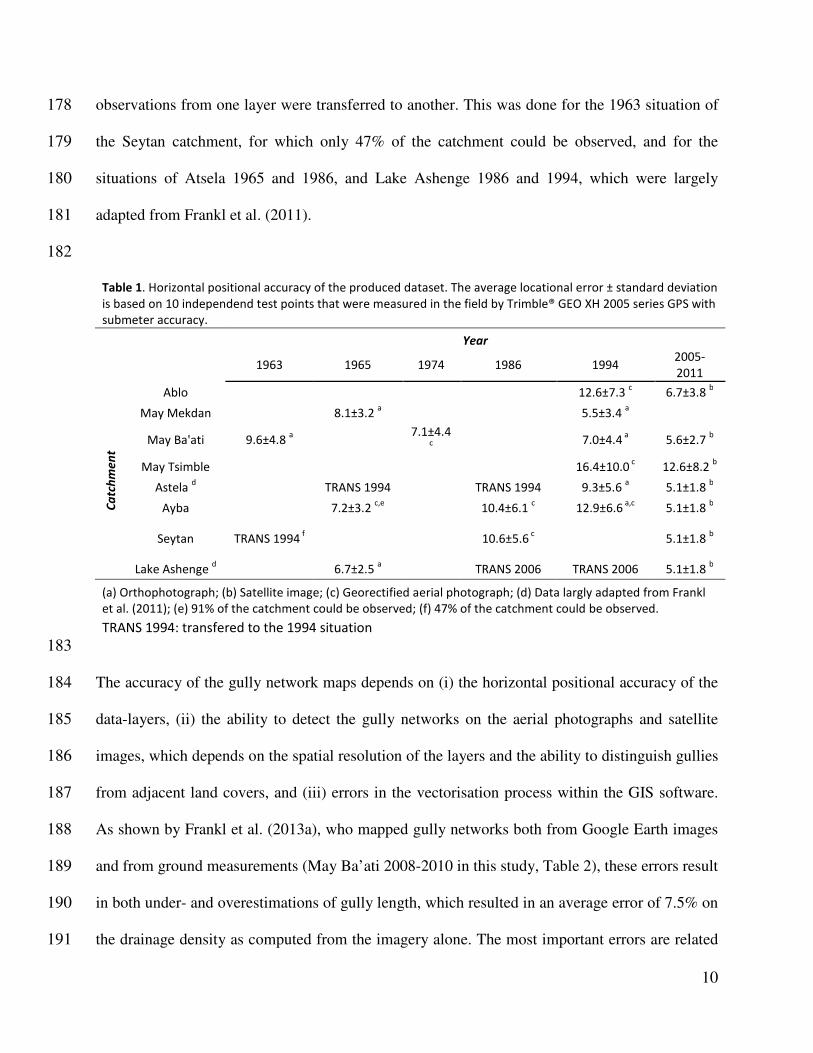
layers could be compared with each other. Table 1 indicates that all the layers have a similar 175
horizontal positional accuracy, which is not related to the type of rectification process. For all 176
periods and catchments the average horizontal positional accuracy was 8.4±3.3 m. In some cases, 177
10
observations from one layer were transferred to another. This was done for the 1963 situation of 178
the Seytan catchment, for which only 47% of the catchment could be observed, and for the 179
situations of Atsela 1965 and 1986, and Lake Ashenge 1986 and 1994, which were largely 180
adapted from Frankl et al. (2011). 181
182
Table 1. Horizontal positional accuracy of the produced dataset. The average locational error ± standard deviation
is based on 10 independend test points that were measured in the field by Trimble® GEO XH 2005 series GPS with
submeter accuracy.
Year
1963 1965 1974 1986 1994
2005-
2011
Ca
tch
me
nt
Ablo 12.6±7.3 c 6.7±3.8
b
May Mekdan 8.1±3.2 a 5.5±3.4
a
May Ba'ati 9.6±4.8 a
7.1±4.4 c
7.0±4.4 a
5.6±2.7 b
May Tsimble 16.4±10.0 c 12.6±8.2
b
Astela d TRANS 1994 TRANS 1994 9.3±5.6
a 5.1±1.8
b
Ayba 7.2±3.2 c,e
10.4±6.1 c 12.9±6.6
a,c 5.1±1.8
b
Seytan TRANS 1994 f 10.6±5.6
c 5.1±1.8
b
Lake Ashenge d 6.7±2.5
a TRANS 2006 TRANS 2006 5.1±1.8
b
(a) Orthophotograph; (b) Satellite image; (c) Georectified aerial photograph; (d) Data largly adapted from Frankl
et al. (2011); (e) 91% of the catchment could be observed; (f) 47% of the catchment could be observed.
TRANS 1994: transfered to the 1994 situation
183
The accuracy of the gully network maps depends on (i) the horizontal positional accuracy of the 184
data-layers, (ii) the ability to detect the gully networks on the aerial photographs and satellite 185
images, which depends on the spatial resolution of the layers and the ability to distinguish gullies 186
from adjacent land covers, and (iii) errors in the vectorisation process within the GIS software. 187
As shown by Frankl et al. (2013a), who mapped gully networks both from Google Earth images 188
and from ground measurements (May Ba’ati 2008-2010 in this study, Table 2), these errors result 189
in both under- and overestimations of gully length, which resulted in an average error of 7.5% on 190
the drainage density as computed from the imagery alone. The most important errors are related 191
11
to difficulties in correctly identifying gullies in low-contrast areas, which is very similar for all 192
aerial photographs and images used in this study. Therefore, we assumed an error of 7.5% 193
(Frankl et al., 2013a) on the network density calculation in this study (see Section 2.2.). 194
195
2.2. Quantifying changes in gully networks and volumes 196
Gully networks observed on the time-series of aerial photographs and satellite images were 197
mapped on-screen using ArcGIS 9.2 or Google Earth, and were updated with more recent 198
modifications as observed in the field (period 2008-2010). For each period, a distinction was 199
made between low-active and high-active gullies (Figure 2) using criteria similar as those used 200
by Oostwoud Wijdenes et al. (2000). Low-active gullies typically have a narrow active channel, 201
smooth cross-sectional profiles, and walls overgrown by vegetation; and mobile bed material is 202
absent or restricted to small grain sizes. For the most recent period, stabilization of low-active 203
channels was typically enforced by check dams. High-active gullies are characterized by an 204
active channel width equal to the total width of the gully bottom. Therefore, the channel has a 205
rectangular cross-sectional shape with steep, well-delineated walls subject to mass failure. 206
Vegetation is not present on the channel floor and on the lower section of the walls. Mobile bed 207
material is present, especially in the lower sections of the gullies where sediment deposition 208
becomes more important. Furthermore, recent peak flow discharges in the gully can be assessed 209
by the size of the entrained bed particles and by flood marks in the gully channel. 210
For the most recent situation, field observations allowed to classify the gully networks into 211
low- and high-active segments. This was accompanied by observing the high-resolution 212
satellite images available in Google Earth. For previous periods, for which aerial 213
photographs were used to map gully networks, the distinction between low- and high-active 214
12
gullies was made visually by observing the gully segments in stereographic view. The steep and 215
well delineated walls make the high-active gullies very distinctive. Their detection is often 216
accentuated by shadows cast in the gullies and by the absence of vegetation. Making the 217
distinction between low- and high-active gullies from aerial photographs requires expertise in 218
gully erosion and good practice with using aerial photographs, and therefore, remains to a certain 219
extent subjective. Validating the classification of historical gully networks into low- or high-220
active segments was therefore done by using a large dataset of historical terrestrial photographs 221
(Frankl et al., 2011) that show the gully networks in the same periods as that of the aerial 222
photographs, and from which gully activity could be assessed easily. Before analyzing changes 223
in gully network development, networks mapped in Google Earth were integrated in ArcGIS 9.2 224
by the method of Frankl et al. (2013a). Subsequently, the gully network density could be 225
calculated and analyzed for the different study areas and periods. 226
A preliminary study on the controls of the drainage density was made by analyzing the effect of 227
catchment area (A, in km²), lithology and average catchment slope gradient (Sc, in m m-1
) of 21 228
subcatchments smaller than 10 km². A was mapped from contour lines derived from DEMs or 229
from topographical maps and was verified in the field, Sc was obtained from SRTM data (90 m 230
resolution, available on http://srtm.csi.cgiar.org), using ArcGIS 9.2 (Spatial Analyst). The effects 231
of A and Sc were analyzed with a linear regression (α = 0.05) and the effects of lithology with 232
Analysis of Variance (one-way ANOVA, α = 0.05). 233
Quantifying gully volumes was done in the field for the most recent situation of 2008-2010 234
(Frankl et al., 2013b). By considering 33 mutually exclusive catchments, totaling 5 380 ha and 235
152 km of gully length, gully volume (V) – length (L) relationships were established, taking the 236
regional environmental variability and gully characteristics into account. As the lithology and the 237
13
presence of check dams or low-active channels proved to be the most important controls of gully 238
cross-sectional shape and size, V – L relationships were established for the different lithologies 239
and percentages of the gully network having check dams and/or being low active (Frankl et al., 240
2013b). These equations (having r² values ranging between 0.81 and 0.94) could then be applied 241
to historical gully networks to calculate their volumes taking into account the gully cross-242
sectional variability. 243
244
245
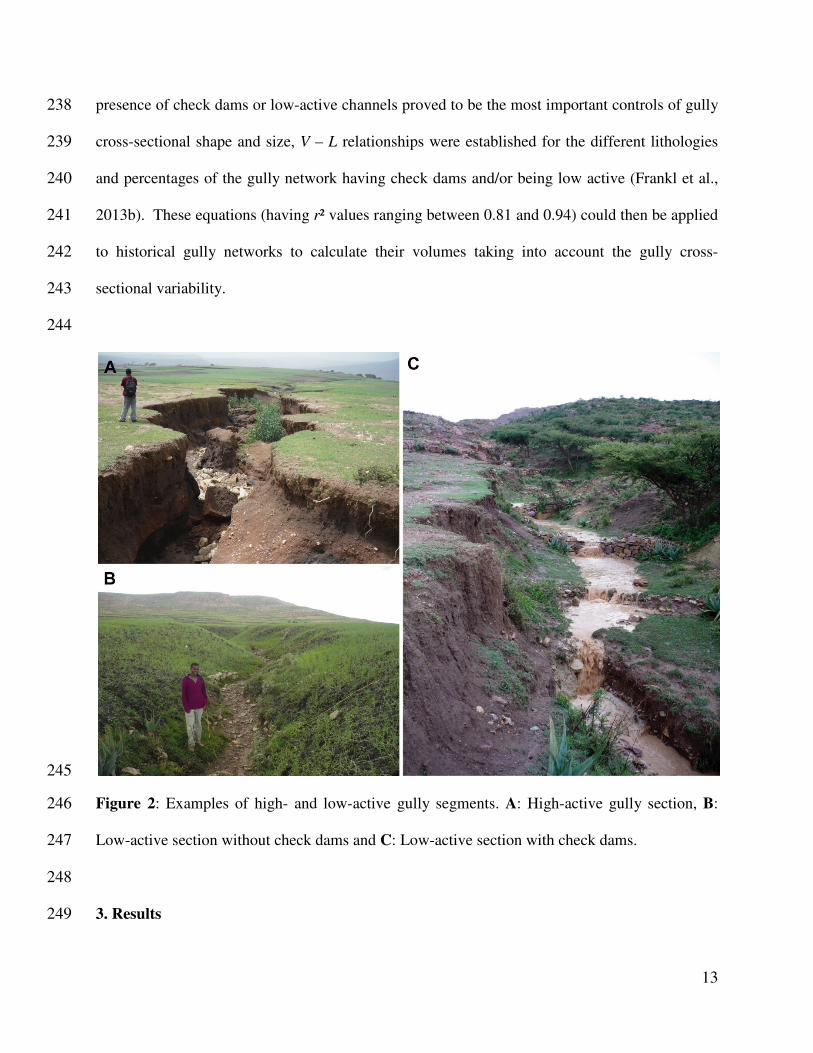
Figure 2: Examples of high- and low-active gully segments. A: High-active gully section, B: 246
Low-active section without check dams and C: Low-active section with check dams. 247
248
3. Results 249
14
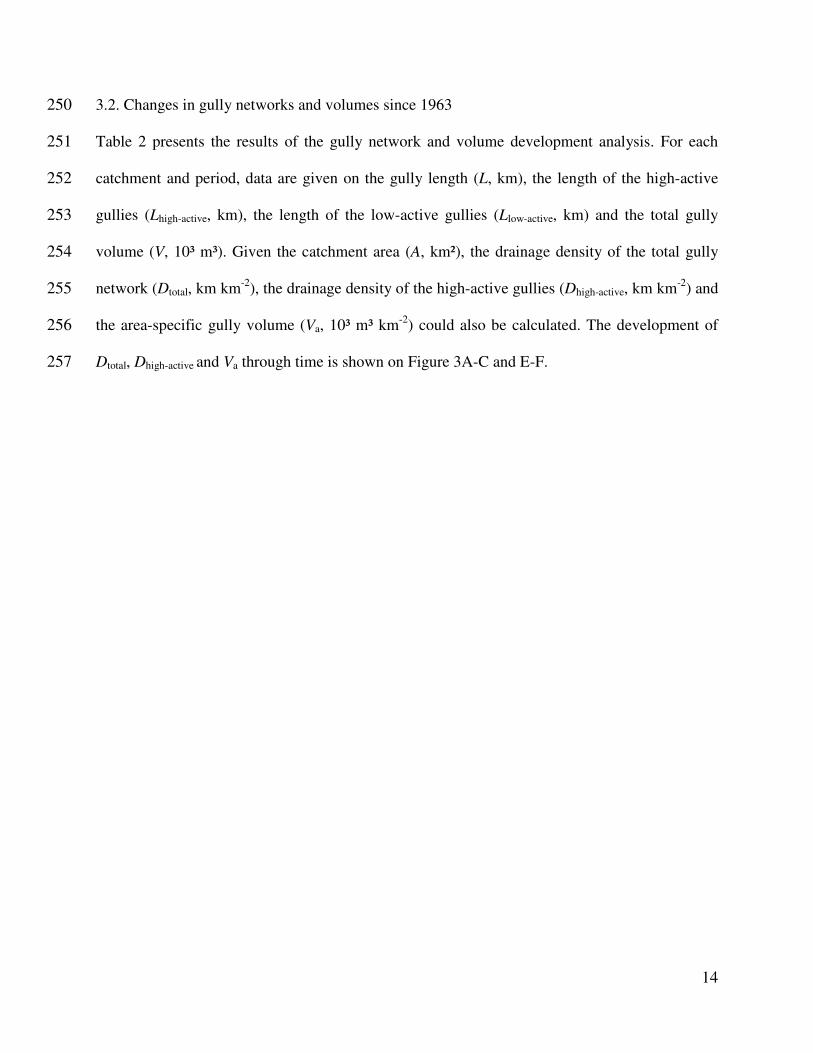
3.2. Changes in gully networks and volumes since 1963 250
Table 2 presents the results of the gully network and volume development analysis. For each 251
catchment and period, data are given on the gully length (L, km), the length of the high-active 252
gullies (Lhigh-active, km), the length of the low-active gullies (Llow-active, km) and the total gully 253
volume (V, 10³ m³). Given the catchment area (A, km²), the drainage density of the total gully 254
network (Dtotal, km km-2
), the drainage density of the high-active gullies (Dhigh-active, km km-2
) and 255
the area-specific gully volume (Va, 10³ m³ km-2
) could also be calculated. The development of 256
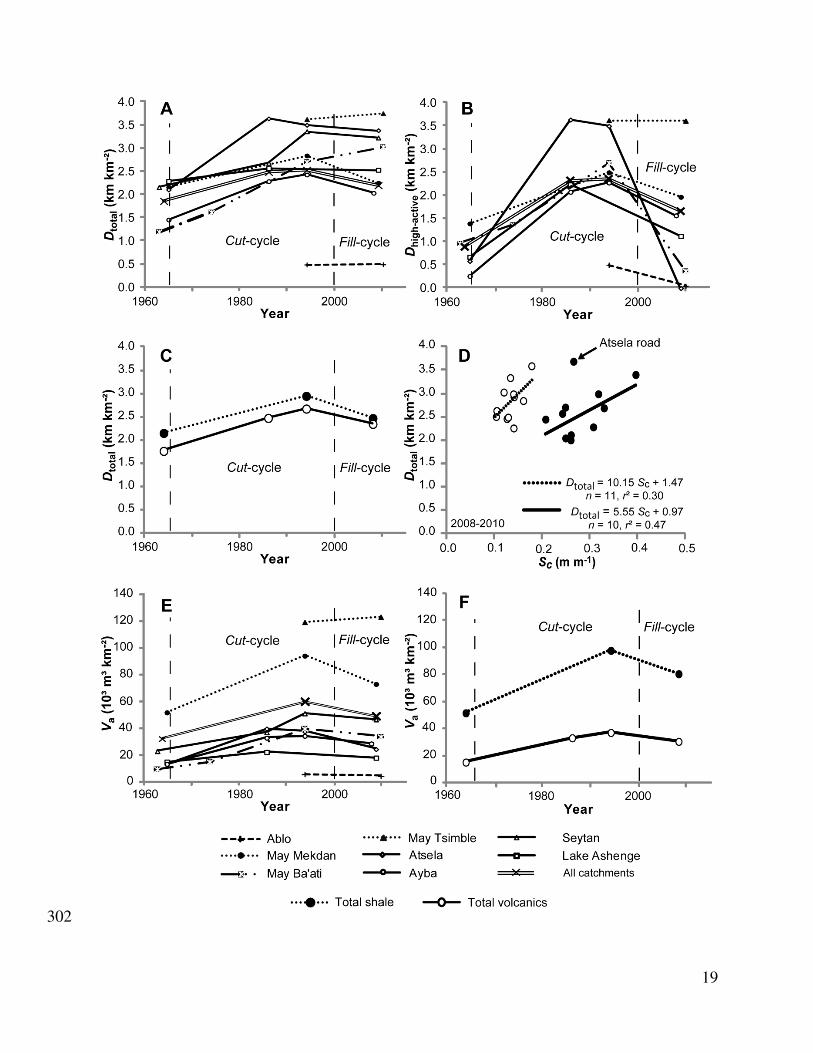
Dtotal, Dhigh-active and Va through time is shown on Figure 3A-C and E-F. 257
15
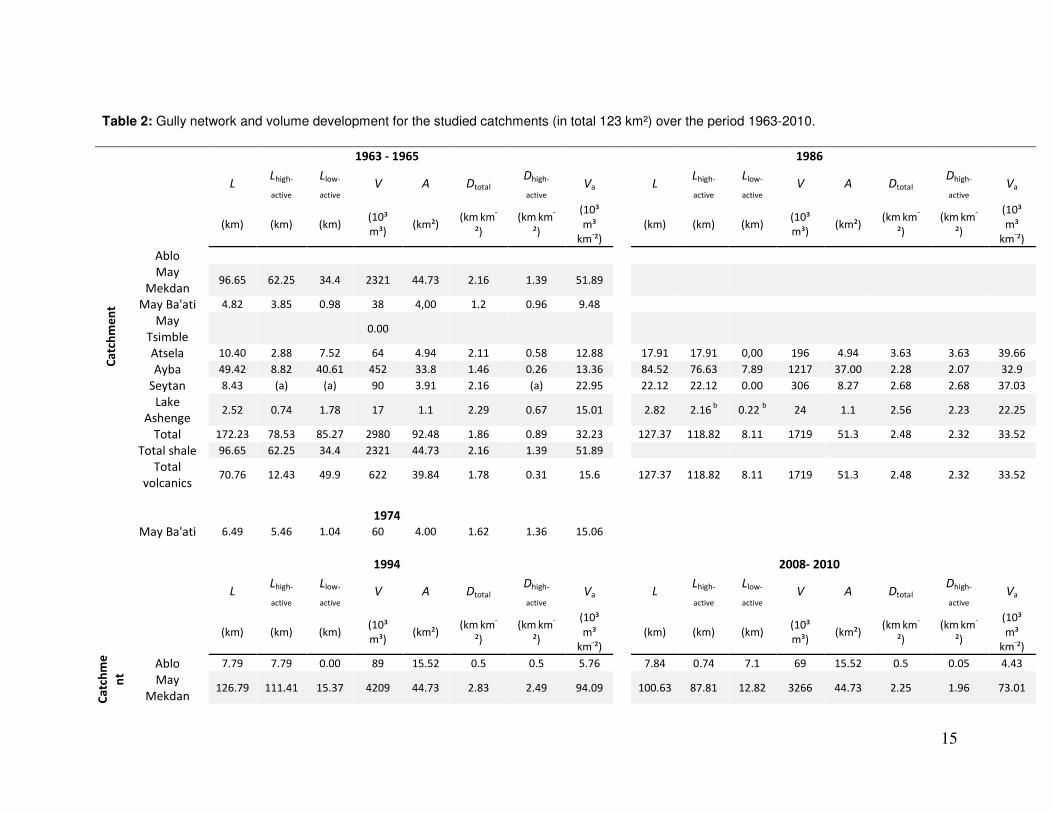
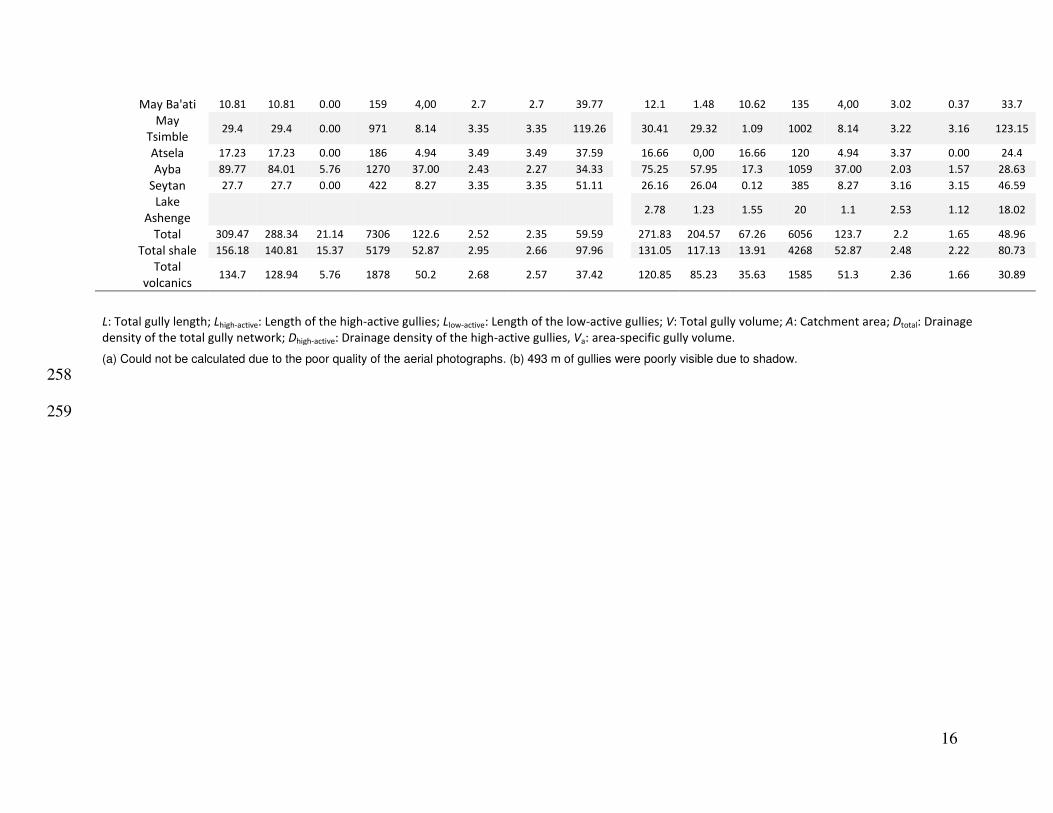
Table 2: Gully network and volume development for the studied catchments (in total 123 km²) over the period 1963-2010.
1963 - 1965 1986
L
Lhigh-
active
Llow-
active V A Dtotal
Dhigh-
active Va L
Lhigh-
active
Llow-
active V A Dtotal
Dhigh-
active Va
(km) (km) (km)
(10³
m³) (km²)
(km km
-
²)
(km km
-
²)
(10³
m³
km-²)
(km) (km) (km) (10³
m³) (km²)
(km km
-
²)
(km km
-
²)
(10³
m³
km-²)
Ca
tch
me
nt
Ablo
May
Mekdan 96.65 62.25 34.4 2321 44.73 2.16 1.39 51.89
May Ba'ati 4.82 3.85 0.98 38 4,00 1.2 0.96 9.48
May
Tsimble 0.00
Atsela 10.40 2.88 7.52 64 4.94 2.11 0.58 12.88 17.91 17.91 0,00 196 4.94 3.63 3.63 39.66
Ayba 49.42 8.82 40.61 452 33.8 1.46 0.26 13.36 84.52 76.63 7.89 1217 37.00 2.28 2.07 32.9
Seytan 8.43 (a) (a) 90 3.91 2.16 (a) 22.95 22.12 22.12 0.00 306 8.27 2.68 2.68 37.03
Lake
Ashenge 2.52 0.74 1.78 17 1.1 2.29 0.67 15.01 2.82 2.16
b 0.22
b 24 1.1 2.56 2.23 22.25
Total 172.23 78.53 85.27 2980 92.48 1.86 0.89 32.23 127.37 118.82 8.11 1719 51.3 2.48 2.32 33.52
Total shale 96.65 62.25 34.4 2321 44.73 2.16 1.39 51.89
Total
volcanics 70.76 12.43 49.9 622 39.84 1.78 0.31 15.6 127.37 118.82 8.11 1719 51.3 2.48 2.32 33.52
1974
May Ba'ati 6.49 5.46 1.04 60 4.00 1.62 1.36 15.06
1994 2008- 2010
L
Lhigh-
active
Llow-
active V A Dtotal
Dhigh-
active Va L
Lhigh-
active
Llow-
active V A Dtotal
Dhigh-
active Va
(km) (km) (km)
(10³
m³) (km²)
(km km
-
²)
(km km
-
²)
(10³
m³
km-²)
(km) (km) (km) (10³
m³) (km²)
(km km
-
²)
(km km
-
²)
(10³
m³
km-²)
Ca
tch
me
nt
Ablo 7.79 7.79 0.00 89 15.52 0.5 0.5 5.76 7.84 0.74 7.1 69 15.52 0.5 0.05 4.43
May
Mekdan 126.79 111.41 15.37 4209 44.73 2.83 2.49 94.09 100.63 87.81 12.82 3266 44.73 2.25 1.96 73.01
16
May Ba'ati 10.81 10.81 0.00 159 4,00 2.7 2.7 39.77 12.1 1.48 10.62 135 4,00 3.02 0.37 33.7
May
Tsimble 29.4 29.4 0.00 971 8.14 3.35 3.35 119.26 30.41 29.32 1.09 1002 8.14 3.22 3.16 123.15
Atsela 17.23 17.23 0.00 186 4.94 3.49 3.49 37.59 16.66 0,00 16.66 120 4.94 3.37 0.00 24.4
Ayba 89.77 84.01 5.76 1270 37.00 2.43 2.27 34.33 75.25 57.95 17.3 1059 37.00 2.03 1.57 28.63
Seytan 27.7 27.7 0.00 422 8.27 3.35 3.35 51.11 26.16 26.04 0.12 385 8.27 3.16 3.15 46.59
Lake
Ashenge 2.78 1.23 1.55 20 1.1 2.53 1.12 18.02
Total 309.47 288.34 21.14 7306 122.6 2.52 2.35 59.59 271.83 204.57 67.26 6056 123.7 2.2 1.65 48.96
Total shale 156.18 140.81 15.37 5179 52.87 2.95 2.66 97.96 131.05 117.13 13.91 4268 52.87 2.48 2.22 80.73
Total
volcanics 134.7 128.94 5.76 1878 50.2 2.68 2.57 37.42 120.85 85.23 35.63 1585 51.3 2.36 1.66 30.89
L: Total gully length; Lhigh-active: Length of the high-active gullies; Llow-active: Length of the low-active gullies; V: Total gully volume; A: Catchment area; Dtotal: Drainage
density of the total gully network; Dhigh-active: Drainage density of the high-active gullies, Va: area-specific gully volume.
(a) Could not be calculated due to the poor quality of the aerial photographs. (b) 493 m of gullies were poorly visible due to shadow.
258
259
17
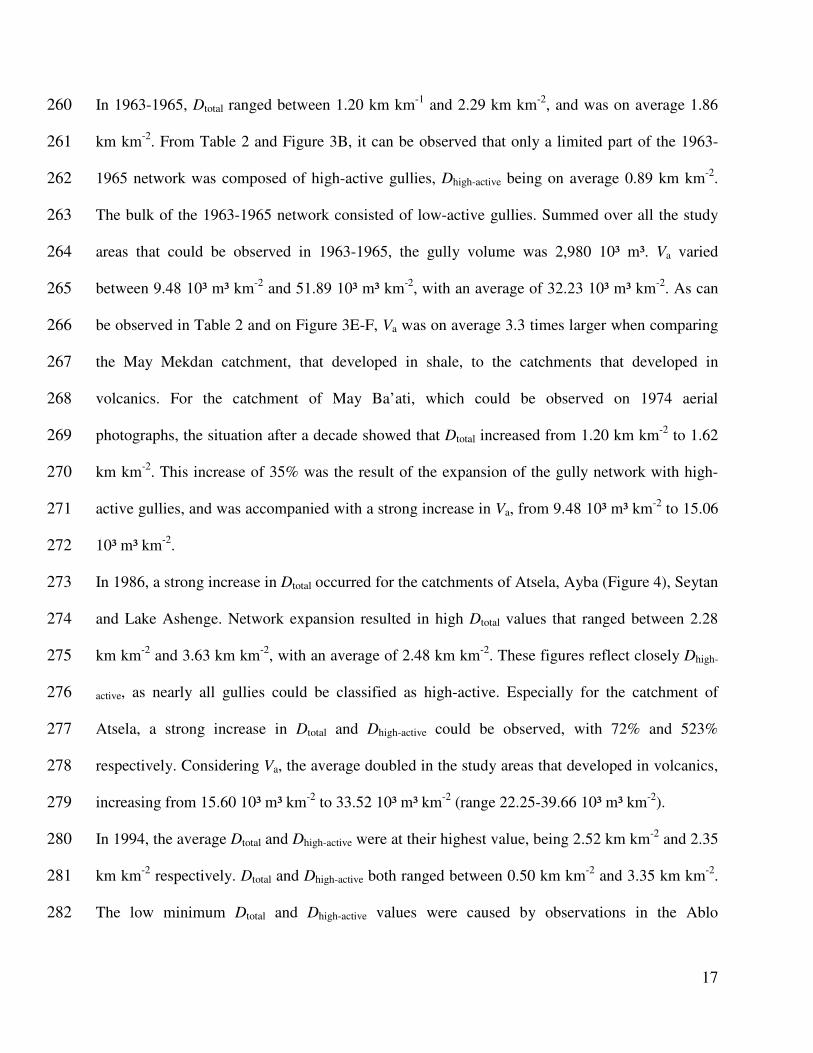
In 1963-1965, Dtotal ranged between 1.20 km km-1
and 2.29 km km-2
, and was on average 1.86 260
km km-2
. From Table 2 and Figure 3B, it can be observed that only a limited part of the 1963-261
1965 network was composed of high-active gullies, Dhigh-active being on average 0.89 km km-2
. 262
The bulk of the 1963-1965 network consisted of low-active gullies. Summed over all the study 263
areas that could be observed in 1963-1965, the gully volume was 2,980 10³ m³. Va varied 264
between 9.48 10³ m³ km-2
and 51.89 10³ m³ km-2
, with an average of 32.23 10³ m³ km-2
. As can 265
be observed in Table 2 and on Figure 3E-F, Va was on average 3.3 times larger when comparing 266
the May Mekdan catchment, that developed in shale, to the catchments that developed in 267
volcanics. For the catchment of May Ba’ati, which could be observed on 1974 aerial 268
photographs, the situation after a decade showed that Dtotal increased from 1.20 km km-2
to 1.62 269
km km-2
. This increase of 35% was the result of the expansion of the gully network with high-270
active gullies, and was accompanied with a strong increase in Va, from 9.48 10³ m³ km-2
to 15.06 271
10³ m³ km-2
. 272
In 1986, a strong increase in Dtotal occurred for the catchments of Atsela, Ayba (Figure 4), Seytan 273
and Lake Ashenge. Network expansion resulted in high Dtotal values that ranged between 2.28 274
km km-2
and 3.63 km km-2
, with an average of 2.48 km km-2
. These figures reflect closely Dhigh-275
active, as nearly all gullies could be classified as high-active. Especially for the catchment of 276
Atsela, a strong increase in Dtotal and Dhigh-active could be observed, with 72% and 523% 277
respectively. Considering Va, the average doubled in the study areas that developed in volcanics, 278
increasing from 15.60 10³ m³ km-2
to 33.52 10³ m³ km-2
(range 22.25-39.66 10³ m³ km-2
). 279
In 1994, the average Dtotal and Dhigh-active were at their highest value, being 2.52 km km-2
and 2.35 280
km km-2
respectively. Dtotal and Dhigh-active both ranged between 0.50 km km-2
and 3.35 km km-2
. 281
The low minimum Dtotal and Dhigh-active values were caused by observations in the Ablo 282
18
catchment, which was only studied since 1994. On Figure 3B, it can clearly be observed that for 283
the period 1986-1994, the gully network was in a very active phase, with most of the gullies 284
being high-active while important network extensions took place. The total volume of the 1994 285
networks was 7,306 10³ m³, which is more than the double of the 1963-1965 situation. Va was on 286
average 59.59 10³ m³ km-2
, and Va-values were on average 2.6 times higher in shale catchments 287
than in volcanics catchments. The highest value for Va was quantified in May Tsimble (= 119.26 288
10³ m³ km-2
) and the lowest in the Ablo catchment (= 5.76 10³ m³ km-2
). In the steep-sloped 289
catchment of Seytan, a marked increase in Va occurred between 1986 and 1994. 290
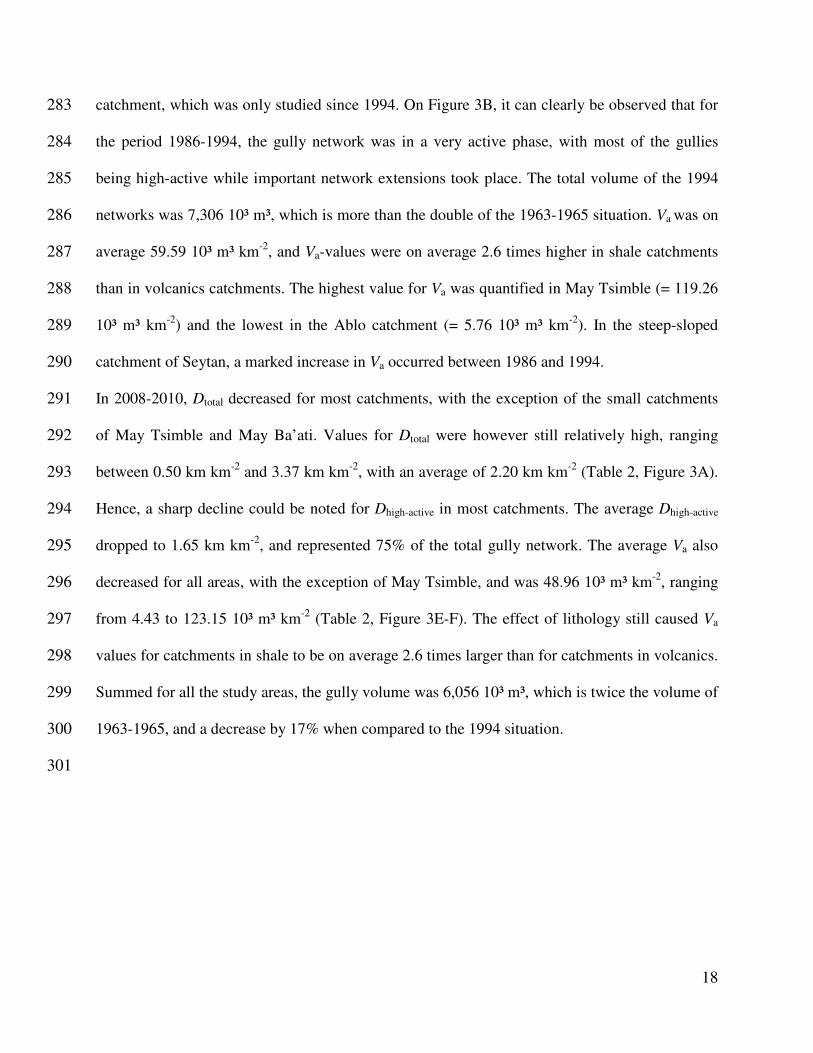
In 2008-2010, Dtotal decreased for most catchments, with the exception of the small catchments 291
of May Tsimble and May Ba’ati. Values for Dtotal were however still relatively high, ranging 292
between 0.50 km km-2
and 3.37 km km-2
, with an average of 2.20 km km-2
(Table 2, Figure 3A). 293
Hence, a sharp decline could be noted for Dhigh-active in most catchments. The average Dhigh-active 294
dropped to 1.65 km km-2
, and represented 75% of the total gully network. The average Va also 295
decreased for all areas, with the exception of May Tsimble, and was 48.96 10³ m³ km-2
, ranging 296
from 4.43 to 123.15 10³ m³ km-2
(Table 2, Figure 3E-F). The effect of lithology still caused Va 297
values for catchments in shale to be on average 2.6 times larger than for catchments in volcanics. 298
Summed for all the study areas, the gully volume was 6,056 10³ m³, which is twice the volume of 299
1963-1965, and a decrease by 17% when compared to the 1994 situation. 300
301
19
302
20
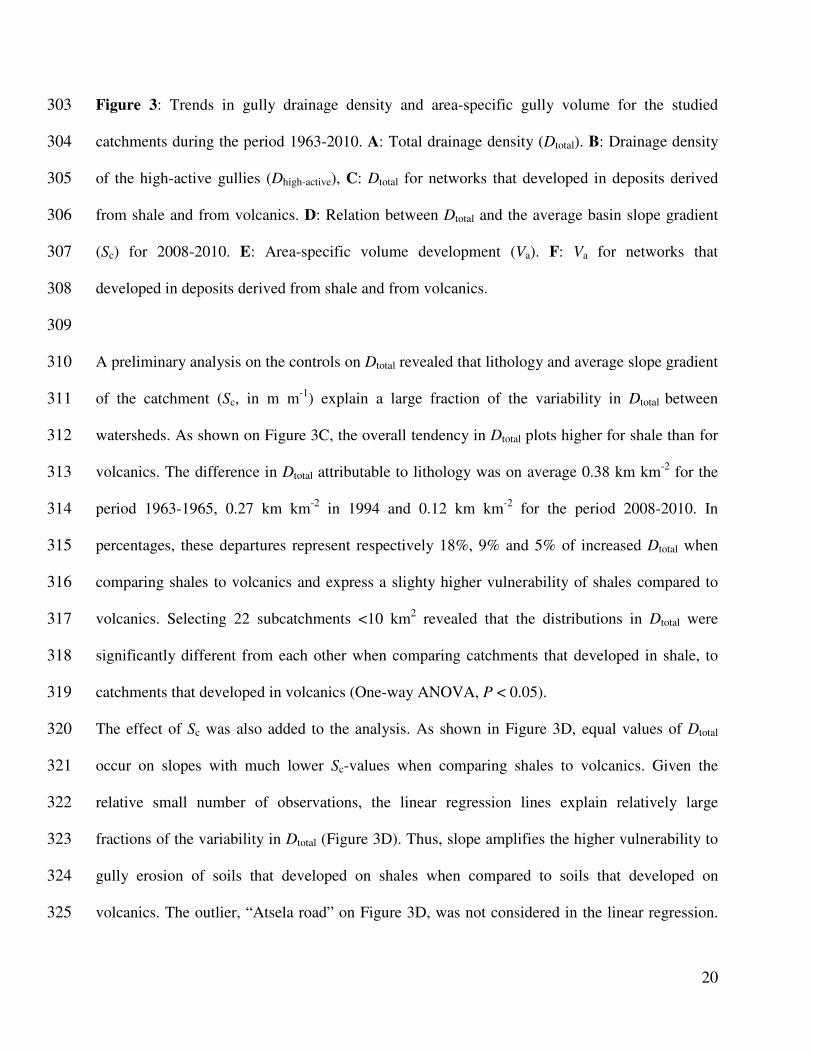
Figure 3: Trends in gully drainage density and area-specific gully volume for the studied 303
catchments during the period 1963-2010. A: Total drainage density (Dtotal). B: Drainage density 304
of the high-active gullies (Dhigh-active), C: Dtotal for networks that developed in deposits derived 305
from shale and from volcanics. D: Relation between Dtotal and the average basin slope gradient 306
(Sc) for 2008-2010. E: Area-specific volume development (Va). F: Va for networks that 307
developed in deposits derived from shale and from volcanics. 308
309
A preliminary analysis on the controls on Dtotal revealed that lithology and average slope gradient 310
of the catchment (Sc, in m m-1
) explain a large fraction of the variability in Dtotal between 311
watersheds. As shown on Figure 3C, the overall tendency in Dtotal plots higher for shale than for 312
volcanics. The difference in Dtotal attributable to lithology was on average 0.38 km km-2
for the 313
period 1963-1965, 0.27 km km-2
in 1994 and 0.12 km km-2
for the period 2008-2010. In 314
percentages, these departures represent respectively 18%, 9% and 5% of increased Dtotal when 315
comparing shales to volcanics and express a slighty higher vulnerability of shales compared to 316
volcanics. Selecting 22 subcatchments <10 km2 revealed that the distributions in Dtotal were 317
significantly different from each other when comparing catchments that developed in shale, to 318
catchments that developed in volcanics (One-way ANOVA, P < 0.05). 319
The effect of Sc was also added to the analysis. As shown in Figure 3D, equal values of Dtotal 320
occur on slopes with much lower Sc-values when comparing shales to volcanics. Given the 321
relative small number of observations, the linear regression lines explain relatively large 322
fractions of the variability in Dtotal (Figure 3D). Thus, slope amplifies the higher vulnerability to 323
gully erosion of soils that developed on shales when compared to soils that developed on 324
volcanics. The outlier, “Atsela road” on Figure 3D, was not considered in the linear regression. 325
21
The road zigzags in the upper catchments and clearly had an aggravating effect on gully erosion. 326
Catchment area did not show a significant effect on Dtotal (linear regression, n = 22, P = 0.09). 327
328
329
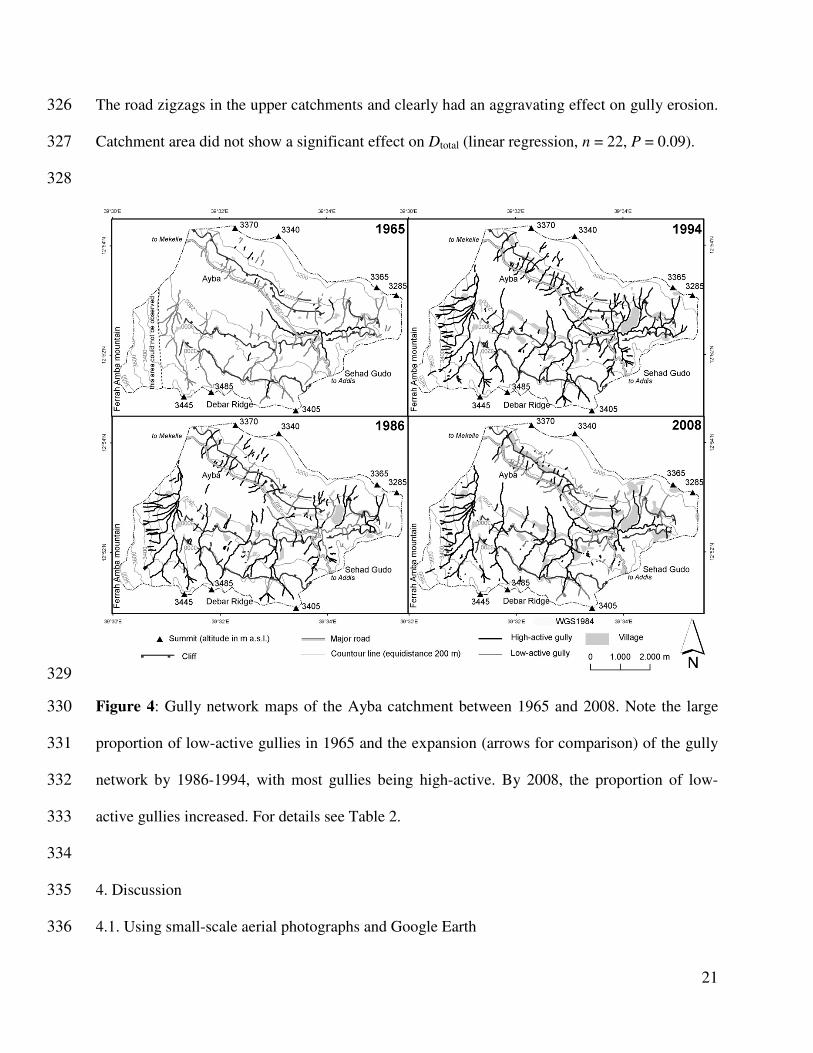
Figure 4: Gully network maps of the Ayba catchment between 1965 and 2008. Note the large 330
proportion of low-active gullies in 1965 and the expansion (arrows for comparison) of the gully 331
network by 1986-1994, with most gullies being high-active. By 2008, the proportion of low-332
active gullies increased. For details see Table 2. 333
334
4. Discussion 335
4.1. Using small-scale aerial photographs and Google Earth 336
22
Using small-scale aerial photographs proved to be very useful for the analysis of changes in 337
gully networks and volumes, even in a mountainous country like Ethiopia for which old aerial 338
photographs are of poor quality and difficult to orthorectify. This study indeed confirms that, 339
with a minimal geomorphologic background and stereographic view, gully networks can be 340
delineated with relative ease. Assessing their volumes requires the establishment of V – L 341
relations (Frankl et al., 2013b), based on in situ observations. 342
High resolution satellite images complete the recent data series for which the use of Google 343
Earth was very helpful. This platform can map features in 3D on-the-screen with a planimetric 344
accuracy comparable to that of a handheld GPS (e.g. Garmin GPSMap 60, standard deviation of 345
5 m) (Frankl et al., 2013a). With the ability to import mapped features into a GIS-environment, 346
the potential of Google Earth for geomorphologic studies is strongly increasing. Several studies 347
exist that use Google Earth, but mostly these are limited to 3D-visualizations or on-screen 348
measurements (e.g., Warren et al. 2007; Hesse, 2009; Tsou et al. 2011). Few studies explored its 349
potential for analyzing landforms (e.g., Iglesias et al., 2009; McInnes et al., 2011). 350
351
4.2. Cut-and-fill cycle 352
The changes in gully networks and volumes shown on Figure 3A-C and E-F indicate that the 353
gully system experienced a cut-and-fill cycle over the period 1963-2010. In 1963-1965, the quite 354
extensive gully network merely consisted of low-active gullies. By 1984-1994, with a marked 355
increase in high-active gullies, the gully network became highly active, with the expansion of the 356
network and the increase in gully volume as a result. At present, in 2008-2010, the proportion of 357
high-active gullies decreased at the benefit of low-active gullies. Moreover, the gully network 358
shrunk and the total gully volume decreased. This cut-and-fill cycle can best be observed when 359
23
considering the largest catchments, i.e. those of May Mekdan (44.7 km²) and Ayba (37 km²) 360
(Figure 3 A and E; Figure 4). 361
These findings are in line with those of Frankl et al. (2011). On the basis of repeat photography, 362
gully dynamism in Northern Ethiopia was explained in terms of hydrogeomorphic phases. From 363
ca. 1868 to 1965, gullies were low-active, displaying smooth (vegetated) cross-sections. This 364
corresponds to the large proportions of low-active gullies for the period 1963-1965 in this study. 365
It indicates that environmental vulnerability did not yet reach a critical point for large-scale 366
channel extension and degradation to occur. After 1965, a marked transition from low- to high-367
active gullies occurred, which is also apparent in this study. This is probably related to arid 368
pulses that occurred in the 1970s and 1980s. Such phases alter biomass production and increase 369
the human pressure on land and vegetation. In order to secure food production, farmers will be 370
forced to cultivate steeper land and grazing will deplete slopes of most vegetation. Analyses of 371
region-wide land-use and cover on the basis of Landsat imagery by de Mûelenaere et al. (2012) 372
in the 1970s and 1980s confirmed that in 1984/1986, the surface covered by bare ground was 373
extensive and that the surface covered by cropland peaked. From the analysis of land-use and 374
land cover on old terrestrial photographs, Meire et al. (2012) also indicate a minimum in 375
vegetation cover in the period 1940s-1990s. Frankl et al. (2013c) showed that the length of the 376
growing period decreases with increasing drought in Northern Ethiopia, making croplands very 377
vulnerable to high-intensity rainfall in the summer rainy season. Since ca. 2000, the large-scale 378
implementation of soil and water conservation measures started to yield positive effects on the 379
environmental rehabilitation and the on stabilization of gullies. Several studies indeed indicate 380
that vegetation cover and land management strongly improved in recent decades (e.g., 381
Gebremedhin et al., 2004; Munro et al., 2008; Alemayehu et al., 2009; Mekuria et al., 2009; 382
24
Nyssen et al., 2009; de Mûelenaere et al., 2012; Meire et al., 2012). Frankl et al. (2011) indicated 383
that in 2009, 23% of the studied gully sections were stabilizing. In this study, low-active gully 384
segments count for 25% of the gully network, which is very close to the previous findings. 385
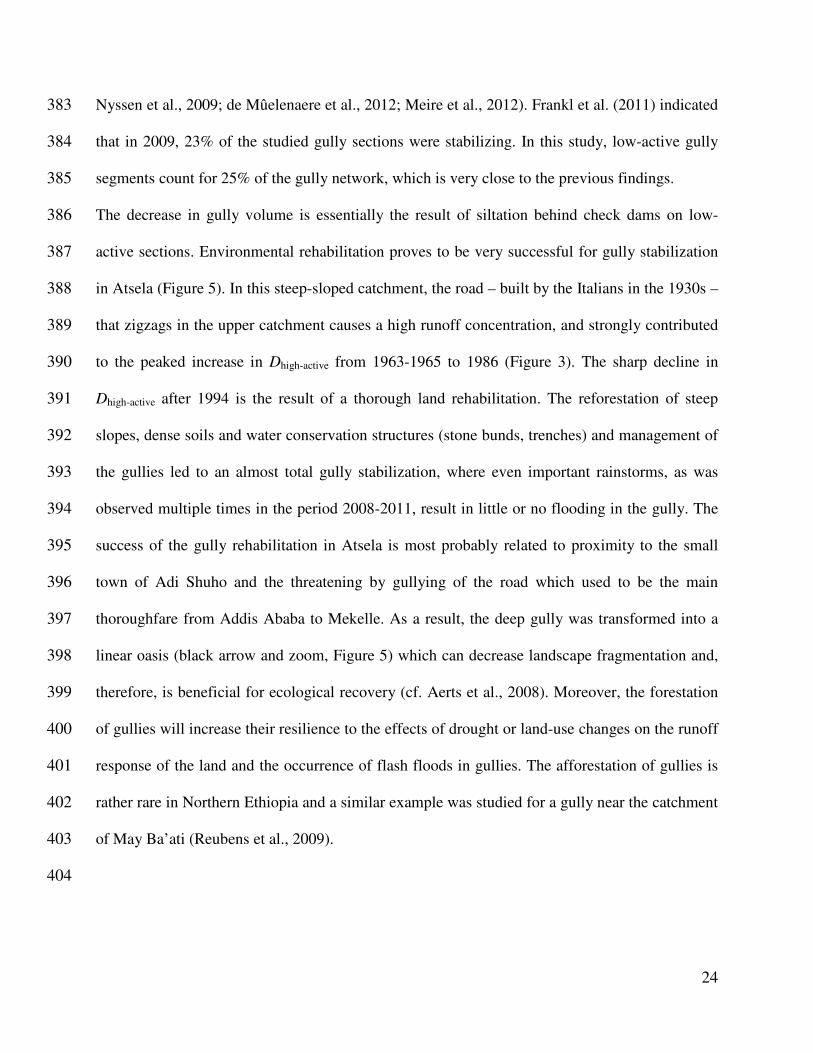
The decrease in gully volume is essentially the result of siltation behind check dams on low-386
active sections. Environmental rehabilitation proves to be very successful for gully stabilization 387
in Atsela (Figure 5). In this steep-sloped catchment, the road – built by the Italians in the 1930s – 388
that zigzags in the upper catchment causes a high runoff concentration, and strongly contributed 389
to the peaked increase in Dhigh-active from 1963-1965 to 1986 (Figure 3). The sharp decline in 390
Dhigh-active after 1994 is the result of a thorough land rehabilitation. The reforestation of steep 391
slopes, dense soils and water conservation structures (stone bunds, trenches) and management of 392
the gullies led to an almost total gully stabilization, where even important rainstorms, as was 393
observed multiple times in the period 2008-2011, result in little or no flooding in the gully. The 394
success of the gully rehabilitation in Atsela is most probably related to proximity to the small 395
town of Adi Shuho and the threatening by gullying of the road which used to be the main 396
thoroughfare from Addis Ababa to Mekelle. As a result, the deep gully was transformed into a 397
linear oasis (black arrow and zoom, Figure 5) which can decrease landscape fragmentation and, 398
therefore, is beneficial for ecological recovery (cf. Aerts et al., 2008). Moreover, the forestation 399
of gullies will increase their resilience to the effects of drought or land-use changes on the runoff 400
response of the land and the occurrence of flash floods in gullies. The afforestation of gullies is 401
rather rare in Northern Ethiopia and a similar example was studied for a gully near the catchment 402
of May Ba’ati (Reubens et al., 2009). 403
404
25
405
Figure 5: Gully rehabilitation in the catchment of Atsela. Thanks to the improved land 406
management and the application of soil and water conservation measures, like the reforestation 407
of the steep slope (foreground), the gully indicated by the black arrow was transformed into a 408
green oasis in the landscape. (Photographs by Cleo De Wolf, March 2012) 409
410
4.3. Soil loss by gullying 411
In order to compare our results to other reports of soil erosion by gullying in Northern Ethiopia 412
and in other drylands, the soil loss was also expressed as soil loss by gullying (SLg, t ha-1
y-1
). As 413
no soil bulk density measurements were performed in this study, we used a standard soil bulk 414
density of 1.5 g cm-³. Average soil bulk density values for topsoils in Northern Ethiopia vary 415
between 1.28 and 1.38 g cm-³ (Girmay et al., 2009). 416
26
Soil losses by gullying (SLg) are considerable in Northern Ethiopia. Over the period 1963/1965 – 417
2008/2010, the average SLg was 8.3 t ha-1
y-1
. This is similar soil losses of 9.7 t ha y-1
by sheet 418
and rill erosion (Nyssen et al., 2008b). For shales and for volcanics, the average SLg-values were 419
12.28 t ha-1
y-1
and 6.3 t ha-1
y-1
, respectively. Over the same period, Nyssen et al. (2006) 420
obtained average SLg-values of 6.2 t ha-1
y-1
, for several gullies near the catchment of May 421
Ba’ati. Low SLg-values of 4.1 t ha-1
y-1
were reported by Nyssen et al. (2008b) over the period 422
1998-2001 in a well managed catchment also near May Ba’ati. Calculating SLg over the period 423
1963/1965 - 1994, when the gully system was in a pronounced cut-phase, gave a much higher 424
value of 17.6 t ha-1
y-1
. Differentiating between shales and volcanics gave values of 27.0 t ha-1
y-1 425
and 12.5 t ha-1
y-1
respectively. Over the period 1994-2008/2010 a net infilling of 8.3 t ha-1
y-1
426
was calculated. This of course does not imply that no active gullying occurs (headcut retreat, 427
bank erosion, etc.), but merely indicates that soil is efficiently being trapped into gullies. 428
Compared to SLg-values of other dryland environments reported in Poesen et al. (2003), see 429
introduction, soil loss by gullying is severe in Northern Ethiopia. 430
These tendencies have to be understood within a socio-economic environment of strong 431
population growth and a low level of technological development, where most people rely on land 432
resources for their livelihood, and where the fragility of the country’s economy is frequently 433
emphasized, for example when climatic shocks such as drought cause severe food shortages and 434
famine. Socio-economical developments and their relation to land degradation should therefore 435
be monitored closely. With an annual population growth rate of 2.37% (period 2000-2010, CSA, 436
2008) and population size which is likely to double by 2050, the country faces immense 437
challenges. The key is to rehabilitate land as a resource base for food security and ecosystem 438
services, and to strengthen and diversify the rural economy in order to make local communities 439
27
less dependent on land resources. Such challenges are embraced by many local, national and 440
international programs, and should remain high on the agenda. 441
442
5. Conclusions 443
Small-scale aerial photographs of the period 1963-1994 proved to be very valuable to map and 444
understand historical gully erosion, even for a mountainous country like Ethiopia for which old 445
aerial photographs are of poor quality and difficult to orthorectify. Having a basic geomorphic 446
background (fieldwork, use of aerial photographs) and stereographic views, gully networks could 447
be mapped relatively easily and a distinction between low- and high-active gullies could be 448
made. High-resolution satellite images offer similar resolutions to those of aerial photographs, 449
and could thus be used to collect data on present gully erosion. At no cost and at good spatial 450
accuracy, we mapped gully networks in Google Earth using 3D visualization of the images. 451
Considering the changes in gully networks and volumes from 1963 to 2010, this study confirms 452
previous findings by Frankl et al. (2011) that the gully network is experiencing a cut-and-fill 453
phase, related to alternating environmental conditions. Although network density was relatively 454
high (1.86 km km-2
) in the 1960s, 50% of the network was low-active, and the area specific gully 455
volume (Va) was only 32.23 10³ m³ km-2
. These figures changed dramatically towards the 1980s 456
and 1990s. The total (Dtotal) and high-active (Dhigh-active) network density then peaked reaching 457
2.52 km km-2
and 2.35 km km-2
in 1994. This coincided with an almost double Va of 59.59 10³ 458
m³ km-2
. With improved land management and the region-wide implementation of soil and water 459
conservation measures in the recent decades, the gully network density and volume subsequently 460
decreased. Dtotal and Dhigh-active declined to 2.2 km km-2
and 1.65 km km-2
respectively, and 25% 461
of the gully network is low-active. Va in 2008-2010 was 48.96 10³ m³ km-2
. Comparing 462
28
catchments of similar size showed that the drainage density is largely controlled by catchment 463
gradient and that for the same gradient, densities in shales are higher than in volcanics (flood 464
basalt, rhyolites and consolidated volcanic ash). 465
Soil losses by gullying (SLg) are considerable in Northern Ethiopia. Over the period 1963/1965-466
2008/2010, SLg was on average 8.3 t ha-1
y-1
. However, these rates have varied considerably in 467
time and space. Average SLg-values between shales and volcanics differ considerably. The gully 468
cut-phase from 1963/1965-1994 gave a much higher average SLg-values of 17.6 t ha-1
y-1
. Over 469
the period 1994-2008/2010 a net filling of 8.3 t ha-1
y-1
occurred. 470
This study shows that land degradation by gullying was indeed severe in Northern Ethiopia in 471
the second half of the 20th century. However, the huge efforts in environmental rehabilitation 472
undertaken in the recent decades are starting to result in gully stabilization. When proper land 473
management is applied, gullies can even be transformed into a linear oasis (Figure 5) which will 474
increases the resistance of gullies to possible further erosion. In the light of strong population 475
growth and expected increasing demands of land resources, rehabilitating the gully networks 476
needs to be of high priority for all local, national and international beneficiaries of soil recourses. 477
478
Acknowledgements 479
This study was carried out with the support of Ghent University, Research Foundation Flanders 480
(FWO), Royal Academy of Overseas Sciences, Couderé Geomatic Engineering bvba and the 481
Flemish Interuniversity Council – University Development Cooperation (VLIR-UOS-MU-Land 482
Project). Special thanks go to our field assistant Gebrekidan Mesfin and to the local residents for 483
their hospitality. 484
485
29
References 486
Aerts, R., Lerouge, F., November, E., Lens, L., Hermy, M., Muys, B., 2008. Land rehabilitation 487
and the conservation of birds in a degraded Afromontane landscape in northern 488
Ethiopia. Biodiversity and Conservation 17, 53-69. 489
Alemayehu, F., Taha, N., Nyssen, J., Girma, A., Zenebe, A., Behailu, M., Deckers, S., Poesen, J., 490
2009. The impacts of watershed management on land-use and land cover dynamics in 491
Eastern Tigray (Ethiopia). Resources, Conservation and Recycling 53, 192-198. 492
Billi, P., Dramis, F., 2003. Geomorphological investigation on gully erosion in the Rift Valley 493
and the northern highlands of Ethiopia. Catena 50, 353-368. 494
Boardman, J., Parsons, A.J., Holland, R., Holmes, P.J., Washington, R., 2003. Development of 495
badlands and gullies in the Sneeuberg, Great Karoo, South Africa. Catena 50, 165-184. 496
Crummey, D., 1998. Deforestation in Wällo: process of illusion? Journal of Ethiopian Studies 497
21, 1-41. 498
CSA, 2008. Central Statistical Agency Federal Democratic Republic of Ethiopia population 499
census commission. Summary and statistical report of the 2007 population and housing 500
census. Addis Ababa. 501
Daba, S., Rieger, W., Strauss, P., 2003. Assessment of gully erosion in eastern Ethiopia using 502
photogammetric techniques. Catena 50, 273-291. 503
de Mûelenaere, S., Frankl, A., Mitiku Haile, Poesen, J., Deckers, J., Munro, N., Veraverbeke, S., 504
Nyssen, J., 2012. Historical landscape photographs for calibration of LANDSAT land 505
use/cover in the Northern Ethiopian Highlands. Land Degradation and Development, 506
online early view. DOI: 10.1002/ldr.2142 507
30
Descheemaeker, K., Nyssen, J., Rossi, J., Poesen, J., Mitiku Haile, Moeyersons, J., Deckers, J., 508
2006. Sediment deposition and pedogenesis in exclosures in the Tigray Highlands, 509
Ethiopia. Geoderma 132, 291-314. 510
Frankl, A., Nyssen, J., De Dapper, M., Mitiku Haile, Billi, P., Munro, R.N., Deckers, J., Poesen, 511
J., 2011. Linking long-term gully and river channel dynamics to environmental change 512
using repeat photography (North Ethiopia). Geomorphology 129, 238-251. 513
Frankl, A., Poesen, J., De Dapper, M., Deckers, J., Mitiku Haile, Nyssen, J., 2012. Gully head 514
retreat rates in the semiarid Highlands of North Ethiopia. Geomorphology 173-174, 515
185-195. 516
Frankl, A., Zwertvaegher, A., Poesen, J., Nyssen, J., 2013a. Transferring Google Earth 517
observations to GIS-software: Example from gully erosion study. International Journal 518
of Digital Earth 6, 196-201. 519
Frankl, A., Poesen, J., Scholiers, N., Jacob, M., Mitiku Haile, Deckers, J., De Dapper, M., 520
Nyssen, J., 2013b. Factors controlling the morphology and volume (V) – length (L) 521
relations of permanent gullies in the Northern Ethiopian Highlands. Earth Surface 522
Processes and Landforms, in press. DOI: 10.1002/esp.3405. 523
Frankl, A., Jacob, M., Mitiku Haile, Poesen, J., Deckers, J., Nyssen, J., 2013c. Spatio-temporal 524
variability of cropping systems and crop land cover with rainfall in the Northern 525
Ethiopian Highlands. Soil Use and Management, in press. 526
Gebremedhin, B., Pender, J., Tesfay, G., 2004. Collective action for grazing land management in 527
crop-livestock mixed systems in the highlands of northern Ethiopia. Agricultural 528
Systems 82, 273-290. 529
31
Girmay Gebresamuel, Singh, B.R., Nyssen, J., Borrosen, T., 2009. Runoff and sediment-530
associated nutrient losses under different land-uses in Tigray, Northern Ethiopia. 531
Journal of Hydrology 376, 70-80. 532
Hesse, R., 2009. Do swarms of migrating barchan dunes record paleoenvironmental changes? - 533
A case study spanning the middle to late Holocene in the Pampa de Jaguay, southern 534
Peru. Geomorphology 104, 185-190. 535
HTS, 1976. Tigrai Rural Development Study (TRDS). Hunting Technical Services Ltd. 536
Government of Ethiopia and UK Ministry of Overseas Development, Hunting Technical 537
Services, Borehamwood. 538
Hughes, M.L., McDowell, P.F., Marcus, W.A., 2006. Accuracy assessment of georectified aerial 539
photographs: Implications for measuring lateral channel movement in a GIS. 540
Geomorphology 74, 1-16. 541
Iglesias, G., Lopez, I., Castro, A., Carballo, R., 2009. Neural network modelling of planform 542
geometry of headland-bay beaches. Geomorphology 103, 577-587. 543
James, L.A., Hodgson, M.E., Ghoshal, S., Latiolais, M.M., 2012. Geomorphic change detection 544
using historic maps and DEM differencing: The temporal dimension of geospatial 545
analysis. Geomorphology 137, 181-198. 546
Kassas, M., 1995. Desertification: a general review. Journal of Arid Environments 30, 115-128. 547
Katsurada, Y., 2007. Regional scaled mapping of gully erosion sensitivity in Western Kenya. 548
African Environment, Science and Technology 1, 049-052. 549
Knighton, D., 1998. Fluvial Forms and Processes – A New Perspective. Hodder Education, 550
London. 551
32
Leblanc, M.J., Favreau, G., Massuel, S., Tweed, S.O., Loireau, M., Cappelaere, B., 2008. Land 552
clearance and hydrological change in the Sahel: SW Niger. Global and Planetary 553
Change 61, 135-150. 554
Marzolff, I., Ries, J.B., 2007. Gully erosion monitoring in semi-arid landscapes. Zeitschrift für 555
Geomorphologie 51, 405-425. 556
McCann, J., 1997. The Plow and the Forest: Narratives of Deforestation in Ethiopia, 1840-1992. 557
Environmental History 2, 138-159. 558
McInnes, J., Vigiak, O., Roberts, A.M., 2011. Using Google Earth to map gully extent in the 559
West Gippsland region (Victoria, Australia), 19th International Congress on Modeling 560
and Simulation, Perth. http://mssanz.org.au/modsim2011, 1-7 561
Meire, E., Frankl, A., De Wulf, A., Mitiku Haile, Deckers, J., Nyssen, J., 2012. Mapping the 562
19th century landscape in Africa – warped terrestrial photographs of North Ethiopia. 563
Regional Environmental Change, online early view. DOI: 10.1007/s10113-012-0347-9 564
Mekuria, W., Veldkamp, E., Haile, M., Gebrehiwot, K., Muys, B., Nyssen, J., 2009. 565
Effectiveness of exclosures to control soil erosion and local community perception on 566
soil erosion in Tigray, Ethiopia. African Journal of Agricultural Research 4, 365-377. 567
Miller, S., 2004. Photogrammetric products, In: McGlone, J.C.,Mikhail, E.M., Bethel, J. (Eds.), 568
Manual of Photogammetry, Fifth Edition. ASPRS, Bethesda, MA, pp. 983–1013. 569
Moeyersons, J., 1989. La nature de l’érosion des versants au Rwanda. Annales, Kon. Mus. Mid. 570
Afr., Tervuren. 571
Moeyersons, J., 1991. Ravine formation on steep slopes: Forward versus regressive erosion. 572
Some case studies from Rwanda. Catena 18, 309-324. 573
33
Moges, A., Holden, N.M., 2008. Estimating the rate and consequences of gully development, a 574
case study of Umbulo catchment in southern Ethiopia. Land Degradation and 575
Development 19, 574-586. 576
Muhindo Sahani, 2011. Le contexte urbain et climatique des risques hydrologiques de la ville de 577
Butembo (Nord-Kivu/RDC). Unpubl. Phd. thesis, Université de Liège, Liège. 578
Munro, R.N., Deckers, J., Grove, A.T., Mitiku Haile, Poesen, J., Nyssen, J., 2008. Soil and 579
erosion features of the Central Plateau region of Tigrai - Learning from photo 580
monitoring with 30 years interval. Catena 75, 55-64. 581
Ndona, A., Truong, P., 2011. Community mobilization for the control of ravine erosion with 582
vetiver technology in the Congo. http://www.vetiver.org/ICV4pdfs/DC04.pdf 583
Nyssen, J., Poesen, J., J., M., Luyten, E., Veyret-Picot, M., Deckers, J., Mitiku Haile, Govers, G., 584
2002. Impact of road building on gully erosion risk: a case study from the Northern 585
Ethiopian Highlands. Earth Surface Processes and Landforms 27, 1267-1283. 586
Nyssen, J., Poesen, J., Moeyersons, J., Deckers, J., Haile, M., Lang, A., 2004. Human impact on 587
the environment in the Ethiopian and Eritrean highlands - a state of the art. Earth 588
Science Reviews 64, 273-320. 589
Nyssen, J., Vandenreyken, H., Poesen, J., Moeyersons, J., Deckers, J., Mitiku Haile, Salles, C., 590
Govers, G., 2005. Rainfall erosivity and variability in the Northern Ethiopian 591
Highlands. Journal of Hydrology 311, 172-187. 592
Nyssen, J., Poesen, J., Veyret-Picot, M., Moeyersons, J., Mitiku Haile, Deckers, J., Dewit, J., 593
Naudts, J., Kassa Teka, Govers, G., 2006. Assessment of gully erosion rates through 594
interviews and measurements: a case study from Northern Ethiopia. Earth Surface 595
Processes and Landforms 31, 167-185. 596
34
Nyssen, J., Naudts, J., De Geyndt, K., Mitiku Haile, Poesen, J., Moeyersons, J., Deckers, J., 597
2008a. Soils and land use in the Tigray highlands (Northern Ethiopia). Land 598
Degradation and Development 19, 257-274. 599
Nyssen, J., Poesen, J., Moeyersons, J., Mitiku Haile, Deckers, J., 2008b. Dynamics of soil 600
erosion rates and controlling factors in the Northern Ethiopian Highlands - towards a 601
sediment budget. Earth Surface Processes and Landforms 33, 695-711. 602
Nyssen, J., Mitiku Haile, Nauds, J., Munro, N., Poesen, J., Moeyersons, J., Frankl, A., Deckers, 603
J., Pankhurst, R., 2009. Desertification? Northern Ethiopia re-photographed after 140 604
years. Science of the Total Environment 407, 2749-2755. 605
Oostwoud Wijdenes, D., Poesen, J., Vandekerckhove, L. and Ghesquiere M. 2000. Spatial 606
distribution of gully head activity and sediment supply along an ephemeral channel in a 607
Mediterranean environment. Catena 39,147-167. 608
Poesen, J., Vandekerckhove, L., Nachtergaele, J., Oostwoud Wijdenes, D., Verstraeten, G., van 609
Wesemael, B., 2002. Gully erosion in dryland environments. In: Bull, L.J., Kirkby, M.J. 610
(Eds.), Dryland Rivers: Hydrology and Geomorphology of Semi-Arid Channels. Wiley, 611
Chichester. 612
Poesen, J., Nachtergaele, J., Verstraeten, G., Valentin, C., 2003. Gully erosion and 613
environmental change: importance and research needs. Catena 50, 91-133. 614
Reubens, B., Poesen, J., Nyssen, J., Leduc, Y., Amanuel Zenebe, Sarah Tewoldeberhan, Bauer, 615
H., Kindeya Gebrehiwot, Deckers, J., Muys, B., 2009. Establishment and management 616
of woody seedlings in gullies in a semi-arid environment (Tigray, Ethiopia). Plant Soil 617
324, 131-156. 618
35
Stocking, M.A., 1980. Examination of factors controlling gully growth. In: De Boodt, M., 619
Gabriels, D. (Eds.), Assessment of Erosion. Wiley, Chichester. 620
Thornthwaite, C.W., 1948. An approach toward a rational classification of climate. Geogr. 621
Rev. 38, 55-94. 622
Tsou, C-Y., Feng, Z-Y., Chigira, M., 2011. Catastrophic landslide induced by Typhoon Morakot, 623
Shiaolin, Taiwan. Geomorphology 127, 166-178. 624
UN-DDD, 2012. United Nations Decade for Deserts and Fight Against Desertification 625
(UNDDD). http://unddd.unccd.int/. 626
UNEP, 1994. United Nations Convention to Combat Desertification (UNCCD). 627
http://www.unccd.int/. 628
Valentin, C., Poesen, J., Li, Y., 2005. Gully erosion: Impacts, factors and control. Catena 63, 629
132-153. 630
Virgo, K.J., Munro R.N., 1978. Soil and erosion features of the Central Plateau region of Tigrai, 631
Ethiopia. Geoderma 20, 131-157. 632
Warren, A., Chappell, A., Todd, M.C., Bristow, C., Drake, N., Engelstaedter, S., Martins, V., 633
M'Bainayel, S., Washington, R., 2007. Dust-raising in the dustiest place on earth. 634
Geomorphology 92, 25-37 635
Williams, M., Williams, F., 1980. Evolution of the Nile basin. In, Williams, M., Faure, H. (Eds.), 636
The Sahara and the Nile. Quaternary Environments and Prehistoric Occupation in 637
Northern Africa. Balkema, Rotterdam. 638
Related Documents